| x | ANNUAL REPORT PURSUANT TO SECTION 13 OR 15(d) OF THE SECURITIES EXCHANGE ACT OF 1934 |
| o | TRANSITION REPORT PURSUANT TO SECTION 13 OR 15(d) OF THE SECURITIES EXCHANGE ACT OF 1934 |
Maryland (Essex Property Trust, Inc.) California (Essex Portfolio, L.P.) | 77-0369576 (Essex Property Trust, Inc.) 77-0369575 (Essex Portfolio, L.P.) | ||
| (State or Other Jurisdiction of Incorporation or Organization) | (I.R.S. Employer Identification Number) | ||
| Title of each class | Name of each exchange on which registered | |
| Common Stock, $.0001 par value (Essex Property Trust, Inc.) | New York Stock Exchange | |
| 7.125% Series H Cumulative Redeemable Preferred Stock (Essex Property Trust, Inc.) | New York Stock Exchange | |
Essex Property Trust, Inc. Yes x No o | Essex Portfolio, L.P. Yes o No x |
Essex Property Trust, Inc. Yes o No x | Essex Portfolio, L.P. Yes o No x |
Essex Property Trust, Inc. Yes x No o | Essex Portfolio, L.P. Yes x No o |
Essex Property Trust, Inc. Yes x No o | Essex Portfolio, L.P. Yes x No o |
Essex Property Trust, Inc. o | Essex Portfolio, L.P. o |
Large accelerated filer | Accelerated filer | Non-accelerated filer | Smaller reporting company |
Large accelerated filer o | Accelerated filer o | Non-accelerated filer x (Do not check if a smaller reporting company) | Smaller reporting company o |
Essex Property Trust, Inc. Yes o No x | Essex Portfolio, L.P. Yes o No x |
| Part I. | Page | |
| Item 1. | ||
| Item 1A. | ||
| Item 1B. | ||
| Item 2. | ||
| Item 3. | ||
| Item 4. | ||
| Part II. | ||
| Item 5. | ||
| Item 6. | ||
| Item 7. | ||
| Item 7A. | ||
| Item 8. | ||
| Item 9. | ||
| Item 9A. | ||
| Item 9B. | ||
| Part III. | ||
| Item 10. | ||
| Item 11. | ||
| Item 12. | ||
| Item 13. | ||
| Item 14. | ||
| Part IV. | ||
| Item 15. | ||
| Constraints on new supply driven by: (i) low availability of developable land sites where competing housing could be economically built; (ii) political growth barriers, such as protected land, urban growth boundaries, and potential lengthy and expensive development permit processes; and (iii) natural limitations to development, such as mountains or waterways; |
| Rental demand is enhanced by affordability of rents relative to costs of |
| Property Name | Location | Apartment Homes | Essex Ownership Percentage | Ownership | Quarter in 2015 | Purchase Price | ||||||||||
| 8th & Hope | Los Angeles, CA | 290 | 100 | % | EPLP | Q1 | $ | 200.0 | ||||||||
The Huxley (1) | Los Angeles, CA | 187 | 100 | % | EPLP | Q1 | 48.8 | |||||||||
The Dylan (1) | Los Angeles, CA | 184 | 100 | % | EPLP | Q1 | 51.3 | |||||||||
Reveal (2) | Woodland Hills, CA | 438 | 99.75 | % | EPLP | Q2 | 73.0 | |||||||||
| Avant | Los Angeles, CA | 247 | 100 | % | EPLP | Q2 | 99.0 | |||||||||
| Avant II | Los Angeles, CA | 193 | 100 | % | EPLP | Q4 | 73.0 | |||||||||
| Enso | San Jose, CA | 183 | 100 | % | EPLP | Q4 | 93.0 | |||||||||
| Total 2015 | 1,722 | $ | 638.1 | |||||||||||||
(1) | In March |
(2) | In April |
| As of 12/31/07 ($ in millions) | ||||||||||||
| Estimated | Incurred | Projected | ||||||||||
| Development Pipeline | Location | Units | Project Cost(1) | Project Cost | Stabilization | |||||||
| Development Projects | ||||||||||||
| Belmont Station | Los Angeles, CA | 275 | $ | 71.1 | $ | 55.5 | Dec-08 | |||||
| The Grand | Oakland, CA | 238 | 96.2 | 42.0 | May-09 | |||||||
| Fourth Street | Berkeley, CA | 171 | 69.4 | 13.4 | Aug-10 | |||||||
| 684 | 236.7 | 110.9 | ||||||||||
| Predevelopment projects | various | 1,658 | 508.4 | 97.1 | Nov-10 to Jul-14 | |||||||
| Land held for future development | various | 434 | 25.5 | 25.5 | - | |||||||
| Consolidated Development Pipeline | 2,776 | $ | 770.6 | $ | 233.5 | |||||||
| As of | ||||||||||||||||
| 12/31/2015 | ||||||||||||||||
| Essex | Incurred | Estimated | ||||||||||||||
| Development Pipeline | Location | Ownership% | Apartment Homes | Project Cost (1) | Project Cost(1) | |||||||||||
| Development Projects - Consolidated | ||||||||||||||||
| MB 360 - Phase II | San Francisco, CA | 100 | % | 172 | $ | 119 | $ | 135 | ||||||||
| Station Park Green | San Mateo, CA | 100 | % | 599 | 83 | 354 | ||||||||||
| Total - Consolidated Development Projects | 771 | 202 | 489 | |||||||||||||
| Development Projects - Joint Venture | ||||||||||||||||
| Epic - Phase III | San Jose, CA | 55 | % | 200 | 84 | 92 | ||||||||||
Agora(2) | Walnut Creek, CA | 51 | % | 49 | 84 | 95 | ||||||||||
| Owens | Pleasanton, CA | 55 | % | 255 | 55 | 89 | ||||||||||
| Hacienda | Pleasanton, CA | 55 | % | 251 | 37 | 86 | ||||||||||
| Century Towers | San Jose, CA | 50 | % | 376 | 93 | 172 | ||||||||||
500 Folsom (3) | San Francisco, CA | 50 | % | 545 | 62 | 381 | ||||||||||
| Total - Joint Venture Development Projects | 1,676 | 415 | 915 | |||||||||||||
| Predevelopment Projects - Consolidated | ||||||||||||||||
| Other Projects | various | 100 | % | — | 40 | 40 | ||||||||||
| Total - Predevelopment Projects | — | 40 | 40 | |||||||||||||
| Grand Total - Development and Predevelopment Pipeline | 2,447 | $ | 657 | $ | 1,444 | |||||||||||
(1) | Includes costs related to the entire project, including both the Company's and joint venture partners' costs. Includes incurred costs and estimated costs to complete these development projects. For predevelopment projects, only incurred costs are included in estimated costs. |
(2) | Estimated project costs for this development include costs to develop both residential and commercial space. |
(3) | Estimated project cost for this development is net of a projected value for low-income housing tax credit proceeds and savings from tax exempt bonds. |
| As of 12/31/07 ($ in thousands) | ||||||||||
| Estimated | Incurred | |||||||||
| Redevelopment Pipeline | Location | Units | Renovation Cost(1) | Project Cost | ||||||
| Southern California | ||||||||||
| Avondale at Warner Center | Woodland Hills, CA | 446 | $ | 14,070 | $ | 11,188 | ||||
| Highridge | Rancho Palos Verde, CA | 255 | 16,063 | 1,976 | ||||||
| Mira Monte | Mira Mesa, CA | 355 | 6,060 | 5,900 | ||||||
| Pathways | Long Beach, CA | 296 | 10,721 | 5,788 | ||||||
| Northern California | ||||||||||
| Boulevard (Treetops) | Fremont, CA | 172 | 8,387 | 5,757 | ||||||
| Bridgeport (Summerhill Commons) | Newark, CA | 184 | 4,586 | 3,869 | ||||||
| Marina Cove | Santa Clara, CA | 292 | 9,858 | 805 | ||||||
| Montclaire (Oak Pointe) - Phase I-III | Sunnyvale, CA | 390 | 15,106 | 5,688 | ||||||
| Wimbledon Woods | Hayward, CA | 560 | 9,350 | 7,195 | ||||||
| Seattle Metro | ||||||||||
| Palisades - Phase I and II | Bellevue, WA | 192 | 6,951 | 6,461 | ||||||
Sammamish View(2) | Bellevue, WA | 153 | 3,875 | 3,875 | ||||||
| Woodland Commons | Bellevue, WA | 236 | 11,779 | 1,240 | ||||||
| Foothill Commons | Bellevue, WA | 360 | 18,804 | 1,298 | ||||||
| Total Redevelopment Pipeline | 3,891 | $ | 135,610 | $ | 61,040 | |||||
| As of 12/31/07 ($ in millions) | ||||||||||||
| Estimated | Incurred | Projected | ||||||||||
| Development Pipeline - Fund II | Location | Units | Project Cost(1) | Project Cost | Stabilization | |||||||
| Development Projects | ||||||||||||
| Eastlake 2851 on Lake Union | Seattle, WA | 127 | $ | 35.4 | $ | 24.7 | Jul-08 | |||||
| Studio 40-41 | Studio City, CA | 149 | 60.6 | 30.7 | Aug-09 | |||||||
| Cielo | Chatsworth, CA | 119 | 39.4 | 12.3 | Sep-09 | |||||||
| Fund II - Development Pipeline | 395 | $ | 135.4 | $ | 67.7 | |||||||
| Redevelopment Pipeline - Fund II | ||||||||||||
| Redevelopment Projects | ||||||||||||
| Regency Tower - Phase I - II | Oakland, CA | 178 | $ | 4.5 | $ | 3.7 | ||||||
| The Renaissance | Los Angeles, CA | 168 | 5.0 | 3.6 | ||||||||
| Fund II - Redevelopment Pipeline | 346 | $ | 9.5 | $ | 7.3 | |||||||
| Rentable | ||||||||||||
| Square | Year | Year | ||||||||||
Apartment Communities (1) | Location | Units | Footage | Built | Acquired | Occupancy(2) | ||||||
| Southern California | ||||||||||||
| Alpine Country | Alpine, CA | 108 | 81,900 | 1986 | 2002 | 94% | ||||||
| Alpine Village | Alpine, CA | 306 | 254,400 | 1971 | 2002 | 96% | ||||||
| Barkley, The(3)(4) | Anaheim, CA | 161 | 139,800 | 1984 | 2000 | 97% | ||||||
| Bonita Cedars | Bonita, CA | 120 | 120,800 | 1983 | 2002 | 98% | ||||||
| Camarillo Oaks | Camarillo, CA | 564 | 459,000 | 1985 | 1996 | 96% | ||||||
| Camino Ruiz Square | Camarillo, CA | 160 | 105,448 | 1990 | 2006 | 97% | ||||||
| Mountain View | Camarillo, CA | 106 | 83,900 | 1980 | 2004 | 98% | ||||||
| Cardiff by the Sea | Cardiff, CA | 300 | 284,460 | 1986 | 2007 | 97% | ||||||
| Cambridge | Chula Vista, CA | 40 | 22,100 | 1965 | 2002 | 96% | ||||||
| Woodlawn Colonial | Chula Vista, CA | 159 | 104,500 | 1974 | 2002 | 93% | ||||||
| Mesa Village | Clairemont, CA | 133 | 43,600 | 1963 | 2002 | 99% | ||||||
| Parcwood(5) | Corona, CA | 312 | 270,000 | 1989 | 2004 | 95% | ||||||
| Coral Gardens | El Cajon, CA | 200 | 182,000 | 1976 | 2002 | 94% | ||||||
| Tierra del Sol/Norte | El Cajon, CA | 156 | 117,000 | 1969 | 2002 | 97% | ||||||
| Grand Regency | Escondido, CA | 60 | 42,400 | 1967 | 2002 | 98% | ||||||
| Valley Park(6) | Fountain Valley, CA | 160 | 169,700 | 1969 | 2001 | 96% | ||||||
| Capri at Sunny Hills(6) | Fullerton, CA | 100 | 128,100 | 1961 | 2001 | 97% | ||||||
| Wilshire Promenade | Fullerton, CA | 149 | 128,000 | 1992(7) | 1997 | 94% | ||||||
| Montejo(6) | Garden Grove, CA | 124 | 103,200 | 1974 | 2001 | 97% | ||||||
| CBC Apartments | Goleta, CA | 148 | 91,538 | 1962 | 2006 | 98% | ||||||
| Chimney Sweep Apartments | Goleta, CA | 91 | 88,370 | 1967 | 2006 | 95% | ||||||
| Hampton Court (Columbus) | Glendale, CA | 83 | 71,500 | 1974(8) | 1999 | 94% | ||||||
| Hampton Place (Lorraine) | Glendale, CA | 132 | 141,500 | 1970(9) | 1999 | 95% | ||||||
| Devonshire | Hemet, CA | 276 | 207,200 | 1988 | 2002 | 92% | ||||||
| Huntington Breakers | Huntington Beach, CA | 342 | 241,700 | 1984 | 1997 | 97% | ||||||
| Hillsborough Park | La Habra, CA | 235 | 215,500 | 1999 | 1999 | 96% | ||||||
| Trabuco Villas | Lake Forest, CA | 132 | 131,000 | 1985 | 1997 | 98% | ||||||
| Marbrisa | Long Beach, CA | 202 | 122,800 | 1987 | 2002 | 97% | ||||||
| Pathways | Long Beach, CA | 296 | 197,700 | 1975(10) | 1991 | 85% | ||||||
| Bunker Hill | Los Angeles, CA | 456 | 346,600 | 1968 | 1998 | 96% | ||||||
| Cochran Apartments | Los Angeles, CA | 58 | 51,400 | 1989 | 1998 | 93% | ||||||
| Kings Road | Los Angeles, CA | 196 | 132,100 | 1979(11) | 1997 | 96% | ||||||
| Marbella, The | Los Angeles, CA | 60 | 50,108 | 1991 | 2005 | 90% | ||||||
| Marina City Club(12) | Los Angeles, CA | 101 | 127,200 | 1971 | 2004 | 95% | ||||||
| Park Place | Los Angeles, CA | 60 | 48,000 | 1988 | 1997 | 93% | ||||||
| Renaissance, The(5) | Los Angeles, CA | 168 | 154,268 | 1990(13) | 2006 | 84% | ||||||
| Windsor Court | Los Angeles, CA | 58 | 46,600 | 1988 | 1997 | 93% | ||||||
| Mirabella(14) | Marina Del Rey, CA | 188 | 176,800 | 2000 | 2000 | 98% | ||||||
| Mira Monte | Mira Mesa, CA | 355 | 262,600 | 1982(15) | 2002 | 96% | ||||||
| Hillcrest Park | Newbury Park, CA | 608 | 521,900 | 1973(16)(17) | 1998 | 96% | ||||||
| Fairways(18) | Newport Beach, CA | 74 | 107,100 | 1972 | 1999 | 90% | ||||||
| Country Villas | Oceanside, CA | 180 | 179,700 | 1976 | 2002 | 97% | ||||||
| Mission Hills | Oceanside, CA | 282 | 244,000 | 1984 | 2005 | 97% | ||||||
| Mariner's Place | Oxnard, CA | 105 | 77,200 | 1987 | 2000 | 98% | ||||||
| Monterey Villas | Oxnard, CA | 122 | 122,100 | 1974(19) | 1997 | 98% | ||||||
| Tierra Vista | Oxnard, CA | 404 | 387,100 | 2001 | 2001 | 96% | ||||||
| Monterra del Mar | Pasadena, CA | 123 | 74,400 | 1972(20) | 1997 | 94% | ||||||
| Monterra del Rey | Pasadena, CA | 84 | 73,100 | 1972(21) | 1999 | 92% | ||||||
| Monterra del Sol | Pasadena, CA | 85 | 69,200 | 1972(22) | 1999 | 96% | ||||||
| Villa Angelina(6) | Placentia, CA | 256 | 217,600 | 1970 | 2001 | 97% | ||||||
| (continued) | ||||||||||||
| Rentable | ||||||||||||
| Square | Year | Year | ||||||||||
Apartment Communities (1) | Location | Units | Footage | Built | Acquired | Occupancy(2) | ||||||
| Southern California (continued) | ||||||||||||
| Fountain Park | Playa Vista, CA | 705 | 608,900 | 2002 | 2004 | 96% | ||||||
| Highridge(6) | Rancho Palos Verdes, CA | 255 | 290,200 | 1972(23) | 1997 | 92% | ||||||
| Bluffs II, The(24) | San Diego, CA | 224 | 126,700 | 1974 | 1997 | 98% | ||||||
| Summit Park | San Diego, CA | 300 | 229,400 | 1972 | 2002 | 97% | ||||||
| Vista Capri - North | San Diego, CA | 106 | 51,800 | 1975 | 2002 | 98% | ||||||
| Brentwood (Hearthstone)(6) | Santa Ana, CA | 140 | 154,800 | 1970 | 2001 | 96% | ||||||
| Treehouse(6) | Santa Ana, CA | 164 | 135,700 | 1970 | 2001 | 95% | ||||||
| Hope Ranch Collection | Santa Barbara, CA | 108 | 126,700 | 1965&73 | 2007 | 95% | ||||||
| Carlton Heights | Santee, CA | 70 | 48,400 | 1979 | 2002 | 94% | ||||||
| Hidden Valley (Parker Ranch)(25) | Simi Valley, CA | 324 | 310,900 | 2004 | 2004 | 94% | ||||||
| Meadowood | Simi Valley, CA | 320 | 264,500 | 1986 | 1996 | 91% | ||||||
| Shadow Point | Spring Valley, CA | 172 | 131,200 | 1983 | 2002 | 97% | ||||||
| Coldwater Canyon | Studio City, CA | 39 | 34,125 | 1979 | 2007 | 70% | ||||||
| Lofts at Pinehurst, The | Ventura, CA | 118 | 71,100 | 1971(26) | 1997 | 97% | ||||||
| Pinehurst(27) | Ventura, CA | 28 | 21,200 | 1973 | 2004 | 98% | ||||||
| Woodside Village | Ventura, CA | 145 | 136,500 | 1987 | 2004 | 96% | ||||||
| Walnut Heights | Walnut, CA | 163 | 146,700 | 1964 | 2003 | 94% | ||||||
| Avondale at Warner Center | Woodland Hills, CA | 446 | 331,000 | 1970(28) | 1997 | 92% | ||||||
| 13,205 | 11,038,017 | 95% | ||||||||||
| Northern California | ||||||||||||
| Belmont Terrace | Belmont, CA | 71 | 72,951 | 1974 | 2006 | 96% | ||||||
| Carlmont Woods(5) | Belmont, CA | 195 | 107,200 | 1971 | 2004 | 98% | ||||||
| Davey Glen(5) | Belmont, CA | 69 | 65,974 | 1962 | 2006 | 92% | ||||||
| Pointe at Cupertino, The | Cupertino, CA | 116 | 135,200 | 1963(29) | 1998 | 98% | ||||||
| Harbor Cove(5) | Foster City, CA | 400 | 306,600 | 1971 | 2004 | 97% | ||||||
| Stevenson Place | Fremont, CA | 200 | 146,200 | 1971(30) | 1983 | 95% | ||||||
| Boulevard (Treetops) | Fremont, CA | 172 | 131,200 | 1978(31) | 1996 | 87% | ||||||
| Waterstone at Fremont (Mountain Vista)(32) | Fremont, CA | 526 | 433,100 | 1975 | 2000 | 94% | ||||||
| City View (Wimbledon Woods) | Hayward, CA | 560 | 462,400 | 1975(33) | 1998 | 95% | ||||||
| Alderwood Park(5) | Newark, CA | 96 | 74,624 | 1987 | 2006 | 97% | ||||||
| Bridgeport (Summerhill Commons) | Newark, CA | 184 | 139,000 | 1987(34) | 1987 | 96% | ||||||
| Regency Towers(5) | Oakland, CA | 178 | 140,900 | 1975(35) | 2005 | 92% | ||||||
| San Marcos (Vista del Mar) | Richmond, CA | 432 | 407,600 | 2003 | 2003 | 96% | ||||||
| Mt. Sutro | San Francisco, CA | 99 | 64,000 | 1973 | 2001 | 98% | ||||||
| Carlyle, The | San Jose, CA | 132 | 129,200 | 2000 | 2000 | 97% | ||||||
| Enclave, The(5) | San Jose, CA | 637 | 525,463 | 1998 | 2005 | 96% | ||||||
| Esplanade | San Jose, CA | 278 | 279,000 | 2002 | 2004 | 97% | ||||||
| Waterford, The | San Jose, CA | 238 | 219,600 | 2000 | 2000 | 98% | ||||||
| Hillsdale Garden Apartments(36) | San Mateo, CA | 697 | 611,505 | 1948 | 2006 | 96% | ||||||
| Bel Air | San Ramon, CA | 462 | 391,000 | 1988(37) | 1997 | 96% | ||||||
| Canyon Oaks | San Ramon, CA | 250 | 237,894 | 2005 | 2007 | 94% | ||||||
| Foothill Gardens | San Ramon, CA | 132 | 155,100 | 1985 | 1997 | 94% | ||||||
| Mill Creek at Windermere | San Ramon, CA | 400 | 381,060 | 2005 | 2007 | 93% | ||||||
| Twin Creeks | San Ramon, CA | 44 | 51,700 | 1985 | 1997 | 94% | ||||||
| Le Parc Luxury Apartments | Santa Clara, CA | 140 | 113,200 | 1975(38) | 1994 | 98% | ||||||
| Marina Cove(39) | Santa Clara, CA | 292 | 250,200 | 1974(40) | 1994 | 98% | ||||||
| Harvest Park | Santa Rosa, CA | 104 | 116,628 | 2004 | 2007 | 95% | ||||||
| Bristol Commons | Sunnyvale, CA | 188 | 142,600 | 1989 | 1997 | 97% | ||||||
| Brookside Oaks(6) | Sunnyvale, CA | 170 | 119,900 | 1973 | 2000 | 99% | ||||||
| Magnolia Lane(41) | Sunnyvale, CA | 32 | 31,541 | 2001 | 2007 | 97% | ||||||
| Montclaire, The (Oak Pointe) | Sunnyvale, CA | 390 | 294,100 | 1973(42) | 1988 | 90% | ||||||
| Summerhill Park | Sunnyvale, CA | 100 | 78,500 | 1988 | 1988 | 98% | ||||||
| Thomas Jefferson(6) | Sunnyvale, CA | 156 | 110,824 | 1969 | 2007 | 100% | ||||||
| Windsor Ridge | Sunnyvale, CA | 216 | 161,800 | 1989 | 1989 | 96% | ||||||
| Vista Belvedere | Tiburon, CA | 76 | 78,300 | 1963 | 2004 | 94% | ||||||
| Tuscana | Tracy, CA | 30 | 29,088 | 2007 | 2007 | 84% | ||||||
| 8,462 | 7,195,152 | 96% | ||||||||||
| (continued) | ||||||||||||
| Rentable | ||||||||||||
| Square | Year | Year | ||||||||||
Apartment Communities (1) | Location | Units | Footage | Built | Acquired | Occupancy(2) | ||||||
| Seattle, Washington Metropolitan Area | ||||||||||||
| Cedar Terrace | Bellevue, WA | 180 | 174,200 | 1984 | 2005 | 95% | ||||||
| Emerald Ridge-North | Bellevue, WA | 180 | 144,000 | 1987 | 1994 | 95% | ||||||
| Foothill Commons | Bellevue, WA | 360 | 288,300 | 1978(43) | 1990 | 99% | ||||||
| Palisades, The | Bellevue, WA | 192 | 159,700 | 1977(44) | 1990 | 94% | ||||||
| Sammamish View | Bellevue, WA | 153 | 133,500 | 1986(45) | 1994 | 87% | ||||||
| Woodland Commons | Bellevue, WA | 236 | 172,300 | 1978(43) | 1990 | 99% | ||||||
| Canyon Pointe | Bothell, WA | 250 | 210,400 | 1990 | 2003 | 97% | ||||||
| Inglenook Court | Bothell, WA | 224 | 183,600 | 1985 | 1994 | 94% | ||||||
| Salmon Run at Perry Creek | Bothell, WA | 132 | 117,100 | 2000 | 2000 | 97% | ||||||
| Stonehedge Village | Bothell, WA | 196 | 214,800 | 1986 | 1997 | 95% | ||||||
| Park Hill at Issaquah | Issaquah, WA | 245 | 277,700 | 1999 | 1999 | 96% | ||||||
| Wandering Creek | Kent, WA | 156 | 124,300 | 1986 | 1995 | 98% | ||||||
| Bridle Trails | Kirkland, WA | 108 | 73,400 | 1986(46) | 1997 | 97% | ||||||
| Evergreen Heights | Kirkland, WA | 200 | 188,300 | 1990 | 1997 | 96% | ||||||
| Laurels at Mill Creek, The | Mill Creek, WA | 164 | 134,300 | 1981 | 1996 | 97% | ||||||
| Morning Run(5) | Monroe, WA | 222 | 221,786 | 1991 | 2005 | 97% | ||||||
| Anchor Village(6) | Mukilteo, WA | 301 | 245,900 | 1981 | 1997 | 96% | ||||||
| Castle Creek | Newcastle, WA | 216 | 191,900 | 1997 | 1997 | 95% | ||||||
| Brighton Ridge | Renton, WA | 264 | 201,300 | 1986 | 1996 | 96% | ||||||
| Fairwood Pond | Renton, WA | 194 | 189,200 | 1997 | 2004 | 95% | ||||||
| Forest View | Renton, WA | 192 | 182,500 | 1998 | 2003 | 96% | ||||||
| Cairns, The | Seattle, WA | 100 | 70,806 | 2006 | 2007 | 95% | ||||||
| Fountain Court | Seattle, WA | 320 | 207,000 | 2000 | 2000 | 96% | ||||||
| Linden Square | Seattle, WA | 183 | 142,200 | 1994 | 2000 | 97% | ||||||
| Maple Leaf | Seattle, WA | 48 | 35,500 | 1986 | 1997 | 99% | ||||||
| Spring Lake | Seattle, WA | 69 | 42,300 | 1986 | 1997 | 99% | ||||||
| Tower @ 801(5) | Seattle, WA | 173 | 118,500 | 1970 | 2005 | 97% | ||||||
| Wharfside Pointe | Seattle, WA | 142 | 119,200 | 1990 | 1994 | 97% | ||||||
| Echo Ridge(5) | Snoqualmie, WA | 120 | 124,539 | 2000 | 2005 | 97% | ||||||
| 5,520 | 4,688,531 | 96% | ||||||||||
| Other Region | ||||||||||||
| St. Cloud | Houston, TX | 302 | 306,800 | 1968 | 2002 | 93% | ||||||
| 302 | 306,800 | 93% | ||||||||||
| Total/Weighted Average | 27,489 | 23,228,500 | 96% |
| Rentable | ||||||||||||
| Square | Year | Year | ||||||||||
Other real estate assets(1) | Location | Tenants | Footage | Built | Acquired | Occupancy(2) | ||||||
| Office Buildings | ||||||||||||
| 535 - 575 River Oaks(47) | San Jose, CA | 1 | 262,500 | 1990 | 2007 | 100% | ||||||
| 925 East Meadow Drive(48) | Palo Alto, CA | 1 | 17,400 | 1988 | 1997 | 100% | ||||||
| 935 East Meadow Drive(49) | Palo Alto, CA | - | 14,500 | 1962 | 2007 | 0% | ||||||
| 6230 Sunset Blvd(47) | Los Angeles, CA | 1 | 35,000 | 1938 | 2006 | 100% | ||||||
| 17461 Derian Ave(50) | Irvine, CA | 3 | 110,000 | 1983 | 2000 | 100% | ||||||
| 22110-22120 Clarendon Street(51) | Woodland Hills, CA | 9 | 38,940 | 1982 | 2001 | 100% | ||||||
| Total Office Buildings | 15 | 478,340 | 100% | |||||||||
| Recreational Vehicle Parks | ||||||||||||
| Circle RV | El Cajon, CA | 179 spaces | 1977 | 2002 | (52) | |||||||
| Vacationer | El Cajon, CA | 159 spaces | 1973 | 2002 | (52) | |||||||
| Total Recreational Vehicle Parks | 338 spaces | |||||||||||
| Manufactured Housing Community | ||||||||||||
| Green Valley | Vista, CA | 157 sites | 1973 | 2002 | (52) | |||||||
| Total Manufactured Housing Community | 157 sites |
| Apartment | Rentable | Year | Year | |||||||||||
Communities (1) | Location | Homes | Square Footage | Built | Acquired | Occupancy(2) | ||||||||
| Southern California | ||||||||||||||
| Alpine Village | Alpine, CA | 301 | 254,400 | 1971 | 2002 | 97% | ||||||||
| Anavia | Anaheim, CA | 250 | 312,343 | 2009 | 2010 | 96% | ||||||||
| Apartment | Rentable | Year | Year | |||||||||||
Communities (1) | Location | Homes | Square Footage | Built | Acquired | Occupancy(2) | ||||||||
Barkley, The (3)(4) | Anaheim, CA | 161 | 139,800 | 1984 | 2000 | 98% | ||||||||
| Park Viridian | Anaheim, CA | 320 | 254,600 | 2008 | 2014 | 96% | ||||||||
| Bonita Cedars | Bonita, CA | 120 | 120,800 | 1983 | 2002 | 97% | ||||||||
| Camarillo Oaks | Camarillo, CA | 564 | 459,000 | 1985 | 1996 | 96% | ||||||||
| Camino Ruiz Square | Camarillo, CA | 160 | 105,448 | 1990 | 2006 | 97% | ||||||||
Enclave at Town Square (21) | Chino Hills, CA | 124 | 89,948 | 1987 | 2014 | 97% | ||||||||
The Heights I & II (21) | Chino Hills, CA | 332 | 324,370 | 2004 | 2014 | 96% | ||||||||
The Summit (5) | Chino Hills, CA | 125 | 98,420 | 1989 | 2014 | 98% | ||||||||
| Pinnacle at Otay Ranch | Chula Vista, CA | 364 | 384,192 | 2001 | 2014 | 95% | ||||||||
| Mesa Village | Clairemont, CA | 133 | 43,600 | 1963 | 2002 | 98% | ||||||||
| Villa Siena | Costa Mesa, CA | 272 | 262,842 | 1974 | 2014 | 96% | ||||||||
| Emerald Pointe | Diamond Bar, CA | 160 | 134,816 | 1989 | 2014 | 96% | ||||||||
| Regency at Encino | Encino, CA | 75 | 78,487 | 1989 | 2009 | 97% | ||||||||
The Havens (21) | Fountain Valley, CA | 440 | 414,040 | 1969 | 2014 | 96% | ||||||||
Valley Park (4) | Fountain Valley, CA | 160 | 169,700 | 1969 | 2001 | 97% | ||||||||
Capri at Sunny Hills (4) | Fullerton, CA | 100 | 128,100 | 1961 | 2001 | 97% | ||||||||
Haver Hill (5) | Fullerton, CA | 264 | 224,130 | 1973 | 2012 | 96% | ||||||||
| Pinnacle at Fullerton | Fullerton, CA | 192 | 174,336 | 2004 | 2014 | 96% | ||||||||
| Wilshire Promenade | Fullerton, CA | 149 | 128,000 | 1992 | 1997 | 96% | ||||||||
Montejo (4) | Garden Grove, CA | 124 | 103,200 | 1974 | 2001 | 97% | ||||||||
| CBC Apartments | Goleta, CA | 148 | 91,538 | 1962 | 2006 | 97% | ||||||||
| The Sweeps | Goleta, CA | 91 | 88,370 | 1967 | 2006 | 97% | ||||||||
| 416 on Broadway | Glendale, CA | 115 | 126,782 | 2009 | 2010 | 96% | ||||||||
| Hampton Court | Glendale, CA | 83 | 71,500 | 1974 | 1999 | 93% | ||||||||
| Hampton Place | Glendale, CA | 132 | 141,500 | 1970 | 1999 | 93% | ||||||||
| Devonshire | Hemet, CA | 276 | 207,200 | 1988 | 2002 | 96% | ||||||||
| Huntington Breakers | Huntington Beach, CA | 342 | 241,700 | 1984 | 1997 | 95% | ||||||||
| The Huntington | Huntington Beach, CA | 276 | 202,256 | 1975 | 2012 | 97% | ||||||||
| Axis 2300 | Irvine, CA | 115 | 170,714 | 2010 | 2010 | 97% | ||||||||
| Hillsborough Park | La Habra, CA | 235 | 215,500 | 1999 | 1999 | 97% | ||||||||
| Village Green | La Habra, CA | 272 | 175,762 | 1971 | 2014 | 97% | ||||||||
| The Palms at Laguna Niguel | Laguna Niguel, CA | 460 | 362,136 | 1988 | 2014 | 96% | ||||||||
| Trabuco Villas | Lake Forest, CA | 132 | 131,000 | 1985 | 1997 | 97% | ||||||||
| Marbrisa | Long Beach, CA | 202 | 122,800 | 1987 | 2002 | 96% | ||||||||
| Pathways | Long Beach, CA | 296 | 197,700 | 1975 | 1991 | 96% | ||||||||
| 8th & Hope | Los Angeles, CA | 290 | 298,437 | 2014 | 2015 | 79% | ||||||||
| 5600 Wilshire | Los Angeles, CA | 284 | 243,910 | 2008 | 2014 | 96% | ||||||||
| Alessio | Los Angeles, CA | 624 | 552,716 | 2001 | 2014 | 95% | ||||||||
| Avant | Los Angeles, CA | 440 | 305,989 | 2014 | 2015 | 95% | ||||||||
The Avery (4) | Los Angeles, CA | 121 | 129,393 | 2014 | 2014 | 97% | ||||||||
| Bellerive | Los Angeles, CA | 63 | 79,296 | 2011 | 2011 | 97% | ||||||||
| Belmont Station | Los Angeles, CA | 275 | 225,000 | 2009 | 2009 | 97% | ||||||||
| Bunker Hill | Los Angeles, CA | 456 | 346,600 | 1968 | 1998 | 88% | ||||||||
| Catalina Gardens | Los Angeles, CA | 128 | 117,585 | 1987 | 2014 | 97% | ||||||||
| Cochran Apartments | Los Angeles, CA | 58 | 51,400 | 1989 | 1998 | 97% | ||||||||
Gas Company Lofts (5) | Los Angeles, CA | 251 | 226,666 | 2004 | 2013 | 97% | ||||||||
| Jefferson at Hollywood | Los Angeles, CA | 270 | 238,119 | 2010 | 2014 | 94% | ||||||||
| Kings Road | Los Angeles, CA | 196 | 132,100 | 1979 | 1997 | 96% | ||||||||
| Apartment | Rentable | Year | Year | |||||||||||
Communities (1) | Location | Homes | Square Footage | Built | Acquired | Occupancy(2) | ||||||||
| Marbella | Los Angeles, CA | 60 | 50,108 | 1991 | 2005 | 97% | ||||||||
| Muse | Los Angeles, CA | 152 | 135,292 | 2011 | 2011 | 97% | ||||||||
Pacific Electric Lofts (6) | Los Angeles, CA | 314 | 277,980 | 2006 | 2012 | 94% | ||||||||
| Park Catalina | Los Angeles, CA | 90 | 72,864 | 2002 | 2012 | 96% | ||||||||
| Park Place | Los Angeles, CA | 60 | 48,000 | 1988 | 1997 | 97% | ||||||||
Regency Palm Court (5) | Los Angeles, CA | 116 | 54,844 | 1987 | 2014 | 96% | ||||||||
| Santee Court | Los Angeles, CA | 165 | 132,040 | 2004 | 2010 | 97% | ||||||||
| Santee Village | Los Angeles, CA | 73 | 69,817 | 2011 | 2011 | 97% | ||||||||
| Tiffany Court | Los Angeles, CA | 101 | 74,538 | 1987 | 2014 | 98% | ||||||||
| Wilshire La Brea | Los Angeles, CA | 478 | 354,972 | 2014 | 2014 | 95% | ||||||||
Windsor Court (5) | Los Angeles, CA | 95 | 51,266 | 1987 | 2014 | 95% | ||||||||
| Windsor Court | Los Angeles, CA | 58 | 46,600 | 1988 | 1997 | 97% | ||||||||
| Aqua at Marina Del Rey | Marina Del Rey, CA | 500 | 479,312 | 2001 | 2014 | 95% | ||||||||
Marina City Club (7) | Marina Del Rey, CA | 101 | 127,200 | 1971 | 2004 | 96% | ||||||||
| Mirabella | Marina Del Rey, CA | 188 | 176,800 | 2000 | 2000 | 97% | ||||||||
| Mira Monte | Mira Mesa, CA | 355 | 262,600 | 1982 | 2002 | 96% | ||||||||
Madrid Apartments (6) | Mission Viejo, CA | 230 | 228,099 | 2000 | 2012 | 97% | ||||||||
| Hillcrest Park | Newbury Park, CA | 608 | 521,900 | 1973 | 1998 | 96% | ||||||||
Fairways (8) | Newport Beach, CA | 74 | 107,100 | 1972 | 1999 | 96% | ||||||||
| Candlewood North | Northridge, CA | 189 | 166,910 | 1964 | 2014 | 96% | ||||||||
Canyon Creek (21) | Northridge, CA | 200 | 148,150 | 1986 | 2014 | 96% | ||||||||
| Country Villas | Oceanside, CA | 180 | 179,700 | 1976 | 2002 | 96% | ||||||||
| Mission Hills | Oceanside, CA | 282 | 244,000 | 1984 | 2005 | 96% | ||||||||
| Renaissance at Uptown Orange | Orange, CA | 460 | 432,836 | 2007 | 2014 | 96% | ||||||||
| Mariner's Place | Oxnard, CA | 105 | 77,200 | 1987 | 2000 | 97% | ||||||||
| Monterey Villas | Oxnard, CA | 122 | 122,100 | 1974 | 1997 | 97% | ||||||||
| Tierra Vista | Oxnard, CA | 404 | 387,100 | 2001 | 2001 | 96% | ||||||||
Arbors Parc Rose (6) | Oxnard, CA | 373 | 503,196 | 2001 | 2011 | 95% | ||||||||
| The Hallie del Mar | Pasadena, CA | 123 | 74,400 | 1972 | 1997 | 92% | ||||||||
| The Hallie del Rey | Pasadena, CA | 84 | 73,100 | 1972 | 1999 | 92% | ||||||||
| The Hallie del Sol | Pasadena, CA | 85 | 69,200 | 1972 | 1999 | 92% | ||||||||
| Stuart at Sierra Madre Villa | Pasadena, CA | 188 | 168,630 | 2007 | 2014 | 96% | ||||||||
Villa Angelina (4) | Placentia, CA | 256 | 217,600 | 1970 | 2001 | 97% | ||||||||
| Fountain Park | Playa Vista, CA | 705 | 608,900 | 2002 | 2004 | 97% | ||||||||
Highridge (4) | Rancho Palos Verdes, CA | 255 | 290,200 | 1972 | 1997 | 98% | ||||||||
| Cortesia at Rancho Santa Margarita | Rancho Santa Margarita, CA | 308 | 277,580 | 1999 | 2014 | 96% | ||||||||
| Pinnacle at Talega | San Clemente, CA | 362 | 355,764 | 2002 | 2014 | 96% | ||||||||
| Allure at Scripps Ranch | San Diego, CA | 194 | 207,052 | 2002 | 2014 | 96% | ||||||||
| Bernardo Crest | San Diego, CA | 216 | 205,548 | 1988 | 2014 | 96% | ||||||||
| Cambridge Park | San Diego, CA | 320 | 317,958 | 1998 | 2014 | 95% | ||||||||
| Carmel Creek | San Diego, CA | 348 | 384,216 | 2000 | 2014 | 96% | ||||||||
| Carmel Landing | San Diego, CA | 356 | 283,426 | 1989 | 2014 | 94% | ||||||||
| Carmel Summit | San Diego, CA | 246 | 225,880 | 1989 | 2014 | 97% | ||||||||
| CentrePointe | San Diego, CA | 224 | 126,700 | 1974 | 1997 | 94% | ||||||||
| Domain | San Diego, CA | 379 | 345,044 | 2013 | 2013 | 94% | ||||||||
Esplanade (21) | San Diego, CA | 616 | 479,600 | 1986 | 2014 | 96% | ||||||||
| Apartment | Rentable | Year | Year | |||||||||||
Communities (1) | Location | Homes | Square Footage | Built | Acquired | Occupancy(2) | ||||||||
| Montanosa | San Diego, CA | 472 | 414,968 | 1990 | 2014 | 96% | ||||||||
| Summit Park | San Diego, CA | 300 | 229,400 | 1972 | 2002 | 96% | ||||||||
Essex Skyline at MacArthur Place (9) | Santa Ana, CA | 349 | 512,791 | 2008 | 2010 | 96% | ||||||||
Fairhaven (4) | Santa Ana, CA | 164 | 135,700 | 1970 | 2001 | 98% | ||||||||
Parkside Court (21) | Santa Ana, CA | 210 | 152,400 | 1986 | 2014 | 97% | ||||||||
| Pinnacle at MacArthur Place | Santa Ana, CA | 253 | 262,867 | 2002 | 2014 | 96% | ||||||||
| Hope Ranch | Santa Barbara, CA | 108 | 126,700 | 1965 / 1973 | 2007 | 98% | ||||||||
Bridgeport Coast (22) | Santa Clarita, CA | 188 | 168,198 | 2006 | 2014 | 97% | ||||||||
Hidden Valley (10) | Simi Valley, CA | 324 | 310,900 | 2004 | 2004 | 97% | ||||||||
| Meadowood | Simi Valley, CA | 320 | 264,500 | 1986 | 1996 | 96% | ||||||||
| Shadow Point | Spring Valley, CA | 172 | 131,200 | 1983 | 2002 | 96% | ||||||||
The Fairways at Westridge (22) | Valencia, CA | 234 | 223,330 | 2004 | 2014 | 96% | ||||||||
Vistas of West Hills (22) | Valencia, CA | 220 | 221,119 | 2009 | 2014 | 96% | ||||||||
| Allegro | Valley Village, CA | 97 | 127,812 | 2010 | 2010 | 97% | ||||||||
| Lofts at Pinehurst, The | Ventura, CA | 118 | 71,100 | 1971 | 1997 | 97% | ||||||||
Pinehurst (11) | Ventura, CA | 28 | 21,200 | 1973 | 2004 | 98% | ||||||||
| Woodside Village | Ventura, CA | 145 | 136,500 | 1987 | 2004 | 97% | ||||||||
| Walnut Heights | Walnut, CA | 163 | 146,700 | 1964 | 2003 | 95% | ||||||||
| The Dylan | West Hollywood, CA | 184 | 150,678 | 2014 | 2014 | 92% | ||||||||
| The Huxley | West Hollywood, CA | 187 | 154,776 | 2014 | 2014 | 93% | ||||||||
| Reveal | Woodland Hills, CA | 438 | 414,892 | 2010 | 2011 | 95% | ||||||||
| Avondale at Warner Center | Woodland Hills, CA | 446 | 331,000 | 1970 | 1999 | 96% | ||||||||
| 28,039 | 24,850,294 | 96% | ||||||||||||
| Northern California | ||||||||||||||
| Belmont Terrace | Belmont, CA | 71 | 72,951 | 1974 | 2006 | 94% | ||||||||
| Fourth & U | Berkeley, CA | 171 | 146,255 | 2010 | 2010 | 96% | ||||||||
| The Commons | Campbell, CA | 264 | 153,168 | 1973 | 2010 | 97% | ||||||||
| The Pointe at Cupertino | Cupertino, CA | 116 | 135,200 | 1963 | 1998 | 98% | ||||||||
Connolly Station (23) | Dublin, CA | 309 | 286,348 | 2014 | 2014 | 96% | ||||||||
| Avenue 64 | Emeryville, CA | 224 | 196,896 | 2007 | 2014 | 94% | ||||||||
Emme (23) | Emeryville, CA | 190 | 148,935 | 2015 | 2015 | 81% | ||||||||
| Foster's Landing | Foster City, CA | 490 | 415,130 | 1987 | 2014 | 96% | ||||||||
| Stevenson Place | Fremont, CA | 200 | 146,200 | 1975 | 2000 | 95% | ||||||||
| Mission Peaks | Fremont, CA | 453 | 404,034 | 1995 | 2014 | 96% | ||||||||
| Mission Peaks II | Fremont, CA | 336 | 294,720 | 1989 | 2014 | 96% | ||||||||
| Paragon Apartments | Fremont, CA | 301 | 267,047 | 2013 | 2014 | 94% | ||||||||
| Boulevard | Fremont, CA | 172 | 131,200 | 1978 | 1996 | 97% | ||||||||
Briarwood (6) | Fremont, CA | 160 | 111,160 | 1978 | 2011 | 96% | ||||||||
The Woods (6) | Fremont, CA | 160 | 105,280 | 1978 | 2011 | 96% | ||||||||
City Centre (22) | Hayward, CA | 192 | 175,420 | 2000 | 2014 | 97% | ||||||||
| City View | Hayward, CA | 572 | 462,400 | 1975 | 1998 | 97% | ||||||||
| Lafayette Highlands | Lafayette, CA | 150 | 151,790 | 1973 | 2014 | 97% | ||||||||
| Apex | Milpitas, CA | 366 | 350,961 | 2014 | 2014 | 96% | ||||||||
Regency at Mountain View (5) | Mountain View, CA | 142 | 127,600 | 1970 | 2013 | 96% | ||||||||
| Bridgeport | Newark, CA | 184 | 139,000 | 1987 | 1987 | 98% | ||||||||
| The Landing at Jack London Square | Oakland, CA | 282 | 257,796 | 2001 | 2014 | 95% | ||||||||
| Apartment | Rentable | Year | Year | |||||||||||
Communities (1) | Location | Homes | Square Footage | Built | Acquired | Occupancy(2) | ||||||||
| The Grand | Oakland, CA | 243 | 205,026 | 2009 | 2009 | 96% | ||||||||
| Radius | Redwood City, CA | 264 | 245,862 | 2015 | 2015 | 94% | ||||||||
| San Marcos | Richmond, CA | 432 | 407,600 | 2003 | 2003 | 96% | ||||||||
| Bennett Lofts | San Francisco, CA | 165 | 184,713 | 2004 | 2012 | 95% | ||||||||
| Fox Plaza | San Francisco, CA | 443 | 230,017 | 1968 | 2013 | 95% | ||||||||
| MB 360 Phase I | San Francisco, CA | 188 | 222,810 | 2014 | 2014 | 96% | ||||||||
Mosso (23) | San Francisco, CA | 463 | 607,549 | 2014 | 2014 | 87% | ||||||||
| Park West | San Francisco, CA | 126 | 90,060 | 1958 | 2012 | 95% | ||||||||
| 101 San Fernando | San Jose, CA | 323 | 296,078 | 2001 | 2010 | 96% | ||||||||
| Bella Villagio | San Jose, CA | 231 | 227,511 | 2004 | 2010 | 97% | ||||||||
| Enso | San Jose, CA | 183 | 179,562 | 2014 | 2015 | 100% | ||||||||
Epic - Phase I & II (13) (23) | San Jose, CA | 569 | 472,236 | 2013 | 2013 | 95% | ||||||||
| Esplanade | San Jose, CA | 278 | 279,000 | 2002 | 2004 | 96% | ||||||||
| Fountains at River Oaks | San Jose, CA | 226 | 209,954 | 1990 | 2014 | 97% | ||||||||
| Museum Park | San Jose, CA | 117 | 121,329 | 2002 | 2014 | 97% | ||||||||
One South Market (23) | San Jose, CA | 312 | 283,268 | 2015 | 2015 | 46% | ||||||||
Palm Valley (16) | San Jose, CA | 1,098 | 1,132,284 | 2008 | 2014 | 96% | ||||||||
| The Carlyle | San Jose, CA | 132 | 129,200 | 2000 | 2000 | 97% | ||||||||
| The Waterford | San Jose, CA | 238 | 219,600 | 2000 | 2000 | 97% | ||||||||
| Willow Lake | San Jose, CA | 508 | 471,744 | 1989 | 2012 | 96% | ||||||||
| Lakeshore Landing | San Mateo, CA | 308 | 223,972 | 1988 | 2014 | 95% | ||||||||
| Hillsdale Garden | San Mateo, CA | 697 | 611,505 | 1948 | 2006 | 97% | ||||||||
Park 20 (23) | San Mateo, CA | 197 | 140,547 | 2015 | 2015 | 79% | ||||||||
| Deer Valley | San Rafael, CA | 171 | 167,238 | 1996 | 2014 | 97% | ||||||||
| Bel Air | San Ramon, CA | 462 | 391,000 | 1988 | 1995 | 96% | ||||||||
| Canyon Oaks | San Ramon, CA | 250 | 237,894 | 2005 | 2007 | 98% | ||||||||
| Crow Canyon | San Ramon, CA | 400 | 337,064 | 1992 | 2014 | 96% | ||||||||
| Foothill Gardens | San Ramon, CA | 132 | 155,100 | 1985 | 1997 | 97% | ||||||||
| Mill Creek at Windermere | San Ramon, CA | 400 | 381,060 | 2005 | 2007 | 97% | ||||||||
| Twin Creeks | San Ramon, CA | 44 | 51,700 | 1985 | 1997 | 97% | ||||||||
| 1000 Kiely | Santa Clara, CA | 121 | 128,486 | 1971 | 2011 | 95% | ||||||||
| Le Parc | Santa Clara, CA | 140 | 113,200 | 1975 | 1994 | 97% | ||||||||
Marina Cove (14) | Santa Clara, CA | 292 | 250,200 | 1974 | 1994 | 96% | ||||||||
Riley Square (6) | Santa Clara, CA | 156 | 126,900 | 1972 | 2012 | 95% | ||||||||
| Villa Granada | Santa Clara, CA | 270 | 238,841 | 2010 | 2014 | 96% | ||||||||
| Chestnut Street Apartments | Santa Cruz, CA | 96 | 87,640 | 2002 | 2008 | 97% | ||||||||
| Harvest Park | Santa Rosa, CA | 104 | 116,628 | 2004 | 2007 | 97% | ||||||||
| Bristol Commons | Sunnyvale, CA | 188 | 142,600 | 1989 | 1995 | 95% | ||||||||
Brookside Oaks (4) | Sunnyvale, CA | 170 | 119,900 | 1973 | 2000 | 95% | ||||||||
| Lawrence Station | Sunnyvale, CA | 336 | 297,188 | 2012 | 2014 | 96% | ||||||||
Magnolia Lane (15) | Sunnyvale, CA | 32 | 31,541 | 2001 | 2007 | 97% | ||||||||
Magnolia Square (4) | Sunnyvale, CA | 156 | 110,824 | 1963 | 2007 | 97% | ||||||||
| Montclaire | Sunnyvale, CA | 390 | 294,100 | 1973 | 1988 | 97% | ||||||||
| Reed Square | Sunnyvale, CA | 100 | 95,440 | 1970 | 2011 | 97% | ||||||||
| Solstice | Sunnyvale, CA | 280 | 571,466 | 2014 | 2014 | 96% | ||||||||
| Summerhill Park | Sunnyvale, CA | 100 | 78,500 | 1988 | 1988 | 95% | ||||||||
| Via | Sunnyvale, CA | 284 | 309,421 | 2011 | 2011 | 96% | ||||||||
| Windsor Ridge | Sunnyvale, CA | 216 | 161,800 | 1989 | 1989 | 96% | ||||||||
| Apartment | Rentable | Year | Year | |||||||||||
Communities (1) | Location | Homes | Square Footage | Built | Acquired | Occupancy(2) | ||||||||
| Vista Belvedere | Tiburon, CA | 76 | 78,300 | 1963 | 2004 | 95% | ||||||||
| Tuscana | Tracy, CA | 30 | 29,088 | 2007 | 2007 | 99% | ||||||||
Verandas (22) | Union City, CA | 282 | 199,092 | 1989 | 2014 | 96% | ||||||||
| 18,924 | 17,173,129 | 95% | ||||||||||||
| Seattle, Washington Metropolitan Area | ||||||||||||||
| Belcarra | Bellevue, WA | 296 | 241,567 | 2009 | 2014 | 96% | ||||||||
| BellCentre | Bellevue, WA | 248 | 181,288 | 2001 | 2014 | 96% | ||||||||
| Cedar Terrace | Bellevue, WA | 180 | 174,200 | 1984 | 2005 | 96% | ||||||||
| Courtyard off Main | Bellevue, WA | 110 | 108,388 | 2000 | 2010 | 96% | ||||||||
| Ellington at Bellevue | Bellevue, WA | 220 | 165,794 | 1994 | 2014 | 96% | ||||||||
| Emerald Ridge | Bellevue, WA | 180 | 144,000 | 1987 | 1994 | 96% | ||||||||
| Foothill Commons | Bellevue, WA | 394 | 288,300 | 1978 | 1990 | 96% | ||||||||
| Palisades, The | Bellevue, WA | 192 | 159,700 | 1977 | 1990 | 97% | ||||||||
| Park Highland | Bellevue, WA | 250 | 224,750 | 1993 | 2014 | 95% | ||||||||
| Piedmont | Bellevue, WA | 396 | 348,969 | 1969 | 2014 | 96% | ||||||||
| Sammamish View | Bellevue, WA | 153 | 133,500 | 1986 | 1994 | 97% | ||||||||
| Woodland Commons | Bellevue, WA | 302 | 217,878 | 1978 | 1990 | 95% | ||||||||
Bothell Ridge (21) | Bothell, WA | 214 | 167,370 | 1988 | 2014 | 96% | ||||||||
| Canyon Pointe | Bothell, WA | 250 | 210,400 | 1990 | 2003 | 95% | ||||||||
| Inglenook Court | Bothell, WA | 224 | 183,600 | 1985 | 1994 | 97% | ||||||||
| Pinnacle Sonata | Bothell, WA | 268 | 343,095 | 2000 | 2014 | 95% | ||||||||
| Salmon Run at Perry Creek | Bothell, WA | 132 | 117,100 | 2000 | 2000 | 98% | ||||||||
| Stonehedge Village | Bothell, WA | 196 | 214,800 | 1986 | 1997 | 97% | ||||||||
| Highlands at Wynhaven | Issaquah, WA | 333 | 424,674 | 2000 | 2008 | 96% | ||||||||
| Park Hill at Issaquah | Issaquah, WA | 245 | 277,700 | 1999 | 1999 | 97% | ||||||||
| Wandering Creek | Kent, WA | 156 | 124,300 | 1986 | 1995 | 97% | ||||||||
| Ascent | Kirkland, WA | 90 | 75,840 | 1988 | 2012 | 97% | ||||||||
| Bridle Trails | Kirkland, WA | 108 | 99,700 | 1986 | 1997 | 97% | ||||||||
| Corbella at Juanita Bay | Kirkland, WA | 169 | 103,339 | 1978 | 2010 | 96% | ||||||||
| Evergreen Heights | Kirkland, WA | 200 | 188,300 | 1990 | 1997 | 97% | ||||||||
| Slater 116 | Kirkland, WA | 108 | 81,415 | 2013 | 2013 | 96% | ||||||||
| Montebello | Kirkland, WA | 248 | 272,734 | 1996 | 2012 | 96% | ||||||||
Aviara (12) | Mercer Island, WA | 166 | 147,033 | 2013 | 2014 | 96% | ||||||||
| Laurels at Mill Creek | Mill Creek, WA | 164 | 134,300 | 1981 | 1996 | 97% | ||||||||
| Parkwood at Mill Creek | Mill Creek, WA | 240 | 257,160 | 1989 | 2014 | 95% | ||||||||
The Elliot at Mukilteo (4) | Mukilteo, WA | 301 | 245,900 | 1981 | 1997 | 95% | ||||||||
| Castle Creek | Newcastle, WA | 216 | 191,900 | 1998 | 1998 | 97% | ||||||||
| Delano | Redmond, WA | 126 | 116,340 | 2005 | 2011 | 97% | ||||||||
| Elevation | Redmond, WA | 158 | 138,916 | 1986 | 2010 | 97% | ||||||||
Redmond Hill (6) | Redmond, WA | 442 | 350,275 | 1985 | 2011 | 96% | ||||||||
| Shadowbrook | Redmond, WA | 418 | 338,880 | 1986 | 2014 | 97% | ||||||||
| The Trails of Redmond | Redmond, WA | 423 | 376,000 | 1985 | 2014 | 97% | ||||||||
Vesta (6) | Redmond, WA | 440 | 381,675 | 1998 | 2011 | 96% | ||||||||
| Brighton Ridge | Renton, WA | 264 | 201,300 | 1986 | 1996 | 97% | ||||||||
| Fairwood Pond | Renton, WA | 194 | 189,200 | 1997 | 2004 | 97% | ||||||||
| Forest View | Renton, WA | 192 | 182,500 | 1998 | 2003 | 97% | ||||||||
| Pinnacle on Lake Washington | Renton, WA | 180 | 190,908 | 2001 | 2014 | 96% | ||||||||
| Annaliese | Seattle, WA | 56 | 48,216 | 2009 | 2013 | 96% | ||||||||
| Apartment | Rentable | Year | Year | |||||||||||
Communities (1) | Location | Homes | Square Footage | Built | Acquired | Occupancy(2) | ||||||||
| The Audrey at Belltown | Seattle, WA | 137 | 94,119 | 1992 | 2014 | 97% | ||||||||
Ballinger Commons (21) | Seattle, WA | 485 | 407,253 | 1989 | 2014 | 96% | ||||||||
| The Bernard | Seattle, WA | 63 | 43,151 | 2008 | 2011 | 96% | ||||||||
| Cairns, The | Seattle, WA | 100 | 70,806 | 2006 | 2007 | 97% | ||||||||
Citywalk (21) | Seattle, WA | 102 | 92,010 | 1988 | 2014 | 97% | ||||||||
| Collins on Pine | Seattle, WA | 76 | 48,733 | 2013 | 2014 | 97% | ||||||||
| Domaine | Seattle, WA | 92 | 79,421 | 2009 | 2012 | 95% | ||||||||
Expo (16) | Seattle, WA | 275 | 190,176 | 2012 | 2012 | 97% | ||||||||
| Fountain Court | Seattle, WA | 320 | 207,000 | 2000 | 2000 | 95% | ||||||||
Joule (17) | Seattle, WA | 295 | 191,109 | 2010 | 2010 | 96% | ||||||||
| Taylor 28 | Seattle, WA | 197 | 155,630 | 2008 | 2014 | 95% | ||||||||
| Vox | Seattle, WA | 58 | 42,173 | 2013 | 2013 | 97% | ||||||||
| Wharfside Pointe | Seattle, WA | 155 | 119,200 | 1990 | 1994 | 94% | ||||||||
| 12,197 | 10,503,985 | 96% | ||||||||||||
| Total/Weighted Average | 59,160 | 52,527,408 | 95% | |||||||||||
| Square | Year | Year | |||||||||||
Other real estate assets (1) | Location | Tenants | Footage | Built | Acquired | Occupancy (2) | |||||||
925 / 935 East Meadow Drive (18) | Palo Alto, CA | — | 39,600 | 1988 / 1962 | 1997 / 2007 | —% | |||||||
Essex - Hollywood (19) | Los Angeles, CA | 1 | 34,000 | 1938 | 2006 | 100% | |||||||
Derian Office Building (20) | Irvine, CA | 8 | 106,564 | 1983 | 2000 | 100% | |||||||
| Santa Clara Retail | Santa Clara, CA | 3 | 138,915 | 1970 | 2011 | 100% | |||||||
| 12 | 319,079 | 88% | |||||||||||
(1) | Unless otherwise specified, the |
(2) | For |
(3) | The community is subject to a ground lease, which, unless extended, will expire in 2082. |
(4) | The |
(5) | This community is owned by Wesco III. The Company has a 50% interest in Wesco III which is accounted for using the |
(6) | This community is owned by Wesco I. The |
| This community is subject to a ground lease, which, unless extended, will expire in 2067. |
| This community is subject to a ground lease, which, unless extended, will expire in 2027. |
(9) | The |
(10) | The |
| The community is subject to a ground lease, which, unless extended, will expire in 2028. |
(12) | This community is |
(13) | The |
(14) | A portion of this community on which 84 |
(15) | The community is subject to a ground lease, which, unless extended, will expire in 2070. |
(16) | The |
(17) | The |
(18) | This property was the |
| The property is leased through January 2016 to a single |
(20) | The |
(21) | This community is owned by BEXAEW. The Company has a 50% interest in BEXAEW which is accounted for using the equity method of accounting. |
(22) | This community is owned by Wesco IV. The Company has a 50% interest in Wesco IV which is accounted for using the equity method of accounting. |
(23) | The |
| Quarter Ended | High | Low | Close | |||||||||
| December 31, 2015 | $ | 244.71 | $ | 214.29 | $ | 239.41 | ||||||
| September 30, 2015 | $ | 232.20 | $ | 205.72 | $ | 223.42 | ||||||
| June 30, 2015 | $ | 231.90 | $ | 208.85 | $ | 212.50 | ||||||
| March 31, 2015 | $ | 243.17 | $ | 207.26 | $ | 229.90 | ||||||
| December 31, 2014 | $ | 214.43 | $ | 176.70 | $ | 206.60 | ||||||
| September 30, 2014 | $ | 196.08 | $ | 177.68 | $ | 178.75 | ||||||
| June 30, 2014 | $ | 185.99 | $ | 164.76 | $ | 184.91 | ||||||
| March 31, 2014 | $ | 173.01 | $ | 141.79 | $ | 170.05 | ||||||
| 2015 | 2014 | 2013 | |||||||
| Common Stock | |||||||||
| Ordinary income | 99.28 | % | 70.03 | % | 77.34 | % | |||
| Capital gain | 0.72 | % | 21.95 | % | 17.64 | % | |||
| Unrecaptured section 1250 capital gain | — | % | 8.02 | % | 5.02 | % | |||
| 100.00 | % | 100.00 | % | 100.00 | % | ||||
| 2015 | 2014 | 2013 | |||||||
| Series G, and H Preferred stock | |||||||||
| Ordinary income | 99.28 | % | 70.03 | % | 77.34 | % | |||
| Capital gains | 0.72 | % | 21.95 | % | 17.64 | % | |||
| Unrecaptured section 1250 capital gain | — | % | 8.02 | % | 5.02 | % | |||
| 100.00 | % | 100.00 | % | 100.00 | % | ||||
| Year Ended | Annual Dividend/Distribution | Quarter Ended | 2015 | 2014 | 2013 | |||||||
| 1995 | $ | 1.69 | March 31, | $1.44 | $1.21 | $1.21 | ||||||
| 1996 | $ | 1.72 | June 30, | $1.44 | $1.30 | $1.21 | ||||||
| 1997 | $ | 1.77 | September 30, | $1.44 | $1.30 | $1.21 | ||||||
| 1998 | $ | 1.95 | December 31, | $1.44 | $1.30 | $1.21 | ||||||
| 1999 | $ | 2.15 | ||||||||||
| 2000 | $ | 2.38 | Annual Dividend/Distribution | $5.76 | $5.11 | $4.84 | ||||||
| 2001 | $ | 2.80 | ||||||||||
| 2002 | $ | 3.08 | ||||||||||
| 2003 | $ | 3.12 | ||||||||||
| 2004 | $ | 3.16 | ||||||||||
| 2005 | $ | 3.24 | ||||||||||
| 2006 | $ | 3.36 | ||||||||||
| 2007 | $ | 3.72 | ||||||||||
| 2008 | $ | 4.08 | ||||||||||
| 2009 | $ | 4.12 | ||||||||||
| 2010 | $ | 4.13 | ||||||||||
| 2011 | $ | 4.16 | ||||||||||
| 2012 | $ | 4.40 | ||||||||||
| Period | Total Number of Shares Sold | Average Price per Share | Proceeds (net of fees and commissions) | |||
| 4/5/07 to 5/6/07 | 1,670,500 | $127.91 | $213,672,000 | |||
| Period | Total Number of Shares Purchased | Average Price Paid per Share | Total Number of Shares Purchased as Part of Publicly Announced Plans or Programs | Total Amount that May Yet be Purchased Under the Plans or Programs | |||||
| 9/12/07 to 9/17/07 | 12,600 | $111.60 | 12,600 | $198,593,456 | |||||
| 11/13/07 to 11/31/07 | 196,059 | $101.90 | 208,659 | $178,615,425 | |||||
| 12/4/07 to 12/21/07 | 114,600 | $98.20 | 323,259 | $167,358,504 | |||||
| Total | 323,259 | $100.90 | 323,259 | $167,358,504 | |||||
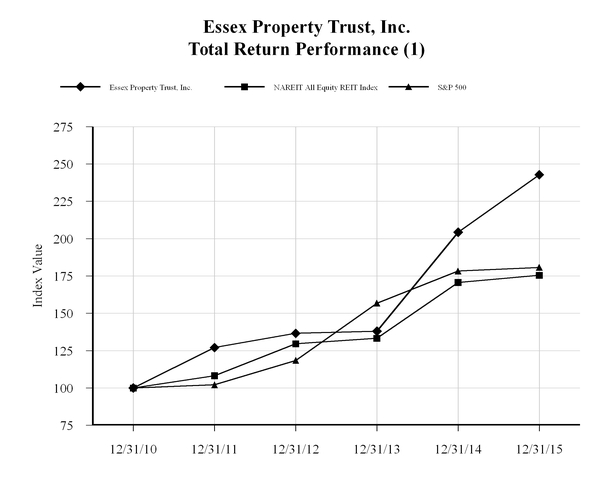
| Period Ending | ||||||||||||||||||
| Index | 12/31/2010 | 12/31/2011 | 12/31/2012 | 12/31/2013 | 12/31/2014 | 12/31/2015 | ||||||||||||
| Essex Property Trust, Inc. | 100.00 | 127.06 | 136.59 | 138.04 | 204.30 | 242.85 | ||||||||||||
| NAREIT All Equity REIT Index | 100.00 | 108.28 | 129.62 | 133.32 | 170.68 | 175.51 | ||||||||||||
| S&P 500 | 100.00 | 102.11 | 118.45 | 156.82 | 178.28 | 180.75 | ||||||||||||
(1) | Common stock performance data is provided by SNL Financial. |
| Years Ended December 31, | |||||||||||||||
| 2007 | 2006(1) | 2005(1) | 2004(1) | 2003(1) | |||||||||||
| (In thousands, except per unit amounts) | |||||||||||||||
| OPERATING DATA: | |||||||||||||||
| REVENUES | |||||||||||||||
| Rental and other property | $ | 383,433 | $ | 334,770 | $ | 303,235 | $ | 266,722 | $ | 233,800 | |||||
| Management and other fees from affiliates | 5,090 | 5,030 | 10,951 | 23,146 | 6,027 | ||||||||||
| 388,523 | 339,800 | 314,186 | 289,868 | 239,827 | |||||||||||
| EXPENSES | |||||||||||||||
| Property operating expenses, excluding depreciation | |||||||||||||||
| and amortization | 128,424 | 114,398 | 104,479 | 93,666 | 77,307 | ||||||||||
| Depreciation and amortization | 100,389 | 78,094 | 74,849 | 66,414 | 51,814 | ||||||||||
| Amortization of deferred financing costs | 3,071 | 2,745 | 1,947 | 1,560 | 1,187 | ||||||||||
| General and administrative | 26,273 | 22,234 | 19,148 | 18,042 | 9,549 | ||||||||||
| Interest | 80,995 | 72,898 | 70,784 | 60,709 | 49,985 | ||||||||||
| Other expenses | 800 | 1,770 | 5,827 | - | - | ||||||||||
| 339,952 | 292,139 | 277,034 | 240,391 | 189,842 | |||||||||||
| Earnings from operations | 48,571 | 47,661 | 37,152 | 49,477 | 49,985 | ||||||||||
| Gain on the sales of real estate | - | - | 6,391 | 7,909 | - | ||||||||||
| Interest and other income | 10,310 | 6,176 | 8,524 | 3,077 | 668 | ||||||||||
| Equity income (loss) in co-investments | 3,120 | (1,503) | 18,553 | 40,683 | 2,349 | ||||||||||
| Minority interests | (4,847) | (4,977) | (5,340) | (4,550) | (4,696) | ||||||||||
| Income from continuing operations before income tax provision | 57,154 | 47,357 | 65,280 | 96,596 | 48,306 | ||||||||||
| Income tax provision | (400) | (525) | (2,538) | (257) | - | ||||||||||
| Income from continuing operations | 56,754 | 46,832 | 62,742 | 96,339 | 48,306 | ||||||||||
| Income from discontinued operations (net of minority interests | 80,546 | 33,015 | 35,558 | 7,469 | 8,660 | ||||||||||
| Net income | 137,300 | 79,847 | 98,300 | 103,808 | 56,966 | ||||||||||
| Write off of Series C preferred units offering costs | - | - | - | - | (625) | ||||||||||
| Write off of Series E preferred units offering costs | - | - | - | (1,575) | - | ||||||||||
| Amortization of discount on Series F preferred equity | - | - | - | - | (336) | ||||||||||
| Distributions on preferred units - Series F & G | (9,174) | (5,145) | (1,953) | (1,952) | (195) | ||||||||||
| Distributions on preferred units - limited partners | (10,238) | (10,238) | (10,238) | (14,175) | (17,996) | ||||||||||
| Net income available to common units | $ | 117,888 | $ | 64,464 | $ | 86,109 | $ | 86,106 | $ | 37,814 | |||||
| Per unit data: | |||||||||||||||
| Basic: | |||||||||||||||
| Net income from continuing operations available to | |||||||||||||||
| common units | $ | 1.38 | $ | 1.23 | $ | 2.00 | $ | 3.11 | $ | 1.23 | |||||
| Net income available to common units | $ | 4.36 | $ | 2.52 | $ | 3.40 | $ | 3.41 | $ | 1.59 | |||||
| Weighted average common units outstanding | 27,044 | 25,560 | 25,344 | 25,255 | 23,737 | ||||||||||
| Diluted: | |||||||||||||||
| Net income from continuing operations available to | |||||||||||||||
| common units | $ | 1.35 | $ | 1.21 | $ | 1.97 | $ | 3.09 | $ | 1.22 | |||||
| Net income available to common units | $ | 4.27 | $ | 2.48 | $ | 3.35 | $ | 3.38 | $ | 1.58 | |||||
| Weighted average common units outstanding | 27,597 | 26,030 | 25,694 | 25,490 | 23,948 | ||||||||||
| Cash dividend per common unit | $ | 3.72 | $ | 3.36 | $ | 3.24 | $ | 3.16 | $ | 3.12 | |||||
| As of December 31, | ||||||||||||||||
| 2007 | 2006(1) | 2005(1) | 2004(1) | 2003(1) | ||||||||||||
| BALANCE SHEET DATA: | ||||||||||||||||
| Investment in rental properties (before accumulated | ||||||||||||||||
| depreciation) | $ | 3,117,759 | $ | 2,669,187 | $ | 2,431,629 | $ | 2,371,194 | $ | 1,984,122 | ||||||
| Net investment in rental proerties | 2,575,772 | 2,204,172 | 2,042,589 | 2,041,542 | 1,718,359 | |||||||||||
| Real estate under development | 233,445 | 107,620 | 54,416 | 38,320 | 55,183 | |||||||||||
| Total assets | 2,980,323 | 2,485,840 | 2,239,290 | 2,217,217 | 1,916,811 | |||||||||||
| Total secured indebtedness | 1,362,873 | 1,186,554 | 1,129,918 | 1,161,184 | 976,545 | |||||||||||
| Total unsecured indebtedness | 294,818 | 225,000 | 225,000 | 155,800 | 12,500 | |||||||||||
| Cumulative convertible preferred equity | 145,912 | 145,912 | - | - | - | - | ||||||||||
| Cumulative redeemable preferred equity | 24,412 | 24,412 | 24,412 | 24,412 | 24,412 | |||||||||||
| Partners' capital (less redeemable preferred equity) | 972,769 | 774,217 | 737,497 | 752,991 | 787,396 | |||||||||||
| As of and for the years ended December 31, | ||||||||||||||||
| 2007 | 2006(1) | 2005(1) | 2004(1) | 2003(1) | ||||||||||||
| OTHER DATA: | ||||||||||||||||
Interest coverage ratio(2) | 3.0 | X | 2.8 | X | 2.7 | X | 3.0 | X | 3.1 | X | ||||||
Same-property gross operating margin(3)(4) | 67% | 67% | 66% | 65% | 66% | |||||||||||
| Average same-property monthly rental rate per | ||||||||||||||||
apartment unit(4)(5) | $ | 1,314 | $ | 1,225 | $ | 1,149 | $ | 1,055 | $ | 1,088 | ||||||
| Average same-property monthly operating expenses | ||||||||||||||||
per apartment unit(4)(6) | $ | 437 | $ | 421 | $ | 395 | $ | 331 | $ | 325 | ||||||
| Total apartment units (at end of period) | 27,489 | 27,553 | 26,587 | 25,518 | 26,012 | |||||||||||
Same-property occupancy rate(7) | 96% | 96% | 97% | 96% | 96% | |||||||||||
| Total Properties (at end of period) | 134 | 130 | 126 | 131 | 132 | |||||||||||
| Years Ended December 31, | ||||||||||||||||||||
| 2015 | 2014 | 2013 | 2012 | 2011 | ||||||||||||||||
| ($ in thousands, except per share amounts) | ||||||||||||||||||||
OPERATING DATA:(1) | ||||||||||||||||||||
| Rental and other property | $ | 1,185,498 | $ | 961,591 | $ | 603,327 | $ | 527,945 | $ | 461,866 | ||||||||||
| Management and other fees from affiliates | 8,909 | 9,347 | 7,263 | 8,457 | 5,428 | |||||||||||||||
| Income before discontinued operations | $ | 248,239 | $ | 134,438 | $ | 140,882 | $ | 127,653 | $ | 46,958 | ||||||||||
| Income from discontinued operations | — | — | 31,173 | 11,937 | 10,558 | |||||||||||||||
| Net income | 248,239 | 134,438 | 172,055 | 139,590 | 57,516 | |||||||||||||||
| Net income available to common stockholders | $ | 226,865 | $ | 116,859 | $ | 150,811 | $ | 119,812 | $ | 40,368 | ||||||||||
| Per share data: | ||||||||||||||||||||
| Basic: | ||||||||||||||||||||
| Income before discontinued operations available to common stockholders | $ | 3.50 | $ | 2.07 | $ | 3.26 | $ | 3.10 | $ | 0.94 | ||||||||||
| Net income available to common stockholders | $ | 3.50 | $ | 2.07 | $ | 4.05 | $ | 3.42 | $ | 1.24 | ||||||||||
| Weighted average common stock outstanding | 64,872 | 56,547 | 37,249 | 35,032 | 32,542 | |||||||||||||||
| Diluted: | ||||||||||||||||||||
| Income before discontinued operations available to common stockholders | $ | 3.49 | $ | 2.06 | $ | 3.25 | $ | 3.09 | $ | 0.94 | ||||||||||
| Net income available to common stockholders | $ | 3.49 | $ | 2.06 | $ | 4.04 | $ | 3.41 | $ | 1.24 | ||||||||||
| Weighted average common stock outstanding | 65,062 | 56,697 | 37,335 | 35,125 | 32,629 | |||||||||||||||
| Cash dividend per common share | $ | 5.76 | $ | 5.11 | $ | 4.84 | $ | 4.40 | $ | 4.16 | ||||||||||
(1) | Reclassifications have been made in prior periods to conform to the current year’s presentation. |
| As of December 31, | ||||||||||||||||||||
| 2015 | 2014 | 2013 | 2012 | 2011 | ||||||||||||||||
| ($ in thousands) | ||||||||||||||||||||
BALANCE SHEET DATA:(1) | ||||||||||||||||||||
| Investment in rental properties (before accumulated depreciation) | $ | 12,331,469 | $ | 11,244,681 | $ | 5,443,757 | $ | 5,033,672 | $ | 4,313,064 | ||||||||||
| Net investment in rental properties | 10,381,577 | 9,679,875 | 4,188,871 | 3,952,155 | 3,393,038 | |||||||||||||||
| Real estate under development | 242,326 | 429,096 | 50,430 | 66,851 | 44,280 | |||||||||||||||
| Co-investments | 1,036,047 | 1,042,423 | 677,133 | 571,345 | 383,412 | |||||||||||||||
| Total assets | 12,005,091 | 11,526,732 | 5,162,320 | 4,826,356 | 4,019,519 | |||||||||||||||
| Total indebtedness | 5,315,464 | 5,080,689 | 3,009,005 | 2,797,816 | 2,343,413 | |||||||||||||||
| Redeemable noncontrolling interest | 45,452 | 23,256 | — | — | — | |||||||||||||||
| Cumulative convertible preferred stock | — | — | 4,349 | 4,349 | 4,349 | |||||||||||||||
| Cumulative redeemable preferred stock | 73,750 | 73,750 | 73,750 | 73,750 | 73,750 | |||||||||||||||
| Stockholders' equity | 6,237,733 | 6,022,672 | 1,884,619 | 1,764,804 | 1,437,527 | |||||||||||||||
(1) | Reclassifications have been made in prior periods to conform to the current year’s presentation. Additionally, due to measurement adjustments related to the BRE merger in 2014, certain amounts do not agree to previously reported balances. |
| As of and for the years ended December 31, | ||||||||||||||||||||
| 2015 | 2014 | 2013 | 2012 | 2011 | ||||||||||||||||
| ($ in thousands, except per share amounts) | ||||||||||||||||||||
| OTHER DATA: | ||||||||||||||||||||
Funds from operations (FFO)(1) attributable to common stockholders and unitholders: | ||||||||||||||||||||
| Net income available to common stockholders | $ | 226,865 | $ | 116,859 | $ | 150,811 | $ | 119,812 | $ | 40,368 | ||||||||||
| Adjustments: | ||||||||||||||||||||
| Depreciation and amortization | 453,423 | 360,592 | 193,518 | 170,686 | 152,543 | |||||||||||||||
| Gains not included in FFO attributable to common stockholders and unitholders | (81,347 | ) | (50,064 | ) | (67,975 | ) | (60,842 | ) | (7,543 | ) | ||||||||||
| Depreciation add back from unconsolidated co-investments | 49,826 | 33,975 | 15,748 | 14,467 | 12,642 | |||||||||||||||
| Noncontrolling interest related to Operating Partnership units | 7,824 | 4,911 | 8,938 | 7,950 | 3,228 | |||||||||||||||
| Insurance reimbursements | (1,751 | ) | — | — | — | — | ||||||||||||||
| Depreciation attributable to third party ownership and other | (781 | ) | (1,331 | ) | (1,309 | ) | (1,223 | ) | (1,066 | ) | ||||||||||
| Funds from operations attributable to common stockholders and unitholders | $ | 654,059 | $ | 464,942 | $ | 299,731 | $ | 250,850 | $ | 200,172 | ||||||||||
| Non-core items: | ||||||||||||||||||||
| Merger and integration expenses | 3,798 | 53,530 | 4,284 | — | — | |||||||||||||||
| Acquisition and investment related costs | 2,414 | 1,878 | 1,161 | 2,255 | 1,231 | |||||||||||||||
| Gain on sale of marketable securities, note prepayment, and other investments | (598 | ) | (886 | ) | (2,519 | ) | (819 | ) | (4,956 | ) | ||||||||||
| Gain on sale of co-investments | — | — | — | — | (919 | ) | ||||||||||||||
| Gain on sale of land | — | (2,533 | ) | (1,503 | ) | — | (180 | ) | ||||||||||||
| Loss on early retirement of debt | 6,114 | 268 | 300 | 5,009 | 1,163 | |||||||||||||||
| Co-investment promote income | (192 | ) | (10,640 | ) | — | (2,299 | ) | — | ||||||||||||
| Income from early redemption of preferred equity investments | (1,954 | ) | (5,250 | ) | (1,358 | ) | — | — | ||||||||||||
| Insurance reimbursements | (2,319 | ) | — | — | — | — | ||||||||||||||
Other non-core items, net (2) | (651 | ) | 1,852 | — | — | 268 | ||||||||||||||
| Core funds from operations (Core FFO) attributable to common stockholders and unitholders | $ | 660,671 | $ | 503,161 | $ | 300,096 | $ | 254,996 | $ | 196,779 | ||||||||||
Weighted average number of shares outstanding, diluted (FFO)(3) | 67,310 | 58,921 | 39,501 | 37,378 | 34,861 | |||||||||||||||
Funds from operations attributable to common stockholders and unitholders per share - diluted | $ | 9.72 | $ | 7.89 | $ | 7.59 | $ | 6.71 | $ | 5.74 | ||||||||||
Core funds from operations attributable to common stockholders and unitholders per share - diluted | $ | 9.82 | $ | 8.54 | $ | 7.60 | $ | 6.82 | $ | 5.64 | ||||||||||
(1) | FFO is a financial measure that is commonly used in the REIT industry. The Company presents funds from operations as a supplemental operating performance measure. FFO is not used by the Company, nor should it be considered to be, as an alternative to net earnings computed under GAAP as an indicator of the Company’s operating performance or as an alternative to cash from operating activities computed under GAAP as an indicator of the Company's ability to fund its cash needs. |
| Years Ended December 31, | ||||||||||||||||
| 2007 | 2006(1) | 2005(1) | 2004(1) | 2003(1) | ||||||||||||
(Dollars in thousands) | ||||||||||||||||
| RECONCILIATION OF NET INCOME TO | ||||||||||||||||
ADJUSTED EBITDA (2): | ||||||||||||||||
| Net income | $ | 137,300 | $ | 79,847 | $ | 98,300 | $ | 103,808 | $ | 56,966 | ||||||
| Interest expense | 80,995 | 72,898 | 70,784 | 60,709 | 49,985 | |||||||||||
| Tax expense | 400 | 525 | 2,538 | 257 | - | |||||||||||
| Depreciation and amortization | 100,389 | 78,094 | 74,849 | 66,414 | 51,814 | |||||||||||
| Amortization of deferred financing costs | 3,071 | 2,745 | 1,947 | 1,560 | 1,187 | |||||||||||
| Gain on the sales of real estate | - | - | (6,391) | (7,909) | - | |||||||||||
| Gain on the sales of co-investment activities, net | (2,046) | - | (18,116) | (39,242) | - | |||||||||||
| Minority interests | 4,847 | 4,977 | 5,340 | 4,550 | 4,696 | |||||||||||
| Income from discontinued operations (net of minority interest) | (80,546) | (33,015) | (35,558) | (7,469) | (8,660) | |||||||||||
Adjusted EBITDA(2) | 244,410 | 206,071 | 193,693 | 182,678 | 155,988 | |||||||||||
| Interest expense | 80,995 | 72,898 | 70,784 | 60,709 | 49,985 | |||||||||||
Interest coverage ratio(2) | 3.0 | X | 2.8 | X | 2.7 | X | 3.0 | X | 3.1 | X | ||||||
| (a) | historical cost accounting for real estate assets in accordance with GAAP assumes, through |
| (b) | REITs were created as a legal form of organization in order to encourage public ownership of real estate as an asset class through investment in firms that |
(2) | Other items, net are non-recurring in nature and |
(3) | Assumes conversion of all dilutive outstanding operating partnership interests in the Operating Partnership and excludes 744,346 DownREIT units |
| Years Ended December 31, | ||||||||||||||||||||
| 2015 | 2014 | 2013 | 2012 | 2011 | ||||||||||||||||
| ($ in thousands, except per unit amounts) | ||||||||||||||||||||
OPERATING DATA:(1) | ||||||||||||||||||||
| Rental and other property | $ | 1,185,498 | $ | 961,591 | $ | 603,327 | $ | 527,945 | $ | 461,866 | ||||||||||
| Management and other fees from affiliates | 8,909 | 9,347 | 7,263 | 8,457 | 5,428 | |||||||||||||||
| Income before discontinued operations | $ | 248,239 | $ | 134,438 | $ | 140,882 | $ | 127,653 | $ | 46,958 | ||||||||||
| Income from discontinued operations | — | — | 31,173 | 11,937 | 10,558 | |||||||||||||||
| Net income | 248,239 | 134,438 | 172,055 | 139,590 | 57,516 | |||||||||||||||
| Net income available to common unitholders | $ | 234,689 | $ | 121,726 | $ | 159,749 | $ | 127,771 | $ | 43,593 | ||||||||||
| Per unit data: | ||||||||||||||||||||
| Basic: | ||||||||||||||||||||
| Income before discontinued operations available to common unitholders | $ | 3.50 | $ | 2.07 | $ | 3.27 | $ | 3.11 | $ | 0.95 | ||||||||||
| Net income available to common unitholders | $ | 3.50 | $ | 2.07 | $ | 4.06 | $ | 3.43 | $ | 1.25 | ||||||||||
| Weighted average common units outstanding | 67,054 | 58,772 | 39,380 | 37,252 | 34,774 | |||||||||||||||
| Diluted: | ||||||||||||||||||||
| Income before discontinued operations available to common unitholders | $ | 3.49 | $ | 2.07 | $ | 3.26 | $ | 3.10 | $ | 0.95 | ||||||||||
| Net income available to common unitholders | $ | 3.49 | $ | 2.07 | $ | 4.05 | $ | 3.42 | $ | 1.25 | ||||||||||
| Weighted average common units outstanding | 67,244 | 58,921 | 39,467 | 37,344 | 34,861 | |||||||||||||||
| Cash distributions per common unit | $ | 5.76 | $ | 5.11 | $ | 4.84 | $ | 4.40 | $ | 4.16 | ||||||||||
(1) | Reclassifications have been made in prior periods to conform to the |
| As of December 31, | ||||||||||||||||||||
| 2015 | 2014 | 2013 | 2012 | 2011 | ||||||||||||||||
| ($ in thousands) | ||||||||||||||||||||
BALANCE SHEET DATA:(1) | ||||||||||||||||||||
| Investment in rental properties (before accumulated depreciation) | $ | 12,331,469 | $ | 11,244,681 | $ | 5,443,757 | $ | 5,033,672 | $ | 4,313,064 | ||||||||||
| Net investment in rental properties | 10,381,577 | 9,679,875 | 4,188,871 | 3,952,155 | 3,393,038 | |||||||||||||||
| Real estate under development | 242,326 | 429,096 | 50,430 | 66,851 | 44,280 | |||||||||||||||
| Co-investments | 1,036,047 | 1,042,423 | 677,133 | 571,345 | 383,412 | |||||||||||||||
| Total assets | 12,005,091 | 11,526,732 | 5,162,320 | 4,826,356 | 4,019,519 | |||||||||||||||
| Total indebtedness | 5,315,464 | 5,080,689 | 3,009,005 | 2,797,816 | 2,343,413 | |||||||||||||||
| Redeemable noncontrolling interest | 45,452 | 23,256 | — | — | — | |||||||||||||||
| Cumulative convertible preferred interest | — | — | 4,349 | 4,349 | 4,349 | |||||||||||||||
| Cumulative redeemable preferred interest | 71,209 | 71,209 | 71,209 | 71,209 | 71,209 | |||||||||||||||
| Partners' capital | 6,287,381 | 6,073,433 | 1,932,108 | 1,811,427 | 1,486,914 | |||||||||||||||
(1) | Reclassifications have been made in prior periods to conform to the |
| As of December 31, 2007 | As of December 31, 2006 | ||||
| Apartment Units | % | Apartment Units | % | ||
| Southern California | 12,725 | 52% | 12,965 | 55% | |
| Northern California | 6,361 | 26% | 5,389 | 23% | |
| Seattle Metro | 5,005 | 21% | 4,905 | 21% | |
| Other Regions | 302 | 1% | 302 | 1% | |
| Total | 24,393 | 100% | 23,561 | 100% | |
| As of | As of | ||||||||||
| December 31, 2015 | December 31, 2014 | ||||||||||
| Apartment Homes | % | Apartment Homes | % | ||||||||
| Southern California | 23,707 | 49 | % | 22,168 | 47 | % | |||||
| Northern California | 14,694 | 30 | % | 14,789 | 31 | % | |||||
| Seattle Metro | 10,239 | 21 | % | 10,216 | 21 | % | |||||
| Arizona | — | — | % | 552 | 1 | % | |||||
| Total | 48,640 | 100 | % | 47,725 | 100 | % | |||||
| Years ended | |||
| December 31, | |||
| 2007 | 2006 | ||
| Southern California | 95.6% | 96.3% | |
| Northern California | 96.8% | 96.7% | |
| Seattle Metro | 96.3% | 96.8% | |
| Other Regions | 92.5% | 90.6% | |
Years ended December 31, | |||||
| 2015 | 2014 | ||||
| Southern California | 96.2 | % | 96.3 | % | |
| Northern California | 96.3 | % | 96.2 | % | |
| Seattle Metro | 96.2 | % | 96.0 | % | |
| Years Ended | ||||||||||||||
| Number of | December 31, | Dollar | Percentage | |||||||||||
| Properties | 2007 | 2006 | Change | Change | ||||||||||
Property Revenues (dollars in thousands) | ||||||||||||||
| 2007/2006 Same-Properties: | ||||||||||||||
| Southern California | 56 | $ | 185,060 | $ | 177,336 | $ | 7,724 | 4.4 | % | |||||
| Northern California | 16 | 60,024 | 54,887 | 5,137 | 9.4 | |||||||||
| Seattle Metro | 22 | 56,427 | 50,852 | 5,575 | 11.0 | |||||||||
| Other Regions | 1 | 2,015 | 1,980 | 35 | 1.8 | |||||||||
| Total 2007/2006 Same-Property revenues | 95 | 303,526 | 285,055 | 18,471 | 6.5 | |||||||||
| 2007/2006 Non-Same Property Revenues (1) | 79,907 | 49,715 | 30,192 | 60.7 | ||||||||||
| Total property revenues | $ | 383,433 | $ | 334,770 | $ | 48,663 | 14.5 | % | ||||||
| Number of | Years Ended December 31, | Dollar | Percentage | |||||||||||||||
Property Revenues ($ in thousands) | Properties | 2015 | 2014 | Change | Change | |||||||||||||
2015/2014 Same-Properties: (1) | ||||||||||||||||||
| Southern California | 58 | $ | 283,435 | $ | 267,413 | $ | 16,022 | 6.0 | % | |||||||||
| Northern California | 37 | 250,478 | 226,679 | $ | 23,799 | 10.5 | % | |||||||||||
| Seattle Metro | 34 | 124,143 | 115,219 | 8,924 | 7.7 | % | ||||||||||||
| Total 2015/2014 Same-Property revenues | 129 | 658,056 | 609,311 | 48,745 | 8.0 | % | ||||||||||||
| 2015/2014 Non-Same Property Revenues | 527,442 | 352,280 | 175,162 | 49.7 | % | |||||||||||||
| Total property revenues | $ | 1,185,498 | $ | 961,591 | $ | 223,907 | 23.3 | % | ||||||||||
(1) | Same-property excludes BRE properties acquired April 1, 2014 and properties held for sale. |
| Years ended | ||||||||
| December 31, | Years ended December 31, | |||||||
| 2006 | 2005 | 2014 | 2013 | |||||
| Southern California | 96.3% | 96.5% | 96.3 | % | 96.1 | % | ||
| Northern California | 96.7% | 97.1% | 96.3 | % | 96.1 | % | ||
| Seattle Metro | 96.9% | 96.7% | 96.0 | % | 96.1 | % | ||
| Other Regions | 90.6% | 88.1% | ||||||
| Years Ended | ||||||||||||||
| Number of | December 31, | Dollar | Percentage | |||||||||||
| Properties | 2006 | 2005 | Change | Change | ||||||||||
Property Revenues (dollars in thousands) | ||||||||||||||
| 2006/2005 Same-Properties: | ||||||||||||||
| Southern California | 53 | $ | 174,156 | $ | 164,550 | $ | 9,606 | 5.8 | % | |||||
| Northern California | 16 | 54,887 | 50,625 | 4,262 | 8.4 | |||||||||
| Seattle Metro | 21 | 48,663 | 44,551 | 4,112 | 9.2 | |||||||||
| Other Regions | 1 | 1,980 | 1,843 | 137 | 7.4 | |||||||||
| Total 2006/2005 Same-Property revenues | 91 | 279,686 | 261,569 | 18,117 | 6.9 | |||||||||
| 2006/2005 Non-Same Property Revenues (1) | 55,084 | 41,666 | 13,418 | 32.2 | ||||||||||
| Total property revenues | $ | 334,770 | $ | 303,235 | $ | 31,535 | 10.4 | % | ||||||
| Number of | Years Ended December 31, | Dollar | Percentage | |||||||||||||||
Property Revenues ($ in thousands) | Properties | 2014 | 2013 | Change | Change | |||||||||||||
| 2014/2013 Same-Properties: | ||||||||||||||||||
| Southern California | 58 | $ | 267,413 | $ | 253,503 | $ | 13,910 | 5.5 | % | |||||||||
| Northern California | 35 | 218,577 | 199,395 | 19,182 | 9.6 | % | ||||||||||||
| Seattle Metro | 29 | 115,219 | 107,225 | 7,994 | 7.5 | % | ||||||||||||
| Total 2014/2013 Same-Property revenues | 122 | 601,209 | 560,123 | 41,086 | 7.3 | % | ||||||||||||
2014/2013 Non-Same Property Revenues (1) | 80,059 | 43,204 | 36,855 | 85.3 | % | |||||||||||||
2014 BRE Legacy Property Revenues (2) | 280,323 | — | 280,323 | |||||||||||||||
| Total property revenues | $ | 961,591 | $ | 603,327 | $ | 358,264 | 59.4 | % | ||||||||||
(1) | Includes eleven communities acquired after January 1, 2013, three sold communities and one redevelopment community. |
(2) | Includes 55 stabilized properties acquired in connection with the BRE merger on April 1, 2014, and two development communities in lease-up. |
| For the year ended December 31, | ||||||||||||
| 2015 | 2014 | 2013 | ||||||||||
| Cash flow provided by (used in): | ||||||||||||
| Operating activities | $ | 617,410 | $ | 493,312 | $ | 304,982 | ||||||
| Investing activities | $ | (725,556 | ) | $ | (1,147,156 | ) | $ | (453,696 | ) | |||
| Financing activities | $ | 108,214 | $ | 520,610 | $ | 148,599 | ||||||
| 2009 and | 2011 and | ||||||||||||||
| (In thousands) | 2008 | 2010 | 2012 | Thereafter | Total | ||||||||||
| Mortgage notes payable | $ | 116,357 | $ | 179,502 | $ | 198,728 | $ | 768,286 | $ | 1,262,873 | |||||
| Exchangeable bonds | - | - | - | 225,000 | 225,000 | ||||||||||
| Lines of credit | 8,818 | 161,000 | - | - | 169,818 | ||||||||||
| Interest on indebtedness | 87,000 | 93,100 | 57,900 | 204,800 | 442,800 | ||||||||||
| Development commitments | 153,000 | 260,600 | 89,800 | 33,700 | 537,100 | ||||||||||
| Redevelopment commitments | 42,700 | 31,900 | - | - | 74,600 | ||||||||||
| Essex Apartment Value Fund II, L.P. | |||||||||||||||
| capital commitment | 13,383 | - | - | - | 13,383 | ||||||||||
| $ | 421,258 | $ | 726,102 | $ | 346,428 | $ | 1,231,786 | $ | 2,725,574 |
| 2016 | 2017 and 2018 | 2019 and 2020 | Thereafter | Total | ||||||||||||||||
| Mortgage notes payable | $ | 29,714 | $ | 519,802 | $ | 1,279,300 | $ | 329,451 | $ | 2,158,267 | ||||||||||
| Unsecured debt | 350,000 | 365,000 | 75,000 | 2,300,000 | 3,090,000 | |||||||||||||||
| Lines of credit | — | — | 15,000 | — | 15,000 | |||||||||||||||
Interest on indebtedness (1) | 221,917 | 373,819 | 266,313 | 223,734 | 1,085,783 | |||||||||||||||
| Ground leases | 2,742 | 5,484 | 5,484 | 131,851 | 145,561 | |||||||||||||||
| Operating leases | 1,695 | 3,557 | 3,792 | 12,350 | 21,394 | |||||||||||||||
Development commitments (including co-investments) (2) | 195,218 | 329,207 | 17,235 | — | 541,660 | |||||||||||||||
| $ | 801,286 | $ | 1,596,869 | $ | 1,662,124 | $ | 2,997,386 | $ | 7,057,665 | |||||||||||
(1) | Interest on indebtedness for variable debt was calculated using interest rates as of December 31, 2015. |
(2) | Estimated project cost for development the Company's 500 Folsom project is net of a projected value for low-income housing tax credit proceeds and savings from tax exempt bonds. |
| 2015 | 2014 | 2013 | |||||||||
| Earnings from operations | $ | 331,174 | $ | 201,514 | $ | 188,705 | |||||
| Adjustments: | |||||||||||
| General and administrative | 40,090 | 40,878 | 26,684 | ||||||||
| Management and other fees from affiliates | (8,909 | ) | (9,347 | ) | (7,263 | ) | |||||
| Depreciation and amortization | 453,423 | 360,592 | 192,420 | ||||||||
| Merger and integration expenses | 3,798 | 53,530 | 4,284 | ||||||||
| Acquisition and investment related costs | 2,414 | 1,878 | 1,161 | ||||||||
| Net operating income | 821,990 | 649,045 | 405,991 | ||||||||
| Less: Non Same-Property NOI | (357,457 | ) | (229,244 | ) | (22,599 | ) | |||||
| Same-Property NOI | $ | 464,533 | $ | 419,801 | $ | 383,392 | |||||
| Carrying and | ||||||||||||||||||||||||||||||
| Notional | Maturity | Estimate Fair | + 50 | - 50 | ||||||||||||||||||||||||||
| (Dollars in thousands) | Amount | Date Range | Value | Basis Points | Basis Points | |||||||||||||||||||||||||
| Carrying and | Estimated Carrying Value | |||||||||||||||||||||||||||||
| Maturity | Estimated | + 50 | - 50 | |||||||||||||||||||||||||||
($ in thousands) | Notional Amount | Date Range | Fair Value | Basis Points | Basis Points | |||||||||||||||||||||||||
| Cash flow hedges: | Cash flow hedges: | |||||||||||||||||||||||||||||
| Interest rate forward-starting swaps | $ | 450,000 | 2008-2011 | $ | (10,240) | $ | 5,828 | $ | (27,504) | |||||||||||||||||||||
| Interest rate swaps | $ | 225,000 | 2016-2017 | $ | (1,032 | ) | $ | (56 | ) | $ | (2,003 | ) | ||||||||||||||||||
| Interest rate caps | Interest rate caps | 152,749 | 2008-2011 | 13 | 42 | 3 | 20,674 | 2018-2019 | — | — | — | |||||||||||||||||||
| Total cash flow hedges | Total cash flow hedges | $ | 602,749 | 2008-2011 | $ | (10,227) | $ | 5,870 | $ | (27,501) | $ | 245,674 | 2016-2019 | $ | (1,032 | ) | $ | (56 | ) | $ | (2,003 | ) | ||||||||
| For the Years Ended December 31 | ||||||||||||||||||||||||
2008(1) | 2009 | 2010(2) | 2011(3) | 2012 | Thereafter | Total | Fair value | |||||||||||||||||
| (In thousands) | ||||||||||||||||||||||||
| Fixed rate debt | $ | 116,357 | $ | 24,689 | $ | 154,813 | $ | 166,545 | $ | 32,183 | $ | 760,148 | $ | 1,254,735 | $ | 1,301,938 | ||||||||
| Average interest rate | 6.8% | 7.2% | 8.0% | 6.3% | 5.2% | 5.2% | ||||||||||||||||||
| Variable rate LIBOR debt | $ | 8,818 | $ | 173,150 | $ | - | $ | - | $ | - | $ | 220,988 | (4) | $ | 402,956 | $ | 402,956 | |||||||
| Average interest rate | 5.6% | 5.7% | - | - | - | 4.5% | ||||||||||||||||||
| For the Years Ended December 31, | |||||||||||||||||||||||||||||||
| 2016 | 2017 | 2018 | 2019 | 2020 | Thereafter | Total | Fair value | ||||||||||||||||||||||||
Fixed rate debt (1) | $179,677 | $538,685 | $320,080 | $650,620 | $692,440 | $ | 2,350,056 | $ | 4,731,558 | $ | 4,835,891 | ||||||||||||||||||||
| Average interest rate | 4.5 | % | 3.3 | % | 5.5 | % | 4.3 | % | 5.0 | % | 3.8 | % | |||||||||||||||||||
Variable rate debt (1) | $200,038 | $ | 25,495 | $ | 542 | $ | 25,592 | $ | 647 | $ | 279,395 | (2 | ) | $ | 531,709 | $ | 527,592 | ||||||||||||||
| Average interest rate | 2.3 | % | 2.3 | % | 1.1 | % | 1.8 | % | 1.1 | % | 1.2 | % | |||||||||||||||||||
(1) | Represents scheduled principal payments. |
(2) | $245.7 million is subject to interest rate protection agreements. |
| (1) Consolidated Financial Statements of Essex Property Trust, Inc. | Page |
| Reports of Independent Registered Public Accounting Firm | |
| Consolidated Balance Sheets: As of December 31, 2014 | |
| Consolidated Statements of Income: Years ended December 31, 2013 | |
| Consolidated Statements of Comprehensive Income: Years ended December 31, 2013 | |
| Consolidated Statements of Equity: Years ended December 31, 2015, 2014, and 2013 | |
| Consolidated Statements of Cash Flows: Years ended December 31, 2013 | |
| Notes to | |
| (2) Consolidated Financial Statements of Essex Portfolio, L.P. | |
| Report of Independent Registered Public Accounting Firm | |
| Consolidated Balance Sheets: As of December 31, 2015 and 2014 | |
| Consolidated Statements of Income: Years ended December 31, 2015, 2014, and 2013 | |
| Consolidated Statements of Comprehensive Income: Years ended December 31, 2015, 2014, and 2013 | |
| Consolidated Statements of Capital: Years ended December 31, 2015, 2014, and 2013 | |
| Consolidated Statements of Cash Flows: Years ended December 31, 2015, 2014, and 2013 | |
| Notes to Consolidated Financial Statements | |
| (3) Financial Statement Schedule | |
| (4) See the Exhibit Index immediately following the signature page and certifications for a list of exhibits filed or incorporated by reference as part of this report. | |
| /S/ KPMG LLP |
| KPMG LLP |
| /S/ KPMG LLP |
| KPMG LLP |
| /S/ KPMG LLP |
| KPMG LLP |
| 2007 | 2006 | |||||
| ASSETS | ||||||
| Real estate: | ||||||
| Rental properties: | ||||||
| Land and land improvements | $ | 670,494 | $ | 560,880 | ||
| Buildings and improvements | 2,447,265 | 2,108,307 | ||||
| 3,117,759 | 2,669,187 | |||||
| Less accumulated depreciation | (541,987) | (465,015) | ||||
| 2,575,772 | 2,204,172 | |||||
| Real estate - held for sale, net | - | 41,221 | ||||
| Real estate under development | 233,445 | 107,620 | ||||
| Co-investments | 64,191 | 56,318 | ||||
| 2,873,408 | 2,409,331 | |||||
| Cash and cash equivalents-unrestricted | 9,956 | 9,662 | ||||
| Cash and cash equivalents-restricted | 12,527 | 13,948 | ||||
| Marketable securities | 2,017 | - | ||||
| Notes receivable and other receivables from related parties | 904 | 1,209 | ||||
| Notes and other receivables | 49,632 | 18,195 | ||||
| Prepaid expenses and other assets | 20,286 | 20,632 | ||||
| Deferred charges, net | 11,593 | 12,863 | ||||
| Total assets | $ | 2,980,323 | $ | 2,485,840 | ||
| LIABILITIES AND PARTNERS' CAPITAL | ||||||
| Mortgage notes payable | $ | 1,262,873 | $ | 1,060,704 | ||
| Mortgage notes payable - held for sale | - | 32,850 | ||||
| Exchangeable bonds | 225,000 | 225,000 | ||||
| Lines of credit | 169,818 | 93,000 | ||||
| Accounts payable and accrued liabilities | 58,148 | 38,614 | ||||
| Dividends payable | 28,521 | 24,910 | ||||
| Other liabilities | 15,580 | 14,328 | ||||
| Deferred gain | 2,193 | 2,193 | ||||
| Total liabilities | 1,762,133 | 1,491,599 | ||||
| Commitments and contingencies | ||||||
| Minority interests | 70,347 | 44,950 | ||||
| Redeemable convertible limited partnership units | 4,750 | 4,750 | ||||
| Cumulative convertible preferred equity (liquidation value of $149,500) | 145,912 | 145,912 | ||||
| Partners' Capital: | ||||||
| General Partner: | ||||||
| Common equity | 774,894 | 590,070 | ||||
| Preferred equity (liquidation value of $25,000) | 24,412 | 24,412 | ||||
| 799,306 | 614,482 | |||||
| Limited Partners: | ||||||
| Common equity | 80,173 | 59,730 | ||||
| Preferred equity (liquidation value of $130,000) | 126,690 | 126,690 | ||||
| 206,863 | 186,420 | |||||
| Accumulated other comprehensive (loss) income | (8,988) | (2,273) | ||||
| Total partners' capital | 997,181 | 798,629 | ||||
| Total liabilities and partners' capital | $ | 2,980,323 | $ | 2,485,840 |
| 2015 | 2014 | ||||||
| ASSETS | |||||||
| Real estate: | |||||||
| Rental properties: | |||||||
| Land and land improvements | $ | 2,522,842 | $ | 2,424,930 | |||
| Buildings and improvements | 9,808,627 | 8,819,751 | |||||
| 12,331,469 | 11,244,681 | ||||||
| Less accumulated depreciation | (1,949,892 | ) | (1,564,806 | ) | |||
| 10,381,577 | 9,679,875 | ||||||
| Real estate under development | 242,326 | 429,096 | |||||
| Co-investments | 1,036,047 | 1,042,423 | |||||
| Real estate held for sale, net | 26,879 | 56,300 | |||||
| 11,686,829 | 11,207,694 | ||||||
| Cash and cash equivalents-unrestricted | 29,683 | 25,610 | |||||
| Cash and cash equivalents-restricted | 93,372 | 70,139 | |||||
| Marketable securities and other investments | 137,485 | 117,240 | |||||
| Notes and other receivables | 19,285 | 24,923 | |||||
| Acquired in-place lease value, net | 2,857 | 47,748 | |||||
| Prepaid expenses and other assets | 35,580 | 33,378 | |||||
| Total assets | $ | 12,005,091 | $ | 11,526,732 | |||
| LIABILITIES AND EQUITY | |||||||
| Unsecured debt, net | $ | 3,088,680 | $ | 2,603,548 | |||
| Mortgage notes payable, net | 2,215,077 | 2,234,317 | |||||
| Lines of credit, net | 11,707 | 242,824 | |||||
| Accounts payable and accrued liabilities | 131,415 | 135,162 | |||||
| Construction payable | 40,953 | 30,892 | |||||
| Dividends payable | 100,266 | 88,221 | |||||
| Other liabilities | 34,518 | 32,444 | |||||
| Total liabilities | 5,622,616 | 5,367,408 | |||||
| Commitments and contingencies | |||||||
| Redeemable noncontrolling interest | 45,452 | 23,256 | |||||
| Equity: | |||||||
| Common stock; $.0001 par value, 656,020,000 shares authorized; 65,379,359 and 63,682,646 shares issued and outstanding, respectively | 6 | 6 | |||||
| Cumulative redeemable 7.125% Series H preferred stock at liquidation value | 73,750 | 73,750 | |||||
| Additional paid-in capital | 7,003,317 | 6,651,165 | |||||
| Distributions in excess of accumulated earnings | (797,329 | ) | (650,797 | ) | |||
| Accumulated other comprehensive loss, net | (42,011 | ) | (51,452 | ) | |||
| Total stockholders' equity | 6,237,733 | 6,022,672 | |||||
| Noncontrolling interest | 99,290 | 113,396 | |||||
| Total equity | 6,337,023 | 6,136,068 | |||||
| Total liabilities and equity | $ | 12,005,091 | $ | 11,526,732 | |||
| 2015 | 2014 | 2013 | |||||||||
| Revenues: | |||||||||||
| Rental and other property | $ | 1,185,498 | $ | 961,591 | $ | 603,327 | |||||
| Management and other fees from affiliates | 8,909 | 9,347 | 7,263 | ||||||||
| 1,194,407 | 970,938 | 610,590 | |||||||||
| Expenses: | |||||||||||
| Property operating, excluding real estate taxes | 234,953 | 204,673 | 140,060 | ||||||||
| Real estate taxes | 128,555 | 107,873 | 57,276 | ||||||||
| Depreciation and amortization | 453,423 | 360,592 | 192,420 | ||||||||
| General and administrative | 40,090 | 40,878 | 26,684 | ||||||||
| Merger and integration expenses | 3,798 | 53,530 | 4,284 | ||||||||
| Acquisition and investment related costs | 2,414 | 1,878 | 1,161 | ||||||||
| 863,233 | 769,424 | 421,885 | |||||||||
| Earnings from operations | 331,174 | 201,514 | 188,705 | ||||||||
| Interest expense | (204,827 | ) | (164,551 | ) | (116,524 | ) | |||||
| Total return swap income | 5,655 | — | — | ||||||||
| Interest and other income | 19,143 | 11,811 | 11,633 | ||||||||
| Equity income from co-investments | 21,861 | 39,893 | 55,865 | ||||||||
| Loss on early retirement of debt, net | (6,114 | ) | (268 | ) | (300 | ) | |||||
| Gains on sale of real estate and land | 47,333 | 46,039 | 1,503 | ||||||||
| Gains on remeasurement of co-investment | 34,014 | — | — | ||||||||
| Income before discontinued operations | 248,239 | 134,438 | 140,882 | ||||||||
| Income from discontinued operations | — | — | 31,173 | ||||||||
| Net income | 248,239 | 134,438 | 172,055 | ||||||||
| Net income attributable to noncontrolling interest | (16,119 | ) | (12,288 | ) | (15,772 | ) | |||||
| Net income attributable to controlling interest | 232,120 | 122,150 | 156,283 | ||||||||
| Dividends to preferred stockholders | (5,255 | ) | (5,291 | ) | (5,472 | ) | |||||
| Net income available to common stockholders | $ | 226,865 | $ | 116,859 | $ | 150,811 | |||||
| Per share data: | |||||||||||
| Basic: | |||||||||||
| Income before discontinued operations available to common stockholders | $ | 3.50 | $ | 2.07 | $ | 3.26 | |||||
| Income from discontinued operations available to common stockholders | — | — | 0.79 | ||||||||
| Net income available to common stockholders | $ | 3.50 | $ | 2.07 | $ | 4.05 | |||||
| Weighted average number of shares outstanding during the year | 64,871,717 | 56,546,959 | 37,248,960 | ||||||||
| Diluted: | |||||||||||
| Income before discontinued operations available to common stockholders | $ | 3.49 | $ | 2.06 | $ | 3.25 | |||||
| Income from discontinued operations available to common stockholders | — | — | 0.79 | ||||||||
| Net income available to common stockholders | $ | 3.49 | $ | 2.06 | $ | 4.04 | |||||
| Weighted average number of shares outstanding during the year | 65,061,685 | 56,696,525 | 37,335,295 | ||||||||
| 2015 | 2014 | 2013 | |||||||||
| Net income | $ | 248,239 | $ | 134,438 | $ | 172,055 | |||||
| Other comprehensive income (loss): | |||||||||||
| Changes in fair value of cash flow hedges and reclassification to interest expense | 7,893 | 4,168 | 12,614 | ||||||||
| Changes in fair value of marketable securities | 1,865 | 6,302 | (1,556 | ) | |||||||
| Reversal of unrealized gains upon the sale of marketable securities | — | (886 | ) | (1,767 | ) | ||||||
| Total other comprehensive income | 9,758 | 9,584 | 9,291 | ||||||||
| Comprehensive income | 257,997 | 144,022 | 181,346 | ||||||||
| Comprehensive income attributable to noncontrolling interest | (16,436 | ) | (12,852 | ) | (16,274 | ) | |||||
| Comprehensive income attributable to controlling interest | $ | 241,561 | $ | 131,170 | $ | 165,072 | |||||
Series H Preferred stock | Common stock | Additional paid-in | Distributions in excess of accumulated | Accumulated other comprehensive | Noncontrolling | ||||||||||||||||||||||||||||
| Shares | Amount | Shares | Amount | capital | earnings | loss, net | Interest | Total | |||||||||||||||||||||||||
| Balances at December 31, 2012 | 2,950 | $ | 73,750 | 36,443 | $ | 3 | $ | 2,204,778 | $ | (444,466 | ) | $ | (69,261 | ) | $ | 115,312 | $ | 1,880,116 | |||||||||||||||
| Net income | — | — | — | — | — | 156,283 | — | 15,772 | 172,055 | ||||||||||||||||||||||||
| Reversal of unrealized gains upon the sale of marketable securities | — | — | — | — | — | — | (1,673 | ) | (94 | ) | (1,767 | ) | |||||||||||||||||||||
| Change in fair value of cash flow hedges and amortization of swap settlements | — | — | — | — | — | — | 11,934 | 680 | 12,614 | ||||||||||||||||||||||||
| Change in fair value of marketable securities | — | — | — | — | — | — | (1,472 | ) | (84 | ) | (1,556 | ) | |||||||||||||||||||||
| Issuance of common stock under: | |||||||||||||||||||||||||||||||||
| Stock option plans | — | — | 65 | — | 7,244 | — | — | — | 7,244 | ||||||||||||||||||||||||
| Sale of common stock | — | — | 913 | 1 | 138,365 | — | — | — | 138,366 | ||||||||||||||||||||||||
| Equity-based compensation costs | — | — | — | — | (907 | ) | — | — | 2,515 | 1,608 | |||||||||||||||||||||||
| Redemptions of noncontrolling interest | — | — | — | — | (3,717 | ) | — | — | (1,994 | ) | (5,711 | ) | |||||||||||||||||||||
| Distributions to noncontrolling interest | — | — | — | — | — | — | — | (18,488 | ) | (18,488 | ) | ||||||||||||||||||||||
| Common and preferred stock dividends | — | — | — | — | — | (186,243 | ) | — | — | (186,243 | ) | ||||||||||||||||||||||
| Balances at December 31, 2013 | 2,950 | 73,750 | 37,421 | 4 | 2,345,763 | (474,426 | ) | (60,472 | ) | 113,619 | 1,998,238 | ||||||||||||||||||||||
| Net income | — | — | — | — | — | 122,150 | — | 12,288 | 134,438 | ||||||||||||||||||||||||
| Reversal of unrealized gains upon the sale of marketable securities | — | — | — | — | — | — | (841 | ) | (45 | ) | (886 | ) | |||||||||||||||||||||
| Changes in fair value derivatives and amortization of swap settlements | — | — | — | — | — | — | 3,721 | 447 | 4,168 | ||||||||||||||||||||||||
| Changes in fair value of marketable securities | — | — | — | — | — | — | 6,140 | 162 | 6,302 | ||||||||||||||||||||||||
| Issuance of common stock under: | |||||||||||||||||||||||||||||||||
| Stock consideration in the Merger, net | — | — | 23,067 | 2 | 3,774,085 | — | — | — | 3,774,087 | ||||||||||||||||||||||||
| Stock option and restricted stock plans | — | — | 218 | — | 11,024 | — | — | — | 11,024 | ||||||||||||||||||||||||
| Equity distribution agreements, net | — | — | 2,943 | — | 532,670 | — | — | — | 532,670 | ||||||||||||||||||||||||
| Equity-based compensation costs | — | — | — | — | 5,719 | — | — | 6,153 | 11,872 | ||||||||||||||||||||||||
| Reclassification of noncontrolling interest to redeemable noncontrolling interest | — | — | — | — | (19,823 | ) | — | — | (1,067 | ) | (20,890 | ) | |||||||||||||||||||||
| Changes in the redemption value of redeemable noncontrolling interest | — | — | — | — | 312 | — | — | — | 312 | ||||||||||||||||||||||||
| Conversion of Series G preferred stock | — | — | 34 | — | 4,349 | — | — | — | 4,349 | ||||||||||||||||||||||||
| Contributions from noncontrolling interest | — | — | — | — | — | — | — | 1,419,816 | 1,419,816 | ||||||||||||||||||||||||
| Retirement of noncontrolling interest | — | — | — | — | — | — | — | (1,419,816 | ) | (1,419,816 | ) | ||||||||||||||||||||||
| Distributions to noncontrolling interest | — | — | — | — | — | — | — | (17,069 | ) | (17,069 | ) | ||||||||||||||||||||||
| Redemptions of noncontrolling interest | — | — | — | — | (2,934 | ) | — | — | (1,092 | ) | (4,026 | ) | |||||||||||||||||||||
| Common and preferred stock dividends | — | — | — | — | — | (298,521 | ) | — | — | (298,521 | ) | ||||||||||||||||||||||
| Balances at December 31, 2014 | 2,950 | 73,750 | 63,683 | 6 | 6,651,165 | (650,797 | ) | (51,452 | ) | 113,396 | 6,136,068 | ||||||||||||||||||||||
| Net income | — | — | — | — | — | 232,120 | — | 16,119 | 248,239 | ||||||||||||||||||||||||
| Change in fair value of derivatives and amortization of swap settlements | — | — | — | — | — | — | 7,637 | 256 | 7,893 | ||||||||||||||||||||||||
| Change in fair value of marketable securities | — | — | — | — | — | — | 1,804 | 61 | 1,865 | ||||||||||||||||||||||||
| Issuance of common stock under: | |||||||||||||||||||||||||||||||||
| Stock option and restricted stock plans | — | — | 207 | — | 26,540 | — | — | — | 26,540 | ||||||||||||||||||||||||
| Sale of common stock | — | — | 1,489 | — | 332,137 | — | — | — | 332,137 | ||||||||||||||||||||||||
| Equity based compensation costs | — | — | — | — | 5,946 | — | — | 3,700 | 9,646 | ||||||||||||||||||||||||
| Reclassification of noncontrolling interest to redeemable noncontrolling interest | — | — | — | — | (7,657 | ) | — | — | (12,115 | ) | (19,772 | ) | |||||||||||||||||||||
| Changes in the redemption value of redeemable noncontrolling interest | — | — | — | — | (2,615 | ) | — | — | — | (2,615 | ) | ||||||||||||||||||||||
| Distributions to noncontrolling interest | — | — | — | — | — | — | — | (21,705 | ) | (21,705 | ) | ||||||||||||||||||||||
| Redemptions of noncontrolling interest | — | — | — | — | (2,199 | ) | — | — | (422 | ) | (2,621 | ) | |||||||||||||||||||||
| Common and preferred stock dividends | — | — | — | — | — | (378,652 | ) | — | — | (378,652 | ) | ||||||||||||||||||||||
| Balances at December 31, 2015 | 2,950 | $ | 73,750 | 65,379 | $ | 6 | $ | 7,003,317 | $ | (797,329 | ) | $ | (42,011 | ) | $ | 99,290 | $ | 6,337,023 | |||||||||||||||
| 2015 | 2014 | 2013 | |||||||||
| Cash flows from operating activities: | |||||||||||
| Net income | $ | 248,239 | $ | 134,438 | $ | 172,055 | |||||
| Adjustments to reconcile net income to net cash provided by operating activities: | |||||||||||
| Depreciation and amortization | 453,423 | 360,592 | 193,518 | ||||||||
| Earnings from co-investments | (21,392 | ) | (33,335 | ) | (14,613 | ) | |||||
| Company's share of gain on the sales of co-investments | (469 | ) | (6,558 | ) | (41,252 | ) | |||||
| Operating distributions from co-investments | 46,608 | 49,486 | 19,636 | ||||||||
| Gain on the sales of real estate and land | (47,333 | ) | (46,039 | ) | (30,725 | ) | |||||
| Loss on early retirement of debt, net | 6,114 | 268 | 300 | ||||||||
| Gains on sale of marketable securities and other investments | (598 | ) | (886 | ) | (1,767 | ) | |||||
| Amortization of (premium) discount and financing costs, net | (19,361 | ) | (14,672 | ) | 12,216 | ||||||
| Amortization of discount on notes receivables | — | — | (844 | ) | |||||||
| Amortization of discount on marketable securities and other investments | (12,389 | ) | (9,325 | ) | (6,556 | ) | |||||
| Non cash merger and integration expenses | — | 9,025 | — | ||||||||
| Equity-based compensation | 6,061 | 8,740 | 4,508 | ||||||||
| Gains on remeasurement of co-investment | (34,014 | ) | — | — | |||||||
| Changes in operating assets and liabilities: | |||||||||||
| Prepaid expenses, in-place lease value, receivables and other assets | 267 | 15,828 | (1,588 | ) | |||||||
| Accounts payable and accrued liabilities | (9,633 | ) | 24,233 | 72 | |||||||
| Other liabilities | 1,887 | 1,517 | 22 | ||||||||
| Net cash provided by operating activities | 617,410 | 493,312 | 304,982 | ||||||||
| Cash flows from investing activities: | |||||||||||
| Additions to real estate: | |||||||||||
| Acquisitions of real estate and acquisition related capital expenditures | (515,726 | ) | (387,547 | ) | (348,774 | ) | |||||
| Redevelopment | (99,346 | ) | (81,429 | ) | (47,289 | ) | |||||
| Development acquisitions of and additions to real estate under development | (157,900 | ) | (152,766 | ) | (17,757 | ) | |||||
| Capital expenditures on rental properties | (57,277 | ) | (78,864 | ) | (56,919 | ) | |||||
| Proceeds from insurance for property losses | 16,811 | 35,547 | — | ||||||||
| BRE merger consideration paid | — | (555,826 | ) | — | |||||||
| Acquisition of membership interest in co-investment | (115,724 | ) | — | — | |||||||
| Dispositions of real estate | 319,008 | 141,189 | 65,496 | ||||||||
| Dispositions of co-investments | 31,556 | 13,900 | — | ||||||||
| Changes in restricted cash and refundable deposits | (14,068 | ) | (36,582 | ) | (9,149 | ) | |||||
| Purchases of marketable securities | (14,300 | ) | (20,516 | ) | (16,442 | ) | |||||
| Sales and maturities of marketable securities and other investments | 8,907 | 8,753 | 24,172 | ||||||||
| Purchases of and advances under notes and other receivables | — | — | (56,750 | ) | |||||||
| Collections of notes and other receivables | — | 76,585 | 53,438 | ||||||||
| Contributions to co-investments | (127,879 | ) | (246,006 | ) | (162,578 | ) | |||||
| Non-operating distributions from co-investments | 382 | 136,406 | 118,856 | ||||||||
| Net cash used in investing activities | (725,556 | ) | (1,147,156 | ) | (453,696 | ) | |||||
| Cash flows from financing activities: | |||||||||||
| Borrowings under debt agreements | 1,345,855 | 2,093,406 | 969,061 | ||||||||
| Repayment of debt | (1,197,351 | ) | (1,814,020 | ) | (750,900 | ) | |||||
| Additions to deferred charges | (8,034 | ) | (17,402 | ) | (7,402 | ) | |||||
| Net proceeds from stock options exercised | 26,540 | 11,039 | 4,958 | ||||||||
| Net proceeds from issuance of common stock | 332,137 | 531,379 | 137,749 | ||||||||
| Distributions to noncontrolling interest | (21,055 | ) | (17,465 | ) | (18,488 | ) | |||||
| Redemption of noncontrolling interest | (2,621 | ) | (5,753 | ) | (5,711 | ) | |||||
| Common and preferred stock dividends paid | (367,257 | ) | (260,574 | ) | (180,668 | ) | |||||
| Net cash provided by financing activities | 108,214 | 520,610 | 148,599 | ||||||||
| Cash acquired from the BRE merger | — | 140,353 | — | ||||||||
| Cash acquired from consolidation of co-investment | 4,005 | — | — | ||||||||
| Net increase (decrease) in cash and cash equivalents | 4,073 | 7,119 | (115 | ) | |||||||
| Cash and cash equivalents at beginning of year | 25,610 | 18,491 | 18,606 | ||||||||
| Cash and cash equivalents at end of year | $ | 29,683 | $ | 25,610 | $ | 18,491 | |||||
| Supplemental disclosure of cash flow information: | |||||||||||
| Cash paid for interest, net of capitalized interest | $ | 181,106 | $ | 130,691 | $ | 103,516 | |||||
| Interest capitalized | $ | 15,571 | $ | 22,510 | $ | 16,486 | |||||
| Supplemental disclosure of noncash investing and financing activities: | |||||||||||
| Issuance of Operating Partnership units for contributed properties | $ | — | $ | 1,419,816 | $ | — | |||||
| Retirement of Operating Partnership units | $ | — | $ | (1,419,816 | ) | $ | — | ||||
| Transfer from real estate under development to rental properties | $ | 308,704 | $ | 10,203 | $ | 68 | |||||
| Transfer from real estate under development to co-investments | $ | 6,234 | $ | 83,574 | $ | 27,906 | |||||
| Reclassification to redeemable noncontrolling interest from additional paid in capital and noncontrolling interest | $ | 22,387 | $ | 18,766 | $ | — | |||||
| Debt assumed in connection with acquisition of co-investment | $ | 114,435 | $ | — | $ | — | |||||
| Mortgage notes (excluding BRE merger) assumed in connection with purchases of real estate including the loan premiums recorded | $ | — | $ | 72,568 | $ | — | |||||
| 2015 | 2014 | ||||||
| ASSETS | |||||||
| Real estate: | |||||||
| Rental properties: | |||||||
| Land and land improvements | $ | 2,522,842 | $ | 2,424,930 | |||
| Buildings and improvements | 9,808,627 | 8,819,751 | |||||
| 12,331,469 | 11,244,681 | ||||||
| Less: accumulated depreciation | (1,949,892 | ) | (1,564,806 | ) | |||
| 10,381,577 | 9,679,875 | ||||||
| Real estate under development | 242,326 | 429,096 | |||||
| Co-investments | 1,036,047 | 1,042,423 | |||||
| Real estate held for sale, net | 26,879 | 56,300 | |||||
| 11,686,829 | 11,207,694 | ||||||
| Cash and cash equivalents-unrestricted | 29,683 | 25,610 | |||||
| Cash and cash equivalents-restricted | 93,372 | 70,139 | |||||
| Marketable securities and other investments | 137,485 | 117,240 | |||||
| Notes and other receivables | 19,285 | 24,923 | |||||
| Acquired in-place lease value, net | 2,857 | 47,748 | |||||
| Prepaid expenses and other assets | 35,580 | 33,378 | |||||
| Total assets | $ | 12,005,091 | $ | 11,526,732 | |||
| LIABILITIES AND CAPITAL | |||||||
| Unsecured debt, net | $ | 3,088,680 | $ | 2,603,548 | |||
| Mortgage notes payable, net | 2,215,077 | 2,234,317 | |||||
| Lines of credit, net | 11,707 | 242,824 | |||||
| Accounts payable and accrued liabilities | 131,415 | 135,162 | |||||
| Construction payable | 40,953 | 30,892 | |||||
| Distributions payable | 100,266 | 88,221 | |||||
| Other liabilities | 34,518 | 32,444 | |||||
| Total liabilities | 5,622,616 | 5,367,408 | |||||
| Commitments and contingencies | |||||||
| Redeemable noncontrolling interest | 45,452 | 23,256 | |||||
| Capital: | |||||||
| General Partner: | |||||||
| Common equity (65,379,359 and 63,682,646 units issued and outstanding, respectively) | 6,208,535 | 6,002,915 | |||||
| Series H 7.125% Preferred interest (liquidation value of $73,750) | 71,209 | 71,209 | |||||
| 6,279,744 | 6,074,124 | ||||||
| Limited Partners: | |||||||
| Common equity (2,214,545 and 2,168,158 units issued and outstanding, respectively) | 47,235 | 48,665 | |||||
| Accumulated other comprehensive loss | (39,598 | ) | (49,356 | ) | |||
| Total partners' capital | 6,287,381 | 6,073,433 | |||||
| Noncontrolling interest | 49,642 | 62,635 | |||||
| Total capital | 6,337,023 | 6,136,068 | |||||
| Total liabilities and capital | $ | 12,005,091 | $ | 11,526,732 | |||
| 2007 | 2006 | 2005 | |||||||
| Revenues: | |||||||||
| Rental and other property | $ | 383,433 | $ | 334,770 | $ | 303,235 | |||
| Management and other fees from affiliates | 5,090 | 5,030 | 10,951 | ||||||
| 388,523 | 339,800 | 314,186 | |||||||
| Expenses: | |||||||||
| Property operating, excluding real estate taxes | 95,849 | 85,811 | 78,715 | ||||||
| Real estate taxes | 32,575 | 28,587 | 25,764 | ||||||
| Depreciation and amortization | 100,389 | 78,094 | 74,849 | ||||||
| Interest | 80,995 | 72,898 | 70,784 | ||||||
| Amortization of deferred financing costs | 3,071 | 2,745 | 1,947 | ||||||
| General and administrative | 26,273 | 22,234 | 19,148 | ||||||
| Other expenses | 800 | 1,770 | 5,827 | ||||||
| 339,952 | 292,139 | 277,034 | |||||||
| Earnings from operations | 48,571 | 47,661 | 37,152 | ||||||
| Gain on sale of real estate | - | - | 6,391 | ||||||
| Interest and other income | 10,310 | 6,176 | 8,524 | ||||||
| Equity income (loss) in co-investments | 3,120 | (1,503) | 18,553 | ||||||
| Minority interests | (4,847) | (4,977) | (5,340) | ||||||
| Income before discontinued operations and tax provision | 57,154 | 47,357 | 65,280 | ||||||
| Income tax provision | (400) | (525) | (2,538) | ||||||
| Income before discontinued operations | 56,754 | 46,832 | 62,742 | ||||||
| Income from discontinued operations (net of minority interests) | 80,546 | 33,015 | 35,558 | ||||||
| Net income | 137,300 | 79,847 | 98,300 | ||||||
| Distribution on preferred units - Series F & G | (9,174) | (5,145) | (1,953) | ||||||
| Distribution on preferred units - limited partners | (10,238) | (10,238) | (10,238) | ||||||
| Net income available to common units | $ | 117,888 | $ | 64,464 | $ | 86,109 | |||
| Per unit data: | |||||||||
| Basic: | |||||||||
| Income before discontinued operations available to common units | $ | 1.38 | $ | 1.23 | $ | 2.00 | |||
| Income from discontinued operations | 2.98 | 1.29 | 1.40 | ||||||
| Net income available to common units | $ | 4.36 | $ | 2.52 | $ | 3.40 | |||
| Weighted average number of units outstanding during the year | 27,043,697 | 25,560,415 | 25,343,695 | ||||||
| Diluted: | |||||||||
| Income before discontinued operations available to common units | $ | 1.35 | $ | 1.21 | $ | 1.97 | |||
| Income from discontinued operations | 2.92 | 1.27 | 1.38 | ||||||
| Net income available to common units | $ | 4.27 | $ | 2.48 | $ | 3.35 | |||
| Weighted average number of units outstanding during the year | 27,596,668 | 26,029,775 | 25,693,637 | ||||||
| 2015 | 2014 | 2013 | |||||||||
| Revenues: | |||||||||||
| Rental and other property | $ | 1,185,498 | $ | 961,591 | $ | 603,327 | |||||
| Management and other fees from affiliates | 8,909 | 9,347 | 7,263 | ||||||||
| 1,194,407 | 970,938 | 610,590 | |||||||||
| Expenses: | |||||||||||
| Property operating, excluding real estate taxes | 234,953 | 204,673 | 140,060 | ||||||||
| Real estate taxes | 128,555 | 107,873 | 57,276 | ||||||||
| Depreciation and amortization | 453,423 | 360,592 | 192,420 | ||||||||
| General and administrative | 40,090 | 40,878 | 26,684 | ||||||||
| Merger and integration expenses | 3,798 | 53,530 | 4,284 | ||||||||
| Acquisition and investment related costs | 2,414 | 1,878 | 1,161 | ||||||||
| 863,233 | 769,424 | 421,885 | |||||||||
| Earnings from operations | 331,174 | 201,514 | 188,705 | ||||||||
| Interest expense | (204,827 | ) | (164,551 | ) | (116,524 | ) | |||||
| Total return swap income | 5,655 | — | — | ||||||||
| Interest and other income | 19,143 | 11,811 | 11,633 | ||||||||
| Equity income from co-investments | 21,861 | 39,893 | 55,865 | ||||||||
| Loss on early retirement of debt, net | (6,114 | ) | (268 | ) | (300 | ) | |||||
| Gains on sale of real estate and land | 47,333 | 46,039 | 1,503 | ||||||||
| Gains on remeasurement of co-investment | 34,014 | — | — | ||||||||
| Income before discontinued operations | 248,239 | 134,438 | 140,882 | ||||||||
| Income from discontinued operations | — | — | 31,173 | ||||||||
| Net income | 248,239 | 134,438 | 172,055 | ||||||||
| Net income attributable to noncontrolling interest | (8,295 | ) | (7,421 | ) | (6,834 | ) | |||||
| Net income attributable to controlling interest | 239,944 | 127,017 | 165,221 | ||||||||
| Preferred interest distributions | (5,255 | ) | (5,291 | ) | (5,472 | ) | |||||
| Net income available to common unitholders | $ | 234,689 | $ | 121,726 | $ | 159,749 | |||||
| Per unit data: | |||||||||||
| Basic: | |||||||||||
| Income before discontinued operations available to common unitholders | $ | 3.50 | $ | 2.07 | $ | 3.27 | |||||
| Income from discontinued operations | — | — | 0.79 | ||||||||
| Net income available to common unitholders | $ | 3.50 | $ | 2.07 | $ | 4.06 | |||||
| Weighted average number of common units outstanding during the year | 67,054,184 | 58,771,666 | 39,380,385 | ||||||||
| Diluted: | |||||||||||
| Income before discontinued operations available to common unitholders | $ | 3.49 | $ | 2.07 | $ | 3.26 | |||||
| Income from discontinued operations | — | — | 0.79 | ||||||||
| Net income available to common unitholders | $ | 3.49 | $ | 2.07 | $ | 4.05 | |||||
| Weighted average number of common units outstanding during the year | 67,244,152 | 58,921,232 | 39,466,720 | ||||||||
| 2015 | 2014 | 2013 | |||||||||
| Net income | $ | 248,239 | $ | 134,438 | $ | 172,055 | |||||
| Other comprehensive income (loss): | |||||||||||
| Changes in fair value of cash flow hedges and reclassification to interest expense | 7,893 | 4,168 | 12,614 | ||||||||
| Changes in fair value of marketable securities | 1,865 | 6,302 | (1,556 | ) | |||||||
| Reversal of unrealized gains upon the sale of marketable securities | — | (886 | ) | (1,767 | ) | ||||||
| Total other comprehensive income | 9,758 | 9,584 | 9,291 | ||||||||
| Comprehensive income | 257,997 | 144,022 | 181,346 | ||||||||
| Comprehensive income attributable to noncontrolling interest | (8,295 | ) | (7,421 | ) | (6,834 | ) | |||||
| Comprehensive income attributable to controlling interest | $ | 249,702 | $ | 136,601 | $ | 174,512 | |||||
| General Partner | Limited Partners | Accumulated | ||||||||||||||||||||
| Preferred | Preferred | other | ||||||||||||||||||||
| Common Equity | Equity | Common Equity | Equity | comprehensive | ||||||||||||||||||
| Units | Amount | Amount | Units | Amount | Amount | (loss) income | Total | |||||||||||||||
| Balances at December 31, 2004 | 23,041 | $ | 566,865 | $ | 24,412 | 2,478 | $ | 59,436 | $ | 126,690 | $ | - | $ | 777,403 | ||||||||
| Comprehensive income: | ||||||||||||||||||||||
| Net income | - | 77,763 | 1,953 | - | 8,346 | 10,238 | - | 98,300 | ||||||||||||||
| Change in fair value of cash flow hedges | - | - | - | - | - | - | 660 | 660 | ||||||||||||||
| Comprehensive income | 98,960 | |||||||||||||||||||||
| Issuance of common units under | ||||||||||||||||||||||
| stock-based compensation plans | 103 | 5,767 | - | - | - | - | - | 5,767 | ||||||||||||||
| Retirement of Essex Property Trust, Inc. | ||||||||||||||||||||||
| common stock | (286) | (25,000) | - | - | - | - | - | (25,000) | ||||||||||||||
| Redemption of limited partner common units | - | - | - | (89) | (2,861) | - | - | (2,861) | ||||||||||||||
| Vested series Z and Z-1 incentive units | - | - | - | 48 | 2,351 | - | - | 2,351 | ||||||||||||||
| Reallocation of partners' capital | - | 5,135 | - | - | (5,135) | - | - | - | ||||||||||||||
| Partners' distributions | - | (74,635) | (1,953) | - | (7,885) | (10,238) | - | (94,711) | ||||||||||||||
| Balances at December 31, 2005 | 22,858 | $ | 555,895 | $ | 24,412 | 2,437 | $ | 54,252 | $ | 126,690 | $ | 660 | $ | 761,909 | ||||||||
| Comprehensive income: | ||||||||||||||||||||||
| Net income | - | 57,603 | 5,145 | - | 6,861 | 10,238 | - | 79,847 | ||||||||||||||
| Change in fair value of cash flow hedges | - | - | - | - | - | - | (2,933) | (2,933) | ||||||||||||||
| Comprehensive income | 76,914 | |||||||||||||||||||||
| Issuance of common units under | ||||||||||||||||||||||
| Stock-based compensation plans | 92 | 5,575 | - | - | - | - | - | 5,575 | ||||||||||||||
| Sale of common stock | 427 | 48,273 | - | - | - | - | - | 48,273 | ||||||||||||||
| Issuance of general partner common units | 39 | 443 | - | - | - | - | - | 443 | ||||||||||||||
| Issuance of limited partners' common units | - | - | - | 73 | 7,704 | - | - | 7,704 | ||||||||||||||
| Redemption of limited partner common units | - | - | - | (57) | (2,863) | - | - | (2,863) | ||||||||||||||
| Vested series Z and Z-1 incentive units | - | - | - | 42 | 1,759 | - | - | 1,759 | ||||||||||||||
| Reallocation of partners' capital | - | - | - | - | 307 | - | - | 307 | ||||||||||||||
| Partners' distributions | - | (77,719) | (5,145) | - | (8,290) | (10,238) | - | (101,392) | ||||||||||||||
| Balances at December 31, 2006 | 23,416 | $ | 590,070 | $ | 24,412 | 2,495 | $ | 59,730 | $ | 126,690 | $ | (2,273) | $ | 798,629 | ||||||||
| Comprehensive income: | ||||||||||||||||||||||
| Net income | - | 106,464 | 9,174 | - | 11,424 | 10,238 | - | 137,300 | ||||||||||||||
| Settlement of forward-starting swap | - | - | - | - | - | - | 1,311 | 1,311 | ||||||||||||||
| Change in fair value of cash flow hedges and | ||||||||||||||||||||||
| amortization of gain on settlement of swap | - | - | - | - | - | - | (8,026) | (8,026) | ||||||||||||||
| Comprehensive income | 130,585 | |||||||||||||||||||||
| Issuance of common units under | ||||||||||||||||||||||
| Stock-based compensation plans | 87 | 5,648 | - | - | - | - | - | 5,648 | ||||||||||||||
| Sale of common stock | 1,671 | 213,672 | - | - | - | - | - | 213,672 | ||||||||||||||
Retirement of common units from retirement of common stock | (323) | (32,644) | - | - | - | - | - | (32,644) | ||||||||||||||
Issuance of general partner common units and reallocation between general partner and limited partners | 26 | (16,504) | - | - | 18,767 | - | - | 2,263 | ||||||||||||||
| Issuance of limited partners' common units | - | - | - | - | - | - | - | - | ||||||||||||||
| Redemption of limited partner common units | - | - | - | (37) | (2,088) | - | - | (2,088) | ||||||||||||||
| Vested series Z and Z-1 incentive units | - | - | - | 29 | 1,595 | - | - | 1,595 | ||||||||||||||
| Partners' distributions | - | (91,812) | (9,174) | - | (9,255) | (10,238) | - | (120,479) | ||||||||||||||
| Balances at December 31, 2007 | 24,877 | $ | 774,894 | $ | 24,412 | 2,487 | $ | 80,173 | $ | 126,690 | $ | (8,988) | $ | 997,181 | ||||||||
| General Partner | Limited Partners | Accumulated | |||||||||||||||||||||||||||||||
| Preferred | Preferred | other | |||||||||||||||||||||||||||||||
| Common Equity | Equity | Common Equity | Equity | comprehensive | Noncontrolling | ||||||||||||||||||||||||||||
| Units | Amount | Amount | Units | Amount | Amount | loss, net | Interest | Total | |||||||||||||||||||||||||
| Balances at December 31, 2012 | 36,443 | $ | 1,762,856 | $ | 71,209 | 2,122 | $ | 45,593 | $ | — | $ | (68,231 | ) | $ | 68,689 | $ | 1,880,116 | ||||||||||||||||
| Net income | — | 150,811 | 5,472 | — | 8,938 | — | — | 6,834 | 172,055 | ||||||||||||||||||||||||
| Reversal of unrealized gains upon the sale of marketable securities | — | — | — | — | — | — | (1,767 | ) | — | (1,767 | ) | ||||||||||||||||||||||
| Change in fair value of cash flow hedges and amortization of swap settlements | — | — | — | — | — | — | 12,614 | — | 12,614 | ||||||||||||||||||||||||
| Changes in fair value of marketable securities | — | — | — | — | — | — | (1,556 | ) | — | (1,556 | ) | ||||||||||||||||||||||
| Issuance of common units under: | |||||||||||||||||||||||||||||||||
| Stock and unit based compensation plans | 65 | 7,244 | — | — | — | — | — | — | 7,244 | ||||||||||||||||||||||||
| Sale of common stock by the general partner | 913 | 138,366 | — | — | — | — | — | — | 138,366 | ||||||||||||||||||||||||
| Stock and unit based compensation costs | — | (907 | ) | — | 28 | 2,515 | — | — | — | 1,608 | |||||||||||||||||||||||
| Redemptions | — | (3,717 | ) | — | — | (617 | ) | — | — | (1,377 | ) | (5,711 | ) | ||||||||||||||||||||
| Distributions to noncontrolling interest | — | — | — | — | — | — | — | (8,016 | ) | (8,016 | ) | ||||||||||||||||||||||
| Distributions declared | — | (180,771 | ) | (5,472 | ) | — | (10,472 | ) | — | — | — | (196,715 | ) | ||||||||||||||||||||
| Balances at December 31, 2013 | 37,421 | 1,873,882 | 71,209 | 2,150 | 45,957 | — | (58,940 | ) | 66,130 | 1,998,238 | |||||||||||||||||||||||
| Net income | — | 116,859 | 5,291 | — | 4,867 | — | — | 7,421 | 134,438 | ||||||||||||||||||||||||
| Reversal of unrealized gains upon the sale of marketable securities | — | — | — | — | — | — | (886 | ) | — | (886 | ) | ||||||||||||||||||||||
| Changes in fair value of derivatives and amortization of swap settlements | — | — | — | — | — | — | 4,168 | — | 4,168 | ||||||||||||||||||||||||
| Changes in fair value of marketable securities | — | — | — | — | — | — | 6,302 | — | 6,302 | ||||||||||||||||||||||||
| Issuance of common units under: | |||||||||||||||||||||||||||||||||
| Common stock issued as consideration by general partner in merger | 23,067 | 3,774,087 | — | — | — | — | — | — | 3,774,087 | ||||||||||||||||||||||||
| General partner's stock based compensation | 218 | 11,024 | — | — | — | — | — | — | 11,024 | ||||||||||||||||||||||||
| Sale of common stock by the general partner | 2,943 | 532,670 | — | — | — | — | — | — | 532,670 | ||||||||||||||||||||||||
| Equity-based compensation costs | — | 5,719 | — | 28 | 6,153 | — | — | — | 11,872 | ||||||||||||||||||||||||
| Reclassification of noncontrolling interest to redeemable noncontrolling interest | — | (19,823 | ) | — | (10 | ) | 4,017 | — | — | (5,084 | ) | (20,890 | ) | ||||||||||||||||||||
| Changes in the redemption value of redeemable noncontrolling interest | — | 312 | — | — | — | — | — | — | 312 | ||||||||||||||||||||||||
| Conversion of Series G preferred stock | 34 | 4,349 | — | — | — | — | — | — | 4,349 | ||||||||||||||||||||||||
| Contributions from noncontrolling interest | — | — | — | 8,561 | 1,419,816 | — | — | — | 1,419,816 | ||||||||||||||||||||||||
| Retirement of noncontrolling interest | — | — | — | (8,561 | ) | (1,419,816 | ) | — | — | — | (1,419,816 | ) | |||||||||||||||||||||
| Distributions to noncontrolling interests | — | — | — | — | — | — | — | (4,890 | ) | (4,890 | ) | ||||||||||||||||||||||
| Redemptions | — | (3,374 | ) | — | — | (1,181 | ) | — | — | (942 | ) | (5,497 | ) | ||||||||||||||||||||
| Distributions declared | — | (292,790 | ) | (5,291 | ) | — | (11,148 | ) | — | — | — | (309,229 | ) | ||||||||||||||||||||
| Balances at December 31, 2014 | 63,683 | 6,002,915 | 71,209 | 2,168 | 48,665 | — | (49,356 | ) | 62,635 | 6,136,068 | |||||||||||||||||||||||
| Net income | — | 226,865 | 5,255 | — | 7,824 | — | — | 8,295 | 248,239 | ||||||||||||||||||||||||
| Change in fair value of derivatives and amortization of swap settlements | — | — | — | — | — | — | 7,893 | — | 7,893 | ||||||||||||||||||||||||
| Changes in fair value of marketable securities | — | — | — | — | — | — | 1,865 | — | 1,865 | ||||||||||||||||||||||||
| Issuance of common units under: | |||||||||||||||||||||||||||||||||
| General partner's stock based compensation | 207 | 26,540 | — | — | — | — | — | — | 26,540 | ||||||||||||||||||||||||
| Sale of common stock by the general partner | 1,482 | 332,137 | — | — | — | — | — | — | 332,137 | ||||||||||||||||||||||||
| Equity based compensation costs | — | 5,946 | — | 54 | 3,700 | — | — | — | 9,646 | ||||||||||||||||||||||||
| Changes in redemption value of redeemable noncontrolling interest | — | (2,615 | ) | — | — | — | — | — | — | (2,615 | ) | ||||||||||||||||||||||
| Reclassification of noncontrolling interest to redeemable noncontrolling interest | — | (7,657 | ) | — | — | — | — | — | (12,115 | ) | (19,772 | ) | |||||||||||||||||||||
| Distributions to noncontrolling interests | — | — | — | — | — | — | — | (8,751 | ) | (8,751 | ) | ||||||||||||||||||||||
| Redemptions | 7 | (2,199 | ) | — | (7 | ) | — | — | — | (422 | ) | (2,621 | ) | ||||||||||||||||||||
| Distributions declared | — | (373,397 | ) | (5,255 | ) | — | (12,954 | ) | — | — | — | (391,606 | ) | ||||||||||||||||||||
| Balances at December 31, 2015 | 65,379 | $ | 6,208,535 | $ | 71,209 | 2,215 | $ | 47,235 | $ | — | $ | (39,598 | ) | $ | 49,642 | $ | 6,337,023 | ||||||||||||||||
| 2007 | 2006 | 2005 | |||||||
| Cash flows from operating activities: | |||||||||
| Net income | $ | 137,300 | $ | 79,847 | $ | 98,300 | |||
| Minority interests | 4,847 | 5,639 | 5,687 | ||||||
| Adjustments to reconcile net income to net | |||||||||
| cash provided by operating activities: | |||||||||
| Gain on the sales of real estate | (66,559) | (22,096) | (37,802) | ||||||
| The Operating Partnership's share of gain on the sales of | |||||||||
| co-investments assets | (2,046) | - | (18,115) | ||||||
| Impairment loss and reserve for loan loss | 500 | 800 | 1,300 | ||||||
| Equity (income) loss of co-investments | (320) | 1,503 | (7,420) | ||||||
| Depreciation and amortization | 100,389 | 83,036 | 80,075 | ||||||
| Amortization of deferred financing costs | 3,071 | 2,743 | 1,970 | ||||||
| Changes in operating assets and liabilities: | |||||||||
| Prepaid expenses and other assets | 2,458 | 493 | (4,762) | ||||||
| Accounts payable and accrued liabilities | 9,984 | 6,162 | 4,709 | ||||||
| Other liabilities | 1,254 | 1,808 | 667 | ||||||
| Net cash provided by operating activities | 190,878 | 159,935 | 124,609 | ||||||
| Cash flows used in investing activities: | |||||||||
| Additions to real estate: | |||||||||
| Acquisitions of real estate | (336,312) | (199,107) | (91,496) | ||||||
| Improvements to recent acquisitions | (5,145) | (5,238) | (5,009) | ||||||
| Redevelopment | (38,618) | (25,609) | (14,229) | ||||||
| Revenue generating capital expenditures | (11,044) | (4,788) | (2,933) | ||||||
| Non-revenue generating capital expenditures | (22,620) | (19,120) | (14,568) | ||||||
| Additions to real estate under development | (142,968) | (68,362) | (24,861) | ||||||
| Dispositions of real estate | 218,069 | 38,092 | 68,585 | ||||||
| Changes in restricted cash and refundable deposits | 467 | 4,371 | 7,318 | ||||||
| Purchases of marketable securities | (7,776) | - | - | ||||||
| Sales of marketable securities | 5,759 | - | - | ||||||
| Advances under notes and other receivables | (36,145) | (26,125) | (3,220) | ||||||
| Collections of notes and other receivables | 3,724 | 21,234 | 4,880 | ||||||
| Contributions to co-investments | (21,647) | (38,395) | (4,799) | ||||||
| Distributions from co-investments | 16,385 | 10,171 | 49,489 | ||||||
| Net cash used in investing activities | (377,871) | (312,876) | (30,843) | ||||||
| Cash flows from financing activities: | |||||||||
| Borrowings under mortgage and other notes payable and lines of credit | 866,397 | 324,228 | 205,096 | ||||||
| Repayment of mortgage and other notes payable and lines of credit | (678,383) | (266,965) | (389,363) | ||||||
| Additions to deferred charges | (1,800) | (587) | (6,339) | ||||||
| Proceeds from settlement of derivative instruments | 1,311 | - | - | ||||||
| Proceeds from exchangeable bonds | - | - | 225,000 | ||||||
| Retirement of Essex Property Trust, Inc. common stock | (32,644) | - | (25,000) | ||||||
| Net proceeds from stock options exercised | 4,321 | 4,287 | 4,489 | ||||||
| Net proceeds from issuance of common units to general partners | 213,672 | 48,273 | - | ||||||
| Net proceeds from issuance of preferred equity, Series G | - | 145,912 | - | ||||||
| Contributions from minority interest partner | 4,000 | - | - | ||||||
| Distributions to limited partners and minority interest partners | (82,715) | (21,657) | (23,165) | ||||||
| Redemption of limited partner units and minority interests | (9,233) | (4,779) | (4,528) | ||||||
| Distributions to general partner | (97,639) | (80,446) | (76,263) | ||||||
| Net cash provided by (used in) financing activities | 187,287 | 148,266 | (90,073) | ||||||
| Net increase (decrease) in cash and cash equivalents | 294 | (4,675) | 3,693 | ||||||
| Cash and cash equivalents at beginning of year | 9,662 | 14,337 | 10,644 | ||||||
| Cash and cash equivalents at end of year | $ | 9,956 | $ | 9,662 | $ | 14,337 |
| 2007 | 2006 | 2005 | |||||||
| Supplemental disclosure of cash flow information: | |||||||||
| Cash paid for interest, net of $5,100, $3,900 and $1,100 | |||||||||
| capitalized in 2007, 2006 and 2005, respectively | $ | 74,397 | $ | 68,686 | $ | 71,619 | |||
| Supplemental disclosure of noncash investing and | |||||||||
| financing activities: | |||||||||
| Mortgage notes assumed in connection with purchases | |||||||||
| of real estate | $ | 43,839 | - | - | |||||
| Land contributed by a partner in a consolidated joint venture | $ | 22,200 | - | - | |||||
| Issuance of DownREIT units in connection with | |||||||||
| purchase of real estate | $ | 7,067 | - | - | |||||
| Issuance of Operating Partnership units in | |||||||||
| connection with the purchase of real estate | - | $ | 7,704 | - | |||||
| Land contributed by a partner in a consolidated joint venture | |||||||||
| Accrual of distributions | $ | 28,521 | $ | 24,910 | $ | 22,496 | |||
| Change in value of cash flow hedges and amortization of swap settlement | |||||||||
| included in other liabilities or other assets as applicable | $ | (8,026) | $ | (2,933) | $ | 660 | |||
| Accruals for capital expenditures included in the year-end balance of | |||||||||
| accounts payable and accrued liabilities | $ | 8,703 | $ | 4,804 | $ | 4,636 |
| 2015 | 2014 | 2013 | |||||||||
| Cash flows from operating activities: | |||||||||||
| Net income | $ | 248,239 | $ | 134,438 | $ | 172,055 | |||||
| Adjustments to reconcile net income to net cash provided by operating activities: | |||||||||||
| Depreciation and amortization | 453,423 | 360,592 | 193,518 | ||||||||
| Earnings from co-investments | (21,392 | ) | (33,335 | ) | (14,613 | ) | |||||
| Operating Partnership's share of gain on the sales of co-investments | (469 | ) | (6,558 | ) | (41,252 | ) | |||||
| Operating distributions from co-investments | 46,608 | 49,486 | 19,636 | ||||||||
| Gain on the sales of real estate and land | (47,333 | ) | (46,039 | ) | (30,725 | ) | |||||
| Loss on early retirement of debt, net | 6,114 | 268 | 300 | ||||||||
| Gains on sale of marketable securities and other investments | (598 | ) | (886 | ) | (1,767 | ) | |||||
| Amortization of (premium) discount and financing costs, net | (19,361 | ) | (14,672 | ) | 12,216 | ||||||
| Amortization of discount on notes receivables | — | — | (844 | ) | |||||||
| Amortization of discount on marketable securities and other investments | (12,389 | ) | (9,325 | ) | (6,556 | ) | |||||
| Non cash merger and integration expenses | — | 9,025 | — | ||||||||
| Equity-based compensation | 6,061 | 8,740 | 4,508 | ||||||||
| Gains on remeasurement of co-investment | (34,014 | ) | — | — | |||||||
| Changes in operating assets and liabilities: | |||||||||||
| Prepaid expenses, in-place lease value, receivables and other assets | 267 | 15,828 | (1,588 | ) | |||||||
| Accounts payable and accrued liabilities | (9,633 | ) | 24,233 | 72 | |||||||
| Other liabilities | 1,887 | 1,517 | 22 | ||||||||
| Net cash provided by operating activities | 617,410 | 493,312 | 304,982 | ||||||||
| Cash flows from investing activities: | |||||||||||
| Additions to real estate: | |||||||||||
| Acquisitions of real estate and acquisition related capital expenditures | (515,726 | ) | (387,547 | ) | (348,774 | ) | |||||
| Redevelopment | (99,346 | ) | (81,429 | ) | (47,289 | ) | |||||
| Development acquisitions of and additions to real estate under development | (157,900 | ) | (152,766 | ) | (17,757 | ) | |||||
| Capital expenditures on rental properties | (57,277 | ) | (78,864 | ) | (56,919 | ) | |||||
| Proceeds from insurance for property losses | 16,811 | 35,547 | — | ||||||||
| BRE merger consideration paid | — | (555,826 | ) | — | |||||||
| Acquisition of membership interest in co-investment | (115,724 | ) | — | — | |||||||
| Dispositions of real estate | 319,008 | 141,189 | 65,496 | ||||||||
| Dispositions of co-investments | 31,556 | 13,900 | — | ||||||||
| Changes in restricted cash and refundable deposits | (14,068 | ) | (36,582 | ) | (9,149 | ) | |||||
| Purchases of marketable securities | (14,300 | ) | (20,516 | ) | (16,442 | ) | |||||
| Sales and maturities of marketable securities and other investments | 8,907 | 8,753 | 24,172 | ||||||||
| Purchases of and advances under notes and other receivables | — | — | (56,750 | ) | |||||||
| Collections of notes and other receivables | — | 76,585 | 53,438 | ||||||||
| Contributions to co-investments | (127,879 | ) | (246,006 | ) | (162,578 | ) | |||||
| Non-operating distributions from co-investments | 382 | 136,406 | 118,856 | ||||||||
| Net cash used in investing activities | (725,556 | ) | (1,147,156 | ) | (453,696 | ) | |||||
| Cash flows from financing activities: | |||||||||||
| Borrowings under debt agreements | 1,345,855 | 2,093,406 | 969,061 | ||||||||
| Repayment of debt | (1,197,351 | ) | (1,814,020 | ) | (750,900 | ) | |||||
| Additions to deferred charges | (8,034 | ) | (17,402 | ) | (7,402 | ) | |||||
| Net proceeds from stock options exercised | 26,540 | 11,039 | 4,958 | ||||||||
| Net proceeds from issuance of common units | 332,137 | 531,379 | 137,749 | ||||||||
| Distributions to noncontrolling interest | (7,615 | ) | (4,841 | ) | (8,016 | ) | |||||
| Redemption of limited partners units and noncontrolling interests | (2,621 | ) | (802 | ) | (5,711 | ) | |||||
| Common units and preferred units and preferred interests distributions paid | (380,697 | ) | (278,149 | ) | (191,140 | ) | |||||
| Net cash provided by financing activities | 108,214 | 520,610 | 148,599 | ||||||||
| Cash acquired from the BRE merger | — | 140,353 | — | ||||||||
| Cash acquired from consolidation of co-investment | 4,005 | — | — | ||||||||
| Net increase (decrease) in cash and cash equivalents | 4,073 | 7,119 | (115 | ) | |||||||
| Cash and cash equivalents at beginning of year | 25,610 | 18,491 | 18,606 | ||||||||
| Cash and cash equivalents at end of year | $ | 29,683 | $ | 25,610 | $ | 18,491 | |||||
| Supplemental disclosure of cash flow information: | |||||||||||
| Cash paid for interest, net of capitalized interest | $ | 181,106 | $ | 130,691 | $ | 103,516 | |||||
| Interest capitalized | $ | 15,571 | $ | 22,510 | $ | 16,486 | |||||
| Supplemental disclosure of noncash investing and financing activities: | |||||||||||
| Issuance of Operating Partnership units for contributed properties | $ | — | $ | 1,419,816 | $ | — | |||||
| Retirement of Operating Partnership units | $ | — | $ | (1,419,816 | ) | $ | — | ||||
| Transfer from real estate under development to rental properties | $ | 308,704 | $ | 10,203 | $ | 68 | |||||
| Transfer from real estate under development to co-investments | $ | 6,234 | $ | 83,574 | $ | 27,906 | |||||
| Reclassification to redeemable noncontrolling interest from additional paid in capital and noncontrolling interest | $ | 22,387 | $ | 18,766 | $ | — | |||||
| Debt assumed in connection with acquisition of co-investment | $ | 114,435 | $ | — | $ | — | |||||
| Mortgage notes (excluding BRE merger) assumed in connection with purchases of real estate including the loan premiums recorded | $ | — | $ | 72,568 | $ | — | |||||
| Computer software and equipment | 3 - 5 years |
| Interior | 5 years |
| Furniture, fixtures and equipment | 5 years |
| Land improvements and certain exterior components of real property | 10 years |
| Real estate structures | 30 years |
| (1) | adjust the purchase price for any fair value adjustments resulting from such things as assumed debt or contingencies; |
| (2) | estimate the value of the real estate “as if vacant” as of the acquisition date; |
| (3) | allocate that value among land and |
| (4) | compute the value of the difference between the “as if vacant” value and the adjusted purchase price, which will represent the total intangible assets; |
| (5) | compute the value of the above and below market leases |
| (6) | compute the |
| December 31, 2015 | |||||||||||
Amortized Cost | Gross Unrealized Gain (Loss) | Carrying Value | |||||||||
| Available for sale: | |||||||||||
| Investment-grade unsecured bonds | $ | 11,618 | $ | 68 | $ | 11,686 | |||||
| Investment funds - US treasuries | 3,675 | (9 | ) | 3,666 | |||||||
| Common stock and stock funds | 34,655 | 7,091 | 41,746 | ||||||||
| Held to maturity: | |||||||||||
| Mortgage backed securities | 80,387 | — | 80,387 | ||||||||
| Total - Marketable securities and other investments | $ | 130,335 | $ | 7,150 | $ | 137,485 | |||||
| December 31, 2014 | |||||||||||
Amortized Cost | Gross Unrealized Gain | Carrying Value | |||||||||
| Available for sale: | |||||||||||
| Investment-grade unsecured bonds | $ | 9,435 | $ | 145 | $ | 9,580 | |||||
| Investment funds - US treasuries | 3,769 | 3 | 3,772 | ||||||||
| Common stock and stock funds | 25,755 | 5,137 | 30,892 | ||||||||
| Held to maturity: | |||||||||||
| Mortgage backed securities | 67,996 | — | 67,996 | ||||||||
| Total - Marketable securities | 106,955 | 5,285 | 112,240 | ||||||||
| Other investments | 5,000 | — | 5,000 | ||||||||
| Total - Marketable securities and other investments | $ | 111,955 | $ | 5,285 | $ | 117,240 | |||||
| 2015 | 2014 | 2013 | ||||||
| Common Stock | ||||||||
| Ordinary income | 99.28 | % | 70.03 | % | 77.34 | % | ||
| Capital gain | 0.72 | % | 21.95 | % | 17.64 | % | ||
| Unrecaptured section 1250 capital gain | — | % | 8.02 | % | 5.02 | % | ||
| 100.00 | % | 100.00 | % | 100.00 | % | |||
| 2015 | 2014 | 2013 | ||||||
| Series G and H Preferred stock | ||||||||
| Ordinary income | 99.28 | % | 70.03 | % | 77.34 | % | ||
| Capital gains | 0.72 | % | 21.95 | % | 17.64 | % | ||
| Unrecaptured section 1250 capital gain | — | % | 8.02 | % | 5.02 | % | ||
| 100.00 | % | 100.00 | % | 100.00 | % | |||
Change in fair value and amortization of swap settlements | Unrealized gains on available for sale securities | Total | |||||||||
| Balance at December 31, 2014 | $ | (56,003 | ) | $ | 4,551 | $ | (51,452 | ) | |||
| Other comprehensive income before reclassification | (393 | ) | 1,804 | 1,411 | |||||||
| Amounts reclassified from accumulated other comprehensive loss | 8,030 | — | 8,030 | ||||||||
| Other comprehensive income | 7,637 | 1,804 | 9,441 | ||||||||
| Balance at December 31, 2015 | $ | (48,366 | ) | $ | 6,355 | $ | (42,011 | ) | |||
Change in fair value and amortization of swap settlements | Unrealized gains on available for sale securities | Total | |||||||||
| Balance at December 31, 2014 | $ | (53,980 | ) | $ | 4,624 | $ | (49,356 | ) | |||
| Other comprehensive income before reclassification | (407 | ) | 1,865 | 1,458 | |||||||
| Amounts reclassified from accumulated other comprehensive loss | 8,300 | — | 8,300 | ||||||||
| Other comprehensive income | 7,893 | 1,865 | 9,758 | ||||||||
| Balance at December 31, 2015 | $ | (46,087 | ) | $ | 6,489 | $ | (39,598 | ) | |||
| Cash assumed | $ | 140 | |
| Rental properties and real estate under development | 5,605 | ||
| Real estate held for sale, net | 108 | ||
| Co-investments | 224 | ||
| Acquired in-place lease value | 77 | ||
| Other assets | 16 | ||
| Mortgage notes payable and unsecured debt | (1,747 | ) | |
| Other liabilities | (87 | ) | |
| Redeemable noncontrolling interest | (5 | ) | |
| $ | 4,331 | ||
| Cash consideration for BRE merger | $ | 556 | |
| Equity consideration for BRE merger | 3,775 | ||
| Total consideration for BRE merger | $ | 4,331 | |
| Property Name | Location | Apartment Homes | Essex Ownership Percentage | Quarter in 2015 | Purchase Price | ||||
| 8th & Hope | Los Angeles, CA | 290 | 100 | % | Q1 | $ | 200.0 | ||
The Huxley (1) | Los Angeles, CA | 187 | 100 | % | Q1 | 48.8 | |||
The Dylan (1) | Los Angeles, CA | 184 | 100 | % | Q1 | 51.3 | |||
Reveal (2) | Woodland Hills, CA | 438 | 99.75 | % | Q2 | 73.0 | |||
| Avant | Los Angeles, CA | 247 | 100 | % | Q2 | 99.0 | |||
| Avant II | Los Angeles, CA | 193 | 100 | % | Q4 | 73.0 | |||
| Enso | San Jose, CA | 183 | 100 | % | Q4 | 93.0 | |||
| Total 2015 | 1,722 | $ | 638.1 | ||||||
(1) | In March 2015, the Company purchased the joint venture partner's remaining membership interest in The Huxley and The Dylan co-investments for a purchase price of $100.1 million. The properties are now consolidated. |
(2) | In April 2015, the Company purchased the joint venture partner's 49.5% membership interest in the Reveal co-investment for a purchase price of $73.0 million. The property is now consolidated. |
| Property Name | Location | Apartment Homes | Essex Ownership Percentage | Ownership | Quarter in 2015 | Sales Price | Gains | ||||||
| Pinnacle South Mountain | Phoenix, AZ | 552 | 100 | % | EPLP | Q1 | $ | 63.8 | $ | 4.7 | |||
| Sharon Green | Menlo Park, CA | 296 | 100 | % | EPLP | Q4 | 245.0 | 40.2 | |||||
| Total 2015 | 848 | $ | 308.8 | $ | 44.9 | ||||||||
| Ownership | December 31, | ||||||||
| Percentage | 2015 | 2014 | |||||||
| Membership interest/Partnership interest in: | |||||||||
| CPPIB | 50%-55% | $ | 329,723 | $ | 336,977 | ||||
| Wesco I, III and IV | 50 | % | 218,902 | 256,790 | |||||
| BEXAEW | 50 | % | 88,850 | 97,686 | |||||
| Palm Valley | 50 | % | 68,525 | 70,186 | |||||
| Other | 28%-55% | 32,927 | 50,438 | ||||||
| Total operating co-investments | 738,927 | 812,077 | |||||||
| Total development co-investments | 50%-55% | 190,808 | 121,655 | ||||||
| Total preferred interest co-investments (includes related party investments of $35.8 million and $40.8 million as of December 31, 2015 and December 31, 2014, respectively) | 106,312 | 108,691 | |||||||
| Total co-investments | $ | 1,036,047 | $ | 1,042,423 | |||||
| 2007 | 2006 | |||
| Investments in joint ventures accounted for under the equity | ||||
| method of accounting: | ||||
| Limited partnership interest of 27.2% and general partner | ||||
| interest of 1% in Essex Apartment Value Fund II, L.P (Fund II) | $ | 58,419 | $ | 45,598 |
| Preferred limited partnership interest in Mountain Vista | ||||
| Apartments LLC (A) | 1,182 | 6,806 | ||
| Development joint venture | 4,090 | 3,414 | ||
| 63,691 | 55,818 | |||
| Investments accounted for under the cost method of accounting: | ||||
| Series A Preferred Stock interest in Multifamily Technology Solutions, Inc | 500 | 500 | ||
| Total investments | $ | 64,191 | $ | 56,318 |
| December 31, | ||||||||
| 2007 | 2006 | |||||||
| Balance sheets: | ||||||||
| Rental properties and real estate under development | $ | 614,266 | $ | 576,134 | ||||
| Other assets | 16,184 | 20,681 | ||||||
| Total assets | $ | 630,450 | $ | 596,815 | ||||
| Mortgage notes payable | $ | 322,615 | $ | 301,665 | ||||
| Other liabilities | 24,014 | 74,793 | ||||||
| Partners' capital | 283,821 | 220,357 | ||||||
| Total liabilities and partners' capital | $ | 630,450 | $ | 596,815 | ||||
| Operating Partnership's share of capital | $ | 63,691 | $ | 55,818 | ||||
| Years ended | ||||||||
| December 31, | ||||||||
| 2007 | 2006 | 2005 | ||||||
| Statements of operations: | ||||||||
| Property revenues | $ | 46,559 | $ | 43,031 | $ | 28,156 | ||
| Property operating expenses | (18,551) | (20,464) | (11,761) | |||||
| Net operating income | 28,008 | 22,567 | 16,395 | |||||
| Gain on the sale of real estate | - | - | 41,985 | |||||
| Interest expense | (13,888) | (17,000) | (11,042) | |||||
| Depreciation and amortization | (14,116) | (12,395) | (7,037) | |||||
| Net income (loss) | $ | 4 | $ | (6,828) | $ | 40,301 | ||
| Operating Partnership's share of co-investment net income (loss) | 1,074 | (1,503) | 18,553 | |||||
| Operating Partnership's gain on partial sale of its interest | 2,046 | - | - | |||||
| Income (loss) for co-investments | $ | 3,120 | $ | (1,503) | $ | 18,553 | ||
| December 31, | |||||||
| 2015 | 2014 | ||||||
Combined balance sheets: (1) | |||||||
| Rental properties and real estate under development | $ | 3,360,360 | $ | 3,426,574 | |||
| Other assets | 96,785 | 107,902 | |||||
| Total assets | $ | 3,457,145 | $ | 3,534,476 | |||
| Debt | $ | 1,499,601 | $ | 1,568,398 | |||
| Other liabilities | 92,241 | 91,579 | |||||
| Equity | 1,865,303 | 1,874,499 | |||||
| Total liabilities and equity | $ | 3,457,145 | $ | 3,534,476 | |||
| Company's share of equity | $ | 1,036,047 | $ | 1,042,423 | |||
Years ended December 31, | |||||||||||
| 2015 | 2014 | 2013 | |||||||||
Combined statements of income: (1) | |||||||||||
| Property revenues | $ | 260,175 | $ | 188,548 | $ | 100,402 | |||||
| Property operating expenses | (93,067 | ) | (71,419 | ) | (37,518 | ) | |||||
| Net operating income | 167,108 | 117,129 | 62,884 | ||||||||
| Gain on sale of real estate | 14 | 23,333 | 146,758 | ||||||||
| Interest expense | (44,834 | ) | (39,990 | ) | (24,155 | ) | |||||
| General and administrative | (5,879 | ) | (6,321 | ) | (5,344 | ) | |||||
Equity income from co-investments (2) | — | 26,798 | 18,703 | ||||||||
| Depreciation and amortization | (103,613 | ) | (74,657 | ) | (36,831 | ) | |||||
| Net income | $ | 12,796 | $ | 46,292 | $ | 162,015 | |||||
Company's share of net income (3) | $ | 21,861 | $ | 39,893 | $ | 55,865 | |||||
(1) | Includes preferred equity investments held by the Company. |
(2) | Represents income from Wesco II's preferred equity investment in Park Merced. |
(3) | Includes the Company's share of equity income from co-investments, income from preferred equity investments, gain on sale of co-investments, co-investment promote income, and income from early redemption of preferred equity investments. Includes income earned from investments with a related party of $3.7 million and $3.8 million for the years ended December 31, 2015 and 2014, respectively. |
| 2007 | 2006 | ||||
| Related party receivables, unsecured: | |||||
| Loans to officers made prior to July 31, 2002, secured, | |||||
| bearing interest of 8%, due beginning April 2007 | $ | - | $ | 375 | |
| Other related party receivables, substantially due on demand | 904 | 834 | |||
| Total notes and other receivable from related parties | $ | 904 | $ | 1,209 | |
| 2007 | 2006 | ||||
| Note receivable, secured, bearing interest at 12%, due June 2008 | $ | 2,193 | $ | 2,193 | |
| Note receivable, secured, bearing interest at LIBOR + 3.69%, due June 2009 | 7,346 | 7,309 | |||
| Note receivable, secured, bearing interest at LIBOR + 4.65%, due January 2008 | 5,448 | 7,807 | |||
| Note receivable, secured, bearing interest at LIBOR + 3.38%, due February 2009 | 7,128 | - | |||
| Note receivable, secured, bearing interest at LIBOR + 4.75%, due March 2011 | 10,999 | - | |||
| Note receivable, secured, bearing interest at LIBOR + 2.95%, due April 2009 | 14,010 | - | |||
| Other receivables | 2,508 | 886 | |||
| $ | 49,632 | $ | 18,195 |
| 2015 | 2014 | ||||||
| Note receivable, secured, bearing interest at 6.0%, due December 2016 | $ | 3,219 | $ | 3,212 | |||
Notes and other receivables from affiliates (1) | 3,092 | 8,105 | |||||
| Other receivables | 12,974 | 13,606 | |||||
| $ | 19,285 | $ | 24,923 | ||||
(1) | The Company had $3.1 million and $8.1 million of short-term loans outstanding and due from various joint ventures for the years ended December 31, 2015 and 2014, respectively. See Note 5, Related Party Transactions, for additional details. |
| 2013 | |||||
| Revenues | $ | 4,454 | |||
| Property operating expenses | (1,406 | ) | |||
| Depreciation and amortization | (1,098 | ) | |||
| Expenses | (2,504 | ) | |||
| Operating income from real estate sold | 1,950 | ||||
| Gain on sale of real estate | 29,223 | ||||
| Income from discontinued operations | $ | 31,173 | |||
| 2007 | 2006 | 2005 | |||||||
| Rental revenues | $ | 9,466 | $ | 19,537 | $ | 21,267 | |||
| Interest and other income | 290 | 41 | 1,231 | ||||||
| Equity income co-investments | - | 238 | 477 | ||||||
| Revenues | 9,756 | 19,816 | 22,975 | ||||||
| Property operating expenses | (3,779) | (7,611) | (8,159) | ||||||
| Interest expense | (416) | (2,314) | (2,830) | ||||||
| Depreciation and amortization | (1,861) | (4,940) | (5,300) | ||||||
| Minority interests | - | (660) | (347) | ||||||
| Expenses | (6,056) | (15,525) | (16,636) | ||||||
| Income from real estate sold | 3,700 | 4,291 | 6,339 | ||||||
| Gain on sale of real estate | 52,874 | 20,503 | 29,219 | ||||||
| Gain on sale of real estate - City Heights | 78,306 | - | - | ||||||
| Promote interest and fees | 10,290 | 8,221 | - | ||||||
| Minority interests - City Heights | (64,624) | - | - | ||||||
| 76,846 | 28,724 | 29,219 | |||||||
| Income from discontinued operations | $ | 80,546 | $ | 33,015 | $ | 35,558 |
| 2015 | 2014 | Weighted Average Maturity In Years | |||||||
| Unsecured bonds private placement - fixed rate | $ | 463,891 | $ | 463,443 | 3.2 | ||||
| Term loan - variable rate | 224,467 | 224,130 | 0.9 | ||||||
| Bonds public offering - fixed rate | 2,400,322 | 1,915,975 | 6.7 | ||||||
Unsecured debt, net (1) | 3,088,680 | 2,603,548 | |||||||
Lines of credit, net (2) | 11,707 | 242,824 | |||||||
| Total unsecured debt | $ | 3,100,387 | $ | 2,846,372 | |||||
| Weighted average interest rate on fixed rate unsecured and unsecured private placement bonds | 3.6 | % | 3.6 | % | |||||
| Weighted average interest rate on variable rate term loan | 2.4 | % | 2.4 | % | |||||
| Weighted average interest rate on lines of credit | 1.9 | % | 1.8 | % | |||||
(1) | Includes unamortized premium and discounts of $14.3 million and $27.5 million and reduced by unamortized debt issuance costs of $15.6 million and $13.9 million as of December 31, 2015 and 2014, respectively. |
(2) | Includes unamortized debt issuance costs of $3.3 million and $3.6 million as of December 31, 2015 and 2014, respectively. |
| Maturity | 2015 | 2014 | Coupon Rate | |||||||||
| Senior unsecured private placement notes | March 2016 | $ | 150,000 | $ | 150,000 | 4.36 | % | |||||
| Senior unsecured private placement notes | September 2017 | 40,000 | 40,000 | 4.50 | % | |||||||
| Senior unsecured private placement notes | December 2019 | 75,000 | 75,000 | 4.92 | % | |||||||
| Senior unsecured private placement notes | April 2021 | 100,000 | 100,000 | 4.27 | % | |||||||
| Senior unsecured private placement notes | June 2021 | 50,000 | 50,000 | 4.30 | % | |||||||
| Senior unsecured private placement notes | August 2021 | 50,000 | 50,000 | 4.37 | % | |||||||
| $ | 465,000 | $ | 465,000 | |||||||||
| Maturity | 2015 | 2014 | Coupon Rate | |||||||
| Senior notes | March 2017 | 300,000 | 300,000 | 5.500 | % | |||||
| Senior notes | March 2021 | 300,000 | 300,000 | 5.200 | % | |||||
| Senior notes | August 2022 | 300,000 | 300,000 | 3.625 | % | |||||
| Senior notes | January 2023 | 300,000 | 300,000 | 3.375 | % | |||||
| Senior notes | May 2023 | 300,000 | 300,000 | 3.250 | % | |||||
| Senior notes | May 2024 | 400,000 | 400,000 | 3.875 | % | |||||
| Senior notes | April 2025 | 500,000 | — | 3.500 | % | |||||
| 2,400,000 | 1,900,000 | |||||||||
| 2016 | $ | 350,000 | |
| 2017 | 365,000 | ||
| 2018 | — | ||
2019(1) | 75,000 | ||
| 2020 | — | ||
| Thereafter | 2,300,000 | ||
| $ | 3,090,000 | ||
(1) | Amount does not include $15.0 million outstanding on the Company's lines of credit as of December 31, 2015, that becomes due in December 2019 in accordance with the January 2016 amendment. |
| 2007 | 2006 | |||||
| Mortgage notes payable to a pension fund, secured by deeds of trust, bearing interest | ||||||
| at rates ranging from 6.62% to 8.18%, principal and interest payments due monthly, | ||||||
| and maturity dates ranging from October 2008 through October 2010. Under certain | ||||||
| conditions a portion of these loans can be converted to an unsecured note payable. | ||||||
| Three loans are cross-collateralized by a total of 13 properties | $ | 224,876 | $ | 228,663 | ||
| Mortgage notes payable, secured by deeds of trust, bearing interest at ranges | ||||||
| ranging from 4.86% to 7.90%, principal and interest payments due monthly, | ||||||
| and maturity dates ranging from March 2008 through June 2018 | 804,859 | 645,702 | ||||
| Mortgage notes payable - held for sale, secured by deed of trust, bearing interest | ||||||
| at 6.90%, principal and interest payments due monthly, and maturity date of | ||||||
| January 2008. Repaid in February 2007 | - | 32,850 | ||||
| Multifamily housing mortgage revenue bonds secured by deeds of trust on | ||||||
| rental properties and guaranteed by collateral pledge agreements, payable | ||||||
| monthly at a variable rate as defined in the Loan Agreement | ||||||
| (approximately 4.50% at December 2007 and 4.60% at December 2006), | ||||||
| plus credit enhancement and underwriting fees ranging from approximately | ||||||
| 1.2% to 1.9%. The bonds are primarily convertible to a fixed rate at the Operating | ||||||
| Partnership's option. Among the terms imposed on the properties, which are security for | ||||||
| the bonds, is a requirement that 20% of the units are subject to tenant income | ||||||
| criteria. Principal balances are due in full at various maturity dates from December | ||||||
| 2009 through December 2039. $152.7 million of these bonds are subject to various | ||||||
| interest rate cap agreements which limit the maximum interest rate to such bonds | 233,138 | 186,339 | ||||
| Exchangeable bonds, unsecured obligations of the Operating Partnership and guaranteed | ||||||
| by the Company, bearing interest at 3.625% per year, payable November 1 and May 1 | ||||||
| of each year, which mature on November 1, 2025. The bonds are exchangeable at the | ||||||
| option of the holder into cash and, in certain circumstances at the Operating Partnership's | ||||||
| option, shares of the Company's common stock at an initial exchange price of | ||||||
| $103.25 per share subject to certain adjustments. These bonds will also be exchangeable | ||||||
| prior to November 1, 2020 under certain circumstances. The bonds are redeemable at | ||||||
| the Operating Partnership's option for cash at any time on or after November 4, | ||||||
| 2010 and are subject to repurchase for cash at the option of the holder on November 1st | ||||||
| in years 2010, 2015, and 2020 or upon the occurrence of certain events | 225,000 | 225,000 | ||||
| $ | 1,487,873 | $ | 1,318,554 | |||
| 2015 | 2014 | ||||||
| Fixed rate mortgage notes payable | $ | 1,925,985 | $ | 2,049,577 | |||
Variable rate mortgage notes payable (1) | 289,092 | 184,740 | |||||
Total mortgage notes payable (2) | $ | 2,215,077 | $ | 2,234,317 | |||
| Number of properties securing mortgage notes | 64 | 67 | |||||
| Remaining terms | 1-31 years | 1-26 years | |||||
| Weighted average interest rate | 4.4 | % | 4.6 | % | |||
| 2008 | $ | 116,357 |
| 2009 | 24,689 | |
| 2010 | 154,813 | |
| 2011 | 166,545 | |
| 2012 | 32,183 | |
| Thereafter | 993,286 | |
| $ | 1,487,873 |
| 2016 | $ | 29,714 | |
| 2017 | 199,180 | ||
| 2018 | 320,622 | ||
| 2019 | 586,212 | ||
| 2020 | 693,088 | ||
| Thereafter | 329,451 | ||
| $ | 2,158,267 | ||
(1) | Variable rate mortgage notes payable, including $257.3 million in bonds that have been converted to variable rate through total return swap contracts, consists of multi-family housing mortgage revenue bonds secured by deeds of trust on rental properties and guaranteed by collateral pledge agreements, payable monthly at a variable rate as defined in the Loan Agreement (approximately 1.2% at December 2015 and 1.8% at December 2014) plus credit enhancement and underwriting fees ranging from approximately 1.2% to 1.9%. Among the terms imposed on the properties, which are security for the bonds, is a requirement that 20% of the apartment homes are subject to tenant income criteria. Principal balances are due in full at various maturity dates from March 2019 through December 2046. Of these bonds $20.7 million are subject to various interest rate cap agreements which limit the maximum interest rate to such bonds. |
(2) | Includes total unamortized premium of $64.8 million and $83.8 million and reduced by unamortized debt issuance costs of $8.0 million and $11.9 million as of December 31, 2015 and 2014, respectively. |
| Future | ||
| Minimum | ||
| Rent | ||
| 2008 | $ | 6,184 |
| 2009 | 4,149 | |
| 2010 | 1,439 | |
| 2011 | 695 | |
| 2012 | 183 | |
| 2013 and thereafter | 474 | |
| $ | 13,124 |
| Future | |||
| Minimum | |||
| Rent | |||
| 2016 | $ | 11,067 | |
| 2017 | 10,078 | ||
| 2018 | 9,211 | ||
| 2019 | 8,467 | ||
| 2020 | 7,690 | ||
| Thereafter | 24,955 | ||
| $ | 71,468 | ||
| 2007 | 2006 | 2005 | |||||||||||||||||||
| Weighted- | Per | Weighted- | Per | Weighted- | Per | ||||||||||||||||
| average | Common | average | Common | average | Common | ||||||||||||||||
| Common | Unit | Common | Unit | Common | Unit | ||||||||||||||||
| Income | Units | Amount | Income | Units | Amount | Income | Units | Amount | |||||||||||||
| Basic: | |||||||||||||||||||||
| Income from continuing operations | |||||||||||||||||||||
| available to common units | $ | 37,342 | 27,043,697 | $ | 1.38 | $ | 31,449 | 25,560,415 | $ | 1.23 | $ | 50,551 | 25,343,695 | $ | 2.00 | ||||||
| Income from discontinued operations | 80,546 | 27,043,697 | 2.98 | 33,015 | 25,560,415 | 1.29 | 35,558 | 25,343,695 | 1.40 | ||||||||||||
| 117,888 | 4.36 | 64,464 | 2.52 | 86,109 | 3.40 | ||||||||||||||||
| Effect of Dilutive Securities (1) | - | 552,971 | - | 469,360 | - | 349,942 | |||||||||||||||
| Diluted: | |||||||||||||||||||||
| Income from continuing operations | |||||||||||||||||||||
| available to common units | 37,342 | 27,596,668 | 1.35 | 31,449 | 26,029,775 | 1.21 | 50,551 | 25,693,637 | 1.97 | ||||||||||||
| Income from discontinued operations | 80,546 | 27,596,668 | 2.92 | 33,015 | 26,029,775 | 1.27 | 35,558 | 25,693,637 | 1.38 | ||||||||||||
| $ | 117,888 | $ | 4.27 | $ | 64,464 | $ | 2.48 | $ | 86,109 | $ | 3.35 | ||||||||||
| 2015 | 2014 | 2013 | ||||||||||||||||||||||||||||||
| Income | Weighted- average Common Shares | Per Common Share Amount | Income | Weighted- average Common Shares | Per Common Share Amount | Income | Weighted- average Common Shares | Per Common Share Amount | ||||||||||||||||||||||||
| Basic: | ||||||||||||||||||||||||||||||||
| Income from continuing operations available to common stockholders | $ | 226,865 | 64,871,717 | $ | 3.50 | $ | 116,859 | 56,546,959 | $ | 2.07 | $ | 121,324 | 37,248,960 | $ | 3.26 | |||||||||||||||||
| Income from discontinued operations available to common stockholders | — | 64,871,717 | — | — | 56,546,959 | — | 29,487 | 37,248,960 | 0.79 | |||||||||||||||||||||||
| $ | 226,865 | $ | 3.50 | $ | 116,859 | $ | 2.07 | $ | 150,811 | $ | 4.05 | |||||||||||||||||||||
Effect of Dilutive Securities (1) | — | 189,968 | — | 149,566 | — | 86,335 | ||||||||||||||||||||||||||
| Diluted: | ||||||||||||||||||||||||||||||||
Income from continuing operations available to common stockholders (1) | $ | 226,865 | 65,061,685 | $ | 3.49 | $ | 116,859 | 56,696,525 | $ | 2.06 | $ | 121,324 | 37,335,295 | $ | 3.25 | |||||||||||||||||
| Income from discontinued operations available to common stockholders | — | 65,061,685 | — | — | 56,696,525 | — | 29,487 | 37,335,295 | 0.79 | |||||||||||||||||||||||
| $ | 226,865 | $ | 3.49 | $ | 116,859 | $ | 2.06 | $ | 150,811 | $ | 4.04 | |||||||||||||||||||||
(1) | Weighted average convertible limited partnership units of 2,182,467, 2,224,707, and 2,131,425, which include vested Series Z Incentive Units, Series Z-1 Incentive Units, 2014 Long-Term Incentive Plan Units, and 2015 Long-Term Incentive Plan Units, for the |
| 2015 | 2014 | 2013 | ||||||||||||||||||||||||||||||
| Income | Weighted- average Common Units | Per Common Unit Amount | Income | Weighted- average Common Units | Per Common Unit Amount | Income | Weighted- average Common Units | Per Common Unit Amount | ||||||||||||||||||||||||
| Basic: | ||||||||||||||||||||||||||||||||
| Income from continuing operations available to common unitholders | $ | 234,689 | 67,054,184 | $ | 3.50 | $ | 121,726 | 58,771,666 | $ | 2.07 | $ | 128,576 | 39,380,385 | $ | 3.27 | |||||||||||||||||
| Income from discontinued operations | — | 67,054,184 | — | — | 58,771,666 | — | 31,173 | 39,380,385 | 0.79 | |||||||||||||||||||||||
| Income available to common unitholders | $ | 234,689 | $ | 3.50 | $ | 121,726 | $ | 2.07 | $ | 159,749 | $ | 4.06 | ||||||||||||||||||||
Effect of Dilutive Securities (1) | — | 189,968 | — | 149,566 | — | 86,335 | ||||||||||||||||||||||||||
| Diluted: | ||||||||||||||||||||||||||||||||
Income from continuing operations available to common unitholders (1) | $ | 234,689 | 67,244,152 | $ | 3.49 | $ | 121,726 | 58,921,232 | $ | 2.07 | $ | 128,576 | 39,466,720 | $ | 3.26 | |||||||||||||||||
| Income from discontinued operations | — | 67,244,152 | — | — | 58,921,232 | — | 31,173 | 39,466,720 | 0.79 | |||||||||||||||||||||||
| Income available to common unitholders | $ | 234,689 | $ | 3.49 | $ | 121,726 | $ | 2.07 | $ | 159,749 | $ | 4.05 | ||||||||||||||||||||
(1) | Stock options of 54,100, 10,843, and 168,325, for the years ended December 31, 2015, 2014, and 2013, respectively, were not included in the diluted earnings per unit calculation because the assumed proceeds per share of these options plus the average unearned compensation were greater than the average market price of the common shares for the years ended and, therefore, were anti-dilutive. Additionally, excludes 963,172 DownREIT units as they are anti-dilutive. |
| | 2007 | 2006 | 2005 | 2015 | 2014 | 2013 | |||||||||||
| Stock price | $95.34-$126.73 | $101.01-$132.62 | $69.11-$91.88 | $ | 227.75 | $ | 176.65 | $ | 153.54 | ||||||||
| Risk-free interest rates | 3.52%-4.58% | 4.45%-5.15% | 3.64%-4.50% | 1.83 | % | 2.37 | % | 2.68 | % | ||||||||
| Expected lives | 7-9 years | 4-7 years | 5-6 years | 6 years | 8 years | 8 years | |||||||||||
| Volatility | 18.52%-20.31% | 18.44%-18.54% | 18.09%-18.54% | 20.06 | % | 18.00 | % | 18.03 | % | ||||||||
| Dividend yield | 3.99%-5.26% | 3.12%-4.29% | 4.22%-5.13% | 2.73 | % | 2.90 | % | 3.15 | % | ||||||||
| 2007 | 2006 | 2005 | ||||||||||||||
Weighted- | Weighted- | Weighted- | ||||||||||||||
| average | average | average | ||||||||||||||
| exercise | exercise | exercise | ||||||||||||||
| Shares | price | Shares | price | Shares | price | |||||||||||
| Outstanding at beginning of year | 570,542 | $ | 72.60 | 530,375 | $ | 57.73 | 463,376 | $ | 47.07 | |||||||
| Granted | 29,250 | 119.98 | 170,350 | 106.63 | 188,800 | 78.01 | ||||||||||
| Exercised | (86,056) | 50.23 | (90,633) | 47.57 | (103,201) | 43.47 | ||||||||||
| Forfeited and canceled | (20,033) | 94.29 | (39,550) | 80.85 | (18,600) | 76.70 | ||||||||||
| Outstanding at end of year | 493,703 | 79.83 | 570,542 | 72.60 | 530,375 | 57.73 | ||||||||||
| Options exercisable at year end | 288,889 | 64.69 | 272,074 | 52.42 | 248,015 | 43.77 | ||||||||||
| 2015 | 2014 | 2013 | ||||||||||||||||||
| Shares | Weighted- average exercise price | Shares | Weighted- average exercise price | Shares | Weighted- average exercise price | |||||||||||||||
| Outstanding at beginning of year | 664,785 | $ | 138.78 | 695,488 | $ | 133.37 | 623,434 | $ | 125.96 | |||||||||||
| Granted | 78,600 | 227.75 | 42,518 | 176.65 | 150,325 | 153.54 | ||||||||||||||
| Granted - BRE options converted | — | — | 133,766 | 121.03 | — | — | ||||||||||||||
| Exercised | (203,556 | ) | 131.53 | (185,387 | ) | 113.72 | (52,970 | ) | 102.43 | |||||||||||
| Forfeited and canceled | (14,735 | ) | 136.11 | (21,600 | ) | 144.29 | (25,301 | ) | 135.25 | |||||||||||
| Outstanding at end of year | 525,094 | 154.98 | 664,785 | 138.78 | 695,488 | 133.37 | ||||||||||||||
| Options exercisable at year end | 342,048 | 152.42 | 395,986 | 133.99 | 300,632 | 119.09 | ||||||||||||||
| Options outstanding | Options exercisable | |||||||||||||||
Number outstanding as of | Weighted- average remaining | Weighted- average | Number exercisable as of | Weighted- average | ||||||||||||
| Range of | December 31, | contractual | exercise | December 31, | exercise | |||||||||||
| exercise prices | 2015 | life (years) | price | 2015 | price | |||||||||||
| $66.05 - $101.01 | 15,901 | 3.2 | $ | 74.47 | 15,901 | $ | 74.47 | |||||||||
| $105.64 - $161.98 | 367,024 | 5.3 | 139.73 | 218,041 | 135.00 | |||||||||||
| $164.76 - $229.43 | 142,169 | 7.5 | 203.37 | 108,106 | 199.02 | |||||||||||
| 525,094 | 5.8 | 154.98 | 342,048 | 152.42 | ||||||||||||
| 2015 | 2014 | 2013 | ||||||||||||||||||
| Shares | Weighted- average grant price | Shares | Weighted- average grant price | Shares | Weighted- average grant price | |||||||||||||||
| Unvested at beginning of year | 25,820 | $ | 168.22 | 16,176 | $ | 108.06 | 24,922 | $ | 104.52 | |||||||||||
| Granted | 56,177 | 155.21 | 22,014 | 194.03 | 1,556 | 158.75 | ||||||||||||||
| Granted - BRE restricted stock converted | — | — | 119,411 | 173.82 | — | — | ||||||||||||||
| Vested | (22,939 | ) | 148.20 | (126,931 | ) | 171.56 | (7,211 | ) | 109.86 | |||||||||||
| Forfeited and canceled | (4,382 | ) | 122.06 | (4,850 | ) | 135.10 | (3,091 | ) | 100.84 | |||||||||||
| Unvested at end of year | 54,676 | 147.10 | 25,820 | 168.22 | 16,176 | 108.06 | ||||||||||||||
| Options outstanding | Options exercisable | ||||||||||||
| Number | Weighted- | Number | |||||||||||
| outstanding | average | Weighted- | exercisable | Weighted- | |||||||||
| as of | remaining | average | as of | average | |||||||||
| Range of | December 31, | contractual | exercise | December 31, | exercise | ||||||||
| exercise prices | 2007 | | life | price | 2007 | price | |||||||
| $13.26-26.52 | 600 | 0.1 years | $ | 19.08 | 600 | $ | 19.08 | ||||||
| 26.52-39.79 | 41,547 | 1.4 years | 32.64 | 41,547 | 32.64 | ||||||||
| 39.78-53.05 | 90,027 | 3.8 years | 49.33 | 87,427 | 49.28 | ||||||||
| 53.05-66.31 | 40,680 | 5.7 years | 59.10 | 38,230 | 59.37 | ||||||||
| 66.31-79.57 | 90,775 | 7.2 years | 75.69 | 52,795 | 76.37 | ||||||||
| 79.57-92.83 | 58,704 | 7.5 years | 83.18 | 25,170 | 82.95 | ||||||||
| 92.83-106.10 | 39,620 | 8.3 years | 101.51 | 7,720 | 102.63 | ||||||||
| 106.10-119.36 | 103,500 | 8.4 years | 107.36 | 34,100 | 107.42 | ||||||||
| 119.36-132.62 | 28,250 | 9.3 years | 125.27 | 1,300 | 128.02 | ||||||||
| 493,703 | 6.6 years | 79.83 | 288,889 | 64.69 | |||||||||
| Long Term Incentive Plan - LTIP Units | ||||||||||||||
Total Vested Units | Total Unvested Units | Total Outstanding Units | Weighted- average Grant-date Fair Value | Weighted- average Remaining Contractual Life (years) | ||||||||||
| Balance, December 31, 2012 | 190,704 | 140,043 | 330,747 | $ | 58.44 | 11.3 | ||||||||
| Granted | — | 50,500 | 50,500 | |||||||||||
| Vested | 35,919 | (35,919 | ) | — | ||||||||||
| Converted | (108,433 | ) | — | (108,433 | ) | |||||||||
| Cancelled | — | (5,243 | ) | (5,243 | ) | |||||||||
| Balance, December 31, 2013 | 118,190 | 149,381 | 267,571 | 63.53 | 9.3 | |||||||||
| Granted | 24,000 | 44,750 | 68,750 | |||||||||||
| Vested | 41,729 | (41,729 | ) | — | ||||||||||
| Converted | (2,000 | ) | — | (2,000 | ) | |||||||||
| Cancelled | — | (1,335 | ) | (1,335 | ) | |||||||||
| Balance, December 31, 2014 | 181,919 | 151,067 | 332,986 | 71.14 | 10.5 | |||||||||
| Granted | — | — | — | |||||||||||
| Vested | 36,650 | (36,650 | ) | — | ||||||||||
| Converted | (74,384 | ) | — | (74,384 | ) | |||||||||
| Cancelled | — | (8,260 | ) | (8,260 | ) | |||||||||
| Balance, December 31, 2015 | 144,185 | 106,157 | 250,342 | $ | 75.41 | 9.5 | ||||||||
| Years Ended December 31, | |||||||||||
| 2015 | 2014 | 2013 | |||||||||
| Revenues: | |||||||||||
| Southern California | $ | 529,440 | $ | 423,570 | $ | 263,582 | |||||
| Northern California | 416,347 | 326,996 | 210,831 | ||||||||
| Seattle Metro | 201,418 | 168,337 | 107,796 | ||||||||
| Other real estate assets | 38,293 | 42,688 | 21,118 | ||||||||
| Total property revenues | $ | 1,185,498 | $ | 961,591 | $ | 603,327 | |||||
| Net operating income: | |||||||||||
| Southern California | $ | 355,007 | $ | 279,434 | $ | 176,075 | |||||
| Northern California | 297,472 | 228,971 | 146,053 | ||||||||
| Seattle Metro | 136,580 | 112,494 | 71,650 | ||||||||
| Other real estate assets | 32,931 | 28,146 | 12,213 | ||||||||
| Total net operating income | 821,990 | 649,045 | 405,991 | ||||||||
| Depreciation and amortization | (453,423 | ) | (360,592 | ) | (192,420 | ) | |||||
| Interest expense | (204,827 | ) | (164,551 | ) | (116,524 | ) | |||||
| Total return swap income | 5,655 | — | — | ||||||||
| Management and other fees from affiliates | 8,909 | 9,347 | 7,263 | ||||||||
| General and administrative | (40,090 | ) | (40,878 | ) | (26,684 | ) | |||||
| Merger and integration expenses | (3,798 | ) | (53,530 | ) | (4,284 | ) | |||||
| Acquisition and investment related costs | (2,414 | ) | (1,878 | ) | (1,161 | ) | |||||
| Interest and other income | 19,143 | 11,811 | 11,633 | ||||||||
| Loss on early retirement of debt, net | (6,114 | ) | (268 | ) | (300 | ) | |||||
| Gain on sale of real estate and land | 47,333 | 46,039 | 1,503 | ||||||||
| Equity income from co-investments | 21,861 | 39,893 | 55,865 | ||||||||
| Gain on remeasurement of co-investment | 34,014 | — | — | ||||||||
| Income before discontinued operations | $ | 248,239 | $ | 134,438 | $ | 140,882 | |||||
| Years Ended December 31, | |||||||||
| 2007 | 2006 | 2005 | |||||||
| Revenues: | |||||||||
| Southern California | $ | 215,090 | $ | 198,929 | $ | 181,048 | |||
| Northern California | 99,734 | 75,624 | 67,099 | ||||||
| Seattle Metro | 64,079 | 55,721 | 50,936 | ||||||
| Other Regions | 4,530 | 4,496 | 4,152 | ||||||
| Total property revenues | $ | 383,433 | $ | 334,770 | $ | 303,235 | |||
| Net operating income: | |||||||||
| Southern California | $ | 147,340 | $ | 135,969 | $ | 122,551 | |||
| Northern California | 65,143 | 49,907 | 44,528 | ||||||
| Seattle Metro | 42,137 | 35,138 | 31,792 | ||||||
| Other Regions | 389 | (642) | (115) | ||||||
| Total net operating income | 255,009 | 220,372 | 198,756 | ||||||
| Depreciation and amortization: | |||||||||
| Southern California | (49,551) | (43,017) | (39,219) | ||||||
| Northern California | (27,892) | (17,568) | (15,984) | ||||||
| Seattle Metro | (15,491) | (13,170) | (12,343) | ||||||
| Other Regions | (7,455) | (4,339) | (7,303) | ||||||
| (100,389) | (78,094) | (74,849) | |||||||
| Interest: | |||||||||
| Southern California | (31,626) | (26,432) | (27,690) | ||||||
| Northern California | (18,741) | (18,295) | (17,201) | ||||||
| Seattle Metro | (6,892) | (6,904) | (6,508) | ||||||
| Other Regions | (23,736) | (21,267) | (19,385) | ||||||
| (80,995) | (72,898) | (70,784) | |||||||
| Amortization of deferred financing costs | (3,071) | (2,745) | (1,947) | ||||||
| General and administrative | (26,273) | (22,234) | (19,148) | ||||||
| Other expenses | (800) | (1,770) | (5,827) | ||||||
| Management and other fees from affiliates | 5,090 | 5,030 | 10,951 | ||||||
| Gain on sale or real estate | - | - | 6,391 | ||||||
| Interest and other income | 10,310 | 6,176 | 8,524 | ||||||
| Equity income in co-investments | 3,120 | (1,503) | 18,553 | ||||||
| Minority interests | (4,847) | (4,977) | (5,340) | ||||||
| Income tax provision | (400) | (525) | (2,538) | ||||||
| Income from continuing operations | $ | 56,754 | $ | 46,832 | $ | 62,742 | |||
| Assets: | |||||||||
| Southern California | $ | 1,354,818 | $ | 1,244,037 | |||||
| Northern California | 829,879 | 565,405 | |||||||
| Pacific Northwest | 353,737 | 317,848 | |||||||
| Other Regions | 37,338 | 76,882 | |||||||
| Net reportable operating segments - real estate assets | 2,575,772 | 2,204,172 | |||||||
| Real estate - held for sale, net | - | 41,221 | |||||||
| Real estate under development | 233,445 | 107,620 | |||||||
| Co-investments | 64,191 | 56,318 | |||||||
| Notes and other receivables | 50,536 | 19,404 | |||||||
| Other non-segment assets | 56,379 | 57,105 | |||||||
| Total assets | $ | 2,980,323 | $ | 2,485,840 | |||||
| As of December 31, | |||||||
| Assets: | 2015 | 2014 | |||||
| Southern California | $ | 4,912,264 | $ | 4,277,754 | |||
| Northern California | 3,749,072 | 3,418,571 | |||||
| Seattle Metro | 1,613,175 | 1,647,058 | |||||
| Other real estate assets | 107,066 | 336,492 | |||||
| Net reportable operating segments - real estate assets | 10,381,577 | 9,679,875 | |||||
| Real estate under development | 242,326 | 429,096 | |||||
| Co-investments | 1,036,047 | 1,042,423 | |||||
| Real estate held for sale, net | 26,879 | 56,300 | |||||
| Cash and cash equivalents, including restricted cash | 123,055 | 95,749 | |||||
| Marketable securities and other investments | 137,485 | 117,240 | |||||
| Notes and other receivables | 19,285 | 24,923 | |||||
| Other non-segment assets | 38,437 | 81,126 | |||||
| Total assets | $ | 12,005,091 | $ | 11,526,732 | |||
| Quarter ended | Quarter ended | Quarter ended | Quarter ended | |||||||||
| December 31(1) | September 30(1) | June 30(1) | March 31(1) | |||||||||
| 2007: | ||||||||||||
| Total property revenues | $ | 101,138 | $ | 97,780 | $ | 94,508 | $ | 90,007 | ||||
| Income before discontinued operations | $ | 8,384 | $ | 15,454 | $ | 15,010 | $ | 17,906 | ||||
| Net income | $ | 61,175 | $ | 16,164 | $ | 16,085 | $ | 43,876 | ||||
| Net income available to common | ||||||||||||
| units | $ | 56,304 | $ | 11,294 | $ | 11,216 | $ | 39,074 | ||||
| Per unit data: | ||||||||||||
| Net income: | ||||||||||||
| Basic | $ | 2.04 | $ | 0.41 | $ | 0.42 | $ | 1.51 | ||||
| Diluted | $ | 2.02 | $ | 0.40 | $ | 0.41 | $ | 1.46 | ||||
| Distributions per common unit | $ | 0.93 | $ | 0.93 | $ | 0.93 | $ | 0.93 | ||||
| 2006: | ||||||||||||
| Total property revenues | $ | 88,118 | $ | 84,740 | $ | 81,665 | $ | 80,247 | ||||
| Income before discontinued operations | $ | 13,440 | $ | 14,281 | $ | 9,215 | $ | 9,896 | ||||
| Net income | $ | 21,926 | $ | 16,412 | $ | 27,450 | $ | 14,059 | ||||
| Net income available to common | ||||||||||||
| units | $ | 16,988 | $ | 12,062 | $ | 24,402 | $ | 11,012 | ||||
| Per unit data: | ||||||||||||
| Net income: | ||||||||||||
| Basic | $ | 0.65 | $ | 0.47 | $ | 0.97 | $ | 0.44 | ||||
| Diluted | $ | 0.64 | $ | 0.46 | $ | 0.95 | $ | 0.43 | ||||
| Distributions per common unit | $ | 0.84 | $ | 0.84 | $ | 0.84 | $ | 0.84 | ||||
Quarter ended December 31 | Quarter ended September 30 | Quarter ended June 30 | Quarter ended March 31 | ||||||||||||
| 2015: | |||||||||||||||
| Total property revenues | $ | 308,646 | $ | 302,522 | $ | 294,101 | $ | 280,229 | |||||||
| Net income | $ | 85,762 | $ | 47,182 | $ | 50,542 | $ | 64,753 | |||||||
| Net income available to common stockholders | $ | 79,624 | $ | 42,323 | $ | 45,555 | $ | 59,363 | |||||||
| Per share data: | |||||||||||||||
| Net income: | |||||||||||||||
Basic (1) | $ | 1.22 | $ | 0.65 | $ | 0.70 | $ | 0.92 | |||||||
Diluted (1) | $ | 1.22 | $ | 0.65 | $ | 0.70 | $ | 0.92 | |||||||
| Market price: | |||||||||||||||
| High | $ | 244.71 | $ | 232.20 | $ | 231.90 | $ | 243.17 | |||||||
| Low | $ | 214.29 | $ | 205.72 | $ | 208.85 | $ | 207.26 | |||||||
| Close | $ | 239.41 | $ | 223.42 | $ | 212.50 | $ | 229.90 | |||||||
| Dividends declared | $ | 1.44 | $ | 1.44 | $ | 1.44 | $ | 1.44 | |||||||
2014 (2): | |||||||||||||||
| Total property revenues | $ | 276,778 | $ | 268,512 | $ | 256,952 | $ | 159,349 | |||||||
| Net income | $ | 44,805 | $ | 58,582 | $ | 4,645 | $ | 26,406 | |||||||
| Net income available to common stockholders | $ | 40,175 | $ | 53,565 | $ | 1,207 | $ | 21,912 | |||||||
| Per share data: | |||||||||||||||
| Net income: | |||||||||||||||
Basic (1) | $ | 0.63 | $ | 0.85 | $ | 0.02 | $ | 0.58 | |||||||
Diluted (1) | $ | 0.63 | $ | 0.85 | $ | 0.02 | $ | 0.58 | |||||||
| Market price: | |||||||||||||||
| High | $ | 214.43 | $ | 196.08 | $ | 185.99 | $ | 173.01 | |||||||
| Low | $ | 176.70 | $ | 177.68 | $ | 164.76 | $ | 141.79 | |||||||
| Close | $ | 206.60 | $ | 178.75 | $ | 184.91 | $ | 170.05 | |||||||
| Dividends declared | $ | 1.30 | $ | 1.30 | $ | 1.30 | $ | 1.21 | |||||||
(1) | Quarterly earnings |
(2) | Includes BRE results of operations after the merger date, April 1, 2014. |
Initial cost | Costs | Gross amount carried at close of period | |||||||||||||||||||||||||
| Buildings and | capitalized subsequent to | Land and | Buildings and | Accumulated | Date of | Date | Lives | ||||||||||||||||||||
| Property | Units | Location | Encumbrance | Land | improvements | acquisition | improvements | improvements | Total(1) | depreciation | construction | acquired | (years) | ||||||||||||||
| Encumbered apartment communities | |||||||||||||||||||||||||||
| Foothill Commons | 360 | Bellevue, WA | $ | $ | 2,435 | $ | 9,821 | $ | 6,074 | $ | 2,440 | $ | 15,890 | $ | 18,330 | $ | 9,298 | 1978 | 03/90 | 3-30 | |||||||
| Montclaire, The (Oak Pointe) | 390 | Sunnyvale, CA | 4,842 | 19,776 | 12,774 | 4,847 | 32,545 | 37,392 | 17,967 | 1973 | 12/88 | 3-30 | |||||||||||||||
| Palisades, The | 192 | Bellevue, WA | 1,560 | 6,242 | 9,421 | 1,565 | 15,658 | 17,223 | 6,617 | 1969/1977(2) | 05/90 | 3-30 | |||||||||||||||
| Pathways | 296 | Long Beach, CA | 4,083 | 16,757 | 15,174 | 6,239 | 29,775 | 36,014 | 13,093 | 1975 | 02/91 | 3-30 | |||||||||||||||
| Stevenson Place | 200 | Fremont, CA | 996 | 5,582 | 7,879 | 1,001 | 13,456 | 14,457 | 8,763 | 1971 | 04/83 | 3-30 | |||||||||||||||
| Bridgeport (Summerhill Commons) | 184 | Newark, CA | 1,608 | 7,582 | 5,984 | 1,525 | 13,649 | 15,174 | 7,019 | 1987 | 07/87 | 3-30 | |||||||||||||||
| Summerhill Park | 100 | Sunnyvale, CA | 2,654 | 4,918 | 1,149 | 2,656 | 6,065 | 8,721 | 3,978 | 1988 | 09/88 | 3-30 | |||||||||||||||
| Woodland Commons | 236 | Bellevue, WA | 2,040 | 8,727 | 4,293 | 2,044 | 13,016 | 15,060 | 7,236 | 1978 | 03/90 | 3-30 | |||||||||||||||
| 90,005 | 20,218 | 79,405 | 62,748 | 22,317 | 140,054 | 162,371 | 73,972 | ||||||||||||||||||||
| Fountain Court | 320 | Seattle, WA | 6,702 | 27,306 | 1,691 | 6,985 | 28,714 | 35,699 | 7,679 | 2000 | 03/00 | 3-30 | |||||||||||||||
| Hillcrest Park | 608 | Newbury Park, CA | 15,318 | 40,601 | 12,353 | 15,755 | 52,517 | 68,272 | 16,713 | 1973 | 03/98 | 3-30 | |||||||||||||||
| Hillsborough Park | 235 | La Habra, CA | 6,291 | 15,455 | 827 | 6,272 | 16,302 | 22,573 | 4,728 | 1999 | 09/99 | 3-30 | |||||||||||||||
| 76,732 | 28,311 | 83,362 | 14,871 | 29,012 | 97,532 | 126,544 | 29,120 | ||||||||||||||||||||
| Bel Air | 462 | San Ramon, CA | 12,105 | 18,252 | 18,642 | 12,682 | 36,317 | 48,999 | 12,687 | 1988 | 01/97 | 3-30 | |||||||||||||||
| Waterford, The | 238 | San Jose, CA | 11,808 | 24,500 | 11,688 | 15,165 | 32,831 | 47,996 | 7,659 | 2000 | 06/00 | 3-30 | |||||||||||||||
| 58,139 | 23,913 | 42,752 | 30,329 | 27,847 | 69,147 | 96,994 | 20,346 | ||||||||||||||||||||
| Bonita Cedars | 120 | Bonita, CA | 2,496 | 9,913 | 977 | 2,503 | 10,883 | 13,386 | 1,983 | 1983 | 12/02 | 3-30 | |||||||||||||||
| Bristol Commons | 188 | Sunnyvale, CA | 5,278 | 11,853 | 2,447 | 5,293 | 14,285 | 19,578 | 5,889 | 1989 | 01/97 | 3-30 | |||||||||||||||
| Castle Creek | 216 | Newcastle, WA | 4,149 | 16,028 | 2,020 | 4,833 | 17,364 | 22,197 | 6,593 | 1997 | 12/97 | 3-30 | |||||||||||||||
| Forest View | 192 | Renton, WA | 3,731 | 14,530 | 689 | 3,731 | 15,219 | 18,950 | 2,233 | 1998 | 10/03 | 3-30 | |||||||||||||||
| Mira Monte | 355 | Mira Mesa, CA | 7,165 | 28,459 | 6,909 | 7,186 | 35,347 | 42,533 | 6,243 | 1982 | 12/02 | 3-30 | |||||||||||||||
| Mission Hills | 282 | Oceanside, CA | 10,099 | 38,778 | 1,920 | 10,167 | 40,630 | 50,797 | 3,611 | 1984 | 7/05 | 3-30 | |||||||||||||||
| Walnut Heights | 163 | Walnut, CA | 4,858 | 19,168 | 1,140 | 4,887 | 20,280 | 25,166 | 2,927 | 1964 | 10/03 | 3-30 | |||||||||||||||
| Windsor Ridge | 216 | Sunnyvale, CA | 4,017 | 10,315 | 3,855 | 4,021 | 14,167 | 18,187 | 8,183 | 1989 | 03/89 | 3-30 | |||||||||||||||
| 100,000 | 41,793 | 149,044 | 19,959 | 42,621 | 168,174 | 210,796 | 37,662 | ||||||||||||||||||||
| Alpine Village | 306 | Alpine, CA | 17,016 | 4,967 | 19,728 | 1,994 | 4,982 | 21,707 | 26,689 | 3,845 | 1971 | 12/02 | 3-30 | ||||||||||||||
| Anchor Village | 301 | Mukilteo, WA | 10,750 | 2,498 | 10,595 | 5,433 | 2,681 | 15,845 | 18,526 | 7,092 | 1981 | 01/97 | 3-30 | ||||||||||||||
| Barkley, The | 161 | Anaheim, CA | 4,883 | 2,272 | 8,520 | 1,705 | 2,353 | 10,144 | 12,497 | 3,253 | 1984 | 04/00 | 3-30 | ||||||||||||||
| Bluffs II, The | 224 | San Diego, CA | 12,137 | 3,405 | 7,743 | 5,979 | 3,442 | 13,685 | 17,127 | 3,756 | 1974 | 06/97(3) | 3-30 | ||||||||||||||
| Brentwood (Hearthstone) | 140 | Santa Ana, CA | 9,333 | 2,833 | 11,303 | 4,341 | 3,502 | 14,975 | 18,477 | 2,798 | 1970 | 11/01 | 3-30 | ||||||||||||||
| Brighton Ridge | 264 | Renton, WA | 16,013 | 2,623 | 10,800 | 3,789 | 2,656 | 14,555 | 17,212 | 6,030 | 1986 | 12/96 | 3-30 | ||||||||||||||
| Brookside Oaks | 170 | Sunnyvale, CA | 14,130 | 7,301 | 16,310 | 16,792 | 10,301 | 30,102 | 40,403 | 5,312 | 1973 | 06/00 | 3-30 | ||||||||||||||
| Cairns, The | 100 | Seattle, WA | 11,552 | 6,937 | 20,679 | 62 | 6,939 | 20,739 | 27,678 | 396 | 2006 | 06/07 | 3-30 | ||||||||||||||
| Camarillo Oaks | 564 | Camarillo, CA | 53,052 | 10,953 | 25,254 | 5,109 | 11,075 | 30,241 | 41,316 | 13,871 | 1985 | 07/96 | 3-30 | ||||||||||||||
| Camino Ruiz Square | 160 | Camarillo, CA | 21,110 | 6,871 | 26,119 | 64 | 6,878 | 26,176 | 33,054 | 876 | 1990 | 12/06 | 3-30 | ||||||||||||||
| Canyon Point | 250 | Bothell, WA | 15,736 | 4,692 | 18,288 | 1,082 | 4,693 | 19,370 | 24,062 | 2,785 | 1990 | 10/03 | 3-30 | ||||||||||||||
| Capri at Sunny Hills | 100 | Fullerton, CA | 19,150 | 3,337 | 13,320 | 3,962 | 3,867 | 16,752 | 20,619 | 3,444 | 1961 | 09/01 | 3-30 | ||||||||||||||
| Cardiff by the Sea | 300 | Cardiff, CA | 42,200 | 13,724 | 57,395 | 439 | 14,224 | 57,881 | 72,105 | 1,355 | 1986 | 04/07 | 3-30 | ||||||||||||||
| (Continued) | |||||||||||||||||||||||||||
Initial cost | Costs | Gross amount carried at close of period | |||||||||||||||||||||||||
| Buildings and | capitalized subsequent to | Land and | Buildings and | Accumulated | Date of | Date | Lives | ||||||||||||||||||||
| Property | Units | Location | Encumbrance | Land | improvements | acquisition | improvements | improvements | Total(1) | depreciation | construction | acquired | (years) | ||||||||||||||
| Encumbered apartment communities (continued) | |||||||||||||||||||||||||||
| Carlyle, The | 132 | San Jose, CA | 15,424 | 3,954 | 15,277 | 9,270 | 5,801 | 22,701 | 28,501 | 5,266 | 2000 | 04/00 | 3-30 | ||||||||||||||
| City View (Wimbledon Woods) | 560 | Hayward, CA | 51,600 | 9,883 | 37,670 | 15,069 | 10,350 | 52,272 | 62,622 | 15,861 | 1975 | 03/98 | 3-30 | ||||||||||||||
| Coldwater Canyon | 39 | Studio City, CA | 5,919 | 1,674 | 6,640 | 367 | 1,676 | 7,005 | 8,681 | 143 | 1979 | 05/07 | 3-30 | ||||||||||||||
| Coral Gardens | 200 | El Cajon, CA | 10,943 | 3,638 | 14,452 | 936 | 3,649 | 15,377 | 19,026 | 2,770 | 1976 | 12/02 | 3-30 | ||||||||||||||
| Devonshire | 276 | Hemet, CA | 11,078 | 3,470 | 13,786 | 1,548 | 3,482 | 15,322 | 18,804 | 2,905 | 1988 | 12/02 | 3-30 | ||||||||||||||
| Emerald Ridge - North | 180 | Bellevue, WA | 10,721 | 3,449 | 7,801 | 3,036 | 3,449 | 10,837 | 14,286 | 5,018 | 1987 | 11/94 | 3-30 | ||||||||||||||
| Esplanade | 278 | San Jose, CA | 38,956 | 18,170 | 40,086 | 2,946 | 18,425 | 42,777 | 61,202 | 4,635 | 2002 | 11/04 | 3-30 | ||||||||||||||
| Evergreen Heights | 200 | Kirkland, WA | 10,910 | 3,566 | 13,395 | 2,134 | 3,649 | 15,446 | 19,095 | 5,847 | 1990 | 06/97 | 3-30 | ||||||||||||||
| Fairwood Pond | 194 | Renton, WA | 14,514 | 5,296 | 15,564 | 709 | 5,300 | 16,269 | 21,569 | 1,755 | 1997 | 10/04 | 3-30 | ||||||||||||||
| Fountain Park | 705 | Playa Vista, CA | 98,665 | 25,073 | 94,980 | 17,327 | 25,208 | 112,173 | 137,380 | 13,407 | 2002 | 02/04 | 3-30 | ||||||||||||||
| Harvest Park | 104 | Santa Rosa, CA | 11,603 | 6,700 | 15,479 | 192 | 6,690 | 15,681 | 22,371 | 413 | 2004 | 03/07 | 3-30 | ||||||||||||||
| Hidden Valley (Parker Ranch) | 324 | Simi Valley, CA | 33,303 | 14,174 | 34,065 | 287 | 11,724 | 36,802 | 48,526 | 4,334 | 2004 | 12/04 | 3-30 | ||||||||||||||
| Highridge | 255 | Rancho Palos Verde, CA | 44,807 | 5,419 | 18,347 | 8,220 | 5,841 | 26,145 | 31,986 | 9,376 | 1972 | 05/97 | 3-30 | ||||||||||||||
| Huntington Breakers | 342 | Huntington Beach, CA | 20,962 | 9,306 | 22,720 | 3,882 | 9,315 | 26,593 | 35,908 | 9,494 | 1984 | 10/97 | 3-30 | ||||||||||||||
| Inglenook Court | 224 | Bothell, WA | 8,300 | 3,467 | 7,881 | 6,502 | 3,474 | 14,375 | 17,850 | 5,757 | 1985 | 10/94 | 3-30 | ||||||||||||||
| Kings Road | 196 | Los Angeles, CA | 14,618 | 4,023 | 9,527 | 5,675 | 4,031 | 15,194 | 19,225 | 4,932 | 1979 | 06/97 | 3-30 | ||||||||||||||
| Le Pac Luxury Apartments | 140 | Santa Clara, CA | 13,713 | 3,090 | 7,421 | 4,768 | 3,092 | 12,187 | 15,279 | 4,889 | 1975 | 02/94 | 3-30 | ||||||||||||||
| Marbrisa | 202 | Long Beach, CA | 20,923 | 4,700 | 18,605 | 1,323 | 4,760 | 19,869 | 24,628 | 3,806 | 1987 | 09/02 | 3-30 | ||||||||||||||
| Mariners Place | 105 | Oxnard, CA | 3,872 | 1,555 | 6,103 | 1,029 | 1,562 | 7,126 | 8,687 | 2,166 | 1987 | 05/00 | 3-30 | ||||||||||||||
| Montejo | 124 | Garden Grove, CA | 5,812 | 1,925 | 7,685 | 1,332 | 2,110 | 8,833 | 10,942 | 1,959 | 1974 | 11/01 | 3-30 | ||||||||||||||
| Monterey Villas | 122 | Oxnard, CA | 13,802 | 2,349 | 5,579 | 4,395 | 2,424 | 9,900 | 12,323 | 3,206 | 1974 | 07/97 | 3-30 | ||||||||||||||
| Monterra del Rey | 84 | Pasadena, CA | 10,130 | 2,312 | 4,923 | 4,292 | 2,825 | 8,702 | 11,527 | 2,494 | 1972 | 04/99 | 3-30 | ||||||||||||||
| Mt. Sutro | 99 | San Francisco, CA | 5,725 | 2,334 | 8,507 | 1,850 | 2,810 | 9,881 | 12,691 | 2,942 | 1973 | 06/01 | 3-30 | ||||||||||||||
| Park Place/Windsor Court/Cochran | 176 | Los Angeles, CA | 21,964 | 4,965 | 11,806 | 5,090 | 5,015 | 16,846 | 21,861 | 5,682 | 1988 | 08/97 | 3-30 | ||||||||||||||
| Pointe at Cupertino, The | 116 | Cupertino, CA | 13,033 | 4,505 | 17,605 | 606 | 4,505 | 18,211 | 22,716 | 2,282 | 1963 | 08/98(4) | 3-30 | ||||||||||||||
| Sammamish View | 153 | Bellevue, WA | 10,778 | 3,324 | 7,501 | 5,942 | 3,331 | 13,436 | 16,767 | 4,724 | 1986 | 11/94 | 3-30 | ||||||||||||||
| San Marcos | 432 | Richmond, CA | 49,225 | 15,563 | 36,204 | 24,269 | 22,866 | 53,170 | 76,036 | 7,372 | 2003 | 11/03 | 3-30 | ||||||||||||||
| Stonehedge Village | 196 | Bothell, WA | 13,786 | 3,167 | 12,603 | 3,198 | 3,201 | 15,767 | 18,968 | 5,363 | 1986 | 10/97 | 3-30 | ||||||||||||||
| Summit Park | 300 | San Diego, CA | 21,100 | 5,959 | 23,670 | 2,011 | 5,977 | 25,663 | 31,640 | 4,773 | 1972 | 12/02 | 3-30 | ||||||||||||||
| Thomas Jefferson | 156 | Sunnyvale, CA | 19,529 | 8,190 | 19,306 | 91 | 8,195 | 19,392 | 27,587 | 340 | 1969 | 09/07 | 3-30 | ||||||||||||||
| Tierra Vista | 404 | Oxnard, CA | 62,037 | 13,652 | 53,336 | 669 | 13,661 | 53,997 | 67,657 | 6,665 | 2001 | 01/01(4) | 3-30 | ||||||||||||||
| Treehouse | 164 | Santa Ana, CA | 7,825 | 2,626 | 10,485 | 1,440 | 2,843 | 11,708 | 14,551 | 2,706 | 1970 | 11/01 | 3-30 | ||||||||||||||
| Boulevard (Treetops) | 172 | Fremont, CA | 9,800 | 3,520 | 8,182 | 7,717 | 3,580 | 15,839 | 19,419 | 4,925 | 1978 | 01/96 | 3-30 | ||||||||||||||
| Valley Park | 160 | Fountain Valley, CA | 9,913 | 3,361 | 13,420 | 3,001 | 3,761 | 16,021 | 19,782 | 3,458 | 1969 | 11/01 | 3-30 | ||||||||||||||
| Villa Angelina | 256 | Placentia, CA | 13,405 | 4,498 | 17,962 | 2,860 | 4,962 | 20,359 | 25,320 | 4,282 | 1970 | 11/01 | 3-30 | ||||||||||||||
| Vista Belvedere | 76 | Tiburon, CA | 11,297 | 5,573 | 11,901 | 1,973 | 5,573 | 13,874 | 19,447 | 1,520 | 1963 | 08/04 | 3-30 | ||||||||||||||
| Wandering Creek | 156 | Kent, WA | 5,300 | 1,285 | 4,980 | 3,762 | 1,296 | 8,731 | 10,027 | 3,615 | 1986 | 11/95 | 3-30 | ||||||||||||||
| Wharfside Pointe | 142 | Seattle, WA | 7,827 | 2,245 | 7,020 | 4,180 | 2,256 | 11,189 | 13,445 | 4,645 | 1990 | 06/94 | 3-30 | ||||||||||||||
| 1,325,057 | 408,608 | 1,283,091 | 342,554 | 432,055 | 1,602,745 | 2,034,800 | 391,640 | (Continued) | |||||||||||||||||||
Quarter ended December 31 | Quarter ended September 30 | Quarter ended June 30 | Quarter ended March 31 | ||||||||||||
| 2015: | |||||||||||||||
| Total property revenues | $ | 308,646 | $ | 302,522 | $ | 294,101 | $ | 280,229 | |||||||
| Net income | $ | 85,762 | $ | 47,182 | $ | 50,542 | $ | 64,753 | |||||||
| Net income available to common unitholders | $ | 82,333 | $ | 43,794 | $ | 47,088 | $ | 61,474 | |||||||
| Per unit data: | |||||||||||||||
| Net income: | |||||||||||||||
Basic (1) | $ | 1.22 | $ | 0.65 | $ | 0.70 | $ | 0.93 | |||||||
Diluted (1) | $ | 1.22 | $ | 0.65 | $ | 0.70 | $ | 0.92 | |||||||
| Distributions declared | $ | 1.44 | $ | 1.44 | $ | 1.44 | $ | 1.44 | |||||||
2014 (2): | |||||||||||||||
| Total property revenues | $ | 276,778 | $ | 268,512 | $ | 256,952 | $ | 159,349 | |||||||
| Net income | $ | 44,805 | $ | 58,582 | $ | 4,645 | $ | 26,406 | |||||||
| Net income available to common unitholders | $ | 41,599 | $ | 55,382 | $ | 1,416 | $ | 23,329 | |||||||
| Per unit data: | |||||||||||||||
| Net income: | |||||||||||||||
Basic (1) | $ | 0.63 | $ | 0.85 | $ | 0.02 | $ | 0.58 | |||||||
Diluted (1) | $ | 0.63 | $ | 0.85 | $ | 0.02 | $ | 0.58 | |||||||
| Distributions declared | $ | 1.30 | $ | 1.30 | $ | 1.30 | $ | 1.21 | |||||||
(1) | Quarterly earnings per common unit amounts may not total to the annual amounts due to rounding and the changes in the number of weighted common units outstanding and included in the calculation of basic and diluted shares. |
(2) | Includes BRE results of operations after the merger date, April 1, 2014. |
Initial cost | Costs | Gross amount carried at close of period | ||||||||||||||||||||||||||
| Buildings and | capitalized subsequent to | Land and | Buildings and | Accumulated | Date of | Date | Lives | |||||||||||||||||||||
| Property | Units | Location | Encumbrance | Land | improvements | acquisition | improvements | improvements | Total(1) | depreciation | construction | acquired | (years) | |||||||||||||||
| Unencumbered apartment communities | ||||||||||||||||||||||||||||
| Alpine Country | 108 | Alpine, CA | 1,741 | 6,914 | 456 | 1,746 | 7,364 | 9,111 | 1,335 | 1986 | 12/02 | 3-30 | ||||||||||||||||
| Avondale at Warner Center | 446 | Woodland Hills, CA | 10,536 | 24,522 | 14,962 | 10,601 | 39,419 | 50,020 | 12,858 | 1970 | 01/97 | 3-30 | ||||||||||||||||
| Belmont Terrace | 71 | Belmont, CA | 4,446 | 10,290 | 647 | 4,474 | 10,909 | 15,383 | 433 | 1974 | 10/06 | 3-30 | ||||||||||||||||
| Bridle Trails | 108 | Kirkland, WA | 1,500 | 5,930 | 4,982 | 1,531 | 10,881 | 12,412 | 3,182 | 1986 | 10/97 | 3-30 | ||||||||||||||||
| Bunker Hill | 456 | Los Angeles, CA | 11,498 | 27,871 | 3,350 | 11,639 | 31,080 | 42,719 | 11,324 | 1968 | 03/98 | 3-30 | ||||||||||||||||
| Cambridge | 40 | Chula Vista, CA | 497 | 1,973 | 214 | 498 | 2,186 | 2,684 | 387 | 1965 | 12/02 | 3-30 | ||||||||||||||||
| Canyon Oaks | 250 | San Ramon, CA | 19,088 | 44,473 | 119 | 19,088 | 44,591 | 63,680 | 934 | 2005 | 05/07 | 3-30 | ||||||||||||||||
| Carlton Heights | 70 | Santee, CA | 1,099 | 4,368 | 318 | 1,103 | 4,682 | 5,785 | 855 | 1979 | 12/02 | 3-30 | ||||||||||||||||
| CBC Apartments | 148 | Goleta, CA | 6,283 | 24,000 | 96 | 6,288 | 24,091 | 30,379 | 1,587 | 1962 | 01/06 | 3-30 | ||||||||||||||||
| Cedar Terrace | 180 | Bellevue, WA | 5,543 | 16,442 | 2,077 | 5,652 | 18,410 | 24,062 | 1,857 | 1984 | 01/05 | 3-30 | ||||||||||||||||
| Chimney Sweep Apartments | 91 | Goleta, CA | 5,558 | 21,320 | 1,561 | 5,618 | 22,820 | 28,439 | 1,670 | 1967 | 01/06 | 3-30 | ||||||||||||||||
| Country Villas | 180 | Oceanside, CA | 4,174 | 16,583 | 2,180 | 4,187 | 18,750 | 22,937 | 3,404 | 1976 | 12/02 | 3-30 | ||||||||||||||||
| Monterra del Sol (Euclid) | 85 | Pasadena, CA | 2,202 | 4,794 | 4,364 | 2,824 | 8,536 | 11,360 | 2,274 | 1972 | 04/99 | 3-30 | ||||||||||||||||
Fairways(5) | 74 | Newport Beach, CA | - | 7,850 | 2,876 | 9 | 10,717 | 10,726 | 3,877 | 1972 | 06/99 | 3-30 | ||||||||||||||||
| Foothill Gardens/Twin Creeks | 176 | San Ramon, CA | 5,875 | 13,992 | 3,435 | 5,964 | 17,339 | 23,302 | 6,957 | 1985 | 02/97 | 3-30 | ||||||||||||||||
| Grand Regency | 60 | Escondido, CA | 881 | 3,498 | 217 | 883 | 3,713 | 4,596 | 669 | 1967 | 12/02 | 3-30 | ||||||||||||||||
| Hampton Park | 83 | Glendale, CA | 2,407 | 5,672 | 1,563 | 2,426 | 7,216 | 9,642 | 2,055 | 1974 | 06/99 | 3-30 | ||||||||||||||||
| Hampton Place | 132 | Glendale, CA | 4,288 | 11,081 | 2,323 | 4,307 | 13,385 | 17,692 | 3,817 | 1970 | 06/99 | 3-30 | ||||||||||||||||
| Hillsdale Garden Apartments | 697 | Hillsdale Garden, CA | 22,000 | 94,681 | 1,976 | 22,325 | 97,184 | 119,509 | 3,971 | 1948 | 09/06(6) | 3-30 | ||||||||||||||||
| Hope Ranch Collection | 108 | Santa Barbara, CA | 16,877 | 4,078 | 122 | 4,208 | 16,869 | 21,077 | 384 | 1965 | 03/07 | 3-30 | ||||||||||||||||
| Linden Square | 183 | Seattle, WA | 4,374 | 11,588 | 931 | 4,202 | 12,691 | 16,893 | 3,464 | 1994 | 06/00 | 3-30 | ||||||||||||||||
| Pinehurst | 118 | Ventura, CA | 1,570 | 3,912 | 3,962 | 1,618 | 7,826 | 9,444 | 2,546 | 1971 | 06/97 | 3-30 | ||||||||||||||||
Magnonlia Lane(7) | 32 | Sunnyvale, CA | - | 5,430 | 8 | 3 | 5,434 | 5,438 | 98 | 2001 | 06/07 | 3-30 | ||||||||||||||||
| Maple Leaf | 48 | Seattle, WA | 805 | 3,283 | 749 | 828 | 4,010 | 4,837 | 1,376 | 1986 | 10/97 | 3-30 | ||||||||||||||||
| Marbella, The | 60 | Los Angeles, CA | 2,826 | 11,269 | 147 | 2,871 | 11,371 | 14,242 | 865 | 1991 | 09/05 | 3-30 | ||||||||||||||||
Marina City Club(8) | 101 | Marina Del Rey, CA | - | 28,167 | 2,669 | - | 30,836 | 30,836 | 4,070 | 1971 | 01/04 | 3-30 | ||||||||||||||||
Marina Cove(9) | 292 | Santa Clara, CA | 5,320 | 16,431 | 4,136 | 5,324 | 20,563 | 25,887 | 10,377 | 1974 | 06/94 | 3-30 | ||||||||||||||||
| Meadowood | 320 | Simi Valley, CA | 7,852 | 18,592 | 3,829 | 7,898 | 22,375 | 30,273 | 9,088 | 1986 | 11/96 | 3-30 | ||||||||||||||||
| Mesa Village | 133 | Clairemont, CA | 1,888 | 7,498 | 494 | 1,894 | 7,986 | 9,880 | 1,382 | 1963 | 12/02 | 3-30 | ||||||||||||||||
| Mill Creek at Windermere | 400 | San Ramon, CA | 29,551 | 70,430 | 37 | 29,551 | 69,070 | 98,620 | 671 | 1974 | 09/07 | 3-30 | ||||||||||||||||
| Mirabella | 188 | Marina Del Rey, CA | 6,180 | 26,673 | 10,264 | 6,270 | 36,847 | 43,117 | 7,557 | 2000 | 05/00 | 3-30 | ||||||||||||||||
| Monterra del Mar (Windsor Terrace) | 123 | Pasadena, CA | 2,188 | 5,263 | 3,951 | 2,735 | 8,666 | 11,402 | 3,016 | 1972 | 09/97 | 3-30 | ||||||||||||||||
| Mountain View | 106 | Camarillo, CA | 3,167 | 11,106 | 667 | 3,117 | 11,823 | 14,940 | 1,581 | 1980 | 01/04 | 3-30 | ||||||||||||||||
| Park Hill at Issaquah | 245 | Issaquah, CA | 7,284 | 21,937 | 810 | 7,284 | 22,747 | 30,031 | 2,530 | 1999 | 02/99(10) | 3-30 | ||||||||||||||||
| Pinehurst | 28 | Ventura, CA | 355 | 1,356 | 269 | 6 | 1,975 | 1,980 | 252 | 1973 | 12/04 | 3-30 | ||||||||||||||||
| Salmon Run at Perry Creek | 132 | Bothell, WA | 3,717 | 11,483 | 501 | 3,801 | 11,900 | 15,701 | 2,877 | 2000 | 10/00 | 3-30 | ||||||||||||||||
| Shadow Point | 172 | Spring Valley, CA | 2,812 | 11,170 | 1,386 | 2,820 | 12,548 | 15,368 | 2,373 | 1983 | 12/02 | 3-30 | ||||||||||||||||
| Spring Lake | 69 | Seattle, WA | 838 | 3,399 | 359 | 859 | 3,737 | 4,596 | 1,441 | 1986 | 10/97 | 3-30 | ||||||||||||||||
| St. Cloud | 302 | Houston, TX | 2,140 | 7,782 | 247 | 2,146 | 8,022 | 10,169 | 1,915 | 1968 | 12/02 | 3-30 | ||||||||||||||||
| (Continued) | ||||||||||||||||||||||||||||
Initial cost | Costs capitalized | Gross amount carried at close of period | |||||||||||||||||||||||||
| Buildings and | subsequent to | Land and | Buildings and | Accumulated | Date of | Date | Lives | ||||||||||||||||||||
| Property | Units | Location | Encumbrance | Land | improvements | acquisition | improvements | improvements | Total(1) | depreciation | construction | acquired | (years) | ||||||||||||||
| Unencumbered apartment communities (continued) | |||||||||||||||||||||||||||
| The Laurels | 164 | Mill Creek, WA | 1,559 | 6,430 | 1,916 | 1,595 | 8,309 | 9,905 | 3,435 | 1981 | 12/96 | 3-30 | |||||||||||||||
| Tierra del Sol/Norte | 156 | El Cajon, CA | 2,455 | 9,753 | 654 | 2,463 | 10,399 | 12,862 | 1,881 | 1969 | 12/02 | 3-30 | |||||||||||||||
| Trabucco Villas | 132 | Lake Forest, CA | 3,638 | 8,640 | 1,548 | 3,890 | 9,936 | 13,826 | 4,011 | 1985 | 10/97 | 3-30 | |||||||||||||||
| Tuscana | 30 | Tracy, CA | 2,828 | 6,599 | 153 | 2,870 | 6,710 | 9,580 | 140 | 2007 | 02/07 | 3-30 | |||||||||||||||
| Vista Capri - North | 106 | San Diego, CA | 1,663 | 6,609 | 489 | 1,668 | 7,093 | 8,761 | 1,192 | 1975 | 12/02 | 3-30 | |||||||||||||||
| Wilshire Promenade | 149 | Fullerton, CA | 3,118 | 7,385 | 5,215 | 3,797 | 11,921 | 15,718 | 4,572 | 1992 | 01/97 | 3-30 | |||||||||||||||
| Woodlawn Colonial | 159 | Chula Vista, CA | 2,344 | 9,311 | 943 | 2,351 | 10,248 | 12,598 | 1,923 | 1974 | 12/02 | 3-30 | |||||||||||||||
| Woodside Village | 145 | Ventura, CA | 5,331 | 21,036 | 1,145 | 5,342 | 22,170 | 27,512 | 2,221 | 1987 | 12/04 | 3-30 | |||||||||||||||
| 24,393 | 1,325,057 | 640,904 | 1,985,955 | 437,870 | 654,629 | 2,410,099 | 3,064,729 | 532,323 | |||||||||||||||||||
Initial cost | Costs capitalized | Gross amount carried at close of period | |||||||||||||||||||||||||
| Buildings and | subsequent to | Land and | Buildings and | Accumulated | Date of | Date | Lives | ||||||||||||||||||||
| Property | Units | Location | Encumbrance | Land | improvements | acquisition | improvements | improvements | Total(1) | depreciation | construction | acquired | (years) | ||||||||||||||
| Other real estate assets | |||||||||||||||||||||||||||
| Office Buildings | |||||||||||||||||||||||||||
| 925 East Meadow | Palo Alto, CA | - | 1,401 | 3,172 | 1,105 | 1,857 | 3,822 | 5,678 | 2,211 | 1988 | 11/97 | 3-30 | |||||||||||||||
935 East Meadow(11) | Palo Alto, CA | - | 1,290 | 3,078 | 0 | 1,290 | 3,078 | 4,368 | - | 1962 | 12/07 | 3-30 | |||||||||||||||
| 17461 Derian | Irvine, CA | - | 3,079 | 12,315 | 5,220 | 3,105 | 17,509 | 20,614 | 4,527 | 1983 | 07/00 | 3-30 | |||||||||||||||
| 22120 Clarendon | Woodland Hills, CA | - | 903 | 3,600 | 1,205 | 1,014 | 4,694 | 5,708 | 1,538 | 1982 | 03/01 | 3-30 | |||||||||||||||
| Recreational vehicle parks | |||||||||||||||||||||||||||
| Circle RV | El Cajon, CA | - | 2,375 | 2,347 | 140 | 2,505 | 2,357 | 4,862 | 400 | 1977 | 12/02 | 3-30 | |||||||||||||||
| Vacationer | El Cajon, CA | - | 1,975 | 1,951 | 138 | 2,100 | 1,964 | 4,064 | 338 | 1973 | 12/02 | 3-30 | |||||||||||||||
| Manufactured housing communities | |||||||||||||||||||||||||||
| Green Valley | Vista, CA | 6,216 | 3,750 | 3,710 | 275 | 3,993 | 3,742 | 7,735 | 650 | 1973 | 12/02 | 3-30 | |||||||||||||||
| Total apartment communities and other real estate assets | $ | 1,331,273 | $ | 655,677 | $ | 2,016,128 | $ | 445,954 | $ | 670,494 | $ | 2,447,265 | $ | 3,117,759 | $ | 541,987 | (Continued) | ||||||||||
| Costs | ||||||||||||||||||||||||||||
| Initial cost | capitalized | Gross amount carried at close of period | ||||||||||||||||||||||||||
| Buildings and | subsequent to | Land and | Buildings and | Accumulated | Date of | �� | Date | Lives | ||||||||||||||||||||
| Property | Units | Location | Encumbrance | Land | improvements | acquisition | improvements | improvements | Total(1) | depreciation | construction | acquired | (years) | |||||||||||||||
| Other real estate assets (continued) | ||||||||||||||||||||||||||||
Development Projects(12) | ||||||||||||||||||||||||||||
| Belmont Station | 275 | Los Angeles, CA | $ | 19,450 | $ | 8,100 | $ | - | $ | 47,378 | $ | 55,478 | $ | - | $ | 55,478 | $ | - | - | 12/04 | - | |||||||
| The Grand | 238 | Oakland, CA | - | 4,838 | - | 37,211 | 42,049 | - | 42,049 | - | - | 08/05 | - | |||||||||||||||
| Fourth Street | 171 | Berkeley, CA | - | 8,772 | 4,601 | 13,373 | - | 13,373 | - | - | 12/07 | - | ||||||||||||||||
Predevelopment Projects(13) | 1,658 | various | 12,150 | 87,845 | - | 9,248 | 97,093 | - | 97,093 | - | - | - | ||||||||||||||||
| Land held for future development | 434 | various | - | - | - | 25,452 | 25,452 | - | 25,452 | - | - | - | ||||||||||||||||
| Consolidated Development Pipeline | 2,776 | $ | 31,600 | $ | 109,555 | $ | - | $ | 123,890 | $ | 233,445 | $ | - | $ | 233,445 | $ | - | |||||||||||
| (1) The aggregate cost for federal income tax purposes is approximately $2,379,000,000 (unaudited). | ||||||||||||||||||||||||||||
| (2) Phase I was built in 1969 and Phase II was built in 1977. | ||||||||||||||||||||||||||||
| (3) The Operating Partnership's initial ownership was 85%, and the remaining 15% interest was acquired in 2007. | ||||||||||||||||||||||||||||
| (4) The Operating Partnership's initial ownership was 20%, and the remaining 80% interest was acquired in 2004. | ||||||||||||||||||||||||||||
| (5) The land is leased pursuant to a ground lease expiring 2027. | ||||||||||||||||||||||||||||
| (6) The land was subject to a ground lease that would have expired in 2047. In the second quarter of 2007, the Operating Partnership entered into a joint venture with a third-party, and the Operating Partnership contributed the improvements for an 81.5% interest and the joint venture partner contributed title to the land for an 18.5% interest in the partnership. | ||||||||||||||||||||||||||||
| (7) The land is leased pursuant to a ground lease expiring 2070. | ||||||||||||||||||||||||||||
| (8) The land is leased pursuant to a ground lease expiring 2067. | ||||||||||||||||||||||||||||
| (9) A portion of land is leased pursuant to a ground lease expiring in 2028. | ||||||||||||||||||||||||||||
| (10) The Operating Partnership's initial ownership was 45%, and the remaining 55% interest was acquired in 2004. | ||||||||||||||||||||||||||||
| (11) The office building is currently under renovation through approximately the third quarter of 2008. | ||||||||||||||||||||||||||||
| (12) All construction costs are reflected as real estate under development in the Operating Partnership's consolidated balance sheets until the project reaches stabilization. | ||||||||||||||||||||||||||||
| (13) The 535 - 575 River Oaks and 6230 Sunset Blvd. commercial buildings are accounted as part of predevelopment projects for the year ended December 31, 2007. | ||||||||||||||||||||||||||||
| A summary of activity for rental properties and accumulated depreciation is as follows: | ||||||||||||||||||||||||||
| 2007 | 2006 | 2005 | 2007 | 2006 | 2005 | |||||||||||||||||||||
| Rental properties: | Accumulated depreciation: | |||||||||||||||||||||||||
| Balance at beginning of year | $ | 2,669,187 | $ | 2,431,629 | $ | 2,371,194 | Balance at beginning of year | $ | 465,015 | $ | 389,040 | $ | 329,652 | |||||||||||||
| Improvements | 105,673 | 40,885 | 24,000 | Depreciation expense - Acquisitions | 4,838 | 2,314 | 1,406 | |||||||||||||||||||
| Acquisition of real estate | 397,605 | 202,459 | 90,065 | Depreciation expense - Development | 5,540 | - | - | |||||||||||||||||||
| Development of real estate | - | - | 20,460 | Depreciation expense - Discontinued operations | 1,820 | 4,941 | 5,777 | |||||||||||||||||||
| Disposition of real estate | (54,706) | (5,786) | (22,473) | Depreciation and amortization expense - Rental properties | 83,274 | 73,241 | 66,409 | |||||||||||||||||||
| Real estate investment held for sale | - | - | (51,617) | Dispositions | (18,500) | (2,362) | (4,768) | |||||||||||||||||||
| Balance at the end of year | $ | 3,117,759 | $ | 2,669,187 | $ | 2,431,629 | Real estate investment held for sale | - | (2,159) | (9,436) | ||||||||||||||||
| Balance at the end of year | $ | 541,987 | $ | 465,015 | $ | 389,040 | ||||||||||||||||||||
| Costs | ||||||||||||||||||||||||||||||
| Initial cost | capitalized | Gross amount carried at close of period | ||||||||||||||||||||||||||||
| Apartment | Buildings and | subsequent to | Land and | Buildings and | Accumulated | Date of | Date | Lives | ||||||||||||||||||||||
| Property | Homes | Location | Encumbrance | Land | improvements | acquisition | improvements | improvements | Total (1) | depreciation | construction | acquired | (years) | |||||||||||||||||
| Encumbered communities | ||||||||||||||||||||||||||||||
| Avondale at Warner Center | 446 | Woodland Hills, CA | $ | 44,470 | $ | 10,536 | $ | 24,522 | $ | 18,315 | $ | 10,601 | $ | 42,772 | $ | 53,373 | $ | (26,174 | ) | 1970 | Jan-97 | 3-30 | ||||||||
| Bel Air | 462 | San Ramon, CA | 52,615 | 12,105 | 18,252 | 31,563 | 12,682 | 49,238 | 61,920 | (26,928 | ) | 1988 | Jan-97 | 3-30 | ||||||||||||||||
| Belcarra | 296 | Bellevue, WA | 54,416 | 21,725 | 92,091 | 253 | 21,725 | 92,344 | 114,069 | (5,874 | ) | 2009 | Apr-14 | 5-30 | ||||||||||||||||
| Bella Villagio | 231 | San Jose, CA | 34,686 | 17,247 | 40,343 | 2,271 | 17,247 | 42,614 | 59,861 | (8,054 | ) | 2004 | Sep-10 | 3-30 | ||||||||||||||||
| BellCentre | 248 | Bellevue, WA | 40,485 | 16,197 | 67,207 | 1,463 | 16,197 | 68,670 | 84,867 | (4,461 | ) | 2001 | Apr-14 | 5-30 | ||||||||||||||||
| Belmont Station | 275 | Los Angeles, CA | 29,604 | 8,100 | 66,666 | 5,034 | 8,267 | 71,533 | 79,800 | (20,898 | ) | 2009 | Mar-09 | 3-30 | ||||||||||||||||
| Bridgeport | 184 | Newark, CA | 20,559 | 1,608 | 7,582 | 8,801 | 1,525 | 16,466 | 17,991 | (12,685 | ) | 1987 | Jul-87 | 3-30 | ||||||||||||||||
| Brookside Oaks | 170 | Sunnyvale, CA | 18,897 | 7,301 | 16,310 | 23,258 | 10,328 | 36,541 | 46,869 | (16,270 | ) | 1973 | Jun-00 | 3-30 | ||||||||||||||||
| Camino Ruiz Square | 160 | Camarillo, CA | 21,093 | 6,871 | 26,119 | 1,431 | 6,931 | 27,490 | 34,421 | (8,515 | ) | 1990 | Dec-06 | 3-30 | ||||||||||||||||
| Canyon Oaks | 250 | San Ramon, CA | 27,553 | 19,088 | 44,473 | 2,543 | 19,088 | 47,016 | 66,104 | (14,036 | ) | 2005 | May-07 | 3-30 | ||||||||||||||||
| Carmel Creek | 348 | San Diego, CA | 65,204 | 26,842 | 107,368 | 2,474 | 26,842 | 109,842 | 136,684 | (7,078 | ) | 2000 | Apr-14 | 5-30 | ||||||||||||||||
| City View | 572 | Hayward, CA | 73,204 | 9,883 | 37,670 | 23,281 | 10,350 | 60,484 | 70,834 | (38,459 | ) | 1975 | Mar-98 | 3-30 | ||||||||||||||||
| Courtyard off Main | 110 | Bellevue, WA | 15,402 | 7,465 | 21,405 | 2,927 | 7,465 | 24,332 | 31,797 | (4,663 | ) | 2000 | Oct-10 | 3-30 | ||||||||||||||||
| Domaine | 92 | Seattle, WA | 15,149 | 9,059 | 27,177 | 710 | 9,059 | 27,887 | 36,946 | (3,130 | ) | 2009 | Sep-12 | 3-30 | ||||||||||||||||
| Elevation | 158 | Redmond, WA | 10,973 | 4,758 | 14,285 | 5,740 | 4,757 | 20,026 | 24,783 | (5,319 | ) | 1986 | Jun-10 | 3-30 | ||||||||||||||||
| Ellington at Bellevue | 220 | Bellevue, WA | 22,289 | 15,066 | 45,249 | 1,322 | 15,066 | 46,571 | 61,637 | (2,109 | ) | 1994 | Jul-14 | 3-30 | ||||||||||||||||
| Fairhaven | 164 | Santa Ana, CA | 20,230 | 2,626 | 10,485 | 6,040 | 2,957 | 16,194 | 19,151 | (7,714 | ) | 1970 | Nov-01 | 3-30 | ||||||||||||||||
| Foster's Landing | 490 | Foster City, CA | 100,847 | 61,714 | 144,000 | 5,685 | 61,714 | 149,685 | 211,399 | (9,741 | ) | 1987 | Apr-14 | 5-30 | ||||||||||||||||
| Fountain at River Oaks | 226 | San Jose, CA | 33,159 | 26,046 | 60,773 | 590 | 26,046 | 61,363 | 87,409 | (3,953 | ) | 1990 | Apr-14 | 3-30 | ||||||||||||||||
| Fountain Park | 705 | Playa Vista, CA | 82,366 | 25,073 | 94,980 | 29,371 | 25,203 | 124,221 | 149,424 | (53,723 | ) | 2002 | Feb-04 | 3-30 | ||||||||||||||||
| Hampton Place/Hampton Court | 215 | Glendale, CA | 20,213 | 6,695 | 16,753 | 13,193 | 6,733 | 29,908 | 36,641 | (13,448 | ) | 1970 | Jun-99 | 3-30 | ||||||||||||||||
| Hidden Valley | 324 | Simi Valley, CA | 29,262 | 14,174 | 34,065 | 2,620 | 9,674 | 41,185 | 50,859 | (15,871 | ) | 2004 | Dec-04 | 3-30 | ||||||||||||||||
| Highlands at Wynhaven | 333 | Issaquah, WA | 31,522 | 16,271 | 48,932 | 8,001 | 16,271 | 56,933 | 73,204 | (15,525 | ) | 2000 | Aug-08 | 3-30 | ||||||||||||||||
| Highridge | 255 | Rancho Palos Verdes, CA | 44,772 | 5,419 | 18,347 | 29,555 | 6,073 | 47,248 | 53,321 | (26,591 | ) | 1972 | May-97 | 3-30 | ||||||||||||||||
| Hillcrest Park | 608 | Newbury Park, CA | 65,566 | 15,318 | 40,601 | 17,368 | 15,755 | 57,532 | 73,287 | (32,302 | ) | 1973 | Mar-98 | 3-30 | ||||||||||||||||
| Huntington Breakers | 342 | Huntington Beach, CA | 36,648 | 9,306 | 22,720 | 17,026 | 9,315 | 39,737 | 49,052 | (19,480 | ) | 1984 | Oct-97 | 3-30 | ||||||||||||||||
| Inglenook Court | 224 | Bothell, WA | 8,174 | 3,467 | 7,881 | 6,686 | 3,474 | 14,560 | 18,034 | (10,524 | ) | 1985 | Oct-94 | 3-30 | ||||||||||||||||
Magnolia Square/Magnolia Lane (2) | 188 | Sunnyvale, CA | 17,363 | 8,190 | 24,736 | 14,591 | 8,191 | 39,326 | 47,517 | (13,145 | ) | 1969 | Sep-07 | 3-30 | ||||||||||||||||
| Mill Creek at Windermere | 400 | San Ramon, CA | 47,344 | 29,551 | 69,032 | 3,447 | 29,551 | 72,479 | 102,030 | (20,639 | ) | 2005 | Sep-07 | 3-30 | ||||||||||||||||
| Mirabella | 188 | Marina Del Rey, CA | 43,518 | 6,180 | 26,673 | 14,103 | 6,270 | 40,686 | 46,956 | (19,485 | ) | 2000 | May-00 | 3-30 | ||||||||||||||||
| Costs | ||||||||||||||||||||||||||||||
| Initial cost | capitalized | Gross amount carried at close of period | ||||||||||||||||||||||||||||
| Apartment | Buildings and | subsequent to | Land and | Buildings and | Accumulated | Date of | Date | Lives | ||||||||||||||||||||||
| Property | Homes | Location | Encumbrance | Land | improvements | acquisition | improvements | improvements | Total (1) | depreciation | construction | acquired | (years) | |||||||||||||||||
| Montanosa | 472 | San Diego, CA | 62,724 | 26,697 | 106,787 | 2,210 | 26,697 | 108,997 | 135,694 | (7,005 | ) | 1990 | Apr-14 | 5-30 | ||||||||||||||||
| Montebello | 248 | Kirkland, WA | 27,353 | 13,857 | 41,575 | 3,735 | 13,858 | 45,309 | 59,167 | (5,903 | ) | 1996 | Jul-12 | 3-30 | ||||||||||||||||
| Montejo | 124 | Garden Grove, CA | 15,232 | 1,925 | 7,685 | 2,822 | 2,194 | 10,238 | 12,432 | (4,974 | ) | 1974 | Nov-01 | 3-30 | ||||||||||||||||
| Park Highland | 250 | Bellevue, WA | 26,556 | 9,391 | 38,224 | 8,053 | 9,391 | 46,277 | 55,668 | (2,743 | ) | 1993 | Apr-14 | 5-30 | ||||||||||||||||
| Park Hill at Issaquah | 245 | Issaquah, WA | 27,802 | 7,284 | 21,937 | 5,979 | 7,284 | 27,916 | 35,200 | (10,277 | ) | 1999 | Feb-99 | 3-30 | ||||||||||||||||
| Pathways | 296 | Long Beach, CA | 36,325 | 4,083 | 16,757 | 19,274 | 6,239 | 33,875 | 40,114 | (25,965 | ) | 1975 | Feb-91 | 3-30 | ||||||||||||||||
| Piedmont | 396 | Bellevue, WA | 46,635 | 19,848 | 59,606 | 4,502 | 19,848 | 64,108 | 83,956 | (3,638 | ) | 1969 | May-14 | 3-30 | ||||||||||||||||
| Pinnacle at Fullerton | 192 | Fullerton, CA | 27,578 | 11,019 | 45,932 | 858 | 11,019 | 46,790 | 57,809 | (2,980 | ) | 2004 | Apr-14 | 5-30 | ||||||||||||||||
| Pinnacle on Lake Washington | 180 | Renton, WA | 18,724 | 7,760 | 31,041 | 449 | 7,760 | 31,490 | 39,250 | (2,027 | ) | 2001 | Apr-14 | 5-30 | ||||||||||||||||
| Pinnacle at MacArthur Place | 253 | Santa Ana, CA | 39,859 | 15,810 | 66,401 | 1,343 | 15,810 | 67,744 | 83,554 | (4,306 | ) | 2002 | Apr-14 | 5-30 | ||||||||||||||||
| Pinnacle at Otay Ranch | 364 | San Diego, CA | 40,970 | 17,023 | 68,093 | 766 | 17,023 | 68,859 | 85,882 | (4,442 | ) | 2001 | Apr-14 | 5-30 | ||||||||||||||||
| Pinnacle at Talega | 362 | Irvine, CA | 46,489 | 19,292 | 77,168 | 993 | 19,292 | 78,161 | 97,453 | (5,014 | ) | 2002 | Apr-14 | 5-30 | ||||||||||||||||
| Stevenson Place | 200 | Fremont, CA | 20,980 | 996 | 5,582 | 9,323 | 1,001 | 14,900 | 15,901 | (10,244 | ) | 1971 | Apr-83 | 3-30 | ||||||||||||||||
| Summerhill Park | 100 | Sunnyvale, CA | 13,032 | 2,654 | 4,918 | 9,769 | 2,656 | 14,685 | 17,341 | (5,764 | ) | 1988 | Sep-88 | 3-30 | ||||||||||||||||
| The Audrey at Belltown | 137 | Seattle, WA | 22,099 | 9,228 | 36,911 | 185 | 9,228 | 37,096 | 46,324 | (2,373 | ) | 1992 | Apr-14 | 5-30 | ||||||||||||||||
| The Avery | 121 | Los Angeles, CA | 9,985 | 6,964 | 29,922 | 16 | 6,964 | 29,938 | 36,902 | (1,786 | ) | 2014 | Mar-14 | 3-30 | ||||||||||||||||
The Barkley (3) | 161 | Anaheim, CA | 15,951 | — | 8,520 | 5,561 | 2,353 | 11,728 | 14,081 | (6,090 | ) | 1984 | Apr-00 | 3-30 | ||||||||||||||||
| The Bernard | 63 | Seattle, WA | 9,141 | 3,699 | 11,345 | 231 | 3,689 | 11,586 | 15,275 | (1,706 | ) | 2008 | Sep-11 | 3-30 | ||||||||||||||||
| The Carlyle | 132 | San Jose, CA | 21,889 | 3,954 | 15,277 | 10,317 | 5,801 | 23,747 | 29,548 | (11,968 | ) | 2000 | Apr-00 | 3-30 | ||||||||||||||||
| The Dylan | 184 | West Hollywood, CA | 59,592 | 19,984 | 82,286 | 16 | 19,984 | 82,302 | 102,286 | (2,637 | ) | 2015 | Mar-15 | 3-30 | ||||||||||||||||
| The Elliot at Mukilteo | 301 | Mukilteo, WA | 10,628 | 2,498 | 10,595 | 14,940 | 2,824 | 25,209 | 28,033 | (14,705 | ) | 1981 | Jan-97 | 3-30 | ||||||||||||||||
| The Huntington | 276 | Huntington Beach, CA | 30,890 | 10,374 | 41,495 | 3,381 | 10,374 | 44,876 | 55,250 | (5,765 | ) | 1975 | Jun-12 | 3-30 | ||||||||||||||||
| The Huxley | 187 | West Hollywood, CA | 54,272 | 19,362 | 75,641 | 40 | 19,362 | 75,681 | 95,043 | (2,486 | ) | 2014 | Mar-15 | 3-30 | ||||||||||||||||
| The Landing at Jack London Square | 282 | Oakland, CA | 54,771 | 33,554 | 78,292 | 2,966 | 33,554 | 81,258 | 114,812 | (5,336 | ) | 2001 | Apr-14 | 5-30 | ||||||||||||||||
| The Montclaire | 390 | Sunnyvale, CA | 44,921 | 4,842 | 19,776 | 20,602 | 4,997 | 40,223 | 45,220 | (33,694 | ) | 1973 | Dec-88 | 3-30 | ||||||||||||||||
| The Palms at Laguna Niguel | 460 | Laguna Niguel, CA | 57,032 | 23,584 | 94,334 | 1,634 | 23,584 | 95,968 | 119,552 | (6,171 | ) | 1988 | Apr-14 | 5-30 | ||||||||||||||||
| The Palisades | 192 | Bellevue, WA | 20,138 | 1,560 | 6,242 | 11,658 | 1,565 | 17,895 | 19,460 | (13,831 | ) | 1977 | May-90 | 3-30 | ||||||||||||||||
| The Waterford | 238 | San Jose, CA | 30,689 | 11,808 | 24,500 | 13,536 | 15,165 | 34,679 | 49,844 | (17,641 | ) | 2000 | Jun-00 | 3-30 | ||||||||||||||||
| Tierra Vista | 404 | Oxnard, CA | 53,948 | 13,652 | 53,336 | 4,226 | 13,661 | 57,553 | 71,214 | (23,033 | ) | 2001 | Jan-01 | 3-30 | ||||||||||||||||
| Valley Park | 160 | Fountain Valley, CA | 25,856 | 3,361 | 13,420 | 5,269 | 3,761 | 18,289 | 22,050 | (8,190 | ) | 1969 | Nov-01 | 3-30 | ||||||||||||||||
| Villa Angelina | 256 | Placentia, CA | 31,908 | 4,498 | 17,962 | 6,539 | 4,962 | 24,037 | 28,999 | (11,020 | ) | 1970 | Nov-01 | 3-30 | ||||||||||||||||
| Villa Grenada | 270 | Santa Clara, CA | 61,057 | 38,299 | 89,365 | 326 | 38,299 | 89,691 | 127,990 | (5,789 | ) | 2010 | Apr-14 | 5-30 | ||||||||||||||||
| Costs | ||||||||||||||||||||||||||||||
| Initial cost | capitalized | Gross amount carried at close of period | ||||||||||||||||||||||||||||
| Apartment | Buildings and | subsequent to | Land and | Buildings and | Accumulated | Date of | Date | Lives | ||||||||||||||||||||||
| Property | Homes | Location | Encumbrance | Land | improvements | acquisition | improvements | improvements | Total (1) | depreciation | construction | acquired | (years) | |||||||||||||||||
| Wandering Creek | 156 | Kent, WA | 5,209 | 1,285 | 4,980 | 3,790 | 1,296 | 8,759 | 10,055 | (6,313 | ) | 1986 | Nov-95 | 3-30 | ||||||||||||||||
| Wilshire Promenade | 149 | Fullerton, CA | 17,259 | 3,118 | 7,385 | 7,693 | 3,797 | 14,399 | 18,196 | (8,305 | ) | 1992 | Jan-97 | 3-30 | ||||||||||||||||
| 17,085 | $ | 2,215,077 | $ | 797,144 | $ | 2,589,987 | $ | 482,664 | $ | 810,649 | $ | 3,059,146 | $ | 3,869,795 | $ | (750,915 | ) | |||||||||||||
| Unencumbered Communities | ||||||||||||||||||||||||||||||
| 8th & Hope | 290 | Los Angeles, CA | $ | — | $ | 29,279 | $ | 169,350 | $ | 441 | $ | 29,279 | $ | 169,791 | $ | 199,070 | $ | (5,544 | ) | 2014 | Feb-15 | 3-30 | ||||||||
| Alessio | 624 | Los Angeles, CA | — | 32,136 | 128,543 | 3,105 | 32,136 | 131,648 | 163,784 | (8,564 | ) | 2001 | Apr-14 | 5-30 | ||||||||||||||||
| Allegro | 97 | Valley Village, CA | — | 5,869 | 23,977 | 1,573 | 5,869 | 25,550 | 31,419 | (6,656 | ) | 2010 | Oct-10 | 3-30 | ||||||||||||||||
| Allure at Scripps Ranch | 194 | San Diego, CA | — | 11,923 | 47,690 | 280 | 11,923 | 47,970 | 59,893 | (3,074 | ) | 2002 | Apr-14 | 5-30 | ||||||||||||||||
| Alpine Village | 301 | Alpine, CA | — | 4,967 | 19,728 | 6,551 | 4,982 | 26,264 | 31,246 | (11,485 | ) | 1971 | Dec-02 | 3-30 | ||||||||||||||||
| Anavia | 250 | Anaheim, CA | — | 15,925 | 63,712 | 6,340 | 15,925 | 70,052 | 85,977 | (11,955 | ) | 2009 | Dec-10 | 3-30 | ||||||||||||||||
| Annaliese | 56 | Seattle, WA | — | 4,727 | 14,229 | 330 | 4,726 | 14,560 | 19,286 | (1,452 | ) | 2009 | Jan-13 | 3-30 | ||||||||||||||||
| Apex | 366 | Milpitas, CA | — | 44,240 | 103,251 | 1,104 | 44,240 | 104,355 | 148,595 | (4,635 | ) | 2014 | Aug-14 | 3-30 | ||||||||||||||||
| Aqua at Marina Del Rey | 500 | Marina Del Ray, CA | — | 58,442 | 175,326 | 4,965 | 58,442 | 180,291 | 238,733 | (11,632 | ) | 2001 | Apr-14 | 5-30 | ||||||||||||||||
| Ascent | 90 | Kirkland, WA | — | 3,924 | 11,862 | 1,669 | 3,924 | 13,531 | 17,455 | (1,734 | ) | 1988 | Oct-12 | 3-30 | ||||||||||||||||
| Avant | 440 | Los Angeles, CA | — | 32,379 | 137,940 | 261 | 32,379 | 138,201 | 170,580 | (1,631 | ) | 2014 | Jun-15 | 3-30 | ||||||||||||||||
| Avenue 64 | 224 | Emeryville, CA | — | 27,235 | 64,403 | 8,486 | 27,235 | 72,889 | 100,124 | (4,257 | ) | 2007 | Apr-14 | 5-30 | ||||||||||||||||
Aviara (4) | 166 | Mercer Island, CA | — | — | 49,813 | 136 | — | 49,949 | 49,949 | (3,596 | ) | 2013 | Apr-14 | 5-30 | ||||||||||||||||
| Axis 2300 | 115 | Irvine, CA | — | 5,405 | 33,585 | 1,127 | 5,405 | 34,712 | 40,117 | (8,800 | ) | 2010 | Aug-10 | 3-30 | ||||||||||||||||
| Bellerive | 63 | Los Angeles, CA | — | 5,401 | 21,803 | 765 | 5,401 | 22,568 | 27,969 | (4,455 | ) | 2011 | Aug-11 | 3-30 | ||||||||||||||||
| Belmont Terrace | 71 | Belmont, CA | — | 4,446 | 10,290 | 4,399 | 4,473 | 14,662 | 19,135 | (5,372 | ) | 1974 | Oct-06 | 3-30 | ||||||||||||||||
| Bennett Lofts | 165 | San Francisco, CA | — | 21,771 | 50,800 | 25,515 | 28,371 | 69,715 | 98,086 | (7,560 | ) | 2004 | Dec-12 | 3-30 | ||||||||||||||||
| Bernardo Crest | 216 | San Diego, CA | — | 10,802 | 43,209 | 1,302 | 10,802 | 44,511 | 55,313 | (2,837 | ) | 1988 | Apr-14 | 5-30 | ||||||||||||||||
| Bonita Cedars | 120 | Bonita, CA | — | 2,496 | 9,913 | 2,187 | 2,503 | 12,093 | 14,596 | (5,574 | ) | 1983 | Dec-02 | 3-30 | ||||||||||||||||
| Boulevard | 172 | Fremont, CA | — | 3,520 | 8,182 | 10,888 | 3,580 | 19,010 | 22,590 | (13,725 | ) | 1978 | Jan-96 | 3-30 | ||||||||||||||||
| Bridle Trails | 108 | Kirkland, WA | — | 1,500 | 5,930 | 5,577 | 1,531 | 11,476 | 13,007 | (7,107 | ) | 1986 | Oct-97 | 3-30 | ||||||||||||||||
| Brighton Ridge | 264 | Renton, WA | — | 2,623 | 10,800 | 4,342 | 2,656 | 15,109 | 17,765 | (9,599 | ) | 1986 | Dec-96 | 3-30 | ||||||||||||||||
| Bristol Commons | 188 | Sunnyvale, CA | — | 5,278 | 11,853 | 6,978 | 5,293 | 18,816 | 24,109 | (9,909 | ) | 1989 | Jan-97 | 3-30 | ||||||||||||||||
| 416 on Broadway | 115 | Glendale, CA | — | 8,557 | 34,235 | 1,905 | 8,557 | 36,140 | 44,697 | (6,542 | ) | 2009 | Dec-10 | 3-30 | ||||||||||||||||
| Bunker Hill | 456 | Los Angeles, CA | — | 11,498 | 27,871 | 43,175 | 11,639 | 70,905 | 82,544 | (24,680 | ) | 1968 | Mar-98 | 3-30 | ||||||||||||||||
| Camarillo Oaks | 564 | Camarillo, CA | — | 10,953 | 25,254 | 4,813 | 11,075 | 29,945 | 41,020 | (19,180 | ) | 1985 | Jul-96 | 3-30 | ||||||||||||||||
| Cambridge Park | 320 | San Diego, CA | — | 18,185 | 72,739 | 945 | 18,185 | 73,684 | 91,869 | (4,770 | ) | 1998 | Apr-14 | 5-30 | ||||||||||||||||
| Costs | ||||||||||||||||||||||||||||||
| Initial cost | capitalized | Gross amount carried at close of period | ||||||||||||||||||||||||||||
| Apartment | Buildings and | subsequent to | Land and | Buildings and | Accumulated | Date of | Date | Lives | ||||||||||||||||||||||
| Property | Homes | Location | Encumbrance | Land | improvements | acquisition | improvements | improvements | Total (1) | depreciation | construction | acquired | (years) | |||||||||||||||||
| Candlewood North | 189 | Northridge, CA | — | 7,267 | 29,068 | 1,298 | 7,267 | 30,366 | 37,633 | (1,954 | ) | 1964 | Apr-14 | 5-30 | ||||||||||||||||
| Canyon Pointe | 250 | Bothell, WA | — | 4,692 | 18,288 | 6,156 | 4,693 | 24,443 | 29,136 | (10,351 | ) | 1990 | Oct-03 | 3-30 | ||||||||||||||||
| Capri at Sunny Hills | 100 | Fullerton, CA | — | 3,337 | 13,320 | 8,354 | 4,048 | 20,963 | 25,011 | (10,424 | ) | 1961 | Sep-01 | 3-30 | ||||||||||||||||
| Carmel Landing | 356 | San Diego, CA | — | 16,725 | 66,901 | 2,694 | 16,725 | 69,595 | 86,320 | (4,478 | ) | 1989 | Apr-14 | 5-30 | ||||||||||||||||
| Carmel Summit | 246 | San Diego, CA | — | 14,968 | 59,871 | 1,076 | 14,968 | 60,947 | 75,915 | (3,887 | ) | 1989 | Apr-14 | 5-30 | ||||||||||||||||
| Castle Creek | 216 | Newcastle, WA | — | 4,149 | 16,028 | 2,644 | 4,833 | 17,988 | 22,821 | (11,526 | ) | 1988 | Dec-98 | 3-30 | ||||||||||||||||
| Catalina Gardens | 128 | Los Angeles, CA | — | 6,714 | 26,856 | 503 | 6,714 | 27,359 | 34,073 | (1,748 | ) | 1987 | Apr-14 | 5-30 | ||||||||||||||||
| CBC Apartments & The Sweeps | 239 | Goleta, CA | — | 11,841 | 45,320 | 5,525 | 11,906 | 50,780 | 62,686 | (19,106 | ) | 1962 | Jan-06 | 3-30 | ||||||||||||||||
| Cedar Terrace | 180 | Bellevue, WA | — | 5,543 | 16,442 | 5,020 | 5,652 | 21,353 | 27,005 | (8,662 | ) | 1984 | Jan-05 | 3-30 | ||||||||||||||||
| CentrePointe | 224 | San Diego, CA | — | 3,405 | 7,743 | 19,503 | 3,442 | 27,209 | 30,651 | (11,507 | ) | 1974 | Jun-97 | 3-30 | ||||||||||||||||
| Chestnut Street Apartments | 96 | Santa Cruz, CA | — | 6,582 | 15,689 | 1,262 | 6,582 | 16,951 | 23,533 | (4,527 | ) | 2002 | Jul-08 | 3-30 | ||||||||||||||||
| Collins on Pine | 76 | Seattle, WA | — | 7,276 | 22,226 | 78 | 7,276 | 22,304 | 29,580 | (1,215 | ) | 2013 | May-14 | 3-30 | ||||||||||||||||
| Corbella at Juanita Bay | 169 | Kirkland, WA | — | 5,801 | 17,415 | 2,133 | 5,801 | 19,548 | 25,349 | (3,663 | ) | 1978 | Nov-10 | 3-30 | ||||||||||||||||
| Cortesia at Rancho Santa Margarita | 308 | Rancho Santa Margarita, CA | — | 13,912 | 55,649 | 719 | 13,912 | 56,368 | 70,280 | (3,625 | ) | 1999 | Apr-14 | 5-30 | ||||||||||||||||
| Country Villas | 180 | Oceanside, CA | — | 4,174 | 16,583 | 3,332 | 4,187 | 19,902 | 24,089 | (9,274 | ) | 1976 | Dec-02 | 3-30 | ||||||||||||||||
| Deer Valley | 171 | San Rafael, CA | — | 21,478 | 50,116 | 1,023 | 21,478 | 51,139 | 72,617 | (3,329 | ) | 1996 | Apr-14 | 5-30 | ||||||||||||||||
| Delano/Bon Terra | 126 | Redmond, WA | — | 7,470 | 22,511 | 978 | 7,470 | 23,489 | 30,959 | (3,265 | ) | 2005 | Dec-11 | 3-30 | ||||||||||||||||
| Devonshire | 276 | Hemet, CA | — | 3,470 | 13,786 | 3,236 | 3,482 | 17,010 | 20,492 | (7,891 | ) | 1988 | Dec-02 | 3-30 | ||||||||||||||||
| Domain | 379 | San Diego, CA | — | 23,848 | 95,394 | 799 | 23,848 | 96,193 | 120,041 | (6,868 | ) | 2013 | Nov-13 | 3-30 | ||||||||||||||||
| Emerald Pointe | 160 | Diamond Bar, CA | — | 8,458 | 33,832 | 813 | 8,458 | 34,645 | 43,103 | (2,235 | ) | 1989 | Apr-14 | 5-30 | ||||||||||||||||
| Emerald Ridge | 180 | Bellevue, WA | — | 3,449 | 7,801 | 3,500 | 3,449 | 11,301 | 14,750 | (8,307 | ) | 1987 | Nov-94 | 3-30 | ||||||||||||||||
| Enso | 183 | San Jose, CA | — | 21,397 | 71,135 | 2 | 21,397 | 71,137 | 92,534 | (102 | ) | 2014 | Dec-15 | 3-30 | ||||||||||||||||
| Esplanade | 278 | San Jose, CA | — | 18,170 | 40,086 | 9,874 | 18,429 | 49,701 | 68,130 | (19,358 | ) | 2002 | Apr-11 | 3-30 | ||||||||||||||||
| Essex Skyline at MacArthur Place | 349 | Santa Ana, CA | — | 21,537 | 146,099 | 2,862 | 21,537 | 148,961 | 170,498 | (18,766 | ) | 2008 | Apr-12 | 3-30 | ||||||||||||||||
| Evergreen Heights | 200 | Kirkland, WA | — | 3,566 | 13,395 | 4,566 | 3,649 | 17,878 | 21,527 | (10,945 | ) | 1990 | Jun-97 | 3-30 | ||||||||||||||||
Fairways (5) | 74 | Newport Beach, CA | — | — | 7,850 | 6,731 | 9 | 14,572 | 14,581 | (7,135 | ) | 1972 | Jun-99 | 3-30 | ||||||||||||||||
| Fairwood Pond | 194 | Renton, WA | — | 5,296 | 15,564 | 2,490 | 5,297 | 18,053 | 23,350 | (7,407 | ) | 1997 | Oct-04 | 3-30 | ||||||||||||||||
| Foothill Commons | 394 | Bellevue, WA | — | 2,435 | 9,821 | 36,446 | 2,440 | 46,262 | 48,702 | (30,270 | ) | 1978 | Mar-90 | 3-30 | ||||||||||||||||
| Foothill Gardens/Twin Creeks | 176 | San Ramon, CA | — | 5,875 | 13,992 | 7,919 | 5,964 | 21,822 | 27,786 | (12,293 | ) | 1985 | Feb-97 | 3-30 | ||||||||||||||||
| Forest View | 192 | Renton, WA | — | 3,731 | 14,530 | 1,798 | 3,731 | 16,328 | 20,059 | (6,991 | ) | 1998 | Oct-03 | 3-30 | ||||||||||||||||
| Fountain Court | 320 | Seattle, WA | — | 6,702 | 27,306 | 10,209 | 6,585 | 37,632 | 44,217 | (19,053 | ) | 2000 | Mar-00 | 3-30 | ||||||||||||||||
| Costs | ||||||||||||||||||||||||||||||
| Initial cost | capitalized | Gross amount carried at close of period | ||||||||||||||||||||||||||||
| Apartment | Buildings and | subsequent to | Land and | Buildings and | Accumulated | Date of | Date | Lives | ||||||||||||||||||||||
| Property | Homes | Location | Encumbrance | Land | improvements | acquisition | improvements | improvements | Total (1) | depreciation | construction | acquired | (years) | |||||||||||||||||
| Fourth & U | 171 | Berkeley, CA | — | 8,879 | 52,351 | 2,396 | 8,879 | 54,747 | 63,626 | (11,966 | ) | 2010 | Apr-10 | 3-30 | ||||||||||||||||
| Fox Plaza | 443 | San Francisco, CA | — | 39,731 | 92,706 | 12,668 | 39,731 | 105,374 | 145,105 | (10,314 | ) | 1968 | Feb-13 | 3-30 | ||||||||||||||||
| Hillsborough Park | 235 | La Habra, CA | — | 6,291 | 15,455 | 2,182 | 6,272 | 17,656 | 23,928 | (9,602 | ) | 1999 | Sep-99 | 3-30 | ||||||||||||||||
| Hillsdale Garden | 697 | San Mateo, CA | — | 22,000 | 94,681 | 20,672 | 22,000 | 115,353 | 137,353 | (38,841 | ) | 1948 | Sep-06 | 3-30 | ||||||||||||||||
| Hope Ranch | 108 | Santa Barbara, CA | — | 4,078 | 16,877 | 2,507 | 4,208 | 19,254 | 23,462 | (5,586 | ) | 1965 | Mar-07 | 3-30 | ||||||||||||||||
| Jefferson at Hollywood | 270 | Los Angeles, CA | — | 19,054 | 89,321 | 1,182 | 19,054 | 90,503 | 109,557 | (5,745 | ) | 2010 | Apr-14 | 5-30 | ||||||||||||||||
| Joule | 295 | Seattle, WA | — | 14,558 | 69,417 | 3,614 | 14,558 | 73,031 | 87,589 | (16,387 | ) | 2010 | Mar-10 | 3-30 | ||||||||||||||||
| 1000 Kiely | 121 | Santa Clara, CA | — | 9,359 | 21,845 | 6,725 | 9,359 | 28,570 | 37,929 | (5,605 | ) | 1971 | Mar-11 | 3-30 | ||||||||||||||||
| Kings Road | 196 | Los Angeles, CA | — | 4,023 | 9,527 | 10,731 | 4,031 | 20,250 | 24,281 | (11,236 | ) | 1979 | Jun-97 | 3-30 | ||||||||||||||||
| Lafayette Highlands | 150 | Lafayette, CA | — | 17,774 | 41,473 | 410 | 17,774 | 41,883 | 59,657 | (2,716 | ) | 1973 | Apr-14 | 5-30 | ||||||||||||||||
| Lakeshore Landing | 308 | San Mateo, CA | — | 38,155 | 89,028 | 2,950 | 38,155 | 91,978 | 130,133 | (6,171 | ) | 1988 | Apr-14 | 5-30 | ||||||||||||||||
| Laurels at Mill Creek | 164 | Mill Creek, WA | — | 1,559 | 6,430 | 5,390 | 1,595 | 11,784 | 13,379 | (7,694 | ) | 1981 | Dec-96 | 3-30 | ||||||||||||||||
| Lawrence Station | 336 | Sunnyvale, CA | — | 45,532 | 106,735 | (15 | ) | 45,532 | 106,720 | 152,252 | (8,451 | ) | 2012 | Apr-14 | 5-30 | |||||||||||||||
| Le Parc Luxury Apartments | 140 | Santa Clara, CA | — | 3,090 | 7,421 | 11,118 | 3,092 | 18,537 | 21,629 | (12,351 | ) | 1975 | Feb-94 | 3-30 | ||||||||||||||||
| Marbrisa | 202 | Long Beach, CA | — | 4,700 | 18,605 | 6,526 | 4,760 | 25,071 | 29,831 | (10,771 | ) | 1987 | Sep-02 | 3-30 | ||||||||||||||||
Marina City Club (6) | 101 | Marina Del Rey, CA | — | — | 28,167 | 40,352 | — | 68,519 | 68,519 | (17,674 | ) | 1971 | Jan-04 | 3-30 | ||||||||||||||||
Marina Cove (7) | 292 | Santa Clara, CA | — | 5,320 | 16,431 | 12,560 | 5,324 | 28,987 | 34,311 | (18,435 | ) | 1974 | Jun-94 | 3-30 | ||||||||||||||||
| Mariner's Place | 105 | Oxnard, CA | — | 1,555 | 6,103 | 2,150 | 1,562 | 8,246 | 9,808 | (4,584 | ) | 1987 | May-00 | 3-30 | ||||||||||||||||
| MB 360 Phase I | 188 | San Francisco, CA | — | 21,421 | 114,376 | — | 21,421 | 114,376 | 135,797 | (3,749 | ) | 2014 | Apr-14 | 3-30 | ||||||||||||||||
| Meadowood | 320 | Simi Valley, CA | — | 7,852 | 18,592 | 7,060 | 7,898 | 25,606 | 33,504 | (16,003 | ) | 1986 | Nov-96 | 3-30 | ||||||||||||||||
| Mesa Village | 133 | Clairemont, CA | — | 1,888 | 7,498 | 1,250 | 1,894 | 8,742 | 10,636 | (3,967 | ) | 1963 | Dec-02 | 3-30 | ||||||||||||||||
| Mira Monte | 355 | Mira Mesa, CA | — | 7,165 | 28,459 | 9,237 | 7,186 | 37,675 | 44,861 | (19,094 | ) | 1982 | Dec-02 | 3-30 | ||||||||||||||||
| Miracle Mile/Marbella | 236 | Los Angeles, CA | — | 7,791 | 23,075 | 13,484 | 7,886 | 36,464 | 44,350 | (20,985 | ) | 1988 | Aug-97 | 3-30 | ||||||||||||||||
| Mission Hills | 282 | Oceanside, CA | — | 10,099 | 38,778 | 4,996 | 10,167 | 43,706 | 53,873 | (16,771 | ) | 1984 | Jul-05 | 3-30 | ||||||||||||||||
| Mission Peaks | 453 | Fremont, CA | — | 46,499 | 108,498 | 1,181 | 46,499 | 109,679 | 156,178 | (7,087 | ) | 1995 | Apr-14 | 5-30 | ||||||||||||||||
| Mission Peaks II | 336 | Fremont, CA | — | 31,429 | 73,334 | 2,011 | 31,429 | 75,345 | 106,774 | (4,860 | ) | 1989 | Apr-14 | 5-30 | ||||||||||||||||
| Monterey Villas | 122 | Oxnard, CA | — | 2,349 | 5,579 | 5,880 | 2,424 | 11,384 | 13,808 | (6,284 | ) | 1974 | Jul-97 | 3-30 | ||||||||||||||||
| Muse | 152 | Los Angeles, CA | — | 7,822 | 33,436 | 2,168 | 7,823 | 35,603 | 43,426 | (8,563 | ) | 2011 | Feb-11 | 3-30 | ||||||||||||||||
| Museum Park | 117 | San Jose, CA | — | 13,864 | 32,348 | 476 | 13,864 | 32,824 | 46,688 | (2,145 | ) | 2002 | Apr-14 | 5-30 | ||||||||||||||||
| Paragon | 301 | Fremont, CA | — | 32,230 | 77,320 | 328 | 32,230 | 77,648 | 109,878 | (3,782 | ) | 2013 | Jul-14 | 3-30 | ||||||||||||||||
| Park Catalina | 90 | Los Angeles, CA | — | 4,710 | 18,839 | 2,281 | 4,710 | 21,120 | 25,830 | (2,730 | ) | 2002 | Jun-12 | 3-30 | ||||||||||||||||
| Park Viridian | 320 | Anaheim, CA | — | 15,894 | 63,574 | 1,116 | 15,894 | 64,690 | 80,584 | (4,137 | ) | 2008 | Apr-14 | 5-30 | ||||||||||||||||
| Costs | ||||||||||||||||||||||||||||||
| Initial cost | capitalized | Gross amount carried at close of period | ||||||||||||||||||||||||||||
| Apartment | Buildings and | subsequent to | Land and | Buildings and | Accumulated | Date of | Date | Lives | ||||||||||||||||||||||
| Property | Homes | Location | Encumbrance | Land | improvements | acquisition | improvements | improvements | Total (1) | depreciation | construction | acquired | (years) | |||||||||||||||||
| Park West | 126 | San Francisco, CA | — | 9,424 | 21,988 | 9,472 | 9,424 | 31,460 | 40,884 | (3,667 | ) | 1958 | Sep-12 | 3-30 | ||||||||||||||||
| Parkwood at Mill Creek | 240 | Mill Creek, WA | — | 10,680 | 42,722 | 1,517 | 10,680 | 44,239 | 54,919 | (2,875 | ) | 1989 | Apr-14 | 5-30 | ||||||||||||||||
Pinehurst (8) | 28 | Ventura, CA | — | — | 1,711 | 482 | 6 | 2,187 | 2,193 | (1,049 | ) | 1973 | Dec-04 | 3-30 | ||||||||||||||||
| Pinnacle Crow Canyon | 400 | San Ramon, CA | — | 37,579 | 87,685 | 1,717 | 37,579 | 89,402 | 126,981 | (5,791 | ) | 1992 | Apr-14 | 5-30 | ||||||||||||||||
| Pinnacle Sonata | 268 | Bothell, WA | — | 14,647 | 58,586 | 564 | 14,647 | 59,150 | 73,797 | (3,807 | ) | 2000 | Apr-14 | 5-30 | ||||||||||||||||
| Radius | 264 | Redwood City, CA | — | 11,702 | 152,336 | 28 | 11,702 | 152,364 | 164,066 | (7,622 | ) | 2015 | Apr-14 | 3-30 | ||||||||||||||||
| Reed Square | 100 | Sunnyvale, CA | — | 6,873 | 16,037 | 7,750 | 6,873 | 23,787 | 30,660 | (4,356 | ) | 1970 | Jan-12 | 3-30 | ||||||||||||||||
| Regency at Encino | 75 | Encino, CA | — | 3,184 | 12,737 | 2,519 | 3,184 | 15,256 | 18,440 | (3,896 | ) | 1989 | Dec-09 | 3-30 | ||||||||||||||||
| Renaissance at Uptown Orange | 460 | Orange, CA | — | 27,870 | 111,482 | 1,600 | 27,870 | 113,082 | 140,952 | (7,246 | ) | 2007 | Apr-14 | 5-30 | ||||||||||||||||
| Reveal | 438 | Woodlands Hills, CA | — | 25,073 | 121,314 | 232 | 25,073 | 121,546 | 146,619 | (3,334 | ) | 2010 | Apr-15 | 3-30 | ||||||||||||||||
| Salmon Run at Perry Creek | 132 | Bothell, WA | — | 3,717 | 11,483 | 1,624 | 3,801 | 13,023 | 16,824 | (6,577 | ) | 2000 | Oct-00 | 3-30 | ||||||||||||||||
| Sammamish View | 153 | Bellevue, WA | — | 3,324 | 7,501 | 6,192 | 3,331 | 13,686 | 17,017 | (10,310 | ) | 1986 | Nov-94 | 3-30 | ||||||||||||||||
| 101 San Fernando | 323 | San Jose, CA | — | 4,173 | 58,961 | 8,048 | 4,173 | 67,009 | 71,182 | (13,787 | ) | 2001 | Jul-10 | 3-30 | ||||||||||||||||
| San Marcos | 432 | Richmond, CA | — | 15,563 | 36,204 | 27,780 | 22,866 | 56,681 | 79,547 | (23,786 | ) | 2003 | Nov-03 | 3-30 | ||||||||||||||||
| Santee Court/Santee Village | 238 | Los Angeles, CA | — | 9,581 | 40,317 | 4,524 | 9,582 | 44,840 | 54,422 | (8,616 | ) | 2004 | Oct-10 | 3-30 | ||||||||||||||||
| Shadow Point | 172 | Spring Valley, CA | — | 2,812 | 11,170 | 2,406 | 2,820 | 13,568 | 16,388 | (6,197 | ) | 1983 | Dec-02 | 3-30 | ||||||||||||||||
| Shadowbrook | 418 | Redmond, WA | — | 19,292 | 77,168 | 2,326 | 19,292 | 79,494 | 98,786 | (5,082 | ) | 1986 | Apr-14 | 5-30 | ||||||||||||||||
| Slater 116 | 108 | Kirkland, WA | — | 7,379 | 22,138 | 513 | 7,379 | 22,651 | 30,030 | (1,793 | ) | 2013 | Sep-13 | 3-30 | ||||||||||||||||
| Solstice | 280 | Sunnyvale, CA | — | 34,444 | 147,262 | 4,096 | 34,444 | 151,358 | 185,802 | (11,281 | ) | 2014 | Apr-14 | 5-30 | ||||||||||||||||
| Stonehedge Village | 196 | Bothell, WA | — | 3,167 | 12,603 | 5,739 | 3,201 | 18,308 | 21,509 | (11,102 | ) | 1986 | Oct-97 | 3-30 | ||||||||||||||||
| Summit Park | 300 | San Diego, CA | — | 5,959 | 23,670 | 4,773 | 5,977 | 28,425 | 34,402 | (13,134 | ) | 1972 | Dec-02 | 3-30 | ||||||||||||||||
| Taylor 28 | 197 | Seattle, WA | — | 13,915 | 57,700 | 218 | 13,915 | 57,918 | 71,833 | (3,686 | ) | 2008 | Apr-14 | 5-30 | ||||||||||||||||
| The Cairns | 100 | Seattle, WA | — | 6,937 | 20,679 | 1,055 | 6,939 | 21,732 | 28,671 | (6,340 | ) | 2006 | Jun-07 | 3-30 | ||||||||||||||||
| The Commons | 264 | Campbell, CA | — | 12,555 | 29,307 | 4,687 | 12,556 | 33,993 | 46,549 | (7,457 | ) | 1973 | Jul-10 | 3-30 | ||||||||||||||||
| The Grand | 243 | Oakland, CA | — | 4,531 | 89,208 | 5,072 | 4,531 | 94,280 | 98,811 | (24,391 | ) | 2009 | Jan-09 | 3-30 | ||||||||||||||||
| The Hallie on del Mar/Rey/Sol | 292 | Pasadena, CA | — | 2,202 | 4,794 | 48,986 | 8,385 | 47,597 | 55,982 | (17,675 | ) | 1972 | Apr-99 | 3-30 | ||||||||||||||||
| The Lofts at Pinehurst | 118 | Sunnyvale, CA | — | 1,570 | 3,912 | 4,544 | 1,618 | 8,408 | 10,026 | (4,565 | ) | 2012 | Apr-14 | 3-30 | ||||||||||||||||
| The Pointe at Cupertino | 116 | Cupertino, CA | — | 4,505 | 17,605 | 11,510 | 4,505 | 29,115 | 33,620 | (11,984 | ) | 1963 | Aug-98 | 3-30 | ||||||||||||||||
| The Stuart at Sierra Madre | 188 | Pasadena, CA | — | 13,574 | 54,298 | 1,486 | 13,574 | 55,784 | 69,358 | (3,674 | ) | 2007 | Apr-14 | 5-30 | ||||||||||||||||
| The Trails of Redmond | 423 | Redmond, WA | — | 21,930 | 87,720 | 2,408 | 21,930 | 90,128 | 112,058 | (5,779 | ) | 1985 | Apr-14 | 5-30 | ||||||||||||||||
| Tiffany Court | 101 | Los Angeles, CA | — | 6,949 | 27,796 | 461 | 6,949 | 28,257 | 35,206 | (1,811 | ) | 1987 | Apr-14 | 5-30 | ||||||||||||||||
| Trabuco Villas | 132 | Lake Forest, CA | — | 3,638 | 8,640 | 2,605 | 3,890 | 10,993 | 14,883 | (6,549 | ) | 1985 | Oct-97 | 3-30 | ||||||||||||||||
| Costs | ||||||||||||||||||||||||||||||
| Initial cost | capitalized | Gross amount carried at close of period | ||||||||||||||||||||||||||||
| Apartment | Buildings and | subsequent to | Land and | Buildings and | Accumulated | Date of | Date | Lives | ||||||||||||||||||||||
| Property | Homes | Location | Encumbrance | Land | improvements | acquisition | improvements | improvements | Total (1) | depreciation | construction | acquired | (years) | |||||||||||||||||
| Tuscana | 30 | Tracy, CA | — | 2,828 | 6,599 | 166 | 2,870 | 6,723 | 9,593 | (2,668 | ) | 2007 | Feb-07 | 3-30 | ||||||||||||||||
| Via | 284 | Sunnyvale, CA | — | 22,000 | 82,270 | 944 | 22,016 | 83,198 | 105,214 | (15,571 | ) | 2011 | Jul-11 | 3-30 | ||||||||||||||||
| Villa Siena | 272 | Costa Mesa, CA | — | 13,842 | 55,367 | 1,333 | 13,842 | 56,700 | 70,542 | (3,632 | ) | 1974 | Apr-14 | 5-30 | ||||||||||||||||
| Village Green | 272 | La Habra, CA | — | 6,488 | 36,768 | 2,168 | 6,488 | 38,936 | 45,424 | (2,491 | ) | 1971 | Apr-14 | 5-30 | ||||||||||||||||
| Vista Belvedere | 76 | Tiburon, CA | — | 5,573 | 11,901 | 7,360 | 5,573 | 19,261 | 24,834 | (7,708 | ) | 1963 | Aug-04 | 3-30 | ||||||||||||||||
| Vox | 58 | Seattle, WA | — | 5,545 | 16,635 | 70 | 5,545 | 16,705 | 22,250 | (1,237 | ) | 2013 | Oct-13 | 3-30 | ||||||||||||||||
| Walnut Heights | 163 | Walnut, CA | — | 4,858 | 19,168 | 3,920 | 4,887 | 23,059 | 27,946 | (9,514 | ) | 1964 | Oct-03 | 3-30 | ||||||||||||||||
| Wharfside Pointe | 155 | Seattle, WA | — | 2,245 | 7,020 | 10,292 | 2,258 | 17,299 | 19,557 | (10,007 | ) | 1990 | Jun-94 | 3-30 | ||||||||||||||||
| Willow Lake | 508 | San Jose, CA | — | 43,194 | 101,030 | 6,615 | 43,194 | 107,645 | 150,839 | (12,559 | ) | 1989 | Oct-12 | 3-30 | ||||||||||||||||
| 5600 Wilshire | 284 | Los Angeles, CA | — | 30,535 | 91,604 | 471 | 30,535 | 92,075 | 122,610 | (5,937 | ) | 2008 | Apr-14 | 5-30 | ||||||||||||||||
| Wilshire La Brea | 478 | Los Angeles, CA | — | 56,932 | 211,998 | 6,259 | 56,932 | 218,257 | 275,189 | (16,228 | ) | 2014 | Apr-14 | 5-30 | ||||||||||||||||
| Windsor Ridge | 216 | Sunnyvale, CA | — | 4,017 | 10,315 | 15,210 | 4,021 | 25,521 | 29,542 | (15,505 | ) | 1989 | Mar-89 | 3-30 | ||||||||||||||||
| Woodland Commons | 302 | Bellevue, WA | — | 2,040 | 8,727 | 20,544 | 2,044 | 29,267 | 31,311 | (14,679 | ) | 1978 | Mar-90 | 3-30 | ||||||||||||||||
| Woodside Village | 145 | Ventura, CA | — | 5,331 | 21,036 | 3,502 | 5,341 | 24,528 | 29,869 | (9,667 | ) | 1987 | Dec-04 | 3-30 | ||||||||||||||||
| 31,451 | $ | — | $ | 1,667,597 | $ | 5,970,356 | $ | 754,076 | $ | 1,691,213 | $ | 6,700,816 | $ | 8,392,029 | $ | (1,177,395 | ) | |||||||||||||
| Costs | ||||||||||||||||||||||||||||||
| Initial cost | capitalized | Gross amount carried at close of period | ||||||||||||||||||||||||||||
| Square | Buildings and | subsequent | Land and | Buildings and | Accumulated | Date of | Date | Lives | ||||||||||||||||||||||
| Property | Footage | Location | Encumbrance | Land | improvements | to acquisition | improvements | improvements | Total(1) | depreciation | construction | acquired | (years) | |||||||||||||||||
| Other real estate assets | ||||||||||||||||||||||||||||||
| Hollywood | 34,000 | Los Angeles, CA | $ | — | $ | 10,200 | $ | 13,800 | $ | 2,470 | $ | 10,200 | $ | 16,270 | $ | 26,470 | $ | (5,777 | ) | 1938 | Jul-06 | 3-30 | ||||||||
| Santa Clara Retail | 138,915 | Santa Clara, CA | — | 6,472 | 11,704 | 5,556 | 6,472 | 17,260 | 23,732 | (4,643 | ) | 1970 | Sep-11 | 3-30 | ||||||||||||||||
| Derian Office Building | 106,564 | Irvine, CA | — | 3,079 | 12,315 | 4,049 | 4,308 | 15,135 | 19,443 | (11,162 | ) | 1983 | Jul-00 | 3-30 | ||||||||||||||||
| 279,479 | $ | — | $ | 19,751 | $ | 37,819 | $ | 12,075 | $ | 20,980 | $ | 48,665 | $ | 69,645 | $ | (21,582 | ) | |||||||||||||
| Total | $ | 2,215,077 | $ | 2,484,492 | $ | 8,598,162 | $ | 1,248,815 | $ | 2,522,842 | $ | 9,808,627 | $ | 12,331,469 | $ | (1,949,892 | ) | |||||||||||||
| 2015 | 2014 | 2013 | 2015 | 2014 | 2013 | ||||||||||||||||||
| Rental properties: | Accumulated depreciation: | ||||||||||||||||||||||
| Balance at beginning of year | $ | 11,244,681 | $ | 5,443,757 | $ | 5,033,672 | Balance at beginning of year | $ | 1,564,806 | $ | 1,254,886 | $ | 1,081,517 | ||||||||||
| Improvements | 220,895 | 135,812 | 92,016 | Depreciation expense - Acquisitions | 15,734 | 121,426 | 6,203 | ||||||||||||||||
| Acquisition of real estate (1) | 805,124 | 5,678,054 | 344,476 | Depreciation expense - Discontinued operations | — | — | 12,290 | ||||||||||||||||
| Development of real estate | 307,083 | 19,751 | 14,111 | Depreciation expense - Rental properties | 386,953 | 199,495 | 168,092 | ||||||||||||||||
| Disposition of real estate | (246,314 | ) | (32,693 | ) | (40,518 | ) | Dispositions | (17,601 | ) | (11,001 | ) | (13,216 | ) | ||||||||||
| Balance at the end of year | $ | 12,331,469 | $ | 11,244,681 | $ | 5,443,757 | Balance at the end of year | $ | 1,949,892 | $ | 1,564,806 | $ | 1,254,886 | ||||||||||
ESSEX PROPERTY TRUST, INC. | |
| By: /S/ | |
Executive Vice President, Chief Financial Officer (Authorized Officer, Principal Financial Officer) | |
| By: /S/ JOHN FARIAS | |
| Group Vice President, Chief Accounting Officer | |
ESSEX PORTFOLIO, L.P. By: Essex Property Trust, Inc., its general partner | |
| By: /S/ ANGELA L. KLEIMAN | |
| Angela L. Kleiman | |
| Executive Vice President, Chief Financial Officer (Authorized Officer, Principal Financial Officer) | |
| By: /S/ JOHN FARIAS | |
| John Farias | |
| Group Vice President, Chief Accounting Officer | |