UNITED STATES
SECURITIES AND EXCHANGE COMMISSION
Washington, D.C. 20549
UNITED STATES
SECURITIES AND EXCHANGE COMMISSION
Washington, D.C. 20549
FORM 10-K
(Mark One) | |
ý | ANNUAL REPORT PURSUANT TO SECTION 13 OR 15(d) OF THE SECURITIES EXCHANGE ACT OF 1934 |
For the fiscal year ended December 31, 2006 2008 |
OR |
o | TRANSITION REPORT PURSUANT TO SECTION 13 OR 15(d) OF THE SECURITIES EXCHANGE ACT OF 1934 |
For the transition period from ____________to_________________ |
Commission file Number: 0-24249
PDI, Inc. |
| (Exact name of registrant as specified in its charter) |
| | | |
Delaware | | 22-2919486 |
(State or other jurisdiction of incorporation or organization) | | (I.R.S. Employer Identification No.) |
| |
Saddle River Executive Centre 1 State Route 17 South, Saddle River, NJ 07458 |
| (Address of principal executive offices and zip code) |
| |
(201) 258-8450 |
| (Registrant's telephone number, including area code) |
Securities registered pursuant to Section 12(b) of the Act: |
Title of each class Common Stock, par value $0.01 per share | The Nasdaq Stock Market LLC |
(Title of each class) | (Name of each exchange on which registered)registered The Nasdaq Stock Market LLC |
| |
| Securities registered pursuant to Section 12(g) of the Act: None |
Indicate by checkmark if the registrant is a well-known seasoned issuer, as defined in Rule 405 of the Securities Act. Yes o No ý
Indicate by checkmark if the registrant is not required to file reports pursuant to Section 13 or Section 15(d) of the Act. Yes o No ý
Indicate by checkmark whether the registrant (1) has filed all reports required to be filed by Section 13 or 15 (d) of the Securities Exchange Act of 1934 during the preceding 12 months (or for such shorter period that the registrant was required to file such reports), and (2) has been subject to such filing requirements for the past 90 days. Yes ý No o
Indicate by checkmark if disclosure of delinquent filers pursuant to Item 405 of Regulation S-K is not contained herein, and will not be contained, to the best of registrant's knowledge, in definitive proxy or information statements incorporated by reference in Part III of this Form 10-K or any amendment to this Form 10-K. ýo
Indicate by check mark whether the registrant is a large accelerated filer, an accelerated filer, or a non-accelerated filer, or a smaller reporting company. See definitiondefinitions of “large accelerated filer,” “accelerated filer,” and large accelerated filer”“smaller reporting company” in rule 12b-2 of the Exchange Act. (check one):
| | | |
Large accelerated filer o | Accelerated filer oý | Non-accelerated filer ý | Smaller reporting company o |
| | | (Do not check if a smaller reporting company) | |
Indicate by check mark whether the registrant is a shell company (as defined in Rule 12b-2 of the Act). Yes o No ý
The aggregate market value of the registrant's common stock, $0.01 par value per share, held by non-affiliates of the registrant on June 30, 2006,2008, the last business day of the registrant's most recently completed second fiscal quarter, was $64,957,237$63,438,954 (based on the closing sales price of the registrant's common stock on that date). Shares of the registrant's common stock held by each officer and director and each person who owns 5%10% or more of the outstanding common stock of the registrant have been excluded in that such persons may be deemed to be affiliates. This determination of affiliate status is not necessarily a conclusive determination for other purposes.
As of March 6, 2007, 14,078,970February 27, 2009, 14,221,802 shares of the registrant's common stock, $0.01 par value per share, were issued and outstanding.
DOCUMENTS INCORPORATED BY REFERENCE
Portions of the Proxy Statement for the 20072009 Annual Meeting of Stockholders (the Proxy Statement), to be filed within 120 days of the end of the fiscal year ended December 31, 2006,2008, are incorporated by reference in Part III hereof. Except with respect to information specifically incorporated by reference in this Annual Report on Form 10-K (the Form 10-K), the Proxy Statement is not deemed to be filed as part hereof.
PDI, INC.Inc.
Annual Report on Form 10-K
| | | | Page |
| PART I | | |
| | Item 1. | Business | 5 |
| | Item 1A. | Risk Factors | 910 |
| | Item 1B. | Unresolved Staff Comments | 1417 |
| | Item 2. | Properties | 1417 |
| | Item 3. | Legal Proceedings | 1417 |
| | Item 4. | Submission of Matters to a Vote of Security Holders | 1618 |
| | | |
| PART II | | |
| | Item 5. | Market for our Common Equity, Related Stockholder Matters and Issuer Purchases of Equity Securities | 1718 |
| | Item 6. | Selected Financial Data | 1820 |
| | Item 7. | Management’s Discussion and Analysis of Financial Condition and Results of Operations | 2021 |
| | Item 7A. | Quantitative and Qualitative Disclosures about Market Risk | 3837 |
| | Item 8. | Financial Statements and Supplementary Data | 3937 |
| | Item 9. | Changes in and Disagreements with Accountants on Accounting and Financial Disclosures | 3937 |
| | Item 9A. | Controls and Procedures | 3937 |
| | Item 9B. | Other Information | 4039 |
| | | |
| PART III | | |
| | Item 10. | Directors, Executive Officers and Corporate Governance | 4139 |
| | Item 11. | Executive Compensation | 4139 |
| | Item 12. | Security Ownership of Certain Beneficial Owners and Management and Related Stockholder Matters | 4139 |
| | Item 13. | Certain Relationships and Related Transactions, and Director Independence | 4139 |
| | Item 14. | Principal Accounting Fees and Services | 4139 |
| | | |
| PART IV | | |
| | Item 15. | Exhibits, and Financial Statement Schedules | 4240 |
| | | | |
| Signatures | 4442 |
PDI, INC.Inc.
Annual Report on Form 10-K
FORWARD LOOKING STATEMENT INFORMATION
| FORWARD LOOKING STATEMENT INFORMATION |
This Form 10-K contains “forward-looking statements” within the meaning of Section 27A of the Securities Act of 1933, as amended (the Securities Act) and Section 21E of the Securities Exchange Act of 1934 (the Exchange Act). Statements that are not historical facts, including statements about our plans, objectives, beliefs and expectations, are forward-looking statements. Forward-looking statements include statements preceded by, followed by or that include the words “believes,” “expects,” “anticipates,” “plans,” “estimates,” “intends,” “projects,” “should,” “may,” “will” or similar words and expressions. These forward-looking statements are contained throughout this Form 10-K, including, but not limited to, statements found in Part I -– Item 1 -– “Business,” Part II -– Item 5 -– “Market for our Common Equity, Related Stockholder Matters and Issuer Purchases of Securities,” Part II -– Item 7 -– “Management’s Discussion and Analysis of Financial Condition and Results of Operation” and “Part II -– Item 7A -– “Quantitative and Qualitative Disclosures About Market Risk”.
Forward-looking statements are only predictions and are not guarantees of future performance. These statements are based on current expectations and assumptions involving judgments about, among other things, future economic, competitive and market conditions and future business decisions, all of which are difficult or impossible to predict accurately and many of which are beyond our control. These statements also involve known and unknown risks, uncertainties and other factors that may cause our actual results to be materially different from those expressed or implied by any forward-looking statement. Many of these factors are beyond our ability to control or predict. Such factors include, but are not limited to, the following:
| | · | The effects of the current worldwide economic and financial crisis; |
| · | Changes in outsourcing trends andor a reduction in promotional, marketing and sales expenditures in the pharmaceutical, biotechnology and life sciences industries; |
| | · | LossEarly termination of a significant services contract or the loss of one or more of our significant customers or a material reduction in service revenues from such customers; |
| · | Our ability to obtain additional funds in order to implement our business model; |
| | · | Senior management’sOur ability to successfully implementidentify, complete and integrate any future acquisitions and the effects of any such acquisitions on our updated long-term strategic plan;ongoing business; |
| · | Our ability to meet performance goals in incentive-based arrangements with customers; |
| | · | Competition in our industry; |
| | · | TheOur ability to attract and retain qualified sales representatives and other key employees and management personnel; |
| | · | Product liability claims against us; and |
| | · | Our,Changes in laws and healthcare regulations applicable to our industry or our, or our customers’, failure to comply with applicablesuch laws and healthcare regulations.regulations; |
| · | The sufficiency of our insurance and self-insurance reserves to cover future liabilities; |
| · | Our ability to successfully develop and generate sufficient revenue from product commercialization opportunities; |
| · | Our ability to increase our revenues and successfully manage the size of our operations; |
| · | Volatility of our stock price and fluctuations in our quarterly revenues and earnings; |
| · | Failure of, or significant interruption to, the operation of our information technology and communication systems; and |
| · | The results of any future impairment testing for goodwill and other intangible assets. |
Please see Part I -– Item 1A -– “Risk Factors” of this Form 10-K, as well as other documents we file with the United States Securities and Exchange Commission (SEC) from time to time, for other important factors that could cause our actual results to differ materially from our current expectations and from the forward-looking statements discussed in this Form 10-K. Because of these and other risks, uncertainties and assumptions, you should not place undue reliance on these forward-looking statements. In addition, these statements speak only as of the date of the report in which they are set forth and, except as may be required by law, we undertake no obligation to revise or update publicly any forward-looking statements for any reason.
PDI, Inc.
Annual Report on Form 10-K (continued)
PART I
We are a diversified sales and marketing services company serving the biopharmaceutical and life sciences industries. In addition, we develop and execute continuing medical education activities to help pharmaceutical manufacturers meet their strategic educational goals. We commenced operations as aleading provider of contract sales organization (CSO) in 1987 and we completed our initial publicteams to pharmaceutical companies, offering in May 1998.
We create and executea range of sales and marketing programs for our customers with the goal of demonstrating our abilitysupport services designed to add value toachieve their products and maximize their sales performance. We have a variety of agreement types that we enter into with our customers.In these agreements, we leverage our experience in sales, peer persuasion programs, medical education and marketing research to help our customers meet strategic and financial product objectives.
In addition to contract sales teams, we also provide marketing research and promotional physician interaction program services. Our services offer customers a range of promotional options for the commercialization of their products throughout their lifecycles, from development through maturity. We have assembledprovide innovative and flexible service offerings designed to drive our commercial capabilities through organic growth, acquisitionscustomers’ businesses forward and internal expansion.successfully respond to a continually changing market. Our portfolio of services enables us to provide a wide rangevital link between our customers and the medical community through the communication of marketingproduct information to physicians and promotional options that can benefit many different products throughoutother healthcare professionals for use in the various stagescare of their life cycles.
It is important for us to form strong relationships with companies within the biopharmaceutical and life sciences industries. Our focus is to achieve operational excellence that delivers the desired product sales results.patients.
We are among the leaders in outsourced pharmaceutical sales and marketing services in the U.S.United States. We have evolved our commercial capabilities through innovation, organic growth and acquisitions. We have designed and implemented programs for many of the majorlarge pharmaceutical companies serving the U.S. market as well as manya variety of emerging and specialty pharmaceutical companies. OurWe recognize that our relationships with customers are built ondependent upon the quality of our performance, and program results delivered.our focus is to flawlessly execute our customers’ programs in order to consistently deliver their desired results.
OurTypically, our customers engage us on a contractual basis to design and implement promotional programs for both prescription and over-the-counter products. The programs are designed to increase product sales and are tailored to meet the specific needs of the product and the customer. These services are provided predominantly on a fee for servicefee-for-service basis. These contracts can include incentive payments that can be earned if our activities generate results that meet or exceed performance targets. Contracts may generally be terminated with or without cause by our customers. Certain contracts provide that we may incur specific penalties if we fail to meet stated performance benchmarks.
Corporate Strategy
Our current service offerings includeWe commenced operations as a contract sales services, peer persuasion programs, medical education (CME)organization (CSO) in 1987 and market research. In October 2006,we completed our board of directors approved an updated long-term strategic plan developed by senior managementinitial public offering in consultation with a leading strategy consultant. That plan provides for us to:May 1998. Our executive offices are located at Saddle River Executive Centre, 1 State Route 17 South, Saddle River, New Jersey 07458 and our telephone number is (800) 242-7494.
In 2007 we announced the implementation of a strategic plan, which was further refined in early 2008 to include the following primary components:
| · | becomeRecapture PDI’s position as the leading contract sales organization |
| · | Enhance our commercialization capabilities in order to provide a leading providerbroader base of commercialization services to the biopharmaceutical and life sciences industries;more diversified sources of revenue and, |
| · | regain leadership inLeverage our contract sales business.and marketing expertise to capitalize on product commercialization opportunities |
Reporting SegmentsIn November 2008, Ms. Nancy Lurker joined PDI as our new chief executive officer and Operating Groupsmember of the Board of Directors with the full commitment of establishing PDI as the best in class contract sales organization in the United States. Under Ms. Lurker’s leadership, we have intensified our focus on strengthening all aspects of the core CSO business that we believe will most favorably position PDI as the best in class contract sales organization in the United States.
In addition to concentrating our efforts on strengthening our core CSO business, we also continue to focus on enhancing our commercialization capabilities by aggressively promoting and broadening the depth of the value-added service offerings of our existing marketing services businesses, TVG Marketing Research & Consulting and Pharmakon. However, in light of current market conditions, we are not currently seeking to make acquisitions of other commercialization service businesses.
As part of our product commercialization strategic initiative, we announced in April 2008 that we had entered into our first promotional arrangement. However, as we re-evaluate this component of our strategy, we are not actively pursuing any additional product commercialization opportunities at this time although we may continue to evaluate potential opportunities for similar types of promotional arrangements on a very selective and opportunistic basis to the extent we are able to mitigate certain risks relating to the investment of our resources.
PDI, Inc.
Annual Report on Form 10-K (continued)
| Reporting Segments and Operating Groups |
For 2006,2008, we reported under the following three segments: Sales Services,Services; Marketing ServicesServices; and PDI Products Group (PPG).Product Commercialization. For details on revenue, operating results and total assets by segment see Note 20 to the consolidated financial statements included in this Form 10-K.
Sales Services
This segment, which focuses primarily on product detailing, includes our Performance Sales Teams and Select Accessä’ Teams (formerly referred to as Shared Teams). Teams. This segment which focuses on product detailing, represented 84.7%79% of our consolidated revenue for the year ended December 31, 2006.
2008. Product detailing involves a sales representative meeting face-to-face with targeted physicians and other healthcare decision makers to provide a technical review of the product being promoted. Contract sales teams can be deployed on either a dedicated or shared basis. This segment also includes a portfolio of expanded sales services known as “PDI ON DEMAND”, which includes talent acquisition services, pulsing teams and vacancy coverage services. Our talent acquisition platform provides pharmaceutical customers with an outsourced, stand-alone sales force recruiting and on-boarding service. Pulsing teams provide temporary full or flex-time sales teams of any size anywhere in the United States that are designed to help our customers increase brand impact during key market cycles or rapidly respond to regional opportunities. Our vacancy coverage service provides customers with outsourced temporary full or flex-time sales representatives to fill temporary territory vacancies created by leaves of absence within our customers’ internal sales forces, which allows our customers to maintain continuity of services. From time to time, we also provide sales teams to market and promote the products and/or services of customers outside of the pharmaceutical and life sciences industries.
PDI, Inc.
Annual Report on Form 10-K (continued)
Performance Sales Teams (formerly Dedicated Teams)
A performance contract sales teamPerformance Sales Team works exclusively on behalf of one customer. The sales team is customized to meet the customer’s specifications of the team’s customer with respect to sales representative profile, physician targeting, product training, incentive compensation plans, integration with the customers’ in-house sales forces, call reporting platform and data integration. Without adding permanent personnel, the customer gets aour customers receive high quality, industry-standard sales teamteams comparable to itstheir internal sales force.
Select Access’
Select Access represents a shared sales team business model where multiple non-competing brands are represented for different pharmaceutical companies. Using these teams, we make a face-to-face selling resource available to those customers thatwho want an alternative to a dedicated team. PDI Select Access isWe are a leading provider of thesethis type of detailing programsprogram in the U.S.United States. Since costs are shared among various companies, these programs may be less expensive for the customer than programs involving a dedicated sales force. With a shared sales team, the customer still receivesour customers receive targeted coverage of its physician audience within the representatives’ geographic territories.
Marketing Services
This segment, which includes our Pharmakon, TVG Marketing Research & Consulting (TVG) and Vital Issues in Medicine business units, represented 15.3%21% of consolidated revenue for the year ended December 31, 2006.2008.
Pharmakon
Pharmakon’s emphasisbusiness is focused on the creation, design and implementation of promotional peer interactive peer persuasion programs.programming targeted to healthcare professionals. Each marketing program can be offereddelivered through a number of different venues, includingincluding; teleconferences, dinner meetings, “lunchwebcasts, satellite and learns,” and web casts.other alternative media. Within each of our programs, we offer a number of services including strategic design, tactical execution, technology support, audience recruitment,generation, moderator services and thought leader management. In the last ten years, Pharmakon has conducted over 45,000 peer persuasioninteractive programs with more than 550,000 participants. Pharmakon’s peer programs can be designed as promotional or marketing research/advisory programs. In addition to our peer persuasioninteractive programs, Pharmakon also provides promotional communications activities. We acquired Pharmakon in August 2004.
TVG Marketing Research & Consultingactivities, thought leader training and content development.
TVG Marketing Research & Consulting (TVG)
TVG employs leading edge, and in some instances proprietary, research methodologies. Wemethodologies to provide qualitative and quantitative marketing research to pharmaceutical companies with respect to healthcare providers, patients and managed care customers in the U.S. and globally.worldwide. We offer a full range of pharmaceutical marketing research services, including studies designed to identify the highest impact business strategy, profile, positioning, message, execution, implementation and post implementation for a product. OurWe believe our marketing research model improves theour customers’ knowledge customers obtain about how physicians and other healthcare professionals will likely react to products.
PDI, Inc.
Annual Report on Form 10-K (continued)
We utilize a systematic approach to pharmaceutical marketing research. Recognizing that every marketing need, and therefore every marketing research solution, is unique, we have developed our marketing model to help identify the work that needs to be done in order to identify critical paths to marketing goals. At each step of the marketing model, we can offer proven research techniques, proprietary methodologies and customized study designs to address specific product needs.
Vital Issues in Medicine
Our Vital Issues in Medicine (VIM®) business unit (VIM) developsdeveloped and executesexecuted continuing medical education services funded by the biopharmaceutical and medical device and diagnostics industries. Using an expert-driven, customized approach,We are currently in the process of winding down the operations of the VIM business unit and expect this process to be completed during 2009.
Product Commercialization
In March 2008, we announced a new strategic initiative to identify and take advantage of opportunities to enter into arrangements with pharmaceutical companies to provide faculty development/advocacy, continuing medical education activitiessales and marketing support services and potentially limited capital in connection with the promotion of pharmaceutical products in exchange for a wide varietypercentage of formats,product sales above a certain threshold amount. These types of arrangements would typically involve a significant upfront investment of our resources with no guaranteed return on investment and interactive initiativeswould be expected to generate additional value to our customers' portfolios.losses in the first year of the contract as program ramp up occurs.
PDI Products Group (PPG)On April 11, 2008, we announced that we had entered into our first arrangement under our product commercialization strategic initiative to provide sales and marketing support services in connection with the promotion of a pharmaceutical product on behalf of Novartis Pharmaceuticals Corporation. See Note 1 and Note 10 the consolidated financial statements as well as “Part I – Item 1 – Business – Contracts – Product Commercialization” and “Part I – Item 1A – Risk Factors ” of this Form 10-K for additional information. As we re-evaluate this strategic initiative in conjunction with the appointment of Ms. Lurker as our new chief executive officer, we are not actively pursuing any additional product commercialization opportunities at this time although we will continue to evaluate potential opportunities within this segment on a very selective and opportunistic basis to the extent we are able to mitigate certain risks relating to the investment of our resources.
The goal of the PPG segment was to source biopharmaceutical products in the U.S. through licensing, copromotion, acquisition or integrated commercialization services arrangements. This segment did not have any revenue for the years ended December 31, 2006 and 2005.
PDI, Inc.
Annual Report on Form 10-K (continued)
Notwithstanding the fact that we have in recent years shifted our near-term strategy to deemphasize the PPG segment and focus onSet forth below is a general description of our service businesses, we may continue to review opportunities which may include copromotion, distribution arrangements, licensing and brand ownership of products. We currently do not expect any activitycontracts within the PPG segment in 2007.our business segments.
ContractsSales Services
Our contractsContracts within our Sales Services business segment consist primarily of detailing agreements and are nearly all fee for service. They may contain operational benchmarks, such as a minimum amount of activity within a specified amount of time. These contracts may include incentive payments that can be earned if our activities generate results that meet or exceed performance targets. Contracts may be terminated with or without cause by our customers. Certain contracts provide that we may incur specific penalties if we fail to meet stated performance benchmarks. Occasionally, our contracts may require us to meet certain financial covenants, such as maintaining a specified minimum amount of working capital.
Sales Services
During fiscal 2006, the majority of our revenue was generated by contracts for dedicated sales teams. These contracts are generally for afee-for-service arrangements. The term of these contracts is typically between one toand two years andwhich may be renewed or extended.extended upon mutual agreement of the parties. The majority of these contracts, however, are terminable by the customerclient for any reason upon 30 to 90 days’ notice. Certain contracts provide for termination payments if the customerclient terminates the contract without cause. Typically, however, these penalties do not offset the revenue we could have earned under the contract or the costs we may incur as a result of its termination. The loss or termination of a large contract or the loss of multiple contracts could have a material adverse effect on our business, financial condition, or results of operations.operations or cash flow. Our Sales Services contracts include standard mutual representations and warranties as well as mutual confidentiality and indemnification provisions, including product liability indemnification from our clients to us. These contracts, which include the Sales Services contracts with our significant customers, may also contain performance benchmarks, such as a minimum amount of detailing activity to a certain physician targets within a specified amount of time, and our failure to meet these stated benchmarks may result in specific financial penalties for us. Certain contracts may also include incentive payments that can be earned if our activities generate results that meet or exceed agreed-upon performance targets.
Marketing Services
Our marketing services contracts generally take the form of either master service agreements with a term of one to three years, or contracts specifically related to particular projects with terms for the duration of the project, typically lasting from two to six months. These contracts include standard representations and warranties as well as confidentiality and indemnification obligations and are generally terminable by the customer for any reason. Upon termination, the customer is generally responsible for payment for all work completed to date, plus the cost of any nonrefundable commitments made by us on behalf of the customer. There is significant customer concentration in our Pharmakon business, and the loss or termination of one or more of Pharmakon’s large master service agreements could have a material adverse effect on our business, financial condition or results of operations. Due to the typical
PDI, Inc.
Annual Report on Form 10-K (continued)
size of most of TVG’s and VIM’s contracts, it is unlikely the loss or termination of any individual TVG or VIM contract would have a material adverse effect on our business, financial condition, or results of operations.operations, or cash flow.
Significant CustomersProduct Commercialization
ForIn April 2008, we entered into our first contract under our product commercialization initiative with Novartis. See Note 1 and Note 10 to the consolidated financial statements as well as “Part I – Item 1A – Risk Factors” of this Form 10-K for additional information regarding the terms of this contract. As of December 31, 2008, we made expenditures of approximately $12.3 million in connection with our sales force activities and promotion of the product. To date, we have not achieved the required sales levels necessary to receive revenue under our promotion agreement with Novartis. We do not currently anticipate that we will achieve the required sales levels necessary to generate sufficient revenue to recover the costs we have incurred and will continue to incur in connection with this promotional program during the current term of the contract. We currently intend to terminate this contract at the early termination date for this contract, which is no sooner than February 1, 2010 provided that sales of the product remain below certain pre-determined thresholds. At December 31, 2008, we have accrued a loss of $10.3 million for this contract, which represents the anticipated future loss expected to be incurred by us in order to fulfill our minimum contractual obligations under the contract until February 1, 2010.
As we re-evaluate this strategic initiative in conjunction with the appointment of Ms. Lurker as our new chief executive officer, we are not actively pursuing any additional product commercialization opportunities at this time although we will continue to evaluate potential opportunities within this segment on a very selective and opportunistic basis to the extent we are able to mitigate certain risks relating to the investment of our resources. To the extent that we enter into any additional product commercialization arrangements in the future, we expect that these contracts will typically be multi-year arrangements with limited termination rights in which we are responsible for the sales force and potentially other marketing costs relating to the promotion of the pharmaceutical product. We currently expect that we will receive revenues under the agreement only if and when product sales or prescriptions exceed certain pre-determined thresholds. We also expect that these contracts will likely involve significant upfront investment of our resources with no guaranteed return on investment and are likely to generate losses during the initial periods of the contract as program ramp up occurs.
We have historically experienced a high degree of customer concentration in our businesses. Our three largest customers in 2008 were Pfizer Inc., F. Hoffmann-La Roche AG and Abbott Laboratories, which accounted for approximately 28.2%, 13.6% and 10.7%, respectively, or approximately 52.5% in the aggregate, of our revenue for the year ended December 31, 2006, our three2008. One of these largest customers terminated a significant sales force program effective September 30, 2008 due to generic competition. This sales force program accounted for 28.5%, 18.3% and 9.9%, respectively, or approximately 56.7% in the aggregate,9.5% of our service revenue. During 2006, we experienced the termination and/or expiration of several of these significant contracts. Effective as of April 30, 2006, AstraZeneca terminated its contract sales force arrangement with us, which accounted for 18.0% of our service revenue during 2006. In addition, on December 31, 2006, our contract sales agreement with GlaxoSmithKline (GSK), which accounted for 28.2% of our service revenue during 2006, expired and was not renewed.2008.
Our marketing efforts target established and emerging companies in the biopharmaceutical and life sciences industries. Our marketing efforts are designed to reach the senior sales, marketing, and business development personnel within these companies, with the goal of informing them of the services we offer and the value we can bring to their products. Our tactical plan usually includes advertising in trade publications, direct mail campaigns, presence at industry seminars and conferences and a direct selling effort. We have a dedicated team of business development specialists who work within our business units to identify needs and opportunities within the biopharmaceutical and life sciences industries whichthat we can address. We review possible business opportunities as identified by our business development team and develop a customized strategy and solution for each attractive business opportunity.
Competition
With respect to our sales teams,services segment, we compete with our customers’ alternative choices of managingability to manage their needs internally. In addition, a small number of providers comprise the market for outsourced pharmaceutical sales teams, and we believe that PDI, inVentiv Health Inc., Innovex Inc. and Publicis Groupe SA combined accounted for the majority of the U.S. outsourced sales team market share in 2006.2008. Our marketing services segment operates in a highly fragmented and competitive market.
PDI, Inc.
Annual Report on Form 10-K (continued)
There are relatively few barriers to entry into the businesses in which we operate and, as the industry continues to evolve, new competitors are likely to emerge. We compete on the basis of such factors as reputation, service quality, management experience, performance record, customer satisfaction, ability to respond to specific customer needs, integration skills and price. We believe we compete effectively with respect to each of these factors. Increased competition and/or a decrease in demand for our services may also lead to other forms of competition. While we believe we compete effectively with respect to each of these factors, most of our current and potential competitors are larger than we are and have substantially greater capital, personnel and other resources than we have. Increased competition may lead to pricing pressures and competitive practices that could have a material adverse effect on our market share, our ability to source new business opportunities as well as our business, financial condition and results of operations.
As of March 1, 2007,February 28, 2009, we had approximately 1,100 employees, including approximately 700550 full-time employees. Approximately 80%85% of our employee population is comprised ofemployees are field sales representatives and sales managers. We are not party to a collective bargaining agreement with any labor union. RelationshipsWe believe our relationship with our employees areis generally positive.
Our website address is www.pdi-inc.comwww.pdi-inc.com. We are not including the information contained on our website as part of, or incorporating it by reference into, this Form 10-K. We make available free of charge through our website our annual reports on Form 10-K, quarterly reports on Form 10-Q, current reports on Form 8-K, and all amendments to those reports as soon as reasonably practicable after such material is electronically filed with or furnished to the SEC.
The public may read and copy any materials we file with the SEC at the SEC's Public Reference Room at 100 F Street, N.E., Washington, D.C. 20549. The public may obtain information on the operation of the Public Reference Room by calling the SEC at 1-800-SEC-0330. The SEC maintains an Internet site that contains reports, proxy and information statements, and other information regarding registrants such as us that file electronically with the SEC. The website address is www.sec.govwww.sec.gov.
Government and Industry Regulation
The healthcare sector is heavily regulated by both government and industry. Various laws, regulations and guidelines established by government, industry and professional bodies affect, among other matters, the approval, provision, licensing, labeling, marketing, promotion, price, sale and reimbursement of healthcare services and products, including pharmaceutical products. The federal government has extensive enforcement powers over the activities of pharmaceutical manufacturers, including authority to withdraw product approvals, commence actions to seize and prohibit the sale of unapproved or non-complying products, to halt manufacturing operations that are not in compliance with good manufacturing practices, and to impose or seek injunctions, voluntary recalls, and civil, monetary, and criminal penalties.
The Food, Drug and Cosmetic Act, as supplemented by various other statutes, regulates, among other matters, the approval, labeling, advertising, promotion, sale and distribution of drugs, including the practice of providing product samples to physicians. Under this statute, the Food and Drug Administration (“FDA”)(FDA) regulates all promotional activities involving prescription drugs. The distribution of pharmaceutical products is also governed by the Prescription Drug Marketing Act (PDMA), which regulates thesepromotional activities at both the federal and state level. The PDMA imposes extensive licensing, personnel record keeping, packaging, quantity, labeling, product handling and facility storage and security requirements intended to prevent the sale of pharmaceutical product samples or other diversions. Under the PDMA and its implementing regulations, states are permitted to require registration of manufacturers and distributors who provide pharmaceutical products even if such manufacturers or distributors have no place of business within the state. States are also permitted to adopt regulations limiting the distribution of product samples to licensed practitioners and require extensive record keeping and labeling of such samples for tracing purposes. The sale or distribution of pharmaceutical products is also governed by the Federal Trade Commission Act.
Some of the services that we currently perform or that we may provide in the future may also be affected by various guidelines established by industry and professional organizations. For example, ethical guidelines established by the American Medical Association (AMA) govern, among other matters, the receipt by physicians of gifts from health-related entities. These guidelines govern honoraria and other items of economic value whichthat AMA member physicians may receive, directly or indirectly, from pharmaceutical companies. Similar guidelines and policies have been adopted by other professional and industry organizations, such as Pharmaceutical Research and
PDI, Inc.
Annual Report on Form 10-K (continued)
Manufacturers of America, an industry trade group. In addition, the Office of the Inspector General has also issued guidance for pharmaceutical manufacturers and the Accreditation Council for Continuing Medical Education has issued guidelines for providers of continuing medical education.
PDI, Inc.
Annual Report on Form 10-K (continued)
There are also numerous federal and state laws pertaining to healthcare fraud and abuse as well as increased scrutiny regarding the off-label promotion and marketing of pharmaceutical products and devices. In particular, certain federal and state laws prohibit manufacturers, suppliers and providers from offering, giving or receiving kickbacks or other remuneration in connection with ordering or recommending the purchase or rental of healthcare items and services. The federal anti-kickback statute imposes both civil and criminal penalties for, among other things, offering or paying any remuneration to induce someone to refer patients to, or to purchase, lease or order (or arrange for or recommend the purchase, lease or order of) any item or service for which payment may be made by Medicare or other federally-funded state healthcare programs (e.g.e.g., Medicaid). This statute also prohibits soliciting or receiving any remuneration in exchange for engaging in any of these activities. The prohibition applies whether the remuneration is provided directly or indirectly, overtly or covertly, in cash or in kind. Violations of the statute can result in numerous sanctions, including criminal fines, imprisonment and exclusion from participation in the Medicare and Medicaid programs. Several states also have referral, fee splitting and other similar laws that may restrict the payment or receipt of remuneration in connection with the purchase or rental of medical equipment and supplies. State laws vary in scope and have been infrequently interpreted by courts and regulatory agencies, but may apply to all healthcare items or services, regardless of whether Medicare or Medicaid funds are involved.
ITEM 1A.RISK FACTORS
In addition to the other information provided in this Form 10-K, you should carefully consider the following factors in evaluating our business, operations and financial condition. Additional risks and uncertainties not presently known to us, which we currently deem immaterial or that are similar to those faced by other companies in our industry or businesses in general, such as competitive conditions, may also impair our business operations. The occurrence of any of the following risks could have a material adverse effect on our business, financial condition or results of operations.
The current worldwide economic and financial crisis may have a material and adverse effect on our business, financial condition and results of operations.
The current global financial crisis involves, among other things, significant reductions in available capital and liquidity from banks and other providers of credit, substantial reductions and/or fluctuations in equity and currency values worldwide and concerns that the U.S. and global economy have entered into a prolonged recessionary period. Sustained downturns in the economy generally affect the markets in which we operate. If our customers’ access to capital or willingness to make expenditures is curtailed as a result of the current economic and financial crisis, our business, financial condition and results of operations could be materially and adversely affected. For example, certain customers within our marketing services business segment have recently delayed the implementation or reduced the scope of a number of marketing initiatives. In addition, economic conditions could affect the financial strength of our vendors and their ability to fulfill their commitments to us, and could also affect the financial strength of our customers and our ability to collect accounts receivable. Recent disruptions in the credit markets may also negatively impact our ability to obtain additional sources of financing. The potential effects of the current economic and financial crisis are difficult to forecast and mitigate and are likely to continue to have a significant adverse impact on our customers, vendors and our business for the next several years.
Changes in outsourcing trends in the pharmaceutical and biotechnology industries could materially and adversely affect our business, financial condition and results of operations.
Our business depends in large part on demand from the pharmaceutical and life sciences industries for outsourced marketing and sales services. The practice of many companies in these industries has been to hire outside organizations like usPDI to conduct large sales and marketing projects.projects on their behalf. However, companies may elect to perform these services internally for a variety of reasons, including the rate of new product development and FDA approval of those products, the number of sales representatives employed internally in relation to demand, for or the need to promote new and existing products, and competition from other suppliers. Recently, there has been a slow-down in the rate of approval of new products by the FDA and this trend may continue. Additionally, several large pharmaceutical companies have recently made changes to their commercial model by reducing the number of sales representatives employed internally and through outside organizations like us.PDI. If the pharmaceutical and life sciences industries reduce their tendency to outsource these projects, our business, financial condition and results of operations could be materially and adversely affected.
Our service businesses dependPDI, Inc.
Annual Report on expenditures byForm 10-K (continued)
If companies in the life sciences industries.industries significantly reduce their promotional, marketing and sales expenditures or significantly reduce or eliminate the role of pharmaceutical sales representatives in the promotion of their products, our business, financial condition and results of operations would be materially and adversely affected.
Our service revenues depend on promotional, marketing and sales expenditures by companies in the life sciences industries, including the pharmaceutical and biotechnology industries. Promotional, marketing and sales expenditures by pharmaceutical manufacturers have in the past been, and could in the future be, negatively impacted by, among other things, governmental reform or private market initiatives intended to reduce the cost of pharmaceutical products or by governmental, medical association or pharmaceutical industry initiatives designed to regulate the manner in which pharmaceutical manufacturers promote their products.products as well as the high level of patent expiration and related introduction of generic versions of branded medicine within the industry. Furthermore, the trend in the life sciences industries toward consolidation may result in a reduction in overall sales and marketing expenditures and, potentially, a reduction in the use of contract sales and marketing services providers. This reduction in demand for outsourced pharmaceutical sales and marketing services could be further exacerbated by the current economic and financial crisis occurring in the United States and worldwide. If companies in the life sciences industries significantly reduce their promotional, marketing and sales expenditures or significantly reduce or eliminate the role of pharmaceutical sales representatives in the promotion of their products, our business, financial condition and results of operations would be materially and adversely affected.
Our service contracts are generally short-term agreements and are cancelable at any time, which may result in lost revenue and additional costs and expenses.
Our service contracts are generally for a term of one to two years (certain of our operating entities have contracts of shorter duration) and many may be terminated by the customer at any time for any reason. Additionally, certainIn addition, many of our customers havemay internalize the ability tocontracted sales teams we provide under the terms of the contract or otherwise significantly reduce the number of representatives we deploy on their behalf. For example, as discussed above, AstraZeneca terminated its contract sales force arrangement with us effective April 30, 2006. The termination affected approximately 800 field representatives. The revenue impact was approximately $63.8 million in 2006. Additionally as discussed above, the losses of both the GSK and sanofi-aventis contracts for 2007 represent a loss of approximately $85.7 million in revenue for 2007.
PDI, Inc.
Annual Report on Form 10-K (continued)
The early termination or significant reduction of a contract by one of our major customers not only results in lost revenue, but also typically causes us to incur additional costs and expenses. All of our sales representatives are employees rather than independent contractors. Accordingly, when a contract is significantly reduced or terminated, unless we can immediately transfer the related sales force to a new program, if permitted under the contract, we must either continue to compensate those employees, without realizing any related revenue, or terminate their employment. If we terminate their employment, we may incur significant expenses relating to their termination. The loss, termination or significant reduction of a large contract or the loss of multiple contracts could have a material adverse effect on our business, financial condition orand results of operations.
Most of our service revenue is derived from a limited number of customers, the loss of any one of which could materially and adversely affect our business, financial condition or results of operations.
Our revenue and profitability depend to a great extent on our relationships with a limited number of large pharmaceutical companies. As of December 31, 2008, our three largest customers accounted for approximately 28.2%, 13.6%, and 10.7%, respectively, or approximately 52.5% in the aggregate, of our revenue for 2008. For the year ended December 31, 2007, our three largest customers accounted for approximately 13.7%, 12.9% and 11.3% respectively, or approximately 37.9% in the aggregate, of our revenue for 2007. For the year ended December 31, 2006, our three largest customers accounted for 28.5%, 18.3% and 9.9%, respectively, or approximately 56.7% in the aggregate, of our service revenue. For the year ended December 31, 2005, our three largest customers, each of whom represented 10% or more of our service revenue, accounted for, in the aggregate, approximately 73.6% of our service revenue. For the year ended December 31, 2004, our two largest customers, each of whom individually represented 10% or more of our service revenue, accounted for, in the aggregate, approximately 66.4% of our service revenue. We are likely to continue to experience a high degree of customer concentration, particularly if there is further consolidation within the pharmaceutical industry. The
In order to increase our revenues, we will need to attract additional significant customers on an ongoing basis. Our failure to attract a sufficient number of such customers during a particular period, or our inability to replace the loss of or a significant reduction ofin business from any of oura major customers couldcustomer would have a material adverse effect on our business, financial condition orand results of operations. For example, asduring 2006 and 2007, we announced on February 28, 2006, AstraZeneca terminated its contractthe termination and expiration of a number of significant service contracts, including our sales force arrangementengagements with us effective April 30, 2006. The termination affectedAstraZeneca, GlaxoSmithKline (GSK), sanofi-aventis and another large pharmaceutical company customer. These four customers accounted for approximately 800 field representatives, and the impact on revenue was approximately $63.8$150.9 million in 2006. Additionally,revenue during 2006 and $15.9 million in revenue during 2007. In addition, another client terminated a significant sales force program effective September 30, 2008 due to generic competition. This sales force program accounted for 9.5% of our revenue during 2008.
PDI, Inc.
Annual Report on September 26, 2006,Form 10-K (continued)
We have incurred and expect to continue to incur substantial losses in connection with the product commercialization initiative we announcedentered into with Novartis in April 2008. If we are unable to generate sufficient revenue from any future product commercialization opportunities that GSK would notwe may pursue to offset the costs and expenses associated with implementing and maintaining these types of programs, our business, financial condition, results of operations and cash flows could be renewing itsmaterially and adversely affected.
In April 2008, we entered into our first contract under our product commercialization initiative with us when it expired onNovartis. See Note 1 and Note 10 to the consolidated financial statements as well as “Part I – Item 1A – Risk Factors” of this Form 10-K for additional information regarding the terms of this contract. As of December 31, 2006. This represents2008, we made expenditures of approximately $12.3 million in connection with our sales force activities and promotion of the product. To date, we have not achieved the required sales levels necessary to receive revenue under our promotion agreement with Novartis. We do not currently anticipate that we will achieve the required sales levels necessary to generate sufficient revenue to recover the costs we have incurred and will continue to incur in connection with this promotional program during the current term of the contract. We currently intend to terminate this contract at the early termination date for this contract, which is no sooner than February 1, 2010 provided that sales of the product remain below certain pre-determined thresholds. At December 31, 2008, we have accrued a loss of revenue between $65 and $70$10.3 million for 2007. Furthermore, on October 25, 2006, we announced that we had received notification from sanofi-aventis of its intention to terminate its contract sales engagement with us effective December 1, 2006. Thethis contract, which represented approximately $18 millionrepresents the anticipated future loss expected to $20 millionbe incurred by us in revenue on an annual basis, was scheduledorder to expire on December 31, 2006.fulfill our minimum contractual obligations under the contract until February 1, 2010.
Our new senior management teamWhile we are not actively pursuing any additional product commercialization opportunities at this time, we will continue to evaluate potential opportunities within this segment on a very selective and opportunistic basis. To the extent we enter into any additional product commercialization arrangements in the future, these types of arrangements will likely require us to make a significant upfront investment of our resources and are likely to generate losses in the early stages as program ramp up occurs. In addition, any compensation we will receive is seekingexpected to implement an updated long-term strategic plan.be dependent on sales of the product, and in certain arrangements, including our arrangement with Novartis, we will not receive any compensation unless product sales exceed certain thresholds. There can be no assurance that our promotional activities will generate sufficient product sales for these arrangements to be profitable for us. In addition, there are a number of factors that could negatively impact product sales during the term of a product commercialization contract, many of which are beyond our control, including the level of promotional response to the product, withdrawal of the product from the market, the launch of a therapeutically equivalent generic version of the product, the introduction of a competing product, loss of managed care covered lives, a significant disruption in the manufacture or supply of the product as well as other significant events that could affect sales of the product or the prescription market for the product. Therefore, the revenue we will successfully implementreceive, if any, from product sales under these types of arrangements may not be sufficient to offset the costs incurred by us implementing and maintaining these programs. Our arrangement with Novartis requires, and any future product commercialization arrangements we may enter into may also require, that we make a certain amount of expenditures in connection with our promotional activities for the product, regardless of whether sufficient product sales are achieved in order for us to generate revenue, and there are limited opportunities for us to terminate this plan.arrangement prior to its scheduled expiration. In addition, if any contractual product commercialization arrangement we enter into was to be terminated by our customer prior to its scheduled expiration, our expected revenue and profitability could be materially and adversely affected due to our significant upfront investment of sales force and other promotional resources during the ramp up period for these types of programs.
In May 2006, Michael MarquardIf we do not meet performance goals established in our incentive-based arrangements with customers, our revenue could be materially and Jeffrey Smith joined us as our chief executive officer and chief financial officer, respectively. In October 2006, our board of directors approved an updated long-term strategic plan developed by senior management in consultation with a leading strategy consultant. In order to implement our strategic plan, we may seek to do one or more of the following:
· | acquire companies that offer prioritized complementary services that we have identified in order to expand our portfolio of product and service offerings to the biopharmaceutical and life sciences industries and to strengthen our contract sales offerings; or build these services in-house; and |
· | enter into risk-sharing and/or performance based arrangements on a selective basis. |
adversely affected.
We may expend significant fundshave entered into a number of incentive-based arrangements with our pharmaceutical company customers. Under incentive-based arrangements, we are typically paid a lower fixed fee and, in addition, have an opportunity to earn additional compensation upon achieving specific performance metrics with respect to the products being detailed. Typically, these performance metrics relate to targeted sales or prescription volumes, sales force performance metrics or a combination thereof. These types of arrangements transfer some market risk from our customers to us. In addition, these arrangements can result in variability in our incentive-based earnings (and therefore our revenue) due to seasonality of product usage, changes in market share, new product introductions (including the introduction of competing generic products into the market), overall promotional efforts and other resources implementing this strategy. There is no assurance thatmarket related factors. If we will successfully implement this strategy orare unable to meet the performance goals established in our incentive-based arrangements, our revenue could be able to expand our market share, increase revenues, yield a significant return on investment and/or improve stockholder value.materially and adversely affected.
Additionally, certain of our service contracts may contain penalty provisions pursuant to which our fixed fees may be significantly reduced if we do not meet certain minimum performance metrics, which may include number and timing of sales calls, physician reach, territory vacancies and/or sales representative turnover.
PDI, Inc.
Annual Report on Form 10-K (continued)
Our industry is highly competitive and our failure to address competitive developments promptly will limit our ability to retain and increase our market share.
Our primary competitors for sales and marketing services include in-house sales and marketing departments of pharmaceutical companies, other CSOs and medical educationproviders of marketing and related services, including marketing research providers. There are relatively few barriers to entry in the businesses in which we compete and, as the industry continues to evolve, new competitors are likely to emerge. Most of our current and potential competitors are larger than we are and have substantially greater capital, personnel and other resources than we have. Increased competition may lead to pricing pressures and competitive practices that could have a material adverse effect on our market share, our ability to source new business opportunities as well as our business, financial condition orand results of operations.
We may require additional funds in order to implement our business model.
10We may require additional funds in order to pursue certain business opportunities or meet future operating requirements, develop incremental marketing and sales capabilities; and/or acquire other services businesses. We may seek additional funding through public or private equity or debt financing or other arrangements with collaborative partners. Our ability to secure any future debt financing on favorable terms or at all may be materially and adversely affected by the current credit market turmoil. In addition, any debt financing arrangements that we enter into may require us to comply with specified financial ratios, including ratios regarding interest coverage, total leverage, senior secured leverage and fixed charge coverage. Our ability to comply with these ratios may be affected by events beyond our control. If we raise additional funds by issuing equity securities, further dilution to existing stockholders may result. As a condition to providing us with additional funds, future investors may demand, and may be granted, rights superior to those of existing stockholders. We cannot be certain, however, that additional financing will be available from any of these sources or, if available, will be available on acceptable or affordable terms. If adequate additional funds are not available, we may be required to delay, reduce the scope of, or eliminate one or more of our strategic initiatives.
PDI, Inc.
Annual Report on Form 10-K (continued)
Due to the expiration and/orand termination of several significant contracts during 2006, and management’s intention to implement our long-term strategic plan during 2007 and beyond,2008, our historical revenue and results of operations for the year ended December 31, 2006 cannot be relied upon as representative of the revenue and results of operations that we may achieve in 20072009 and future periods.
As noted above, during 2006 and the first half of 2007, we experienced the expiration and termination and/or expiration of several significant contracts, including termination of our AstraZenacaAstraZeneca contract sales contract force agreement effective as of April 30, 2006, the termination of our contract sales force agreement with sanofi-aventis effective as of December 1, 2006, the expiration of our contract sales force agreement with GSK on December 31, 2006 and the expiration of our contract sales force agreement with GSKa large pharmaceutical company customer on December 31, 2006.May 12, 2007. These threefour customers accounted for an aggregate of approximately $129.0$150.9 million of revenue during 2006.2006 and $15.9 million of revenue during 2007. In addition, another significant sales force program was terminated which accounted for approximately $10.7 million of revenue during 2008. Unless and until we generate sufficient new business to offset the loss of these contracts, our 2006 financial results for previous periods will not be duplicated in future periods, and future revenue and cash flows from operations will decrease.be significantly less than in previous periods. In addition, in connection with the accrued loss on our product commercialization contract we currently expect a significant decrease in our cash and cash equivalents in 2009.
Our liquidity, business, financial condition, results of operations and cash flows could be materially and adversely affected if the financial institutions which hold our funds fail.
We have substantial funds held in bank deposits, money market funds and other accounts at certain financial institutions. A significant portion of the funds held in these accounts exceeds the Federal Deposit Insurance Corporation’s insurance limits. If any of the financial institutions where we have deposited funds were to fail, we may lose some or all of our deposited funds that exceed the insurance coverage limit. Such a loss would have a material and adverse effect on our liquidity, business, financial condition, results of operations and cash flows.
Our business may suffer if we fail to attract and retain qualified sales representatives.
The success and growth of our business depends in large part on our ability to attract and retain qualified pharmaceutical sales representatives. There is intense competition for pharmaceutical sales representatives from CSOs and pharmaceutical companies. On occasion, our customers have hired the sales representatives that we trained to detail their products. We cannot assure you that we will continue to attract and retain qualified personnel. If we cannot attract and retain qualified sales personnel, we will not be able to maintain or expand our sales services business and our ability to perform under our existing sales force contracts will be impaired.
PDI, Inc.
Annual Report on Form 10-K (continued)
Product liability claims could harm our business.
We could face substantial product liability claims in the event any of the pharmaceutical or other products we have previously marketed or market now or may in the future market is alleged to cause negative reactions or adverse side effects or in the event any of these products causes injury, is alleged to be unsuitable for its intended purpose or is alleged to be otherwise defective. For example, we have been named as a defendant in numerous lawsuits as a result of our detailing of Baycolâ on behalf of Bayer Corporation (Bayer). Product liability claims, regardless of their merits, could be costly and divert management's attention from our business operations, or adversely affect our reputation and the demand for our services. While we rely on contractual indemnification provisions with our customers to protect us against certain product liability related claims, we cannot assure you that these provisions will be fully enforceable or that they will provide adequate protection against claims intended to be covered. We currently have product liability insurance in the aggregate amount of $5.0 million but cannot ensure that our insurance will be sufficient to cover fully all potential claims. Also, adequate insurance coverage might not be available in the future at acceptable costs, if at all.
If we do not increase our revenues and successfully manage the size of our operations, our business, financial condition and results of operations could be materially and adversely affected.
The majority of our operating expenses are personnel-related costs such as employee compensation and benefits as well as the cost of infrastructure to support our operations, including facility space and equipment. We recently instituted a number of cost-saving initiatives, including a reduction in employee headcount. In addition, we are currently seeking to sublet unused office space in our Saddle River, New Jersey and Dresher, Pennsylvania facilities, although there is no guarantee that we will be able to successfully sublet this unused office space, particularly in light of the current economic and financial crisis. If we are unable to achieve revenue growth in the future or fail to adjust our cost infrastructure to the appropriate level to support our revenues, our business, financial condition and results of operations could be materially and adversely affected.
Our business may suffer if we are unable to hire and retain key management personnel to fill critical vacancies.
The success of our business also depends on our ability to attract and retain qualified senior management intendswho are in high demand and who often have competitive employment options. We are currently conducting a search for a President of our Sales Services business segment. Our failure to implementattract and retain qualified individuals could have a material adverse effect on our long-term strategic plan during 2007 and beyond. This plan includes,business, financial condition or results of operations.
Changes in part, a focus on supplementinggovernmental regulation could negatively impact our current service offerings with complementary commercialization service offerings to the biopharmaceuticalbusiness operations.
The pharmaceutical and life sciences industries. Toindustries are subject to a high degree of governmental regulation. Significant changes in these regulations affecting the extent this elementservices we provide, including pharmaceutical product promotional and marketing research services and physician interaction programs, could result in the imposition of additional restrictions on these types of activities, impose additional costs on us in providing these services to our customers or otherwise negatively impact our business operations. In addition, changes in governmental regulations mandating price controls and limitations on patient access to our customers’ products could reduce, eliminate or otherwise negatively impact our customers’ utilization of our strategic plan is implemented during 2007sales and in future periods, these will constitute new service offerings for which there were no comparable financial results during 2006.marketing services.
Our failure, or that of our customers, to comply with applicable healthcare regulations could limit, prohibit or otherwise adversely impact our business activities.
Various laws, regulations and guidelines established by government, industry and professional bodies affect, among other matters, the provision, licensing, labeling, marketing, promotion, sale and distribution of healthcare services and products, including pharmaceutical products. In particular, the healthcare industry is governed by various federal and state laws pertaining to healthcare fraud and abuse, including prohibitions on the payment or acceptance of kickbacks or other remuneration in return for the purchase or lease of products that are paid for by Medicare or Medicaid. Sanctions for violating these laws include civil and criminal fines and penalties and possible exclusion from Medicare, Medicaid and other federal or state healthcare programs. Although we believe our current business arrangements do not violate these federal and state fraud and abuse laws, we cannot assure you that our business practices will not be challenged under these laws in the future or that a challenge would not have a material adverse effect on our business, financial condition or results of operations. Our failure, or the failure of our customers, to comply with these laws, regulations and guidelines, or any change in these laws, regulations and guidelines may, among other things, limit or prohibit our or our customers’ current or business activities, subject us or our customers to adverse publicity, increase the cost of regulatory compliance and insurance coverage or subject us or our customers to monetary fines or other sanctions or penalties.
PDI, Inc.
Annual Report on Form 10-K (continued)
We may experience impairment charges of our goodwill and other intangible assets.
Under Statement of Financial Accounting Standard No. 142, we are required to evaluate goodwill for impairment at least annually. If we determine that the fair value is less than the carrying value, an impairment loss will be recorded in our statement of operations. The determination of fair value is a highly subjective exercise and can produce significantly different results based on the assumptions used and methodologies employed. If our projected long-term sales growth rate, profit margins or terminal rate are considerably lower and/or the assumed weighted average cost of capital is considerably higher, future testing may indicate impairment and we would have to record a non-cash goodwill impairment loss in our statement of operations.
If our insurance and self-insurance reserves are insufficient to cover our future liabilities for workers compensation, automobile and general liability and employee health care benefits, our financial condition and results of operations could be materially and adversely affected.
We use a combination of insurance and self-insurance to provide for potential liabilities for workers’ compensation, automobile and general liability and employee health care benefits. Although we have reserved for these liabilities not covered by insurance, our reserves are only an estimate based on actuarial data, as well as on historical trends, and any projection of these losses is subject to a high degree of variability and we may not be able to accurately predict the number or value of the claims that occur in the future. In the event that our actual liability exceeds our reserves for any given period, or if we are unable to control rapidly increasing health care costs, our business, financial condition and results of operations could be materially and adversely affected.
If our information technology and communications systems fail or we experience a significant interruption in their operation, our reputation, business and results of operations could be materially and adversely affected.
The efficient operation of our business is dependent on our information technology and communications systems. The failure of these systems to operate as anticipated could disrupt our business and result in decreased revenue and increased overhead costs. In addition, we do not have complete redundancy for all of our systems and our disaster recovery planning cannot account for all eventualities. Our information technology and communications systems, including the information technology systems and services that are maintained by third party vendors, are vulnerable to damage or interruption from natural disasters, fire, terrorist attacks, malicious attacks by computer viruses or hackers, power loss or failure of computer systems, Internet, telecommunications or data networks. If these systems or services become unavailable or suffer a security breach, we may expend significant resources to address these problems, and our reputation, business and results of operations could be materially and adversely affected.
We may make acquisitions in the future which may lead to disruptions to our ongoing business.
Historically, we have made a number of acquisitions, and our strategic plan contemplates pursuingwe may pursue new acquisition opportunities.opportunities in the future. If we are unable to successfully integrate an acquired company, the acquisition could lead to disruptions to our business. The success of an acquisition will depend upon, among other things, our ability to:
| · | assimilate the operations and services or products of the acquired company; |
| · | integrate new personnel associated with the acquisition; |
| · | retain and motivate key employees; |
| · | minimize the diversion of management’s attention from other business concerns. |
In the event that the operations of an acquired business do not meet our performance expectations, we may have to restructure the acquired business or write-off the value of some or all of the assets of the acquired business, including goodwill and other intangible assets identified at time of acquisition.
In addition, the current market for acquisition targets in our industry is extremely competitive, and there can be no assurance that we will be able to successfully identify, bid for and complete acquisitions necessary or desirable to achieve our goals.
If we do not meet performance goals set in incentive-based and revenue sharing arrangements, our profits could suffer.
We occasionally enter into incentive-based and revenue sharing arrangements with pharmaceutical companies. Under incentive-based arrangements, we are typically paid a fixed fee and, in addition, have an opportunity to increase our earnings based on the market performance of the products being detailed in relation to targeted sales volumes, sales force performance metrics or a combination thereof. Additionally, certain of our service contracts may contain penalty provisions pursuant to which our fees may be significantly reduced if we do not meet certain performance metrics; for example number and timing of sales calls, physician reach, territory vacancies and/or sales representative turnover. Under revenue sharing arrangements, our compensation is based on the market performance of the products being detailed, usually expressed as a percentage of product sales. These types of arrangements transfer some market risk from our customers to us. In addition, these arrangements can result in variability in revenue and earnings due to seasonality of product usage, changes in market share, new product introductions (including the introduction of competing generic products into the market), overall promotional efforts and other market related factors.
If we are unable to attract key employees, we may be unable to support the implementation of our strategic plan and growth of our business.
Successful execution of our business strategy depends, in large part, on our ability to attract and retain qualified management, marketing and other personnel with the skills and qualifications necessary to fully execute our programs and strategy. Competition for talent among companies in the pharmaceutical and life sciences industries is intense and we cannot assure you that we will be able to continue to attract or retain the talent necessary to support the growth of our business.
PDI, Inc.
Annual Report on Form 10-K (continued)
If we pursue a strategy that includes co-promotion and exclusive distribution arrangements, and/or licensing and brand ownership of products, we cannot assure you that we can successfully develop this business.
We may in the future pursue a strategy which includes co-promotion, distribution arrangements, and/or licensing and brand ownership of products. These types of arrangements can significantly increase our operating expenditures in the short-term. Typically, these agreements require significant “upfront” payments, minimum purchase requirements, minimum royalty payments, payments to third parties for production, inventory maintenance and control, distribution services and accounts receivable administration, as well as sales and marketing expenditures. In addition, particularly where we license or acquire products before they are approved for commercial use, we may be required to incur significant expense to gain and maintain the required regulatory approvals and there can be no assurance that we would be able to obtain any necessary regulatory approvals for those products. In addition, regulatory approval does not ensure commercial success. As a result, our working capital balance and cash flow position could be materially and adversely affected until the products in question become commercially viable, if ever. The risks that we face in developing this segment of our business, if we choose to pursue it, may increase in proportion with:
· | the number and types of products covered by these types of agreements; |
· | the applicable stage of the drug regulatory process of the products at the time we enter into these agreements; |
· | the incidence of adverse patent and other intellectual property developments relating to our product portfolio; and |
· | our control over the manufacturing, distribution and marketing processes. |
In the event that we pursue a strategy which includes the co-promotion, distribution, and/or licensing and brand ownership of products, there is no assurance that we will be able to successfully implement this strategy.
We may require additional funds in order to implement our strategic plan and evolving business model.
Pursuant to our strategic plan, we may require additional funds in order to pursue other business opportunities or meet future operating requirements; develop incremental marketing and sales capabilities; and/or acquire other services businesses. We may seek additional funding through public or private equity or debt financing or other arrangements with collaborative partners. If we raise additional funds by issuing equity securities, further dilution to existing stockholders may result. In addition, as a condition to providing us with additional funds, future investors may demand, and may be granted, rights superior to those of existing stockholders. We cannot be sure, however, that additional financing will be available from any of these sources or, if available, will be available on acceptable or affordable terms. If adequate additional funds are not available, we may be required to delay, reduce the scope of, or eliminate one or more of our strategic initiatives.
Product liability claims could harm our business.
We could face substantial product liability claims in the event any of the pharmaceutical or other products we have previously marketed or market now or may in the future market are alleged to cause negative reactions or adverse side effects or in the event any of these products causes injury, is alleged to be unsuitable for its intended purpose or is alleged to be otherwise defective. For example, we have been named as a defendant in numerous lawsuits as a result of our detailing of Baycolâ on behalf of Bayer Corporation (Bayer). Product liability claims, regardless of their merits, could be costly and divert management's attention, or adversely affect our reputation and the demand for our services or products. We rely on contractual indemnification provisions with our customers to protect us against certain product liability related claims. There is no assurance that these provisions will be fully enforceable or that they will provide adequate protection against claims intended to be covered. We currently have product liability insurance in the aggregate amount of $5.0 million but we cannot assure you that our insurance will be sufficient to cover fully all potential claims. Also, adequate insurance coverage might not be available in the future at acceptable costs, if at all.
Our business will suffer if we are unable to hire and retain key management personnel.
The success of our business also depends on our ability to attract and retain qualified senior management and experienced financial executives who are in high demand and who often have competitive employment options. Our failure to attract and retain qualified individuals could have a material adverse effect on our business, financial condition or results of operations.
PDI, Inc.
Annual Report on Form 10-K (continued)
Our business may suffer if we fail to attract and retain qualified sales representatives.
The success and growth of our business depends on our ability to attract and retain qualified pharmaceutical sales representatives. During 2006, we experienced an unusually high turnover rate among our sales representatives due to the early termination of a number of significant contract sales force arrangements. There is intense competition for pharmaceutical sales representatives from CSOs and pharmaceutical companies. On occasion, our customers have hired the sales representatives that we trained to detail their products. We cannot be certain that we can continue to attract and retain qualified personnel. If we cannot attract and retain qualified sales personnel, we will not be able to expand our teams business and our ability to perform under our existing contracts will be impaired.
Our failure, or that of our customers, to comply with applicable healthcare regulations could limit, prohibit or otherwise adversely impact our business activities.
Various laws, regulations and guidelines established by government, industry and professional bodies affect, among other matters, the provision of, licensing, labeling, marketing, promotion, sale and distribution of healthcare services and products, including pharmaceutical products. In particular, the healthcare industry is governed by various federal and state laws pertaining to healthcare fraud and abuse, including prohibitions on the payment or acceptance of kickbacks or other remuneration in return for the purchase or lease of products that are paid for by Medicare or Medicaid. Sanctions for violating these laws include civil and criminal fines and penalties and possible exclusion from Medicare, Medicaid and other federal or state healthcare programs. Although we believe our current business arrangements do not violate these federal and state fraud and abuse laws, we cannot be certain that our business practices will not be challenged under these laws in the future or that a challenge would not have a material adverse effect on our business, financial condition or results of operations. Our failure, or the failure of our customers, to comply with these laws, regulations and guidelines, or any change in these laws, regulations and guidelines may, among other things, limit or prohibit our business activities or those of our customers, subject us or our customers to adverse publicity, increase the cost of regulatory compliance and insurance coverage or subject us or our customers to monetary fines or other penalties.
Our stock price is volatile and could be further affected by events not within our control. In 2006, our stock traded at a low of $9.37 and a high of $15.69. In 2005, our stock traded at a low of $11.12 and a high of $22.26.
The market for our common stock is volatile. The trading price of our common stock has been and will continue to be subject to:
· | volatility in the trading markets generally; |
· | significant fluctuations in our quarterly operating results; |
· | announcements regarding our business or the business of our competitors; |
· | industry and/or regulatory developments; |
· | changes in revenue and revenue growth rates for us and for our industry as a whole; and |
· | statements or changes in opinions, ratings or earnings estimates made by brokerage firms or industry analysts relating to the markets in which we operate or expect to operate. |
Our quarterly revenues and operating results may vary, which may cause the price of our common stock to fluctuate.
Our quarterly operating results may vary as a result of a number of factors, including:
| · | the commencement, delay, cancellation or completion of sales and marketing programs; |
| · | regulatory developments; |
PDI, Inc.
Annual Report on Form 10-K (continued)
| · | uncertainty related to compensation based on achieving performance benchmarks;about when, if at all, revenue from any product commercialization arrangements and/or other incentive-based arrangements with our customers will be recognized; |
| · | mix of services provided and/or mix of programs i.e., contract sales, peer persuasion programs, medical education, marketing research;during the period; |
| · | timing and amount of expenses for implementing new programs and accuracy of estimates of resources required for ongoing programs; |
| · | timing and integration of any acquisitions; |
| · | changes in regulations related to pharmaceutical companies; and |
| · | general economic conditions.conditions, including the current economic and financial crisis. |
PDI, Inc.
Annual Report on Form 10-K (continued)
In addition, in the case of revenue related to service contracts, we recognize revenue as services are performed, while program costs, other than training costs, are expensed as incurred. For all contracts, training costs are deferred and amortized on a straight-line basis over the shorter of the life of the contract to which they relate or 12 months. As a result, during the first two to three months of a new contract, we may incur substantial expenses associated with implementing that new program without recognizing any revenue under that contract. In addition, if we pursue additional product commercialization opportunities, we will incur similar implementation expenses and likely will not be able to recognize revenue from the contract, if any, for an even greater period of time after commencement of these types of programs. This could have a material adverse impact on our operating results and the price of our common stock for the quarters in which these expenses are incurred. For these and other reasons, we believe that quarterly comparisons of our financial results are not necessarily meaningful and should not be relied upon as an indication of future performance. Fluctuations in quarterly results could materially and adversely affect the market price of our common stock in a manner unrelated to our long-term operating performance.
Our stock price is volatile and could be further affected by events not within our control, and an investment in our common stock could suffer a decline in value.
The market for our common stock is volatile. In 2008, our stock traded at a low of $3.10 and a high of $9.40. During 2007, our stock traded at a low of $8.56 and a high of $12.40. The trading price of our common stock has been and will continue to be subject to:
| · | volatility in the trading markets generally, including volatility associated with the current economic and financial crisis in the United States and worldwide; |
| · | significant fluctuations in our quarterly operating results; |
| · | significant changes in our cash and cash equivalent reserves; |
| · | announcements regarding our business or the business of our competitors; |
| · | strategic actions by us or our competitors, such as acquisitions or restructurings; |
| · | industry and/or regulatory developments; |
| · | changes in revenue and revenue growth rates for us and for our industry as a whole; |
| · | changes in accounting standards, policies, guidance, interpretations or principles; and |
| · | statements or changes in opinions, ratings or earnings estimates made by brokerage firms or industry analysts relating to the markets in which we operate or expect to operate. |
Our controlling stockholder continues to have effective control of us, which could delay or prevent a change in corporate control that may otherwise be beneficial to our stockholders.
John P. Dugan, our chairman, beneficially owns approximately 35%34% of our outstanding common stock. As a result, Mr. Dugan is able to exercise substantial control over the election of all of our directors and to determine the outcome of most corporate actions requiring stockholder approval, including a merger with or into another company, the sale of all or substantially all of our assets and amendments to our certificate of incorporation. This ownership concentration will limit our stockholders’ ability to influence corporate matters and, as a result, we may take actions that other stockholders do not view as beneficial, which may adversely affect the market price of our common stock.
PDI, Inc.
Annual Report on Form 10-K (continued)
We have anti-takeover defenses that could delay or prevent an acquisition and could adversely affect the price of our common stock.
Our certificate of incorporation and bylaws include provisions, such as providing for three classes of directors, which are intended to enhance the likelihood of continuity and stability in the composition of our board of directors. These provisions may make it more difficult to remove our directors and management and may adversely affect the price of our common stock. In addition, our certificate of incorporation authorizes the issuance of "blank check" preferred stock. This provision could have the effect of delaying, deterring or preventing a future takeover or a change in control, unless the takeover or change in control is approved by our board of directors, even thoughdirectors. We are also subject to laws that may have a similar effect. For example, section 203 of the transactionGeneral Corporation Law of the State of Delaware prohibits us from engaging in a business combination with an interested stockholder for a period of three years from the date the person became an interested stockholder unless certain conditions are met. As a result of the foregoing, it will be difficult for another company to acquire us and, therefore, could limit the price that possible investors might offerbe willing to pay in the future for shares of our common stock. In addition, the rights of our common stockholders an opportunitywill be subject to, sell their shares at a price aboveand may be adversely affected by, the current market price.rights of holders of any class or series of preferred stock that may be issued in the future.
ITEM 1B. UNRESOLVED STAFF COMMENTS
| ITEM 1B. | UNRESOLVED STAFF COMMENTS |
None.
Our corporate headquarters are located in Saddle River, New Jersey where we lease approximately 84,000 square feet. The lease runs for a term of approximately twelve12 years, which began in July 2004. We entered into a sublease for approximately 16,000 square feet of space in theour Saddle River facility for a term of five years which began in July 2005. The sublease allows the subtenant a renewal optionto renew for an additional term of two years. In July 2007, we entered into an additional sublease for approximately 20,000 square feet of space in our Saddle River facility for the remaining term of our lease. TVG operates out of a 37,000 square foot facility in Dresher, Pennsylvania under a lease that runs for a term of approximately twelve12 years, which began in January 2005.December 2004. TVG entered into two subleases in August and October of 2007, each for terms of five years, and are approximately 3,000 and 4,700 square feet, respectively. Pharmakon operates out of a 6,700 square foot facility in Schaumburg, Illinois under a lease that expires in February 2010. We believe that our current facilities are adequate for our current and foreseeable operations and that suitable additional space will be available if needed.
In 2008 we had approximately $0.1 million in charges related to unused office space at our Dresher location. In 2007, we had approximately $1.0 million of net charges related to unused office space capacity and asset impairments related to the vacated space at both locations. In 2006, we had net charges of approximately $657,000 related to unused office space capacity at our Saddle River, New Jersey and Dresher, Pennsylvania locations and $1.3 million in asset impairment charges for leasehold improvements and furniture and fixtures associated with the unused office space at those facilities. In the fourth quarter of 2005, we recorded charges ofThere is approximately $2.4 million related to unused office space capacity at our Saddle River and Dresher locations. There are approximately 19,400 and 11,0004,100 square feet of unused office space at Saddle River and Dresher respectively, whichthat we are seeking to sublease in 2007.2009 and we are also seeking to sublease certain unused office space in our Saddle River facility. There can be no assurance, however, that we will be able to successfully sublet unused office space, on favorable terms or at all, particularly in light of the current economic and financial crisis.
Securities Litigation
In January and February 2002, we, our former chief executive officer and our former chief financial officer were served with three complaints that were filed in the U.S. District Court for the District of New Jersey (the Court) alleging violations of the Exchange Act. These complaints were brought as purported shareholder class actions under Sections 10(b) and 20(a) of the Exchange Act and Rule 10b-5 established thereunder. On May 23, 2002, the Court consolidated all three lawsuits into a single action entitled In re PDI Securities Litigation, Master File No. 02-CV-0211, and appointed lead plaintiffs (Lead Plaintiffs) and Lead Plaintiffs’ counsel. On or about December 13, 2002, Lead Plaintiffs filed a second consolidated and amended complaint (Second Consolidated and Amended Complaint), which superseded their earlier complaints.
PDI, Inc.
Annual Report on Form 10-K (continued)
In February 2003, we filed a motion to dismiss the Second Consolidated and Amended Complaint. On or about August 22, 2005, the Court dismissed the Second Consolidated and Amended Complaint without prejudice to plaintiffs.
On October 21, 2005, Lead Plaintiffs filed a third consolidated and amended complaint (Third Consolidated and Amended Complaint). Like its predecessor, the Third Consolidated and Amended Complaint named us, our former chief executive officer and our former chief financial officer as defendants; purported to state claims against us on behalf of all persons who purchased our common stock between May 22, 2001 and August 12, 2002; and sought money damages in unspecified amounts and litigation expenses including attorneys’ and experts’ fees. The essence of the allegations in the Third Consolidated and Amended Complaint was that we intentionally or recklessly made false or misleading public statements and omissions concerning our prospects with respect to our marketing of Ceftin in connection with the October 2000 distribution agreement with GSK, our marketing of Lotensin in connection with the May 2001 distribution agreement with Novartis Pharmaceuticals Corporation, as well as our marketing of Evista in connection with the October 2001 distribution agreement with Eli Lilly and Company.
On December 21, 2005, we filed a motion to dismiss the Third Consolidated and Amended Complaint under the Private Securities Litigation Reform Act of 1995 and Rules 9(b) and 12(b)(6) of the Federal Rules of Civil Procedure. On November 2, 2006, the Court issued an Opinion and Order dismissing with prejudice all claims asserted in the Third Consolidated and Amended Complaint against all defendants and denied Lead Plaintiffs’ request to amend the complaint.
Bayer-Baycol Litigation
We have been named as a defendant in numerous lawsuits, including two class action matters, alleging claims arising from the use of Baycol, a prescription cholesterol-lowering medication. Baycol was distributed, promoted and sold by Bayer in the U.S. throughUnited States until early August 2001, at which time Bayer voluntarily withdrew Baycol from the U.S. market. Bayer had retained certain companies, such as us,PDI, to provide detailing services on its behalf pursuant to contract sales force agreements. We may be named in additional similar lawsuits. To date, we have defended these actions vigorously and have asserted a contractual right of defense and indemnification against Bayer for all costs and expenses we incur relating to these proceedings. In February 2003, we entered into a joint defense and indemnification agreement with Bayer, pursuant to which Bayer has agreed to assume substantially all of our defense costs in pending and prospective proceedings and to indemnify us in these lawsuits, subject to certain limited exceptions. Further, Bayer agreed to reimburse us for all reasonable costs and expenses incurred through such date in defending these proceedings. As of December 31, 2006,2008, Bayer has reimbursed us for approximately $1.6 million in legal expenses, the majority of which was received in 2003 and was reflected as a credit within selling, general and administrative expense. We did not incur any costs or expenses relating to these matters during 2006, 20052007 or 2004.
Cellegy Litigation
On April 11, 2005, we settled a lawsuit which was pending in the U.S. District Court for the Northern District of California against Cellegy Pharmaceuticals, Inc. (Cellegy), which was set to go to trial in May 2005 (PDI, Inc. v. Cellegy Pharmaceuticals, Inc., Case No. C 03-05602 (SC)). We had claimed (i) that we were fraudulently induced to enter into a December 31, 2002 license agreement with Cellegy (the License Agreement) to market the product Fortigel and (ii) that Cellegy had otherwise breached the License Agreement by failing, inter alia, to provide us with full information about Fortigel or to take all necessary steps to obtain expeditious FDA approval of Fortigel. We sought return of our $15 million upfront payment, other damages and an order rescinding the License Agreement. Under the terms of the settlement, in exchange for our executing a stipulation of dismissal with prejudice of the lawsuit, Cellegy agreed to and did deliver to us: (i) a cash payment in the amount of $2.0 million; (ii) a Secured Promissory Note in the principal amount of $3.0 million, with a maturity date of October 11, 2006; (iii) a Security Agreement, granting us a security interest in certain collateral; and (iv) a Nonnegotiable Convertible Senior Note, with a face value of $3.5 million, with a maturity date of April 11, 2008.
In addition to the initial $2.0 million we received on April 11, 2005, Cellegy had paid us $200,000 in 2005 and $458,500 through June 30, 2006 towards the outstanding principal balance of the Secured Promissory Note. These payments were recorded as a credit to litigation expense in the periods in which they were received.
PDI, Inc.
Annual Report on Form 10-K (continued)
On December 1, 2005, we commenced a breach of contract action against Cellegy in the U.S. District Court for the Southern District of New York (PDI, Inc. v. Cellegy Pharmaceuticals, Inc., 05 Civ. 10137 (PKL)). We alleged that Cellegy breached the terms of the Security Agreement and Secured Promissory Note we received in connection with the settlement. We further alleged that to secure its debt to us, Cellegy granted us a security interest in certain "Pledged Collateral," which was broadly defined in the Security Agreement to include, among other things, 50% of licensing fees, royalties or "other payments in the nature thereof" received by Cellegy in connection with then-existing or future agreements for Cellegy's drugs Rectogesic® and Tostrex® outside of the U.S., Mexico, and Canada. Upon receipt of such payments, Cellegy agreed to make prompt payment to us. We alleged that we were owed 50% of a $2.0 million payment received by Cellegy in connection with the renegotiation of its license and distribution agreement for Rectogesic® in Europe, and that Cellegy's failure to pay us constituted an event of default under the Security Agreement and the related Secured Promissory Note. For Cellegy's breach of contract, we sought damages in the total amount of $6.4 million plus default interest from Cellegy.
On December 27, 2005, Cellegy filed an answer to our complaint, denying the allegations contained therein, and asserting affirmative defenses. Discovery subsequently commenced and pursuant to a scheduling order entered by the court, was to be completed by November 21, 2006. On June 22, 2006, the parties appeared before the court for a status conference and agreed to a dismissal of the lawsuit without prejudice because, among other reasons, discovery would not be complete before October 11, 2006, the maturity date of the Secured Promissory Note, at which time Cellegy would owe us the entire unpaid principal balance and interest on the Second Promissory Note. On July 13, 2006, the court dismissed the December 1, 2005 breach of contract lawsuit without prejudice. This had no effect on the original settlement.
On September 27, 2006, Cellegy announced that it had entered into an asset purchase agreement to sell its intellectual property rights and other assets relating to certain of its products and product candidates to Strakan International Limited (the Sale). Pursuant to a letter agreement between Cellegy and us, Cellegy agreed to pay us $3.0 million (the Payoff Amount) in full satisfaction of Cellegy’s obligations to us under the Secured Promissory Note, which had an outstanding principal amount of approximately $2.34 million, and the $3.5 million Nonnegotiable Convertible Senior Note (collectively, the Notes). Pursuant to the letter agreement, $500,000 of the Payoff Amount was paid to us in September 2006, and the remaining $2.5 million was paid to us in December 2006 upon consummation of the Sale. We had previously established an allowance for doubtful notes for the outstanding balance of the Notes; therefore, the Agreement did not result in the recognition of a loss. The $3.0 million received was recorded as a credit to litigation expense.
California Class Action Litigation
On September 26, 2005, we were served with a complaint in a purported class action lawsuit that was commenced against us in the Superior Court of the State of California for the County of San Francisco on behalf of certain of our current and former employees, alleging violations of certain sections of the California Labor Code. During the quarter ended September 30, 2005, we accrued approximately $3.3 million for potential penalties and other settlement costs relating to both asserted and unasserted claims relating to this matter. In October 2005, we filed an answer generally denying the allegations set forth in the complaint. In December 2005, we reached a tentative settlement of this action, subject to court approval. As a result, we reduced our accrual relating to asserted and unasserted claims relating to this matter to $600,000 during the quarter ended December 31, 2005. In October 2006, we received preliminary settlement approval from the court and the final approval hearing was held in January 2007. Pursuant to the settlement, we are currently in the process of distributing payments to the class members, their counsel and the California Labor and Workforce Development Agency in an aggregate amount of approximately $50,000.
Other Legal Proceedings
We are currently a party to other legal proceedings incidental to our business. As required, we have accrued our estimate of the probable costs for the resolution of these claims. While management currently believes that the ultimate outcome of these proceedings, individually and in the aggregate, will not have a material adverse effect on our business, financial condition or results of operations, litigation is subject to inherent uncertainties. WereIf we were to settle a proceeding for a material amount or wereif an unfavorable ruling were to occur, there exists the possibility of a material adverse impact on our business, financial condition or results of operations. Legal fees are expensed as incurred.
ITEM 4.SUBMISSION OF MATTERS TO A VOTE OF SECURITY HOLDERS| ITEM 4. | SUBMISSION OF MATTERS TO A VOTE OF SECURITY HOLDERS |
None.
PDI, Inc.
Annual Report on Form 10-K (continued)
PART II
ITEM 5.MARKET FOR OUR COMMON EQUITY, RELATED STOCKHOLDER MATTERS| ITEM 5. | MARKET FOR OUR COMMON EQUITY, RELATED STOCKHOLDER MATTERS |
| AND ISSUER PURCHASES OF EQUITY SECURITIES |
AND ISSUER PURCHASES OF EQUITY SECURITIES
Our common stock is traded on the Nasdaq Global Market under the symbol “PDII.” The price range per share of common stock presented below represents the highest and lowest closingsales price for our common stock on the Nasdaq Global Market for the last two years by quarter:
| | | 2008 | | | 2007 | |
| | | HIGH | | | LOW | | | HIGH | | | LOW | |
| First quarter | | $ | 9.40 | | | $ | 7.01 | | | $ | 10.98 | | | $ | 9.21 | |
| Second quarter | | $ | 9.15 | | | $ | 7.61 | | | $ | 11.28 | | | $ | 9.00 | |
| Third quarter | | $ | 9.23 | | | $ | 7.22 | | | $ | 12.40 | | | $ | 9.09 | |
| Fourth quarter | | $ | 7.80 | | | $ | 3.10 | | | $ | 10.68 | | | $ | 8.56 | |
| | 2006 | | 2005 | |
| | HIGH | | LOW | | HIGH | | LOW | |
| First quarter | | $ | 15.00 | | $ | 9.70 | | $ | 21.45 | | $ | 19.00 | |
| Second quarter | | $ | 14.59 | | $ | 10.14 | | $ | 20.77 | | $ | 11.27 | |
| Third quarter | | $ | 15.50 | | $ | 11.01 | | $ | 15.99 | | $ | 12.36 | |
| Fourth quarter | | $ | 11.57 | | $ | 9.53 | | $ | 15.24 | | $ | 12.38 | |
We had 336326 stockholders of record as of March 8, 2007.3, 2009. Not reflected in the number of record holders are persons who beneficially own shares of common stock held in nominee or street name.
We have not declared any cash dividends and do not intend to declare or pay any cash dividends in the foreseeable future. Future earnings, if any, will be used to finance the future operation and growth of our business.
Securities Authorized For Issuance Under Equity Compensation Plans
We have in effect a number of stock-based incentive and benefit programs designed to attract and retain qualified directors, executives and management personnel. All equity compensation plans have been approved by security holders. The following table sets forth certain information with respect to our equity compensation plans as of December 31, 2006:2008:
| | | | | | | Number of securities | |
| | | | | | | remaining available for | |
| | | Number of securities to | | Weighted-average | | future issuance | |
| | | be issued upon exercise | | exercise price of | | (excluding securities | |
| Plan Category | | of outstanding options (a)(1) | | outstanding options (b) | | reflected in column (a)) (1) | |
| Equity compensation plans | | | | | | | | | | |
| approved by security holders | | | | | | | | | | |
| (2004 Stock Award and | | | | | | | | | | |
| Incentive Plan, 2000 Omnibus | | | | | | | | | | |
| Incentive Compensation Plan, | | | | | | | | | | |
| and 1998 Stock Option Plan) | | | 807,238 | | $ | 26.03 | | | 1,028,453 | |
| | | | | | | | | | | |
| Equity compensation plans not | | | | | | | | | | |
| approved by security holders | | | - | | | - | | | - | |
| Total | | | 807,238 | | $ | 26.03 | | | 1,028,453 | |
| | | | | | | | | | | |
| (1) Excludes restricted stock and stock-settled stock appreciation rights. | | | |
PDI, Inc.
Annual Report on Form 10-K (continued)
| Plan Category | | Number of securities to be issued upon exercise of outstanding options, warrants and rights | | Weighted-average exercise price of outstanding options, warrants and rights | | Number of securities remaining available for future issuance under equity compensation plans (excluding securities reflected in column (a)) | |
| | | (a) | | | (b) | | | (c) | |
| Equity compensation plans approved by security holders (2004 Stock Award and Incentive Plan, 2000 Omnibus Incentive Compensation Plan, and 1998 Stock Option Plan) | | | 304,531 | | | $ | 23.48 | | | | 1,208,697 | |
| | | | | | | | | | | | | |
| Equity compensation plans not approved by security holders (1) | | | - | | | | - | | | | - | |
| Total | | | 304,531 | | | $ | 23.48 | | | | 1,208,697 | |
| | | | | | | | | | | | | |
| (1) Excludes restricted stock, restricted stock units and stock-settled stock appreciation rights. | |
Issuer Purchases Of Equity Securities| Issuer Purchases of Equity Securities |
From time to time, we repurchase our common stock on the open market or in privately negotiated transactions or both. We did not repurchase any shares of our common stock during 2006. On November 7, 2006, we announced that our Board of Directors authorized us to repurchase up to one million shares of our common stock.stock, none of which have been repurchased. We havedid not repurchasedrepurchase any shares of our common stock on the open market during 2007 asor 2008. Any future purchases of the date of this Form 10-K. Purchases, if any,shares will be made from available cash.
Comparative Stock Performance Graph
The graph below compares the yearly percentage change in the cumulative total stockholder return on our common stock, based on the market price of our common stock, with the total return of companies included within the Nasdaq Composite Index for the period commencing December 31, 20012003 and ending December 31, 2006.2008. The calculation of total cumulative return assumes a $100 investment in the Company’sour common stock and the Nasdaq Composite Index on December 31, 2001,2003, and the reinvestment of all dividends.
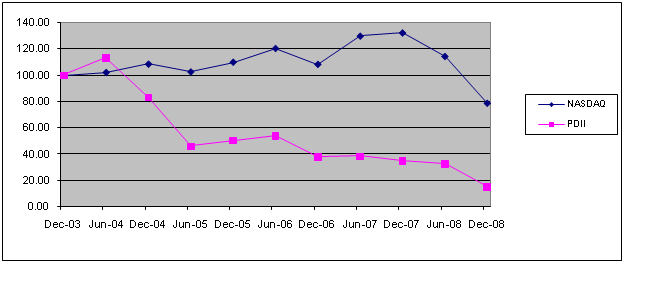
ITEM 6. SELECTED FINANCIAL DATA19
PDI, Inc.
Annual Report on Form 10-K (continued)
| ITEM 6. | SELECTED FINANCIAL DATA |
The selected financial data set forth below should be read in conjunction with "Management's Discussion and Analysis of Financial Condition and Results of Operations" and our consolidated financial statements and related notes appearing elsewhere in this Form 10-K. The operations data for the years ended December 31, 2006, 2005,2008, 2007, and 20042006 and the balance sheet data at December 31, 20062008 and 20052007 are derived from our audited consolidated financial statements appearing elsewhere in this Form 10-K. The operations data for the years ended December 31, 20032005 and 20022004 and the balance sheet data at December 31, 2004, 20032006, 2005 and 20022004 are derived from our audited consolidated financial statements that are not included in this Form 10-K. The historical results are not necessarily indicative of the results to be expected in any future period. Operations dataNo cash dividends have been declared for the year ended December 31, 2006 include the effect of adopting of SFAS No. 123, “(Revised 2004): Share-Based Payment” (FAS 123R) as of January 1, 2006. Operations data for the years ended December 31, 2005, 2004, 2003, and 2002 do not include any effect from FAS 123R.
period.
PDI, Inc.
Annual Report on Form 10-K (continued)
| (in thousands, except per share data) | | 2006 | | | | 2005 | | | | 2004 | | | | 2003 | | | | 2002 | | | | | 2008 | | | 2007 | | | 2006 | | | 2005 | | | 2004 | |
Continuing operations data: | | | | | | | | | | | | | | | | | | | | | | | | | | | | | | | | | | | | |
| Total revenues, net | | $ | 239,242 | | | | $ | 305,205 | | | | $ | 345,797 | | (4 | ) | $ | 330,547 | | (5 | ) | $ | 295,199 | | (5 | ) | | $ | 112,528 | | | $ | 117,131 | | | $ | 239,242 | | | $ | 305,205 | | | $ | 345,797 | (7) |
| Gross profit | | | 55,844 | | | | 52,402 | | | | 92,633 | | | | 84,960 | | | | 25,070 | | | | | 4,513 | (1) | | 31,615 | | | 55,844 | | | 52,402 | | | 92,633 | |
| | | | | | | | | | | | | | | | | | | | | | | | | | | | | | | | | | | | | | | | | | | |
| Operating expenses | | | 49,931 | | (1 | ) | | 65,064 | | (2 | ) | | 58,554 | | | | 65,897 | | | | 73,251 | | (6 | ) | | 40,917 | (2) | | 45,853 | (3) | | 49,931 | (4) | | 65,064 | (5) | | 58,554 | |
| Asset impairment | | | - | | | | | 6,178 | | (3 | ) | | - | | | | | - | | | | | - | | | | | | 23 | | | | 42 | | | | - | | | | 6,178 | (6) | | | - | |
| Total operating expenses | | | 49,931 | | | | 71,242 | | | | 58,554 | | | | 65,897 | | | | 73,251 | | | | | 40,940 | | | 45,895 | | | 49,931 | | | 71,242 | | | 58,554 | |
| | | | | | | | | | | | | | | | | | | | | | | | | | | | | | | | | | | | | | | | | | | |
| Income (loss) from | | | | | | | | | | | | | | | | | | | | | | | |
| (Loss) income from | | | | | | | | | | | | | | | | | | | | | |
| continuing operations | | $ | 11,375 | | | | $ | (11,407 | ) | | | $ | 20,435 | | | | $ | 11,931 | | | | $ | (29,540 | ) | | | | $ | (34,461) | | | $ | (9,974) | | | $ | 11,375 | | | $ | (11,407) | | | $ | 20,435 | |
| | | | | | | | | | | | | | | | | | | | | | | | | | | | | | | | | | | | | | | | | | | |
Per share data from continuing operations: | | | | | | | | | | | | | | | | | | | | | | | | | | | Per share data from continuing operations: | | | | | | | | | | | | | | | | | |
| Income (loss) per share of common stock | | | | | | | | | | | | | | | | | | | | | | | |
| (Loss) income per share of common stock | | (Loss) income per share of common stock | | | | | | | | | | | | | | | | | |
| Basic | | $ | 0.82 | | | | $ | (0.80 | ) | | | $ | 1.40 | | | | $ | 0.84 | | | | $ | (2.11 | ) | | | | $ | (2.46) | | | $ | (0.72) | | | $ | 0.82 | | | $ | (0.80) | | | $ | 1.40 | |
| Diluted | | $ | 0.81 | | | | $ | (0.80 | ) | | | $ | 1.37 | | | | $ | 0.83 | | | | $ | (2.11 | ) | | | | $ | (2.46) | | | $ | (0.72) | | | $ | 0.81 | | | $ | (0.80) | | | $ | 1.37 | |
| | | | | | | | | | | | | | | | | | | | | | | | | | | | | | | | | | | | | | | | | | | |
Weighted average number of shares outstanding: | | | | | | | | | | | | | | | | | | | | | | | | | | | Weighted average number of shares outstanding: | | | | | | | | | | | | | | | | | |
| Basic | | | 13,859 | | | | 14,232 | | | | 14,564 | | | | 14,231 | | | | 14,033 | | | | | 14,012 | | | 13,940 | | | 13,859 | | | 14,232 | | | 14,564 | |
| Diluted | | | 13,994 | | | | 14,232 | | | | 14,893 | | | | 14,431 | | | | 14,033 | | | | | 14,012 | | | 13,940 | | | 13,994 | | | 14,232 | | | 14,893 | |
| | | | | | | | | | | | | | | | | | | | | | | | | | | | | | | | | | | | | | | | | | | |
Balance sheet data: | | | | | | | | | | | | | | | | | | | | | | | | | | | | | | | | | | | | | | | | | | | | | | |
| Cash and short-term investments | | $ | 114,684 | | | | $ | 97,634 | | | | $ | 109,498 | | | | $ | 114,632 | | | | $ | 72,661 | | | | | $ | 90,233 | | | $ | 106,985 | | | $ | 114,684 | | | $ | 97,634 | | | $ | 109,498 | |
| Working capital | | | 112,186 | | | | 92,264 | | | | 96,156 | | | | 100,009 | | | | 81,854 | | | | | 81,639 | | | 110,739 | | | 112,186 | | | 92,264 | | | 96,156 | |
| Total assets | | | 201,636 | | | | 200,159 | | | | 224,705 | | | | 219,623 | | | | 190,939 | | | | | 149,036 | | | 179,554 | | | 201,636 | | | 200,159 | | | 224,705 | |
| Total long-term debt | | | - | | | | - | | | | - | | | | - | | | | - | | | | | - | | | - | | | - | | | - | | | - | |
| Stockholders' equity | | | 149,197 | | | | 135,610 | | | | 165,425 | | | | 138,488 | | | | 123,211 | | | | | 107,107 | | | 140,189 | | | 149,197 | | | 135,610 | | | 165,425 | |
| | (1) | Includes $10.3 million in charges related to an accrued contract loss. See Note 10 to the consolidated financial statements for more details. |
(1) | (2) | Includes $1.2 million in charges for executive severance costs and $0.1 million in facilities realignment costs. See Notes 15 and 16 to the consolidated financial statements for more details. |
| (3) | Includes $1.0 million in charges for facilities realignment costs. See Note 16 to the consolidated financial statements for more details. |
| (4) | Includes $4.0 million in credits to legal expense related to settlements in the Cellegysettlement of certain litigation matter and the California class action lawsuitmatters and $2.0 million in charges for facilities realignment costs. See Note 9 and Note 1716 to the consolidated financial statements for more details. As a result of adopting FAS 123R in 2006 there was an additional $290,000 recognized in stock compensation expense. |
| | (2)
(5) | Includes $5.7 million for executive severance costs and $2.4 million for facilities realignment costs. See Notes 1615 and 1716 to the consolidated financial statements for more details. |
| | (3)
(6) | Asset impairment charges include a $3.3 million non-cash charge for the impairment of the goodwill associated with the Select Access reporting unit; and a $2.8 million non-cash charge for the impairment of the Siebel sales force automation platform. See Notes 4 and 5 to the consolidated financial statements for more details. |
| | (4)
(7) | Includes revenue of $4.9 million associated with the acquisition of Pharmakon on August 31, 2004. |
| (5)
| Includes product revenue of negative $11.6 million in 2003 for the Ceftin returns reserve, which we began selling in the fourth quarter of 2000. For 2002, it includes product revenue of $6.4 million that related to Ceftin. See Note 15 to the consolidated financial statements for more details. |
| (6)
| Includes $15.0 million for the initial licensing fee associated with the Cellegy License Agreement, and $3.2 million associated with our 2002 restructuring. |
PDI, Inc.
Annual Report on Form 10-K (continued)
ITEM 7.MANAGEMENT'S DISCUSSION AND ANALYSIS OF FINANCIAL CONDITION AND RESULTS OF OPERATIONS
We make forward-looking statements that involve risks, uncertainties and assumptions in this Form 10-K. Actual results may differ materially from those anticipated by these forward-looking statements as a result of various factors, including, but not limited to, those presented under the captions “Forward-Looking Statement Information” and “Risk Factors” contained elsewhere in this Form 10-K.| ITEM 7. | MANAGEMENT'S DISCUSSION AND ANALYSIS OF FINANCIAL CONDITION AND RESULTS OF OPERATIONS |
The following Management’s Discussion and Analysis of Financial Condition and Results of Operations should be read in conjunction with our consolidated financial statements and the related notes appearing elsewhere in this Form 10-K.
OVERVIEW
We are a diversifiedleading provider of contract sales teams in the United States to pharmaceutical companies. Additionally, we provide marketing research and physician interaction programs. Our services offer customers a range of promotional options for the commercialization of their products throughout their lifecycles, from development through maturity.
Our business depends in large part on demand from the pharmaceutical and life sciences industries for outsourced sales and marketing services. In recent years, this demand has been adversely impacted by certain industry-wide factors affecting pharmaceutical companies in recent years, including, among other things, pressures on pricing and access, successful challenges to intellectual property rights (including the introduction of competitive generic products), a strict regulatory environment and decreased pipeline productivity. Recently, there has been a slow-down in the rate of approval of new products by the FDA and this trend may continue. Additionally, a number of pharmaceutical companies have recently made changes to their commercial models by reducing the number of sales representatives employed internally and through outside organizations like PDI. A very significant source of our revenue is derived from our sales force arrangements with large pharmaceutical companies, and we have therefore been significantly impacted by cost control measures implemented by these companies, including a substantial reduction in the number of sales representatives deployed. This has culminated in the expiration or termination of a number of our significant sales force contracts during 2006 and 2007, including our sales force engagements with AstraZeneca, GlaxoSmithKline, sanofi-aventis and another large pharmaceutical company customer. These four customers accounted for approximately $150.9 million in revenue during 2006 and $15.9 million in revenue during 2007. In addition, a significant sales force program for one of our clients was terminated, effective September 30, 2008, due to generic product competition. This program accounted for approximately $10.7 million in revenue in 2008. This reduction in demand for outsourced pharmaceutical sales and marketing services company servingcould be further exacerbated by the biopharmaceuticalcurrent economic and financial crisis occurring in the United States and worldwide. For example, certain customers within our marketing services business segment have recently delayed the implementation or reduced the scope of a number of marketing initiatives. If companies in the life sciences industries. We createindustries significantly reduce their promotional, marketing and executesales expenditures or significantly reduce or eliminate the role of pharmaceutical sales representatives in the promotion of their products, our business, financial condition and results of operations would be materially and adversely affected.
While we recognize that there is currently significant volatility in the markets in which we provide services, we believe there are opportunities for growth of our sales and marketing programs. We do this by workingservices businesses, which provide our pharmaceutical company clients with companies who own the intellectual property rightsflexibility to these productssuccessfully respond to a constantly changing market and recognize our ability to add value to these products and maximize their sales performance.a means of controlling costs through outsourcing. We have a varietyrecently intensified our focus on strengthening all aspects of agreement typesthe core CSO business that we enter into withbelieve will most favorably position PDI as the best in class contract sales organization in the United States. In addition, we also continue to focus on enhancing our customers, from fee forcommercialization capabilities by aggressively promoting and broadening the depth of the value-added service arrangements to arrangements which involve risk-sharingofferings of our existing marketing services businesses, TVG and incentive based provisions.Pharmakon.
DESCRIPTION OF REPORTING SEGMENTS AND NATURE OF CONTRACTS
InFor the fourth quarter of 2005, we announced that we would be discontinuing our medical devices and diagnostics (MD&D) business unit. Beginning in the second quarter of 2006, the MD&D business unit was reported as discontinued operations. Atyear ended December 31, 2006,2008, our three reporting segments arewere as follows:
¨Sales Services: | ¨ | Sales Services, which is comprised of the following business units: |
| | · | Performance Sales Teams; and |
| · | Vital Issues in Medicine (VIM)®;Services, which is comprised of the following business units: |
| | · | TVG Marketing Research and Consulting (TVG); and |
| · | Vital Issues in Medicine (VIM)®. |
| ¨ | Product Commercialization. |
¨PDI Products Group (PPG).
An analysisSelected financial information for each of these reporting segments and their results of operations is contained in Note 2120 to ourthe condensed consolidated financial statements and in the discussion under “Consolidated Results of OperationsOperations.” discussion below.
Description of Businesses
Sales Services
This segment includes our Performance Sales Teams and Select Access’ Teams (formerly referred to as Shared Teams). This segment, which focuses on product detailing, represented 84.7% of consolidated revenue for the year ended December 31, 2006.
Product detailing involves a representative meeting face-to-face with targeted physicians and other healthcare decision makers to provide a technical review of the product being promoted. Contract sales teams can be deployed on either a dedicated or shared basis.
Performance Sales Teams (formerly Dedicated Teams)
A performance contract sales team works exclusively on behalf of one customer. The sales team is customized to meet the specifications of the team’s customer with respect to representative profile, physician targeting, product training, incentive compensation plans, integration with customers’ in-house sales forces, call reporting platform and data integration. Without adding permanent personnel, the customer gets a high quality, industry-standard sales team comparable to its internal sales force.
PDI, Inc.
Annual Report on Form 10-K (continued)
Select Access’
Select Access represents a shared sales team business model where multiple non-competing brands are represented for different pharmaceutical companies. Using these teams, we make a face-to-face selling resource available to those customers that want an alternative to a dedicated team. PDI Select Access is a leading provider of these detailing programs in the U.S. Since costs are shared among various companies, these programs may be less expensive for the customer than programs involving a dedicated sales force. With a shared sales team, the customer still receives targeted coverage of its physician audience within the representatives’ geographic territories.
Marketing Services
This segment, which includes our Pharmakon, TVG and VIM business units, represented 15.3% of consolidated revenue for the year ended December 31, 2006.
Pharmakon
Pharmakon’s emphasis is on the creation, design and implementation of promotional interactive peer persuasion programs. Each marketing program can be offered through a number of different venues, including teleconferences, dinner meetings, “lunch and learns,” and web casts. Within each of our programs, we offer a number of services including strategic design, tactical execution, technology support, audience recruitment, moderator services and thought leader management. In the last ten years, Pharmakon has conducted over 45,000 peer persuasion programs with more than 550,000 participants. Pharmakon’s peer programs can be designed as promotional or marketing research/advisory programs. In addition to peer persuasion programs, Pharmakon also provides promotional communications activities. We acquired Pharmakon in August 2004.
TVG Marketing Research & Consulting
TVG employs leading edge, and in some instances proprietary, research methodologies. We provide qualitative and quantitative marketing research to pharmaceutical companies with respect to healthcare providers, patients and managed care customers in the U.S. and globally. We offer a full range of pharmaceutical marketing research services, including studies to identify the highest impact business strategy, profile, positioning, message, execution, implementation and post implementation for a product. Our marketing research model improves the knowledge customers obtain about how physicians and other healthcare professionals will likely react to products.
We utilize a systematic approach to pharmaceutical marketing research. Recognizing that every marketing need, and therefore every marketing research solution, is unique, we have developed our marketing model to help identify the work that needs to be done in order to identify critical paths to marketing goals. At each step of the marketing model, we can offer proven research techniques, proprietary methodologies and customized study designs to address specific product needs.
Vital Issues in Medicine
VIM develops and executes continuing medical education services funded by the biopharmaceutical and medical device and diagnostics industries. Using an expert-driven, customized approach, we provide faculty development/advocacy, continuing medical education activities in a wide variety of formats, and interactive initiatives to generate added-value to our customers' portfolios.
PDI Products Group (PPG)
The goal of the PPG segment was to source biopharmaceutical products in the U.S. through licensing, copromotion, acquisition or integrated commercialization services arrangements. This segment did not have any revenue for the years ended December 31, 2006 and 2005.
Notwithstanding the fact that we have in recent years shifted our near-term strategy to deemphasize the PPG segment and focus on our service businesses, we may continue to review opportunities which may include copromotion, distribution arrangements, licensing and brand ownership of products. We currently do not expect any activity within the PPG segment in 2007.
Discontinued Operations
MD&D Contract Sales and Clinical Sales Teams
Our medical teams group provided an array of sales and marketing services to the MD&D industry. It provided dedicated sales teams to the MD&D industry as well as clinical after sales support teams.
PDI, Inc.
Annual Report on Form 10-K (continued)
Nature of Contracts by Segment
Our contracts are nearly all fee for service. They may contain operational benchmarks, such as a minimum amount of activity within a specified amount of time. These contracts may include incentive payments that can be earned if our activities generate results that meet or exceed performance targets. Contracts may be terminated with or without cause by our customers. Certain contracts provide that we may incur specific penalties if we fail to meet stated performance benchmarks. Occasionally, our contracts may require us to meet certain financial covenants, such as maintaining a specified minimum amount of working capital.
Sales Services
During fiscal 2006, the majority of our revenue was generated by contracts for dedicated sales teams. These contracts are generally for a term of one to two years and may be renewed or extended. The majority of these contracts, however, are terminable by the customer for any reason upon 30 to 90 days’ notice. Certain contracts provide for termination payments if the customer terminates the contract without cause. Typically, however, these penalties do not offset the revenue we could have earned under the contract or the costs we may incur as a result of its termination. The loss or termination of a large contract or the loss of multiple contracts could have a material adverse effect on our business, financial condition or results of operations.
Marketing Services
Our marketing services contracts generally take the form of either master service agreements with a term of one to three years or contracts specifically related to particular projects with terms typically lasting from two to six months. These contracts are generally terminable by the customer for any reason. Upon termination, the customer is generally responsible for payment for all work completed to date, plus the cost of any nonrefundable commitments made on behalf of the customer. There is significant customer concentration in our Pharmakon business, and the loss or termination of one or more of Pharmakon’s large master service agreements could have a material adverse effect on our business, financial condition or results of operations. Due to the typical size of most of TVG’s and VIM’s contracts, it is unlikely the loss or termination of any individual TVG or VIM contract would have a material adverse effect on our business, financial condition or results of operations.
PPG
The contracts within the products group were either performance based or fee for service and may have required sales, marketing and distribution of a product. In performance based contracts, we typically provided and financed a portion, if not all, of the commercial activities in support of a brand in return for a percentage of product sales. An important performance parameter was normally the level of sales or prescriptions attained by the product during the period of our marketing or promotional responsibility, and in some cases, for periods after our promotional activities have ended.
CRITICAL ACCOUNTING POLICIES
We prepare our financial statements in accordance with U.S. generally accepted accounting principles (GAAP). The preparation of financial statements and related disclosures in conformity with GAAP requires our management to make judgments, estimates and assumptions at a specific point in time that affect the amounts reported in the consolidated financial statements and disclosed in the accompanying notes. These assumptions and estimates are inherently uncertain. Outlined below are accounting policies, which are important to our financial position and results of operations, and require the most significant judgments on the part of our management in their application. Some of those judgments can be subjective and complex. Management’s estimates are based on historical experience, information from third-party professionals, facts and circumstances available at the time and various other assumptions that are believed to be reasonable. Actual results could differ from those estimates. Additionally, changes in estimates could have a material impact on our consolidated results of operations in any one period. For a summary of all of our significant accounting policies, including the accounting policies discussed below, see Note 1 to our consolidated financial statements.
Goodwill, Intangibles and Other Long-Lived Assets
We account for our purchases of acquired companies in accordance with SFAS No. 141, "Business Combinations" (FAS 141) and account for the related goodwill and other identifiable definite and indefinite-lived acquired intangible assets in accordance with SFAS No. 142, “Goodwill and Other Intangible Assets” (FAS 142). Additionally, we review our lived-assets for recoverability in accordance with SFAS No. 144, “Accounting for the Impairment or Disposal of Long-Lived Assets” (FAS 144).
PDI, Inc.
Annual Report on Form 10-K (continued)
The identification and valuation of these intangible assets and the determination of the estimated useful lives at the time of acquisition, as well as the completion of annual impairment tests require significant management judgments and estimates. These estimates are made based on, among others, consultations with an accredited independent valuation consultant, reviews of projected future cash flows and statutory regulations. In accordance with FAS 141, we allocate the cost of the acquired companies to the identifiable tangible and intangible assets and liabilities acquired, with the remaining amount being classified as goodwill. Since the entities we have acquired do not have significant tangible assets, a significant portion of the purchase price has been allocated to intangible assets and goodwill. The use of alternative estimates and assumptions could increase or decrease the estimated fair value of our goodwill and other intangible assets, and potentially result in a different impact to our results of operations. Further, changes in business strategy and/or market conditions may significantly impact these judgments thereby impacting the fair value of these assets, which could result in an impairment of the goodwill and acquired intangible assets.
We have elected to do the annual tests for indications of goodwill impairment as of December 31of each year. We utilize a discounted cash flow model to determine fair value in the goodwill impairment evaluation. In assessing the recoverability of goodwill, projections regarding estimated future cash flows and other factors are made to determine the fair value of the respective reporting units.
We review the carrying value of long-lived assets for impairment whenever events or changes in circumstances indicate that the carrying value of such assets may not be recoverable. If the sum of the expected future undiscounted cash flows is less than the carrying amount of the asset, an impairment loss is recognized by reducing the recorded value of the asset to its fair value.
While we use available information to prepare our estimates and to perform impairment evaluations, actual results could differ significantly from these estimates or related projections, resulting in impairment and losses related to recorded goodwill or long-lived asset balances.
Revenue Recognition and Associated Costs
Revenue and associated costs under pharmaceutical detailing contracts are generally based on the number of physician details made or the number of sales representatives utilized. With respect to risk-based contracts, all or a portion of revenues earned are based on contractually defined percentages of either product revenues or the market value of prescriptions written and filled in a given period. These contracts are generally for terms of one to two years and may be renewed or extended. The majority of these contracts, however, are terminable by the customer for any reason upon 30 to 90 days’ notice. Certain contracts provide for termination payments if the customer terminates usthe agreement without cause. Typically, however, these penalties do not offset the revenue we could have earned under the contract or the costs we may incur as a result of its termination.
The loss or termination of a large pharmaceutical detailing contract or the loss of multiple contracts could have a material adverse effect on our business, financial condition or results of operations. Historically, we have derived a significant portion of its service revenue from a limited number of customers. Concentration of business in the pharmaceutical services industry is common and the industry continues to consolidate. As a result, we are likely to continue to experience significant customer concentration in future periods. For the years ended December 31, 2008 and 2007, our three largest customers, who each individually represented 10% or more of our service revenue, together accounted for approximately 52.5% and 37.9% of its service revenue, respectively. For the year ended December 31, 2006 our two largest customers, who each individually represented 10% or more of our service revenue, together accounted for approximately 46.8% of our service revenue. See Note 14 to theour consolidated financial statements.
Revenue and associated costs under marketing service contracts are generally based on a single deliverable such as a promotional program, accredited continuing medical education seminar or marketing research/advisory program. The contracts are generally terminable by the customer for any reason. Upon termination, the customer is generally responsible for payment for all work completed to date, plus the cost of any nonrefundable commitments made on behalf of the customer. There is significant customer concentration in our Pharmakon business, and the loss or termination of one or more of Pharmakon’s large master service agreements wouldcould have a material adverse effect on our business, financial condition or results of operations. Due to the typical size of most contracts of TVG and VIM, it is unlikely the loss or termination of any individual TVG or VIM contract.contract would have a material adverse effect on our business, financial condition or results of operations.
Service revenue is recognized on product detailing programs and certain marketing, promotional and medical education contracts as services are performed and the right to receive payment for the services is assured. Many of the product detailing contracts allow for additional periodic incentive fees to be earned if certain performance benchmarks have been attained. Revenue earned from incentive fees is recognized in the period earned and when we are reasonably assured that payment will be made. Under performance based contracts, revenue is recognized when the performance based parameters are achieved. Many contracts also stipulate penalties if agreed upon performance benchmarks have not been met. Revenue is recognized net of any potential penalties until the performance criteria relating to the penalties have been achieved. Commissions based revenue is recognized when performance is completed. Revenue from recruiting and hiring contracts is recognized at the time the candidate begins full-time employment less a provision for sales allowances based on contractual commitments and historical experience. Revenue and associated costs from marketing research contracts are recognizerecognized upon completion of the contract. These contracts are generally short-term in nature typically lasting two to six months.
PDI, Inc.
Annual Report on Form 10-K (continued)
Under our promotional program included in the product commercialization segment, we recognize revenue quarterly based on a specified formula set forth in our product commercialization agreement with Novartis related to product sales for the quarter. We will not receive any compensation during any quarter in which product sales are below certain thresholds established for that quarter as set forth in the agreement. Revenues recognized (if any) under this agreement will be directly impacted by prescription data provided by a third party vendor and other information provided by Novartis. Additionally, we must perform a minimum number of sales calls to designated physicians each year, and the failure to satisfy this requirement could result in penalties being imposed on PDI or provide the customer with the ability to terminate the agreement.
Cost of services consist primarily of the costs associated with executing product detailing programs, performance based contracts or other sales and marketing services identified in the contract. Cost of services include personnel costs and other costs associated with executing a product detailing or other marketing or promotional program, as well as the initial direct costs associated with staffing a product detailing program. Such costs include, but are not limited to, facility rental fees, honoraria and travel expenses, sample expenses and other promotional expenses.
Personnel costs, which constitute the largest portion of cost of services, include all labor related costs, such as salaries, bonuses, fringe benefits and payroll taxes for the sales representatives, and sales managers and professional staff that are directly responsible for executing a particular program. Initial direct program costs are those costs associated with initiating a product detailing program, such as recruiting, hiring, and training the sales representatives who staff a particular product detailing program. All personnel costs and initial direct program costs, other than training costs, are expensed as incurred for service offerings.
Reimbursable out-of-pocket expenses include those relating to travel and other similar costs, for which we arethe Company is reimbursed at cost by ourits customers. In accordance with the requirements of Emerging Issues Task Force No. 01-14, “Income Statement Characterization of Reimbursements Received for Out-of-Pocket Expenses Incurred” (EITF 01-14), reimbursements received for out-of-pocket expenses incurred are characterized as revenue and an identical amount is included as cost of goods and services in the consolidated statements of operations.
Training costs include the costs of training the sales representatives and managers on a particular product detailing program so that they are qualified to properly perform the services specified in the related contract. For allthe majority of the Company’s contracts, training costs are reimbursable out-of-pocket expenses. For contracts where the Company is responsible for training costs, these costs are deferred and amortized on a straight-line basis over the shorter of the life of the contract to which they relate or 12 months. When we receive a specific contract payment from a customer upon commencement of a product detailing program expressly
Contract Loss Provisions
Provisions for losses to compensate us for recruiting, hiring and training services associated with staffing that program, such payment is deferred andbe incurred on contracts are recognized as revenuein full in the same period in which it is determined that the recruiting and hiring expenses are incurred and amortizationa loss will result from performance of the deferred training is expensed. When we do not receivecontractual arrangement. Performance based contracts have the potential for higher returns but also an increased risk of contract loss as compared to the traditional fee for service contracts. We recognized a specific contract payment for training, all revenue is deferred and recognized over the life of the contract.loss related to our product commercialization agreement in 2008. See Note 10 to our consolidated financial statements.
Product revenue was recognized when products are shipped and title is transferred to the customer. Product revenue for the year ended December 31, 2004 was negative, primarily from the adjustments to the Ceftin sales returns reserve, as discussed in Note 15, net of the sale of the Xylos Corporation (Xylos) wound care products.
Cost of goods sold includes all expenses for product distribution costs, acquisition and manufacturing costs of the product sold.
Loans and Investments in Privately Held Entities
From time to time, we make investments in and/or loans to privately-held companies. We consider whether the fair values of any investments in privately held entities have declined below their carrying value whenever adverse events or changes in circumstances indicate that recorded values may not be recoverable. If we considered any such decline to be other than temporary (based on various factors, including historical financial results, and the overall health of the investee’s industry), a write-down would be recorded to estimated fair value. Additionally, on a quarterly basis, we review outstanding loans receivable to determine if a provision for doubtful accounts is necessary. Our review includes discussions with senior management of the investee, and evaluations of, among other things, the investee’s progress against its business plan, its product development activities and customer base, industry market conditions, historical and projected financial performance, expected cash needs and recent funding events. Our assessments of value are highly subjective given that these companies may be at an early stage of development and rely regularly on their investors for cash infusions.
Allowance for Doubtful Accounts
We maintain allowances for doubtful accounts for estimated losses resulting from the inability of our customers to make required payments. We review a customer’s credit history before extending credit. We establish an allowance for doubtful accounts based on the aging of a customer’s accounts receivable or when we become aware of a customer’s inability to meet its financial obligations (e.g., a bankruptcy filing). We operate almost exclusively in the pharmaceutical industry and to a great extent our revenue is dependent on a limited number of large pharmaceutical companies. We also partner with customers in the emerging pharmaceutical sector, some of whom may have limited financial resources. A general downturn in the pharmaceutical industry or a material adverse event to one or more of our emerging pharmaceutical customers could result in higher than expected customer defaults requiring additional allowances.
PDI, Inc.
Annual Report on Form 10-K (continued)
Self-Insurance AccrualsGoodwill, Intangibles and Other Long-Lived Assets
We are self-insured for certain losses for claims filed and claims incurred but not reported relating to workers’ compensation and automobile-related losses for our company-leased cars. Our liability is estimated on an actuarial undiscounted basis using individual case-based valuations and statistical analysis supplied by our insurance brokers and insurers and is based upon judgment and historical experience; however,allocate the final cost of manyacquired companies to the identifiable tangible and intangible assets and liabilities acquired, with the remaining amount being classified as goodwill. Since the entities we have acquired do not have significant tangible assets, a significant portion of the purchase price has been allocated to intangible assets and goodwill. The identification and valuation of these claimsintangible assets and the determination of the estimated useful lives at the time of acquisition, as well as the completion of annual impairment tests require significant management judgments and estimates. These estimates are made based on, among other factors, consultations with an accredited independent valuation consultant, reviews of projected future operating results and business plans, economic projections, anticipated future cash flows and the cost of capital. The use of alternative estimates and assumptions could increase or decrease the estimated fair value of goodwill and other intangible assets, and potentially result in a different impact to our results of operations. Further, changes in business strategy and/or market conditions may significantly impact these judgments thereby impacting the fair value of these assets, which could result in an impairment of the goodwill and acquired intangible assets.
We test goodwill for impairment at least annually and whenever events or circumstances change that indicate impairment may have occurred. These events or circumstances could include a significant long-term adverse change in the business climate, poor indicators of operating performance or a sale or disposition of a significant portion of a reporting unit. We test goodwill for impairment at the reporting unit level, which is one level below its operating segments. Goodwill has been assigned to the reporting units to which the value of the goodwill relates. We currently have six reporting units; however, only one reporting unit, Pharmakon, includes goodwill. Goodwill is tested by estimating the fair value of the reporting unit using a discounted cash flow model. The estimated fair value of the reporting unit is then compared with the carrying value including goodwill, to determine if any impairment exists. In assessing the recoverability of goodwill, projections regarding estimated future cash flows and other factors are made to determine the fair value of the respective reporting units. The key estimates and factors used in the discounted cash flow valuation include revenue growth rates and profit margins based on internal forecasts, terminal value and the weighted-average cost of capital used to discount future cash flows.
We review the recoverability of long-lived assets and finite-lived intangible assets whenever events or changes in circumstances indicate that the carrying value of such assets may not be knownrecoverable. If the sum of the expected future undiscounted cash flows is less than the carrying amount of the asset, an impairment loss is recognized by reducing the recorded value of the asset to its fair value measured by future discounted cash flows. This analysis requires estimates of the amount and timing of projected cash flows and, where applicable, judgments associated with, among other factors, the appropriate discount rate. Such estimates are critical in determining whether any impairment charge should be recorded and the amount of such charge if an impairment loss is deemed to be necessary. In addition, future events impacting cash flows for five yearsexisting assets could render a write-down or longer. We maintain stop-loss coverage with third-party insurers to limit our total exposure on these programs. Management reviews these accruals on a quarterly basis. At December 31, 2006 and 2005, self-insurance accruals totaled $2.5 million and $3.8 million, respectively.
Contingencieswrite-off necessary that previously required no such write-down or write-off.
While we use available information to prepare our estimates and to perform impairment evaluations, actual results could differ significantly from these estimates or related projections, resulting in impairment and losses related to recorded goodwill or long-lived asset balances.
Contingencies
In the normal course of business, we are subject to various contingencies. Contingencies are recorded in the consolidated financial statements when it is probable that a liability will be incurred and the amount of the loss can be reasonably estimated, or otherwise disclosed, in accordance with SFAS No. 5, “Accounting for Contingencies” (SFAS 5).disclosed. We are currently involved in certain legal proceedings and, as required, we have accrued our estimate of the probable costs for the resolution of these claims. These estimates are developed in consultation with outside counsel and are based upon an analysis of potential results, assuming a combination of litigation and settlement strategies. Predicting the outcome of claims and litigation, and estimating related costs and exposures, involves substantial uncertainties that could cause actual costs to vary materially from estimates.
Income Taxes
In accordance with the provisions of SFAS No. 109, “Accounting for Income Taxes,” weWe account for income taxes using the asset and liability method. This method requires recognition of deferred tax assets and liabilities for expected future tax consequences of temporary differences that currently exist between tax bases and financial reporting bases of our assets and liabilities based on enacted tax laws and rates. A valuation allowance is established, when necessary, to reduce the deferred income tax assets when it is more likely than not that all or a portion of a deferred tax asset will not be realized.
PDI, Inc.
Annual Report on Form 10-K (continued)
We operate in multiple tax jurisdictions and provide taxes in each jurisdiction where we conduct business and are subject to taxation. The breadth of our operations and the complexity of the various tax laws require assessments of uncertainties and judgments in estimating the ultimate taxes we will pay. The final taxes paid are dependent upon many factors, including negotiations with taxing authorities in various jurisdictions, outcomes of tax litigation and resolution of proposed assessments arising from federal and state audits. We have established estimated liabilities for federal and state income tax exposures that arise and meet the criteria for accrual under SFAS 5.arise. These accruals represent accounting estimates that are subject to inherent uncertainties associated with the tax audit process. We adjust these accruals as facts and circumstances change, such as the progress of a tax audit. We believe that any potential audit adjustments will not have a material adverse effect on our financial condition or liquidity. However, any adjustments made may be material to our consolidated results of operations for a reporting period.
Significant judgment is also required in evaluating the need for and magnitude of appropriate valuation allowances against deferred tax assets. Deferred tax assets are regularly reviewed for recoverability. We currently have significant deferred tax assets resulting from net operating loss carryforwards and deductible temporary differences. The realization of these assets is dependent on generating future taxable income. AWe perform an analysis quarterly to determine whether the expected future income will more likely than not be sufficient to realize the deferred tax assets. Our recent operating results and projections of future income weighed heavily in our overall assessment. The minimum amount of future taxable income that would have to be generated to realize our net deferred tax assets is approximately $30 million and the existing levels of pretax earnings for financial reporting purposes are not sufficient to generate this amount of future taxable income. As a result, we established a full federal and state valuation allowance is required whenfor the net deferred tax assets at December 31, 2008 and 2007 because we determined that it iswas more likely than not that all or a portion of a deferred tax asset willthese assets would not be realized.
Prior to October 1, 2008, we were self-insured for certain losses for claims filed and claims incurred but not reported relating to workers’ compensation and automobile-related liabilities for Company-leased cars. Beginning October 1, 2008, we are fully-insured through an outside carrier for these losses. Our liability for claims filed and claims incurred but not reported prior to October 1, 2008 is estimated on an actuarial undiscounted basis supplied by its insurance brokers and insurers using individual case-based valuations and statistical analysis and is based upon judgment and historical experience, however, the final cost of many of these claims may not be known for five years or longer. We also are self-insured for benefits paid under employee healthcare programs. Our liability for healthcare claims is estimated using an underwriting determination which is based on current year’s average lag days between when a claim is incurred to when it is paid. We maintain stop-loss coverage with third-party insurers to limit our total exposure on all of these programs. Periodically, we evaluate the level of insurance coverage and adjust insurance levels based on risk tolerance and premium expense. Management reviews our self-insurance accruals on a quarterly basis. Actual results can vary from these estimates, which results in adjustments in the period of the change in estimate.
The estimated compensation cost associated with the granting of stock-based awards is based on the grant date fair value of the stock award on the date of grant. We recognize the compensation cost, net of estimated forfeitures, over the vesting term. Forfeitures are initially estimated based on historical information and subsequently updated over the life of the awards to ultimately reflect actual forfeitures. As a result, changes in forfeiture activity can influence the amount of stock compensation cost recognized from period to period.
We primarily use the Black-Scholes option pricing model to determine the fair value of stock options and stock-based stock appreciation rights (SARs). The determination of the fair value of stock-based payment awards is made on the date of grant and is affected by our stock price as well as assumptions made regarding a number of complex and subjective variables. These assumptions including our expected stock price volatility over the term of the awards, actual and projected employee stock option exercise behaviors, the risk-free interest rate, and expected dividend yield. Our assumptions are detailed in Note 13 to our consolidated financial statements.
Changes in the valuation assumptions could result in a significant change to the cost of an individual award. However, the total cost of an award is also a function of the number of awards granted, and as result, we have the ability to manage the cost and value of our equity awards by adjusting the number of awards granted.
PDI, Inc.
Annual Report on Form 10-K (continued)
Restructuring, Facilities Realignment and Related Costs
From time to time, in order to consolidate operations, downsize and improve operating efficiencies, we recognize restructuring or facilities realignment charges. The recognition of these charges requires estimates and judgments regarding employee termination benefits, lease termination costs and other exit costs to be incurred when these actions take place. Actual results can vary from these estimates, which results in adjustments in the period of the change in estimate.
PDI, Inc.
Annual Report on Form 10-K (continued)
CONSOLIDATED RESULTS OF OPERATIONS| CONSOLIDATED RESULTS OF OPERATIONS |
The following table sets forth for the periods indicated below selected statement of continuing operations data as a percentage of revenue. The trends illustrated in this table may not be indicative of future operating results.
| | | Years Ended December 31, | |
| Continuing operations data | | 2008 | | | 2007 | | | 2006 | | | 2005 | | | 2004 | |
| Revenues: | | | | | | | | | | | | | | | |
| Service, net | | | 100.0 | % | | | 100.0 | % | | | 100.0 | % | | | 100.0 | % | | | 100.4 | % |
| Product, net | | | - | | | | - | | | | - | | | | - | | | | (0.4 | %) |
| Total revenues, net | | | 100.0 | % | | | 100.0 | % | | | 100.0 | % | | | 100.0 | % | | | 100.0 | % |
| Cost of goods and services: | | | | | | | | | | | | | | | | | | | | |
| Cost of services | | | 96.0 | % | | | 73.0 | % | | | 76.7 | % | | | 82.8 | % | | | 73.1 | % |
| Cost of goods sold | | | - | | | | - | | | | - | | | | - | | | | 0.1 | % |
| Total cost of goods and services | | | 96.0 | % | | | 73.0 | % | | | 76.7 | % | | | 82.8 | % | | | 73.2 | % |
| | | | | | | | | | | | | | | | | | | | | |
| Gross profit | | | 4.0 | % | | | 27.0 | % | | | 23.3 | % | | | 17.2 | % | | | 26.8 | % |
| | | | | | | | | | | | | | | | | | | | | |
| Operating expenses: | | | | | | | | | | | | | | | | | | | | |
| Compensation expense | | | 20.3 | % | | | 20.9 | % | | | 11.7 | % | | | 8.5 | % | | | 8.9 | % |
| Other selling, general and administrative | | | 14.7 | % | | | 17.1 | % | | | 9.5 | % | | | 9.6 | % | | | 7.2 | % |
| Asset impairment | | | - | | | | - | | | | - | | | | 2.0 | % | | | - | |
| Executive severance | | | 1.1 | % | | | - | | | | 0.2 | % | | | 1.9 | % | | | 0.1 | % |
| Legal and related costs, net | | | 0.2 | % | | | 0.3 | % | | | (1.4 | %) | | | 0.6 | % | | | 0.7 | % |
| Facilities realignment | | | 0.1 | % | | | 0.9 | % | | | 0.8 | % | | | 0.8 | % | | | - | |
| Total operating expenses | | | 36.4 | % | | | 39.2 | % | | | 20.9 | % | | | 23.3 | % | | | 16.9 | % |
| | | | | | | | | | | | | | | | | | | | | |
| Operating (loss) income | | | (32.4 | %) | | | (12.2 | %) | | | 2.5 | % | | | (6.2 | %) | | | 9.9 | % |
| Gain (loss) on investments | | | - | | | | - | | | | - | | | | 1.5 | % | | | (0.3 | %) |
| Interest income, net | | | 2.5 | % | | | 5.2 | % | | | 2.0 | % | | | 1.0 | % | | | 0.5 | % |
| (Loss) income from continuing operations | | | | | | | | | | | | | | | | | | | | |
| before income taxes | | | (29.8 | %) | | | (7.0 | %) | | | 4.5 | % | | | (3.7 | %) | | | 10.1 | % |
| Income tax expense (benefit) | | | 0.8 | % | | | 1.5 | % | | | (0.3 | %) | | | 0.1 | % | | | 4.2 | % |
| (Loss) income from continuing operations | | | (30.6 | %) | | | (8.5 | %) | | | 4.8 | % | | | (3.7 | %) | | | 5.9 | % |
| | | Years Ended December 31, | |
Continuing operations data | | 2006 | | 2005 | | 2004 | | 2003 | | 2002 | |
| Revenues: | | | | | | | | | | | |
| Service, net | | | 100.0 | % | | 100.0 | % | | 100.4 | % | | 103.5 | % | | 97.8 | % |
| Product, net | | | - | | | - | | | (0.4 | %) | | (3.5 | %) | | 2.2 | % |
| Total revenues, net | | | 100.0 | % | | 100.0 | % | | 100.0 | % | | 100.0 | % | | 100.0 | % |
| Cost of goods and services: | | | | | | | | | | | | | | | | |
| Cost of services | | | 76.7 | % | | 82.8 | % | | 73.1 | % | | 73.9 | % | | 91.5 | % |
| Cost of goods sold | | | - | | | - | | | 0.1 | % | | 0.4 | % | | - | |
| Total cost of goods and services | | | 76.7 | % | | 82.8 | % | | 73.2 | % | | 74.3 | % | | 91.5 | % |
| | | | | | | | | | | | | | | | | |
| Gross profit | | | 23.3 | % | | 17.2 | % | | 26.8 | % | | 25.7 | % | | 8.5 | % |
| | | | | | | | | | | | | | | | | |
| Operating expenses: | | | | | | | | | | | | | | | | |
| Compensation expense | | | 11.7 | % | | 8.5 | % | | 8.9 | % | | 10.6 | % | | 10.4 | % |
| Other selling, general and administrative | | | 9.5 | % | | 9.6 | % | | 7.2 | % | | 8.6 | % | | 13.3 | % |
| Asset impairment | | | - | | | 2.0 | % | | - | | | - | | | - | |
| Executive severance | | | 0.2 | % | | 1.9 | % | | 0.1 | % | | - | | | - | |
| Legal and related costs, net | | | (1.4 | %) | | 0.6 | % | | 0.7 | % | | 0.7 | % | | 1.1 | % |
| Facilities realignment | | | 0.8 | % | | 0.8 | % | | - | | | - | | | - | |
| Total operating expenses | | | 20.9 | % | | 23.3 | % | | 16.9 | % | | 19.9 | % | | 24.8 | % |
| | | | | | | | | | | | | | | | | |
| Operating income (loss) | | | 2.5 | % | | (6.2 | %) | | 9.9 | % | | 5.8 | % | | (16.3 | %) |
| Gain (loss) on investments | | | - | | | 1.5 | % | | (0.3 | %) | | - | | | - | |
| Interest income, net | | | 2.0 | % | | 1.0 | % | | 0.5 | % | | 0.3 | % | | 0.7 | % |
| Income (loss) from continuing operations | | | | | | | | | | | | | | | | |
| before income taxes | | | 4.5 | % | | (3.7 | %) | | 10.1 | % | | 6.1 | % | | (15.7 | %) |
| Income tax (benefit) expense | | | (0.3 | %) | | 0.1 | % | | 4.2 | % | | 2.5 | % | | (5.6 | %) |
| Income (loss) from continuing operations | | | 4.8 | % | | (3.7 | %) | | 5.9 | % | | 3.6 | % | | (10.0 | %) |
Comparison of 2006 and 2005
Revenue (in thousands) | | | | | | | |
| | | | | | | | | | |
| | | | | | | Change | | Change | |
| | | 2006 | | 2005 | | ($) | | (%) | |
| Sales services | | $ | 202,748 | | $ | 270,420 | | $ | (67,672 | ) | | (25.0 | %) |
| Marketing services | | | 36,494 | | | 34,785 | | | 1,709 | | | 4.9 | % |
| PPG | | | - | | | - | | | - | | | - | |
Total | | $ | 239,242 | | $ | 305,205 | | $ | (65,963 | ) | | (21.6 | %) |
Total revenues for 2006 were $239.2 million, a decrease of $66.0 million or 21.6% from revenues of $305.2 million for 2005. The decrease was primarily related to the termination of the AstraZeneca sales force effective April 30, 2006 which consisted of approximately 800 representatives. The Astra Zeneca termination resulted in a decrease in revenue of approximately $63.8 million.
PDI, Inc.
Annual Report on Form 10-K (continued)
Comparison of 2008 and 2007
| Revenue (in thousands) | | | | | | | | | | | | |
| | | | | | | | | | | | | |
| | | Year Ended | | | | | | | |
| | | December 31, | | | | | | | |
| | | 2008 | | | 2007 | | | Change ($) | | | Change (%) | |
| Sales services | | $ | 89,656 | | | $ | 86,766 | | | $ | 2,890 | | | | 3.3 | % |
| Marketing services | | | 23,872 | | | | 30,365 | | | | (6,493 | ) | | | (21.4 | %) |
| Product commercialization | | | (1,000 | ) | | | - | | | | (1,000 | ) | | | - | |
| Total | | $ | 112,528 | | | $ | 117,131 | | | $ | (4,603 | ) | | | (3.9 | %) |
The decrease in total revenues of $4.6 million, or 3.9%, was primarily related to a decrease in revenue in the marketing services segment. The sales services segment generated $202.7revenue increased by $2.9 million in revenue for 2006, a decrease of $67.7 million2008 compared to 2005. This decrease is2007 primarily relateddue to the AstraZenecaan increase in revenue within our Select Access business unit of 32.6% due to new and expanded sales force termination mentioned above.engagements during 2008.
On September 26, 2006, we announced that we had received verbal notification from GSK of its intention not to renew its contract sales engagement with usRevenue for 2007. The contract, which represented approximately $65 million to $70 million in revenue on an annual basis, expired as scheduled on December 31, 2006.
On October 25, 2006, we also announced that we had received notification from sanofi-aventis of its intention to terminate its contract sales engagement with us effective December 1, 2006. The contract, which represented approximately $18 million to $20 million in revenue on an annual basis, was previously scheduled to expire on December 31, 2006.
Thethe marketing services segment generated $36.5decreased by approximately 21.4% as revenue at TVG and Pharmakon was lower due in part to a decrease in new projects as well as the curtailment or postponement of certain existing projects within these business units. Pharmakon revenue decreased by 28.5% as its two major clients postponed many of their projects with Pharmakon due to budget constraints.
The product commercialization segment recorded negative revenue of $1.0 million. This pertained to a non-refundable upfront payment we made to Novartis as per the terms of our promotion agreement, which has been recognized as negative revenue pursuant to Emerging Issues Task Force (EITF) Issue No. 01-09, "Accounting for Consideration Given by a Vendor to a Customer or a Reseller of the Vendor's Product." This segment had no revenue in 2007.
| Cost of services (in thousands) | | | | | | | | | | | | | | | | | | | | | |
| | | | | | | | | | | | | | | | | | | | | | | | |
| Year Ended | | Sales | | | % of | | | Marketing | | | % of | | | Product | | | % of | | | | | % of | |
| December 31, | | services | | | sales | | | services | | | sales | | | commercialization | | | sales | | | Total | | sales | |
| 2008 | | $ | 71,266 | | | | 79.5 | % | | $ | 14,121 | | | | 59.2 | % | | $ | 22,628 | | | | - | | | $ | 108,015 | | | 96.0 | % |
| 2007 | | | 68,554 | | | | 79.0 | % | | | 16,962 | | | | 55.9 | % | | | - | | | | - | | | | 85,516 | | | 73.0 | % |
| Change ($) | | $ | 2,712 | | | | | | | $ | (2,841 | ) | | | | | | $ | 22,628 | | | | | | | $ | 22,499 | | | | |
| | | | | | | | | | | | | | | | | | | | | | | | | | | | | | | | |
The increase of approximately $22.5 million in revenue in 2006, an increase of $1.7 million or 4.9% from revenue of $34.8 million in 2005. This is attributable to a $4.7 million increase in Pharmakon revenue, partially offset by declines in revenue at both the TVG and VIM units.
The PPG segment did not have any revenue in 2006.
| | | | | | | | | | |
Cost of services (in thousands) | | | | | |
| | | | | | | | | | |
| | | | | | | Change | | Change | |
| | | 2006 | | 2005 | | ($) | | (%) | |
| Sales services | | $ | 163,735 | | $ | 231,768 | | $ | (68,033 | ) | | (29.4 | %) |
| Marketing services | | | 19,663 | | | 21,035 | | | (1,372 | ) | | (6.5 | %) |
| PPG | | | - | | | - | | | - | | | - | |
Total | | $ | 183,398 | | $ | 252,803 | | $ | (69,405 | ) | | (27.5 | %) |
Costcosts of services was primarily attributed to the $22.6 million associated with our promotional program within the product commercialization segment for 2006 was $183.4the year ended December 31, 2008. Included within that amount is $10.3 million associated with an accrued contract loss, which was $69.4 million or 27.5% less than cost of services of $252.8 millionrepresents the future loss expected to be incurred by us to fulfill our contractual obligations under our existing product commercialization agreement until February 1, 2010, the early termination date for 2005.this contract. See Note 10 for more details. This segment had no activity in 2007. The sales services segment had a reductionan increase of $68.0$2.7 million in cost of services, which is primarily attributable to the reductionincrease in the size of the sales force including the AstraZeneca termination mentioned above.revenue at Select Access. Cost of services within the marketing services segment decreased approximately $1.4$2.8 million, or 6.5%. The PPG segment had no costs16.7% primarily due to the decrease in new projects and the curtailment or postponement of services expense in either 2006 or 2005.certain existing projects at Pharmakon.
| Gross profit (in thousands) | | | | | | | | | | | | | | | | | | | | | |
| | | | | | | | | | | | | | | | | | | | | | | | |
| Year Ended | | Sales | | | % of | | | Marketing | | | % of | | | Product | | | % of | | | | | % of | |
| December 31, | | services | | | sales | | | services | | | sales | | | commercialization | | | sales | | | Total | | sales | |
| 2008 | | $ | 18,390 | | | | 20.5 | % | | $ | 9,751 | | | | 40.8 | % | | $ | (23,628 | ) | | | - | | | $ | 4,513 | | | 4.0 | % |
| 2007 | | | 18,212 | | | | 21.0 | % | | | 13,403 | | | | 44.1 | % | | | - | | | | - | | | | 31,615 | | | 27.0 | % |
| Change ($) | | $ | 178 | | | | | | | $ | (3,652 | ) | | | | | | $ | (23,628 | ) | | | | | | $ | (27,102 | ) | | | |
Gross profit (in thousands) | | | | | | | | | | | |
| | | | | | | | | | | | | | |
| | | | | % of | | | | % of | | Change | | Change | |
| | | 2006 | | revenue | | 2005 | | revenue | | ($) | | (%) | |
| Sales services | | $ | 39,013 | | | 19.2 | % | $ | 38,652 | | | 14.3 | % | $ | (361 | ) | | 0.9 | % |
| Marketing services | | | 16,831 | | | 46.1 | % | | 13,750 | | | 39.5 | % | | (3,081 | ) | | 22.4 | % |
| PPG | | | - | | | - | | | - | | | - | | | - | | | - | |
Total | | $ | 55,844 | | | 23.3 | % | $ | 52,402 | | | 17.2 | % | $ | (3,442 | ) | | 6.6 | % |
During 2006 the gross profit percentage was 23.3% compared to 17.2% in the comparable prior year period. The primary reasons for the increase were as follows:
· | an increase in incentive revenue earned - $3.2 million greater in 2006 than 2005; |
· | the higher margin businesses within marketing services were a greater portion of consolidated revenue than they were in the prior period (15.3% in 2006 vs. 11.4% in 2005) |
· | The gross profit percentage from our two largest customers was higher in 2006 than in 2005. The primary reasons for this improvement were: 1) greater incentive revenue earned; 2) fewer net contractual penalties incurred for stated performance benchmarks; and 3) more stable service costs. In 2005, the sharp increase in fuel and travel costs was greater than the rates specified in our contracts which lowered our gross profit percentages; whereas in 2006 there was not a large disparity in fuel and travel costs when compared to our contractual reimbursements. |
The sales services segment had gross profit of $39.0 million in 2006, with a gross profit percentage of 19.2%. During 2005 this segment had gross profit of $38.7 million and a gross profit percentage of 14.3%. The increase in gross profit percentage can be attributed to the reasons listed above.
PDI, Inc.
Annual Report on Form 10-K (continued)
Gross profit in the sales services segment increased slightly on higher revenue for the year ended 2008 as compared to year ended 2007. In 2007, we recognized $0.6 million in revenue associated with a contract with a former emerging pharmaceutical client for services performed in 2006. Because of the uncertainty surrounding collections, we recognized revenue from this client on a cash basis and all costs associated with this contract were recognized in 2006.
The marketing services segment earned gross profit of $16.8 million and $13.8 million for 2006 and 2005, respectively. The increasedecrease in gross profit attributable to the marketing services segment is due towas commensurate with the increasedecrease in revenue discussed above as total gross profit associated with Pharmakon which had greater revenue in 2006.decreased at all three business units. The gross profit percentage increaseddecreased to 46.1%40.8% from 39.5%44.1% in the comparable prior year period primarily due primarily to the increasea decrease in gross profit at Pharmakon as well as an increase in gross profitmargin percentage at VIM.TVG attributed to a change in product mix.
The PPG segment had noproduct commercialization segment’s negative gross profit in 2006 or 2005.was attributable to our sales force, promotional costs and contract loss accrual associated with this program plus the $1 million non-refundable upfront payment we made to Novartis as per the terms of our promotion agreement.
(Note: (Note: Compensation and other Selling, General and Administrative (other SG&A) expense amounts for each segment contain allocated corporate overhead.)
Compensation expense (in thousands) | | | |
| | | | | | | | | | | | | | |
| | | | | % of | | | | % of | | Change | | Change | |
| | | 2006 | | revenue | | 2005 | | revenue | | ($) | | (%) | |
| Sales services | | $ | 19,410 | | | 9.6 | % | $ | 18,397 | | | 6.8 | % | $ | 1,013 | | | 5.5 | % |
| Marketing services | | | 8,665 | | | 23.7 | % | | 7,499 | | | 21.6 | % | | 1,166 | | | 15.5 | % |
| PPG | | | - | | | - | | | 1 | | | - | | | (1 | ) | | (100.0 | %) |
Total | | $ | 28,075 | | | 11.7 | % | $ | 25,897 | | | 8.5 | % | $ | 2,178 | | | 8.4 | % |
Compensation expense for 2006 was $28.1 million, an increase of $2.2 million or 8.4% compared to the $25.9 million for the comparable prior year period. This increase can be primarily attributed to an increase in incentive compensation accruals in 2006 due to the improved performance of the company as compared to the incentive compensation accrued in 2005. Increases in incentive accruals were partially offset by decreases in salaries of approximately $2.9 million and the absence of a national managers meeting which cost approximately $800,000 in 2005. As a percentage of total revenue, compensation expense increased to 11.7% for 2006 from 8.5% in 2005 primarily due to the decrease in revenue.
Compensation expense for the sales services segment was $19.4 million, an increase of approximately $1.0 million or 5.5%.
Compensation expense for the marketing services segment was $8.7 million in 2006, a 15.5% increase over $7.5 million in the comparable prior year period. This increase is primarily due to the increased amount of incentives accrued within the segment in 2006.| Compensation expense (in thousands) | | | | | | | | | | | | | | | | | | |
| | | | | | | | | | | | | | | | | | | | | | | | |
| Year Ended | | Sales | | | % of | | | Marketing | | | % of | | | Product | | | % of | | | | | % of | |
| December 31, | | services | | | sales | | | services | | | sales | | | commercialization | | | sales | | | Total | | sales | |
| 2008 | | $ | 13,176 | | | | 14.7 | % | | $ | 8,361 | | | | 35.0 | % | | $ | 1,301 | | | | - | | | $ | 22,838 | | | 20.3 | % |
| 2007 | | | 15,973 | | | | 18.4 | % | | | 8,543 | | | | 28.1 | % | | | - | | | | - | | | | 24,516 | | | 20.9 | % |
| Change ($) | | $ | (2,797 | ) | | | | | | $ | (182 | ) | | | | | | $ | 1,301 | | | | | | | $ | (1,678 | ) | | | |
| | | | | | | | | | | | | | | | | | | | | | | | | | | | | | | | |
The PPG segment did not have anydecrease in compensation expense was primarily a result of a reduction in 2006 or 2005.incentive compensation accrued for 2008 due to our financial performance relative to the financial targets established for 2008 under our incentive compensation plan. The decrease for both sales services and marketing services segments in 2008 can be attributed to the reason discussed above.
The product commercialization segment had compensation costs of $1.3 million. This was primarily attributable to employee and sales services support costs. There was no compensation expense attributable to this segment in 2007.
Other SG&A (in thousands) | | | | | |
| | | | | | | | | | | | | | |
| | | | | % of | | | | % of | | Change | | Change | |
| | | 2006 | | revenue | | 2005 | | revenue | | ($) | | (%) | |
| Sales services | | $ | 18,109 | | | 8.9 | % | $ | 23,607 | | | 8.7 | % | $ | (5,498 | ) | | (23.3 | %) |
| Marketing services | | | 4,501 | | | 12.3 | % | | 5,775 | | | 16.6 | % | | (1,274 | ) | | (22.1 | %) |
| PPG | | | - | | | - | | | 10 | | | - | | | (10 | ) | | (100.0 | %) |
Total | | $ | 22,610 | | | 9.5 | % | $ | 29,392 | | | 9.6 | % | $ | (6,782 | ) | | (23.1 | %) |
| Other selling, general and administrative expenses (in thousands) | | | | | | | | | |
| | | | | | | | | | | | | | | | | | | | | | | | |
| Year Ended | | Sales | | | % of | | | Marketing | | | % of | | | Product | | | % of | | | | | % of | |
| December 31, | | services | | | sales | | | services | | | sales | | | commercialization | | | sales | | | Total | | sales | |
| 2008 | | $ | 11,549 | | | | 12.9 | % | | $ | 3,857 | | | | 16.2 | % | | $ | 1,126 | | | | - | | | $ | 16,532 | | | 14.7 | % |
| 2007 | | | 15,033 | | | | 17.3 | % | | | 4,990 | | | | 16.4 | % | | | - | | | | - | | | | 20,023 | | | 17.1 | % |
| Change ($) | | $ | (3,484 | ) | | | | | | $ | (1,133 | ) | | | | | | $ | 1,126 | | | | | | | $ | (3,491 | ) | | | |
| | | | | | | | | | | | | | | | | | | | | | | | | | | | | | | | |
Total other SG&A expenses were $22.6 million in 2006, versus $29.4 million in 2005, a decrease of $6.8 million or 23.1%. This decrease is mainly attributabledecreased primarily due to the following: 1) a decrease in facility costsdepreciation expense of approximately $1.2 million;$0.7 million primarily due to the conversion to a new financial reporting system that was at a much lower capitalized cost than our previous system; 2) a decrease in net franchise taxes of approximately $1.0 million primarily due to the settlement of one state’s assessment for less than the $0.6 million that had been accrued in 2007; 3) a reduction in bad debt expenseexecutive consulting of $1.8 million, $755,000 of which was recorded in 2005 that pertained to the TMX loan (see Note 6 to the consolidated financial statements for further information);approximately $1.0 million; and 4) a reduction in miscellaneous office operationsbusiness insurance expense of $1.9approximately $0.4 million. Some of the main categories within office operations expense are business insurance, software licenses and maintenance, and telephone and internet charges. As a percentage of total revenue, other SG&A expenses decreased to 9.5%14.7% in 2008 from 9.6%17.1% in 2005.2007.
Other SG&AExecutive severance
In 2008, we incurred approximately $1.2 million in executive severance costs that related to the departure of our chief executive officer and one other executive. In 2007, we did not have any executive severance costs.
Legal and related costs
In 2008 and 2007, we had legal expenses associated withof approximately $0.3 million, respectively, which primarily pertained to legal expenses incurred by us in the ordinary course of business.
PDI, Inc.
Annual Report on Form 10-K (continued)
Facilities realignment
In 2008, we had charges of approximately $75,000 related to the excess office space at our Dresher, Pennsylvania location. In 2007, we had net charges of approximately $1.0 million primarily related to the impairment of fixed assets and other expenses related to our exiting the computer data center space at our Saddle River, New Jersey location in December 2007. Total charges in 2007 for the sales services segment were $18.1approximately $1.0 million a decrease of $5.5 million or 23.3%. This decreaseand approximately $26,000 was credited to the marketing services segment.
| Operating loss | | | | | | | | | | | | | | | | | | | | | | |
| | | | | | | | | | | | | | | | | | | | | | | |
| Year Ended | | Sales | | | % of | | | Marketing | | | % of | | | Product | | % of | | | | | % of | |
| December 31, | | services | | | sales | | | services | | | sales | | | commercialization | | sales | | | Total | | sales | |
| 2008 | | $ | (7,196 | ) | | | (8.0 | %) | | $ | (3,070 | ) | | | (12.9 | %) | | $ | (26,161 | ) | | - | | | $ | (36,427 | ) | | (32.4 | %) |
| 2007 | | | (13,918 | ) | | | (16.0 | %) | | | (362 | ) | | | (1.2 | %) | | | - | | | - | | | | (14,280 | ) | | (12.2 | %) |
| Change ($) | | $ | 6,722 | | | | | | | $ | (2,708 | ) | | | | | | $ | (26,161 | ) | | | | | $ | (22,147 | ) | | | |
| | | | | | | | | | | | | | | | | | | | | | | | | | | | | | | |
The increased operating loss in 2008 is primarily attributable to the reasons mentioned above.$26.2 million in negative revenue and expenses associated with our promotional program within the product commercialization segment. This was partially offset by a reduction in our total operating expenses of approximately $5.0 million, or 10.8%.
Other SG&A expensesInterest income, net
Interest income, net, for the marketing services segment decreased by $1.32008 and 2007 was approximately $2.8 million or 22.1%. Thisand $6.1 million, respectively. The decrease is primarily attributable to a decrease in facility costsinterest rates for 2008 as well as smaller available cash balances.
Provision for income taxes
We recorded a provision for income taxes of $0.9 million for 2008 and $1.8 million for 2007. Our overall effective tax rate was a provision of 2.6% and a provision of 21.5% for 2008 and 2007, respectively. The tax provision for 2007 is primarily attributable to the full valuation allowance on the net deferred tax assets except for the basis difference in goodwill. Federal tax attribute carryforwards at December 31, 2008, consist primarily of approximately $29.2 million of net operating losses and $339,000 of capital losses. In addition, we have approximately $63.5 million of state net operating losses carryforwards. The utilization of the federal carryforwards as an available offset to future taxable income is subject to limitations under federal income tax laws. If the federal net operating losses are not utilized, they will begin to expire in 2027 and if the current state net operating losses are not utilized they begin to expire in 2009. The capital losses can only be utilized against capital gains and $339,000 will expire in 2009.
Net loss
There was a net loss of $34.5 million in 2008, compared to a net loss of $10.0 million in 2007, due to the factors discussed above.
| Comparison of 2007 and 2006 |
| Revenue (in thousands) | | | | | | | | | | | | |
| | | | | | | | | | | | | |
| | | Year Ended | | | | | | | |
| | | December 31, | | | | | | | |
| | | 2007 | | | 2006 | | | Change ($) | | | Change (%) | |
| Sales services | | $ | 86,766 | | | $ | 202,748 | | | $ | (115,982 | ) | | | (57.2 | %) |
| Marketing services | | | 30,365 | | | | 36,494 | | | | (6,129 | ) | | | (16.8 | %) |
| Product commercialization | | | - | | | | - | | | | - | | | | - | |
| Total | | $ | 117,131 | | | $ | 239,242 | | | $ | (122,111 | ) | | | (51.0 | %) |
The decrease in total revenues of $122.1, or 51.0%, was primarily related to our Dresher, Pennsylvania facility.the termination of several large contracts in 2006. Effective April 30, 2006, AstraZeneca terminated its contract sales force arrangement with us, which represented approximately $43.0 million of revenue in 2006. On September 26, 2006, we announced that GSK would not be renewing its contract with us when it expired on December 31, 2006. This contract represented $67.4 million of revenue in 2006. On October 25, 2006, we announced that we had received notification from
Other SG&A expenses in the PPG segment were zero in 2006 and approximately $10,000 in 2005.
PDI, Inc.
Annual Report on Form 10-K (continued)
Asset impairment
We recognized asset impairment chargessanofi-aventis of $6.2its intention to terminate its contract sales engagement with us effective December 1, 2006. This contract represented approximately $18.3 million of revenue in 2006. Additionally, on March 21, 2007, we announced that a large pharmaceutical company customer had notified us of its intention not to renew its contract sales engagement with us upon its scheduled expiration on May 12, 2007. This contract, which had a one-year term, provided for approximately $37 million of annual revenue and represented a $7.1 million decline in revenue when compared to 2006. The loss in revenue from those terminated and expired contracts was partially offset by new sales force arrangements we entered into during 2007, including a contract sales force engagement for our Select Access business unit in March 2007, which generated approximately $12.0 million in revenue in 2007 and a dedicated contract sales force engagement entered into during June 2007 that generated approximately $14.6 million in revenue in 2007.
The sales services segment revenue decreased by $116.0 million compared to 2006 primarily due to the contract terminations as described above.
Revenue for the year ended December 31, 2005. marketing services segment decreased by $6.1 million, or 16.8%, which was attributable to a $3.9 million decrease in TVG revenue, as well as decreases at both Pharmakon and VIM due to fewer projects at all three business units.
The charges relatedproduct commercialization segment did not have any revenue in either period.
| Cost of services (in thousands) | | | | | | | | | | | | | | | | | | | | | | |
| | | | | | | | | | | | | | | | | | | | | | | | | |
| Year Ended | | Sales | | | % of | | | Marketing | | | % of | | | Product | | | % of | | | | | | % of | |
| December 31, | | services | | | sales | | | services | | | sales | | | commercialization | | | sales | | | Total | | | sales | |
| 2007 | | $ | 68,554 | | | | 79.0 | % | | $ | 16,962 | | | | 55.9 | % | | $ | - | | | | - | | | $ | 85,516 | | | | 73.0 | % |
| 2006 | | | 163,735 | | | | 80.8 | % | | | 19,663 | | | | 53.9 | % | | | - | | | | - | | | | 183,398 | | | | 76.7 | % |
| Change ($) | | $ | (95,181 | ) | | | | | | $ | (2,701 | ) | | | | | | $ | - | | | | | | | $ | (97,882 | ) | | | | |
The sales services segment had a reduction of $95.2 million in cost of services, which is primarily attributable to the contract terminations mentioned above. Cost of services within the marketing services segment decreased approximately $2.7 million, or 13.7%, due to fewer projects at all three business units. The product commercialization segment had no costs of services expense in either 2007 or 2006.
The two primary reasons for the increase in gross profit percentage were: 1) the higher margin businesses within marketing services were a greater portion of consolidated revenue than they were in the prior period (25.9% in 2007 vs. 15.3% in 2006); and 2) the gross profit percentage for Select Access increased from 15.2% in 2006 to 21.4% in 2007. This increase was primarily a result of fixed service costs (i.e., sales force management) being a smaller percentage of total revenue as Select Access revenue increased approximately 63.7% in 2007.
| Gross profit (in thousands) | | | | | | | | | | | | | | | | | | | | | | |
| | | | | | | | | | | | | | | | | | | | | | | | | |
| Year Ended | | Sales | | | % of | | | Marketing | | | % of | | | Product | | | % of | | | | | | % of | |
| December 31, | | services | | | sales | | | services | | | sales | | | commercialization | | | sales | | | Total | | | sales | |
| 2007 | | $ | 18,212 | | | | 21.0 | % | | $ | 13,403 | | | | 44.1 | % | | $ | - | | | | - | | | $ | 31,615 | | | | 27.0 | % |
| 2006 | | | 39,013 | | | | 19.2 | % | | | 16,831 | | | | 46.1 | % | | | - | | | | - | | | | 55,844 | | | | 23.3 | % |
| Change ($) | | $ | (20,801 | ) | | | | | | $ | (3,428 | ) | | | | | | $ | - | | | | | | | $ | (24,229 | ) | | | | |
| | | | | | | | | | | | | | | | | | | | | | | | | | | | | | | | | |
The increase in gross profit percentage for the sales services segment can be primarily attributed to Select Access goodwill impairment - $3.3 millionAccess. The decrease in total sales services’ gross profit can be attributed to the contract terminations discussed above. The segment benefited from recognizing $550,000 in revenue and gross profit in 2007 associated with a contract with a former emerging pharmaceutical client for services performed in 2006. Because of the uncertainty surrounding collections, we recognized revenue from this client on a cash basis. All costs associated with this contract were recognized in 2006. The segment also benefited from recognizing $558,000 in revenue and gross profit in 2007 associated with accrued penalties with a former sales force client. Because the likelihood of paying these penalties was deemed remote, the accrual was reversed in the fourth quarter of 2005;2007 and $2.8 million associatedrecognized as revenue.
PDI, Inc.
Annual Report on Form 10-K (continued)
The decrease in gross profit attributable to the marketing services segment was commensurate with the write-down of our Siebel sales force automation softwaredecrease in revenue discussed above as total gross profit decreased at all three business units. The gross profit percentage decreased to 44.1% from 46.1% in the second quartercomparable prior year period.
(Note: Compensation and other Selling, General and Administrative (other SG&A) expense amounts for each segment contain allocated corporate overhead.)
| Compensation expense (in thousands) | | | | | | | | | | | | | | | | | | | |
| | | | | | | | | | | | | | | | | | | | | | | | | |
| Year Ended | | Sales | | | % of | | | Marketing | | | % of | | | Product | | | % of | | | | | | % of | |
| December 31, | | services | | | sales | | | services | | | sales | | | commercialization | | | sales | | | Total | | | sales | |
| 2007 | | $ | 15,973 | | | | 18.4 | % | | $ | 8,543 | | | | 28.1 | % | | $ | - | | | | - | | | $ | 24,516 | | | | 20.9 | % |
| 2006 | | | 19,410 | | | | 9.6 | % | | | 8,665 | | | | 23.7 | % | | | - | | | | - | | | | 28,075 | | | | 11.7 | % |
| Change ($) | | $ | (3,437 | ) | | | | | | $ | (122 | ) | | | | | | $ | - | | | | | | | $ | (3,559 | ) | | | | |
| | | | | | | | | | | | | | | | | | | | | | | | | | | | | | | | | |
The decrease in compensation expense for both sales services and marketing services segments in 2007 was the result of 2005. See Notes 4reduced headcount and 5unfilled executive positions when compared to 2006. As a percentage of total revenue, compensation expense increased to 20.9% for 2007 from 11.7% in 2006 primarily due to the consolidated financial statements for more details on these asset impairments.decrease in revenue.
| Other selling, general and administrative expenses (in thousands) | | | | | | | | | | |
| | | | | | | | | | | | | | | | | | | | | | | | | |
| Year Ended | | Sales | | | % of | | | Marketing | | | % of | | | Product | | | % of | | | | | | % of | |
| December 31, | | services | | | sales | | | services | | | sales | | | commercialization | | | sales | | | Total | | | sales | |
| 2007 | | $ | 15,033 | | | | 17.3 | % | | $ | 4,948 | | | | 16.3 | % | | $ | - | | | | - | | | $ | 19,981 | | | | 17.1 | % |
| 2006 | | | 18,109 | | | | 8.9 | % | | | 4,501 | | | | 12.3 | % | | | - | | | | - | | | | 22,610 | | | | 9.5 | % |
| Change ($) | | $ | (3,076 | ) | | | | | | $ | 447 | | | | | | | $ | - | | | | | | | $ | (2,629 | ) | | | | |
| | | | | | | | | | | | | | | | | | | | | | | | | | | | | | | | | |
Total other SG&A expenses decreased primarily due to the following: 1) a decrease in audit and related costs of $1.5 million; 2) a decrease in facility costs of approximately $390,000; 3) a reduction in business insurance expense of approximately $400,000; and 4) approximately $600,000 less in marketing expense. These decreases were partially offset by an approximately $550,000 accrual in state franchise taxes pertaining to one particular state’s assessment. As a percentage of total revenue, other SG&A expenses increased to 17.1% from 9.5% in 2006 due to the decrease in revenue in 2007.
Executive severance
In 2007, we did not have any executive severance costs. In 2006, we incurred approximately $573,000 in executive severance costs that related to the departure of one executive. In 2005 we incurred approximately $5.7 million in executive severance costs. These expenses were primarily attributable to resignations of our CEO - $2.8 million, and our CFO - $1.6 million. The remaining costs pertained to other executives who resigned during the year or for which settlements were reached during that period.
Legal and related costs
In 2007, we had legal expenses of approximately $335,000, which primarily pertained to legal expenses incurred by us in the ordinary course of business. In 2006, we had a net credit to legal expense of $3.3 million as compared to $1.7 million in expense in the comparable prior year period.million. The credit to legal expense included approximately $3.5 million in cash received in relation to the Cellegy litigation matter;matter and approximately $516,000 in credits related to the reversing of the California class action lawsuit accrual. For details on both legal matters, see Note 9 to the consolidated financial statements.
Facilities realignment
In 2005, legal expense2007, we had net charges of approximately $1.0 million primarily consistedrelated to the impairment oflegal fees associated with fixed assets and other expenses related to our exiting the Cellegy litigation matter, net of any settlement payments received and $566,000 that was accruedcomputer data center space at our Saddle River, New Jersey location in December 2007. Total charges in 2007 for the California class action lawsuit.
Facilities realignment
sales services segment were approximately $1.0 million and approximately $26,000 was credited to the marketing services segment. In 2006, we had net charges of approximately $657,000 related to unused office space capacity at our Saddle River, New Jersey and Dresher, Pennsylvania locations and approximately $1.3 million in expense related to the impairment of fixed assets associated with the unused office space at these facilities. Total charges in 2006 for the sales services segment arewere approximately $1.3 million and approximately $675,000 was charged to the marketing services segment. In 2005, we took charges of approximately $2.4 million related
PDI, Inc.
Annual Report on Form 10-K (continued)
Operating loss (income)
The operating loss in 2007 is primarily attributable to unused office space capacity at our Saddle Riverthe decline in revenue and Dresher locations. There was a charge of approximately $1.1 million recordedgross profit in the sales services segment and a chargedue to the termination of approximately $1.3 million recorded in the marketing services segment.sales force contracts mentioned previously. There are approximately 19,400 and 11,000 square feet of unused office space at Saddle River and Dresher, respectively, which we are seeking to sublease in 2007.
Operating income (loss) (in thousands) | | | | | | | | | |
| | | | | | | | | | | | | | |
| | | | | % of | | | | % of | | Change | | Change | |
| | | 2006 | | revenue | | 2005 | | revenue | | ($) | | (%) | |
| Sales services | | $ | 33 | | | 0.0 | % | $ | (17,386 | ) | | (6.4 | %) | $ | 17,419 | | | 100.2 | % |
| Marketing services | | | 2,798 | | | 7.7 | % | | (1,186 | ) | | (3.4 | %) | | 3,984 | | | 335.9 | % |
| PPG | | | 3,082 | | | 0.0 | % | | (268 | ) | | 0.0 | % | | 3,350 | | | 1,250.0 | % |
Total | | $ | 5,913 | | | 2.5 | % | $ | (18,840 | ) | | (6.2 | %) | $ | 24,753 | | | 131.4 | % |
There was operating income of $5.9 million in 2006 as compared to an operating loss of $18.8 million in 2005. This large increase can be attributed to several factors, including the following: a reduction in corporate overhead; an improved contribution from the marketing services segment; net $3.1 million in operating income that pertained primarily to the settling of the Cellegy litigation matter; asset impairments totaling $6.2 million that impacted 2005; and the improved performance of Select Access which showed a $4.4 million increase in gross profit which led to higher operating income. There was operating income for the sales services segment of approximately $33,000 as compared to an operating loss of $17.4 million in 2005. The asset impairments in 2005 and the improved performance of Select Access were two of the main factors for this increase. There was operating income in 20062007 for the marketing services segment of $362,000 compared to operating income of $2.8 million compared to anin 2006. The decrease in operating loss of $1.2 million in the comparable prior year period. The loss in 2005income from marketing services segment was primarily attributable to the facilities realignment expenses associated with this segment.a decrease in revenue and gross profit at all three units due to fewer projects. There was operating income of $3.1 million in 2006 in the PPGproduct commercialization segment which consisted entirely of settlement payments from Cellegy, net of legal expenses. There was anno operating loss for the PPG segmentincome from product commercialization in 2005 of $268,000 that was attributable to Cellegy litigation expenses, net of settlements received.2007.
Gain/loss on investment
We recognized a gain on sale of our In2Focus investment of approximately $4.4 million in the second quarter of 2005.
PDI, Inc.
Annual Report on Form 10-K (continued)
Interest income, net
Interest income, net, for 20062007 and 20052006 was approximately $4.7$6.1 million and $3.2$4.7 million, respectively. The increase is primarily attributable to an increase in interest rates for 20062007 as well as larger available cash balances.
Provision for income taxes
We recorded a benefit for incomes taxes of $724,000 for the year ended December 31, 2006, compared to a provision for income taxes of $201,000 for the year ended December 31, 2005. Our overall effective tax rate was a benefit of 6.8% and a provision of 1.8% for the years ended December 31, 2006 and 2005, respectively. The 2006 rate includes a reduction in valuation allowance of $2.9 million related to deferred tax assets realized in 2006 which corresponds to a rate benefit of 26.9%; tax-exempt income of $1.8 million which corresponds to a rate benefit of 6.0%; and state tax benefits of $1.2 million which corresponds to a rate benefit of 11.3%. Without these items, we would have had a 37.4% effective tax rate in 2006.
Income (loss) from continuing operations
There was income from continuing operations for the year ended December 31, 2006 of approximately $11.4 million, compared to a loss from continuing operations of approximately $11.4 million for the year ended December 31, 2005.
Discontinued operations
Revenue from discontinued operations for the years ended December 31, 2006 and 2005 was approximately $1.9 million and $14.2 million, respectively. There was income from discontinued operations before income tax for the year ended December 31, 2006 of $693,000 and a loss from discontinued operations before income tax for the year ended December 31, 2005 of $8.0 million. Income from discontinued operations, net of tax, for the year ended December 31, 2006 was approximately $434,000. There was a loss from discontinued operations for the year ended December 31, 2005 of approximately $8.0 million, primarily attributable to the write-off of MD&D goodwill.
Net income (loss)
There was net income of $11.8 million in 2006, compared to a net loss for 2005 of $19.5 million, due to the factors discussed above.
Comparison of 2005 and 2004
Revenue (in thousands) | | | | | | | |
| | | | | | | | | | |
| | | | | | | Change | | Change | |
| | | 2005 | | 2004 | | ($) | | (%) | |
| Sales services | | $ | 270,420 | | $ | 313,784 | | $ | (43,364 | ) | | (13.8 | %) |
| Marketing services | | | 34,785 | | | 29,057 | | | 5,728 | | | 19.7 | % |
| PPG | | | - | | | 2,956 | | | (2,956 | ) | | (100.0 | %) |
Total | | $ | 305,205 | | $ | 345,797 | | $ | (40,592 | ) | | (11.7 | %) |
Total revenue for 2005 was $305.2 million, a decrease of $40.6 million or 11.7% from revenue of $345.8 million for 2004. The decrease was primarily related to the reduction in the AstraZeneca sales force for 2005 by a monthly average of approximately 375 sales reps as compared to 2004. Service revenue was $305.2 million, a decrease of $42.1 million or 12.1% from revenue of $347.3 million in 2004. Product net revenue for 2004 was negative $1.5 million primarily as a result of a $1.7 million increase in the Ceftin reserve (See Note 15 to the consolidated financial statements).
The sales services segment generated $270.4 million in revenue for 2005, a decrease of $43.4 million compared to 2004. This decrease is primarily related to the AstraZeneca sales force reduction for 2005 mentioned above. Sales services revenue from the AstraZeneca contracts in 2005 was approximately $45.8 million less when compared to the comparable prior year period. While our business development efforts yielded several contracts that were either new or of increased size, those revenue increases were offset by decreases in other contracts that were either reduced in size or closed-out.
PDI, Inc.
Annual Report on Form 10-K (continued)
The marketing services segment generated $34.8 million in revenue in 2005, an increase of $5.7 million or 19.7% from revenue of $29.1 million in 2004. This increase was attributable to having Pharmakon results for twelve months in 2005 versus four months in 2004; Pharmakon was acquired on August 31, 2004. The additional revenue generated by Pharmakon was partially offset by declines in revenue at both the TVG and former EdComm units.
The PPG segment did not have any revenue in 2005. The PPG segment generated net revenue of $3.0 million in 2004, which consisted of $4.5 million in service revenue offset by negative product revenue of $1.5 million. The service revenue of $4.5 million was generated almost entirely by revenue from Lotensin royalties; the negative product revenue of $1.5 million was primarily related to the increase in the Ceftin sales returns reserve. As our responsibility to accept product returns ended December 31, 2004, no further material increases to this reserve are likely.
Cost of goods and services (in thousands) | | | | | |
| | | | | | | | | | |
| | | | | | | Change | | Change | |
| | | 2005 | | 2004 | | ($) | | (%) | |
| Sales services | | $ | 231,768 | | $ | 236,681 | | $ | (4,913 | ) | | (2.1 | %) |
| Marketing services | | | 21,035 | | | 16,352 | | | 4,683 | | | 28.6 | % |
| PPG | | | - | | | 131 | | | (131 | ) | | (100.0 | %) |
Total | | $ | 252,803 | | $ | 253,164 | | $ | (361 | ) | | (0.1 | %) |
Cost of goods and services for 2005 was $252.8 million, which was $361,000 less than cost of services of $253.2 million for 2004.
Gross profit (in thousands) | | | | | | | | | | | |
| | | | | | | | | | | | | | |
| | | | | % of | | | | % of | | Change | | Change | |
| | | 2005 | | revenue | | 2004 | | revenue | | ($) | | (%) | |
| Sales services | | $ | 38,652 | | | 14.3 | % | $ | 77,103 | | | 24.6 | % | $ | 38,451 | | | (49.9 | %) |
| Marketing services | | | 13,750 | | | 39.5 | % | | 12,705 | | | 43.7 | % | | (1,045 | ) | | 8.2 | % |
| PPG | | | - | | | - | | | 2,825 | | | 95.6 | % | | 2,825 | | | (100.0 | %) |
Total | | $ | 52,402 | | | 17.2 | % | $ | 92,633 | | | 26.8 | % | $ | 40,231 | | | (43.4 | %) |
During 2005 the gross profit percentage was 17.2% compared to 26.8% in the comparable prior year period. The primary reasons for the large percentage decrease were as follows:
· | A decrease in incentive payments ($2.6 million) received in 2005 as compared to 2004; |
· | Higher amount of net penalties accrued in 2005 ($2.0 million) as compared to 2004; |
· | Lower contractual margins for some of our 2005 contract renewals; |
· | Market conditions that led to increases in field compensation and other field costs (i.e. gas, travel) that were, in some cases, higher than the rates specified in our contracts; and |
· | No PPG revenues or gross profit earned in 2005 as compared to 2004 when revenue was $3.0 million and gross profit was $2.8 million. |
The sales services segment had gross profit of $38.7 million in 2005, with a gross profit percentage of 14.3%; during 2004 this segment had gross profit of $77.1 million and a gross profit percentage of 24.6%. The decrease of $38.5 million is primarily attributable to the reduction in the AstraZeneca sales force as well as the factors mentioned directly above.
The marketing services segment earned gross profit of $13.8 million and $12.7 million for 2005 and 2004, respectively. The increase in gross profit attributable to the marketing services segment is due to the increase in gross profit associated with Pharmakon; this was partially offset by decreases in gross profit at both the TVG and former EdComm units. The gross percentage declined slightly from 43.7% in 2004 to 39.5% in 2005.
The PPG segment had no gross profit in 2005. The PPG segment had $2.8 million in gross profit for 2004 which was entirely attributable to the Lotensin royalties received in 2004, partially offset by the negative gross profit associated with the increase in the Ceftin reserve.
PDI, Inc.
Annual Report on Form 10-K (continued)
(Note: Compensation and other SG&A expense amounts for each segment contain allocated corporate overhead.)
Compensation expense (in thousands) | | | |
| | | | | | | | | | | | | | |
| | | | | % of | | | | % of | | Change | | Change | |
| | | 2005 | | revenue | | 2004 | | revenue | | ($) | | (%) | |
| Sales services | | $ | 18,397 | | | 6.8 | % | $ | 21,826 | | | 7.0 | % | $ | (3,429 | ) | | (15.7 | %) |
| Marketing services | | | 7,499 | | | 21.6 | % | | 7,367 | | | 25.4 | % | | 132 | | | 1.8 | % |
| PPG | | | 1 | | | 0.0 | % | | 1,441 | | | 48.7 | % | | (1,440 | ) | | (99.9 | %) |
Total | | $ | 25,897 | | | 8.5 | % | $ | 30,634 | | | 8.9 | % | $ | (4,737 | ) | | (15.5 | %) |
Compensation expense for 2005 was $25.9 million, a decrease of $4.7 million or 15.5% less than the $30.6 million for the comparable prior year period. This decrease can be primarily attributed to an overall decrease in the amount of incentive compensation in 2005. As a percentage of total revenue, compensation expense decreased to 8.5% for 2005 from 8.9% in 2004.
Compensation expense for the sales services segment was $18.4 million, a decrease of $3.4 million from the comparable prior year period. This decrease can be attributable to the reduction in incentive compensation mentioned above.
Compensation expense for the marketing services segment was $7.5 million in 2005, a 1.8% increase over $7.4 million in the comparable prior year period.
The PPG segment did not have any compensation expense in 2005. Compensation expense associated with the PPG segment in 2004 was $1.4 million and was primarily for severance related activities associated with the de-emphasis of that segment beginning in 2004.
Other SG&A (in thousands) | | | | | |
| | | | | | | | | | | | | | |
| | | | | % of | | | | % of | | Change | | Change | |
| | | 2005 | | revenue | | 2004 | | revenue | | ($) | | (%) | |
| Sales services | | $ | 23,607 | | | 8.7 | % | $ | 20,097 | | | 6.4 | % | $ | 3,510 | | | 17.5 | % |
| Marketing services | | | 5,775 | | | 16.6 | % | | 3,686 | | | 12.7 | % | | 2,089 | | | 56.7 | % |
| PPG | | | 10 | | | 0.0 | % | | 1,244 | | | 42.1 | % | | (1,234 | ) | | (99.2 | %) |
Total | | $ | 29,392 | | | 9.6 | % | $ | 25,027 | | | 7.2 | % | $ | 4,365 | | | 17.4 | % |
Total other SG&A expenses were $29.4 million in 2005, versus $25.0 million in 2004, an increase of $4.4 million or 17.4%. This increase is mainly attributable to the following: an increase in marketing spend of $1.2 million; an increase in compliance costs of $1.0 million; and an increase in outsourcing and consulting costs of $1.4 million. As a percentage of total revenue, other SG&A expenses increased to 9.6% from 7.2% in 2004.
Other SG&A expenses associated with the sales services segment were $23.6 million, an increase of $3.5 million or 17.5%. This increase is primarily attributable to the reasons mentioned above.
Other SG&A expenses for the marketing services segment increased by $2.1 million or 56.7%. Approximately $800,000 was related to costs involved in moving to TVG’s new facility. Amortization expense increased by approximately $850,000 as result of having a full twelve months of amortization associated with Pharmakon as opposed to four months in 2004.
Other SG&A expenses in the PPG segment were approximately $10,000 for 2005, as compared to $1.2 million in 2004. In 2004, those costs were primarily related to closeout activities associated with that segment.
Asset impairment
We recognized asset impairment charges of $6.2 million for the year ended December 31, 2005. The charges related to Select Access goodwill impairment - $3.3 million in the fourth quarter of 2005; and $2.8 million associated with the write-down of our Siebel sales force automation software in the second quarter of 2005. See Notes 4 and 5 to the consolidated financial statements for more details on these asset impairments.
PDI, Inc.
Annual Report on Form 10-K (continued)
Executive severance
In 2005, we incurred approximately $5.7 million in executive severance and related costs as compared to approximately $495,000 in the comparable prior year period. These expenses were primarily attributable to the announced departures of our CEO - $2.8 million in the fourth quarter of 2005, and our CFO - $1.6 million as disclosed and recorded in the third quarter of 2005. The remaining costs pertained to other executives who resigned during the year or for which settlements were reached during that period. In 2004, the expense pertained to the departure of one executive.
Legal and related costs
In 2005, we incurred approximately $1.7 million in legal expenses as compared to $2.4 million in the comparable prior year period. Included in 2005 is a $566,000 litigation accrual related to the California class action lawsuit. For details on this lawsuit, see Note 9 to the consolidated financial statements.In 2004, the legal costs of $2.4 million were primarily related to the Cellegy litigation.
Facilities realignment
In the fourth quarter of 2005, we took charges of approximately $2.4 million related to unused office space capacity at our Saddle River, New Jersey and Dresher, Pennsylvania locations. There was a charge of approximately $1.1 million recorded in the sales services segment and a charge of approximately $1.3 million recorded in the marketing services segment. The charges were for approximately 7,300 and 11,000 square feet of unused office space at Saddle River and Dresher, respectively.
Operating Income (Loss) (in thousands) | | | | | | | | | |
| | | | | | | | | | | | | | |
| | | | | % of | | | | % of | | Change | | Change | |
| | | 2005 | | revenue | | 2004 | | revenue | | ($) | | (%) | |
| Sales services | | $ | (17,386 | ) | | (6.4 | %) | $ | 32,906 | | | 10.5 | % | $ | (50,292 | ) | | (152.8 | %) |
| Marketing services | | | (1,186 | ) | | (3.4 | %) | | 1,535 | | | 5.3 | % | | (2,721 | ) | | (177.3 | %) |
| PPG | | | (268 | ) | | 0.0 | % | | (362 | ) | | (12.2 | %) | | 94 | | | 26.0 | % |
Total | | $ | (18,840 | ) | | (6.2 | %) | $ | 34,079 | | | 9.9 | % | $ | (52,919 | ) | | (155.3 | %) |
There was an operating loss of $18.8 million in 2005 as compared to operating income for 2004 of $34.1 million. This large decrease can be attributed to several factors, including the reduction in the size of the dedicated contract sales force and lower gross profit margins (as discussed above); the asset impairments and executive severance costs mentioned above; and facility realignment costs. There was an operating loss for the sales services segment of $17.4 million as compared to operating income of $32.9 million in 2004 and was primarily due to the factors discussed above. There was an operating loss in 2005 for the marketing services segment of $1.2 million compared to operating income of $1.5 million in the comparable prior year period. The loss in 2005 was primarily attributable to the facilities realignment expenses associated with this segment. There was an operating loss for the PPG segment in 2005 of $268,000 that was attributable to Cellegy litigation expenses, net of settlements received. In 2004, PPG had an operating loss of $362,000 that primarily related to the closing out of that segment.
Gain/loss on investment
In 2005, we recognized a gain on sale of our In2Focus investment of approximately $4.4 million in the second quarter of 2005.In 2004, our investment in Xylos of $1.0 million was found to be impaired and was written down to zero in the fourth quarter of 2004.
Interest income, net
Interest income, net, for 2005 and 2004 was approximately $3.2 million and $1.8 million, respectively. The increase is primarily attributable to an increase in interest rates for 2005.
Provision for income taxes
We recorded a provision for income taxes of $201,000$1.8 million for 2005,2007, compared to $14.4 milliona benefit for 2004.income taxes of $724,000 for 2006. Our overall effective tax rate was 1.8%a provision of 21.5% and 41.4%a benefit of 6.8% for 20052007 and 2004,2006, respectively. The 2005 rate includes a release of $1.7 milliontax provision for 2007 was primarily attributable to the full valuation allowance on capital loss carryforwards, which corresponds to a rate benefit of 8.8%; as well as $9.3 million (or 48.4%) federal and state valuation allowances onthe net deferred tax assets since management believes it was more likely thanexcept for the basis difference in goodwill. Federal tax attribute carryforwards at December 31, 2007, consisted primarily of approximately $9.7 million of net operating losses and $339,000 of capital losses. In addition, we had approximately $47.9 million of state net operating losses carryforwards. The utilization of the federal carryforwards as an available offset to future taxable income is subject to limitations under federal income tax laws. If the federal net operating losses are not that these deferred tax assets would notutilized, they will expire in 2027. The capital losses can only be realized. Without these valuation allowance items, we would have had a 38.5% rate benefitutilized against capital gains and $339,000 will expire in 2005.2009.
PDI, Inc.
Annual Report on Form 10-K (continued)
(Loss) income from continuing operations
There was a loss from continuing operations for the year ended December 31, 20052007 of approximately $11.4$10.0 million, compared to income from continuing operations of approximately $20.4$11.4 million for 2006.
Discontinued operations
For the year ended December 31, 2004.
Discontinued operations
Revenue from2006, discontinued operations for the years ended December 31, 2005 and 2004 wasincluded revenue of approximately $14.2$1.9 million, and $18.6 million, respectively. There was a loss from discontinued operationsincome before income tax for the year ended December 31, 2005 of $8.0 million and income from discontinued operations before income tax for the year ended December 31, 2004 of $1.1 million. There was a loss from discontinued operations, net of tax, for the year ended December 31, 2005 of approximately $8.0 million$693,000 and net income from discontinued operations, net of tax, for the year ended December 31, 2004 of $697,000.approximately $434,000.
Net (loss) income
There was a net loss of $19.5$10.0 million in 2005,2007, compared to net income for 2004 of $21.1$11.8 million in 2006, due to the factors discussed above.
LIQUIDITY AND CAPITAL RESOURCES
| LIQUIDITY AND CAPITAL RESOURCES |
As of December 31, 2006,2008, we had cash and cash equivalents and short-term investments of approximately $114.7$90.2 million and working capital of $112.2$81.6 million, compared to cash and cash equivalents and short-term investments of approximately $97.6$107.0 million and working capital of approximately $92.3$110.7 million at December 31, 2005.2007.
ForDuring 2008, net cash used in operating activities was $16.0 million as compared to net cash used by operating activities of $6.2 million during 2007. Net cash used in operating activities for the year ended December 31, 2006, net cash provided by2008 reflects continuing operating activities was $19.7losses of $34.5 million, comparedless $6.5 million of non-cash items charged to $3.1 million net cash provided by operating activities in 2005. The main components of cash provided by operating activities during 2006 were:
· | net income of $11.8 million; |
· | depreciation and other non-cash expense of $10.4 million which included depreciation expenses of $4.4 million; stock compensation expense of $1.7 million; decrease in the net deferred tax asset of $2.7 million and facilities’ realignment of approximately $1.3 million offset by recoveries of doubtful accounts and notes of $1.0 million; |
· | offset by a net decrease in other changes in assets and liabilities of $2.6 million which includes a $5.4 million federal tax refund received in the fourth quarter of 2006. |
The net changes in the “other changes in assets and liabilities” section of the consolidated statement of cash flows may fluctuate depending on a number of factors, includingoperations, less $11.9 million representing the number and size of programs, contract terms and other timing issues. These variations maynet change in sizeour operating assets and direction with each reporting period.liabilities. The net non-cash items consist primarily of depreciation and amortization of $4.6 million, deferred income taxes of $0.3 million and stock-based compensation of $1.5 million. The net change in operating assets and liabilities resulted primarily from decreases in accounts receivable of $7.0 million, unbilled costs of $1.0 million and unearned contract revenue of $4.8 million, and increase in accrued contract loss of $10.0 million. The decreases in accounts receivable, unbilled costs and unearned contract revenue are primarily as a result of the decline in revenue in 2008. The increase in accrued contract loss is due to our product commercialization agreement as discussed above.
As of December 31, 2006,2008, we had $4.2$2.5 million of unbilled costs and accrued profits on contracts in progress. When services are performed in advance of billing, the value of such services is recorded as unbilled costs and accrued profits on contracts in progress. Normally, all unbilled costs and accrued profits are earned and billed within 12 months from the end of the respective period. As of December 31, 2006,2008, we had $14.3$3.7 million of unearned contract revenue. When we bill customers for services before the revenue has been earned, billed amounts are recorded as unearned contract revenue, and are recorded as income when earned. Normally, unbilled costs and accrued profits are billed and unearned contract revenue is earned within 12 months from the end of the respective period.
PDI, Inc.
Annual Report on Form 10-K (continued)
During 2008, net cash provided by investing activities was approximately $6.9 million as compared to net cash provided by investing activities of $60.6 million during 2007. For both periods, net cash provided by investing activities reflects a continued movement towards investments that have greater liquidity and shorter-term maturities. For the year ended December 31, 2006,2008, net cash used inprovided by investing activities was $65.4 million. The main components consisted of the following:
| · | Approximately $63.9$7.3 million used inprovided by the purchasesale of short-term investments. Our investments consist of a laddered portfolio of investment grade debt instruments such as obligations offor the U.S. Treasuryyear ended December 31, 2008; and U.S. Federal Government agencies, municipal bonds and commercial paper. We are focused on preserving capital, maintaining liquidity, and maximizing returns, in accordance with our investment criteria. |
| · | Capital expenditures for the year ended December 31, 20062008 of $1.8$0.4 million which consisted primarily of capital expenditures associated with ITinformation technology and other computer-relatedcomputer–related expenditures. Capital expenditures for the year ended December 31, 2005 were $5.8 million, which consisted primarily of capital expenditures associated with the relocation of our offices within the marketing services group and for costs associated with the rollout of our new sales force automation software. |
PDI, Inc.
Annual Report on Form 10-K (continued)
On August 31, 2004, we acquired substantially all of the assets of Pharmakon, LLC in a transaction treated as an asset acquisition for tax purposes. The acquisition has been accounted for as a purchase, subject to the provisions of SFAS No. 141. We made payments to the members of Pharmakon, LLC on August 31, 2004 of $27.4 million, of which $1.5 million was deposited into an escrow account, and we assumed approximately $2.6 million in net liabilities. As of December 31, 2006, all escrow payments have been made and the escrow balance is zero. Approximately $1.1 million in direct costs of the acquisition were also capitalized. Based upon the attainment of annual profit targets agreed upon at the date of acquisition, the members of Pharmakon, LLC received approximately $1.4 million in additional payments on April 1, 2005 for the year ended December 31, 2004.
No additional payments were made in 2006 nor will any be made in 2007 since the Pharmakon business did not exceed its specified 2005 and 2006 performance benchmarks, respectively. In connection with this transaction, we have recorded $13.6 million in goodwill and $18.9 million in other identifiable intangibles through December 31, 2006. The identifiable intangible assets have a weighted average remaining amortization period of 12.6 years.
For the year ended December 31, 2006, net cash provided by financing activities consisted of $110,000 related to the exercise of stock options, net of related tax effects. For the year ended December 31, 2005,During 2008, net cash used in financing activities was approximately $11.8 million. Approximately $13.1 million was$62,000 as compared to net cash used by financing activities of approximately $460,000 during 2007. For the year ended December 31, 2008, net cash used in financing activities represented shares that were delivered back to PDI and included in treasury stock for the repurchasingpayment of shares of our common stock. This was partially offset by proceedstaxes resulting from the exercisevesting of stock options and the issuance of shares under the employee stock purchase plan of $1.3 million. The employee stock purchase plan was discontinued in 2005.
On April 27, 2005, we terminated our original 2001 stock repurchase plan. On May 2, 2005, we announced plans to repurchase up to a million of our outstanding shares of common stock as authorized by our Board of Directors. We repurchased 996,900 shares in 2005 with an average purchase price of $12.90 under that plan. The plan was terminated in 2006.restricted stock.
We did not repurchase any shareshad standby letters of credit of approximately $5.9 million and $7.3 million at December 31, 2008 and 2007, respectively, as collateral for our common stock during 2006. On November 7, 2006 we announcedexisting insurance policies and our facility leases. Our standby letters of credit are evergreen in that the Board of Directors authorized us to repurchase up to one million shares of our common stock. We have not repurchased any shares of our common stock during 2007 asthey automatically renew every year unless cancelled in writing by PDI with consent of the datebeneficiary, generally not less than 60 days before the expiry date.
We recorded facility realignment charges totaling approximately $75,000, $1.0 million and $2.0 million during 2008, 2007 and 2006, respectively. These charges were for costs related to excess leased office space at our Saddle River, New Jersey and Dresher, Pennsylvania facilities. In 2007, we sub-leased the excess office space at our Saddle River, New Jersey location and also secured sub-leases for two of the three vacant spaces at our Dresher location. We are currently seeking to sublease the remaining excess space at our Dresher location. A rollforward of the activity for the facility realignment plan is as follows:
| Balance as of December 31, 2006 | | $ | 2,312 | |
| Accretion | | | 21 | |
| Payments | | | (1,378 | ) |
| Adjustments | | | (280 | ) |
| Balance as of December 31, 2007 | | $ | 675 | |
| Accretion | | | 13 | |
| Payments | | | (204 | ) |
| Adjustments | | | 75 | |
| Balance as of December 31, 2008 | | $ | 559 | |
In April 2008, we signed a promotion agreement with Novartis in connection with our product commercialization initiative. See Note 10 to the consolidated financial statements for additional information. Under terms of the agreement, we are providing sales representatives, at our own cost and expense, to promote a pharmaceutical product to physicians. In addition, we are obligated to spend at least $7.0 million per year during the term on promotional activities relating to this Form 10-K. Purchases, if any,product. In addition, we provided a $1.0 million upfront payment to Novartis in the second quarter of 2008 as per the terms of the agreement. Under this arrangement, we will be made fromcompensated each quarter based on a specified formula set forth in the contract relating to product sales during the quarter. Therefore, if we are unable to increase the sales of the product above a pre-determined quarterly threshold amount, it could have a material adverse effect on our available cash.business, financial condition and results of operations. In 2008, we incurred losses associated with this promotional program of approximately $23.6 million.
Our revenue and profitability depend to a great extent on our relationships with a limited number of large pharmaceutical companies. ForOur three largest customers in 2008 accounted for approximately 28.2%, 13.6% and 10.7%, respectively, or approximately 52.5% in the aggregate, of our revenue for the year ended December 31, 2006, we had two major customers that2008. On September 30, 2008, a significant sales force program for one of these clients was terminated due to generic product competition. This sales force program accounted for approximately 28.5% and 18.3%, respectively, or a total of 46.8%9.5% of our service revenue.revenue for the year ended December 31, 2008 and 10.2% of our revenue for the year ended December 31, 2007. We are likely to continue to experience a high degree of customerclient concentration, particularly if there is further consolidation within the pharmaceutical industry. The loss or a significant reduction of business from any of our major customers,clients, or a decrease in demand for our services, could have a material adverse effect on our business, financial condition orand results of operations. For example, on April 30, 2006, AstraZeneca terminated its contract sales force arrangement with us, as previously announced on February 28, 2006. The size ofIn addition, Select Access’ services to a significant customer are seasonal in nature, occurring primarily in the AstraZeneca sales force was approximately 800 representatives. The revenue impact of this termination was $63.8 million in 2006. Additionally, on September 26, 2006, we announced that GSK would not be renewing its current contract with us when it expired on December 31, 2006. This represents a loss of revenue between $65 and $70 million for 2007. Furthermore, on October 25, 2006, we announced that we had received notification from sanofi-aventis of its intention to terminate its contract sales engagement with us effective December 1, 2006. The contract, which represented approximately $18 million to $20 million in revenue on an annual basis, was scheduled to expire on December 31, 2006. Unless and until we generate sufficient new business to offset the loss of the aforementioned contracts, the current results will not be duplicated in future periods and future revenue and cash flows will decrease. winter season.
PDI, Inc.
Annual Report on Form 10-K (continued)
The majority of our operating expenses are personnel-related costs such as employee compensation and benefits as well as the cost of infrastructure to support our operations, including facility space and equipment. We recently instituted a number of cost-saving initiatives, including a reduction in employee headcount. In 2006,addition, we had net charges of approximately $657,000 relatedare currently seeking to sublet additional unused office space capacity atin our Saddle River, New Jersey and Dresher, Pennsylvania locations and $1.3 million in asset impairment charges for leasehold improvements and furniture and fixtures associated with thefacilities, although there is no guarantee that we will be able to successfully sublet this unused office space, at those facilities. Inparticularly in light of the fourth quartercurrent economic and financial crisis. If we are unable to achieve revenue growth in the future or fail to adjust our cost infrastructure to the appropriate level to support our revenues, our business, financial condition and results of 2005, we took chargesoperations could be materially and adversely affected.
Going Forward
Our primary sources of liquidity are cash generated from our operations and available cash and cash equivalents. These sources of liquidity are needed to fund our working capital requirements, estimated capital expenditures in 2009 of approximately $2.4$1.0 million related to unused office space capacityand remaining minimum contractual obligations under our product commercialization agreement for which there is approximately $10.0 million accrued at our Saddle River, New Jersey and Dresher, Pennsylvania locations. There are approximately 19,400 and 11,000 square feet of unused office space at Saddle River and Dresher, respectively, which we are seeking to sublease in 2007. As a result of preparing the Saddle River space for sublettingDecember 31, 2008.
Although we expect to incur approximately $200,000 in capital expenditures in 2007. A rollforward of the activitya net loss for the facility realignment plan is as follows:
PDI, Inc.
Annual Report on Form 10-K (continued)
| Balance as of December 31, 2004 | | $ | - | |
| Facility realignment charge | | | 2,354 | |
| Payments | | | (19 | ) |
| Balance as of December 31, 2005 | | $ | 2,335 | |
| | | | | |
| Accretion | | | 51 | |
| Payments | | | (680 | ) |
| Adjustments | | | 606 | |
| Balance as of December 31, 2006 | | $ | 2,312 | |
Cash flows from discontinued operations are included in the consolidated statement of cash flows. The absence of cash flows from the discontinued operation has had no material impact on cash flows. We are not expecting any material cash outlays with regards to this discontinued operation in the future.
Acquisitions are a part of our corporate strategy. Weyear ending December 31, 2009, we believe that our existing cash balances and expected cash flows generated from operations will be sufficient to meet our operating requirements for at least the next 12 months. However, we may require alternative forms of financing if and when we make acquisitions.
We have committed cash outflow related to operating lease agreements and other contractual obligations. Minimum payments for these long-termThe following table summarizes our contractual obligations are:and commercial commitments as of December 31, 2008.
| | | | | Less than | | 1 to 3 | | 3 to 5 | | After | | | | | | Less than | | | 1 to 3 | | | 3 to 5 | | | After | |
| | | Total | | 1 Year | | Years | | Years | | 5 Years | | | Total | | | 1 Year | | | Years | | | Years | | | 5 Years | |
Contractrual obligations (1) | | $ | 6,523 | | $ | 4,496 | | $ | 2,027 | | $ | - | | $ | - | | |
Contractual obligations (1) | | | $ | 1,476 | | | $ | 859 | | | $ | 617 | | | $ | - | | | $ | - | |
Purchase obligations (2) | | | 7,583 | | | 7,000 | | | 583 | | | - | | | - | |
| Operating lease obligations | | | | | | | | | | | | | | | | | | | | | | | | | | | | | | | | |
| Minimum lease payments | | | 30,641 | | 3,100 | | 6,516 | | 6,462 | | 14,563 | | | 24,395 | | | 3,318 | | | 6,507 | | | 6,564 | | | 8,006 | |
Less minimum sublease rentals (2) | | | (1,452 | ) | | (401 | ) | | (801 | ) | | (250 | ) | | - | | |
Less minimum sublease rentals (3) | | | | (5,113 | ) | | | (1,069 | ) | | | (1,613 | ) | | | (1,239 | ) | | | (1,192 | ) |
| Net minimum lease payments | | | 29,189 | | | 2,699 | | | 5,715 | | | 6,212 | | | 14,563 | | | | 19,282 | | | | 2,249 | | | | 4,894 | | | | 5,325 | | | | 6,814 | |
| Total | | $ | 35,712 | | $ | 7,195 | | $ | 7,742 | | $ | 6,212 | | $ | 14,563 | | | $ | 28,341 | | | $ | 10,108 | | | $ | 6,094 | | | $ | 5,325 | | | $ | 6,814 | |
| | (1) | Amounts represent contractual obligations related to software license contracts, IT consulting contractsdata center hosting, and outsourcing contracts for employee benefits administration and software system support. |
| (2) | Represents minimum annualized purchase obligations associated with promotional spending as per the terms of our agreement with Novartis through February 2010, which is the early termination date for this contract provided that sales of the product remain below certain pre-determined thresholds. |
| | (2)
(3) | OnIn June 21, 2005, we signed an agreement to sublease approximately 16,000 square feet of the first floor at our corporate headquarters facility in Saddle River, New Jersey. The sublease is for a five-year term commencing July 15, 2005, and provides for approximately $2 million in lease payments over the five-year period. In July 2007, we signed an agreement to sublease approximately 20,000 square feet of the second floor at our corporate headquarters. The sublease term is through the remainder of our lease, which is approximately eight and one-half years and will provide for approximately $4.4 million in lease payments over that period. Also in 2007, we signed two separate subleases at our facility in Dresher, Pennsylvania. These subleases are for five-year terms and will provide approximately $650,000 combined in lease payments over the five-year period. |
As a result of the net operating loss carryback claims which have been filed or are expected to be filed by us, and the impact of those claims on the relevant statue of limitations, it is not practicable to predict the amount or timing of the impact of FIN 48 liabilities in the table above and, therefore, these liabilities have been excluded from the table above.
Off-Balance Sheet Arrangements
| Off-Balance Sheet Arrangements |
As of December 31, 2006,2008, we had no off-balance sheet arrangements.
PDI, Inc.
Annual Report on Form 10-K (continued)
Selected Quarterly Financial Information (unaudited)
The following tabletables set forth selected quarterly financial information for the years ended December 31, 20062008 and 20052007 (in thousands except per share data):
PDI, Inc.
Annual Report on Form 10-K (continued)
| | | For the Quarters ended | |
| | | March 31 | | June 30 | | September 30 | | December 31 | |
2006 Quarters: | | | | | | | | | | | | | |
| Total revenues, net | | $ | 77,144 | | $ | 54,951 | | $ | 51,317 | | $ | 55,830 | |
| Gross profit | | | 18,704 | | | 11,958 | | | 12,403 | | | 12,779 | |
Operating income (loss) (1) | | | 7,504 | | | 37 | | | (611 | ) | | (1,017 | ) |
| Income from | | | | | | | | | | | | | |
| continuing operations | | | 5,422 | | | 707 | | | 409 | | | 4,837 | |
| Income (loss) from discontinued | | | | | | | | | |
| operations, net of tax | | | 199 | | | 188 | | | 54 | | | (7 | ) |
| Net income | | | 5,621 | | | 895 | | | 463 | | | 4,830 | |
| | | | | | | | | | | | | | |
| Income (loss) per share: | | | | | | | | | | | | | |
| Basic | | | | | | | | | | | | | |
| Continuing operations | | $ | 0.39 | | $ | 0.05 | | $ | 0.03 | | $ | 0.35 | |
| Discontinued operations | | | 0.01 | | | 0.01 | | | 0.00 | | | (0.00 | ) |
| | | $ | 0.41 | | $ | 0.06 | | $ | 0.03 | | $ | 0.35 | |
| Diluted | | | | | | | | | | | | | |
| Continuing operations | | $ | 0.39 | | $ | 0.05 | | $ | 0.03 | | $ | 0.35 | |
| Discontinued operations | | | 0.01 | | | 0.01 | | | 0.00 | | | (0.00 | ) |
| | | $ | 0.40 | | $ | 0.06 | | $ | 0.03 | | $ | 0.35 | |
| | | | | | | | | | | | | | |
| Weighted average number of shares: | | | | | | | | | |
| Basic | | | 13,824 | | | 13,857 | | | 13,871 | | | 13,883 | |
| Diluted | | | 13,914 | | | 13,953 | | | 13,987 | | | 13,995 | |
| | | | | | | | | | | | | | |
2005 Quarters: | | | | | | | | | | | | | |
| Total revenues, net | | $ | 77,955 | | $ | 76,058 | | $ | 72,854 | | $ | 78,338 | |
| Gross profit | | | 16,231 | | | 13,670 | | | 10,041 | | | 12,460 | |
Operating loss (1) | | | (925 | ) | | (179 | ) | | (8,333 | ) | | (9,403 | ) |
| (Loss) income from | | | | | | | | | | | | | |
| continuing operations | | | (147 | ) | | 4,441 | | | (4,278 | ) | | (11,423 | ) |
| Income (loss) from discontinued | | | | | | | | | |
| operations, net of tax | | | 85 | | | 72 | | | 94 | | | (8,298 | ) |
| Net (loss) income | | | (62 | ) | | 4,513 | | | (4,184 | ) | | (19,721 | ) |
| | | | | | | | | | | | | | |
| (Loss) income per share: | | | | | | | | | | | | | |
| Basic | | | | | | | | | | | | | |
| Continuing operations | | $ | (0.01 | ) | $ | 0.30 | | $ | (0.31 | ) | $ | (0.83 | ) |
| Discontinued operations | | | 0.01 | | | 0.00 | | | 0.01 | | | (0.60 | ) |
| | | $ | (0.00 | ) | $ | 0.31 | | $ | (0.30 | ) | $ | (1.43 | ) |
| Diluted | | | | | | | | | | | | | |
| Continuing operations | | $ | (0.01 | ) | $ | 0.30 | | $ | (0.31 | ) | $ | (0.83 | ) |
| Discontinued operations | | | 0.01 | | | 0.00 | | | 0.01 | | | (0.60 | ) |
| | | $ | (0.00 | ) | $ | 0.31 | | $ | (0.30 | ) | $ | (1.43 | ) |
| | | For the Quarters ended | |
| | | March 31 | | | June 30 | | | September 30 | | | December 31 | |
| 2008 Quarters: | | | | | | | | | | | | |
| Revenues, net | | $ | 32,229 | | | $ | 30,399 | | | $ | 24,496 | | | $ | 25,404 | |
| Gross profit | | | 8,699 | | | | 3,590 | | | | 412 | | | | (8,189 | ) |
Operating (loss) (1) | | | (1,708 | ) | | | (7,900 | ) | | | (9,589 | ) | | | (17,231 | ) |
| Net loss | | | (1,060 | ) | | | (7,477 | ) | | | (9,004 | ) | | | (16,920 | ) |
| | | | | | | | | | | | | | | | | |
| Loss per share: | | | | | | | | | | | | | | | | |
| Basic | | $ | (0.08 | ) | | $ | (0.53 | ) | | $ | (0.64 | ) | | $ | (1.20 | ) |
| Diluted | | $ | (0.08 | ) | | $ | (0.53 | ) | | $ | (0.64 | ) | | $ | (1.20 | ) |
| | | | | | | | | | | | | | | | | |
| Weighted average number of shares: | | | | | | | | | | | | | |
| Basic | | | 13,969 | | | | 13,986 | | | | 14,026 | | | | 14,066 | |
| Diluted | | | 13,969 | | | | 13,986 | | | | 14,026 | | | | 14,066 | |
| | | | | | | | | | | | | | | | | |
| | | For the Quarters ended | |
| | | March 31 | | | June 30 | | | September 30 | | | December 31 | |
| 2007 Quarters: | | | | | | | | | | | | | | | | |
| Revenues, net | | $ | 32,802 | | | $ | 27,784 | | | $ | 23,969 | | | $ | 32,576 | |
| Gross profit | | | 8,975 | | | | 7,151 | | | | 5,766 | | | | 9,723 | |
Operating (loss) (2) | | | (2,243 | ) | | | (3,887 | ) | | | (5,250 | ) | | | (2,900 | ) |
| Net loss | | | (1,901 | ) | | | (2,497 | ) | | | (4,057 | ) | | | (1,519 | ) |
| | | | | | | | | | | | | | | | | |
| Loss per share: | | | | | | | | | | | | | | | | |
| Basic | | $ | (0.14 | ) | | $ | (0.18 | ) | | $ | (0.29 | ) | | $ | (0.11 | ) |
| Diluted | | $ | (0.14 | ) | | $ | (0.18 | ) | | $ | (0.29 | ) | | $ | (0.11 | ) |
| | | | | | | | | | | | | | | | | |
| Weighted average number of shares: | | | | | | | | | | | | | |
| Basic | | | 13,908 | | | | 13,931 | | | | 13,956 | | | | 13,965 | |
| Diluted | | | 13,908 | | | | 13,931 | | | | 13,956 | | | | 13,965 | |
Note: Quarterly information reflects our results of operations shown excluding the MD&D unit which was reported as a discontinued operation beginning in the second quarter of 2006. All prior periods have been restated. Quarterly and year-to-date computations of per share amounts are made independently; therefore,independently. Therefore, the sum of per share amounts for the quarters may not equal per share amounts for the year.
| (1) | (1)
| The quarter ended June 30, 20062008 and September 30, 2008 includes executive severance costs of $0.7 million and $0.3 million, respectively. The quarter ended December 31, 2008 includes facilities realignment costs of $0.3$0.1 million and a contract loss of $10.3 million. |
| (2) | The quarter ended September 30, 2007 includes facilities realignment costs of $0.1 million. The quarter ended December 31, 20062007 includes a $2.5 million credit to expense as a result of the Cellegy litigation settlement; $1.6 million in facilities realignment costs; and $0.6 million in executive severance costs. |
PDI, Inc.
Annual Report on Form 10-K (continued)
| (2)
| The quarter ended March 31, 2005 includes a $1.2 million charge for employee severance costs and a $0.2 million charge for executive severance costs. The quarter ended June 30, 2005 includes a $2.8 million charge for the impairment of the Siebel sales force automation platform and a $0.4 million charge for executive severance costs; the quarter ended September 30, 2005 includes a $1.7 million charge for executive severance costs. The quarter ended December 31, 2005 includes a $3.4 million charge for executive severance costs; a $2.4 million charge for facilities realignment costs; and a $3.3 million charge for the impairment of the goodwill associated with the Select Access reporting unit.$0.9 million. |
Our results of operations have varied, and are expected to continue to vary, from quarter to quarter. These fluctuations result from a number of factors including, among other things, the timing of commencement, completion or cancellation of major contracts. In the future, our revenue may also fluctuate as a result of a number of additional factors, including the types of products we market and sell, delays or costs associated with acquisitions, government regulatory initiatives and conditions in the healthcare industry generally. Revenue, generally, is recognized as services are performed. Program costs, other than training costs, are expensed as incurred. As a result, we may incur substantial expenses associated with staffing a new detailing program during the first two to three months of a contract without recognizing any revenue under that contract. This could have an adverse impact on our operating results for the quarters in which those expenses are incurred. Revenue related to performance incentives is recognized in the period when the performance based parameters are achieved and payment is assured. A significant portion of this revenue could be recognized in the first and fourth quarters of a year. Costs of goods sold are expensed when products are shipped.
PDI, Inc.
Annual Report on Form 10-K (continued)
EFFECT OF NEW ACCOUNTING PRONOUNCEMENTS
The following represent recently issued accounting pronouncements that will affect reporting and disclosures in future periods. See Note 1 to the consolidated financial statements for a further discussion of each item.Recently Issued Standards
In July 2006,December 2007, the Financial Accounting Standards Board (FASB) issued SFAS No. 141 (Revised 2007), “Business Combinations” (FAS 141R). FAS 141R continues to require the purchase method of accounting to be applied to all business combinations, but it significantly changes the accounting for certain aspects of business combinations. Under FAS 141R, an acquiring entity will be required to recognize all the assets acquired and liabilities assumed in a transaction at the acquisition-date fair value with limited exceptions. FAS 141R will change the accounting treatment for certain specific acquisition related items including: (1) expensing acquisition related costs as incurred; (2) valuing noncontrolling interests at fair value at the acquisition date; and (3) expensing restructuring costs associated with an acquired business. FAS 141R also includes a substantial number of new disclosure requirements. FAS 141R is to be applied prospectively to business combinations for which the acquisition date is on or after January 1, 2009. We expect FAS 141R will have an impact on our accounting for any future business combinations once adopted but the effect is dependent upon the nature and timing of any acquisitions that may be made in the future.
In June 2008, the FASB issuedapproved FASB Interpretation No. 48, “Accounting For Uncertainty In Income Taxes - an Interpretation of FASB Statement 109” (FIN 48). FIN 48 clarifies that an entity’s tax benefits recognizedStaff Position (FSP) EITF 03-6-1, “Determining Whether Instruments Granted in tax returns must be more likely than not of being sustained prior to recording the related tax benefit in the financial statements. As required by FIN 48, we will adopt this new accounting standardShare-Based Payment Transactions Are Participating Securities” (FSP EITF 03-6-1) which is effective January 1, 2007.2009. FSP EITF 03-6-1 clarifies that share-based payment awards that entitle holders to receive non-forfeitable dividends before they vest will be considered participating securities and included in the basic earnings per share calculation. Prior to May 30, 2008, our stock award agreements provided for nonforfeitable dividend rights to unvested restricted stock awards and, consequently, these awards are participating securities as defined in this FSP. On May 31, 2008, we revised our stock award agreements for future grants so that unvested shares are non-participating securities. We are currently evaluating the potential effects the interpretation may haveimpact of adopting FSP EITF 03-6-1 on our consolidated financial position orand results of operations, but do not expect there to be a material consequence.operations.
In September 2006, the FASB issued Recently Adopted Standards
SFAS No. 157, (SFAS“Fair Value Measurements” (FAS 157), “Fair Value Measurements.” This statement defines fair value, establishes a framework for measuring fair value, and expands disclosures about fair value measurements. This standard is to be applied when other standards require or permit the use of fair value measurement of an asset or liability. The statementSFAS 157 was adopted on January 1, 2008 for all financial assets and liabilities and for nonfinancial assets and liabilities recognized or disclosed at fair value in our consolidated financial statements on a recurring basis (at least annually). For all other nonfinancial assets and liabilities, SFAS 157 is effective foron January 1, 2009. The initial adoption of FAS 157 had no impact on our consolidated financial statements issued for fiscal years beginning after November 15, 2007, and interim periods within that fiscal year.position or results of operations; however, we are now required to provide additional disclosures as part of its financial statements. See Note 6, Fair Value Measurements. We are still in the process of evaluating this standard with respect to its effect on nonfinancial assets and liabilities and, therefore, have not yet determined the impact that it will have our financial statements upon full adoption in 2009. Nonfinancial assets and liabilities for which we have not applied the provisions of adopting this statement.
FAS 157 include those measured at fair value in impairment testing and those initially measured at fair value in a business combination.
ITEM 7A. In February 2007, the FASB issued SFAS No. 159, “The Fair Value Option for Financial Assets and Financial Liabilities-including an amendment of FASB Statement No. 115QUANTITATIVE AND QUALITATIVE DISCLOSURES ABOUT MARKET RISK” (FAS 159). FAS 159 permits entities to elect to measure eligible financial instruments at fair value. We would report unrealized gains and losses on items for which the fair value option has been elected in earnings at each subsequent reporting date, and recognize upfront costs and fees related to those items in earnings as incurred and not deferred. We adopted FAS 159 as of January 1, 2008. We did not apply the fair value option to any of its outstanding instruments and, therefore, the adoption of FAS 159 did not have an impact on our financial condition or results of operations.
PDI, Inc.
Annual Report on Form 10-K (continued)
| ITEM 7A. | QUANTITATIVE AND QUALITATIVE DISCLOSURES ABOUT MARKET RISK |
We are exposed to market risk for changes in the market values of some of our investments (investment risk) and the effect of interest rate changes (interest rate risk). Our financial instruments are not currently subject to foreign currency risk or commodity price risk. We have no financial instruments held for trading purposes and we have no interest bearing long term or short term debt. At December 31, 2006, 2005,2008, 2007, and 2004,2006, we did not hold any derivative financial instruments.
The objectives of our investment activities are: to preserve capital, maintain liquidity, and maximize returns without significantly increasing risk. In accordance with our investment policy, we attempt to achieve these objectives by investing our cash in a variety of financial instruments. These investments are principally restricted to government sponsored enterprises, high-grade bank obligations, high-gradeinvestment-grade corporate bonds, certain money market funds of investment grade debt instruments such as obligations of the U.S. Treasury and U.S. Federal Government Agencies, municipal bonds and commercial paper.
PDI, Inc.
Annual Report on Form 10-K (continued)
Investments in both fixed rate and floating rate interest earning instruments carry a degree of interest rate risk. Fixed rate securities may have their fair market value adversely impacted due to a rise in interest rates, while floating rate securities may produce less income than expected if interest rates fall. Due in part to these factors, our future investment income may fall short of expectations due to changes in interest rates or we may suffer losses in principal if forced to sell securities that have seen a decline in market value due to changes in interest rates. Our cash and cash equivalents and short term investments at December 31, 20062008 were composed of the instruments described in the preceding paragraph. All of those investments mature by August 2007, with the majority maturing within the first four months of 2007 or having interest reset periods not greater than 35 days. If interest rates were to increase or decrease by one percent, the fair value of our investments would have an insignificant increase or decrease primarily due to the quality of the investments and the relative near term maturity.
ITEM 8.FINANCIAL STATEMENTS AND SUPPLEMENTARY DATA| ITEM 8. | FINANCIAL STATEMENTS AND SUPPLEMENTARY DATA |
Our financialFinancial statements and requiredthe financial statement scheduleschedules specified by this Item, together with the reports thereon of Ernst & Young LLP, are included herein beginning on page F-1.presented following Item 15 of this report.
ITEM 9.CHANGES IN AND DISAGREEMENTS WITH ACCOUNTANTS ON ACCOUNTING AND FINANCIAL DISCLOSURES| ITEM 9. | CHANGES IN AND DISAGREEMENTS WITH ACCOUNTANTS ON ACCOUNTING AND FINANCIAL DISCLOSURES |
None.
ITEM 9A. CONTROLS AND PROCEDURES
(a)Disclosure Controls and Procedures| (a) | Disclosure Controls and Procedures |
Our management, with the participation of our chief executive officer and chief financial officer, has evaluated the effectiveness of our disclosure controls and procedures (as such term is defined in Rules 13a-15(e) and 15d-15(e) under the Exchange Act) as of the end of the period covered by this Form 10-K. Based on that evaluation, our chief executive officer and chief financial officer have concluded that, as of the end of such period, our disclosure controls and procedures are effective to ensure that information required to be disclosed by us in the reports that we file or submit under the Exchange Act is (i) recorded, processed, summarized and reported, within the time periods specified in the SEC’s rules and forms; and (ii) accumulated and communicated to management, including our chief executive officer and chief financial officer, as appropriate to allow timely decisions regarding required disclosure.
Our management, including our chief executive officer and chief financial officer, does not expect that our disclosure controls and procedures or our internal controls will prevent all errors and all fraud. A control system, no matter how well conceived and operated, can provide only reasonable, not absolute, assurance that the objectives of the control system are met. Further, the design of a control system must reflect the fact that there are resource constraints and the benefits of controls must be considered relative to their costs. Because of the inherent limitations in all control systems, no evaluation of controls can provide absolute assurance that all control issues and instances of fraud, if any, within PDI, Inc. have been detected.
(b)Management's Report on Internal Control over Financial Reporting| (b) | Management's Annual Report on Internal Control over Financial Reporting |
Our management is responsible for establishing and maintaining adequate internal control over financial reporting (as defined in Rule 13a-15(f) under the Exchange Act). Our management assessed the effectiveness of our internal control over financial reporting as of December 31, 2006.2008. In making this assessment, our management used the criteria set forth by the Committee of Sponsoring Organizations of the Treadway Commission in Internal Control-Integrated Framework. Our management has concluded that, as of December 31, 2006,2008, our internal control over financial reporting is effective based on these criteria. Our independent registered public accounting firm, Ernst & Young LLP, has issued an audit report on our assessmentThe effectiveness of our internal control over financial reporting as of December 31, 2008 has been audited by Ernst & Young LLP, an independent registered public accounting firm, as stated in its report appearing in this Form 10-K, which is included herein.report expressed an unqualified opinion on the effectiveness of our internal control over financial reporting as of December 31, 2008.
(c)Changes in Internal Control over Financial Reporting| (c) | Changes in Internal Control over Financial Reporting |
There were no changes in our internal controls over financial reporting during the quarter ended December 31, 20062008 that have materially affected, or are reasonably likely to materially affect our internal controls over financial reporting.
PDI, Inc.
Annual Report on Form 10-K (continued)
(d)Report of Independent Registered Public Accounting Firm
The Board of Directors and Stockholders of PDI, Inc.
We have audited management’s assessment, included in the accompanying Management's Annual Report on Internal Control Over Financial Reporting, that PDI, Inc. maintained effective’s internal control over financial reporting as of December 31, 2006,2008, based on criteria established in Internal Control—Integrated Framework issued by the Committee of Sponsoring Organizations of the Treadway Commission (the COSO criteria). PDI Inc.’s management is responsible for maintaining effective internal control over financial reporting, and for its assessment of the effectiveness of internal control over financial reporting.reporting included in the accompanying Management’s Report on Internal Control over Financial Reporting. Our responsibility is to express an opinion on management’s assessment and an opinion on the effectiveness of the company’sCompany’s internal control over financial reporting based on our audit.
We conducted our audit in accordance with the standards of the Public Company Accounting Oversight Board (United States). Those standards require that we plan and perform the audit to obtain reasonable assurance about whether effective internal control over financial reporting was maintained in all material respects. Our audit included obtaining an understanding of internal control over financial reporting, evaluating management’s assessment,assessing the risk that a material weakness exists, testing and evaluating the design and operating effectiveness of internal control based on the assessed risk, and performing such other procedures as we considered necessary in the circumstances. We believe that our audit provides a reasonable basis for our opinion.
A company’s internal control over financial reporting is a process designed to provide reasonable assurance regarding the reliability of financial reporting and the preparation of financial statements for external purposes in accordance with generally accepted accounting principles. A company’s internal control over financial reporting includes those policies and procedures thatthat: (1) pertain to the maintenance of records that, in reasonable detail, accurately and fairly reflect the transactions and dispositions of the assets of the company; (2) provide reasonable assurance that transactions are recorded as necessary to permit preparation of financial statements in accordance with generally accepted accounting principles, and that receipts and expenditures of the company are being made only in accordance with authorizations of management and directors of the company; and (3) provide reasonable assurance regarding prevention or timely detection of unauthorized acquisition, use, or disposition of the company’s assets that could have a material effect on the financial statements.
Because of its inherent limitations, internal control over financial reporting may not prevent or detect misstatements. Also, projections of any evaluation of effectiveness to future periods are subject to the risk that controls may become inadequate because of changes in conditions, or that the degree of compliance with the policies or procedures may deteriorate.
In our opinion, management’s assessment that PDI, Inc. maintained effective internal control over financial reporting as of December 31, 2006 is fairly stated, in all material respects, based on the COSO criteria. Also, in our opinion, PDI, Inc. maintained, in all material respects, effective internal control over financial reporting as of December 31, 2006,2008, based onthe COSO criteria.criteria.
We also have audited, in accordance with the standards of the Public Company Accounting Oversight Board (United States), the accompanying consolidated balance sheets of PDI, Inc. as of December 31, 20062008 and 2005,2007, and the related consolidated statements of operations, stockholders’ equity, and cash flows of PDI, Inc. for each of the three years in the period ended December 31, 20062008 of PDI, Inc. and our report dated March 15, 200711, 2009 expressed an unqualified opinion thereon.
| | /s/Ernst &Young LLP |
| | |
MetroPark, New York, NYJersey | |
March 15, 200711, 2009 | |
ITEM 9B. OTHER INFORMATIONPDI, Inc.
Annual Report on Form 10-K (continued)
| ITEM 9B. | OTHER INFORMATION |
None.
PDI, Inc.
Annual Report on Form 10-K (continued)
PART III
ITEM 10. DIRECTORS AND EXECUTIVE OFFICERS OF THE REGISTRANT| ITEM 10. | DIRECTORS, EXECUTIVE OFFICERS AND CORPORATE GOVERNANCE |
Information relating to directors and executive officers of the registrant that is responsive to Item 10 of this Form 10-K will be included in our Proxy Statement in connection with our 20072009 annual meeting of stockholders and such information is incorporated by reference herein.
ITEM 11.EXECUTIVE COMPENSATION| ITEM 11. | EXECUTIVE COMPENSATION |
Information relating to executive compensation that is responsive to Item 11 of this Form 10-K will be included in our Proxy Statement in connection with our 20072009 annual meeting of stockholders and such information is incorporated by reference herein.
ITEM 12. SECURITY OWNERSHIP OF CERTAIN BENEFICIAL OWNERS AND MANAGEMENT AND RELATED STOCKHOLDER MATTERS| ITEM 12. | SECURITY OWNERSHIP OF CERTAIN BENEFICIAL OWNERS AND MANAGEMENT AND RELATED STOCKHOLDER MATTERS |
Information relating to security ownership of certain beneficial owners and management that is responsive to Item 12 of this Form 10-K will be included in our Proxy Statement in connection with our 20072009 annual meeting of stockholders and such information is incorporated by reference herein.
ITEM 13. CERTAIN RELATIONSHIPS AND RELATED TRANSACTIONS| ITEM 13. | CERTAIN RELATIONSHIPS AND RELATED TRANSACTIONS, AND DIRECTOR INDEPENDENCE |
Information relating to certain relationships and related transactions that is responsive to Item 13 of this Form 10-K will be included in our Proxy Statement in connection with our 20072009 annual meeting of stockholders and such information is incorporated by reference herein.
ITEM 14. PRINCIPAL ACCOUNTING FEES AND SERVICES
| ITEM 14. | PRINCIPAL ACCOUNTING FEES AND SERVICES |
Information relating to principal accounting fees and services that is responsive to Item 14 of this Form 10-K will be included in our Proxy Statement in connection with our 20072009 annual meeting of stockholders and such information is incorporated by reference herein.
PDI, Inc.
Annual Report on Form 10-K (continued)
PART IV
ITEM 15.EXHIBITS AND FINANCIAL STATEMENT SCHEDULES| ITEM 15. | EXHIBITS, FINANCIAL STATEMENT SCHEDULES |
| (a) | The following documents are filed as part of this Form 10-K: |
(1)Financial Statements - See Index to Financial Statements on page F-1 of this report. | (1) | Financial Statements – See Index to Financial Statements on page F-1 of this report. |
(2)Financial Statement Schedule | (2) | Financial Statement Schedule |
Schedule II:Valuation and Qualifying Accounts
All other schedules are omitted because they are not applicable or the required information is shown in the financial statements or notes thereto.
Exhibit No. | | Description |
| | |
| 3.1 | | Certificate of Incorporation of PDI, Inc. (1)(1) |
| | |
| 3.2 | | By-Laws of PDI, Inc . Inc. (1)(1) |
| | |
| 3.3 | | Certificate of Amendment of Certificate of Incorporation of PDI, Inc. (3)(3) |
| | |
| 4.1 | | Specimen Certificate Representing the Common Stock (1)(1) |
| | |
| 10.1* | | Form of 1998 Stock Option Plan (1)(1)
|
| | |
| 10.2* | | Form of 2000 Omnibus Incentive Compensation Plan (2)(2)
|
| 10.3* | | 2004 Stock Award and Incentive Plan (4) |
10.3*10.4* | | Form of Restricted Stock Unit Agreement for Employees, filed herewith. |
| 10.5* | | Form of Stock Appreciation Rights Agreement for Employees, filed herewith. |
| 10.6* | | Form of Restricted Stock Unit Agreement for Directors, filed herewith. |
| 10.7* | | Agreement between the Company and John P. Dugan (1)(1) |
| 10.8* | | |
10.4* | | Form of Employment Separation Agreement between the Company and Steven K. Budd, filed herewithNancy Lurker (9) |
| | |
10.5*10.9* | | Form of Amended and Restated Employment Agreement between the Company and Stephen Cotugno Jeffrey Smith (10)(3)
|
| | |
10.6 | | Saddle River Executive Centre Lease (5)
|
| | |
10.7* | | 2004 Stock Award and Incentive Plan (4)
|
| | |
10.8* | | Form of Agreement between the Company and Larry Ellberger (5)
|
| | |
10.9* | | Form of Agreement between the Company and Bernard C. Boyle (5)
|
| | |
| 10.10* | | Memorandum of UnderstandingEmployment Separation Agreement between the Company and Bernard C. Boyle Michael Marquard (6)(5)
|
| | |
| 10.11* | | Amendment to Memorandum of UnderstandingEmployment Separation Agreement between the Company and Bernard C. Boyle Kevin Connolly (7)(5)
|
| | |
| 10.12 | | Saddle River Executive Centre Lease (5) |
| 10.13 | | Saddle River Executive Centre 2005 Sublease Agreement (5) |
| 10.14 | | (5)Saddle River Executive Centre 2007 Sublease (8)
|
| | | |
PDI, Inc.
Annual Report on Form 10-K (continued)
10.13*Exhibit No. | | Form of Agreement between the Company and Michael J. Marquard (6)
|
| | |
10.14* | | Form of Agreement between the Company and Jeffrey E. Smith (6)
|
| | |
10.15* | | Form of Agreement between the Company and Kevin Connolly, filed herewithDescription |
| | | |
| 21.1 | | Subsidiaries of the Registrant, (3)filed herewith. |
| | |
| 23.1 | | Consent of Ernst & Young LLP, filed herewith. |
PDI, Inc.
Annual Report on Form 10-K (continued)
Exhibit No.
| | Description
|
23.2 | | Consent of PricewaterhouseCoopers LLP filed herewith. |
| | |
| 31.1 | | Certification of Chief Executive Officer Pursuant to Section 302 of the Sarbanes-Oxley Act of 2002, filed herewith. |
| | |
| 31.2 | | Certification of Chief Financial Officer Pursuant to Section 302 of the Sarbanes-Oxley Act of 2002, filed herewith. |
| | |
| 32.1 | | Certification of Chief Executive Officer Pursuant to 18 U.S.C. Section 1350, as adopted Pursuant to Section 906 of the Sarbanes-Oxley Act of 2002, filed herewith. |
| | |
| 32.2 | | Certification of Chief Financial Officer Pursuant to 18 U.S.C. Section 1350, as adopted Pursuant to Section 906 of the Sarbanes-Oxley Act of 2002, filed herewith. |
| | |
| |
| * | Denotes compensatory plan, compensation arrangement or management contract. |
| | | |
(1) | Filed as an exhibit to our Registration Statement on Form S-1 (File No 333-46321), and incorporated herein by reference. |
| | | |
(2) | Filed as an Exhibitexhibit to our definitive proxy statement dated May 10, 2000, and incorporated herein by reference. |
| | | |
(3) | Filed as an exhibit to our Annual Report on Form 10-K for the year ended December 31, 2001, and incorporated herein by reference. |
| | | |
(4) | Filed as an Exhibitexhibit to our definitive proxy statement dated April 28, 2004, and incorporated herein by reference. |
| | | |
(5) | Filed as an exhibit to our Form 10-K for the year ended December 31, 2005, and incorporated herein by reference. |
| | | |
(6) | Filed as an exhibit to our Form 10-Q for the quarter ended June 30, 2006, and incorporated herein by reference. |
| | |
| (7) | Filed as an exhibit to our Annual Report on Form 10-K for the year ended December 31, 2006, and incorporated herein by reference. |
| | |
| (8) | Filed as an exhibit to our Annual Report on Form 10-K for the year ended December 31, 2007, and incorporated herein by reference. |
| |
| (9) | Filed as an exhibit to our Current Report on Form 8-K filed on November 18, 2008, and incorporated herein by reference. |
| |
| (10) | Filed as an exhibit to our Current Report on Form 8-K filed on January 7, 2009, and incorporated herein by reference. |
(b) | We have filed, as exhibits to this Form 10-K, the exhibits required by Item 601 of the Regulation S-K. |
(c) | We have filed, as financial statements schedules to this annual report on Form 10-K, the financial statements required by Regulation S-X, which are excluded from the annual report to stockholders by Rule 14a-3(b). |
PDI, Inc.
Annual Report on Form 10-K (continued)
SIGNATURES
Pursuant to the requirements of Section 13 or 15(d) of the Securities Exchange Act of 1934, as amended, the Registrant has duly caused this Form 10-K to be signed on its behalf by the undersigned, thereunto duly authorized, on the 16th12th day of March, 2007.
2009.
| | PDI, INC. |
| | |
| | /ss/ Michael J. MarquardNancy Lurker |
| | Michael J. MarquardNancy Lurker |
| | Chief Executive Officer |
| | |
| |
POWER OF ATTORNEY
PDI, Inc., a Delaware Corporation, and each person whose signature appears below constitutes and appoints each of Nancy Lurker and Jeffrey E. Smith, and either of them, such person’s true and lawful attorney-in-fact, with full power of substitution and resubstitution, for such person and in such person’s name, place and stead, in any and all capacities, to sign on such person’s behalf, individually and in each capacity stated below, any and all amendments to this Annual Report on Form 10-K and other documents in connection therewith, and to file the same and all exhibits thereto and other documents in connection therewith, with the Securities and Exchange Commission, granting unto said attorneys-in-fact, and each of them, full power and authority to do and perform each and every act and thing necessary or desirable to be done in and about the premises, as fully to all intents and purposes as he or she might or could do in person, thereby ratifying and confirming all that said attorneys-in-fact, or any of them, or their or his or her substitute or substitutes, may lawfully do or cause to be done by virtue hereof.
Pursuant to the requirements of the Securities Exchange Act of 1934, as amended, this Form 10-K has been signed by the following persons on behalf of the Registrant and in the capacities indicated and on the 16th12th day of March, 2007.
2009.
| Signature | | Title |
| | |
| /s/ John P. Dugan | | Chairman of the Board of Directors |
| John P. Dugan | | |
| | | |
/ss/ Michael J. MarquardNancy Lurker | | Chief Executive Officer and Director |
Michael J. MarquardNancy Lurker | | (principal executive officer) |
| | | |
| /s/ Jeffrey E. Smith | | Chief Financial Officer and Treasurer |
| Jeffrey E. Smith | | (principal accounting and financial officer) |
| | | |
| /s/ John M. Pietruski | | Director |
| John M. Pietruski | | |
| | | |
| /s/ Jan Martens Vecsi | | Director |
| Jan Martens Vecsi | | |
| | | |
| /s/ Frank Ryan | | Director |
| Frank Ryan | | |
| | | |
| /s/ John Federspiel | | Director |
| John Federspiel | | |
| | | |
| /s/ Dr. Joseph T. Curti | | Director |
| Dr. Joseph T. Curti | | |
| | | |
| /s/ Stephen J. Sullivan | | Director |
| Stephen J. Sullivan | | |
| | | |
| /s/ Jack E. Stover | | Director |
| Jack E. Stover | | |
| | |
| /s/ Gerald Belle | | Director |
| Gerald Belle | | |
| | |
| /s/ Veronica Lubatkin | | Director |
| Veronica Lubatkin | | |
PDI, INC.Inc.
Index to Consolidated Financial Statements
and Financial Statement Schedules
| | | Page |
| | |
| Report of Independent Registered Public Accounting Firm | F-2 |
| | |
Report of Independent Registered Public Accounting Firm | F-3 |
| |
| Financial Statements | |
| | Consolidated Balance Sheets at December 31, 20062008 and 20052007 | F-4F-3 |
| | | |
| | Consolidated Statements of Operations for each of the three years | |
| | in the period ended December 31, 20062008 | F-5F-4 |
| | | |
| | Consolidated Statements of Stockholders’ Equity for each of the three years | |
| | in the period ended December 31, 20062008 | F-6F-5 |
| | | |
| | Consolidated Statements of Cash Flows for each of the three years | |
| | in the period ended December 31, 20062008 | F-7F-6 |
| | | |
| | Notes to Consolidated Financial Statements | F-8F-7 |
| | | |
| Schedule II. Valuation and Qualifying Accounts | F-31F-30 |
| | | |
| | | |
Report of Independent Registered Public Accounting Firm
| The Board of Directors and Stockholders of PDI, Inc.: |
We have audited the accompanying consolidated balance sheets of PDI, Inc. as of December 31, 20062008 and 2005,2007, and the related consolidated statements of operations, stockholders’ equity, and cash flows for each of the twothree years in the period ended December 31, 2006.2008. Our audits also included the financial statement schedule listed in the Index at Item 15(a) (2). These financial statements and schedule are the responsibility of the Company’s management. Our responsibility is to express an opinion on the financial statements and schedule based on our audits.
We conducted our audits in accordance with the standards of the Public Company Accounting Oversight Board (United States). Those standards require that we plan and perform the audit to obtain reasonable assurance about whether the financial statements are free of material misstatement. An audit includes examining, on a test basis, evidence supporting the amounts and disclosures in the financial statements. An audit also includes assessing the accounting principles used and significant estimates made by management, as well as evaluating the overall financial statement presentation. We believe that our audits provide a reasonable basis for our opinion.
In our opinion, the financial statements referred to above present fairly, in all material respects, the consolidated financial position of PDI, Inc. at December 31, 20062008 and 2005,2007, and the consolidated results of its operations and its cash flows for each of the twothree years in the period ended December 31, 2006,2008, in conformity with U.S. generally accepted accounting principles. Also, in our opinion, the related financial statement schedule, when considered in relation to the basic financial statements taken as a whole, presents fairly in all material respects the information set forth therein.
As discussed in Note 1 to the financial statements, effective January 1, 2006, the Company adopted the provisions of, and accounts for stock-based compensation in accordance with, Financial Accounting Standards Board Statement of Financial Accounting Standards No. 123 (revised 2004), Share-Based Payment.
We also have audited, in accordance with the standards of the Public Company Accounting Oversight Board (United States), the effectiveness of PDI, Inc.’s internal control over financial reporting as of December 31, 2006,2008, based on criteria established in Internal Control-Integrated Framework issued by the Committee of Sponsoring Organizations of the Treadway Commission and our report dated March 15, 200711, 2009 expressed an unqualified opinion on management's assessment and an unqualified opinion thereon.
| | /s/Ernst &Young LLP |
| | |
MetroPark, New York, NYJersey | |
March 15, 200711, 2009 | |
| | |
| |
| CONSOLIDATED BALANCE SHEETS | |
| (in thousands, except share and per share data) | |
| | | | | | | |
| | | December 31, | | | December 31, | |
| | | 2008 | | | 2007 | |
| ASSETS | | | | | | |
| Current assets: | | | | | | |
| Cash and cash equivalents | | $ | 90,074 | | | $ | 99,185 | |
| Short-term investments | | | 159 | | | | 7,800 | |
| Accounts receivable, net | | | 15,786 | | | | 22,751 | |
| Unbilled costs and accrued profits on contracts in progress | | | 2,469 | | | | 3,481 | |
| Other current assets | | | 4,511 | | | | 6,710 | |
| Total current assets | | | 112,999 | | | | 139,927 | |
| Property and equipment, net | | | 5,423 | | | | 8,348 | |
| Goodwill | | | 13,612 | | | | 13,612 | |
| Other intangible assets, net | | | 13,388 | | | | 14,669 | |
| Other long-term assets | | | 3,614 | | | | 2,998 | |
| Total assets | | $ | 149,036 | | | $ | 179,554 | |
| | | | | | | | | |
| LIABILITIES AND STOCKHOLDERS' EQUITY | | | | | | | | |
| Current liabilities: | | | | | | | | |
| Accounts payable | | $ | 2,298 | | | $ | 2,792 | |
| Unearned contract revenue | | | 3,678 | | | | 8,459 | |
| Accrued salary and bonus | | | 5,640 | | | | 7,136 | |
| Accrued contract loss | | | 10,021 | | | | - | |
| Other accrued expenses | | | 9,723 | | | | 10,801 | |
| Total current liabilities | | | 31,360 | | | | 29,188 | |
| Long-term liabilities | | | 10,569 | | | | 10,177 | |
| Total liabilities | | | 41,929 | | | | 39,365 | |
| | | | | | | | | |
| Commitments and contingencies (Note 9) | | | | | | | | |
| | | | | | | | | |
| Stockholders’ equity: | | | | | | | | |
| Preferred stock, $.01 par value; 5,000,000 shares authorized, no | | | | | | | | |
| shares issued and outstanding | | | - | | | | - | |
| Common stock, $.01 par value; 100,000,000 shares authorized; | | | | | | | | |
| 15,272,704 and 15,222,715 shares issued, respectively; | | | | | | | | |
| 14,223,669 and 14,183,236 shares outstanding, respectively | | | 153 | | | | 152 | |
| Additional paid-in capital | | | 121,908 | | | | 120,422 | |
| (Accumulated deficit)/retained earnings | | | (1,443 | ) | | | 33,018 | |
| Accumulated other comprehensive (loss) income | | | (16 | ) | | | 30 | |
| Treasury stock, at cost (1,049,035 and 1,039,479 shares, respectively) | | | (13,495 | ) | | | (13,433 | ) |
| Total stockholders' equity | | | 107,107 | | | | 140,189 | |
| Total liabilities and stockholders' equity | | $ | 149,036 | | | $ | 179,554 | |
| | | | | | | | | |
| | | | | | | | | |
| | | | | | | | | |
| | | | | | | | | |
| | | | | | | | | |
| | | | | | | | | |
| | | | | | | | | |
| The accompanying notes are an integral part of these consolidated financial statements | |
Report of Independent Registered Public Accounting Firm
To the Board of Directors and
Shareholders of PDI, Inc.:
In our opinion, the consolidated statements of operations, cash flows and stockholders' equity for the year ended December 31, 2004 present fairly, in all material respects, the results of operations and cash flows of PDI, Inc. and its subsidiaries for the year ended December 31, 2004, in conformity with accounting principles generally accepted in the United States of America. These financial statements are the responsibility of the Company's management. Our responsibility is to express an opinion on these financial statements based on our audit. We conducted our audit of these statements in accordance with the standards of the Public Company Accounting Oversight Board (United States). Those standards require that we plan and perform the audit to obtain reasonable assurance about whether the financial statements are free of material misstatement. An audit includes examining, on a test basis, evidence supporting the amounts and disclosures in the financial statements, assessing the accounting principles used and significant estimates made by management, and evaluating the overall financial statement presentation. We believe that our audit provides a reasonable basis for our opinion.
PricewaterhouseCoopers LLP
Florham Park, NJ
March 11, 2005
| |
CONSOLIDATED BALANCE SHEETS | |
| (in thousands, except share and per share data) | |
| | | | | | |
| | | December 31, | | December 31, | |
| | | 2006 | | 2005 | |
ASSETS | | | | | |
| Current assets: | | | | | | | |
| Cash and cash equivalents | | $ | 45,221 | | $ | 90,827 | |
| Short-term investments | | | 69,463 | | | 6,807 | |
| Accounts receivable, net of allowance for doubtful accounts of | | | | | | | |
| $36 and $778, respectively | | | 25,416 | | | 27,148 | |
| Unbilled costs and accrued profits on contracts in progress | | | 4,224 | | | 5,974 | |
| Income tax receivable | | | 1,888 | | | 6,145 | |
| Other current assets | | | 10,528 | | | 14,078 | |
| Total current assets | | | 156,740 | | | 150,979 | |
| Property and equipment, net | | | 12,809 | | | 16,053 | |
| Goodwill | | | 13,612 | | | 13,112 | |
| Other intangible assets, net | | | 15,950 | | | 17,305 | |
| Other long-term assets | | | 2,525 | | | 2,710 | |
| Total assets | | $ | 201,636 | | $ | 200,159 | |
| | | | | | | | |
LIABILITIES AND STOCKHOLDERS' EQUITY | | | | | | | |
| Current liabilities: | | | | | | | |
| Accounts payable | | $ | 3,915 | | $ | 5,693 | |
| Accrued income taxes | | | 1,761 | | | 4,047 | |
| Unearned contract revenue | | | 14,252 | | | 12,598 | |
| Accrued incentives | | | 9,009 | | | 12,179 | |
| Accrued payroll and related benefits | | | 1,475 | | | 3,709 | |
| Other accrued expenses | | | 14,142 | | | 20,489 | |
| Total current liabilities | | | 44,554 | | | 58,715 | |
| Long-term liabilities | | | 7,885 | | | 5,834 | |
| Total liabilities | | | 52,439 | | | 64,549 | |
| | | | | | | | |
| Commitments and contingencies (Note 9) | | | | | | | |
| | | | | | | | |
| Stockholders’ equity: | | | | | | | |
| Preferred stock, $.01 par value; 5,000,000 shares authorized, no | | | | | | | |
| shares issued and outstanding | | | - | | | - | |
| Common stock, $.01 par value; 100,000,000 shares authorized; | | | | | | | |
| 15,096,976 and 14,947,771 shares issued, respectively; | | | | | | | |
| 14,078,970 and 13,929,765 shares outstanding, respectively | | | 151 | | | 149 | |
| Additional paid-in capital | | | 119,189 | | | 118,325 | |
| Retained earnings | | | 42,992 | | | 31,183 | |
| Accumulated other comprehensive income | | | 79 | | | 71 | |
| Unamortized compensation costs | | | - | | | (904 | ) |
| Treasury stock, at cost (1,018,006 shares) | | | (13,214 | ) | | (13,214 | ) |
| Total stockholders' equity | | | 149,197 | | | 135,610 | |
| Total liabilities and stockholders' equity | | $ | 201,636 | | $ | 200,159 | |
| | | | | | | | |
| | | | | | | | |
| | | | | | | | |
| | | | | | | | |
| | | | | | | | |
The accompanying notes are an integral part of these consolidated financial statements |
| PDI, INC. | |
| CONSOLIDATED STATEMENTS OF OPERATIONS | |
| (in thousands, except for per share data) | |
| | | | | | | | | | |
| | | For The Years Ended December 31, | |
| | | 2008 | | | 2007 | | | 2006 | |
| | | | | | | | | | |
| Revenue, net | | $ | 112,528 | | | $ | 117,131 | | | $ | 239,242 | |
| Cost of services | | | 108,015 | | | | 85,516 | | | | 183,398 | |
| Gross profit | | | 4,513 | | | | 31,615 | | | | 55,844 | |
| | | | | | | | | | | | | |
| Operating expenses: | | | | | | | | | | | | |
| Compensation expense | | | 22,838 | | | | 24,516 | | | | 28,075 | |
| Other selling, general and administrative expenses | | | 16,532 | | | | 20,023 | | | | 22,610 | |
| Executive severance | | | 1,237 | | | | - | | | | 573 | |
| Legal and related costs, net | | | 258 | | | | 335 | | | | (3,279 | ) |
| Facilities realignment | | | 75 | | | | 1,021 | | | | 1,952 | |
| Total operating expenses | | | 40,940 | | | | 45,895 | | | | 49,931 | |
| | | | | | | | | | | | | |
| Operating (loss) income | | | (36,427 | ) | | | (14,280 | ) | | | 5,913 | |
| Interest income, net | | | 2,841 | | | | 6,073 | | | | 4,738 | |
| | | | | | | | | | | | | |
| (Loss) income before income tax | | | (33,586 | ) | | | (8,207 | ) | | | 10,651 | |
| Provision (benefit) for income tax | | | 875 | | | | 1,767 | | | | (724 | ) |
| | | | | | | | | | | | | |
| (Loss) income from continuing operations | | | (34,461 | ) | | | (9,974 | ) | | | 11,375 | |
| | | | | | | | | | | | | |
| Income from discontinued operations, | | | | | | | | | | | | |
| net of tax | | | - | | | | - | | | | 434 | |
| | | | | | | | | | | | | |
| Net (loss) income | | $ | (34,461 | ) | | $ | (9,974 | ) | | $ | 11,809 | |
| | | | | | | | | | | | | |
| (Loss) income per share of common stock: | | | | | | | | | | | | |
| Basic: | | | | | | | | | | | | |
| Continuing operations | | $ | (2.46 | ) | | $ | (0.72 | ) | | $ | 0.82 | |
| Discontinued operations | | | - | | | | - | | | | 0.03 | |
| | | $ | (2.46 | ) | | $ | (0.72 | ) | | $ | 0.85 | |
| Assuming dilution: | | | | | | | | | | | | |
| Continuing operations | | $ | (2.46 | ) | | $ | (0.72 | ) | | $ | 0.81 | |
| Discontinued operations | | | - | | | | - | | | | 0.03 | |
| | | $ | (2.46 | ) | | $ | (0.72 | ) | | $ | 0.84 | |
| | | | | | | | | | | | | |
| Weighted average number of common shares and | | | | | | | | | | | | |
| common share equivalents outstanding: | | | | | | | | | | | | |
| Basic | | | 14,012 | | | | 13,940 | | | | 13,859 | |
| Assuming dilution | | | 14,012 | | | | 13,940 | | | | 13,994 | |
| | | | | | | | | | | | | |
| | | | | | | | | | | | | |
| | | | | | | | | | | | | |
| | | | | | | | | | | | | |
| | | | | | | | | | | | | |
| | | | | | | | | | | | | |
| The accompanying notes are an integral part of these consolidated financial statements | |
| PDI, INC. | |
| CONSOLIDATED STATEMENTS OF STOCKHOLDERS' EQUITY | |
| (in thousands) | |
| | | | | | | | | | | | | | | | | | | |
| | | For The Years Ended December 31, | |
| | | 2008 | | | 2007 | | | 2006 | |
| | | Shares | | | Amount | | | Shares | | | Amount | | | Shares | | | Amount | |
| Common stock: | | | | | | | | | | | | | | | | | | |
| Balance at January 1 | | | 15,223 | | | $ | 152 | | | | 15,097 | | | $ | 151 | | | | 14,948 | | | $ | 149 | |
| Common stock issued | | | 64 | | | | 1 | | | | - | | | | - | | | | - | | | | - | |
| Restricted stock issued | | | 122 | | | | 1 | | | | 167 | | | | 1 | | | | 155 | | | | 2 | |
| Restricted stock forfeited | | | (136 | ) | | | (1 | ) | | | (41 | ) | | | - | | | | (23 | ) | | | - | |
| SARs exercised | | | - | | | | - | | | | - | | | | - | | | | 1 | | | | - | |
| Stock options exercised | | | - | | | | - | | | | - | | | | - | | | | 16 | | | | - | |
| Balance at December 31 | | | 15,273 | | | | 153 | | | | 15,223 | | | | 152 | | | | 15,097 | | | | 151 | |
| Treasury stock: | | | | | | | | | | | | | | | | | | | | | | | | |
| Balance at January 1 | | | 1,039 | | | | (13,433 | ) | | | 1,018 | | | | (13,214 | ) | | | 1,018 | | | | (13,214 | ) |
| Treasury stock purchased | | | 10 | | | | (62 | ) | | | 21 | | | | (219 | ) | | | - | | | | - | |
| Balance at December 31 | | | 1,049 | | | | (13,495 | ) | | | 1,039 | | | | (13,433 | ) | | | 1,018 | | | | (13,214 | ) |
| Additional paid-in capital: | | | | | | | | | | | | | | | | | | | | | | | | |
| Balance at January 1 | | | | | | | 120,422 | | | | | | | | 119,189 | | | | | | | | 118,325 | |
| Common stock issued | | | | | | | 299 | | | | | | | | - | | | | | | | | - | |
| Restricted stock issued | | | | | | | (1 | ) | | | | | | | (1 | ) | | | | | | | (2 | ) |
| Restricted stock forfeited | | | | | | | (7 | ) | | | | | | | (164 | ) | | | | | | | (95 | ) |
| Stock-based compensation expense | | | | 1,195 | | | | | | | | 1,640 | | | | | | | | 1,755 | |
| Stock grants exercised | | | | | | | - | | | | | | | | - | | | | | | | | 87 | |
| Excess tax (expense) benefit | | | | | | | | | | | | | | | | | | | | | | | | |
| on stock-based compensation | | | | | | | - | | | | | | | | (242 | ) | | | | | | | 23 | |
| Reclassification of unamortized compensation | | | - | | | | | | | | - | | | | | | | | (904 | ) |
| Balance at December 31 | | | | | | | 121,908 | | | | | | | | 120,422 | | | | | | | | 119,189 | |
| (Accumulated deficit)retained earnings: | | | | | | | | | | | | | | | | | | | | | |
| Balance at January 1 | | | | | | | 33,018 | | | | | | | | 42,992 | | | | | | | | 31,183 | |
| Net (loss) income | | | | | | | (34,461 | ) | | | | | | | (9,974 | ) | | | | | | | 11,809 | |
| Balance at December 31 | | | | | | | (1,443 | ) | | | | | | | 33,018 | | | | | | | | 42,992 | |
| Accumulated other | | | | | | | | | | | | | | | | | | | | | | | | |
| comprehensive (loss) income: | | | | | | | | | | | | | | | | | | | | | | | | |
| Balance at January 1 | | | | | | | 30 | | | | | | | | 79 | | | | | | | | 71 | |
| Reclassification of realized gain, net of tax | | | | (17 | ) | | | | | | | (76 | ) | | | | | | | (33 | ) |
| Unrealized holding (loss)/gain, net of tax | | | | (29 | ) | | | | | | | 27 | | | | | | | | 41 | |
| Balance at December 31 | | | | | | | (16 | ) | | | | | | | 30 | | | | | | | | 79 | |
| Unamortized compensation costs: | | | | | | | | | | | | | | | | | | | | | | | | |
| Balance at January 1 | | | | | | | - | | | | | | | | - | | | | | | | | (904 | ) |
| Reclassification to additional paid-in capital | | | | - | | | | | | | | - | | | | | | | | 904 | |
| Balance at December 31 | | | | | | | - | | | | | | | | - | | | | | | | | - | |
| Total stockholders' equity | | | | | | | 107,107 | | | | | | | | 140,189 | | | | | | | | 149,197 | |
| Comprehensive (loss) income: | | | | | | | | | | | | | | | | | | | | | | | | |
| Net (loss) income | | | | | | $ | (34,461 | ) | | | | | | $ | (9,974 | ) | | | | | | $ | 11,809 | |
| Reclassification of realized gain, net of tax | | | | (17 | ) | | | | | | | (76 | ) | | | | | | | (33 | ) |
| Unrealized holding gain, net of tax | | | | | | | (29 | ) | | | | | | | 27 | | | | | | | | 41 | |
| Total comprehensive (loss) income | | | | | | $ | (34,507 | ) | | | | | | $ | (10,023 | ) | | | | | | $ | 11,817 | |
| | | | | | | | | | | | | | | | | | | | | | | | | |
| | | | | | | | | | | | | | | | | | | | | | | | | |
| The accompanying notes are an integral part of these consolidated financial statements | |
| |
CONSOLIDATED STATEMENTS OF OPERATIONS | |
| (in thousands, except for per share data) | |
| | | | | | | | |
| | | For The Years Ended December 31, | |
| | | 2006 | | 2005 | | 2004 | |
| Revenues: | | | | | | | | | | |
| Service, net | | $ | 239,242 | | $ | 305,205 | | $ | 347,318 | |
| Product, net | | | - | | | - | | | (1,521 | ) |
| Total revenues, net | | | 239,242 | | | 305,205 | | | 345,797 | |
| Cost of goods and services: | | | | | | | | | | |
| Cost of services (including related party expense | | | | | | | | | | |
| of $180 for the period ended December 31, 2004) | | | 183,398 | | | 252,803 | | | 252,910 | |
| Cost of goods sold | | | - | | | - | | | 254 | |
| Total cost of goods and services | | | 183,398 | | | 252,803 | | | 253,164 | |
| Gross profit | | | 55,844 | | | 52,402 | | | 92,633 | |
| Operating expenses: | | | | | | | | | | |
| Compensation expense | | | 28,075 | | | 25,897 | | | 30,634 | |
| Other selling, general and administrative expenses | | | 22,610 | | | 29,392 | | | 25,027 | |
| Asset impairment | | | - | | | 6,178 | | | - | |
| Executive severance | | | 573 | | | 5,730 | | | 495 | |
| Legal and related costs, net | | | (3,279 | ) | | 1,691 | | | 2,398 | |
| Facilities realignment | | | 1,952 | | | 2,354 | | | - | |
| Total operating expenses | | | 49,931 | | | 71,242 | | | 58,554 | |
| | | | | | | | | | | |
| Operating income (loss) | | | 5,913 | | | (18,840 | ) | | 34,079 | |
| Gain (loss) on investments | | | - | | | 4,444 | | | (1,000 | ) |
| Interest income, net | | | 4,738 | | | 3,190 | | | 1,779 | |
| | | | | | | | | | | |
| Income (loss) before income tax | | | 10,651 | | | (11,206 | ) | | 34,858 | |
| (Benefit) provision for income tax | | | (724 | ) | | 201 | | | 14,423 | |
| | | | | | | | | | | |
| Income (loss) from continuing operations | | | 11,375 | | | (11,407 | ) | | 20,435 | |
| | | | | | | | | | | |
| Income (loss) from discontinued operations, | | | | | | | | | | |
| net of tax | | | 434 | | | (8,047 | ) | | 697 | |
| | | | | | | | | | | |
| Net income (loss) | | $ | 11,809 | | $ | (19,454 | ) | $ | 21,132 | |
| | | | | | | | | | | |
| Income (loss) per share of common stock: | | | | | | | | | | |
| Basic: | | | | | | | | | | |
| Continuing operations | | $ | 0.82 | | $ | (0.80 | ) | $ | 1.40 | |
| Discontinued operations | | | 0.03 | | | (0.57 | ) | | 0.05 | |
| | | $ | 0.85 | | $ | (1.37 | ) | $ | 1.45 | |
| Assuming dilution: | | | | | | | | | | |
| Continuing operations | | $ | 0.81 | | $ | (0.80 | ) | $ | 1.37 | |
| Discontinued operations | | | 0.03 | | | (0.57 | ) | | 0.05 | |
| | | $ | 0.84 | | $ | (1.37 | ) | $ | 1.42 | |
| | | | | | | | | | | |
| Weighted average number of common shares and | | | | | | | | | | |
| common share equivalents outstanding: | | | | | | | | | | |
| Basic | | | 13,859 | | | 14,232 | | | 14,564 | |
| Assuming dilution | | | 13,994 | | | 14,232 | | | 14,893 | |
| | | | | | | | | | | |
The accompanying notes are an integral part of these consolidated financial statements |
| |
| CONSOLIDATED STATEMENTS OF CASH FLOWS | |
| (in thousands) | |
| | | | | | | | | | |
| | | For The Years Ended December 31, | |
| | | 2008 | | | 2007 | | | 2006 | |
| Cash Flows From Operating Activities | | | | | | | | | |
| Net (loss) income from operations | | $ | (34,461 | ) | | $ | (9,974 | ) | | $ | 11,809 | |
| Adjustments to reconcile net income to net cash | | | | | | | | | | | | |
| provided by operating activities: | | | | | | | | | | | | |
| Depreciation, amortization and accretion | | | 4,613 | | | | 5,607 | | | | 5,764 | |
| Deferred income taxes, net | | | 331 | | | | 1,113 | | | | 2,710 | |
| (Recovery of) provision for bad debt, net | | | 31 | | | | (15 | ) | | | (728 | ) |
| (Recovery of) provision for doubtful notes, net | | | - | | | | (150 | ) | | | (250 | ) |
| Stock-based compensation | | | 1,487 | | | | 1,476 | | | | 1,660 | |
| Excess tax expense (benefit) from stock-based compensation | | | - | | | | 242 | | | | (23 | ) |
| Other (gains), losses and expenses, net | | | (15 | ) | | | 90 | | | | - | |
| Non-cash facilities realignment | | | 75 | | | | 796 | | | | 1,295 | |
| Other changes in assets and liabilities: | | | | | | | | | | | | |
| Decrease in accounts receivable | | | 6,965 | | | | 2,680 | | | | 2,460 | |
| Decrease in unbilled costs | | | 1,012 | | | | 743 | | | | 1,750 | |
| Decrease in other current assets | | | 554 | | | | 4,858 | | | | 4,593 | |
| Decrease in other long-term assets | | | 1,023 | | | | 375 | | | | 185 | |
| Decrease in accounts payable | | | (494 | ) | | | (1,123 | ) | | | (1,778 | ) |
| (Decrease) increase in unearned contract revenue | | | (4,781 | ) | | | (5,793 | ) | | | 1,654 | |
| Decrease in accrued salaries and bonus | | | (1,496 | ) | | | (3,056 | ) | | | (3,170 | ) |
| Increase in accrued contract loss | | | 10,021 | | | | - | | | | - | |
| (Decrease) increase in accrued liabilities | | | (829 | ) | | | (5,224 | ) | | | (8,489 | ) |
| (Decrease) increase in long-term liabilities | | | (27 | ) | | | 1,179 | | | | 243 | |
| Net cash (used in) provided by operating activities | | | (15,991 | ) | | | (6,176 | ) | | | 19,685 | |
| Cash Flows From Investing Activities | | | | | | | | | | | | |
| Purchase of available-for-sale investments | | | - | | | | (11,700 | ) | | | (32,585 | ) |
| Proceeds from sales of available-for-sale investments | | | - | | | | 44,285 | | | | - | |
| Purchase of held-to-maturity investments | | | (15,050 | ) | | | (24,290 | ) | | | (61,216 | ) |
| Proceeds from maturities of held-to-maturity investments | | | 22,391 | | | | 53,165 | | | | 29,920 | |
| Repayments from Xylos | | | - | | | | 150 | | | | 250 | |
| Purchase of property and equipment | | | (399 | ) | | | (1,009 | ) | | | (1,770 | ) |
| Net cash provided by (used in) investing activities | | | 6,942 | | | | 60,601 | | | | (65,401 | ) |
| Cash Flows From Financing Activities | | | | | | | | | | | | |
| Excess tax (expense) benefit from stock-based compensation | | | | | | | (242 | ) | | | 23 | |
| Proceeds from exercise of stock options | | | - | | | | - | | | | 87 | |
| Cash paid for repurchase of restricted shares | | | (62 | ) | | | (219 | ) | | | - | |
| Net cash (used in) provided by financing activities | | | (62 | ) | | | (461 | ) | | | 110 | |
| | | | | | | | | | | | | |
| Net (decrease) increase in cash and cash equivalents | | | (9,111 | ) | | | 53,964 | | | | (45,606 | ) |
| Cash and cash equivalents – beginning | | | 99,185 | | | | 45,221 | | | | 90,827 | |
| Cash and cash equivalents – ending | | $ | 90,074 | | | $ | 99,185 | | | $ | 45,221 | |
| | | | | | | | | | | | | |
| Cash paid for interest | | $ | - | | | $ | 1 | | | $ | 2 | |
| Cash paid for taxes | | $ | 211 | | | $ | 123 | | | $ | 640 | |
| | | | | | | | | | | | | |
| | | | | | | | | | | | | |
| | | | | | | | | | | | | |
| The accompanying notes are an integral part of these consolidated financial statements | |
PDI, INC. | |
CONSOLIDATED STATEMENTS OF STOCKHOLDERS' EQUITY | |
| (in thousands) | |
| | | | | | | | | | | | | | |
| | | For The Years Ended December 31, | |
| | | 2006 | | 2005 | | 2004 | |
| | | Shares | | Amount | | Shares | | Amount | | Shares | | Amount | |
Common stock: | | | | | | | | | | | | | | | | | | | |
| Balance at January 1 | | | 14,948 | | $ | 149 | | | 14,820 | | $ | 148 | | | 14,523 | | $ | 145 | |
| Common stock issued | | | - | | | - | | | 68 | | | 1 | | | 68 | | | 1 | |
| Restricted stock issued | | | 155 | | | 2 | | | 43 | | | - | | | 98 | | | 1 | |
| Restricted stock forfeited | | | (23 | ) | | - | | | (24 | ) | | - | | | (14 | ) | | - | |
| SARs exercised | | | 1 | | | - | | | - | | | - | | | - | | | - | |
| Stock options exercised | | | 16 | | | - | | | 41 | | | - | | | 145 | | | 1 | |
| Balance at December 31 | | | 15,097 | | | 151 | | | 14,948 | | | 149 | | | 14,820 | | | 148 | |
Treasury stock: | | | | | | | | | | | | | | | | | | | |
| Balance at January 1 | | | 1,018 | | | (13,214 | ) | | 5 | | | (110 | ) | | 5 | | | (110 | ) |
| Treasury stock purchased | | | - | | | - | | | 1,013 | | | (13,104 | ) | | - | | | - | |
| Balance at December 31 | | | 1,018 | | | (13,214 | ) | | 1,018 | | | (13,214 | ) | | 5 | | | (110 | ) |
Additional paid-in capital: | | | | | | | | | | | | | | | | | | | |
| Balance at January 1 | | | | | | 118,325 | | | | | | 116,737 | | | | | | 109,531 | |
| Common stock issued | | | | | | - | | | | | | 699 | | | | | | 1,511 | |
| Restricted stock issued | | | | | | (2 | ) | | | | | 533 | | | | | | 2,626 | |
| Restricted stock forfeited | | | | | | (95 | ) | | | | | (494 | ) | | | | | (174 | ) |
| Stock-based compensation expense | | | | | | 1,755 | | | | | | 259 | | | | | | - | |
| Stock grants exercised | | | | | | 87 | | | | | | 591 | | | | | | 2,369 | |
| Tax benefit on stock-based compensation | | 23 | | | | | | - | | | | | | 641 | |
| Acceleration of stock option vesting | | | | | | - | | | | | | - | | | | | | 233 | |
| Reclassification of unamortized compensation | | (904 | ) | | | | | - | | | | | | - | |
| Balance at December 31 | | | | | | 119,189 | | | | | | 118,325 | | | | | | 116,737 | |
Retained earnings: | | | | | | | | | | | | | | | | | | | |
| Balance at January 1 | | | | | | 31,183 | | | | | | 50,637 | | | | | | 29,505 | |
| Net income (loss) | | | | | | 11,809 | | | | | | (19,454 | ) | | | | | 21,132 | |
| Balance at December 31 | | | | | | 42,992 | | | | | | 31,183 | | | | | | 50,637 | |
Accumulated other | | | | | | | | | | | | | | | | | | | |
comprehensive income (loss): | | | | | | | | | | | | | | | | | | | |
| Balance at January 1 | | | | | | 71 | | | | | | 76 | | | | | | 25 | |
| Reclassification of realized (gain) loss, net of tax | | (33 | ) | | | | | (49 | ) | | | | | 21 | |
| Unrealized holding gain, net of tax | | | | | | 41 | | | | | | 44 | | | | | | 30 | |
| Balance at December 31 | | | | | | 79 | | | | | | 71 | | | | | | 76 | |
Unamortized compensation costs: | | | | | | | | | | | | | | | | | | | |
| Balance at January 1 | | | | | | (904 | ) | | | | | (2,063 | ) | | | | | (608 | ) |
| Restricted stock issued | | | | | | - | | | | | | (533 | ) | | | | | (2,627 | ) |
| Restricted stock forfeited | | | | | | - | | | | | | 494 | | | | | | 137 | |
| Restricted stock vested | | | | | | - | | | | | | 1,198 | | | | | | 1,035 | |
| Reclassification to additional paid-in capital | | 904 | | | | | | - | | | | | | - | |
| Balance at December 31 | | | | | | - | | | | | | (904 | ) | | | | | (2,063 | ) |
Total stockholders' equity | | | | | | 149,197 | | | | | | 135,610 | | | | | | 165,425 | |
Comprehensive income (loss): | | | | | | | | | | | | | | | | | | | |
| Net income (loss) | | | | | $ | 11,809 | | | | | $ | (19,454 | ) | | | | $ | 21,132 | |
| Reclassification of realized (gain) loss, net of tax | | (33 | ) | | | | | (49 | ) | | | | | 21 | |
| Unrealized holding gain, net of tax | | | | | | 41 | | | | | | 44 | | | | | | 30 | |
| Total comprehensive income (loss) | | | | | $ | 11,817 | | | | | $ | (19,459 | ) | | | | $ | 21,183 | |
| | | | | | | | | | | | | | | | | | | | |
The accompanying notes are an integral part of these consolidated financial statements |
PDI, INC. | |
CONSOLIDATED STATEMENTS OF CASH FLOWS | |
| (in thousands) | |
| | | | | | | | |
| | | For The Years Ended December 31, | |
| | | 2006 | | 2005 | | 2004 | |
Cash Flows From Operating Activities | | | | | | | | | | |
| Net income (loss) from operations | | $ | 11,809 | | $ | (19,454 | ) | $ | 21,132 | |
| Adjustments to reconcile net income to net cash | | | | | | | | | | |
| provided by operating activities: | | | | | | | | | | |
| Depreciation, amortization and accretion | | | 5,764 | | | 5,820 | | | 5,916 | |
| Deferred income taxes, net | | | 2,710 | | | 6,447 | | | 9,199 | |
| (Recovery of) provision for bad debt, net | | | (728 | ) | | 730 | | | 683 | |
| (Recovery of) provision for doubtful notes, net | | | (250 | ) | | 655 | | | - | |
| Stock-based compensation | | | 1,660 | | | 1,457 | | | 1,232 | |
| Tax benefit from stock-based compensation | | | (23 | ) | | - | | | - | |
| Loss on disposal of assets | | | - | | | 269 | | | 622 | |
| Asset impairment | | | - | | | 14,351 | | | - | |
| Non-cash facilities realignment | | | 1,295 | | | - | | | - | |
| (Gain) loss on investment | | | - | | | (4,444 | ) | | 1,000 | |
| Other changes in assets and liabilities: | | | | | | | | | | |
| Decrease (increase) in accounts receivable | | | 2,460 | | | (1,229 | ) | | 15,807 | |
| Decrease (increase) in unbilled costs | | | 1,750 | | | (2,581 | ) | | 648 | |
| Decrease (increase) in income tax receivable | | | 4,257 | | | (6,145 | ) | | - | |
| Decrease in inventory | | | - | | | - | | | 43 | |
| Decrease (increase) in other current assets | | | 336 | | | 448 | | | (33 | ) |
| Decrease (increase) in other long-term assets | | | 185 | | | 218 | | | (28 | ) |
| Decrease in accounts payable | | | (1,778 | ) | | (41 | ) | | (3,439 | ) |
| Decrease in accrued income taxes | | | (2,286 | ) | | (1,216 | ) | | (3,529 | ) |
| Increase in unearned contract revenue | | | 1,654 | | | 5,674 | | | 507 | |
| Decrease in accrued incentives | | | (3,170 | ) | | (4,254 | ) | | (4,204 | ) |
| Decrease in accrued payroll and related benefits | | | (2,234 | ) | | (858 | ) | | (617 | ) |
| (Decrease) increase in accrued liabilities | | | (3,969 | ) | | 2,727 | | | (17,250 | ) |
| Increase in long-term liabilities | | | 243 | | | 4,541 | | | 1,293 | |
| Net cash provided by operating activities | | | 19,685 | | | 3,115 | | | 28,982 | |
Cash Flows From Investing Activities | | | | | | | | | | |
| (Purchases) sales of short-term investments, net | | | (63,881 | ) | | 21,686 | | | (27,103 | ) |
| Repayments from (investments in) Xylos | | | 250 | | | 100 | | | (1,500 | ) |
| Purchase of property and equipment | | | (1,770 | ) | | (5,832 | ) | | (8,104 | ) |
| Cash paid for acquisition, including acquisition costs | | | - | | | (1,936 | ) | | (28,443 | ) |
| Proceeds from sale of assets and investments | | | - | | | 4,507 | | | - | |
| Net cash (used in) provided by investing activities | | | (65,401 | ) | | 18,525 | | | (65,150 | ) |
Cash Flows From Financing Activities | | | | | | | | | | |
| Net proceeds from exercise of stock options | | | 110 | | | 1,291 | | | 3,880 | |
| Cash paid for repurchase of shares | | | - | | | (13,104 | ) | | - | |
| Net cash provided by (used in) financing activities | | | 110 | | | (11,813 | ) | | 3,880 | |
| | | | | | | | | | | |
| Net (decrease) increase in cash and cash equivalents | | | (45,606 | ) | | 9,827 | | | (32,288 | ) |
| Cash and cash equivalents - beginning | | | 90,827 | | | 81,000 | | | 113,288 | |
| Cash and cash equivalents - ending | | $ | 45,221 | | $ | 90,827 | | $ | 81,000 | |
| | | | | | | | | | | |
| Cash paid for interest | | $ | 2 | | $ | 2 | | $ | 3 | |
| Cash paid for taxes | | $ | 640 | | $ | 1,513 | | $ | 7,389 | |
| | | | | | | | | | | |
The accompanying notes are an integral part of these consolidated financial statements |
PDI, Inc.
Notes to the Consolidated Financial Statements
(tabular information in thousands, except share and per share data)
1. | Nature of Business and Significant Accounting Policies |
Nature of Business
PDI, Inc. together with its wholly-owned subsidiaries (PDI or the Company) is a diversified sales and marketing services company serving the biopharmaceutical and life sciences industries. See Note 21,20, Segment Information, for additional information.
Principles of Consolidation
The accompanying consolidated financial statements have been prepared in accordance with U.S. generally accepted accounting principles (GAAP). The consolidated financial statements include accounts of PDI and its wholly owned subsidiaries TVG,(TVG, Inc., ProtoCall, Inc., InServe Support Solutions, (InServe), and PDI Investment Company, Inc.) All significant intercompany balances and transactions have been eliminated in consolidation. In the second quarter of 2006, the Company discontinued its Medical Device and Diagnostic (MD&D) business. The MD&D business was part of the Company's sales services reporting segment. The MD&D business is accounted for as a discontinued operation under GAAP and, therefore, the MD&D business results of operations have been removed from the Company's results of continuing operations for all periods presented.2006. See Note 20,19, Discontinued Operations.
Accounting Estimates
The preparation of consolidated financial statements in conformity with GAAP requires management to make estimates and assumptions that affect the amounts of assets and liabilities reported and disclosure of contingent assets and liabilities at the date of the financial statements and the reported amounts of revenues and expenses during the reporting period. Actual results could differ from those estimates.Management's estimates are based on historical experience, facts and circumstances available at the time, and various other assumptions that are believed to be reasonable under the circumstances. Significant estimates include incentives earned or penalties incurred on contracts, loss contract provisions, valuation allowances related to deferred income taxes, self-insurance loss accruals, allowances for doubtful accounts and notes, fair value of assets, income tax accruals and facilities realignment accrualsaccruals. The Company periodically reviews these matters and sales returns.reflects changes in estimates as appropriate. Actual results could materially differ from those estimates.
Cash and Cash Equivalents
Cash and cash equivalents consist ofinclude unrestricted cash accounts, money market investments and highly liquid investment instruments and certificates of deposit with an original maturity of three months or less at the date of purchase.
Investments in Marketable Securities
The Company classifies its investments in marketableAvailable-for-sale securities as “available-for-sale” or “held-to-maturity” in accordance with Statement of Financial Accounting Standards (SFAS) No. 115, “Accounting for Certain Investments in Debt and Equity Securities.” The Company does not have any investments classified as “trading.” Available-for-sale investments are carried at fair market value based on quoted market values with the unrealized holding gain and loss,gains or losses, net of taxes, reportedtax, included as a component of accumulated other comprehensive income until realized.(loss) in stockholders’ equity. Realized gains and losses and declines in value judged to be other-than-temporary on available-for-sale securities are included in other income (expense), net. The Company’s other short-term investments consist of a laddered portfolio of investment grade debt instruments such as obligations of the U.S. Treasury and U.S. Federal Government agencies, municipal bonds and commercial paper. These investmentsfair values for marketable equity securities are classified as held-to-maturity because the Company has the intent and ability to hold these securities to maturity.based on quoted market prices. Held-to-maturity investments are stated at amortized cost. Interest income is accrued as earned. Realized gains and losses are computed based upon specific identification and included in interest income, net in the consolidated statement of operations. The Company does not have any investments classified as “trading.”
Receivables and Allowance for Doubtful Accounts
Trade accounts receivable are recorded at the invoiced amount and do not bear interest. Management reviews a customer’s credit history before extending credit. The Company has recorded a provision for estimated losses resulting from the inability of its customers to make required payments based on historical experience and periodically adjusts these provisions to reflect actual experience. Additionally, the Company will establish a specific allowance for doubtful accounts when the Company becomes aware of a specific customer’s inability or unwillingness to meet its financial obligations (e.g., bankruptcy filing). Allowance for doubtful accounts was $0 as of December 31, 2008 and 2007, respectively. The Company operates almost exclusively in the pharmaceutical industry and to a great extent its revenue is dependent on a limited number of large pharmaceutical companies. The Company also partners with customers in the emerging pharmaceutical sector, some of whom may have limited financial resources. A general downturn in the pharmaceutical industry or adverse material event to one or more of the Company’s emerging pharmaceutical customers could result in higher than expected customer defaults and additional allowances may be required. Allowance for doubtful accounts was approximately $36,000 and $778,000 as of December 31, 2006 and 2005, respectively.
PDI, Inc.
Notes to the Consolidated Financial Statements (Continued)
(tabular information in thousands, except share and per share data)
Unbilled Costs and Accrued Profits and Unearned Contract Revenue
In general, contractual provisions, including predetermined payment schedules or submission of appropriate billing detail, establish the prerequisites for billings. Unbilled costs and accrued profits arise when services have been rendered and payment is assured but customers have not been billed. These amounts are classified as a current asset. Normally, in the case of detailing contracts, the customers agree to pay the Company a portion of the fee due under a contract in advance of performance of services because of large recruiting and employee development costs associated with the beginning of a contract. The excess of amounts billed over revenue recognized represents unearned contract revenue, which is classified as a current liability.
Loans and Investments in Privately Held Entities
From time to time, the Company makes investments in and/or loans to privately-held companies. The Company considersdetermines whether the fair values of any investments in privately held entities have declined below their carrying value whenever adverse events or changes in circumstances indicate that recorded values may not be recoverable. If the Company considers any such decline to be other than temporary (based on various factors, including historical financial results, and the overall health of the investee’s industry), a write-down is recorded to estimated fair value. For the year ended December 31, 2004, the Company recorded a loss on investments of $1.0 million to write-down investments to their fair value. Additionally, onOn a quarterly basis, the Company reviews outstanding loans receivable to determine if a provision for doubtful accountsnotes is necessary. These reviews include discussions with senior management of the investee, and evaluations of, among other things, the investee’s progress against its business plan, its product development activities and customer base, industry market conditions, historical and projected financial performance, expected cash needs and recent funding events. The Company records interest income on the impaired loans; however, that amount is fully reserved for if the investee is not making theirits interest payments. Subsequent cash receipts on the outstanding interest would be applied against the outstanding interest receivable balance and the corresponding allowance. The Company’s assessments of value are highly subjective given that these companies may be at an early stage of development and rely regularly on their investors for cash infusions. At December 31, 20062008 and 2005,2007, the allowance for doubtful notes was approximately $700,000 and $1.2 million, respectively.$500,000. See Note 6,5, Loans and Investments in Privately-Held Entities, for additional information.
Property and Equipment
Property and equipment are stated at cost less accumulated depreciation. Depreciation is computed using the straight-line method, based on estimated useful lives of seven to ten years for furniture and fixtures, three to five years for office and computer equipment and ten years for phone systems, and three to seven years for computer software.systems. Leasehold improvements are amortized over the shorter of the estimated service lives or the terms of the related leases. Repairs and maintenance are charged to expense as incurred. Upon disposition, the asset and related accumulated depreciation are removed from the related accounts and any gains or losses are reflected in operations. As the prices of computer desktops and laptops continue to decline, more of these computer purchases are falling short of the Company’s minimum price threshold for capitalization and are being expensed. The Company expects that trend to continue.
Software Costs
It is the Company’s policy to capitalize certain costs incurred in connection with developing or obtaining internal-use software. Capitalized software costs are included in property and equipment on the consolidated balance sheet and amortized over the software's useful life.life, generally three to seven years. Software costs that do not meet capitalization criteria are expensed immediately.
Concentration of Credit Risk
Financial instruments that potentially subject the Company to a significant concentration of credit risk consist primarily of cash and cash equivalents and investments in marketable securities. The Company maintains deposits in federally insured financial institutions. The Company also holds investments in Treasury money market funds that maintain an average portfolio maturity under 90 days and, under the temporary guarantee program for money market funds, are insured by the United States Treasury. Deposits held with financial institutions may exceed the amount of insurance provided on such deposits; however, management believes the Company is not exposed to significant credit risk due to the financial position of the financial institutions in which those deposits are held and the nature of the investments.
PDI, Inc.
Notes to the Consolidated Financial Statements (Continued)
(tabular information in thousands, except share and per share data)
Fair Value of Financial Instruments
The Company considers carrying amounts of cash, accounts receivable, accounts payable and accrued expenses to approximate fair value due to the short-term nature of these financial instruments. Marketable securities classified as “available for sale” are carried at fair value. Marketable securities classified as “held-to-maturity” are carried at amortized cost, which approximates fair value. The fair value of letters of credit is determined to be zero$0 as management does not expect any material losses to result from these instruments because performance is not expected to be required.
PDI, Inc.
Notes to the Consolidated Financial Statements (Continued)
(tabular information in thousands, except share and per share data)
Goodwill and Other Intangible Assets
The Company accounts for purchasesallocates the cost of acquired companies in accordance with SFAS No. 141, "Business Combinations" (FAS 141)to the identifiable tangible and accounts for the related goodwill and other identifiable definite and indefinite-lived acquired intangible assets in accordanceand liabilities acquired, with SFAS No. 142, “Goodwillthe remaining amount being classified as goodwill. Since the entities the Company has acquired do not have significant tangible assets, a significant portion of the purchase price has been allocated to intangible assets and Other Intangible Assets” (FAS 142).goodwill. The identification and valuation of these intangible assets and the determination of the estimated useful lives at the time of acquisition, as well as the completion of annual impairment tests require significant management judgments and estimates. These estimates are made based on, among other factors, consultations with an accredited independent valuation consultant, reviews of projected future operating results and business plans, economic projections, anticipated future cash flows and statutory regulations. In accordance with FAS 141, the Company allocates the cost of the acquired companies to the identifiable tangible and intangible assets and liabilities acquired, with the remaining amount being classified as goodwill. Since the entities the Company has acquired do not have significant tangible assets, a significant portion of the purchase price has been allocated to intangible assets and goodwill.capital. The use of alternative estimates and assumptions could increase or decrease the estimated fair value of goodwill and other intangible assets, and potentially result in a different impact to the Company’s results of operations. Further, changes in business strategy and/or market conditions may significantly impact these judgments thereby impacting the fair value of these assets, which could result in an impairment of the goodwill and acquired intangible assets.
The Company has elected to dotests goodwill for impairment at least annually and whenever events or circumstances change that indicate impairment may have occurred. These events or circumstances could include a significant long-term adverse change in the annual tests for indicationsbusiness climate, poor indicators of goodwill impairment asoperating performance or a sale or disposition of December 31a significant portion of each year.a reporting unit. The Company utilizestests goodwill for impairment at the reporting unit level, which is one level below its operating segments. Goodwill has been assigned to the reporting units to which the value of the goodwill relates. The Company currently has six reporting units; however, only one reporting unit, Pharmakon, includes goodwill. Goodwill is tested by estimating the fair value of the reporting unit using a discounted cash flow modelsmodel. The estimated fair value of the reporting unit is then compared with the carrying value including goodwill, to determine fair value in the goodwillif any impairment evaluation.exists. In assessing the recoverability of goodwill, projections regarding estimated future cash flows and other factors are made to determine thatthe fair value of the respective reporting units. The key estimates and factors used in the discounted cash flow valuation include revenue growth rates and profit margins based on internal forecasts, terminal value and the weighted-average cost of capital used to discount future cash flows. While the Company uses available information to prepare estimates and to perform impairment evaluations, actual results could differ significantly from these estimates or related projections, resulting in impairment related to recorded goodwill balances.
The 2006 evaluationtesting performed as of December 31, 2008 and 2007, indicated that there was no impairmentan excess of goodwill. The 2005 evaluation indicated thatestimated fair value over book value for Pharmakon. This unit had goodwill recorded in the MD&D and Select Access reporting units was impaired and accordingly, the Company recognized non-cash charges of approximately $7.8$13.6 million, carrying value of $25.4 million and $3.3 million, respectively,estimated fair value of $27.2 million. If the Company’s projected long-term sales growth rate, profit margins, or terminal rate are considerably lower, and/or the assumed weighted average cost of capital is considerably higher, future testing may indicate impairment in 2005.this reporting unit and, as a result, the related goodwill may also be impaired. See Note 5,4, Goodwill and Other Intangible Assets, for additional information.
Long-Lived Assets
In accordance with SFAS No. 144, “Accounting for the Impairment or Disposal of Long-Lived Assets,” (FAS 144)theThe Company reviews the recoverability of long-lived assets and finite-lived intangible assets whenever events or changes in circumstances indicate that the carrying value of such assets may not be recoverable. If the sum of the expected future undiscounted cash flows is less than the carrying amount of the asset, an impairment loss is recognized by reducing the recorded value of the asset to its fair value measured by future discounted cash flows. This analysis requires estimates of the amount and timing of projected cash flows and, where applicable, judgments associated with, among other factors, the appropriate discount rate. Such estimates are critical in determining whether any impairment charge should be recorded and the amount of such charge if an impairment loss is deemed to be necessary. In addition, future events impacting cash flows for existing assets could render a write-down or write-off necessary that previously required no such write-down or write-off.
PDI, Inc.
Notes to the Consolidated Financial Statements (Continued)
(tabular information in thousands, except share and per share data)
In 2007 the Company recorded a non-cash charge of approximately $1.1 million related to computer equipment, furniture and leasehold improvements primarily due to the outsourcing of the Company’s computer data center space at its Saddle River, New Jersey location. In December 2007, the Company relocated its data center to a secured, hosted facility. See Note 16, Facilities Realignment, for additional information. Additionally, in 2007, the Company recorded a non-cash charge of approximately $42,000 related to the impairment of certain capitalized software development costs associated with one of its web portals. In 2006, the Company recorded a non-cash charge of approximately $1.3 million for furniture and leasehold improvements related to the excess leased space at its Saddle River, New Jersey and Dresher, Pennsylvania locations. See Note 17,16, Facilities Realignment, for additional information. In 2005,
Self-Insurance Accruals
Prior to October 1, 2008, the Company recorded a non-cash charge of approximately $2.8 million related to the impairment of its Siebel sales force automation software and a non-cash charge of approximately $349,000 related to the impairment of the InServe intangible assets. See Note 4, Property and Equipment, and Note 5, Goodwill and Other Intangible Assets, respectively, for additional information.
Self-Insurance Accruals
The Company iswas self-insured for certain losses for claims filed and claims incurred but not reported relating to workers’ compensation and automobile-related liabilities for Company-leased cars. Beginning October 1, 2008, the Company is fully-insured through an outside carrier for these losses. The Company’s liability for claims filed and claims incurred but not reported prior to October 1, 2008 is estimated on an actuarial undiscounted basis supplied by its insurance brokers and insurers using individual case-based valuations and statistical analysis and is based upon judgment and historical experience, however, the final cost of many of these claims may not be known for five years or longer. The Company also is self-insured for benefits paid under employee healthcare programs. The Company’s liability for healthcare claims is estimated using an underwriting determination which is based on current year’s average lag days between when a claim is incurred to when it is paid. The Company maintains stop-loss coverage with third-party insurers to limit its total exposure on all of these programs. Periodically, the Company evaluates the level of insurance coverage and adjusts insurance levels based on risk tolerance and premium expense. Management reviews theseits self-insurance accruals on a quarterly basis. At December 31, 20062008 and 2005,2007, self-insurance accruals totaled $2.5$1.9 million and $3.8$2.9 million, respectively, and are included in other accrued expenses on the balance sheet.
PDI, Inc.
Notes to the Consolidated Financial Statements (Continued)
(tabular information in thousands, except share and per share data)
Accrued Sales ReturnsContingencies
For product sales, provision is made atIn the timenormal course of sale for all discounts and estimated sales allowances. Upon approval frombusiness, the Company customers who purchasedis subject to various contingencies. Contingencies are recorded in the Company’s Ceftin product were permitted to return unused product up to six months before,consolidated financial statements when it is probable that a liability will be incurred and one year after the expiration dateamount of the loss can be reasonably estimated, or otherwise disclosed. The Company is currently involved in certain legal proceedings and, as required, the Company has accrued its estimate of the probable costs for the product, but no later than December 31, 2004, as discussedresolution of these claims. These estimates are developed in Note 15, Performance Based Contracts. There wasconsultation with outside counsel and are based upon an analysis of potential results, assuming a $1.7 million adjustment for changes in estimatescombination of litigation and settlement strategies. Predicting the outcome of claims and litigation, and estimating related costs and exposures, involves substantial uncertainties that could cause actual costs to the Ceftin returns reserve in 2004. There were no adjustments in 2006 and 2005. These adjustments were recorded as a reduction to revenue consistent with the initial recognition of the returns allowance and resulted in the Company reporting net negative product revenue in 2004.vary materially from estimates.
Treasury Stock
Treasury stock purchases are accounted for under the cost method whereby the entire cost of the acquired stock is recorded as treasury stock. Upon reissuance of shares of treasury stock, the Company records any difference between the weighted-average cost of such shares and any proceeds received as an adjustment to additional paid-in capital.
Revenue Recognition and Associated Costs
Revenue and associated costs under pharmaceutical detailing contracts are generally based on the number of physician details made or the number of sales representatives utilized. With respect to risk-based contracts, all or a portion of revenues earned are based on contractually defined percentages of either product revenues or the market value of prescriptions written and filled in a given period. These contracts are generally for terms of one to two years and may be renewed or extended. The majority of these contracts, however, are terminable by the customer for any reason upon 30 to 90 days’ notice. Certain contracts provide for termination payments if the customer terminates the agreement without cause. Typically, however, these penalties do not offset the revenue the Company could have earned under the contract or the costs the Company may incur as a result of its termination.
The loss or termination of a large pharmaceutical detailing contract or the loss of multiple contracts could have a material adverse effect on the Company’s business, financial condition or results of operations. Historically, the Company has derived a significant portion of its service revenue from a limited number of customers. Concentration of business in the pharmaceutical services industry is common and the industry continues to consolidate. As a result, the Company is likely to continue to experience significant customer concentration in future periods. For the years ended December 31, 2008 and 2007, the Company’s three largest customers, who each individually represented 10% or more of its service revenue, together accounted for approximately 52.5% and 37.9% of its service revenue, respectively. For the year ended December 31, 2006 the Company’s two largest customers, who each individually represented 10% or more of its service revenue, together accounted for approximately 46.8% of its service revenue. See Note 14, Significant Customers.
PDI, Inc.
Notes to the Consolidated Financial Statements (Continued)
(tabular information in thousands, except share and per share data)
Revenue and associated costs under marketing service contracts are generally based on a single deliverable such as a promotional program, accredited continuing medical education seminar or marketing research/advisory program. The contracts are generally terminable by the customer for any reason. Upon termination, the customer is generally responsible for payment for all work completed to date, plus the cost of any nonrefundable commitments made on behalf of the customer. There is significant customer concentration in the Company’s Pharmakon business, and the loss or termination of one or more of Pharmakon’s large master service agreements could have a material adverse effect on the Company’s business, financial condition or results of operations. Due to the typical size of most contracts of TVG Marketing Research and Consulting (TVG) and Vital Issues in Medicine (VIM)®, it is unlikely the loss or termination of any individual TVG or VIM contract would have a material adverse effect on the Company’s business, financial condition or results of operations.
Service revenue is recognized on product detailing programs and certain marketing, promotional and medical education contracts as services are performed and the right to receive payment for the services is assured. Many of the product detailing contracts allow for additional periodic incentive fees to be earned if certain performance benchmarks have been attained. Revenue earned from incentive fees is recognized in the period earned and when the Company is reasonably assured that payment will be made. Under performance based contracts, revenue is recognized when the performance based parameters are achieved. Many contracts also stipulate penalties if agreed upon performance benchmarks have not been met. Revenue is recognized net of any potential penalties until the performance criteria relating to the penalties have been achieved. Commissions based revenue is recognized when performance is completed. Revenue from recruiting and hiring contracts is recognized at the time the candidate begins full-time employment less a provision for sales allowances based on contractual commitments and historical experience. Revenue and associated costs from marketing research contracts are recognized upon completion of the contract. These contracts are generally short-term in nature typically lasting two to six months.
Historically,Under its promotional program included in the product commercialization segment, the Company has derivedrecognizes revenue quarterly based on a significant portion of its service revenue fromspecified formula set forth in our product commercialization agreement with Novartis related to product sales for the quarter. The Company will not receive any compensation during any quarter in which product sales are below certain thresholds established for that quarter as set forth in the agreement. Revenues recognized (if any) under this agreement will be directly impacted by prescription data provided by a limitedthird party vendor and other information provided by Novartis. Additionally, the Company must perform a minimum number of customers. Concentration of business in the pharmaceutical services industry is commonsales calls to designated physicians each year, and the industry continuesfailure to consolidate. As asatisfy this requirement could result in penalties being imposed on PDI or provide the Company is likelycustomer with the ability to continue to experience significant customer concentration in future periods. Forterminate the years ended December 31, 2006 and 2004, the Company’s two largest customers, who each individually represented 10% or more of its service revenue, together accounted for approximately 46.8% and 66.4%, respectively, of its service revenue. For 2005, the Company’s three largest customers, who each individually represented 10% or more of its service revenue, together accounted for approximately 73.6% of its service revenue.agreement.
PDI, Inc.
Notes to the Consolidated Financial Statements (Continued)
(tabular information in thousands, except share and per share data)
Cost of services consist primarily of the costs associated with executing product detailing programs, performance based contracts or other sales and marketing services identified in the contract. Cost of services include personnel costs and other costs associated with executing a product detailing or other marketing or promotional program, as well as the initial direct costs associated with staffing a product detailing program. Such costs include, but are not limited to, facility rental fees, honoraria and travel expenses, sample expenses and other promotional expenses.
Personnel costs, which constitute the largest portion of cost of services, include all labor related costs, such as salaries, bonuses, fringe benefits and payroll taxes for the sales representatives, and sales managers and professional staff that are directly responsible for executing a particular program. Initial direct program costs are those costs associated with initiating a product detailing program, such as recruiting, hiring, and training the sales representatives who staff a particular product detailing program. All personnel costs and initial direct program costs, other than training costs, are expensed as incurred for service offerings.
Reimbursable out-of-pocket expenses include those relating to travel and other similar costs, for which the Company is reimbursed at cost by its customers. In accordance with the requirements of Emerging Issues Task Force No. 01-14, “Income Statement Characterization of Reimbursements Received for Out-of-Pocket Expenses Incurred” (EITF 01-14), reimbursements received for out-of-pocket expenses incurred are characterized as revenue and an identical amount is included as cost of goods and services in the consolidated statements of operations. For the years ended December 31, 2006, 20052008, 2007 and 2004,2006, reimbursable out-of-pocket expenses were $12.6 million, $14.3 million and $25.3 million, $35.2 millionrespectively.
PDI, Inc.
Notes to the Consolidated Financial Statements (Continued)
(tabular information in thousands, except share and $22.8 million, respectively.per share data)
Training costs include the costs of training the sales representatives and managers on a particular product detailing program so that they are qualified to properly perform the services specified in the related contract. For allthe majority of the Company’s contracts, training costs are reimbursable out-of-pocket expenses. For contracts where the Company is responsible for training costs, these costs are deferred and amortized on a straight-line basis over the shorter of the life of the contract to which they relate or 12 months. When
Contract Loss Provisions
Provisions for losses to be incurred on contracts are recognized in full in the period in which it is determined that a loss will result from performance of the contractual arrangement. Performance based contracts have the potential for higher returns but also an increased risk of contract loss as compared to the traditional fee for service contracts. The Company recognized a contract loss related to its existing product commercialization agreement in 2008. See Note 10 for more details.
Treasury Stock
Treasury stock purchases are accounted for under the cost method whereby the entire cost of the acquired stock is recorded as treasury stock. Upon reissuance of shares, the Company receives a specific contract payment from a customer upon commencementrecords any difference between the weighted-average cost of a product detailing program expresslysuch shares and any proceeds received as an adjustment to compensate the Company for recruiting, hiring and training services associated with staffing that program, such payment is deferred and recognized as revenue in the same period that the recruiting and hiring expenses are incurred and amortization of the deferred training is expensed. When the Company does not receive a specific contract payment for training, all revenue is deferred and recognized over the life of the contract.additional paid-in capital.
Product revenue is recognized when products are shipped and title is transferred to the customer. Product revenue for the year ended December 31, 2004 was negative, primarily from the adjustments to the Ceftin sales returns reserve, as discussed previously in Note 1, Nature of Business and Significant Accounting Policies, net of the sale of the Xylos wound care products.
Cost of goods sold includes all expenses for product distribution costs, acquisition and manufacturing costs of the product sold.Stock-Based Compensation
Stock-Based Compensation
On January 1, 2006, the Company adopted SFASStatement of Financial Accounting Standards (SFAS) No. 123, “(Revised(Revised 2004): “Share-Based Payment” (FAS 123R), which replaces SFAS No. 123, “Accounting for Stock-Based Compensation” (FAS 123) and supersedes Accounting Principles Board Opinion No. 25, “Accounting for Stock Issued to Employees” (APB 25). FAS 123R requires all share-based payments to employees, including grants of employee stock options, to be recognized as compensation expense over the service period (generally the vesting period) in the consolidated financial statements based on their fair values. The Company elected to useusing the modified prospective transition method and as a result prior period results were not restated.approach. Under the modified prospective transition method, awards that wereapproach, the amount of compensation cost recognized includes: (i) compensation cost for all share-based payments granted or modified on or afterbefore but not yet vested as of January 1, 2006, are measured and accounted for in accordance with FAS 123R. The unearned compensation costs related to unvested stock options and restricted stock awards that were granted prior to January 1, 2006 will be recognized usingbased on the grant date fair value determined under FAS 123. The Company has adoptedestimated in accordance with the useprovisions of the straight-line attribution method over the requisite service periodSFAS No. 123, “Accounting for the entire award. The Company had no cumulative effect adjustment upon adoption of FAS 123R under theStock-Based Compensation” (FAS No.123) and (ii) compensation cost for all share-based payments granted or modified prospective method. The Company reversed the balance of $904,000 of unamortized compensation costs that pertainedsubsequent to restricted stock as of the January 1, 2006, balance sheetbased on the estimated fair value at the date to additional paid-in capital as required byof grant or subsequent modification date in accordance with the provisions of FAS 123R. As a result of adopting FAS 123R on January 1, 2006, net income and net income per share for the year ended December 31, 2006 were $290,000 and $0.02 lower, respectively, than if the Company had continued to account for stock-based compensation under APB 25.
PDI, Inc.
Notes to the Consolidated Financial Statements (Continued)
(tabular information in thousands, except share and per share data)
Prior to January 1, 2006, the Company accounted for stock-based employee compensation using the intrinsic value method under the recognition and measurement principles of APBAccounting Principles Board Opinion No. 25, and related interpretations. In accordance with APB 25, the Company did not recognize stock-based compensation expense with respect“Accounting for Stock Issued to options granted with an exercise price equal to the market value of the underlying common stock on the date of grant. As a result, prior to 2006, the recognition of stock-based compensation expense was generally limited to the expense related to restricted share awards. The following table illustrates the effect on net income and earnings per share if the Company had applied the fair value recognition provisions of FAS 123 to stock-based employee compensation for the years ended December 31, 2005 and 2004.Employees.”
| | | For the Year Ended December 31, | |
| | | 2005 | | 2004 | |
| Net (loss) income, as reported | | $ | (19,454 | ) | $ | 21,132 | |
| Add: Stock-based employee | | | | | | | |
| compensation expense included | | | | | | | |
| in reported net (loss) income, | | | | | | | |
| net of related tax effects | | | 974 | | | 721 | |
| Deduct: Total stock-based | | | | | | | |
| employee compensation expense | | | | | | | |
| determined under fair value based | | | | | | | |
| methods for all awards, net of | | | | | | | |
| related tax effects | | | (6,670 | ) | | (3,946 | ) |
| Pro forma net (loss) income | | $ | (25,150 | ) | $ | 17,907 | |
| (Loss) earnings per share | | | | | | | |
| Basic—as reported | | $ | (1.37 | ) | $ | 1.45 | |
| Basic—pro forma | | $ | (1.77 | ) | $ | 1.23 | |
| | | | | | | | |
| Diluted—as reported | | $ | (1.37 | ) | $ | 1.42 | |
| Diluted—pro forma | | $ | (1.77 | ) | $ | 1.20 | |
Prior to adoption of FAS 123R the Company presented allrequires any income tax benefits for deductions resulting fromrealized upon the exercise of stock options and disqualifying dispositionsor issuance of restricted share awards in excess of that which is associated with the expense recognized for financial reporting purposes be presented as a financing activity rather than as an operating cash flows on itsactivity in the consolidated statementsstatement of cash flows. SFAS 123R requires the benefits of tax deductions in excess of recognized compensation expense to be reported as a component of financing cash flows, rather than as a component of operating cash flows. This requirement will reduce net operating cash flows and increase net financing cash flows in periods after adoption. Total cash flow will remain unchanged from what would have been reported under prior accounting rules.
FAS 123R also requires that the Company recognize compensation expense for only the portion of stock options, stock-settled stock appreciation rights (SARs) or restricted shares that are expected to vest. Therefore, the Company applies estimated forfeiture rates that are derived from historical employee termination behavior. The Company applied a forfeiture rate to certain grants in 2007 and 2006. If the actual number of forfeitures differs from those estimated by management, adjustments to compensation expense might be required in future periods.
The Company had no cumulative effect adjustment upon adoption of FAS 123R under the modified prospective method. As a result of adopting FAS 123R on January 1, 2006, net income and net income per share for the year ended December 31, 2006 were $290,000 and $0.02 lower, respectively, than if the Company had continued to account for stock-based compensation under APB 25. See Note 11,13, Stock-Based Compensation, for further information regarding the Company’s stock-based compensation assumptions and expenses.
Rent Expense
Minimum rental expenses are recognized over the term of the lease. The Company recognizes minimum rent starting when possession of the property is taken from the landlord, which normally includes a construction period prior to occupancy. When a lease contains a predetermined fixed escalation of the minimum rent, the Company recognizes the related rent expense on a straight-line basis and records the difference between the recognized rental expense and the amounts payable under the lease as deferred lease credits. The Company also may receive tenant allowances including cash or rent abatements, which are reflected in other accrued expenses and long-term liabilities on the consolidated balance sheet and are amortized as a reduction to rent expense over the term of the lease. Certain leases provide for contingent rents that are not measurable at inception. These contingent rents are primarily based upon use of utilities and the landlord’s operating expenses. These amounts are excluded from minimum rent and are included in the determination of total rent expense when it is probable that the expense has been incurred and the amount is reasonably estimable.
PDI, Inc.
Notes to the Consolidated Financial Statements (Continued)
(tabular information in thousands, except share and per share data)
Advertising
The Company recognizes advertising costs as incurred. The total amounts charged to advertising expense, which is included in other SG&A, were approximately $825,000, $335,000$378,000, $290,000 and $230,000$825,000 for the years ended December 31, 2006, 20052008, 2007 and 2004,2006, respectively.
Income taxes
The Company adopted Financial Accounting Standards Board (FASB) Interpretation No. 48, “Accounting for Uncertainty in Income Taxes - an Interpretation of FASB Statement 109” (FIN 48) on January 1, 2007. FIN 48 prescribes a recognition threshold and measurement attributes for financial statement recognition and measurement of tax positions taken or expected to be taken in tax returns. In addition, FIN 48 provides guidance on derecognition, classification and disclosure of tax positions, as well as the accounting for related interest and penalties. The Company’s adoption of FIN 48 did not have a material effect on its financial position or results of operations.
In accordance with the provisions of SFAS No. 109, “Accounting for Income Taxes,” theThe Company accounts for income taxes using the asset and liability method. This method requires recognition of deferred tax assets and liabilities for expected future tax consequences of temporary differences that currently exist between tax bases and financial reporting bases of the Company’s assets and liabilities based on enacted tax laws and rates. A valuation allowance is established, when necessary, to reduce the deferred income tax assets when it is more likely than not that all or a portion of a deferred tax asset will not be realized.
The Company operates in multiple tax jurisdictions and provides taxes in each jurisdiction where it conducts business and is subject to taxation. The breadth of the Company’s operations and the complexity of the tax law require assessments of uncertainties and judgments in estimating the ultimate taxes the Company will pay. The final taxes paid are dependent upon many factors, including negotiations with taxing authorities in various jurisdictions, outcomes of tax litigation and resolution of proposed assessments arising from federal and state audits. The Company has established estimated liabilitiesUncertain tax positions are accounted for federal and state incomeunder FIN 48. FIN 48 requires that a position taken or expected to be taken in a tax exposuresreturn be recognized in the financial statements when it is more likely than not (i.e., a likelihood of more than fifty percent) that arise and meet the criteria for accrual under SFAS No. 5, “Accounting for Contingencies” (FAS 5).These accruals represent accounting estimatesposition would be sustained upon examination by tax authorities that are subject to inherent uncertainties associated withhave full knowledge of all relevant information. A recognized tax position is then measured at the tax audit process.largest amount of benefit that is greater than fifty percent likely of being realized upon ultimate settlement. The Company adjusts these accruals for unrecognized tax benefits as facts and circumstances change, such as the progress of a tax audit. The Company believes that any potential audit adjustments will not have a material adverse effect on its financial condition or liquidity. However, any adjustments made may be material to the Company’s consolidated results of operations or cash flows for a reporting period.
Significant judgment is also required in evaluating the need for and magnitude of appropriate valuation allowances against deferred tax assets. Deferred tax assets are regularly reviewed for recoverability. The Company currently has significant deferred tax assets resulting from net operating loss carryforwards and deductible temporary differences, which should reduce taxable income in future periods. The realization of these assets is dependent on generating future taxable income. A valuation allowance is required when it is more likely than not that all or a portion of a deferred tax asset will not be realized.
Based on the Company's assessment of its recent operating results and projections of future income, the Company concluded that it is more likely than not that its net deferred tax assets at December 31, 2006 will not be realized. Therefore, a full federal and state valuation allowance has been established. At December 31, 2005, based on a similar assessment, the Company established a federal and state valuation allowance for its net deferred tax assets in excess of the amount which was more likely than not to be realized in the form of a net operating loss carryback.
Comprehensive Income
Comprehensive income includes net income and the net unrealized net gains and losses on investment securities.securities, net of tax. Other comprehensive income is net of reclassification adjustments to adjust for items currently included in net income, such as realized gains and losses on investment securities. The deferred tax benefit for unrealized holding losses arising from investment securities during the year ended December 31, 2008 was $11,000. The deferred tax expense for unrealized holding gains arising from investment securities during the yearsyear ended December 31, 2007 and 2006 2005was $18,000 and 2004 was $26,000, $27,000 and $19,000, respectively. The deferred tax expense (benefit) for reclassification adjustments for gains (losses) included in net income on investment securitessecurities during the years ended December 31, 2008, 2007 and 2006 2005was $11,000, $48,000 and 2004 was $20,000, $30,000 and ($13,000), respectively.
New Accounting Pronouncements - Standards to be ImplementedReclassifications
In July 2006, the Financial Accounting Standards Board (FASB) issued FASB Interpretation No. 48, “Accounting for Uncertainty in Income Taxes - an Interpretation of FASB Statement 109” (FIN 48). FIN 48 clarifies that an entity’s tax benefits recognized in tax returns must be more likely than not of being sustained prior to recording the related tax benefit in the financial statements. As required by FIN 48, the Company will adopt this new accounting standard effective January 1, 2007. The Company is evaluatingreclassified certain prior period financial statements balances to conform to the potential effects the interpretation may have on its consolidated financial position or results of operations, but does not expect there to be a material consequence.current year presentation.
PDI, Inc.
Notes to the Consolidated Financial Statements (Continued)
(tabular information in thousands, except share and per share data)
Recently Issued Standards
In September 2006,December 2007, the FASB issued SFAS No. 141 (Revised 2007), “Business Combinations” (FAS 141R). FAS 141(R) requires the use of the acquisition method of accounting, defines the acquirer, establishes the acquisition date and broadens the scope to all transactions and other events in which one entity obtains control over one or more other businesses. FAS 141R will change the accounting treatment for certain specific acquisition related items including: (1) expensing acquisition related costs as incurred; (2) valuing noncontrolling interests at fair value at the acquisition date; and (3) expensing restructuring costs associated with an acquired business. FAS 141R also includes a substantial number of new disclosure requirements. This statement is effective for business combinations or transactions entered into for fiscal years beginning on or after December 15, 2008. The Company expects FAS 141R will have an impact on accounting for business combinations once adopted but the effect is dependent upon acquisitions at that time.
In June 2008, the FASB approved FASB Staff Position (FSP) EITF 03-6-1, “Determining Whether Instruments Granted in Share-Based Payment Transactions Are Participating Securities” (FSP EITF 03-6-1) which is effective January 1, 2009. FSP EITF 03-6-1 clarifies that share-based payment awards that entitle holders to receive non-forfeitable dividends before they vest will be considered participating securities and included in the basic earnings per share calculation. Prior to May 30, 2008, the Company’s stock award agreements provided for nonforfeitable dividend rights to unvested restricted stock awards and, consequently, these awards are participating securities as defined in this FSP. On May 31, 2008, the Company revised its stock award agreements for future grants so that unvested shares are non-participating securities. The Company is currently evaluating the impact of adopting FSP EITF 03-6-1 on its consolidated financial position and results of operations.
Recently Adopted Standards
SFAS No. 157, “Fair“Fair Value Measurements” (FAS(FAS 157). This statement defines fair value, establishes a framework for measuring fair value, and expands disclosures about fair value measurements. This standard is to be applied when other standards require or permit the use of fair value measurement of an asset or liability. The statementSFAS 157 was adopted on January 1, 2008 for all financial assets and liabilities and for nonfinancial assets and liabilities recognized or disclosed at fair value in the Company’s consolidated financial statements on a recurring basis (at least annually). For all other nonfinancial assets and liabilities, SFAS 157 is effective foron January 1, 2009. The initial adoption of FAS 157 had no impact on the Company’s consolidated financial statements issued for fiscal years beginning after November 15, 2007, and interim periods within that fiscal year.position or results of operations; however, the Company is now required to provide additional disclosures as part of its financial statements. See Note 11, Fair Value Measurements. The Company is still in the process of evaluating this standard with respect to its effect on nonfinancial assets and liabilities and, therefore, has not yet determined the impact that it will have on the Company’s financial statements upon full adoption in 2009. Nonfinancial assets and liabilities for which the Company has not applied the provisions of adopting this statement.FAS 157 include those measured at fair value in impairment testing and those initially measured at fair value in a business combination.
ReclassificationsIn February 2007, the FASB issued SFAS No. 159, “The Fair Value Option for Financial Assets and Financial Liabilities-including an amendment of FASB Statement No. 115” (FAS 159). FAS 159 permits entities to elect to measure eligible financial instruments at fair value. The Company would report unrealized gains and losses on items for which the fair value option has been elected in earnings at each subsequent reporting date, and recognize upfront costs and fees related to those items in earnings as incurred. The Company adopted FAS 159 as of January 1, 2008. The Company did not apply the fair value option to any of its outstanding instruments.
The Company reclassified certain prior period financial statements balances to conform to the current year presentation.
2. | Acquisition
Investments in Marketable Securities |
On August 31, 2004, the Company acquired substantially all of the assets of Pharmakon, LLC in a transaction treated as an asset acquisition for tax purposes. The acquisition has been accounted for as a purchase, subject to the provisions of SFAS No. 141. The Company made payments to the members of Pharmakon, LLC on August 31, 2004 of $27.4 million, of which $1.5 million was deposited into an escrow account, and the Company assumed approximately $2.6 million in net liabilities. Approximately $1.1 million in direct costs of the acquisition were also capitalized. As of December 31, 2006, all escrow payments had been paid to the members of Pharmakon, LLC. Based upon the attainment of annual profit targets agreed upon at the date of acquisition, the members of Pharmakon, LLC received approximately $1.4 million in additional payments on April 1, 2005 for the year ended December 31, 2004. No additional payments will be made in 2007, nor were any made in 2006 since the Pharmakon business did not exceed its specified 2006 and 2005 performance benchmarks. In connection with this transaction, the Company has recorded $13.6 million in goodwill and $18.9 million in other identifiable intangibles through December 31, 2006. The identifiable intangible assets have a weighted average remaining amortization period of 12.6 years.
The following unaudited pro forma consolidated results of operations for the year ended December 31, 2004 assume that the Company had acquired substantially all of the assets of Pharmakon, LLC as of the beginning of the period presented. The pro forma results include estimates and assumptions which management believes are reasonable. However, pro forma results are not necessarily indicative of the results that would have occurred if the acquisition had been consummated as of the dates indicated, nor are they necessarily indicative of future operating results.
| | | Year ended December 31, | |
| | | 2004 | |
| Revenue | | $ | 358,930 | |
| Income from continuing operations | | | 22,145 | |
| Earnings per share | | $ | 1.48 | |
3.
| Investments in Marketable Securities
|
Available-for-sale securitiesCompany’s available-for-sale investments are carried at fair value and consist of auction rate securities (ARSs) held by the Company as well as assets in a Rabbi Trustrabbi trust associated with its deferred compensation plan. For the years endedplan at December 31, 20062008 and 2005,2007. Marketable securities classified as available-for-sale are carried at fair value. At December 31, 2008 and 2007, the carrying value of available-for-sale securities was approximately $33.2 million$159,000 and $1.9 million,$459,000, respectively, andwhich are included in short-temshort-term investments. For the years ended December 31, 2006 and 2005, there was $32.6 million and zero invested in ARSs. The ARSs are invested in high-grade municipal bonds that have a weighted average maturity date of 27.2 years with an average interest rate reset period of 33.5 days. The available-for-sale securities within the Company’s deferred compensation plan for the years endedat December 31, 20062008 and 20052007 consisted of approximately $215,000$103,000 and $1.1 million$198,000 respectively, in money market accounts, and approximately $447,000$56,000 and $811,000,$261,000, respectively, in mutual funds. At December 31, 20062008 and 2005,2007, included in accumulated other comprehensive income were gross unrealized gains of approximately $131,000$0 and $115,000,$51,000, respectively, and gross unrealized losses of approximately $3,000$27,000 and $10,000,$2,000, respectively. AtIn years ended December 31, 20062008 and 2005,2007, included in interestother income, net were gross realized gains of approximately $65,000$29,000 and $98,000,$126,000, respectively, and no gross realized losses of approximately $12,000 and $28,000, respectively.losses.
PDI, Inc.
Notes to the Consolidated Financial Statements (Continued)
(tabular information in thousands, except share and per share data)
The Company’s other marketable securities consist of a laddered portfolio of investment grade debt instruments such as obligations of U.S. Treasury and U.S. Federal Government agencies, municipal bonds and commercial paper.agencies. These investments are categorized as held-to-maturity because the Company’s management has the intent and ability to hold these securities to maturity. Held-to-maturityMarketable securities classified as held-to-maturity are carried at amortized cost which approximates fair value, and have a weighted average maturity of 3.4 months. Portions of thesevalue. Certain held-to-maturity securitiesinvestments are maintained in separate accounts to support the Company’s standby letters of credit. The Company has standby letters of credit of approximately $9.7$5.9 million and $10.5$7.3 million at December 31, 20062008 and 2005,2007, respectively, as collateral for its existing insurance policies and its facility leases.
At December 31, 20062008 and 2005,2007, held-to-maturity securitiesinvestments were included in short-term investments (approximately $36.2$0 million and $4.9$7.3 million, respectively), other current assets (approximately $7.2$2.2 million and $7.8$4.3 million, respectively) and other long-term assets (approximately $2.5$3.6 million and $2.7$3.0 million, respectively). ForAt December 31, 2008 and 2007, held-to-maturity investments included:
| | | | | | Maturing | | | | | | Maturing |
| | | December 31, | | | within | | | 1 year | | | December 31, | | | within | | | 1 year |
| | | 2008 | | | 1 year | | | to 3 years | | | 2007 | | | 1 year | | | to 3 years |
| Short-term investments: | | | | | | | | | | | | | | | | | |
| Corporate debt securities | | $ | - | | | $ | - | | | $ | - | | | $ | 7,340 | | | $ | 7,340 | | | $ | - |
| Investments supporting letters of credit: | | | | | | | | | | | | | | | | | | | | | | | |
| Cash/money market accounts | | | 733 | | | | 733 | | | | - | | | | 2,390 | | | | 2,390 | | | | - |
| US Treasury securities | | | 2,043 | | | | 1,000 | | | | 1,043 | | | | 1,498 | | | | 500 | | | | 998 |
| Government agency securities | | | 3,071 | | | | 500 | | | | 2,571 | | | | 3,400 | | | | 1,400 | | | | 2,000 |
| | | | 5,847 | | | | 2,233 | | | | 3,614 | | | | 7,288 | | | | 4,290 | | | | 2,998 |
| Total | | $ | 5,847 | | | $ | 2,233 | | | $ | 3,614 | | | $ | 14,628 | | | $ | 11,630 | | | $ | 2,998 |
| | | | | | | | | | | | | | | | | | | | | | | | |
Property and equipment consisted of the following as of December 31, 2008 and 2007:
| | | December 31, | |
| | | 2008 | | | 2007 | |
| Furniture and fixtures | | $ | 3,281 | | | $ | 3,281 | |
| Office equipment | | | 1,306 | | | | 1,465 | |
| Computer equipment | | | 4,800 | | | | 4,773 | |
| Computer software | | | 9,580 | | | | 9,496 | |
| Leasehold improvements | | | 6,036 | | | | 6,023 | |
| | | | 25,003 | | | | 25,038 | |
| Less accumulated depreciation | | | (19,580 | ) | | | (16,690 | ) |
| | | $ | 5,423 | | | $ | 8,348 | |
| | | | | | | | |
Depreciation expense was approximately $3.3 million, $3.1 million and $3.3 million, for the years ended December 31, 2008, 2007 and 2006, respectively. Included in depreciation expense is amortization expense for capitalized computer software cost of approximately $0.9 million, $1.2 million and 2005 held-to-maturity securities included:
| | | December 31, | | December 31, | |
| | | 2006 | | 2005 | |
| Cash/money accounts | | $ | 332 | | $ | 1,953 | |
| Certificate of deposit | | | - | | | 2,131 | |
| Municipal securities | | | 32,843 | | | 2,620 | |
| US Treasury obligations | | | 1,499 | | | 987 | |
| Government agency obligations | | | 8,394 | | | 7,742 | |
| Other securities | | | 2,879 | | | - | |
| Total | | $ | 45,947 | | $ | 15,433 | |
$1.1 million, respectively.
In 2006,2007, the Company recorded a non-cash charge of approximately $1.3$1.0 million for furniture and leasehold improvements related to the excess leased space at its Saddle River, New Jersey and Dresher, Pennsylvania locations. See Note 17,14, Facilities Realignment, for additional information.
In the second quarter of 2005, the Company had a $2.8 million write-down of its Siebel sales force automation software. Due to the migration of the Company’s sales force automation software to the Dendrite platform, it was determined that the Company’s Siebel sales force automation software was impaired and a write-down of the asset was necessary. The non-cash charge was included in operating expense
| 4. | Goodwill and Other Intangible Assets |
There have been no changes in the sales services segment.
Property and equipment consistedcarrying amount of the following asgoodwill of December 31, 2006 and 2005:
| | | December 31, | |
| | | 2006 | | 2005 | |
| Furniture and fixtures | | $ | 3,549 | | $ | 3,925 | |
| Office equipment | | | 1,461 | | | 1,663 | |
| Computer equipment | | | 8,265 | | | 7,402 | |
| Computer software | | | 9,355 | | | 9,350 | |
| Leasehold improvements | | | 6,698 | | | 5,730 | |
| | | | 29,328 | | | 28,070 | |
| Less accumulated depreciation | | | (16,519 | ) | | (12,017 | ) |
| | | $ | 12,809 | | $ | 16,053 | |
Depreciation expense was approximately $4.4 million, $3.9 million and $4.9$13.6 million for the years ended December 31, 2006, 20052008 and 2004, respectively.2007.
PDI, Inc.
Notes to the Consolidated Financial Statements (Continued)
(tabular information in thousands, except share and per share data)
5.
| Goodwill and Other Intangible Assets
|
In December 2006 and 2005, the Company performed its annual goodwill impairment evaluation. Goodwill has been assigned to the reporting units to which the value of the goodwill relates. The 2006 evaluation indicated that goodwill was not impaired. The 2005 evaluation indicated that goodwill recorded in the MD&D and Select Access reporting units was impaired and accordingly, the Company recognized non-cash charges of approximately $7.8 million and $3.3 million, respectively, in 2005. On December 4, 2005 the Company announced it was discontinuing its MD&D business unit, which ceased operations in the second quarter of 2006. (See Note 20, Discontinued Operations, for additional information.) As a result of that decision and the expected cash flows that the unit was expected to generate in 2006, an impairment charge of $7.8 million was recorded in operating expense in the sales services segment, which represented all of the goodwill associated with the InServe acquisition. That charge is currently included in discontinued operations as MD&D is no longer part of the sales services segment. The loss of a key customer that historically represented between 25% and 35% of revenue and the lack of new business projected within Select Access were the main factors for the $3.3 million goodwill impairment charge and was recorded in the sales services segment.
Additionally, due to the discontinuation of the MD&D business unit, the Company evaluated the recoverability of MD&D long-lived assets and determined that those assets were impaired. The Company recorded a non-cash charge of approximately $349,000. This was also recorded in operating expense to discontinued operations.
The Company increased goodwill by $500,000 for the year ended December 31, 2006 associated with the final escrow payment made to the members of Pharmakon, LLC, pursuant to the Pharmakon acquisition agreement.
Changes in the carrying amount of goodwill for the year ended December 31, 2006 were as follows:
| | | Marketing | |
| | | Services | |
| | | | | |
| Balance as of December 31, 2005 | | $ | 13,112 | |
| Goodwill additions | | | 500 | |
| Balance as of December 31, 2006 | | $ | 13,612 | |
All identifiable intangible assets recorded as of December 31, 2006 are being amortized on a straight-line basis over the lives of the intangibles, which range from 5 to 15 years. The weighted average amortization period for all of the identifiable intangible assets is approximately 12.6 years. Amortization expense related to continuing operations for the years ended December 31, 2006, 2005 and 2004 was approximately $1.3 million, $1.3 million, and $427,000, respectively. Estimated amortization expense for the next five years is as follows:
| 2007 | | 2008 | | 2009 | | 2010 | | 2011 |
| $ 1,281 | | $ 1,281 | | $ 1,272 | | $ 1,253 | | $ 1,253 |
All intangible assets recorded as of December 31, 20062008 are attributable to the acquisition of Pharmakon and are being amortized on a straight-line basis over the lives of the intangibles, which range from 5 to 15 years. As of March 31, 2006, the intangible assets associated with the acquisition of InServe were fully amortized and written-off. The net carrying value of the identifiable intangible assets for the years ended December 31, 2008 and 2007 is as follows:
| | | As of December 31, 2008 | | | As of December 31, 2007 |
| | | Carrying | | | Accumulated | | | | | | Carrying | | | Accumulated | | | |
| | | Amount | | | Amortization | | | Net | | | Amount | | | Amortization | | | Net |
| Covenant not to compete | | $ | 140 | | | $ | 121 | | | $ | 19 | | | $ | 140 | | | $ | 93 | | | $ | 47 |
| Customer relationships | | | 16,300 | | | | 4,709 | | | | 11,591 | | | | 16,300 | | | | 3,622 | | | | 12,768 |
| Corporate tradename | | | 2,500 | | | | 722 | | | | 1,778 | | | | 2,500 | | | | 556 | | | | 1,944 |
| Total | | $ | 18,940 | | | $ | 5,552 | | | $ | 13,388 | | | $ | 18,940 | | | $ | 4,271 | | | $ | 14,669 |
Amortization expense related to continuing operations for the years ended December 31, 2008, 2007 and 2006 and 2005was approximately $1.3 million for each of the three years,
respectively. Estimated amortization expense for the next five years is as follows:
| | | As of December 31, 2006 | | As of December 31, 2005 | |
| | | Carrying | | Accumulated | | | | Carrying | | Accumulated | | | |
| | | Amount | | Amortization | | Net | | Amount | | Amortization | | Net | |
| Covenant not to compete | | $ | 140 | | $ | 65 | | $ | 75 | | $ | 1,634 | | $ | 1,491 | | $ | 143 | |
| Customer relationships | | | 16,300 | | | 2,536 | | | 13,764 | | | 17,371 | | | 2,491 | | | 14,880 | |
| Corporate tradename | | | 2,500 | | | 389 | | | 2,111 | | | 2,652 | | | 370 | | | 2,282 | |
| Total | | $ | 18,940 | | $ | 2,990 | | $ | 15,950 | | $ | 21,657 | | $ | 4,352 | | $ | 17,305 | |
PDI, Inc.
Notes to the Consolidated Financial Statements (Continued)
(tabular information in thousands, except share and per share data)| 2009 | | 2010 | | 2011 | | 2012 | | 2013 |
| $ 1,272 | | $ 1,253 | | $ 1,253 | | $ 1,253 | | $ 1,253 |
6.
5. | Loans and Investments in Privately-Held Entities |
In October 2002, the Company acquired $1.0 million of preferred stock of Xylos Corporation (Xylos). In addition, the Company provided Xylos with short-term loans totaling $500,000 in the first half of 2004. The Company determined its $1.0 million investment and $500,000 short-term loan to Xylos were impaired as of December 31, 2004. The Company wrote its $1.0 million investment down to zero and established an allowance for credit losses against the $500,000 short-term loan. Xylos made loan payments totaling $150,000, $250,000, and $100,000 in 2007, 2006 and 2005, respectively.respectively and the loan has been repaid in full. These payments were recorded as credits to bad debt expense in the periods in which they were received.
In May 2004, the Company entered into a loan agreement with TMX Interactive, Inc. (TMX), a provider of sales force effectiveness technology. Pursuant to the loan agreement, the Company provided TMX with a term loan facility of $500,000 and a convertible loan facility of $500,000, both of which were due to be repaid on November 26, 2005. In 2005, due to TMX’s continued losses and uncertainty regarding its future prospects, the Company established an allowance for credit losses against the TMX loans. During 2006 andFrom 2005 to 2007, TMX provided services to PDIthe Company valued at $246,000$500,000 and $245,000 respectively. The receipt of these services was used as payment towards the loan and the balance of the loan receivable at December 31, 2006 is $509,000. The receipt of services in lieu of cash payment was recorded as a credit to bad debt expense and a reduction of the receivable in 2006 and credit tothe respective periods. At December 31, 2008, the loan receivable in 2005.
In June 2005, the Company sold its approximately 12% ownership share in In2Focus Sales Development Services Limited, (In2Focus),has a United Kingdom contract sales company. The Company’s original investmentbalance of $1.9 million had been written down to zero in the fourth quarter of 2001. The Company received approximately $4.4 million, net of deal costs,$500,000, which was included in gain on investments in 2005.is fully reserved.
The Company offers an employee 401(k) saving plan. Under the PDI, Inc. 401(k) Plan, employees may contribute up to 25% of their pre-tax compensation. Effective January 1, 2004, the Company makes a safe harbor non-elective contribution in an amount equal to 100% of the participant’s base salary contributed up to 3% plus 50% of the participant’s base salary contributed exceeding 3% but not more than 5%. Prior to January 1, 2004, the Company made cash contributions in an amount equal to 100% of the participant’s base salary contributed up to 2%. Participants are not allowed to invest any of their 401(k) funds in the Company’s common stock. The Company’s total contribution expense related to the Company’s 401(k) plans for 2006, 20052008, 2007 and 20042006 was approximately $1.3$0.8 million, $2.1$0.7 million, and $1.6$1.3 million, respectively.
8.
7. | Deferred Compensation Arrangements |
Beginning in 2000, the Company established a deferred compensation arrangement whereby a portion of certain employees’ salaries is withheld and placed in a Rabbi Trust.rabbi trust. The plan permits the employeesparticipants to diversify these assets through a variety of investment options. Members of the Company’s Board of Directors (Board) also have the opportunity to defer their compensation through this arrangement. The Company adopted the provisions of EITF No. 97-14 "Accounting for Deferred Compensation Arrangement Where Amounts are Earned and Held in a Rabbi Trust and Invested” which requires the Company to consolidate into its financial statementsincludes the net assets of the trust.trust in its financial statements. The deferred compensation obligation has been classified as a current liability and the net assets in the trust are classified as available-for-sale securities and are included in short-term investments.
PDI, Inc.
Notes to the Consolidated Financial Statements (Continued)
(tabular information in thousands, except share and per share data)
Long-term liabilities consisted of the following as of December 31, 2008 and 2007:
| | | December 31, |
| | | 2008 | | | 2007 |
| Deferred tax | | $ | 1,443 | | | $ | 1,113 |
| Rent payable | | | 2,736 | | | | 2,959 |
| Accrued income taxes | | | 6,003 | | | | 5,765 |
| Other | | | 387 | | | | 340 |
| | | $ | 10,569 | | | $ | 10,177 |
9. | Commitments and Contingencies |
The Company leases facilities, automobiles and certain equipment under agreements classified as operating leases, which expire at various dates through 2016. Substantially all of the property leases provide for increases based upon use of utilities and landlord’s operating expenses. Lease and auto expense under these agreements for the years ended December 31, 2006, 20052008, 2007 and 20042006 was approximately $15.0$4.9 million, $22.9$5.0 million, and $24.4$15.0 million, and respectively, of which $2.9 million in 2008, $2.9 million in 2007, and $12.7 million in 2006 $19.3 million in 2005, and $21.2 million in 2004 related to automobiles leased for use by employees for a term of one year from the date of delivery with yearly annual renewal options.
As of December 31, 2006,2008, contractual obligations with terms exceeding one year and estimated minimum future rental payments required by non-cancelable operating leases with initial or remaining lease terms exceeding one year are as follows:
PDI, Inc.
Notes to the Consolidated Financial Statements (Continued)
(tabular information in thousands, except share and per share data)
| | | | | Less than | | 1 to 3 | | 3 to 5 | | After | |
| | | Total | | 1 Year | | Years | | Years | | 5 Years | |
Contractrual obligations (1) | | $ | 6,523 | | $ | 4,496 | | $ | 2,027 | | $ | - | | $ | - | |
| Operating lease obligations | | | | | | | | | | | | | | | | |
| Minimum lease payments | | | 30,641 | | | 3,100 | | | 6,516 | | | 6,462 | | | 14,563 | |
Less minimum sublease rentals (2) | | | (1,452 | ) | | (401 | ) | | (801 | ) | | (250 | ) | | - | |
| Net minimum lease payments | | | 29,189 | | | 2,699 | | | 5,715 | | | 6,212 | | | 14,563 | |
| Total | | $ | 35,712 | | $ | 7,195 | | $ | 7,742 | | $ | 6,212 | | $ | 14,563 | |
| | | | | Less than | | | 1 to 3 | | | 3 to 5 | | | After | |
| | | Total | | | 1 Year | | | Years | | | Years | | | 5 Years | |
Contractual obligations (1) | | $ | 1,476 | | | $ | 859 | | | $ | 617 | | | $ | - | | | $ | - | |
Purchase obligations (2) | | | 7,583 | | | | 7,000 | | | | 583 | | | | - | | | | - | |
| Operating lease obligations | | | | | | | | | | | | | | | | | | | | |
| Minimum lease payments | | | 24,395 | | | | 3,318 | | | | 6,507 | | | | 6,564 | | | | 8,006 | |
Less minimum sublease rentals (3) | | | (5,113 | ) | | | (1,069 | ) | | | (1,613 | ) | | | (1,239 | ) | | | (1,192 | ) |
| Net minimum lease payments | | | 19,282 | | | | 2,249 | | | | 4,894 | | | | 5,325 | | | | 6,814 | |
| Total | | $ | 28,341 | | | $ | 10,108 | | | $ | 6,094 | | | $ | 5,325 | | | $ | 6,814 | |
| (1) | Amounts represent contractual obligations related to software license contracts, IT consulting contractsdata center hosting, and outsourcing contracts for employee benefits administration and software system support. |
| | (2) | OnRepresents minimum annualized purchase obligations associated with promotional spending as per the terms of the Company’s agreement with Novartis through February 2010, which is the early termination date for this contract provided that sales of the product remain below certain pre-determined thresholds. |
| (3) | In June 21, 2005, the Companywe signed an agreement to sublease approximately 16,000 square feet of the first floor at itsour corporate headquarters facility in Saddle River, New Jersey. (approximately 16,000 square feet) The sublease is for a five-year term commencing on July 15, 2005, and provides for approximately $2 million in lease payments over the five-year period. In July 2007, we signed an agreement to sublease approximately 20,000 square feet of the second floor at our corporate headquarters. The sublease term is through the remainder of our lease, which is approximately eight and one-half years and will provide for approximately $4.4 million in lease payments over that period. Also in 2007, we signed two separate subleases at our facility in Dresher, Pennsylvania. These subleases are for five-year terms and will provide approximately $650,000 combined in lease payments over the five-year period. |
Letters of Credit
As of December 31, 2008, the Company has $5.9 million in letters of credit outstanding as required by its existing insurance policies and its facility leases.
PDI, Inc.
Notes to the Consolidated Financial Statements (Continued)
(tabular information in thousands, except share and per share data)
Due to the nature of the businessbusinesses in which the Company is engaged, such as product detailing and in the past, the distribution of products, it could be exposed to certain risks. Such risks include, among others, risk of liability for personal injury or death to persons using products the Company promotes or distributes. There can be no assurance that substantial claims or liabilities will not arise in the future due to the nature of the Company’s business activities and recent increases in litigation related to healthcare products, including pharmaceuticals. The Company seeks to reduce its potential liability under its product detailingservice agreements through measures such as contractual indemnification provisions with customersclients (the scope of which may vary from customerclient to customer,client, and the performances of which are not secured) and insurance. The Company could, however, also be held liable for errors and omissions of its employees in connection with the services it performs that are outside the scope of any indemnity or insurance policy. The Company could be materially and adversely affected if it waswere required to pay damages or incur defense costs in connection with a claim that is outside the scope of an indemnification agreement; if the indemnity, although applicable, is not performed in accordance with its terms; or if the Company’s liability exceeds the amount of applicable insurance or indemnity.
Securities Litigation
In January and February 2002, the Company, its former chief executive officer and its former chief financial officer were served with three complaints that were filed in the U.S. District Court for the District of New Jersey (the Court) alleging violations of the Securities Exchange Act of 1934 (the Exchange Act). These complaints were brought as purported shareholder class actions under Sections 10(b) and 20(a) of the Exchange Act and Rule 10b-5 established thereunder. On May 23, 2002, the Court consolidated all three lawsuits into a single action entitled In re PDI Securities Litigation, Master File No. 02-CV-0211, and appointed lead plaintiffs (Lead Plaintiffs) and Lead Plaintiffs’ counsel. On or about December 13, 2002, Lead Plaintiffs filed a second consolidated and amended complaint (Second Consolidated and Amended Complaint), which superseded their earlier complaints. In February 2003, the Company filed a motion to dismiss the Second Consolidated and Amended Complaint. On or about August 22, 2005, the Court dismissed the Second Consolidated and Amended Complaint without prejudice to plaintiffs.
On October 21, 2005, Lead Plaintiffs filed a third consolidated and amended complaint (Third Consolidated and Amended Complaint). Like its predecessor, the Third Consolidated and Amended Complaint named the Company, its former chief executive officer and its former chief financial officer as defendants; purported to state claims against the Company on behalf of all persons who purchased its common stock between May 22, 2001 and August 12, 2002; and sought money damages in unspecified amounts and litigation expenses including attorneys’ and experts’ fees. The essence of the allegations in the Third Consolidated and Amended Complaint was that the Company intentionally or recklessly made false or misleading public statements and omissions concerning its prospects with respect to its marketing of Ceftin in connection with the October 2000 distribution agreement with GlaxoSmithKline (GSK), its marketing of Lotensin in connection with the May 2001 distribution agreement with Novartis Pharmaceuticals Corporation, as well as its marketing of Evista in connection with the October 2001 distribution agreement with Eli Lilly and Company.
PDI, Inc.
Notes to the Consolidated Financial Statements (Continued)
(tabular information in thousands, except share and per share data)
On December 21, 2005, the Company filed a motion to dismiss the Third Consolidated and Amended Complaint under the Private Securities Litigation Reform Act of 1995 and Rules 9(b) and 12(b)(6) of the Federal Rules of Civil Procedure. On November 2, 2006, the Court issued an Opinion and Order dismissing with prejudice all claims asserted in the Third Consolidated and Amended Complaint against all defendants and denied Lead Plaintiffs’ request to amend the complaint.
Cellegy Litigation
On April 11, 2005, the Company settled a lawsuit which was pending in the U.S. District Court for the Northern District of California against Cellegy Pharmaceuticals, Inc. (Cellegy), which was set to go to trial in May 2005 (PDI, Inc. v. Cellegy Pharmaceuticals, Inc., Case No. C 03-05602 (SC)). The Company had claimed (i) that it was fraudulently induced to enter into a December 31, 2002 license agreement with Cellegy (the License Agreement) to market the product Fortigel, and (ii) that Cellegy had otherwise breached the License Agreement by failing, inter alia, to provide it with full information about Fortigel or to take all necessary steps to obtain expeditious FDA approval of Fortigel. The Company sought return of its $15 million upfront payment, other damages and an order rescinding the License Agreement. Under the terms of the settlement, in exchange for executing a stipulation of dismissal with prejudice of the lawsuit, Cellegy agreed to and did deliver to the Company: (i) a cash payment in the amount of $2.0 million; (ii) a Secured Promissory Note in the principal amount of $3.0 million, with a maturity date of October 11, 2006; (iii) a Security Agreement, granting the Company a security interest in certain collateral; and (iv) a Nonnegotiable Convertible Senior Note, with a face value of $3.5 million, with a maturity date of April, 11, 2008.
In addition to the initial $2.0 million received on April 11, 2005, Cellegy had paid $200,000 in 2005 and $458,500 through June 30, 2006 towards the outstanding principal balance of the Secured Promissory Note. These payments were recorded as a credit to litigation expense in the periods in which they were received.
On December 1, 2005, the Company commenced a breach of contract action against Cellegy in the U.S. District Court for the Southern District of New York (PDI, Inc. v. Cellegy Pharmaceuticals, Inc., 05 Civ. 10137 (PKL)). The Company alleged that Cellegy breached the terms of the Security Agreement and Secured Promissory Note that it received in connection with the settlement. The Company further alleged that to secure its debt to the Company, Cellegy granted the Company a security interest in certain "Pledged Collateral," which is broadly defined in the Security Agreement to include, among other things, 50% of licensing fees, royalties or "other payments in the nature thereof" received by Cellegy in connection with then-existing or future agreements for Cellegy's drugs Rectogesic® and Tostrex® outside of the U.S., Mexico, and Canada. Upon receipt of such payments, Cellegy agreed to make prompt payment to the Company. The Company alleged that it was owed 50% of a $2.0 million payment received by Cellegy in connection with the renegotiation of its license and distribution agreement for Rectogesic® in Europe, and that Cellegy's failure to pay the Company constituted an event of default under the Security Agreement and the Secured Promissory Note. For Cellegy's breach of contract, the Company sought damages in the total amount of $6.4 million plus default interest from Cellegy.
On December 27, 2005, Cellegy filed an answer to the Company’s complaint, denying the allegations contained therein, and asserting affirmative defenses. Discovery subsequently commenced and pursuant to a scheduling order entered by the court, was to be completed by November 21, 2006. On June 22, 2006, the parties appeared before the court for a status conference and agreed to a dismissal of the lawsuit without prejudice because, among other reasons, discovery would not be complete before October 11, 2006, the maturity date of the Secured Promissory Note, at which time Cellegy would owe the Company the entire unpaid principal balance and interest on the Secured Promissory Note. On July 13, 2006, the court dismissed the December 1, 2005 breach of contract lawsuit without prejudice. This had no effect on the original settlement.
On September 27, 2006, Cellegy announced that it had entered into an asset purchase agreement to sell its intellectual property rights and other assets relating to certain of its products and product candidates to Strakan International Limited (the Sale). Pursuant to a letter agreement between Cellegy and the Company, Cellegy agreed to pay the Company $3.0 million (the Payoff Amount) in full satisfaction of Cellegy’s obligations to the Company under the Secured Promissory Note, which had an outstanding principal amount of approximately $2.34 million, and the $3.5 million Nonnegotiable Convertible Senior Note (collectively, the Notes). Pursuant to the letter agreement, $500,000 of the Payoff Amount was paid to the Company in September 2006, and the remaining $2.5 million was paid to the Company in December 2006 upon consummation of the Sale.
PDI, Inc.
Notes to the Consolidated Financial Statements (Continued)
(tabular information in thousands, except share and per share data)
The Company had previously established an allowance for doubtful notes for the outstanding balance of the Notes; therefore, the Agreement did not result in the recognition of a loss. The $3.0 million received was recorded as a credit to litigation expense.
California Class Action Litigation
On September 26, 2005, the Company was served with a complaint in a purported class action lawsuit that was commenced against the Company in the Superior Court of the State of California for the County of San Francisco on behalf of certain of its current and former employees, alleging violations of certain sections of the California Labor Code. During the quarter ended September 30, 2005, the Company accrued approximately $3.3 million for potential penalties and other settlement costs relating to both asserted and unasserted claims relating to this matter. In October 2005, the Company filed an answer generally denying the allegations set forth in the complaint. In December 2005, the Company reached a tentative settlement of this action, subject to court approval. As a result, the Company reduced its accrual relating to asserted and unasserted claims relating to this matter to $600,000 during the quarter ended December 31, 2005. In October 2006, the Company received preliminary settlement approval from the court and the final approval hearing was held in January 2007. Pursuant to the settlement, the Company is currently in the process of distributing payments to the class members, their counsel and the California Labor and Workforce Development Agency in an aggregate amount of approximately $50,000.
Bayer-Baycol Litigation
The Company has been named as a defendant in numerous lawsuits, including two class action matters, alleging claims arising from the use of Baycol, a prescription cholesterol-lowering medication. Baycol was distributed, promoted and sold by Bayer AG (Bayer) in the U.S. through early August 2001, at which time Bayer voluntarily withdrew Baycol from the U.S. market. Bayer had retained certain companies, such as the Company, to provide detailing services on its behalf pursuant to contract sales force agreements. The Company may be named in additional similar lawsuits. To date, the Company has defended these actions vigorously and has asserted a contractual right of defense and indemnification against Bayer for all costs and expenses that it incurs relating to these proceedings. In February 2003, the Company entered into a joint defense and indemnification agreement with Bayer, pursuant to which Bayer has agreed to assume substantially all of the Company’s defense costs in pending and prospective proceedings and to indemnify the Company in these lawsuits, subject to certain limited exceptions. Further, Bayer agreed to reimburse the Company for all reasonable costs and expenses incurred through such date in defending these proceedings. As of December 31, 2006,2008, Bayer has reimbursed the Company for approximately $1.6 million in legal expenses, the majority of which was received in 2003 and was reflected as a credit within selling, general and administrative expense. The Company did not incur any costs or expenses relating to these matters during 2005, 2006, 2005,2007, or 2004.2008.
| 10. | Product Commercialization Contract |
LettersOn April 11, 2008, the Company announced the signing of Credita promotion agreement with Novartis Pharmaceuticals Corporation (Novartis). Pursuant to the agreement, the Company has the co-exclusive right to promote on behalf of Novartis the pharmaceutical product Elidel® (pimecrolimus) Cream 1% (the Product) to physicians in the United States. Under terms of the agreement, the Company is providing sales representatives to promote the Product to physicians. The Company must perform a minimum number of sales calls to designated physicians each year, and the failure to satisfy this requirement could result in penalties being imposed on the Company. In addition, the Company is obligated to spend at least $7.0 million per year during the term on promotional activities relating to the Product. Finally, as required under the agreement, the Company paid an up-front nonrefundable fee of $1.0 million. This fee was paid during the second quarter of 2008 and has been recognized as negative revenue pursuant to Emerging Issues Task Force Issue No. 01-09, "Accounting for Consideration Given by a Vendor to a Customer or a Reseller of the Vendor's Product."
In exchange for its promotional and sales force activities, the Company will be compensated each quarter based on a specified formula set forth in the agreement relating to Product sales for the quarter. Under the terms of the contract, any shortfall between actual sales and the pre-determined threshold from the previous quarter is added to the current quarter’s threshold amount that the Company must achieve in order to generate revenue. It is possible that the Company may not receive any compensation if Product sales are below certain thresholds set forth in the agreement.
The term of the agreement is approximately four years, extending through March 31, 2012, and it may be extended for an additional year upon the mutual consent of the parties. In addition, if the agreement is not terminated prior to its scheduled expiration on March 31, 2012, if due under the terms of the agreement, Novartis will provide the Company with two residual payments in accordance with specified formulas set forth in the agreement, which are payable 12 and 24 months after the expiration of the term of the agreement.
PDI, Inc.
Notes to the Consolidated Financial Statements (Continued)
(tabular information in thousands, except share and per share data)
The agreement provides that if one or more major market events occur during the term that significantly affects the Product, in certain cases either party will have the right to terminate the agreement. Either party may terminate the agreement if the other party materially breaches or fails to perform its obligations under the agreement. In addition, either party may terminate the agreement, effective no earlier than February 2010, upon three months prior notice to the other party if the number of prescriptions for the Product generated in a specified period is less than a predetermined level for that period. Novartis may terminate the agreement, effective no earlier than February 1, 2010, without cause upon three months prior notice to the Company subject to the payment of an early termination fee based in part on a fixed amount and in part on a specified formula set forth in the agreement.
As of December 31, 2006,2008, the Company made expenditures of approximately $12.3 million in connection with our sales force activities and promotion of the product. To date, the Company has $9.7not achieved the required sales levels necessary to receive revenue under its promotion agreement with Novartis. The Company does not anticipate that it will achieve the required sales levels necessary to generate sufficient revenue to recover the costs it incurred or will incur in connection with this promotional program during the term of the contract. The Company intends to terminate this contract at the early termination date for the contract, which is no sooner than February 1, 2010 provided that sales of the product remain below certain pre-determined thresholds.
At December 31, 2008, the Company accrued a contract loss of approximately $10.3 million, representing the anticipated future loss expected to be incurred by the Company to fulfill its contractual obligations under this product commercialization agreement until February 2010, the early termination date for this contract. The loss contract provision for this product commercialization agreement includes cost of the sales force needed to deliver the minimum number of sales calls and promotional program costs, including the cost of samples and other promotional costs net of anticipated revenue. In determining the amount of the loss contract provision, projections regarding estimated future cash flows are made to estimate the expected loss. The use of alternative estimates and assumptions could increase or decrease the estimated loss and potentially result in lettersa different impact to the Company’s results of credit outstanding as required by its existing insurance policies and its facility leases.
operations. Further, changes in business strategy and/or market conditions may significantly impact these judgments. Actual results could materially differ from this estimate.
10.11.
| Fair Value Measurements |
As discussed in Note 2, the Company adopted FAS 157 for all financial assets and liabilities and for nonfinancial assets and liabilities recognized or disclosed at fair value in the Company’s consolidated financial statements on a recurring basis (at least annually). Broadly, the FAS 157 framework requires fair value to be determined based on the exchange price that would be received for an asset or paid to transfer a liability (an exit price) in the principal or most advantageous market for the asset or liability in an orderly transaction between market participants. FAS 157 establishes market or observable inputs as the preferred source of values, followed by assumptions based on hypothetical transactions in the absence of market inputs. The valuation techniques required by FAS 157 are based upon observable and unobservable inputs. Observable inputs reflect market data obtained from independent sources, while unobservable inputs reflect the Company’s market assumptions. These two types of inputs create the following three-tier fair value hierarchy: Level 1, defined as observable inputs such as quoted prices in active markets; Level 2, defined as inputs other than quoted prices in active markets that are either directly or indirectly observable; and Level 3, defined as unobservable inputs in which little or no market data exists, therefore, requiring the Company to develop its own assumptions.
The Company’s adoption of FAS 157 was limited to its investment in marketable securities. See Note 2, Investments in Marketable Securities, for additional information. The fair values for these securities are based on quoted market prices.
PDI, Inc.
Notes to the Consolidated Financial Statements (Continued)
(tabular information in thousands, except share and per share data)
The following table presents financial assets and liabilities measured at fair value at December 31, 2008:
| | | | | | | | | Fair Market |
| | | Carrying | | | Fair | | | Measurements at December 31, 2008 |
| | | Amount | | | Value | | | Level 1 | | | Level 2 | | | Level 3 |
| Available-for-sale securities | | $ | 159 | | | $ | 159 | | | $ | 159 | | | $ | - | | | $ | - |
| Held-to-maturity securities | | | 5,847 | | | | 5,970 | | | | 5,970 | | | | - | | | | - |
| Total | | $ | 6,006 | | | $ | 6,129 | | | $ | 6,129 | | | $ | - | | | $ | - |
| | | | | | | | | | | | | | | | | | | | |
The Company's Board is authorized to issue, from time to time, up to 5,000,000 shares of preferred stock in one or more series. The Board is authorized to fix the rights and designation of each series, including dividend rights and rates, conversion rights, voting rights, redemption terms and prices, liquidation preferences and the number of shares of each series. As of December 31, 20062008 and 2005,2007, there were no issued and outstanding shares of preferred stock.
On January 1, 2006, the Company adopted FAS 123R. See Note 1, Nature of Business and Significant Accounting Policies, for a description of the adoption of FAS 123R. The Company’s stock-incentive program is a long term retention program that is intended to attract, retain and provide incentives for talented employees, officers and directors, and to align stockholder and employee interests. The Company considers its stock-incentive program critical to its operations and productivity. Currently, the Company grants options, SARs and restricted shares from the PDI, Inc. 2004 Stock Award and Incentive Plan (the 2004 Plan), which is described below. The Company recognizes compensation cost arising from the issuance of stock options, SARs, and restricted shares on a straight-line basis over the vesting period of the grant. Total share-based compensation expense recognized for the years ended December 31, 2006, 2005, and 2004 was $1.7 million, $1.5 million, and $1.2 million, respectively.
PDI, Inc.
Notes to the Consolidated Financial Statements (Continued)
(tabular information in thousands, except share and per share data)
On January 1, 2006, the Company adopted FAS 123R. See Note 1, Nature of Business and Significant Accounting Policies, for a description of the adoption of FAS 123R. The Company currentlyprimarily uses the Black-Scholes option pricing model to determine the fair value of stock options and SARs. The determination of the fair value of stock-based payment awards on the date of grant using an option-pricing model is affected by the Company’s stock price as well as assumptions regarding a number of complex and subjective variables. These variables include the Company’s expected stock price volatility over the term of the awards, actual and projected employee stock option exercise behaviors, risk-free interest rate and expected dividends.
Expected volatility was based on historical volatility. As there is no trading volume for the Company’s options, implied volatility was not representative of the Company’s current volatility so the historical volatility was determined to be more indicative of the Company’s expected future stock performance. The expected life was determined using the safe-harbor method permitted by Securities Exchange Commission’s Staff Accounting Bulletin (SAB) No. 107 (SAB 107). The Company expects to use this simplified method for valuing employee SARs grants as permitted by the provisions of SAB 107 until more detailed information about exercise behavior becomes available over time. When stock options are issued, the Company will use an expected life commensurate with their historical exercise patterns. The Company bases the risk-free interest rate on U.S. Treasury zero-coupon issues with remaining terms similar to the expected term on the options or SARs. The Company does not anticipate paying any cash dividends in the foreseeable future and therefore uses an expected dividend yield of zero in the option valuation model. The Company is required to estimate forfeitures at the time of grant and revise those estimates in subsequent periods if actual forfeitures differ from those estimates. The Company uses historical data to estimate pre-vesting option forfeitures and records stock-based compensation expense only for those awards that are expected to vest. The Company recognizes compensation cost, net of estimated forfeitures, arising from the issuance of stock options and SARs on a straight-line basis over the vesting period of the grant.
Prior to the adoption of FAS 123R, the Company recognized theThe estimated compensation cost associated with the granting of restricted shares over the vesting term. The estimated compensation coststock and restricted stock units is based on the fair value of the Company’s common stock on the date of grant. The Company continues to recognizerecognizes the compensation cost, net of estimated forfeitures, arising from the issuance of restricted stock and restricted stock units on a straight-line basis over the vesting term.period of the grant.
In accordance with FAS 123R, the Company will recognize the estimated compensation cost of performance contingent shares, net of estimated forfeitures, based on the probability that the performance condition will be achieved. These awards are earned upon attainment of identified performance goals. The fair value of the awards is based on the measurement date. The awards will be amortized over the performance period. Compensation cost for performance contingent shares is estimated based on the number of awards that are expected to vest and is adjusted for those awards that do ultimately vest.PDI, Inc.
Notes to the Consolidated Financial Statements (Continued)
(tabular information in thousands, except share and per share data)
The following table provides the weighted average assumptions used in determining the fair value of the non-performance based stock-based awards granted during the years ended December 31, 2006, 2005,2008, 2007, and 20042006 respectively:
| | 2008 | | 2007 | | 2006 |
| Risk-free interest rate | 2.25% | | 4.54% | | 4.81% |
| Expected life | 3.5 years | | 3.5 years | | 3.5 years |
| Expected volatility | 41.31% | | 50.87% | | 66.12% |
| | 2006 | | 2005 | | 2004 |
| Risk-free interest rate | 4.81% | | 3.79% | | 3.63% |
| Expected life | 3.5 | | 5 years | | 5 years |
| Expected volatility | 66.12% | | 100% | | 100% |
Stock Incentive Plan
In June 2004, the Board and stockholders approved the 2004 Plan. The 2004 Plan replaced the 1998 Stock Option Plan (the 1998 Plan) and the 2000 Omnibus Incentive Compensation Plan (the 2000 Plan). The 2004 Plan reserved an additional 893,916 shares for new awards as well as combined the remaining shares available under the 1998 Plan and 2000 Plan. The maximum number of shares that can be granted under the 2004 Plan is approximately 2.9 million shares. Eligible participants under the 2004 Plan include officers and other employees of the Company, members of the Board and outside consultants, as specified under the 2004 Plan and designated by the Compensation and Management Development Committee of the Board. Unless earlier terminated by action of the Board, the 2004 Plan will remain in effect until such time as no stock remains available for delivery under the 2004 Plan and the Company has no further rights or obligations under the 2004 Plan with respect to outstanding awards under the 2004 plan. No participant may be granted more than the annual limit of 400,000 shares plus the amount of the participant's unused annual limit relating to share-based awards as of the close of the previous year, subject to adjustment for splits and other extraordinary corporate events.
PDI, Inc.
Notes to the Consolidated Financial Statements (Continued)
(tabular information in thousands, except share and per share data)
StockHistorically, stock options arewere generally granted with an exercise price equal to the market value of the common stock on the date of grant, expireexpired 10 years from the date they are granted, and generally vestvested over a two-year period for members of the Board of Directors and three-year period for employees. Upon exercise, new shares are issued by the Company. The Company has not issued stock options since 2005. SARs are generally granted with a grant price equal to the market value of the common stock on the date of grant, vest one-third each year on the anniversary of the date of grant and expire five years from the date of grant. The restricted shares and restricted stock units generally have vesting periods that range from eighteen months to three years and are subject to accelerated vesting and forfeiture under certain circumstances.
On February 9, 2005,In November 2008, the Company acceleratedCompany’s chief executive officer was granted 140,000 restricted stock units and 280,000 performance contingent SARs. The restricted stock units will vest into shares of the Company’s common stock, equally in five installments, with the initial 20% of the units vesting immediately on the grant date and an additional 20% of all outstanding unvested underwater stock options. Accelerated stock options totaled 473,334the units vesting on each anniversary of the grant date over a four year period. The performance contingent SARs have an exercise price of $4.28, a seven year term to expiration, and impacted 43 employees and seven board members. Therea weighted average fair value of $0.86. The fair value estimate of the performance contingent SARs was no compensation expense recognized ascalculated by an accredited independent valuation consultant using a result of this acceleration. On December 30, 2005, priorMonte Carlo Simulation model. The performance contingent SARs are subject to the adoption of FAS 123R,same vesting schedule as the Company acceleratedrestricted stock units but are only exercisable if the vesting of 97,706following stock performance-based conditions are satisfied: (1) with respect to the initial 94,000 performance contingent SARs, and placed a restriction on the transfer or saleclosing price of the Company’s common stock received uponis at least $10.00 per share for 60 consecutive trading days anytime within five years from the exercise of thesegrant date; (2) with respect to the next 93,000 performance contingent SARs, that matched the original vesting scheduleclosing price of the SARs. This impacted 38 employeesCompany’s common stock is at least $15.00 per share for 60 consecutive trading days anytime within five years from the grant date; and resulted in $86,000 in compensation expense. The Company accelerated(3) with respect to the vesting of all outstanding unvested underwater stock options and SARs in 2005 to avoid recognizing compensation expense in future periods.
At January 1, 2006, the Company had a total of 43,104final 93,000 performance contingent sharesSARs, the closing price of itsthe Company’s common stock to be issued uponis at least $20.00 per share for 60 consecutive trading days anytime within five years from the attainment of all established performance goals by March 2008. There are three levels of performance for each business unit and at a corporate level that dictate the number of shares to be issued. Throughout 2005, the Company had recognized compensation expense related to this award on its expectation of the probability that the performance conditions would be satisfied. Based on the 2006 annual budget and future income projections prepared in the first quarter of 2006, the probability that the performance conditions, even at the marginal level, would be satisfied, was deemed remote and at March 31, 2006, the Company reversed approximately $60,000 of previously recognized compensation expense and discontinued recognizing any future expense associated with this award until such time as it is considered probable that the performance condition will be met. The Company has and will continue to reassess the probability of vesting of this award at each reporting period.grant date.
The weighted average fair value of options andnon-performance based SARs granted during the years ended December 31, 2006, 20052008, 2007 and 20042006 was estimated to be $6.31, $9.10$2.54, $3.97 and $19.26,$6.31 respectively. For the yearsyear ended December 31, 2006 2005 and 2004, the aggregate intrinsic values of options and SARs exercised under the Company’s stock option plans werewas approximately $130,000 $243,000, and $1.5 million respectively, determined as of the date of exercise. There were no exercises in 2007 or 2008. As of December 31, 2006,2008, there was $1.6$2.0 million of total unrecognized compensation cost, net of estimated forfeitures, related to unvested options, SARs and restricted stock that are expected to be recognized over a weighted-average period of approximately 1.92.5 years. Cash received from options exercised under the Company’s stock option plans for the years ended December 31, 2006 2005was $87,000. Historically, shares issued upon the exercise of options have been new shares and 2004have not come from treasury shares.
PDI, Inc.
Notes to the Consolidated Financial Statements (Continued)
(tabular information in thousands, except share and per share data)
The impact of stock options, SARs, performance shares and restricted stock on net (loss) income and cash flow for 2008, 2007 and 2006 was $87,000, $591,000, and $2.4 million, respectively.as follows:
| | | 2008 | | | 2007 | | | 2006 | |
| Stock options and SARs | | $ | 259 | | | $ | 455 | | | $ | 361 | |
| Conditional grant | | | - | | | | - | | | | 104 | |
| Common stock awards | | | 300 | | | | - | | | | - | |
| Performance awards | | | 9 | | | | 11 | | | | (60 | ) |
| Restricted stock | | | 1,052 | | | | 1,163 | | | | 1,198 | |
| | | | 1,620 | | | | 1,629 | | | | 1,603 | |
| Acceleration of vesting - restricted stock | | | 8 | | | | 54 | | | | 233 | |
| Forfeitures | | | (141 | ) | | | (207 | ) | | | (176 | ) |
| Total stock-based compensation expense | | | 1,487 | | | | 1,476 | | | | 1,660 | |
| Tax impact | | | (583 | ) | | | (565 | ) | | | (408 | ) |
| Reduction to net income | | $ | 904 | | | $ | 911 | | | $ | 1,252 | |
| | | | | | | | | | | | | |
| Increase (reduction) in cash flow | | | | | | | | | | | | |
| from operating activies | | $ | - | | | $ | 242 | | | $ | (23 | ) |
| (Reduction) increase in cash flow | | | | | | | | | | | | |
| from financing activies | | $ | - | | | $ | (242 | ) | | $ | 23 | |
A summary of option and SARs activity for the year ended December 31, 20062008 and changes during the year then ended is presented below:
| | | | | | Weighted- | | | | | | |
| | | | | | Average | | | Contractual | | | Intrinsic |
| | | Shares | | | Grant Price | | | Period (in years) | | | Value |
| Outstanding at January 1, 2008 | | | 646,825 | | | $ | 18.18 | | | | 4.18 | | | $ | 19 |
| Granted | | | 474,538 | | | | 5.69 | | | | 6.21 | | | | - |
| Forfeited or expired | | | (323,986 | ) | | | 12.54 | | | | | | | | |
| Outstanding at December 31, 2008 | | | 797,377 | | | | 13.04 | | | | 4.77 | | | | - |
| | | | | | | | | | | | | | | | |
| Exercisable at December 31, 2008 | | | 370,378 | | | $ | 21.40 | | | | 3.58 | | | $ | - |
A summary of the status of the Company’s nonvested SARs for the year ended December 31, 2008 and changes during the year ended December 31, 2008 is presented below:
| | | Shares | | | Weighted- Average Grant Date Fair Value |
| | | | | | |
| Nonvested at January 1, 2008 | | | 198,990 | | | $ | 4.71 |
| Granted | | | 474,538 | | | | 1.55 |
| Vested | | | (130,055 | ) | | | 3.19 |
| Forfeited | | | (172,925 | ) | | | 3.37 |
| Nonvested at December 31, 2008 | | | 370,548 | | | $ | 1.82 |
| | | | | | | | |
A summary of the Company’s outstanding shares of restricted stock and restricted stock units for the year ended December 31, 2008 and changes during the year then ended is presented below:
| | | | | Grant | | Contractual | | Intrinsic | |
| | | Shares | | Price | | Period (in years) | | Value | |
| Outstanding at January 1, 2006 | | | 1,381,096 | | $ | 26.20 | | | 6.58 | | $ | 494 | |
| Granted | | | 146,047 | | | 12.40 | | | 3.71 | | | - | |
| Exercised | | | (20,167 | ) | | 6.30 | | | | | | | |
| Forfeited or expired | | | (490,358 | ) | | 28.64 | | | | | | | |
| Outstanding at December 31, 2006 | | | 1,016,618 | | | 23.44 | | | 5.23 | | | 36 | |
| | | | | | | | | | | | | | |
| Exercisable at December 31, 2006 | | | 863,160 | | $ | 25.38 | | | 5.31 | | $ | 36 | |
A summary of the status of the Company’s nonvested options and SARs for the year ended December 31, 2006 and changes during the year ended December 31, 2006 is presented below:
PDI, Inc.
Notes to the Consolidated Financial Statements (Continued)
(tabular information in thousands, except share and per share data)
| | | Shares | | Weighted- Average Grant Date Fair Value | | | | | | Weighted- | | | Average | | | Aggregate |
| | | | | | | | | | | Average | | | Remaining | | | Intrinsic |
| Nonvested at January 1, 2006 | | | 53,501 | | $ | 8.26 | | |
| | | | | | | Grant Date | | | Vesting | | | Value |
| | | | Shares | | | Fair Value | | | Period (in years) | | | (in thousands) |
| Outstanding at January 1, 2008 | | | 213,964 | | | $ | 10.71 | | | 2.07 | | | $ | 2,005 |
| Granted | | | 146,047 | | | 6.31 | | | 298,388 | | | 6.33 | | | 2.90 | | | 1,197 |
| Vested | | | (29,999 | ) | | 7.59 | | | (79,668 | ) | | 11.15 | | | | | | | | |
| Forfeited | | | (19,258 | ) | | 6.18 | | | | (108,259 | ) | | | 8.83 | | | | | | | | |
| Nonvested at December 31, 2006 | | | 150,291 | | $ | 6.76 | | |
| Outstanding at December 31, 2008 | | | | 324,425 | | | $ | 7.20 | | | | 2.56 | | | $ | 1,301 |
| | | | | | | | | | | | | | | | | |
A summary of the Company’s outstanding shares of restricted stock for the year ended December 31, 2006 and changes during the year then ended is presented below:
| | | | | Weighted- | | Average | | | |
| | | | | Average | | Remaining | | Aggregate | |
| | | | | Grant | | Vesting | | Intrinsic | |
| | | Shares | | Price | | Period (in years) | | Value | |
| Outstanding at January 1, 2006 | | | 112,723 | | $ | 17.49 | | | 1.08 | | $ | 1,522 | |
| Granted | | | 155,418 | | | 12.31 | | | 1.73 | | | 1,806 | |
| Vested | | | (48,583 | ) | | 14.23 | | | | | | | |
| Forfeited | | | (22,820 | ) | | 14.38 | | | | | | | |
| Outstanding at December 31, 2006 | | | 196,738 | | $ | 14.57 | | | 1.31 | | $ | 2,286 | |
12.
14. | Related Party Transactions
|
The Company purchased certain print advertising for initial recruitment of representatives through a company that is wholly-owned by family members of the Company's largest stockholder. The amounts charged to the Company for these purchases totaled approximately $180,000 for the year ended December 31, 2004. The Company no longer used this vendor after December 31, 2004.
On April 27, 2005, the Company terminated its original 2001 stock repurchase plan. On May 2, 2005, the Company announced that its Board had authorized a plan to repurchase up to a million of its outstanding shares of common stock. The Company repurchased 996,900 shares in 2005 under that plan. The plan was terminated in 2006.
On November 7, 2006 the Company announced that its Board had authorized the Company to repurchase up to one million shares of its common stock. The Company may repurchase shares on the open market or in privately negotiated transactions, or both. Some or all of the repurchases, if any, may be made pursuant to a Company 10(b)5-1 Plan that the Company intends to adopt. Purchases, if any, will be made from the Company's available cash.
The number of shares repurchased as of December 31, 2006 is as follows:
| | | Average. Price | | Shares |
| Period | | Per Share | | Purchased |
| September 2001 | | $ 22.00 | | 5,000 |
| May 2005 | | $ 12.36 | | 226,900 |
| June 2005 | | $ 11.92 | | 353,330 |
| July 2005 | | $ 13.77 | | 315,570 |
| August 2005 | | $ 14.39 | | 101,100 |
| Total | | $ 12.90 | | 1,001,900 |
An additional 16,106 shares were delivered back to the Company and included in treasury stock for the payment of taxes resulting from the vesting of restricted stock.
PDI, Inc.
Notes to the Consolidated Financial Statements (Continued)
(tabular information in thousands, except share and per share data)
Significant Customers
During 2006, 20052008, 2007 and 20042006 the Company had several significant customers for which it provided services under specific contractual arrangements. The following sets forth the net service revenue generated by customers who accounted for more than 10% of the Company's service revenue during each of the periods presented.
| | | | Years Ended December 31, |
| Customer | | | 2008 | | | 2007 | | | 2006 |
| | A | | | $ | 31,697 | | | $ | 15,155 | | | $ | - |
| | B | | | | 15,304 | | | | - | | | | - |
| | C | | | | 12,072 | | | | 13,259 | | | | - |
| | D | | | | | | | | 15,992 | | | | |
| | E | | | | - | | | | - | | | | 68,240 |
| | F | | | | - | | | | - | | | | 43,603 |
| | | Years Ended December 31, | |
| Customer | | 2006 | | 2005 | | 2004 | |
| A | | $ | 68,240 | | $ | 69,452 | | $ | 76,744 | |
| B | | | 43,603 | | | 107,260 | | | 153,801 | |
| C | | | - | | | 48,051 | | | - | |
For the years ended December 31, 2006,2008, and 2004,2007, the Company had two largeCompany’s three largest customers, who each individually represented 10% or more of its service revenue; these customersrevenue, accounted for in the aggregate, approximately 46.8%52.5% and 66.4%37.9% respectively, of its service revenue. For the year ended December 31, 20052006 the Company’s threetwo largest customers, each of whom represented 10% or more of its service revenue, accounted for, in the aggregate, approximately 73.6%46.8% of its service revenue.
At December 31, 20062008 and 2005,2007, the Company’s two and three largest customers represented 11.7%71.7% and 56.6%21.4%, respectively, of the aggregate of outstanding service accounts receivable and unbilled services.
On March 21, 2007, the Company announced that a large pharmaceutical company customer had notified them of its intention not to renew its contract sales engagement with the Company upon its scheduled expiration on May 12, 2007. This contract, which had a one-year term, represented approximately $37 million in annual revenue.
On February 28, 2006, the Company announced that it has been notified by AstraZeneca that its fee-for-service agreements with the Company would be terminated effective April 30, 2006, reducing revenue by approximately $63.8 million in 2006.
On September 26, 2006, the Company announced that it had received verbal notification from GSK of its intention not to renew its contract sales engagement with the Company for 2007. The contract, which represented approximately $65 million to $70 million in revenue on an annual basis, expired as scheduled on December 31, 2006.
On October 25, 2006, the Company also announced that it had received notification from sanofi-aventis of its intention to terminate its contract sales engagement with the Company effective December 1, 2006. The contract, which represented approximately $18 million to $20 million in revenue on an annual basis, was previously scheduled to expire on December 31, 2006.
15. | Performance Based Contracts
|
In October 2000, the Company entered into an agreement (the Ceftin Agreement) with GSK for the exclusive U.S. sales, marketing and distribution rights for Ceftin® Tablets and Ceftin® for Oral Suspension, two dosage forms of a cephalosporin antibiotic, which agreement was terminated in February 2002 by mutual agreement of the parties. From October 2000 through February 2002, the Company marketed Ceftin to physicians and sold the products primarily to wholesale drug distributors, retail chains and managed care providers. Pursuant to the termination agreement, the Company agreed to perform marketing and distribution services through February 28, 2002. Customers who purchased the Company’s Ceftin product were permitted to return unused product, after approval from the Company, up to six months before and one year after the expiration date for the product, but no later than December 31, 2004. On March 31, 2004, the Company signed an agreement and waiver with a large wholesaler by which the Company agreed to pay that wholesaler $10.0 million, and purchase $2.5 million worth of services from that wholesaler by March 31, 2006, in exchange for that wholesaler waiving, to the fullest extent permitted by law, all rights with respect to any additional returns of Ceftin to the Company. In lieu of purchasing $2.5 million worth of services from the wholesaler, the Company entered into an agreement to provide services to affiliates of the wholesaler. The Company’s accrual for returns of $231,000 at December 31, 2006 consists almost entirely of amounts owed to that wholesaler. The accrual as recorded by the Company is its best estimate based on its understanding of its obligations.
On October 21, 2005,June 20, 2008, the Company announced the resignationretirement of Charles T. SaldariniMichael J. Marquard as vice chairman of the Board and chief executive officer. Mr. Saldarini also resignedofficer and as a member of the Company’s Board. As perboard of directors. In connection with his retirement, the terms of his employment agreement, Mr. Saldarini was entitled toCompany recorded approximately $2.8$0.9 million in cash and stock compensation expense in 2008. During 2008, the Company also announced the departure of one other executive vice president for which was recognized in the fourth quarter of 2005.it incurred
PDI, Inc.
Notes to the Consolidated Financial Statements (Continued)
(tabular information in thousands, except share and per share data)
On August 10, 2005, the Company announced that Bernard C. Boyle, the Company’s Chief Financial Officer would resign from his position with the Company effective December 31, 2005. The Company recognized approximately $1.6$0.3 million in additional compensation expense in the third quarter of 2005 as per the terms of his employment agreement. Effective December 31, 2005, the Company entered into an amended memorandum of understanding with the Company, pursuant to which Mr. Boyle deferred his resignation until March 31, 2006.expense.
The Company also announced the resignation of three other executive vice presidents during 2005 and one other executive vice president during 2006. The Company recognized charges of approximately $5.7$0.6 million and $573,000 related to executive resignations/settlements in 2005 and 2006, respectively. These amounts are shown separately within operating expenses on the consolidated statement of operations2006. There were no executive severance charges for the yearsyear ended December 31, 2005 and 2006.2007.
The Company recorded facility realignment charges totaling approximately $75,000, $1.0 million and $2.0 million during 2008, 2007 and $2.4 million during 2006, and 2005, respectively. These charges were for costs related to excess leased office space the Company has at its Saddle River, New Jersey and Dresher, Pennsylvania facilities. In 2007, the Company sub-leased the excess office space at its Saddle River, New Jersey location and also secured sub-leases for two of the three vacant spaces at its Dresher location. The Company is currently seeking to sublease the remaining excess spacesspace at both locations.its Dresher location. A summary of the significant components of the facility realignment charges for the two years ended December 31, 2006, 2007 and 2008 by segment is as follows:
| | | Sales | | | Marketing | | | | |
| 2006: | | Services | | | Services | | | Total | |
| Facility lease obligations | | $ | 803 | | | $ | (146 | ) | | $ | 657 | |
| Asset impairments (1) | | | 474 | | | | 821 | | | | 1,295 | |
| Total facility realignment charge | | $ | 1,277 | | | $ | 675 | | | $ | 1,952 | |
| 2007: | | | | | | | | | | | | |
| Facility lease obligations | | $ | (198 | ) | | $ | (82 | ) | | $ | (280 | ) |
| Asset impairments (1) | | | 1,020 | | | | 56 | | | | 1,076 | |
| Related charges | | | 225 | | | | - | | | | 225 | |
| Total facility realignment charge | | $ | 1,047 | | | $ | (26 | ) | | $ | 1,021 | |
| 2008: | | | | | | | | | | | | |
| Facility lease obligations | | $ | - | | | $ | 75 | | | $ | 75 | |
| Total facility realignment charge | | $ | - | | | $ | 75 | | | $ | 75 | |
| | | | | | | | | | | | | |
| (1) The asset impairments resulted in charges to the accumulated depreciation balance | |
| | | Sales | | Marketing | | | |
| | | Services | | Services | | Total | |
| 2005: | | | | | | | |
| Facility lease obligations | | $ | 1,057 | | $ | 1,297 | | $ | 2,354 | |
| Total facility realignment charge | | $ | 1,057 | | $ | 1,297 | | $ | 2,354 | |
| 2006: | | | | | | | | | | |
| Facility lease obligations | | $ | 803 | | $ | (146 | ) | $ | 657 | |
| Asset impairments (1) | | | 474 | | | 821 | | | 1,295 | |
| Total facility realignment charge | | $ | 1,277 | | $ | 675 | | $ | 1,952 | |
(1) The asset impairments resulted in changes to the accumulated depreciation balance.
The following table presents a reconciliation of the restructuring charges in 20052007 and 20062008 to the balance at December 31, 20062008 and 2005,2007, which is included in other accrued liabilitiesexpenses ($1.00.2 million and $1.2$0.3 million, respectively) and in other long-term liabilities ($1.30.4 million and $1.1$0.4 million, respectively):
| Balance as of December 31, 2004 | | $ | - | | |
| Facility realignment charge | | | 2,354 | | |
| | | | Sales | | | Marketing | | | | |
| | | | Services | | | Services | | | Total | |
| | | | | | | | | | | |
| Balance as of December 31, 2006 | | | $ | 1,549 | | | $ | 763 | | | $ | 2,312 | |
| Accretion | | | 11 | | | 10 | | | 21 | |
| Adjustments | | | (198 | ) | | (82 | ) | | (280 | ) |
| Payments | | | (19 | ) | | (1,089 | ) | | (289 | ) | | (1,378 | ) |
| Balance as of December 31, 2005 | | $ | 2,335 | | |
| | | | | | |
| Balance as of December 31, 2007 | | | $ | 273 | | | $ | 402 | | | $ | 675 | |
| Accretion | | | 51 | | | 6 | | | 7 | | | 13 | |
| Adjustments | | | - | | | 75 | | | 75 | |
| Payments | | | (680 | ) | | | (87 | ) | | | (117 | ) | | | (204 | ) |
| Adjustments | | | 606 | | |
| Balance as of December 31, 2006 | | $ | 2,312 | | |
| Balance as of December 31, 2008 | | | $ | 192 | | | $ | 367 | | | $ | 559 | |
Charges for facility lease obligations relate to real estate lease contracts where the Company has exited certain space and is required to make payments over the remaining lease term (January 2016 and November 2016 for the Saddle River, New Jersey facility and for the Dresher, Pennsylvania facility, respectively). All lease termination amounts are shown net of projected sublease income. The chargecharges in 2008 pertained to a change in the estimated time it will take to sublet the remaining Dresher space. The charges in 2007 were primarily related to the exiting of the computer data center space at its Saddle River location as the Company is now outsourcing that capability. The charges in 2006 reflectreflected additional space exited as well as additional charges to reflect the softness of the real estate market in both areas as neither sublet despite actively marketing the spaces. Additionally, in 2006, the Company recorded an impairment charge related to leasehold improvements in both spaces as the Company determined it was unlikely that itthe Company will be able to recover the carrying value of these assets.
PDI, Inc.
Notes to the Consolidated Financial Statements (Continued)
(tabular information in thousands, except share and per share data)
Deferred tax assets and liabilities are determined based on the estimated future tax effects of temporary differences between the financial statements and tax bases of assets and liabilities, as measured by the current enacted tax rates. Deferred tax expense (benefit) is the result of changes in the deferred tax asset and liability.
The provision (benefit) for income taxes from continuing operations for the years ended December 31, 2008, 2007 and 2006 2005is comprised of the following:
| | | 2008 | | | 2007 | | | 2006 | |
| Current: | | | | | | | | | |
| Federal | | $ | 278 | | | $ | 465 | | | $ | (1,520 | ) |
| State | | | 266 | | | | 189 | | | | (1,914 | ) |
| Total current | | | 544 | | | | 654 | | | | (3,434 | ) |
| | | | | | | | | | | | | |
| Deferred: | | | | | | | | | | | | |
| Federal | | | 314 | | | | 1,058 | | | | 2,592 | |
| State | | | 17 | | | | 55 | | | | 118 | |
| Total deferred | | | 331 | | | | 1,113 | | | | 2,710 | |
| Provision for income taxes | | $ | 875 | | | $ | 1,767 | | | $ | (724 | ) |
Total income tax expense in 2008, 2007 and 2004 are summarized as follows:2006, including taxes associated with discontinued operations was $0.9 million, $1.8 million, and ($0.5) million, respectively.
| | | 2006 | | 2005 | | 2004 | |
| Current: | | | | | | | |
| Federal | | $ | (1,520 | ) | $ | (5,867 | ) | $ | 3,320 | |
| State | | | (1,914 | ) | | (379 | ) | | 1,904 | |
| Total current | | | (3,434 | ) | | (6,246 | ) | | 5,224 | |
| | | | | | | | | | | |
| Federal | | | 2,592 | | | 3,662 | | | 8,039 | |
| State | | | 118 | | | 2,785 | | | 1,160 | |
| Total deferred | | | 2,710 | | | 6,447 | | | 9,199 | |
| Provision for income taxes | | $ | (724 | ) | $ | 201 | | $ | 14,423 | |
The deferred income taxes reflect the net tax effects of temporary differences between the bases of assets and liabilities for financial reporting purposes and their bases for income tax purposes. The tax effects of significant items comprising the Company’s deferred tax assets and (liabilities) as of December 31, 20062008 and 20052007 are as follows:
| | | 2008 | | | 2007 | |
| Current deferred tax assets (liabilities) | | | | | | |
| included in other current assets: | | | | | | |
| Allowances and reserves | | $ | 4,931 | | | $ | 1,402 | |
| Compensation | | | 3,022 | | | | 905 | |
| Valuation allowance on deferred tax assets | | | (7,953 | ) | | | (2,307 | ) |
| | | | - | | | | - | |
| Noncurrent deferred tax assets (liabilities) | | | | | |
| included in other long-term assets: | | | | | | | | |
| State net operating loss carryforwards | | | 3,171 | | | | 2,221 | |
| Federal net operating loss carryforwards | | | 10,218 | | | | 3,148 | |
| State taxes | | | 1,052 | | | | 1,066 | |
| Compensation | | | (474 | ) | | | - | |
| Equity investment | | | 135 | | | | 128 | |
| Self insurance and other reserves | | | 1,736 | | | | 1,940 | |
| Property, plant and equipment | | | 978 | | | | 178 | |
| Intangible assets | | | (681 | ) | | | (291 | ) |
| Other reserves - restructuring | | | 25 | | | | (64 | ) |
| Valuation allowance on deferred tax assets | | | (17,603 | ) | | | (9,439 | ) |
| | | | (1,443 | ) | | | (1,113 | ) |
| Net deferred tax liability | | $ | (1,443 | ) | | $ | (1,113 | ) |
| | | | | | | | | |
| | | 2006 | | 2005 | |
| Current deferred tax assets (liabilities) | | | | | |
| included in other current assets: | | | | | | | |
| Allowances and reserves | | $ | 1,580 | | $ | 2,001 | |
| Contract costs | | | 31 | | | 2,394 | |
| Compensation | | | 835 | | | 717 | |
| Valuation allowance on deferred tax assets | | | (2,446 | ) | | (2,402 | ) |
| - | | | | | | 2,710 | |
| Noncurrent deferred tax assets (liabilities) | | | |
| included in other long-term assets: | | | | | | | |
| Property, plant and equipment | | | (1,133 | ) | | (1,631 | ) |
| State net operating loss carryforwards | | | 2,048 | | | 1,955 | |
| State taxes | | | 1,016 | | | 1,731 | |
| Intangible assets | | | (172 | ) | | 3,088 | |
| Equity investment | | | 505 | | | 509 | |
| Self insurance and other reserves | | | 2,703 | | | 1,766 | |
| Other accruals | | | (629 | ) | | - | |
| Valuation allowance on deferred tax assets | | | (4,338 | ) | | (7,418 | ) |
| - | | | | | | - | |
| Net deferred tax asset | | $ | - | | $ | 2,710 | |
At December 31, 2006 and 2005, the Company had a valuation allowance of approximately $6.8 million and $9.8 million, respectively, related to the Company's net deferred tax assets that cannot be carried back.
The Company performs an analysis each year to determine whether the expected future income will more likely than not be sufficient to realize the deferred tax assets. The Company's recent operating results and projections of future income weighed heavily in the Company's overall assessment. As a result, the Company established a full federal and state valuation allowance for the net deferred tax assets at December 31, 20062008 and 2007 because the Company determined that it was more likely than not that these assets would not be realized. Similarly, atAt December 31, 2005,2008 and 2007, the Company establishedhad a federal and state valuation allowance for itsof approximately $25.6 million and $11.7 million, respectively, related to the Company's net deferred tax assets in excess of the benefit that could be realized from a net operating loss carryback. At December 31, 2006, the Company has approximately $40.8 million of state net operating loss carryforwards, which has a full valuation allowance at December 31, 2006. These state operating losses will begin to expire in 2010.assets.
PDI, Inc.
Notes to the Consolidated Financial Statements (Continued)
(tabular information in thousands, except share and per share data)
The noncurrent net deferred tax liability relates to tax amortization of the tax basis in goodwill associated with the Pharmakon acquisition. Prior to 2007, the Company included in net deferred tax assets, the deferred tax liability related to the Pharmakon acquisition. In the first quarter of 2007 the Company determined that this deferred tax liability would not be realizable for an indeterminate time in the future and consequently should not be included in net deferred tax assets for purposes of calculating the valuation allowance in any period. As a result, the Company increased the valuation allowance by $882,000 in the first quarter of 2007. The Company did not believe this increase was material to the results of operations or its financial position in 2007. The Company also believes that the additional valuation allowance that would have resulted as of December 31, 2006 was not material to the results of operations or the financial position of the Company in those years.
Federal tax attribute carryforwards at December 31, 2008, consist primarily of approximately $29.2 million of net operating losses and $339,000 of capital losses. In addition, the Company has approximately $63.5 million of state net operating losses carryforwards. The utilization of the federal carryforwards as an available offset to future taxable income is subject to limitations under federal income tax laws. If the federal net operating losses are not utilized, they begin to expire in 2027, and if the current state net operating losses are not utilized they begin to expire in 2009. The capital losses can only be utilized against capital gains and $339,000 will expire in 2009.
A reconciliation of the difference between the federal statutory tax rates and the Company's effective tax rate is as follows:
| | | 2006 | | 2005 | | 2004 | | 2008 | | 2007 | | 2006 |
| Federal statutory rate | | | 35.0 | % | | (35.0 | %) | | 35.0 | % | (35.0%) | | (35.0%) | | 35.0% |
| State income tax rate, net | | | | | | | | | | | | | | | |
| of Federal tax benefit | | | (11.0 | %) | | 17.9 | % | | 5.7 | % | 1.8% | | 1.0% | | (11.0%) |
| Meals and entertainment | | | 0.3 | % | | 0.7 | % | | 0.2 | % | 0.1% | | 0.4% | | 0.3% |
| Valuation allowance | | | (26.9 | %) | | 18.4 | % | | 0.9 | % | 34.1% | | 46.8% | | (26.9%) |
| Other non-deductible | | 0.9% | | 0.2% | | (2.0%) |
| Tax exempt income | | | (6.0 | %) | | (2.9 | %) | | (0.4 | %) | 0.0% | | (2.7%) | | (6.0%) |
| Other | | | 1.8 | % | | 2.7 | % | | - | | |
| Net change in Federal and state reserves | | 0.7% | | 10.8% | | 3.8% |
| Effective tax rate | | | (6.8 | %) | | 1.80 | % | | 41.40 | % | 2.6% | | 21.5% | | (6.8%) |
| | | | | | | |
The Company adopted the provisions of FIN48 on January 1, 2007. As a result of the implementation of FIN 48, the Company recognized no material adjustment in the liability for unrecognized income tax benefits. At the adoption date of January 1, 2007, the Company had $4.0 million of unrecognized tax benefits, all of which would affect its effective tax rate if recognized. At December 31, 2007, the Company had $4.1 million of unrecognized tax benefits, all of which would affect its effective tax rate if recognized.
Upon adoption of FIN 48, the Company’s income tax liabilities as of January 1, 2007 included a total of $4.0 million for unrecognized tax benefits, excluding approximately $925,000 of related accrued interest, and approximately $300,000 of related penalties. A reconciliation of the beginning and ending amount of unrecognized tax benefits, excluding accrued interest and penalties, is as follows:
| | | Unrecognized | |
| | | Tax Benefits | |
| Balance of unrecognized benefits as of January 1, 2007 | | $ | 4,027 | |
| Additions for tax positions related to the current year | | | 11 | |
| Additions for tax positions of prior years | | | 209 | |
| Reductions for tax positions of prior years | | | (137 | ) |
| Balance as of December 31, 2007 | | $ | 4,110 | |
| Reductions for tax positions of prior years | | | (157 | ) |
| Balance as of December 31, 2008 | | $ | 3,953 | |
| | | | | |
PDI, Inc.
Notes to the Consolidated Financial Statements (Continued)
(tabular information in thousands, except share and per share data)
The Company recognizes interest and penalties, if any, related to unrecognized tax benefits in income tax expense. As of December 31, 2008, the Company recognized approximately $504,000, respectively, of such interest expense as a component of its “Provision (benefit) for income taxes." The liability for unrecognized tax benefits included accrued interest of $1.8 million and $1.4 million at December 31, 2008 and January 1, 2008, respectively. The Company has approximately $265,000 and $300,000 of accrued liabilities or expense for penalties related to unrecognized tax benefits for the years ended December 31, 2008 and 2007, respectively.
The Company and its subsidiaries file a U.S. Federal consolidated income tax return and consolidated and separate income tax returns in numerous state and local tax jurisdictions. The following tax years remain subject to examination as of December 31, 2008:
| Jurisdiction | Tax Years |
| Federal | 2003-2007 |
| State and Local | 2002-2007 |
| |
The Company reached an agreement with the Internal Revenue Service (IRS) examiner in regards to the audit of the 2003, 2004 and 2005 tax years. The adjustments are not material to the Company's financial position, results of operations or cash flows. The Company does not anticipate a significant change to the total amount of unrecognized tax benefits within the next 12 months.
The Company is currently in the examination phase of a state and local income tax audit for the years 2003 through 2006, and expects this audit to be completed within the next 12 months with no material adjustments.
19.
| 18. | Historical Basic and Diluted Net (Loss)/Income per Share |
Historical basic and diluted net (loss)/income per share is calculated based on the requirements of SFAS No. 128, “Earnings Per Share.” A reconciliation of the number of shares used in the calculation of basic and diluted earnings per share for the years ended December 31, 2006, 20052008, 2007 and 20042006 is as follows:
| | | Years Ended December 31, |
| | | 2008 | | | 2007 | | | 2006 |
| | | | | | | | | |
| Basic weighted average number of common shares | | | 14,012 | | | | 13,940 | | | | 13,859 |
| Dilutive effect of stock options, SARs, and | | | | | | | | | | | |
| restricted stock | | | - | | | | - | | | | 135 |
| Diluted weighted average number | | | | | | | | | | | |
| of common shares | | | 14,012 | | | | 13,940 | | | | 13,994 |
| | | | | | | | | | | | |
| | | Years Ended December 31, | |
| | | 2006 | | 2005 | | 2004 | |
| | | (in thousands) | | (in thousands) | | (in thousands) | |
| Basic weighted average number of common shares | | | 13,859 | | | 14,232 | | | 14,564 | |
| Dilutive effect of stock options, SARs, and | | | | | | | | | | |
| restricted stock | | | 135 | | | - | | | 329 | |
| Diluted weighted average number | | | | | | | | | | |
| of common shares | | | 13,994 | | | 14,232 | | | 14,893 | |
Outstanding options at December 31, 2007 to purchase 372,441 shares of common stock with exercise prices of $7.70 to $83.69 were not included in the computation of historical and pro forma diluted net income per share because to do so would have been antidilutive, as a result of the Company’s net loss in 2007. In addition, there were 274,384 outstanding SARs with exercise prices $9.52 to $20.15 that were not included in the computation of earnings per share as a result of the Company’s net loss.
Outstanding options at December 31, 2006 to purchase 734,404 shares of common stock with exercise prices of $14.16 to $93.75 were not included in the 2006 computation of historical and pro forma diluted net income per share because the exercise prices of the options were greater than the average market price per share of the common stock and therefore, the effect would have been antidilutive. In addition, there were 81,856 outstanding SARs with exercise prices $12.52 to $20.15 that were not included in the 2006 computation of historical and pro forma diluted net income per share because the exercise prices of the options were greater than the average market price per share of the common stock and therefore, the effect would have been antidilutive.
Outstanding options at December 31, 2005 to purchase 1,271,890 shares of common stock with exercise prices of $5.21 to $93.75 per share were not included in the 2005 computation of historical and pro forma diluted net income per share because to do so would have been antidilutive, as a result of the Company’s net loss in 2005. Additionally, 109,206 SARs were outstanding at December 31, 2005, and were not included in the computation of earnings per share as a result of the Company’s net loss.
Outstanding options at December 31, 2004 to purchase 409,182 shares of common stock with exercise prices of $27.00 to $93.75 were not included in the 2004 computation of historical and pro forma diluted net income per share because the exercise prices of the options were greater than the average market price per share of the common stock and therefore, the effect would have been antidilutive.
PDI, Inc.
Notes to the Consolidated Financial Statements (Continued)
(tabular information in thousands, except share and per share data)
As announced in December 2005, theThe Company discontinued its MD&D business in the second quarter of 2006. The MD&D business included the Company’s MD&D contract sales and clinical sales teams and was previously reported in the sales services reporting segment. The MD&D businessThere was abandoned through the run off ofno activity within discontinued operations (i.e., to cease accepting new business but to continue to provide service under remaining contracts until they expirein 2007 or terminate). In accordance with FAS No. 144, operations must be abandoned prior to reporting them as discontinued operations. The last active contract within MD&D ended in the second quarter of 2006. All prior periods have been restated to reflect the treatment of this unit as a discontinued operation.2008. Summarized selected financial information for the discontinued operations is as follows:
| | | For the Year Ended December 31, 2006 |
| Revenue, net | | $ | 1,876 |
| | | | |
| Income from discontinued | | | |
| operations before income tax | | $ | 693 |
| Income tax expense | | | 259 |
| Net income from | | | |
| discontinued operations | | $ | 434 |
| | | | |
PDI, Inc.
Notes to the Consolidated Financial Statements (Continued)
(tabular information in thousands, except share and per share data)
| | | For the Year Ended December 31, | |
| | | 2006 | | 2005 | | 2004 | |
| Revenue, net | | $ | 1,876 | | $ | 14,210 | | $ | 18,647 | |
| | | | | | | | | | | |
| Income (loss) from discontinued | | | | | | | | | | |
| operations before income tax | | $ | 693 | | $ | (8,047 | ) | $ | 1,112 | |
| Income tax expense | | | 259 | | | - | | | 415 | |
| Net income (loss) from | | | | | | | | | | |
| discontinued operations | | $ | 434 | | $ | (8,047 | ) | $ | 697 | |
The Company reports under the following three segments, which excludes the MD&D reporting unit which is now reported as a discontinued operation:
Sales services segment - includes the Company’s Performance and Select Access teams. This segment uses teams to deliver services to a wide base; they have similar long-term average gross margins, contract terms, types of customers and regulatory environments. One segment manager oversees the operations of all of these units and regularly discusses the results of operations, forecasts and activities of this segment with the chief operating decision maker;
Marketing services segment - includes the Company’s marketing research and medical education and communication services. This segment is project driven; the units comprising it have a large number of smaller contracts, share similar gross margins, have similar customers, and have low barriers to entry for competition. There are many discrete offerings within this segment, including: accredited continuing medical education (CME), content development for CME, promotional medical education, marketing research and communications. One segment manager oversees the operations of all of these units and regularly discusses the results of operations, forecasts and activities of this segment with the chief operating decision maker; and
PDI products group (PPG) - includes revenues that were earned through the Company’s licensing and copromotion of pharmaceutical and MD&D products. There are currently no ongoing operations in this segment. Any business opportunities are reviewed by the chief executive officer and other members of senior management.
The accounting policies followed by the segments are described in Note 1, Nature of Business and Significant Accounting Policies. Corporate charges are allocated to each of the operating segments on the basis of total salary costs. Corporate charges include corporate headquarter costs and certain depreciation expenses. Certain corporate capital expenditures have not been allocated from the sales services segment to the other operating segments since it is impracticable to do so.
The Company reports under the following three segments:
Sales services segment – includes the Company’s Performance and Select Access teams. This segment uses teams to deliver services to a wide base; they have similar long-term average gross margins, contract terms, types of customers and regulatory environments. One segment manager oversees the operations of all of these units and regularly discusses the results of operations, forecasts and activities of this segment with the chief operating decision maker;
Marketing services segment – includes the Company’s marketing research and medical education and communication services. This segment is project driven; the units comprising it have a large number of smaller contracts, share similar gross margins, have similar customers, and have low barriers to entry for competition. There are many discrete offerings within this segment, including: accredited continuing medical education (CME), content development for CME, promotional medical education, marketing research and communications. The CME portion of this segment will be discontinued in 2009. Two unit managers oversee the operations of these units and regularly discuss the results of operations, forecasts and activities of this segment with the chief operating decision maker; and
Product commercialization segment – includes revenues and expenses associated with the Company’s licensing and co-promotion of pharmaceutical products. In 2008, this segment consisted of our current promotional agreement with Novartis. Any business opportunities are reviewed by the chief executive officer and other members of senior management.
PDI, Inc.
Notes to the Consolidated Financial Statements (Continued)
(tabular information in thousands, except share and per share data)
| | | Sales | | | Marketing | | | Product | | | | |
| | | Services | | | Services | | | Commercialization | | | Consolidated | |
| For the year ended December 31, 2008: | | | | | | | | | | | | |
| Revenue | | $ | 89,656 | | | $ | 23,872 | | | $ | (1,000 | ) | | $ | 112,528 | |
| Operating loss | | | (7,196 | ) | | | (3,070 | ) | | | (26,161 | ) | | | (36,427 | ) |
| Capital expenditures | | | 339 | | | | 60 | | | | - | | | | 399 | |
| Depreciation expense | | | 2,570 | | | | 652 | | | | 97 | | | | 3,319 | |
| Total assets | | | 112,469 | | | | 36,567 | | | | - | | | | 149,036 | |
| | | | | | | | | | | | | | | | | |
| For the year ended December 31, 2007: | | | | | | | | | | | | | | | | |
| Revenue | | $ | 86,766 | | | $ | 30,365 | | | $ | - | | | $ | 117,131 | |
| Operating loss | | | (13,918 | ) | | | (362 | ) | | | - | | | | (14,280 | ) |
| Capital expenditures | | | 870 | | | | 139 | | | | - | | | | 1,009 | |
| Depreciation expense | | | 3,477 | | | | 828 | | | | - | | | | 4,305 | |
| Total assets | | | 140,161 | | | | 39,393 | | | | - | | | | 179,554 | |
| | | | | | | | | | | | | | | | | |
| For the year ended December 31, 2006: | | | | | | | | | | | | | | | | |
| Revenue | | $ | 202,748 | | | $ | 36,494 | | | $ | - | | | $ | 239,242 | |
| Operating income | | | 33 | | | | 2,798 | | | | 3,082 | | | | 5,913 | |
| Capital expenditures | | | 1,508 | | | | 262 | | | | - | | | | 1,770 | |
| Depreciation expense | | | 3,671 | | | | 679 | | | | - | | | | 4,350 | |
| Total assets | | | 157,750 | | | | 43,886 | | | | - | | | | 201,636 | |
| | | For the Year Ended December 31, | |
| | | 2006 | | 2005 | | 2004 | |
| Revenue: | | | | | | | |
| Sales services | | $ | 202,748 | | $ | 270,420 | | $ | 313,784 | |
| Marketing services | | | 36,494 | | | 34,785 | | | 29,057 | |
| PPG | | | - | | | - | | | 2,956 | |
| Total | | $ | 239,242 | | $ | 305,205 | | $ | 345,797 | |
| Operating income (loss): | | | | | | | | | | |
| Sales services | | $ | 33 | | $ | (17,386 | ) | $ | 32,906 | |
| Marketing services | | | 2,798 | | | (1,186 | ) | | 1,535 | |
| PPG | | | 3,082 | | | (268 | ) | | (362 | ) |
| Total | | $ | 5,913 | | $ | (18,840 | ) | $ | 34,079 | |
| Reconciliation of income (loss) from operations to | | | | | | | | | | |
| income (loss) before income taxes: | | | | | | | | | | |
| Total income (loss) from operations | | | | | | | | | | |
| for operating groups | | $ | 5,913 | | $ | (18,840 | ) | $ | 34,079 | |
| Gain (loss) on investments | | | - | | | 4,444 | | | (1,000 | ) |
| Interest income, net | | | 4,738 | | | 3,190 | | | 1,779 | |
| Income (loss) before income taxes | | $ | 10,651 | | $ | (11,206 | ) | $ | 34,858 | |
| Capital expenditures: (1) | | | | | | | | | | |
| Sales services | | $ | 1,508 | | $ | 2,901 | | $ | 7,645 | |
| Marketing services | | | 262 | | | 2,881 | | | 433 | |
| PPG | | | - | | | - | | | - | |
| Total | | $ | 1,770 | | $ | 5,782 | | $ | 8,078 | |
| Depreciation expense: (1) | | | | | | | | | | |
| Sales services | | $ | 3,671 | | $ | 3,260 | | $ | 4,132 | |
| Marketing services | | | 679 | | | 550 | | | 627 | |
| PPG | | | - | | | - | | | 27 | |
| Total | | $ | 4,350 | | $ | 3,810 | | $ | 4,786 | |
| Total assets | | | | | | | | | | |
| Sales services | | $ | 157,750 | | $ | 148,642 | | $ | 179,754 | |
| Marketing services | | | 43,886 | | | 51,517 | | | 44,516 | |
| PPG | | | - | | | - | | | 435 | |
| Total | | $ | 201,636 | | $ | 200,159 | | $ | 224,705 | |
| | | | | | | | | | | |
| (1) Capital expenditures and depreciation expense do not include amounts for discontinued operations. |
| PDI, INC. |
| VALUATION AND QUALIFYING ACCOUNTS |
| YEARS ENDED DECEMBER 31, 2006, 2007 AND 2008 |
| | | | | | | | | | | | |
| | | Balance at | | | Additions | | | | (1) | | | Balance at |
| | | Beginning | | | Charged to | | | Deductions | | | end |
| Description | | of Period | | | Operations | | | Other | | | of Period |
| 2006 | | | | | | | | | | | | |
| Allowance for doubtful accounts | | $ | 778,407 | | | $ | 35,713 | | | $ | (778,407 | ) | | $ | 35,713 |
| Allowance for doubtful notes | | | 1,242,378 | | | | 38,051 | | | | (495,837 | ) | | | 784,592 |
| Tax valuation allowance | | | 9,820,101 | | | | - | | | | (3,035,884 | ) | | | 6,784,217 |
| Accrued product rebates, sales | | | | | | | | | | | | | | | |
| discounts and returns | | | 230,859 | | | | - | | | | - | | | | 230,859 |
| | | | | | | | | | | | | | | | |
| 2007 | | | | | | | | | | | | | | | |
| Allowance for doubtful accounts | | $ | 35,713 | | | $ | - | | | $ | (35,713 | ) | | $ | - |
| Allowance for doubtful notes | | | 784,592 | | | | 30,416 | | | | (159,163 | ) | | | 655,845 |
| Tax valuation allowance | | | 6,784,217 | | | | - | | | | 4,960,586 | | | | 11,744,803 |
| Accrued product rebates, sales | | | | | | | | | | | | | | | |
| discounts and returns | | | 230,859 | | | | - | | | | - | | | | 230,859 |
| | | | | | | | | | | | | | | | |
| 2008 | | | | | | | | | | | | | | | |
| Allowance for doubtful accounts | | $ | - | | | $ | - | | | $ | - | | | $ | - |
| Allowance for doubtful notes | | | 655,845 | | | | 30,500 | | | | - | | | | 686,345 |
| Tax valuation allowance | | | 11,744,803 | | | | - | | | | 13,811,001 | | | | 25,555,804 |
| Accrued product rebates, sales | | | | | | | | | | | | | | | |
| discounts and returns | | | 230,859 | | | | - | | | | - | | | | 230,859 |
| | | | | | | | | | | | | | | | |
| | | | | | | | | | | | | | | | |
| (1) Includes payments and actual write offs, as well as changes in estimates in the reserves and |
| the impact of acquisitions. |
| | | | | | | | | Schedule II | |
| | | | | | | | | | |
| | | | | | | | | | |
PDI, INC. | |
VALUATION AND QUALIFYING ACCOUNTS | |
YEARS ENDED DECEMBER 31, 2004, 2005 AND 2006 | |
| | | | | | | | | | |
| | | Balance at | | Additions | | (1) | | Balance at | |
| | | Beginning | | Charged to | | Deductions | | end | |
| Description | | of Period | | Operations | | Other | | of Period | |
2004 | | | | | | | | | |
| Allowance for doubtful accounts | | $ | 749,341 | | $ | 654,903 | | $ | (1,330,660 | ) | $ | 73,584 | |
| Allowance for doubtful notes | | | - | | | 500,000 | | | - | | | 500,000 | |
| Tax valuation allowance | | | 1,881,851 | | | 322,436 | | | - | | | 2,204,287 | |
| Inventory valuation allowance | | | 817,865 | | | - | | | (817,865 | ) | | - | |
| Accrued product rebates, sales | | | | | | | | | | | | | |
| discounts and returns | | | 22,810,826 | | | 1,676,000 | | | (20,171,058 | ) | | 4,315,768 | |
| | | | | | | | | | | | | | |
2005 | | | | | | | | | | | | | |
| Allowance for doubtful accounts | | $ | 73,584 | | $ | 713,669 | | $ | (8,847 | ) | $ | 778,407 | |
| Allowance for doubtful notes | | | 500,000 | | | 842,378 | | | (100,000 | ) | | 1,242,378 | |
| Tax valuation allowance | | | 2,204,287 | | | 9,318,890 | | | (1,703,076 | ) | | 9,820,101 | |
| Accrued product rebates, sales | | | | | | | | | | | | | |
| discounts and returns | | | 4,315,768 | | | 31,551 | | | (4,116,460 | ) | | 230,859 | |
| | | | | | | | | | | | | | |
2006 | | | | | | | | | | | | | |
| Allowance for doubtful accounts | | $ | 778,407 | | $ | 35,713 | | $ | (778,407 | ) | $ | 35,713 | |
| Allowance for doubtful notes | | | 1,242,378 | | | 38,051 | | | (495,837 | ) | | 784,592 | |
| Tax valuation allowance | | | 9,820,101 | | | - | | | (3,035,884 | ) | | 6,784,217 | |
| Accrued product rebates, sales | | | | | | | | | | | | | |
| discounts and returns | | | 230,859 | | | - | | | - | | | 230,859 | |
| | | | | | | | | | | | | | |
| | | | | | | | | | | | | | |
| (1) Includes payments and actual write offs, as well as changes in estimates in the reserves and |
| the impact of acquisitions. |