UNITED STATES
SECURITIES AND EXCHANGE COMMISSION
Washington, D.C.DC 20549

FORM 10-K

ANNUAL REPORT PURSUANT TO SECTION 13 OR 15(d) OF
THE SECURITIES EXCHANGE ACT OF 1934

For the fiscal year ended December 31, 20082010

Commission file number 0-24531

CoStar Group, Inc.
(Exact name of registrant as specified in its charter)

Delaware52-2091509
(State or other jurisdiction of incorporation or organization)(I.R.S. Employer Identification No.)

2 Bethesda Metro Center, 10th Floor
Bethesda, Maryland 20814
1331 L Street, NW, Washington, DC 20005
(Address of principal executive offices) (zip code)
 
(301) 215-8300(202) 346-6500
Registrant’s telephone number, including area code
(877) 739-0486
Registrant’s facsimile number, including area code

Securities registered pursuant to Section 12(b) of the Act:
Title of Each ClassName of Each Exchange on Which Registered
Common Stock, $.01 par valueNASDAQ Global Select Market

Securities registered pursuant to Section 12(g) of the Act:
None

Indicate by check mark if the registrant is a well-known seasoned issuer, as defined in Rule 405 of the Securities Act.  Yes ox   No xo

Indicate by check mark if the registrant is not required to file reports pursuant to Section 13 or Section 15(d) of the Exchange Act. Yes o   No x

Indicate by check mark whether the registrant: (1) has filed all reports required to be filed by Section 13 or 15(d) of the Securities Exchange Act of 1934 during the preceding 12 months (or for such shorter period that the registrant was required to file such reports), and (2) has been subject to such filing requirements of the past 90 days. Yes x   No o

Indicate by check mark whether the registrant has submitted electronically and posted on its corporate Web site, if any, every Interactive Data File required to be submitted and posted pursuant to Rule 405 of Regulation S-T (§232.405 of this chapter) during the preceding 12 months (or for such shorter period that registrant was required to submit and post such files.) Yes o   No o

Indicate by check mark if disclosure of delinquent filers pursuant to Item 405 of Regulation S-K is not contained herein, and will not be contained, to the best of registrant’s knowledge, in definitive proxy or information statements incorporated by reference in Part III of this Form 10-K or any amendment to this Form 10-K.  ox

Indicate by check mark whether the registrant is a large accelerated filer, an accelerated filer, a non-accelerated filer, or a smaller reporting company.  See the definitions of “large accelerated filer,” “accelerated filer” and “smaller reporting company” in Rule 12b-2 of the Securities Exchange Act of 1934.

Large accelerated filer  o
Accelerated filer  x
Non-accelerated filer  o
Smaller reporting company  o

Indicate by check mark whether the registrant is a shell company (as defined in Rule 12b-2 of the Exchange Act).  Yes  o No  x

Based on the closing price of the common stock on June 30, 20082010 on the Nasdaq Stock Market®,Market, Nasdaq Global Select Market®,Market, the aggregate market value of registrant’s common stock held by non-affiliates of the registrant was approximately $460$658 million.

As of February 17, 2009,18, 2011, there were 19,729,41920,761,799 shares of the registrant’s common stock outstanding.


DOCUMENTS INCORPORATED BY REFERENCE

Portions of the registrant’s definitive proxy statement, which is expected to be filed with the Securities and Exchange Commission within 120 days after the end of the registrant’s fiscal year ended December 31, 2008,2010, are incorporated by reference into Part III of this Report.

2

 
TABLE OF CONTENTS

PART I  
Item 1.34
Item 1A.1315
Item 1B.2022
Item 2.2022
Item 3.2023
Item 4.2023
   
PART II  
Item 5.2124
Item 6.2326
Item 7.2427
Item 7A.3644
Item 8.3744
Item 9.3744
Item 9A.3745
Item 9B.3846
   
PART III  
Item 10.3946
Item 11.3946
Item 12.3946
Item 13.3946
Item 14.3946
   
PART IV  
Item 15.3946
 4048
 4149
 F-1

23

 
PART I

Item 1.

(In this report, the words “we,” “our,” “us,” “CoStar” or the “Company” refer to CoStar Group, Inc. and its direct and indirect subsidiaries. This report also refers to our websites, but information contained on those sites is not part of this report.)

CoStar Group, Inc., a Delaware corporation, is the number one provider of information/information, marketing and analytic services  to the commercial real estate industry in the United States (“U.S.”(U.S.) and United Kingdom (“U.K.”(U.K.) based on the fact that we offer the most comprehensive commercial real estate database available, have the largest research department in the industry, provide more information/information, marketing and analytic services than any of our competitors and believe we generate more revenues than any of our competitors. CoStar’s integrated suite of services offers customers online access to the most comprehensive database of commercial real estate information, which has been researched and verified by our team of researchers, currently covering the U.S., as well as London and other parts of the U.K. and parts of France. Prior to 2007, CoStar operated within one segment. Due to the increased size, complexity and funding requirements associated with our international expansion, in 2007 we began to manageWe man age our business geographically in two operating segments, withsegments; our primary areas of measurement and decision-making beingare the U.S. and International, which includes the U.K. and France.

Since our founding in 1987, CoStar’s strategy has been to provide commercial real estate professionals with critical knowledge to explore and complete transactions by offering the most comprehensive, timely and standardized information on U.S. commercial real estate. As a result of our January 2003 acquisition of Focus Information Limited (now, CoStar U.K. Limited), June 2004 acquisition of Scottish Property Network, December 2006 acquisition of Grecam S.A.S., and February 2007 acquisition of Property Investment Exchange Limited, and July 2009 acquisition of Property and Portfolio Research, Inc. (“PPR”) and its wholly owned U.K. subsidiary, Property and Portfolio Research Ltd. (“PPR UK”), we have extended our offering of comprehensive commercial real estate information to include London and other parts of the U.K. and parts of France.  Information about CoStar’s revenues from, and long-lived assets located in, foreign countries is included in Notes 2 and 1211 to our consolidated financial statements. CoStar’s revenues, net income, assets and liabilities, broken out by segment are set forth in Note 1211 to our consolidated financial statements.  Information about risks attendant toassociated with our foreign operations is included in “Item 7A. Quantitative and Qualitative Disclosures about Market Risk.”

We deliver our content to our U.S. customers primarily via an integrated suite of online service offerings that includes information about space available for lease, comparable sales information, tenant information, information about properties for sale, internet marketing services, property information for clients’ websites, information about industry professionals and their business relationships, analytic information, data integration, and industry news.  We also provide market research and analysis for commercial real estate investors and lenders via our PPR service offerings, and portfolio and debt management and reporting capabilities through our Resolve Technology, Inc. (“Resolve Technology”) service offerings. We have created and are continually improving a standardized information platform where theth e commercial real estate industry and related businesses can continuously interact and easily facilitate transactions due to the efficient exchange of accurate information we have supplied.supply.

We have a number of assets that provide a unique foundation for our standardized platform, including the most comprehensive proprietary database in the industry; the largest research department in the industry; proprietary data collection, information management and quality control systems; a large in-house product development team; a broad suite of web-based information/information, marketing and analytic services; a large team of analysts and economists and a large base of clients. Our database has been developed and enhanced for more than 2123 years by a research department that makes thousands of daily database updates. In addition to our internal efforts to grow the database, we have obtained and assimilated over 5152 proprietary databases.

CoStar intendsWe intend to continue to grow itsour standardized platform of commercial real estate information/information, marketing and analytic services.  In 2004, CoStarwe began research for a 21-market U.S. expansion effort.  By the end of the first quarter of 2006, CoStarwe had successfully launched service in each of those 21 markets.  In addition, following our acquisition of National Research Bureau in January 2005, we launched various research initiatives as part of our expansion into real estate information for retail properties.  We launched the new retail component of our flagship product, CoStar Property Professional, in May 2006. In July 2006, we announced our intention to commence actively researching commercial properties in approximately 81 new Core Based Statistical Areas (“CBSAs”) across the U.S. in an efforte ffort to expand the geographical coverage of our service offerings, including our new retail service. In the fourth quarter of 2007, we released our CoStar Property Professional service in the 81 new CBSAs across the U.S. In 2008, we released CoStar Showcase, an internet marketing service that provides commercial real estate professionals the opportunity to make their listings accessible to all visitors to our public website, www.CoStar.com.websites, www.CoStar.com and www.showcase.com.

34

 
CoStarDuring the second half of 2009, as part of our strategy for providing subscribers with tools for conducting primary research and analysis on commercial real estate, we expanded subscribers’ capabilities to use our database of research-verified commercial property information to conduct in-depth analysis and generate online reports of trends in sales and leasing activity.  Furthermore, in July 2009, we added analytic and market forecasting services to our platform of research and marketing services with our acquisition of PPR, and in October 2009 we acquired Resolve Technology’s business intelligence and portfolio management software used by institutional real estate investment companies.

We also intendsintend to continue to grow and expand the coverage of itsour service offerings within the U.K.our International segment.  In December 2006, CoStar’sour U.K. Subsidiary,subsidiary, CoStar Limited, acquired Grecam S.A.S., a provider of commercial property information and market-level surveys, studies and consulting services, located in Paris, France.  In February 2007, CoStar Limited also acquired Property Investment Exchange Limited, a provider of commercial property information and operator of an online investment property exchange located in London, England.  Our July 2009 acquisition of PPR and PPR UK also expanded the market research capabilities of our U.K. operations.  Further information about CoStar’s acquisitions is included in Note 3 to our consolidated financial statements.

CoStar intends to integrate its U.K. and French operations more fully with its U.S. operations and eventually to introduce a consistent international platform of service offerings.  Further information about CoStar’sIn 2007, we introduced the “CoStar Group” as the brand encompassing our worldwide operations.

Following our acquisitions is includedof PPR and Resolve Technology in Note 3 to2009, we began integrating their respective product and service offerings with our consolidated financial statements.own, including the services we have successfully integrated following prior acquisitions.  We believe that our recent U.S. and International expansion and integration efforts have created a platform for long-term growth.

Our subscription-based information/marketinginformation services, consisting primarily of CoStar Property Professional, CoStar Tenant, CoStar COMPS Professional and FOCUS services, currently generate more then 90%than 94% of our total revenues. OurCoStar Property Professional, CoStar Tenant, and CoStar COMPS Professional are generally sold as a suite of similar services and comprise our primary service offering in our U.S. operating segment.  FOCUS is our primary service offering in our International operating segment. The majority of our contracts for our subscription-based information/marketinginformation services typically have a minimum term of one year and renew automatically. Upon renewal, many of the subscription contract rates may increasechange in accordance with contract provisions or as a result of contract renegotiations. To encourage clients to use our services regularly, we generally charge a fixed monthly amount for our subscription-based information services rather than fees based on actual system usage. Contract rates are generally based on the number of sites, number of users, organization size, the client’s business focus, geography and the number of services to which a client subscribes. Our subscription clients generally pay contract fees on a monthly basis, but in some cases may pay us on a quarterly or annual basis.

Industry Overview

The market for commercial real estate information and analysis is vast based on the variety, volume and value of transactions related to commercial real estate. Each transaction has multiple participants and multiple information requirements, and in order to facilitate transactions, industry participants must have extensive, accurate and current information.information and analysis. Members of the commercial real estate and related business community require daily access to current data such as space availability, properties for sale, rental rates, vacancy rates, tenant movements, sales comparables, supply, new construction, absorption rates and other important market developments to carry out their businesses effectively. Market research (including historical and forecast conditions) and applied analytics have also become instrumental to the suc cess of commercial real estate industry participants operating in the current economic environment. There is a strong need for an efficient marketplace, where commercial real estate professionals can exchange information, evaluate opportunities using standardized data and interpretive analyses, and interact with each other on a continuous basis.

5


A large number of parties involved in the commercial real estate and related business community make use of the services we provide in order to obtain information they need to conduct their businesses, including:

 Sales and leasing brokersGovernment agencies
 Property ownersMortgage-backed security issuers
 Property managersAppraisers
 Design and construction professionalsPension fund managers
 Real estate developersReporters
 Real estate investment trust managersTenant vendors
 Investment bankersBuilding services vendors
 Commercial bankersCommunications providers
 Mortgage bankersInsurance companies’ managers
 Mortgage brokersInstitutional advisors
 RetailersInvestors and asset managers

The commercial real estate and related business community generally has operated in an inefficient marketplace because of the fragmented approach to gathering and exchanging information within the marketplace. Various organizations, including hundreds of brokerage firms, directory publishers and local research companies, collect data on specific markets and develop software to analyze the information they have independently gathered. This highly fragmented methodology has resulted in duplication of effort in the collection and analysis of information, excessive internal cost and the creation of non-standardized data containing varying degrees of accuracy and comprehensiveness, resulting in a formidable information gap.
4


The creation of a standardized information platform for commercial real estate requires an infrastructure including a standardized database, accurate and comprehensive research capabilities, experienced analysts, easy to use technology and intensive participant interaction. By combining itsour extensive database, approximately 900957 researchers and outside contractors, our experienced team of analysts and economists, technological expertise and broad customer base, CoStar believeswe believe that it haswe have created such a platform.

The U.S. and global economies have changed adversely over the past year or more, and the commercial real estate industry has been negatively impacted.  The commercial real estate market has seen a reduction in property sales and leasing activity, lower absorption rates, climbing vacancy rates and decreases in rental rates and sales prices.  The full extent of the impact of our current financial crisis is not yet clear.  As our customers continue to look for ways to reduce spending, we may continue to see reduced demand for our information/marketing services.  However, we believe that even in a weakened economy there is a continuing need for accurate, standardized commercial real estate information/marketing services.  We believe that access to continuously researched verified commercial real estate information becomes even more valuable in a down market, as industry players assess where market conditions are heading, how their businesses should adapt, determine what properties are worth, and try to market their properties, among other things.  Moreover, outsourcing the labor-intensive task of conducting basic real estate research may result in cost savings for our clients.

CoStar’s Comprehensive Database

CoStar has spent more than 2123 years building and acquiring a database of commercial real estate information, which includes information on leasing, sales, comparable sales, tenants, and demand statistics, as well as digital images.

As of January 30, 2009,31, 2011, our database of real estate information covered the U.S., as well as London, England and other parts of the U.K. and parts of France, and contained:


More than 1.1Approximately 1.5 million sale and lease listings;
Over 3.2Approximately 4.0 million total properties;
Over 8.9Approximately 11.1 billion square feet of sale and lease listings;
Over 5.7Approximately 8.9 million tenants;
More than 1.3Approximately 1.8 million sales transactions valued in the aggregate at over $3.1approximately $3.7 trillion; and
Approximately 7.611.2 million digital attachments, including building photographs, aerial photographs, plat maps and floor plans.

This highly complex database is comprised of hundreds of data fields, tracking such categories as:

 LocationMortgage and deed information
 Site and zoning informationFor-sale information
 Building characteristicsIncome and expense histories
 Space availabilityTenant names
 Tax assessmentsLease expirations
 OwnershipContact information
 Sales and lease comparablesHistorical trends
 Space requirementsDemographic information
 Number of retail storesRetail sales per square foot

6

CoStar Research

We have developed a sophisticated data collection organization utilizing a multi-faceted research process. In 2008,2010, our full time researchers and contractors drove millions of miles, conducted hundreds of thousands of on-site building inspections, and conducted millions of interviews of brokers, owners and tenants.

Research Department. As of January 30, 2009,31, 2011, we havehad approximately 900957 commercial real estate research professionals and outside contractors performing research.  Our research professionals undergo an extensive training program so that we can maintain consistent research methods and processes throughout our research department. Our researchers collect and analyze commercial real estate information through millions of phone calls, e-mails, internet updates and faxes each year, in addition to field inspections, public records review, news monitoring and direct mail. Each researcher is responsible for maintaining the accuracy and reliability of database information. As part of their update process, researchers develop cooperative relationships with industry professionals thatt hat allow them to gather useful information. Because of the importance commercial real estate professionals place on our data and our prominent position in the industry, many of these professionals routinely take the initiative and proactively report available space and transactions to our researchers.
5


CoStar has an extensive field research effort that includes physical inspection of properties in order to research new markets, find additional inventory, photograph properties and verify existing information.

CoStar utilizes 147144 high-tech field research vehicles in 41 states and the U.K. Of these vehicles, 10098 are custom-designed energy efficient hybrid cars that are equipped with computers, proprietary Global Positioning System tracking software, high resolution digital cameras and handheld laser instruments to help precisely measure buildings, geo-code them and position them on digital maps.  Some of our researchers also use custom-designed trucks with the same equipment as well as pneumatic masts that extend up to an elevation of twenty-five feet to allow for unobstructed building photographs from “birds-eye” views.  Each CoStar vehicle uses wireless technology to track and transmit field data. A typical site inspection consists of photographing the building, measuring the building, geo-coding the building , capturing “For Sale” or “For Lease” sign information, counting parking spaces, assessing property condition and construction, and gathering tenant information. Certain researchers canvass properties, interviewing tenants suite by suite. In addition, many of our field researchers are photographers who take photographs of commercial real estate properties to add to CoStar’s database of digital images.

Data and Image Providers. We license a small portion of our data and images from public record providers and third party data sources. Licensing agreements with these entities provide for our use of a variety of commercial real estate information, including property ownership, tenant information, demographic information, maps and aerial photographs, all of which enhance various CoStar services. These license agreements generally grant us a non-exclusive license to use the data and images in the creation and supplementation of our information/information, marketing and analytic services and include what we believe are standard terms, such as a contract term ranging from one to five years, automatic renewal of the contract and fixed periodic license fees or a combination of fixed periodic licenselic ense fees plus additional fees based upon our usage.

Management and Quality Control Systems. Our research processes include automated and non-automated controls to ensure the integrity of the data collection process. A large number of automated data quality tests check for potential errors, including occupancy date conflicts, available square footage greater than building area, typical floor space greater than land area and expired leases. We also monitor changes to critical fields of information to ensure all information is kept in compliance with our standard definitions and methodology. Our non-automated quality control procedures include:

·  calling our information sources on recently updated properties to re-verify information;
·  reviewing calls our researchers made to their industry contacts to ensure data reported to the researcher is  entered correctly into the database;
·  performing periodic research audits and field checks to determine if we correctly canvassed buildings;
·  providing training and retraining to our research professionals to ensure accurate data compilation; and
·  compiling measurable performance metrics for research teams and managers for feedback on data quality.

Finally, one of the most important and effective quality control measures we rely on is feedback provided by the commercial real estate professionals using our data every day.
7


Proprietary Technology

As of January 30, 2009,31, 2011, CoStar had a staff of 90154 product development, database and network professionals.  CoStar’s information technology professionals focus on developing new services for our customers and delivering research automation tools that improve the quality of our data and increase the efficiency of our research analysts.

6

Our information technology team is responsible for developing and maintaining CoStar products,services, including CoStar Property Professional, CoStar Property Express, CoStar COMPS, CoStar Tenant, CoStar Showcase, CoStar Commercial MLS, and CoStar Connect, as well as our international products.  In 2006, CoStar released a major upgrade to its CoStar COMPS service that provides customers with over 100 improvements, including access to for sale information, aerialsFOCUS, SPN, Shopproperty, PPR products and enhanced mapping.  In 2007, to better support our retail customers, we added significant features to CoStar Property Professional including tenant proximityservices, and demographic search capability, mapping layers, detailed retail tenant informationResolve Portfolio Maximizer and demographics.Request.  In 2008, CoStar released CoStar Showcase, an internet marketing service that provides commercial real estate professionals the opportunity to make their listings accessible to all visitors to our public website, websites, www.CoStar.com. CoStar has also begun development and www.showcase.com.  In 2009, we expanded subscribers’ capabilities to use CoStar’s database of an international platform, which will allow CoStarresearch-verified commercial property information to offer CoStar Property Professionalconduct in-depth analysis and generate reports on trends in international countries.sales and leasing activity online. In 2010, we launched Showcase in the U.K. via www.Showcase.co.uk. 

Our information technology team is responsible for developing the infrastructure necessary to support CoStar’s business processes, our comprehensive database of commercial real estate information/information, marketing and analytic services and our extensive image library. The team implements technologies and systems that introduce efficient workflows and controls that increase the production capacity of our research teams and improve the quality of our data.  Over the years, the team has developed data collection and quality control mechanisms that we believe are unique to the commercial real estate industry. The team continues to develop and modify our enterprise information management system that integrates CoStar sales, research, field research, customer support and accounting information.  We use this system to maintainmain tain our commercial real estate research information, manage contacts with the commercial real estate community, provide research workflow automation and conduct daily automated quality assurance checks. In addition, our information technology team has also developed fraud-detection technology to detect and prevent unauthorized access to our services.

Our information technology professionals also maintain the servers and network components necessary to support CoStar services and research systems.  Our encrypted virtual private network provides remote researchers and salespeople secure access to CoStar applications and network resources. CoStar maintains a comprehensive data protection policy that provides for use of encrypted data fields and off-site storage of all system backups, among other protective measures.  CoStar’s services are continually monitored in an effort to ensure our customers fast and reliable access.

Services

Our suite of information/information, marketing and analytic services is branded and marketed to our customers. Our services are derived from a database of building-specific information and offer customers specialized tools for accessing, analyzing and using our information. Over time, we expect to continue to enhance our existing information/information, marketing and analytic services and develop additional services that make use of our comprehensive database to meet the needs of our existing customers as well as potential new categories of customers.

Our various information/information, marketing and analytic services are described in detail in the following paragraphs as of January 30, 2009:31, 2011:

CoStar Property Professional®   CoStar Property Professional, or “CoStar Property,” is the Company’s flagship service. It provides subscribers a comprehensive inventory of office, industrial, retail and multifamily properties and land in markets throughout the U.S., including for-lease and for-sale listings, historical data, building photographs, maps and floor plans. Commercial real estate professionals use CoStar Property to identify available space for lease, evaluate leasing and sale opportunities, value assets and position properties in the marketplace. Our clients also use CoStar Property to analyze market conditions by calculating current vacancy rates, absorptionabs orption rates or average rental rates, and forecasting future trends based on user selected variables. CoStar Property provides subscribers with powerful map-based search capabilities as well as a user controlled, password protected extranet (or electronic “file cabinet”) where brokers may share space surveys and transaction-related documents online, in real time, with team members. When used together with CoStar Connect, CoStar Property enables subscribers to share space surveys and transaction-related documents with their clients, accessed through their corporate website. CoStar Property, along with all of CoStar’s other core information/information, marketing and analytic services, areis delivered solely via the internet.

8

CoStar COMPS Professional®   CoStar COMPS Professional, or “COMPS Professional,” provides comprehensive coverage of comparable sales information in the U.S. commercial real estate industry. It is the industry’s most comprehensive database of comparable sales transactions and is designed for professionals who need to research property comparables, identify market trends, expedite the appraisal process and support property valuations. COMPS Professional service offers subscribers numerous fields of property information, access to support documents (e.g., deeds of trust) for new comparables, demographics and the abilitya bility to view for-sale properties alongside sold properties in three formats – plotted on a map, aerial image or in a table.

7

CoStar Tenant® CoStar Tenant is a detailed online business-to-business prospecting and analytical tool providing commercial real estate professionals with the most comprehensive commercial real estate-related U.S. tenant information available. CoStar Tenant profiles tenants occupying space in commercial buildings across the U.S. and provides updates on lease expirations - one of the service’s key features - as well as occupancy levels, growth rates and numerous other facts. Delivering this information via the internet allows users to target prospective clients quickly through a searchable database that identifies only those tenants meeting certain criteria.

CoStar Showcase®   CoStar Showcase offers commercial real estate professionals a simple way to get their for salefor-sale and for leasefor-lease listings in front of a broad internet audience who search on Google,TM, Yahoo,® Bing, Showcase.com and Costar.com to find commercial properties.  When customers sign up for CoStar Showcase, their listings become accessible to visitors to Showcase.com and Costar.com, who can search those listings for free.  To drive traffic to CoStar Showcase subscriber listings, CoStar invests in Google,TM Yahoo and Yahoo®Bing keyword based pay-per-click advertising to capture the high volume traffic of users actively searching for commercial properties on those search engines.engin es.  As part of their CoStar Showcase subscription, subscribers also receive customized websites for each of their brokers that displays their bio, photo, contact information and updated listings that they can use to promote their services. CoStar Showcase can be purchased as a firm-wide annual subscription by firms who want all of their brokers to be able to access the service, or it can be purchased by individual brokers on a month-to-month basis.  When individual brokers sign up for CoStar Showcase, they also receive access to CoStar Commercial MLS (described below).

CoStar Property Express® CoStar Property Express provides access, via an annual subscription, to a “light” or scaled down version of CoStar Property. Commercial real estate professionals use CoStar Property Express to look up and search for leasefor-lease and for salefor-sale listings in CoStar’s comprehensive national database. CoStar Property Express provides base building information, photos, floor plans, maps and a limited number of reports.

CoStar Listings Express®   CoStar Listings Express provides access via an annual subscription to a listings only version of CoStar Property Express.  Commercial real estate professionals use CoStar Listings Express to look up and search for lease and for sale listings in CoStar’s comprehensive national database.  CoStar Listings Express provides base building information, photos, floor plans, maps and a limited number of reports on only properties that are either for lease or for sale.  CoStar Listings Express does not provide information on fully leased properties, as found in CoStar Property Professional and CoStar Property Express.

CoStar COMPS Express®   CoStar COMPS Express provides users with immediate, subscription free access with payment by credit card to the CoStar COMPS Professional system on a report-by-report basis. Subscribers also use this on-demand service to research comparable sales information outside of their subscription markets.

CoStar Connect® CoStar Connect allows commercial real estate firms to license CoStar’s technology and information to market their U.S. property listings on their corporate websites. Customers enhance the quality and depth of their listing information through access to CoStar’s database of content and digital images. The service automatically updates via the CoStar Property database and manages customers’ online property information, providing comprehensive listings coverage and significantly reducing the expense of building and maintaining their websites’ content and functionality.

CoStar Commercial MLS® CoStar Commercial MLS is the industry’s most comprehensive collection of researched for sale listings.  CoStar Commercial MLS draws upon CoStar’s large database of digital images and includes office, industrial, multifamily and retail properties, as well as shopping centers and raw land.  CoStar Commercial MLS represents an efficient means for sellers to market their properties to a large audience and for buyers to easily identify target properties.

9

CoStar Advertising® CoStar Advertising offers property owners a highly targeted and cost effective way to market a space for lease or a property for sale directly to the individuals looking for that type of space through interactive advertising. Our advertising model is based on varying levels of exposure, enabling the advertiser to target as narrowly or broadly as its budget permits. With the CoStar Advertising program, when the advertiser’s listings appear in a results set, they receive priority positioning and are enhanced to stand out. The advertiser can also purchase exposure in additional submarkets, or the entire market area so that this ad will appear even when this listing would not be returned in a results set.

8

CoStar Professional Directory®   CoStar Professional Directory, a service available exclusively to CoStar Property Professional subscribers, provides detailed contact information for approximately 1.11.4 million commercial real estate professionals, including specific information about an individual’s current and prior activities such as completed transactions, current landlord representation assignments, sublet listings, major tenants and owners represented and local and national affiliations.  Commercial real estate brokers can input their biographical information and credentials and upload their photo to create personal profiles.  SubscribersSubsc ribers use CoStar Professional Directory to network with their peers, identify and evaluate potential business partners, and maintain accurate mailing lists of other industry professionals for their direct mail marketing efforts.

CoStar Market Report™   The CoStar Market Report provides in-depth current and historical analytical information covering office, industrial and retail properties across the U.S.  Published quarterly, each market report includes details such as absorption rates, vacancy rates, rental rates, average sales prices, capitalization rates, existing inventory and current construction activity. This data is presented using standard definitions and calculations developed by CoStar, and offers real estate professionals critical and unbiased information necessary to make intelligent commercial real estate decisions. CoStar Market Reports are available to CoStar Property Professional subscribers at no additional charge, and are available for purchase by non-subscribers.charge.

Metropolis™   The Metropolis service is a single interface that combines commercial real estate data from multiple information providers into a comprehensive resource. The Metropolis service allows a user to input a property address and then view detailed information on that property from multiple information providers, including CoStar services. This technology offers commercial real estate professionals a simple and convenient solution for integrating a wealth of third party information and proprietary data, and is currently available for the Southern California markets.
PPR®   Our subsidiary PPR, and its U.K. subsidiary, PPR UK, offer products and services designed to meet the research needs of commercial real estate investors and lenders. PPR covers metropolitan areas throughout the United States, the U.K., and Europe, with offerings including historical and forecast market data and analysis by market and property type, and services including access to PPR’s analysts, economists, and strategists to develop and deliver custom research solutions.  Key tools include analysis of underlying property data, assessment of current market fundamentals, forecasts of future market performance, and credit default models.
PPR Portal™ is PPR’s primary delivery platform for research, forecasts, analytics, and granular data surrounding a specific address and property type. Information is organized around clearly defined tabs, for ease of access. The information is presented in written, table data, graphic, and map formats, and can easily be downloaded by the user for integration into their own analytical framework.  PPR’s Portal is used by lenders, investors, and owners to identify and price investment opportunities, manage assets and portfolios, and source and service capital.
PPR COMPASS™ is PPR’s premier commercial real estate risk management tool. It allows users to calculate Probability of Default, Loss Given Default, Expected Loss, and Confidence Interval (of Expected Loss) results for a loan or a portfolio. It provides direct comparisons of credit risk and refinance risk across Time, Market, Property Type, and Loan Structure for all macroeconomic forecast scenarios.   COMPASSCRE is used by lenders, issuers, ratings agencies, and regulators to estimate required loss reserves and economic capital, target lending opportunities, set pricing strategy, objectively compare/price loans, more effectively allocate capital, and manage re finance risk.
Resolve Portfolio Maximizer® Resolve Portfolio Maximizer is an industry leading real estate portfolio management software solution. Resolve Portfolio Maximizer allows users to model partnership structures, calculate waterfall distributions and fees, model and analyze debt obligations, and create multiple “what if” scenarios for alternative investment decisions.
10

Request™   Request is the first business intelligence software solution built specifically for managing commercial real estate investments. Request helps users eliminate some of the difficulties of consolidating real estate investment data from disparate sources and facilitates standardization of information presentation and reporting across an organization. Request also provides a platform for users to develop business intelligence and reporting capabilities.

FOCUS™   CoStar’s U.K. subsidiary, CoStar UKU.K. Limited, offers several services, theservices; its primary of whichservice is FOCUS. FOCUS is a digital online service offering information on the U.K. commercial real estate market. This service seamlessly links data on individual properties and companies across the U.K., including comparable sales, available space, requirements, tenants, lease deals, planning information, socio-economics and demographics, credit ratings, photos and maps.

Showcase.co.uk   Showcase.co.uk offers commercial real estate professionals a simple way to get their for-sale and for-lease listings in front of a broad internet audience who search on Google, Yahoo, Bing, and Showcase.co.uk to find commercial properties.  When customers sign up for Showcase.co.uk, their listings become accessible to visitors to www.Showcase.co.uk and other CoStar URLs who can search those listings for free.  To drive traffic to Showcase.co.uk subscriber listings, CoStar UK Limited invests in Google, Yahoo and Bing keyword based pay-per-click advertising to capture the high volume traffic of users actively searching for commercial properties on those search engines.  As part of their Showcase.co.uk subscription, subscribers also re ceive customized websites for each of their brokers that displays their bio, photo, contact information and updated listings that they can use to promote their services. Showcase.co.uk is available as a firm-wide annual subscription by firms who want all of their brokers to be able to access the service or can be purchased by a single location of a national firm on an annual subscription basis.

SPN™   SPN provides users online access to a comprehensive database of information for properties located in Scotland, including available space, comparable sales and lease deals.

Propex™ Propex gives users access to the commercial property investment market. It is used by U.K. investment agencies and professional investors and is a secure online exchange through which investment deals may be introduced. It is a primary channel for the distribution of live transaction data and property research data in the U.K. investment market.  Propex also provides private investors with a gateway into the commercial property investment market. It is a free-access listing website, which provides details of commercial property investments. It is used by U.K. agencies to sell investments suitable for the private investor.

Shopproperty.co.uk™   Shopproperty is a listing database of available retail units across the U.K. on a free-access website.  Shopproperty.co.uk is the only specialist listing website with fully licensed Goad street-trader plans.

Grecam™   Our French subsidiary, Grecam S.A.S., provides commercial real estate information throughout the Paris region through its Observatoire Immobilier D’ Entreprise (“OIE”) service offering.  The OIE service provides commercial property availability and transaction information to its subscribers through both an online service and market reports.

Clients

We draw clients from across the commercial real estate and related business community. Commercial real estate brokers have traditionally formed the largest portion of CoStar clients, however, we also provide services to owners, landlords, financial institutions, retailers, vendors, appraisers, investment banks, governmental agencies, and other parties involved in commercial real estate. The following chart lists U.S. and U.K. clients that are well known or have the highest annual subscription fees in each of the various categories, each as of January 30, 2009.
31, 2011.
 
911

 
Brokers Lenders, Investment Bankers 
Institutional Advisors, Asset Managers
 CB Richard Ellis
 
 Capmark — U.K.Deutsche Bank
 
 BlackRock
 CB Richard Ellis — U.K.
 
 Deutsche BankWells Fargo
 
 Prudential
 Colliers
 
 Wells FargoJP Morgan Chase Bank
 
 Prudential — U.K.
 Colliers Conrad Ritblat ErdmanInternational UK  — U.K.
 
 JP Morgan ChaseKey Bank
 
 Metropolitan Life
 Cushman & Wakefield
 
 KeyTD Bank
 
 ING Clarion Partners
 Cushman & Wakefield  — U.K.
 
 TD BankCitibank
 
 Duke Realty CorporationProgressive Casualty Insurance Co.
 Weichert Commercial Brokerage
 
 CitibankAEGON USA Realty Advisors, Inc.
 
 USAA Real Estate Company
 Jones Lang LaSalle
 
 AEGON USA Realty Advisors, Inc.Bank of America, N.A.
 
 NorthMarq Capital
 Jones Lang LaSalle — U.K.
 
 Capmark Financial Group, Inc.East West Bank
 
 AEW Capital Management LP
 Grubb & Ellis
 
 East West BankQ10 Capital LLC
 
 Progressive Casualty Insurance Co.Manulife Financial
 Gerald EveDrivers Jonas Deloitte — U.K.
 
 Q10 Bonneville Mortgage CompanyGE Capital
 
Hartford Investment Management Company
 Drivers JonasKing Sturge  — U.K.
    
 Lambert Smith Hampton — U.K.
    
 Charles Dunn Company, Inc.
 
Owners, Developers
 
Appraisers, Accountants
 Marcus & Millichap
Owners, DevelopersAppraisers, Accountants
Mohr Partners
 
 Hines
  Integra
 Newmark & Company Real EstateMohr Partners
 
 LNR Property Corp
 
Deloitte
 CRESA PartnersNewmark Knight Frank
 
 Shorenstein Company, LLC
 
 Deloitte — U.K.Marvin F. Poer
CRESA Partners
Tishman Speyer
KPMG
 Studley
 
 Mack-CaliThe British Land Company  - UK
 
 Marvin F. PoerThomson Reuters
 Coldwell Banker Commercial NRT
Manulife Financial
KPMG
UGL Equis
 
 Industrial Developments International (IDI)
 
 GE Capital
FirstService Williams
Land Securities — U.K.
PGP Valuation
 GVA AdvantisUGL Services
   
 Thomson ReutersNAI Global
Cassidy Turley
 Binswanger
    
 Re/Max
    
 Carter
 Retailers 
Government Agencies
 USI Real Estate Brokerage Services
 
 Nationwide InsuranceStarbucks
  U.S. General Services Administration
 DAUM Commercial Real Estate Services
 
 Café Rio Mexican Grill, Inc.In-N-Out Burger
 
 County of Los Angeles
   ServicesHFF
 
 Merle Norman Cosmetics, Inc.Taco Bell
 
 Internal Revenue Service
 HFFU.S. Equities Realty
 
 Massage Envy
 
 City of Chicago
 U.S. Equities RealtySperry Van Ness
 
 7-Eleven
 
 Cook County Assessor’s Office
 Sperry Van NessDTZ — U.K.
 
 Dollar General Corporation
 
 U.S. Department of Housing and
 DTZSavills Commercial — U.K.
 
 Walgreens
 
 Urban Development
 Savillis CommercialCapita Symonds — U.K.
 
 Town Fair Tire
Corporation of London — U.K.
Atis Real — U.K.
Rent-A-CenterDenny’s
 
 Scottish Enterprise — U.K.
 GVA Grimley — U.K.
 
 Spencer Gifts LLCRent-A-Center
 
 Federal Reserve Bank of New York
 King SturgeBNP Paribas — U.K.
Spencer Gifts LLC
Federal Deposit Insurance Corporation
Avision Young Commercial Real Estate
   
Transportation Security Administration
     
     
REITs
 
Property Managers
 
Vendors
 Brandywine Realty TrustSimon Property Group, Inc.
 
 Transwestern Commercial Services
 
 Turner Construction Company
 Brookfield PropertiesBrandywine Realty Trust
 
 Lincoln Property Company
 
Kastle Systems
 BostonBrookfield Properties
 
 PM Realty Group
 
Comcast Corporation
 Liberty Property TrustBoston Properties
 
 Navisys Group
 
 ADT Security
 Kimco
Duke Realty Corporation
 
 Osprey Management Company
 
 MWB — U.K.Cox Communications, Inc.
 Vornado
Kimco Realty Trust Corporation
 
 Leggat McCall Properties
 
 Cox Communications,Time Warner Cable, Inc.
 Simon Property Group, Inc. Asset Plus Corporation
Vornado/Charles E. Smith
 
 Clear Channel OutdoorAsset Plus Corporation
 Morlin Asset Management LP 
 Verizon Communications, Inc.


1012

 
For the years ended December 31, 2006, 20072008, 2009 and 2008,2010, no single client accounted for more than 5% of our revenues.

Sales and Marketing

As of January 30, 2009,31, 2011, we had 220262 sales, marketing and customer support employees, with the majority of our direct sales force located in field sales offices. Our sales teams are primarily located in 2223 field sales offices throughout the U.S. and in offices located in London, England; Manchester, England; Glasgow, Scotland and Paris, France.  Our inside sales team is located in our Maryland offices.downtown Washington, DC. office. This team prospects for new clients and performs service demonstrations exclusively by telephone and over the internet to support the direct sales force.

Our local offices typically serve as the platform for our in-market sales, customer support and field research operations for their respective regions. The sales force is responsible for selling to new prospects, training new and existing clients, providing ongoing customer support, renewing existing client contracts and identifying cross-selling opportunities. In addition, the sales force has primary front line responsibility for customer care.

Our sales strategy is to aggressively attract new clients, while providing ongoing incentives for existing clients to subscribe to additional services. We actively manage client accounts in order to retain clients by providing frequent service demonstrations as well as company-client contact and communication.  We place a premium on training new and existing client personnel on the use of our services so as to promote maximum client utilization and satisfaction with our services. Our strategy also involves entering into multi-year, multi-market license agreements with our larger clients.

We seek to make our services essential to our clients’ businesses. To encourage clients to use our services regularly, we generally charge a fixed monthly amount for our subscription-based services rather than fees based on actual system usage. Contract rates are generally based on the number of sites, number of users, organization size, the client’s business focus, geography and the number of services to which a client subscribes. Our subscription clients generally pay contract fees on a monthly basis, but in some cases may pay us on a quarterly or annual basis.  In addition, through CoStar COMPS Express, clients can access our database of commercial real estate information without a subscription on a pay per use basis.

Our customer service and support staff is charged with ensuring high client satisfaction by providing ongoing customer support.

Our primary marketing methods include: service demonstrations; face to face networking; web-based marketing; direct marketing; communication via our corporate website and news services; participation in trade show and industry events; print advertising in trade magazines and localother business journals;publications; client referrals; and CoStar Advisor™, the Company’s newsletter, which is distributed to our clients and prospects. We currently offer dozens of webinars each year aimed at helping customers learn more about the commercial real estate industry and how to use our services.  The webinars are available both as live presentations and as on-demand programs hosted on our website.  On a monthly basis, we issue the CoStar Commercial Repeat Sales Index (CCRSI), a comprehensive set of benchmarks that investors and other market participants can use to better understand commercial real estate price movements.  The Index is produced using our underlying data and is publicly distributed by CoStar through the news media and made available online at www.costar.com/ccrsi.

Web-based marketing and direct marketing are the most cost-effective means for us to find prospective clients. Our web-based marketing efforts include paid advertising with major search engines and commercial real estate news sites and our direct marketing efforts include direct mail, email and telemarketing, and make extensive use of our unique, proprietary database. Once we have identified a prospective client, our most effective sales method is a service demonstration. We use various forms of advertising to build brand identity and reinforce the value and benefits of our services. We also sponsor and attend local association activities and events, including industry-leading events for commercial brokers and retail and financial services institutions, and attend and/or exhibit at industry trade shows and conferences to reinforce our relationships with our core user groups, including industry-leading events for commercial brokers and retail and financial services institutions.groups.

In May 2008, we released CoStar Showcase®, an internet marketing service that provides commercial real estate professionals the opportunity to make their listings available to all visitors to our public website, www.CoStar.com, and allows each visitor to search those property listings for free.  CoStar Showcase draws additional traffic to our website through searches on GoogleTM and Yahoo®.  Commercial real estate listings are derived from our database and are researched and verified by CoStar researchers.  CoStar Showcase subscribers need only designate their listings for inclusion in the free property search tool.  In addition, CoStar Showcase customers who have not subscribed for our other services, serve as leads for additional cross-selling opportunities.
11

Competition

The market for information/information, marketing and analytic services generally is competitive and rapidly changing. In the commercial real estate industry, the principal competitive factors for commercial real estate information/information, marketing and analytic services and providers are:

13

quality and depth of the underlying databases;
ease of use, flexibility, and functionality of the software;
timeliness of the data;
breadth of geographic coverage and services offered;
client service and support;
perception that the service offered is the industry standard;
price;
effectiveness of marketing and sales efforts;
proprietary nature of methodologies, databases and technical resources;
vendor reputation;
brand loyalty among customers; and
capital resources.

We compete directly and indirectly for customers with the following categories of companies:

online services or websites targeted to commercial real estate brokers, buyers and sellers of commercial real estate properties, insurance companies, mortgage brokers and lenders, such as LoopNet, Inc., Cityfeet.com, Inc., Reed Business Information Limited, officespace.com, MrOfficeSpace.com, TenantWise, Inc., WorkplaceIQ, RealPoint LLC and TenantWise, Inc;RealUp;

publishers and distributors of information/information, marketing and analytic services, including regional providers and national print publications, such as Black’s Guide, Property and Portfolio Research, Torto Wheaton Research,CBRE Economic Advisors, Marshall & Swift, Yale Robbins, Inc., Reis, Inc., Real Capital Analytics, Inc. and The Smith Guide, Inc.;

locally controlled real estate boards, exchanges or associations sponsoring property listing services and the companies with whom they partner, such as Xceligent, Catalyst, the National Association of Realtors, CCIM Institute, Society of Industrial and Office Realtors (SIOR) the Commercial Association of Realtors Data Services and the Association of Industrial Realtors;Realtors (AIR);

real estate portfolio management software solutions, such as Cougar Software, Yardi Systems, MRI Software, Argus Software and Intuit Inc.;

in-house research departments operated by commercial real estate brokers; and

public record providers.

As the commercial real estate information/information, marketing and analytic services marketplace develops, additional competitors (including companies which could have greater access to data, financial, product development, technical, analytic or marketing resources than we do) may enter the market and competition may intensify. A company like Bloomberg L.P. has the resources and has previously announced an intention to move into the commercial real estate information business.  Further, a company like Google, which has a far-reaching web presence and substantial data aggregation capabilities, could easily enter the commercial real estate marketing arena. While we believe that we have successfully differentiated ourselves from existing competitors, competitioncurrent or future competitors could materially harm our business.

Proprietary Rights

To protect our proprietary rights in our methodologies, database, software, trademarks and other intellectual property, we depend upon a combination of:

trade secret, copyright, trademark, database protection and other laws;
nondisclosure, noncompetition and other contractual provisions with employees and consultants;
license agreements with customers;
patent protection; and
technical measures.
 
1214

 
We seek to protect our software’s source code, our database and our photography as trade secrets and under copyright law. Although copyright registration is not a prerequisite for copyright protection, we have filed for copyright registration for many of our databases, photographs, software and other materials. Under current U.S. copyright law, the arrangement and selection of data may be protected, but the actual data itself may not be. In addition, with respect to our U.K. databases, certain database protection laws provide additional protections of these databases. We license our services under license agreements that grant our clients non-exclusive, non-transferable licenses. These agreements restrict the disclosure and use of our information and prohibit the unauthorized reproduction or transfer of the information/marketinginformation, marketin g and analytic services we license.

We also attempt to protect the secrecy of our proprietary database, our trade secrets and our proprietary information through confidentiality and noncompetition agreements with our employees and consultants. Our services also include technical measures designed to discourage and detect unauthorized copying of our intellectual property. We have established an internal antipiracy team that uses fraud-detection technology to continually monitor our services to detect and prevent unauthorized access, and we actively prosecute individuals and firms that engage in this unlawful activity.

We have filed trademark applications to register trademarks for a variety of names for CoStar services and other marks, and have obtained registered trademarks for a variety of our marks, including “CoStar”, “COMPS”,“CoStar,” “COMPS,” “CoStar Property”,Property,” “CoStar Tenant”,Tenant,” “CoStar Showcase” and “CoStar Group”.Group.” Depending upon the jurisdiction, trademarks are generally valid as long as they are in use and/or their registrations are properly maintained and they have not been found to become generic.  We consider our trademarks in the aggregate to constitute a valuable asset.  In addition, we have filed several patent applications covering certain of our methodologies and software and currently have one patent in the U.K. which expires in 2021 covering, among other things,thi ngs, certain of our field research methodologies, and threesix patents in the U.S. which expire in 2020, 2021, 2022, 2023 (2 patents) and 2022,2025, covering, among other things, critical elements of CoStar’s proprietary field research technology and mapping tools.  We regard the rights under our patents as valuable to our business but do not believe that our business is materially dependent on any single patent.

Employees

As of January 30, 2009,31, 2011, we employed 1,1781,389 employees. None of our employees isare represented by a labor union. We have experienced no work stoppages. We believe that our employee relations are excellent.

Available Information

Our investor relations internet website is http://www.costar.com/investors.aspx. The reports we file with or furnish to the Securities and Exchange Commission, including our annual report, quarterly reports and current reports, are available free of charge on our internet website as soon as reasonably practicable after we electronically file such material with, or furnish it to, the Securities and Exchange Commission. You may review and copy any of the information we file with the Securities and Exchange Commission at the Commission's Public Reference Room at 100 F Street, NE, Washington, DC 20549. You may obtain information regarding the operation of the Public Reference Room by calling the SEC at 1-800-SEC-0330.  The Securities and Exchange Commission maintains an internet site that contains reports, proxy and information statements, and other information regarding issuers that file electronically with the Commission at http://www.sec.gov.

Item 1A.


We have made forward-looking statements in this Report and make forward-looking statements in our press releases and conference calls that are subject to risks and uncertainties. Forward-looking statements include information that is not purely historic fact and include, without limitation, statements concerning our financial outlook for 20092011 and beyond, our possible or assumed future results of operations generally, and other statements and information regarding assumptions about our revenues, EBITDA, fully diluted net income, taxable income, cash flow from operating activities, available cash, operating costs, amortization expense, intangible asset recovery, net income per share, diluted net income per share, weighted-average outstanding shares, capital and other expenditures, effective tax rate, equity compensation charges, future taxable income, purchase amortization, financing plans, geographic expansion, acquisitions, contract renewal rate, capital structure, contractual obligations, legal proceedings and claims, our database, database growth, services and facilities, employee relations, future economic performance, our ability to
15

liquidate or realize our long-term investments, management’s plans, goals and objectives for future operations, and growth and markets for our stock. Sections of this Report which contain forward-looking statements include “Business,” “Risk Factors,” “Properties,” “Legal Proceedings,” “Management’s Discussion and Analysis of Financial Condition and Results of Operations,” “Quantitative and Qualitative Disclosures About Market Risk,” “Controls and Procedures” and the Financial Statements and related Notes.

13

Our forward-looking statements are also identified by words such as “believes,” “expects,” “thinks,” “anticipates,” “intends,” “estimates” or similar expressions. You should understand that these forward-looking statements are estimates reflecting our judgment, beliefs and expectations, not guarantees of future performance. They are subject to a number of assumptions, risks and uncertainties that could cause actual results to differ materially from those expressed or implied in the forward-looking statements. The following important factors, in addition to those discussed or referred to under the heading “Risk Factors,” and other unforeseen events or circumstances, could affect our future results and could cause those results or other outcomes to differdiffe r materially from those expressed or implied in our forward-looking statements: general economic conditions; commercial real estate market conditions; general economic conditions; changes or consolidations within the commercial real estate industry; customer retention; our ability to attract new clients; our ability to sell additional services to existing clients; our ability to integrate our U.S. and international product offerings; competition; foreign currency fluctuations; our ability to identify, acquire and integrate acquisition candidates; our ability to obtain any required financing on favorable terms; global credit market conditions affecting investments; our ability to integrate our U.S. and international product offerings; our ability to continue to expand successfully; our ability to effectively penetrate the market for retail real estate information and gain acceptance in that market; our ability to control costs; litigation; changes in accounting policies or practices; release of new and upgraded services by us or our competitors; data quality; development of our sales force; employee retention;retenti on; technical problems with our services; managerial execution; changes in relationships with real estate brokers and other strategic partners; legal and regulatory issues; and successful adoption of and training on our services.

Accordingly, you should not place undue reliance on forward-looking statements, which speak only as of, and are based on information available to us on, the date of this Report. All subsequent written and oral forward-looking statements attributable to us or any person acting on our behalf are expressly qualified in their entirety by the cautionary statements contained or referred to in this section. We do not undertake any obligation to update any such statements or release publicly any revisions to these forward-looking statements to reflect events or circumstances after the date of this Report or to reflect the occurrence of unanticipated events.

Risk Factors

A downturn or consolidation in the commercial real estate industry may decrease customer demand for our services. The continuing declineA reversal of recent improvements in the commercial real estate industry’s leasing activity rental rates and absorption rates and the on-goingor a renewed downturn in the commercial real estate market’s for sale activitymarket may affect our ability to generate revenues and may lead to more cancellations by our current or future customers, botheither of which could cause our revenues or our revenue growth rate to decline and reduce our profitability. A depressed commercial real estate market has a negative impact on our core customer base, which could decrease demand for our information/information, marketing and analytic services. Also, companies in this industry are consolidating, often in order to reduce expenses. Consolidation , or other cost-cutting measures by our customers, may lead to more cancellations of our information/information, marketing and analytic services by our customers, reduce the number of our existing clients, reduce the size of our target market or increase our clients’ bargaining power, all of which could cause our revenues or our revenue growth to decline and reduce our profitability.

Negative general economic conditions could increase our expenses and reduce our revenues. Our business and the commercial real estate industry are particularly affected by negative trends in the general economy. The success of our business depends on a number of factors relating to general global, national, regional and local economic conditions, including perceived and actual economic conditions, recessions, inflation, deflation, exchange rates, interest rates, taxation policies, availability of credit, employment levels, and wage and salary levels. Negative general economic conditions could adversely affect our business by reducing our revenues and profitability.  Further, continuing bankIf we experience greater cancellations or reductions of services and failures to timely pay, and freezing of the credit markets generally, other adversewe do n ot acquire new clients or sell new services to our existing clients, our revenues may decline and our financial position would be adversely affected.  Adverse national and global economic events, as well as any significant terrorist attack, are likely to have a further dampening effect on the economy in general, which could negatively affect our financial performance and our stock price. Market disruptions may also contribute to extreme price and volume fluctuations in the stock market that may affect our stock price for reasons
14

unrelated to our operating performance.  In addition, a significant
16

increase in inflation could increase our expenses more rapidly than expected, the effect of which may not be offset by corresponding increases in revenue. Conversely, deflation resulting in a decline of prices could reduce our revenues.  In the current economic environment, it is difficult to predict whether we will experience significant inflation or deflation in the near future. A significant increase in either could have an adverse effect on our results of operations. As a result of current economic conditions, we have recently seen an increase in customer cancellations, reductions of services and failures to timely pay amounts due us.  If we experience greater cancellations and more reductions of services and failures to timely pay and we do not acquire new clients or sell new services to our existing clients, our revenues may decline and our financial position would be adversely affected.

Our revenues and financial position will be adversely affected if we are not able to attract and retain clients. Our success and revenues depend on attracting and retaining subscribers to our information/information, marketing and analytic services. Our subscription-based information/information, marketing and analytic services generate the largest portion of our revenues. However, we may be unable to attract new clients, and our existing clients may decide not to add, not to renew or to cancel subscription services. In addition, in order to increase our revenue, we must continue to attract new customers, continue to keep our cancellation rate low and continue to sell new services to our existing customers. We may not be able to continue to grow our customer base, keep the cancellation rate for customerscustome rs and services low or sell new services to existing customers as a result of several factors, including without limitation: economic pressures, a decision that customers have no need for our services; a decision to use alternative services; customers’ and potential customers’ pricing and budgetary constraints; consolidation in the real estate and/or financial services industries; data quality; technical problems; or competitive pressures. If clients decide to cancel services or not to renew their subscription agreements, and we do not sell new services to our existing clients or attract new clients, then our renewal rate, revenues and our revenue growth raterevenues may decline.

If we are not able to successfully identify, finance and/or integrate acquisitions, our business operations and financial position could be adversely affected. We have expanded our markets and services in part through acquisitions of complementary businesses, services, databases and technologies, and expect to continue to do so in the future. Our strategy to acquire complementary companies or assets depends on our ability to identify, and the availability of, suitable acquisition candidates. We may incur costs in the preliminary stages of an acquisition, but may ultimately be unable or unwilling to consummate the proposed transaction for various reasons.  In addition, acquisitions involve numerous risks, including the ability to realize or capitalize on synergy created through combinations; managing the integration of personnel and products; managing geographically remote operations, such as SPN in Scotland, Grecam S.A.S. in France, CoStar U.K. Limited, Propex and Property and Portfolio Research Ltd. in the U.K.; the diversion of management’s attention from other business concerns; the inherent risks in entering markets and sectors in which we have either limited or no direct experience; and the potential loss of key employees or clients of the acquired companies. We may not successfully integrate acquired businesses or assets and may not achieve anticipated benefits of an acquisition, including expected synergy. Acquisitions could result in dilutive issuances of equity securities, the incurrence of debt, one-time write-offs of goodwill and substantial amortization expenses of other intangible assets.  We may be unable to obtain financing on favorable terms, or at all, if necessary to finance future acquisitions making it impossible or more costly to acqui re complementary businesses.  If we are able to obtain financing, the terms may be onerous and restrict our operations.

If we are unable to hire qualified persons for, or retain and continue to develop, our sales force, or if our sales force is unproductive, our revenues could be adversely affected. In order to support revenues and future revenue growth, we need to continue to develop, train and retain our sales force. Our ability to build and develop a strong sales force may be affected by a number of factors, including: our ability to attract, integrate and motivate sales personnel; our ability to effectively train our sales force; the ability of our sales force to sell an increased number of services; our ability to manage effectively an outbound telesales group; the length of time it takes new sales personnel to become productive; the competition we face from other companies in hiring and retainingret aining sales personnel; and our ability to effectively manage a multi-location sales organization. If we are unable to hire qualified sales personnel and develop and retain the members of our sales force, including sales force management, or if our sales force is unproductive, our revenues or growth rate could decline and our expenses could increase.

Competition could render our services uncompetitive. The market for information systems and services in general is highly competitive and rapidly changing.  Competition in this market may increase further as a result of current recessionary economic conditions, as customer bases and customer spending have decreased and service providers are competing for fewer customer resources.  Our existing competitors, or future competitors, may have greater name recognition, larger customer bases, better technology or data, lower prices, easier access to data, greater user traffic or greater financial, technical or marketing resources than we have. Our competitors may be able to undertake more effective marketing campaigns, obtain more data, adopt more aggressive pricing policies, make more attractive offers to potential employees, subscribers, distribution partners and content providers or may be able to respond more quickly to new or emerging technologies or changes in user requirements. If we are unable to retain customers or obtain new customers, our revenues could decline.  Increased competition could result in lower revenues and higher expenses, which would reduce our profitability.

17

If we are unable to increase our revenues or our operating costs are higher than expected, our profitability may continue to decline and our operating results may fluctuate significantly. We may not be able to accurately forecast our revenues or future revenue growth rate.  Many of our expenses, particularly personnel costs and occupancy costs, are relatively fixed. As a result, we may not be able to adjust spending quickly enough to offset any unexpected increase in expenses or revenue shortfall. We may experience higher than expected operating costs, including increased personnel costs, occupancy costs, selling and marketing costs, investments in geographic expansion, acquisition costs, communications costs, travel costs, software development costs, professional fees and other costs. If operating costs exceed our expectations and cannot be adjusted accordingly, our profitability may be reduced and our results of operations and financial position will be adversely affected.  Additionally, we may not be able to sustain our historic revenue growth rates, and our percentage revenue growth rates may decline.  Our ability to increase our revenues and operating profit will depend on increased demand for our services.  Our sales are affected by, among other things, general economic and commercial real estate conditions.  Reduced demand, whether due to changes in customer preference, a further weakening of the U.S. or global economy, competition or other reasons, may result in decreased revenue and growth, adversely affecting our operating results.

International operations expose us to additional business risks, which may reduce our profitability. Our international operations and expansion subject us to additional business risks, including: currency exchange rate fluctuations; adapting to the differing business practices and laws in foreign countries; difficulties in managing foreign operations; limited protection for intellectual property rights in some countries; difficulty in collecting accounts receivable and longer collection periods; costs of enforcing contractual obligations; impact of recessions in economies outside the U.S.; and potentially adverse tax consequences. In addition, international expansion imposes additional burdens on our executive and administrative personnel, systems development, research and sales departments, and general managerial resources. If we are not able to manage our international operations successfully, we may incur higher expenses and our profitability may be reduced. Finally, the investment required for additional international expansion could exceed the profit generated from such expansion, which would reduce our profitability and adversely affect our financial position.

Fluctuating foreign currencies may negatively impact our business, results of operations and financial position. Due to our acquisitions of CoStar UKU.K. Limited (formerly FOCUS Information Limited), SPN, Grecam S.A.S., Propex, and Propex,Property and Portfolio Research Ltd., a portion of our business is denominated in the British Pound and Euro and as a result, fluctuations in foreign currencies may have an impact on our business, results of operations and financial position.  Recently, foreignForeign currency exchange rates have fluctuated greatly and may continue to fluctuate.  Significant foreign currency exchange rate fluctuations may negatively impact our international revenue, which in turn affects our consolidated revenue.  Currencies may be affected by internal factors, generalgen eral economic conditions and external developments in other countries, all of which can have an adverse impact on a country’s currency. Currently, we are not party to any hedging transactions intended to reduce our exposure to exchange rate fluctuations. We may seek to enter into hedging transactions in the future, but we may be unable to enter into these transactions successfully, on acceptable terms or at all. We cannot predict whether we will incur foreign exchange losses in the future. Further, significant foreign exchange fluctuations resulting in a decline in the British Pound or Euro may decrease the value of our foreign assets, as well as decrease our revenues and earnings from our foreign subsidiaries, which would reduce our profitability and adversely affect our financial position.

15

IfNegative conditions in the global credit markets may affect the liquidity of a portion of our long-term investments.  Currently, our long-term investments include mostly AAA rated auction rate securities (“ARS”), which are primarily student loan securities supported by guarantees from the Federal Family Education Loan Program (“FFELP”) of the U.S. Department of Education. Continuing negative conditions in the global credit markets have prevented some investors from liquidating their holdings of auction rate securities because the amount of securities submitted for sale has exceeded the amount of purchase orders for such securities. As of December 31, 2010, we areheld $32.2 million par value of ARS, all of which failed to settle at auctions. When an auction fails for ARS in which we have invested, we may be unable to sustain our revenue growthliquidate some or our operating costs are higher than expected, our profitability may be reduced and our operating results may fluctuate significantly. We mayall of these securities at par. In the event we need or desire to immediately access these funds, we will not be able to accurately forecastdo so until a future auction on these investments is successful, a buyer is found outside the auction process or an alternative action is determined. If a buyer is found but is unwilling to purchase the investments at par, we may incur a loss, which would reduce our revenue growth rate.  Manyprofitability and adversely affect our financial position.
18

Our ARS investments are not currently trading and therefore do not currently have a readily determinable market value.  Accordingly, the estimated fair value of the ARS no longer approximates par value.  We have used a discounted cash flow model to determine the estimated fair value of our expenses, particularly personnel costsinvestment in ARS as of December 31, 2010.  The assumptions used in preparing the discounted cash flow model include estimates for interest rates, credit spreads, timing and occupancy costs,amount of cash flows, liquidity risk premiums, expected holding periods and default risk of the ARS.  Based on this assessment of fair value, as of December 31, 2010, we determined there was a decline in the fair value of our ARS investments of approximately $3.0 million.  The decline was deemed to be a temporary impair ment and was recorded as an unrealized loss in accumulated other comprehensive loss in stockholders’ equity.  If the issuers of these ARS are relatively fixed. As a result,unable to successfully close future auctions and/or their credit ratings deteriorate, we may be required to record additional unrealized losses in accumulated other comprehensive loss or an other-than-temporary impairment charge to earnings on these investments, which would reduce our profitability and adversely affect our financial position.

We have not made any material changes in the accounting methodology used to determine the fair value of the ARS.  We do not expect any material changes in the near term to the underlying assumptions used to determine the unobservable inputs used to calculate the fair value of the ARS as of December 31, 2010.  However, if changes in these assumptions occur, and, should those changes be ablesignificant, we may be required to adjust spending quickly enoughrecord additional unrealized losses in accumulated other comprehensive loss or an other-than-temporary impairment charge to offset any unexpected increase in expensesearnings on these investments.

Our current or revenue shortfall. We may experience higher than expected operating costs, including increased personnel costs, occupancy costs, selling and marketing costs, investments infuture geographic expansion acquisition costs, communications costs, travel costs, software development costs, professional fees and other costs. If operating costs exceedplans may not result in increased revenues, which may negatively impact our expectations and cannot be adjusted accordingly, our profitability may be reduced and ourbusiness, results of operations and financial position will be adversely affected.  Additionally,. Expanding into new markets and investing resources towards increasing the depth of our coverage within existing markets imposes additional burdens on our research, systems development, sales, marketing and general managerial resources.  During 2011, we plan to continue to increase the depth of our coverage in the U.S., U.K and France, and we may not be able to sustain our historic revenue growth rates and our percentage revenue growth rates may decline.  Our revenue and operating profit growth depend on continued increased demand for our services.  Our sales are affected by, among other things, general economic and commercial real estate conditions.  Reduced demand, whether due to changes in customer preference, a further weakening of the U.S. or global economies or other reasons, may result in decreased revenue and growth, adversely affecting our operating results.

Competition could render our services uncompetitive. The market for information systems and services in general is highly competitive and rapidly changing.  Competition in this market may increase further as a result of current recessionary economic conditions, as customer bases and customer spending decrease and service providers are competing for fewer customer resources.  Our existing competitors, or future competitors, may have greater name recognition, larger customer bases, better technology or data, lower prices, easier access to data, greater user traffic or greater financial, technical or marketing resources than we have. Our competitors may be able to undertake more effective marketing campaigns, obtain more data, adopt more aggressive pricing policies, make more attractive offers to potential employees, subscribers, distribution partners and content providers or may be able to respond more quickly to new or emerging technologies or changes in user requirements.expand into additional geographies.  If we are unable to retain customers or obtain new customers,manage our revenues and revenue growth could decline.  Increased competition could result in lower revenues and higher expenses, which would reduceexpansion efforts effectively, if our profitability.
Litigation or government investigations in which we become involved may significantly increase our expenses and adversely affect our stock price. Currently and from time to time, we are a party to various lawsuits. Any lawsuits, threatened lawsuits or government investigations in which we are involved could cost us a significant amount of time and money to defend, could result in negative publicity, and could adversely affect our stock price. In addition, if any claims are determined against usexpansion efforts take longer than planned or if a settlement requires us to pay a large monetary amount, our profitability could be significantly reduced andcosts for these efforts exceed our expectations, our financial position could be advers ely affected. In addition, if we incur significant costs to improve data quality within existing markets, or are not successful in marketing and selling our services in these markets or in new markets, our expansion may have a material adverse effect on our financial position by increasing our expenses without increasing our revenues, adversely affected. We cannot make assurances that we will have any or sufficient insurance to cover any litigation claims.affecting our profitability.

We may be subject to legal liability for collecting, displaying or distributing information. Because the content in our database is collected from various sources and distributed to others, we may be subject to claims for breach of contract, defamation, negligence, unfair competition or copyright or trademark infringement or claims based on other theories. We could also be subject to claims based upon the content that is accessible from our website through links to other websites or information on our website supplied by third parties. Even if these claims do not result in liability to us, we could incur significant costs in investigating and defending against any claims. Our potential liability for information distributed by us to others could require us to implement measures tot o reduce our exposure to such liability, which may require us to expend substantial resources and limit the attractiveness of our information/information, marketing and analytic services to users.

Litigation or government investigations in which we become involved may significantly increase our expenses and adversely affect our stock price. Currently and from time to time, we are a party to various lawsuits. Any lawsuits, threatened lawsuits or government investigations in which we are involved could cost us a significant amount of time and money to defend, could distract management’s attention away from operating our business, could result in negative publicity and could adversely affect our stock price. In addition, if any claims are determined against us or if a settlement requires us to pay a large monetary amount or take other action that materially restricts or impedes our operations, our profitability could be significantly reduced and our financial position could be adversely affected. We cannot make assurances that we will have any or sufficient insurance to cover any litigation claims.

An impairment in carrying value of goodwill could negatively impact our consolidated results of operations and net worth. Goodwill and identifiable intangible assets not subject to amortization are tested annually by each reporting unit on October 1st of each year for impairment and are tested for impairment more frequently based upon the existence of one or more indicators.  We consider our operating segments, U.S. and International, as our reporting
19

units under Statement of Financial Accounting Standards Board (“SFAS”FASB”) No. 142authoritative guidance for consideration of potential impairment of goodwill. We assess the impairment of long-lived assets, identifiable intangibles and goodwill whenever events or changes in circumstances indicate that the carrying value may not be recoverable. The existence of one or more of the following indicators could cause us to test for impairment prior to the annual assessment.assessment:

Significant underperformance relative to historical or projected future operating results;
Significant changes in the manner of our use of acquired assets or the strategy for our overall business;
Significant negative industry or economic trends; or
Significant decline in our market capitalization relative to net book value for a sustained period.

These types of events or indicators and the resulting impairment analysis could result in goodwill impairment charges in the future, which would reduce our profitability. Impairment charges could negatively affect our financial results in the periods of such charges, which may reduce our profitability. As of December 31, 2008,2010, we had $54.3$79.6 million of goodwill, $31.5$55.3 million in our U.S. segment and $22.8$24.3 million in our International segment.

16

Our stock price may be negatively affected by fluctuations in our financial results. Our operating results, revenues and expenses may fluctuate as a result of changes in general economic conditions and also for many other reasons, many of which are outside of our control, such as: cancellations or non-renewals of our services; competition; our ability to control expenses; loss of clients or revenues; technical problems with our services; changes or consolidation in the real estate industry; our investments in geographic expansion and to increase coverage in existing markets; interest rate fluctuations; the timing and success of new service introductions and enhancements; successful execution of our expansion plans; data quality; the development of our sales force; managerial execution;exe cution; employee retention; foreign currency and exchange rate fluctuations; inflation; successful adoption of and training on our services; litigation; acquisitions of other companies or assets; sales, brand enhancement and marketing promotional activities; client support activities; changes in client budgets; or our investments in other corporate resources. In addition, changes in accounting policies or practices may affect our level of net income. Fluctuations in our financial results, revenues and expenses may cause the market price of our common stock to decline.

Market volatility may have an adverse effect on our stock price. The trading price of our common stock has fluctuated widely in the past, and we expect that it will continue to fluctuate in the future. The price could fluctuate widely based on numerous factors, including: economic factors; quarter-to-quarter variations in our operating results; changes in analysts’ estimates of our earnings; announcements by us or our competitors of technological innovations or new services; general conditions in the commercial real estate industry; developments or disputes concerning copyrights or proprietary rights or other legal proceedings; and regulatory developments. In addition, in recent years, the stock market in general, and the shares of internet-related and other technology companies in particular,particu lar, have experienced extreme price fluctuations. This volatility has had a substantial effect on the market prices of securities issued by many companies for reasons unrelated to the operating performance of the specific companies and may have the same effect on the market price of our common stock.

International operations expose usWe may not be able to additional business risks,successfully introduce new or upgraded information, marketing and analytic services, which may reducecould decrease our revenues and our profitability. Our international operationsfuture business and expansion subject usfinancial success will depend on our ability to additional business risks, including: currency exchange rate fluctuations; adaptingcontinue to introduce new and upgraded services into the differing business practicesmarketplace. To be successful, we must adapt to rapid technological changes by continually enhancing our information, marketing and laws in foreign countries; difficulties in managing foreign operations; limited protection for intellectual property rights in some countries; difficulty in collecting accounts receivableanalytic services. Developing new services and longer collection periods; costs of enforcing contractual obligations; impact of recessions in economies outside the U.S.; and potentially adverse tax consequences. In addition, international expansionupgrades to services imposes additionalheavy burdens on our executivesystems department, management and administrative personnel, systems development, researchresearchers. This process is costly, and we cannot assure you that we will be able to successfully develop and enhance our services. In addition, successfully launching and selling a new service puts pressure on our sales departments, and general managerialmarket ing resources. If we are not ableunable to managedevelop new or upgraded services, then our international operations successfully, wecustomers may incur higher expenseschoose a competitive service over ours and our revenues may decline and our profitability may be reduced. Finally, the investment required for additional international expansionIn addition, if we incur significant costs in developing new or upgraded services, are not successful in marketing and selling these new services or upgrades, or our customers fail to accept these new services, it could exceed the profit generated from such expansion, which would reducehave a material adverse effect on our profitabilityresults of operations by decreasing our revenues and adversely affectreducing our financial position.profitability.

Negative conditionsOur expansion into the commercial real estate analytics sector may not be successful or may not result in increased revenues, which may negatively impact our business, results of operations and financial position.  Expanding into the commercial real estate market research and forecasting arena imposes additional burdens on our research, systems development, sales, marketing and general management resources.  During 2011, we expect to continue to expand our presence in the global credit markets may affect the liquidity of a portion of our long-term investments.  Currently our long-term investments include mostly AAA rated auction rate securities (“ARS”), whichcommercial real estate analytics sector.  If we are primarily student loan securities supported by guarantees from the Federal Family Education Loan Program (“FFELP”) of the U.S. Department of Education. Recent negative conditions in the global credit markets have prevented some investors from liquidating their holdings of auction rate securities because the amount of securities submitted for sale has exceeded the amount of purchase orders for such securities. As of December 31, 2008, we held $33.1 million par value of ARS all of which failed to settle at auctions. When an auction fails for ARS in which we have invested, we may be unable to liquidate somemanage this expansion effectively or all of these securities at par. In the event we need or desire to immediately access these funds, we will not be able to do so until a future auction on these investments is successful, a buyer is found outside the auction process or an alternative action is determined. If a buyer is found but is unwilling to purchase the investments at par, we may incur a loss, which would reduceif our profitability and adversely affectcosts for this effort exceed our expectations, our financial position.position could be
 
1720

Our ARS investments
adversely affected.  In addition, if we incur additional costs to expand our analytics services and we are not currently trading and therefore do not currentlysuccessful in marketing or selling these expanded services, our expansion may have a readily determinable market value.  Accordingly, the estimated fair valuematerial adverse effect on our financial position by increasing our expenses without increasing our revenues, adversely affecting our profitability.

As a result of the ARS no longer approximates par value.  consolidation of facilities, we may incur additional costs.  We have used a discounted cash flow modeltaken, and may continue to determinetake, actions that may increase our cost structure in the estimated fair valueshort-term but are intended to reduce certain portions of our investmentlong-term cost structure, such as consolidation of office space. As a result of consolidation of office space, we may reduce our long-term occupancy costs, but incur restructuring charges.  If our long-term cost reduction efforts are ineffective or our estimates of cost savings are inaccurate, our profitability could be negatively impacted.  Expected savings from relocating facilities can be highly variable and uncertain.  For instance, we may not meet the requirements necessary to receive the full property tax a batement provided by the District of Columbia as incentive for us to relocate our headquarters to downtown Washington, DC and may incur greater property taxes than anticipated in ARS as of December 31, 2008.  The assumptions usedconnection with the move to our new headquarters.    Further, we may not be successful in preparingachieving the discounted cash flow model include estimates for interest rates, credit spreads, timing and amount of cash flows, liquidity risk premiums,operating efficiencies or operating cost reductions expected holding periods and default risk of the ARS.  Based on this assessment of fair value, as of December 31, 2008, we determined there was a declinefrom these efforts in the fair value of our ARS investments of approximately $3.7 million.  The decline was deemed to be a temporary impairment and recorded as an unrealized loss in other comprehensive income in stockholders’ equity.  Ifamounts or at the issuers of these ARS are unable to successfully close future auctions and their credit ratings deteriorate,times we may be required to record additional unrealized losses in other comprehensive income or an other-than-temporary impairment charge to earnings on these investments, which would reduce our profitability and adversely affect our financial position.anticipate.

If we are unable to enforce or defend our ownership and use of intellectual property, our business, competitive position and operating results could be harmed. The success of our business depends in large part on the intellectual property involved in our methodologies, database, services and software. We rely on a combination of trade secret, patent, copyright and other laws, nondisclosure and noncompetition provisions, license agreements and other contractual provisions and technical measures to protect our intellectual property rights. However, current law may not provide for adequate protection of our databases and the actual data. In addition, legal standards relating to the validity, enforceability and scope of protection of proprietary rights in internet related businesses are uncertain and evolving, and we cannot assure you of the future viability or value of any of our proprietary rights. Our business could be significantly harmed if we are not able to protect our content and our other intellectual property. The same would be true if a court found that our services infringe other persons’ intellectual property rights. Any intellectual property lawsuits or threatened lawsuits in which we are involved, either as a plaintiff or as a defendant, could cost us a significant amount of time and money and distract management’s attention from operating our business. In addition, if we do not prevail on any intellectual property claims, this could result in a change to our methodology or information/information, marketing and analytic services and could reduce our profitability.

Our current or future geographic expansion plans may not result in increased revenues, which may negatively impact our business, results of operations and financial position. Expanding into new markets and investing resources towards increasing the depth of our coverage within existing markets imposes additional burdens on our research, systems development, sales, marketing and general managerial resources.  During 2009, we plan to continue to increase the depth of our coverage in the U.S. and U.K.  If we are unable to manage our expansion efforts effectively, if our expansion efforts take longer than planned or if our costs for these efforts exceed our expectations, our financial position could be adversely affected. In addition, if we incur significant costs to improve data quality within existing markets, or are not successful in marketing and selling our services in these markets or in new markets, our expansion may have a material adverse effect on our financial position by increasing our expenses without increasing our revenues, adversely affecting our profitability.

Our continuing expansion into the retail real estate sector may not be completed successfully or may not result in increased revenues, which may negatively impact our business, results of operations and financial position. Expanding into the retail real estate sector imposed and continues to impose additional burdens on our research, systems development, sales, marketing and general managerial resources. During the next year, we expect to continue to expand the number of retail properties contained within our database. If we are unable to manage this expansion effectively, if this expansion effort takes longer than planned or if our costs for this effort exceed our expectations, our financial position could be adversely affected. In addition, if we incur significant costs to expand our retail sector services and we are not successful in marketing and selling these expanded services, or customers fail to accept these new services, our expansion may have a material adverse effect on our financial position by increasing our expenses without increasing our revenues, adversely affecting our profitability.

We may not be able to successfully introduce new or upgraded information/marketing services, which could decrease our revenues and our profitability. Our future business and financial success will depend on our ability to continue to introduce new and upgraded services into the marketplace. To be successful, we must adapt to rapid technological changes by continually enhancing our information/marketing services. Developing new services and upgrades to services imposes heavy burdens on our systems department, management and researchers. This process is costly, and we cannot assure you that we will be able to successfully develop and enhance our services. In addition, successfully launching and selling a new service puts pressure on our sales and marketing resources. If we are unable to develop new or upgraded services, then our customers may choose a competitive service over ours and our revenues may decline and our profitability may be reduced. In addition, if we incur significant costs in developing new or upgraded services, are not successful in marketing and selling these new services or upgrades, or our customers fail to accept these new services, it could have a material adverse effect on our results of operations by decreasing our revenues or our revenue growth rate and reducing our profitability.
18

Technical problems that affect either our customers’ ability to access our services, or the software, internal applications and systems underlying our services, could lead to reduced demand for our information/information, marketing and analytic services, lower revenues and increased costs. Our business increasingly depends upon the satisfactory performance, reliability and availability of our website, the internet and our service providers. Problems with our website, the internet or the services provided by our local exchange carriers or internet service providers could result in slower connections for our customers or interfere with our customers’ access to our information/information, marketing and analytic services. If we experience technical problems in distributing our services, we couldco uld experience reduced demand for our information/information, marketing and analytic services. In addition, the software, internal applications and systems underlying our services are complex and may not be efficient or error-free. Our careful development and testing may not be sufficient to ensure that we will not encounter technical problems when we attempt to enhance our software, internal applications and systems. Any inefficiencies, errors or technical problems with our software, internal applications and systems could reduce the quality of our services or interfere with our customers’ access to our information/information, marketing and analytic services, which could reduce the demand for our services, lower our revenues and increase our costs.

If we are not able to obtain and maintain accurate, comprehensive or reliable data, we could experience reduced demand for our information/information, marketing and analytic services. Our success depends on our clients’ confidence in the comprehensiveness, accuracy and reliability of the data and analysis we provide. The task of establishing and maintaining accurate and reliable data and analysis is challenging. If our data, including the data we obtain from third parties, or analysis is not current, accurate, comprehensive or reliable, we could experience reduced demand for our services or legal claims by our customers, which could result in lower revenues and higher expenses. Our U.S. researchers use integrated internal research processes to update our database.  Any inefficiencies,inef ficiencies, errors, or technical problems with this application could reduce the quality of our data, which could result in reduced demand for our services, lower revenues and higher costs.

If we are not able to successfully identify, finance and/or integrate acquisitions, our business operations and financial position could be adversely affected. We have expanded our markets and services in part through acquisitions of complementary businesses, services, databases and technologies, and expect to continue to do so in the future. Our strategy to acquire complementary companies or assets depends on our ability to identify, and the availability of, suitable acquisition candidates. In addition, acquisitions involve numerous risks, including managing the integration of personnel and products; managing geographically remote operations, such as SPN in Scotland, Grecam S.A.S. in France, CoStar U.K. Limited and Propex in the U.K.; the diversion of management’s attention from other business concerns; the inherent risks in entering markets and sectors in which we have either limited or no direct experience; and the potential loss of key employees or clients of the acquired companies. We may not successfully integrate any acquired businesses or assets and may not achieve anticipated benefits of any acquisition. Acquisitions could result in dilutive issuances of equity securities, the incurrence of debt, one-time write-offs of goodwill and substantial amortization expenses of other intangible assets.  Obtaining credit in the current economic environment may be difficult and cost prohibitive.  We may be unable to obtain financing on favorable terms, or at all, if necessary to finance future acquisitions making it impossible or more costly to acquire complementary businesses.  If we are able to obtain financing, the terms may be onerous and more restrictive than we are willing to accept.

21

Temporary or permanent outages of our computers, software or telecommunications equipment could lead to reduced demand for our information/information, marketing and analytic services, lower revenues and increased costs. Our operations depend on our ability to protect our database, computers and software, telecommunications equipment and facilities against damage from potential dangers such as fire, power loss, security breaches, computer viruses and telecommunications failures. Any temporary or permanent loss of one or more of these systems or facilities from an accident, equipment malfunction or some other cause could harm our business. If we experience a failure that prevents us from delivering our information/information, marketing and analytic services to clients, we could experience reduced demanddeman d for our information/information, marketing and analytic services, lower revenues and increased costs.

19

Changes in accounting and reporting policies or practices may affect our financial results or presentation of results, which may affect our stock price. Changes in accounting and reporting policies or practices could reduce our net income, which reductions may be independent of changes in our operations. These reductions in reported net income could cause our stock price to decline.  For example, in the first quarter of 2006, we adopted the provisions of SFAS 123R,authoritative guidance for stock compensation, which required us to expense the value of granted stock options. We recorded $2.9 million in compensation charges for stock options in 2006.

Our business depends on retaining and attracting highly capable management and operating personnel. Our success depends in large part on our ability to retain and attract management and operating personnel, including our President and Chief Executive Officer, Andrew Florance, and our other officers and key employees. Our business requires highly skilled technical, sales, management, web development, marketing and research personnel, who are in high demand and are often subject to competing offers. To retain and attract key personnel, we use various measures, including employment agreements, awards under a stock incentive plan and incentive bonuses for key executive officers. These measures may not be enough to retain and attract the personnel we need or to offset the impact on ouro ur business of the loss of the services of Mr. Florance or other key officers or employees.

Item 1B.


Item 2.

Our corporateOn February 5, 2010, we purchased an office building located at 1331 L Street, NW, in downtown Washington, DC, through our wholly owned subsidiary, 1331 L Street Holdings, LLC (“Holdings”), for use as our new headquarters is located in Bethesda, Maryland, where we occupy approximately 60,000 square feet of office space. Our main lease for our Bethesda, Maryland headquarters expires on March 31, 2010.and have since relocated to this location. This facility is used primarily by our U.S. segment.  The lease for our previous headquarters in Bethesda, MD expired on October 15, 2010.

On February 2, 2011, Holdings and GLL L-Street 1331, LLC (“GLL”), an affiliate of Munich-based GLL Real Estate Partners GmbH, entered into a purchase and sale agreement pursuant to which (i) Holdings agreed to sell to GLL its interest in the 169,429 square-foot office building located at 1331 L Street, NW, in downtown Washington, DC, and (ii) CoStar Realty Information, Inc. (“CoStar Realty”), our wholly owned subsidiary, agreed to enter into a lease expiring May 31, 2025 (with two 5-year renewal options) with GLL to lease back 149,514 square feet of the office space located in this building, which we will continue to use as our corporate headquarters.  The closing of the sale took place on February 18, 2011.

Our principal facility in the U.K. is located in London, England, where we occupy approximately 11,000 square feet of office space.  Our lease for this facility has a maximum term ending October 20, 2018, with early termination at our option on October 18, 2013, with advance notice. This facility is used primarily by our International segment.

In addition to our Bethesda, Maryland facility,downtown Washington, DC and London, England facilities, our research operations are principally run out of leased spaces in San Diego, California; Columbia, Maryland; White Marsh, Maryland; London, England; Glasgow, Scotland; and Paris, France. Additionally, we lease office space in a variety of other metropolitan areas, which generally house our field sales offices. These locations include, without limitation, the following: New York; Los Angeles; Chicago; San Francisco; Boston; Manchester, England; Orange County, California; Philadelphia; Houston; Atlanta; Phoenix; Detroit; Pittsburgh; Iselin, New Jersey; Fort Lauderdale; Denver; Dallas; Kansas City; Cleveland; Cincinnati; Tustin, California; Indianapolis; Austin; Salt Lake City; Seattle; and St. Louis.  Our subsidiaries, PPR and Resolve Technology, share space with CoStar in one facility leased in Boston, Mas sachusetts.

We believe these facilities are suitable and appropriately support our business needs.

22

Item 3.

Currently, and from time to time, we are involved in litigation incidental to the conduct of our business. We are not a party to any lawsuit or proceeding that, in the opinion of our management based on consultations with legal counsel, is likely to have a material adverse effect on our financial position or results of operations.

Item 4.

We did not submit any matters to a vote of our security holders during the quarter ended December 31, 2008.

 
2023

 
PART II

Item 5.
Market for the Registrant’s Common Stock, Related Stockholder Matters and Issuer Purchases of Equity Securities

Price Range of Common Stock. Our common stock is traded on the Nasdaq Global Select Market®Market under the symbol “CSGP.” The following table sets forth, for the periods indicated, the high and low daily closing prices per share of our common stock, as reported by the Nasdaq Global Select Market®.Market.

  High  Low 
       
Year Ended December 31, 2007      
First Quarter $52.15  $43.44 
Second Quarter $55.71  $44.95 
Third Quarter $58.49  $50.70 
Fourth Quarter $61.65  $44.48 
         
Year Ended December 31, 2008        
First Quarter $45.31  $36.55 
Second Quarter $51.36  $44.39 
Third Quarter $56.70  $43.57 
Fourth Quarter $45.20  $27.00 
 
  High  Low 
Year Ended December 31, 2009      
First Quarter $35.93  $24.23 
Second Quarter $40.09  $31.10 
Third Quarter $41.57  $33.97 
Fourth Quarter $44.43  $38.35 
         
Year Ended December 31, 2010        
First Quarter $42.97  $38.22 
Second Quarter $45.95  $38.80 
Third Quarter $49.53  $37.66 
Fourth Quarter $57.75  $48.86 
As of February 1, 2009,3, 2011, there were approximately 260438 holders of record of our common stock.

Dividend Policy. We have never declared or paid any dividends on our common stock. Any future determination to pay dividends will be at the discretion of our Board of Directors, subject to applicable limitations under Delaware law, and will be dependent upon our results of operations, financial position and other factors deemed relevant by our Board of Directors. We do not anticipate paying any dividends on our common stock during the foreseeable future, but intend to retain any earnings for future growth of our business.

Recent Issues of Unregistered Securities. We did not issue any unregistered securities during the quarteryear ended December 31, 2008.2010.

Issuer Purchases of Equity Securities.    The following table is a summary of our repurchases of common stock during each of the three months in the quarter ended December 31, 2008:2010:

ISSUER PURCHASES OF EQUITY SECURITIES

Month, 2008Total Number of Shares PurchasedAverage Price Paid per ShareTotal Number of Shares Purchased as Part of Publicly Announced Plans or ProgramsMaximum Number of Shares that May Yet Be Purchased Under the Plans or Programs
Month, 2010 Total Number of Shares Purchased  Average Price Paid per Share  Total Number of Shares Purchased as Part of Publicly Announced Plans or Programs  Maximum Number of Shares that May Yet Be Purchased Under the Plans or Programs 
October 1 through 31¾¾¾  ¾   ¾   ¾   ¾ 
November 1 through 30¾¾¾  ¾   ¾   ¾   ¾ 
December 1 through 31
    4,220 (1)
$29.37¾¾  30,400(1) $55.70   ¾   ¾ 
Total4,220$29.37¾¾  30,400  $55.70   ¾   ¾ 


(1) The number of shares purchased consists of shares of common stock tendered by employees to the Company to satisfy the employees’ tax withholding obligations arising as a result of vesting of restricted stock grants under the Company’s 1998 Stock Incentive Plan, as amended, and the Company’s 2007 Stock Incentive Plan, as amended, which shares were purchased by the Company based on their fair market value on the vesting date.  None of these share purchases were part of a publicly announced program to purchase common stock of the Company.
 
2124

 
Stock Price Performance Graph

The stock performance graph below shows how an initial investment of $100 in our common stock would have compared to:

·  An equal investment in the Standards & Poor's Stock 500 (“S&P 500”) Index.

·  An equal investment in the S&P 500 Application Software Index.
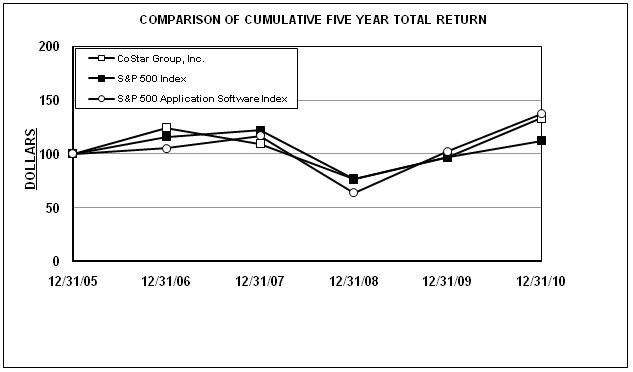
The comparison covers the period beginning December 31, 2003,2005, and ending on December 31, 2008,2010, and assumes the reinvestment of any dividends. You should note that this performance is historical and is not necessarily indicative of future price performance.


 Company / Index
 12/31/05  12/31/06  12/31/07  12/31/08  12/31/09  12/31/10 
 CoStar Group, Inc.
  100   124.07   109.45   76.30   96.76   133.33 
 S&P 500 Index
  100   115.79   122.16   76.96   97.33   111.99 
 S&P 500 Application Software Index
  100   105.33   117.00   63.96   102.21   137.37 

       
 Company / Index
12/31/0312/31/0412/31/0512/31/0612/31/0712/31/08
 CoStar Group, Inc.
100110.74103.53128.44113.3178.99
 S&P 500 Index
100110.88116.33134.70142.1089.53
 S&P 500 Application Software Index
100111.63123.57130.15144.5779.03
 
 
2225

 
Item 6.
SeSelectedlected Consolidated Financial and Operating Data

Selected Consolidated Financial and Operating Data
(in thousands, except per share data and other operating data)

The following table provides selected consolidated financial and other operating data for the five years ended December 31, 2008.2010. The consolidated statement of operations data shown below for each of the three years ended December 31, 2006, 2007,2008, 2009, and 20082010 and the consolidated balance sheet data as of December 31, 20072009 and 20082010 are derived from audited consolidated financial statements that are included in this report. The consolidated statement of operations data for each of the years ended December 31, 20042006 and 20052007 and the consolidated balance sheet data as of December 31, 2004, 2005,2006, 2007, and 20062008 shown below are derived from audited consolidated financial statements for those years that are not included in this report.
 
 Year Ended December 31,  Year Ended December 31, 
Consolidated Statement of Operations Data: 2004  2005  2006  2007  2008  2006  2007  2008  2009  2010 
Revenues $112,085  $134,338  $158,889  $192,805  $212,428  $158,889  $192,805  $212,428  $209,659  $226,260 
Cost of revenues  35,384   44,286   56,136   76,704   73,408   56,136   76,704   73,408   73,714   83,599 
Gross margin 76,701  90,052  102,753  116,101  139,020   102,753   116,101   139,020   135,945   142,661 
Operating expenses  69,955   82,710   88,672   98,249   99,232   88,672   98,249   99,232   104,110   119,886 
Income from operations 6,746  7,342  14,081  17,852  39,788   14,081   17,852   39,788   31,835   22,775 
Interest and other income, net  1,314   3,455   6,845   8,045   4,914   6,845   8,045   4,914   1,253   735 
Income before income taxes 8,060  10,797  20,926  25,897  44,702   20,926   25,897   44,702   33,088   23,510 
Income tax (benefit) expense , net  (16,925)  4,340   8,516   9,946   20,079 
Income tax expense, net  8,516   9,946   20,079   14,395   10,221 
Net income $24,985  $6,457  $12,410  $15,951  $24,623  $12,410  $15,951  $24,623  $18,693  $13,289 
Net income per share - basic
 $1.38  $0.35  $0.66  $0.84  $1.27  $0.66  $0.84  $1.27  $0.95  $0.65 
Net income per share - diluted
 $1.33  $0.34  $0.65  $0.82  $1.26  $0.65  $0.82  $1.26  $0.94  $0.64 
Weighted average shares outstanding - basic
  18,165   18,453   18,751   19,044   19,372   18,751   19,044   19,372   19,780   20,330 
Weighted average shares outstanding - diluted
  18,827   19,007   19,165   19,404   19,550   19,165   19,404   19,550   19,925   20,707 

 As of December 31,  As of December 31, 
Consolidated Balance Sheet Data: 2004  2005  2006  2007  2008  2006  2007  2008  2009  2010 
Cash, cash equivalents, short-term and long-term investments $117,069  $134,185  $158,148  $187,426  $224,590  $158,148  $187,426  $224,590  $255,698  $239,316 
Working capital 107,875  124,501  154,606  167,441  183,347   154,606   167,441   183,347   203,660   184,247 
Total assets 232,691  248,059  275,437  321,843  334,384   275,437   321,843   334,384   404,579   439,648 
Total liabilities 21,747  23,263  25,327  40,038  30,963   25,327   40,038   30,963   45,573   58,146 
Stockholders’ equity 210,944  224,796  250,110  281,805  303,421   250,110   281,805   303,421   359,006   381,502 

 As of December 31,  As of December 31, 
Other Operating Data: 2004 2005  2006 2007  2008  2006  2007  2008  2009  2010 
Number of subscription client sites 9,489  11,464   13,257   14,467   15,920   13,257   14,467   15,920   16,020   16,781 
Millions of properties in database 1.6  1.8   2.1   2.7   3.2   2.1   2.7   3.2   3.6   4.0 
 
 
2326

 
Item 7.

The following Management’s Discussion and Analysis of Financial Condition and Results of Operations contains “forward-looking statements,” including statements about our beliefs and expectations. There are many risks and uncertainties that could cause actual results to differ materially from those discussed in the forward-looking statements. Potential factors that could cause actual results to differ materially from those discussed in any forward-looking statements include, but are not limited to, those stated above in Item 1A. under the headings “Risk Factors ¾ Cautionary Statement Concerning Forward-Looking Statements” and “¾Risk Factors,” as well as those described from time to time in our filings with the Securities and Exchange Commission.

All forward-looking statements are based on information available to us on the date of this filing and we assume no obligation to update such statements. The following discussion should be read in conjunction with our Annual Reports on Form 10-K, Quarterly Reports on Form 10-Q, Current Reports on Form 8-K and other filings with the Securities and Exchange Commission and the consolidated financial statements and related notes in this Annual Report on Form 10-K.

Overview

CoStar Group, Inc. (“CoStar”) is the number one provider of information/information, marketing and analytic services to the commercial real estate industry in the U.S. and the U.K. based on the fact that we offer the most comprehensive commercial real estate database available, have the largest research department in the industry, provide more information/information, marketing and analytic services than any of our competitors and believe we generate more revenues than any of our competitors. We have created a standardized information/information, marketing and analytic platform where the members of the commercial real estate and related business community can continuously interact and facilitate transactions by efficiently exchanging accurate and standardized commercial real estate information. Our integrated suite of online service offerings includes informationinformati on about space available for lease, comparable sales information, tenant information, information about properties for sale, internet marketing services, analytical capabilities, information for clients' websites, information about industry professionals and their business relationships, analytic information, data integration, and industry news. We also provide market research and analysis for commercial real estate investors and lenders via our PPR service offerings and portfolio and debt management and reporting capabilities through our Resolve Technology service offerings. Our service offerings span all commercial property types, including office, industrial, retail, land, mixed-use, hospitality and multifamily.

Since 1994, we have expanded the geographical coverage of our existing information/information and marketing services and developed new information/information, marketing and analytic services. In addition to internal growth, this expansion included the acquisitions of Chicago ReSource, Inc. in Chicago in 1996 and New Market Systems, Inc. in San Francisco in 1997. In August 1998, we expanded into the Houston region through the acquisition of Houston-based real estate information provider C Data Services, Inc. In January 1999, we expanded further into the Midwest and Florida by acquiring LeaseTrend, Inc. and into Atlanta and Dallas/Fort Worth by acquiring Jamison Research, Inc. In February 2000, we acquired COMPS.COM, Inc., a San Diego-based provider of commercial real estate information. In November 2000, we acquired First Image Technologies, Inc., a California-based provider of commercial real estate software.  In September 2002, we expanded further into Portland, Oregon through the acquisition of certain assets of Napier Realty Advisors (doing business as REAL-NET). In January 2003, we established a base in the U.K. with our acquisition of London-based FOCUS Information Limited. In May 2004, we expanded into Tennessee through the acquisition of Peer Market Research, Inc., and in September 2004, we extended our coverage of the U.K. through the acquisition of Scottish Property Network (“SPN”).Network. In September 2004, we strengthened our position in Denver, Colorado through the acquisition of substantially all of the assets of RealComp, Inc., a local comparable sales information provider.

In January 2005, we acquired National Research Bureau, a Connecticut-based leading provider of U.S. shopping center information. In December 2006, our U.K. subsidiary, CoStar Limited, acquired Grecam S.A.S. (“Grecam”), a provider of commercial property information and market-level surveys, studies and consulting services located in Paris, France. In February 2007, CoStar Limited also acquired Property Investment Exchange Limited (“Propex”), a provider of commercial property information and operator of an electronic platform that facilitates the exchange of investment property located in London, England. In April 2008, we acquired the assets of First CLS, Inc. (doing business as the Dorey Companies and DoreyPRO), an Atlanta-based provider of local commercial real estate information. Most recently, in July 2009, we acquired Massachusetts-based Property and Portfolio Research, Inc. (“PPR”), a provider of real estate analysis, market forecasts and credit risk analytics to the commercial real estate industry, and its wholly owned U.K. subsidiary Property and Portfolio Research Ltd., and in October 2009, we acquired Massachusetts-based Resolve Technology, a provider of business intelligence and portfolio management software serving the institutional real estate investment industry. The more recentPPR and Resolve Technology acquisitions are discussed later in this section under the heading “Recent Acquisitions.”
 
2427

 
We have consistently worked to expand our service offerings, both in terms of geographical coverage and the scope of services offered, in order to position the company for future revenue growth.  In 2004, we began our expansion into 21 new metropolitan markets throughout the U.S., as well as and began expanding the geographical coverage of many of our existing U.S. and U.K. markets. We completed our expansion into the 21 new markets in the first quarter of 2006. In early 2005, in conjunction with the acquisition of National Research Bureau, we launched a major effort to expand our coverage of retail real estate information. The new retail component of our flagship product, CoStar Property Professional, was unveiled in May 2006 at the International Council of Shopping Centers’ convention in Las Vegas.

During the second half of 2006, in order to expand the geographical coverage of our service offerings, we began actively researching commercial properties in 81 new Core Based Statistical Areas (“CBSAs”) in the U.S., we increased our U.S. field research fleet by adding 89 vehicles and we hired researchers to staff these vehicles. In March 2007, we signed a long-term lease for a new research facility in White Marsh, Maryland, in support of our expanded research efforts and hired and trained additional researchers and other personnel. We released our CoStar Property Professional service in the 81 new CBSAs across the U.S. in the fourth quarter of 2007. Throughout our recent expansion efforts, we have remained focused on ensuring that CoStar continues to provide the quality of information our customers expect. As such, in 2010 we expanded our research operations, and we plan to continue to grow our research operations slightly in 2011 in order to continue to meet customer expectations.

During the second half of 2009, as a part of our strategy to provide subscribers with tools for conducting primary research and analysis on commercial real estate, we expanded subscribers’ capabilities to use CoStar’s database of research-verified commercial property information to conduct in-depth analysis and generate reports on trends in sales and leasing activity online. Further, in July 2009, we acquired PPR and its wholly owned subsidiary, providers of real estate investment analysis and market forecasting services.

In connection with our acquisitions of Propex, Grecam and Grecam,PPR’s wholly owned subsidiary Property and Portfolio Research Ltd., we intend to expand the coverage of our service offerings within the U.K. and to integrate our international operations more fully with those ofin the U.S.  We have gained operational efficiencies as a result of consolidating a majority of our U.K. research operations in one location in Glasgow and combining the majority of our remaining U.K. operations in one central location in London.

We intend to eventually introduce a consistent international platform of service offerings. In 2007, we introduced the “CoStar Group” as the brand encompassing our international operations.operations, and in early 2010 we launched Showcase, our Internet marketing service that provides commercial real estate professionals the opportunity to make their listings accessible to all visitors to our public websites, in the U.K. We believe that our recent U.S. and international expansion and integration efforts have created a platform for earnings.long-term growth, which we intend to continue to develop, invest in and expand.

We expect to continue to develop and distribute new services, expand existing services within our current platform, and expand and develop our sales and marketing organization. For instance, in July 2009, we expanded subscribers’ analytic capabilities to use our online database to conduct in-depth analysis and generate reports on sales and leasing activity through our acquisition of PPR and in October 2009, we acquired Resolve Technology, which enabled us to provide our customers with additional tools for analyzing commercial real estate markets. Any future expansion, including expansion through acquisitions and expansion internationally, could reduce our profitability and increase our capital expenditures. Therefore, while we expect current service offerings to remain profitable, driving overall earnings throughout 2011 and pro viding substantial cash flow for our business, it is possible that any new investments could cause us to generate losses and negative cash flow from operations in the future.

Our goal is to provide additional tools that make our research and analytics even more valuable to subscribers.  For example, we are currently focusing on integration and further development of the PPR and Resolve Technology service offerings.  We have launched an initiative to develop a discounted cash flow (DCF) forecasting and valuation solution that effectively integrates the combined capabilities of CoStar’s market and property information and PPR’s analytics and forecasting expertise with Resolve Technology’s real estate investment software expertise.  In fact,order to implement this initiative, we have incurred, and expect to continue to incur additional costs, including costs of hiring additional personnel.  While our results for 2008 reflect growthinvestments in earningsPPR and Resolve Technology have resulted a nd may continue to result in an increase in expenses, our revenues have also increased as a result of these investmentsacquisitions, and we have experienced increased cross-selling opportunities among CoStar and the acquired companies.
28

In some cases, the business operations of some of our clients continue to be negatively affected by challenging economic conditions in the U.S. and the world, resulting at times in business consolidations and, in some circumstances, business failure.  If cancellations, reductions of services and failures to pay continue at the current rate or increase, and we are unable to offset the resulting decrease in revenue by increasing sales to new or existing customers, our business.revenues may decline or grow at reduced rates.  Additionally, current economic conditions may cause customers to reduce expenses, and customers may be forced to purchase fewer services from us or cancel all services.  We compete against many other commercial real estate information, marketing and analytic service providers for busine ss.  If customers choose to cancel our services for cost-cutting or other reasons, our revenue could decline.  

There are clear signs of improving conditions in the commercial real estate industry, including heightened leasing activity and positive net absorption of office space, resulting from modest office-related job growth and recent business expansions in the U.S.  The extent and duration of continued improvement of the economy and the commercial real estate industry is unknown, as is the extent and duration of any benefits resulting from any of the governmental or private sector initiatives designed to strengthen the economy.  Because of these uncertainties and any resulting impact on our business, we may not be able to accurately forecast our revenue or earnings.  Based on current economic conditions, we believe that the Company is positioned to generate continued, sustained earnings from current operations in 2011 and for the foreseeable future.

Our financial reporting currency is the U.S. Dollar.dollar. Changes in exchange rates can significantly affect our reported results and consolidated trends.  We believe that our increasing diversification beyond the U.S. economy through our international businesses benefits our shareholdersstockholders over the long term. We also believe it is important to evaluate our operating results before and after the effect of currency changes, as it may provide a more accurate comparison of our results of operations over historical periods. Currency volatilitiesexchange rate volatility may continue, which may significantly impact (either positively or negatively) our reported financial results and consolidated trends and comparisons.period-to-period comparisons of our consolidated operations.

We expect to continue to develop and distribute new services, expand existing services within our current platform, consider strategic acquisitions and expand and develop our sales and marketing organization. For instance, in May 2008, we released CoStar Showcase®, an internet marketing service that provides commercial real estate professionals the opportunity to make their listings accessible to all visitors to our public website, www.CoStar.com. In addition, in April 2008, as described above we acquired the online commercial real estate information assets of First CLS, Inc. (doing business as the Dorey Companies and DoreyPRO). Any future expansion could reduce our profitability and increase our capital expenditures. Therefore, while we expect current service offerings to remain profitable, driving overall earnings throughout 2009 and providing substantial cash flow for our business, it is possible that any new investments could cause us to generate losses and negative cash flow from operations in the future.
  Current general economic conditions in the U.S. and the world are negatively affecting business operations for our clients and are resulting in more business consolidations and, in certain circumstances, failures. As a result of the economic conditions, we have recently seen an uptick in customer cancellations, reductions of services and failures to pay amounts due us.  If cancellations, reductions of services and failures to pay continue to rise, and we are unable to offset the resulting decrease in revenue by increasing sales to new or existing customers, our revenues will be adversely affected and our revenue may decline.  Additionally, current conditions may cause customers to reduce expenses, when reducing expenses, customers may be forced to purchase fewer services or cancel all services.  We compete against many other commercial real estate information/marketing service providers for business.  If customers choose to cancel our services for cost-cutting or other reasons, our revenue could decline.  The extent and duration of any future continued weakening of the economy is unknown and there can be no assurance that any of the governmental or private sector initiatives designed to strengthen the economy will be successful.  Because of the current uncertainties in the economic environment, we may not be able to accurately forecast our revenue.  However, we continue to believe that the company is positioned to generate continued, sustained earnings through the end of 2009.

25

We currently issue stock options and/or restricted stock and stock options to our officers, directors and employees, and as a result we record additional compensation expense in our consolidated statements of operations. We plan to continue the use of alternative stock-based compensation for our officers, directors and employees, which may include, among other things, restricted stock, restricted stock units or stock option grants that typically will require us to record additional compensation expense in our consolidated statements of operations and reduce our net income.

We incurredrecently decided to take advantage of favorable market conditions to lower our long-term occupancy costs as a tenant.  As part of our overall strategy to consolidate our London office locations and reduce occupancy costs, we relocated our London offices and in July 2010 entered into a settlement pursuant to which we terminated our lease for our former London offices.  In addition, in September 2010, we consolidated our three facilities located in the Boston, Massachusetts area, including the facilities used by CoStar, PPR and Resolve Technology, into one facility. We recorded a lease restructuring charge of approximately $4.9$1.3 million in total equity compensationgeneral and administrative expense in 2008.the third quarter of 2010 as a result of the Boston office consolidation.  In December 2010, we consolidated our New York and Isel in, New Jersey offices into one facility.  The consolidation of these facilities did not result in a lease restructuring charge.

On February 5, 2010, we took advantage of favorable market conditions and purchased an office building in downtown Washington, DC for $41.25 million for use as our new headquarters and have since relocated to this location.  The lease for our previous headquarters in Bethesda, MD expired on October 15, 2010; therefore, we incurred overlapping occupancy costs through the end of the Bethesda lease term as we transitioned to our new headquarters.  We were able to create value through our occupancy of the building in Washington, DC and on February 18, 2011 sold the building for aggregate consideration of $101.0 million, $15.0 million of which is being held in escrow to fund additional build-out and planned improvements at the building.  As part of the sale, we entered into a long-term lease with the buye r to lease back approximately 88% of the office space, where our corporate headquarters will remain.  We expect that the lease-back arrangement will result in additional expense of approximately $4.5 million to $5.0 million in 2011.
 
29

Our subscription-based information/marketinginformation services, consisting primarily of CoStar Property Professional, CoStar Tenant, CoStar COMPS Professional, and FOCUS services currently generate more than 90%94% of our total revenues. CoStar Property Professional, CoStar Tenant, and CoStar COMPS Professional are generally sold as a suite of similar services and comprise our primary service offering in our U.S. operating segment.  FOCUS is our primary service offering in our International operating segment. OurThe majority of our contracts for our subscription-based information/marketinginformation services typically have a minimum term of one year and renew automatically. Upon renewal, many of the subscription contract rates may increasechange in accordance with contract provisions or as a result of contract renegotiations. To encourage clients to use our services regularly,regu larly, we generally charge a fixed monthly amount for our subscription-based information services rather than fees based on actual system usage. Contract rates are generally based on the number of sites, number of users, organization size, the client’s business focus, geography and the number of services to which a client subscribes. Our subscription clients generally pay contract fees on a monthly basis, but in some cases may pay us on a quarterly or annual basis. We recognize this revenue on a straight-line basis over the life of the contract. Annual and quarterly advance payments result in deferred revenue, substantially reducing the working capital requirements generated by accounts receivable.

For the yeartwelve months ended December 31, 2007,2010 and 2009, our contract renewal rate for subscription-based services was overapproximately 90%.  For and 85%, respectively, and therefore our cancellation rate was approximately 10% and 15%, respectively, for the year ended December 31, 2008, oursame periods of time.  Our contract renewal rate was approximately 89%.is a quantitative measurement that is typically closely correlated with our revenue results. As discussed above, oura result, management also believes that the rate may be a reliable indicator of short-term and long-term performance.  Our trailing twelve-month contract renewal rate may continue to decline if continuing negative economic conditions lead to greater business failures and/or consolidations andamong our clients, further reductions in customer spending, andor decreases in theour customer base.

Application of Critical Accounting Policies and Estimates

The preparation of financial statements and related disclosures in conformity with U.S. generally accepted accounting principles (“GAAP”) in the United States of America requires management to make estimates and assumptions that affect the reported amounts of assets and liabilities, the disclosure of contingent assets and liabilities at the date of the financial statements and revenues and expenses during the period reported. The following accounting policies involve a “critical accounting estimate” because they are particularly dependent on estimates and assumptions made by management about matters that are highly uncertain at the time the accounting estimates are made. In addition, while we have used our best estimates based on facts and circumstances available to us at the time, different estimates reasonably could have been used in the current period.acceptable assumptions would yield different result s. Changes in the accounting estimates we use are reasonably likely to occur from period to period, which may have a material impact on the presentation of our financial condition and results of operations. We review these estimates and assumptions periodically and reflect the effects of revisions in the period that they are determined to be necessary.

Fair Value of Auction Rate Securities

Fair value is defined as the price that would be received in the sale of an asset or paid to transfer a liability in an orderly transaction between market participants.  There is a three-tier fair value hierarchy, which categorizes assets and liabilities by the inputs used in measuring fair value.  These tiers include: Level 1, defined as observable inputs such as quoted prices in active markets; Level 2, defined as inputs other than quoted prices in active markets that are either directly or indirectly observable; and Level 3, defined as unobservable inputs in which little or no market data exists, therefore requiring an entity to develop its own assumptions.  Our Level 3 assets consist of auction rate securities (“ARS”), whose underlying assets are primarily student loan securities supported by guarantees from the Federal Family Education Loan Program (“FFELP”) of the U.S. Department of Education.

Our ARS investments are not currently trading and therefore do not currently have a readily determinable market value.  Accordingly, the estimated fair value of the ARS no longer approximates par value.  We have used a discounted cash flow model to determine the estimated fair value of our investment in ARS as of December 31, 2010.  The assumptions used in preparing the discounted cash flow model include estimates for interest rates, credit spreads, timing and amount of cash flows, liquidity risk premiums, expected holding periods and default risk of the ARS.  Based on this assessment of fair value, as of December 31, 2010, we determined there was a decline in the fair value of our ARS investments of approximately $3.0 million.  The decline was deemed to be a temporary impair ment and recorded as an unrealized loss in accumulated other comprehensive loss in stockholders’ equity.  If the issuers of these ARS are unable to successfully close future auctions and/or their credit ratings deteriorate, we may be required to record additional unrealized losses in accumulated other comprehensive loss or an other-than-temporary impairment charge to earnings on these investments, which would reduce our profitability and adversely affect our financial position.

30

We have not made any material changes in the accounting methodology used to determine the fair value of the ARS.  We do not expect any material changes in the near term to the underlying assumptions used to determine the unobservable inputs used to calculate the fair value of the ARS as of December 31, 2010.  However, if changes in these assumptions occur, and, should those changes be significant, we may be exposed to additional unrealized losses in accumulated other comprehensive loss or an other-than-temporary impairment charge to earnings on these investments.

Fair Value of Deferred Consideration

Our Level 3 liabilities consist of a $3.2 million liability as of December 31, 2010 for deferred consideration related to the October 19, 2009 acquisition of Resolve Technology. The deferred consideration is for (i) a potential deferred cash payment two years after closing based on the incremental growth of Resolve Technology’s revenue, and (ii) other potential deferred cash payments for successful completion of operational and sales milestones during the period from closing through October 31, 2013, which period may be extended by the parties to a date no later than December 31, 2014.

We used a discounted cash flow model to determine the estimated fair value of our Level 3 liabilities as of December 31, 2010.  The significant assumptions used in preparing the discounted cash flow model include the discount rate, estimates for future incremental revenue growth and probabilities for completion of operational and sales milestones.

We have not made any material changes in the accounting methodology used to determine the fair value of the deferred consideration.  We do not expect any material changes in the near term to the underlying assumptions used to determine the unobservable inputs used to calculate the fair value of the deferred consideration as of December 31, 2010.  However, if changes in these assumptions occur, and, should those changes be significant, we may be required to recognize additional liabilities related to this deferred consideration.

Stock-Based Compensation

We account for equity instruments issued in exchange for employee services using a fair-value based method and we recognize the fair value of such equity instruments as an expense in the consolidated statements of operations.  We estimated the fair value of each option granted on the date of grant using the Black-Scholes option-pricing model, which requires us to estimate the dividend yield, expected volatility, risk-free interest rate and expected life of the stock option.  These assumptions and the estimation of expected forfeitures are based on multiple factors, including historical employee behavior patterns of exercising options and post-employment termination behavior, expected future employee option exercise patterns, and the historical volatility of the Company’s stock price.

We do not expect any material changes in the near term to the underlying assumptions used to calculate stock-based compensation expense for the twelve months ended December 31, 2010.  However, if changes in these assumptions occur, and, should those changes be significant, they could have a material impact on our stock-based compensation expense.

Valuation of Long-Lived and Intangible Assets and Goodwill

We assess the impairment of long-lived assets, identifiable intangibles and goodwill whenever events or changes in circumstances indicate that the carrying value may not be recoverable. Judgments made by management relate to the expected useful lives of long-lived assets and our ability to realize any undiscounted cash flows of the carrying amounts of such assets.  The accuracy of these judgments may be adversely affected by several factors, including the factors listed below:

Significant underperformance relative to historical or projected future operating results;
Significant changes in the manner of our use of the acquired assets or the strategy for our overall business;
Significant negative industry or economic trends; or
Significant decline in our market capitalization relative to net book value for a sustained period.

2631

 
When we determine that the carrying value of long-lived and identifiable intangible assets may not be recovered based upon the existence of one or more of the above indicators, we test for impairment.

Goodwill and identifiable intangible assets that are not subject to amortization are tested annually for impairment by each reporting unit on October 1st of each year for impairment and are also tested for impairment more frequently based upon the existence of one or more of the above indicators.  We consider our operating segments, U.S. and International, as our reporting units under Statement of Financial Accounting Standards (“SFAS”) No. 142FASB authoritative guidance for consideration of potential impairment of goodwill.

The goodwill impairment test is a two-step process.  The first step is to determine the fair value of each reporting unit. We estimate the fair value of each reporting unit based on a projected discounted cash flow model that includes significant assumptions and estimates including our future financial performance and a weighted average cost of capital. The fair value of each reporting unit is compared to the carrying amount of the reporting unit. If the carrying value of the reporting unit exceeds the fair value, then the second step of the process is performed to measure the impairment loss.  We measure impairment loss based on a projected discounted cash flow method using a discount rate determined by our management to be commensurate with the risk in our current business model.  As of October 1, 2010, the date of our most recent impairment analysis, the estimated fair value of each of our reporting units substantially exceeded the carrying value of our reporting units. There have been no events or changes in circumstances since the date of our impairment analysis on October 1, 2010 that would indicate that the carrying value of each reporting unit may not be recoverable.

Accounting for Income Taxes

As part of the process of preparing our consolidated financial statements, we are required to estimate our income taxes in each of the jurisdictions in which we operate. This process requires us to estimate our actual current tax exposure and assess the temporary differences resulting from differing treatment of items, such as deferred revenue or deductibility of certain intangible assets, for tax and accounting purposes. These differences result in deferred tax assets and liabilities, which are included within our consolidated balance sheets. We must then also assess the likelihood that our deferred tax assets will be recovered from future taxable income, and, to the extent we believe that it is more-likely-than not that some portion or all of our deferred tax assets will not be realized, we must establish a valuation allowance.  To the extent we establish a valuation allowance or change the allowance in a period, we must reflect the corresponding increase or decrease within the tax provision in the consolidated statements of operations.

Non-GAAP Financial Measures

We prepare and publicly release quarterly unaudited financial statements prepared in accordance with GAAP. We also disclose and discuss certain non-GAAP financial measures in our public releases. Currently,releases, investor conference calls and filings with the Securities and Exchange Commission. The non-GAAP financial measuremeasures that we may disclose isinclude EBITDA, whichadjusted EBITDA, non-GAAP net income and non-GAAP net income per diluted share.  EBITDA is our net income (loss) before interest, income taxes, depreciation and amortization. We typically disclose EBITDA on a consolidated and an operating segment basis in our earnings releases, investor conference calls and filings with the Securities and Exchange Commission. Adjusted EBITDA is different from EBITDA because we further adjust EBITDA for stock-based compensation expense, acquisition re lated costs, restructuring costs, headquarters acquisition and transition related costs and settlements and impairments incurred outside our ordinary course of business.  Non-GAAP net income and non-GAAP net income per diluted share are similarly adjusted for stock-based compensation expense, acquisition related costs, restructuring costs, headquarters acquisition and transition related costs and settlement and impairment costs incurred outside our ordinary course of business as well as purchase amortization and other related costs.  We may disclose adjusted EBITDA, non-GAAP net income and non-GAAP net income per diluted share on a consolidated basis in our earnings releases, investor conference calls and filings with the Securities and Exchange Commission. The non-GAAP financial measures that we use may not be comparable to similarly titled measures reported by other companies. Also, in the future, we may disclose different non-GAAP financial measures in order to help our investors more meaningfully evaluate and compare our future results of operations to our previously reported results of operations.operations or to those of other companies in our industry.

32

We view EBITDA, adjusted EBITDA, non-GAAP net income and non-GAAP net income per diluted share as an operating performance measuremeasures and as such we believe that the GAAP financial measure most directly comparable to itGAAP financial measure is net income (loss). In calculating EBITDA, adjusted EBITDA, non-GAAP net income and non-GAAP net income per diluted share, we exclude from net income (loss) the financial items that we believe should be separately identified to provide additional analysis of the financial components of the day-to-day operation of our business. We have outlined below the type and scope of these exclusions and the material limitations on the use of these non-GAAP financial measures as a result of these exclusions. EBITDA, isadjusted EBITDA, non-GAAP net income and non-GAAP net income per diluted share are not a measurementmeasurements of financial performance underu nder GAAP and should not be considered as a measure of liquidity, as an alternative to net income (loss) or as an indicator of any other measure of performance derived in accordance with GAAP. Investors and potential investors in our securities should not rely on EBITDA, adjusted EBITDA, non-GAAP net income and non-GAAP net income per diluted share as a substitute for any GAAP financial measure, including net income (loss). In addition, we urge investors and potential investors in our securities to carefully review the reconciliation of EBITDA to net income (loss) set forth below, in our earnings releases and in other filings with the Securities and Exchange Commission and to carefully review the GAAP financial information included as part of our Quarterly Reports on Form 10-Q and our Annual Reports on Form 10-K that are filed with the Securities and Exchange Commission, as well as our quarterly earnings releases, and compare the GAAP financial information with our EBITDA.EBITDA, adjusted EBITDA, non-GAAP net income and non-GAAP net income per diluted share.

27

EBITDA, isadjusted EBITDA, non-GAAP net income and non-GAAP net income per diluted share may be used by management to internally measure our operating and management performance and may be used by investors as a supplemental financial measuremeasures to evaluate the performance of our businessbusiness.  We believe that these non-GAAP measures, when viewed with our GAAP results and the accompanying reconciliation, we believe providesprovide additional information that is useful to gain an understanding ofunderstand the factors and trends affecting our business. We have spent more than 2123 years building our database of commercial real estate information and expanding our markets and services partially through acquisitions of complementary businesses. Due to the expansion of our information/information, marketing and analytic services, which included acquisitions, our net income (loss) has includedinclu ded significant charges for purchase amortization, depreciation and other amortization.amortization, acquisition costs and restructuring costs. EBITDA, excludesadjusted EBITDA, non-GAAP net income and non-GAAP net income per diluted share exclude these charges and providesprovide meaningful information about the operating performance of our business, apart from charges for purchase amortization, depreciation and other amortization.amortization, acquisition costs, restructuring costs and settlement and impairment costs incurred outside our ordinary course of business. We believe the disclosure of EBITDA helpsthese non-GAAP measures can help investors meaningfully evaluate and compare our performance from quarter to quarter and from year to year. We also believe EBITDA is a measurethese non-GAAP measures are measures of our ongoing operating performance because the isolation of non-cash charges, such as amortization and depreciation, and non-operatingother items, such as interest, and income taxes, stock-based compensation expenses, acquisition costs, headquarters acquisition and transition related costs, restructuring costs and settlement and impairment costs incurred outside our ordinary course of business, provides additional information about our cost structure, and, over time, helps track our operating progress. In addition, investors, securities analysts and others have regularly relied on EBITDA and may rely on adjusted EBITDA, non-GAAP net income or non-GAAP net income per diluted share to provide a financial measure by which to compare our operating performance against that of other companies in our industry.

Set forth below are descriptions of the financial items that have been excluded from our net income (loss) to calculate EBITDA and the material limitations associated with using this non-GAAP financial measure as compared to net income (loss):

 ·Purchase amortization in cost of revenues may be useful for investors to consider because it represents the use of our acquired database technology, which is one of the sources of information for our database of commercial real estate information. We do not believe these charges necessarily reflect the current and ongoing cash charges related to our operating cost structure.

 ·Purchase amortization in operating expenses may be useful for investors to consider because it represents the estimated attrition of our acquired customer base and the diminishing value of any acquired trade names. We do not believe these charges necessarily reflect the current and ongoing cash charges related to our operating cost structure.

 ·Depreciation and other amortization may be useful for investors to consider because they generally represent the wear and tear on our property and equipment used in our operations. We do not believe these charges necessarily reflect the current and ongoing cash charges related to our operating cost structure.

 ·The amount of net interest income we generate may be useful for investors to consider and may result in current cash inflows or outflows. However, we do not consider the amount of net interest income to be a representative component of the day-to-day operating performance of our business.

33

 ·Income tax expense (benefit) may be useful for investors to consider because it generally represents the taxes which may be payable for the period and the change in deferred income taxes during the period and may reduce the amount of funds otherwise available for use in our business.  However, we do not consider the amount of income tax expense (benefit) to be a representative component of the day-to-day operating performance of our business.

Set forth below are descriptions of the financial items that have been excluded from our net income (loss) to calculate adjusted EBITDA and the material limitations associated with using this non-GAAP financial measure as compared to net income (loss):

·Purchase amortization in cost of revenues, purchase amortization in operating expenses, depreciation and other amortization, interest income, net, and income tax expense (benefit) as previously described above with respect to the calculation of EBITDA.

·Stock-based compensation expense may be useful for investors to consider because it represents a portion of the compensation of our employees and executives.  Determining the fair value of the stock-based instruments involves a high degree of judgment and estimation and the expenses recorded may bear little resemblance to the actual value realized upon the future exercise or termination of the related stock-based awards. Therefore, we believe it is useful to exclude stock-based compensation in order to better understand the long-term performance of our core business.

·The amount of acquisition related costs incurred may be useful for investors to consider because they generally represent professional service fees and direct expenses related to the acquisition.  Because we do not acquire businesses on a predictable cycle we do not consider the amount of acquisition related costs to be a representative component of the day-to-day operating performance of our business.

·The amount of restructuring costs incurred may be useful for investors to consider because they generally represent costs incurred in connection with a change in the makeup of our properties or personnel.  We do not consider the amount of restructuring related costs to be a representative component of the day-to-day operating performance of our business.

·The amount of headquarters acquisition and transition related costs incurred may be useful for investors to consider because they generally represent the overlapping rent and building carrying costs, legal costs and other related costs incurred to relocate our headquarters. We do not believe these charges necessarily reflect the current and ongoing charges related to our operating cost structure.

·The amount of material settlement and impairment costs incurred outside of our ordinary course of business may be useful for investors to consider because they generally represent gains or losses from the settlement of litigation matters. We do not believe these charges necessarily reflect the current and ongoing cash charges related to our operating cost structure.

The financial items that have been excluded from our net income (loss) to calculate non-GAAP net income and non-GAAP net income per diluted share are stock-based compensation, acquisition related costs, restructuring costs, headquarter acquisition and transition related costs and settlement and impairment costs incurred outside our ordinary course of business.  These items are discussed above with respect to the calculation of adjusted EBITDA along with the material limitations associated with using this non-GAAP financial measure as compared to net income (loss).  We subtract an assumed provision for income taxes to calculate non-GAAP net income.  We assume a 40% tax rate in order to approximate our long-term effective corporate tax rate.

Non-GAAP net income per diluted share is a non-GAAP financial measure that represents non-GAAP net income divided by the number of diluted shares outstanding for the period used in the calculation of GAAP net income per diluted share.

Management compensates for the above-described limitations of using non-GAAP measures by using a non-GAAP measure only to supplement our GAAP results and to provide additional information that is useful to gain an understanding ofunderstand the factors and trends affecting our business.
 
2834

 
The following table shows our EBITDA reconciled to our net income and our net cash flows from operating, investing and financing activities for the indicated periods (in thousands):

  Year Ended December 31, 
  2006  2007  2008 
Net income                                                                                 $12,410  $15,951  $24,623 
Purchase amortization in cost of revenues                                                                                  1,205   2,170   2,284 
Purchase amortization in operating expenses                                                                                  4,183   5,063   4,880 
Depreciation and other amortization                                                                                  6,421   8,914   9,637 
Interest income, net                                                                                  (6,845)  (8,045)  (4,914)
Income tax expense, net                                                                                  8,516   9,946   20,079 
EBITDA                                                                                 $25,890  $33,999  $56,589 
             
Cash flows provided by (used in)            
Operating activities                                                                              $32,587  $51,732  $40,908 
Investing activities                                                                              $(28,329) $(40,331) $52,430 
Financing activities                                                                              $5,582  $8,161  $11,475 
  Year Ended December 31, 
  2008  2009  2010 
Net income
 $24,623  $18,693  $13,289 
Purchase amortization in cost of revenues
  2,284   2,389   1,471 
Purchase amortization in operating expenses
  4,880   3,412   2,305 
Depreciation and other amortization
  9,637   8,875   9,873 
Interest income, net
  (4,914)  (1,253)  (735)
Income tax expense, net
  20,079   14,395   10,221 
EBITDA
 $56,589  $46,511  $36,424 
             
Net cash flows provided by (used in)            
Operating activities
 $40,908  $38,445  $39,269 
Investing activities
 $52,430  $4,532  $(40,504)
Financing activities
 $11,475  $2,172  $2,042 

Consolidated Results of Operations

The following table provides our selected consolidated results of operations for the indicated periods (in thousands of dollars and as a percentage of total revenue):

 Year Ended December 31,  Year Ended December 31, 
 2006  2007  2008  2008  2009  2010 
Revenues  $158,889   100.0% $192,805   100.0% $212,428   100.0% $212,428   100.0% $209,659   100.0% $226,260   100.0%
Cost of revenues   56,136   35.3   76,704   39.8   73,408   34.6   73,408   34.6   73,714   35.2   83,599   36.9 
Gross margin  102,753   64.7  116,101   60.2  139,020   65.4   139,020   65.4   135,945   64.8   142,661   63.1 
Operating expenses:                                                
Selling and marketing  41,774   26.3  51,777   26.9  41,705   19.6   41,705   19.6   42,508   20.3   52,455   23.2 
Software development  12,008   7.6  12,453   6.5  12,759   6.0   12,759   6.0   13,942   6.6   17,350   7.7 
General and administrative  30,707   19.3  36,569   19.0  39,888   18.8   39,888   18.8   44,248   21.1   47,776   21.1 
Gain on lease settlement, net ¾   0.0  (7,613)  (3.9) ¾   0.0 
Purchase amortization   4,183   2.6   5,063   2.6   4,880   2.3   4,880   2.3   3,412   1.6   2,305   1.0 
Total operating expenses   88,672   55.8   98,249   51.0   99,232   46.7   99,232   46.7   104,110   49.7   119,886   53.0 
Income from operations  14,081   8.9  17,852   9.3  39,788   18.7   39,788   18.7   31,835   15.2   22,775   10.1 
Interest and other income, net  6,845   4.3   8,045   4.2   4,914   2.3   4,914   2.3   1,253   0.6   735   0.3 
Income before income taxes  20,926   13.2  25,897   13.4  44,702   21.0   44,702   21.0   33,088   15.8   23,510   10.4 
Income tax expense, net   8,516   5.4   9,946   5.2   20,079   9.5   20,079   9.5   14,395   6.9   10,221   4.5 
Net income  $12,410   7.8% $15,951   8.3% $24,623   11.6% $24,623   11.6% $18,693   8.9% $13,289   5.9%
 
Comparison of Year Ended December 31, 20082010 and Year Ended December 31, 20072009

Revenues. Revenues grewincreased to $212.4$226.3 million in 2008,2010, from $192.8$209.7 million in 2007. This2009. The increase in revenue wasrevenues of approximately $16.6 million is primarily due to further penetrationadditional revenue from our July 2009 acquisition of our subscription-based information/marketing services, and successful cross-selling of our services to our customers in existing markets, combined with continued high renewal rates.PPR. Our subscription-based information services consist primarily of CoStar Property Professional, CoStar Tenant, CoStar COMPS Professional, FOCUS services and Propex services. As of December 31, 2008,2010, our subscription-based information/marketinginformation services represented more than 90%94% of our total revenues.

29

Gross Margin. Gross margin increased to $139.0$142.7 million in 2008,2010, from $116.1$135.9 million in 2007.2009. The increase in the amount of gross margin was principally due to a $16.6 million increase in revenue partially offset by an increase in cost of revenues.  The gross margin percentage increaseddecreased to 65.4%63.1% in 2008,2010, from 60.2%64.8% in 2007.2009.  The decrease in the percentage of gross margin was principally due to an increase in the gross margin resulted principally from revenue growth from our subscription-based information/marketing services and a decrease in cost of revenues.  Cost of revenues decreasedincreased to $73.4$83.6 million for the year ended December 31, 2008,in 2010, from $76.7$73.7 million for the year ended December 31, 2007in 2009.  The increase in cost of revenues was principally due to expansion costs that were incurred in 2007 that were not incurred in 2008.additional cost of revenues of approximately $7.4 million included as a result of our July 2009 acquisition of PPR and our October 2009 acquisition of Resolve Technology.

35

Selling and Marketing Expenses. Selling and marketing expenses decreasedincreased to $41.7$52.5 million in 2008,2010, from $51.8$42.5 million in 2007,2009, and decreasedincreased as a percentage of revenues to 19.6%23.2% in 2008,2010, from 26.9%20.3% in 2007.2009. The decreaseincrease in the amount and percentage of selling and marketing expenses was principallyprimarily due to a reduction in personnelincreased costs of approximately $5.4$6.1 million primarily due to the fact that theincreased sales force sold services with a smaller average price point in 2008, which resulted in lower average contract values compared to 2007. Additionally, there was a decrease inpersonnel costs, as well as additional selling and marketing initiativesexpenses of approximately $2.3$1.7 million in 2008.included as a result of our July 2009 acquisition of PPR and our October 2009 acquisition of Resolve Technology.

Software Development Expenses. Software development expenses slightly increased to $12.8$17.4 million in 2008,2010, from $12.5$13.9 million in 2007,2009, and slightly decreasedincreased as a percentage of revenues to 6.0%7.7% in 2008,2010, from 6.5%6.6% in 2007.2009.  The decreaseincrease in the amount and percentage of software development expense was primarily due to increased revenues in 2008.additional software development expenses included as a result of our July 2009 acquisition of PPR and our October 2009 acquisition of Resolve Technology.

General and Administrative Expenses. General and administrative expenses increased to $39.9$47.8 million in 2008,2010, from $36.6$44.2 million in 2007,2009, and decreased slightlyremained relatively constant as a percentage of revenues to 18.8%at 21.1% in 2008, from 19.0% in 2007.2010 and 2009. The increase in the amount of general and administrative expenses was principally due to $2.8 million recorded for the settlement of two litigation matters in June 2010, the 2010 lease restructuring charge of approximately $1.3 million, and additional general and administrative expense of approximately $2.0 million included as a result of an increaseour July 2009 acquisition of approximately $2.5 million in legal feesPPR and an increaseour October 2009 acquisition of $1.6 millionResolve Technology, partially offset by a decrease in bad debt expense.

Gain on Lease Settlement, Net. On September 14, 2007, CoStar U.K Limited, a wholly owned U.K. subsidiaryexpense of CoStar, entered into an agreement with Trafigura Limited to assign to Trafigura our leasehold interest in our office space located in London. The lease assignment was effective on December 19, 2007. As a result, CoStar U.K. Limited was paid $7.6 million, net of expenses, for the assignment of the lease. There were no gains on lease settlements in 2008.approximately $3.0 million.

Purchase Amortization. Purchase amortization slightly decreased to $4.9$2.3 million in 2008,2010, from $5.1$3.4 million in 2007,2009, and slightly decreased as a percentage of revenues to 2.3%1.0% in 2008,2010, from 2.6%1.6% in 2007.2009.  The decrease in purchase amortization expense is due to the completion of amortization for certain identifiable intangible assets in 2010.

Interest and Other Income, Net. Interest and other income, net decreased to $4.9approximately $700,000 in 2010, from $1.3 million in 2008, from $8.0 million in 2007. Although, cash and cash equivalents, short-term and long-term investments were higher in 2008 than in 2007, our interest and other income decreased2009, primarily due to lower average interest rates in 2008 compared to 2007.short-term investment balances.

Income Tax Expense, Net. Income tax expense, net increaseddecreased to $20.1$10.2 million in 2008,2010, from $9.9$14.4 million in 2007.2009. This increasedecrease was primarily due to higherlower income before income taxes for 2008 due to our growth and profitability, in addition to a higher effective tax rate in 2008.  The effective tax rate was lower in 2007 due to the gain on lease settlement in the U.K. that was completed in December 2007.  The lease settlement resulted in income in the U.K., which reduced the overall effective tax rate.taxes.

Comparison of Business Segment Results for Year Ended December 31, 20082010 and Year Ended December 31, 20072009

Due to the increased size, complexity and funding requirements associated with our international expansion, in 2007 we began toWe manage our business geographically in two operating segments, with our primary areas of measurement and decision-making being the U.S. and International, which includes the U.K. and France. Management relies on an internal management reporting process that provides segment revenue and operating segment EBITDA, which is our net income before interest, income taxes, depreciation and amortization. Management believes that operating segment EBITDA is an appropriate measure for evaluating the operational performance of our operating segments. EBITDA is used by management to internally measure our operating and management performance and to evaluate the performance of our business. However, this measure should be considered in addition to, not as a substitute for or superior to, income from operations or other measures of financial performance preparedp repared in accordance with GAAP.
30


Segment Revenues. CoStar Property Professional, CoStar Tenant, and CoStar COMPS Professional are generally sold as a suite of similar services and comprise our primary service offering in our U.S. operating segment. U.S. revenues increased to $190.1$208.5 million from $170.3$191.6 million for the years ended December 31, 20082010 and 2007,2009, respectively. This increase in U.S. revenue iswas primarily due to further penetrationadditional revenues as a result of our U.S. subscription-based information/marketing services and the successful cross-sellingJuly 2009 acquisition of our service to our customers, combined with a continued high renewal rate.PPR.  FOCUS is our primary service offering in our International operating segment.  International revenues slightlydecreased approximately $300,000 primarily due to foreign currency fluctuations, offset by intersegment revenues of approximately $1.3 million attrib utable to services performed by Property and Portfolio Research Ltd. for PPR.  PPR and Property and Portfolio Research Ltd. were acquired in July 2009.  Intersegment revenues are eliminated from total revenues.

36

Segment EBITDA. U.S. EBITDA decreased to $22.4$39.6 million from $22.5$47.7 million for the years ended December 31, 20082010 and 2007,2009, respectively. ThisThe decrease isin U.S. EBITDA was due primarily to foreign currency fluctuations.  In their functional currency,additional personnel cost of approximately $8.1 million, increased legal settlement charges of approximately $800,000, and a lease restructuring charge of approximately $1.3 million related to the consolidation of our three facilities located in Boston, Massachusetts, partially offset by a decrease in bad debt expense of approximately $2.2 million. International revenuesEBITDA increased 7.2%to a loss of $3.2 million for the year ended December 31, 2008 compared to2010 from a $1.2 million loss for the year ended December 31, 2007.

Segment EBITDA. U.S.2009. This increased loss was primarily due to approximately $2.0 million paid in connection with the settlement of our litigation with Nokia U.K. Limited.  International EBITDA increased to $58.8 million from $32.9 millionincludes a corporate allocation of approximately $400,000 and $500,000 for the years ended December 31, 20082010 and 2007, respectively. The increase in U.S. EBITDA was due to increased revenues, and lower sales and marketing personnel costs, partially offset by an increase in legal fees and bad debt expense. International EBITDA decreased to a loss of $2.2 million from $1.1 million earnings for the years ended December 31, 2008 and 2007, respectively. This decrease is primarily due to gain on lease settlement of $7.6 million in 2007 that did not occur in 2008. International EBITDA also includes a corporate allocation of approximately $1.1 million and $2.6 million for the years ended December 31, 2008 and 2007,2009, respectively. The corporate allocation represents costs incurred for U.S. employees involved in international management and expansion activities.

Comparison of Year Ended December 31, 20072009 and Year Ended December 31, 20062008

Revenues. Revenues grew 21.3%decreased to $192.8$209.7 million in 2007,2009, from $158.9$212.4 million in 2006. This2008. Revenues from customers in our International operations decreased $4.3 million primarily due to foreign currency fluctuations. The decrease in International revenues was partially offset by an increase in U.S. revenues of approximately $1.5 million.  The increase in U.S. revenues is primarily due to additional revenue has resultedof approximately $8.5 million from continued penetrationour July 2009 acquisition of our subscription-based information services, the successful cross-selling of additional productsPPR partially offset by decreased sales resulting from a difficult commercial real estate and services to our existing customer base combined with a continued high renewal rate, and additional revenues from acquired companies, including Grecam, acquired in December 2006, and Propex, acquired in February 2007.economic environment. Our subscription-based information services consist primarily of CoStar Property Professional, CoStar Tenant, CoStar COMPS Professional, FOCUS services and Propex services. As of December 31, 2007,20 09, our subscription-based information services represented approximatelymore than 95% of our total revenues.

Gross Margin. Gross margin increaseddecreased to $116.1$135.9 million in 2007,2009, from $102.8$139.0 million in 2006.2008. The gross margin percentage decreased to 60.2%64.8% in 2007,2009, from 64.7%65.4% in 2006. The increase in the gross margin amount resulted principally from revenue growth from our subscription-based information services, partially offset by an increase in cost of revenues.2008. The decrease in the amount and percentage of gross margin percentage was principally due to an increasea $2.8 million decrease in the cost of revenues to $76.7 million for 2007, from $56.1 million for 2006. The increaserevenue in cost of revenues resulted from increased research department hiring, training, compensation and other operating costs, principally in connection with our retail and 81 new CBSA expansions, and our international expansion, as well as increased cost structures associated with the acquisitions of Grecam and Propex.2009.

Selling and Marketing Expenses. Selling and marketing expenses increased to $51.8$42.5 million in 2007,2009, from $41.8$41.7 million in 2006,2008, and increased as a percentage of revenues to 26.9%20.3% in 2007,2009, from 26.3%19.6% in 2006.2008. The increase in the amount and percentage of selling and marketing expenses iswas primarily due to increased growth in the sales force, increasedadditional selling and marketing efforts,expenses of approximately $1.7 million incurred by PPR and included as well as increased cost structures associated with thea result of our July 2009 acquisition of Propex.PPR.  The increase was offset by an approximately $900,000 decrease due to foreign currency fluctuations.

Software Development Expenses. Software development expenses increased to $12.5$13.9 million in 2007,2009, from $12.0$12.8 million in 2006,2008, and decreasedincreased as a percentage of revenues to 6.5%6.6% in 2007,2009, from 7.6%6.0% in 2006.2008.  The  increase in the amount and percentage of software development expenses was primarily due to increased costs associated with the continuedadditional software development expenses of an international platform. The decrease in the percentage was primarily due toapproximately $600,000 incurred by PPR and included as a result of our continued efforts to controlJuly 2009 acquisition of PPR as well as additional development expenses of approximately $400,000 incurred by Resolve Technology, and leverageincluded as a result of our costs.October 2009 acquisition of Resolve Technology.

General and Administrative Expenses. General and administrative expenses increased to $36.6$44.2 million in 2007,2009, from $30.7$39.9 million in 2006,2008, and decreased slightlyincreased as a percentage of revenues to 19.0%21.1% in 2007,2009, from 19.3%18.8% in 2006.2008. The increase primarily includes increases in personnelthe amount and percentage of general and administrative expenses cost structures associated with thewas principally a result of an increase of acquisition and deal related costs of approximately $700,000, an increase in legal fees of $2.0 million and additional general and administrative expenses of approximately $1.1 million incurred by PPR and included as a result of our July 2009 acquisition of Propex and equity compensation.
31

Gain on Lease Settlement, Net. On September 14, 2007, CoStar U.K. Limited, a wholly owned U.K. subsidiary of CoStar, entered into an agreement with Trafigura Limited to assign to Trafigura our leasehold interest in our office space located in London. The lease assignment was effective on December 19, 2007. As a result, CoStar U.K. Limited was paid $7.6 million, net of expenses, for the assignment of the lease. There were no gains on lease settlements in 2006.PPR.

Purchase Amortization. Purchase amortization increaseddecreased to $5.1$3.4 million in 2007,2009, from $4.2$4.9 million in 2006,2008, and remained consistentdecreased as a percentage of revenues at 2.6%to 1.6% in 2007 and 2006. This increase2009, from 2.3% in the amount was2008.  The decrease in purchase amortization expense is due to the acquisitionscompletion of Grecam and Propex.amortization for certain identifiable intangible assets in 2009.

Interest and Other Income, Net. Interest and other income, net increaseddecreased to $8.0$1.3 million in 2007,2009, from $6.8$4.9 million in 2006. This increase was primarily2008. Interest and other income, net decreased due to higher interest income as a result of higher total short-term investment balances for 2007 and increasedlower average interest rates for 2007 asin 2009 compared to 2006.2008.

Income Tax Expense, Net. Income tax expense, net increaseddecreased to $9.9$14.4 million in 2007,2009, from $8.5$20.1 million in 2006.2008. This increasedecrease was due to higherlower income before income taxes for 2007, partially offset byas a lower effective tax rate.  The effective tax rate was lower in 2007 due to the gain on lease settlement in the U.K. that was completed in December 2007.  The lease settlement resulted in income in the U.K., which reduced the overall effective tax rate.result of our decreased profitability.

37

Comparison of Business Segment Results for Year Ended December 31, 20072009 and Year Ended December 31, 20062008

Due to the increased size, complexity and funding requirements associated with our international expansion, in 2007 we began toWe manage our business geographically in two operating segments, with our primary areas of measurement and decision-making being the U.S. and International, which includes the U.K. and France. Management relies on an internal management reporting process that provides operating segment revenue and segment EBITDA, which is our net income before interest, income taxes, depreciation and amortization. Management believes that operating segment EBITDA is an appropriate measure for evaluating the operational performance of our segments. EBITDA is used by management to internally measure our operating and management performance and to evaluate the performance of our business. However, this measure should be considered in addition to, not as a substitute for or superior to, income from operations or other measures of financial performance prepared in accordance with GAAP.

Segment Revenues. CoStar Property Professional, CoStar Tenant, and CoStar COMPS Professional are generally sold as a suite of similar services and comprise our primary service offering in our U.S. operating segment. U.S. revenues increased to $170.3$191.6 million from $146.1$190.1 million for the years ended December 31, 20072009 and 2006,2008, respectively. This increase in U.S. revenue is due to further penetrationadditional revenues of our U.S. subscription-based information services and the successful cross-selling into our customer base across our service platform in existing markets, combined with a continued high renewal rate. International revenues increased to $22.5approximately $8.5 million from $12.8 million for the years ended December 31, 2007 and 2006, respectively. This increase in international revenue is principallyincluded as a result of our July 2009 acquisition of PPR, partially offset by a combinationdecrease of further penetrationapproximately $7.0 million in U.S. revenues due to decreased sales resulting from a difficult commercial real estate and economic environment. FOCUS is our primary service offering in our International operatin g segment.  International revenues decreased approximately $4.3 million primarily due to foreign currency fluctuations, partially offset by intersegment revenues of our subscription-based informationapproximately $900,000 attributable to services in the U.K.performed by Property and the acquisitions of Grecam and Propex.Portfolio Research Ltd. for PPR.  Intersegment revenues are eliminated from total revenues.

Segment EBITDA. U.S. EBITDA increaseddecreased to $32.9$47.7 million from $26.2$58.8 million for the years ended December 31, 20072009 and 2006,2008, respectively. The increasedecrease in U.S. EBITDA was due primarily to additional costs incurred by PPR, which we acquired in July of 2009 and increased revenues, partially offset by increased research costs and growth in our sales force as a result of our expansion.legal fees. International EBITDA increaseddecreased to $1.1 million from a loss of $315,000$1.2 million for the yearsyear ended December 31, 2007 and 2006, respectively.2009 from a $2.2 million loss for the year ended December 31, 2008. This increasedecreased loss is primarily due to the assignment of our leasea lower corporate allocation in 2009 as compared to Trafigura, offset by our increased investment in international expansion.2008. International EBITDA also includes a corporate allocation of approximately $2.6 million$500,000 and $1.0$1.1 million for the years ended December 31, 20072009 and 2006,2008, respectively. The corporate allocation represents costs incurred for U.S. employees involved in international managementm anagement and expansion activities.

32

Consolidated Quarterly Results of Operations

The following tables summarize our consolidated results of operations on a quarterly basis for the indicated periods (in thousands, except per share amounts, and as a percentage of total revenues):

  2007  2008 
  Mar. 31  Jun. 30  Sep. 30  Dec. 31  Mar. 31  Jun. 30  Sep. 30  Dec. 31 
Revenues $44,831  $47,794  $49,340  $50,840  $52,264  $53,478  $53,757  $52,929 
Cost of revenues  17,826   19,318   19,551   20,009   19,721   18,341   17,613   17,733 
Gross margin  27,005   28,476   29,789   30,831   32,543   35,137   36,144   35,196 
Operating expenses  25,569   28,230   25,952   18,498   25,313   26,627   24,864   22,428 
Income from operations  1,436   246   3,837   12,333   7,230   8,510   11,280   12,768 
Interest and other income, net  1,862   1,891   2,072   2,220   1,938   1,243   951   782 
Income before income taxes  3,298   2,137   5,909   14,553   9,168   9,753   12,231   13,550 
Income tax expense, net  1,484   962   2,659   4,841   4,126   4,318   5,586   6,049 
Net income $1,814  $1,175  $3,250  $9,712  $5,042  $5,435  $6,645  $7,501 
Net income per share - basic
 $0.10  $0.06  $0.17  $0.51  $0.26  $0.28  $0.34  $0.39 
Net income per share - diluted
 $0.09  $0.06  $0.17  $0.50  $0.26  $0.28  $0.34  $0.38 


  2009  2010 
  Mar. 31  Jun. 30  Sep. 30  Dec. 31  Mar. 31  Jun. 30  Sep. 30  Dec. 31 
Revenues $51,370  $50,064  $53,590  $54,635  $55,093  $55,838  $57,144  $58,185 
Cost of revenues  16,894   16,744   19,149   20,927   21,200   20,360   20,762   21,277 
Gross margin  34,476   33,320   34,441   33,708   33,893   35,478   36,382   36,908 
Operating expenses  23,735   25,129   27,490   27,756   28,791   30,987   30,247   29,861 
Income from operations  10,741   8,191   6,951   5,952   5,102   4,491   6,135   7,047 
Interest and other income, net  442   322   263   226   238   196   156   145 
Income before income taxes  11,183   8,513   7,214   6,178   5,340   4,687   6,291   7,192 
Income tax expense, net  5,077   3,897   2,889   2,532   2,451   1,436   2,909   3,425 
Net income $6,106  $4,616  $4,325  $3,646  $2,889  $3,251  $3,382  $3,767 
Net income per share - basic
 $0.31  $0.24  $0.22  $0.18  $0.14  $0.16  $0.17  $0.18 
Net income per share - diluted
 $0.31  $0.24  $0.22  $0.18  $0.14  $0.16  $0.16  $0.18 
  2007  2008 
  Mar. 31  Jun. 30  Sep. 30  Dec. 31  Mar. 31  Jun. 30  Sep. 30  Dec. 31 
Revenues  100.0%  100.0%  100.0%  100.0%  100.0%  100.0%  100.0%  100.0%
Cost of revenues  39.8   40.4   39.6   39.4   37.7   34.3   32.8   33.5 
Gross margin  60.2   59.6   60.4   60.6   62.3   65.7   67.2   66.5 
Operating expenses  57.0   59.1   52.6   36.4   48.5   49.8   46.2   42.4 
Income from operations  3.2   0.5   7.8   24.2   13.8   15.9   21.0   24.1 
Interest and other income, net  4.1   4.0   4.2   4.4   3.7   2.3   1.8   1.5 
Income before income taxes  7.3   4.5   12.0   28.6   17.5   18.2   22.8   25.6 
Income tax expense, net  3.3   2.0   5.4   9.5   7.9   8.0   10.4   11.4 
Net income  4.0%  2.5%  6.6%  19.1%  9.6%  10.2%  12.4%  14.2%
38

 
   2009 2010
   Mar. 31 Jun. 30 Sep. 30 Dec. 31 Mar. 31 Jun. 30 Sep. 30 Dec. 31
Revenues  100.0%  100.0%  100.0%  100.0%  100.0%  100.0%  100.0%  100.%
Cost of revenues  32.9   33.4   35.7   38.3   38.5   36.5   36.3   36.6 
Gross margin  67.1   66.6   64.3   61.7   61.5   63.5   63.7   63.4 
Operating expenses  46.2   50.2   51.3   50.8   52.3   55.5   52.9   51.3 
Income from operations  20.9   16.4   13.0   10.9   9.3   8.0   10.7   12.1 
Interest and other income,net  0.9   0.6   0.5   0.4   0.4   0.4   0.3   0.2 
Income before income taxes  21.8   17.0   13.5   11.3   9.7   8.4   11.0   12.4 
Income tax expense, net  9.9   7.8   5.4   4.6   4.4   2.6   5.1   5.9 
Net income  11.9%  9.2%  8.1%  6.7%  5.2%  5.8%  5.9%  6.5%
Recent Acquisitions

Propex. PPR. On February 16, 2007, CoStar LimitedJuly 17, 2009, we acquired all of the issued and outstanding equity securities of PPR, and its wholly owned subsidiary Property Investment Exchange Limited (“Propex”)and Portfolio Research Ltd., a providerproviders of web-based commercial property informationreal estate analysis, market forecasts and operator of an electronic platform that facilitates the exchange of investment property in the U.K. Propex’s suite of electronic platforms and listing websites give users accesscredit risk analytics to the U.K. commercial property investmentreal estate industry. We acquired PPR from DMG Information, Inc. (“DMGI”) in exchange for 572,999 shares of CoStar common stock, which had an aggregate value of approximately $20.9 million as of the closing date. On July 17, 2009, we issued 433,667 shares of our common stock to DMGI, and leasing markets. CoStar Limitedwe issued the remaining 139,332 shares to DMGI on September 28, 2009 after taking into account post-closing purchase price adjustments.

Resolve Technology. On October 19, 2009, we acquired all of the outstanding capital stock of PropexResolve Technology, a Delaware corporation, for approximately $22.0$4.5 million, consisting of approximately $3.4 million in cash deferred consideration and 21,52625,886 shares of CoStar common stock.

First CLS, Inc. On April 1, 2008, we acquired certain assetsstock, which had an aggregate value of First CLS, Inc. (doing businessapproximately $1.1 million as the Dorey Companies and DoreyPRO), an Atlanta-based provider of local commercial real estate information for $3.0 million in initial cash consideration and deferred consideration payable within approximately six months of the one-year anniversaryclosing date.  The shares are subject to a three-year lockup, pursuant to which one-third were released in October 2010.  The purchase price is subject to certain post-closing adjustments.  Additionally, the seller may be entitled to receive (i) a potential deferred cash payment due approximately two years after closing based on the incremental growth of closing.Resolve Technology’s revenue as of September 2011 over its revenue as of September 2009, and (ii) other potential deferred cash payments for successful completion of operational and sales milestones during the period from closing through no later than October 31, 2013, which period may be extended by the parties to a date no later than December 31, 2014.

Accounting Treatment. These acquisitions were accounted for usingas purchase accounting. Thebusiness combinations.  For each of the PPR and Resolve Technology acquisitions, the purchase price for the Propex acquisition was primarily allocated to acquiredvarious working capital accounts, developed technology, customer base, trade names,trademarks, non-competition agreements and goodwill. The purchase price for the First CLS, Inc. acquisition was primarily allocated to acquired customer base.  The acquired customer base for the acquisitions, which consists of one distinct intangible asset for each acquisition and is composed of acquired customer contracts and the related customer relationships, is being amortized on a 125% declining balance method over ten years. The Propex acquired trade name is beingidentified intangibles are amortized on a straight-line basis over
33

three years.  We recorded goodwill of approximately $15.0 million their estimated useful lives.  Goodwill for the Propex acquisition and $1.1 million for the First CLS, Inc. acquisition. Goodwillthese acquisitions is not amortized, but is subject to annual impairment tests.   The results of operations of PropexPPR and First CLS, Inc.Resolve Technology have been consolidated with those of the Company since the respective dates of the acquisitions and are not considered material to our consolidated financial statements. Accordingly, pro forma financial information has not been presented for either acquisition.
any of the acquisitions.

Liquidity and Capital Resources

Our principal sources of liquidity are cash, cash equivalents and short-term investments. Total cash, cash equivalents and short-term investments were $195.3$210.1 million at December 31, 20082010 compared to $187.4$226.0 million at December 31, 2007.2009. The increasedecrease in cash, cash equivalents and short-term investments for the year ended December 31, 20082010 was primarily due to netthe purchase of a 169,429 square-foot office building located at 1331 L Street, NW in downtown Washington, DC for a purchase price of $41.25 million in cash, from operating activitiesand approximately $1.7 million in acquisition costs, as well as other purchases of property and equipment of approximately $40.9$14.4 million, partially offset by the reclassificationnet cash flows from operating and financing activities of approximately $33.1 million par value auction rate securities (“ARS”) from$41.3 million.

39

Changes in cash, cash equivalents and short-term investments are dependent upon changes in, among other things, working capital items such as accounts receivable, accounts payable, various accrued expenses and deferred revenues, as well as changes in our capital structure due to long-termstock option exercises, purchases and sales of short-term investments in the first quarter of 2008.and similar events.

Net cash provided by operating activities for the year ended December 31, 20082010 was $40.9$39.3 million compared to $51.7$38.5 million for the year ended December 31, 2007.2009. The $10.8 million decrease$800,000 increase in net cash provided by operating activities is primarily due to approximately $3.3a $4.4 million decreased cash receipts on accounts receivablenet increase in changes in operating assets and liabilities due to increased balancesdifferences in timing of collection of receipts and declining economic conditionspayments of disbursements partially offset by a decrease of approximately $3.6 million from net income plus non-cash items.   The $4.4 million net increase in changes in operating assets and increased payments forliabilities was primarily related to an increase in changes in accounts payable and accrued expensesother liabilities of approximately $9.8$5.2 million which includedand approximately $3.0 million in increased change in deferred revenue primarily associated with cash received for annual bill ings.  The increase in the $2.9change in accounts payable and other liabilities of approximately $5.2 million paymentincludes increased changes in accruals of deferred considerationrent of approximately $2.6 million, $800,000 accrued in June 2010 in anticipation of the settlement of a litigation matter, $900,000 remaining in the lease restructuring charge associated with our Boston lease consolidation in September 2010 and increased accruals associated with the operations of our recent acquisitions and new headquarters.  These increases in changes in operating assets and liabilities were partially offset by a decrease in the changes in income tax receivable of approximately $4.9 million, as the tax legislation enacted during the fourth quarter of 2010 allowed us to deduct 100% of qualifying assets purchased after September 8, 2010, resulting in an income tax receivable recorded for the Propex acquisition, approximately $400,000 in payments for a Propex data agreement, and payment of approximately $1.4 million in value added taxes related to the lease settlement.year ended December 31, 2010.

Net cash provided byused in investing activities was $52.4$40.5 million for the year ended December 31, 2008,2010, compared to net cash used inprovided by investing activities of $40.3$4.5 million for the year ended December 31, 2007.2009. This $92.7$45.0 million increaseincreased change in net cash provided byused in investing activities was primarily due to the decision to investFebruary 2010 purchase of our new headquarters in money market funds and U.S. treasuries instead of short-term investment instruments, which resulteddowntown Washington, DC, as well as capital improvements for our facilities in a net sale of investments of approximately $59.12010, partially offset by the $3.2 million in the year ended December 31, 2008 compared to a net purchase of investments of approximately $9.3 million in the year ended December 31, 2007.  In addition, we used $3.0 million in cash as initial considerationpayments for the purchase of First CLS, Inc. in the year ended December 31, 2008, as compared to $16.7 million in cash consideration used for the acquisition of Propex in the year ended December 31, 2007. We also purchased approximately $10.6 million less in property, equipment and other assets during the year ended December 31, 2008 compared to the year ended December 30, 2007.acquisitions.

Net cash provided by financing activities was $11.5relatively consistent at $2.0 million for the year ended December 31, 20082010 compared to $8.2$2.2 million for the year ended December 31, 2007.  The higher net cash provided by financing activities in 2008 compared to 2007 is due to an increase in excess tax benefits from stock options partially offset by a decrease in proceeds from the exercise of stock options.2009.

Contractual Obligations. The following table summarizes our principal contractual obligations at December 31, 20082010 and the effect such obligations are expected to have on our liquidity and cash flows in future periods (in thousands):
  Total  2011   2012-2013   2014-2015  
2016 and
thereafter
 
Operating leases                                                            $47,453  $8,691  $13,105  $6,908  $18,749 
Purchase obligations(1)                                                           
  6,763   2,797   3,366   600   ¾ 
Total contractual principal cash obligations $54,216  $11,488  $16,471  $7,508  $18,749 
 
  Total  2009  2010-2011  2012-2013  
2014 and
thereafter
 
Operating leases                                                            $23,596  $8,264  $10,041  $4,276  $1,015 
Purchase obligations(1)                                                           
  2,971   2,242   294   290   145 
Total contractual principal cash obligations $26,567  $10,506  $10,335  $4,566  $1,160 

 
(1)Amounts do not include (i) contracts with initial terms of twelve months or less, or (ii) multi-year contracts that may be terminated by a third party or us.  Amounts do not include unrecognized tax benefits of $1.8 million due to uncertainty regarding the timing of future cash payments.

During 2008,In 2010, we incurredpurchased our new headquarters in downtown Washington, DC, and made capital expenditures of approximately $3.7$14.4 million.  We expect to make total capital expenditures in 20092011 of approximately $4.0$7.0 million to $7.0$10.0 million.

On February 2, 2011, 1331 L Street Holdings, LLC (“Holdings”), our wholly owned subsidiary, and GLL L-Street 1331, LLC (“GLL”), an affiliate of Munich-based GLL Real Estate Partners GmbH, entered into a purchase and sale agreement pursuant to which (i) Holdings agreed to sell to GLL its interest in the 169,429 square-foot office building located at 1331 L Street, NW, in downtown Washington, DC, and (ii) CoStar Realty Information, Inc. (“CoStar Realty”), our wholly owned subsidiary, agreed to enter into a lease expiring May 31, 2025 (with two 5-year renewal options) with GLL to lease back 149,514 square feet of the office space located in this building, which we will continue to use as our corporate headquarters.  The closing of the sale took place on February 18, 2011. The aggregate consid eration paid by GLL to Holdings pursuant to the purchase and sale agreement was $101.0 million in cash, $15.0 million of which is being held in escrow to fund additional build-out and planned improvements at the building.
 
3440

 
The lease is effective as of June 1, 2010 and will expire May 31, 2025. The initial base rent is $38.50 per square foot of occupied space, escalating 2.5% per year commencing June 1, 2011. Our obligation to pay rent increases proportionately over the course of the first year of the lease as certain scheduled completion dates for our build out, on a floor-by-floor basis, are reached.  Our occupied space under the lease will consist of the entire rented premises as of June 1, 2011, from and after which we will owe rent on the entire leased premises.  Annual lease payments for 2011 will be approximately $5.0 million.  This obligation is not included in the above December 31, 2010 contractual obligation table.

Our future capital requirements will depend on many factors, including our operating results, expansion efforts, and our level of acquisition activity or other strategic transactions.

To date, we have grown in part by acquiring other companies and we may continue to make acquisitions.  Our acquisitions may vary in size and could be material to our current operations. We expect tomay use cash, stock, debt or other means of funding to make these acquisitions.   In April 2008,the third quarter of 2009, we paid $3.0 million in initial cash consideration and made a commitmentissued 572,999 shares of common stock to DMGI, Inc. for deferred consideration payable within approximately six monthsall of the one-year anniversaryissued and outstanding capital stock of PPR and its wholly owned subsidiary.  In October 2009, we acquired Resolve Technology for approximately $3.4 million ($2.9 million was paid upon acquisition and $450,000 was deferred until February 2010) in cash and 25,886 shares of CoStar common stock, which had an aggregate value of approximately $1.1 million as of the closing date.  The shares are subject to a three-year lockup, pursuant t o which one-third were released in October 2010.  Additionally, the seller may be entitled to receive (i) a potential deferred cash payment due approximately two years after closing based on the incremental growth of Resolve Technology’s revenue as of September 2011 over its revenue as of September 2009, and (ii) other potential deferred cash payments for successful completion of additional operational and sales milestones during the online commercial real estate information assets of First CLS, Inc., an Atlanta-based provider of local commercial real estate information.period from closing through October 31, 2013, which period may be extended by the parties to a date no later than December 31, 2014.

Based on current plans, we believe that our available cash combined with positive cash flow provided by operating activities should be sufficient to fund our operations for at least the next 12 months.

As of December 31, 2008,2010, we had $33.1$32.2 million par value of long-term investments in student loan ARS, which failed to settle at auctions.  The majority of these investments are of high credit quality with AAA credit ratings and are primarily securities supported by guarantees from the Federal Family Education Loan Program (“FFELP”) of the U.S. Department of Education.  While we continue to earn interest on these investments, the investments are not liquid in the short term.  In the event we need to immediately access these funds, we may have to sell these securities at an amount below par value.  Based on our ability to access our cash, cash equivalents and other short-term investments and our expected operating cash flows, we do not anticipate having to sell these investmentsinv estments below par value in order to operate our business in the foreseeable future.

AsOn December 8, 2009, a former employee filed a lawsuit against us in the United States District Court for the Southern District of December 31, 2008,California alleging violations of the Fair Labor Standards Act and California state wage-and-hour laws and is seeking unspecified damages under those laws.  The complaint also seeks to declare a class of all similarly situated employees to pursue similar claims.  In May 2010, the parties reached a preliminary agreement to settle this lawsuit, and in June 2010, we had utilized allaccrued approximately $800,000 in anticipation of our U.S. net operating loss carryforwards for federal income tax purposes.  Asmaking a result, we expect our cash payments for taxes tosettlement payment that will formally resolve this litigation.  We anticipate the payment will be approximately $20.0 million to $23.0 million in 2009.due during the second quarter of 2011.

Inflation may affect the way we operate in the U.S. and abroad. In general, we believe that over time we are able to increase the prices of our services to counteract the majority of the inflationary effects of increasing costs.  We do not believe the impact of inflation has significantly affected our operations, and we do not anticipate that inflation will have a material impact on our operations in 2009.

Recent Accounting Pronouncements

In June 2006, the Financial Accounting Standards Board (“FASB”) issued FASB Interpretation No. 48 “Accounting for Uncertainty in Income Taxes – an interpretation of FASB Statement No. 109” (“FIN 48”), which became effective for our company as of January 1, 2007. FIN 48 addresses the determination of how tax benefits claimed or expected to be claimed on a tax return should be recorded in the financial statements. Under FIN 48, we must recognize the tax benefit from an uncertain tax position only if it is more-likely-than-not that the tax position will be sustained upon examination by the taxing authorities, based on the technical merits of the position. The tax benefits recognized in the financial statements from such a position are measured based on the largest benefit that has a greater than fifty percent likelihood of being realized upon ultimate resolution. Our reassessment of our tax positions in accordance with FIN 48 did not have a material impact on our results of operations and financial position.

In September 2006, the FASB issued SFAS No. 157, “Fair Value Measurements” (“SFAS 157”), which defines fair value, establishes a framework for measuring fair value in accordance with GAAP and expands disclosures about fair value measurements. SFAS 157 does not require any new fair value measurements under GAAP and is effective for fiscal years beginning after November 15, 2007.  In February 2008, the FASB issued FASB Staff Position (“FSP”) 157-2, “Partial Deferral of the Effective Date of Statement 157”, (“FSP 157-2”), which delays the effective date of SFAS 157 to January 1, 2009 for all non-financial assets and non-financial liabilities, except those that are recognized or disclosed at fair value in the consolidated financial statements on a recurring basis (at least annually).  Effective January 1, 2008, we adopted the portion of SFAS 157 that was not deferred under FSP 157-2.  The adoption of SFAS 157 did not have a material impact on our results of operations and financial position.  In October 2008, the FASB issued FSP 157-3, “Determining the Fair Value of a Financial Asset in a Market That Is Not Active” (“FSP 157-3”), which clarifies the application of SFAS 157 to markets that are not active and provides an example illustrating key considerations for determining the fair value of financial assets when their markets are not active. FSP 157-3 was effective upon issuance, including prior periods for which financial statements had not been issued. The adoption of this standard did not have an impact on our results of operations or financial position.
35

In February 2007, the FASB issued SFAS No. 159, “Fair Value Option for Financial Assets and Financial Liabilities — Including an amendment of FASB Statement No. 115” (“SFAS 159”), which permits entities to choose to measure many financial instruments and certain other items at fair value that are not currently required to be measured at fair value. SFAS 159 is effective for fiscal years beginning on or after December 31, 2007. We adopted SFAS 159 on January 1, 2008 and have not elected to apply the fair value option to any of our financial instruments.  The adoption of SFAS 159 did not have a material impact on our results of operations and financial position.

In December 2007, the FASB issued SFAS No. 141 (Revised 2007), “Business Combinations” (“SFAS 141R”), which will change the accounting for any business combination we enter into with an acquisition date after December 31, 2008. Under SFAS 141R, an acquiring entity will be required to recognize all the assets acquired and liabilities assumed in a transaction at the acquisition date fair value with limited exceptions. SFAS 141R will change the accounting treatment and disclosure for certain specific items in a business combination. SFAS 141R will have an impact on accounting for business combinations once adopted, but its effect will depend upon the specifics of any business combination with an acquisition date subsequent to December 31, 2008.

In December 2007, the FASB issued SFAS No. 160, “Noncontrolling Interests in Consolidated Financial Statements—An Amendment of ARB No. 51” (“SFAS 160”), which establishes new accounting and reporting standards for the non-controlling interest in a subsidiary and for the deconsolidation of a subsidiary. SFAS 160 is effective for fiscal years beginning on or after December 15, 2008. The adoption of SFAS 160 is not expected to have a material impact on our results of operations or financial position.

In April 2008, the FASB issued FSP SFAS No. 142-3, “Determination of the Useful Life of Intangible Assets” (“FSP 142-3”),authoritative guidance on existing intangibles or expected future cash flows from those intangibles, which is effective for all fiscal years and interim periods beginning after December 15, 2008. Early adoption of FSP 142-3this guidance is not permitted. FSP 142-3This guidance requires additional footnote disclosures about the impact of our ability or intent to renew or extend agreements related to existing intangibles or expected future cash flows from those intangibles, how we account for costs incurred to renew or extend such agreements, the time until the next renewal or extension period by asset class, and the amount of renewal or extension costs capitalized, if any. For any intangibles acquired after December 31, 2008, FSP 142-3this guidance requires that we consider our experience regarding renewal and extensions of similar arrangements in determining the useful life.life of such intangibles. If we do not have experience with similar arrangements, FSP 142-3this guidance requires that we use the assumptions of a market participant putting the intangible to its highest and best use in determining the useful life. We adopted this guidance on January 1, 2009. The adoption of FSP 142-3 will impact intangibles acquired after December 31, 2008, and its effect will depend on the specifics of the intangible acquired.

In May 2008, the FASB issued SFAS No. 162, “The Hierarchy of Generally Accepted Accounting Principles” (“SFAS 162”), which identifies the sources of accounting principles and the framework for selecting the principles to be used in the preparation of financial statements. SFAS 162 is effective as of November 17, 2008. The adoption of SFAS 162this guidance did not have a material impact on our results of operations or financial position.
41

In June 2008, the FASB issued authoritative guidance related to determining whether instruments granted in share-based payment transactions are participating securities.  This guidance clarifies that unvested share-based payment awards with a right to receive non-forfeitable dividends are participating securities. This guidance is effective for all annual and interim periods beginning after December 15, 2008. Adoption of this standard will require the two-class method of calculating basic earnings per share to the extent that unvested share-based payments have the right to receive non-forfeitable dividends. We adopted this guidance on January 1, 2009.  The adoption of this guidance did not have a material impact on our results of operations or financial position.

In April 2009, the FASB issued authoritative guidance related to the initial recognition, measurement and subsequent accounting for assets and liabilities arising from pre-acquisition contingencies in a business combination. It requires that such assets acquired or liabilities assumed be initially recognized at fair value at the acquisition date if fair value can be determined during the measurement period. When fair value cannot be determined, companies should typically account for the acquired contingencies using existing guidance. This guidance requires that companies expense acquisition and deal-related costs that were previously allowed to be capitalized.  This guidance also requires that a systematic and rational basis for subsequently measuring and accounting for the assets or liabilities be developed depending on the ir nature. This guidance was effective for contingent assets or liabilities arising from business combinations with an acquisition date on or after January 1, 2009.   The adoption of this guidance changes the accounting treatment and disclosure for certain specific items in a business combination with an acquisition date subsequent to December 31, 2008.  We adopted this guidance on January 1, 2009, and expensed acquisition and deal-related costs associated primarily with the acquisitions of PPR and Resolve Technology.

In April 2009, the FASB issued authoritative guidance for determining whether a market is active or inactive, and whether a transaction is distressed. This guidance is applicable to all assets and liabilities (financial and non-financial) and will require enhanced disclosures. We adopted this guidance for our interim period ending June 30, 2009. The adoption of this guidance did not have a material impact on our results of operations or financial position, but did require additional disclosures in our financial statements.

In April 2009, the FASB issued authoritative guidance requiring disclosures in interim reporting periods concerning the fair value of financial instruments that were previously only required in the annual financial statements. We adopted the provisions of this guidance for our interim period ending June 30, 2009. The adoption of this guidance did not have a material impact on our results of operations or financial position, but did require additional disclosures in our financial statements.

In April 2009, the FASB issued authoritative guidance that redefines what constitutes an other-than-temporary impairment, defines credit and non-credit components of an other-than-temporary impairment, prescribes their financial statement treatment, and requires enhanced disclosures relating to such impairments. We adopted this guidance for our interim period ending June 30, 2009. The adoption of this guidance did not have a material impact on our results of operations or financial position, but did require additional disclosures in our financial statements.

In May 2009, the FASB issued authoritative guidance which establishes general standards of accounting for and disclosure of events that occur after the balance sheet date but before financial statements are issued. This guidance was effective for all interim and annual reporting periods ending after June 15, 2009. This guidance has not and is not expected to result in significant changes in the subsequent events that we report, either through recognition or disclosure, in our financial statements.

In June 2009, the FASB issued authoritative guidance to amend the manner in which entities evaluate whether consolidation is required for variable interest entities (VIE).  Previously, variable interest holders were required to determine whether they had a controlling financial interest in a VIE based on a quantitative analysis of the expected gains and/or losses of the entity.  The new guidance requires an enterprise with a variable interest in a VIE to qualitatively assess whether it has a controlling financial interest in the entity, and if so, whether it is the primary beneficiary.  This guidance also requires that companies continually evaluate VIEs for consolidation, rather than assessing whether consolidation is required based upon the occurrence of triggering events.  This guidance enhan ces disclosures to provide financial statement users with greater transparency about transfers of financial assets and a transferor’s continuing involvement with transferred financial assets. This guidance will be effective for the first annual reporting period beginning after November 15, 2009. This guidance did not materially impact our results of operations, financial position or related disclosures.
42

In June 2009, the FASB issued authoritative guidance which replaced the previous hierarchy of U.S. GAAP and establishes the FASB Codification as the single source of authoritative U.S. GAAP recognized by the FASB to be applied by nongovernmental entities. This guidance is effective for financial statements issued for interim and annual periods ending after September 15, 2009. This guidance did not materially impact our results of operations or financial position, but did require changes to our disclosures in our financial statements.

In July 2009, the FASB issued authoritative guidance to improve the consistency with which companies apply fair value measurements guidance to liabilities.  This guidance is effective for interim and annual periods beginning after September 30, 2009.  This guidance did not materially impact our results of operations, financial position or related disclosures.

In October 2009, the FASB issued authoritative guidance that amends existing guidance for identifying separate deliverables in a revenue-generating transaction where multiple deliverables exist, and provides guidance for measuring and allocating revenue to one or more units of accounting.  In addition, the FASB issued authoritative guidance on arrangements that include software elements.  Under this guidance, tangible products containing software components and non-software components that are essential to the functionality of the tangible product will no longer be within the scope of the software revenue recognition guidance. This guidance is effective using the prospective application or the retrospective application for revenue arrangements entered into or materially modified in fiscal years beginning on or afte r June 15, 2010 with earlier application permitted. This guidance did not materially impact our results of operations or financial position.

In January 2010, the FASB issued authoritative guidance that amends the disclosure requirements related to recurring and nonrecurring fair value measurements. This guidance requires new disclosures on the transfers of assets and liabilities between Level 1 (assets and liabilities measured using observable inputs such as quoted prices in active markets) and Level 2 (assets and liabilities measured using inputs other than quoted prices in active markets that are either directly or indirectly observable) of the fair value measurement hierarchy, including the amount and reason of the transfers. Additionally, this guidance requires a roll forward of activities on purchases, sales, issuance, and settlements of the assets and liabilities measured using significant unobservable inputs (Level 3 fair value measurements). This guidance is effect ive for interim and annual reporting periods beginning after December 15, 2009, with the exception of the additional disclosure for Level 3 assets and liabilities, which is effective for fiscal years beginning after December 15, 2010, and for interim periods within those fiscal years. This guidance did not materially impact our results of operations or financial position, but did require changes to our disclosures in our interim and annual financial statements.

In February 2010, the FASB issued authoritative guidance that amends the disclosure requirements related to subsequent events. This guidance includes the definition of a Securities and Exchange Commission filer, removes the definition of a public entity, redefines the reissuance disclosure requirements and allows public companies to omit the disclosure of the date through which subsequent events have been evaluated.  This guidance is effective for financial statements issued for interim and annual periods ending after February 2010. This guidance did not materially impact our results of operations or financial position, but did require changes to our disclosures in our financial statements.

In April 2010, the FASB issued authoritative guidance related to the criteria that should be met for determining whether the milestone method of revenue recognition is appropriate.  A vendor can recognize consideration that is contingent upon achievement of a milestone in its entirety as revenue in the period in which the milestone is achieved if the milestone is: (a) commensurate with either the vendor’s performance to achieve the milestone or the enhancement of the value of the item delivered; (b) relates solely to past performance; and (c) is reasonable relative to all deliverables and payment terms in the arrangement.  This guidance is effective on a prospective basis for financial statements issued for interim and annual periods ending after June 15, 2010 with early adoption permitted.  The ado ption of this guidance did not have a material impact on our results of operations or financial position.
43

Item 7A.
Quantitative and Qualitative Disclosures About Market Risk

We provide information/information, marketing and analytic services to the commercial real estate and related business community in the U.S., U.K. and France. Our functional currency for our operations in the U.K. and France is the local currency. As such, fluctuations in the British Pound and Euro may have an impact on our business, results of operations and financial position.  For the year ended December 31, 2008,2010, revenue denominated in foreign currencies was approximately 11%8.4% of total revenue.  For the year ended December 31, 2008,2010, our revenue would have decreased by approximately $2.2$1.9 million if the U.S. dollar exchange rate used strengthened by 10%.  In addition, we have assets and liabilities denominated in foreign currencies.  A 10% strengthening of the U.S. dollar exchange rate against all currenciescurrenc ies with which we have exposure at December 31, 20082010 would have resulted in a decreasean increase of approximately $340,000$900,000 in the carrying amount of net assets. For the year ended December 31, 2008,2010, our revenue would have increased by approximately $2.2$1.9 million if the U.S. dollar exchange rate used weakened by 10%. In addition, we have assets and liabilities denominated in foreign currencies.  A 10% weakening of the U.S. dollar exchange rate against all currencies with which we have exposure at December 31, 20082010 would have resulted in a increasedecrease of approximately $340,000$900,000 in the carrying amount of net assets. We currently do not use financial instruments to hedge our exposure to exchange rate fluctuations with respect to our foreign subsidiaries. We may seek to enter hedging transactions in the future to reduce our exposure to exchange rate fluctuations, but we may be unable to enter into hedging transactions successfully, on acceptable terms or at all.  As of December 31, 2008,2010, accumulated other comprehensive income (loss)c omprehensive loss included a loss from foreign currency translation adjustments of approximately $8.5$5.9 million.

36

We do not have material exposure to market risks associated with changes in interest rates related to cash equivalent securities held as of December 31, 2008.2010.  As of December 31, 2008,2010, we had $195.3$210.1 million of cash, cash equivalents and short-term investments.  If there is an increase or decrease in interest rates, there will be a corresponding increase or decrease in the amount of interest earned on our cash, cash equivalents and short-term investments.  Based on our ability to access our cash, cash equivalents and short-term investments, and our expected operating cash flows, we do not believe that increases or decreases in interest rates will impact our ability to operate our business in the foreseeable future.

Included within our long-term investments are investments in mostly AAA rated student loan ARS.  These securities are primarily securities supported by guarantees from the FFELP of the U.S. Department of Education.  As of December 31, 2008,2010, auctions for $33.1$32.2 million of our investments in auction rate securities failed.  As a result, we may not be able to sell these investments at par value until a future auction on these investments is successful. In the event we need to immediately liquidate these investments, we may have to locate a buyer outside the auction process, who may be unwilling to purchase the investments at par, resulting in a loss.  Based on an assessment of fair value of these investments in ARS as of December 31, 2008,2010, we determined that there was a decline in the fair value of our ARS investments of approximately $3.7$3.0 million, which was deemed to be a temporary impairment and recorded as an unrealized loss in accumulated other comprehensive incomeloss in stockholders’ equity.  If the issuers are unable to successfully close future auctions and their credit ratings deteriorate, we may be required to adjust the carrying value of these investments as a temporary impairment and recognize a greater unrealized loss in accumulated other comprehensive incomeloss or as an other-than-temporary impairment charge to earnings. Based on our ability to access our cash, cash equivalents and short-term investments, and our expected operating cash flows, we do not anticipate having to sell these securities below par value in order to operate our business in the foreseeable future.  See Note 2 to the consolidated financial statements for further discussion.

We have approximately $70.7$98.4 million in intangible assets as of December 31, 2008.2010. As of December 31, 2008,2010, we believe our intangible assets will be recoverable, however, changes in the economy, the business in which we operate and our own relative performance could change the assumptions used to evaluate intangible asset recoverability. In the event that we determine that an asset has been impaired, we would recognize an impairment charge equal to the amount by which the carrying amount of the assets exceeds the fair value of the asset. We continue to monitor these assumptions and their effect on the estimated recoverability of our intangible assets.

Item 8.
Financial Statements and Supplementary Data

Financial Statements meeting the requirements of Regulation S-X are set forth beginning at page F-1. Supplementary data is set forth in “Management’s Discussion and Analysis of Financial Condition and Results of Operations” under the caption “Consolidated Results of Operations.”

Item 9.
Changes in and Disagreements with Accountants on Accounting and Financial Disclosure

None.

44


Item 9A.
Controls and Procedures

We maintain disclosure controls and procedures that are designed to ensure that information required to be disclosed in our reports filed or submitted under the Exchange Act is recorded, processed, summarized and reported, within the time periods specified in the Securities and Exchange Commission’s rules and forms, and that such information is accumulated and communicated to our management, including our Chief Executive Officer and Chief Financial Officer, as appropriate, to allow for timely decisions regarding required disclosure. In designing and evaluating the disclosure controls and procedures, management recognized that any controls and procedures, no matter how well designed and operated, can provide only reasonable assurance of achieving the desired control objectives, and management is required to apply its judgment in evaluating the cost-benefit relationship of possible controls and procedures.

37

As of December 31, 2008,2010, we carried out an evaluation, under the supervision and with the participation of our management, including our Chief Executive Officer and our Chief Financial Officer, of the effectiveness of the design and operation of our disclosure controls and procedures. Based on the foregoing, our Chief Executive Officer and Chief Financial Officer concluded that our disclosure controls and procedures were effective and were operating at the reasonable assurance level.

Management’s Report on Internal Control over Financial Reporting

Management of CoStar is responsible for establishing and maintaining adequate internal control over financial reporting and for the assessment of the effectiveness of internal control over financial reporting. As defined by the Securities and Exchange Commission, internal control over financial reporting is a process designed by, or supervised by, the Company’s principal executive and principal financial officers, to provide reasonable assurance regarding the reliability of financial reporting and the preparation of financial statements in accordance with generally accepted accounting principles.

The Company’s internal control over financial reporting is supported by written policies and procedures, that (1) pertain to the maintenance of records that, in reasonable detail, accurately and fairly reflect the transactions and dispositions of the Company’s assets; (2) provide reasonable assurance that transactions are recorded as necessary to permit preparation of financial statements in accordance with generally accepted accounting principles, and that receipts and expenditures of the Company are being made only in accordance with authorizations of the Company’s management and directors; and (3) provide reasonable assurance regarding prevention or timely detection of unauthorized acquisition, use or disposition of the Company’s assets that could have a material effect on the financial statements.

Because of its inherent limitations, internal control over financial reporting may not prevent or detect misstatements.  Projections of any evaluation of effectiveness to future periods are subject to the risk that controls may become inadequate because of changes in conditions, or that the degree of compliance with the policies or procedures may deteriorate.

In connection with the preparation of the Company's annual financial statements, management of the Company has undertaken an assessment of the effectiveness of the Company’s internal control over financial reporting as of December 31, 20082010 based on criteria established in Internal Control – Integrated Framework issued by the Committee of Sponsoring Organizations of the Treadway Commission (“the COSO Framework”).  Management's assessment included an evaluation of the design of the Company's internal control over financial reporting and testing of the operational effectiveness of the Company's internal control over financial reporting.

Based on this assessment, management did not identify any material weakness in the Company's internal control, and management has concluded that the Company's internal control over financial reporting was effective as of December 31, 2008.2010.

Ernst & Young LLP, the independent registered public accounting firm that audited the Company's financial statements included in this report, has issued an attestation report on the effectiveness of internal control over financial reporting, a copy of which is included in this Annual Report on Form 10-K.

45

There have been no changes in our internal control over financial reporting during our most recent fiscal quarter that have materially affected, or are reasonably likely to materially affect, our internal control over financial reporting.

Item 9B.

None.

38

 
PART III

Item 10.
Directors, Executive Officers and Corporate Governance

The information required by this Item is incorporated by reference to our Proxy Statement for our 20092011 annual meeting of stockholders.

Item 11.

The information required by this Item is incorporated by reference to our Proxy Statement for our 20092011 annual meeting of stockholders.

Item 12.
Security OwnershipOwnership of Certain Beneficial Owners and Management and Related Stockholder Matters

The information required by this Item is incorporated by reference to our Proxy Statement for our 20092011 annual meeting of stockholders.

Item 13.
Certain RelationshipsRelationships and Related Transactions, and Director Independence

The information required by this Item is incorporated by reference to our Proxy Statement for our 20092011 annual meeting of stockholders.

Item 14.
Principal AccountantAccountant Fees and Services

The information required by this Item is incorporated by reference to our Proxy Statement for our 20092011 annual meeting of stockholders.

PART IV

Item 15.
Exhibits and Financial Statement Schedules

(a)(1) The following financial statements are filed as a part of this report: CoStar Group, Inc. Consolidated Financial Statements.

(a)(2) AllFinancial statement schedules:
Schedule II – Valuation and Qualifying Accounts
Years Ended December 31, 2008, 2009, and 2010 (in thousands):
Allowance for doubtful accounts and billing adjustments (1)
 
Balance at
Beginning
of Year
  
Charged to
Expense
  
Write-offs,
Net of
Recoveries
  
Balance at End
of Year
 
Year ended December 31, 2008
 $2,959  $4,042  $3,788  $3,213 
Year ended December 31, 2009
 $3,213  $4,172  $4,522  $2,863 
Year ended December 31, 2010
 $2,863  $1,471  $1,919  $2,415 

(1)  Additions to the allowance for doubtful accounts are charged to bad debt expense. Additions to the allowance for billing adjustments are charged against revenues.
46

Additional financial statement schedules are omitted because they are not applicable or not required or because the required information is incorporated herein by reference or included in the financial statements or related notes included elsewhere in this report.

(a)(3) The documents required to be filed as exhibits to this Report under Item 601 of Regulation S-K are listed in the Exhibit Index included elsewhere in this report, which list is incorporated herein by reference.
 
3947


Pursuant to the requirements of Section 13 of the Securities Act of 1934, as amended, the Registrant has duly caused this report to be signed on its behalf by the undersigned, thereunto duly authorized, in the City of Bethesda, StateWashington, District of Maryland,Columbia, on the 2324rdth day of February 2009.2011.
 
 COSTAR GROUP, INC.
   
 By:/S/s/ Andrew C. Florance
  Andrew C. Florance
  President and Chief Executive Officer

KNOW ALL PERSONS BY THESE PRESENTS, that each individual whose signature appears below constitutes and appoints Andrew C. Florance and Brian J. Radecki, and each of them individually, as their true and lawful attorneys-in-fact and agents, with full power of substitution, for him and in his name, place and stead, in any and all capacities, to sign any and all amendments to this report, and to file the same, with all exhibits thereto and to all documents in connection therewith, with the Securities and Exchange Commission, granting unto said attorneys-in-fact and agents, and each of them, full power and authority to do and perform each and every act and thing requisite and necessary to be done in connection therewith, as fully to all intents and purposes as he might or could do in person, herein by ratifying and confirming all that said attorneys-in-fact and agents or any of them, or his or their substitute or substitutes, may lawfully do or cause to be done by virtue hereof.

Pursuant to the requirements of the Securities Act of 1934, as amended, this report has been signed by the following persons on behalf of the registrant and in the capacities and on the dates indicated.
 
Signature
 
Capacity
 Date
     
     
/S/s/ Michael R. Klein Chairman of the Board February 23, 200924, 2011
Michael R. Klein    
     
/S/s/ Andrew C. Florance Chief Executive Officer and February 23, 200924, 2011
Andrew C. Florance President and a Director  
  (Principal Executive Officer)  
     
/S/s/ Brian J. Radecki Chief Financial Officer February 23, 200924, 2011
Brian J. Radecki (Principal Financial and Accounting Officer)  
     
/S/s/ David Bonderman Director February 23, 200924, 2011
David Bonderman    
     
/S/s/ Warren H. Haber Director February 23, 200924, 2011
Warren H. Haber    
     
/S/s/ Josiah O. Low, III Director February 23, 200924, 2011
Josiah O. Low, III    
     
/S/s/ Christopher J. Nassetta Director February 23, 200918, 2011
Christopher J. Nassetta    
     
/S/s/ Michael J. Glosserman Director February 23, 200921, 2011
Michael J. Glosserman    
 
 
4048


Exhibit No. Description
2.1 Offer Document by CoStar Limited for the share capital of Focus Information Limited (Incorporated by reference to Exhibit 2.1 to Amendment No. 2 to the Registration Statement on Form S-3 of the Registrant (Reg. No. 333-106769) filed with the Commission on August 14, 2003).
3.1 Restated Certificate of Incorporation (Incorporated by reference to Exhibit 3.1 the Registration Statement on Form S-1 of the Registrant (Reg. No. 333-47953) filed with the Commission on March 13, 1998 (the “1998 Form S-1”)).
3.2 Certificate of Amendment of Restated Certificate of Incorporation (Incorporated by reference to Exhibit 3.1 to the Registrant’s Report on Form 10-Q for the quarter ended June 30, 1999).
3.3 Amended and Restated By-Laws (filed herewith)(Incorporated by reference to Exhibit 3.3 to the Registrant’s Report on Form 10-K for the year ended December 31, 2008).
4.1 Specimen Common Stock Certificate (Incorporated by reference to Exhibit 4.1 to the Registrant’s Report on Form 10-K for the year ended December 31, 1999).
*10.1 CoStar Group, Inc. 1998 Stock Incentive Plan, as amended (Incorporated by reference to Exhibit 10.1 to the Registrant’s Report on Form 10-Q for the quarter ended September 30, 2005).
*10.2 CoStar Group, Inc. 2007 Stock Incentive Plan, as amended (filed herewith)(Incorporated by reference to Exhibit 10.1 to the Registrant’s Current Report on Form 8-K filed June 8, 2010).
*10.3 CoStar Group, Inc. 2007 Stock Incentive Plan French Sub-Plan (Incorporated by reference to Exhibit 10.3 to the Registrant’s Report on Form 10-K for the year ended December 31, 2007).
*10.4 Form of Stock Option Agreement between the Registrant and certain of its officers, directors and employees (Incorporated by reference to Exhibit 10.8 to the Registrant’s Report on Form 10-K for the year ended December 31, 2004).
*10.5 Form of Stock Option Agreement between the Registrant and Andrew C. Florance (Incorporated by reference to Exhibit 10.8.1 to the Registrant’s Report on Form 10-K for the year ended December 31, 2004).
*10.6 Form of Restricted Stock Agreement between the Registrant and certain of its officers, directors and employees (Incorporated by reference to Exhibit 10.9 to the Registrant’s Report on Form 10-K for the year ended December 31, 2004).
*10.7 Form of 2007 Plan Restricted Stock Grant Agreement between the Registrant and certain of its officers, directors and employees (Incorporated by reference to Exhibit 99.1 to the Registrant’s Report on Form 8-K filed June 22, 2007).
*10.8 Form of 2007 Plan Incentive Stock Option Grant Agreement between the Registrant and certain of its officers and employees (filed herewith)(Incorporated by reference to Exhibit 10.8 to the Registrant’s Report on Form 10-K for the year ended December 31, 2008).
*10.9 Form of 2007 Plan Incentive Stock Option Grant Agreement between the Registrant and Andrew C. Florance (filed herewith)(Incorporated by reference to Exhibit 10.9 to the Registrant’s Report on Form 10-K for the year ended December 31, 2008).
*10.10 Form of 2007 Plan Nonqualified Stock Option Grant Agreement between the Registrant and certain of its officers and employees (filed herewith)(Incorporated by reference to Exhibit 10.10 to the Registrant’s Report on Form 10-K for the year ended December 31, 2008).
*10.11 Form of 2007 Plan Nonqualified Stock Option Grant Agreement between the Registrant and certain of its directors (filed herewith)(Incorporated by reference to Exhibit 10.11 to the Registrant’s Report on Form 10-K for the year ended December 31, 2008).
*10.12 Form of 2007 Plan Nonqualified Stock Option Grant Agreement between the Registrant and Andrew C. Florance (filed herewith)(Incorporated by reference to Exhibit 10.12 to the Registrant’s Report on Form 10-K for the year ended December 31, 2008).
*10.13 Form of 2007 Plan French Sub-Plan Restricted Stock Agreement between the Registrant and certain of its employees (Incorporated by reference to Exhibit 10.10 to the Registrant’s Report on Form 10-K for the year ended December 31, 2007).

49

INDEX TO EXHIBITS ¾ (CONTINUED)


Exhibit No.Description
*10.14 CoStar Group, Inc. Employee Stock Purchase Plan, (Incorporated by reference to Exhibit 10.1 to the Registrant’s Quarterly Report on Form 10-Q for the quarter ended June 30, 2006)as amended (filed herewith).
*10.15 Employment Agreement for Andrew C. Florance (Incorporated by reference to Exhibit 10.2 to Amendment No. 1 to the Registration Statement on Form S-1 of the Registrant (Reg. No. 333-47953) filed with the Commission on April 27, 1998).
41

INDEX TO EXHIBITS ¾ (Continued)

Exhibit No.Description
*10.16 First Amendment to Andrew C. Florance Employment Agreement, effective January 1, 2009 (filed herewith)(Incorporated by reference to Exhibit 10.16 to the Registrant’s Report on Form 10-K for the year ended December 31, 2008).
*10.17 Executive Service Contract dated February 16, 2007, between Property Investment Exchange Limited and Paul Marples (Incorporated by reference to Exhibit 10.14 to the Registrant’s Report on Form 10-K for the year ended December 31, 2007).
*10.18 Form of Indemnification Agreement between the Registrant and each of its officers and directors (Incorporated by reference to Exhibit 10.1 to the Registrant’s Report on Form 10-Q for the quarter ended March 31, 2004).
10.19 OfficeAgreement for Lease between CoStar UK Limited and Wells Fargo & Company, dated August 12, 1999, between CoStar Realty Information, Inc. and Newlands Building Ventures, LLC25, 2009 (Incorporated by reference to Exhibit 10.2 to the Registrant’s Report on Form 10-Q for the quarter ended September 30, 1999).
10.20Office Sublease, dated June 14, 2002, between CoStar Realty Information, Inc., CoStar Group, Inc. and Gateway, Inc. (Incorporated by reference to Exhibit 10.2 to the Registrant’s Report on Form 10-Q for the quarter ended June 30, 2002).
10.21Exercise of option to extend lease term and sublease amendment, dated February 22, 2007 between Gateway, Inc. and CoStar Realty Information, Inc. and CoStar Group, Inc. (Incorporated by reference to Exhibit 10.1110.26 to the Registrant’s Report on Form 10-K for the year ended December 31, 2006)2009).
10.2210.20 Addendum No. 3Sub-Underlease between CoStar UK Limited and Wells Fargo & Company, dated November 18, 2009 (Incorporated by reference to Office Lease, dated as of May 12, 2004,Exhibit 10.28 to the Registrant’s Report on Form 10-K for the year ended December 31, 2009).
10.21Purchase and Sale Agreement between Newlands Building Venture,1331 L Street LLC and CoStar Realty Information, Inc.1331 L Street Holdings, LLC, dated January 20, 2010 (Incorporated by reference to Exhibit 10.1 to the Registrant’s Report on Form 10-Q for the quarter ended June 30, 2004).
10.23Office Lease, dated as of February 23, 2005, between CoStar Realty Information, Inc. and Crestpointe III, LLC. (Incorporated by reference to Exhibit 10.13 to the Registrant’s Report on Form 10-K for the year ended December 31, 2004).
10.24Office Lease Agreement, dated March 16, 2007, between Corporate Place I Business Trust and CoStar Group, Inc. (Incorporated by reference to Exhibit 10.2 to the Registrant’s Report on Form 10-Q for the quarter ended March 31, 2007).
10.25Agreement for Lease among Nokia UK Limited, Focus Information Limited and CoStar Group, Inc., dated November 23, 2007 (Incorporated by reference to Exhibit 10.22 to the Registrant’s Report on Form 10-K for the year ended December 31, 2007).
10.26Contract for Sale and Purchase between Focus Information Limited and Trafigura Limited, dated September 14, 2007 (Incorporated by reference to Exhibit 10.1 to the Registrant’s Report on Form 10-Q for the quarter ended September 30, 2007)2010).
21.1 Subsidiaries of the Registrant (filed herewith).
23.1 Consent of Ernst & Young LLP, Independent Registered Public Accounting Firm (filed herewith).
31.1 Certification of Principal Executive Officer pursuant to Section 302 of the Sarbanes-Oxley Act of 2002 (filed herewith).
31.2 Certification of Principal Financial Officer pursuant to Section 302 of the Sarbanes-Oxley Act of 2002 (filed herewith).
32.1 Certification of Principal Executive Officer pursuant to 18 U.S.C. Sec. 1350, as adopted pursuant to Section 906 of the Sarbanes-Oxley Act of 2002 (filed herewith).
32.2 Certification of Principal Financial Officer pursuant to 18 U.S.C. Sec. 1350, as adopted pursuant to Section 906 of the Sarbanes-Oxley Act of 2002 (filed herewith).

* Management Contract or Compensatory Plan or Arrangement.
 
4250

 
COSTAR GROUP, INC.

INDEX TO CONSOLIDATED FINANCIAL STATEMENTS

Reports of Independent Registered Public Accounting Firm                                                                                                                              F-2
Consolidated Statements of Operations for the years ended December 31,  2006, 20072008, 2009 and 20082010F-4
Consolidated Balance Sheets as of December 31, 20072009 and 20082010                                                                                                                              F-5
Consolidated Statements of Stockholders’ Equity for the years ended December 31, 2006, 20072008, 2009 and 20082010F-6
Consolidated Statements of Cash Flows for the years ended December 31, 2006, 20072008, 2009 and 20082010F-7
Notes to Consolidated Financial Statements                                                                                                                              F-8

F-1

 
REPORT OF INDEPENDENT REGISTERED PUBLIC ACCOUNTING FIRMReport of Independent Registered Public Accounting Firm

The Board of Directors and Shareholders of CoStar Group, Inc.

We have audited the accompanying consolidated balance sheets of CoStar Group, Inc. as of December 31, 20082010 and 2007,2009, and the related consolidated statements of operations, stockholders’ equity, and cash flows for each of the three years in the period ended December 31, 2008.2010.  Our audits also included the financial statement schedule listed in the Index at Item 15(a). These financial statements and schedule are the responsibility of the Company's management.  Our responsibility is to express an opinion on these financial statements and schedule based on our audits.

We conducted our audits in accordance with the standards of the Public Company Accounting Oversight Board (United States). Those standards require that we plan and perform the audit to obtain reasonable assurance about whether the financial statements are free of material misstatement. An audit includes examining, on a test basis, evidence supporting the amounts and disclosures in the financial statements. An audit also includes assessing the accounting principles used and significant estimates made by management, as well as evaluating the overall financial statement presentation. We believe that our audits provide a reasonable basis for our opinion.

In our opinion, the financial statements referred to above present fairly, in all material respects, the consolidated financial position of CoStar Group, Inc. at December 31, 20082010 and 2007,2009, and the consolidated results of its operations and its cash flows for each of the three years in the period ended December 31, 2008,2010, in conformity with U.S. generally accepted accounting principles.

As also discussed Also, in Note 9our opinion, the related financial statement schedule, when considered in relation to the consolidatedbasic financial statements undertaken as a whole, presents fairly in all material respects the heading Income Taxes, the Company adopted FASB Interpretation No. 48 “Accounting for Uncertainty in Income Taxes- an interpretation of FASB Statement No. 109” effective January 1, 2007.information set forth therein.

We also have audited, in accordance with the standards of the Public Company Accounting Oversight Board (United States), CoStar'sCoStar Group, Inc.’s internal control over financial reporting as of December 31, 2008,2010, based on criteria established in Internal Control IntegratedControl-Integrated Framework issued by the Committee of Sponsoring Organizations of the Treadway Commission and our report dated February 19, 200924, 2011 expressed an unqualified opinion thereon.

/S/s/  Ernst & Young LLP


McLean, Virginia

February 19, 2009
24, 2011

 
F-2

 
REPORT OF INDEPENDENT REGISTERED PUBLIC ACCOUNTING FIRMReport of Independent Registered Public Accounting Firm

The Board of Directors and Shareholders of CoStar Group, Inc.
 
We have audited CoStar Group, Inc.’s (“CoStar”) internal control over financial reporting as of December 31, 2008,2010, based on criteria established in Internal Control—Integrated Framework issued by the Committee of Sponsoring Organizations of the Treadway Commission (the COSO criteria). CoStar’sCoStar Group, Inc.’s management is responsible for maintaining effective internal control over financial reporting, and for its assessment of the effectiveness of internal control over financial reporting included in the accompanying Management’s Report on Internal Control over Financial Reporting. Our responsibility is to express an opinion on the company’s internal control over financial reporting based on our audit.
 
We conducted our audit in accordance with the standards of the Public Company Accounting Oversight Board (United States). Those standards require that we plan and perform the audit to obtain reasonable assurance about whether effective internal control over financial reporting was maintained in all material respects. Our audit included obtaining an understanding of internal control over financial reporting, assessing the risk that a material weakness exists, testing and evaluating the design and operating effectiveness of internal control based on the assessed risk, and performing such other procedures as we considered necessary in the circumstances. We believe that our audit provides a reasonable basis for our opinion.
 
A company’s internal control over financial reporting is a process designed to provide reasonable assurance regarding the reliability of financial reporting and the preparation of financial statements for external purposes in accordance with generally accepted accounting principles. A company’s internal control over financial reporting includes those policies and procedures that (1) pertain to the maintenance of records that, in reasonable detail, accurately and fairly reflect the transactions and dispositions of the assets of the company; (2) provide reasonable assurance that transactions are recorded as necessary to permit preparation of financial statements in accordance with generally accepted accounting principles, and that receipts and expenditures of the company are being made only in accordance with authorizations of management and directors of the company; and (3) provide reasonable assurance regarding prevention or timely detection of unauthorized acquisition, use, or disposition of the company’s assets that could have a material effect on the financial statements.
 
Because of its inherent limitations, internal control over financial reporting may not prevent or detect misstatements.  Also, projections of any evaluation of effectiveness to future periods are subject to the risk that controls may become inadequate because of changes in conditions, or that the degree of compliance with the policies or procedures may deteriorate.
 
In our opinion, CoStar Group, Inc. maintained, in all material respects, effective internal control over financial reporting as of December 31, 2008,2010, based on the COSO criteria.criteria.
 
We also have audited, in accordance with the standards of the Public Company Accounting Oversight Board (United States), the consolidated balance sheets as of December 31, 20082010 and 20072009, and the related consolidated statements of operations, stockholders’ equity, and cash flows for each of the three years in the period ended December 31, 20082010 of CoStar Group, Inc. and our report dated February 19, 200924, 2011 expressed an unqualified opinion thereon.
/S/s/  Ernst & Young LLP
 
 
McLean, Virginia
February 19, 200924, 2011

  
F-3

 
COSTAR GROUP, INC.
CONSOLIDATED STATEMENTS OF OPERATIONS
(in thousands, except per share data)

 Year Ended December 31,  Year Ended December 31, 
 2006  2007  2008  2008  2009  2010 
                  
Revenues $158,889  $192,805  $212,428  $212,428  $209,659  $226,260 
Cost of revenues  56,136   76,704   73,408   73,408   73,714   83,599 
Gross margin  102,753  116,101   139,020   139,020   135,945   142,661 
                        
Operating expenses:                        
Selling and marketing  41,774  51,777   41,705   41,705   42,508   52,455 
Software development  12,008  12,453   12,759   12,759   13,942   17,350 
General and administrative  30,707  36,569   39,888   39,888   44,248   47,776 
Gain on lease settlement, net ¾  (7,613) ¾ 
Purchase amortization  4,183   5,063   4,880   4,880   3,412   2,305 
  88,672   98,249   99,232   99,232   104,110   119,886 
Income from operations  14,081  17,852   39,788   39,788   31,835   22,775 
Interest and other income, net  6,845   8,045   4,914   4,914   1,253   735 
Income before income taxes  20,926  25,897   44,702   44,702   33,088   23,510 
Income tax expense, net  8,516   9,946   20,079   20,079   14,395   10,221 
Net income $12,410  $15,951  $24,623  $24,623  $18,693  $13,289 
                        
Net income per share ¾ basic
 $0.66  $0.84  $1.27  $1.27  $0.95  $0.65 
Net income per share ¾ diluted
 $0.65  $0.82  $1.26  $1.26  $0.94  $0.64 
                        
Weighted average outstanding shares ¾ basic
  18,751   19,044   19,372   19,372   19,780   20,330 
Weighted average outstanding shares ¾ diluted
  19,165   19,404   19,550   19,550   19,925   20,707 

See accompanying notes.

F-4

 
COSTAR GROUP, INC.
CONSOLIDATED BALANCE SHEETS
(in thousands except per share data)

 December 31,  December 31, 
 2007  2008  2009  2010 
ASSETS            
            
Current assets:            
Cash and cash equivalents $57,785  $159,982  $205,786  $206,405 
Short-term investments 129,641  35,268   20,188   3,722 
Accounts receivable, less allowance for doubtful accounts of approximately $2,959 and $3,213 as of December 31, 2007 and 2008, respectively 10,875  12,294 
Accounts receivable, less allowance for doubtful accounts of $2,863 and $2,415 as of December 31, 2009 and 2010, respectively  12,855   13,094 
Deferred income taxes, net 2,716  2,036   3,450   5,203 
Income tax receivable
  ¾   4,940 
Prepaid expenses and other current assets  4,661   2,903   5,128   5,809 
Total current assets  205,678  212,483   247,407   239,173 
                
Long-term investments  ¾  29,340   29,724   29,189 
Deferred income taxes, net  2,233  3,392   1,978   ¾ 
Property and equipment, net  24,045  16,876   19,162   69,921 
Goodwill  61,854  54,328   80,321   79,602 
Intangibles and other assets, net  25,711  16,421   23,390   18,774 
Deposits and other assets   2,322   1,544   2,597   2,989 
Total assets  $321,843  $334,384  $404,579  $439,648 
                
LIABILITIES AND STOCKHOLDERS’ EQUITY                
                
Current liabilities:                
Accounts payable  $3,299  $1,636  $3,667  $3,123 
Accrued wages and commissions  7,489  7,217   9,696   12,465 
Accrued expenses  15,505  7,754   14,167   18,411 
Income taxes payable  191  1,907 
Deferred revenue  10,374  9,442   14,840   16,895 
Deferred rent   1,379   1,180   1,377   4,032 
Total current liabilities  38,237  29,136   43,747   54,926 
                
Deferred income taxes, net  1,801  132   ¾   1,450 
Income taxes payable  ¾  1,695   1,826   1,770 
                
Commitments and Contingencies  ¾  ¾ 
Commitments and contingencies
  ¾   ¾ 
                
Stockholders’ equity:                
Preferred stock, $0.01 par value; 2,000 shares authorized; none outstanding ¾  ¾   ¾   ¾ 
Common stock, $0.01 par value; 30,000 shares authorized; 19,474 and 19,733 issued and outstanding as of December 31, 2007 and 2008, respectively 195  197 
Common stock, $0.01 par value; 30,000 shares authorized; 20,617 and 20,773 issued and outstanding as of December 31, 2009 and 2010, respectively  206   208 
Additional paid-in capital 317,570  333,983   364,635   374,981 
Accumulated other comprehensive income (loss) 5,626  (13,796)
Accumulated deficit  (41,586)  (16,963)
Accumulated other comprehensive loss
  (7,565)  (8,706)
Retained earnings
  1,730   15,019 
Total stockholders’ equity   281,805   303,421   359,006   381,502 
Total liabilities and stockholders’ equity  $321,843  $334,384  $404,579  $439,648 
 
See accompanying notes
notes.
 
F-5

 
COSTAR GROUP, INC.
CONSOLIDATED STATEMENTS OF STOCKHOLDERS’ EQUITY
(in (in thousands)
 
        
Additional
     
Accumulated
Other
     
Total
 
  
Comprehensive
Income
  Common Stock  
Paid-In
Capital
  
Unearned
Compensation
  
Comprehensive
Income (Loss)
  
Accumulated
Deficit
  
Stockholders’
Equity
 
 Shares  Amount 
Balance at December 31, 2005     18,674  $187  $295,920  $(2,712) $1,348  $(69,947) $224,796 
Net income  12,410   ¾   ¾   ¾   ¾   ¾   12,410   12,410 
Foreign currency translation adjustment  2,950   ¾   ¾   ¾   ¾   2,950   ¾   2,950 
Net unrealized gain on short-term investments  222   ¾   ¾   ¾   ¾   222   ¾   222 
Comprehensive income $15,582                             
Exercise of stock options      270   3   6,566   ¾   ¾   ¾   6,569 
Swaps of shares for exercise      (20)  (1)  (938)  ¾   ¾   ¾   (939)
Restricted stock grants      165   2   34   ¾   ¾   ¾   36 
Restricted stock grants surrendered      (12)  ¾   (234)  ¾   ¾   ¾   (234)
Stock compensation expense, net of forfeitures      ¾   ¾   4,094   ¾   ¾   ¾   4,094 
Employee Stock Purchase Plan (ESPP)      4   ¾   206   ¾   ¾   ¾   206 
Impact upon adoption of SFAS 123R      ¾   ¾   (2,712)  2,712   ¾   ¾   ¾ 
Balance at December 31, 2006      19,081   191   302,936   ¾   4,520   (57,537)  250,110 
FIN 48 Adjustment      ¾   ¾   26   ¾   ¾   ¾   26 
Balance at January 1, 2007      19,081   191   302,962   ¾   4,520   (57,537)  250,136 
Net income  15,951   ¾   ¾   ¾   ¾   ¾   15,951   15,951 
Foreign currency translation adjustment  873   ¾   ¾   ¾   ¾   873   ¾   873 
Net unrealized gain on short-term investments  233   ¾   ¾   ¾   ¾   233   ¾   233 
Comprehensive income $17,057                             
Exercise of stock options      289   3   8,127   ¾   ¾   ¾   8,130 
Restricted stock grants      131   1   (1)  ¾   ¾   ¾   ¾ 
Restricted stock grants surrendered      (58)  ¾   (635)  ¾   ¾   ¾   (635)
Consideration for Propex      22   ¾   1,010   ¾   ¾   ¾   1,010 
Stock compensation expense, net of forfeitures      ¾   ¾   5,440   ¾   ¾   ¾   5,440 
ESPP      9   ¾   407   ¾   ¾   ¾   407 
Excess tax benefit for exercised stock options      ¾   ¾   260   ¾   ¾   ¾   260 
Balance at December 31, 2007      19,474   195   317,570   ¾   5,626   (41,586)  281,805 
Net income  24,623   ¾   ¾   ¾   ¾   ¾   24,623   24,623 
Foreign currency translation adjustment  (14,061)  ¾   ¾   ¾   ¾   (14,061)  ¾   (14,061)
Net unrealized loss on short-term investments  (5,361)  ¾   ¾   ¾   ¾   (5,361)  ¾   (5,361)
Comprehensive income $5,201                             
Exercise of stock options      198   2   6,555   ¾   ¾   ¾   6,557 
Restricted stock grants      102   1   ¾   ¾   ¾   ¾   1 
Restricted stock grants surrendered      (49)  (1)  (695)  ¾   ¾   ¾   (696)
Stock compensation expense, net of forfeitures      ¾   ¾   4,907   ¾   ¾   ¾   4,907 
ESPP      8   ¾   329   ¾   ¾   ¾   329 
Excess tax benefit for exercised stock options      ¾   ¾   5,317   ¾   ¾   ¾   5,317 
Balance at December 31, 2008      19,733  $197  $333,983  $¾  $(13,796) $(16,963) $303,421 
           Accumulated  Retained    
       Additional   Other  Earnings  Total 
  Comprehensive  Common Stock Paid-In   Comprehensive  (Accumulated  Stockholders’ 
  Income  Shares   Amount Capital   Income (Loss)  Deficit)  Equity 
Balance at December 31, 2007     19,474  $195  $317,570  $5,626  $(41,586) $281,805 
Net income $24,623   ¾   ¾   ¾   ¾   24,623   24,623 
Foreign currency translation adjustment  (14,061)  ¾   ¾   ¾   (14,061)  ¾   (14,061)
Net unrealized loss on investments  (5,361)  ¾   ¾   ¾   (5,361)  ¾   (5,361)
Comprehensive income $5,201                         
Exercise of stock options      198   2   6,555   ¾   ¾   6,557 
Restricted stock grants      102   1   ¾   ¾   ¾   1 
Restricted stock grants surrendered      (49)  (1)  (695)  ¾   ¾   (696)
Stock compensation expense, net of forfeitures      ¾   ¾   4,907   ¾   ¾   4,907 
ESPP      8   ¾   329   ¾   ¾   329 
Excess tax benefit for exercised stock options      ¾   ¾   5,317   ¾   ¾   5,317 
Balance at December 31, 2008      19,733   197   333,983   (13,796)  (16,963)  303,421 
Net income  18,693   ¾   ¾   ¾   ¾   18,693   18,693 
Foreign currency translation adjustment  3,671   ¾   ¾   ¾   3,671   ¾   3,671 
Net unrealized gain on  investments  2,560   ¾   ¾   ¾   2,560   ¾   2,560 
Comprehensive income $24,924                         
Exercise of stock options      85   ¾   2,232   ¾   ¾   2,232 
Restricted stock grants      237   2   ¾   ¾   ¾   2 
Restricted stock grants surrendered      (44)  ¾   (672)  ¾   ¾   (672)
Stock compensation expense, net of forfeitures      ¾   ¾   6,438   ¾   ¾   6,438 
ESPP      7   ¾   230   ¾   ¾   230 
Consideration for PPR      573   6   20,897   ¾   ¾   20,903 
Consideration for Resolve Technology      26   1   1,124   ¾   ¾   1,125 
Excess tax benefit for exercised stock options      ¾   ¾   403   ¾   ¾   403 
Balance at December 31, 2009      20,617   206   364,635   (7,565)  1,730   359,006 
Net income  13,289   ¾   ¾   ¾   ¾   13,289   13,289 
Foreign currency translation adjustment  (1,064)  ¾   ¾   ¾   (1,064)  ¾   (1,064)
Net unrealized loss on  investments  (77)  ¾   ¾   ¾   (77)  ¾   (77)
Comprehensive income $12,148                         
Exercise of stock options      138   2   3,720   ¾   ¾   3,722 
Restricted stock grants      113   ¾   ¾   ¾   ¾   ¾ 
Restricted stock grants surrendered      (103)  ¾   (2,906)  ¾   ¾   (2,906)
Stock compensation expense, net of forfeitures      ¾   ¾   8,270   ¾   ¾   8,270 
ESPP      8   ¾   360   ¾   ¾   360 
Excess tax benefit for exercised stock options      ¾   ¾   902   ¾   ¾   902 
Balance at December 31, 2010      20,773  $208  $374,981  $(8,706) $15,019  $381,502 
  
See accompanying notes. 

See accompanying notes.
 
 
F-6

 
COSTAR GROUP, INC.
CONSOLIDATED STATEMENTS OF CASH FLOWS
(in thousands)

 Year Ended December 31,  Year Ended December 31, 
 2006  2007  2008  2008  2009  2010 
Operating activities:                  
Net income $12,410  $15,951  $24,623  $24,623  $18,693  $13,289 
Adjustments to reconcile net income to net cash provided by operating activities:                        
Depreciation 5,734  7,778  8,360   8,360   7,583   8,607 
Amortization 6,076  8,369  8,441   8,441   7,093   5,042 
Deferred income tax expense, net 7,658  9,946  2,148   2,148   (2,428)  1,675 
Provision for losses on accounts receivable 1,813  2,464  4,042   4,042   4,172   1,471 
Excess tax benefit from stock options ¾  ¾  (5,317)  (5,317)  (403)  (902)
Stock-based compensation expense 4,155  5,440  4,940   4,940   6,460   8,306 
Fixed asset write-off
  ¾   603   674 
Changes in operating assets and liabilities, net of acquisitions:                        
Accounts receivable (5,080) (2,944) (6,196)  (6,196)  (1,610)  (1,776)
Interest receivable (164) (67 533   533   97   70 
Income tax receivable  ¾   ¾   (4,940
Prepaid expenses and other current assets (1,205) (755) 1,464   1,464   (1,521)  (714)
Deposits (246) (670) 652 
Accounts payable and accrued expenses 688  6,721  (3,044)
Deposits and other assets
  652   (1,013)  (385)
Accounts payable and other liabilities
  (3,044)  1,531   6,690 
Deferred revenue  748   (501)  262   262   (812)  2,162 
Net cash provided by operating activities 32,587  51,732  40,908   40,908   38,445   39,269 
                        
Investing activities:                        
Purchases of short-term investments (108,876) (116,609) (4,839)
Sales of short-term investments 95,393  107,286  63,949 
Purchases of investments
  (4,839)  ¾   ¾ 
Sales of investments
  63,949   17,159   16,854 
Purchases of property and equipment and other assets (12,959) (14,271) (3,656)  (3,656)  (9,420)  (57,358)
Acquisitions, net of cash acquired  (1,887)  (16,737)  (3,024)  (3,024)  (3,207)  ¾ 
Net cash (used in) provided by investing activities (28,329) (40,331) 52,430 
Net cash provided by (used in) investing activities
  52,430   4,532   (40,504)
                        
Financing activities:                        
Excess tax benefit from stock options ¾  ¾  5,317   5,317   403   902 
Proceeds from transactions in stock based plans  5,582   8,161   6,158 
Repurchase of restricted stock to satisfy tax withholding obligations  (695)  (672)  (2,904)
Proceeds from exercise of stock options and ESPP
  6,853   2,441   4,044 
Net cash provided by financing activities 5,582  8,161  11,475   11,475   2,172   2,042 
                        
Effect of foreign currency exchange rates on cash and cash equivalents  254   64   (2,616)  (2,616)  655   (188)
Net increase in cash and cash equivalents 10,094  19,626  102,197   102,197   45,804   619 
Cash and cash equivalents at beginning of year  28,065   38,159   57,785   57,785   159,982   205,786 
Cash and cash equivalents at end of year $38,159  $57,785  $159,982  $159,982  $205,786  $206,405 

See accompanying notesnotes.
 
 
F-7

 
COSTAR GROUP, INC.
NOTES TO CONSOLIDATED FINANCIAL STATEMENTS

December 31, 20082010

1. ORGANIZATION

CoStar Group, Inc. (the “Company”) has created a comprehensive, proprietary database of commercial real estate information covering the United States (“U.S.”), as well as parts of the United Kingdom and France. Based on its unique database, the Company provides information/information, marketing and analytic services to the commercial real estate and related business community and operates within two segments, U.S. and International. The Company’s information/information, marketing and analytic services are typically distributed to its clients under subscription-based license agreements, which typically have a minimum term of one year and renew automatically.

2. SUMMARY OF SIGNIFICANT ACCOUNTING POLICIES

Basis of Presentation

The consolidated financial statements include the accounts of the Company and its wholly owned subsidiaries. All significant intercompany balances and transactions have been eliminated in consolidation. Accounting policies are consistent for each operating segment.

 Use of Estimates

The preparation of financial statements in conformity with U.S. generally accepted accounting principles (“GAAP”) in the United States of America requires management to make estimates and assumptions that affect the amounts reported in the financial statements and accompanying notes. Actual results could differ from those estimates.

Reclassifications

Certain previously reported amounts in Note 9 and the Consolidated Statements of Cash Flows have been reclassified to conform to the Company’s current presentation.

Revenue Recognition

The Company primarily derives revenues fromby providing access to its proprietary database of commercial real estate information. The Company generally charges a fixed monthly amount for its subscription-based services. Subscription contract rates are based on the number of sites, number of users, organization size, the client’s business focus, geography and the number of services to which a client subscribes. Subscription-based license agreements typically have a minimum term of one year and renew automatically.

Revenue is recognized when (1) there is persuasive evidence of an arrangement, (2) the fee is fixed and determinable, (3) services have been rendered and payment has been contractually earned and (4) collectability is reasonably assured.

Revenues from subscription-based services are recognized on a straight-line basis over the term of the agreement. Deferred revenue results from advance cash receipts from customers or amounts billed in advance to customers from the sales of subscription licenses and is recognized over the term of the license agreement.

Cost of Revenues

Cost of revenues principally consists of salaries and related expenses for the Company’s researchers who collect and analyze the commercial real estate data that is the basis for the Company’s information/information, marketing and analytic services. Additionally, cost of revenues includes the cost of data from third party data sources, which is expensed as incurred, and the amortization of database technology.

Significant Customers

No single customer accounted for more than 5% of the Company’s revenues for each of the years ended December 31, 2006, 2007 and 2008.
F-8


COSTAR GROUP, INC.
NOTES TO CONSOLIDATED FINANCIAL STATEMENTS ¾ (CONTINUED)

2. SUMMARY OF SIGNIFICANT ACCOUNTING POLICIES ¾ (CONTINUED)

Significant Customers

No single customer accounted for more than 5% of the Company’s revenues for each of the years ended December 31, 2008, 2009 and 2010.

Foreign Currency Translation

The Company’s functional currency in its foreign locations is the local currency. Assets and liabilities are translated into U.S. dollars as of the balance sheet date. Revenues, expenses, gains and losses are translated at the average exchange rates in effect during each period. Gains and losses resulting from translation are included in accumulated other comprehensive income.income (loss). Net gains or losses resulting from foreign currency exchange transactions are included in the consolidated statements of operations. There were no material gains or losses from foreign currency exchange transactions for the years ended December 31, 2008, 2009 and 2007.
2010.

Accumulated Other Comprehensive IncomeLoss

The components of accumulated other comprehensive incomeloss were as follows (in thousands):

  Year Ended December 31, 
  2007  2008 
Foreign currency translation adjustment $5,540  $(8,521)
Accumulated net unrealized gain (loss) on investments, net of tax  86   (5,275)
Total accumulated other comprehensive income (loss) $5,626  $(13,796)
 Year Ended December 31, 
 2009 2010 
Foreign currency translation adjustment
 $(4,850) $(5,914)
Accumulated net unrealized loss on investments, net of tax  (2,715)  (2,792)
Total accumulated other comprehensive loss
 $(7,565) $(8,706)
 
Advertising Costs

The Company expenses advertising costs as incurred. Advertising expenseexpenses were approximately $4.0$2.8 million, $2.3$3.3 million and $2.8$3.0 million for the years ended December 31, 2006, 20072008, 2009 and 2008,2010, respectively.

Income Taxes

The Company provides for income taxes under the provisions of Statement of Financial Accounting Standards No. 109 “Accounting for Income Taxes” (“SFAS No. 109”). Deferred income taxes result from temporary differences between the tax basis of assets and liabilities and the basis reported in the Company’s consolidated financial statements. Deferred tax liabilities and assets are determined based on the difference between the financial statement and the tax basis of assets and liabilities using enacted rates expected to be in effect during the year in which the differences reverse. Valuation allowances are provided against assets, including net operating losses, if it is anticipated that some or all of thean asset may not be realized through future taxable earnings or implementation of tax planning strategies. Interest and penalties related to income tax matters are recognized in income tax expense.

Net Income Per Share

Net income per share is computed by dividing net income by the weighted average number of common shares outstanding during the period on a basic and diluted basis. The Company’s potentially dilutive securities include stock options and restricted stock. Diluted net income per share considers the impact of potentially dilutive securities except in periods in which there is a net loss, as the inclusion of the potentialpotentially dilutive common shares would have an anti-dilutive effect.

Stock-Based Compensation

On January 1, 2006, the Company adopted Statement of Financial Accounting Standards No. 123R “Share Based Payment” (“SFAS 123R”), which addresses the accounting for share-based payment transactions in which the Company receives employee services in exchange for equity instruments., The statement generally requires that equity instruments issued in such transactions be accounted for using a fair-value based method and the fair value of such equity instruments be recognized as expense in the consolidated statements of operations.
 
F-9

 
COSTAR GROUP, INC.
NOTES TO CONSOLIDATED FINANCIAL STATEMENTS ¾ (CONTINUED)

2. SUMMARY OF SIGNIFICANT ACCOUNTING POLICIES ¾ (CONTINUED)

Stock-Based Compensation¾(Continued)

Under theEquity instruments issued in exchange for employee services are accounted for using a fair-value recognition provisions of SFAS 123R, stock-based compensation cost is estimated at the grant date based onmethod and the fair value of the awards expected to vest andsuch equity instruments is recognized as expense ratably over the requisite service period of the award.  The Company recognizes compensation costs for awards with graded vesting on a straight-line basis.

The Company adopted SFAS 123R using the modified prospective method, which requires the application of the accounting standard as of January 1, 2006. SFAS 123R requires forfeitures to be estimated at the time of grant and revised, if necessary, in subsequent periods if actual forfeitures differ from those estimates. Upon adoption of SFAS 123R, the Company recorded a charge of approximately $35,000 representing the cumulative effect of a change in accounting principle. This amount was recorded in general and administrative expenses in the consolidated statements of operations foroperations.

Stock-based compensation cost is measured at the year ended December 31, 2006.
The impactgrant date of the adoptionshare-based awards based on their fair values, and is recognized on a straight line basis as expense over the vesting periods of SFAS 123R on the Company's resultsawards, net of operations for the year ended December 31, 2006, was as follows (in thousands, except per share data):an estimated forfeiture rate.

Income from operations                                                                                                                   $(2,860)
Income before taxes                                                                                                                   $(2,860)
Net income                                                                                                                   $(1,784)
Basic earnings per share                                                                                                                   $(0.10)
Diluted earnings per share                                                                                                                   $(0.09)
SFAS 123R requires cashCash flows resulting from excess tax benefits to beare classified as part of net cash flows from operating and financing activities. Excess tax benefits represent tax benefits related to exercised optionsstock-based compensation in excess of the associated deferred tax asset for such options. There were no excess tax benefits as a result of adopting SFAS 123R for the year ended December 31, 2006, and no amounts were classified as an operating cash outflow or a financing cash inflow in the accompanying consolidated statement of cash flows.equity compensation.  Net cash proceeds from the exercise of stock options and ESPP were approximately $6.6$6.9 million; $8.1$2.4 million and $6.6$4.0 million for the years ended December 31, 2006, 20072008, 2009 and 2008,2010, respectively.  There were approximately $5.3 million, $403,000 and $902,000 of excess tax benefits realized from stock option exercises for the yearyears ended December 31, 2008.
2008, 2009 and 2010.

Stock-based compensation expense for stock options and restricted stock under equity incentive plans and stock purchases under the employee stock purchase plan included in the Company's results of operations for the years ended December 31, was as follows (in thousands):
 
  Year Ended December 31, 
  2006  2007  2008 
Cost of revenues                                                                                               $317  $926  $547 
Selling and marketing                                                                                                1,263   1,118   400 
Software development                                                                                                202   340   423 
General and administrative                                                                                                2,373   3,056   3,570 
Total                                                                                           $4,155  $5,440  $4,940 
  Year Ended December 31, 
  2008  2009  2010 
Cost of revenues                                                                                               $547  $888  $1,504 
Selling and marketing                                                                                                400   1,125   1,518 
Software development                                                                                                423   588   949 
General and administrative                                                                                                3,570   3,859   4,335 
Total                                                                                           $4,940  $6,460  $8,306 
 
F-10

COSTAR GROUP, INC.
NOTES TO CONSOLIDATED FINANCIAL STATEMENTS ¾ (CONTINUED)

2. SUMMARY OF SIGNIFICANT ACCOUNTING POLICIES ¾ (CONTINUED)

Cash and Cash Equivalents

The Company considers all highly liquid investments purchased with an original maturity of three months or less to be cash equivalents. Cash equivalents consist of money market fund investments and U.S. Government Securities. As of December 31, 20072009 and 2008,2010, cash of $754,000approximately $519,000 and $518,000,$190,000, respectively, was held to support letters of credit for security deposits.

Investments

The Company accounts for investments in accordance with Statement of Financial Accounting Standards No. 115“Accounting for Certain Investments in Debt and Equity Securities” (“SFAS No. 115”), The Company determines the appropriate classification of debt and equity investments at the time of purchase and reevaluates such designation as of each balance sheet date.  The Company considers all of its investments to be available-for-sale.  Short-term investments consist of commercial paper, government/federal notes and bonds and corporate obligations with maturities greater than 90 days at the time of purchase. Available-for-sale short-term investments with contractual maturities beyond one year are classified as current in the Company’s consolidated balance sheets because they represent the investment of cash that is available for current operations. Long-term investments consist of auction rate securities.securities (“ARS”).  Investments are carried at fair market value.
F-10

COSTAR GROUP, INC.
NOTES TO CONSOLIDATED FINANCIAL STATEMENTS ¾ (CONTINUED)

2. SUMMARY OF SIGNIFICANT ACCOUNTING POLICIES ¾ (CONTINUED)
 Concentration of Credit Risk and Financial Instruments

The Company performs ongoing credit evaluations of its customers’ financial condition and generally does not require that its customers’ obligations to the Company be secured. The Company maintains reserves for credit losses, and such losses have been within management’s expectations. The large size and widespread nature of the Company’s customer base and the Company’s lack of dependence on individual customers mitigate the risk of nonpayment of the Company’s accounts receivable. The carrying amount of the accounts receivable approximates the net realizable value. The carrying value of the Company’s financial instruments including cash and cash equivalents, short-term investments, long-term investments, accounts receivable, accounts payable, and accrued expenses approximates fair value.

Allowance for Doubtful Accounts

The allowance for doubtful accounts is based on the Company’s assessment of the collectability of customer accounts.  The Company regularly reviews the allowance by considering factors such as historical experience, the aging of the balances, and current economic conditions that may affect a customer’s ability to pay.

Property and Equipment

Property and equipment are stated at cost. All repairs and maintenance costs are expensed as incurred. Depreciation and amortization are calculated on a straight-line basis over the following estimated useful lives of the assets:

BuildingThirty-nine years
Leasehold improvements Shorter of lease term or useful life
Furniture and office equipment Five to seventen years
Research vehicles Five years
Computer hardware and software Two to five years

Internal useQualifying internal-use software costs are capitalized in accordance with Statement of Position No. 98-1, “Accounting for the Costs of Computer Software Developed or Obtained for Internal Use” (“SOP 98-1”). Qualifying costs incurred during the application development stage, which consist primarily of outside services and purchased software license costs, are capitalized and amortized over the estimated useful life of the asset. All other costs are expensed as incurred.

F-11

COSTAR GROUP, INC.
NOTES TO CONSOLIDATED FINANCIAL STATEMENTS ¾ (CONTINUED)

2. SUMMARY OF SIGNIFICANT ACCOUNTING POLICIES ¾ (CONTINUED)

Goodwill, Intangibles and Other Assets

Goodwill represents the excess of costs over the fair value of assets of businesses acquired. Goodwill and intangible assets subject to amortization that arose from acquisitions prior to July 1, 2001, have been amortized on a straight-line basis over their estimated useful lives in accordance with Accounting Principles Board Opinion No. 17, “Intangible Assets” (“APB 17”). The Company adopted the provisions of Statement of Financial Accounting Standards No. 142, “Goodwill and Other Intangible Assets” (“SFAS 142”), as of January 1, 2002. Goodwill and intangible assets acquired in a purchase business combination and determined to have an indefinite useful life are not amortized, but instead tested for impairment at least annually by reporting unit in accordance withunit. The Company’s operating segments, U.S. and International, are the provisions of SFAS No. 142.reporting units tested for potential impairment.  The goodwill impairment test is a two-step process.  The first step is to determine the fair value of each reporting unit.  The estimate of the fair value of each reporting unit is based on a projected discounted cash flow model that includes significant assumptions and estimates including ourthe Company’s future financial performance and a weighted average cost of capital. The fairfa ir value of each reporting unit is compared to the carrying amount of the reporting unit. If the carrying value of the reporting unit exceeds the fair value, then the second step of the process is performed to measure the impairment loss.  The impairment loss is measured based on a projected discounted cash flow method using a discount rate determined by ourthe Company’s management to be commensurate with the risk in ourits current business model.

 SFAS No. 142 also requires that intangibleIntangible assets with estimable useful lives that arose from acquisitions on or after July 1, 2001, beare amortized over their respective estimated useful lives using a method of amortization that reflects the pattern in which the economic benefits of the intangible assets are consumed or otherwise used up, and are reviewed at least annually for impairment in accordance with Statement of Financial Accounting Standards No. 144 (“SFAS 144”), “Accounting for Impairment or Disposal of Long-Lived Assets”..

F-11

COSTAR GROUP, INC.
NOTES TO CONSOLIDATED FINANCIAL STATEMENTS ¾ (CONTINUED)

2. SUMMARY OF SIGNIFICANT ACCOUNTING POLICIES ¾ (CONTINUED)

Goodwill, Intangibles and Other Assets¾ (Continued)

Acquired database technology, customer base and trade names and other are related to the Company’s acquisitions (See(see Notes 3, 7 and 6)8). Acquired database technology and trade names and other are amortized on a straight-line basis over periods ranging from two to ten years. The acquired intangible asset characterized as customer base consists of one distinct intangible asset composed of acquired customer contracts and the related customer relationships. Acquired customer bases that arose from acquisitions prior to July 1, 2001 are amortized on a straight-line basis principally over a period of ten years. Acquired customer bases that arose from acquisitions on or after July 1, 2001 are amortized on a 125% declining balance method over ten years. The cost of capitalized building photography is amortized on a straight-line basis overove r five years.

Long-Lived Assets

In accordance with SFAS 144, long-livedLong-lived assets, such as property, plant, and equipment, and purchased intangibles subject to amortization, are reviewed for impairment whenever events or changes in circumstances indicate that the carrying amount of an asset may not be recoverable. Recoverability of assets to be held and used is measured by a comparison of the carrying amount of an asset to estimateestimated undiscounted future cash flows expected to be generated by the asset or asset group. If the carrying amount of an asset exceeds its estimated future cash flows, an impairment charge is recognized by the amount for which the carrying amount of the asset exceeds the fair value of the asset.

Assets to be disposed of would be separately presented in the balance sheet and reported at the lower of the carrying amount or fair value less costs to sell, and would no longer be depreciated. The assets and liabilities of a disposed group classified as held for sale would be presented separately in the appropriate asset and liability sections of the balance sheet.

Goodwill and intangible assets not subject to amortization are tested annually for impairment by reporting unit, and are tested for impairment more frequently if events and circumstances indicate that the asset might be impaired. The Company’s operating segments, U.S. and International, are the reporting units tested for potential impairment under SFAS No. 142. An impairment loss is recognized to the extent that the carrying amount exceeds the asset’s fair value.

F-12

COSTAR GROUP, INC.
NOTES TO CONSOLIDATED FINANCIAL STATEMENTS ¾ (CONTINUED)

2. SUMMARY OF SIGNIFICANT ACCOUNTING POLICIES ¾ (CONTINUED)

Recent Accounting Pronouncements

In June 2006,April 2008, the Financial Accounting Standards Board (“FASB”)  issued FASB Interpretation No. 48 “Accounting for Uncertainty in Income Taxes – an interpretation of FASB Statement No. 109” (“FIN 48”), which became effective for the Company as of January 1, 2007. FIN 48 addresses the determination of how tax benefits claimedauthoritative guidance on existing intangibles or expected to be claimed on a tax return should be recorded in the financial statements. Under FIN 48, the Company must recognize the tax benefitfuture cash flows from an uncertain tax position only if it is more-likely-than-not that the tax position will be sustained upon examination by the taxing authorities, based on the technical merits of the position. The tax benefits recognized in the financial statements from such a position are measured based on the largest benefit that has a greater than fifty percent likelihood of being realized upon ultimate resolution. The Company’s reassessment of its tax positions in accordance with FIN 48 did not have a material impact on its results of operations and financial position.

In September 2006, the FASB issued SFAS No. 157, “Fair Value Measurements” (“SFAS 157”), which defines fair value, establishes a framework for measuring fair value in accordance with GAAP and expands disclosures about fair value measurements. SFAS 157 does not require any new fair value measurements under GAAP and is effective for fiscal years beginning after November 15, 2007.  In February 2008, the FASB issued FASB Staff Position (“FSP”) 157-2, “Partial Deferral of the Effective Date of Statement 157” (“FSP 157-2”), which delays the effective date of SFAS 157 to January 1, 2009 for all non-financial assets and non-financial liabilities, except those that are recognized or disclosed at fair value in the consolidated financial statements on a recurring basis (at least annually).  Effective January 1, 2008, the Company adopted the portion of SFAS 157 that was not deferred under FSP 157-2.  The adoption of SFAS 157 did not have a material impact on the Company’s results of operations or financial position.  In October 2008, the FASB issued FSP 157-3, “Determining the Fair Value of a Financial Asset in a Market That Is Not Active” (“FSP 157-3”), which clarifies the application of SFAS 157 to markets that are not active and provides an example illustrating key considerations for determining the fair value of financial assets when their markets are not active. FSP 157-3 was effective upon issuance, including prior periods for which financial statements had not been issued. The adoption of this standard did not have an impact on the Company’s results of operations or financial position.

In February 2007, the FASB issued SFAS No. 159, “Fair Value Option for Financial Assets and Financial Liabilities — Including an amendment of FASB Statement No. 115” (“SFAS 159”), which permits entities to choose to measure many financial instruments and certain other items at fair value that are not currently required to be measured at fair value. SFAS 159 is effective for fiscal years beginning on or after December 31, 2007. The Company adopted SFAS 159 on January 1, 2008 and has elected not to apply the fair value option to any of its financial instruments.  The adoption of SFAS 159 did not have a material impact on the Company’s results of operations or financial position.

In December 2007, the FASB issued SFAS No. 141 (Revised 2007), “Business Combinations” (“SFAS 141R”), which will change the accounting for any business combination the Company enters into with an acquisition date after December 31, 2008. Under SFAS 141R, an acquiring entity will be required to recognize all the assets acquired and liabilities assumed in a transaction at the acquisition date fair value with limited exceptions. SFAS 141R will change the accounting treatment and disclosure for certain specific items in a business combination. SFAS 141R will have an impact on accounting for business combinations once adopted, but its effect will depend upon the specifics of any business combination with an acquisition date subsequent to December 31, 2008.

In December 2007, the FASB issued SFAS No. 160, “Noncontrolling Interests in Consolidated Financial Statements—An Amendment of ARB No. 51” (“SFAS 160”), which establishes new accounting and reporting standards for the non-controlling interest in a subsidiary and for the deconsolidation of a subsidiary. SFAS 160 is effective for fiscal years beginning on or after December 15, 2008. The adoption of SFAS 160 is not expected to have a material impact on the Company’s results of operations or financial position.
F-13

COSTAR GROUP, INC.
NOTES TO CONSOLIDATED FINANCIAL STATEMENTS ¾ (CONTINUED)

2. SUMMARY OF SIGNIFICANT ACCOUNTING POLICIES ¾ (CONTINUED)

Recent Accounting Pronouncements ¾  (Continued)

In April 2008, the FASB issued FSP SFAS No. 142-3, “Determination of the Useful Life of Intangible Assets” (“FSP 142-3”),intangibles, which is effective for all fiscal years and interim periods beginning after December 15, 2008. Early adoption of FSP 142-3this guidance is not permitted. FSP 142-3This guidance requires additional footnote disclosures about the impact of the Company’s ability or intent to renew or extend agreements related to existing intangibles or expected future cash flows from those intangibles, how the Company accounts for costs incurred to renew or extend such agreements, the time until the next renewal or extension period by asset class, and the amount of renewal or extension costs capitalized, if any. For any intangibles acquired after December 31, 2008, FSP 142-3this gui dance requires that the Company consider its experience regarding renewal and extensions of similar arrangements in determining the useful life of such intangibles. If the Company does not have experience with similar arrangements, FSP 142-3this guidance requires that the Company use the assumptions of a market participant putting the intangible to its highest and best use in determining the useful life. The adoption of FSP 142-3 will impact intangibles acquired after December 31, 2008, and its effect will dependCompany adopted this guidance on the specifics of the intangible acquired.

In May 2008, the FASB issued SFAS No. 162, “The Hierarchy of Generally Accepted Accounting Principles” (“SFAS 162”), which identifies the sources of accounting principles and the framework for selecting the principles to be used in the preparation of financial statements. SFAS 162 is effective as of November 17, 2008.January 1, 2009. The adoption of SFAS 162this guidance did not have a material impact on the Company’s results of operations or financial position.

In June 2008, the FASB issued authoritative guidance related to determining whether instruments granted in share-based payment transactions are participating securities.  This guidance clarifies that unvested share-based payment awards with a right to receive non-forfeitable dividends are participating securities. This guidance is effective for all annual and interim periods beginning after December 15, 2008. Adoption of this standard will require the two-class method of calculating basic earnings per share to the extent that unvested share-based payments have the right to receive non-forfeitable dividends. The Company adopted this guidance on January 1, 2009.  The adoption of this guidance did not have a material impact on the Company’s results of operations or financial position.

F-12

COSTAR GROUP, INC.
NOTES TO CONSOLIDATED FINANCIAL STATEMENTS ¾ (CONTINUED)

2. SUMMARY OF SIGNIFICANT ACCOUNTING POLICIES ¾ (CONTINUED)

Recent Accounting Pronouncements¾ (Continued)

In April 2009, the FASB issued authoritative guidance related to the initial recognition, measurement and subsequent accounting for assets and liabilities arising from pre-acquisition contingencies in a business combination. It requires that such assets acquired or liabilities assumed be initially recognized at fair value at the acquisition date if fair value can be determined during the measurement period. When fair value cannot be determined, companies should typically account for the acquired contingencies using existing guidance. This guidance requires that companies expense acquisition and deal-related costs that were previously allowed to be capitalized.  This guidance also requires that a systematic and rational basis for subsequently measuring and accounting for the assets or liabilities be developed depending on the ir nature. This guidance was effective for contingent assets or liabilities arising from business combinations with an acquisition date on or after January 1, 2009.   The adoption of this guidance changes the accounting treatment and disclosure for certain specific items in a business combination with an acquisition date subsequent to December 31, 2008.  The Company adopted this guidance on January 1, 2009, and expensed acquisition and deal-related costs of approximately $700,000 associated primarily with the acquisitions of Property and Portfolio Research, Inc. (“PPR”) and Resolve Technology, Inc. (“Resolve Technology”).

In April 2009, the FASB issued authoritative guidance for determining whether a market is active or inactive, and whether a transaction is distressed. This guidance is applicable to all assets and liabilities (financial and non-financial) and will require enhanced disclosures. The Company adopted this guidance for its interim period ending June 30, 2009. The adoption of this guidance did not have a material impact on the Company’s results of operations or financial position, but did require additional disclosures in the Company’s financial statements.

In April 2009, the FASB issued authoritative guidance requiring disclosures in interim reporting periods concerning the fair value of financial instruments that were previously only required in the annual financial statements. The Company adopted the provisions of this guidance for the interim period ending June 30, 2009. The adoption of this guidance did not have a material impact on the Company’s results of operations or financial position, but did require additional disclosures in the Company’s financial statements.

In April 2009, the FASB issued authoritative guidance that redefines what constitutes an other-than-temporary impairment, defines credit and non-credit components of an other-than-temporary impairment, prescribes their financial statement treatment, and requires enhanced disclosures relating to such impairments. The Company adopted this guidance for the interim period ending June 30, 2009. The adoption of this guidance did not have a material impact on the Company’s results of operations or financial position, but did require additional disclosures in the Company’s financial statements.

In May 2009, the FASB issued authoritative guidance which establishes general standards of accounting for and disclosure of events that occur after the balance sheet date but before financial statements are issued. This guidance was effective for all interim and annual reporting periods ending after June 15, 2009. This guidance has not and is not expected to result in significant changes in the subsequent events that the Company reports, either through recognition or disclosure, in its financial statements.

In June 2009, the FASB issued authoritative guidance to amend the manner in which entities evaluate whether consolidation is required for variable interest entities (VIE).  Previously, variable interest holders were required to determine whether they had a controlling financial interest in a VIE based on a quantitative analysis of the expected gains and/or losses of the entity.  The new guidance requires an enterprise with a variable interest in a VIE to qualitatively assess whether it has a controlling financial interest in the entity, and if so, whether it is the primary beneficiary.  This guidance also requires that companies continually evaluate VIEs for consolidation, rather than assessing whether consolidation is required based upon the occurrence of triggering events.  This guidance enhan ces disclosures to provide financial statement users with greater transparency about transfers of financial assets and a transferor’s continuing involvement with transferred financial assets. This guidance will be effective for the first annual reporting period beginning after November 15, 2009. This guidance did not materially impact the Company’s results of operations, financial position or related disclosures.
F-13

COSTAR GROUP, INC.
NOTES TO CONSOLIDATED FINANCIAL STATEMENTS ¾ (CONTINUED)

2. SUMMARY OF SIGNIFICANT ACCOUNTING POLICIES ¾ (CONTINUED)

Recent Accounting Pronouncements¾ (Continued)

In June 2009, the FASB issued authoritative guidance which replaced the previous hierarchy of U.S. GAAP and establishes the FASB Codification as the single source of authoritative U.S. GAAP recognized by the FASB to be applied by nongovernmental entities. This guidance is effective for financial statements issued for interim and annual periods ending after September 15, 2009. This guidance did not materially impact the Company’s results of operations or financial position, but did require changes to the disclosures in the Company’s financial statements.

In July 2009, the FASB issued authoritative guidance to improve the consistency with which companies apply fair value measurements guidance to liabilities.  This guidance is effective for interim and annual periods beginning after September 30, 2009.  This guidance did not materially impact the Company’s results of operations, financial position or related disclosures.

In October 2009, the FASB issued authoritative guidance that amends existing guidance for identifying separate deliverables in a revenue-generating transaction where multiple deliverables exist, and provides guidance for measuring and allocating revenue to one or more units of accounting.  In addition, the FASB issued authoritative guidance on arrangements that include software elements.  Under this guidance, tangible products containing software components and non-software components that are essential to the functionality of the tangible product will no longer be within the scope of the software revenue recognition guidance. This guidance is effective using the prospective application or the retrospective application for revenue arrangements entered into or materially modified in fiscal years beginning on or afte r June 15, 2010 with earlier application permitted. This guidance did not materially impact the Company’s results of operations or financial position.

In January 2010, the FASB issued authoritative guidance that amends the disclosure requirements related to recurring and nonrecurring fair value measurements. This guidance requires new disclosures on the transfers of assets and liabilities between Level 1 (assets and liabilities measured using observable inputs such as quoted prices in active markets) and Level 2 (assets and liabilities measured using inputs other than quoted prices in active markets that are either directly or indirectly observable) of the fair value measurement hierarchy, including the amount and reason of the transfers. Additionally, this guidance requires a roll forward of activities on purchases, sales, issuance, and settlements of the assets and liabilities measured using significant unobservable inputs (Level 3 fair value measurements). This guidance is effect ive for interim and annual reporting periods beginning after December 15, 2009, with the exception of the additional disclosure for Level 3 assets and liabilities, which is effective for fiscal years beginning after December 15, 2010, and for interim periods within those fiscal years. This guidance did not materially impact the Company’s results of operations or financial position, but did require changes to the disclosures in its interim and annual financial statements.

In February 2010, the FASB issued authoritative guidance that amends the disclosure requirements related to subsequent events. This guidance includes the definition of a Securities and Exchange Commission filer, removes the definition of a public entity, redefines the reissuance disclosure requirements and allows public companies to omit the disclosure of the date through which subsequent events have been evaluated.  This guidance is effective for financial statements issued for interim and annual periods ending after February 2010. This guidance did not materially impact the Company’s results of operations or financial position, but did require changes to the Company’s disclosures in its financial statements.

In April 2010, the FASB issued authoritative guidance related to the criteria that should be met for determining whether the milestone method of revenue recognition is appropriate.  A vendor can recognize consideration that is contingent upon achievement of a milestone in its entirety as revenue in the period in which the milestone is achieved if the milestone is: (a) commensurate with either the vendor’s performance to achieve the milestone or the enhancement of the value of the item delivered; (b) relates solely to past performance; and (c) is reasonable relative to all deliverables and payment terms in the arrangement.  This guidance is effective on a prospective basis for financial statements issued for interim and annual periods ending after June 15, 2010 with early adoption permitted.  The ado ption of this guidance did not have a material impact on the Company’s results of operations or financial position.
F-14

COSTAR GROUP, INC.
NOTES TO CONSOLIDATED FINANCIAL STATEMENTS ¾ (CONTINUED)

3. ACQUISITIONS

On February 16, 2007, CoStar Limited, aJuly 17, 2009, the Company acquired all of the issued and outstanding equity securities of PPR, and its wholly owned U.K. subsidiary Property and Portfolio Research Ltd., providers of real estate analysis, market forecasts and credit risk analytics to the commercial real estate industry. The Company acquired PPR from DMG Information, Inc. (“DMGI”) in exchange for 572,999 shares of CoStar common stock, which had an aggregate value of approximately $20.9 million as of the closing date. On July 17, 2009, 433,667 shares of the Company’s common stock were issued to DMGI, and the remaining 139,332 shares were issued to DMGI on September 28, 2009 after taking into account post-closing purchase price adjustments.

The purchase price for the PPR acquisition was allocated as follows (in thousands):
Working capital                                                                                                                        $(5,479)
Acquired trade names and other                                                                                                                         810 
Acquired customer base                                                                                                                         5,300 
Acquired database technology                                                                                                                        3,700 
Goodwill                                                                                                                        16,572 
Total purchase consideration                                                                                                                     $20,903 
On October 19, 2009, the Company acquired all of the outstanding capital stock of Property Investment Exchange LimitedResolve Technology, Inc. (“PropexTMResolve Technology”), a Delaware corporation, for approximately $22.0$4.5 million, consisting of approximately $3.4 million in cash deferred consideration and 21,52625,886 shares of CoStar common stock. Propex provides web-based commercial property informationstock, which had an aggregate value of approximately $1.1 million as of the closing date.  The shares are subject to a three-year lockup, pursuant to which one-third were released in October 2010.   Additionally, the seller may be entitled to receive (i) a potential deferred cash payment due approximately two years after closing based on the incremental growth of Resolve Technology’s revenue as of September 2011 over its revenue as of September 2009, and operates an electronic platform that facilitates(ii) other potential deferred cash payments for successful completion of operational and sales milestones during the exchange of investment property inperiod from closing through no later than October 31, 2013, which period may be extended by the U.K. Propex’s suite of electronic platforms and listing websites give users accessparties to a date no later than December 31, 2014.

The purchase price for the U.K. commercial property investment and leasing markets.Resolve Technology acquisition was allocated as follows (in thousands):
Purchase price in cash and stock                                                                                                                        $4,499 
Deferred consideration                                                                                                                         3,052 
Total purchase consideration                                                                                                                     $7,551 
     
Working capital                                                                                                                        $(550)
Acquired trade names and other                                                                                                                         430 
Acquired customer base                                                                                                                         890 
Acquired database technology                                                                                                                        1,200 
Goodwill                                                                                                                        5,581 
Total purchase consideration                                                                                                                     $7,551 
F-15

COSTAR GROUP, INC.
NOTES TO CONSOLIDATED FINANCIAL STATEMENTS ¾ (CONTINUED)

On April 1, 2008, the Company acquired certain assets of First CLS, Inc. (doing business as the Dorey Companies and DoreyPRO), an Atlanta-based provider of local commercial real estate information for $3.0 million in initial cash consideration and deferred consideration payable within approximately six months of the one-year anniversary of closing.3. ACQUISITIONS¾ (CONTINUED)

These acquisitions were accounted for usingas purchase business combinations.  For each of the PPR and Resolve Technology acquisitions, the purchase method of accounting. The purchase price of the Propex acquisition was primarily allocated to various working capital accounts, developed technology, customer base, trade name,trademarks, non-competition agreements and goodwill. The purchase price of the First CLS, Inc. acquisition was primarily allocated to acquired customer base.  The acquired customer base for the acquisitions, which consists of one distinct intangible asset for each acquisition and is composed of acquired customer contracts and the related customer relationships, is being amortized on a 125% declining balance method over ten years. The Propex acquired trade name isidentified intangibles are being amortized on a straight-line basis over three years. We recorded goodwill of approximately $15.0 milliontheir estimated useful lives.  Goodwill for the Propex acquisition and $1.1 million for the First CLS, Inc. acquisition.  Goodwillthese acquisitions is not amortized, but is subject to annual impairment tests.  Goodwill includes acquired workforce. The results of operationsoperation s of PropexPPR and First CLS, Inc.Resolve Technology have been consolidated with those of the Company since the daterespective dates of the acquisitionacquisitions and are not considered material to ourthe Company’s consolidated financial statements. Accordingly, pro forma financial information has not been presented for either acquisition.
F-14

COSTAR GROUP, INC.
NOTES TO CONSOLIDATED FINANCIAL STATEMENTS ¾ (CONTINUED)of the acquisitions.

4. INVESTMENTS

The Company accounts for investments in accordance with Statement of Financial Accounting Standards No. 115“Accounting for Certain Investments in Debt and Equity Securities” (“SFAS No. 115”). The Company determines the appropriate classification of debt and equity investments at the time of purchase and reevaluatesre-evaluates such designation as of each balance sheet date.  The Company considers all of its investments to be available-for-sale.  Short-term investments consist of commercial paper, government/federal notes and bonds and corporate obligations with maturities greater than 90 days at the time of purchase. Available-for-sale short-term investments with contractual maturities beyond one year are classified as current in the Company’s consolidated balance sheets because they represent the investment of cash that is available for current operations. Long-term investments consist of variable rate debt instruments with an auction rate securities.reset feature, referred to as ARS.  Investments are carried at fair market value.

Scheduled maturities of investments classified as available-for-sale as of December 31, 20082010 are as follows (in thousands):

Maturity Fair Value 
Due in:   
2009 $5,226 
2010-2013  26,881
 
2014-2018  917 
2019 and thereafter  31,131 
   64,155 
Securities with multiple maturities  453 
Investments $64,608 
Maturity Fair Value 
Due in:   
2011                                                                                                                 $46 
2012-2015                                                                                                                  3,603 
2016-2020                                                                                                                  73 
2021 and thereafter                                                                                                                  29,189 
Available-for-sale investments                                                                                                                     $32,911 
 
The realized gains on the Company’s investments for the years ended December 31, 20072008, 2009 and 2008 was2010 were approximately $24,000$329,000, $4,000 and $329,000,$11,000, respectively.  The realized losses on the Company’s investments for the years ended December 31, 20072008, 2009 and 2008 was2010 were approximately $232,000$489,000, $5,000 and $489,000,$41,000, respectively.

Unrealized holding gains and losses, net of the related tax effect, on available-for-sale securities are excluded from earnings and are reported as a separate component of accumulated other comprehensive income (loss) in stockholders’ equity until realized.  Realized gains and losses from the sale of available-for-sale securities are determined on a specific-identification basis. A decline in market value of any available-for-sale security below cost that is deemed to be other than temporaryother-than-temporary results in a reduction in carrying amount to fair value.  The impairment is charged to earnings and a new cost basis for the security is established.  Dividend and interest income are recognized when earned.
F-16

COSTAR GROUP, INC.
NOTES TO CONSOLIDATED FINANCIAL STATEMENTS ¾ (CONTINUED)

4. INVESTMENTS ¾ (CONTINUED)
As of December 31, 2010, the amortized cost basis and fair value of investments classified as available-for-sale are as follows (in thousands):

  
Amortized
Cost
  
Gross
Unrealized
Gains
  
Gross
Unrealized
Losses
  Fair Value 
Collateralized debt obligations                                                                                $46  $¾  $¾  $46 
Corporate debt securities                                                                                 3,407   196   ¾   3,603 
Government-sponsored enterprise obligations
  74   ¾   (1)  73 
Auction rate securities
  32,175   ¾   (2,986)  29,189 
Available-for-sale investments
 $35,702  $196  $(2,987) $32,911 

As of December 31, 2009, the amortized cost basis and fair value of investments classified as available-for-sale are as follows (in thousands):

  
Amortized
Cost
  
Gross
Unrealized
Gains
  
Gross
Unrealized
Losses
  Fair Value 
Collateralized debt obligations                                                                                $12,987  $5  $(14) $12,978 
Corporate debt securities                                                                                 6,396   331   ¾   6,727 
Residential mortgage-backed securities
  394   ¾   (7)  387 
Government-sponsored enterprise obligations
  97   ¾   (1)  96 
Auction rate securities
  32,750   ¾   (3,026)  29,724 
Available-for-sale investments
 $52,624  $336  $(3,048) $49,912 
The unrealized losses on the Company’s investments as of December 31, 20072009 and 20082010 were generated primarily from increaseschanges in interest rates. The losses are considered temporary, as the contractual terms of these investments do not permit the issuer to settle the security at a price less than the amortized cost of the investment. Because the Company hasdoes not intend to sell these instruments and it is more likely than not that the abilityCompany will not be required to holdsell these investments until ainstruments prior to anticipated recovery, of fair value, which may be maturity, it does not consider these investments to be other-than-temporarily impaired as of December 31, 20072009 and 2008.2010.  See Note 5 to the consolidated financial statements for further discussion on the fair value of the Company’s financial assets.

The components of the Company’s investments in an unrealized loss position for more than twelve months consists of the following (in thousands):
 December 31, 
 2009 2010 
 
Aggregate
Fair
 Value
 
Gross
Unrealized
Losses
 
Aggregate
Fair
 Value
 
Gross
Unrealized
Losses
 
Collateralized debt obligations
 $7,578  $(14) $¾  $¾ 
Residential mortgage-backed securities  387   (7)  ¾   ¾ 
Government-sponsored enterprise obligations
  96   (1)  73   (1)
Auction rate securities
  29,724   (3,026)  29,189   (2,986)
  $37,785  $(3,048) $29,262  $(2,987)
 
F-15F-17

 
COSTAR GROUP, INC.
NOTES TO CONSOLIDATED FINANCIAL STATEMENTS ¾ (CONTINUED)

4. INVESTMENTS ¾ (CONTINUED)

The components of theCompany did not have any investments in a loss position for more than twelve months consists of the following (in thousands):

  December 31, 
  2007  2008 
  
Aggregate
Fair
 Value
  
Gross
Unrealized
Losses
  
Aggregate
Fair
 Value
  
Gross 
Unrealized 
Losses
 
Federal debt securities $1,592  $(15) $¾  $¾ 
Corporate debt securities  13,886   (49)  22,136   (1,494)
  $15,478  $(64) $22,136  $(1,494)

The components of the investments in aan unrealized loss position for less than twelve months consistsas of the following (in thousands):

  December 31, 
  2007  2008 
  
Aggregate
Fair
 Value
  
Gross
Unrealized
Losses
  
Aggregate
Fair
 Value
  
Gross 
Unrealized 
Losses
 
Auction rate securities $¾  $¾  $29,340  $(3,710)
Federal debt securities  531   (1)  19   (1)
Corporate debt securities  21,234   (148)  6,976   (366)
  $21,765  $(149) $36,335  $(4,077)
December 31, 2009 and 2010, respectively.

The gross unrealized gains on the Company’s investments as of December 31, 20072009 and 20082010 were approximately $330,000$336,000 and $128,000,$196,000, respectively.

5. FAIR VALUE

In September 2006,Fair value is defined as the FASB issued SFAS No. 157, “Fair Value Measurements” (“SFAS 157”), which defines fair value, establishesprice that would be received in the sale of an asset or paid to transfer a framework for measuring fair valueliability in accordance with GAAP and expands disclosures about fair value measurements. The Company adopted the provisions of SFAS 157 as of January 1, 2008 for financial instruments.  Although the adoption of SFAS 157 did not materially impact its financial position, results of operations, or cash flow, the Companyan orderly transaction between market participants.  There is now required to provide additional disclosures as part of its financial statements.
F-16

COSTAR GROUP, INC.
NOTES TO CONSOLIDATED FINANCIAL STATEMENTS ¾ (CONTINUED)

5. FAIR VALUE ¾ (CONTINUED)

SFAS 157 establishes a three-tier fair value hierarchy, which categorizes the inputs used in measuring fair value.  These tiers include: Level 1, defined as observable inputs such as quoted prices in active markets; Level 2, defined as inputs other than quoted prices in active markets that are either directly or indirectly observable; and Level 3, defined as unobservable inputs in which little or no market data exists, therefore requiring an entity to develop its own assumptions.

In accordance with SFAS 157, theThe following table represents the Company's fair value hierarchy for its financial assets (cash, cash equivalents and investments) and liabilities measured at fair value on a recurring basis as of December 31, 20082010 (in thousands):
 
 Level 1  Level 2  Level 3  Total  Level 1  Level 2  Level 3  Total 
Assets:            
Cash  $29,297  $¾  $¾  $29,297  $55,496  $¾  $¾  $55,496 
Money market funds   130,685   ¾   ¾   130,685   150,909   ¾   ¾   150,909 
Collateralized debt obligations
  ¾   46   ¾   46 
Corporate debt securities  ¾   35,132   ¾   35,132   ¾   3,603   ¾   3,603 
Government-sponsored enterprise obligations  ¾   136   ¾   136   ¾   73   ¾   73 
Auction rate securities  ¾   ¾   29,340   29,340   ¾   ¾   29,189   29,189 
Total $159,982  $35,268  $29,340  $224,590 
Total assets measured at fair value
 $206,405  $3,722  $29,189  $239,316 
Liabilities:                
Deferred consideration
 $¾  $¾  $3,222  $3,222 
Total liabilities measured at fair value
 $¾  $¾  $3,222  $3,222 

The following table represents the Company's fair value hierarchy for its financial assets (cash, cash equivalents and investments) and liabilities measured at fair value on a recurring basis as of December 31, 2009 (in thousands):

  Level 1  Level 2  Level 3  Total 
Assets:            
Cash
 $38,721  $¾  $¾  $38,721 
Money market funds
  167,065   ¾   ¾   167,065 
Collateralized debt obligations
  ¾   12,978   ¾   12,978 
Corporate debt securities
  ¾   6,727   ¾   6,727 
Residential mortgage-backed securities
  ¾   387   ¾   387 
Government-sponsored enterprise obligations
  ¾   96   ¾   96 
Auction rate securities
  ¾   ¾   29,724   29,724 
Total assets measured at fair value
 $205,786  $20,188  $29,724  $255,698 
Liabilities:                
Deferred consideration
 $¾  $¾  $3,082  $3,082 
Total liabilities measured at fair value
 $¾  $¾  $3,082  $3,082 
 
F-18

COSTAR GROUP, INC.
NOTES TO CONSOLIDATED FINANCIAL STATEMENTS ¾ (CONTINUED)

5. FAIR VALUE ¾ (CONTINUED)

The Company’s Level 2 assets consist of collateralized debt obligations, corporate debt securities, residential mortgage-backed securities and government-sponsored enterprise obligations, which do not have directly observable quoted prices in active markets.  The Company’s corporate debt securitiesLevel 2 assets are valued using matrix pricing, which is an acceptable practical expedient under SFAS 157 for inputs.pricing.

The Company’s Level 3 assets consist of variable rate debt instruments with an auction-reset feature, Auction Rate Securities (“ARS”),ARS, whose underlying assets are primarily student loan securities supported by guarantees from the FFELPFederal Family Education Loan Program (“FFELP”) of the U.S. Department of Education.

The following table presentssummarizes changes in fair value of the Company’s Level 3 assets measured at fair value on a recurring basis using significant unobservable inputs as defined in SFAS 157, as offrom December 31, 20082007 to December 31, 2010 (in thousands):
 
 
Auction
Rate
Securities
  
Auction
Rate
Securities
 
Balance at December 31, 2007 $53,975  $53,975 
Unrealized loss included in other comprehensive income  (3,710)
Unrealized loss included in other comprehensive loss
  (3,710)
Settlements  (20,925)  (20,925)
Balance at December 31, 2008 $29,340   29,340 
Unrealized gain included in other comprehensive loss
  684 
Settlements
  (300)
Balance at December 31, 2009
  29,724 
Unrealized gain included in other comprehensive loss
  40 
Settlements
  (575)
Balance at December 31, 2010
 $29,189 
 
ARS are variable rate debt instruments whose interest rates are reset approximately every 28 days.  The underlying securities have contractual maturities greater than twenty years.  The ARS are recorded at fair value.  Typically, the carrying value of ARS approximates fair value due to frequent resetting of the interest rates.

As of December 31, 2008,2010, the Company held ARS with $33.1$32.2 million par value, all of which failed to settle at auctions.auction.  The majority of these investments are of high credit quality with AAA credit ratings and are primarily student loan securities supported by guarantees from the FFELP of the U.S. Department of Education.  The Company may not be able to liquidate and fully recover the carrying value of the ARS in the near term.  As a result, these securities are classified as long-term investments in the Company’s consolidated balance sheet as of December 31, 2008. 
F-17

COSTAR GROUP, INC.
NOTES TO CONSOLIDATED FINANCIAL STATEMENTS ¾ (CONTINUED)2010. 

5. FAIR VALUE ¾ (CONTINUED)

While the Company continues to earn interest on its ARS investments at the maximum contractual rate, these investments are not currently trading and therefore do not currently have a readily determinable market value.  Accordingly, the estimated fair value of the ARS no longer approximates par value.  The Company has used a discounted cash flow model to determine the estimated fair value of its investment in ARS as of December 31, 2008.2010.  The assumptions used in preparing the discounted cash flow model include estimates for interest rates, credit spreads, timing and amount of cash flows, liquidity risk premiums, expected holding periods and default risk.  Based on this assessment of fair value, as of December 31, 2008,2010, the Company determined there was a decline in the fair value of its ARS investments of approximately $3.7$3.0 million.  The decline was deemed to be a temporary impairment and recorded as an unrealized loss in accumulated other comprehensive incomeloss in stockholders’ equity.  In addition, while a majority of the ARS are currently rated AAA, if the issuers are unable to successfully close future auctions andand/or their credit ratings deteriorate, the Company may be required to record additional unrealized losses in accumulated other comprehensive incomeloss or an other-than-temporary impairment charge to earnings on these investments.

 
F-19

COSTAR GROUP, INC.
NOTES TO CONSOLIDATED FINANCIAL STATEMENTS ¾ (CONTINUED)

5. FAIR VALUE ¾ (CONTINUED)

As of December 31, 2010, the Company’s Level 3 liabilities consist of a $3.2 million liability for deferred consideration related to the October 19, 2009 acquisition of Resolve Technology. The deferred consideration includes (i) a potential deferred cash payment due approximately two years after closing based on the incremental growth of Resolve Technology’s revenue as of September 2011 over its revenue as of September 2009, and (ii) other potential deferred cash payments for successful completion of operational and sales milestones during the period from closing through no later than October 31, 2013, which period may be extended by the parties to a date no later than December 31, 2014.

The following table summarizes changes in fair value of the Company’s Level 3 liabilities from December 31, 2008 to December 31, 2010 (in thousands):

  Deferred Consideration 
Balance at December 31, 2008
 $¾ 
Deferred consideration upon acquisition
  3,052 
Accretion for 2009
  30 
Balance at December 31, 2009
  3,082 
Accretion for 2010
  140 
Balance at December 31, 2010
 $3,222 

The Company used a discounted cash flow model to determine the estimated fair value of its Level 3 liabilities as of December 31, 2010.  The significant assumptions used in preparing the discounted cash flow model include the discount rate, estimates for future incremental revenue growth and probabilities for completion of operational and sales milestones.

6. PROPERTY AND EQUIPMENT

Property and equipment consists of the following (in thousands):

 December 31,  December 31, 
 2007  2008  2009  2010 
      
Building
 $¾  $42,920 
Leasehold improvements  $8,357  $7,808   10,333   16,290 
Furniture, office equipment and research vehicles  19,874  19,305   20,279   21,116 
Computer hardware and software   27,735   27,938   28,259   24,354 
 55,966  55,051   58,871   104,680 
Accumulated depreciation and amortization   (31,921)  (38,175)  (39,709)  (34,759)
Property and equipment, net  $24,045  $16,876  $19,162  $69,921 

F-20


COSTAR GROUP, INC.
NOTES TO CONSOLIDATED FINANCIAL STATEMENTS ¾ (CONTINUED)

7. GOODWILL

The changes in the carrying amount of goodwill by operating segment consist of the following (in thousands):

  United States  International  Total 
Goodwill, December 31, 2008
 $31,547  $22,781  $54,328 
Acquisitions
  23,858   ¾   23,858 
Effect of foreign currency translation
  ¾   2,280   2,280 
Purchase accounting adjustment
  (145)  ¾   (145)
Goodwill, December 31, 2009 
  55,260   25,061   80,321 
Effect of foreign currency translation
  ¾   (719)  (719)
Goodwill, December 31, 2010 
 $55,260  $24,342  $79,602 

  United States  International  Total 
Goodwill, December 31, 2006 $30,428  $16,069  $46,497 
Acquisitions  ¾   14,806   14,806 
Effect of foreign currency translation  ¾   551   551 
Goodwill, December 31, 2007  30,428   31,426   61,854 
Acquisitions  1,119   ¾   1,119 
Effect of foreign currency translation  ¾   (8,645)  (8,645)
Goodwill, December 31, 2008 $31,547  $22,781  $54,328 

The Company recorded goodwill of approximately $15.0 million for the Propex acquisition in February 2007.  The Company recorded goodwill of approximately $1.1 million in connection with the First CLS, Inc. acquisition in April 2008.2008, which was decreased by $145,000 in 2009, upon completion of purchase accounting.  Approximately $1.7 million in additional goodwill was recorded in connection with the First CLS, Inc. acquisition as a result of the payment of deferred consideration of $1.7 million in August 2009.  The decreaseCompany recorded goodwill of approximately $16.6 million in connection with the July 2009 acquisition of PPR.  In July 2009, the Company had recorded $12.1 million in goodwill for the PPR acquisition, which was increased by $4.5 million in 2008 isDecember 2009 upon completion of the Company’s review of the income tax attributes and deferred taxes related to foreign currency fluctuations.the PPR purchase accounting. The Company reco rded goodwill of approximately $5.6 million in connection with the Resolve Technology acquisition in October 2009.

During the fourth quarters of 20072009 and 2008,2010, the Company completed the annual impairment test of goodwill and concluded that goodwill was not impaired.
 
F-18F-21

 
COSTAR GROUP, INC.
NOTES TO CONSOLIDATED FINANCIAL STATEMENTS ¾ (CONTINUED)

8. INTANGIBLES AND OTHER ASSETS

Intangibles and other assets consist of the following (in thousands, except amortization period data):
 
     Weighted-Average 
  December 31,   Amortization Period 
  2009  2010    (in years) 
          
Building photography
 $11,504  $11,771  5 
Accumulated amortization
  (9,089)  (10,311)    
Building photography, net
  2,415   1,460     
             
Acquired database technology
  25,790   26,034  4 
Accumulated amortization
  (21,144)  (22,150)    
Acquired database technology, net
  4,646   3,884     
             
Acquired customer base
  55,770   55,380  10 
Accumulated amortization
  (41,208)  (43,349)    
Acquired customer base, net
  14,562   12,031     
             
Acquired trade names and other
  9,755   9,640  7 
Accumulated amortization
  (7,988)  (8,241)    
Acquired trade names and other, net  1,767   1,399     
             
Intangibles and other assets, net
 $23,390  $18,774     


December 31,
 
Weighted- Average
Amortization
Period
(in years)
2007  2008 
        
Building photography $10,799  $11,011 5
Accumulated amortization  (6,708)  (7,711) 
Building photography, net  4,091   3,300  
          
Acquired database technology  21,390   20,711 4
Accumulated amortization  (20,573)  (20,361) 
Acquired database technology, net  817   350  
          
Acquired customer base  50,891   48,198 10
Accumulated amortization  (34,374)  (37,192) 
Acquired customer base, net  16,517   11,006  
          
Acquired trade names and other  9,089   7,744 6
Accumulated amortization  (4,803)  (5,979) 
Acquired trade names and other, net  4,286   1,765  
          
Intangibles and other assets, net $25,711  $16,421  
 
Amortization expense for intangibles and other assets was approximately $6.1$8.4 million, for the year ended December 31, 2006$7.1 million and $8.4$5.0 million for the years ended December 31, 20072008, 2009 and 2008, respectively.2010.

In the aggregate, amortization for intangibles and other assets existing as of December 31, 20082010 for future periods is expected to be approximately $5.4$3.3 million, $3.3 million, $2.4 million, $1.9 million, $1.1$1.8 million and $1.0$1.7 million for the years ending December 31, 2009, 2010, 2011, 2012, 2013, 2014 and 2013,2015, respectively.
 
F-19F-22

 
COSTAR GROUP, INC.
NOTES TO CONSOLIDATED FINANCIAL STATEMENTS ¾ (CONTINUED)

9. INCOME TAXES

The components of the provision (benefit) for income taxes attributable to operations consist of the following (in thousands):

 Year Ended December 31, 
 2006  2007  2008  Year Ended December 31, 
          2008  2009  2010 
Current:                  
Federal $414  $574  $18,289  $18,289  $15,194  $7,061 
State  220   821   3,842   3,842   1,593   1,424 
Foreign
  ¾   26   61 
Total current  634   1,395   22,131   22,131   16,813   8,546 
Deferred:                        
Federal 7,497  9,716  (408)  (408)  (2,097)  1,706 
State 1,077  72  (52)  (52)  (199)  (6)
Foreign  (692)  (1,237)  (1,592)  (1,592)  (122)  (25)
Total deferred  7,882   8,551   (2,052)  (2,052)  (2,418)  1,675 
Total provision for income taxes $8,516  $9,946  $20,079  $20,079  $14,395  $10,221 

The components of deferred tax assets and liabilities consists of the following (in thousands):

 December 31, 
 2007  2008  December 31, 
       2009  2010 
Deferred tax assets:            
Reserve for bad debts  $799  $928  $1,093  $921 
Accrued compensation  1,286  2,144   3,156   3,030 
Stock compensation  1,603  2,115   3,168   3,087 
Net operating losses  3,177  3,077   2,985   3,365 
Restructuring reserve  45  ¾ 
Alternative minimum tax credits  1,393  ¾ 
Accrued reserve
  238   961 
Capital loss carryovers  ¾  345   348   312 
Unrealized loss on securities  ¾  2,088   1,076   1,074 
Deferred rent   501   1,546 
Deferred revenue
  214   1,154 
Other liabilities   1,001   1,401   209   226 
Total deferred tax assets   9,304   12,098   12,988   15,676 
                
Deferred tax liabilities:                
Prepaids  (739) (522)  (638)  (725)
Depreciation  (427) (626)  (587)  (2,396)
Identified intangibles associated with purchase accounting   (4,927)  (2,607)
Intangibles
  (3,350)  (4,132)
Total deferred tax liabilities   (6,093)  (3,755)  (4,575)  (7,253)
                
Net deferred tax asset  3,211  8,343   8,413   8,423 
Valuation allowance   (63)  (3,047)  (2,985)  (4,670)
Net deferred taxes  $3,148  $5,296  $5,428  $3,753 

The net long-term deferred tax liability shown on the balance sheet includes deferred tax liabilities and assets related to the international operations of the Company.
 
F-20F-23

 
COSTAR GROUP, INC.
NOTES TO CONSOLIDATED FINANCIAL STATEMENTS ¾ (CONTINUED)

9. INCOME TAXES ¾ (CONTINUED)

For the years ended December 31, 20072009 and 2008,2010, a valuation allowance has been established for certain deferred tax assets due to the uncertainty of realization. The Company’s change in valuation allowance was a decrease of approximately $274,000 for the yearyears ended December 31, 20072009 and 2010 includes an increase of approximately $3.0 millionallowance for the year ended December 31, 2008. The increase for the year ended December 31, 2008 is due to an increase in the valuation allowance required for theunrealized losses, capital loss carryforwards, foreign deferred tax assets for internationaland state net operating loss carryforwards, capital loss carryforwards,  and unrealized losses on securities.carryforwards. The increase in the valuation allowance for the deferred tax asset for unrealized losses has been recorded as an adjustment to accumulated other comprehensive loss.

The Company established the valuation allowance because it is more likely than not that a portion of the deferred tax asset for certain items will not be realized based on the weight of available evidence. A valuation allowance was established for the unrealized losses on securities and the capital loss carryovers as the Company has not historically generated capital gains, and it is uncertain whether the Company will generate sufficient capital gains in the future to absorb the capital losses. A valuation allowance was established for the foreign deferred tax assets due to the uncertainty of future foreign taxable income. The Company has not had sufficient taxable income historically to utilize the foreign deferred tax assets, and it is uncertain whether the Company will generate sufficient taxable income in the future.  Si milarly, the Company has established a valuation allowance for net operating losses in certain states where it is uncertain whether the Company will generate sufficient taxable income before the losses expire.

The Company’s change in valuation allowance was a decrease of approximately $62,000 for the year ended December 31, 2007 was2009 and an increase of approximately $1.7 million for the year ended December 31, 2010. The increase for the year ended December 31, 2010 is primarily attributabledue to the increase in the valuation allowance for foreign deferred tax assets for state net operating loss carryforwards.assets.
 
For the year ended December 31, 2008,2010, the Company had U.S. income of approximately $52.7$30.2 million subject to applicable U.S. federal and state income tax laws and a foreign loss of approximately $8.0 million subject to applicable international tax laws.$6.7 million.

The Company’s provision for income taxes resulted in effective tax rates that varied from the statutory federal income tax rate as follows (in thousands):
 
  Year Ended December 31, 
  2006  2007  2008 
          
Expected federal income tax provision at statutory rate $7,115  $8,805  $15,646 
State income taxes, net of federal benefit  1,014   841   2,505 
Foreign income taxes, net effect  119   156   497 
Stock compensation  528   146   87 
(Decrease) increase in valuation allowance  (267)  (274)  1,023 
Other adjustments  7   272   321 
Income tax expense, net $8,516  $9,946  $20,079 

  Year Ended December 31, 
  2008  2009  2010 
          
Expected federal income tax provision at statutory rate $15,646  $11,581  $8,229 
State income taxes, net of federal benefit
  2,505   1,778   1,372 
Foreign income taxes, net effect
  497   347   (1,688)
Stock compensation
  87   300   289 
Increase in valuation allowance
  1,023   1,446   1,657 
Disregarded entity election
  ¾   (1,477)  (992)
Nondeductible compensation  ¾   140   945 
Other adjustments
  321   280   409 
Income tax expense, net
 $20,079  $14,395  $10,221 
The Company paid approximately $858,000, $1.1$13.4 million, $19.4 million, and $13.4$12.9 million in income taxes for the years ended December 31, 2006, 20072008, 2009 and 2008,2010, respectively.

The Company has net operating loss carryforwards for international income tax purposes of approximately $10.1$11.8 million, which do not expire.
F-24

COSTAR GROUP, INC.
NOTES TO CONSOLIDATED FINANCIAL STATEMENTS ¾ (CONTINUED)

The Company adopted FIN 48 on January 1, 2007. As a result of the implementation of FIN 48, the Company recognized no material adjustment in the liability for unrecognized income tax benefits. At the adoption date of January 1, 2007, the Company had $217,000 of unrecognized tax benefits, all of which would favorably affect the effective tax rate if recognized in future periods, and $52,000 of accrued penalties and $47,000 of accrued interest. The Company’s continuing practice is to recognize interest and penalties related to income tax matters in income tax expense.
9. INCOME TAXES¾ (CONTINUED)

The following tables summarize the activity related to the Company’s unrecognized tax benefits (in thousands):

Unrecognized tax benefit as of January 1, 2007                                                                                                                   $217 
Increase for current year tax positions                                                                                                                44 
Increase for prior year tax positions                                                                                                                (6
Expiration of the statute of limitation for assessment of taxes                                                                                                                (22)
Unrecognized tax benefit as of December 31, 2007                                                                                                                   $233 
F-21

COSTAR GROUP, INC.
NOTES TO CONSOLIDATED FINANCIAL STATEMENTS ¾ (CONTINUED)
9. INCOME TAXES¾ (CONTINUED)
Unrecognized tax benefit as of December 31, 2007  $233  $233 
Increase for current year tax positions   1,451 
Decrease for prior year tax positions   (9)
Expiration of the statute of limitation for assessment of taxes   (117)
Unrecognized tax benefit as of December 31, 2008   1,558 
Increase for current year tax positions   1,451   69 
Increase for prior year tax positions   (9)  257 
Expiration of the statute of limitation for assessment of taxes   (117)  (28)
Unrecognized tax benefit as of December 31, 2008  $1,558 
Unrecognized tax benefit as of December 31, 2009   1,856 
Increase for current year tax positions   70 
Decrease for prior year tax positions   (116)
Expiration of the statute of limitation for assessment of taxes   (44)
Unrecognized tax benefit as of December 31, 2010  $1,766 
 
Approximately $142,000$244,000 and $233,000$217,000 of the unrecognized tax benefit as of December 31, 2008,2010, and 2007,2009, respectively, would favorably affect the annual effective tax rate, if recognized in future periods. During 2010, the Company recognized approximately $20,000 of interest and $7,000 of penalties, and had total accruals of approximately $184,000 for interest and $61,000 for penalties as of December 31, 2010. During 2009, the Company recognized approximately $10,000 of interest benefit and $20,000 of penalties, and had total accruals of approximately $164,000 for interest and $54,000 for penalties as of December 31, 2009. During 2008, the Company recognized approximately $145,000 of interest and $9,000 of penalties, and had total accruals of approximately $173,000 for interest and $34,000 for penalties as of December 31, 2008. During 2007, the Company recognized approximately $36,000 of interest and $11,000 of penalties, and had total accruals of approximately $74,000 for interest and $57,000 for penalties as of December 31, 2007. The CompanyComp any does not anticipate the amount of the unrecognized tax benefits to change significantly over the next twelve months.

The Company’s federal and state income tax returns for tax years 20052006 through 20072009 remain open to examination.  The Company’s U.K. income tax returns for tax years 20022004 through 20072009 remain open to examination.

10. GAIN ON LEASE SETTLEMENT, NET

On September 14, 2007, CoStar Limited, a wholly owned U.K. subsidiary of CoStar, entered into an agreement with Trafigura Limited to assign to Trafigura the leasehold interest in the office space located in London. The lease assignment was completed on December 19, 2007. As a result, CoStar U.K. was paid approximately $7.6 million, net of expenses, for the assignment of the lease. The expenses associated with the lease settlement included legal, moving and the disposal of assets.

11. COMMITMENTS AND CONTINGENCIES

The Company leases office facilities and office equipment under various noncancelable-operating leases. The leases contain various renewal options. Rent expense for the years ended December 31, 2006, 20072008, 2009 and 20082010 was approximately $7.0$8.0 million, $8.1$9.1 million and $8.0$12.0 million, respectively.

Future minimum lease payments as of December 31, 20082010 are as follows (in thousands):

   
2009 $8,264 
2010  5,652 
2011  4,389  $8,691 
2012  3,221   7,774 
2013  1,055   5,331 
2014 and thereafter  1,015 
2014
  3,567 
2015
  3,341 
2016 and thereafter
  18,749 
 $23,596  $47,453 
F-25

 
COSTAR GROUP, INC.
NOTES TO CONSOLIDATED FINANCIAL STATEMENTS ¾ (CONTINUED)

10. COMMITMENTS AND CONTINGENCIES ¾ (CONTINUED)

On December 8, 2009, a former employee filed a lawsuit against the Company in the United States District Court for the Southern District of California alleging violations of the Fair Labor Standards Act and California state wage-and-hour laws and is seeking unspecified damages under those laws.  The complaint also seeks to declare a class of all similarly situated employees to pursue similar claims.  In May 2010, the parties reached a preliminary agreement to settle this lawsuit, and in June 2010, the Company accrued approximately $800,000 in general and administrative expense in anticipation of making a settlement payment that will formally resolve this litigation.  The Company anticipates the payment will be due during the second quarter of 2011.

Currently, and from time to time, the Company is involved in litigation incidental to the conduct of its business.  TheIn accordance with GAAP, the Company records a provision for a liability when it is both probable that a liability has been incurred and the amount can be reasonably estimated.  At the present time, while it is reasonably possible that an unfavorable outcome may occur as a result of one or more of the Company’s current litigation matters, management has concluded that it is not probable that a loss has been incurred in connection with the Company’s current litigation other than as described above.  In addition, other than as described above, the Company is not a partyunable to any lawsuitestimate the possible loss or proceedingrange of loss that could result from an unfavorable outcome in the opinion of management, is likely to have a material adverse effect on itsCompany’s cu rrent litigation and accordingly, the Company has not recognized any liability in the consolidated financial position orstatements for unfavorable results, of operations.
F-22

COSTAR GROUP, INC.
NOTES TO CONSOLIDATED FINANCIAL STATEMENTS — (CONTINUED)if any, other than described above. Legal defense costs are expensed as incurred.

12.11.  SEGMENT REPORTING

Due to the increased size, complexity, and funding requirements associated with the Company’s international expansion, in 2007 theThe Company began to manage themanages its business geographically in two operating segments, with the primary areas of measurement and decision-making being the U.S. and International, which includes the U.K. and France. The Company’s subscription-based information/marketinginformation services, consisting primarily of CoStar Property Professional®, CoStar Tenant®, CoStar COMPS Professional®, and FOCUSTM services, currently generate more than 90%approximately 94% of the Company’s total revenues.reve nues. CoStar Property Professional, CoStar Tenant, and CoStar COMPS Professional are generally sold as a suite of similar services and comprise the Company’s primary service offering in the U.S. operating segment.  FOCUS is the Company’s primary service offering in the International operating segment. Management relies on an internal management reporting process that provides revenue and operating segment EBITDA, which is the Company’s net income before interest, income taxes, depreciation and amortization. Management believes that operating segment EBITDA is an appropriate measure for evaluating the operational performance of our operating segments.  EBITDA is used by management to internally measure operating and management performance and to evaluate the performance of the business. However, this measure should be considered in addition to, not as a substitute for or superior to, income from operations or other measures of financial performance prepared in accordance with GAAP.
 
Summarized information by segment was as follows (in thousands):

  Year Ended December 31, 
  2006  2007 2008 
Revenues         
United States $146,073  $170,298  $190,075 
International  12,816   22,507   22,353 
  Total revenues $158,889  $192,805  $212,428 
             
EBITDA            
United States $26,205  $32,872  $58,813 
International  (315)  1,127   (2,224)
  Total EBITDA $25,890  $33,999  $56,589 
             
Reconciliation of EBITDA to net income            
EBITDA $25,890  $33,999  $56,589 
Purchase amortization in cost of revenues  (1,205)  (2,170)  (2,284)
Purchase amortization in operating expenses  (4,183)  (5,063)  (4,880)
Depreciation and other amortization  (6,421)  (8,914)  (9,637)
Interest income, net  6,845   8,045   4,914 
Income tax expense, net  (8,516)  (9,946)  (20,079)
  Net income $12,410  $15,951  $24,623 

International EBITDA includes a corporate allocation of approximately $1.0 million, $2.6 million and $1.1 million for the years ended December 31, 2006, 2007 and 2008, respectively.
 
F-23F-26

 
COSTAR GROUP, INC.
NOTES TO CONSOLIDATED FINANCIAL STATEMENTS — (CONTINUED)

12.SEGMENT REPORTING — (CONTINUED)
11.  SEGMENT REPORTING¾ (CONTINUED)

Summarized information by operating segment was as follows (in thousands):
  Year Ended December 31, 
  2008  2009 2010 
Revenues         
United States
 $190,075  $191,556  $208,463 
International            
External customers
  22,353   18,103   17,797 
Intersegment revenue
  ¾   898   1,266 
Total international revenue
  22,353   19,001   19,063 
Intersegment eliminations
  ¾   (898)  (1,266)
  Total revenues
 $212,428  $209,659  $226,260 
             
EBITDA            
United States
 $58,813  $47,697  $39,607 
International
  (2,224)  (1,186)  (3,183)
  Total EBITDA
 $56,589  $46,511  $36,424 
             
Reconciliation of EBITDA to net income            
EBITDA
 $56,589  $46,511  $36,424 
Purchase amortization in cost of revenues
  (2,284)  (2,389)  (1,471)
Purchase amortization in operating expenses
  (4,880)  (3,412)  (2,305)
Depreciation and other amortization
  (9,637)  (8,875)  (9,873)
Interest income, net
  4,914   1,253   735 
Income tax expense, net
  (20,079)  (14,395)  (10,221)
  Net income
 $24,623  $18,693  $13,289 
Intersegment revenue is attributable to services performed by Property and Portfolio Research Ltd., a wholly owned subsidiary of PPR, for PPR.  Intersegment revenue is recorded at an amount the Company believes approximates fair value.  U.S. EBITDA includes a corresponding cost for the services performed by Property and Portfolio Research Ltd. for PPR.  PPR and Property and Portfolio Research Ltd. were acquired in July 2009.
International EBITDA includes a corporate allocation of approximately $1.1 million, $500,000 and $400,000 for the years ended December 31, 2008, 2009 and 2010, respectively.  The corporate allocation represents costs incurred for U.S. employees involved in management and expansion activities of the Company’s International operating segment.
F-27

COSTAR GROUP, INC.
NOTES TO CONSOLIDATED FINANCIAL STATEMENTS — (CONTINUED)

11.  SEGMENT REPORTING¾ (CONTINUED)

Summarized information by operating segment consists of the following (in thousands):

  December 31, 
  2007  2008 
Property and equipment, net      
United States                                                                                                 $18,162  $13,927 
International                                                                                                  5,883   2,949 
  Total property and equipment, net                                                                                                 $24,045  $16,876 
         
Goodwill        
United States                                                                                                 $30,428  $31,547 
International                                                                                                  31,426   22,781 
Total goodwill                                                                                              $61,854  $54,328 
         
Assets        
United States                                                                                                 $308,373  $353,084 
International                                                                                                  72,659   43,474 
  Total segment assets                                                                                                 $381,032  $396,558 
         
Reconciliation of segment assets to total assets        
Total segment assets                                                                                                 $381,032  $396,558 
Investment in subsidiaries                                                                                                  (18,343)  (18,343)
Intercompany receivables                                                                                                  (40,846)  (43,831)
  Total assets                                                                                                 $321,843  $334,384 
         
Liabilities        
United States                                                                                                 $21,581  $24,180 
International                                                                                                  61,025   40,053 
  Total segment liabilities                                                                                                 $82,606  $64,233 
         
Reconciliation of segment liabilities to total liabilities        
Total segment liabilities                                                                                                 $82,606  $64,233 
Intercompany payables                                                                                                  (42,568)  (33,270)
  Total liabilities                                                                                                 $40,038  $30,963 
  December 31, 
  2009  2010 
Property and equipment, net      
United States                                                                                                 $14,851  $67,076 
International                                                                                                  4,311   2,845 
  Total property and equipment, net                                                                                                 $19,162  $69,921 
         
Goodwill        
United States                                                                                                 $55,260  $55,260 
International                                                                                                  25,061   24,342 
Total goodwill                                                                                              $80,321  $79,602 
         
Assets        
United States                                                                                                 $424,479  $469,449 
International
  44,558   39,038 
  Total segment assets
 $469,037  $508,487 
         
Reconciliation of segment assets to total assets        
Total segment assets                                                                                                 $469,037  $508,487 
Investment in subsidiaries                                                                                                  (18,344)  (18,344)
Intercompany receivables                                                                                                  (46,114)  (50,495)
  Total assets                                                                                                 $404,579  $439,648 
         
Liabilities        
United States
 $37,838  $52,482 
International                                                                                                  46,678   47,944 
  Total segment liabilities                                                                                                 $84,516  $100,426 
         
Reconciliation of segment liabilities to total liabilities        
Total segment liabilities                                                                                                 $84,516  $100,426 
Intercompany payables                                                                                                  (38,943)  (42,280)
  Total liabilities
 $45,573  $58,146 
 
 
F-24F-28

 
COSTAR GROUP, INC.
NOTES TO CONSOLIDATED FINANCIAL STATEMENTS ¾ (CONTINUED)

13.12.  STOCKHOLDERS’ EQUITY

Preferred Stock

The Company has 2,000,000 shares of preferred stock, $0.01 par value, authorized for issuance. The Board of Directors may issue the preferred stock from time to time as shares of one or more classes or series.

Common Stock

The Company has 30,000,000 shares of common stock, $0.01 par value, authorized for issuance. Dividends may be declared and paid on the common stock, subject in all cases to the rights and preferences of the holders of preferred stock and authorization by the Board of Directors. In the event of liquidation or winding up of the Company and after the payment of all preferential amounts required to be paid to the holders of any series of preferred stock, any remaining funds shall be distributed among the holders of the issued and outstanding common stock.

14.13.  NET INCOME PER SHARE

The following table sets forth the calculation of basic and diluted net income per share (in thousands except per share data):

  Year Ended December 31, 
  2006  2007  2008 
Numerator:         
Net income $12,410  $15,951  $24,623 
Denominator:            
Denominator for basic net income per share ¾ weighted-average outstanding shares
  18,751   19,044   19,372 
Effect of dilutive securities:            
Stock options and restricted stock  414   360   178 
Denominator for diluted net income per share ¾ weighted-average outstanding shares
  19,165   19,404   19,550 
             
Net income per share ¾ basic
 $0.66  $0.84  $1.27 
Net income per share ¾ diluted
 $0.65  $0.82  $1.26 
  Year Ended December 31, 
  2008  2009  2010 
Numerator:         
Net income
 $24,623  $18,693  $13,289 
Denominator:            
Denominator for basic net income per share ¾ weighted-average outstanding shares
  19,372   19,780   20,330 
Effect of dilutive securities:            
Stock options and restricted stock
  178   145   377 
Denominator for diluted net income per share ¾ weighted-average outstanding shares
  19,550   19,925   20,707 
             
Net income per share ¾ basic 
 $1.27  $0.95  $0.65 
Net income per share ¾ diluted 
 $1.26  $0.94  $0.64 
 
Stock options to purchase approximately 86,900, 80,400250,200, 483,800 and 250,200167,000 shares that were outstanding as of December 31, 2006, 20072008, 2009 and 2008,2010, respectively, but were not included in the computation of diluted earnings per share because the exercise price of the stock options was greater than the average share price of the common shares during the period and, therefore, the effect would have been anti-dilutive.
 
F-25F-29

 
COSTAR GROUP, INC.
NOTES TO CONSOLIDATED FINANCIAL STATEMENTS ¾ (CONTINUED)

15.14. EMPLOYEE BENEFIT PLANS

 Stock Incentive Plans

In June 1998, the Company’s Board of Directors adopted the 1998 Stock Incentive Plan (as amended, the “1998 Plan”) prior to consummation of the Company’s initial public offering.  In April 2007, the Company’s Board of Directors adopted the CoStar Group, Inc. 2007 Stock Incentive Plan (as amended, the “2007 Plan”), subject to stockholder approval, which was obtained on June 7, 2007.  All shares of common stock that were authorized for issuance under the 1998 Plan that, as of June 7, 2007, remained available for issuance under the 1998 Plan (excluding shares subject to outstanding awards) were rolled into the 2007 Plan and, as of that date, no shares of common stock were available under the 1998 Plan.  The 1998 Plan continues to govern unexercised and unexpired awardsawar ds issued under the 1998 Plan prior to June 7, 2007.  The 1998 Plan providesprovided for the grant of stock and stock options to officers, directors and employees of the Company and its subsidiaries. Stock options granted under the 1998 Plan mightcould be incentive or non-qualified. The exercise price for an incentive stock option may not be less than the fair market value of the Company’s common stock on the date of grant.  The vesting period of the options and restricted stock grants iswas determined by the Board of Directors and iswas generally three to four years. Upon the occurrence of a Change of Control, as defined in the 1998 Plan, all outstanding unexercisable options and restricted stock grants under the 1998 Plan immediately become exercisable.

The 2007 Plan provides for the grant of stock options, restricted stock, restricted stock units, and stock appreciation rights to officers, employees, directors and consultants of the Company and its subsidiaries. Stock options granted under the 2007 Plan may be non-qualified or may qualify as incentive stock options. Except in limited circumstances related to a merger or other acquisition, the exercise price for an option may not be less than the fair market value of the Company’s common stock on the date of grant.  The vesting period for each grant of options, restricted stock, restricted stock units and stock appreciation rights under the 2007 Plan is determined by the Board of Directors and is generally three to four years, subject to minimum vesting periods for restricted stock and restricted stock units of at leastlea st one year. The Company has reserved the following shares of common stock for issuance under the 2007 Plan:Plan (including an increase of 1,300,000 shares of common stock pursuant to an amendment to the 2007 Plan approved by the Stockholders on June 2, 2010): (a) 1,000,0002,300,000 shares of common stock, plus (b) 121,875 shares of common stock that were authorized for issuance under the 1998 Plan that, as of June 7, 2007, remained available for issuance under the 1998 Plan (not including any Shares that were subject as of such date to outstanding awards under the 1998 Plan), and (c) any shares of common stock subject to outstanding awards under the 1998 Plan as of June 7, 2007 that on or after such date cease for any reason to be subject to such awards (other than by reason of exercise or settlement of the awards to the extent they are exercised for or settled in vested and nonforfeitable shares). Unless terminated sooner, the 2007 Plan will terminate in April 2017, but will continue to govern unexercised and unexpired awards issued under the 2007 Plan prior to that date.  Approximately 1.1430,000 and 1.9 million and 880,000 shares were available for future grant under the 2007 Plan as of December 31, 20072009 and 2008,2010, respectively.
 
F-26F-30

 
COSTAR GROUP, INC.
NOTES TO CONSOLIDATED FINANCIAL STATEMENTS ¾ (CONTINUED)

15.14. EMPLOYEE BENEFIT PLANS ¾  (CONTINUED)

 Stock Incentive Plans ¾ (Continued)

Option activity was as follows:


Number of
Shares


Range of
Exercise Price


Weighted-
Average
Exercise
Price
  
Weighted-
Average
Remaining
Contract Life
(in years)
  
 
Aggregate
Intrinsic Value
(in thousands)
 
Outstanding at December 31, 2007  967,845  $16.20 - $54.12  $33.25       
Granted
  93,900  $43.99 - $55.07  $45.76       
Exercised
  (198,434) $17.77 - $45.18  $33.05       
Canceled or expired
  (47,725) $39.00 - $52.13  $46.36       
Outstanding at December 31, 2008  815,586  $16.20 - $55.07  $33.98       
Granted
  267,756  $25.00 - $40.13  $31.05       
Exercised
  (85,228) $17.35 - $36.38  $26.20       
Canceled or expired
  (44,818) $30.06 - $46.81  $39.40       
Outstanding at December 31, 2009  953,296  $16.20 - $55.07  $33.60       
Granted
  160,892  $40.06 - $54.51  $43.49       
Exercised
  (137,724) $16.20 - $45.18  $27.01       
Canceled or expired
  (30,768) $18.31 - $44.86  $37.83       
Outstanding at December 31, 2010  945,696  $17.34 - $55.07  $36.10   5.70  $20,293 
                     
Exercisable at December 31, 2008  701,975  $16.20 - $54.12  $31.84         
Exercisable at December 31, 2009  650,063  $16.20 - $55.07  $33.60         
Exercisable at December 31, 2010  609,274  $17.34 - $55.07  $35.21   4.05  $13,618 


Number of Shares
  
Range of Exercise Price
  
Weighted- Average
Exercise Price
  Weighted- Average Remaining Contract Life (in years)  
Aggregate Intrinsic Value
(in thousands)
 
 
Outstanding at December 31, 2005
  1,473,897  $9.00 - $52.13  $29.76       
Granted  96,900  $51.92  $51.92       
Exercised  (269,755) $9.00 - $45.18  $24.35       
Canceled or expired  (26,565) $18.28 - $45.18  $37.85       
 
Outstanding at December 31, 2006
  1,274,477  $9.00 - $52.13  $32.23       
Granted  7,000  $48.25 - $54.12  $50.77       
Exercised  (288,757) $9.00 - $45.18  $28.16       
Canceled or expired  (24,875) $21.28 - $51.92  $44.82       
 
Outstanding at December 31, 2007
  967,845  $16.20 - $54.12  $33.25       
Granted  93,900  $43.99 - $55.07  $45.76       
Exercised  (198,434) $17.77 - $45.18  $33.05       
Canceled or expired  (47,725) $39.00 - $52.13  $46.36       
 
Outstanding at December 31, 2008
  815,586  $16.20 - $55.07  $33.98   4.77  $3,692 
                     
 
Exercisable at December 31, 2006
  929,324  $
 
9.00 - $52.13
  $28.93         
 
Exercisable at December 31, 2007
  826,782  $16.20 - $52.13  $31.07         
 
Exercisable at December 31, 2008
  701,975  $16.20 - $54.12  $31.84   4.10  $3,692 

The aggregate intrinsic value is calculated as the difference between (i) the closing price of the common stock at December 31, 2006, 20072008, 2009 and 20082010 and (ii) the exercise prices of the underlying awards, multiplied by the shares underlying options as of December 31, 2006, 20072008, 2009 and 2008,2010, that had an exercise price less than the closing price on that date. Options to purchase 269,755, 288,757,198,434, 85,228, and 198,434137,724 shares were exercised for the years ended December 31, 2006, 2007,2008, 2009, and 2008,2010, respectively.  The aggregate intrinsic value of options exercised, determined as of the date of option exercise, was $7.4$3.4 million, $7.5$1.2 million and $3.4$2.5 million, respectively.

At December 31, 2008,2010, there was $10.5$9.9 million of unrecognized compensation cost related to stock-based payments, net of forfeitures, which is expected to be recognized over a weighted-average-period of 1.92.2 years.

The weighted-average grant date fair value of each option granted during the years ended December 2006, 20072008, 2009 and 20082010 was $33.45, $32.70$27.81, $12.72 and $27.81,$16.54, respectively.
 
F-27F-31

 
COSTAR GROUP, INC.
NOTES TO CONSOLIDATED FINANCIAL STATEMENTS ¾ (CONTINUED)

15.14. EMPLOYEE BENEFIT PLANS ¾ (CONTINUED)

 Stock Incentive Plans ¾ (Continued)

The Company estimated the fair value of each option granted on the date of grant using the Black-Scholes option-pricing model, using the assumptions noted in the following table:

 Year Ended December 31,  Year Ended December 31, 
 2006  2007  2008  2008  2009  2010 
                  
Dividend yield  0%  0%  0%  0%  0%  0%
Expected volatility  61%  61%  59%  59%  43%  40%
Risk-free interest rate  4.7%  4.7%  3.0%  3.0%  2.2%  2.2%
Expected life (in years)  5   5   5   5   5   5 

The assumptions above and the estimation of expected forfeitures are based on multiple facts, including historical employee behavior patterns of exercising options and post-employment termination behavior, expected future employee option exercise patterns, and the historical volatility of the Company’s stock price.
 
The following table summarizes information regarding options outstanding at December 31, 2008:2010:

   Options Outstanding  Options Exercisable 
Range of
Exercise Price
  Number of Shares  Weighted-Average Remaining Contractual Life (in years)  Weighted-Average Exercise Price  Number of Shares  Weighted-Average Exercise Price 
$16.20 - $18.06   99,617   2.76  $17.94   99,617  $17.94 
$18.12 - $22.87   102,828   3.44  $20.78   102,828  $20.78 
$23.06 - $28.15   118,171   3.45  $27.04   118,171  $27.04 
$29.00 - $30.75   95,275   3.19  $30.33   95,275  $30.33 
$32.00 - $39.00   89,932   4.59  $38.75   89,932  $38.75 
$39.53 - $43.99   135,938   6.91  $42.49   63,063  $40.79 
$44.06 - $45.18   85,625   5.76  $44.83   85,625  $44.83 
$46.81 - $51.92   70,200   7.64  $51.49   46,464  $51.48 
$54.12 - $54.12   3,000   8.42  $54.12   1,000  $54.12 
$55.07 - $55.07   15,000   9.67  $55.07   0  $0.00 
$16.20 - $55.07   815,586   4.77  $33.98   701,975  $31.84 
  Options Outstanding  Options Exercisable 
Range of
Exercise Price
 Number of Shares  Weighted-Average Remaining Contractual Life (in years)  
Weighted-
Average
Exercise Price
  
Number of
Shares
  
Weighted-
Average
Exercise Price
 
$17.34 - $22.87  122,167   1.50  $20.19   122,167  $20.19 
$23.08 - $24.01  1,625   1.06  $23.80   1,625  $23.80 
$25.00 - $25.00  124,357   8.16  $25.00   39,222  $25.00 
$25.01 - $30.06  110,290   2.63  $28.77   110,290  $28.77 
$36.48 - $39.00  168,564   6.07  $37.92   100,551  $38.54 
$39.53 - $42.10  52,978   5.01  $40.04   38,762  $40.02 
$42.29 - $42.29  106,600   9.19  $42.29   ¾  $0.00 
$42.71 - $44.86  146,886   6.04  $44.18   106,457  $44.40 
$45.18 - $54.51  97,229   6.46  $51.60   80,200  $50.98 
$55.07 - $55.07  15,000   7.67  $55.07   10,000  $55.07 
$17.34 - $55.07  945,696   5.70  $36.10   609,274  $35.21 

The following table presents unvested restricted stock awards activity for the year ended December 31, 2008:2010:

 
Number of Shares
  
Weighted-Average Grant Date
Fair Value per Share
  Number of Shares  
Weighted-Average Grant Date
Fair Value per Share
 
Unvested restricted stock at December 31, 2007   258,588  $48.55 
Unvested restricted stock at December 31, 2009   419,347  $39.40 
Granted   102,177  $48.76   106,931  $43.01 
Vested   (54,009) $46.49   (169,363) $47.54 
Canceled   (33,403) $47.86   (42,541) $38.63 
Unvested restricted stock at December 31, 2008   273,353  $49.12 
Unvested restricted stock at December 31, 2010   314,374  $39.09 
 
F-28F-32

 
COSTAR GROUP, INC.
NOTES TO CONSOLIDATED FINANCIAL STATEMENTS ¾ (CONTINUED)

15.14. EMPLOYEE BENEFIT PLANS ¾ (CONTINUED)

Employee 401(k) Plan

The Company maintains a 401(k) Plan (the “401(k)”) as a defined contribution retirement plan for all eligible employees.  The 401(k) provides for tax-deferred contributions of employees’ salaries, limited to a maximum annual amount as established by the Internal Revenue Service. In 2006, 2007 and 2008, the Company matched 100% of employee contributions up to a maximum of 6% of total compensation. In 2009 and 2010, the Company matched 50% of employee contributions up to a maximum of 6% of total compensation.  Amounts contributed to the 401(k) by the Company to match employee contributions for the years ended December 31, 2006, 20072008, 2009 and 20082010 were approximately $2.0$2.6 million, $2.3$1.4 million and $2.6$1.5 million, respectively. The Company paid administrative expenses in connection with the 401(k) plan of approximately $25,000, $22,000$28, 000 for the year ended December 31, 2008 and $28,000$0 for the years ended December 31, 2006, 20072009 and 2008,2010, respectively.

Employee Pension Plan

The Company maintains a company personal pension plan for all eligible employees in the Company’s London, England office. The plan is a defined contribution plan. Employees are eligible to contribute a portion of their salaries, subject to a maximum annual amount as established by the Inland Revenue. The Company contributes a match subject to the percentage of the employees’ contribution. Amounts contributed to the plan by the Company to match employee contributions for the years ended December 31, 2006, 20072008, 2009 and 20082010 were approximately $193,000, $281,000$265,000, $130,000 and $265,000,$160,000, respectively.

Employee Stock Purchase Plan

As of August 1, 2006, the Company introduced an Employee Stock Purchase Plan (“ESPP”), pursuant to which eligible employees participating in the plan authorize the Company to withhold from the employees’ compensation and use the withheld amounts to purchase shares of the Company's common stock at 90% of the market price. Participating employees are able to purchase common stock under this plan during the offering period. The offering period begins the second Saturday before each of the Company’s regular pay dates and ends on each of the Company’s regular pay dates.  There were 86,30872,237 and 78,84064,106 shares available for purchase under the plan as of December 31, 20072009 and 2008,2010, respectively and approximately 9,0006,600 and 7,4008,100 shares of the Company’s common stock were purchased during 20072009 and 2008,2010 , respectively.

15. LEASE RESTRUCTURING CHARGES

Effective September 24, 2010, the Company consolidated its three facilities located in the Boston, Massachusetts area, including the facilities used by CoStar, PPR, and Resolve Technology, into one facility.  The consolidation of the facilities resulted in a lease restructuring charge of approximately $1.3 million recorded in general and administrative expense in the third quarter of 2010. The third quarter lease restructuring charge included amounts for the abandonment of certain lease space and the impairment of leasehold improvements.  The amount of the lease restructuring charge was based upon management’s best estimate of amounts and timing of certain events that will occur in the future. It is possible that the actual outcome of these events may differ from estimates. Changes will be made to the re structuring accrual when any such differences become determinable.
 
F-29F-33

COSTAR GROUP, INC.
NOTES TO CONSOLIDATED FINANCIAL STATEMENTS ¾ (CONTINUED)

15. LEASE RESTRUCTURING CHARGES ¾ (CONTINUED)


The following table summarizes the amount included in accrued expenses related to these restructuring charges at December 31, 2010 (in thousands):
 
Lease
Restructuring
Accrual
Accrual balance at December 31, 2009
$¾
Original charge
 1,160
Rent payments made in 2010
 (229)
Accrual balance at December 31, 2010
$931
16. PURCHASE OF BUILDING

In February 2010, the Company purchased a 169,429 square-foot office building located at 1331 L Street, NW in downtown Washington, DC together with the tenancy in the underlying ground lease for the property for a purchase price of $41.25 million in cash. This facility is being used primarily by the Company’s U.S. segment. The Company began relocating its Bethesda-based employees and infrastructure to the new building starting in July 2010 and completed its relocation by October 15, 2010, the expiration date of the lease of its Bethesda property.

In connection with the purchase of the building, the Company assumed the ground lease for the parcel of land under the building. The lease, which expires February 29, 2088, requires the payment of minimum annual rent of $778,000 through February 29, 2012, then approximately $918,000 annually through February 29, 2024. Thereafter, the minimum rate is adjusted to fair market value, as defined in the lease, once every 7 years.

The purchase of the building was accounted for as an asset acquisition.  The total purchase price of $41.25 million, plus $1.7 million of direct transaction costs was allocated to the building.  No other significant assets or liabilities were acquired in this transaction.

17. SUBSEQUENT EVENTS

On February 2, 2011, 1331 L Street Holdings, LLC (“Holdings”), a wholly owned subsidiary of the Company, and GLL L-Street 1331, LLC (“GLL”), an affiliate of Munich-based GLL Real Estate Partners GmbH, entered into a purchase and sale agreement pursuant to which (i) Holdings agreed to sell to GLL its interest in the 169,429 square-foot office building located at 1331 L Street, NW, in downtown Washington, DC, and (ii) CoStar Realty Information, Inc. (“CoStar Realty”), a wholly owned subsidiary of the Company, agreed to enter into a lease expiring May 31, 2025 (with two 5-year renewal options) with GLL to lease back 149,514 square feet of the office space located in this building, which the Company will continue to use as its corporate headquarters.   The closing of the sale took place o n February 18, 2011. The aggregate consideration paid by GLL to Holdings pursuant to the purchase and sale agreement was $101.0 million in cash, $15.0 million of which is being held in escrow to fund additional build-out and planned improvements at the building.

The lease is effective as of June 1, 2010 and will expire May 31, 2025. The initial base rent is $38.50 per square foot of occupied space, escalating 2.5% per year commencing June 1, 2011. The Company’s obligation to pay rent increases proportionately over the course of the first year of the lease as certain scheduled completion dates for the Company’s build out, on a floor-by-floor basis, are reached.  The Company’s occupied space under the lease will consist of the entire rented premises as of June 1, 2011, from and after which the Company will owe rent on the entire leased premises.  Annual lease payments for 2011 will be approximately $5.0 million.


F-34