PART I
Item 1. Business | |
Overview
Cognizant is one of information technology (IT), consulting and business process services, dedicated to helping the world’s leading professional services companies, transforming clients’ business, operating and technology models for the digital era. Our industry-based, consultative approach helps customers envision, build strongerand run more innovative and efficient businesses. Our clients engage us to help them operate more efficiently, provideservices include digital services and solutions, for critical business and technology problems, and to help them drive technology-based innovation and growth. Our core competencies include: business, process, operations and IT consulting, application development, and systems integration, enterprise information management, application testing, application maintenance, IT infrastructure services and business process services. Digital services are becoming an increasingly important part of our portfolio of services and solutions and are often integrated or delivered along with our other services. We tailor our services and solutions to specific industries and utilizeuse an integrated global delivery model. This seamless global sourcing model combines industry-specific expertise, clientthat employs customer service teams based on-site at the clientcustomer locations and delivery teams located at customer locations and dedicated near-shoreglobal and offshore globalregional delivery centers.
We go to market across our four industry-based business environment, many companies face intense competitive pressure and rapidly changing market dynamics, driven by such factors as changes in the economy, government regulations, globalization, virtualization and other technological innovations. Companies must also evaluate the effect of emerging digital technologies, including social networks, mobile devices, advanced analytics and cloud computing, on their business operations. These technologies represent a new IT infrastructure that continues to transform the way companies relate to theirsegments. Our customers engage with employees, and bring innovative products and services to market. In response to these challenges, many companies are focused on improving efficiencies and enhancing effectiveness while also driving innovation through technology to favorably impact both the bottom-line and the top-line. Companies increasingly view a global sourcing model as a key to their efforts to operate more cost-effectively and productively. At the same time, companies are confronting secular industry shifts, changing customer requirements and new technologies that require them to innovate by building new and different capabilities with emerging technologies to ensure their businesses stay competitive.
| Financial Services | Healthcare | |||||
• Manufacturing and Logistics | ||||||
Our Financial Services segment includes banking, capital markets and insurance companies. Demand in this segment is driven by our customers’ focus on cost optimization in the face of profitability pressures, the need to be compliant with significant regulatory requirements and adaptable to regulatory change, and their adoption and integration of digital technologies, including customer experience enhancement, robotic process automation, analytics and artificial intelligence in areas such as digital lending and next generation payments.
Our Healthcare segment consists of healthcare providers and payers as well as life sciences companies, including pharmaceutical, biotech and medical device companies. Demand in this segment is driven by emerging industry trends, including enhanced compliance, integrated health management, claims investigative services, as well as services that drive operational improvements in areas such as claims processing, enrollment, membership and billing, in addition to the adoption and integration of digital technologies, such as artificial intelligence, personalized care plans and predictive data analytics to improve patient outcomes.
Our Products and Resources segment includes manufacturers, retailers, travel and hospitality companies, as well as companies providing logistics, energy and utility services. Demand in this segment is driven by our customers’ focus on improving the efficiency of their operations, the enablement and integration of mobile platforms to support sales and other omni channel commerce initiatives, and their adoption and integration of digital technologies, such as the application of intelligent systems to manage supply chain and enhance overall customer experiences.
Our Communications, Media and Technology segment includes information, media and entertainment, communications and technology companies. Demand in this segment is driven by our customers’ need to manage their digital content, create differentiated user experiences, transition to agile development methodologies, enhance their networks and adopt and integrate digital technologies, such as cloud enablement and interactive and connected products.
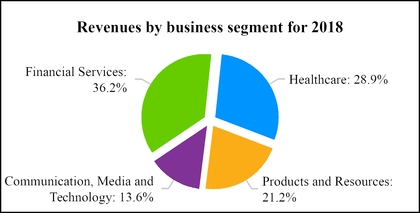
For the year ended December 31, 2015,2018, the distribution of our revenues across our four industry-based business segments was as follows: 40.3% from Financial Services, 29.5% from Healthcare, 18.9% from Manufacturing/Retail/Logistics and 11.3% from Other.
See Note 153 to our consolidated financial statements for additional information related to disaggregation of revenues by customer location, service line and contract-type for each of our business segments, including the disclosure of segment operating profitsegments.
Services and financial information by geographic area.
Our Financial Services business segment serves leading financial institutions throughout the world. Our clientsservices include banks, investment firms and insurance companies. This business segment provides services to our customers operating in the following industries:
We seek to drive organic growth through investments in our digital capabilities, including the extensive training and competition from generics, the drive to expand into new geographic markets, the need for more targeted or personalized therapies leading to research and development innovation, continued diversificationre-skilling of product portfoliosour technical teams and the related high costexpansion of product development, and a dynamic regulatory environment with greater emphasis on product safety, ethics and compliance, transparency of pricing and promotional activity. Our life sciences solutions help transform many of the business processesour local workforces in the life sciences value chain (research, clinical development, manufacturingUnited States and supply chain, sales and marketing) as well as regulatory and administrative functions and general IT. Life sciences companiesother markets around the world where we operate. Additionally, we pursue select strategic acquisitions, joint ventures, investments and alliances that can expand our digital capabilities or the geographic or industry coverage of our business. In 2018, we completed five such acquisitions: Bolder Healthcare Solutions, a provider of revenue cycle management solutions to the healthcare industry in the United States; Hedera Consulting, a business advisory and data analytics service provider in Belgium and the Netherlands; Softvision, a digital engineering and consulting company with significant operations in Romania and India that focuses on agile development of custom cloud-based software and platforms for customers primarily in the United States; ATG, a United States based consulting company that helps companies plan, implement, and optimize automated cloud-based quote-to-cash business processes and technologies; and SaaSfocus, a Salesforce services provider in Australia.
We have significantly increased their emphasis on digital engagement with all of their stakeholders while increasingly leveraging enterprise-level analytics to drive a customer-centric approach to marketingorganized our services and sales.
solutions into three practice areas: Digital Business, Digital Operations, and Digital Systems and Technology. These practice areas are supported by Cognizant Consulting, our Global Technology Office and Cognizant Accelerator.
Cognizant Digital Business
Our Manufacturing, Retail and Logisticsdigital business segment provides services for global leaders in a range of sub-sectors, including industrial, automotive, process logistics, energy and utilities, and retail. Thispractice helps customers rethink their business segment services customers in the following industry groups:
Cognizant Digital Operations
Our digital operations practice helps customers rethink their businesses.
Cognizant Digital Systems & Technology
Our digital systems and technology practice helps customers reshape their technology models to simplify, modernize and secure the enabling systems that form the backbone of their business. Areas of focus within this practice area include system integration services, infrastructure services (including cloud), quality engineering and assurance, and security and application services. Our application services include traditional development, testing and maintenance and agile development ofnew software and applications that transform existing businesses at speed and scale.
Cognizant Consulting, Global Technology Office, and Cognizant Accelerator
Supporting our three practice areas, the Cognizant Consulting team provides global business, process, operations and technology consulting services related services includeto our customers. Our consulting professionals and domain experts from our industry-focused business segments work closely with our practice areas to ensure process excellencecreate frameworks, platforms and solutions that customers find valuable as they pursue new efficiencies and look to leverage digital technologies across their operations. Our Global Technology Office and Cognizant Accelerator focus on utilizing new technologies to develop innovative and practical offerings for customers' emerging needs and support our business segments and practice areas.
Global Delivery Model
We utilize a global delivery model, with delivery centers worldwide, to provide the full range of platform-based services.services we offer to our customers. Our goals for our client relationships areglobal delivery model includes four distinct delivery methods, with most customer satisfaction, operational productivity, strategic value and business transformation. Among the factors driving growthengagements utilizing several or all of these delivery methods. Our global delivery model includes employees located in our services are the desire to improve cost-effectiveness, the emergence of digital technologies, and the need for clients to access capabilities beyond their organizations to adapt to rapid changes in technologies, markets and customer demands.
Sales and Marketing
We market and sell our services directly through our professional staff, senior management and direct sales personnel operating out of our global headquarters and business development offices, which are strategically located in various metropolitan areas around the world. The sales and marketing group works with our clientcustomer delivery team as the sales process moves closer to thea customer’s selection of a services provider. The duration of the sales process may vary widely depending on the type and complexity of services.
Customers
The services we provide are distributed among a number of customers served by us has increased significantly in recent years. As of December 31, 2015, we increased the number of strategic clients to 300. We define a strategic client as one offering the potential to generate at least $5 million to $50 million or more in annual revenues at maturity. Accordingly, we provide a significant volume of services to many customers in each of our business segments. Therefore, aA loss of a significant customer or a few significant customers in a particular segment could materially reduce revenues for suchthat segment. However, no individual customer exceeded 10.0% of our consolidated revenues for the years ended December 31, 2015, 2014 and 2013. In addition, the services we provide to our larger customers are often critical to thetheir operations of such customers and a termination of our services generally would typically require an extended transition period with gradually declining revenues. For the years ended December 31, 2015, 2014 and 2013, 78.6%, 76.8% and 77.6% of our revenue, respectively, was from North American customers. The volume of work performed for specific customers is likely to vary from year to year, and a significant customer in one year may not use our services in a subsequent year. Presented in the table below is additional information aboutRevenues from our customers.top customers as a percentage of total revenues were as follows:
| Year Ended December 31, | |||||||||
| 2015 | 2014 | 2013 | |||||||
| Revenues from top five customers as a percentage of total revenues | 11.0 | % | 12.2 | % | 13.2 | % | |||
| Revenues from top ten customers as a percentage of total revenues | 18.6 | % | 21.3 | % | 22.6 | % | |||
| Revenues under fixed-bid contracts as a percentage of total revenues | 36.5 | % | 35.5 | % | 34.0 | % | |||
| For the years ended December 31, | |||||||||
| 2018 | 2017 | 2016 | |||||||
| Top five customers | 8.6 | % | 8.9 | % | 10.0 | % | |||
| Top ten customers | 15.4 | % | 14.9 | % | 16.7 | % | |||
Competition
The intenselymarkets for our services are highly competitive, IT services and outsourcing market includescharacterized by a large number of participants and is subject to rapid change. This market includes participants from a variety of market segments, including:
Our direct competitors include, among others, Accenture, Atos, Capgemini, Computer Sciences Corporation,Deloitte Digital, DXC Technology, EPAM Systems, Genpact, HCL Technologies, HP Enterprise, IBM Global Services, Infosys Technologies, Tata Consultancy Services and Wipro. In addition, we compete with numerous smaller local companies in the various geographic markets in which we operate.
our recruiting, training and retention model;
a broad customer referral base;
Intellectual Property
We provide value to our clientscustomers based, in part, on our proprietary innovations, methodologies, reusable knowledge capital and other intellectual property ("IP") assets. We recognize the importance of intellectual propertyIP and its ability to differentiate us from our competitors. We seek IP protection for some of our innovations and rely on a combination of intellectual propertyIP laws, as well as confidentiality procedures and contractual provisions, to protect our intellectual propertyIP and our brand. We have registered, and applied for the registration of, U.S. and international trademarks, service marks, domain names and copyrights. AsWe own or are licensed under a number of December 31, 2015, we have also applied for or obtained a total of 596 trademark registrationspatents, trademarks, copyrights, and licenses, which vary in 63 countries. In addition, we have applied for or obtained 115 U.S.duration, relating to our products and international patents and patent applications and 156 U.S. and international copyright registrations covering certain ofservices. While our proprietary technology assets. AlthoughIP rights are important to our success, we believe the ownership of such patents, copyrights, trademarks and service marks is an important factor in our business and that our success does depend in partas a whole is not materially dependent on the ownership thereof, we rely primarily on the innovative skills, technical competence and marketing abilitiesany particular IP right, or any particular group of our personnel.patents, trademarks, copyrights or licenses.
Employees
We had approximately 221,700281,600 employees at the end of 2015,2018, with approximately 40,800 persons50,000 in the North American region,America, approximately 8,600 persons18,300 in the European regionEurope and approximately 172,300 persons213,300 in various other locations throughout the rest of the world, including 162,500 personsapproximately 194,700 in India. We are not party to any significant collective bargaining agreements. We consider our relations with our employees to be good.
Our Executive Officers
On February 6, 2019, we announced that the Board of Directors has appointed Brian Humphries as our Chief Executive Officer and as a member of the Board, in each case effective April 1, 2019. Francisco D’Souza will step down as the Company’s Chief Executive Officer, effective April 1, 2019, and has agreed to serve as an advisor to the new Chief Executive Officer with the title of “Executive Vice Chairman” from April 1, 2019 through June 30, 2019. Thereafter, he will continue to serve as Vice Chairman of the Board of Directors. Rajeev Mehta will step down as our President, effective on April 1, 2019, and will thereafter serve as an advisor to the new Chief Executive Officer from April 1, 2019 through May 1, 2019, at which point Mr. Mehta’s employment with us will terminate.
The following table identifies our current executive officers:
| Name | Age | Capacities in Which Served | In Current Position Since | ||||
Francisco D’Souza(1) | 47 | Chief Executive Officer | 2007 | ||||
Gordon Coburn(2) | 52 | President | 2012 | ||||
Karen McLoughlin(3) | 51 | Chief Financial Officer | 2012 | ||||
Ramakrishnan Chandrasekaran(4) | 58 | Executive Vice Chairman, Cognizant India | 2013 | ||||
Rajeev Mehta(5) | 49 | Chief Executive Officer, IT Services | 2013 | ||||
Malcolm Frank(6) | 49 | Executive Vice President, Strategy and Marketing | 2012 | ||||
Steven Schwartz(7) | 48 | Executive Vice President, Chief Legal and Corporate Affairs Officer | 2013 | ||||
Sridhar Thiruvengadam(8) | 52 | Chief Operating Officer | 2013 | ||||
Ramakrishna Prasad Chintamaneni(9) | 46 | Executive Vice President and President, Banking and Financial Services | 2013 | ||||
Venkat Krishnaswamy(10) | 62 | Executive Vice President and President, Healthcare & Life Sciences | 2013 | ||||
Debashis Chatterjee(11) | 50 | Executive Vice President and President, Technology Solutions | 2013 | ||||
Dharmendra Kumar Sinha(12) | 53 | Executive Vice President and President, Client Services | 2013 | ||||
Sumithra Gomatam(13) | 48 | Executive Vice President and President, Industry Solutions | 2013 | ||||
| Name | Age | Capacities in Which Served | In Current Position Since | ||||
Francisco D’Souza(1) | 50 | Chief Executive Officer | 2007 | ||||
Rajeev Mehta(2) | 52 | President | 2016 | ||||
Karen McLoughlin(3) | 54 | Chief Financial Officer | 2012 | ||||
Ramakrishnan Chandrasekaran(4) | 61 | Executive Vice Chairman, Cognizant India | 2013 | ||||
Debashis Chatterjee(5) | 53 | Executive Vice President and President, Global Delivery | 2016 | ||||
Ramakrishna Prasad Chintamaneni(6) | 49 | Executive Vice President and President, Global Industries and Consulting | 2016 | ||||
Malcolm Frank(7) | 52 | Executive Vice President, Strategy and Marketing | 2012 | ||||
Matthew Friedrich (8) | 52 | Executive Vice President, General Counsel, Chief Corporate Affairs Officer and Secretary | 2017 | ||||
Sumithra Gomatam(9) | 51 | Executive Vice President and President, Digital Operations | 2016 | ||||
Gajakarnan Vibushanan Kandiah(10) | 51 | Executive Vice President and President, Digital Business | 2016 | ||||
Venkat Krishnaswamy(11) | 65 | Vice Chairman, Healthcare and Life Sciences | 2013 | ||||
James Lennox(12) | 54 | Executive Vice President, Chief People Officer | 2016 | ||||
Sean Middleton(13) | 37 | Senior Vice President and President, Cognizant Accelerator | 2017 | ||||
Allen Shaheen(14) | 56 | Executive Vice President, North American Digital Hubs | 2018 | ||||
Dharmendra Kumar Sinha(15) | 56 | Executive Vice President and President, Global Client Services | 2013 | ||||
Robert Telesmanic(16) | 52 | Senior Vice President, Controller and Chief Accounting Officer | 2017 | ||||
Santosh Thomas(17) | 50 | Executive Vice President and President, Global Growth Markets | 2016 | ||||
Srinivasan Veeraraghavachary(18) | 59 | Chief Operating Officer | 2016 | ||||
| (1) | Francisco D’Souza |
| (2) | Rajeev Mehta has been our President since September 2016. From December 2013 to September 2016, Mr. Mehta served as our Chief Executive Officer, IT Services. From February 2012 to December 2013, Mr. Mehta served as our Group Chief Executive - Industries and Markets. Mr. Mehta held other senior management positions in client services and our financial services business segment from 2001 to 2012. Prior to joining Cognizant in 1997, Mr. Mehta was involved in implementing GE Information Services' offshore outsourcing program and also held consulting positions at Deloitte & Touche LLP and |
Andersen Consulting. Mr. Mehta has a Bachelor of Science degree from the University of Macau (formerly known as the University of East Asia)Maryland and a Master of Business Administrationan MBA degree from Carnegie Mellon University.
| (3) | Karen McLoughlin |
| (4) | Ramakrishnan Chandrasekaran |
| (5) |
| (6) |
Ramakrishna Prasad Chintamaneni |
| (7) | Malcolm Frank has been our Executive Vice President, Strategy and Marketing since February 2012. Mr. Frank served as our Senior Vice President of Strategy and Marketing from 2005 to 2012. Prior to joining Cognizant in 2005, Mr. Frank was a founder and the President and Chief Executive Officer of CXO Systems, Inc., an independent software vendor providing dashboard solutions for senior managers, a founder and the President, Chief Executive Officer and Chairman of NerveWire Inc., a management consulting and systems integration firm, and a founder and executive officer at Cambridge Technology Partners, an information technology professional services firm. Mr. Frank has served on the Board of Directors of Factset Research Systems Inc. since June 2016, where he is a member of the Compensation Committee. Mr. Frank has a Bachelor degree in Economics from Yale University. |
| (8) | Matthew Friedrich has been our Executive Vice President, General Counsel, Chief Corporate Affairs Officer and Secretary since May 2017. Prior to joining Cognizant, Mr. Friedrich was Chief Corporate Counsel for Chevron Corporation, a multinational energy company, from August 2014 to May 2017, a partner with the law firm of Freshfields Bruckhaus Deringer LLP from April 2013 to August 2014 and a partner with the law firm of Boies Schiller & Flexner LLP from June 2009 to April 2013. Mr. Friedrich began his legal career in 1995 as a federal prosecutor with the United States Department of Justice, where he remained for nearly 14 years, culminating with his designation as the acting assistant Attorney General of the Criminal Division in 2008. Mr. Friedrich is a life member of the Council on Foreign Relations and serves on the Board of Directors of the U.S.-India Business Council. Mr. Friedrich has a Bachelor of Arts degree in Foreign Affairs from the University of Virginia and a Juris Doctor degree from the University of Texas School of Law. |
| (9) | Sumithra Gomatam has been our Executive Vice President and President, Digital Operations since August 2016. From December 2013 to August 2016, Ms. Gomatam served as our Executive Vice President and President, Industry Solutions. From 2008 to December 2013, Ms. Gomatam served as Senior Vice President, and global leader for our Testing practice. Ms. Gomatam held other management positions in our global delivery and BFS practices from 1995 to 2008. Ms. Gomatam has a Bachelor of Engineering degree in Electronics and Communication from Anna University. |
| (10) | Gajakarnan Vibushanan Kandiah has been our Executive Vice President and President, Digital Business since August 2016. Mr. Kandiah previously served as Executive Vice President of Business Process Services ("BPS") and Digital Works from January 2014 to August 2016, and as Senior Vice President of BPS from 2011 to December 2013. Previous roles he held at |
Cognizant included roles in System Integration, Testing, BPS, Information, Media and Entertainment, and Communications practices. Before joining Cognizant in 2003, Mr. Kandiah was a founder and the Chief Operating Officer of NerveWire, Inc. and the Global Vice President of the Interactive Solutions business of Cambridge Technology Partners. Mr. Kandiah completed his advanced level education at the Royal College in Sri Lanka.
| (11) | Venkat Krishnaswamy |
| (13) | Sean Middleton has been our Senior Vice President and President, Cognizant Accelerator since January 2017. He was |
| (14) | Allen Shaheen has been our Executive Vice President, North American Digital Hubs since January 2018. He has also served as a director of the Cognizant U.S. Foundation, a non-profit organization, since April 2018. From August 2015 to December 2017, Mr. Shaheen was Executive Vice President, Corporate Development. From December 2013 to August 2016, Mr. Shaheen was also responsible for various Cognizant practices, including our Enterprise Application Services Practice. Mr. Shaheen was the General Manager for our German business unit from February 2013 to December 2014 and our Markets Delivery Leader for Europe from May 2012 to December 2014. Mr. Shaheen's prior roles included being responsible for our IT Infrastructure Services, head of our Global Technology Office and head of our Systems Integration and Testing practices. Prior to joining Cognizant in 2006, Mr. Shaheen was a consultant for Cognizant from 2004 to 2006, a founder and Executive Vice President of International Operations of Cambridge Technology Partners and the Chief Executive Officer of ArsDigita Corporation. Mr. Shaheen has a Bachelor of Arts degree in Engineering and Applied Sciences from Harvard College. |
| (15) | Dharmendra Kumar Sinha has been our Executive Vice President and President, |
| (17) | Santosh Thomas has been our Executive Vice President and President, |
| (18) | Srinivasan Veeraraghavachary has been our |
in 1998. Mr. Veeraraghavachary has a Bachelor degree in Mechanical Engineering from the National Institute of Technology (formerly the Regional Engineering College) in Trichy, India and an MBA degree from the Indian Institute of Management in Calcutta, India.
None of our executive officers is related to any other executive officer or to any of our Directors. Our executive officers are electedappointed annually by the Board of Directors and generally serve until their successors are duly electedappointed and qualified.
Corporate History
We began our IT development and maintenance services business in early 1994 as an in-house technology development center for The Dun & Bradstreet Corporation and its operating units. In 1996, we along with certain other entities, were spun-off from The Dun & Bradstreet Corporation to form a new company, Cognizant Corporation. On June 24,and, in 1998, we completed an initial public offering of our Class A common stock. On June 30, 1998,to become a majority interest in us, and certain other entities were spun-off from Cognizant Corporation to form IMS Health. Subsequently, Cognizant Corporation was renamed Nielsen Media Research, Incorporated.
Available Information
We make available the following public filings with the Securities and Exchange Commission or the SEC,("SEC") free of charge through our website at www.cognizant.com as soon as reasonably practicable after we electronically file such material with, or furnish such material to, the SEC:
our Annual Reports on Form 10-K and any amendments thereto;
our Quarterly Reports on Form 10-Q and any amendments thereto; and
our Current Reports on Form 8-K and any amendments thereto.
In addition, we make available our code of business conduct and ethics entitled “Cognizant’s Core“Core Values and StandardsCode of Business Conduct”Ethics” free of charge through our website. We intend to disclosepost on our website all disclosures that are required by law or Nasdaq Stock Market listing standards concerning any amendments to, or waivers from, any provision of our code of business conduct and ethics that are required to be publicly disclosed pursuant to rules of the SEC and the NASDAQ Global Select Market by posting it on our website.ethics.
No information on our website is incorporated by reference into this Form 10-K or any other public filing made by us with the SEC.
Item 1A. Risk Factors
Factors That May Affect Future Results
We face various important risks and uncertainties, including those described below, that could adversely affect our business, results of operations and financial condition and, as a result, cause a decline in the trading price of our common stock.
Global macroeconomic conditions have a material adverse effect on our ability to retain and attract clients and our competitive position, which could in turn have a material adversesignificant effect on our business resultsas well as the businesses of operationsour customers. Volatile, negative or uncertain economic conditions could cause our customers to reduce, postpone or cancel spending on projects with us and financial condition.could make it more difficult for us to accurately forecast customer demand and have available the right resources to profitably address such customer demand. The short-term nature of contracts in our industry means that actions by customers may occur quickly and with little warning, which may cause us to incur extra costs where we have employed more professionals than customer demand supports.
Our business results of operationsis particularly susceptible to economic and financial condition may be affected by the rate of growthpolitical conditions in the use of technology in business and the type and level of technology spending by our clients.
concentrated. Our revenues are highly dependent on clients concentrated in certain industries, including the financial services and healthcare industries. Consolidation and factors that negatively affect these industries may adversely affect our business, results of operations and financial condition.
of operations. As a developing country, India has also recently experienced civil unrest and terrorism and has been involved in conflicts with neighboring countries. In recent years, there have been military confrontations between India and Pakistan that have occurred in the region of Kashmir and along the India-Pakistan border. The potential for hostilities between the two countries has been high in light of tensions relatedmay continue to recent terrorist incidents in India and the unsettled nature of the regional geopolitical environment, including events in and related to Afghanistan, Iraq and Syria. If India becomes engaged in armed hostilities, particularly if these hostilities are protracted or involve the threat of or use of weapons of mass destruction, it is likely that our business, results of operations and financial condition would be materially adversely affected.
Our success is dependent, in large part, on our ability to keep our supply of skilled professionals, including project managers, IT engineers and senior technical personnel, in balance with customer demand around the Indian rupeeworld and on our ability to attract and retain senior management with the knowledge and skills to lead our business globally. Each year, we must hire tens of thousands of new professionals and retrain, retain, and motivate our workforce of hundreds of thousands of professionals with diverse skills and expertise in order to serve customer demands across the globe, respond quickly to rapid and ongoing technological, industry and macroeconomic developments and grow and manage our business. We also must continue to maintain an effective senior leadership team. The loss of senior executives, or the failure to attract, integrate and retain new senior executives as the needs of our business require, could have a material adverse effect on our business and results of operations.
Competition for skilled labor is intense and, in some jurisdictions in which we operate, there are more jobs for IT professionals than qualified persons to fill these jobs. Our business has experienced significant employee attrition, which may cause us to incur increased costs to hire new professionals with the desired skills. Costs associated with recruiting and training professionals are significant. If we are unable to hire or deploy professionals with the needed skillsets or if we are unable to adequately equip our professionals with the skills needed, this could materially adversely affect our business. Additionally, if we are unable to maintain an employee environment that is competitive and contemporary, it could have an adverse effect on engagement and retention, which may materially adversely affect our business.
We face challenges related to growing our business organically as well as inorganically through acquisitions, and we may not be able to achieve our targeted growth rates.
Achievement of our targeted growth rates requires continued significant organic growth of our business as well as inorganic growth through acquisitions. To achieve such growth, we must, among other foreign currency exchange rates, restrictions on the deployment of cash acrossthings, continue to significantly expand our global operations, increase our product and service offerings and scale our use of derivative financial instruments.
We may not be able to achieve our profitability and capital return goals.
Our goals for profitability and capital return rely upon a number of assumptions, including our ability to improve the efficiency of our operations and make successful investments to grow and further develop our business. Our profitability depends on the efficiency with which we run our operations and the cost of our operations, especially the compensation and benefits costs of the professionals we employ. We may not be able to efficiently utilize our professionals if increased regulation, policy changes or administrative burdens of immigration, work visas or outsourcing prevents us from deploying our professionals globally on a timely basis, or at all, to fulfill the needs of our customers. Wage and other than the U.S. dollar.cost pressures may put pressure on our profitability. Fluctuations in foreign currency exchange rates can also have a number of adverse effects on us. Because our consolidated financial statements are presented in U.S. dollars, we must translate revenues, expenses and income, as well as assets and liabilities, into U.S. dollars at exchange rates in effect during or at the end of each reporting period. Therefore, changes in the value of the U.S. dollar against other currencies will affect our revenues, income from operations and net income and the value of balance sheetwhen items originally denominated in other currencies. There is no guarantee that our financial results will not be adversely affected by currency exchange rate fluctuations. In addition, in some countries we could be subject to strict restrictions on the movement of cash and the exchange of foreign currencies which could limit our ability to use these funds across our global operations. Further, as we continue to leverage our global delivery model, moreare translated or remeasured into U.S. dollars for presentation of our expenses are incurred in currencies other than those in which we bill for the related services. An increase in the value of certain currencies, such as the Indian rupee, against the U.S. dollar could increase costs for delivery of services at offshore sites by increasing labor and other costs that are denominated in local currency.
consolidated financial statements. We have entered into a series of foreign exchange forward contracts that are designated as cash flow hedges of certain rupee denominated payments in India. These contracts are intended to partially offset the impact of the movement of the exchange rates on future operating costs. In addition, we have also entered into foreign exchange forward contracts in ordercosts and to
mitigate foreign currency risk on foreign currency denominated net monetary assets. TheHowever, the hedging strategies that we have implemented, or may in the future implement, to mitigate foreign currency exchange rate risks may not reduce or completely offset our exposure to foreign exchange rate fluctuations and may expose our business to unexpected market, operational and counterparty credit risks. Accordingly,We are particularly susceptible to wage and cost pressures in India and the exchange rate of the Indian rupee relative to the currencies of our customer contracts due to the fact that the substantial majority of our employees are in India while our contracts with customers are typically in the local currency of the country where our customers are located. If we are unable to improve the efficiency of our operations, our operating margin may decline and our business, results of operations and financial condition may be materially adversely affected. Failure to achieve our profitability goals could adversely affect our business, financial condition and results of operations.
With respect to capital return, our ability and decisions to pay dividends and repurchase shares consistent with our announced goals or at all depend on a variety of factors, including our cash flow generated from operations, the amount and geographic location of our cash and investment balances, our net income, our overall liquidity position, potential alternative uses of cash, such as acquisitions, and anticipated future economic conditions and financial results. Failure to achieve our capital return goals may adversely impact our reputation with shareholders and shareholders’ perception of our business and the value of our common stock.
Our failure to meet specified service levels required by certain of our contracts may result in our contracts being less profitable, potential liability for penalties or damages or reputational harm.
Many of our contracts include clauses that tie our compensation to the achievement of agreed-upon performance standards or milestones. Failure to satisfy these measures could significantly reduce or eliminate our fees under the contracts, increase the cost to us of meeting performance standards or milestones, delay expected payments, subject us to potential damage claims under the contract terms or harm our reputation. Customers also often have the right to terminate a contract and pursue damage claims for serious or repeated failure to meet these service commitments. Some of our contracts provide that a portion of our compensation depends on performance measures such as cost-savings, revenue enhancement, benefits produced, business goals attained and adherence to schedule. These goals can be complex and may depend on our customers’ actual levels of business activity or may be based on assumptions that are later determined not to be achievable or accurate. As such, these provisions may increase the variability in revenues and margins earned on those contracts.
We face intense and evolving competition in the rapidly changing markets we compete in.
The markets we serve and operate in are highly competitive, subject to rapid change and characterized by a large number of participants, as described in “Part I, Item 1. Business-Competition.” In addition to large, global competitors, we face competition from numerous smaller, local competitors in many geographic markets that may have more experience with operations in these markets, have well-established relationships with our desired customers, or be able to provide services and solutions at lower costs or on terms more attractive to customers than we can. Consolidation activity may also result in new competitors with greater scale, a broader footprint or vertical integration that makes them more attractive to customers as a single provider of integrated products and services. In addition, the short-term nature of contracts in our industry and the long-term concurrent use by many customers of multiple professional service providers means that we are required to be continually competitive on the quality, scope and pricing of our offerings or face a reduction or elimination of our business.
Our success depends on our ability to continue to develop and implement services and solutions that anticipate and respond to rapid and continuing changes in technology to serve the evolving needs of our customers. If we do not sufficiently invest in new technologies, successfully adapt to industry developments and changing demand, and evolve and expand our business at sufficient speed and scale to keep pace with the demands of the markets we serve, we may be unable to develop and maintain a competitive advantage and execute on our growth strategy, which would materially adversely affect our business, results of operations and financial condition.
Our relationships with our third party alliance partners, who supply us with necessary components to the services and solutions we offer our customers, are also critical to our ability to provide many of our services and solutions that address customer demands. There can be no assurance that we will be able to maintain such relationships. Among other things, such alliance partners may in the future decide to compete with us, form exclusive or more favorable arrangements with our competitors or otherwise reduce our access to their products impairing our ability to provide the services and solutions demanded by customers.
We face legal, reputational and financial risks if we fail to protect customer and/or Cognizant data from security breaches or cyberattacks.
In order to provide our services and solutions, we depend on global information technology networks and systems, including those of third parties, to process, transmit, host and securely store electronic information (including our confidential information and the confidential information of our customers) and to communicate among our locations around the world and with our customers, suppliers and partners. Security breaches, employee malfeasance, or human or technological error could lead to shutdowns or disruptions of our operations and potential unauthorized disclosure of our or our customers’ sensitive data, which in turn could jeopardize projects that are critical to our operations or the operations of our customers’ businesses. Like other global companies, we and the businesses we interact with have experienced threats to data and systems, including by perpetrators of random or targeted malicious cyberattacks, computer viruses, malware, worms, bot attacks or other destructive or disruptive software and attempts to misappropriate customer information and cause system failures and disruptions.
A security compromise of our information systems or of those of businesses with whom we interact that results in confidential information being accessed by unauthorized or improper persons could harm our reputation and expose us to regulatory actions, customer attrition, remediation expenses, disruption of our business, and claims brought by our customers or others for breaching contractual confidentiality and security provisions or data protection laws. Monetary damages imposed on us could be significant and not covered by our liability insurance. Techniques used by bad actors to obtain unauthorized access, disable or degrade service, or sabotage systems evolve frequently and may not immediately produce signs of intrusion, and we may be unable to anticipate these techniques or to implement adequate preventative measures. In addition, a security breach could require that we expend substantial additional resources related to the security of our information systems, diverting resources from other projects and disrupting our businesses. If we experience a data security breach, our reputation could be damaged and we could be subject to additional litigation, regulatory risks and business losses.
We are required to comply with increasingly complex and changing data security and privacy regulations in the United States, the European Union and in other jurisdictions in which we operate that regulate the collection, use and transfer of personal data, including the transfer of personal data between or among countries. In the United States, for example, the Health Insurance Portability and Accountability Act imposes extensive privacy and security requirements governing the transmission, use and disclosure of protected health information by participants in the health care industry. The European Union’s General Data Protection Regulation, which became effective in May 2018, imposes new compliance obligations regarding the handling of personal data and has significantly increased financial penalties for noncompliance. Additionally, the Digital Information Security in Healthcare Act is under consideration in India, which proposed legislation includes significant penalties related to disclosure of healthcare data. Other countries have enacted or are considering enacting data localization laws that require certain data to stay within their borders. We may also face audits or investigations by one or more domestic or foreign government agencies or our customers pursuant to our contractual obligations relating to our compliance with these regulations. Complying with changing regulatory
requirements requires us to incur losses fromsubstantial costs, exposes us to potential regulatory action or litigation, and may require changes to our usebusiness practices in certain jurisdictions, any of derivative financial instruments thatwhich could materially adversely affect our business operations and operating results.
If our business continuity and disaster recovery plans are not effective and our global delivery capability is impacted, our business and results of operations may be materially adversely affected and we may suffer harm to our reputation.
Our business model is dependent on our global delivery capability, which includes coordination between our main operating offices in India, our other global delivery centers, the offices of our customers and our associates worldwide. System failures, outages and operational disruptions may be caused by factors outside of our control such as hostilities, political unrest, terrorist attacks, natural disasters or pandemics affecting the geographies where our operations and transmission equipment is located. Our business continuity and disaster recovery plans may not be effective at preventing or mitigating the effects of such disruptions, particularly in the case of a catastrophic event. Any such disruption may result in lost revenues, a loss of customers and reputational damage, which would have a materialan adverse effect on our business, results of operations and financial condition.
Anti-outsourcing legislation, if adopted, and negative perceptions associated with offshore outsourcing could impair our ability to serviceserve our customers and materially adversely affect our business, results of operations and financial condition.
The issuepractice of companies outsourcing services to organizations operating in other countries is a topic of political discussion in the United States, which is our largest market, as well as in Europe, the Asia Pacific and other regions in which we have clients.customers. For example, measures aimed at limiting or restricting outsourcing by United StatesU.S. companies are periodically considered inhave been put forward for consideration by the U.S. Congress and in numerous state legislatures to address concerns over the perceived association between offshore outsourcing and the loss of jobs domestically. If enacted,any such measures may broaden existing restrictions on outsourcing by federal and state government agencies and on government contracts with firms that outsource
In addition, from time to time there has been publicity about purported negative experiences associated with offshore outsourcing, such as alleged domestic job loss and theft and misappropriation of sensitive clientcustomer data, particularly involving service providers in India. Current or prospective clientscustomers may elect to perform certain services themselves or may be discouraged from utilizing global service delivery providers like us due to negative perceptions that may be associated with using global service delivery models or firms. Any slowdown or reversal of existing industry trends toward global service delivery would seriously harm our ability to compete effectively with competitors that provide the majority of their services from within the country in which our clientscustomers operate.
We provide services to clients, which could hamper our growthcustomers and cause our revenuehave operations in many parts of the world and in a wide variety of different industries, subjecting us to decline.numerous, and sometimes conflicting, laws and regulations on matters as diverse as import and export controls,
temporary work in the United States, Europe, the Asia Pacific and other regions in which we have clients depends on their and our ability to obtain the necessary visas and work permits for our personnel who need to travel internationally. If we are unable to obtain such visasauthorizations or work permits, content requirements, trade restrictions, tariffs, taxation, anti-corruption laws (including the U.S. Foreign Corrupt Practices Act ("FCPA") and the U.K. Bribery Act), government affairs, internal and disclosure control obligations, data privacy, intellectual property and labor relations. We are subject to a wide range of potential enforcement actions, audits or if their issuance is delayedinvestigations regarding our compliance with these laws or if their length is shortened, we may not be ableregulations in the conduct of our business, and any finding of a violation could subject us to provide servicesa wide range of civil or criminal penalties, including fines, debarment, or suspension or disqualification from government contracting, prohibitions or restrictions on doing business, loss of customers and business, legal claims by customers and damage to our clientsreputation.
We face significant regulatory compliance costs and risks as a result of the size and breadth of our business. For example, we commit significant financial and managerial resources to comply with our internal control over financial reporting requirements, but we have in the past and may in the future identify material weaknesses or deficiencies in our internal control over financial reporting that causes us to continueincur incremental remediation costs in order to provide servicesmaintain adequate controls. As another example, we had to spend significant resources on a timelyconducting an internal investigation and cost-effective basis, receive revenues as early as expected or manage our delivery centers as efficiently as we otherwise could, anycooperating with investigations by the U.S. Department of Justice ("DOJ") and the SEC, each of which is now concluded, focused on whether certain payments relating to Company-owned facilities in India were made in violation of the FCPA and other applicable laws.
Changes in tax laws or in their interpretation or enforcement, failure by us to adapt our corporate structure and intercompany arrangements to achieve global tax efficiencies or adverse outcomes of tax audits, investigations or proceedings could have a material adverse effect on our business, results of operations and financial condition.
The industriesinterpretation of tax laws and regulations in which our clients are concentrated, such as the financial services industry and the healthcare industry, are, or may be, increasingly subject to governmental regulation and intervention. For instance, the financial services industry is subject to extensive and complex federal and state regulation. As a provider of services to financial institutions, portions of our operations are examined by a number of regulatory agencies. These agencies regulate the services we provide and mannermany jurisdictions in which we operate. For example, some financial services regulators have imposed guidelines for use of cloud computing services that mandate specific controls oroperate and the related tax accounting principles are complex and require financial services enterprisesconsiderable judgment to obtain regulatory approval prior to outsourcing certain functions. If we are unable to comply with these guidelines or controls, or ifdetermine our income taxes and other tax liabilities worldwide. Tax laws and regulations affecting us and our customers, are unable to obtain regulatory approval to use our services where required, our business may be harmed. In addition, clients inincluding applicable tax rates, and the financial services sector have beeninterpretation and enforcement of such laws and regulations are subject to increased regulation following the enactmentchange as a result of the Dodd-Frank Wall Street Reform and Consumer Protection Act in the United States. New or changing regulations under Dodd-Frank, as well as other regulations or legislation affecting our customers in the financial services industry, may reduce demand for our services or cause us to incur costly changes in our processes or personnel, thereby negatively affecting our business, results of operations and financial condition.
Additionally, we are subject from time to time to tax audits, investigations and proceedings. Tax authorities have disagreed, and may in the future disagree, with our judgments, and are taking increasingly aggressive positions, including with respect to our intercompany transactions. For example, we are currently involved in an ongoing dispute with the Indian Income Tax Department ("ITD") in which the ITD asserts that we owe additional taxes for two transactions by which our principal operating subsidiary in India ("CTS India") repurchased shares from its shareholders, as more fully described in Note 11 to the consolidated financial statements. Adverse outcomes in any such audits, investigations or proceedings could increase our tax exposure and cause us to incur increased expense, which could materially adversely affect our results of operations and financial condition.
We are subject to, and may become a party to, a variety of litigation or increased government interventionother claims and suits that arise from time to time in the conduct of our business. Our business is subject to the risk of litigation involving current and former employees, clients, alliance partners, subcontractors, suppliers, competitors, shareholders, government agencies or others through private actions, class actions, whistleblower claims, administrative proceedings, regulatory actions or other industries in which our clients operate also may adversely affect the growthlitigation. While we maintain insurance for certain potential liabilities, such insurance does not cover all types and amounts of their respective businessespotential liabilities and therefore negatively impact our business, results of operations and financial condition.is subject to various exclusions as well as caps on amounts recoverable.
Our stock price continuescustomer engagements expose us to be volatile.
We also face considerable potential legal liability from a variety of other sources. Our acquisition activities have in the past and may in the future be subject to litigation or other claims, including claims from professionals, customers, stockholders, might otherwise receiveor other third parties. We have also been the subject of a premium for their shares over then-current market prices. These provisions include:
Our earnings may be adversely affected if we change our intent not to fix the rights and preferences, and issue shares of preferred stock;repatriate Indian accumulated undistributed earnings.
Item 1B. Unresolved Staff Comments
None.
Item 2. Properties
| Geographic Area | Number of Locations | Square Footage Leased (in millions) | Square Footage Owned (in millions) | Total Square Footage (in millions) | ||||||||
| India | 45 | 9.8 | 12.8 | 22.6 | ||||||||
| North America | 35 | 1.1 | 0.2 | 1.3 | ||||||||
| Europe | 15 | 0.3 | — | 0.3 | ||||||||
Rest of World1 | 20 | 0.5 | — | 0.5 | ||||||||
| Total | 115 | 11.7 | 13.0 | 24.7 | ||||||||
We operate out of our Teaneck, New Jersey executive office where we lease 0.1 million square feet.feet of office space for our worldwide headquarters in Teaneck, NJ. In addition to our executive officetotal, we have offices and operations in more than 74 cities in 37 countries around the above development andworld.
We utilize a global delivery model with delivery centers weworldwide, including in-country, regional and global delivery centers. We have business development officesover 26 million square feet of owned and leased facilities for our delivery centers. Our largest delivery center presence is in approximately 68 citiesIndia: Chennai (10 million square feet); Pune (4 million square feet); Kolkata (3 million square feet); Bangalore (2 million square feet); and 35Hyderabad (2 million square feet). Our India delivery centers represent more than two-thirds of our total delivery centers on a square-foot basis. We also have a significant number of delivery centers in other countries, acrossincluding the globe.
United States, Philippines, Canada, Mexico and countries throughout Europe.
We believe that our current facilities are adequate to support our existing operations. We also believeoperations in the immediate future, and that we will be able to obtain suitable additional facilities on commercially reasonable terms on an “as needed basis.”as needed.
Item 3. Legal Proceedings
Item 4. Mine Safety Disclosures
Not applicable.
PART II
Item 5. Market for Registrant’s Common Equity, Related Stockholder Matters and Issuer Purchases of Equity Securities | |
Our Class A common stock trades on the NASDAQNasdaq Global Select Market (NASDAQ)("Nasdaq") under the symbol “CTSH”.
| Quarter Ended | High | Low | ||||
| March 31, 2014 | 54.00 | 44.96 | ||||
| June 30, 2014 | 53.40 | 45.73 | ||||
| September 30, 2014 | 51.38 | 41.51 | ||||
| December 31, 2014 | 54.89 | 42.94 | ||||
| March 31, 2015 | 64.69 | 50.71 | ||||
| June 30, 2015 | 65.96 | 58.35 | ||||
| September 30, 2015 | 69.35 | 57.50 | ||||
| December 31, 2015 | 69.80 | 58.15 | ||||
As of December 31, 2015,2018, the approximate number of holders of record of our Class A common stock was 156125 and the approximate number of beneficial holders of our Class A common stock was 50,200.376,500.
Cash Dividends
Issuer Purchases of Equity Securities
In November 2018, the Board of Directors approved an amendment to our stock repurchase program. Under our stock repurchase program, as amended, and approved by our Board of Directors, allows for thewe are authorized to repurchase of $2.0$5.5 billion, of our outstanding shares of Class A common stock, excluding fees and expenses, through December 31, 2017. Under the stock repurchase program, the Company is authorized to repurchase itsof our Class A common stock through open market purchases, including under a trading plan adopted pursuant to Rule 10b5-1 of the Securities Exchange Act of 1934, as amended, or in private transactions, including through accelerated stock repurchase agreements entered into with financial institutions, in accordance with applicable federal securities laws.laws through December 31, 2020. The timing of repurchases and the exact number of shares to be purchased are determined by the Company's management, in its discretion, or pursuant to a Rule 10b5-1 trading plan, and will depend upon market conditions and other factors.
| Month | Total Number of Shares Purchased | Average Price Paid per Share | Total Number of Shares Purchased as Part of Publicly Announced Plans or Programs | Approximate Dollar Value of Shares that May Yet Be Purchased under the Plans or Programs (in millions) | ||||||||||
| October 1, 2015 - October 31, 2015 | — | $ | — | — | $ | 480.0 | ||||||||
| November 1, 2015 - November 30, 2015 | 400,000 | 64.82 | 400,000 | 454.1 | ||||||||||
| December 1, 2015 - December 31, 2015 | 250,000 | 64.65 | 250,000 | $ | 437.9 | |||||||||
| Total | 650,000 | $ | 64.76 | 650,000 | ||||||||||
| Month | Total Number of Shares Purchased | Average Price Paid per Share | Total Number of Shares Purchased as Part of Publicly Announced Plans or Programs | Approximate Dollar Value of Shares that May Yet Be Purchased under the Plans or Programs (in millions) | ||||||||||
| October 1, 2018 - October 31, 2018 | ||||||||||||||
| Open market purchases | 1,649,171 | $ | 71.56 | 1,649,171 | $ | 657 | ||||||||
| November 1, 2018 - November 30, 2018 | ||||||||||||||
| Open market purchases | 1,175,683 | 69.70 | 1,175,683 | 2,575 | ||||||||||
| December 1, 2018 - December 31, 2018 | ||||||||||||||
| Open market purchases | 776,935 | 64.34 | 776,935 | 2,525 | ||||||||||
| Total | 3,601,789 | $ | 69.39 | 3,601,789 | ||||||||||
______________
1 | Free cash flow is not a measurement of financial performance prepared in accordance with accounting principles generally accepted in the United States of America ("GAAP"). See “Non-GAAP Financial Measures” in Item 7. Management's Discussion and Analysis of Financial Condition and Results of Operations for more information. |
Performance Graph
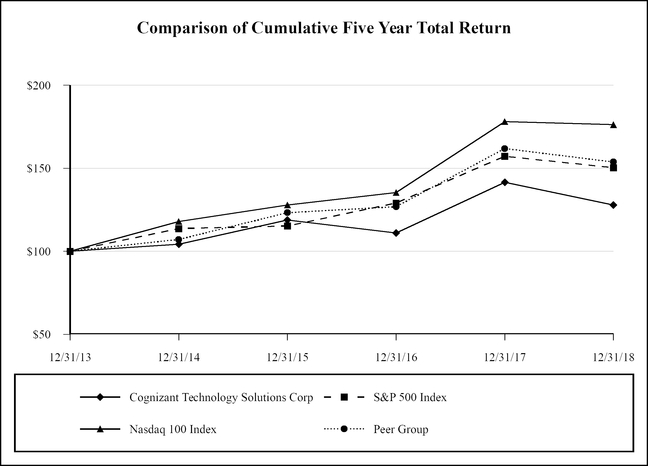
The following graph compares the cumulative total stockholder return on our Class A common stock with the cumulative total return on the S&P 500 Index, NASDAQ-100Nasdaq-100 Index and a Peer Group Index (capitalization weighted) for the period beginning December 31, 20102013 and ending on the last day of our last completed fiscal year. The stock performance shown on the graph below is not indicative of future price performance.
COMPARISON OF CUMULATIVE TOTAL RETURN(1)(2)
Among Cognizant, the S&P 500 Index, the NASDAQ-100Nasdaq-100 Index
And a Peer Group Index(3) (Capitalization Weighted)

| Company / Index | Base Period 12/31/10 | 12/31/11 | 12/31/12 | 12/31/13 | 12/31/14 | 12/31/15 | ||||||||||||||||||
COGNIZANT TECHNOLOGY SOLUTIONS CORP | $ | 100 | $ | 87.75 | $ | 100.81 | $ | 137.78 | $ | 143.70 | $ | 163.79 | ||||||||||||
| S&P 500 INDEX | 100 | 102.11 | 118.45 | 156.82 | 178.29 | 180.75 | ||||||||||||||||||
| NASDAQ-100 | 100 | 102.70 | 119.98 | 161.96 | 191.01 | 207.10 | ||||||||||||||||||
| PEER GROUP | 100 | 78.87 | 83.24 | 115.16 | 122.45 | 139.40 | ||||||||||||||||||
| Company / Index | Base Period 12/31/13 | 12/31/14 | 12/31/15 | 12/31/16 | 12/31/17 | 12/31/18 | ||||||||||||||||||
| Cognizant Technology Solutions Corp | $ | 100 | $ | 104.30 | $ | 118.88 | $ | 110.97 | $ | 141.57 | $ | 127.87 | ||||||||||||
| S&P 500 Index | 100 | 113.69 | 115.26 | 129.05 | 157.22 | 150.33 | ||||||||||||||||||
| Nasdaq-100 | 100 | 117.94 | 127.88 | 135.40 | 178.07 | 176.22 | ||||||||||||||||||
| Peer Group | 100 | 107.07 | 123.24 | 126.80 | 161.82 | 153.76 | ||||||||||||||||||
| (1) | Graph assumes $100 invested on December 31, |
| (2) | Cumulative total return assumes reinvestment of dividends. |
| (3) | We have constructed a Peer Group Index of other information technology consulting |
Item 6. Selected Financial Data | |
The following table sets forth our selected consolidated historical financial data as of the dates and for the periods indicated. Our selected consolidated financial data set forth below as of December 31, 20152018 and 20142017 and for each of the years ended December 31, 2015, 20142018, 2017 and 20132016 have been derived from the audited consolidated financial statements included elsewhere herein. Our selected consolidated financial data set forth below as of December 31, 2013, 20122016, 2015 and 20112014 and for each of the years ended December 31, 20122015 and 20112014 are derived from our audited consolidated financial statements not included elsewhere herein. Our selected consolidated financial information for 2015, 20142018, 2017 and 20132016 should be read in conjunction with the Consolidated Financial Statementsconsolidated financial statements and the Notesaccompanying notes and “ItemItem 7. Management’s Discussion and Analysis of Financial Condition and Results of Operations”Operations, which are included elsewhere in this Annual Report on Form 10-K.
| 2015 | 2014 | 2013 | 2012 | 2011 | 2018(1) | 2017 | 2016 | 2015 | 2014 | |||||||||||||||||||||||||||||||
| (in millions, except per share data) | (in millions, except per share data) | |||||||||||||||||||||||||||||||||||||||
| For the Year Ended December 31: | ||||||||||||||||||||||||||||||||||||||||
| For the year ended December 31: | ||||||||||||||||||||||||||||||||||||||||
| Revenues | $ | 12,416.0 | $ | 10,262.7 | $ | 8,843.2 | $ | 7,346.5 | $ | 6,121.2 | $ | 16,125 | $ | 14,810 | $ | 13,487 | $ | 12,416 | $ | 10,263 | ||||||||||||||||||||
| Income from operations | 2,142.0 | 1,884.9 | 1,677.9 | 1,361.5 | 1,136.5 | 2,801 | 2,481 | 2,289 | 2,142 | 1,885 | ||||||||||||||||||||||||||||||
| Net income | $ | 1,623.6 | $ | 1,439.3 | $ | 1,228.6 | $ | 1,051.3 | $ | 883.6 | 2,101 | 1,504 | 1,553 | 1,624 | 1,439 | |||||||||||||||||||||||||
| Basic earnings per share | $ | 2.67 | $ | 2.37 | $ | 2.03 | $ | 1.74 | $ | 1.46 | $ | 3.61 | $ | 2.54 | $ | 2.56 | $ | 2.67 | $ | 2.37 | ||||||||||||||||||||
| Diluted earnings per share | $ | 2.65 | $ | 2.35 | $ | 2.02 | $ | 1.72 | $ | 1.42 | $ | 3.60 | $ | 2.53 | $ | 2.55 | $ | 2.65 | $ | 2.35 | ||||||||||||||||||||
| Cash dividends declared per common share | $ | — | $ | — | $ | — | $ | — | $ | — | $ | 0.80 | $ | 0.45 | $ | — | $ | — | $ | — | ||||||||||||||||||||
| Weighted average number of common shares outstanding-Basic | 609.1 | 608.1 | 604.0 | 602.6 | 606.6 | 582 | 593 | 607 | 609 | 608 | ||||||||||||||||||||||||||||||
| Weighted average number of common shares outstanding-Diluted | 613.3 | 612.5 | 609.7 | 611.7 | 620.7 | 584 | 595 | 610 | 613 | 613 | ||||||||||||||||||||||||||||||
| As of December 31: | ||||||||||||||||||||||||||||||||||||||||
| Cash, cash equivalents and short-term investments | $ | 4,949.5 | $ | 3,774.7 | $ | 3,747.5 | $ | 2,863.8 | $ | 2,432.3 | $ | 4,511 | $ | 5,056 | $ | 5,169 | $ | 4,949 | $ | 3,775 | ||||||||||||||||||||
Working capital | 5,194.9 | 3,828.5 | 4,117.1 | 3,235.5 | 2,766.8 | 5,900 | 6,272 | 6,182 | 5,195 | 3,829 | ||||||||||||||||||||||||||||||
Total assets | 13,065.4 | 11,479.0 | 8,129.2 | 6,454.8 | 5,480.8 | 15,913 | 15,221 | 14,262 | 13,061 | 11,473 | ||||||||||||||||||||||||||||||
| Total debt | 1,287.5 | 1,637.5 | — | — | — | 745 | 873 | 878 | 1,283 | 1,632 | ||||||||||||||||||||||||||||||
| Stockholders’ equity | 9,278.1 | 7,740.2 | 6,135.8 | 4,854.4 | 3,952.9 | 11,424 | 10,669 | 10,728 | 9,278 | 7,740 | ||||||||||||||||||||||||||||||
______________________
| (1) | On January 1, 2018, we adopted Accounting Standards |
| (2) | In |
| (3) | Includes $423 million in restricted time deposits as of December 31, 2018. See Note 11 in our consolidated financial statements. |
Item 7. Management’s Discussion and Analysis of Financial Condition and Results of Operations.Operations
| Executive Summary | ||||
In 2018, we executed on our strategy to grow revenues and expand operating margins while completing our previously announced capital return plan. Revenues for the year ended December 31, 2018 increased to $16,125 million from $14,810 million for the year ended December 31, 2017, representing growth of 8.9%, or 8.5% on a constant currency basis1. Going forward, we expect to continue to invest in our digital capabilities, including the extensive training and re-skilling of our technical teams and the expansion of our local workforces in the United States and other markets around the world. We expect these investments to contribute significantly to our organic revenue growth. Additionally, we plan to supplement our organic growth through select strategic acquisitions, joint ventures, investments and alliances that can expand our digital capabilities, geographic footprint or industry capabilities. In 2018, we completed five acquisitions: Bolder Healthcare Solutions ("Bolder"), a provider of revenue cycle management solutions to the healthcare industry in the United States; Hedera Consulting, a business advisory and data analytics service provider in Belgium and the Netherlands; Softvision, a digital engineering and consulting company with significant operations in Romania and India that focuses on agile development of custom cloud-based software and platforms for customers primarily in the United States; ATG, a United States based consulting company that helps companies plan, implement, and optimize automated cloud-based quote-to-cash business processes and technologies; and SaaSfocus, a Salesforce services provider in Australia.
We are focused on driving margin enhancement while continuing to invest in our business. In 2018, our operating margin increased to 17.4% as compared to 16.8% in 2017, as we continued to target higher margin digital services customer contracts and improve our cost structure through our realignment program and other margin enhancement initiatives, primarily by optimizing our resource pyramid, improving utilization and containing our corporate spend.
As part of our capital return plan, we returned $3.7 billion to our stockholders through share repurchases and dividend payments over the two years ended December 31, 2015 and 2014:2018, exceeding our previously announced target of $3.4 billion as shown below.
| Increase | ||||||||||||||
| 2015 | 2014 | $ | % | |||||||||||
| (Dollars in millions, except per share data) | ||||||||||||||
| Revenue | $ | 12,416.0 | $ | 10,262.7 | $ | 2,153.3 | 21.0 | |||||||
| Net Income | 1,623.6 | 1,439.3 | 184.3 | 12.8 | ||||||||||
| Diluted earnings per share | 2.65 | 2.35 | 0.30 | 12.8 | ||||||||||
Non-GAAP diluted earnings per share1 | 3.07 | 2.60 | 0.47 | 18.1 | ||||||||||
| 2017 Capital Return Plan | |||||||||||
| 2018 | 2017 | Total | |||||||||
| (in millions) | |||||||||||
Dividends paid(1) | $ | 468 | $ | 265 | $ | 733 | |||||
| Share repurchases under our Board authorized stock repurchase plan | 1,175 | 1,800 | 2,975 | ||||||||
| Total | $ | 1,643 | $ | 2,065 | $ | 3,708 | |||||
Beginning in 2019, our new capital return plan anticipates the deployment of approximately 50% of our global free cash flow1 for dividends and share repurchases and approximately 25% of our global free cash flow1 for acquisitions, as needed. For the year ended December 31, 2018, our cash flows from operating activities were $2,592 million while our global free cash flow1 was $2,215 million. We review our capital return plan on an on-going basis, considering our financial performance and liquidity position, investments required to execute our strategic plans and initiatives, acquisition opportunities, the economic outlook, regulatory changes and other relevant factors. As these factors may change over time, the actual amounts expended on stock repurchase activity, dividends and acquisitions, if any, during any particular period cannot be predicted and may fluctuate from time to time.
______________
1 | Constant currency revenue growth and free cash flow are not |
non-GAAP financial measures. Our historical non-GAAP financial measures, non-GAAP operating margin in 2015 decreased to 19.7%2, non-GAAP income from operations2 from 20.2%and non-GAAP diluted earnings per share2 ("non-GAAP diluted EPS")2, excluded stock-based compensation expense, acquisition-related charges and unusual items, and our non-GAAP diluted EPS2 in 2014. The decrease in ouradditionally excluded net non-operating foreign currency exchange gains or losses and the tax impacts of all applicable adjustments. Our new non-GAAP operating margin was due to increases in compensationfinancial measures, Adjusted Operating Margin2, Adjusted Income From Operations2 and benefit costs (inclusive ofAdjusted Diluted Earnings Per Share2 ("Adjusted Diluted EPS")2,exclude only unusual items and Adjusted Diluted EPS2 additionally excludes net non-operating foreign currency exchange gains or losses and the tax impact of higher incentive-based compensation), partially offset byall applicable adjustments. We are also introducing two new non-GAAP financial measures, free cash flow2 and constant currency revenue growth2. Free cash flow2 is defined as cash flow from operating activities net of purchases of property and equipment. Constant currency revenue growth2 is defined as revenues for a given period restated at the impact of the depreciation of the Indian rupeecomparative period’s foreign currency exchange rates measured against the U.S. dollar, lower realized losses on our cash flow hedges and decreases in certain operating expenses, including travel, in 2015 compared to 2014. Historically, we have invested our profitability above the 19% to 20% non-GAAP operating margin level back into our business, which we believe iscomparative period's reported revenues. See “Non-GAAP Financial Measures” for more information.
2018 Financial Results
The following table sets forth a significant contributing factor to our strong revenue growth. This investment is primarily focused in the areas of hiring client partners and relationship personnel with specific industry experience or domain expertise, training our technical staff in a broader range of service offerings, strengthening our business analytics and digital technology capabilities, strengthening and expanding our portfolio of services, continuing to expand our geographic presence for both sales and delivery, as well as recognizing and rewarding employee performance by means of enhanced incentive-based compensation. In addition, this investment includes maintaining a level of resources, trained in a broad range of service offerings, to be well positioned to respond to our customer requests to take on additional projects. We expect to continue to invest amounts in excesssummary of our targeted operating margin levels back into the business.
| Increase | ||||||||||||||
2018(1) | 2017 | $ | % | |||||||||||
| (Dollars in millions, except per share data) | ||||||||||||||
| Revenues | $ | 16,125 | $ | 14,810 | $ | 1,315 | 8.9 | |||||||
| Income from operations | 2,801 | 2,481 | 320 | 12.9 | ||||||||||
| Net income | 2,101 | 1,504 | 597 | 39.7 | ||||||||||
| Diluted earnings per share | 3.60 | 2.53 | 1.07 | 42.3 | ||||||||||
Other Financial Information2 | ||||||||||||||
| Non-GAAP income from operations | $ | 3,345 | $ | 2,912 | $ | 433 | 14.9 | |||||||
| Adjusted Income From Operations | 2,920 | 2,553 | 367 | 14.4 | ||||||||||
| Non-GAAP diluted EPS | 4.57 | 3.77 | 0.80 | 21.2 | ||||||||||
| Adjusted Diluted EPS | 4.02 | 3.42 | 0.60 | 17.5 | ||||||||||
| (1) | On January 1, 2018, we adopted the New Revenue Standard using the modified retrospective method. Results for reporting periods beginning on or after January 1, 2018 are presented under the New Revenue Standard, while prior period amounts are not adjusted and continue to be reported in accordance with our historic accounting policies. During 2018, the adoption of the New Revenue Standard had a positive impact on revenue of $96 million, income from operations of $134 million and diluted earnings per share of $0.19 per share. See Note 3 to our consolidated financial statements for additional information. |
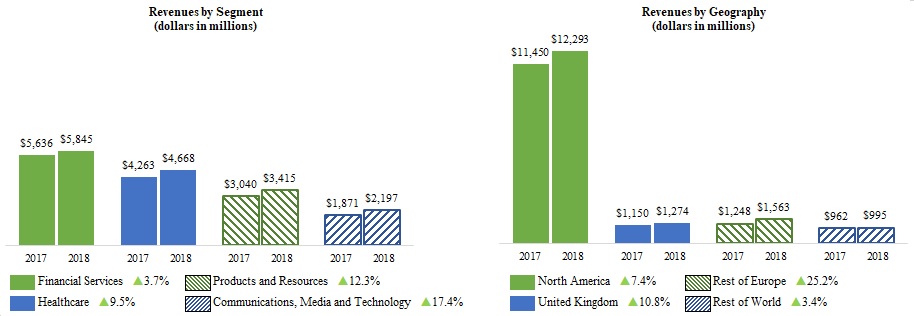
The following charts set forth revenues and revenue growth by business segment and geography for the years ended December 31, 2017 and 2018:
______________
2 | Non-GAAP income from operations, Adjusted Income From Operations, non-GAAP operating margin, |
The following factors impacted our revenue growth during the year ended December 31, 2018 as compared to the year ended December 31, 2017:
Solid performance in our Communications, Media and Technology, Products and Resources and Healthcare segments;
Revenues in our Financial Services segment grew below Company average as certain banking customers continue to optimize the cost of supporting their legacy systems and operations, including moving a portion of their services to captives, as they shift their spend to transformation and digital services;
Sustained strength in the North American market;
| • | Revenues from our customers in Europe grew 18.3%, or 15.2% on a |
| ◦ | Revenues from our Rest of Europe customers increased 25.2%, or 22.2% on a constant currency basis3; |
| ◦ | Revenues from our United Kingdom customers increased 10.8%, or 7.6% on a constant currency basis3. Revenue growth in the United Kingdom continues to be negatively affected by weakness in the banking sector in that region; |
| • | Revenues from our customers in our Rest of World region grew 3.4%, or 6.1% on a constant currency basis3; |
Increased customer spending on discretionary projects;
Expansion of our service offerings, including consulting and digital services, next-generation IT solutions and platform-based solutions;
Continued expansion of the market for global delivery of technology and business process services; and
Increased penetration of existing customers.
The following chart sets forth our GAAP operating margin, Adjusted Operating Margin3 andnon-GAAP operating margin3 for the years ended December 31, 2017 and 2018:
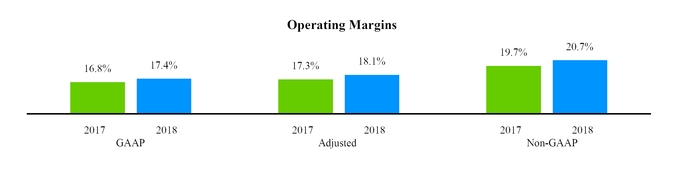
The increases in our GAAP operating margin, Adjusted Operating Margin3 and non-GAAP operating margin3 were attributable to our margin enhancement initiatives, which targeted the optimization of our resource pyramid, improvement of utilization and the containment of our corporate spend, as well as the depreciation of the Indian Rupee against the U.S. dollar, net of lower gains on settlement of our cash flow hedges in 2018 compared to 2017. Our GAAP operating margin was negatively impacted by the initial funding of the Cognizant U.S. Foundation. Our GAAP operating margin and our Adjusted Operating Margin were both negatively impacted by the increase in amortization expense due to recent acquisitions.
In 2017, the United States enacted the Tax Cuts and Jobs Act ("Tax Reform Act") which significantly revised the U.S. corporate income tax law for tax years beginning after December 31, 2017. As a result of this enactment, in 2017, we recorded a one-time provisional net income tax expense of $617 million. During 2018, we recognized a $5 million reduction to the provision for income taxes as we finalized our calculation of this one-time net income tax expense, bringing the one-time cost to $612 million. Our effective income tax rate for 2018 was 25.0% as compared to 43.4% in 2017. The decrease in our effective tax rate in 2018 was primarily driven by the one-time net income tax expense of $617 million that was recorded in 2017 as a result of the enactment of the Tax Reform Act and the reduction of the U.S. federal statutory corporate income tax rate in 2018 from 35% to 21%.
_____________
3 | Constant currency revenue growth, non-GAAP operating margin and Adjusted Operating Margin are not measurements of financial performance prepared in accordance with GAAP. See “Non-GAAP Financial Measures” for more information and reconciliations to the most directly comparable GAAP financial measures. |
Other Matters
In March 2018, the ITD placed an attachment on certain of our India bank accounts, relating to the 2016 India Cash Remittance. In April 2018, the Madras High Court granted our application for a stay of the actions of the ITD and lifted the ITD’s attachment of our bank accounts. As part of the interim stay order, we have deposited 5 billion Indian rupees ($71 million at the December 31, 2018 exchange rate), representing 15% of the disputed tax amount related to the 2016 India Cash Remittance, with the ITD. This amount is presented in "Other current assets" on our consolidated statement of financial position. In addition, the court has placed a lien on certain time deposits of CTS India in the amount of 28 billion Indian rupees ($404 million at the December 31, 2018 exchange rate), which is the remainder of the disputed tax amount related to the 2016 India Cash Remittance. The affected time deposits are considered restricted assets and we have reported them in “Short-term investments” on our consolidated statement of financial position. As of December 31, 2018, the restricted time deposits balance was $423 million, including accumulated interest.
In February 2019, we completed our internal investigation focused on whether certain payments relating to Company-owned facilities in India were made improperly and in violation of the U.S. Foreign Corrupt Practices Act ("FCPA") and other applicable laws. The investigation was conducted under the oversight of the Audit Committee, with the assistance of outside counsel. During the year ended December 31, 2016, we recorded out-of-period corrections related to $4 million of potentially improper payments between 2009 and 2016 that had been previously capitalized when they should have been expensed. These out-of-period corrections were not material to any previously issued financial statements. There were no adjustments recorded during 2018 or 2017 related to the amounts then under investigation.
On February 15, 2019, we announced a resolution of the previously disclosed investigations by the U.S. Department of Justice ("DOJ") and the U.S. Securities and Exchange Commission ("SEC") into the matters that were the subject of our internal investigation. The resolution required the Company to pay approximately $28 million to the DOJ and SEC, an amount consistent with the Company’s accrual ("FCPA Accrual") recorded during the quarter ended September 30, 2018.
During the years ended December 31, 2018, 2017 and 2016, we incurred $16 million (not including the FCPA Accrual), $36 million and $27 million, respectively, in costs related to the above investigations and the legal matters described in Note 15 to our consolidated financial statements. We expect to continue to incur legal fees and other expenses, including indemnification and expense advancement obligations, related to stockholder litigation and other legal proceedings pertaining to the matters that were the focus of the now completed FCPA investigations described above.
2019 Business Considerations
During 2016,2019, barring any unforeseen events, we expect the following factors to affect our business and our operating results:
Demand from our customers to help them meet theirfor digital services and industry-specific changes driven by evolving digital technologies;
Our customers' dual mandate of simultaneously achieving cost savings while investing in transformation and innovation;
Continued focus by customers on directing ITtechnology spending towards cost containment projects, suchprojects;
Discretionary spending by our customers may be negatively affected by international trade policies as application maintenance, infrastructure services and business process services;well as other macroeconomic factors;
Demand from certain banking customers may continue to be negatively affected by their ongoing efforts to optimize the cost of supporting their legacy systems and operations, including moving a portion of their services to captives, as they shift their spend to transformation and digital services;
Demand from our healthcare customers may continue to be affected by the uncertainty in the regulatory environment and industry-specific trends, including industry consolidation and convergence;
Demand among our technology customers may be affected by uncertainty in the regulatory environment while significant merger and acquisition activity continues to impact our customers in the communications and media industry;
Uncertainty regarding regulatory changes, including potential regulatory changes with respect to immigration and taxes;
Legal fees and other expenses, including indemnification and expense advancement obligations, related to stockholder litigation and other legal proceedings pertaining to the matters that were the focus of now completed FCPA investigations described above; and
Volatility in foreign currency rates; and
In response to this environment, we plan to:
Continue to invest in our digital capabilities across industries and geographies;
Continue to invest in our talent base, including through local hiring and re-skilling, and new service offerings, including digital technologies and new delivery models;
Partner with our existing customers to garner an increased portion of our customers’ overall IT spend by providing innovative solutions;
Focus on growing our business in Europe, the Middle East, the Asia Pacific and Latin America, regions, where we believe there are opportunities to gain market share;
Focus on operating discipline in order to appropriately manage our cost structure; andstructure.
| Business Segments | ||||
Our four reportable business segments are:
Financial Services, which includes customers providing banking/transaction processing, capital marketsconsists of our banking and insurance services;operating segments;
Healthcare, which includesconsists of our healthcare providers and payers as well as life sciences customers including pharmaceutical, biotechoperating segments;
Products and medical device companies;Resources, which consists of our retail and consumer goods, manufacturing and logistics, travel and hospitality, and energy and utilities operating segments; and
Our chief operating decision maker evaluates Cognizant’sthe Company’s performance and allocates resources based on segment revenues and operating profit. Segment operating profit is defined as income from operations before unallocated costs. Generally, operating expenses for each operating segment have similar characteristics and are subject to the same factors, pressures and challenges. However, the economic environment and its effects on industries served by our operating groupssegments may affect revenuerevenues and operating expenses to differentdiffering degrees. Expenses included in segment operating profit consist principally of direct selling and delivery costs as well as a per seat charge for use of the development and delivery centers. Certain selling, general and administrative expenses, excess or shortfall of incentive compensation for delivery personnel as compared to target, stock-based compensation expense, a portion of depreciation and amortization and the impact of the settlements of our cash flow hedges are not allocated to individual segments in internal management reports used by the chief operating decision maker. Accordingly, such expenses are excluded from segment operating profit.
We provide a significant volume of services to many customers in each of our business segments. Therefore, a loss of a significant customer or a few significant customers in a particular segment could materially reduce revenues for that segment. However, no individual customer accounted for sales in excess of 10% of our consolidated revenues during 2015, 2014 or 2013. In addition, the services we provide to our larger customers are often critical to the operations of such customers and we believe that a termination of our services would require an extended transition period with gradually declining revenues.
| Results of Operations for the Three Years Ended December 31, 2018 | ||||
The following table sets forth certain financial data for the three years ended December 31, 2015:2018:
| 2015 | % of Revenues | 2014 | % of Revenues | 2013 | % of Revenues | Increase (Decrease) | 2018(1) | % of Revenues | 2017 | % of Revenues | 2016 | % of Revenues | Increase/Decrease | |||||||||||||||||||||||||||||||||||||||
| 2015 | 2014 | 2018 | 2017 | |||||||||||||||||||||||||||||||||||||||||||||||||
| (Dollars in millions, except per share data) | (Dollars in millions, except per share data) | |||||||||||||||||||||||||||||||||||||||||||||||||||
| Revenues | $ | 12,416.0 | 100.0 | $ | 10,262.7 | 100.0 | $ | 8,843.2 | 100.0 | $ | 2,153.3 | $ | 1,419.5 | $ | 16,125 | 100.0 | $ | 14,810 | 100.0 | $ | 13,487 | 100.0 | $ | 1,315 | $ | 1,323 | ||||||||||||||||||||||||||
Cost of revenues | 7,440.2 | 59.9 | 6,141.1 | 59.8 | 5,265.5 | 59.5 | 1,299.1 | 875.6 | 9,838 | 61.0 | 9,152 | 61.8 | 8,108 | 60.1 | 686 | 1,044 | ||||||||||||||||||||||||||||||||||||
Selling, general and administrative(1) | 2,508.6 | 20.2 | 2,037.0 | 19.8 | 1,727.6 | 19.5 | 471.6 | 309.4 | ||||||||||||||||||||||||||||||||||||||||||||
Selling, general and administrative expenses(2) | 3,026 | 18.8 | 2,769 | 18.7 | 2,731 | 20.2 | 257 | 38 | ||||||||||||||||||||||||||||||||||||||||||||
| Depreciation and amortization expense | 325.2 | 2.6 | 199.7 | 1.9 | 172.2 | 1.9 | 125.5 | 27.5 | 460 | 2.9 | 408 | 2.8 | 359 | 2.7 | 52 | 49 | ||||||||||||||||||||||||||||||||||||
| Income from operations | 2,142.0 | 17.3 | 1,884.9 | 18.4 | 1,677.9 | 19.0 | 257.1 | 207.0 | 2,801 | 17.4 | 2,481 | 16.8 | 2,289 | 17.0 | 320 | 192 | ||||||||||||||||||||||||||||||||||||
| Other income (expense), net | 21.6 | 39.1 | 10.0 | (17.5 | ) | 29.1 | (4 | ) | 174 | 68 | (178 | ) | 106 | |||||||||||||||||||||||||||||||||||||||
| Income before provision for income taxes | 2,797 | 17.3 | 2,655 | 17.9 | 2,357 | 17.5 | 142 | 298 | ||||||||||||||||||||||||||||||||||||||||||||
| Provision for income taxes | 540.0 | 484.7 | 459.3 | 55.3 | 25.4 | (698 | ) | (1,153 | ) | (805 | ) | 455 | (348 | ) | ||||||||||||||||||||||||||||||||||||||
| Income from equity method investment | 2 | 2 | 1 | — | 1 | |||||||||||||||||||||||||||||||||||||||||||||||
| Net income | $ | 1,623.6 | 13.1 | $ | 1,439.3 | 14.0 | $ | 1,228.6 | 13.9 | $ | 184.3 | $ | 210.7 | $ | 2,101 | 13.0 | $ | 1,504 | 10.2 | $ | 1,553 | 11.5 | $ | 597 | $ | (49 | ) | |||||||||||||||||||||||||
| Diluted earnings per share | $ | 2.65 | $ | 2.35 | $ | 2.02 | $ | 0.30 | $ | 0.33 | ||||||||||||||||||||||||||||||||||||||||||
Other Financial Information (2) | ||||||||||||||||||||||||||||||||||||||||||||||||||||
| Diluted EPS | $ | 3.60 | $ | 2.53 | $ | 2.55 | $ | 1.07 | $ | (0.02 | ) | |||||||||||||||||||||||||||||||||||||||||
Other Financial Information (3) | Other Financial Information (3) | |||||||||||||||||||||||||||||||||||||||||||||||||||
| Non-GAAP income from operations and non-GAAP operating margin | $ | 2,449.8 | 19.7 | $ | 2,068.1 | 20.2 | $ | 1,820.7 | 20.6 | $ | 381.7 | $ | 247.4 | $ | 3,345 | 20.7 | $ | 2,912 | 19.7 | $ | 2,636 | 19.5 | 433 | $ | 276 | |||||||||||||||||||||||||||
| Non-GAAP diluted earnings per share | $ | 3.07 | $ | 2.60 | $ | 2.27 | $ | 0.47 | $ | 0.33 | ||||||||||||||||||||||||||||||||||||||||||
| Adjusted Income From Operations and Adjusted Operating Margin | $ | 2,920 | 18.1 | $ | 2,553 | 17.3 | $ | 2,289 | 17.0 | 367 | 264 | |||||||||||||||||||||||||||||||||||||||||
| Non-GAAP diluted EPS | $ | 4.57 | $ | 3.77 | $ | 3.39 | 0.80 | 0.38 | ||||||||||||||||||||||||||||||||||||||||||||
| Adjusted Diluted EPS | $ | 4.02 | $ | 3.42 | $ | 2.98 | $ | 0.60 | $ | 0.44 | ||||||||||||||||||||||||||||||||||||||||||
| (1) | Results for 2018 are presented under the New Revenue Standard, while prior period amounts are not adjusted and continue to be reported in accordance with our historic accounting policies. See Note 3 to our consolidated financial statements for additional information. |
| (2) | Exclusive of depreciation and amortization expense. |
| Non-GAAP income from operations, Adjusted Income from Operations, non-GAAP operating margin, |
Our revenue growth in 2015. In both years, the remaining increase2018 and 2017 was primarily attributed to greater acceptanceservices related to the integration of digital technologies that are reshaping our global delivery model among an increasing number of industries,customers' business and operating models, increased customer spending on discretionary projects, continued interest in using our global delivery model as a means to reduce overall ITtechnology and operations costs increased customer spending on discretionary projects, and continued penetration in all our geographic markets. Revenues from new customers contributed $195.4$305 million and $298.1$208 million, representing 9.1%23.2% and 21.0%15.7% of the year-over-year revenue growth for 20152018 and 2014,2017, respectively. In 2015,
On January 1, 2018, we adopted the New Revenue Standard using the modified retrospective method. For the year ended December 31, 2018, adoption of the New Revenue Standard had a positive impact on revenue of $96 million. See Note 3 to our consulting and technology services revenues increased by 31.8% and represented 57.6% of total 2015 revenues, while our outsourcing services revenue increased by 8.9% and constituted 42.4% of total revenues. In 2014, consulting and technology services revenue increased by 22.1% and represented 52.8% of total 2014 revenues, while our outsourcing services revenue increased by 10.0% and constituted 47.2% of total 2014 revenues. While both consulting and technology services revenue and outsourcing services revenue grew in 2015 and 2014, we saw a shift in customer spending from legacy application maintenance toward project-based work, including digital and other transformational programs.consolidated financial statements for additional information.
Revenues from our top five customers as a percentage of total revenues were 11.0%, 12.2% and 13.2% in 2015, 2014 and 2013, respectively. Revenues from our top ten customers as a percentage of total revenues were 18.6%, 21.3% and 22.6% in 2015, 2014 and 2013, respectively. follows:
| For the years ended December 31, | |||||||||
| 2018 | 2017 | 2016 | |||||||
| Top five customers | 8.6 | % | 8.9 | % | 10.0 | % | |||
| Top ten customers | 15.4 | % | 14.9 | % | 16.7 | % | |||
As we continue to add new customers and increase our penetration at existing customers, we expect the percentage of revenues from our top five and top ten customers to continue to decline over time.
Revenues by reportable business segment were as follows:
| 2015 | 2014 | 2013 | Increase | |||||||||||||||||||||
| 2015 | 2014 | |||||||||||||||||||||||
| $ | % | $ | % | |||||||||||||||||||||
| (Dollars in millions) | ||||||||||||||||||||||||
| Financial Services | $ | 5,002.9 | $ | 4,285.6 | $ | 3,717.6 | $ | 717.3 | 16.7 | $ | 568.0 | 15.3 | ||||||||||||
| Healthcare | 3,667.5 | 2,689.4 | 2,264.8 | 978.1 | 36.4 | 424.6 | 18.7 | |||||||||||||||||
| Manufacturing/Retail/Logistics | 2,343.9 | 2,093.6 | 1,868.3 | 250.3 | 12.0 | 225.3 | 12.1 | |||||||||||||||||
| Other | 1,401.7 | 1,194.1 | 992.5 | 207.6 | 17.4 | 201.6 | 20.3 | |||||||||||||||||
| Total revenue | $ | 12,416.0 | $ | 10,262.7 | $ | 8,843.2 | $ | 2,153.3 | 21.0 | $ | 1,419.5 | 16.1 | ||||||||||||
2018(1) | 2017 | 2016 | Increase | |||||||||||||||||||||
| 2018 | 2017 | |||||||||||||||||||||||
| $ | % | $ | % | |||||||||||||||||||||
| (Dollars in millions) | ||||||||||||||||||||||||
| Financial Services | $ | 5,845 | $ | 5,636 | $ | 5,366 | $ | 209 | 3.7 | $ | 270 | 5.0 | ||||||||||||
| Healthcare | 4,668 | 4,263 | 3,871 | 405 | 9.5 | 392 | 10.1 | |||||||||||||||||
| Products and Resources | 3,415 | 3,040 | 2,660 | 375 | 12.3 | 380 | 14.3 | |||||||||||||||||
| Communications, Media and Technology | 2,197 | 1,871 | 1,590 | 326 | 17.4 | 281 | 17.7 | |||||||||||||||||
| Total revenues | $ | 16,125 | $ | 14,810 | $ | 13,487 | $ | 1,315 | 8.9 | $ | 1,323 | 9.8 | ||||||||||||
_____________________
| (1) | Results for 2018 are presented under the New Revenue Standard, while prior period amounts are not adjusted and continue to be reported in accordance with our historic accounting policies. See Note 3 to our consolidated financial statements for additional information. |
Financial Services
Revenues from our Financial Services segment grew 5.0% in 2017. In 2017, growth was stronger among our insurance customers, where revenues increased by $191 million as compared to an increase of $79 million from our banking customers. In 2017, revenues from customers added during that year over yearwere $56 million and represented 20.7% of the year-over-year revenues increase in this segment. In 2017, demand from certain banking customers was negatively affected by their continued focus on optimizing their cost structure and managing their discretionary spending.
Healthcare
Revenues from our Healthcare segment grew 9.5% in 2018. In 2018, revenues in this segment increased by $342 million from our healthcare customers as compared to an increase of $63 million among our life sciences customers. Revenue growth from our healthcare customers includes revenues from Bolder, which we acquired in 2018, partially offset by a ramp down of a customer relationship in which we were a subcontractor to a third party for the purpose of delivering healthcare-related systems implementation services to local government. Revenues from customers added during 2018, including Bolder's customers, were $139 million and represented 34.3% of the year-over-year revenue increase in this segment. KeyDemand in this segment was driven by emerging industry trends, including enhanced compliance, integrated health management, claims investigative services, as well as services that drive operational improvements in areas of focus for our Financial Services customers included cost optimization, regulatorysuch as claims processing, enrollment, membership and compliance driven initiatives, cyber security andbilling, in addition to the adoption and integration of digital technologies, such as artificial intelligence, personalized care plans and predictive data
analytics to align with shifts in consumer preferences. Revenueimprove patient outcomes. Demand from our Financial Services segment grew 15.3% or $568.0 million in 2014, as compared to 2013. In 2014, our banking and insurance customers contributed $344.1 million and $223.9 million, respectively, to the year over year revenue growth. In 2014, revenue from customers added during that year was $49.6 million and represented 8.7% of the year over year revenue increase in this segment. We believe future demand from certain of our banking customers may be negatively affected by the current macroeconomic conditions affecting the industry.
Products and Resources
Revenues from our Products and Resources segment grew 12.3% in 2018. In 2018, revenue growth in this segment was strongest among our energy and utilities customers and our manufacturing and logistics customers, contributed $130.3 million to the year over year revenue growth as compared to $120.0 million forwhere revenues increased by a combined $220 million. Revenues from our retail and consumer goods customers and travel and hospitality customers. Revenuecustomers increased by a combined $155 million. Revenues from customers added during 2015 was $63.32018 were $93 million and represented 25.3%24.8% of the year-over-year revenues increase in this segment. Demand in this segment was driven by our customers’ focus on improving the efficiency of their operations, the enablement and integration of mobile platforms to support sales and other omni channel commerce initiatives, and their adoption and integration of digital technologies, such as the application of intelligent systems to manage supply chain and enhance overall customer experiences.
Revenues from our Products and Resources segment grew 14.3% in 2017. In 2017, revenue growth in this segment was strongest among our energy and utilities customers and manufacturing and logistic customers, where revenue increased by a combined $326 million, including revenues from a new strategic customer acquired in the fourth quarter of 2016. Revenue from our retail and consumer goods customers and travel and hospitality customers increased by a combined $54 million. Revenues from customers added during 2017 were $85 million and represented 22.4% of the year over year revenue increase in this segment. DemandIn 2017, demand within this segment continues to bewas driven by omnichannel commerce implementation and integration efforts, analytics, supply chain consulting and implementation initiatives, andthe increased adoption of digital technologies to align with shiftsas well as growing demand for analytics, supply chain consulting, implementation initiatives, smart products, transformation of business models, internet of things and omni channel commerce implementation and integration services. In 2017, discretionary spending by our retail customers was affected by weakness in consumer preferences. Revenuethe retail sector.
Communications, Media and Technology
Revenues from our Manufacturing/Retail/LogisticsCommunications, Media and Technology segment grew 12.1% or $225.317.4% in 2018. In 2018, growth was stronger among our technology customers where revenues increased $259 million in 2014, as compared to 2013.an increase of $67 million for our communications and media customers. Revenues from customers added during 2018 were $33 million and represented 10.1% of the year-over-year revenues increase in this segment. Demand in this segment was driven by our customers’ need to manage their digital content, create differentiated user experiences, expand their range of services, including business process services, transition to agile development methodologies, enhance their network and adopt and integrate digital technologies, such as cloud enablement and interactive and connected products. Additionally, demand among our technology customers may be affected by uncertainty in the regulatory environment while significant merger and acquisition activity continues to impact our customers in the communications and media industry.
Revenues from our Communications, Media and Technology segment grew 17.7% in 2017. In 2014,2017, revenue growth was $154 million among our communications and media customers and $127 million among our technology customers. Revenues from customers added during 2017 were $27 million and represented 9.6% of the year-over-year revenues increase in this segment. In 2017, demand within this segment was stronger amongdriven by the increased adoption of digital technologies, digital content operations, services to help our manufacturingcustomers balance rationalizing costs while creating a differentiated user experience and logistics customers, where revenue increased by $124.4 million, while revenue for our retail and hospitality customers increased by $100.8 million. In 2014, revenue from customers added during that year was $59.6 million and represented 26.5%an expanded range of the year over year revenue increase in this segment.
Revenues - Geographic Locations.
Revenues by geographic market, as determined by customer location, were as follows:
| 2015 | 2014 | 2013 | Increase | 2018(1) | 2017 | 2016 | Increase (Decrease) | ||||||||||||||||||||||||||||||||||||||||||
| 2015 | 2014 | 2018 | 2017 | ||||||||||||||||||||||||||||||||||||||||||||||
| $ | % | $ | % | $ | % | $ | % | ||||||||||||||||||||||||||||||||||||||||||
| (Dollars in millions) | (Dollars in millions) | ||||||||||||||||||||||||||||||||||||||||||||||||
| North America | $ | 9,759.4 | $ | 7,879.8 | $ | 6,860.1 | $ | 1,879.6 | 23.9 | $ | 1,019.7 | 14.9 | $ | 12,293 | $ | 11,450 | $ | 10,546 | $ | 843 | 7.4 | $ | 904 | 8.6 | |||||||||||||||||||||||||
| United Kingdom | 1,188.5 | 1,099.2 | 942.6 | 89.3 | 8.1 | 156.6 | 16.6 | 1,274 | 1,150 | 1,176 | 124 | 10.8 | (26 | ) | (2.2 | ) | |||||||||||||||||||||||||||||||||
| Rest of Europe | 819.7 | 784.4 | 636.6 | 35.3 | 4.5 | 147.8 | 23.2 | 1,563 | 1,248 | 969 | 315 | 25.2 | 279 | 28.8 | |||||||||||||||||||||||||||||||||||
| Europe - Total | 2,008.2 | 1,883.6 | 1,579.2 | 124.6 | 6.6 | 304.4 | 19.3 | 2,837 | 2,398 | 2,145 | 439 | 18.3 | 253 | 11.8 | |||||||||||||||||||||||||||||||||||
| Rest of World | 648.4 | 499.3 | 403.9 | 149.1 | 29.9 | 95.4 | 23.6 | 995 | 962 | 796 | 33 | 3.4 | 166 | 20.9 | |||||||||||||||||||||||||||||||||||
| Total revenue | $ | 12,416.0 | $ | 10,262.7 | $ | 8,843.2 | $ | 2,153.3 | 21.0 | $ | 1,419.5 | 16.1 | |||||||||||||||||||||||||||||||||||||
| Total revenues | $ | 16,125 | $ | 14,810 | $ | 13,487 | $ | 1,315 | 8.9 | $ | 1,323 | 9.8 | |||||||||||||||||||||||||||||||||||||
_____________________
| (1) | Results for 2018 are presented under the New Revenue Standard, while prior period amounts are not adjusted and continue to be reported in accordance with our historic accounting policies. See Note 3 to our consolidated financial statements for additional information. |
North America continues to be our largest market, representing 78.6%76.2% of total 2015 revenue2018 revenues and accounting for $1,879.6 million64.1% of the $2,153.3 million revenue increase in 2015. Revenue growth among our North America customers includes $643.9 million year over year growth in TriZetto revenue.
In 2017, North America represented 77.3% of total revenues and 68.3% of total revenue growth. In 2017, the increase in revenues in this region was primarily attributed to services related to the integration of digital technologies that are reshaping our customers' business and operating models to align with shifts in consumer preferences, increased customer spending on discretionary projects and continued interest in using our global delivery model as a means to reduce overall technology and operations costs. In 2017, revenue growth in Europe and Rest of World markets was driven by an increase in demand for an expanded range of services, such as business process services and customer adoption and integration of digital technologies. Revenues from our customers in Europe grew 11.8%, or 13.0% on a constant currency4 basis. Specifically, revenues from our Rest of Europe customers, increased 28.8%, or 26.8% on a constant currency4 basis, while within the United Kingdom we experienced a decrease in revenues of 2.2%, or an increase of 1.6% on a constant currency4 basis. Revenue growth in the United Kingdom was negatively affected by weakness in the banking sector in that country. In 2017, revenues from our Rest of World customers grew 20.9%, primarily driven by the Australia and India markets.
Cost of Revenues (Exclusive of Depreciation and Amortization Expense).
Our cost of revenues consists primarily of salaries, incentive-based compensation, stock-based compensation expense, payroll taxes, employee benefits, project-related immigration and project-related travel for technical personnel and subcontracting and sales commissions relatedcosts relating to revenues. Our cost of revenues increased by 21.2% or $1,299.1 million7.5% during 20152018 as compared to an increase of 16.6% or $875.6 million12.9% during 2014.2017, decreasing as a percentage of revenue to 61.0% during 2018 compared to 61.8% in 2017. In both 2015 and 2014,2018, the increasedecrease in cost of revenues was due primarily to a decrease, as a percentage of revenues, in compensation and benefits costs due to the optimization of our resource pyramid, improved utilization and the depreciation of the Indian rupee against the U.S. dollar, partially offset by an increase in fees paid to strategic partners and other vendors in our digital operations, platform and infrastructure services and increases in certain professional service costs. In 2017, cost of revenues increased, as a percentage of revenue, to 61.8% as compared to 60.1% in 2016, primarily due to an increase in compensation and benefits costs (inclusive of the impact of higher incentive-based compensation costs), partially offset by the impact of the depreciation of the Indian rupee versus the U.S. dollar, and lower realized losses on our cash flow hedges in 2015 compared to 2014. In 2015, compensation and benefit costs increased by $1,112.1 million as a result of thean increase in the number of our service delivery personnel, including new TriZetto employees, and higher incentive-based compensation costs in 2015 as compared to 2014. In 2014, the increase in compensation and benefit costs was $650.6 million as a result of the increase in the number of our service delivery personnel, partially offset by lower incentive-based compensation costs in 2014 as compared to 2013.certain professional services costs.
_____________
4 | Constant currency revenue growth is not a measurement of financial performance prepared in accordance with GAAP. See “Non-GAAP Financial Measures” for more information. |
Selling, General and Administrative Expenses
Income from Operations and Operating Margin - Overall
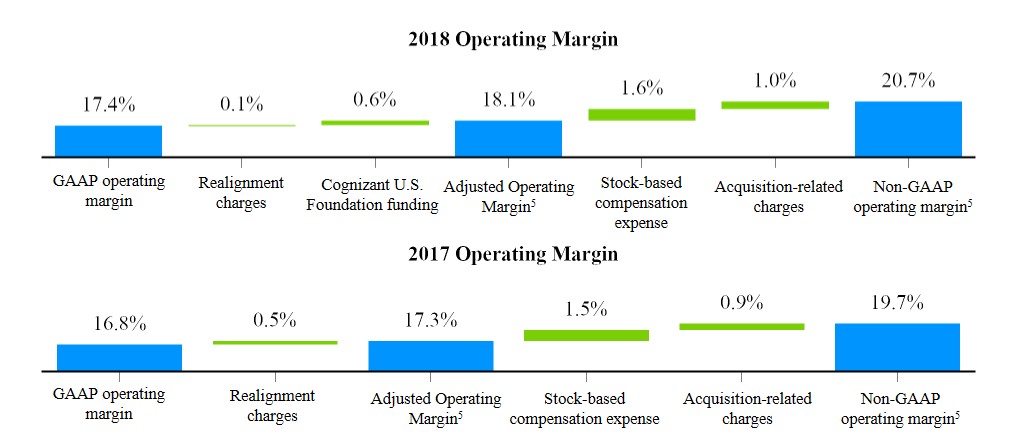
The increases in 2015our GAAP operating margin, Adjusted Operating Margin5 and non-GAAP operating margin5 were attributable to our margin enhancement initiatives, which targeted the optimization of our resource pyramid, improvement of utilization and the containment of our corporate spend, as well as the depreciation of the Indian Rupee against the U.S. dollar, net of lower gains on settlement of our cash flow hedges in 2018 compared to an increase of 12.3% or $207.0 million in 2014. Our2017. In 2018, our GAAP operating margin decreased to 17.3% of revenues in
Excluding the impact of applicable designated cash flow hedges, the depreciation of the Indian rupee against the U.S. dollar positively impacted our operating margin by approximately 9889 basis points or 0.980.89 percentage points in 2015 and 862018, while in 2017 the appreciation of the Indian rupee against the U.S. dollar negatively impacted our operating margin by approximately 58 basis points or 0.860.58 percentage points in 2014.points. Each additional 1.0% change in exchange rate between the Indian rupee and the U.S. dollar will have the effect of moving our operating margin by approximately 1918 basis points or 0.190.18 percentage points.
We enteredenter into foreign exchange forward contracts to hedge certain Indian rupee denominated payments in India. These hedges are intended to mitigate the volatility of the changes in the exchange rate between the U.S. dollar and the Indian rupee. During the yearsyear ended December 31, 2015, 2014 and 2013,2018, the settlement of certain cash flow hedges negativelypositively impacted our operating margin by approximately 5744 basis points or 0.570.44 percentage points 133as compared to a positive impact of approximately 87 basis points or 1.330.87 percentage points in 2017 and 184a positive impact of approximately 13 basis points or 1.840.13 percentage points respectively.
| Increase | |||||||||||||||||||||||
| 2015 | 2014 | ||||||||||||||||||||||
| 2015 | 2014 | 2013 | $ | % | $ | % | |||||||||||||||||
| (Dollars in millions) | |||||||||||||||||||||||
| Financial Services | $ | 1,641.9 | $ | 1,320.1 | $ | 1,212.1 | $ | 321.8 | 24.4 | $ | 108.0 | 8.9 | |||||||||||
| Healthcare | 1,200.0 | 851.0 | 829.9 | 349.0 | 41.0 | 21.1 | 2.5 | ||||||||||||||||
| Manufacturing/Retail/Logistics | 802.7 | 685.7 | 630.3 | 117.0 | 17.1 | 55.4 | 8.8 | ||||||||||||||||
| Other | 453.7 | 391.9 | 318.3 | 61.8 | 15.8 | 73.6 | 23.1 | ||||||||||||||||
| Total segment operating profit | 4,098.3 | 3,248.7 | 2,990.6 | 849.6 | 26.2 | 258.1 | 8.6 | ||||||||||||||||
| Less: unallocated costs | 1,956.3 | 1,363.8 | 1,312.7 | 592.5 | 43.4 | 51.1 | 3.9 | ||||||||||||||||
| Income from operations | $ | 2,142.0 | $ | 1,884.9 | $ | 1,677.9 | $ | 257.1 | 13.6 | $ | 207.0 | 12.3 | |||||||||||
5 | Non-GAAP operating margin |
Our most significant costs are the salaries and related benefits for our employees. In certain regions, competition for professionals with the advanced technical skills necessary to perform our services has caused wages to increase at a rate greater than the general rate of inflation. As with other service providers in our industry, we must adequately anticipate wage increases, particularly on our fixed-price and transaction- or volume-based priced contracts. Historically, we have experienced increases in compensation and benefit costs in India; however, this has not had a material impact on our results of operations as we have been able to absorb such cost increases through cost management strategies, such as managing discretionary costs, the mix of professional staff and utilization levels, and achieving other operating efficiencies. There can be no assurance that we will be able to offset such cost increases in the future.
We finished the year with approximately 281,600 employees, which is an increase of approximately 21,600 over the prior year end. For the three months ended December 31, 2018, annualized turnover, including both voluntary and involuntary, was approximately 18.9%. Turnover for the years ended December 31, 2018, 2017 and 2016, including both voluntary and involuntary, was approximately 20.8%, 19.6% and 16.0%, respectively. The higher than usual annual turnover rate in 2018 reflects the highly competitive labor market in our industry in the geographies in which we compete for talent, including India. Annual attrition rates at on-site customer locations are generally below our global attrition rate. In addition, attrition is weighted more towards the junior members of our staff.
Segment Operating Profit and Margin
In 2018, we made changes to the internal measurement of segment operating profits for the purpose of evaluating segment performance and resource allocation. The primary reason for the changes was to charge to our business segments costs that are directly managed and controlled by them. Specifically, segment operating profit now includes the stock-based compensation expense of sales managers, account executives, account managers and project teams, which was previously included in "unallocated costs." In addition, we have changed the methodology of allocating costs to our business segments for the use of our global delivery centers and infrastructure from a fixed per employee charge to a variable per employee charge that differs depending on location and assets deployed.
Segment operating profit and margin were as follows:
| Increase / (Decrease) | |||||||||||||||||||||||||
| 2018 | Operating Margin % | 2017 | Operating Margin % | 2016(1) | Operating Margin % | 2018 | 2017(1) | ||||||||||||||||||
| (Dollars in millions) | |||||||||||||||||||||||||
| Financial Services | $ | 1,757 | 30.1 | $ | 1,771 | 31.4 | $ | 1,707 | 31.8 | $ | (14 | ) | $ | 64 | |||||||||||
| Healthcare | 1,431 | 30.7 | 1,301 | 30.5 | 1,153 | 29.8 | 130 | 148 | |||||||||||||||||
| Products and Resources | 1,043 | 30.5 | 923 | 30.4 | 851 | 32.0 | 120 | 72 | |||||||||||||||||
| Communications, Media and Technology | 700 | 31.9 | 601 | 32.1 | 488 | 30.7 | 99 | 113 | |||||||||||||||||
| Total segment operating profit and margin | 4,931 | 30.6 | 4,596 | 31.0 | 4,199 | 31.1 | 335 | 397 | |||||||||||||||||
| Less: unallocated costs | 2,130 | 2,115 | 1,910 | 15 | 205 | ||||||||||||||||||||
| Income from operations | $ | 2,801 | 17.4 | $ | 2,481 | 16.8 | $ | 2,289 | 17.0 | $ | 320 | $ | 192 | ||||||||||||
| (1) | As described above, in 2018 we made changes to the internal measurement of segment operating profits. While we have restated the 2017 results to conform to the new methodology, it is impracticable for us to restate our 2016 segment operating results as the detailed information required for the allocation of such costs to the segments is not reasonably available. |
In 2018, our Financial Services segment operating margin decreased due to investments in our digital platform and infrastructure services as well as costs incurred to re-skill service delivery personnel, partially offset by the depreciation of Contentsthe Indian rupee against the U.S. dollar. In our Healthcare, Products and Resources and Communications, Media and Technology segments, operating margins remained relatively flat.
In 2017, prior to giving effect to the changes in the measurement of our segment operating profit as described above, our operating margins for our Financial Services, Healthcare, Products and Resources and Communications, Media and Technology segments were 29.0%, 30.6%, 28.6% and 30.2%, respectively. Our Financial Services, Products and Resources and Communications, Media and Technology segments operating margins decreased due to increases in compensation and benefits costs, investments to accelerate our shift to digital, including re-skilling of service delivery personnel, and the negative impact of the appreciation of various currencies, including the Indian rupee, against the U.S. dollar. Our Financial Services segment’s operating profit was negatively impacted by weakness in the banking sector as certain customers focused on optimizing their cost
structure and managing their discretionary spending. In 2017, our Healthcare segment operating margin increased, benefiting from lower losses on certain fixed-price contracts with customers.
Other Income (Expense), Net.
Total other income (expense), net consists primarily of foreign currency exchange gains and (losses),losses, interest income and interest expense. The following table sets forth for the periods indicated, total other income (expense), net:net for the years ended December 31:
| Increase / Decrease | Increase / Decrease | |||||||||||||||||||||||||||||||||||||
| 2015 | 2014 | 2013 | 2015 | 2014 | 2018 | 2017 | 2016 | 2018 | 2017 | |||||||||||||||||||||||||||||
| (in millions) | (in millions) | |||||||||||||||||||||||||||||||||||||
| Foreign currency exchange (losses) | $ | (42.9 | ) | $ | (16.5 | ) | $ | (55.2 | ) | $ | (26.4 | ) | $ | 38.7 | ||||||||||||||||||||||||
| Foreign currency exchange (losses) gains | $ | (183 | ) | $ | 90 | $ | (27 | ) | $ | (273 | ) | $ | 117 | |||||||||||||||||||||||||
| Gains (losses) on foreign exchange forward contracts not designated as hedging instruments | 0.3 | (3.9 | ) | 14.1 | 4.2 | (18.0 | ) | 31 | (23 | ) | (3 | ) | 54 | (20 | ) | |||||||||||||||||||||||
| Net foreign currency exchange (losses) | (42.6 | ) | (20.4 | ) | (41.1 | ) | (22.2 | ) | 20.7 | |||||||||||||||||||||||||||||
| Foreign currency exchange gains (losses), net | (152 | ) | 67 | (30 | ) | (219 | ) | 97 | ||||||||||||||||||||||||||||||
| Interest income | 83.7 | 62.4 | 48.9 | 21.3 | 13.5 | 177 | 133 | 115 | 44 | 18 | ||||||||||||||||||||||||||||
| Interest expense | (17.7 | ) | (2.5 | ) | — | (15.2 | ) | (2.5 | ) | (27 | ) | (23 | ) | (19 | ) | (4 | ) | (4 | ) | |||||||||||||||||||
| Other, net | (1.8 | ) | (0.4 | ) | 2.2 | (1.4 | ) | (2.6 | ) | (2 | ) | (3 | ) | 2 | 1 | (5 | ) | |||||||||||||||||||||
| Total other income (expense), net | $ | 21.6 | $ | 39.1 | $ | 10.0 | $ | (17.5 | ) | $ | 29.1 | $ | (4 | ) | $ | 174 | $ | 68 | $ | (178 | ) | $ | 106 | |||||||||||||||
The foreign currency exchange gains and losses in all the years presented were primarily attributable to the remeasurement of the Indian rupee denominated net monetary assets and liabilities in our U.S. dollar functional currency India subsidiaries as well asand, to a lesser extent, the remeasurement of other net monetary assets and liabilities denominated in currencies other than the functional currencies of our subsidiaries. The gains (losses)and losses on foreign exchange forward contracts not designated as hedging instruments relate to the realized and unrealized gains and losses on foreign exchange forward contracts entered into primarily to partially offset foreign currency exposure to the British pound, Euro, Indian rupee and other non-U.S. dollar denominated net monetary assets.assets and liabilities. As of December 31, 2015,2018, the notional value of our undesignated hedges was $165.5$507 million. The increases in interest income in 20152018 and 20142017 were primarily attributed to the increaseincreases in average invested balances. The 2015balances and 2014 increases in interest expense are primarily attributable to the interest on debt originated in the fourth quarter of 2014.higher yields.
Provision for Income Taxes.
The provision for income taxes was $540.0$698 million in 2015, $484.72018, $1,153 million in 20142017 and $459.3$805 million in 2013.2016. The effective income tax rate decreased to 25.0% in 20152018 from 25.2%43.4% in 20142017 and 34.2% in 2016. The decrease in our effective tax rate in 2018 was primarily driven by the one-time net income tax expense of $617 million that was recorded in 2017 as a result of the enactment of the Tax Reform Act and the reduction of the U.S. federal statutory corporate income tax rate in 2018 from 35% to 21%. In 2016, we incurred an incremental income tax expense of $238 million related to the India Cash Remittance.
Net Income
Net income was $2,101 million in 2018, $1,504 million in 2017 and $1,553 million in 2016. Net income as a percentage of revenues increased to 13.0% in 2018 from 10.2% in 2017 primarily due to discrete tax benefits recordedthe decrease in 2015,the provision for income taxes and an increase in income from operations, partially offset by changesthe fluctuation in the geographic mixvalue of our current year taxable income. The effective income tax rate decreasedthe Indian rupee which generated foreign currency exchange losses in 2018 compared to 25.2%foreign currency exchange gains in 2014 from 27.2% in 2013, primarily due to changes in the geographic mix of taxable income and discrete tax benefits recorded in 2014, partially offset by a scheduled reduction of certain income tax holiday benefits in India in 2014.
Non-GAAP Financial Measures
Portions of our disclosure including the following table, include non-GAAP income from operations, non-GAAP operating margin, and non-GAAP diluted earnings per share.financial measures. These non-GAAP financial measures are not based on any comprehensive set of accounting rules or principles and should not be considered a substitute for, or superior to, financial measures calculated in accordance with GAAP, and may be different from non-GAAP financial measures used by other companies. In addition, these non-GAAP financial measures should be read in conjunction with our financial statements prepared in accordance with GAAP. The reconciliations of Cognizant’sour non-GAAP financial measures to the corresponding GAAP measures, set forth in the following table, should be carefully evaluated.
U.S. Foundation. Our non-GAAP diluted EPS additionally excluded net non-operating foreign currency exchange gains or losses and unusual items, such as the effect of the net income tax expense and benefit related to 20%the enactment of the Tax Reform Act in 2018 and 2017, respectively, the effect of the recognition of an income tax benefit previously unrecognized in our consolidated financial statements related to a specific uncertain tax position in 2017, the effect of an incremental income tax expense related to the India Cash Remittance in 2016, and the tax impacts of all applicable adjustments. Our new non-GAAP financial measures, Adjusted Operating Margin and Adjusted Income From Operations, exclude only unusual items and Adjusted Diluted EPS additionally excludes net non-operating foreign currency exchange gains or losses and the tax impact of all applicable adjustments. The income tax impact of each item is calculated by applying the statutory rate and local tax regulations in the jurisdiction in which the item was incurred. Additionally, we are introducing two new non-GAAP financial measures, free cash flow and constant currency revenue growth. Free cash flow is defined as cash flows from operating activities net of purchases of property and equipment. Constant currency revenue growth is defined as revenues for a given period restated at the comparative period’s foreign currency exchange rates measured against the comparative period's reported revenues.
We believe providing investors with an operating view consistent with how we manage the Company provides enhanced transparency into theour operating results of the Company.results. For our internal management reporting and budgeting purposes, we use various GAAP and non-GAAP financial information that does not include stock-based compensation expense, acquisition-related charges and net non-operating foreign currency exchange gains or lossesmeasures for financial and operational decision making,decision-making, to evaluate period-to-period comparisons, to determine portions of the compensation for our executive officers and for making comparisons of our operating results to those of our competitors. Therefore, it is our belief that the use of non-GAAP financial measures excluding thesecertain costs provides a meaningful supplemental measure for investors to evaluate our financial performance. Accordingly,We believe that changing our historical non-GAAP financial measures, as discussed above, will result in non-GAAP financial measures that more closely align with how we intend to manage the Company. We believe that the presentation of our new non-GAAP financial measures (Adjusted Income from Operations, Adjusted Operating Margin, Adjusted Diluted EPS, free cash flow and constant currency revenue growth) as well as our historical non-GAAP financial measures (non-GAAP income from operations, non-GAAP operating margin and non-GAAP diluted earnings per share, when read in conjunctionEPS) along with our reportedreconciliations to the most comparable GAAP results,measure, as applicable, can
provide useful supplemental information to our management and investors regarding financial and business trends relating to our financial condition and results of operations.
A limitation of using non-GAAP financial measures versus financial measures calculated in accordance with GAAP is that non-GAAP financial measures do not reflect all of the amounts associated with our operating results as determined in accordance with GAAP and may exclude costs that are recurring, namely stock-based compensation expense, certain acquisition-related charges, and net non-operating foreign currency exchange gains or losses. In addition, other companies may calculate non-GAAP financial measures differently than us, thereby limiting the usefulness of these non-GAAP financial measures as a comparative tool. We compensate for these limitations by providing specific information regarding the GAAP amounts excluded from our non-GAAP income from operations, non-GAAP operating margin and non-GAAP diluted earnings per sharefinancial measures to allow investors to evaluate such non-GAAP financial measures.
The following table presents a reconciliation of each non-GAAP financial measure to the most comparable GAAP measure for the years ended December 31:
| 2015 | % of Revenues | 2014 | % of Revenues | 2013 | % of Revenues | ||||||||||||
| (Dollars in millions, except per share data) | |||||||||||||||||
| GAAP income from operations and operating margin | $ | 2,142.0 | 17.3 | $ | 1,884.9 | 18.4 | $ | 1,677.9 | 19.0 | ||||||||
| Add: Stock-based compensation expense | 192.0 | 1.5 | 134.8 | 1.3 | 118.8 | 1.3 | |||||||||||
Add: Acquisition-related charges (1) | 115.8 | 0.9 | 48.4 | 0.5 | 24.0 | 0.3 | |||||||||||
| Non-GAAP income from operations and non-GAAP operating margin | $ | 2,449.8 | 19.7 | $ | 2,068.1 | 20.2 | $ | 1,820.7 | 20.6 | ||||||||
| GAAP diluted earnings per share | $ | 2.65 | $ | 2.35 | $ | 2.02 | |||||||||||
| Effect of above operating adjustments, net of tax | 0.35 | 0.23 | 0.17 | ||||||||||||||
Effect of non-operating foreign currency exchange gains and losses, net of tax (2) | 0.07 | 0.02 | 0.08 | ||||||||||||||
| Non-GAAP diluted earnings per share | $ | 3.07 | $ | 2.60 | $ | 2.27 | |||||||||||
| 2018 | % of Revenues | 2017 | % of Revenues | 2016 | % of Revenues | |||||||||||||||
| (Dollars in millions, except per share data) | ||||||||||||||||||||
| GAAP income from operations and operating margin | $ | 2,801 | 17.4 | % | $ | 2,481 | 16.8 | % | $ | 2,289 | 17.0 | % | ||||||||
Realignment charges (1) | 19 | 0.1 | 72 | 0.5 | — | — | ||||||||||||||
Initial funding of Cognizant U.S. Foundation (2) | 100 | 0.6 | — | — | — | — | ||||||||||||||
| Adjusted Income From Operations and Adjusted Operating Margin | 2,920 | 18.1 | 2,553 | 17.3 | 2,289 | 17.0 | ||||||||||||||
Stock-based compensation expense (3) | 267 | 1.6 | 221 | 1.5 | 217 | 1.6 | ||||||||||||||
Acquisition-related charges (4) | 158 | 1.0 | 138 | 0.9 | 130 | 0.9 | ||||||||||||||
| Non-GAAP income from operations and non-GAAP operating margin | $ | 3,345 | 20.7 | % | $ | 2,912 | 19.7 | % | $ | 2,636 | 19.5 | % | ||||||||
| GAAP diluted EPS | $ | 3.60 | $ | 2.53 | $ | 2.55 | ||||||||||||||
| Effect of realignment charges and initial funding of Cognizant U.S. Foundation, as applicable, pre-tax | 0.20 | 0.12 | — | |||||||||||||||||
Effect of non-operating foreign currency exchange losses (gains), pre-tax (5) | 0.26 | (0.12 | ) | 0.04 | ||||||||||||||||
Tax effect of above adjustments (6) | (0.03 | ) | (0.06 | ) | — | |||||||||||||||
Effect of net incremental income tax expense related to the Tax Reform Act (7) | (0.01 | ) | 1.04 | — | ||||||||||||||||
Effect of recognition of income tax benefit related to an uncertain tax position (8) | — | (0.09 | ) | — | ||||||||||||||||
Effect of incremental income tax expense related to the India Cash Remittance (9) | — | — | 0.39 | |||||||||||||||||
| Adjusted Diluted EPS | 4.02 | 3.42 | 2.98 | |||||||||||||||||
| Effect of stock-based compensation expense and acquisition-related charges, pre-tax | 0.73 | 0.60 | 0.57 | |||||||||||||||||
Tax effect of stock-based compensation expense and acquisition-related charges (6) | (0.18 | ) | (0.25 | ) | (0.16 | ) | ||||||||||||||
| Non-GAAP diluted EPS | $ | 4.57 | $ | 3.77 | $ | 3.39 | ||||||||||||||
| Net cash provided by operating activities | $ | 2,592 | $ | 2,407 | $ | 1,645 | ||||||||||||||
| Purchases of property and equipment | (377 | ) | (284 | ) | (300 | ) | ||||||||||||||
| Free cash flow | $ | 2,215 | $ | 2,123 | $ | 1,345 | ||||||||||||||
_____________________
| (1) | Realignment charges include severance costs, lease termination costs, and advisory fees related to non-routine shareholder matters and to the development of our realignment and return of capital programs, as applicable. The total costs related to the realignment are reported in Selling, general and administrative expenses in our consolidated statements of operations. See Note 5 to our consolidated financial statements for additional information. |
| (2) | In 2018, we provided $100 million of initial funding to Cognizant U.S. Foundation, which is focused on science, technology, engineering and math education in the United States. |
| (3) | Stock-based compensation expense reported in: |
| For the years ended December 31, | |||||||||||
| 2018 | 2017 | 2016 | |||||||||
| (in millions) | |||||||||||
| Cost of revenues | $ | 62 | $ | 55 | $ | 53 | |||||
| Selling, general and administrative expenses | 205 | 166 | 164 | ||||||||
| (4) | Acquisition-related charges include |
| Non-operating foreign currency exchange gains and losses, |
| (6) | Presented below are the tax impacts of each of our non-GAAP adjustments to pre-tax income: |
| For the years ended December 31, | |||||||||||
| 2018 | 2017 | 2016 | |||||||||
| (in millions) | |||||||||||
| Non-GAAP income tax benefit (expense) related to: | |||||||||||
| Realignment charges | $ | 5 | $ | 25 | $ | — | |||||
| Initial funding of Cognizant U.S. Foundation | 28 | — | — | ||||||||
| Foreign currency exchange gains and losses | (12 | ) | 10 | 5 | |||||||
| Stock-based compensation expense | 66 | 101 | 49 | ||||||||
| Acquisition-related charges | 38 | 48 | 46 | ||||||||
The effective income tax rate related to each of our non-GAAP adjustments varies depending on the jurisdictions in which such income and expenses are generated and the statutory rates applicable in those jurisdictions.
| (7) | In 2017, in connection with the enactment of the Tax Reform Act, we recorded a one-time provisional net income tax expense of $617 million. In 2018, we finalized our calculation of the one-time net income tax expense related to the enactment of the Tax Reform Act and recognized a $5 million income tax benefit, which reduced our provision for income taxes. |
| (8) | In 2017, we recognized an income tax benefit previously unrecognized in our consolidated financial statements related to a specific uncertain tax position of $55 million. The recognition of the benefit in 2017 was based on management’s reassessment regarding whether this unrecognized tax benefit met the more-likely-than-not threshold in light of the lapse in the statute of limitations as to a portion of such benefit. |
| (9) | In 2016, as a result of the India Cash Remittance, we incurred an incremental income tax expense of $238 million. |
| Liquidity and Capital Resources | ||||
Our cash generated from operations has historically been our primary source of liquidity to fund operations and investments to grow our business. In addition, as of December 31, 2015,2018, we had cash, cash equivalents and short-term investments of $4,949.5$4,511 million, of which $423 million was restricted and additionalnot available for use as a result of our dispute with the ITD with respect to our 2016 India Cash Remittance. See Note 11 of our consolidated financial statements for more information. As of December 31, 2018, we had available capacity under our revolving credit facility of approximately $400.0$1,750 million. We have used and plan to continue to use a combination of our cash flow from operations, cash on hand and capacity available under our revolving credit facility for expansion of existing operations, including our offshore development and delivery centers, continued development of new service lines, acquisitions of related businesses, formation of joint ventures, stock repurchases and general corporate purposes, including funding working capital requirements.
The following table provides a summary of our cash flows for the three years ended December 31:
| Increase / Decrease | ||||||||||||||||||||
| 2015 | 2014 | 2013 | 2015 | 2014 | ||||||||||||||||
| (in millions) | ||||||||||||||||||||
| Net cash from operating activities | $ | 2,153.3 | $ | 1,473.0 | $ | 1,423.8 | $ | 680.3 | $ | 49.2 | ||||||||||
| Net cash (used in) investing activities | (1,370.6 | ) | (3,160.7 | ) | (730.8 | ) | 1,790.1 | (2,429.9 | ) | |||||||||||
| Net cash (used in) provided by financing activities | (648.1 | ) | 1,503.4 | (30.9 | ) | (2,151.5 | ) | 1,534.3 | ||||||||||||
| Increase / Decrease | ||||||||||||||||||||
| 2018 | 2017 | 2016 | 2018 | 2017 | ||||||||||||||||
| (in millions) | ||||||||||||||||||||
| Net cash provided by (used in): | ||||||||||||||||||||
| Operating activities | $ | 2,592 | $ | 2,407 | $ | 1,645 | $ | 185 | $ | 762 | ||||||||||
| Investing activities | (1,627 | ) | (582 | ) | (963 | ) | (1,045 | ) | 381 | |||||||||||
| Financing activities | (1,693 | ) | (1,985 | ) | (743 | ) | 292 | (1,242 | ) | |||||||||||
Operating activities. activities
The increase in cash generated from operating cash flowactivities for 20152018 compared to 20142017 was primarily attributable to the increase in net income further impactedfrom operations offset by the increase in non-cash expensesa higher days sales outstanding ("DSO"). Our DSO was 75 days as of December 31, 2018, 71 days as of December 31, 2017 and higher incentive-based compensation accruals that will be paid in the first quarter72 days as of December 31, 2016. The increase in cash generated from operating cash flowactivities for 20142017 compared to 2016 was primarily attributedattributable to the increase in net income. Trade accounts receivable increased to $2,252.6 million at December 31, 2015 as compared to $1,968.7 million at December 31, 2014 and $1,648.8 million at December 31, 2013. Unbilled accounts receivable increased to $369.0 million at December 31, 2015 from $324.6 million at December 31, 2014 and $226.5 million at December 31, 2013. The increase in trade accounts receivable and unbilled accounts receivable during 2015 was primarily due to increased revenues. pre-tax earnings.
We monitor turnover, aging and the collection of accounts receivable throughby customer. On January 1, 2018, we adopted the useNew Revenue Standard using the modified retrospective method. Upon adoption, we reclassified (i) balances representing receivables,
as defined by the New Revenue Standard, from Unbilled accounts receivable to Trade accounts receivable, net and (ii) balances representing contract assets, as defined by the New Revenue Standard, from Unbilled accounts receivable to Other current assets. Balances as of management reports thatDecember 31, 2018 are prepared on a customer basispresented under the New Revenue Standard, while prior period balances are not adjusted and evaluated bycontinue to be reported in accordance with our finance staff. Our days sales outstandinghistoric accounting policies. See Note 3 of our consolidated financial statements for more information.
Historically, our DSO calculation includesincluded billed and unbilled accounts receivable, net of allowance for doubtful accounts, reduced by the uncollected portion of our deferred revenue. Our days sales outstanding was 70 daysTo reflect the adoption of the New Revenue Standard and maintain the comparability of the calculation, in 2018 we adjusted the definition to include receivables, as defined by the New Revenue Standard, net of December 31, 2015, 2014allowance for doubtful accounts, and 2013.contract assets, reduced by the uncollected portion of our deferred revenue.
Investing activities.activities
The reductionincrease in net cash used in investing activities in 20152018 compared to 20142017 is primarily related to an increase in cash used for acquisitions. In 2017, the decrease in net cash used when compared to 2016 was primarily due to lower payments for acquisitions, as we acquired TriZetto in 2014, partially offset by greater net purchases of investments and a decrease in cash used for acquisitions.
Financing activities
The decrease in cash used in financing activities in 2018 compared to 2017 is primarily attributable to lower repurchases of common stock, partially offset by an increase in dividend payments and higher outflows for capital expenditures in 2015.net repayments of debt. In 2014,2017, the increase in investing outflows,cash used when compared to 2013,2016 was primarily relatedattributable to our payment forrepurchases of common stock under the acquisition of TriZetto.
New Term Loan beginning in December 2019.
The credit agreementNew Credit Agreement requires interest to be paid, at our option, at either the base rateABR or the Eurocurrency rate,Rate (each as defined in the New Credit Agreement), plus, a margin. The margin overin each case, an Applicable Margin (as defined in the base rateNew Credit Agreement). Initially, the Applicable Margin is 0.00%,0.875% with respect to Eurocurrency Rate loans and 0.00% with respect to ABR loans. Subsequently, the margin over theApplicable Margin with respect to Eurocurrency rate rangesRate loans may range from 0.75% to 1.125%, depending on our public debt ratings (or, if we have not received public debt ratings, from 0.875% to 1.00%1.125%, depending on our debtLeverage Ratio, which is the ratio of indebtedness for borrowed money to total stockholders' equity ratio). Thus, our debt exposes us to market risk from changesConsolidated EBITDA, as defined in interest rates.the New Credit Agreement). Under the credit agreement,New Credit Agreement, we are required to pay commitment fees on the unused portion of the revolving credit facility, which vary based on our public debt ratings (or, if we have not received public debt ratings, our debt to total stockholders' equity ratio). Additionally, we are required to make scheduled quarterly principal payments on the term loan.Leverage Ratio).
The credit agreementNew Credit Agreement contains certaincustomary affirmative and negative covenants including limitations on liens, mergers, consolidations and acquisitions, subsidiary indebtedness and affiliate transactions, as well as certain affirmative covenants. In addition,a financial covenant. The financial covenant is tested at the credit agreementend of each fiscal quarter and requires us to maintain a debt to total stockholders' equity ratioLeverage Ratio not in excess of 0.403.50 to 1.00, or for a period of up to four quarters following certain material acquisitions, 3.75 to 1.00. As of December 31, 2015, we areWe were in compliance with ourall debt covenants and have provided a quarterly certification to our lenders to that effect.representations of the New Credit Agreement as of December 31, 2018. We believe that we currently meet all conditions set forth in the credit agreementNew Credit Agreement to borrow thereunder, and we are not aware of any conditions that would prevent us from borrowing part or all of the remaining available capacity under the revolving credit facility as of December 31, 20152018 and through the date of this filing.
As part of our available capital resourcesreturn plan, we returned $3.7 billion to our stockholders through $2,975 million in share repurchases and $733 million in dividend payments over the two years ended December 31, 2018, exceeding our previously announced target of $3.4 billion. Beginning in 2019, our new capital return plan anticipates the deployment of approximately 50% of our global free cash flow6 for stockdividends and share repurchases during 2016. The numberand approximately 25% of shares ultimately repurchased underglobal free cash flow6 for acquisitions, as needed. For the year ended December 31, 2018, our open-market share purchase program may vary dependingcash flows from operating activities were $2,592 million while our global free cash flow6 was $2,215 million. We review our capital return plan on numerous factors, including, without limitation,an on-going basis, considering our stock pricefinancial performance and liquidity position, investments required to execute our strategic plans and initiatives, acquisition opportunities, the economic outlook, regulatory changes and other market conditions, our ongoing capital allocation planning, the levels of cash and debt balances, other demands for cash, such as acquisition activity, general economic and/or business conditions, and
Other Liquidity and through the use of Rule 10b5-1 plans and/or by other means. The stock repurchase program may be accelerated, suspended, delayed or discontinued at any time, without notice.
As a result of the enactment of the Tax Reform Act, our historical and our current plans do not demonstrate a need to repatriate these amounts to fund our liquidity needs in the United States. If suchfuture foreign earnings are repatriated in the future, or are no longer deemedsubject to U.S. federal income tax upon repatriation beyond the one-time transition tax accrued in 2017. As such, in 2018, we reevaluated our assertion that our foreign earnings would be indefinitely reinvested and concluded that our Indian earnings will continue to be indefinitely reinvested we will accrue the applicable amountwhile historical accumulated undistributed earnings of taxes associated with such earnings at that time. Dueour foreign subsidiaries other than our Indian subsidiaries, are available for repatriation to the various methods by whichUnited States. We evaluate on an ongoing basis what portion of the non-U.S. cash, cash equivalents and short-term investments held outside India is needed locally to execute our strategic plans and what amount is available for repatriation back to the United States. During 2018, we repatriated $2,414 million from our foreign subsidiaries.
Our assertion that our earnings in India continue to be indefinitely reinvested is consistent with our ongoing strategy to expand our Indian operations, including through infrastructure investments. However, future events may occur, such earnings could be repatriatedas material changes in cash estimates, discretionary transactions, including corporate restructurings, and changes in applicable laws, that may lead us to repatriate the future, it is not currently practicable to determineundistributed Indian earnings. As of December 31, 2018, the amount of unrepatriated Indian earnings was approximately $4,679 million. If all of our accumulated unrepatriated Indian earnings were to be repatriated, based on our current interpretation of India tax law, we estimate that we would incur an additional income tax expense of approximately $980 million. This estimate is subject to change based on tax legislation developments in India and other jurisdictions as well as judicial and interpretive developments of applicable taxes that would result from such repatriation.tax laws.
We expect our operating cash flow, cash and investment balances and(excluding the $423 million of India restricted assets), together with our available capacity under our revolving credit facility to be sufficient to meet our operating requirements, in India and globally, for the next twelve months. Our ability to expand and grow our business in accordance with current plans, to make acquisitions and form joint ventures, and to meet our long-term capital requirements beyond a twelve monthtwelve-month period and execute our capital return plan will depend on many factors, including the rate, if any, at which our cash flow increases, our ability and willingness to accomplishpay for acquisitions and joint ventures with capital stock our continued intent not to repatriate foreign earnings, and the availability of public and private debt and equity financing. We cannot be certain that additional financing, if required, will be available on terms and conditions acceptable to us, if at all.
As further described in Note 11 of our consolidated financial statements, certain short-term investment balances in India totaling $423 million were restricted in connection with our dispute with the ITD with respect to our 2016 India Cash Remittance. The ITD Dispute is currently pending before the Madras High Court, and no final decision has been reached. The affected balances may continue to remain restricted and unavailable for our use while the dispute is ongoing.
____________
| 6 | Free cash flow is not a measurement of financial performance prepared in accordance with GAAP. See “Non-GAAP Financial Measures” for more information and a reconciliation to the comparable GAAP financial measure. |
| Commitments and Contingencies | ||||
Commitments
As of December 31, 2015,2018, we had the following obligations and commitments to make future payments under contractual obligations and commercial commitments:
| Payments due by period | Payments due by period | |||||||||||||||||||||||||||||||||||||||
| Total | Less than 1 year | 1-3 years | 3-5 years | More than 5 years | Total | Less than 1 year | 1-3 years | 3-5 years | More than 5 years | |||||||||||||||||||||||||||||||
| (in millions) | (in millions) | |||||||||||||||||||||||||||||||||||||||
Long-term debt obligations(1) | $ | 937.5 | $ | 56.3 | $ | 181.2 | $ | 700.0 | $ | — | $ | 750 | $ | 9 | $ | 75 | $ | 666 | $ | — | ||||||||||||||||||||
Interest on long-term debt(2) | 52.0 | 15.0 | 26.3 | 10.7 | — | 114 | 26 | 48 | 40 | — | ||||||||||||||||||||||||||||||
| Capital lease obligations | 54.8 | 5.4 | 9.7 | 8.2 | 31.5 | 71 | 17 | 23 | 12 | 19 | ||||||||||||||||||||||||||||||
| Operating lease obligations | 666.7 | 134.2 | 213.0 | 154.6 | 164.9 | 988 | 226 | 354 | 211 | 197 | ||||||||||||||||||||||||||||||
Fixed capital commitments(3) | 76.4 | 76.4 | — | — | — | |||||||||||||||||||||||||||||||||||
Other purchase commitments(4) | 175.6 | 77.8 | 92.8 | 5.0 | — | |||||||||||||||||||||||||||||||||||
Other purchase commitments(3) | 207 | 117 | 69 | 21 | — | |||||||||||||||||||||||||||||||||||
Tax Reform Act transition tax(4) | 528 | 51 | 101 | 222 | 154 | |||||||||||||||||||||||||||||||||||
| Total | $ | 1,963.0 | $ | 365.1 | $ | 523.0 | $ | 878.5 | $ | 196.4 | $ | 2,658 | $ | 446 | $ | 670 | $ | 1,172 | $ | 370 | ||||||||||||||||||||
| (1) |
| (2) | Interest on the term loan was calculated at interest rates in effect as of December 31, |
| (3) |
| Other purchase commitments include, among other things, communications and information technology obligations, as well as other obligations in the ordinary course of business that we cannot cancel or where we would be required to pay a termination fee in the event of cancellation. |
| (4) | The Tax Reform Act transition tax on undistributed foreign earnings is payable in installments through the year 2024. See Note 11 to our consolidated financial statements. |
The above table does not include the $28 million FCPA Accrual. See Note 2 to our consolidated financial statements.
As of December 31, 2015,2018, we had $138.7$117 million of unrecognized tax benefits. This represents the tax benefits associated with certain tax positions on our domesticU.S. and internationalnon-U.S. tax returns that have not been recognized on our financial statements due to uncertainty regarding their resolution. The resolution of these income tax positions with the relevant taxing authorities is at various stages, and therefore we are unable to make a reliable estimate of the eventual cash flows by period that may be required to settle these matters.
See Note 15 to our clients, including any breach involving a customer’s confidential information or sensitive data, or our obligations under applicable laws or regulations could result in a claimconsolidated financial statements for substantial damages against us, regardless of our responsibility for such failure. Although we attempt to contractually limit our liability for damages arising from negligent acts, errors, mistakes, or omissions in rendering our services, there can be no assurance that the limitations of liability set forth in our contracts will be enforceable in all instances or will otherwise protect us from liability for damages. Although we have general liability insurance coverage, including coverage for errors or omissions, there can be no assurance that such coverage will cover all types of claims, continue to be available on reasonable terms or will be available in sufficient amounts to cover one or more large claims, or that the insurer will not disclaim coverage as to any future claim. The successful assertion of one or more large claims against us that exceed or are not covered by our insurance coverage or changes in our insurance policies, including premium increases or the imposition of large deductible or co-insurance requirements, could have a material adverse effect on our business, results of operations, financial condition and cash flows.additional information.
| Notional Value (in millions) | Weighted Average Contract Rate (Indian rupee to U.S. dollar) | |||||
| 2016 | $ | 1,215.0 | 68.2 | |||
| 2017 | 900.0 | 71.4 | ||||
| 2018 | 330.0 | 74.1 | ||||
| Total | $ | 2,445.0 | 70.2 | |||
| Off-Balance Sheet Arrangements | ||||
Other than our foreign exchange forward contracts, there were no off-balance sheet transactions, arrangements or other relationships with unconsolidated entities or other persons in 2015, 20142018, 2017 and 20132016 that have, or are reasonably likely to have, a current or future effect on our financial condition, revenues or expenses, results of operations, liquidity, capital expenditures or capital resources.
| Critical Accounting Estimates | ||||
Management’s discussion and analysis of our financial condition and results of operations is based on our accompanying consolidated financial statements that have been prepared in accordance with accounting principles generally accepted in the United States of America, or U.S. GAAP. We base our estimates on historical experience, current trends and on various other assumptions that are believed to be relevant at the time our consolidated financial statements are prepared. We evaluate our estimates on a continuous basis. However, the actual amounts may differ from the estimates used in the preparation of the accompanying consolidated financial statements.
We believe the following accounting estimates are the most critical to aid in fully understanding and evaluating our reported consolidated financial statements as they require the most difficult, subjective or complex judgments, resulting from the need to make estimates about the effect of matters that are inherently uncertain. Changes to these estimates could have a material adverse
effect on our results of operations and financial condition. Our significant accounting policies are described in Note 1 to of the accompanying consolidated financial statements.
Revenue Recognition. Revenues related to our highly complexfixed-price contracts for application development contracts, which are predominantly fixed-price contracts, and certainsystems integration services, consulting or other fixed-price contractstechnology services are recognized as the services areservice is performed using the percentagecost to cost method, under which the total value of completion method and the proportional performance method of accounting, respectively. Under the
Further, we include in the transaction price variable consideration only to the extent it is probable that a significant reversal of revenues recognized will not occur when the uncertainty associated with the variable consideration is resolved. Our estimates of variable consideration and determination of whether to include estimated amounts in the transaction price may involve judgment and are based largely on an allowance for doubtful accounts for estimated losses resulting from the inabilityassessment of our customersanticipated performance and all information that is reasonably available to make required payments. We estimate an allowanceus. Our estimates of variable consideration were immaterial to the consolidated results of operations for doubtful accounts by evaluating the financial condition and relative credit-worthiness of each customer, historical collections experience and other information, including the aging of the receivables.periods presented.
Income Taxes. Determining the consolidated provision for income tax expense, deferred income tax assets (and related valuation allowance, if any) and liabilities requires significant judgment. We are required to calculate and provide for income taxes in each of the jurisdictions where we operate. Changes in the geographic mix of income before taxes or estimated level of annual pre-tax income can affect our overall effective income tax rate. In addition, transactions between our affiliated entities are arranged in accordance with applicable transfer pricing laws, regulations and relevant guidelines. As a result, and due to the interpretive nature of certain aspects of these laws and guidelines, we have pending before the taxing authorities in some of our most significant jurisdictions applications for Advance Pricing Agreements ("APAs"). It could take years for the relevant taxing authorities to negotiate and conclude these applications. The consolidated provision for income taxes may also change period to period based on non-recurring events,changes in facts and circumstances, such as the settlementsettlements of income tax audits and changes in tax laws, regulations, or accounting principles.finalization of our applications for APAs.
Our provision for income taxes also includes the impact of reserves established for uncertain income tax positions, as well as the related interest, which may require us to apply judgment to complex issues and may require an extended period of time to resolve. Although we believe we have adequately reserved for our uncertain tax positions, no assurance can be given that the final outcome of these matters will not differ from our recorded amounts. We adjust these reserves in light of changing facts and circumstances, such as the closing of a tax audit. To the extent that the final outcome of these matters differs from the amounts recorded, such differences will impact the provision for income taxes in the period in which such determination is made.
business plans, operating performance indicators or competition. Evaluation of goodwill for impairment requires judgment, including the identification of reporting units, assignment of assets, liabilities and goodwill to reporting units and determination of the fair value of each reporting unit. To better align our annual goodwill impairment assessment with the timing of our budget process, we elected to change the date of our annual goodwill impairment assessment from December 31st to October 31st.
We estimate the fair value of our reporting units using a combination of an income approach, utilizing a discounted cash flow analysis, and a market approach, using market multiples. Under the income approach, we need to estimate projected future cash flows, the timing of such cash flows and long term growth rates, and determine the appropriate discount rate that reflects the risk inherent in the projected future cash flows. The discount rate used is based on our weighted-average cost of capital and may be adjusted for the relevant risk associated with business-specific characteristics and the uncertainty related to the reporting unit’s
ability to execute on the projected future cash flows. Under the market approach, we estimate fair value based on market multiples of revenuerevenues and earnings derived from comparable publicly-traded companies with characteristics similar to the reporting unit.
The estimates used to calculate the fair value of a reporting unit change from year to year based on operating results, market conditions and other factors. Changes in these estimates and assumptions could materially affect the determination of fair value for each reporting unit.
We also evaluate indefinite-lived intangible assets for impairment at least annually, or as circumstances warrant. Our 20152018 qualitative assessment included the review of relevant macroeconomic factors and entity-specific qualitative factors to determine if it was more-likely-than-not that the fair value of our indefinite-lived intangible assets was below carrying value.
Based on our most recent evaluation of goodwill and indefinite-lived intangible assets which was performed asduring the fourth quarter of December 31, 2015, none2018, we concluded the goodwill and indefinite-lived intangible asset balances in each of our reporting units or indefinite-lived intangible assets was considered to bewere not at risk of impairment. As of December 31, 2015,2018, our goodwill and indefinite-lived intangible asset balances were $2,404.7$3,481 million and $63.0$72 million, respectively.
We review our finite-lived assets, including our finite-lived intangible assets, for impairment whenever events or changes in circumstances indicate that the carrying amount of an asset may not be recoverable. We recognize an impairment loss when the sum of the undiscounted expected future cash flows is less than the carrying amount of such assets. The impairment loss is determined as the amount by which the carrying amount of the asset exceeds the fair value of the asset. Assessing the fair value of assets involves significant estimates and assumptions including estimation of future cash flows, the timing of such cash flows and discount rates reflecting the risk inherent in future cash flows.
Contingencies. Loss contingencies are recorded as liabilities when a loss is considered probable and the amount can be reasonably estimated. When a material loss contingency is reasonably possible but not probable, we do not record a liability, but instead disclose the nature and amount of the claim, and an estimate of the loss or range of loss, if such an estimate can be made. Significant judgment is required in the determination of both probability and whether an exposure is reasonably estimable. Our judgments are subjective and based on the information available from the status of the legal or regulatory proceedings, the merits of our defenses and consultation with in-house and outside legal counsel. As additional information becomes available, we reassess any potential liability related to any pending litigation and may revise our estimates. Such revisions in estimates of any potential liabilities could have a material impact on our results of operations and financial position.
| Recently Adopted and New Accounting Pronouncements | ||||
See Note 1 to our audited consolidated financial statements for additional information.
| Forward Looking Statements | ||||
The statements contained in this Annual Report on Form 10-K that are not historical facts are forward-looking statements (within the meaning of Section 21E of the Securities Exchange Act of 1934, as amended) that involve risks and uncertainties. Such forward-looking statements may be identified by, among other things, the use of forward-looking terminology such as “believe,” “expect,” “may,” “could,” “would,” “plan,” “intend,” “estimate,” “predict,” “potential,”�� “continue,” “should” or “anticipate” or the negative thereof or other variations thereon or comparable terminology, or by discussions of strategy that involve risks and uncertainties. From time to time, we or our representatives have made or may make forward-looking statements, orally or in writing.
Such forward-looking statements may be included in various filings made by us with the Securities and Exchange Commission, orSEC, in press releases or in oral statements made by or with the approval of one of our authorized executive officers. These forward-looking statements, such as statements regarding our anticipated future revenues or operating margins, contract percentage completions, earnings, capital expenditures, anticipated effective tax rates and tax expense, liquidity, access to capital, capital return plan, investment strategies, cost management, realignment program, plans and objectives, including those related to our digital practice areas, investment in our business, potential acquisitions, industry trends, customer behaviors and trends, the outcome of regulatory and litigation matters and other statements regarding matters that are not historical facts, are based on our current expectations, estimates and projections, management’s beliefs and certain assumptions made by management, many of which, by their nature, are inherently uncertain and beyond our control. Our actualActual results, performance, or achievements and outcomes could differ materially from the results expressed in, or anticipated or implied by, these forward-looking statements. There are a number of important factors that could cause our results to differ materially from those indicated by such forward-looking statements, including:
economic and political conditions globally and in particular in the markets in which our customers and operations are concentrated;
our ability to attract, train and retain skilled professionals, including but not limited to:highly skilled technical personnel to satisfy customer demand and senior management to lead our business globally;
our ability to achieve our profitability and capital return goals;
our ability to meet specified service levels required by certain of our contracts;
intense and evolving competition in the rapidly changing markets we compete in;
legal, reputational and financial risks if we fail to protect customer and/or Cognizant data from other service providers;security breaches or cyberattacks;
risks related to anti-outsourcing legislation, if adopted, and negative perceptions associated with offshore outsourcing, both of which could impair our operations in India;ability to serve our customers;
potential changes in tax laws, or in their interpretation or enforcement, failure by us to adapt our corporate structure and other currency exchange rates;intercompany arrangements to achieve global tax efficiencies or adverse outcomes of tax audits, investigations or proceedings;
| • | the factors set forth in Part I, in the section entitled “Item 1A. Risk Factors” in this report. |
You are advised to consult any further disclosures we make on related subjects in the reports we file with the Securities and Exchange Commission,SEC, including this report in the sections titled “Part“Part I, Item 1. Business,” “Part“Part I, Item 1A. Risk Factors”Factors” and “Part“Part II, Item 7. Management’s Discussion and Analysis of Financial Condition and Results of Operations.Operations.” We undertake no obligation to update or revise any forward-looking statements, whether as a result of new information, future events or otherwise, except as may be required under applicable securities laws.
Item 7A. Quantitative and Qualitative Disclosures about Market Risk.Risk
Foreign Currency Risk
We are exposed to foreign currency exchange rate risk in the ordinary course of doing business as we transact or hold a portion of our funds in foreign currencies, particularly the Indian rupee. Additionally, the Brexit Referendum and its effect on the British pound may subject us to increased volatility in foreign currency exchange rate movements. Accordingly, we periodically evaluate the need for hedging strategies, including the use of derivative financial instruments, to mitigate the effect of foreign currency exchange rate fluctuations and expect to continue to use such instruments in the future to reduce foreign currency exposure to appreciation or depreciation in the value of certain foreign currencies. All hedging transactions are authorized and executed pursuant to regularly reviewed policies and procedures.
Revenues from our customers in the United Kingdom, Rest of Europe and Rest of World represented 7.9%, 9.7% and 6.2%, respectively, of our 2018 revenues, and are typically denominated in currencies other than the U.S. dollar. Accordingly, our operating results may be affected by fluctuations in the exchange rates, primarily the Indian rupee, the British pound and the Euro, as compared to the U.S. dollar.
A significant portion of our costs in India are denominated in the Indian rupee, representing approximately 21.5% of our global operating costs during 2018, and are subject to foreign currency exchange rate fluctuations. These foreign currency exchange rate fluctuations have an impact on our results of operations.
We have entered into a series of foreign exchange forward contracts that are designated as cash flow hedges of certain Indian rupee denominated payments in India. Cognizant India converts U.S. dollar receipts from intercompany billings to Indian rupees to fund local expenses. These U.S. dollar / Indian rupee hedges are intended to partially offset the impact of movement of exchange rates on future operating costs. As of December 31, 2015,2018, the notional value and weighted average contract rates of these contracts were as follows:
| Notional Value (in millions) | Weighted Average Contract Rate (Indian rupee to U.S. dollar) | |||||
| 2016 | $ | 1,215.0 | 68.2 | |||
| 2017 | 900.0 | 71.4 | ||||
| 2018 | 330.0 | 74.1 | ||||
| Total | $ | 2,445.0 | 70.2 | |||
| Notional Value (in millions) | Weighted Average Contract Rate (Indian rupee to U.S. dollar) | |||||
| 2019 | $ | 1,388 | 70.4 | |||
| 2020 | 780 | 74.5 | ||||
| Total | $ | 2,168 | 71.8 | |||
As of December 31, 2015,2018, the net unrealized loss on our outstanding foreign exchange forward contracts designated as cash flow hedges was $14.4$4 million. Based upon a sensitivity analysis of our foreign exchange forward contracts at December 31, 2015,2018, which estimates the
fair value of the contracts based upon market exchange rate fluctuations, a 10.0% change in the foreign currency exchange rate against the U.S. dollar with all other variables held constant would have resulted in a change in the fair value of our foreign exchange forward contracts designated as cash flow hedges of approximately $227.7$207 million.
We also use foreign exchange forward contracts to provide an economic hedge against balance sheet exposure to certain monetary assets and liabilities denominated in currencies other than the functional currency of the subsidiary. These contracts are not designated as hedges and are intended to offset the foreign currency exchange gains or losses upon remeasurement of these net monetary assets. We entered into a series of foreign exchange forward contracts scheduled to mature in 2016 which are used to hedge our foreign currency denominated net monetary assets.2019. At December 31, 2015,2018, the notional value of thethese outstanding contracts was $165.5$507 million and the related fair valuenet unrealized loss was a liability of $0.8$3 million. Based upon a sensitivity analysis of our foreign exchange forward contracts at December 31, 2015,2018, which estimates the fair value of the contracts based upon market exchange rate fluctuations, a 10.0% change in the foreign currency exchange rate against the U.S. dollar with all other variables held constant would have resulted in a change in the fair value of approximately $16.5$45 million.
Interest Rate Risk
In the fourth quarter of 2014, we entered into a credit agreement, providing for a $1,000 million unsecured term loan and a $750.0$750 million unsecured revolving credit facility. The term loanfacility, which were due to mature in November 2019. In November 2018, we completed a debt refinancing in which we entered into the New Credit Agreement, providing for the New Term Loan, and thea $1,750 million unsecured revolving credit facility, bothwhich are due to mature onin November 20, 2019.2023. As of December 31, 2015,2018, we have $350.0$750 million outstanding under our New Term Loan and no outstanding notes under the revolving credit facility.
The credit agreementNew Credit Agreement requires interest to be paid, at our option, at either the base rateABR or the Eurocurrency rate,Rate (each as defined in the New Credit Agreement), plus, a margin. The margin overin each case, an Applicable Margin (as defined in the base rateNew Credit Agreement). Initially, the Applicable Margin is 0.00%,0.875% with respect to Eurocurrency Rate loans and 0.00% with respect to ABR loans. Subsequently, the margin over theApplicable Margin with respect to Eurocurrency rate rangesRate loans may range from 0.75% to 1.125%, depending on our public debt ratings (or, if we have not received public debt ratings, from 0.875% to 1.00%1.125%, depending on our Leverage Ratio, which is the ratio of indebtedness for borrowed money to Consolidated EBITDA, as defined in the New Credit Agreement). Under the New Credit Agreement, we are required to pay commitment fees on the unused portion of the revolving credit facility, which vary based on our public debt to total stockholders' equity ratio)ratings (or, if we have not received public debt ratings, on the Leverage Ratio). Thus, our debt exposes us to market risk from changes in interest rates. We performed a sensitivity analysis to determine the effect of interest rate fluctuations on our interest expense. A 10%10.0% change in interest rates, with all other variables held constant, would have resulted in an approximately $0.3 million change toimmaterial effect on our reported interest expense for 2015.expense.
In addition, our cash, cash equivalentsavailable-for-sale and short-term investmentsheld-to-maturity fixed income securities are subject to market risk from changes in interest rates. As of December 31, 2015,2018, the fair market values of our available-for-sale and held-to-maturity portfolios were $1,760 million and $1,070 million, respectively. As of December 31, 2018, a 10% change in interest rates, with all other variables held constant, would result in a change inhave an immaterial effect on the fair market value of our available-for-sale and held-to-maturity investment securities of approximately $2.5 million.
securities. We typically invest in highly-ratedhighly rated securities and our policy generally limits the amount of credit exposure to any one
issuer. Our investment policy requires investments to be investment grade with the objective of minimizing the potential risk of principal loss. We may sell our available-for-sale investments prior to their stated maturities for strategic purposes, in anticipation of credit deterioration or for duration management. As of December 31, 2015, our short-term investments totaled $2,824.3 million. Our investment portfolio is comprised primarily of time deposits, mutual funds invested in fixed income securities, Indian rupee denominated commercial paper, Indian rupee denominated international corporate bonds and government debt securities, U.S. dollar denominated corporate bonds, municipal bonds, certificates of deposit, commercial paper, debt issuances by the U.S. government, U.S. government agencies, foreign governments and supranational entities, and asset-backed securities. The asset-backed securities included Government National Mortgage Association (GNMA) mortgage backed securities and securities backed by auto loans, credit card receivables and other receivables.
Information provided by the sensitivity analysis of foreign currency risk and interest rate risk does not necessarily represent the actual changes that would occur under normal market conditions.
Item 8. Financial Statements and Supplementary Data | |
The financial statements required to be filed pursuant to this Item 8 are appended to this Annual Report on Form 10-K. A list of the financial statements filed herewith is found in Part IV, “Item“Item 15. Exhibits, Financial Statements and Financial Statement Schedule”.Schedule.”
Item 9A. Controls and Procedures | |
Evaluation of Disclosure Controls and Procedures
Our management, under the supervision and with the participation of our chief executive officer and our chief financial officer, evaluated the effectiveness of our disclosure controls and procedures (as defined in Rules 13a-15(e) and 15d-15(e) under the Securities Exchange Act of 1934, as amended or the Exchange Act)(the "Exchange Act")) as of December 31, 2015.2018. Based on this evaluation, our chief executive officer and our chief financial officer concluded that, as of December 31, 2015,2018, our disclosure controls and procedures were effective to ensure that information required to be disclosed by us in our reports that we file or submit under the Exchange Act is (i) recorded, processed, summarized and reported within the time periods specified in the SEC’s rules and forms and (ii) accumulated and communicated to our management, including our chief executive officer and our chief financial officer, as appropriate, to allow timely decisions regarding required disclosure.effective.
Changes in Internal Control over Financial Reporting
Management’s Responsibility for Financial Statements
Our management is responsible for the integrity and objectivity of all information presented in this annual report. The consolidated financial statements were prepared in conformity with accounting principles generally accepted in the United States of America and include amounts based on management’s best estimates and judgments. Management believes the consolidated financial statements fairly reflect the form and substance of transactions and that the financial statements fairly represent the Company’s financial position and results of operations.
The Audit Committee of the Board of Directors, which is composed solely of independent directors, meets regularly with the Company’s independent registered public accounting firm and representatives of management to review accounting, financial reporting, internal control and audit matters, as well as the nature and extent of the audit effort. The Audit Committee is responsible for the engagement of the independent registered public accounting firm. The independent registered public accounting firm has free access to the Audit Committee.
Management’s Report on Internal Control Over Financial Reporting
Our management is responsible for establishing and maintaining adequate internal control over financial reporting. Internal control over financial reporting is defined in Rule 13a-15(f) and 15d-15(f) of the Exchange Act and is a process designed by, or under the supervision of, our chief executive and chief financial officers and effected by our Board of Directors, management and other personnel, to provide reasonable assurance regarding the reliability of financial reporting and the preparation of financial statements for external purposes in accordance with generally accepted accounting principles and includes those policies and procedures that:
Pertain to the maintenance of records that, in reasonable detail, accurately and fairly reflect the transactions and dispositions of our assets;
Provide reasonable assurance that transactions are recorded as necessary to permit preparation of financial statements in accordance with generally accepted accounting principles, and that receipts and expenditures of the Company are being made only in accordance with authorizations of our management and directors; and
Provide reasonable assurance regarding prevention or timely detection of unauthorized acquisition, use or disposition of the Company’s assets that could have a material effect on the financial statements.
Our management assessed the effectiveness of the Company’s internal control over financial reporting as of December 31, 2015.2018. In making this assessment, the Company’s management used the criteria set forth by the Committee of Sponsoring Organizations of the Treadway Commission (COSO) in Internal Control-Integrated Framework (2013).
Based on its evaluation, our management has concluded that, as of December 31, 2015,2018, our internal control over financial reporting was effective. PricewaterhouseCoopers LLP, the independent registered public accounting firm that audited the financial statements included in this annual report, has issued an attestation report on our internal control over financial reporting, as stated in their report which is included on page F-2.
Inherent Limitations of Internal Controls
Because of its inherent limitations, internal control over financial reporting may not prevent or detect all misstatements. Projections of any evaluation of effectiveness to future periods are subject to the risk that controls may become inadequate because of changes in conditions, or that the degree of compliance with the policies or procedures may deteriorate.
Item 9B. Other Information
On February 15, 2019, we announced a resolution of the previously disclosed investigations by the DOJ and SEC focused on whether certain payments relating to Company-owned facilities in India were made in violation of the FCPA and other applicable laws. The resolution required the Company to pay approximately $28 million to the DOJ and SEC, an amount consistent with the FCPA Accrual recorded during the quarter ended September 30, 2018.
See Note 2 to our consolidated financial statements for additional information on the completion of our internal investigation and the resolution of the investigations by the DOJ and SEC in February 2019.
PART III
Item 10. Directors, Executive Officers and Corporate Governance | |
The information relating to our executive officers in response to this item is contained in part under the caption “Our Executive Officers” in Part I of this Annual Report on Form 10-K.
We have adopted a written code of business conduct and ethics, entitled “Cognizant’s Core“Core Values and StandardsCode of Business Conduct,Ethics,” that applies to all of our employees, including our principal executive officer, principal financial officer, principal accounting officer and controller, or persons performing similar functions. We make available our code of business conduct and ethics free of charge through our website which is located at www.cognizant.com. We intend to post on our website all disclosures that are required by law or NASDAQNasdaq Stock Market listing standards concerning any amendments to, or waivers from, any provision of our code of business conduct and ethics.
The remaining information required by this item will be included in our definitive proxy statement for the 20162019 Annual Meeting of Stockholders and is incorporated herein by reference to such proxy statement.
The information required by this item will be included in our definitive proxy statement for the 20162019 Annual Meeting of Stockholders and is incorporated herein by reference to such proxy statement.
Item 12. Security Ownership of Certain Beneficial Owners and Management and Related Stockholder Matters
The information required by this item will be included in our definitive proxy statement for the 20162019 Annual Meeting of Stockholders and is incorporated herein by reference to such proxy statement.
Item 13. Certain Relationships and Related Transactions, and Director Independence
The information required by this item will be included in our definitive proxy statement for the 20162019 Annual Meeting of Stockholders and is incorporated herein by reference to such proxy statement.
Item 14. Principal Accountant Fees and Services
The information required by this item will be included in our definitive proxy statement for the 20162019 Annual Meeting of Stockholders and is incorporated herein by reference to such proxy statement.
PART IV
Item 15. Exhibits, Financial Statement Schedules | |
| (a) | (1) Consolidated Financial Statements. Reference is made to the Index to Consolidated Financial Statements on Page F-1. |
(2) Consolidated Financial Statement Schedule. Reference is made to the Index to Financial Statement Schedule on Page F-1. | |
(3) Exhibits. | |
Schedules other than as listed above are omitted as not required or inapplicable or because the required information is provided in the consolidated financial statements, including the notes thereto.
EXHIBIT INDEX
| Incorporated by Reference | |||||||||||||
| Number | Exhibit Description | Form | File No. | Exhibit | Date | Filed or Furnished Herewith | |||||||
| 3.1 | 8-K | 000-24429 | 3.1 | 6/7/2018 | |||||||||
| 3.2 | 8-K | 000-24429 | 3.1 | 9/20/2018 | |||||||||
| 4.1 | S-4/A | 333-101216 | 4.2 | 1/30/2003 | |||||||||
| 10.1† | 10-Q | 000-24429 | 10.1 | 8/7/2013 | |||||||||
| 10.2† | 10-K | 000-24429 | 10.3 | 2/27/2018 | |||||||||
| 10.3† | 10-K | 000-24429 | 10.4 | 2/26/2013 | |||||||||
| 10.4† | Filed | ||||||||||||
| 10.5† | Filed | ||||||||||||
| 10.6† | 10-Q | 000-24429 | 10.1 | 8/2/2018 | |||||||||
| 10.7† | Filed | ||||||||||||
| 10.8† | 8-K | 000-24429 | 10.1 | 6/7/2018 | |||||||||
| Incorporated by Reference | |||||||||||||
| Number | Exhibit Description | Form | File No. | Exhibit | Date | Filed or Furnished Herewith | |||||||
| 2.1 | Stock Purchase Agreement, by and among TZ Holdings, L.P., TZ US Parent, Inc. and Cognizant Domestic Holdings Corporation, dates as of September 14, 2014 | 8-K | 000-24429 | 2.1 | 9/15/2014 | ||||||||
| 3.1 | Restated Certificate of Incorporation | 8-K | 000-24429 | 3.2 | 9/17/2013 | ||||||||
| 3.2 | Amended and Restated By-laws of the Company, as amended and restated on January 28, 2016 | 8-K | 000-24429 | 3.2 | 2/1/2016 | ||||||||
| 4.1 | Specimen Certificate for shares of Class A common stock | S-4/A | 333-101216 | 4.2 | 1/30/2003 | ||||||||
| 10.1† | Form of Indemnification Agreement for Directors and Officers | 10-Q | 000-24429 | 10.1 | 8/7/2013 | ||||||||
| 10.2† | Form of Amended and Restated Executive Employment and Non-Disclosure, Non-Competition, and Invention Assignment Agreement, between the Company and each of the following Executive Officers: Francisco D'Souza, Gordon Coburn, Karen McLoughlin, Ramakrishnan Chandrasekaran, Rajeev Mehta, Malcolm Frank, Steven Schwartz, Sridhar Thiruvengadam | 10-K | 000-24429 | 10.4 | 2/26/2013 | ||||||||
| 10.3† | Amended and Restated 1999 Incentive Compensation Plan (as Amended and Restated Through April 26, 2007) | 8-K | 000-24429 | 10.1 | 6/8/2007 | ||||||||
| 10.4† | 2004 Employee Stock Purchase Plan (as amended and restated effective as of April 1, 2013) | 8-K | 000-24429 | 10.1 | 6/5/2013 | ||||||||
| 10.5† | Form of Stock Option Certificate | 10-Q | 000-24429 | 10.1 | 11/8/2004 | ||||||||
| 10.6 | Distribution Agreement between IMS Health Incorporated and the Company, dated January 7, 2003 | S-4/A | 333-101216 | 10.13 | 1/9/2003 | ||||||||
| 10.7† | Amended and Restated Key Employees’ Stock Option Plan Amendment No. 1, which became effective on March 2, 2007 | 10-Q | 000-24429 | 10.2 | 5/10/2007 | ||||||||
| 10.8† | Amended and Restated Non-Employee Directors’ Stock Option Plan Amendment No. 1, which became effective on March 2, 2007 | 10-Q | 000-24429 | 10.3 | 5/10/2007 | ||||||||
| 10.9† | Form of Performance Unit Award for grants to certain executive officers | 8-K | 000-24429 | 10.1 | 12/7/2007 | ||||||||
| 10.10† | Form of Stock Unit Award Agreement pursuant to the Cognizant Technology Solutions Corporation Amended and Restated 1999 Incentive Compensation Plan | 8-K | 000-24429 | 10.1 | 9/5/2008 | ||||||||
| 10.11† | The Cognizant Technology Solutions Executive Pension Plan, as amended and restated | 8-K | 000-24429 | 10.2 | 12/5/2008 | ||||||||
| 10.12† | Cognizant Technology Solutions Corporation Amended and Restated 2009 Incentive Compensation Plan, effective March 9, 2015 | 10-Q | 000-24429 | 10.1 | 5/4/2015 | ||||||||
| 10.13† | Form of Cognizant Technology Solutions Corporation Stock Option Agreement | 8-K | 000-24429 | 10.1 | 7/6/2009 | ||||||||
| Incorporated by Reference | |||||||||||||
| Number | Exhibit Description | Form | File No. | Exhibit | Date | Filed or Furnished Herewith | |||||||
| 10.9† | 10-Q | 000-24429 | 10.1 | 11/8/2004 | |||||||||
| 10.10† | 10-Q | 000-24429 | 10.1 | 5/4/2015 | |||||||||
| 10.11† | 8-K | 000-24429 | 10.1 | 7/6/2009 | |||||||||
| 10.12† | 8-K | 000-24429 | 10.2 | 7/6/2009 | |||||||||
| 10.13† | 8-K | 000-24429 | 10.3 | 7/6/2009 | |||||||||
| 10.14† | 8-K | 000-24429 | 10.4 | 7/6/2009 | |||||||||
| 10.15† | 8-K | 000-24429 | 10.5 | 7/6/2009 | |||||||||
| 10.16† | 8-K | 000-24429 | 10.6 | 7/6/2009 | |||||||||
| 10.17† | 8-K | 000-24429 | 10.7 | 7/6/2009 | |||||||||
| 10.18† | 8-K | 000-24429 | 10.8 | 7/6/2009 | |||||||||
| 10.19† | 8-K | 000-24429 | 10.1 | 6/7/2017 | |||||||||
| 10.20† | 10-Q | 000-24429 | 10.2 | 8/3/2017 | |||||||||
| 10.21† | 10-Q | 000-24429 | 10.3 | 8/3/2017 | |||||||||
| 10.22† | 10-Q | 000-24429 | 10.4 | 8/3/2017 | |||||||||
| 10.23† | 10-Q | 000-24429 | 10.5 | 8/3/2017 | |||||||||
| 10.24 | 8-K | 000-24429 | 10.1 | 3/14/2017 | |||||||||
| 10.25 | 8-K | 000-24429 | 10.1 | 11/9/2018 | |||||||||
| 10.26 | Filed | ||||||||||||
| 10.27 | Filed | ||||||||||||
| 21.1 | Filed | ||||||||||||
| Incorporated by Reference | |||||||||||||
| Number | Exhibit Description | Form | File No. | Exhibit | Date | Filed or Furnished Herewith | |||||||
| 23.1 | Filed | ||||||||||||
| 31.1 | Filed | ||||||||||||
| 31.2 | Filed | ||||||||||||
| 32.1 | Furnished | ||||||||||||
| 32.2 | Furnished | ||||||||||||
| 101.INS | XBRL Instance Document | Filed | |||||||||||
| 101.SCH | XBRL Taxonomy Extension Schema Document | Filed | |||||||||||
| 101.CAL | XBRL Taxonomy Extension Calculation Linkbase Document | Filed | |||||||||||
| 101.DEF | XBRL Taxonomy Extension Definition Linkbase Document | Filed | |||||||||||
| 101.LAB | XBRL Taxonomy Extension Label Linkbase Document | Filed | |||||||||||
| 101.PRE | XBRL Taxonomy Extension Presentation Linkbase Document | Filed | |||||||||||
| † | A management contract or compensatory plan or arrangement required to be filed as an exhibit pursuant to Item 15(a)(3) of Form 10-K. |
Item 16. Form 10-K Summary
None.
SIGNATURES
Pursuant to the requirements of Section 13 or 15(d) of the Securities Exchange Act of 1934, the Registrant has duly caused this report to be signed on its behalf by the undersigned, thereunto duly authorized.
| COGNIZANT TECHNOLOGY SOLUTIONS CORPORATION | ||
| By: | /S/ FRANCISCO D’SOUZA | |
| Francisco D’Souza, | ||
| Chief Executive Officer | ||
| (Principal Executive Officer) | ||
| Date: | February 19, 2019 | |
Pursuant to the requirements of the Securities Exchange Act of 1934, this report has been signed below by the following persons on behalf of the Registrant and in the capacities and on the dates indicated.
| Signature | Title | Date | ||
/s/ FRANCISCO D’SOUZA | Chief Executive Officer, Vice Chairman of the Board and Director (Principal Executive Officer) | February 19, 2019 | ||
| Francisco D’Souza | ||||
/s/ KAREN MCLOUGHLIN | Chief Financial Officer (Principal Financial Officer) | February 19, 2019 | ||
| Karen McLoughlin | ||||
/s/ ROBERT TELESMANIC | Controller and Chief Accounting Officer (Principal Accounting Officer) | February 19, 2019 | ||
| Robert Telesmanic | ||||
/s/ MICHAEL PATSALOS-FOX | Chairman of the Board and Director | February 19, 2019 | ||
| Michael Patsalos-Fox | ||||
/s/ ZEIN ABDALLA | Director | February 19, 2019 | ||
| Zein Abdalla | ||||
/s/ MAUREEN BREAKIRON-EVANS | Director | February 19, 2019 | ||
| Maureen Breakiron-Evans | ||||
/s/ JONATHAN CHADWICK | Director | February 19, 2019 | ||
| Jonathan Chadwick | ||||
/s/ JOHN M. DINEEN | Director | February 19, 2019 | ||
| John M. Dineen | ||||
/s/ JOHN N. FOX, JR. | Director | February 19, 2019 | ||
| John N. Fox, Jr. | ||||
/s/ JOHN E. KLEIN | Director | February 19, 2019 | ||
| John E. Klein | ||||
/s/ LEO S. MACKAY, JR. | Director | February 19, 2019 | ||
| Leo S. Mackay, Jr. | ||||
/s/ JOSEPH M. VELLI | Director | February 19, 2019 | ||
| Joseph M. Velli | ||||
COGNIZANT TECHNOLOGY SOLUTIONS CORPORATION
INDEX TO CONSOLIDATED FINANCIAL STATEMENTS
AND FINANCIAL STATEMENT SCHEDULE
| Page | |||
| Consolidated Financial Statements: | |||
| Financial Statement Schedule: | |||
Report of Independent Registered Public Accounting Firm
To the Board of Directors and Stockholders of Cognizant Technology Solutions Corporation:Corporation
Opinions on the Financial Statements and Internal Control over Financial Reporting
In our opinion, the consolidated financial statements referred to above present fairly, in all material respects, the financial position of the Company as of December 31, 2018 and 2017, and the results of its operations and its cash flows for each of the three years in the period ended December 31, 2018 in conformity with accounting principles generally accepted in the United States of America. In addition, in our opinion, the financial statement schedule listed in the accompanying indexpresents fairly, in all material respects, the information set forth therein when read in conjunction with the related consolidated financial statements. Also in our opinion, the Company maintained, in all material respects, effective internal control over financial reporting as of December 31, 2015,2018, based on criteria established in Internal Control - Integrated Framework (2013) issued by the Committee of Sponsoring Organizations ofCOSO.
Change in Accounting Principle
As discussed in Note 3 to the Treadway Commission (COSO). consolidated financial statements, the Company changed the manner in which it accounts for revenues from contracts with customers in 2018.
Basis for Opinions
The Company's management is responsible for these consolidated financial statements, and financial statement schedule, for maintaining effective internal control over financial reporting, and for its assessment of the effectiveness of internal control over financial reporting, included in Management’s Report on Internal Control overOver Financial Reporting appearing under Item 9A. Our responsibility is to express opinions on thesethe Company’s consolidated financial statements on the financial statement schedule, and on the Company's internal control over financial reporting based on our integrated audits. We are a public accounting firm registered with the Public Company Accounting Oversight Board (United States) (PCAOB) and are required to be independent with respect to the Company in accordance with the U.S. federal securities laws and the applicable rules and regulations of the Securities and Exchange Commission and the PCAOB.
We conducted our audits in accordance with the standards of the Public Company Accounting Oversight Board (United States).PCAOB. Those standards require that we plan and perform the audits to obtain reasonable assurance about whether the consolidated financial statements are free of material misstatement, whether due to error or fraud, and whether effective internal control over financial reporting was maintained in all material respects.
Our audits of the consolidated financial statements included performing procedures to assess the risks of material misstatement of the consolidated financial statements, whether due to error or fraud, and performing procedures that respond to those risks. Such procedures included examining, on a test basis, evidence supportingregarding the amounts and disclosures in the consolidated financial statements, assessingstatements. Our audits also included evaluating the accounting principles used and significant estimates made by management, andas well as evaluating the overall presentation of the consolidated financial statement presentation.statements. Our audit of internal control over financial reporting included obtaining an understanding of internal control over financial reporting, assessing the risk that a material weakness exists, and testing and evaluating the design and operating effectiveness of internal control based on the assessed risk. Our audits also included performing such other procedures as we considered necessary in the circumstances. We believe that our audits provide a reasonable basis for our opinions.
A company’s internal control over financial reporting is a process designed to provide reasonable assurance regarding the reliability of financial reporting and the preparation of financial statements for external purposes in accordance with generally accepted accounting principles. A company’s internal control over financial reporting includes those policies and procedures that (i) pertain to the maintenance of records that, in reasonable detail, accurately and fairly reflect the transactions and dispositions of the assets of the company; (ii) provide reasonable assurance that transactions are recorded as necessary to permit preparation of financial statements in accordance with generally accepted accounting principles, and that receipts and expenditures of the company are being made only in accordance with authorizations of management and directors of the company; and (iii) provide reasonable assurance regarding prevention or timely detection of unauthorized acquisition, use, or disposition of the company’s assets that could have a material effect on the financial statements.
Because of its inherent limitations, internal control over financial reporting may not prevent or detect misstatements. Also, projections of any evaluation of effectiveness to future periods are subject to the risk that controls may become inadequate because of changes in conditions, or that the degree of compliance with the policies or procedures may deteriorate.
/s/ PricewaterhouseCoopers LLP
New York, New York
February 25, 201619, 2019
COGNIZANT TECHNOLOGY SOLUTIONS CORPORATION
CONSOLIDATED STATEMENTS OF FINANCIAL POSITION
(in millions, except par values)
| At December 31, | At December 31, | |||||||||||||
| 2015 | 2014 | 2018 | 2017 | |||||||||||
| Assets | ||||||||||||||
| Current assets: | ||||||||||||||
| Cash and cash equivalents | $ | 2,125.2 | $ | 2,010.1 | $ | 1,161 | $ | 1,925 | ||||||
| Short-term investments | 2,824.3 | 1,764.6 | 3,350 | 3,131 | ||||||||||
| Trade accounts receivable, net of allowances of $39.0 and $36.9, respectively | 2,252.6 | 1,968.7 | ||||||||||||
| Trade accounts receivable, net of allowances of $78 and $65, respectively | 3,257 | 2,865 | ||||||||||||
| Unbilled accounts receivable | 369.0 | 324.6 | — | 357 | ||||||||||
| Other current assets | 337.5 | 352.6 | 909 | 833 | ||||||||||
| Total current assets | 7,908.6 | 6,420.6 | 8,677 | 9,111 | ||||||||||
| Property and equipment, net | 1,271.4 | 1,247.2 | 1,394 | 1,324 | ||||||||||
| Goodwill | 2,404.7 | 2,413.6 | 3,481 | 2,704 | ||||||||||
| Intangible assets, net | 864.3 | 953.7 | 1,150 | 981 | ||||||||||
| Deferred income tax assets, net | 347.8 | 234.2 | 442 | 418 | ||||||||||
| Long-term investments | 80 | 235 | ||||||||||||
| Other noncurrent assets | 268.6 | 209.7 | 689 | 448 | ||||||||||
| Total assets | $ | 13,065.4 | $ | 11,479.0 | $ | 15,913 | $ | 15,221 | ||||||
| Liabilities and Stockholders’ Equity | ||||||||||||||
| Current liabilities: | ||||||||||||||
| Accounts payable | $ | 165.3 | $ | 145.7 | $ | 215 | $ | 210 | ||||||
| Deferred revenue | 323.7 | 224.1 | 286 | 383 | ||||||||||
| Short-term debt | 406.3 | 700.0 | 9 | 175 | ||||||||||
| Accrued expenses and other current liabilities | 1,818.4 | 1,522.3 | 2,267 | 2,071 | ||||||||||
| Total current liabilities | 2,713.7 | 2,592.1 | 2,777 | 2,839 | ||||||||||
| Deferred revenue, noncurrent | 49.3 | 81.0 | 62 | 104 | ||||||||||
| Deferred income tax liabilities, net | 3.3 | 11.8 | 183 | 146 | ||||||||||
| Long-term debt | 881.2 | 937.5 | 736 | 698 | ||||||||||
| Long-term income taxes payable | 478 | 584 | ||||||||||||
| Other noncurrent liabilities | 139.8 | 116.4 | 253 | 181 | ||||||||||
| Total liabilities | 3,787.3 | 3,738.8 | 4,489 | 4,552 | ||||||||||
| Commitments and contingencies (See Note 12) | ||||||||||||||
| Stockholders’ Equity: | ||||||||||||||
Commitments and contingencies (See Note 15) | ||||||||||||||
| Stockholders’ equity: | ||||||||||||||
| Preferred stock, $0.10 par value, 15.0 shares authorized, none issued | — | — | — | — | ||||||||||
| Class A common stock, $0.01 par value, 1,000.0 shares authorized, 609.0 and 609.4 shares issued and outstanding at December 31, 2015 and December 31, 2014, respectively | 6.1 | 6.1 | ||||||||||||
| Class A common stock, $0.01 par value, 1,000 shares authorized, 577 and 588 shares issued and outstanding at December 31, 2018 and 2017, respectively | 6 | 6 | ||||||||||||
| Additional paid-in capital | 453.0 | 555.6 | 47 | 49 | ||||||||||
| Retained earnings | 8,925.2 | 7,301.6 | 11,485 | 10,544 | ||||||||||
| Accumulated other comprehensive income (loss) | (106.2 | ) | (123.1 | ) | (114 | ) | 70 | |||||||
| Total stockholders’ equity | 9,278.1 | 7,740.2 | 11,424 | 10,669 | ||||||||||
| Total liabilities and stockholders’ equity | $ | 13,065.4 | $ | 11,479.0 | $ | 15,913 | $ | 15,221 | ||||||
The accompanying notes are an integral part of the consolidated financial statements.
COGNIZANT TECHNOLOGY SOLUTIONS CORPORATION
CONSOLIDATED STATEMENTS OF OPERATIONS
(in millions, except per share data)
| Year Ended December 31, | Year Ended December 31, | |||||||||||||||||||||||
| 2015 | 2014 | 2013 | 2018 | 2017 | 2016 | |||||||||||||||||||
| Revenues | $ | 12,416.0 | $ | 10,262.7 | $ | 8,843.2 | $ | 16,125 | $ | 14,810 | $ | 13,487 | ||||||||||||
| Operating expenses: | ||||||||||||||||||||||||
| Cost of revenues (exclusive of depreciation and amortization expense shown separately below) | 7,440.2 | 6,141.1 | 5,265.5 | 9,838 | 9,152 | 8,108 | ||||||||||||||||||
| Selling, general and administrative expenses | 2,508.6 | 2,037.0 | 1,727.6 | 3,026 | 2,769 | 2,731 | ||||||||||||||||||
| Depreciation and amortization expense | 325.2 | 199.7 | 172.2 | 460 | 408 | 359 | ||||||||||||||||||
| Income from operations | 2,142.0 | 1,884.9 | 1,677.9 | 2,801 | 2,481 | 2,289 | ||||||||||||||||||
| Other income (expense), net: | ||||||||||||||||||||||||
| Interest income | 83.7 | 62.4 | 48.9 | 177 | 133 | 115 | ||||||||||||||||||
| Interest expense | (17.7 | ) | (2.5 | ) | — | (27 | ) | (23 | ) | (19 | ) | |||||||||||||
| Foreign currency exchange gains (losses), net | (42.6 | ) | (20.4 | ) | (41.1 | ) | (152 | ) | 67 | (30 | ) | |||||||||||||
| Other, net | (1.8 | ) | (0.4 | ) | 2.2 | (2 | ) | (3 | ) | 2 | ||||||||||||||
| Total other income (expense), net | 21.6 | 39.1 | 10.0 | (4 | ) | 174 | 68 | |||||||||||||||||
| Income before provision for income taxes | 2,163.6 | 1,924.0 | 1,687.9 | 2,797 | 2,655 | 2,357 | ||||||||||||||||||
| Provision for income taxes | 540.0 | 484.7 | 459.3 | (698 | ) | (1,153 | ) | (805 | ) | |||||||||||||||
| Income from equity method investments | 2 | 2 | 1 | |||||||||||||||||||||
| Net income | $ | 1,623.6 | $ | 1,439.3 | $ | 1,228.6 | $ | 2,101 | $ | 1,504 | $ | 1,553 | ||||||||||||
| Basic earnings per share | $ | 2.67 | $ | 2.37 | $ | 2.03 | $ | 3.61 | $ | 2.54 | $ | 2.56 | ||||||||||||
| Diluted earnings per share | $ | 2.65 | $ | 2.35 | $ | 2.02 | $ | 3.60 | $ | 2.53 | $ | 2.55 | ||||||||||||
| Weighted average number of common shares outstanding—Basic | 609.1 | 608.1 | 604.0 | 582 | 593 | 607 | ||||||||||||||||||
| Dilutive effect of shares issuable under stock-based compensation plans | 4.2 | 4.4 | 5.7 | 2 | 2 | 3 | ||||||||||||||||||
| Weighted average number of common shares outstanding—Diluted | 613.3 | 612.5 | 609.7 | 584 | 595 | 610 | ||||||||||||||||||
The accompanying notes are an integral part of the consolidated financial statements.
COGNIZANT TECHNOLOGY SOLUTIONS CORPORATION
CONSOLIDATED STATEMENTS OF COMPREHENSIVE INCOME
(in millions)
| Year Ended December 31, | ||||||||||||
| 2015 | 2014 | 2013 | ||||||||||
| Net income | $ | 1,623.6 | $ | 1,439.3 | $ | 1,228.6 | ||||||
| Other comprehensive income (loss), net of tax: | ||||||||||||
| Foreign currency translation adjustments | (55.1 | ) | (58.8 | ) | 12.5 | |||||||
| Change in unrealized losses on cash flow hedges, net of taxes | 75.0 | 213.3 | (47.2 | ) | ||||||||
| Change in unrealized losses on available-for-sale investment securities, net of taxes | (3.0 | ) | (1.3 | ) | (1.9 | ) | ||||||
| Other comprehensive income (loss) | 16.9 | 153.2 | (36.6 | ) | ||||||||
| Comprehensive income | $ | 1,640.5 | $ | 1,592.5 | $ | 1,192.0 | ||||||
| Class A Common Stock | Additional Paid-in Capital | Retained Earnings | Accumulated Other Comprehensive Income (Loss) | Total | |||||||||||||||||||
| Shares | Amount | ||||||||||||||||||||||
| Balance, December 31, 2012 | 603.4 | $ | 6.0 | $ | 454.4 | $ | 4,633.7 | $ | (239.7 | ) | $ | 4,854.4 | |||||||||||
| Net income | — | — | — | 1,228.6 | — | 1,228.6 | |||||||||||||||||
| Other comprehensive (loss) | — | — | — | — | (36.6 | ) | (36.6 | ) | |||||||||||||||
| Common stock issued, stock-based compensation plans and other | 9.6 | 0.1 | 117.4 | — | — | 117.5 | |||||||||||||||||
| Tax benefit, stock-based compensation plans | — | — | 32.1 | — | — | 32.1 | |||||||||||||||||
| Stock-based compensation expense | — | — | 118.8 | — | — | 118.8 | |||||||||||||||||
| Repurchases of common stock | (5.3 | ) | — | (179.0 | ) | — | — | (179.0 | ) | ||||||||||||||
| Balance, December 31, 2013 | 607.7 | 6.1 | 543.7 | 5,862.3 | (276.3 | ) | 6,135.8 | ||||||||||||||||
| Net income | — | — | — | 1,439.3 | — | 1,439.3 | |||||||||||||||||
| Other comprehensive income | — | — | — | — | 153.2 | 153.2 | |||||||||||||||||
| Common stock issued, stock-based compensation plans and other | 6.7 | 0.1 | 101.3 | — | — | 101.4 | |||||||||||||||||
| Tax benefit, stock-based compensation plans | — | — | 24.0 | — | — | 24.0 | |||||||||||||||||
| Stock-based compensation expense | — | — | 134.8 | — | — | 134.8 | |||||||||||||||||
| Repurchases of common stock | (5.0 | ) | (0.1 | ) | (248.2 | ) | — | — | (248.3 | ) | |||||||||||||
| Balance, December 31, 2014 | 609.4 | 6.1 | 555.6 | 7,301.6 | (123.1 | ) | 7,740.2 | ||||||||||||||||
| Net income | — | — | — | 1,623.6 | — | 1,623.6 | |||||||||||||||||
| Other comprehensive income | — | — | — | — | 16.9 | 16.9 | |||||||||||||||||
| Common stock issued, stock-based compensation plans and other | 6.9 | 0.1 | 131.5 | — | — | 131.6 | |||||||||||||||||
| Tax benefit, stock-based compensation plans | — | — | 33.8 | — | — | 33.8 | |||||||||||||||||
| Stock-based compensation expense | — | — | 192.0 | — | — | 192.0 | |||||||||||||||||
| Repurchases of common stock | (7.3 | ) | (0.1 | ) | (459.9 | ) | — | — | (460.0 | ) | |||||||||||||
| Balance, December 31, 2015 | 609.0 | $ | 6.1 | $ | 453.0 | $ | 8,925.2 | $ | (106.2 | ) | $ | 9,278.1 | |||||||||||
| Year Ended December 31, | ||||||||||||
| 2018 | 2017 | 2016 | ||||||||||
| Net income | $ | 2,101 | $ | 1,504 | $ | 1,553 | ||||||
| Other comprehensive income (loss), net of tax: | ||||||||||||
| Foreign currency translation adjustments | (65 | ) | 111 | (59 | ) | |||||||
| Change in unrealized gains and losses on cash flow hedges | (118 | ) | 76 | 51 | ||||||||
| Change in unrealized losses on available-for-sale investment securities | — | (3 | ) | — | ||||||||
| Other comprehensive income (loss) | (183 | ) | 184 | (8 | ) | |||||||
| Comprehensive income | $ | 1,918 | $ | 1,688 | $ | 1,545 | ||||||
The accompanying notes are an integral part of the consolidated financial statements.
COGNIZANT TECHNOLOGY SOLUTIONS CORPORATION
CONSOLIDATED STATEMENTS OF STOCKHOLDERS’ EQUITY
(in millions, except per share data)
| Class A Common Stock | Additional Paid-in Capital | Retained Earnings | Accumulated Other Comprehensive Income (Loss) | Total | |||||||||||||||||||
| Shares | Amount | ||||||||||||||||||||||
| Balance, December 31, 2015 | 609 | $ | 6 | $ | 453 | $ | 8,925 | $ | (106 | ) | $ | 9,278 | |||||||||||
| Net income | — | — | — | 1,553 | — | 1,553 | |||||||||||||||||
| Other comprehensive income (loss) | — | — | — | — | (8 | ) | (8 | ) | |||||||||||||||
| Common stock issued, stock-based compensation plans | 8 | — | 176 | — | — | 176 | |||||||||||||||||
| Tax benefit, stock-based compensation plans | — | — | 24 | — | — | 24 | |||||||||||||||||
| Stock-based compensation expense | — | — | 217 | — | — | 217 | |||||||||||||||||
| Repurchases of common stock | (9 | ) | — | (512 | ) | — | — | (512 | ) | ||||||||||||||
| Balance, December 31, 2016 | 608 | 6 | 358 | 10,478 | (114 | ) | 10,728 | ||||||||||||||||
| Net income | — | — | — | 1,504 | — | 1,504 | |||||||||||||||||
| Other comprehensive income (loss) | — | — | — | — | 184 | 184 | |||||||||||||||||
| Common stock issued, stock-based compensation plans | 9 | — | 189 | — | — | 189 | |||||||||||||||||
| Stock-based compensation expense | — | — | 221 | — | — | 221 | |||||||||||||||||
| Repurchases of common stock | (29 | ) | — | (719 | ) | (1,170 | ) | — | (1,889 | ) | |||||||||||||
| Dividends declared, $0.45 per share | — | — | — | (268 | ) | — | (268 | ) | |||||||||||||||
| Balance, December 31, 2017 | 588 | 6 | 49 | 10,544 | 70 | 10,669 | |||||||||||||||||
Cumulative effect of changes in accounting principle (1) | — | — | — | 122 | (1 | ) | 121 | ||||||||||||||||
| Net income | — | — | — | 2,101 | — | 2,101 | |||||||||||||||||
| Other comprehensive income (loss) | — | — | — | — | (183 | ) | (183 | ) | |||||||||||||||
| Common stock issued, stock-based compensation plans | 6 | — | 181 | — | — | 181 | |||||||||||||||||
| Stock-based compensation expense | — | — | 267 | — | — | 267 | |||||||||||||||||
| Repurchases of common stock | (17 | ) | — | (450 | ) | (811 | ) | — | (1,261 | ) | |||||||||||||
| Dividends declared, $0.80 per share | — | — | — | (471 | ) | — | (471 | ) | |||||||||||||||
| Balance, December 31, 2018 | 577 | $ | 6 | $ | 47 | $ | 11,485 | $ | (114 | ) | $ | 11,424 | |||||||||||
The accompanying notes are an integral part of the consolidated financial statements.
COGNIZANT TECHNOLOGY SOLUTIONS CORPORATION
CONSOLIDATED STATEMENTS OF CASH FLOWS
(in millions)
| Year Ended December 31, | Year Ended December 31, | |||||||||||||||||||||
| 2015 | 2014 | 2013 | 2018 | 2017 | 2016 | |||||||||||||||||
| Cash flows from operating activities: | ||||||||||||||||||||||
| Net income | $ | 1,623.6 | $ | 1,439.3 | $ | 1,228.6 | $ | 2,101 | $ | 1,504 | $ | 1,553 | ||||||||||
| Adjustments to reconcile net income to net cash provided by operating activities: | ||||||||||||||||||||||
| Depreciation and amortization | 330.0 | 208.1 | 179.9 | 498 | 443 | 379 | ||||||||||||||||
| Provision for doubtful accounts | 10.2 | 4.7 | 3.6 | 13 | 15 | 12 | ||||||||||||||||
| Deferred income taxes | (126.1 | ) | (99.6 | ) | (88.2 | ) | 8 | 124 | (91 | ) | ||||||||||||
| Stock-based compensation expense | 192.0 | 134.8 | 118.8 | 267 | 221 | 217 | ||||||||||||||||
| Excess tax benefits on stock-based compensation plans | (33.7 | ) | (23.6 | ) | (30.6 | ) | ||||||||||||||||
| Other | 48.6 | 30.3 | 52.6 | 112 | (86 | ) | 46 | |||||||||||||||
| Changes in assets and liabilities: | ||||||||||||||||||||||
| Trade accounts receivable | (322.4 | ) | (259.3 | ) | (258.5 | ) | (365 | ) | (249 | ) | (330 | ) | ||||||||||
| Other current assets | (32.5 | ) | (118.6 | ) | (74.7 | ) | 216 | (181 | ) | (104 | ) | |||||||||||
| Other noncurrent assets | (38.6 | ) | 19.1 | (24.3 | ) | (224 | ) | (89 | ) | (59 | ) | |||||||||||
| Accounts payable | 19.4 | 25.7 | (12.1 | ) | (4 | ) | 16 | 6 | ||||||||||||||
| Deferred revenues, current and noncurrent | 49.7 | 70.6 | 15.2 | |||||||||||||||||||
| Deferred revenue, current and noncurrent | (86 | ) | 18 | (38 | ) | |||||||||||||||||
| Other current and noncurrent liabilities | 433.1 | 41.5 | 313.5 | 56 | 671 | 54 | ||||||||||||||||
| Net cash provided by operating activities | 2,153.3 | 1,473.0 | 1,423.8 | 2,592 | 2,407 | 1,645 | ||||||||||||||||
| Cash flows from investing activities: | ||||||||||||||||||||||
| Purchases of property and equipment | (272.8 | ) | (212.2 | ) | (261.6 | ) | (377 | ) | (284 | ) | (300 | ) | ||||||||||
| Purchases of investments | (3,003.7 | ) | (2,497.3 | ) | (1,848.8 | ) | ||||||||||||||||
| Proceeds from maturity or sale of investments | 1,907.6 | 2,240.2 | 1,573.4 | |||||||||||||||||||
| Business combinations, net of cash acquired | (1.7 | ) | (2,691.4 | ) | (193.8 | ) | ||||||||||||||||
| Purchases of available-for-sale investment securities | (1,630 | ) | (3,120 | ) | (4,231 | ) | ||||||||||||||||
| Proceeds from maturity or sale of available-for-sale investment securities | 1,838 | 3,404 | 3,982 | |||||||||||||||||||
| Purchases of held-to-maturity investment securities | (1,363 | ) | (1,221 | ) | (54 | ) | ||||||||||||||||
| Proceeds from maturity of held-to-maturity investment securities | 1,164 | 404 | 15 | |||||||||||||||||||
| Purchases of other investments | (513 | ) | (385 | ) | (884 | ) | ||||||||||||||||
| Proceeds from maturity or sale of other investments | 365 | 836 | 843 | |||||||||||||||||||
| Payments for business combinations, net of cash acquired, and equity and cost method investments | (1,111 | ) | (216 | ) | (334 | ) | ||||||||||||||||
| Net cash (used in) investing activities | (1,370.6 | ) | (3,160.7 | ) | (730.8 | ) | (1,627 | ) | (582 | ) | (963 | ) | ||||||||||
| Cash flows from financing activities: | ||||||||||||||||||||||
| Issuance of common stock under stock-based compensation plans | 131.6 | 101.4 | 117.5 | 181 | 189 | 176 | ||||||||||||||||
| Excess tax benefits on stock-based compensation plans | 33.7 | 23.6 | 30.6 | |||||||||||||||||||
| Repurchases of common stock | (460.0 | ) | (248.3 | ) | (179.0 | ) | (1,261 | ) | (1,889 | ) | (512 | ) | ||||||||||
| Proceeds from term loan borrowings | — | 1,000.0 | — | |||||||||||||||||||
| Debt issuance costs | — | (9.1 | ) | — | ||||||||||||||||||
| Repayment of term loan borrowings and capital lease obligations | (53.4 | ) | (14.2 | ) | — | (91 | ) | (95 | ) | (57 | ) | |||||||||||
| Net change in notes outstanding under the revolving credit facility | (300.0 | ) | 650.0 | — | (75 | ) | 75 | (350 | ) | |||||||||||||
| Net cash (used in) provided by financing activities | (648.1 | ) | 1,503.4 | (30.9 | ) | |||||||||||||||||
| Proceeds from debt modification | 25 | — | — | |||||||||||||||||||
| Debt issuance costs | (4 | ) | — | — | ||||||||||||||||||
| Dividends paid | (468 | ) | (265 | ) | — | |||||||||||||||||
| Net cash (used in) financing activities | (1,693 | ) | (1,985 | ) | (743 | ) | ||||||||||||||||
| Effect of exchange rate changes on cash and cash equivalents | (19.5 | ) | (18.6 | ) | (19.2 | ) | (36 | ) | 51 | (30 | ) | |||||||||||
| Increase (decrease) in cash and cash equivalents | 115.1 | (202.9 | ) | 642.9 | ||||||||||||||||||
| (Decrease) in cash and cash equivalents | (764 | ) | (109 | ) | (91 | ) | ||||||||||||||||
| Cash and cash equivalents, beginning of year | 2,010.1 | 2,213.0 | 1,570.1 | 1,925 | 2,034 | 2,125 | ||||||||||||||||
| Cash and cash equivalents, end of period | $ | 2,125.2 | $ | 2,010.1 | $ | 2,213.0 | $ | 1,161 | $ | 1,925 | $ | 2,034 | ||||||||||
| Supplemental information: | ||||||||||||||||||||||
| Cash paid for income taxes during the year | $ | 578.6 | $ | 558.6 | $ | 481.0 | $ | 597 | $ | 587 | $ | 845 | ||||||||||
| Cash interest paid during the year | $ | 14.4 | $ | 0.1 | $ | — | $ | 21 | $ | 21 | $ | 16 | ||||||||||
The accompanying notes are an integral part of the consolidated financial statements.
COGNIZANT TECHNOLOGY SOLUTIONS CORPORATION
(Dollars in millions, except share data)
| Note 1 — Business Description and Summary of Significant Accounting Policies | ||||
The terms “Cognizant,” “we,” “our,” “us” and “the Company” refer to Cognizant Technology Solutions Corporation and its subsidiaries unless the context indicates otherwise.
Description of Business.We are a leading providerone of information technology (IT), consulting and business process services, dedicated to helping the world’s leading professional services companies, transforming clients’ business, operating and technology models for the digital era. Our industry-based, consultative approach helps customers envision, build strongerand run more innovative and efficient businesses. Our clients engage us to help them operate more efficiently, provideservices include digital services and solutions, to critical business and technology problems, and help them drive technology-based innovation and growth. Our core competencies include: business, process, operations and IT consulting, application development, and systems integration, enterprise information management, application testing, application maintenance, infrastructure services and business process services. Digital services are becoming an increasingly important part of our portfolio of services and solutions and are often integrated or delivered along with our other services. We tailor our services and solutions to specific industries and utilizeuse an integrated global delivery model. This seamless global sourcing model combines industry-specific expertise, clientthat employs customer service teams based on-site at the clientcustomer locations and delivery teams located at customer locations and dedicated near-shoreglobal and offshore globalregional delivery centers.
Basis of Presentation, and Principles of Consolidation and Use of Estimates.. The consolidated financial statements are presented in accordance with generally accepted accounting principles in the United States of America or U.S. GAAP,("GAAP") and reflect the consolidated financial position, results of operations, comprehensive income and cash flows of our consolidated subsidiaries for all periods presented. All intercompany balances and transactions have been eliminated in consolidation.
The preparation of financial statements requires management to make estimates and assumptions that affect the reported amounts in the consolidated financial statements and accompanying disclosures. We evaluate our estimates on a continuous basis. We base our estimates on historical experience and on various other assumptions that are believed to be reasonable under the circumstances. The actual amounts may vary from the estimates used in the preparation of the accompanying consolidated financial statements.
Cash and Cash Equivalents and Investments. Cash and cash equivalents consist of all cash balances, including money market funds and liquid instruments. Liquid instruments are classified as cash equivalents when their maturitiescertificates of deposits and commercial paper that have a maturity, at the date of purchase, are three monthsof 90 days or less and as short-term investments when their maturities at the date of purchase are greater than three months.less.
We determine the appropriate classification of our investments in marketable securities at the date of purchase and reevaluate such designation at each balance sheet date. We have classified and accounted for our marketable debt securities as available-for-sale.either available-for-sale or held-to-maturity. After consideration of our risk versus reward objectives, as well as our liquidity requirements, we may sell theseour available-for-sale securities prior to their stated maturities. As we viewWe classify these marketable securities as available to support current operations, we classify such securities with maturities at the date of purchase beyond twelve months90 days as short-term investments based on their highly liquid nature and because such investmentsmarketable securities represent an investment inof cash that is available for current operations. Our held-to-maturity investment securities are financial instruments for which we have the intent and ability to hold to maturity and we classify these securities with maturities less than one year as short-term investments. Any held-to-maturity investment securities with maturities beyond one year from the balance sheet date are classified as noncurrent.
Available-for-sale securities are reported at fair value with changes in unrealized gains and losses recorded as a separate component of accumulated other comprehensive income (loss) until realized. We determine the cost of the securities sold based on the specific identification method. Held-to-maturity securities are reported at amortized cost. Time deposits with financial institutions are valued at cost, which approximates fair value.
Interest and amortization of premiums and discounts for debt securities are included in interest income. We alsoOn a quarterly basis, we evaluate our available-for-sale and held-to-maturity investments periodically for possible other-than-temporary impairment by reviewing factors such asquantitative and qualitative factors. If we do not intend to sell the lengthsecurity or it is not more likely than not that we will be required to sell the security before recovery of timeour amortized cost, we evaluate quantitative and extentqualitative criteria to whichdetermine whether we expect to recover the amortized cost basis of the security. If we do not expect to recover the entire amortized cost basis of the security, we consider the security to be other-than-temporarily impaired and we record the difference between the security’s amortized cost basis and its recoverable amount in earnings and the difference between the security’s recoverable amount and fair value has been below cost basis, the financial condition of the issuer, whetherin other comprehensive income. If we intend to sell the security and whetheror it is more likely than not that we will be required to sell the security prior tobefore recovery of its amortized cost basis. Once a decline inbasis, the security is also considered other-than-temporarily impaired and we recognize the entire difference between the security’s amortized cost basis and its fair value is determined to be other-than-temporary, an impairment charge is generally recorded to income and a new cost basis in the investment is established.
Short-term Financial Assets and Liabilities. Cash and certain cash equivalents, trade receivables, accounts payable and other accrued liabilities are short-term in nature and, accordingly, their carrying values approximate fair value.
Property and EquipmentEquipment.. Property and equipment are stated at cost, net of accumulated depreciation. Depreciation is calculated on a straight-line basis over the estimated useful lives of the assets. Leasehold improvements are amortized on a straight-line basis over the shorter of the term of the lease or the estimated useful life of the improvement. In India, leasehold
land is leased by us from the government of India with lease terms ranging up to 99 years. Lease payments are made at the inception of the lease agreement and amortized over the lease term. Maintenance and repairs are expensed as incurred, while renewals and betterments are capitalized. Deposits paid towards acquisition of long-lived assets and the cost of assets not put in use before the balance sheet date are disclosed under the caption “capital work-in-progress”"Capital work-in-progress" in Note 4.7.
Internal Use SoftwareSoftware.. We capitalize certain costs that are incurred to purchase, develop and implement internal-use software during the application development phase, which primarily include coding, testing and certain data conversion activities. Capitalized costs are amortized on a straight-line basis over the useful life of the software. Costs incurred in performing activities associated with the preliminary project phaseplanning and the post-implementation phaseactivities are expensed as incurred.
Software to be Sold, Leased or Marketed. We capitalize costs incurred after technological feasibility is reached but before software is available for general release to customers, which primarily include coding and testing activities.Once the product is ready for general release, capitalized costs are amortized over the useful life of the software.
Business CombinationsCombinations.. We account for business combinations using the acquisition method, which requires the identification of the acquirer, the determination of the acquisition date and the allocation of the purchase price paid by the acquirer to the identifiable tangible and intangible assets acquired, the liabilities assumed, including any contingent consideration and any noncontrolling interest in the acquiree at their acquisition date fair values. Goodwill represents the excess of the purchase price over the fair value of net assets acquired, including the amount assigned to identifiable intangible assets. Identifiable intangible assets with finite lives are amortized over their useful lives. Acquisition-related costs are expensed in the periods in which the costs are incurred. The results of operations of acquired businesses are included in our consolidated financial statements from the acquisition date.
Equity Method Investments. Equity investments that give us the ability to exercise significant influence, but not control, over an investee are accounted for using the equity method of accounting and recorded in the caption "Long-term investments" on our consolidated statements of financial position. Equity method investments are initially recorded at cost. We periodically review the carrying value of our equity method investments to determine if there has been an other-than-temporary decline in carrying value. The Company's proportionate share of the net income or loss of the investee is recorded in the caption "Income from equity method investments" on our consolidated statements of operations. The investment balance is increased or decreased for cash contributions or distributions to or from these investees.
Long-lived Assets and Finite-lived IntangiblesIntangible Assets.. We review long-lived assets and certain finite-lived identifiable intangibles for impairment whenever events or changes in circumstances indicate that the carrying amount of an asset may not be recoverable. We recognize an impairment loss when the sum of undiscounted expected future cash flows is less than the carrying amount of such assets. The impairment loss would equalis determined as the amount by which the carrying amount of the asset exceeds the fair value of the asset. Intangible assets consist primarily of customer relationships and developed technology, which are being amortized on a straight-line basis over their estimated useful lives.
Goodwill and Indefinite-lived IntangiblesIntangible Assets.. We evaluate goodwill and indefinite-lived intangible assets for impairment at least annually, or as circumstances warrant. Goodwill is evaluated at the reporting unit level by comparing the fair value of the reporting unit with its carrying amount.amount including goodwill. An impairment of goodwill exists if the carrying amount of the reporting unit exceeds its fair value. The impairment loss is the amount by which the carrying amount exceeds the reporting unit’s fair value, limited to the total amount of goodwill allocated to that reporting unit. For indefinite-lived intangible assets, if our annual qualitative assessment indicates possible impairment,that it is more-likely-than-not that an indefinite-lived intangible asset is impaired, we test the assets for impairment by comparing the fair value of such assets to their carrying value. In determining the fair value, we utilize various estimates and assumptions, including discount rates and projections of future cash flows. If an impairment is indicated, a write down to the implied fair value of goodwill or fair value of indefinite-lived intangible asset is recorded.
Stock Repurchase Program. Our existingUnder the Board of Directors authorized stock repurchase program, as amended and approved by our Board of Directors, allows for the Company is authorized to repurchase of $2,000.0 million of our outstanding shares ofits Class A common stock and expires on December 31, 2017. Through December 31, 2015, we completedthrough open market purchases, including under a trading plan adopted pursuant to Rule 10b5-1 of the Exchange Act, or in private transactions, including through accelerated stock repurchases of 41.2 millionrepurchase agreements ("ASRs") entered into with financial institutions, in accordance with applicable federal securities laws. We account for the repurchased shares for $1,562.4 million, inclusive of fees and expenses, under this program. During 2015, 2014 and 2013, we repurchased 6.0 million, 3.8 million and 4.1 million shares respectively, at an aggregate cost of $376.0 million, $188.2 million and $131.6 million, respectively. Additional stock repurchases were made in connection with our stock-based compensation plans, whereby Company shares were tendered by employees for payment of applicable statutory tax withholdings. During 2015, 2014 and 2013 such repurchases totaled 1.3 million, 1.2 million and 1.2 million shares, respectively, at an aggregate cost of $84.0 million, $60.1 million and $47.4 million, respectively. At the time of repurchase, sharesas constructively retired. Shares are returned to the status of authorized and unissued shares.shares at the time of repurchase or in the periods they are delivered, if repurchased under an ASR. To reflect share repurchases in the consolidated statements of financial position, we (1) reduce common stock for the par value of the shares, (2) reduce additional paid-in capital for the amount in excess
of par during the period in which the shares are repurchased and (3) record any residual amount in excess of available additional paid-in capital to retained earnings. Upfront payments related to ASRs are accounted for as a reduction to stockholders’ equity in the consolidated statements of financial position in the period the payments are made.
Revenue Recognition. We recognize revenues as we transfer control of deliverables (products, solutions and services) to our customers in an amount reflecting the consideration to which we expect to be entitled. To recognize revenues, we apply the following five step approach: (1) identify the contract with a customer, (2) identify the performance obligations in the contract, (3) determine the transaction price, (4) allocate the transaction price to the performance obligations in the contract, and (5) recognize revenues when a performance obligation is satisfied. We account for a contract when it has approval and commitment from all parties, the repurchases as constructively retiredrights of the parties are identified, payment terms are identified, the contract has commercial substance and record such repurchases ascollectability of consideration is probable. We apply judgment in determining the customer’s ability and intention to pay based on a reductionvariety of Class A common stock and additional paid-in capital.factors including the customer’s historical payment experience.
Revenues related to fixed-price contracts for highly complex application development and systems integration services, consulting or other technology services are recognized as the service is performed using the percentage of completioncost to cost method, of accounting, under which the total value of revenuerevenues is recognized on the basis of the percentage that each contract’s total labor cost to date bears to the total expected labor costs (cost to cost method). Revenues related to fixed price outsourcing services are recognized on a straight-line basis unless revenues are earned and obligations are fulfilled in a different pattern.costs. Revenues related to fixed-price contracts for consulting or other ITapplication maintenance, testing and business process services are recognized asbased on our right to invoice for services are performed on a proportional performance basis based uponfor contracts in which the level of effort.
Revenues related to our time-and-materials, transaction-based or volume-based contracts are recognized over the period the services are provided either using an output method such as labor hours, or a method that is otherwise consistent with the way in which value is delivered to the customer.
Revenues related to our non-hosted software license arrangements that do not require significant modification or customization of the underlying software revenue isare recognized when the software is delivered and all other software revenue recognition criteria are met.as control is transferred at a point in time. For software license arrangements that require significant functionality enhancements or modification of the software, revenuerevenues for the software license and thoserelated services isare recognized as thosethe services are performed. Forperformed in accordance with the methods applicable to application development and systems integration services described above. In software hosting arrangements, the rights provided to the customer, such as ownership of a license, arrangements that includecontract termination provisions and the feasibility of the client to operate the software, are considered in determining whether the arrangement includes a rightlicense or a service. Sales and usage-based fees promised in exchange for licenses of intellectual property are not recognized as revenue until the uncertainty related to use the product forvariable amounts is resolved. Revenues related to software maintenance and support are generally recognized on a defined period of time, we recognize revenue ratablystraight-line basis over the termcontract period.
Incentive revenues, volume discounts, or any other form of variable consideration is estimated using either the license.sum of probability weighted amounts in a range of possible consideration amounts (expected value), or the single most likely amount in a range of possible consideration amounts (most likely amount), depending on which method better predicts the amount of consideration to which we may be entitled. We include in the transaction price variable consideration only to the extent it is probable that a significant reversal of revenues recognized will not occur when the uncertainty associated with the variable consideration is resolved. Our estimates of variable consideration and determination of whether to include estimated amounts in the transaction price may involve judgment and are based largely on an assessment of our anticipated performance and all information that is reasonably available to us.
Revenues also include the reimbursement of out-of-pocket expenses. Our warranties generally provide a customer with assurance that the related deliverable will function as the parties intended because it complies with agreed-upon specifications and is therefore not considered an additional performance obligation in the contract.
We may enter into arrangements with customers that purchase both software licenses and software-related services from us at the same time, or within close proximityconsist of one another (referred to as software-related multiple-element arrangements).multiple performance obligations. Such software related multiple-element arrangements may include software licenses, software license updates, product support contracts and other software-related services. For those software related multiple-element arrangements,any combination of our deliverables. To the extent a contract includes multiple promised deliverables, we apply the residual methodjudgment to determine whether promised deliverables are capable of being distinct and are distinct in the amountcontext of software license revenue. Under the residual method, if VSOE of fair value existscontract. If these criteria are not met, the promised deliverables are accounted for undelivered elements inas a multiple-element arrangement, revenue equalcombined performance obligation. For arrangements with multiple distinct performance obligations, we allocate consideration among the performance obligations based on their relative standalone selling price. Standalone selling price is the price at which we would sell a promised good or service separately to the fair value ofcustomer. When not directly observable, we typically estimate standalone selling price by using the undelivered elementsexpected cost plus a margin approach. We typically establish a standalone selling price range for our deliverables, which is deferred with the remaining portion of the arrangement consideration generally recognized upon delivery of the software license. For arrangements in which VSOE of fair value does not exist for each software-related undelivered element, revenue for the software license is deferredreassessed on a periodic basis or when facts and not recognized until VSOE of fair value is available for the undelivered element or delivery of each element has occurred. If the only undelivered element is a service, revenue from the delivered element is recognized over the service period.circumstances change.
We alsoassess the timing of the transfer of goods or services to the customer as compared to the timing of payments to determine whether a significant financing component exists. As a practical expedient, we do not assess the existence of a significant financing component when the difference between payment and transfer of deliverables is a year or less. If the difference in timing arises for reasons other than the provision of finance to either the customer or us, no financing component is deemed to exist. The primary purpose of our invoicing terms is to provide customers with simplified and predictable ways of purchasing our services, not to receive or provide financing from or to customers. We do not consider set up or transition fees paid upfront by our customers to represent a financing component, as such fees are required to encourage customer commitment to the project and protect us from early termination of the contract.
Our contracts may be modified to add, remove or change existing performance obligations. The accounting for modifications to our contracts involves assessing whether the services added to an existing contract are distinct and whether the pricing is at the standalone selling price. Services added that are not distinct are accounted for on a cumulative catch up basis, while those that are distinct are accounted for prospectively, either as a separate contract if the additional services are priced at the standalone selling price, or as a termination of the existing contract and creation of a new contract if not priced at the standalone selling price. Services added to our application development and systems integration service contracts are typically not distinct, while services added to our other contracts, including application maintenance, testing and business process services contracts, are typically distinct.
From time to time, we may enter into multiple-element arrangements that may include a combination of software licenses and various software-related and non-software-relatedwith third party suppliers to resell products or services. In such arrangements,cases, we evaluate whether we are the principal (i.e., report revenues on a gross basis) or agent (i.e., report revenues on a net basis). In doing so, we first allocateevaluate whether we control the totalgood or service before it is transferred to the customer. If we control the good or service before it is transferred to the customer, we are the principal; if not, we are the agent. Determining whether we control the good or service before it is transferred to the customer may require judgment.
Prior to the adoption of ASC 606 on January 1, 2018, revenues were earned and recognized when all of the following criteria were met: evidence of an arrangement existed, the price was fixed or determinable, the services had been rendered and collectability was reasonably assured. Contingent or incentive revenues were recognized when the contingency was satisfied and we concluded the amounts were earned. Volume discounts were recorded as a reduction of revenues as services were provided. Revenues also included the reimbursement of out-of-pocket expenses.
Trade Receivables, Contract Assets and Contract Liabilities. We classify our right to consideration in exchange for deliverables as either a receivable or a contract asset. A receivable is a right to consideration that is unconditional (i.e., only the passage of time is required before payment is due). For example, we recognize a receivable for revenues related to our time and materials and transaction or volume-based contracts when earned regardless of whether amounts have been billed. We present such receivables in "Trade accounts receivable, net" in our consolidated statements of financial position at their net estimated realizable value. A contract asset is a right to consideration that is conditional upon factors other than the passage of time. Contract assets are presented in "Other current assets" in our consolidated statements of financial position and primarily relate to unbilled amounts on fixed-price contracts utilizing the cost to cost method of revenue recognition. Our contract liabilities, or deferred revenue, consist of advance payments and billings in excess of revenues recognized. We classify deferred revenue as current or noncurrent based on relative selling prices,the timing of when we expect to recognize the revenues. The noncurrent portion of deferred revenue is included in "Other noncurrent liabilities" in our consolidated statements of financial position.
Our contract assets and liabilities are reported on a net basis by contract at the end of each reporting period. The difference between the software groupopening and closing balances of elementsour contract assets and deferred revenues primarily results from the timing difference between our performance obligations and the non-software groupcustomer’s payment. We receive payments from customers based on the terms established in our contracts, which vary by contract type.
Allowance for Doubtful Accounts. We maintain an allowance for doubtful accounts to provide for the estimated amount of elements.receivables that may not be collected. The allowance is based upon an assessment of customer creditworthiness, historical payment experience, the age of outstanding receivables and other applicable factors. We then further allocate consideration withinevaluate the software groupcollectability of our trade accounts receivable on an on-going basis and write off accounts when they are deemed to be uncollectable.
Cost to Fulfill. Recurring operating costs for contracts with customers are recognized as incurred. Certain eligible, nonrecurring costs incurred in the initial phases of our contracts (i.e., set-up or transition costs) are capitalized when such costs (1) relate directly to the respective elements withincontract, (2) generate or enhance resources of the Company that group followingwill be used in satisfying the software-related multiple-element arrangements policies described above. For the non-software group of elements, we further allocate consideration to the respective elements based on relative selling prices. After the arrangement consideration has been allocated to the individual elements, we account for each respective elementperformance obligation in the arrangement as described above.future, and (3) are expected to be recovered. These costs are expensed ratably over the estimated life of the customer relationship, including expected contract renewals. In determining the estimated life of the customer relationship, we evaluate the average contract term, on a portfolio basis by nature of the services to be provided, and apply judgment to evaluate the rate of technological and industry change. Capitalized amounts are monitored regularly for impairment. Impairment losses are recorded when projected remaining undiscounted operating cash flows are not sufficient to recover the carrying amount of the capitalized costs to fulfill.
Stock-Based Compensation. Stock-based compensation expense for awards of equity instruments to employees and non-employee directors is determined based on the grant-dategrant date fair value of those awards. We recognize these compensation costs net of an estimated forfeiture rate over the requisite service period of the award. Forfeitures are estimated on the date of grant and revised if actual or expected forfeiture activity differs materially from original estimates.
Foreign CurrencyCurrency.. The assets and liabilities of our foreign subsidiaries whose functional currency is not the U.S. dollar are translated into U.S. dollars from localfunctional currencies at current exchange rates andwhile revenues and expenses are translated from localfunctional currencies at average monthly exchange rates. The resulting translation adjustments are recorded in accumulatedthe caption "Accumulated other comprehensive income (loss)" on the accompanying consolidated statements of financial position.
Foreign currency transactions and balances are those that are denominated in a currency other than the subsidiary’s functional currency. The subsidiary's functional currency is the currency of the primary economic environment in which the subsidiary operates. The U.S. dollar is the functional currency for certainsome of our foreign subsidiaries who conduct business predominantly in U.S. dollars.subsidiaries. For these subsidiaries, transactions and balances denominated in the local currency are foreign currency transactions. Foreign currency transactions and balances related to non-monetary assets and liabilities are remeasured to the functional currency of the subsidiary at historical exchange rates while monetary assets and liabilities are remeasured to the functional currency of the subsidiary at current exchange rates. Foreign currency exchange gains or losses from remeasurement are included in the caption "Foreign currency exchange gain (losses), net" line on our consolidated statementstatements of operations together with gains or losses on our undesignated foreign currency hedges.
Derivative Financial Instruments. Derivative financial instruments are accounted for in accordance with the authoritative guidance which requires that each derivative instrument be recorded on the balance sheetour consolidated statements of financial position as either an asset or liability measured at its fair value as of the reporting date. Our derivative financial instruments consist of foreign exchange forward contracts. For derivative financial instruments to qualify for hedge accounting, the following criteria must be met: (1) the hedging instrument must be designated as a hedge; (2) the hedged exposure must be specifically identifiable and must expose us to risk; and (3) it ismust be expected that a change in fair value of the derivative financial instrument and an opposite change in the fair value of the hedged exposure will have a high degree of correlation. The authoritative guidance requires that changesChanges in our derivatives’ fair values beare recognized in net income unless specific hedge accounting and documentation criteria are met (i.e., the instruments are designated and accounted for as hedges). We record the effective portion of the unrealized gains and losses on our derivative financial instruments that are designated as cash flow hedges in accumulatedthe caption "Accumulated other comprehensive income (loss)" in the accompanying consolidated statements of financial position. Any ineffectiveness or excluded portion of a designated cash flow hedge is recognized in net income. Upon settlement or maturityoccurrence of the cash flow hedge contracts,hedged transaction, the realized gains and losses on the derivative are recognized in net income.
Income Taxes. We provide for income taxes utilizing the asset and liability method of accounting. Under this method, deferred income taxes are recorded to reflect the tax consequences in future years of differences between the tax basis of assets and liabilities and their financial reporting amounts at each balance sheet date, based on enacted tax laws and statutory tax rates applicable to the periods in which the differences are expected to affect taxable income. If it is determined that it is more likely than not that future tax benefits associated with a deferred income tax asset will not be realized, a valuation allowance is provided. The effect of a change in tax rates on deferred income tax assets and liabilities of a change in the tax rates is recognized in the provision for income taxes in the period that includes the enactment date. TaxBeginning in 2017, the differences between actual tax benefits earnedrealized on employee stock awards and estimated tax benefits at date of grant are adjusted to our provision for income taxes upon vesting or exercise of employeethe stock options in excess of compensation charged to income are credited to additional paid-in capital. award.
Our provision for income taxes also includes the impact of provisions established for uncertain income tax positions, as well as any related penalties and interest. We adjust these reserves in light of changing facts and circumstances, such as the related interest.closing of
a tax audit. To the extent that the final outcome of these matters differs from the amounts recorded, such differences will impact the provision for income taxes in the period in which such determination is made.
Earnings Per Share or EPS.("EPS"). Basic EPS excludes dilution and is computed by dividing earnings available to common stockholders by the weighted-average number of common shares outstanding for the period. Diluted EPS includes all potential dilutive common stock in the weighted average shares outstanding. For purposes of computing diluted earnings per share for the years ended December 31, 2015, 2014 and 2013, respectively, 4.2 million, 4.4 million and 5.7 million shares were assumed to have been outstanding related to common share equivalents. We exclude from the calculation of diluted EPS options with exercise prices that are greater than the average market price and shares related to stock-based awards whose combined exercise price and unamortized fair value and excess tax benefits were greater in each of those periods than the average market price of our common stock for the period, because their effect would be anti-dilutive. We excluded 0.1less than 1 million of anti-dilutive shares in 2015, 2014each of 2018, 2017 and 20132016 from our diluted EPS calculation. We include performance stock unit awards in the dilutive potential common shares when they become contingently issuable per the authoritative guidance and exclude the awards when they are not contingently issuable.
Recently Adopted Accounting Pronouncement.Pronouncements
| Date Issued and Topic | Date Adopted and Method | Description | Impact |
| May 2014 Revenue | January 1, 2018 Modified Retrospective | The new standard, as amended, sets forth a single comprehensive model for recognizing and reporting revenues. The standard also requires additional financial statement disclosures that enable users to understand the nature, amount, timing and uncertainty of revenues and cash flows relating to customer contracts. The standard allows for two methods of adoption: the full retrospective adoption, which requires the standard to be applied to each prior period presented, or the modified retrospective adoption, which requires the cumulative effect of adoption to be recognized as an adjustment to opening retained earnings in the period of adoption. | See Note 3 for the impact of adoption of this standard. |
November 2016 Statement of Cash Flows | January 1, 2018 Retrospective | This update requires restricted cash to be included with cash and cash equivalents when reconciling the beginning and ending amounts on the statement of cash flows. It also requires a reconciliation of such totals to the amounts on the statement of financial position and disclosure as to the nature of the restrictions. | There were no restricted cash balances as of December 31, 2018. The adoption of this update had no impact on our financial statements for the year ended December 31, 2018. |
| February 2018 Income Statement - Reporting Comprehensive Income | January 1, 2018 In the period of adoption | This update provides an option for entities to reclassify stranded tax effects caused by the recently-enacted Tax Cuts and Jobs Act ("Tax Reform Act") from accumulated other comprehensive income to retained earnings. | We have early adopted this update as of January 1, 2018. The adoption resulted in a decrease of $1 million in accumulated other comprehensive income and a corresponding increase of $1 million to opening retained earnings. |
New Accounting Pronouncements
| Date Issued and Topic | Effective Date | Description | Impact |
February 2016 Leases | January 1, 2019 | The new standard replaces the existing guidance on leases and requires the lessee to recognize a right-of-use ("ROU") asset and a lease liability for all leases with lease terms equal to or greater than twelve months. For finance leases, the lessee would recognize interest expense and amortization of the ROU asset, and for operating leases, the lessee would recognize total lease expense on a straight-line basis. The standard offers several practical expedients for transition and certain expedients specific to lessees or lessors. The standard allows for two methods of adoption: retrospective to each prior reporting period presented with the cumulative effect of adoption recognized at the beginning of the earliest period presented or retrospective to the beginning of the period of adoption through a cumulative-effect adjustment (the effective date method). | We expect to adopt the new standard on January 1, 2019 using the effective date method. Upon adoption, we expect to recognize additional lease assets and liabilities of approximately $750 million to $800 million. We intend to elect the package of practical expedients that permits us not to reassess prior conclusions related to contracts containing leases, lease classification and initial direct costs. We do not expect to elect the use of the hindsight practical expedient. The new standard also provides practical expedients for an entity’s ongoing accounting. We expect to elect the short-term lease recognition exemption. This means, for those leases that qualify, we will not recognize ROU assets or lease liabilities in transition or on an ongoing basis. We also expect to elect the practical expedient that permits us not to separate lease and non-lease components for all of our leases. |
| March 2017 Nonrefundable Fees and Other Costs | January 1, 2019 | This update shortens the amortization period for certain callable debt securities held at a premium to the earliest call date. The amendments do not require an accounting change for securities held at a discount. Upon adoption, entities will be required to use a modified retrospective transition with the cumulative effect adjustment recognized to retained earnings as of the beginning of the period of adoption. | We do not expect the adoption of this update to have a material impact on our financial statements. |
August 2018 Customer’s Accounting for Implementation Costs Incurred in a Cloud Computing Arrangement ("CCA") that is a Service Contract | January 1, 2020 | This update aligns the accounting for costs incurred to implement a CCA that is a service arrangement with the guidance on capitalizing costs associated with developing or obtaining internal-use software. The update clarifies that a customer should capitalize certain implementation costs and subsequently amortize such costs over the term of the hosting arrangement as operating expenses. | We do not expect the adoption of this update to have a material impact on our financial statements. |
| Note 2 — Internal Investigation and Related Matters | ||||
In November 2015,February 2019, we completed our internal investigation focused on whether certain payments relating to Company-owned facilities in India were made improperly and in violation of the FinancialU.S. Foreign Corrupt Practices Act ("FCPA") and other applicable laws. The investigation was conducted under the oversight of the Audit Committee, with the assistance of outside counsel. During the year ended December 31, 2016, we recorded out-of-period corrections related to $4 million of potentially improper payments between 2009 and 2016 that had been previously capitalized when they should have been expensed. These out-of-period corrections were not material to any previously issued financial statements. There were no adjustments recorded during 2018 and 2017 related to the amounts then under investigation.
On February 15, 2019, we announced a resolution of the previously disclosed investigations by the U.S. Department of Justice ("DOJ") and the U.S. Securities and Exchange Commission ("SEC") into the matters that were the subject of our internal investigation. The resolution required the Company to pay approximately $28 million to the DOJ and SEC, an amount
consistent with the Company’s accrual ("FCPA Accrual") recorded during the quarter ended September 30, 2018 and reflected in the caption "Accrued expenses and other current liabilities" in our consolidated statement of financial position.
| Note 3 — Revenues | ||||
Adoption of Accounting Standards Board, or FASB, issued an updateCodification ("ASC") Topic 606, “Revenue from Contracts with Customers” ("New Revenue Standard")
On January 1, 2018, we adopted the New Revenue Standard using the modified retrospective method applied to the standard on income taxes pertaining to the balance sheet classificationcontracts that were not completed as of deferred income taxes. The update requires that all deferred income tax assets and liabilities, along with any related valuation allowance, within each tax jurisdiction be classified as noncurrent on the balance sheet. As a result, each tax jurisdiction will only have one net noncurrent deferred income tax asset or liability. This guidance is effective on either a prospective or retrospective basisJanuary 1, 2018. Results for fiscal years, and interimreporting periods within those years, beginning on or after January 1, 20172018 are presented under the New Revenue Standard, while prior period amounts are not adjusted and continue to be reported in accordance with earlyour historic accounting policies. For contracts that were modified before the effective date, the Company aggregated the effect of all contract modifications prior to identifying performance obligations and allocating transaction price in accordance with the practical expedient ASC 606-10-65-1-(f)-4. Upon adoption permitted. We electedof the New Revenue Standard on January 1, 2018, we recorded a net increase to early adopt this guidance retrospectivelyopening retained earnings of approximately $121 million, after a tax impact of $37 million. The impact of adoption primarily relates to (1) changes in the fourth quartermethod used to measure progress on our fixed-price application maintenance, consulting and business process services contracts, (2) the longer period of 2015. We conformed prior years' presentationamortization for costs to current year's presentationfulfill a contract, (3) the timing of revenue recognition and allocation of purchase price on our software license contracts, (4) the reclassification of balances representing receivables, as defined by the New Revenue Standard, from "Unbilled accounts receivable" to "Trade accounts receivable, net" in our consolidated statement of financial position. There is no impact onposition, (5) the reclassification of balances representing contract assets, as defined by the New Revenue Standard, from "Unbilled accounts receivable" to "Other current assets" in our consolidated statement of operations.financial position, as well as (6) the income tax impact of the above items, as applicable.
The following tables compare the financial statement line items materially affected by the adoption of the New Accounting Pronouncements.Revenue Standard as of and for the year ended December 31, 2018 to the pro-forma amounts had the previous guidance been in effect ("Pro-forma Amounts"):
| December 31, 2018 | ||||||||||||
| As Reported | Pro-forma Amounts | Impacts of the New Revenue Standard | ||||||||||
| (in millions) | ||||||||||||
| Assets: | ||||||||||||
Trade accounts receivable, net(1), (2) | $ | 3,257 | $ | 3,115 | $ | 142 | ||||||
Unbilled accounts receivable(1), (3) | — | 485 | (485 | ) | ||||||||
Other current assets(2), (3) | 909 | 604 | 305 | |||||||||
| Total current assets | (38 | ) | ||||||||||
Other noncurrent assets(4) | 689 | 615 | 74 | |||||||||
| Total assets | $ | 36 | ||||||||||
| Liabilities: | ||||||||||||
Deferred revenue, current(2) | $ | 286 | $ | 498 | $ | (212 | ) | |||||
| Total current liabilities | (212 | ) | ||||||||||
Deferred revenue, noncurrent(2) | 62 | 108 | (46 | ) | ||||||||
Deferred income tax liabilities, net(5) | 183 | 118 | 65 | |||||||||
| Total liabilities | (193 | ) | ||||||||||
| Stockholders’ equity: | ||||||||||||
| Retained earnings | 11,485 | 11,256 | 229 | |||||||||
| Total stockholders’ equity | 229 | |||||||||||
| Total liabilities and stockholders’ equity | $ | 36 | ||||||||||
| Year Ended December 31, 2018 | ||||||||||||
| As Reported | Pro-forma Amounts | Impacts of the New Revenue Standard | ||||||||||
| (in millions) | ||||||||||||
Revenues(2) | $ | 16,125 | $ | 16,029 | $ | 96 | ||||||
Cost of revenues (4) | 9,838 | 9,876 | (38 | ) | ||||||||
| Selling, general and administrative expenses | 3,026 | 3,026 | — | |||||||||
| Depreciation and amortization expense | 460 | 460 | — | |||||||||
| Income from operations | 2,801 | 2,667 | 134 | |||||||||
| Other income (expense), net | (4 | ) | (5 | ) | 1 | |||||||
Income before provision for income taxes(5) | 2,797 | 2,662 | 135 | |||||||||
| Provision for income taxes | (698 | ) | (671 | ) | (27 | ) | ||||||
| Income (loss) from equity method investment | 2 | 2 | — | |||||||||
| Net income | $ | 2,101 | $ | 1,993 | $ | 108 | ||||||
| Basic earnings per share | $ | 3.61 | $ | 3.42 | $ | 0.19 | ||||||
| Diluted earnings per share | $ | 3.60 | $ | 3.41 | $ | 0.19 | ||||||
| (1) | Reflects the reclassification of balances representing receivables, as defined by the New Revenue Standard, from Unbilled accounts receivable to Trade accounts receivable, net. |
| (2) | Reflects the impact of changes in the method used to measure progress on our fixed-price application maintenance, consulting and business process services contracts and the timing of revenue recognition and allocation of purchase price on our software license contracts. |
| (3) | Reflects the reclassification of balances representing contract assets, as defined by the New Revenue Standard, from Unbilled accounts receivable to Other current assets. |
| (4) | Reflects the impact of a longer period of amortization for costs to fulfill a contract as well as a change in the methodology of assessing the recoverability of such costs. |
| (5) | Reflects the income tax impact of the above items. |
The following table presents information related to the FASB issuedcapitalized costs to fulfill, such as set-up or transition activities, for the year ended December 31, 2018. Costs to fulfill are recorded in Other noncurrent assets in our consolidated statements of financial position and the amortization expense of costs to fulfill is included in Cost of revenues in our consolidated statements of operations. Costs to obtain contracts were immaterial for the periods disclosed.
| Costs to Fulfill | ||||
| (in millions) | ||||
| Balance - January 1, 2018 | $ | 303 | ||
| Amortization expense | (70 | ) | ||
| Costs capitalized | 170 | |||
| Other | (3 | ) | ||
| Balance - December 31, 2018 | $ | 400 | ||
Contract Balances
A contract asset is a standardright to consideration that is conditional upon factors other than the passage of time. Contract assets are presented in Other current assets in our consolidated statements of financial position and primarily relate to unbilled amounts on fixed-price contracts utilizing the cost to cost method of revenue recognition. The table below shows significant movements in contract assets:
| Contract Assets | ||||
| (in millions) | ||||
| Balance - January 1, 2018 | $ | 306 | ||
| Revenues recognized during the period but not billed | 285 | |||
| Amounts reclassified to accounts receivable | (282 | ) | ||
| Other | (4 | ) | ||
| Balance - December 31, 2018 | $ | 305 | ||
The table below shows significant movements in the deferred revenue balances (current and noncurrent) for the period disclosed:
| Deferred Revenue | ||||
| (in millions) | ||||
| Balance - January 1, 2018 | $ | 431 | ||
| Amounts billed but not recognized as revenues | 204 | |||
| Revenues recognized related to the opening balance of deferred revenue | (284 | ) | ||
| Other | (3 | ) | ||
| Balance - December 31, 2018 | $ | 348 | ||
Revenues recognized during the year ended December 31, 2018 for performance obligations satisfied or partially satisfied in previous periods were immaterial.
Remaining Performance Obligations
As of December 31, 2018, the aggregate amount of transaction price allocated to remaining performance obligations, was $1,852 million, of which approximately 68% is expected to be recognized as revenues within 2 years. Disclosure is not required for performance obligations that meet any of the following criteria:
| (1) | contracts with a duration of one year or less as determined under ASC 606, |
| (2) | contracts for which we recognize revenues based on the right to invoice for services performed, |
| (3) | variable consideration allocated entirely to a wholly unsatisfied performance obligation or to a wholly unsatisfied promise to transfer a distinct good or service that forms part of a single performance obligation in accordance with ASC 606-10-25-14(b), for which the criteria in ASC 606-10-32-40 have been met, or |
| (4) | variable consideration in the form of a sales-based or usage based royalty promised in exchange for a license of intellectual property. |
Many of our performance obligations meet one or more of these exemptions and therefore are not included in the remaining performance obligation amount disclosed above.
Disaggregation of Revenues
The table below presents disaggregated revenues from contracts with customers. The new standard sets forth a single comprehensive modelcustomers by customer location, service line and contract-type for recognizing and reporting revenue. The standard also requires additional financial statement disclosures that will enable users to understandeach of our business segments. We believe this disaggregation best depicts how the nature, amount, timing and uncertainty of revenueour revenues and cash flows relating to customer contracts. In July 2015, the FASB deferred the effective date of the standard by one year to periods beginning on or after January 1, 2018. Early adoption is permitted but not before the original effective date of periods beginning on or after January 1, 2017. The standard allows for two methods of adoption: the full retrospective adoption, which requires the standard to be applied to each prior period presented, or the modified retrospective adoption, which requires the cumulative effect of adoption to be recognized as an adjustment to opening retained earnings in the period of adoption. We are currently evaluating the effect the new standard will have on our consolidated financial statements and related disclosures.
| Amount | ||||
| (in millions) | ||||
| Cash | $ | 170.5 | ||
| Trade accounts receivable | 83.1 | |||
| Unbilled accounts receivable | 32.5 | |||
| Other current assets | 11.2 | |||
| Property and equipment | 124.0 | |||
| Identifiable intangible assets | 849.0 | |||
| Other noncurrent assets | 14.8 | |||
| Accounts payable | (12.5 | ) | ||
| Deferred revenue | (48.3 | ) | ||
| Accrued expenses and other current liabilities | (118.3 | ) | ||
| Other noncurrent liabilities | (54.8 | ) | ||
| Deferred income tax liabilities, net | (209.0 | ) | ||
| Goodwill | 1,956.1 | |||
| Total purchase price | $ | 2,798.3 | ||
| Year Ended | ||||||||||||||||||||
| December 31, 2018 | ||||||||||||||||||||
| Financial Services | Healthcare | Products and Resources | Communications, Media and Technology | Total | ||||||||||||||||
| (in millions) | ||||||||||||||||||||
| Revenues | ||||||||||||||||||||
| Geography: | ||||||||||||||||||||
| North America | $ | 4,162 | $ | 4,254 | $ | 2,397 | $ | 1,480 | $ | 12,293 | ||||||||||
| United Kingdom | 481 | 91 | 358 | 344 | 1,274 | |||||||||||||||
| Rest of Europe | 666 | 270 | 440 | 187 | 1,563 | |||||||||||||||
| Europe - Total | 1,147 | 361 | 798 | 531 | 2,837 | |||||||||||||||
| Rest of World | 536 | 53 | 220 | 186 | 995 | |||||||||||||||
| Total | $ | 5,845 | $ | 4,668 | $ | 3,415 | $ | 2,197 | $ | 16,125 | ||||||||||
| Service line: | ||||||||||||||||||||
Consulting and technology services (1) | $ | 3,571 | $ | 2,553 | $ | 2,024 | $ | 1,161 | $ | 9,309 | ||||||||||
Outsourcing services (2) | 2,274 | 2,115 | 1,391 | 1,036 | 6,816 | |||||||||||||||
| Total | $ | 5,845 | $ | 4,668 | $ | 3,415 | $ | 2,197 | $ | 16,125 | ||||||||||
| Type of contract: | ||||||||||||||||||||
| Time and materials | $ | 3,762 | $ | 1,836 | $ | 1,506 | $ | 1,366 | $ | 8,470 | ||||||||||
| Fixed-price | 1,859 | 1,852 | 1,521 | 734 | 5,966 | |||||||||||||||
| Transaction or volume-based | 224 | 980 | 388 | 97 | 1,689 | |||||||||||||||
| Total | $ | 5,845 | $ | 4,668 | $ | 3,415 | $ | 2,197 | $ | 16,125 | ||||||||||
| (1) | Our consulting and technology services include consulting, application development, systems integration, and application testing services as well as software solutions and related services. |
| (2) | Our outsourcing services include application maintenance, infrastructure and business process services. |
| Fair Value | Weighted Average Useful Life | ||||
| (Dollars in millions) | |||||
| Corporate trademark | $ | 63.0 | Indefinite | ||
| Product trademarks | 21.0 | 16.9 years | |||
| Technology | 328.0 | 7.7 years | |||
| Customer relationships | 437.0 | 15.8 years | |||
| Total | $ | 849.0 | |||
| Note 4 — Business Combinations | ||||
All acquisitions completed during the period subsequent to the completion of the acquisition on November 20, 2014. The following unaudited pro forma information reflecting the combined operating results of Cognizant and TriZetto for thethree years ended December 31, 20142018, 2017 and 2013 assumes the TriZetto acquisition occurred on January 1, 2013. Such pro forma information does2016 were not reflect the potential realization of cost savings relating to the integration of TriZetto. Further, the pro forma information is not indicative of the combined results of operations that actually would have occurred had the TriZetto acquisition been completed on January 1, 2013 nor is it intended to be a projection of future operating results.
| Unaudited Pro Forma Information | ||||||||
| For the Years Ended | ||||||||
| December 31, 2014 | December 31, 2013 | |||||||
| (in millions) | ||||||||
| Revenues | $ | 10,893.0 | $ | 9,519.6 | ||||
| Income from operations | 1,959.5 | 1,253.2 | ||||||
| Year Ended December 31, 2014 | |||
| (in millions) | |||
| Fair value of assets acquired | $ | 3,070.7 | |
| Purchase price paid in cash (net of cash acquired) | (2,627.8 | ) | |
| Liabilities assumed | $ | 442.9 | |
| 2014 | 2013 | |||||||||||
| Fair Value | Useful Life | Fair Value | Useful Life | |||||||||
| (Dollars in millions) | ||||||||||||
| Total initial consideration, net of cash acquired | $ | 46.2 | $ | 184.2 | ||||||||
| Purchase price allocated to: | ||||||||||||
| Non-deductible goodwill | 30.9 | 129.9 | ||||||||||
| Customer relationship intangible assets | 12.1 | 3-10 years | 58.6 | 5-10 years | ||||||||
| Other intangible assets | 4.3 | 1-4 years | 7.2 | 1-5 years | ||||||||
values. The primary items that generated the aforementioned goodwill are the value of the acquired assembled workforces and synergies between the acquired companies and us, and the acquired assembled workforces, neither of which qualify as an amortizable intangible asset.
In 2018, we completed five business combinations for total consideration of approximately $1,122 million. These acquisitions were (a) Bolder Healthcare Solutions ("Bolder"), a provider of revenue cycle management solutions to the healthcare industry in the United States; (b) Hedera Consulting, a business advisory and data analytics service provider in Belgium and the Netherlands; (c) Softvision, a digital engineering and consulting company with significant operations in Romania and India that focuses on agile development of custom cloud-based software and platforms for customers primarily in the United States; (d) ATG, a United States based consulting company that helps companies plan, implement and optimize automated cloud-based quote-to-cash business processes and technologies; and (e) SaaSfocus, a Salesforce services provider in Australia.
The allocation of purchase price to the fair value of the aggregate assets acquired and liabilities assumed was as follows:
| Softvision | Bolder | Others | Total | Weighted Average Useful Life | ||||||||||||||
| ( dollars in millions) | ||||||||||||||||||
| Cash | $ | 4 | $ | 7 | $ | 4 | $ | 15 | ||||||||||
| Current assets | 54 | 32 | 15 | 101 | ||||||||||||||
| Property, plant and equipment and other noncurrent assets | 7 | 7 | 1 | 15 | ||||||||||||||
| Non-deductible goodwill | 385 | 335 | 76 | 796 | ||||||||||||||
| Customer relationship intangible assets | 133 | 113 | 30 | 276 | 10.3 years | |||||||||||||
| Other intangible assets | 9 | 17 | 1 | 27 | 3.7 years | |||||||||||||
| Trademark | — | 9 | — | 9 | Indefinite | |||||||||||||
| Current liabilities | (47 | ) | (11 | ) | (9 | ) | (67 | ) | ||||||||||
| Noncurrent liabilities | (4 | ) | (37 | ) | (9 | ) | (50 | ) | ||||||||||
| Purchase price | $ | 541 | $ | 472 | $ | 109 | $ | 1,122 | ||||||||||
For acquisitions completed in 2018, the allocation is preliminary and will be finalized as soon as practicable within the measurement period, but in no event later than one year following the date of acquisition.
2017
In 2017, we completed five business combinations for total consideration of approximately $233 million. These acquisitions were (a) an intelligent products and solutions company based in Japan specializing in digital strategy, product design and engineering, the internet of things, and enterprise mobility that expands our digital transformation portfolio and capabilities, (b) a U.S. healthcare management consulting firm that strengthens our consulting service offerings within the healthcare consulting market, (c) a leading national provider of business process services to the U.S. government healthcare market that further strengthens our business process-as-a-service solutions for government and public health programs, (d) a provider of digital experience and marketing solutions for some of the world's most recognized brands and an independent Adobe partner in Europe that will enhance our ability to deliver business critical digital experience solutions, and (e) an independent full-service digital agency in the UK specializing in customer experience, digital strategy, technology and content creation that will enhance and expand our digital interactive expertise in experience design, human science-driven insights and analytics.
The allocation of purchase price to the fair value of the aggregate assets acquired and liabilities assumed was as follows:
| Fair Value | Weighted Average Useful Life | ||||
| (in millions) | |||||
| Cash | $ | 8 | |||
| Current assets | 47 | ||||
| Property, plant and equipment and other noncurrent assets | 19 | ||||
| Non-deductible goodwill | 125 | ||||
| Customer relationship intangible assets | 147 | 10.6 years | |||
| Other intangible assets | 4 | 2.4 years | |||
| Current liabilities | (50 | ) | |||
| Noncurrent liabilities | (67 | ) | |||
| Purchase price | $ | 233 | |||
2016
In 2016, we completed eight business combinations for total consideration of approximately $287 million. These transactions included (a) an acquisition of a global consulting and technology services company that strengthens and expands our digital capabilities to deliver cloud-based application services, (b) three acquisitions of delivery centers spanning several industries such as oil and gas services, steel and metal products, and banking and insurance to enhance our delivery capabilities across Europe along with multi-year service agreements, (c) an acquisition of tangible property, an assembled workforce and a multi-year service agreement which qualifies as a business combination under accounting guidance, (d) an acquisition of a global consulting company that offers digital innovation, strategy, design and technology services, (e) an acquisition of a digital marketing and customer
experience agency that expands our digital business capabilities across Europe, and (f) an acquisition of an Australia-based consulting, business transformation and technology services provider in the insurance industry.
The allocation of purchase price to the fair value of the aggregate assets acquired and liabilities assumed was as follows:
| Fair Value | Weighted Average Useful Life | ||||
| (in millions) | |||||
| Cash | $ | 17 | |||
| Current assets | 84 | ||||
| Property, plant and equipment and other noncurrent assets | 53 | ||||
| Non-deductible goodwill | 157 | ||||
| Customer relationship intangible assets | 199 | 6.6 years | |||
| Other intangible assets | 1 | 3.3 years | |||
| Current liabilities | (173 | ) | |||
| Noncurrent liabilities | (51 | ) | |||
| Purchase price | $ | 287 | |||
| Note 5 — Realignment Charges | ||||
In 2017, we began a realignment of our business to accelerate the shift to digital services and solutions while improving the overall efficiency of our operations. As part of this realignment, we incurred charges that included severance costs, lease termination costs and advisory fees related to non-routine shareholder matters and charges related to the development of our realignment and capital return plans. The total costs related to the realignment are reported in "Selling, general and administrative expenses" in our consolidated statements of operations. The accrued realignment costs as of December 31, 2018 and 2017 were immaterial.
Realignment charges were as follows:
| Years Ended December 31, | |||||||
| 2018 | 2017 | ||||||
| (in millions) | |||||||
| Severance costs | $ | 18 | $ | 53 | |||
| Advisory fees | — | 18 | |||||
| Lease termination costs | 1 | 1 | |||||
| Total realignment costs | $ | 19 | $ | 72 | |||
There were no realignment charges incurred in 2016.
| Note 6 — | ||||
Our short-term investments were as follows as of December 31:
| 2015 | 2014 | ||||||
| (in millions) | |||||||
| Available-for-sale investment securities: | |||||||
| U.S. Treasury and agency debt securities | $ | 527.1 | $ | 544.7 | |||
| Corporate and other debt securities | 360.5 | 358.6 | |||||
| Certificates of deposit and commercial paper | 754.0 | 4.6 | |||||
| Asset-backed securities | 229.6 | 220.1 | |||||
| Municipal debt securities | 121.3 | 112.8 | |||||
| Mutual funds | 22.3 | 21.9 | |||||
| Total available-for-sale investment securities | 2,014.8 | 1,262.7 | |||||
| Time deposits | 809.5 | 501.9 | |||||
| Total short-term investments | $ | 2,824.3 | $ | 1,764.6 | |||
| 2018 | 2017 | ||||||
| (in millions) | |||||||
| Short-term investments: | |||||||
| Equity investment securities | $ | 25 | $ | 25 | |||
| Available-for-sale investment securities | 1,760 | 1,972 | |||||
| Held-to-maturity investment securities | 1,065 | 745 | |||||
| Time deposits | 500 | (1) | 389 | ||||
| Total short-term investments | $ | 3,350 | $ | 3,131 | |||
| Long-term investments: | |||||||
| Equity and cost method investments | $ | 74 | $ | 74 | |||
| Held-to-maturity investment securities | 6 | 161 | |||||
| Total long-term investments | $ | 80 | $ | 235 | |||
| (1) | Includes $423 million in restricted time deposits as of December 31, 2018. See Note 11. |
Equity Investment Securities
Our equity investment securities consist of a U.S. dollar denominated investment in a fixed income mutual fund. Unrealized losses for the years ended December 31, 2018 and 2017 were immaterial. The value of the fixed income mutual fund is based on the net asset value ("NAV") of the fund, with appropriate consideration of the liquidity and any restrictions on disposition of our investment in the fund. There were no realized gains or losses on equity securities during the years ended December 31, 2018 and 2017.
Available-for-Sale Investment Securities
Our available-for-sale investment securities consist of U.S. dollar denominated investments primarily in U.S. Treasury notes, U.S. government agency debt securities, municipal debt securities, non-U.S. government debt securities, U.S. and international corporate bonds, certificates of deposit, commercial paper, debt securities issued by supranational institutions, mutual funds invested in fixed income securities, and asset-backed securities, including Government National Mortgage Association (GNMA) mortgage backed securities and securities backed by auto loans, credit card receivables, and other receivables. Our investment guidelines are to purchase securities which are investment grade at the time of acquisition. We monitor the credit ratings of the securities in our portfolio on an ongoing basis.
The amortized cost, gross unrealized gains and losses and fair value of our available-for-sale investment securities were as follows at December 31:
| 2015 | 2018 | |||||||||||||||||||||||||||||
Amortized Cost | Unrealized Gains | Unrealized Losses | Fair Value | Amortized Cost | Unrealized Gains | Unrealized Losses | Fair Value | |||||||||||||||||||||||
| (in millions) | (in millions) | |||||||||||||||||||||||||||||
| U.S. Treasury and agency debt securities | $ | 528.9 | $ | — | $ | (1.8 | ) | $ | 527.1 | $ | 630 | $ | 1 | $ | (6 | ) | $ | 625 | ||||||||||||
| Corporate and other debt securities | 361.9 | 0.1 | (1.5 | ) | 360.5 | 420 | — | (4 | ) | 416 | ||||||||||||||||||||
| Certificates of deposit and commercial paper | 754.0 | 0.1 | (0.1 | ) | 754.0 | 296 | — | — | 296 | |||||||||||||||||||||
| Asset-backed securities | 230.3 | 0.1 | (0.8 | ) | 229.6 | 336 | — | (2 | ) | 334 | ||||||||||||||||||||
| Municipal debt securities | 121.2 | 0.2 | (0.1 | ) | 121.3 | 90 | — | (1 | ) | 89 | ||||||||||||||||||||
| Mutual funds | 25.3 | 0.1 | (3.1 | ) | 22.3 | |||||||||||||||||||||||||
| Total available-for-sale investment securities | $ | 2,021.6 | $ | 0.6 | $ | (7.4 | ) | $ | 2,014.8 | $ | 1,772 | $ | 1 | $ | (13 | ) | $ | 1,760 | ||||||||||||
| 2014 | 2017 | |||||||||||||||||||||||||||||
Amortized Cost | Unrealized Gains | Unrealized Losses | Fair Value | Amortized Cost | Unrealized Gains | Unrealized Losses | Fair Value | |||||||||||||||||||||||
| (in millions) | (in millions) | |||||||||||||||||||||||||||||
| U.S. Treasury and agency debt securities | $ | 544.7 | $ | 0.4 | $ | (0.4 | ) | $ | 544.7 | $ | 667 | $ | — | $ | (6 | ) | $ | 661 | ||||||||||||
| Corporate and other debt securities | 359.0 | 0.3 | (0.7 | ) | 358.6 | 439 | — | (2 | ) | 437 | ||||||||||||||||||||
| Certificates of deposit and commercial paper | 4.6 | — | — | 4.6 | 450 | — | — | 450 | ||||||||||||||||||||||
| Asset-backed securities | 220.4 | 0.1 | (0.4 | ) | 220.1 | 297 | — | (2 | ) | 295 | ||||||||||||||||||||
| Municipal debt securities | 112.5 | 0.4 | (0.1 | ) | 112.8 | 130 | — | (1 | ) | 129 | ||||||||||||||||||||
| Mutual funds | 23.9 | 0.3 | (2.3 | ) | 21.9 | |||||||||||||||||||||||||
| Total available-for-sale investment securities | $ | 1,265.1 | $ | 1.5 | $ | (3.9 | ) | $ | 1,262.7 | $ | 1,983 | $ | — | $ | (11 | ) | $ | 1,972 | ||||||||||||
The fair value and related unrealized losses of our available-for-sale investment securities in a continuous unrealized loss position for less than 12 months and for 12 months or longer were as follows as of December 31:
| 2015 | 2018 | |||||||||||||||||||||||||||||||||||||||||||||
| Less than 12 Months | 12 Months or More | Total | Less than 12 Months | 12 Months or More | Total | |||||||||||||||||||||||||||||||||||||||||
Fair Value | Unrealized Losses | Fair Value | Unrealized Losses | Fair Value | Unrealized Losses | Fair Value | Unrealized Losses | Fair Value | Unrealized Losses | Fair Value | Unrealized Losses | |||||||||||||||||||||||||||||||||||
| (in millions) | (in millions) | |||||||||||||||||||||||||||||||||||||||||||||
| U.S. Treasury and agency debt securities | $ | 475.7 | $ | (1.8 | ) | $ | — | $ | — | $ | 475.7 | $ | (1.8 | ) | $ | 84 | $ | — | $ | 446 | $ | (6 | ) | $ | 530 | $ | (6 | ) | ||||||||||||||||||
| Corporate and other debt securities | 315.1 | (1.5 | ) | 3.1 | — | 318.2 | (1.5 | ) | 108 | (1 | ) | 254 | (3 | ) | 362 | (4 | ) | |||||||||||||||||||||||||||||
| Certificates of deposit and commercial paper | 271.5 | (0.1 | ) | — | — | 271.5 | (0.1 | ) | 295 | — | — | — | 295 | — | ||||||||||||||||||||||||||||||||
| Asset-backed securities | 199.4 | (0.7 | ) | 11.4 | (0.1 | ) | 210.8 | (0.8 | ) | 93 | — | 179 | (2 | ) | 272 | (2 | ) | |||||||||||||||||||||||||||||
| Municipal debt securities | 56.5 | (0.1 | ) | — | — | 56.5 | (0.1 | ) | 17 | — | 64 | (1 | ) | 81 | (1 | ) | ||||||||||||||||||||||||||||||
| Mutual funds | — | — | 21.1 | (3.1 | ) | 21.1 | (3.1 | ) | ||||||||||||||||||||||||||||||||||||||
| Total | $ | 1,318.2 | $ | (4.2 | ) | $ | 35.6 | $ | (3.2 | ) | $ | 1,353.8 | $ | (7.4 | ) | $ | 597 | $ | (1 | ) | $ | 943 | $ | (12 | ) | $ | 1,540 | $ | (13 | ) | ||||||||||||||||
| 2014 | 2017 | |||||||||||||||||||||||||||||||||||||||||||||
| Less than 12 Months | 12 Months or More | Total | Less than 12 Months | 12 Months or More | Total | |||||||||||||||||||||||||||||||||||||||||
Fair Value | Unrealized Losses | Fair Value | Unrealized Losses | Fair Value | Unrealized Losses | Fair Value | Unrealized Losses | Fair Value | Unrealized Losses | Fair Value | Unrealized Losses | |||||||||||||||||||||||||||||||||||
| (in millions) | (in millions) | |||||||||||||||||||||||||||||||||||||||||||||
| U.S. Treasury and agency debt securities | $ | 256.9 | $ | (0.4 | ) | $ | — | $ | — | $ | 256.9 | $ | (0.4 | ) | $ | 519 | $ | (4 | ) | $ | 124 | $ | (2 | ) | $ | 643 | $ | (6 | ) | |||||||||||||||||
| Corporate and other debt securities | 229.7 | (0.7 | ) | — | — | 229.7 | (0.7 | ) | 297 | (1 | ) | 126 | (1 | ) | 423 | (2 | ) | |||||||||||||||||||||||||||||
| Certificates of deposit and commercial paper | 3.7 | — | — | — | 3.7 | — | 49 | — | — | — | 49 | — | ||||||||||||||||||||||||||||||||||
| Asset-backed securities | 151.9 | (0.3 | ) | 2.8 | (0.1 | ) | 154.7 | (0.4 | ) | 193 | (1 | ) | 94 | (1 | ) | 287 | (2 | ) | ||||||||||||||||||||||||||||
| Municipal debt securities | 28.0 | (0.1 | ) | — | — | 28.0 | (0.1 | ) | 107 | (1 | ) | 18 | — | 125 | (1 | ) | ||||||||||||||||||||||||||||||
| Mutual funds | — | — | 20.7 | (2.3 | ) | 20.7 | (2.3 | ) | ||||||||||||||||||||||||||||||||||||||
| Total | $ | 670.2 | $ | (1.5 | ) | $ | 23.5 | $ | (2.4 | ) | $ | 693.7 | $ | (3.9 | ) | $ | 1,165 | $ | (7 | ) | $ | 362 | $ | (4 | ) | $ | 1,527 | $ | (11 | ) | ||||||||||||||||
The unrealized losses for the above securities as of December 31, 20152018 and 20142017 are primarily attributable to changes in interest rates. At each reporting date, we perform an evaluation of impaired available-for-sale securities to determine if the unrealized losses are other-than-temporary. As of December 31, 2015,2018, we do not consider any of the investments to be other-than-temporarily impaired. The gross unrealized gains and losses in the above tables were recorded, net of tax, in accumulated"Accumulated other comprehensive income (loss)." in our consolidated statements of financial position.
The contractual maturities of our fixed income available-for-sale investment securities as of December 31, 20152018 are set forth in the following table:
Amortized Cost | Fair Value | Amortized Cost | Fair Value | |||||||||||
| (in millions) | (in millions) | |||||||||||||
| Due within one year | $ | 806.4 | $ | 806.5 | $ | 569 | $ | 567 | ||||||
| Due after one year up to two years | 536.6 | 535.1 | 544 | 537 | ||||||||||
| Due after two years up to three years | 404.9 | 403.3 | 267 | 265 | ||||||||||
| Due after three years up to four years | 18.1 | 18.0 | ||||||||||||
| Due after three years | 56 | 57 | ||||||||||||
| Asset-backed securities | 230.3 | 229.6 | 336 | 334 | ||||||||||
| Fixed income available-for-sale investment securities | $ | 1,996.3 | $ | 1,992.5 | ||||||||||
| Total available-for-sale investment securities | $ | 1,772 | $ | 1,760 | ||||||||||
Asset-backed securities were excluded from the maturity categories because the actual maturities may differ from the contractual maturities since the underlying receivables may be prepaid without penalties. Further, actual maturities of debt securities may differ from those presented above since certain obligations provide the issuer the right to call or prepay the obligation prior to scheduled maturity without penalty.
Proceeds from sales of available-for-sale investment securities and the gross gains and losses that have been included in earnings as a result of those sales were as follows:
| 2015 | 2014 | 2013 | 2018 | 2017 | 2016 | |||||||||||||||||||
| (in millions) | (in millions) | |||||||||||||||||||||||
| Proceeds from sales of available-for-sale investment securities | $ | 781.9 | $ | 1,475.6 | $ | 1,119.8 | $ | 1,285 | $ | 2,922 | $ | 3,541 | ||||||||||||
| Gross gains | $ | 1.4 | $ | 2.2 | $ | 2.0 | $ | — | $ | 1 | $ | 5 | ||||||||||||
| Gross losses | (0.5 | ) | (0.4 | ) | (0.6 | ) | (4 | ) | (3 | ) | (4 | ) | ||||||||||||
| Net realized gains on sales of available-for-sale investment securities | $ | 0.9 | $ | 1.8 | $ | 1.4 | ||||||||||||||||||
| Net realized (losses) gains on sales of available-for-sale investment securities | $ | (4 | ) | $ | (2 | ) | $ | 1 | ||||||||||||||||
Held-to-Maturity Investment Securities
Our held-to-maturity investment securities consist of Indian rupee denominated investments primarily in commercial paper, international corporate bonds and government debt securities. Our investment guidelines are to purchase securities that are investment grade at the time of acquisition. We monitor the credit ratings of the securities in our portfolio on an ongoing basis.
The amortized cost, gross unrealized gains and losses and fair value of held-to-maturity investment securities were as follows at December 31:
| 2018 | |||||||||||||||
| Amortized Cost | Unrealized Gains | Unrealized Losses | Fair Value | ||||||||||||
| (in millions) | |||||||||||||||
| Short-term investments: | |||||||||||||||
| Corporate and other debt securities | $ | 546 | $ | — | $ | — | $ | 546 | |||||||
| Commercial paper | 519 | — | (1 | ) | 518 | ||||||||||
| Total short-term held-to-maturity investments | 1,065 | — | (1 | ) | 1,064 | ||||||||||
| Long-term investments: | |||||||||||||||
| Corporate and other debt securities | 6 | — | — | 6 | |||||||||||
| Total held-to-maturity investment securities | $ | 1,071 | $ | — | $ | (1 | ) | $ | 1,070 | ||||||
| 2017 | |||||||||||||||
| Amortized Cost | Unrealized Gains | Unrealized Losses | Fair Value | ||||||||||||
| (in millions) | |||||||||||||||
| Short-term investments: | |||||||||||||||
| Corporate and other debt securities | $ | 346 | $ | — | $ | (1 | ) | $ | 345 | ||||||
| Commercial paper | 399 | — | (2 | ) | 397 | ||||||||||
| Total short-term held-to-maturity investments | 745 | — | (3 | ) | 742 | ||||||||||
| Long-term investments: | |||||||||||||||
| Corporate and other debt securities | 161 | — | (1 | ) | 160 | ||||||||||
| Total held-to-maturity investment securities | $ | 906 | $ | — | $ | (4 | ) | $ | 902 | ||||||
The fair value and related unrealized losses of held-to-maturity investment securities in a continuous unrealized loss position for less than 12 months and for 12 months or longer were as follows as of December 31:
| 2018 | |||||||||||||||||||||||
| Less than 12 Months | 12 Months or More | Total | |||||||||||||||||||||
Fair Value | Unrealized Losses | Fair Value | Unrealized Losses | Fair Value | Unrealized Losses | ||||||||||||||||||
| (in millions) | |||||||||||||||||||||||
| Corporate and other debt securities | $ | 263 | $ | — | $ | 57 | $ | — | $ | 320 | $ | — | |||||||||||
| Commercial paper | 268 | (1 | ) | — | — | 268 | (1 | ) | |||||||||||||||
| Total | $ | 531 | $ | (1 | ) | $ | 57 | $ | — | $ | 588 | $ | (1 | ) | |||||||||
| 2017 | |||||||||||||||||||||||
| Less than 12 Months | 12 Months or More | Total | |||||||||||||||||||||
Fair Value | Unrealized Losses | Fair Value | Unrealized Losses | Fair Value | Unrealized Losses | ||||||||||||||||||
| (in millions) | |||||||||||||||||||||||
| Corporate and other debt securities | $ | 473 | $ | (2 | ) | $ | — | $ | — | $ | 473 | $ | (2 | ) | |||||||||
| Commercial paper | 394 | (2 | ) | — | — | 394 | (2 | ) | |||||||||||||||
| Total | $ | 867 | $ | (4 | ) | $ | — | $ | — | $ | 867 | $ | (4 | ) | |||||||||
At each reporting date, the Company performs an evaluation of held-to-maturity securities to determine if the unrealized losses are other-than-temporary. We do not consider any of the investments to be other-than-temporarily impaired as of December 31, 2018.
The contractual maturities of our fixed income held-to-maturity investment securities as of December 31, 2018 are set forth in the following table:
Amortized Cost | Fair Value | ||||||
| (in millions) | |||||||
| Due within one year | $ | 1,065 | $ | 1,064 | |||
| Due after one year up to two years | 6 | 6 | |||||
| Total held-to-maturity investment securities | $ | 1,071 | $ | 1,070 | |||
During the years ended December 31, 2018 and 2017, there were no transfers of investments between our available-for-sale and held-to-maturity investment portfolios.
Equity and Cost Method Investments
As of December 31, 2018 and 2017, we had equity method investments of $66 million and $67 million, respectively, which primarily consist of a 49% ownership interest in a strategic consulting firm specializing in the use of human sciences to help business leaders better understand customer behavior. As of December 31, 2018 and 2017, we had cost method investments of $8 million and $7 million, respectively.
| Note 7 — Property and Equipment, net | ||||
Property and equipment were as follows as of December 31:
| Estimated Useful Life (Years) | 2015 | 2014 | Estimated Useful Life (Years) | 2018 | 2017 | |||||||||||||||
| (in millions) | (in millions) | |||||||||||||||||||
| Buildings | 30 | $ | 804.9 | $ | 605.0 | 30 | $ | 839 | $ | 836 | ||||||||||
| Computer equipment and software | 3 | 696.9 | 537.3 | |||||||||||||||||
| Computer equipment | 3 – 5 | 412 | 364 | |||||||||||||||||
| Computer software | 3 – 8 | 721 | 594 | |||||||||||||||||
| Furniture and equipment | 5 – 9 | 384.5 | 322.6 | 5 – 9 | 639 | 511 | ||||||||||||||
| Land | 22.6 | 22.6 | 19 | 19 | ||||||||||||||||
| Leasehold land | lease term | 63.4 | 60.1 | lease term | 60 | 63 | ||||||||||||||
| Capital work-in-progress | 114.9 | 304.7 | 156 | 145 | ||||||||||||||||
| Leasehold improvements | Shorter of the lease term or the life of the leased asset | 263.3 | 247.0 | Shorter of the lease term or the life of the leased asset | 338 | 308 | ||||||||||||||
| Sub-total | 2,350.5 | 2,099.3 | 3,184 | 2,840 | ||||||||||||||||
| Accumulated depreciation and amortization | (1,079.1 | ) | (852.1 | ) | (1,790 | ) | (1,516 | ) | ||||||||||||
| Property and equipment, net | $ | 1,271.4 | $ | 1,247.2 | $ | 1,394 | $ | 1,324 | ||||||||||||
Depreciation and amortization expense related to property and equipment was $233.1$347 million, $172.1,$313 million and $155.7$266 million for the years ended December 31, 2015, 20142018, 2017 and 2013,2016, respectively.
The gross amount of property and equipment recorded under capital leases was $45.9$73 million and $37.0$44 million atas of December 31, 20152018 and 2014, respectively, and primarily related to buildings.2017, respectively. Accumulated amortization and amortization expense related to capital lease assets were immaterial for the periods presented.
The gross amount of property and equipment recorded for software to be sold, leased by us fromor marketed in the governmentcaption "Computer software" above was $85 million and $52 million, as of India with lease terms ranging upDecember 31, 2018 and 2017, respectively. Accumulated amortization for software to 99 years. Lease payments are made at the inceptionbe sold, leased or marketed was $24 million and $12 million as of the lease agreementDecember 31, 2018 and amortized over the lease term.2017, respectively. Amortization expense of leasehold land isfor software to be sold, leased or marketed recorded as property and equipment was $14 million for the year ended December 31, 2018 and was immaterial for the periods presentedyears ended December 31, 2017 and is included in depreciation and amortization expense in our accompanying consolidated statements of operations.2016.
| Note 8 — Goodwill and Intangible Assets, net | ||||
Changes in goodwill by our reportable segments were as follows for the years ended December 31, 20152018 and 2014:2017:
| Segment | January 1, 2018 | Goodwill Additions and Adjustments | Foreign Currency Translation Adjustments | December 31, 2018 | ||||||||||||
| (in millions) | ||||||||||||||||
| Financial Services | $ | 265 | $ | 152 | $ | (6 | ) | $ | 411 | |||||||
| Healthcare | 2,106 | 365 | (2 | ) | 2,469 | |||||||||||
| Products and Resources | 240 | 152 | (8 | ) | 384 | |||||||||||
| Communications, Media and Technology | 93 | 126 | (2 | ) | 217 | |||||||||||
| Total goodwill | $ | 2,704 | $ | 795 | $ | (18 | ) | $ | 3,481 | |||||||
| Segment | January 1, 2017 | Goodwill Additions and Adjustments | Foreign Currency Translation Adjustments | December 31, 2017 | ||||||||||||
| (in millions) | ||||||||||||||||
| Financial Services | $ | 227 | $ | 27 | $ | 11 | $ | 265 | ||||||||
| Healthcare | 2,089 | 13 | 4 | 2,106 | ||||||||||||
| Products and Resources | 159 | 72 | 9 | 240 | ||||||||||||
| Communications, Media and Technology | 79 | 11 | 3 | 93 | ||||||||||||
| Total goodwill | $ | 2,554 | $ | 123 | $ | 27 | $ | 2,704 | ||||||||
| Segment | January 1, 2015 | Goodwill Additions | Foreign Currency Translation Adjustments | December 31, 2015 | ||||||||||||
| (in millions) | ||||||||||||||||
| Financial Services | $ | 204.5 | $ | 5.5 | $ | (7.3 | ) | $ | 202.7 | |||||||
| Healthcare | 2,079.9 | — | (3.5 | ) | 2,076.4 | |||||||||||
| Manufacturing/Retail/Logistics | 69.2 | — | (2.3 | ) | 66.9 | |||||||||||
| Other | 60.0 | — | (1.3 | ) | 58.7 | |||||||||||
| Total goodwill | $ | 2,413.6 | $ | 5.5 | $ | (14.4 | ) | $ | 2,404.7 | |||||||
| Segment | January 1, 2014 | Goodwill Additions | Foreign Currency Translation Adjustments | December 31, 2014 | ||||||||||||
| (in millions) | ||||||||||||||||
| Financial Services | $ | 208.6 | $ | 4.0 | $ | (8.1 | ) | $ | 204.5 | |||||||
| Healthcare | 107.4 | 1,976.9 | (4.4 | ) | 2,079.9 | |||||||||||
| Manufacturing/Retail/Logistics | 71.6 | 0.7 | (3.1 | ) | 69.2 | |||||||||||
| Other | 56.6 | 5.4 | (2.0 | ) | 60.0 | |||||||||||
| Total goodwill | $ | 444.2 | $ | 1,987.0 | $ | (17.6 | ) | $ | 2,413.6 | |||||||
Components of intangible assets were as follows as of December 31:
| 2015 | 2018 | 2017 | ||||||||||||||||||||||||||||||||||
Gross Carrying Amount | Accumulated Amortization | Net Carrying Amount | Gross Carrying Amount | Accumulated Amortization | Net Carrying Amount | Gross Carrying Amount | Accumulated Amortization | Net Carrying Amount | ||||||||||||||||||||||||||||
| (in millions) | (in millions) | |||||||||||||||||||||||||||||||||||
| Customer relationships | $ | 650.3 | $ | (157.6 | ) | $ | 492.7 | $ | 1,277 | $ | (398 | ) | $ | 879 | $ | 1,005 | $ | (304 | ) | $ | 701 | |||||||||||||||
| Developed technology | 332.1 | (52.5 | ) | 279.6 | 355 | (187 | ) | 168 | 333 | (140 | ) | 193 | ||||||||||||||||||||||||
| Indefinite life trademarks | 63.0 | — | 63.0 | 72 | — | 72 | 63 | — | 63 | |||||||||||||||||||||||||||
| Other | 45.1 | (16.1 | ) | 29.0 | 64 | (33 | ) | 31 | 51 | (27 | ) | 24 | ||||||||||||||||||||||||
| Total intangible assets | $ | 1,090.5 | $ | (226.2 | ) | $ | 864.3 | $ | 1,768 | $ | (618 | ) | $ | 1,150 | $ | 1,452 | $ | (471 | ) | $ | 981 | |||||||||||||||
| 2014 | ||||||||||||||||||||||||||||||||||||
Gross Carrying Amount | Accumulated Amortization | Net Carrying Amount | ||||||||||||||||||||||||||||||||||
| (in millions) | ||||||||||||||||||||||||||||||||||||
| Customer relationships | $ | 644.4 | $ | (112.2 | ) | $ | 532.2 | |||||||||||||||||||||||||||||
| Developed technology | 332.1 | (8.7 | ) | 323.4 | ||||||||||||||||||||||||||||||||
| Indefinite life trademarks | 63.0 | — | 63.0 | |||||||||||||||||||||||||||||||||
| Other | 45.8 | (10.7 | ) | 35.1 | ||||||||||||||||||||||||||||||||
| Total intangible assets | $ | 1,085.3 | $ | (131.6 | ) | $ | 953.7 | |||||||||||||||||||||||||||||
Other than certain trademarks with indefinite lives, our intangible assets have finite lives and, as such, are subject to amortization. Amortization of intangible assets totaled $96.9$151 million for 2015, $36.02018, $130 million for 20142017 and $24.2$113 million for 2013. During 2015, 20142016. Of these amounts, during 2018, 2017 and 2013,2016, amortization of $4.8$38 million, $8.4$35 million and $7.7$20 million, respectively, relating to customer relationship intangible assets was recorded as a reduction of revenues. These intangible assets are attributedattributable to direct revenue contracts with sellers of acquired businesses.businesses was recorded as a reduction of revenues.
Estimated amortization expense related to our existing intangible assets for the next five years is as follows:
| Year | Amount | Amount | ||||||
| (in millions) | (in millions) | |||||||
| 2016 | $ | 96.1 | ||||||
| 2017 | 93.2 | |||||||
| 2018 | 85.8 | |||||||
| 2019 | 83.5 | $ | 167 | |||||
| 2020 | 76.3 | 158 | ||||||
| 2021 | 153 | |||||||
| 2022 | 137 | |||||||
| 2023 | 83 | |||||||
| Note 9 — Accrued Expenses and Other Current Liabilities | ||||
Accrued expenses and other current liabilities were as follows as of December 31:
| 2015 | 2014 | 2018 | 2017 | |||||||||||
| (in millions) | (in millions) | |||||||||||||
| Compensation and benefits | $ | 1,272.0 | $ | 906.8 | $ | 1,216 | $ | 1,272 | ||||||
| Customer volume and other incentives | 323 | 289 | ||||||||||||
| Derivative financial instruments | 25 | 5 | ||||||||||||
| FCPA Accrual | 28 | — | ||||||||||||
| Income taxes | 17.1 | 23.8 | 162 | 48 | ||||||||||
| Professional fees | 69.6 | 82.7 | 110 | 100 | ||||||||||
| Travel and entertainment | 29.8 | 35.0 | 34 | 32 | ||||||||||
| Customer volume incentives | 236.1 | 192.1 | ||||||||||||
| Derivative financial instruments | 10.9 | 97.3 | ||||||||||||
| Other | 182.9 | 184.6 | 369 | 325 | ||||||||||
| Total accrued expenses and other current liabilities | $ | 1,818.4 | $ | 1,522.3 | $ | 2,267 | $ | 2,071 | ||||||
| Note 10 — Debt | ||||
New Term Loan, beginning in December 2019.
The credit agreementNew Credit Agreement requires interest to be paid, at our option, at either the base rateABR or the Eurocurrency rate,Rate (each as defined in the New Credit Agreement), plus, a margin. The margin overin each case, an Applicable Margin (as defined in the base rateNew Credit Agreement). Initially, the Applicable Margin is 0.00%,0.875% with respect to Eurocurrency Rate loans and 0.00% with respect to ABR loans. Subsequently, the margin over theApplicable Margin with respect to Eurocurrency rate rangesRate loans may range from 0.75% to 1.125%, depending on our public debt ratings (or, if we have not received public debt ratings, from 0.875% to 1.00%1.125%, depending on our debtLeverage Ratio, which is the ratio of indebtedness for borrowed money to total stockholders' equity ratio)Consolidated EBITDA, as defined in the New Credit Agreement). Under the credit agreement,New Credit Agreement, we are required to pay commitment fees on the unused portion of the revolving credit facility, which vary based on our public debt ratings (or, if we have not received public debt ratings, our debt to total stockholders' equity ratio). At December 31, 2015, the interest rates on the term loan and revolving credit facility were 1.40% and 1.42%, respectively.Leverage Ratio). As the interest rates on our term loanNew Term Loan and any notes outstanding under the revolving creditscredit facility are variable, the fair value of our debt balances approximates their carrying value as of December 31, 20152018 and 2014.
2017.
The credit agreementNew Credit Agreement contains certaincustomary affirmative and negative covenants including limitations on liens, mergers, consolidations and acquisitions, subsidiary indebtedness and affiliate transactions, as well as certain affirmative covenants. In addition,a financial covenant. The financial covenant is tested at the credit agreementend of each fiscal quarter and requires us to maintain a debt to total stockholders' equity ratioLeverage Ratio not in excess of 0.403.50 to 1.00, or for a period of up to four quarters following certain material acquisitions, 3.75 to 1.00. AsWe were in compliance with all debt covenants and representations of the New Credit Agreement as of December 31, 2015, we are in compliance with our debt covenants.
2018.
Short-term Debt
The following summarizes our short-term debt balances as of December 31:
| 2015 | 2014 | 2018 | 2017 | |||||||||||||||||
| (in millions) | Amount | Weighted Average Interest Rate | Amount | Weighted Average Interest Rate | ||||||||||||||||
| Notes drawn under revolving credit facility | $ | 350.0 | $ | 650.0 | ||||||||||||||||
| (in millions) | (in millions) | |||||||||||||||||||
| Notes outstanding under revolving credit facility | $ | — | not applicable | $ | 75 | 4.5 | % | |||||||||||||
| Term loan - current maturities | 56.3 | 50.0 | 9 | 3.3 | % | 100 | 2.4 | % | ||||||||||||
| Total short-term debt | $ | 406.3 | $ | 700.0 | $ | 9 | $ | 175 | ||||||||||||
Long-term Debt
The following summarizes our long-term debt balances as of December 31:
| 2015 | 2014 | |||||||
| (in millions) | ||||||||
| Term loan, due 2019 | $ | 937.5 | $ | 987.5 | ||||
| Less: current maturities | (56.3 | ) | (50.0 | ) | ||||
| Long-term debt, net of current maturities | $ | 881.2 | $ | 937.5 | ||||
| 2018 | 2017 | |||||||
| (in millions) | ||||||||
| Term loan | $ | 750 | $ | 800 | ||||
| Less: | ||||||||
| Current maturities | (9 | ) | (100 | ) | ||||
| Deferred financing costs | (5 | ) | (2 | ) | ||||
| Long-term debt, net of current maturities | $ | 736 | $ | 698 | ||||
The following represents the schedule of maturities of long-term debt:our term loan:
| Year | Amounts | |||
| (in millions) | ||||
| 2016 | 56.3 | |||
| 2017 | 81.2 | |||
| 2018 | 100.0 | |||
| 2019 | 700.0 | |||
| $ | 937.5 | |||
| Year | Amounts | |||
| (in millions) | ||||
| 2019 | $ | 9 | ||
| 2020 | 38 | |||
| 2021 | 38 | |||
| 2022 | 38 | |||
| 2023 | 627 | |||
| $ | 750 | |||
| Note 11 — Income Taxes | ||||
Income before provision for income taxes shown below is based on the geographic location to which such income iswas attributed for years ended December 31:
| 2015 | 2014 | 2013 | 2018 | 2017 | 2016 | |||||||||||||||||||
| (in millions) | (in millions) | |||||||||||||||||||||||
| United States | $ | 738.5 | $ | 589.2 | $ | 540.7 | $ | 947 | $ | 810 | $ | 752 | ||||||||||||
| Foreign | 1,425.1 | 1,334.8 | 1,147.2 | 1,850 | 1,845 | 1,605 | ||||||||||||||||||
| Income before provision for income taxes | $ | 2,163.6 | $ | 1,924.0 | $ | 1,687.9 | $ | 2,797 | $ | 2,655 | $ | 2,357 | ||||||||||||
The provision for income taxes consistsconsisted of the following components for the years ended December 31:
| 2015 | 2014 | 2013 | 2018 | 2017 | 2016 | |||||||||||||||||||
| (in millions) | (in millions) | |||||||||||||||||||||||
| Current: | ||||||||||||||||||||||||
| Federal and state | $ | 351.8 | $ | 260.2 | $ | 270.0 | $ | 241 | $ | 767 | $ | 544 | ||||||||||||
| Foreign | 314.3 | 324.1 | 277.5 | 449 | 262 | 352 | ||||||||||||||||||
| Total current | 666.1 | 584.3 | 547.5 | |||||||||||||||||||||
| Total current provision | 690 | 1,029 | 896 | |||||||||||||||||||||
| Deferred: | ||||||||||||||||||||||||
| Federal and state | (58.1 | ) | (20.2 | ) | (37.1 | ) | 1 | 102 | (44 | ) | ||||||||||||||
| Foreign | (68.0 | ) | (79.4 | ) | (51.1 | ) | 7 | 22 | (47 | ) | ||||||||||||||
| Total deferred | (126.1 | ) | (99.6 | ) | (88.2 | ) | ||||||||||||||||||
| Total deferred provision (benefit) | 8 | 124 | (91 | ) | ||||||||||||||||||||
| Total provision for income taxes | $ | 540.0 | $ | 484.7 | $ | 459.3 | $ | 698 | $ | 1,153 | $ | 805 | ||||||||||||