Revenue declined $75 million or 0.4% from 2022; a decline of 0.3% in constant currency1 | | Income from Operations declined $279 million or 9.4% from 2022
| Adjusted Income from Operations1 declined $50 million or 1.7% from 2022 | | | | Operating margin down 140 bps compared to 2022
Adjusted Operating Margin1 down 20 basis points from 2022 | | | | Diluted EPS declined $0.20 or 4.5% from 2022
Adjusted Diluted EPS1 increased $0.15 or 3.4% from 2022 | | | | | | | | | | | | | | | | | | | | | | | | | | | | | | | | | | | | | | | | | | | | | | | | | | | | | | | | | | | | | | | | | | | | | | | | | | | | | | | | | | | |
1 Adjusted Income From Operations, andAdjusted Operating Margin, Adjusted Diluted EPS and constant currency revenue growth are not measurements of financial performance prepared in accordance with GAAP. See “Non-GAAP Financial Measures” for more information and reconciliations to the most directly comparable GAAP financial measures. | | | | | | | | | | Cognizant | 28 | December 31, 2023 Form 10-K |
The following charts set forth revenues and change in revenues by business segment and geography forDuring the year ended December 31, 20202023, revenues decreased by $75 million as compared to the year ended December 31, 2019:
| | | | | | | | | | | | | | | | | | | | | | | | | | | | | | | | | | | | | | | | | | | | | | | | | | | | | | | | | | | | | | | | | | | Financial Services | | Healthcare | | | | | | | | | Increase / (Decrease) | | | | Increase / (Decrease) | | | | | | | | | | Dollars in millions | | Revenues | | $ | | % | | CC %2 | | Revenues | | $ | | % | | CC %2 | | | | | | | | | | North America | | $ | 4,013 | | | (124) | | | (3.0) | | | (3.0) | | | $ | 4,181 | | | 34 | | | 0.8 | | | 0.8 | | | | | | | | | | | United Kingdom | | 463 | | | (21) | | | (4.3) | | | (4.7) | | | 157 | | | 27 | | | 20.8 | | | 19.8 | | | | | | | | | | | Continental Europe | | 629 | | | (99) | | | (13.6) | | | (14.0) | | | 434 | | | 93 | | | 27.3 | | | 24.0 | | | | | | | | | | | Europe - Total | | 1,092 | | | (120) | | | (9.9) | | | (10.3) | | | 591 | | | 120 | | | 25.5 | | | 22.9 | | | | | | | | | | | Rest of World | | 516 | | | (4) | | | (0.8) | | | 2.0 | | | 80 | | | 3 | | | 3.9 | | | 6.0 | | | | | | | | | | | Total | | $ | 5,621 | | | (248) | | | (4.2) | | | (4.0) | | | $ | 4,852 | | | 157 | | | 3.3 | | | 3.1 | | | | | | | | | | | | | | | | | | | | | | | | | | | | | | | | | | | | | Products and Resources | | Communications, Media and Technology | | | | | | | | | Increase / (Decrease) | | | | Increase / (Decrease) | | | | | | | | | | Dollars in millions | | Revenues | | $ | | % | | CC %2 | | Revenues | | $ | | % | | CC %2 | | | | | | | | | | North America | | $ | 2,650 | | | (28) | | | (1.0) | | | (1.0) | | | $ | 1,737 | | | (27) | | | (1.5) | | | (1.5) | | | | | | | | | | | United Kingdom | | 371 | | | (9) | | | (2.4) | | | (3.0) | | | 344 | | | 25 | | | 7.8 | | | 6.8 | | | | | | | | | | | Continental Europe | | 413 | | | (40) | | | (8.8) | | | (8.7) | | | 177 | | | 8 | | | 4.7 | | | 2.1 | | | | | | | | | | | Europe - Total | | 784 | | | (49) | | | (5.9) | | | (6.1) | | | 521 | | | 33 | | | 6.8 | | | 5.2 | | | | | | | | | | | Rest of World | | 262 | | | 3 | | | 1.2 | | | 4.7 | | | 225 | | | 28 | | | 14.2 | | | 20.2 | | | | | | | | | | | Total | | $ | 3,696 | | | (74) | | | (2.0) | | | (1.7) | | | $ | 2,483 | | | 34 | | | 1.4 | | | 1.6 | | | | | | | | | | | | | | | | | | | | | | | | | | | | | | | | | | |
2022, representing a decrease of 0.4%, or a decrease of 0.3% on a constant currency basisAcross all2. Revenue decline was driven by our business segments and regions, revenues wereFinancial Services segment, which was negatively impacted by weakness in the COVID-19 pandemic and the ransomware attack. Retail, consumer goods, travel and hospitality clients within our Products and Resources segment as well as communications and media clientsbanking sector, partially offset by growth in our Communications, Media and Technology, segment were particularly adversely affected by the pandemic. Revenues in our Financial Services segment in our Continental Europe region were negatively impacted by $118 million dueProducts and Resources and Health Sciences segments. Our recently completed acquisitions contributed 110 basis points to the Proposed Exit. Additionally, we continued to see certain financial services and healthcare clients transition the support of some of their legacy systems and operations in-house. Revenuerevenue growth, among our life sciences clients was driven by revenues from Zenith and increased demand for our services among pharmaceutical companies while revenues from our healthcare clients benefited from stronger software license sales. Our manufacturing, logistics, energy and utilities clients withinprimarily benefiting our Products and Resources segment generated revenue growth due to our clients' continued adoption and integration of digital technologies. Revenues among our technology clients in our Communications,Communications, Media and Technology segment in the North America region were negatively impacted by approximately $178 million due to our exit from certain content-related services. We continue to see growing demand from our technology clients for other more strategic digital content services. Additionally, the year-over-year change in our revenues included 210 basis points of benefit from our recently completed acquisitions, including Collaborative Solutions, Zenith and Contino.segments. Our operating margin and Adjusted Operating Margin2 decreased to 12.7%was 13.9% and 14.4%15.1%, respectively, for the year ended December 31, 2020 from 14.6%2023. This compares to operating margin and 16.6%, respectively,Adjusted Operating Margin of 15.3% for the year ended December 31, 2019.2022. Our 2023 GAAP and Adjusted Operating Margin2 Margins were adverselynegatively impacted by higher incentive-basedincreased compensation accrual rates, investments intended to drive organic and inorganic revenue growth, the impact of the Proposed Exit, the decline in revenues brought on by the COVID-19 pandemic and the impact of the ransomware attack on both revenues and costs. These impacts were partially offset by a significant decrease in travel and entertainment expenses due to the COVID-19 pandemic, the cost savings generatedcosts, primarily as a result of two merit increase cycles for the 2020 Fit for Growth Plan, lower immigration costs andmajority of our employees since October 2022, partially offset by the benefit of the depreciation of the Indian rupee against the U.S. dollar.dollar, savings generated from our NextGen program and improvement in profitability of a large contract with a Health Sciences client in 2023. In addition, our 2019 GAAP operating margin included a 0.7% negative impact of the incremental accrual in 2019 related to the India Defined Contribution Obligation as discussed in Note 154 to our audited consolidated financial statements, while our 20202023 GAAP operating margin was negatively impacted by COVID-19 Charges.
2 Constant currency revenue growth (CC) andthe NextGen charges, which were excluded from our Adjusted Operating Margin are not measurementsMargin.
As a global professional services company, we compete on the basis of financial performance preparedthe knowledge, experience, insights, skills and talent of our employees and the value they can provide to our clients. We closely monitor attrition trends focusing on the metric that we believe is most relevant to our business. This metric, which we refer to as Voluntary Attrition - Tech Services, includes all voluntary separations with the exception of employees in accordanceour Intuitive Operations and Automation practice. For the year ended December 31, 2023 our Voluntary Attrition - Tech Services was 13.8% as compared to 25.6% for the year ended December 31, 2022. We finished 2023 with GAAP. See “Non-GAAP Financial Measures” for more information and a reconciliationapproximately 347,700 employees as compared to 355,300 employees at the most directly comparable GAAP financial measure, as applicable.
Business Outlook We have fourSee "Overview" within Part I, Item 1. Business for information on our six strategic priorities as we seek to increase our commercial momentum and accelerate growth. These strategic priorities are:•Accelerating digital - growing our digital business organically and inorganically;priorities.
•Globalizing Cognizant - growing our business in key international markets and diversifying leadership, capabilities and delivery footprint;
•Repositioning our brand - improving our global brand recognition and becoming better known as a global digital partner to the entire C-suite; and
•Increasing our relevance to our clients - leading with thought leadership and capabilities to address clients' business needs.
We continue to expect the long-term focus of our clients to be on their digital transformation into software-driven, data-enabled, customer-centric and differentiated businesses. As ourWe believe clients seek to optimize the cost of supporting their legacy systems and operations, our core portfolio of services may be subject to pricing pressure and lower demand due to clients transitioning certain work in-house. At the same time, clients continue to adopt and integrate digital technologies and their demand for our digital operations services and solutions has only increased since the beginning of the COVID-19 pandemic, as demand for mobile workplace solutions, e-commerce, automation and AI and cybersecurity services and solutions has grown. Our clients will likely continue to contend with industry-specific changes driven by evolving digital technologies, uncertainty in the regulatory environment, industry consolidation and convergence as well as international trade policiespolicies and other macroeconomic and geopolitical factors, including the increasing uncertainty related to the global economy, which couldhas affected and may continue to affect their demand for our services. The COVID-19 pandemic may continue
We are focused on expanding our partner ecosystem across a broad range of technology companies, including hyperscalers, cloud providers, enterprise software companies, best-in-class digital software enterprises and emerging start-ups. We believe this partner ecosystem will enable us to negatively impact demand, particularly amongenhance our retail, consumer goods, travel and hospitality clients withininnovative, integrated offerings, by combining third-party products with our Products and Resources segment as well as communications and media clientsservice solutions, to deliver enterprise-wide digital transformation. We increasingly use AI-based technologies, including GenAI, in our Communications, Mediaclient offerings and Technology segment. Theour own internal operations. AI technologies and services are part of a highly competitive and rapidly evolving market. We plan to make significant and evolving nature ofinvestments in our AI capabilities to meet the COVID-19 pandemic makes it difficult to estimate its future impact on our ongoing business, results of operations and overall financial performance. See Part I, Item 1A. Risk Factors. As a global professional services company, we compete on the basis of the knowledge, experience, insights, skills and talentneeds of our employeesclients and theharness its value they can providein a flexible, secure, scalable and responsible way. As AI-based technologies evolve, we expect that some services that we currently perform for our clients will be replaced by AI or forms of automation. This may lead to our clients. Competitionreduced demand for skilled labor is intense and our success is dependent, in large part, oncertain services or harm our ability to keepobtain favorable pricing or other terms for our supply of skilled employees, in particular those with experience in key digital areas, in balance with client demand around the world. As such, we will continue to focus on recruiting, talent management and employee engagement to attract and retain our employees.
We will continue to pursue strategic acquisitions, investments and alliances that will expand our talent, experience and capabilities in key digital areas or in particular geographies or industries.services.
In addition, our future results may be affected by immigration law changes that may impact our abilityconnection with the NextGen program, in 2023 we incurred $229 million in employee separation, facility exit and other costs. We currently expect to do business or significantly increase ourincur total costs of doing business,approximately $300 million in connection with the NextGen program, with approximately $70 million of such costs anticipated in 2024. In addition to the NextGen program, potential tax law changes and other potential regulatory changes, including possible U.S. corporate income tax reform and potentially increased costs in 2021 and future years for employment and post-employment benefits in India as a result of the issuance of the Code in late 2020, as well as costs related to the potential resolution of legal and regulatory matters discussed in Note 15 toon Social Security, 2020, among other items, may impact our consolidated financial statements.future results. For additional information, see Part I, Item 1A. Risk FactorsFactors..
For a discussion of our results of operations for the year ended December 31, 2018, including a year-to-year comparison between 2019 and 2018, refer to Part II, Item 7, "Management's Discussion and Analysis of Financial Condition and Results of Operations" in our Annual Report Form 10-K for the year ended December 31, 2019.
The Year Ended December 31, 2020 Compared to The Year Ended December 31, 2019
The following table sets forth certain financial data for the years ended December 31:
| | | | | | | | | | | | | | | | | | | | | | | | | | | | | | | | | | | | | | | | | | | | | | | | | | | % of | | | | % of | | | | | | Increase / Decrease | | | | | | | 2020 | | Revenues | | 2019 | | Revenues | | | | | | $ | | % | | | | | | | (Dollars in millions, except per share data) | | | | Revenues | | $ | 16,652 | | | 100.0 | | $ | 16,783 | | | 100.0 | | | | | | $ | (131) | | | (0.8) | | | | | | Cost of revenues(1) | | 10,671 | | | 64.1 | | 10,634 | | | 63.4 | | | | | | 37 | | | 0.3 | | | | | | Selling, general and administrative expenses(1) | | 3,100 | | | 18.6 | | 2,972 | | | 17.7 | | | | | | 128 | | | 4.3 | | | | | | | Restructuring charges | | 215 | | | 1.3 | | 217 | | | 1.3 | | | | | | (2) | | | (0.9) | | | | | | | Depreciation and amortization expense | | 552 | | | 3.3 | | 507 | | | 3.0 | | | | | | 45 | | | 8.9 | | | | | | | Income from operations | | 2,114 | | | 12.7 | | 2,453 | | | 14.6 | | | | | | (339) | | | (13.8) | | | | | | | Other income (expense), net | | (18) | | | | | 90 | | | | | | | | | (108) | | | (120.0) | | | | | | | Income before provision for income taxes | | 2,096 | | | 12.6 | | 2,543 | | | 15.2 | | | | | | (447) | | | (17.6) | | | | | | | Provision for income taxes | | (704) | | | | | (643) | | | | | | | | | (61) | | | 9.5 | | | | | | | Income (loss) from equity method investments | | — | | | | | (58) | | | | | | | | | 58 | | | (100.0) | | | | | | | Net income | | $ | 1,392 | | | 8.4 | | $ | 1,842 | | | 11.0 | | | | | | $ | (450) | | | (24.4) | | | | | | | Diluted EPS | | $ | 2.57 | | | | | $ | 3.29 | | | | | | | | | $ | (0.72) | | | (21.9) | | | | | | Other Financial Information 3 | | | | | | | | | | | | | | | | | | | | | | Adjusted Income From Operations and Adjusted Operating Margin | | $ | 2,394 | | | 14.4 | | $ | 2,787 | | | 16.6 | | | | | | (393) | | | (14.1) | | | | | | | Adjusted Diluted EPS | | $ | 3.42 | | | | | $ | 3.99 | | | | | | | | | $ | (0.57) | | | (14.3) | | | | | |
(1) Exclusive of depreciation and amortization expense.
Revenues - Overall
During 2020, revenues decreased by $131 million as compared to 2019, representing a decline of 0.8%, or 0.7% on a constant currency basis3. Across all business segments and regions, revenues were negatively impacted by the ransomware attack and the COVID-19 pandemic. In addition, our exit from certain content-related services and the Proposed Exit negatively impacted our revenues by $178 million and $118 million, respectively. We continue to experience pricing pressure within our core portfolio of services as our clients optimize the cost of supporting their legacy systems and operations. At the same time, clients are adopting and integrating digital technologies and their demand for our digital services and solutions has continued to increase since the beginning of the COVID-19 pandemic as a result of increased demand for mobile workplace solutions, e-commerce, automation and AI and cybersecurity services and solutions. Additionally, the year-over-year change in our revenues included 210 basis points of benefit from our recently completed acquisitions, including Collaborative Solutions, Zenith and Contino. Revenues from clients added during 2020, including those related to acquisitions, were $342 million.
32 Adjusted Income From Operations, Adjusted Operating Margin Adjusted Diluted EPS and constant currency revenue growth are not measurements of financial performance prepared in accordance with GAAP. See “Non-GAAP Financial Measures” for more information and reconciliations to the most directly comparable GAAP financial measures, as applicable.measures.
| | | | | | | | | | Cognizant | 29 | December 31, 2023 Form 10-K |
For a discussion of our results of operations for the year ended December 31, 2021, including a year-to-year comparison between 2022 and 2021, refer to Part II, Item 7, "Management's Discussion and Analysis of Financial Condition and Results of Operations" in our Annual Report Form 10-K for the year ended December 31, 2022. The Year Ended December 31, 2023 Compared to The Year Ended December 31, 2022 The following table sets forth certain financial data for the years ended December 31: | | | | | | | | | | | | | | | | | | | | | | | | | | | | | | | | | | | | | | | | | | | | % of | | | | % of | | | Increase / Decrease | | (Dollars in millions, except per share data) | | 2023 | | Revenues | | 2022 | | Revenues | | | $ | | % | | Revenues | | $ | 19,353 | | | 100.0 | | $ | 19,428 | | | 100.0 | | | $ | (75) | | | (0.4) | | Cost of revenues(a) | | 12,664 | | | 65.4 | | 12,448 | | | 64.1 | | | 216 | | | 1.7 | | Selling, general and administrative expenses(a) | | 3,252 | | | 16.8 | | 3,443 | | | 17.7 | | | (191) | | | (5.5) | | | Restructuring charges | | 229 | | | 1.2 | | — | | | — | | | 229 | | | N/A | | Depreciation and amortization expense | | 519 | | | 2.7 | | 569 | | | 2.9 | | | (50) | | | (8.8) | | | Income from operations and operating margin | | 2,689 | | | 13.9 | | 2,968 | | | 15.3 | | | (279) | | | (9.4) | | | Other income (expense), net | | 98 | | | | | 48 | | | | | | 50 | | | 104.2 | | | Income before provision for income taxes | | 2,787 | | | 14.4 | | 3,016 | | | 15.5 | | | (229) | | | (7.6) | | | Provision for income taxes | | (668) | | | | | (730) | | | | | | 62 | | | (8.5) | | | Income (loss) from equity method investments | | 7 | | | | | 4 | | | | | | 3 | | | 75.0 | | | Net income | | $ | 2,126 | | | 11.0 | | $ | 2,290 | | | 11.8 | | | $ | (164) | | | (7.2) | | | Diluted EPS | | $ | 4.21 | | | | | $ | 4.41 | | | | | | $ | (0.20) | | | (4.5) | | Other Financial Information 3 | | | | | | | | | | | | | | | Adjusted Income From Operations and Adjusted Operating Margin | | $ | 2,918 | | | 15.1 | | $ | 2,968 | | | 15.3 | | | $ | (50) | | | (1.7) | | | Adjusted Diluted EPS | | $ | 4.55 | | | | | $ | 4.40 | | | | | | $ | 0.15 | | | 3.4 | |
(a) Exclusive of depreciation and amortization expense N/A Not applicable3
During the year ended December 31, 2023, revenues declined by $75 million as compared to the twelve months ended December 31, 2022, representing a decline of 0.4%, or a decline of 0.3% on a constant currency basis.3Our recently completed acquisitions contributed 110 basis points of growth to the change in revenues.
3 Adjusted Income from Operations, Adjusted Operating Margin, Adjusted Diluted EPS and constant currency revenue growth are not measures of financial performance prepared in accordance with GAAP. See “Non-GAAP Financial Measures” for more information and reconciliations to the most directly comparable GAAP financial measures, as applicable. | | | | | | | | | | Cognizant | 30 | December 31, 2023 Form 10-K |
| | | | Revenues - Reportable Business Segments and Geographic Markets |
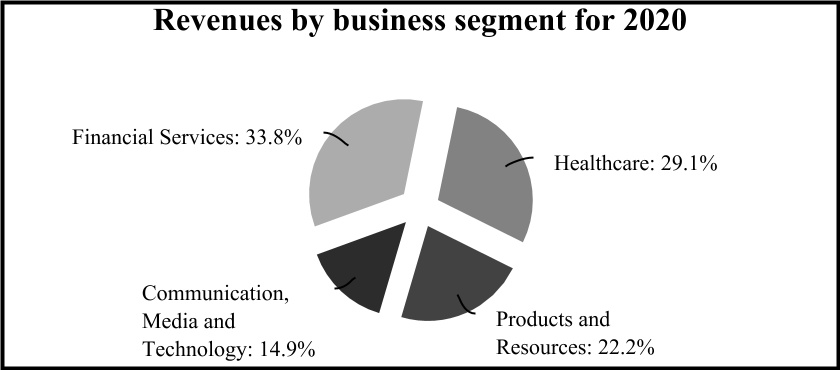
Revenues by reportableof $19,353 million across our business segmentsegments and geographies were as follows:follows for the year ended December 31, 2023: | | | | | | | | | | | | | | | | | | | | | | | | | | | | | | | | | | | | | | | | | | | 2020 | | 2019 | | | | Increase / (Decrease) | | | | | | | | $ | | % | | CC%4 | | | | | | | | | (Dollars in millions) | | Financial Services | | $ | 5,621 | | | $ | 5,869 | | | | | $ | (248) | | | (4.2) | | | (4.0) | | | | | | | | | Healthcare | | 4,852 | | | 4,695 | | | | | 157 | | | 3.3 | | | 3.1 | | | | | | | | | Products and Resources | | 3,696 | | | 3,770 | | | | | (74) | | | (2.0) | | | (1.7) | | | | | | | | | Communications, Media and Technology | | 2,483 | | | 2,449 | | | | | 34 | | | 1.4 | | | 1.6 | | | | | | | | | Total revenues | | $ | 16,652 | | | $ | 16,783 | | | | | $ | (131) | | | (0.8) | | | (0.7) | | | | | | | |
Financial Services | | | | | | | | | | | | | | | | | | | | | | | | | | 2023 as compared to 2022 | | | | | Increase / (Decrease) | | (Dollars in millions) | | $ | | % | | CC %4 | | | Financial Services | | | | | $ | (263) | | | (4.3) | | | (4.2) | | | | Health Sciences | | | | | 43 | | | 0.8 | | | 0.5 | | | | Products and Resources | | | | | 62 | | | 1.4 | | | 1.5 | | | | CMT | | | | | 83 | | | 2.6 | | | 3.1 | | | | Total revenues | | | | | $ | (75) | | | (0.4) | | | (0.3) | | |
| | | | | | | | | | | | | | | | | | | | | | | | | | 2023 as compared to 2022 | | | | | Increase / (Decrease) | | (Dollars in millions) | | $ | | % | | CC %4 | | | North America | | | | | $ | (172) | | | (1.2) | | | (1.1) | | | | United Kingdom | | | | | 75 | | | 4.1 | | | 3.5 | | | | Continental Europe | | | | | 114 | | | 6.4 | | | 4.3 | | | | Europe - Total | | | | | 189 | | | 5.2 | | | 3.9 | | | | Rest of World | | | | | (92) | | | (6.6) | | | (2.6) | | | | Total revenues | | | | | $ | (75) | | | (0.4) | | | (0.3) | | |
Revenues from
Change in revenues was driven by the following factors: •Reduced demand for discretionary work negatively impacted revenues across all segments, and primarily in North America. Banking clients in our Financial Services segment, declined 4.2%, or 4.0% on a constant currency basis4,retail and consumer goods clients in 2020. Revenues among our insurance clients decreased by $85 million as compared to a decrease of $163 million from our banking clients. The Proposed Exit negatively impacted our revenues from banking clients by $118 million. Revenues from clients added during 2020, including those related to acquisitions, were $70 million. Moderate revenue growth generated by our digital services did not fully offset revenue declines attributable to certain financial services clients who continued to transition the support of some of their legacy systems and operations in-house. Healthcare
Revenues from our Healthcare segment grew 3.3%, or 3.1% on a constant currency basis4, in 2020. Revenues in this segment increased by $173 million among our life science clients while revenues from our healthcare clients decreased $16 million. Revenue growth among our life sciences clients was driven by revenues from Zenith and increased demand for our services among pharmaceutical companies. Revenues from our healthcare clients were negatively impacted by the establishment of an offshore captive by a large client, partially offset by the 2019 negative impact of a customer dispute with a healthcare client related to a large volume based contract. Additionally, revenues from our healthcare clients benefited from stronger software license sales in 2020. Revenues from clients added during 2020, including those related to acquisitions, were $50 million. Demand from our healthcare clients may continue to be affected by uncertainty in the regulatory and political environment while demand from our life sciences clients may be affected by industry consolidation.
Products and Resources
Revenues from our Products and Resources segment declined 2.0%, or 1.7% on a constant currency basis4,and clients in 2020. Retail, consumer goods, travel and hospitality clients were particularly adversely affected by the COVID-19 pandemic. Thus, revenue from our travel and hospitality clients and from our retail and consumer goods clients decreased by $126 million and $100 million, respectively. Revenues from our manufacturing, logistics, energy and utilities clients increased by $152 million due to our clients' adoption and integration of digital technologies. Revenues from clients added during 2020, including those related to acquisitions, were $105 million.
Communications, Media and Technology
Revenues from our Communications, Media and Technology segment grew 1.4%, or 1.6% on a constant currencywere particularly affected;
•Recently completed acquisitions which contributed 110 basis points of growth to the overall change in revenues, including 230 basis points of growth to our Products and Resources segment (primarily in North America) and 290 basis points of growth to our Communications, Media and Technology segment (primarily in Continental Europe and the United Kingdom); •4,North America revenues in 2020. Revenues from our communicationsthe Communications, Media and media clients increased $72 million while revenues from our technology clients decreased $38 million. RevenuesTechnology segment included growing demand among our technologythe largest clients in this segment, including for services related to digital content; •The resale of third-party products in North America in connection with our integrated offerings strategy, primarily in the Financial Services and Products and Resources segments, contributed 70 basis points of growth to the overall change in revenue; •North America revenues in the Communications, Media and Technology and Products and Resources segments were negatively impacted by approximately $178 million due to our exit from certain content-related services. Additionally, revenues were negativelypositively impacted by the COVID-19 pandemic, particularly amongramp up of several recently won large deals; •Revenue growth in the United Kingdom was driven by expansion of work public sector clients included in our communicationsCommunications, Media and media clients, partially offsetTechnology and Financial Services segments; •Revenues in the Continental Europe region were driven by growingincreased demand from pharmaceutical clients within the Health Sciences segment and automotive clients within the Products and Resources segment; and •Revenue decline in our technology clients for other more strategic digital content services. Revenues from clients added during 2020, including those related to acquisitions, were $117 million.Rest of World region was primarily driven by weakness in the Financial Services segment and the negative impact of foreign currency exchange rate movements.
4 Constant currency revenue growth is not a measurementmeasure of financial performance prepared in accordance with GAAP. See “Non-GAAP Financial Measures” for more information. | | | | | | | | | | Cognizant | 31 | December 31, 2023 Form 10-K |
Revenues - Geographic Locations | | | | Cost of Revenues (Exclusive of Depreciation and Amortization Expense) |
Revenues by geographic market, as determined by client location, were as follows: | | | | | | | | | | | | | | é | $216M | | | | | | | | | é | 1.3% as a % of revenues | | | | | | | ¡% of Revenues | | | | | | |
| | | | | | | | | | | | | | | | | | | | | | | | | | | | | | | | | | | | | | | | | | | 2020 | | 2019 | | | | Increase / (Decrease) | | | | | | | | $ | | % | | CC %5 | | | | | | | | | (Dollars in millions) | | | | North America | | $ | 12,581 | | | $ | 12,726 | | | | | $ | (145) | | | (1.1) | | | (1.1) | % | | | | | | | | United Kingdom | | 1,335 | | | 1,313 | | | | | 22 | | | 1.7 | | | 1.0 | % | | | | | | | | Continental Europe | | 1,653 | | | 1,691 | | | | | (38) | | | (2.2) | | | (3.3) | % | | | | | | | | Europe - Total | | 2,988 | | | 3,004 | | | | | (16) | | | (0.5) | | | (1.4) | % | | | | | | | | Rest of World | | 1,083 | | | 1,053 | | | | | 30 | | | 2.8 | | | 6.4 | % | | | | | | | | Total revenues | | $ | 16,652 | | | $ | 16,783 | | | | | $ | (131) | | | (0.8) | | | (0.7) | % | | | | | | |
North America continues to be our largest market, representing 75.6% of total 2020 revenues. Our North America region was negatively impacted by our exit from certain content-related services in our Communications, Media and Technology segment and the transition of the support of legacy systems for certain financial services and healthcare clients in-house. Our Continental Europe region was negatively impacted by the Proposed Exit, partially offset by growth from our life sciences customers. Revenues in our United Kingdom region have particularly benefited from our recently completed acquisitions. Revenue growth in our Rest of World region was driven by our Communications, Media and Technology clients.
Cost of Revenues (Exclusive of Depreciation and Amortization Expense)
Our cost of revenues consists primarily of salaries, incentive-based compensation, stock-based compensation expense, employee benefits, project-related immigration and travel for technical personnel, subcontracting and equipment costs of third-party products and services relating to revenues. Our cost of revenues increased by 0.3% during 2020 as compared to 2019, increasing as a percentage of revenues to 64.1% in 2020 compared to 63.4% in 2019. The increase, in cost of revenues, as a percentage of revenues, was due primarily to an increase in costs related to higher incentive-based compensation accrual rates in 2020 and the impact of the Proposed Exit, the COVID-19 pandemic and the ransomware attack. These impacts were partially offset by a significant decrease in travel and entertainment costs for delivery personnel, primarily as a result of a reduction in travel due totwo merit increase cycles for the COVID-19 pandemic, the cost savings generated as a resultmajority of our cost optimization strategy andemployees since October 2022, partially offset by the benefit of the depreciation of the Indian rupee against the U.S. dollar.dollar and improvement in profitability of a large contract with a Health Sciences client in 2023. | | | | SG&A Expenses (Exclusive of Depreciation and Amortization Expense) |
SG&A expenses consist primarily of salaries, incentive-based compensation, stock-based compensation expense, employee benefits, immigration, travel, marketing, communications, management, finance, administrative and occupancy costs. SG&A expenses increased by 4.3% during 2020 as compared to 2019, increasing as a percentage of revenues to 18.6% in 2020 as compared to 17.7% in 2019. The increase,decrease, as a percentage of revenues, was primarily due primarily to an increase in costs related to higher incentive-based compensation accrual rates in 2020, investments intended to drive organic and inorganic revenue growthsavings generated from our NextGen program and the impactsbeneficial impact of the COVID-19 pandemic, the Proposed Exit and the ransomware attack. These negative impacts wereforeign currency exchange rate movements, partially offset by a significant decrease in travel and entertainmenthigher compensation costs, primarily as a result of a reduction in travel due totwo merit increase cycles for the COVID-19 pandemic and lower immigration costs, in addition to the $117 million incremental accrual in 2019 related to the India Defined Contribution Obligation as discussed in Note 15 tomajority of our consolidated financial statements.employees since October 2022. | | | | | | | | | | | | | | ê | $191M | | | | | | | | | ê | 0.9% as a % of revenues | | | | | | | ¡% of Revenues | | | | | | |
Restructuring charges consist of our 2020 Fit for Growth Plan and our realignmentcosts related to the NextGen program. Restructuring charges were $215$229 million or 1.3%1.2%, as a percentage of revenues during 2020, as compared to $217 million, or 1.3% as a percentage of revenues, during 2019.for the year ended December 31, 2023. For further detail on our restructuring charges see Note 4 to our audited consolidated financial statements. | | | | Depreciation and Amortization Expense |
Depreciation and amortization expense increaseddecreased by 8.9% during 20208.8%, and by 0.2% as a percentage of revenues, in 2023 as compared to 2019. The increase was2022, primarily driven by a reduction in amortization expense due to procurementcertain intangible assets reaching the end of additional computer equipment primarily to provision work-from-home arrangementstheir useful lives and amortization of intangiblessavings generated from recently completed acquisitions.our NextGen program. | | | Operating Margin and Adjusted Operating Margin5 - Overall |
Our 2023 operating margin and Adjusted Operating Margin5 were negatively impacted by increased compensation costs, primarily as a result of two merit increase cycles for the majority of our employees since October 2022, partially offset by the benefit of the depreciation of the Indian rupee against the U.S. dollar, savings generated from our NextGen program and improvement in profitability of a large contract with a Health Sciences client in 2023. In addition, as discussed in Note 4 to our audited consolidated financial statements, our 2023 GAAP operating margin was negatively impacted by the NextGen charges, which were excluded from our Adjusted Operating Margin5.
5 Constant currency revenue growth isAdjusted Income From Operations and Adjusted Operating Margin are not a measurementmeasurements of financial performance prepared in accordance with GAAP. See “Non-GAAP Financial Measures” for more information.information and reconciliations to the most directly comparable GAAP financial measures, as applicable. | | | | | | | | | | Cognizant | 32 | December 31, 2023 Form 10-K |
Operating Margin - Overall
Our operating margin and Adjusted Operating Margin6 decreased to 12.7% and 14.4%, respectively,A predominant portion of our costs in 2020 from 14.6% and 16.6%, respectively, during 2019. Our GAAP and Adjusted Operating Margin6 were adversely impacted by higher incentive-based compensation accrual rates, investments intended to drive organic and inorganic revenue growth, the impact of the Proposed Exit, the declineIndia are denominated in revenues brought on by the COVID-19 pandemic and the impact of the ransomware attack on both revenues and costs. These impacts were partially offset by a significant decrease in travel and entertainment expenses due to the COVID-19 pandemic, the cost savings generated as a result of the 2020 Fit for Growth Plan, lower immigration costs and the depreciation of the Indian rupee, against representing approximately 24% of our global operating costs during the U.S. dollar. In addition, our 2019 GAAP operating margin included a 0.7% negative impact of the incremental accrual in 2019 related to the India Defined Contribution Obligation as discussed inyear ended Note 15December 31, 2023. These costs are subject to our consolidated financial statements, while our 2020 GAAP operating margin was negatively impacted by COVID-19 Charges.Excluding the impact of applicable designated cash flow hedges, the depreciation of the Indian rupee against the U.S. dollar positively impacted our operating margin by approximately 92 basis points or 0.92 percentage points in 2020, while in 2019 the depreciation of the Indian rupee against the U.S. dollar positively impacted our operating margin by approximately 53 basis points or 0.53 percentage points. Each additional 1.0% change inforeign currency exchange rate between the Indian rupee and the U.S. dollar willfluctuations, which have the effectan impact on our results of moving our operating margin by approximately 17 basis points or 0.17 percentage points.
operations. We enter into foreign exchange derivative contracts to hedge certain Indian rupee denominated payments in India. These hedges are intended to mitigate the volatility of the changes in the exchange rate between the U.S. dollar and the Indian rupee. TheNet of the impact of the settlementhedges, the depreciation of the Indian rupee contributed 90 basis points to the improvement in our cash flow hedges was immaterial in 2020 and 2019. Our most significant costs are the salaries and related benefitsoperating margin for our employees. These costs are affected by the impact of inflation. In certain regions, competition for professionals with the advanced technical skills necessary to perform our services has caused wages to increase at a rate greater than the general rate of inflation.
We finished the year ended December 31, 2020 with approximately 289,500 employees, which is a decrease of 3,0002023 as compared to December 31, 2019. For2022.
Excluding the three months ended December 31, 2020, annualized turnover, including both voluntary and involuntary, was approximately 19.0%. Turnover for the years ended December 31, 2020 and 2019, including both voluntary and involuntary, was approximately 20.6% and 21.7%. Voluntary attrition normally constitutes the significant majorityimpact of our attrition. In 2020, we saw elevated levels of involuntary attrition due to our Fit for Growth Plan, including the exit from certain content-related services. We also saw a decrease in voluntary attrition from historic levels in the early stages of the COVID-19 pandemic. Both voluntary and involuntary attrition are weighted towards our more junior employees. Segment Operating Profit and Margin
Segment operating profit and margin were as follows:
| | | | | | | | | | | | | | | | | | | | | | | | | | | | | | | | | | | | | 2020 | | Operating Margin % | | 2019 | | Operating Margin % | | | | | | Increase /(Decrease) | | | | (Dollars in millions) | | Financial Services | $ | 1,449 | | | 25.8 | | | $ | 1,605 | | | 27.3 | | | | | | | $ | (156) | | | | | Healthcare | 1,383 | | | 28.5 | | | 1,261 | | | 26.9 | | | | | | | 122 | | | | | Products and Resources | 1,078 | | | 29.2 | | | 1,028 | | | 27.3 | | | | | | | 50 | | | | | Communications, Media and Technology | 794 | | | 32.0 | | | 732 | | | 29.9 | | | | | | | 62 | | | | | Total segment operating profit and margin | 4,704 | | | 28.2 | | | 4,626 | | | 27.6 | | | | | | | 78 | | | | | Less: unallocated costs | 2,590 | | | | | 2,173 | | | | | | | | | 417 | | | | | Income from operations | $ | 2,114 | | | 12.7 | | | $ | 2,453 | | | 14.6 | | | | | | | $ | (339) | | | | | | | | | | | | | | | | | | | | | | | | | | | | | | | | | | | | | | | | | | | | | | | | | | | | | | | | | | | | | | | | | | | | | | | | | | | | | | | | | | | | | | | | | | | | | | | | | | | |
Across all our business segments, operating margins benefited from a significant decrease in travel and entertainment costs due to COVID-19 related reductions in travel, cost savings generated by our cost optimization initiatives andapplicable designated cash flow hedges, the depreciation of the Indian rupee against the U.S. dollar positively impacted our operating margin by approximately 96 basis points in 2023. Each additional 1.0% change in exchange rate between the Indian rupee and the U.S. dollar will have the effect of moving our operating margin by approximately 19 basis points (excluding the impact of our cash flow hedges). In 2023, the settlement of our cash flow hedges negatively impacted our operating margin by approximately 13 basis points, compared to a negative impact of 7 basis points in 2022.
We finished the year ended December 31, 2023 with approximately 347,700 employees as compared to 355,300 employees for the year ended December 31, 2022. For the year ended December 31, 2023 our Voluntary Attrition - Tech Services was 13.8% as compared to 25.6% for the year ended December 31, 2022. In 2023, we made certain changes to the internal measurement of segment operating profit for the purpose of evaluating segment performance and resource allocation. The primary reason for the change was to reflect a more complete cost of delivery. Specifically, segment operating profit now includes an allocation of both SG&A costs related to our integrated practices and the excess or shortfall of incentive-based compensation for commercial and delivery employees as compared to target, which were previously included in "unallocated costs." We have reported 2023 segment operating profits using the new allocation methodology and have recast the 2022 and 2021 results to conform to the new methodology. See Note 18 to our audited consolidated financial statements for the recast 2021 segment operating profits. Segment operating profit and operating margin percentage were as follows:
| | | | | | | | | | | | | | | | | | | | Segment operating profit | | % | Segment operating margin |
In 2023, segment operating margins across all our segments were negatively impacted by increased compensation costs, primarily as a result of two merit increase cycles for the majority of our employees since October 2022, partially offset by investments intended to drive organic and inorganic revenue growth and the negative impact on revenuesbenefit of the COVID-19 pandemicdepreciation of the Indian rupee against the U.S. dollar and the ransomware attack. The 2020savings generated from our NextGen program. In addition, 2023 segment operating margin in our Financial ServicesHealth Sciences benefited from the improvement in profitability of a large contract with a payer client, while segment operating profit in Communications, Media and Technology was negatively impactedaffected by higher costs typical to the Proposed Exit. Additionally, the 2019 operating margininitial phases of several recently won large deals in our Healthcare segment was negatively impacted by client mergers within the segment and a dispute with a customer related to a large volume based contract. The increase in unallocated costs in 2020 compared to 2019 is primarily duethis segment. | | | | | | | | | | Cognizant | 33 | December 31, 2023 Form 10-K |
6 Adjusted Operating Margin is not a measurement of financial performance prepared in accordance with GAAP. See “Non-GAAP Financial Measures” for more information and a reconciliation to the most directly comparable GAAP financial measure.
Total segment operating profit was as follows for the year ended December 31: | | | | | | | | | | | | | | | | | | | | | | | | | | | | | | | (Dollars in millions) | 2023 | | % of Revenues | | 2022 | | % of Revenues | | Increase / (Decrease) | | Total segment operating profit | $ | 4,117 | | | 21.3 | | | $ | 4,353 | | | 22.4 | | | $ | (236) | | | Less: unallocated costs | 1,428 | | | 7.4 | | | 1,385 | | | 7.1 | | | 43 | | | Income from operations | $ | 2,689 | | | 13.9 | | | $ | 2,968 | | | 15.3 | | | $ | (279) | |
to a smaller shortfall
The increase in 2020 than in 2019 of incentive-based compensationunallocated costs for 2023 as compared to target, COVID-19 Charges and costs related to the ransomware attack, partially offset2022 was primarily driven by the 2019 India Defined Contribution Obligation discussedNextGen charges in 2023, see Note 154 to our audited consolidated financial statements.statements, partially offset by lower corporate expenses. | | | | Other Income (Expense), Net |
Total other income (expense), net consists primarily of foreign currency exchange gains and losses, interest income and interest expense. The following table sets forth total other income (expense), net for the years ended December 31: | | 2020 | | 2019 | | | Increase / Decrease | | | (in millions) | | Foreign currency exchange (losses) | $ | (53) | | | $ | (73) | | | | $ | 20 | | | | (in millions) | | | (in millions) | | | (in millions) | | | Foreign currency exchange gains (losses) | | | Foreign currency exchange gains (losses) | | | Foreign currency exchange gains (losses) | | | (Losses) gains on foreign exchange forward contracts not designated as hedging instruments | (Losses) gains on foreign exchange forward contracts not designated as hedging instruments | (63) | | | 8 | | | | (71) | | | | Foreign currency exchange (losses), net | (116) | | | (65) | | | | (51) | | | | (Losses) gains on foreign exchange forward contracts not designated as hedging instruments | | | (Losses) gains on foreign exchange forward contracts not designated as hedging instruments | | | Foreign currency exchange gains (losses), net | | | Foreign currency exchange gains (losses), net | | | Foreign currency exchange gains (losses), net | | | Interest income | | | Interest income | | | Interest income | Interest income | 119 | | | 176 | | | | (57) | | | | Interest expense | Interest expense | (24) | | | (26) | | | | 2 | | | | Interest expense | | | Interest expense | | | Other, net | | | Other, net | | | Other, net | Other, net | 3 | | | 5 | | | | (2) | | | | Total other income (expense), net | Total other income (expense), net | $ | (18) | | | $ | 90 | | | | $ | (108) | | | | Total other income (expense), net | | | Total other income (expense), net | |
The foreign currency exchange gains and losses were primarily attributed to the remeasurement of the Indian rupee denominated net monetary assets and liabilities in our U.S. dollar functional currency India subsidiaries and, to a lesser extent, the remeasurement of other net monetary assets and liabilities denominated in currencies other than the functional currencies of our subsidiaries. The gains and losses on our foreign exchange forward contracts not designated as hedging instruments related to the realized and unrealized gains and losses on foreign exchange forward contractscontracts entered into to offset our foreign currency exposure to non-U.S. dollar denominated net monetary assets and liabilities. exposures. As of December 31, 2020,2023, the notional value of our undesignated hedges was $637$1,317 million. The decreaseincrease in interest income of $57 millionand interest expense was each primarily attributable to lower yieldshigher interest rates in 2020. Provision for Income Taxesthe current period.
The provision for income taxes was $704 million in 2020 and $643 million in 2019. | | | | Provision for Income Taxes |
 | | | | | | | | | | | | | | ê | $62M | | | | ¡Effective Income Tax Rateê0.2% | | | | |
The effective income tax rate increased to 33.6% in 2020 as compared to 25.3% in 2019decreased primarily driven by the Tax on Accumulated Indian Earnings, the impactgeographical mix of the Proposed Exit, which was not deductible for tax purposes, and the depreciation of the Indian rupee against the U.S. dollar, which resultedearnings in non-deductible foreign currency exchange losses in our consolidated statement of operations. Income (loss) from equity method investments
In 2019, we recorded an impairment charge of $57 million on one of our equity method investments2023 as further described incompared to 2022. See Note 511 to our consolidated financial statements.statements for additional information.In December 2021, the OECD adopted model rules for a global framework to impose a 15% global minimum tax referred to as Pillar Two with a targeted effective date of January 1, 2024. The OECD has continued and is continuing to issue additional guidance on the operation of the model rules. While the United States has not enacted Pillar Two, certain countries in which we operate have adopted their own version of the Pillar Two model rules. Although Management continues to monitor additional guidance from the OECD and countries’ implementation of Pillar Two, based on current guidance, we believe that our net income, cash flows, or financial condition will not be materially impacted by Pillar Two. Net IncomeTh
Net income was $1,392 million in 2020 and $1,842 million in 2019. Net income as a percentage of revenues decreased to 8.4% in 2020 from 11.0% in 2019. Thee decrease in net income was primarily driven by lower income from operations, partially offset by higher foreign currency exchange losses (inclusive of losses on our foreign exchange forward contracts not designated as hedging instruments), lower interest income and a higherlower provision for income taxes.taxes in 2023.
 | | | | | | | | | | | ê | $164M | | | | | ê | 0.8% as a % of revenues | | | | | | ¡% of Revenues | | |
| | | | | | | | | | Cognizant | 34 | December 31, 2023 Form 10-K |
Non-GAAP Financial Measures Portions of our disclosure include non-GAAP financial measures. These non-GAAP financial measures are not based on any comprehensive set of accounting rules or principles and should not be considered a substitute for, or superior to, financial measures calculated in accordance with GAAP, and may be different from non-GAAP financial measures used by other companies. In addition, these non-GAAP financial measures should be read in conjunction with our financial statements prepared in accordance with GAAP. The reconciliations of our non-GAAP financial measures to the corresponding GAAP measures set forth below should be carefully evaluated.
Our non-GAAP financial measures Adjusted Operating Margin and Adjusted Income Fromfrom Operations andexclude unusual items, such as NextGen charges. Our non-GAAP financial measure Adjusted Diluted EPS excludeexcludes unusual items. Additionally, Adjusted Diluted EPS excludesitems, such as NextGen charges and the effect of recognition in the third quarter of 2022 of an income tax benefit related to a specific uncertain tax position that was previously unrecognized in our prior-year consolidated financial statements, and net non-operating foreign currency exchange gains or losses and the tax impact of all the applicable adjustments. For further detail on the NextGen charges, see Note 4 to our audited consolidated financial statements. The income tax impact of each item excluded from Adjusted Diluted EPS is calculated by applying the
statutory rate and local tax regulations in the jurisdiction in which the item was incurred. Constant currency revenue growth is defined as revenues for a given period restated at the comparative period’s foreign currency exchange rates measured against the comparative period's reported revenues. Free cash flow is defined as cash flows from operating activities net of purchases of property and equipment.
We believe providing investors with an operating view consistent with how we manage the Company provides enhanced transparency into our operating results. For our internal management reporting and budgeting purposes, we use various GAAP and non-GAAP financial measures for financial and operational decision-making, to evaluate period-to-period comparisons, to determine portions of the compensation for our executive officers and for making comparisons of our operating results to those of our competitors. Therefore, it is our belief that the use of non-GAAP financial measures excluding certain costs provides a meaningful supplemental measure for investors to evaluate our financial performance. We believe that the presentation of our non-GAAP financial measures, alongwhich exclude certain costs, read in conjunction with our reported GAAP results and reconciliations to the most comparable GAAP measure, as applicable, can provide useful supplemental information to our management and investors regarding financial and business trends relating to our financial condition and results of operations. A limitation of using non-GAAP financial measures versus financial measures calculated in accordance with GAAP is that non-GAAP financial measures do not reflect all of the amounts associated with our operating results as determined in accordance with GAAP and may exclude costs that are recurring such as our net non-operating foreign currency exchange gains or losses. In addition, other companies may calculate non-GAAP financial measures differently than us, thereby limiting the usefulness of these non-GAAP financial measures as a comparative tool. We compensate for these limitations by providing specific information regarding the GAAP amounts excluded from our non-GAAP financial measures to allow investors to evaluate such non-GAAP financial measures. | | | | | | | | | | Cognizant | 35 | December 31, 2023 Form 10-K |
The following table presents a reconciliation of each non-GAAP financial measure to the most comparable GAAP measure, as applicable, for the years ended December 31: | | | | | | | | | | | | | | | | | | | | | | | | | | | | | 2020 | | % of
Revenues | | 2019 | | % of
Revenues | | | | | | (Dollars in millions, except per share data) | | | | | | GAAP income from operations and operating margin | $ | 2,114 | | | 12.7 | % | | $ | 2,453 | | | 14.6 | % | | | | | Realignment charges (1) | 42 | | | 0.3 | | | 169 | | | 1.0 | | | | | | 2020 Fit for Growth Plan restructuring charges (2) | 173 | | | 1.0 | | | 48 | | | 0.3 | | | | | | COVID-19 Charges (3) | 65 | | | 0.4 | | | — | | | — | | | | | | Incremental accrual related to the India Defined Contribution Obligation (4) | — | | | — | | | 117 | | | 0.7 | | | | | | | Adjusted Income From Operations and Adjusted Operating Margin | 2,394 | | | 14.4 | | | 2,787 | | | 16.6 | | | | | | | | | | | | | | | | | | | GAAP diluted EPS | $ | 2.57 | | | | | $ | 3.29 | | | | | | | | | Effect of above adjustments, pre-tax | 0.52 | | | | | 0.60 | | | | | | | | Effect of non-operating foreign currency exchange losses (gains), pre-tax (5) | 0.22 | | | | | 0.11 | | | | | | | | Tax effect of above adjustments (6) | (0.15) | | | | | (0.15) | | | | | | | | Tax on Accumulated Indian Earnings (7) | 0.26 | | | | | — | | | | | | | | Effect of the equity method investment impairment (8) | — | | | | | 0.10 | | | | | | | | Effect of the India Tax Law (9) | — | | | | | 0.04 | | | | | | | | | Adjusted Diluted EPS | $ | 3.42 | | | | | $ | 3.99 | | | | | | | |
| | | | | | | | | | | | | | | | | | | | | | | | | | | | | (Dollars in millions, except per share data) | 2023 | | % of
Revenues | | 2022 | | % of
Revenues | | | | | | GAAP income from operations and operating margin | $ | 2,689 | | | 13.9 | % | | $ | 2,968 | | | 15.3 | % | | | | | NextGen charges (1) | 229 | | | 1.2 | | | — | | | — | | | | | | | Adjusted Income From Operations and Adjusted Operating Margin | $ | 2,918 | | | 15.1 | % | | $ | 2,968 | | | 15.3 | % | | | | | | | | | | | | | | | | | | GAAP diluted EPS | $ | 4.21 | | | | | $ | 4.41 | | | | | | | | | Effect of NextGen charges, pre-tax | 0.45 | | | | | — | | | | | | | | Effect of non-operating foreign currency exchange losses (gains), pre-tax (2) | — | | | | | (0.01) | | | | | | | | Tax effect of above adjustments (3) | (0.11) | | | | | 0.07 | | | | | | | | Effect of recognition of income tax benefit related to an uncertain tax position (4) | — | | | | | (0.07) | | | | | | | | | | | | | | | | | | | | | | | | | | | | | | | | | Adjusted Diluted EPS | $ | 4.55 | | | | | $ | 4.40 | | | | | | | | | | | | | | | | | | | | | Net cash provided by operating activities | $ | 2,330 | | | | | $ | 2,568 | | | | | | | | | Purchases of property and equipment | (317) | | | | | (332) | | | | | | | | | Free cash flow | $ | 2,013 | | | | | $ | 2,236 | | | | | | | |
(1) As part of our realignmentthe NextGen program, during 2020, the year ended December 31, 2023, we incurred employee retention costsseparation, facility exit and certain professional services fees and, during 2019, we incurred Executive Transition Costs, employee separation costs, employee retention costs and third party realignmentother costs. See Note 4 to our audited consolidated financial statements for additional information. (2) As part of our 2020 Fit for Growth plan, during 2020, we incurred certain employee separation, employee retention and facility exit costs and other charges and, during 2019, we incurred certain employee separation, employee retention and facility exit costs under the plan. See Note 4 to our consolidated financial statements for additional information.
(3) During2020, we incurred costs in response to the COVID-19 pandemic including a one-time bonus to our employees at the designation of associate and below in both India and the Philippines, certain costs to enable our employees to work remotely and provide medical staff and extra cleaning services for our facilities. Most of the costs related to the pandemic are reported in "Cost of revenues" in our consolidated statement of operations.
(4) In 2019, we recorded an accrual of $117 million related to the India Defined Contribution Obligation as further described in Note 15 to our consolidated financial statements.(5) Non-operating foreign currency exchange gains and losses, inclusive of gains and losses on related foreign exchange forward contracts not designated as hedging instruments for accounting purposes, are reported in "Foreign currency exchange gains (losses), net" in our consolidated statements of operations.
(6)(3) Presented below are the tax impacts of each of our non-GAAP adjustments to pre-tax income:income for the years ended December 31:
| | | | | | | | | | | | | | | For the years ended December 31, | | | | 2020 | | 2019 | | | | (in millions) | | Non-GAAP income tax benefit (expense) related to: | | | | | | | Realignment charges | $ | 11 | | | $ | 43 | | | | | 2020 Fit for Growth Plan restructuring charges | 45 | | | 13 | | | | | COVID-19 Charges | 17 | | | — | | | | | Incremental accrual related to the India Defined Contribution Obligation | — | | | 31 | | | | | Foreign currency exchange gains and losses | 6 | | | (1) | | | |
| | | | | | | | | | | | | | | | | | | (in millions) | 2023 | | 2022 | | | | Non-GAAP income tax benefit (expense) related to: | | | | | | | NextGen charges | $ | 59 | | | $ | — | | | | | Foreign currency exchange gains and losses | (6) | | | (39) | | | |
(7) In 2020, we reversed our indefinite reinvestment assertionThe effective tax rate related to non-operating foreign currency exchange gains and losses varies depending on Indian earnings accumulatedthe jurisdictions in prior yearswhich such income and recorded $140 millionexpenses are generated and the statutory rates applicable in those jurisdictions. As such, the income tax expense.effect of non-operating foreign currency exchange gains and losses shown in the above table may not appear proportionate to the net pre-tax foreign currency exchange gains and losses reported in our consolidated statements of operations.
(8) In 2019,(4) As previously reported in our 2022 Annual Report on Form 10-K, during the three months ended September 30, 2022, we recordedrecognized an impairment chargeincome tax benefit of $57$36 million on one ofrelated to a specific uncertain tax position that was previously unrecognized in our equity investments as further described in Note 5 to ourprior-year consolidated financial statements.(9) In 2019, we recorded a one-time net income tax expense of $21 million as a result The recognition of the enactmentbenefit in the third quarter of 2022 was based on management’s reassessment regarding whether this unrecognized tax benefit met the more-likely-than-not threshold in light of the lapse in the statute of limitations as to a new tax law in India.portion of such benefit.
| | | | | | | | | | Cognizant | 36 | December 31, 2023 Form 10-K |
| | | | | | | | | | | | | | | | Liquidity and Capital Resources |
Cash generated from operations has historically been our primary source of liquidity to fund operations and investments to grow our business. As of December 31, 2020,2023, we had cash, cash equivalents and short-term investments of $2,724$2,635 million. Additionally, as of December 31, 2020,2023, we had available capacity under our credit facilities of approximately $1,928 million.$2.0 billion. The following table provides a summary of our cash flows for the years ended December 31: | | 2020 | | 2019 | | | Increase / Decrease | | | (in millions) | | (in millions) | | | (in millions) | | | (in millions) | | | Net cash provided by (used in): | | | Net cash provided by (used in): | | | Net cash provided by (used in): | Net cash provided by (used in): | | | | | | Operating activities | Operating activities | | $ | 3,299 | | | $ | 2,499 | | | | $ | 800 | | | | Operating activities | | | Operating activities | | | Investing activities | | | Investing activities | | | Investing activities | Investing activities | | (1,238) | | | 1,588 | | | | (2,826) | | | | Financing activities | Financing activities | | (2,009) | | | (2,569) | | | | 560 | | | | Financing activities | | | Financing activities | | Other Cash Flow Information6 | | Other Cash Flow Information6 | | Other Cash Flow Information6 | | | Free cash flow | | | Free cash flow | | | Free cash flow | |
Operating activities6 The increase indecrease in cash generated fromprovided by operating activities for 2020in 2023 compared to 20192022 was primarily driven by an increase in income tax payments. In 2023, we made tax payments related to the mandatory capitalization of research and experimental expenditures for the 2022 tax year of approximately $300 million as well as the estimated tax payments for 2023 of approximately $230 million. Cash provided by operating activities for 2023 benefited from improved collections onof our trade accounts receivable deferrals of certain payments dueas compared to COVID-19 pandemic regulatory relief provided by several jurisdictions in which we operate, and lower incentive-based compensation payouts and cash taxes paid in 2020.2022. We monitor turnover, aging and the collection of trade accounts receivable by client. Our DSO calculation includes trade accounts receivable, net of allowance for doubtful accounts,credit losses, and contract assets, reduced by the uncollected portion of our deferred revenue. DSO was 7077 days as of December 31, 2020 and 732023, 74 days as of December 31, 2019.
Investing activities NetThe increase in cash used in investing activities in 20202023 compared to 2022 was primarily driven by lower net maturities of investments in 2023 as compared to 2022 and higher payments for acquisitions. Net cash provided by investing activitiesbusiness combinations in 2019 was driven by net sales of investments partially offset by payments for acquisitions and outflows for capital expenditures.2023.
Financing activities The decreasedecrease in cash used in financing activities in 20202023 compared to 2019 is2022 was primarily due todriven by lower repurchases of common stock in 2020.stock. We have a Credit Agreement providing for a $750$650 million Term Loan and a $1,750$1,850 million unsecured revolving credit facility, which are each due to mature in November 2023.October 2027. We are required under the Credit AgreementAgreement to make scheduled quarterly principal payments on the Term Loan.Loan beginning in December 2023. See Note 10 to our consolidated financial statements. During the first quarter of 2020, we borrowed $1.74 billion against our revolving credit facility and repaid this amount in full in the fourth quarter of 2020. We believe that we currently meet all conditions set forth in the Credit Agreement to borrow thereunder, and we are not aware of any conditions that would prevent us from borrowing part or all of the remaining available capacity under the revolving credit facility as of December 31, 20202023 and through the date of this filing. As of December 31, 2020,2023, we had no outstanding balance on our revolving credit facility. In February 2020,March 2023, our India subsidiary renewed its one-year 13working capital facility at 15 billion Indian rupee ($178180 million at the December 31, 20202023 exchange rate)working capital. This facility which requires us to repay any balances drawn down within 90 days from the date of disbursement. There is a 1.0% prepayment penalty applicable to payments made within 30 days ofafter disbursement. This working capital facility contains affirmative and negative covenants and may be renewed annually in February.annually. As of December 31, 2020, there was no balance outstanding2023, we have not borrowed funds under the working capital facility.this facility or any of its predecessor facilities. During 2020, we returned
6 $2,034 mFree cash flow is not a measurement of financial performance prepared in accordance with GAAP. See “Non-GAAP Financial Measures” for more information. | | | | | | | | | | Cognizant | 37 | December 31, 2023 Form 10-K |
Capital Allocation Framework  | | | | | | | Acquisitions | | | | Share repurchases | | | | Dividend payments | | |
Our capital allocation framework anticipates the deployment of approximately 50% of our free cash flow7 for acquisitions, 25% for share repurchases under our stock repurchase program and $480 million in25% for dividend payments. Our stock repurchase program, as amended by our Board of Directors in December 2020, allows for the repurchase of an aggregate of up to $9.5 billion, excluding fees and expenses, of our Class A common stock. As of December 31, 2020, we have $2.8 billion, excluding fees and expenses, available for repurchases under the program. Our shares outstanding decreased to 530 million as of December 31, 2020 from 548 million as of December 31, 2019. We review our capital return planallocation on an on-goingongoing basis, considering the potential impacts of COVID-19 pandemic, our financial performance and liquidity position, investments required to execute our strategic plans and initiatives, acquisition opportunities, the economic outlook, regulatory changes and other relevant factors. As these factors may change over time, the actual amounts expended on stock repurchase activity, dividends, and acquisitions, if any, during any particular period cannot be predicted and may fluctuate from time to time. Other Liquidity and Capital Resources Information We seek to ensure that our worldwide cash is available in the locations in which it is needed. As part of our ongoing liquidity assessments, we regularly monitor the mix of our domestic and international cash flows and cash balances. We evaluate on an ongoing basis what portion of the non-U.S. cash, cash equivalents and short-term investments is needed locally to execute our strategic plans and what amount is available for repatriation back to the United States.States. In March 2020, the Indian parliament enacted the Budget of India, which contained a number of provisions related to income tax, including a replacement of the DDT, previously due from the dividend payer, with a tax payable by the shareholder receiving the dividend. This provision reduced the tax rate applicable to us for cash repatriated from India. Following this change, during the first quarter of 2020, we limited our indefinite reinvestment assertion to India earnings accumulated in prior years. In July 2020, the U.S. Treasury Department and the IRS released final regulations, which became effective in September 2020, that reduced the tax applicable on our accumulated Indian earnings upon repatriation. As a result, during the third quarter of 2020, after a thorough analysis of the impact of these changes in law on the cost of earnings repatriation and considering our strategic decision to increase our investments to accelerate growth in various international markets and expandour global delivery footprint, we reversed our indefinite reinvestment assertion on Indian earnings accumulated in prior years and recorded a $140 million Tax on Accumulated Indian Earnings. The recorded income tax expense reflects the India withholding tax on unrepatriated Indian earnings, which were $5.2 billion as of December 31, 2019, net of applicable U.S. foreign tax credits. On October 28, 2020, our subsidiary in India remitted a dividend of $2.1 billion, which resulted in a net payment of $2.0 billion to its shareholders (non-Indian Cognizant entities), after payment of $106 million of India withholding tax.
We expect our operating cash flows, cash and short-term investment balances, together with ourthe available capacity under our revolving credit facilities, to be sufficient to meet our operating requirements, including purchase commitments, tax payments, including Tax Reform Act transition tax payments, and serviceservicing our debt for the next twelve months. Our remaining Tax Reform Act transition tax payments are $123 million and $157 million in the years 2024 and 2025, respectively. In 2023, our Tax Reform Act transition tax payment was $94 million. In addition, we also have purchase commitments of approximately $615 million that will be paid over the next four years, of which approximately $180 million will be paid during the next twelve months. In addition, see Note 7 to our consolidated financial statements for a description of our operating lease obligations.In connection with our ongoing dispute with the ITD, on January 8, 2024, the SCI ruled that, in order to proceed with our appeal, we must deposit 30 billion Indian rupees ($355 million at the December 31, 2023 exchange rate), representing the time deposits of CTS India under lien, on the condition that, if CTS India prevails at the High Court, the amount deposited will be returned to CTS India, along with interest accrued, within 4 weeks of the judgment. The SCI also requested the High Court to consider and dispose of the appeal as expeditiously as possible, preferably within 6 weeks of the January 8, 2024 ruling. We made the required deposit in January 2024. See Note 11 to our consolidated financial statements. The ability to expand and grow our business in accordance with current plans, make acquisitions, meet our long-term capital requirements beyond a twelve-month period and execute our capital return plan will depend on many factors, including the rate, if any, at which our cash flow increases, our ability and willingness to pay for acquisitions with capital stock and the availability of public and private debt, including the ability to extend the maturity of or refinance our existing debt, and equity financing. We cannot be certain that additional financing, if required, will be available on terms and conditions acceptable to us, if at all.
| | | | | | | | | | | | | | | Commitments and Contingencies |
Commitments
As of December 31, 2020, we had the following obligations and commitments to make future payments under contractual obligations and commercial commitments:
| | | | | | | | | | | | | | | | | | | | | | | | | | | | | | | | | | | | Payments due by period | | | | Total | | Less than
1 year | | 1-3 years | | 3-5 years | | More than
5 years | | | | (in millions) | Long-term debt obligations(1) | | $ | 703 | | | $ | 38 | | | $ | 665 | | | $ | — | | | $ | — | | Interest on long-term debt(2) | | 19 | | | 7 | | | 12 | | | — | | | — | | | Finance lease obligations | | 23 | | | 11 | | | 11 | | | 1 | | | — | | | Operating lease obligations | | 1,271 | | | 260 | | | 398 | | | 264 | | | 349 | | Other purchase commitments(3) | | 432 | | | 216 | | | 184 | | | 28 | | | 4 | | | Tax Reform Act transition tax | | 478 | | | 50 | | | 145 | | | 283 | | | — | | | Total | | $ | 2,926 | | | $ | 582 | | | $ | 1,415 | | | $ | 576 | | | $ | 353 | |
(1) Consists of scheduled repayments of our Term Loan.
(2) Interest on the Term Loan was calculated at interest rates in effect as of December 31, 2020.
(3) Other purchase commitments include, among other things, communications and information technology obligations, as well as other obligations that we cannot cancel or where we would be required to pay a termination fee in the event of cancellation.
As of December 31, 2020, we had $193 million of unrecognized income tax benefits. This represents the income tax benefits associated with certain income tax positions on our U.S. and non-U.S. tax returns that have not been recognized on our financial statements due to uncertainty regarding their resolution. The resolution of these income tax positions with the relevant taxing authorities is at various stages, and therefore we are unable to make a reliable estimate of the eventual cash flows by period that may be required to settle these matters.
Contingencies
See Note 15 to our consolidated financial statements for additional information.
| | | | | | | | | | | | | | | Off-Balance Sheet Arrangements |
Other than our foreign exchange forward and option contracts, there were no off-balance sheet transactions, arrangements or other relationships with unconsolidated entities or other persons in 2020 and 2019 that have, or are reasonably likely to have, a current or future effect on our financial condition, revenues or expenses, results of operations, liquidity, capital expenditures or capital resources.
| | | | | | | | | | | | | | | | Critical Accounting Estimates |
Management’s discussion and analysis of our financial condition and results of operations is based on our accompanying consolidated financial statements that have been prepared in accordance with GAAP. We base our estimates on historical experience, current trends and on various other assumptions that are believed to be relevant at the time our consolidated financial statements are prepared. We evaluate our estimates on a continuous basis. However, the actual amounts may differ from the estimates used in the preparation of our consolidated financial statements.
We believe the following accounting estimates are the most critical to aid in fully understanding and evaluating our consolidated financial statements as they require the most difficult, subjective or complex judgments, resulting from the need to make estimates about the effect of matters that are inherently uncertain. Changes to these estimates could have a material effect on our results of operations and financial condition. Our significant accounting policies are described in Note 1 to our consolidated financial statements. 7 Free cash flow is not a measurement of financial performance prepared in accordance with GAAP. See “Non-GAAP Financial Measures” for more information. | | | | | | | | | | Cognizant | 38 | December 31, 2023 Form 10-K |
Revenue Recognition. Revenues related to fixed-price contracts for application development and systems integration services, consulting or other technology services are recognized as the service is performed using the cost to costcost-to-cost method, under which the total value of revenues is recognized on the basis of the percentage that each contract’s total labor cost to dateto-date bears to the total expected labor costs. Revenues related to fixed-price application maintenance, testingquality engineering and assurance and business process services are recognized using the cost to costcost-to-cost method, if the right to invoice is not representative of the value being delivered. The cost to costcost-to-cost method requires estimation of future costs, which is updated as the project progresses to reflect the latest available information. Such estimates and changes in estimates involve the use of judgment. The cumulative impact of any revision in estimates is reflected in the financial reporting period in which the change in estimate becomes known. Net changes in estimates of such future costs and contract losses were immaterial to the consolidated results of operations for the periods presented. Income Taxes. Determining the consolidated provision for income tax expense,taxes, deferred income tax assets (and related valuation allowance, if any) and liabilities requires significant judgment. We are required to calculate and provide for income taxes in each of the jurisdictions where we operate. Changes in the geographic mix of income before taxes or estimated level of annual pre-tax income can affect our overall effective income tax rate. In addition, transactions between our affiliated entities are arranged in accordance with applicable transfer pricing laws, regulations and relevant guidelines. As a result, and due to the interpretive nature of certain aspects of these laws and guidelines, we have pending applications for APAs before the taxing authorities in some of our most significant jurisdictions. It could take years for the relevant taxing authorities to negotiate and conclude these applications. The consolidated provision for income taxes may change period to period based on changes in facts and circumstances, such as settlements of income tax audits, the expiration of the applicable statute of limitations or finalization of our applications for APAs. Our provision for income taxes also includes the impact of reserves established for uncertain income tax positions, as well as the related interest, which may require us to apply judgment to complex issues and may require an extended period of time to resolve. Although we believe we have adequately reserved for our uncertain tax positions, no assurance can be given that the final outcome of these matters will not differ from our recorded amounts. We adjust these reserves in light of changing facts and circumstances, such as the closing of a tax audit.audit or the expiration of the applicable statute of limitations. To the extent that the final outcome of these matters differs from the amounts recorded, such differences will impact the provision for income taxes in the period in which such determination is made. Business Combinations, Goodwill and Intangible Assets. Goodwill and intangible assets, including indefinite-lived intangible assets, arise from the accounting for business combinations. We account for business combinations using the acquisition method which requires us to estimate the fair value of identifiable assets acquired, liabilities assumed, including any contingent consideration, and any noncontrolling interest in the acquiree to properly allocate purchase price to the individual assets acquired and liabilities assumed. The allocation of the purchase price utilizes estimates and assumptions in determining the fair values of identifiable assets acquired and liabilities assumed, especially with respect to intangible assets, including the timing and amount of forecasted revenues and cash flows, anticipated growth rates, client attrition rates and the discount rate reflecting the risk inherent in future cash flows.
At each acquisition date, we allocate goodwill and intangible assets to our reporting units based on how we expect each reporting unit to benefit from the respective business combination. Our seven industry-based operating segments are our reporting units. We exercise judgment to allocate goodwill to the reporting units expected to benefit from each business combination. Goodwill is tested for impairment at the reporting unit level on an annual basis and between annual tests if an event occurs or circumstances change that would more likely than not reduce the fair value of a reporting unit below its carrying value. These events or circumstances could include a significant change in the business climate, regulatory environment, established business plans, operating performance indicators or competition. Evaluation of goodwill for impairment requires judgment, including the identification of reporting units, assignment of assets, liabilities and goodwill to reporting units and determination of the fair value of each reporting unit. We estimate the fair value of our reporting units using a combination of an income approach, utilizing a discounted cash flow analysis, and a market approach, using market multiples. Under the income approach, we estimate projected future cash flows, the timing of such cash flows and long-term growth rates, and determine the appropriate discount rate that reflects the risk inherent in the projected future cash flows. The discount rate used is based on a market participant weighted-average cost of capital and may be adjusted for the relevant risk associated with business-specific characteristics and the uncertainty related to the reporting unit’s ability to execute on the projected future cash flows. Under the market approach, we estimate fair value based on market multiples of revenues and earnings derived from comparable publicly-traded companies with characteristics similar to the reporting unit. The estimates used to calculate the fair value of a reporting unit change from year to year based on
operating results, market conditions and other factors. Changes in these estimates and assumptions could materially affect the determination of fair value for each reporting unit.
We also evaluate indefinite-lived intangible assets for impairment at least annually, or as circumstances warrant. Our 2020 qualitative assessment included the review | | | | | | | | | | Cognizant | 39 | December 31, 2023 Form 10-K |
Beginning with the first quarter of 2020, COVID-19 negatively affected all major economic and financial markets and, although there is a wide range of possible outcomes and the associated impact is highly dependent on variables that are difficult to forecast, we deemed the deterioration in general economic conditions sufficient to trigger an interim impairment testing of goodwill as of March 31, 2020. Our interim test results as of March 31, 2020 indicated that the fair values of all of our reporting units exceeded their carrying values and thus, no impairment of goodwill existed as of March 31, 2020. Based on our most recent evaluation of goodwill and indefinite-lived intangible assets performed during the fourth quarter of 2020,2023, we concluded that the goodwill and indefinite-lived intangible asset balances in each of our reporting units werewas not at risk of impairment. As of December 31, 2023, our goodwill balance was $6,085 million.
We review our finite-lived assets, including our finite-lived intangible assets, for impairment wheneverwhenever events or changes in circumstances indicate that the carrying amount of an asset group may not be recoverable. We recognize an impairment lossThe carrying amount may not be recoverable when the sum of the undiscounted expected future cash flows is less than the carrying amount of such asset groups. The impairment loss is determined as the amount by which the carrying amount of the asset group exceeds its fair value. Assessing the fair value of asset groups involves significant estimates and assumptions including estimation of future cash flows, the timing of such cash flows and discount rates reflecting the risk inherent in future cash flows. Contingencies. Loss contingencies are recorded as liabilities when a loss is considered probable and the amount can be reasonably estimated. When a material loss contingency is reasonably possible but not probable, we do not record a liability, but instead disclose the nature and amount of the claim, and an estimate of the loss or range of loss, if such an estimate can be made. Significant judgment is required in the determination of whether an exposure is considered probable and reasonably estimable. Our judgments are subjective and based on the information available from the status of the legal or regulatory proceedings, the merits of our defenses and consultation with in-house and outside legal counsel. As additional information becomes available, we reassess any potential liability related to any pending litigation and may revise our estimates. Such revisions in estimates of any potential liabilities could have a material impact on our results of operations and financial position.
| | | | | | | | | | | | | | | | Recently Adopted and New Accounting Pronouncements |
See Note 1 to our consolidated financial statements for additional information.
| | | | | | | | | | | | | | | Forward Looking Statements |
The statements contained in this Annual Report on Form 10-K that are not historical facts are forward-looking statements (within the meaning of Section 21E of the Exchange Act) that involve risks and uncertainties. Such forward-looking statements may be identified by, among other things, the use of forward-looking terminology such as “believe,” “expect,” “may,” “could,” “would,” “plan,” “intend,” “estimate,” “predict,” “potential,” “continue,” “should” or “anticipate” or the negative thereof or other variations thereon or comparable terminology, or by discussions of strategy that involve risks and uncertainties. From time to time, we or our representatives have made or may make forward-looking statements, orally or in writing.
Such forward-looking statements may be included in various filings made by us with the SEC, in press releases or in oral statements made by or with the approval of one of our authorized executive officers. These forward-looking statements, such as statements regarding our anticipated future revenues or operating margin, earnings, capital expenditures, impacts to our business, financial results and financial condition as a result of the COVID-19 pandemic, anticipated effective income tax rate and income tax expense, liquidity, access to capital, capital return plan, investment strategies, cost management, realignment program, 2020 Fit for Growth Plan, plans and objectives, including those related to our digital practice areas, investment in our business, potential acquisitions, industry trends, client behaviors and trends, the outcome of regulatory and litigation matters, the incremental accrual related to the India Defined Contribution Obligation, the Proposed Exit and other statements regarding matters that are not historical facts, are based on our current expectations, estimates and projections, management’s beliefs and certain assumptions made by management, many of which, by their nature, are inherently uncertain and beyond our control. Actual results, performance, achievements and outcomes could differ materially from the results expressed in, or anticipated or implied by, these forward-looking statements. There are a number of important factors that could cause our results to differ materially from those indicated by such forward-looking statements, including:
•economic and political conditions globally and in particular in the markets in which our clients and operations are concentrated;
•the continuing impact of the COVID-19 pandemic, or other future pandemics, on our business, results of operations, liquidity and financial condition;
•our ability to attract, train and retain skilled employees, including highly skilled technical personnel to satisfy client demand and senior management to lead our business globally;
•challenges related to growing our business organically as well as inorganically through acquisitions, and our ability to achieve our targeted growth rates;
•our ability to achieve our profitability goals and capital return strategy;
•our ability to successfully implement our 2020 Fit for Growth Plan and achieve the anticipated benefits from the plan;
•our ability to meet specified service levels or milestones required by certain of our contracts;
•intense and evolving competition and significant technological advances that our service offerings must keep pace with in the rapidly changing markets we compete in;
•legal, reputation and financial risks if we fail to protect client and/or our data from security breaches and/or cyber attacks;
•the effectiveness of our risk management, business continuity and disaster recovery plans and the potential that our global delivery capabilities could be impacted;
•restrictions on visas, in particular in the United States, United Kingdom and EU, or immigration more generally or increased costs of such visas or the wages we are required to pay associates on visas, which may affect our ability to compete for and provide services to our clients;
•risks related to anti-outsourcing legislation, if adopted, and negative perceptions associated with offshore outsourcing, both of which could impair our ability to serve our clients;
•risks related to complying with the numerous and evolving legal and regulatory requirements to which we are subject in the many jurisdictions in which we operate;
•potential changes in tax laws, or in their interpretation or enforcement, failure by us to adapt our corporate structure and intercompany arrangements to achieve global tax efficiencies or adverse outcomes of tax audits, investigations or proceedings;
•potential exposure to litigation and legal claims in the conduct of our business; and
| | | | | | Defined Term | Definition | 10b5-1 Plan | Trading plan adopted pursuant to Rule 10b5-1 of the Exchange Act | 10th Magnitude
| Pamlico 10th Magnitude Blocker LLC, now known as Cognizant 10th Magnitude Blocker, LLC | 2009 Incentive Plan | Cognizant Technology Solutions Corporation Amended and Restated 2009 Incentive Compensation Plan | 2017 Incentive Plan | Cognizant Technology Solutions Corporation 2017 Incentive Award Plan | Adjusted Diluted EPS | Adjusted diluted earnings per share | AI | Artificial Intelligence | APA | Advance Pricing Agreement | ASC | Accounting Standards Codification | ASR | Accelerated Stock Repurchase | ASU | Accounting Standards Update | Bright Wolf | Bright Wolf, LLC | Budget of India | Union Budget of India for 2020-2021 | CC | Constant Currency | Code | The Code on Social Security, 2020 | Code Zero | Code Zero, LLC | Collaborative Solutions | Collaborative Solutions Holdings, LLC | Contino | Contino Holdings Inc. | COVID-19 | The novel coronavirus disease | COVID-19 Charges | Costs directly related to the COVID-19 pandemic | CPI | Consumer Price Index | Credit Agreement | Credit agreement with a commercial bank syndicate dated November 6, 2018 | Credit Loss Standard | ASC Topic 326 "Financial Instruments - Credit Losses" | CTS India | Our principal operating subsidiary in India | DDT | Dividend Distribution Tax | D&I | Diversity and Inclusion | Division Bench | Division Bench of the Madras High Court | DevOps | Agile relationship between development and IT operations | DOJ | United States Department of Justice | DSO | Days Sales Outstanding | EI-Technologies | Entrepreneurs et Investisseurs Technologies SAS | EPS | Earnings Per Share | ESG | Environmental, social and corporate governance | EU | European Union | Exchange Act | Securities Exchange Act of 1934, as amended | Executive Transition Costs | Costs associated with our CEO transition and the departure of our President in 2019 | FASB | Financial Accounting Standards Board | FCPA | Foreign Corrupt Practices Act | GAAP | Generally Accepted Accounting Principles in the United States of America | High Court | Madras High Court | HR | Human Resources | Inawisdom | Inawisdom Limited | India Defined Contribution Obligation | Certain statutory defined contribution obligations of employees and employers in India |
| | | | | | India Tax Law | New tax regime enacted by the Government of India effective April 1, 2019 | IP | Intellectual property | IoT | Internet of Things | IRS | Internal Revenue Service | IT | Information Technology | ITD | Indian Income Tax Department | Lev | Levementum, LLC | LIBOR | London Inter-bank Offered Rate | Linium | the ServiceNow business of Ness Digital Engineering | Magenic | Magenic Technologies, Inc. | MAT | Minimum Alternative Tax | Meritsoft | Sterling Topco Limited | Mustache | Mustache, LLC | New Revenue Standard | ASC Topic 606 "Revenue from Contracts with Customers" | New Lease Standard | ASC Topic 842 “Leases” | New Signature | BSI Corporate Holdings, Inc. | OECD | Organization for Economic Co-operation and Development | Proposed Exit | Offer to settle and exit from a large customer engagement in Financial Services in Continental Europe | PSU | Performance Stock Units | Purchase Plan | Cognizant Technology Solutions Corporation 2004 Employee Stock Purchase Plan, as amended | ROU | Right of Use | RSU | Restricted Stock Units | SaaS | Software as a service | Samlink | Oy Samlink Ab | SEC | United States Securities and Exchange Commission | SCI | Supreme Court of India | Servian | SVN HoldCo Pty Limited | SEZ | Special Economic Zone | SG&A | Selling, general and administrative | SLP | Special Leave Petition | Syntel | Syntel Sterling Best Shores Mauritius Ltd. | Tax on Accumulated Indian Earnings | The income tax expense related to the reversal of our indefinite reinvestment assertion on Indian earnings accumulated in prior years | Tax Reform Act | Tax Cuts and Jobs Act | Term Loan | Unsecured term loan under the Credit Agreement | Tin Roof | Tin Roof Software, LLC | TriZetto | The TriZetto Group, Inc., now known as Cognizant Technology Software Group, Inc. | Zenith | Zenith Technologies Limited |
| | | | | | | | | | Cognizant | 40 | December 31, 2023 Form 10-K |
Item 7A. Quantitative and Qualitative Disclosures about Market Risk Foreign Currency Risk We are exposed to foreign currency exchange rate risk in the ordinary course of doing business as we transact or hold a portion of our funds in foreign currencies, particularly the Indian rupee.currencies. Accordingly, we periodically evaluate the need for hedging strategies, including the use of derivative financial instruments, to mitigate the effect of foreign currency exchange rate fluctuations and expect to continue to use such instruments in the future to reduce foreign currency exposure to changes in the value of certain foreign currencies. All hedging transactions are authorized and executed pursuant to regularly reviewed policies and procedures.
Revenues from our clients in the United Kingdom, Continental Europe and Rest of World represented 8.0%9.7%, 9.9% and 6.5%6.7%, respectively, of our 20202023 revenues, and are typically denominated in currencies other than the U.S. dollar. Accordingly, our revenues may be affected by fluctuations in the exchange rates, primarily thethe British pound and the Euro, asas compared to the U.S. dollar.
A significantpredominant portion of our costs in India are denominated in the Indian rupee, representing approximately 20.0%24% of our global operating costs during 2020,2023, and are subject to foreign currency exchange rate fluctuations. These foreign currency exchange rate fluctuations have an impact on our results of operations.
We have entered into a series of foreign exchange forward and option contracts that are designated as cash flow hedges of certain Indian rupee denominated payments in India. These U.S. dollar / Indian rupee hedges are intended to partially offset the impact of movement of exchange rates on future operating costs. As of December 31, 2020,2023, the notional value and weighted average contract rates of these contracts by year of maturity were as follows: | | | | | | | | | | | | | Notional Value
(in millions) | | Weighted Average Contract Rate (Indian rupee to U.S. dollar) | | 2021 | $ | 1,470 | | | 77.0 | | | 2022 | 803 | | | 80.7 | | | Total | $ | 2,273 | | | 78.3 | |
| | | | | | | | | | | | | Notional Value
(in millions) | | Weighted Average Contract Rate (Indian rupee to U.S. dollar) | | 2024 | $ | 1,878 | | | 84.3 | | | 2025 | 1,020 | | | 86.3 | | | Total | $ | 2,898 | | | 85.0 | |
As of December 31, 2020,2023, the net unrealized gain onon our outstanding foreign exchange forward and option contracts designated as cash flow hedges was $70 million.$13 million. Based upon a sensitivity analysis at December 31, 2020,2023, which estimates the fair value of the contracts assuming certain market exchange rate fluctuations, a 10.0% change in the foreign currency exchange rate against the U.S. dollar with all other variables held constant would have resulted in a change in the fair value of our foreign exchange forward and option contracts designated as cash flow hedges of approximately $224 million.$278 million.
A portion of our balance sheet is exposed to foreign currency exchange rate fluctuations, which may result in non-operating foreign currency exchange gains or losses upon remeasurement. In 2020,2023, we reported foreign currency exchange losses, exclusivegains, exclusive of hedging losses,gains, of approximately $53$42 million, which were primarily attributed to the remeasurement of net monetary assets and liabilities denominated in currencies other than the functional currencies of our subsidiaries. We use foreign exchange forward contracts that are scheduled to mature in the first quarter of 2024 to provide an economic hedge against balance sheet exposure to certain monetary assets and liabilities denominated in currencies other than the functional currency of the subsidiary. We entered into foreign exchange forward contracts scheduled to mature in 2021. At December 31, 2020,2023, the notional value of these outstanding contracts was $637$1,317 million and thethe net unrealized gain loss was less than $1$8 million. Based upon a sensitivity analysis of our foreign exchange forward contracts at December 31, 2020,2023, which estimates the fair value of the contracts assuming certain market exchange rate fluctuations, a 10.0% change in the foreign currency exchange rate against the U.S. dollar with all other variables held constant would have resulted in a change in the fair value of our foreign exchange forward contracts not designated as hedges of approximately $17 million.$87 million.
Interest Rate Risk
We have a Credit Agreement providing for a $750$650 million unsecured Term Loan and a $1,750$1,850 million unsecured revolving credit facility, which are due to mature in November 2023. We are required under the Credit Agreement to make scheduled quarterly principal payments on the Term Loan.
October 2027. The Credit Agreement requires interest to be paid, at our option, at either the ABRTerm Benchmark, Adjusted Daily Simple RFR or the EurocurrencyABR Rate (each as defined in the Credit Agreement), plus, in each case, an Applicable Margin (as defined in the Credit Agreement). Initially, the Applicable MarginThe Term Loan is 0.875% with respect to Eurocurrency Rate loans and 0.00% with respect to ABR loans. Subsequently, the
Applicable Margin with respect to Eurocurrency Rate loans may range from 0.75% to 1.125%, depending on our public debt ratings (or, if we have not received public debt ratings, from 0.875% to 1.125%, depending on our Leverage Ratio, which is the ratio of indebtedness for borrowed money to Consolidated EBITDA, as defined in the Credit Agreement). Under the Credit Agreement, we are required to pay commitment fees on the unused portion of the revolving credit facility, which vary based on our public debt ratings (or, if we have not received public debt ratings, on the Leverage Ratio).a Term Benchmark loan. Thus, our debt exposes us to market risk from changes in interest rates. We performed a sensitivity analysis to determine the effect of interest rate fluctuations on our interest expense. A 10.0%100 basis point change in interest rates, with all other variables held constant, would have an immaterial effect on our reported interest expense.
| | | | | | | | | | Cognizant | 41 | December 31, 2023 Form 10-K |
We have $1,161 million of cash equivalents, $14 million of short-term investments and $435 million of long-term investments as of December 31, 2023. Our cash equivalents consist of money market funds and time deposits. Our short-term investments consist primarily of a U.S. dollar denominated investment in a fixed income mutual fund. Our investments are exposed to fluctuations in interest rates, which may affect our interest income and the fair market value of our investments. Our long-term investments primarily consist of restricted time deposits and cash equivalents related to the ITD dispute and equity method investments. As of December 31, 2023, a 100 basis point change in interest rates, with all other variables held constant, would have an immaterial effect on the fair value of our cash equivalents as well as short- and long-term investments. Information provided by the sensitivity analysis of foreign currency risk and interest rate risk does not necessarily represent the actual changes that would occur under normal market conditions.
Item 8. Financial Statements and Supplementary Data
Item 9. Changes in and Disagreements with Accountants on Accounting and Financial Disclosure None.
Item 9A. Controls and Procedures Evaluation of Disclosure Controls and Procedures Our management, under the supervision and with the participation of our chief executive officer and our chief financial officer, evaluated the effectiveness of our disclosure controls and procedures (as defined in Rules 13a-15(e) and 15d-15(e) under the Securities Exchange Act of 1934, as amended) as of December 31, 2020.2023. Based on this evaluation, our chief executive officer and our chief financial officer concluded that, as of December 31, 2020,2023, our disclosure controls and procedures were effective. Changes in Internal Control over Financial Reporting There has been no change in our internal control over financial reporting (as defined in Rules 13a-15(f) and 15d-15(f) under the Securities Exchange Act of 1934, as amended) that occurred during the fiscal quarter ended December 31, 20202023 that has materially affected, or is reasonably likely to materially affect, our internal control over financial reporting. Management’s Responsibility for Financial Statements
Our management is responsible for the integrity and objectivity of all information presented in this annual report. The consolidated financial statements were prepared in conformity with accounting principles generally accepted in the United States of America and include amounts based on management’s best estimates and judgments. Management believes the consolidated financial statements fairly reflect the form and substance of transactions and that the financial statements fairly represent the Company’s financial position and results of operations.
The Audit Committee of the Board of Directors, which is composed solely of independent directors, meets regularly with the Company’s independent registered public accounting firm and representatives of management to review accounting, financial reporting, internal control and audit matters, as well as the nature and extent of the audit effort.
Management’s Report on Internal Control Over Financial Reporting Our management is responsible for establishing and maintaining adequate internal control over financial reporting. Internal control over financial reporting is defined in Rule 13a-15(f) and 15d-15(f) of the Securities Exchange Act of 1934, as amended, and is a process designed by, or under the supervision of, our chief executive and chief financial officers and effected by our Board of Directors, management and other personnel, to provide reasonable assurance regarding the reliability of financial reporting and the preparation of financial statements for external purposes in accordance with generally accepted accounting principles and includes those policies and procedures that: •Pertain to the maintenance of records that, in reasonable detail, accurately and fairly reflect the transactions and dispositions of our assets; •Provide reasonable assurance that transactions are recorded as necessary to permit preparation of financial statements in accordance with generally accepted accounting principles, and that receipts and expenditures of the Company are being made only in accordance with authorizations of our management and directors; and •Provide reasonable assurance regarding prevention or timely detection of unauthorized acquisition, use or disposition of the Company’s assets that could have a material effect on the financial statements. Our management assessed the effectiveness of the Company’s internal control over financial reporting as of December 31, 2020.2023. In making this assessment, the Company’s management used the criteria set forth by the Committee of Sponsoring Organizations of the Treadway Commission (COSO) in Internal Control-Integrated Framework (2013)(2013). Based on its evaluation, our management has concluded that, as of December 31, 2020,2023, our internal control over financial reporting was effective. PricewaterhouseCoopers LLP, the independent registered public accounting firm that audited the | | | | | | | | | | Cognizant | 42 | December 31, 2023 Form 10-K |
financial statements included in this annual report, has issued an attestation report on our internal control over financial reporting, as stated in their report which is included on page F-2. Inherent Limitations of Internal Controls Because of its inherent limitations, internal control over financial reporting may not prevent or detect all misstatements. Projections of any evaluation of effectiveness to future periods are subject to the risk that controls may become inadequate because of changes in conditions, or that the degree of compliance with the policies or procedures may deteriorate.
Item 9B. Other Information On February 10, 2021, John N. Fox, Jr. informedDuring the Company’s Boardthree months ended December 31, 2023, no director or Section 16 officer adopted or terminated any Rule 10b5-1 trading arrangements or non-Rule 10b5-1 trading arrangements (in each case, as defined in Item 408(a) of DirectorsRegulation S-K).
Item 9C. Disclosure Regarding Foreign Jurisdictions that he will retire from the Board of Directors effective on the date of the Company’s 2021 Annual Meeting of Stockholders.Prevent Inspections Not applicable. | | | | | | | | | | Cognizant | 43 | December 31, 2023 Form 10-K |
PART III
Item 10. Directors, Executive Officers and Corporate Governance
The information relating to our executive officers in response to this item is contained in part under the caption “Information About Our Executive Officers” in Part I of this Annual Report on Form 10-K. We have adopted a written code of ethics, entitled “Code of Ethics,” that applies to all of our directors, executive officers and employees, including our principal executive officer, principal financial officer, principal accounting officer and controller, or persons performing similar functions. We make available our code of ethics free of charge through our website which is located at www.cognizant.com. We intend to post on our website all disclosures that are required by law or Nasdaq Stock Market listing standards concerning any amendments to, or waivers from, any provision of our code of ethics. The remaining information required by this item will be included under the caption "Corporate governance" in our definitive proxy statement for the 20212024 Annual Meeting of Stockholders, which will be filed with the SEC pursuant to Regulation 14A not later than 120 days after the end of the fiscal year ended December 31, 2023 and is incorporated herein by reference to such proxy statement.
Item 11. Executive Compensation The information required by this item will be included in our definitive proxy statement for the 20212024 Annual Meeting of Stockholders and is incorporated herein by reference to such proxy statement.
Item 12. Security Ownership of Certain Beneficial Owners and Management and Related Stockholder Matters The information required by this item will be included in our definitive proxy statement for the 20212024 Annual Meeting of Stockholders and is incorporated herein by reference to such proxy statement.
Item 13. Certain Relationships and Related Transactions, and Director Independence
The information required by this item will be included in our definitive proxy statement for the 20212024 Annual Meeting of Stockholders and is incorporated herein by reference to such proxy statement.
Item 14. Principal Accountant Fees and Services
The information required by this item will be included in our definitive proxy statement for the 20212024 Annual Meeting of Stockholders and is incorporated herein by reference to such proxy statement. | | | | | | | | | | Cognizant | 44 | December 31, 2023 Form 10-K |
PART IV
Item 15. Exhibits, Financial Statement Schedules | | | | | | | (a) | (1) Consolidated Financial Statements.
Reference is made to the Index to Consolidated Financial Statements on Page F-1. | | | | (2) Consolidated Financial Statement Schedule.
Reference is made to the Index to Financial Statement Schedule on Page F-1. | | | | (3) Exhibits. |
Schedules other than as listed above are omitted as not required or inapplicable or because the required information is provided in the consolidated financial statements, including the notes thereto.
EXHIBIT INDEX | | | | | | | | | | | | | | | | | | | | | | | | | | | | | | | | | | | | | | | | | | | | Incorporated by Reference | | | | Number | | Exhibit Description | | Form | | File No. | | Exhibit | | Date | | Filed or Furnished
Herewith | | 3.1 | | | | 8-K | | 000-24429 | | 3.1 | | | 6/7/2018 | | | | 3.2 | | | | 8-K | | 000-24429 | | 3.1 | | | 9/20/2018 | | | | 4.1 | | | | S-4/A | | 333-101216 | | 4.2 | | | 1/30/2003 | | | | 4.2 | | | | 10-K | | 000-24429 | | 4.2 | | | 2/14/2020 | | | | 10.1† | | | | 10-Q | | 000-24429 | | 10.1 | | | 8/7/2013 | | | | 10.2† | | Form of Amended and Restated Executive Employment and Non-Disclosure, Non-Competition, and Invention Assignment Agreement, between the Company and each of the following Executive Officers: Brian Humphries, Jan Siegmund, Becky Schmitt, Robert Telesmanic, Balu Ganesh Ayyar, Greg Hyttenrauch, Ursula Morgenstern, Andrew Stafford, Karen McLoughlin and Dharmendra Kumar Sinha | | 10-K | | 000-24429 | | 10.3 | | | 2/27/2018 | | | | 10.3† | | | | 10-K | | 000-24429 | | 10.4 | | | 2/26/2013 | | | | 10.4† | | | | 10-K | | 000-24429 | | 10.4 | | | 2/19/2019 | | | | 10.5† | | | | 8-K | | 000-24429 | | 10.1 | | | 7/29/2020 | | | | 10.6† | | | | | | | | | | | | Filed | | 10.7† | | | | 8-K | | 000-24429 | | 10.1 | | | 6/7/2018 | | | | 10.8† | | | | 10-Q | | 000-24429 | | 10.1 | | | 11/8/2004 | | |
| | | | | | | | | | | | | | | | | | | | | | | | | | | | | | | | | | | | | | | | | | | | Incorporated by Reference | | | | Number | | Exhibit Description | | Form | | File No. | | Exhibit | | Date | | Filed or Furnished
Herewith | | 3.1 | | | | 8-K | | 000-24429 | | 3.1 | | | 6/7/2018 | | | | 3.2 | | | | 8-K | | 000-24429 | | 3.1 | | | 9/20/2018 | | | | 4.1 | | | | S-4/A | | 333-101216 | | 4.2 | | | 1/30/2003 | | | | 4.2 | | | | 10-K | | 000-24429 | | 4.2 | | | 2/14/2020 | | | | 10.1† | | | | 10-Q | | 000-24429 | | 10.1 | | | 8/7/2013 | | | | 10.2† | | | | 10-K | | 000-24429 | | 10.3 | | | 2/27/2018 | | | | 10.3† | | | | 10-Q | | 000-24429 | | 10.1 | | | 7/28/2022 | | | | 10.4† | | | | 10-Q | | 000-24429 | | 10.2 | | | 7/28/2022 | | | | 10.5† | | | | 8-K | | 000-24429 | | 10.2 | | | 1/12/2023 | | | | 10.6† | | | | 10-K | | 000-24429 | | 10.6 | | | 2/15/2023 | | | | 10.7† | | | | 8-K | | 000-24429 | | 10.3 | | | 1/12/2023 | | |
| | | | | | | | | | | | | | | | | | | | | | | | | | | | | | | | | | | | | | | | | | | | Incorporated by Reference | | | | Number | | Exhibit Description | | Form | | File No. | | Exhibit | | Date | | Filed or Furnished
Herewith | | 10.9† | | | | 10-Q | | 000-24429 | | 10.1 | | | 5/4/2015 | | | | 10.10† | | | | 8-K | | 000-24429 | | 10.1 | | | 7/6/2009 | | | | 10.11† | | | | 8-K | | 000-24429 | | 10.2 | | | 7/6/2009 | | | | 10.12† | | | | 8-K | | 000-24429 | | 10.3 | | | 7/6/2009 | | | | 10.13† | | | | 8-K | | 000-24429 | | 10.4 | | | 7/6/2009 | | | | 10.14† | | | | 8-K | | 000-24429 | | 10.5 | | | 7/6/2009 | | | | 10.15† | | | | 8-K | | 000-24429 | | 10.6 | | | 7/6/2009 | | | | 10.16† | | | | 8-K | | 000-24429 | | 10.7 | | | 7/6/2009 | | | | 10.17† | | | | 8-K | | 000-24429 | | 10.8 | | | 7/6/2009 | | | | 10.18† | | | | 8-K | | 000-24429 | | 10.1 | | | 6/7/2017 | | | | 10.19† | | | | 10-Q | | 000-24429 | | 10.2 | | | 8/3/2017 | | | | 10.20† | | | | 10-Q | | 000-24429 | | 10.3 | | | 8/3/2017 | | | | 10.21† | | | | 10-Q | | 000-24429 | | 10.4 | | | 8/3/2017 | | | | 10.22† | | | | 10-Q | | 000-24429 | | 10.5 | | | 8/3/2017 | | | | 10.23† | | | | 10-Q | | 000-24429 | | 10.1 | | | 5/8/2020 | | | | 10.24† | | | | 10-Q | | 000-24429 | | 10.2 | | | 5/8/2020 | | | | 10.25 | | | | 8-K | | 000-24429 | | 10.1 | | | 3/14/2017 | | | | 10.26 | | | | 8-K | | 000-24429 | | 10.1 | | | 11/9/2018 | | | | 10.27† | | | | 10-Q | | 000-24429 | | 10.1 | | | 7/30/2020 | | | | 21.1 | | | | | | | | | | | | Filed |
| | | | | | | | | | Cognizant | 45 | December 31, 2023 Form 10-K |
| | | | | | | | | | | | | | | | | | | | | | | | | | | | | | | | | | | | | | | | | | | | Incorporated by Reference | | | | Number | | Exhibit Description | | Form | | File No. | | Exhibit | | Date | | Filed or Furnished
Herewith | 23.110.8† | | | | 10-K | | 000-24429 | | 10.4 | | | 2/19/2019 | | | | | | Filed | 31.110.9† | | | | 8-K | | 000-24429 | | 10.1 | | | 7/29/2020 | | | | | | Filed | 31.210.10† | | | | 10-K | | 000-24429 | | 10.6 | | | 2/12/2021 | | | | | | Filed | 32.110.11† | | | | 8-K | | 000-24429 | | 10.1 | | | 1/12/2023 | | | | | | Furnished | 32.210.12† | | | | 8-K | | 000-24429 | | 10.1 | | | 9/28/2023 | | | | 10.13† | | | | 10-Q | | 000-24429 | | 10.9 | | | Furnished8/3/2023 | | | | 10.14† | | | | 10-K | | 000-24429 | | 10.7 | | | 2/16/2022 | | | | 10.15† | | | | 10-Q | | 000-24429 | | 10.1 | | | 5/4/2015 | | | | 10.16† | | | | 8-K | | 000-24429 | | 10.7 | | | 7/6/2009 | | | | 10.17† | | | | 8-K | | 000-24429 | | 10.8 | | | 7/6/2009 | | | | 10.18† | | | | 8-K | | 000-24429 | | 10.1 | | | 6/7/2017 | | | 101.INS10.19† | | | | Inline XBRL Instance Document - the instance document does not appear in the Interactive Data File because its XBRL tags are embedded within the Inline XBRL document.10-Q | | 000-24429 | | 10.2 | | | 8/3/2017 | | | | | | | Filed | 101.SCH10.20† | | | | Inline XBRL Taxonomy Extension Schema Document10-Q | | 000-24429 | | 10.3 | | | 8/3/2017 | | | | | | | Filed | 101.CAL10.21† | | | | Inline XBRL Taxonomy Extension Calculation Linkbase Document10-Q | | 000-24429 | | 10.4 | | | 8/3/2017 | | | | | | | Filed | 101.DEF10.22† | | | | Inline XBRL Taxonomy Extension Definition Linkbase Document10-Q | | 000-24429 | | 10.5 | | | 8/3/2017 | | | | | | | Filed | 101.LAB10.23† | | | | 10-Q | | 000-24429 | | 10.1 | | | 5/8/2020 | | | | 10.24† | | | | 10-Q | | 000-24429 | | 10.2 | | | 5/8/2020 | | | | 10.25† | | | | S-8 | | 333-27244 | | 99.1 | | | 6/6/2023 | | | | 10.26† | | | | 10-Q | | 000-24429 | | 10.3 | | | 8/3/2023 | | | | 10.27† | | | | 10-Q | | 000-24429 | | 10.4 | | | 8/3/2023 | | |
| | | | | | | | | | Cognizant | 46 | Inline XBRL Taxonomy Extension Label Linkbase DocumentDecember 31, 2023 Form 10-K |
| | | | | | | | | | | | | | | | | | | | | | | | | | | | | | | | | | | | | | | | | | | | Incorporated by Reference | | | | Number | | Exhibit Description | | Form | | File No. | | Exhibit | | Date | | Filed or Furnished
Herewith | | 10.28† | | | | 10-Q | | 000-24429 | | 10.5 | | | 8/3/2023 | | | | 10.29† | | | | 10-Q | | 000-24429 | | 10.6 | | | 8/3/2023 | | | | 10.30† | | | | 10-Q | | 000-24429 | | 10.7 | | | 8/3/2023 | | | | 10.31† | | | | 10-Q | | 000-24429 | | 10.8 | | | 8/3/2023 | | | | 10.32† | | | | 10-Q | | 000-24429 | | 10.1 | | | 7/30/2020 | | | | 10.33† | | | | 8-K | | 000-24429 | | 10.1 | | | 3/6/2023 | | | | 10.34 | | | | 8-K | | 000-24429 | | 10.1 | | | 10/7/2022 | | | | 21.1 | | | | | | | | | | | | Filed | | 23.1 | | | | | | | | | | | | Filed | | 31.1 | | | | | | | | | | | | Filed | | 31.2 | | | | | | | | | | | | Filed | | 32.1 | | | | | | | | | | | | Furnished | | 32.2 | | | | | | | | | | | | Furnished | | 97.1 | | | | | | | | | | | | Filed | | 101.INS | | Inline XBRL Instance Document - the instance document does not appear in the Interactive Data File because its XBRL tags are embedded within the Inline XBRL document. | | | | | | | | | | Filed | | 101.SCH | | Inline XBRL Taxonomy Extension Schema Document | | | | | | | | | | Filed | | 101.CAL | | Inline XBRL Taxonomy Extension Calculation Linkbase Document | | | | | | | | | | Filed | | 101.DEF | | Inline XBRL Taxonomy Extension Definition Linkbase Document | | | | | | | | | | Filed | | 101.LAB | | Inline XBRL Taxonomy Extension Label Linkbase Document | | | | | | | | | | Filed |
| | | | | | | | | | Cognizant | | | | | | | | | 47 | December 31, 2023 Form 10-K |
| | | | | | | | | | | | | | | | | | | | | | | | | | | | | | | | | | | | | | | | | | | Incorporated by Reference | | | | Number | | Exhibit Description | | Form | | File No. | | Exhibit | | Date | | Filed or Furnished
Herewith | | 101.PRE | | Inline XBRL Taxonomy Extension Presentation Linkbase Document | | | | | | | | | | Filed | | 104 | | Cover Page Interactive Data File (formatted as Inline XBRL and contained in Exhibit 101) | | | | | | | | | | Filed |
| | | | | | | † | A management contract or compensatory plan or arrangement required to be filed as an exhibit pursuant to Item 15(a)(3) of Form 10-K. |
Item 16. Form 10-K Summary None. | | | | | | | | | | Cognizant | 48 | December 31, 2023 Form 10-K |
SIGNATURES Pursuant to the requirements of Section 13 or 15(d) of the Securities Exchange Act of 1934, the Registrant has duly caused this report to be signed on its behalf by the undersigned, thereunto duly authorized. | | | | | | | | | | | | | COGNIZANT TECHNOLOGY SOLUTIONS CORPORATION | | | | By: | | /S/ BRRIANAVI HKUMPHRIESUMAR S | | | Brian Humphries,Ravi Kumar S, | | | | Chief Executive Officer | | | | (Principal Executive Officer) | | | | | Date: | | February 12, 202114, 2024 |
Pursuant to the requirements of the Securities Exchange Act of 1934, this report has been signed below by the following persons on behalf of the Registrant and in the capacities and on the dates indicated. | | | | | | | | | | | | | | | | | | | | | Signature | | Title | | Date | | | | /s/ B /s/ RRIAN AVIH KUMPHRIESUMAR S
| | Chief Executive Officer and Director
(Principal Executive Officer) | | February 12, 202114, 2024 | Brian HumphriesRavi Kumar S | | | | | | /s/ JANATIN SDIEGMUNDALAL | | Chief Financial Officer
(Principal Financial Officer) | | February 12, 202114, 2024 | Jan SiegmundJatin Dalal | | | | | | /s/ ROBERT TELESMANIC | | Senior Vice President, Controller and Chief Accounting Officer
(Principal Accounting Officer) | | February 12, 202114, 2024 | | Robert Telesmanic | | | | | | | /s/ MSICHAELTEPHEN PJ. RATSALOS-FOXOHLEDER | | ChairmanChair of the Board and Director | | February 12, 202114, 2024 | Michael Patsalos-FoxStephen J. Rohleder | | | | | | /s/ ZEIN ABDALLA | | Director | | February 12, 202114, 2024 | | Zein Abdalla | | | | | | | /s/ VINITA BALI | | Director | | February 12, 202114, 2024 | | Vinita Bali | | | | | | | | | /s/ MEAUREENRIC BREAKIRON-EVANSRANDERIZ | | Director | | February 12, 202114, 2024 | Maureen Breakiron-EvansEric Branderiz | | | | | | | /s/ ARCHANA DESKUS | | Director | | February 12, 202114, 2024 | | Archana Deskus | | | | | | | | | /s/ JOHN M. DINEEN | | Director | | February 12, 202114, 2024 | | John M. Dineen | | | | | | | /s/ JOHN N. FOX, JR.
| | Director | | February 12, 2021 | John N. Fox, Jr. | | | | | | | /s/ LEO S. MACKAY, JR. | | Director | | February 12, 202114, 2024 | | Leo S. Mackay, Jr. | | | | | | | | | /s/ MICHAEL PATSALOS-FOX | | Director | | February 14, 2024 | | Michael Patsalos-Fox | | | | | | | | | /s/ ABRAHAM SCHOT | | Director | | February 14, 2024 | | Abraham Schot | | | | | | | | | /s/ JOSEPH M. VELLI | | Director | | February 12, 202114, 2024 | | Joseph M. Velli | | | | | | | | | /s/ SANDRA S. WIJNBERG | | Director | | February 12, 202114, 2024 | | Sandra S. Wijnberg | | | |
| | | | | | | | | | Cognizant | 49 | December 31, 2023 Form 10-K |
COGNIZANT TECHNOLOGY SOLUTIONS CORPORATION INDEX TO CONSOLIDATED FINANCIAL STATEMENTS AND FINANCIAL STATEMENT SCHEDULE | | | | | | | | | | | | | | | | | | | Page | | | | Consolidated Financial Statements: | | | | | | | | | | | | | | | | | | | | | | | | | | | | | | | | | Financial Statement Schedule: | | | | | | | |
| | | | | | | | | | Cognizant | F-1 | December 31, 2023 Form 10-K |
Report of Independent Registered Public Accounting Firm
To the Board of Directors and Stockholders of Cognizant Technology Solutions Corporation
Opinions on the Financial Statements and Internal Control over Financial Reporting
We have audited the accompanying consolidated statements of financial position of Cognizant Technology Solutions Corporation and its subsidiaries (the “Company”) as of December 31, 20202023 and 2019,2022, and the related consolidated statements of operations, of comprehensive income, of stockholders’ equity and of cash flows for each of the three years in the period ended December 31, 2020,2023, including the related notes and financial statement schedule listed in the accompanying index (collectively referred to as the “consolidated financial statements”). We also have audited the Company's internal control over financial reporting as of December 31, 2020,2023, based on criteria established in Internal Control - Integrated Framework (2013) issued by the Committee of Sponsoring Organizations of the Treadway Commission (COSO).
In our opinion, the consolidated financial statements referred to above present fairly, in all material respects, the financial position of the Company as of December 31, 20202023 and 2019,2022, and the results of its operations and its cash flows for each of the three years in the period ended December 31, 20202023 in conformity with accounting principles generally accepted in the United States of America. Also in our opinion, the Company maintained, in all material respects, effective internal control over financial reporting as of December 31, 2020,2023, based on criteria established in Internal Control - Integrated Framework (2013) issued by the COSO.
Change in Accounting Principle
As discussed in Note 1 to the consolidated financial statements, the Company changed the manner in which it accounts for leases in 2019 and the manner in which it accounts for revenues from contracts with customers in 2018.
Basis for Opinions
The Company's management is responsible for these consolidated financial statements, for maintaining effective internal control over financial reporting, and for its assessment of the effectiveness of internal control over financial reporting, included in Management's Report on Internal Control Over Financial Reporting appearing under Item 9A. Our responsibility is to express opinions on the Company’s consolidated financial statements and on the Company's internal control over financial reporting based on our audits. We are a public accounting firm registered with the Public Company Accounting Oversight Board (United States) (PCAOB) and are required to be independent with respect to the Company in accordance with the U.S. federal securities laws and the applicable rules and regulations of the Securities and Exchange Commission and the PCAOB.
We conducted our audits in accordance with the standards of the PCAOB. Those standards require that we plan and perform the audits to obtain reasonable assurance about whether the consolidated financial statements are free of material misstatement, whether due to error or fraud, and whether effective internal control over financial reporting was maintained in all material respects.
Our audits of the consolidated financial statements included performing procedures to assess the risks of material misstatement of the consolidated financial statements, whether due to error or fraud, and performing procedures that respond to those risks. Such procedures included examining, on a test basis, evidence regarding the amounts and disclosures in the consolidated financial statements. Our audits also included evaluating the accounting principles used and significant estimates made by management, as well as evaluating the overall presentation of the consolidated financial statements. Our audit of internal control over financial reporting included obtaining an understanding of internal control over financial reporting, assessing the risk that a material weakness exists, and testing and evaluating the design and operating effectiveness of internal control based on the assessed risk. Our audits also included performing such other procedures as we considered necessary in the circumstances. We believe that our audits provide a reasonable basis for our opinions.
Definition and Limitations of Internal Control over Financial Reporting
A company’s internal control over financial reporting is a process designed to provide reasonable assurance regarding the reliability of financial reporting and the preparation of financial statements for external purposes in accordance with generally accepted accounting principles. A company’s internal control over financial reporting includes those policies and procedures that (i) pertain to the maintenance of records that, in reasonable detail, accurately and fairly reflect the transactions and dispositions of the assets of the company; (ii) provide reasonable assurance that transactions are recorded as necessary to permit preparation of financial statements in accordance with generally accepted accounting principles, and that receipts and
expenditures of the company are being made only in accordance with authorizations of management and directors of the company; and (iii) provide reasonable assurance regarding prevention or timely detection of unauthorized acquisition, use, or disposition of the company’s assets that could have a material effect on the financial statements.
| | | | | | | | | | Cognizant | F-2 | December 31, 2023 Form 10-K |
Because of its inherent limitations, internal control over financial reporting may not prevent or detect misstatements. Also, projections of any evaluation of effectiveness to future periods are subject to the risk that controls may become inadequate because of changes in conditions, or that the degree of compliance with the policies or procedures may deteriorate.
Critical Audit Matters
The critical audit matter communicated below is a matter arising from the current period audit of the consolidated financial statements that was communicated or required to be communicated to the audit committee and that (i) relates to accounts or disclosures that are material to the consolidated financial statements and (ii) involved our especially challenging, subjective, or complex judgments. The communication of critical audit matters does not alter in any way our opinion on the consolidated financial statements, taken as a whole, and we are not, by communicating the critical audit matter below, providing a separate opinion on the critical audit matter or on the accounts or disclosures to which it relates.
Revenue Recognition – Expected Labor Costs to Complete for Certain Fixed-Price Contracts
As described in Notes 1 and 2 to the consolidated financial statements, fixed-price contracts comprised $6.1$8.7 billion of the Company’s total revenues for the year ended December 31, 2020,2023, which includes performance obligations where control is transferred over time. For performance obligations where control is transferred over time, revenues are recognized based on the extent of progress towards completion of the performance obligation. The selection of the method to measure progress towards completion requires judgment and is based on the nature of the deliverables to be provided. Management recognizes revenues related to fixed-price contracts for application development and systems integration services, consulting or other technology services as the service is performed using the cost to costcost-to-cost method, under which the total value of revenues is recognized on the basis of the percentage that each contract’s total labor cost to date bears to the total expected labor costs. The cost to costcost-to-cost method requires estimation of future costs, which is updated as the project progresses to reflect the latest available information. Revenues related to fixed-price application maintenance, testingquality engineering and assurance as well as business process services are recognized based on management’s right to invoice for services performed for contracts in which the invoicing is representative of the value being delivered. If management’s invoicing is not consistent with the value delivered, revenues are recognized as the service is performed based on the cost to costcost-to-cost method described above.
The principal considerations for our determination that performing procedures relating to revenue recognition – expected labor costs to complete for certain fixed-price contracts is a critical audit matter are the significant judgment by management when developing the estimated total expected labor costs to complete fixed-price contracts and the significant auditor judgment, subjectivity, and effort in performing procedures and evaluating audit evidence relating to management’s estimate of total expected labor costs.costs.
Addressing the matter involved performing procedures and evaluating audit evidence in connection with forming our overall opinion on the consolidated financial statements. These procedures included testing the effectiveness of controls relating to the revenue recognition process, including controls over the development of the estimated total expected labor costs to complete fixed-price contracts. These procedures also included, among others, evaluating and testing management’s process for developing the estimated total expected labor costs for a sample of contracts, which included evaluating the reasonableness of the total expected labor cost assumptions used by management. Evaluating the reasonableness of the assumptions related to the total expected labor costs involved assessing management’s ability to reasonably develop total expected labor costs by (i) performing a comparison of actual labor costs incurred with expected labor costscost metrics at project inception with actual cost metrics for similar completed projects and (ii) evaluating the timely identification of circumstances that may warrant a modification to previous labor cost estimates, including actual labor costs in excess of estimates.
/s/ PricewaterhouseCoopers LLP New York, New York February 12, 202114, 2024
We have served as the Company’s auditor since 1997.
| | | | | | | | | | Cognizant | F-3 | December 31, 2023 Form 10-K |
COGNIZANT TECHNOLOGY SOLUTIONS CORPORATION CONSOLIDATED STATEMENTS OF FINANCIAL POSITION (in millions, except par values)
| | | | | | | | | | | | | At December 31, | | 2020 | | 2019 | | Assets | | | | | Current assets: | | | | | Cash and cash equivalents | $ | 2,680 | | | $ | 2,645 | | | Short-term investments | 44 | | | 779 | | | Trade accounts receivable, net | 3,087 | | | 3,256 | | | Other current assets | 1,040 | | | 931 | | | Total current assets | 6,851 | | | 7,611 | | | Property and equipment, net | 1,251 | | | 1,309 | | | Operating lease assets, net | 1,013 | | | 926 | | | Goodwill | 5,031 | | | 3,979 | | | Intangible assets, net | 1,046 | | | 1,041 | | | Deferred income tax assets, net | 445 | | | 585 | | | Long-term investments | 440 | | | 17 | | | Other noncurrent assets | 846 | | | 736 | | | Total assets | $ | 16,923 | | | $ | 16,204 | | | Liabilities and Stockholders’ Equity | | | | | Current liabilities: | | | | | Accounts payable | $ | 389 | | | $ | 239 | | | Deferred revenue | 383 | | | 313 | | | Short-term debt | 38 | | | 38 | | | Operating lease liabilities | 211 | | | 202 | | | Accrued expenses and other current liabilities | 2,519 | | | 2,191 | | | Total current liabilities | 3,540 | | | 2,983 | | | Deferred revenue, noncurrent | 36 | | | 23 | | | Operating lease liabilities, noncurrent | 846 | | | 745 | | | Deferred income tax liabilities, net | 206 | | | 35 | | | Long-term debt | 663 | | | 700 | | | Long-term income taxes payable | 428 | | | 478 | | | Other noncurrent liabilities | 368 | | | 218 | | | Total liabilities | 6,087 | | | 5,182 | | Commitments and contingencies (See Note 15) | 0 | | 0 | | Stockholders’ equity: | | | | | Preferred stock, $0.10 par value, 15 shares authorized, NaN issued | 0 | | | 0 | | Class A common stock, $0.01 par value, 1,000 shares authorized, 530 and 548 shares issued and outstanding at December 31, 2020 and 2019, respectively | 5 | | | 5 | | | Additional paid-in capital | 32 | | | 33 | | | Retained earnings | 10,689 | | | 11,022 | | | Accumulated other comprehensive income (loss) | 110 | | | (38) | | | Total stockholders’ equity | 10,836 | | | 11,022 | | | Total liabilities and stockholders’ equity | $ | 16,923 | | | $ | 16,204 | |
| | | | | | | | | | | | | December 31, | | (in millions, except par values) | 2023 | | 2022 | | Assets | | | | | Current assets: | | | | | Cash and cash equivalents | $ | 2,621 | | | $ | 2,191 | | | Short-term investments | 14 | | | 310 | | | Trade accounts receivable, net | 3,849 | | | 3,796 | | | Other current assets | 1,022 | | | 969 | | | Total current assets | 7,506 | | | 7,266 | | | Property and equipment, net | 1,048 | | | 1,101 | | | Operating lease assets, net | 611 | | | 876 | | | Goodwill | 6,085 | | | 5,710 | | | Intangible assets, net | 1,149 | | | 1,168 | | | Deferred income tax assets, net | 993 | | | 642 | | | Long-term investments | 435 | | | 427 | | | Other noncurrent assets | 656 | | | 662 | | | Total assets | $ | 18,483 | | | $ | 17,852 | | | Liabilities and Stockholders’ Equity | | | | | Current liabilities: | | | | | Accounts payable | $ | 337 | | | $ | 360 | | | Deferred revenue | 385 | | | 398 | | | Short-term debt | 33 | | | 8 | | | Operating lease liabilities | 153 | | | 174 | | | Accrued expenses and other current liabilities | 2,425 | | | 2,407 | | | Total current liabilities | 3,333 | | | 3,347 | | | Deferred revenue, noncurrent | 42 | | | 19 | | | Operating lease liabilities, noncurrent | 523 | | | 714 | | | Deferred income tax liabilities, net | 226 | | | 180 | | | Long-term debt | 606 | | | 638 | | | Long-term income taxes payable | 157 | | | 283 | | | Other noncurrent liabilities | 369 | | | 362 | | | Total liabilities | 5,256 | | | 5,543 | | Commitments and contingencies (See Note 15) | | | | | Stockholders’ equity: | | | | | Preferred stock, $0.10 par value, 15 shares authorized, none issued | — | | | — | | | Class A common stock, $0.01 par value, 1,000 shares authorized, 498 and 509 shares issued and outstanding as of December 31, 2023 and 2022, respectively | 5 | | | 5 | | | Additional paid-in capital | 15 | | | 15 | | | Retained earnings | 13,301 | | | 12,588 | | | Accumulated other comprehensive income (loss) | (94) | | | (299) | | | Total stockholders’ equity | 13,227 | | | 12,309 | | | Total liabilities and stockholders’ equity | $ | 18,483 | | | $ | 17,852 | |
The accompanying notes are an integral part of the consolidated financial statements. | | | | | | | | | | Cognizant | F-4 | December 31, 2023 Form 10-K |
COGNIZANT TECHNOLOGY SOLUTIONS CORPORATION CONSOLIDATED STATEMENTS OF OPERATIONS (in millions, except per share data)
| | | | | | | | | | | | | | | | | | | | | | | | Year Ended December 31, | | | | 2020 | | 2019 | | 2018 | | Revenues | | $ | 16,652 | | | $ | 16,783 | | | $ | 16,125 | | | Operating expenses: | | | | | | | | Cost of revenues (exclusive of depreciation and amortization expense shown separately below) | | 10,671 | | | 10,634 | | | 9,838 | | | Selling, general and administrative expenses | | 3,100 | | | 2,972 | | | 3,007 | | | Restructuring charges | | 215 | | | 217 | | | 19 | | | Depreciation and amortization expense | | 552 | | | 507 | | | 460 | | | Income from operations | | 2,114 | | | 2,453 | | | 2,801 | | | Other income (expense), net: | | | | | | | | Interest income | | 119 | | | 176 | | | 177 | | | Interest expense | | (24) | | | (26) | | | (27) | | | Foreign currency exchange gains (losses), net | | (116) | | | (65) | | | (152) | | | Other, net | | 3 | | | 5 | | | (2) | | | Total other income (expense), net | | (18) | | | 90 | | | (4) | | | Income before provision for income taxes | | 2,096 | | | 2,543 | | | 2,797 | | | Provision for income taxes | | (704) | | | (643) | | | (698) | | | Income (loss) from equity method investments | | 0 | | | (58) | | | 2 | | | Net income | | $ | 1,392 | | | $ | 1,842 | | | $ | 2,101 | | | Basic earnings per share | | $ | 2.58 | | | $ | 3.30 | | | $ | 3.61 | | | Diluted earnings per share | | $ | 2.57 | | | $ | 3.29 | | | $ | 3.60 | | | Weighted average number of common shares outstanding—Basic | | 540 | | | 559 | | | 582 | | | Dilutive effect of shares issuable under stock-based compensation plans | | 1 | | | 1 | | | 2 | | | Weighted average number of common shares outstanding—Diluted | | 541 | | | 560 | | | 584 | |
| | | | | | | | | | | | | | | | | | | | | | | | Year Ended December 31, | | (in millions, except per share data) | | 2023 | | 2022 | | 2021 | | Revenues | | $ | 19,353 | | | $ | 19,428 | | | $ | 18,507 | | | Operating expenses: | | | | | | | | Cost of revenues (exclusive of depreciation and amortization expense shown separately below) | | 12,664 | | | 12,448 | | | 11,604 | | | Selling, general and administrative expenses | | 3,252 | | | 3,443 | | | 3,503 | | | Restructuring charges | | 229 | | | — | | | — | | | Depreciation and amortization expense | | 519 | | | 569 | | | 574 | | | Income from operations | | 2,689 | | | 2,968 | | | 2,826 | | | Other income (expense), net: | | | | | | | | Interest income | | 126 | | | 59 | | | 30 | | | Interest expense | | (41) | | | (19) | | | (9) | | | Foreign currency exchange gains (losses), net | | 2 | | | 7 | | | (20) | | | Other, net | | 11 | | | 1 | | | — | | | Total other income (expense), net | | 98 | | | 48 | | | 1 | | | Income before provision for income taxes | | 2,787 | | | 3,016 | | | 2,827 | | | Provision for income taxes | | (668) | | | (730) | | | (693) | | | Income (loss) from equity method investments | | 7 | | | 4 | | | 3 | | | Net income | | $ | 2,126 | | | $ | 2,290 | | | $ | 2,137 | | | Basic earnings per share | | $ | 4.21 | | | $ | 4.42 | | | $ | 4.06 | | | Diluted earnings per share | | $ | 4.21 | | | $ | 4.41 | | | $ | 4.05 | | | Weighted average number of common shares outstanding—Basic | | 505 | | | 518 | | | 527 | | | Dilutive effect of shares issuable under stock-based compensation plans | | — | | | 1 | | | 1 | | | Weighted average number of common shares outstanding—Diluted | | 505 | | | 519 | | | 528 | |
The accompanying notes are an integral part of the consolidated financial statements. | | | | | | | | | | Cognizant | F-5 | December 31, 2023 Form 10-K |
COGNIZANT TECHNOLOGY SOLUTIONS CORPORATION CONSOLIDATED STATEMENTS OF COMPREHENSIVE INCOME (in millions)
| | | | | | | | | | | | | | | | | | | | | | | | Year Ended December 31, | | | | 2020 | | 2019 | | 2018 | | Net income | | $ | 1,392 | | | $ | 1,842 | | | $ | 2,101 | | | Other comprehensive income (loss), net of tax: | | | | | | | | Foreign currency translation adjustments | | 119 | | | 39 | | | (65) | | | Change in unrealized gains and losses on cash flow hedges | | 29 | | | 29 | | | (118) | | | Change in unrealized losses on available-for-sale investment securities | | 0 | | | 8 | | | 0 | | | Other comprehensive income (loss) | | 148 | | | 76 | | | (183) | | | Comprehensive income | | $ | 1,540 | | | $ | 1,918 | | | $ | 1,918 | |
| | | | | | | | | | | | | | | | | | | | | | | | Year Ended December 31, | | (in millions) | | 2023 | | 2022 | | 2021 | | Net income | | $ | 2,126 | | | $ | 2,290 | | | $ | 2,137 | | | Change in Accumulated other comprehensive income (loss), net of tax: | | | | | | | | Foreign currency translation adjustments | | 144 | | | (228) | | | (75) | | | Unrealized gains and losses on cash flow hedges | | 61 | | | (108) | | | 2 | | | | | | | | | | Other comprehensive income (loss) | | 205 | | | (336) | | | (73) | | | Comprehensive income | | $ | 2,331 | | | $ | 1,954 | | | $ | 2,064 | |
The accompanying notes are an integral part of the consolidated financial statements. | | | | | | | | | | Cognizant | F-6 | December 31, 2023 Form 10-K |
COGNIZANT TECHNOLOGY SOLUTIONS CORPORATION CONSOLIDATED STATEMENTS OF STOCKHOLDERS’ EQUITY (in millions, except per share data)
| | | | | | | | | | | | | | | | | | | | | | | | | | | | | | | | | | | | | | | | | | Class A Common Stock | | Additional
Paid-in
Capital | | Retained
Earnings | | Accumulated
Other
Comprehensive
Income (Loss) | | Total | | Shares | | Amount | | | Balance, December 31, 2017 | | 588 | | | $ | 6 | | | $ | 49 | | | $ | 10,544 | | | $ | 70 | | | $ | 10,669 | | Cumulative effect of changes in accounting principle (1) | | — | | | — | | | — | | | 122 | | | (1) | | | 121 | | | Net income | | — | | | — | | | — | | | 2,101 | | | — | | | 2,101 | | | Other comprehensive income (loss) | | — | | | — | | | — | | | — | | | (183) | | | (183) | | | Common stock issued, stock-based compensation plans | | 6 | | | — | | | 181 | | | — | | | — | | | 181 | | | Stock-based compensation expense | | — | | | — | | | 267 | | | — | | | — | | | 267 | | | Repurchases of common stock | | (17) | | | — | | | (450) | | | (811) | | | — | | | (1,261) | | | Dividends declared, $0.80 per share | | — | | | — | | | — | | | (471) | | | — | | | (471) | | | Balance, December 31, 2018 | | 577 | | | 6 | | | 47 | | | 11,485 | | | (114) | | | 11,424 | | Cumulative effect of changes in accounting principle (2) | | — | | | — | | | — | | | 2 | | | — | | | 2 | | | Net income | | — | | | — | | | — | | | 1,842 | | | — | | | 1,842 | | | Other comprehensive income (loss) | | — | | | — | | | — | | | — | | | 76 | | | 76 | | | Common stock issued, stock-based compensation plans | | 7 | | | — | | | 159 | | | — | | | — | | | 159 | | | Stock-based compensation expense | | — | | | — | | | 217 | | | — | | | — | | | 217 | | | Repurchases of common stock | | (36) | | | (1) | | | (390) | | | (1,856) | | | — | | | (2,247) | | | Dividends declared, $0.80 per share | | — | | | — | | | — | | | (451) | | | — | | | (451) | | | Balance, December 31, 2019 | | 548 | | | 5 | | | 33 | | | 11,022 | | | (38) | | | 11,022 | | Cumulative effect of changes in accounting principle (3) | | — | | | — | | | — | | | 1 | | | — | | | 1 | | | Net income | | — | | | — | | | — | | | 1,392 | | | — | | | 1,392 | | | Other comprehensive income (loss) | | — | | | — | | | — | | | — | | | 148 | | | 148 | | | Common stock issued, stock-based compensation plans | | 6 | | | — | | | 142 | | | — | | | — | | | 142 | | | Stock-based compensation expense | | — | | | — | | | 232 | | | — | | | — | | | 232 | | | Repurchases of common stock | | (24) | | | — | | | (375) | | | (1,246) | | | — | | | (1,621) | | | Dividends declared, $0.88 per share | | — | | | — | | | — | | | (480) | | | — | | | (480) | | | Balance, December 31, 2020 | | 530 | | | $ | 5 | | | $ | 32 | | | $ | 10,689 | | | $ | 110 | | | $ | 10,836 | | | | | | | | | | | | | | | | | | | | | | | | | | | |
(1) Reflects the adoption of the New Revenue Standard as well as ASU 2018-02 "Reclassification of Certain Tax Effects from Accumulated Other Comprehensive Income" on January 1, 2018.
(2) Reflects the adoption of the New Lease Standard on January 1, 2019.
(3) Reflects the adoption of the Credit Loss Standard as described in Note 1. | | | | | | | | | | | | | | | | | | | | | | | | | | | | | | | | | | | | | | | | (in millions, except per share data) | | Class A Common Stock | | Additional
Paid-in
Capital | | Retained
Earnings | | Accumulated
Other
Comprehensive
Income (Loss) | | Total | | Shares | | Amount | | | Balance, December 31, 2020 | | 530 | | | $ | 5 | | | $ | 32 | | | $ | 10,689 | | | $ | 110 | | | $ | 10,836 | | | Net income | | — | | | — | | | — | | | 2,137 | | | — | | | 2,137 | | | Other comprehensive income (loss) | | — | | | — | | | — | | | — | | | (73) | | | (73) | | | Common stock issued, stock-based compensation plans | | 5 | | | — | | | 130 | | | — | | | — | | | 130 | | | Stock-based compensation expense | | — | | | — | | | 246 | | | — | | | — | | | 246 | | | Repurchases of common stock | | (10) | | | — | | | (381) | | | (394) | | | — | | | (775) | | | Dividends declared, $0.96 per share | | — | | | — | | | — | | | (510) | | | — | | | (510) | | | Balance, December 31, 2021 | | 525 | | | 5 | | | 27 | | | 11,922 | | | 37 | | | 11,991 | | | Net income | | — | | | — | | | — | | | 2,290 | | | — | | | 2,290 | | | Other comprehensive income (loss) | | — | | | — | | | — | | | — | | | (336) | | | (336) | | | Common stock issued, stock-based compensation plans | | 4 | | | — | | | 86 | | | — | | | — | | | 86 | | | Stock-based compensation expense | | — | | | — | | | 261 | | | — | | | — | | | 261 | | | Repurchases of common stock | | (20) | | | — | | | (359) | | | (1,059) | | | — | | | (1,418) | | | Dividends declared, $1.08 per share | | — | | | — | | | — | | | (565) | | | — | | | (565) | | | Balance, December 31, 2022 | | 509 | | | 5 | | | 15 | | | 12,588 | | | (299) | | | 12,309 | | | Net income | | — | | | — | | | — | | | 2,126 | | | — | | | 2,126 | | | Other comprehensive income (loss) | | — | | | — | | | — | | | — | | | 205 | | | 205 | | | Common stock issued, stock-based compensation plans | | 4 | | | — | | | 71 | | | — | | | — | | | 71 | | | Stock-based compensation expense | | — | | | — | | | 176 | | | — | | | — | | | 176 | | | Repurchases of common stock | | (15) | | | — | | | (247) | | | (823) | | | — | | | (1,070) | | | Dividends declared, $1.16 per share | | — | | | — | | | — | | | (590) | | | — | | | (590) | | | Balance, December 31, 2023 | | 498 | | | $ | 5 | | | $ | 15 | | | $ | 13,301 | | | $ | (94) | | | $ | 13,227 | | | | | | | | | | | | | | | | | | | | | | | | | | | |
The accompanying notes are an integral part of the consolidated financial statements.
| | | | | | | | | | Cognizant | F-7 | December 31, 2023 Form 10-K |
COGNIZANT TECHNOLOGY SOLUTIONS CORPORATION CONSOLIDATED STATEMENTS OF CASH FLOWS (in millions)
| | | | Year Ended December 31, | | Year Ended December 31, | | | 2020 | | 2019 | | 2018 | | (in millions) | | (in millions) | 2023 | | 2022 | | 2021 | | Cash flows from operating activities: | Cash flows from operating activities: | | | | | | | Net income | | | Net income | | | Net income | Net income | $ | 1,392 | | | $ | 1,842 | | | $ | 2,101 | | | Adjustments to reconcile net income to net cash provided by operating activities: | Adjustments to reconcile net income to net cash provided by operating activities: | | | Depreciation and amortization | Depreciation and amortization | 559 | | | 526 | | | 498 | | | Depreciation and amortization | | | Depreciation and amortization | | | | Deferred income taxes | | | Deferred income taxes | | | Deferred income taxes | Deferred income taxes | 184 | | | (306) | | | 8 | | | Stock-based compensation expense | Stock-based compensation expense | 232 | | | 217 | | | 267 | | | Other | Other | 119 | | | 119 | | | 125 | | | Changes in assets and liabilities: | Changes in assets and liabilities: | | | Trade accounts receivable | | | Trade accounts receivable | | | Trade accounts receivable | Trade accounts receivable | 264 | | | 37 | | | (365) | | | Other current and noncurrent assets | Other current and noncurrent assets | 73 | | | 159 | | | (8) | | | Accounts payable | Accounts payable | 109 | | | 8 | | | (4) | | | Deferred revenue, current and noncurrent | Deferred revenue, current and noncurrent | 65 | | | 56 | | | (86) | | | Other current and noncurrent liabilities | Other current and noncurrent liabilities | 302 | | | (159) | | | 56 | | | Net cash provided by operating activities | Net cash provided by operating activities | 3,299 | | | 2,499 | | | 2,592 | | | Cash flows from investing activities: | Cash flows from investing activities: | | | | | | | Purchases of property and equipment | Purchases of property and equipment | (398) | | | (392) | | | (377) | | | Purchases of property and equipment | | | Purchases of property and equipment | | | Purchases of available-for-sale investment securities | Purchases of available-for-sale investment securities | 0 | | | (333) | | | (1,630) | | | Proceeds from maturity or sale of available-for-sale investment securities | 0 | | | 2,107 | | | 1,838 | | | Proceeds from maturity of available-for-sale investment securities | | | Purchases of held-to-maturity investment securities | Purchases of held-to-maturity investment securities | (202) | | | (693) | | | (1,363) | | | Proceeds from maturity of held-to-maturity investment securities | Proceeds from maturity of held-to-maturity investment securities | 467 | | | 1,498 | | | 1,164 | | | Purchases of other investments | Purchases of other investments | (531) | | | (483) | | | (513) | | | Proceeds from maturity or sale of other investments | Proceeds from maturity or sale of other investments | 549 | | | 501 | | | 365 | | | Proceeds from sales of businesses | | | Payments for business combinations, net of cash acquired | Payments for business combinations, net of cash acquired | (1,123) | | | (617) | | | (1,111) | | | Net cash (used in) provided by investing activities | (1,238) | | | 1,588 | | | (1,627) | | | Net cash (used in) investing activities | | | Cash flows from financing activities: | Cash flows from financing activities: | | | | | | | Issuance of common stock under stock-based compensation plans | | | Issuance of common stock under stock-based compensation plans | | | Issuance of common stock under stock-based compensation plans | Issuance of common stock under stock-based compensation plans | 142 | | | 159 | | | 181 | | | | Repurchases of common stock | Repurchases of common stock | (1,621) | | | (2,247) | | | (1,261) | | | | Repurchases of common stock | | | | Repurchases of common stock | | | Repayment of term loan borrowings and finance lease and earnout obligations | Repayment of term loan borrowings and finance lease and earnout obligations | (50) | | | (28) | | | (91) | | | Proceeds from borrowing under the revolving credit facility | 1,740 | | | 0 | | | 0 | | | Repayment of notes outstanding under the revolving credit facility | (1,740) | | | 0 | | | 0 | | | Net repayments in notes outstanding under the revolving credit facility | 0 | | | 0 | | | (75) | | | Proceeds from debt modification | 0 | | | 0 | | | 25 | | | Proceeds from debt refinancing | | | Debt issuance costs | Debt issuance costs | 0 | | | 0 | | | (4) | | | | Dividends paid | | | | Dividends paid | | | | Dividends paid | Dividends paid | (480) | | | (453) | | | (468) | | | Net cash (used in) financing activities | Net cash (used in) financing activities | (2,009) | | | (2,569) | | | (1,693) | | | Effect of exchange rate changes on cash and cash equivalents | (17) | | | (34) | | | (36) | | | Increase (decrease) in cash and cash equivalents | 35 | | | 1,484 | | | (764) | | | Cash and cash equivalents, beginning of year | 2,645 | | | 1,161 | | | 1,925 | | | Cash and cash equivalents, end of year | $ | 2,680 | | | $ | 2,645 | | | $ | 1,161 | | | | Effect of exchange rate changes on cash, cash equivalents and restricted cash and cash equivalents | | | Increase (decrease) in cash, cash equivalents and restricted cash and cash equivalents | | | Cash, cash equivalents and restricted cash, beginning of year | | | Cash, cash equivalents, and restricted cash and cash equivalents, end of year | | | Supplemental information: | Supplemental information: | | | Cash paid for income taxes during the year | Cash paid for income taxes during the year | $ | 745 | | | $ | 870 | | | $ | 597 | | | Cash paid for income taxes during the year | | | Cash paid for income taxes during the year | | | Cash interest paid during the year | Cash interest paid during the year | $ | 25 | | | $ | 25 | | | $ | 21 | |
The accompanying notes are an integral part of the consolidated financial statements. | | | | | | | | | | Cognizant | F-8 | December 31, 2023 Form 10-K |
COGNIZANT TECHNOLOGY SOLUTIONS CORPORATION NOTES TO CONSOLIDATED FINANCIAL STATEMENTS (Dollars in millions, except share data)
| | | | | | | | | | | | | | | | Note 1 — Business Description and Summary of Significant Accounting Policies |
The terms “Cognizant,” “we,” “our,” “us” and “the Company” refer to Cognizant Technology Solutions Corporation and its subsidiaries unless the context indicates otherwise. Description of Business. We are one of the world’s leading professional services companies, engineering modern businessbusinesses and delivering strategic outcomes for the digital era. Our services include digital servicesour clients. We help clients modernize technology, reimagine processes and solutions, consulting, application development, systems integration, application testing, application maintenance, infrastructure servicestransform experiences so they can stay ahead in a fast-changing world. We provide industry expertise and business process services. Digital services have become an increasingly important part of our portfolio, aligningclose client collaboration, combining critical perspective with our clients' focus on becoming data-enabled, customer-centric and differentiated businesses. We are focused on continued investment in four key areas of digital: IoT, AI, experience-driven software engineering and cloud.a flexible engagement style. We tailor our services and solutions to specific industries with an integrated global delivery model that employs client service and delivery teams based at client locations and dedicated global and regional delivery centers. Our collaborative services include digital services and solutions, consulting, application development, systems integration, quality engineering and assurance, application maintenance, infrastructure and security as well as business process services and automation. Digital services continue to be an important part of our portfolio, aligning with our clients' focus on becoming data-enabled, customer-centric and differentiated businesses. Basis of Presentation, Principles of Consolidation and Use of Estimates. The consolidated financial statements are presented in accordance with GAAP and reflect the consolidated financial position, results of operations, comprehensive income and cash flows of our consolidated subsidiaries for all periods presented. All intercompany balances and transactions have been eliminated in consolidation.
The preparation of financial statements requires management to make estimates and assumptions that affect the reported amounts in the consolidated financial statements and accompanying disclosures. The COVID-19 pandemic may affect management's estimates and assumptions of variable consideration in contracts with customers as well as other estimates and assumptions, in particular those that require a projection of our financial results, our cash flows or broader economic conditions, such as the annual effective tax rate, the allowance for doubtful accounts, the recoverability of capitalized deferred charges and the fair value of goodwill, long-lived assets and indefinite-lived intangible assets We evaluate our estimates on a continuous basis. We base our estimates on historical experience and on various other assumptions that are believed to be reasonable under the circumstances. The actual amounts may vary from the estimates used in the preparation of the accompanying consolidated financial statements. Cash and Cash Equivalents and Investments. Cash and cash equivalents consist of all cash balances, including money market funds, time deposits, certificates of deposits and commercial paper that have a maturity, at the date of purchase, of 90 days or less. We determine the appropriate classification of our investments in marketable securities at the date of purchase and reevaluate such designation at each balance sheet date. We classify and account for our marketable debt securities as either available-for-sale or held-to-maturity. After consideration of our risk versus reward objectives, as well as our liquidity requirements, we may sell our available-for-sale securities prior to their stated maturities. We classify these marketable securities with maturities at the date of purchase beyond 90 days as short-term investments based on their highly liquid nature and because such marketable securities represent an investment of cash that is available for current operations. Available-for-sale securities are reported at fair value with changes in unrealized gains and losses recorded as a separate component of "Accumulated other comprehensive income (loss)" on the consolidated statements of financial position until realized. We determine the cost of the securities sold based on the specific identification method. Our held-to-maturity investment securities are financial instruments for whichthat we have the intent and ability to hold to maturity and we classify these securities with maturities less than one year as short-term investments. Any held-to-maturity investment securities with maturities beyond one year from the balance sheet date are classified as noncurrent.long-term investments. Held-to-maturity securities are reported at amortized cost. Interest and amortization of premiums and discounts for debt securities are included in interest income.
For available-for-sale debt securities, if we do not intend to sell the security or it is not more likely than not that we will be required to sell the security before recovery of our amortized cost, we evaluate qualitative criteria, such as the financial health of and specific prospects for the issuer, to determine whether we do not expect to recover the amortized cost basis of the security. We also evaluate quantitative criteria including determining whether there has been an adverse change in expected future cash flows. If we do not expect to recover the entire amortized cost basis of the security, we consider the security to contain an expected credit loss, and we record the difference between the security’s amortized cost basis and its recoverable amount in earnings as an allowance for credit loss and the difference between the security’s recoverable amount and fair value in other comprehensive income. If we intend to sell the security or it is more likely than not we will be required to sell the security before recovery of its amortized cost basis, the security is considered impaired, and we recognize the entire difference between the security’s amortized cost basis and its fair value in earnings.
| | | | | | | | | | Cognizant | F-9 | December 31, 2023 Form 10-K |
On initial recognition and on an ongoing basis, we evaluate our held-to-maturity investment securities for expected credit losses collectively when they share similar risk characteristics or individually, when the risk characteristics are different. The allowance for expected credit losses is determined using our historical loss experience. We monitor the credit ratings of the securities in our portfolio to evaluate the need for any changes to the allowance. An increase or a decrease in the allowance for expected credit losses is recorded through income as a credit loss expense or a reversal thereof. The allowance for expected credit losses is presented as a deduction from the amortized cost. A held-to-maturity investment security is written off when deemed uncollectible. Financial Assets and Liabilities. Cash and certain cash equivalents, time deposits, trade receivables, accounts payable and other accrued liabilities are short-term in nature and, accordingly, their carrying values approximate fair value. Property and Equipment. Property and equipment are stated at cost, net of accumulated depreciation. Depreciation is calculated on a straight-line basis over the estimated useful lives of the assets. Leasehold improvements are amortized on a straight-line basis over the shorter of the term of the lease or the estimated useful life of the asset. Deposits paid towards acquisition of long-lived assets and the cost of assets not put in use by the balance sheet date are disclosed under the caption "Capital work-in-progress" in Note 6.
Leases. Our lease asset classes primarily consist of operating leases for office space, data centers and IT equipment. At inception of a contract, we determine whether a contract contains a lease, and if a lease is identified, whether it is an operating or finance lease. In determining whether a contract contains a lease we consider whether (1) we have the right to obtain substantially all of the economic benefits from the use of the asset throughout the term of the contract, (2) we have the right to direct how and for what purpose the asset is used throughout the term of the contract and (3) we have the right to operate the asset throughout the term of the contract without the lessor having the right to change the terms of the contract. Some of our lease agreements contain both lease and non-lease components that we account for as a single lease component for all of our lease asset classes. Our ROU lease assets represent our right to use an underlying asset for the lease term and may include any advance lease payments made and any initial direct costs and exclude lease incentives. Our lease liabilities represent our obligation to make lease payments arising from the terms of the lease. ROU lease assets and lease liabilities are recognized at the commencement of the lease and are calculated using the present value of lease payments over the lease term. Typically, our lease agreements do not provide sufficient detail to arrive at andetermine the rate implicit interest rate.in the lease. Therefore, we use our estimated country-specific incremental borrowing rate based on information available at the commencement date of the lease to calculate the present value of the lease payments. In estimating our country-specific incremental borrowing rates, we consider market rates of comparable collateralized borrowings for similar terms. Our lease terms may include the option to extend or terminate the lease before the end of the contractual lease term. Our ROU lease assets and lease liabilities include these options when it is reasonably certain that they will be exercised. A portion of our real estate lease costs is subject to annual changes in the CPI. The changesChanges in CPI subsequent to the CPIlease commencement are treated as variable lease payments and are recognized in the period in which the obligation for those payments is incurred. Other variable lease costs primarily relate to adjustments for common area maintenance, utilities, property tax and lease concessions due to the COVID-19 pandemic.concessions. These variable costs are recognized in the period in which the obligation for those payments is incurred.
We elect not to recognize ROU assets and lease liabilities for short-term leases with a term equal to or less than 12 months. We recognize the lease payments in our income statement on a straight-line basis over the lease term and variable lease payments in the period in which the obligation for those payments is incurred.
Both ROU assets and finance lease assets are reviewed for impairment whenever events or changes in circumstances indicate that the carrying amount of the related asset group may not be recoverable. Internal Use Software. We capitalize certain costs that are incurred to purchase, develop and implement internal-use software during the application development phase, which primarily include coding, testing and certain data conversion activities. Capitalized costs are amortized on a straight-line basis over the useful life of the software. Costs incurred in performing planning and post-implementation activities are expensed as incurred. Cloud Computing Arrangements. We capitalizedefer certain implementation costs within prepaid assets that are incurred when implementing cloud computing service or SaaSsoftware-as-a-service arrangements, which primarily include efforts associated with configuration and development activities. Once the service is ready for use, capitalizeddeferred costs are amortizedexpensed over the term of the arrangement and recognized in income from operations. | | | | | | | | | | Cognizant | F-10 | December 31, 2023 Form 10-K |
Software to be Sold, Leased or Marketed. We capitalize costs incurred after technological feasibility is reached but before software is available for general release to clients, which primarily include coding and testing activities. Once the product is ready for general release, capitalized costs are amortized over the useful life of the software. Business Combinations. We account for business combinations using the acquisition method, which requires the identification of the acquirer, the determination of the acquisition date and the allocation of the purchase price paid by the acquirer to the identifiable tangible and intangible assets acquired, the liabilities assumed, including any contingent consideration and any noncontrolling interest in the acquiree at their acquisition date fair values. Goodwill represents the excess of the purchase price over the fair value of net assets acquired, including the amount assigned to identifiable intangible assets. Identifiable intangible assets with finite lives are amortized over their expected useful lives. Acquisition-related costs are expensed in the periods in which the costs are incurred. The results of operations of acquired businesses are included in our consolidated financial statements from the acquisition date. During the fourth quarter of 2019, the Company adjusted the allocation of the purchase price of certain prior period acquisitions that included revenue contracts with the sellers of the acquired businesses. As a result, we recorded a balance sheet adjustment to decrease total assets (primarily impacting intangible assets, goodwill and deferred income taxes) and total liabilities (primarily impacting deferred revenue) by approximately $70 million each. The impact of the adjustment to our
operating results was immaterial. Management concluded that the adjustment was not material to any previously issued consolidated financial statements or to the consolidated financial statements as of and for the year ended December 31, 2019.
Equity Method Investments. Equity investments that give us the ability to exercise significant influence, but not control, over an investee are accounted for using the equity method of accounting and recorded in the caption "Long-term investments" on our consolidated statements of financial position. Equity method investments are initially recorded at cost. We periodically review the carrying value of our equity method investments to determine if there has been an other-than-temporary decline in the carrying value. The investment balance is increased to reflect contributions and our share of earnings and decreased to reflect our share of losses, distributions and other-than-temporary impairments. The Company'sOur proportionate share of the net income or loss of the investee is recorded in the caption "Income (loss) from equity method investments" on our consolidated statements of operations. Long-lived Assets and Finite-lived Intangible Assets. We review long-lived assets and certain finite-lived identifiable intangible assets for impairment whenever events or changes in circumstances indicate that the carrying amount of an asset group may not be recoverable. The carrying amount may not be recoverable when the sum of undiscounted expected future cash flows is less than the carrying amount of such asset groups. The impairment loss is determined as the amount by which the carrying amount of the asset group exceeds its fair value. Intangible assets consist primarily of customer relationships and developed technology, which are being amortized on a straight-line basis over their estimated useful lives.
Goodwill and Indefinite-lived Intangible Assets. At each acquisition date, we allocate goodwill and intangible assets to our reporting units based on how we expect each reporting unit to benefit from the respective business combination. Our seven industry-based operating segments are our reporting units. We evaluate goodwill and indefinite-lived intangible assets for impairment at least annually, or as circumstances warrant. Goodwill is evaluated at the reporting unit level by comparing the fair value of the reporting unit with its carrying amount including goodwill. An impairment of goodwill exists if the carrying amount of the reporting unit exceeds its fair value. The impairment loss is the amount by which the carrying amount exceeds the reporting unit’s fair value, limited to the total amount of goodwill allocated to that reporting unit. For indefinite-lived intangible assets, if our annual qualitative assessment indicates that it is more-likely-than-not that an indefinite-lived intangible asset is impaired, we test the assets for impairment by comparing the fair value of such assets to their carrying value. If an impairment is indicated, a write down to the fair value of indefinite-lived intangible asset is recorded. Stock Repurchase Program. Under the Board of Directors authorized stock repurchase program, the Company is authorized to repurchase its Class A common stock through open market purchases, including under a 10b5-1 Plan, or in private transactions, including through ASR agreements entered into with financial institutions, in accordance with applicable federal securities laws. We account for the repurchased shares as constructively retired. Shares are returned to the status of authorized and unissued shares at the time of repurchase or in the periods they are delivered if repurchased under an ASR.repurchase. To reflect share repurchases in the consolidated statements of financial position, we (1) reduce common stock for the par value of the shares, (2) reduce additional paid-in capital for the amount in excess of par during the period in which the shares are repurchased and (3) record any residual amount in excess of available additional paid-in capital to retained earnings. Upfront payments related to ASRs are accounted for as a reduction to stockholders’ equity in the consolidated statements of financial position in the period the payments are made.retained earnings. Revenue Recognition. We recognize revenues as we transfer control of deliverables (products, solutions and services) to our clients in an amount reflecting the consideration to which we expect to be entitled. To recognize revenues, we apply the following five step approach: (1) identify the contract with a customer, (2) identify the performance obligations in the contract, (3) determine the transaction price, (4) allocate the transaction price to the performance obligations in the contract, and (5) recognize revenues when a performance obligation is satisfied. We account for a contract when it has approval and commitment from all parties, the rights of the parties are identified, payment terms are identified, the contract has commercial substance and collectabilitycollectibility of consideration is probable. We apply judgment in determining the customer’s ability and intention to pay based on a variety of factors including the customer’s historical payment experience. For performance obligations where control is transferred over time, revenues are recognized based on the extent of progress towards completion of the performance obligation. The selection of the method to measure progress towards completion requires judgment and is based primarily on the nature of the deliverables to be provided. | | | | | | | | | | Cognizant | F-11 | December 31, 2023 Form 10-K |
Revenues related to fixed-price contracts for application development and systems integration services, consulting or other technology services are recognized as the service is performed using the cost to costcost-to-cost method, under which the total value of revenues is recognized on the basis of the percentage that each contract’s total labor cost to date bears to the total expected labor costs. Revenues related to fixed-price application maintenance, testingquality engineering and assurance as well as business process services are recognized based on our right to invoice for services performed for contracts in which the invoicing is representative of the value being delivered. If our invoicing is not consistent with the value delivered, revenues are recognized as the service is performed based on the cost to costcost-to-cost method described above. The cost to costcost-to-cost method requires estimation of future costs, which is updated as the project progresses to reflect the latest available information; suchinformation. Such estimates and changes in estimates involve the use of judgment. The
cumulative impact of any revision in estimates is reflected in the financial reporting period in which the change in estimate becomes known and any anticipated losses on contracts are recognized immediately, where appropriate.
Revenues related to fixed-price hosting and infrastructure and security services are recognized based on our right to invoice for services performed for contracts in which the invoicing is representative of the value being delivered. If our invoicing is not consistent with the value delivered, revenues are recognized on a straight-line basis unless revenues are earned and obligations are fulfilled in a different pattern. The revenue recognition method applied to the types of contracts described above provides the most faithful depiction of performance towards satisfaction of our performance obligations; for example, the cost to costcost-to-cost method is used when the value of services provided to the customer is best represented by the costs expended to deliver those services.
Revenues related to our time-and-materials, transaction-based or volume-based contracts are recognized over the period the services are provided either using an output method such as labor hours, or a method that is otherwise consistent with the way in which value is delivered to the customer.
Revenues related to our non-hosted software license arrangements that do not require significant modification or customization of the underlying software are recognized when the software is delivered as control is transferred at a point in time. For software license arrangements that require significant functionality enhancements or modification of the software, revenues for the software license and related services are recognized as the services are performed in accordance with the methods applicable to application development and systems integration services described above. In software hosting arrangements, the rights provided to the customer, such as ownership of a license, contract termination provisions and the feasibility of the client to operate the software, are considered in determining whether the arrangement includes a license or a service. Sales and usage-based fees promised in exchange for licenses of intellectual property are not recognized as revenue until the uncertainty related to the variable amounts is resolved. Revenues related to software maintenance and support are generally recognized on a straight-line basis over the contract period.
Incentive revenues, volume discounts, or any other form of variable consideration is estimated using either the sum of probability weighted amounts in a range of possible consideration amounts (expected value) or the single most likely amount in a range of possible consideration amounts (most likely amount), depending on which method better predicts the amount of consideration to which we may be entitled. We include in the transaction price variable consideration only to the extent it is probable that a significant reversal of revenues recognized will not occur when the uncertainty associated with the variable consideration is resolved. Our estimates of variable consideration and determination of whether and when to include estimated amounts in the transaction price may involve judgment and are based largely on an assessment of our anticipated performance and all information that is reasonably available to us.
Revenues also include the reimbursement of out-of-pocket expenses. Our warranties generally provide a customer with assurance that the related deliverable will function as the parties intended because it complies with agreed-upon specifications and isare therefore not considered an additional performance obligation in the contract.
We may enter into arrangements that consist of multiple performance obligations. Such arrangements may include any combination of our deliverables. To the extent a contract includes multiple promised deliverables, we apply judgment to determine whether promised deliverables are capable of being distinct and are distinct in the context of the contract. If these criteria are not met, the promised deliverables are accounted for as a combined performance obligation. For arrangements with multiple distinct performance obligations, we allocate consideration among the performance obligations based on their relative standalone selling price. Standalone selling price is the price at which we would sell a promised good or service separately to the customer. When not directly observable, we typically estimate standalone selling price by using the expected cost plus a margin or, in limited circumstances, the residual value approach. We typically establish a standalone selling price range for our deliverables, which is reassessed on a periodic basis or when facts and circumstances change.
| | | | | | | | | | Cognizant | F-12 | December 31, 2023 Form 10-K |
We assess the timing of the transfer of goods or services to the customer as compared to the timing of payments to determine whether a significant financing component exists. As a practical expedient, we do not assess the existence of a significant financing component when the difference between payment and transfer of deliverables is a year or less. If the difference in timing arises for reasons other than the provision of finance to either the customer or us, no financing component is deemed to exist. The primary purpose of our invoicing terms is to provide customers with simplified and predictable ways of purchasing our services, not to receive or provide financing from or to customers. We do not consider set up or transition fees paid upfront by our customers to represent a financing component, as such fees are required to encourage customer commitment to the project and protect us from early termination of the contract.
Our contracts may be modified to add, remove or change existing performance obligations. The accounting for modifications to our contracts involves assessing whether the services added to an existing contract are distinct and whether the pricing is at the standalone selling price. Services added that are not distinct are accounted for on a cumulative catch up basis, while those that are distinct are accounted for prospectively, either as a separate contract if the additional services are priced at the standalone selling price, or as a termination of the existing contract and creation of a new contract if not priced at the standalone selling price. Services added to our application development and systems integration service contracts are typically not distinct, while services added to our other contracts, including application maintenance, testingquality engineering and assurance as well as business process services contracts, are typically distinct. From time to time, we may enter into arrangements with third party suppliers to resell products or services. In such cases, we evaluate whether we are the principal (i.e., report revenues on a gross basis) or agent (i.e., report revenues on a net basis). In doing so, we first evaluate whether we control the good or service before it is transferred to the customer. If we control the good or service before it is transferred to the customer, we are the principal; if not, we are the agent. Determining whether we control the good or service before it is transferred to the customer may requirerequires significant judgment. Trade Accounts Receivable, Contract Assets and Contract Liabilities. We classify our right to consideration in exchange for deliverables as either a receivable or a contract asset. A receivable is a right to consideration that is unconditional (i.e., only the passage of time is required before payment is due). For example, we recognize a receivable for revenues related to our time and materials and transaction or volume-based contracts when earned regardless of whether amounts have been billed. We present such receivables in "Trade accounts receivable, net" in our consolidated statements of financial position at their net estimated realizable value. A contract asset is a right to consideration that is conditional upon factors other than the passage of time. Contract assets are presented in "Other current assets" or "Other noncurrent assets" in our consolidated statements of financial position, based on the expected timing of billing, and primarily relate to unbilled amounts on fixed-price contracts utilizing the cost to costcost-to-cost method of revenue recognition. Our contract liabilities, or deferred revenue, consist of advance payments from clients and billings in excess of revenues recognized. We classify deferred revenue as current or noncurrent based on the timing of when we expect to recognize the revenues. Our contract assets and contract liabilities are reported on a net basis by contract at the end of each reporting period. The difference between the opening and closing balances of our contract assets and contract liabilities primarily results from the timing difference between our performance obligations and the client’s payment. We receive payments from clients based on the terms established in our contracts, which vary byfrom contract type.to contract. Allowance for Expected Credit Losses. We calculate expected credit losses for our trade accounts receivable and contract assets. Expected credit losses include losses expected based on known credit issues with specific customers as well as a general expected credit loss allowance based on relevant information, about past events, including historical loss rates, current conditions, and reasonable economic forecasts that affect collectibility.collectibility. We update our allowance for expected credit losses on a quarterly basis with changes in the allowance recognized in income from operations. Costs to Fulfill. Recurring operating costs for contracts with customers are recognized as incurred. Certain eligible, nonrecurring costs (i.e., set-up or transition costs) are capitalized when such costs (1) relate directly to the contract, (2) generate or enhance resources of the Company that will be used in satisfying the performance obligation in the future, and (3) are expected to be recovered. These costs are expensed ratably over the estimated life of the customer relationship, including expected contract renewals. In determining the estimated life of the customer relationship, we evaluate the average contract term on a portfolio basis by nature of the services to be provided, and apply judgment in evaluating the rate of technological and industry change. Capitalized amounts are monitored regularly for impairment. Impairment losses are recorded when projected remaining undiscounted operating cash flowsconsideration that has not already been recognized as revenue less costs related to the services being provided are not sufficient to recover the carrying amount of the capitalized costs to fulfill. Costs to fulfill are recorded in "Other noncurrent assets" in our consolidated statements of financial position and the amortization expense of costs to fulfill is included in "Cost of revenues" in our consolidated statements of operations. | | | | | | | | | | Cognizant | F-13 | December 31, 2023 Form 10-K |
Stock-Based Compensation. Stock-based compensation expense for awards of equity instruments to employees and non-employee directors is determined based on the grant date fair value of those awards. We recognize these compensation costs net of an estimated forfeiture rate over the requisite service period of the award. Forfeitures are estimated on the date of grant and revised if actual or expected forfeiture activity differs materially from originaloriginal estimates. Stock-based compensation costs forexpense relating to RSUs and PSUs thatis recognized as shares vest proportionally are recognized on a graded-vesting basis over the vesting period based on the most probable outcome of the performance conditions.requisite service period. If the minimumminimum performance targets are not met, no compensation cost is recognized and any recognized compensation cost is reversed, except for awards subject to a market condition. The fair value of RSUs and PSUs is determined based on the number of stock units granted and the quoted price of our stock at the date of grant. The fair value of PSUs granted subject to a market condition is determined using a Monte Carlo valuation model. Foreign Currency. The assets and liabilities of our foreign subsidiaries whose functional currency is not the U.S. dollar are translated into U.S. dollars at current exchange rates while revenues and expenses are translated at average monthly
exchange rates. The resulting translation adjustments are recorded in the caption "Accumulated other comprehensive income (loss)" on the consolidated statements of financial position. Foreign currency transactions and balances are those that are denominated in a currency other than the entity’s functional currency. An entity's functional currency is the currency of the primary economic environment in which it operates. The U.S. dollar is the functional currency for some of our foreign subsidiaries. For these subsidiaries, transactions and balances denominated in the local currency are foreign currency transactions. Foreign currency transactions and balances related to non-monetary assets and liabilities are remeasured to the functional currency of the entity at historical exchange rates while monetary assets and liabilities are remeasured to the functional currency of the entity at current exchange rates. Foreign currency exchange gains or losses from remeasurement are included in the caption "Foreign currency exchange gain (losses), net" on our consolidated statements of operations together with gains or losses on our undesignated foreign currency hedges. Derivative Financial Instruments. Derivative financial instruments are recorded on our consolidated statements of financial position as either an asset or liability measured at its fair value as of the reporting date. Our derivative financial instruments consist primarily of foreign exchange forward and option contracts. For derivative financial instruments to qualify for hedge accounting, the following criteria must be met: (1) the hedging instrument must be designated as a hedge; (2) the hedged exposure must be specifically identifiable and must expose us to risk; and (3) it must be expected that a change in fair value of the hedging instrument and an opposite change in the fair value of the hedged exposure will have a high degree of correlation. Changes in our derivatives’ fair values are recognized in net income unless specific hedge accounting and documentation criteria are met (i.e., the instruments are designated and accounted for as hedges). We record the effective portion of the unrealized gains and losses on our derivative financial instruments that are designated as cash flow hedges in the caption "Accumulated other comprehensive income (loss)" in the consolidated statements of financial position. Any ineffectivenessineffectiveness or excluded portion of a designated cash flow hedge is recognized in net income. UponUpon occurrence of the hedged transaction, the gains and losses on the derivative are recognized in net income. Income Taxes. We provide for income taxes utilizing the asset and liability method of accounting. Under this method, deferred income taxes are recorded to reflect the tax consequences in future years of differences between the tax basis of assets and liabilities and their financial reporting amounts at each balance sheet date, based on enacted tax laws and statutory tax rates applicable to the periods in which the differences are expected to affect taxable income. If it is determined that it is more likely than not that future tax benefits associated with a deferred income tax asset will not be realized, a valuation allowance is provided. The effect of a change in tax rates on deferred income tax assets and liabilities is recognized in the provision for income taxes in the period that includes the enactment date. Our provision for income taxes also includes the impact of provisions established for uncertain income tax positions, as well as any related penalties and interest. We adjust these reserves in light of changing facts and circumstances, such as the closing of a tax audit.audit or the expiration of the applicable statute of limitations. To the extent that the final outcome of these matters differs from the amounts recorded, such differences will impact the provision for income taxes in the period in which such determination is made. Earnings Per Share. Basic EPS is computed by dividing earnings available to common stockholders by the weighted-average number of common shares outstanding for the period. Diluted EPS includes all potential dilutive common stock in the weighted average shares outstanding. We exclude from the calculation of diluted EPS options with exercise prices that are greater than the average market price and shares related to stock-based awards whose combined exercise price and unamortized fair value were greater in each of those periods than the average market price of our common stock for the period, because their effect would be anti-dilutive. We excluded less than 1 million of anti-dilutive shares in each of 2020, 20192023, 2022 and 20182021 from our diluted EPS calculation. We include PSUs in the dilutive potential common shares when they become contingently issuable per the authoritative guidance and exclude them when they are not contingently issuable. Restructuring Charges. Restructuring charges principally consist of severance and related separation costs, facility exit costs and other related third-party costs necessary to execute the restructuring program. The Company accrues for severance and other related separation costs when it is probable that termination benefits will be paid and the amount is reasonably | | | | | | | | | | Cognizant | F-14 | December 31, 2023 Form 10-K |
Recently Adoptedestimable. Recognition of employee severance and other separation costs is also dependent on requirements established by severance policy, statutory laws, or historical experience. Facility exit costs generally reflect the accelerated lease expense for right-of-use assets, expected lease termination costs, and asset impairments in connection with closure of certain sites, net of gains on exit-related disposals.
Restructuring costs are recorded in “Restructuring charges” in the consolidated statements of operations. The restructuring liability related to accrued employee separation costs is included in "Accrued expenses and other current liabilities" in the consolidated statements of financial position. At the end of each reporting period, the Company evaluates the remaining accrued balances to ensure these balances are properly stated. New Accounting Pronouncements | | | | | | | | | | | | | Date Issued and Topic | Effective Date Adopted and Method | Description | Impact | | | | | | | | | | | | | | | | | May 2014November 2023
Revenue
| January 1, 2018
Modified Retrospective | The new standard, as amended, sets forth a single comprehensive model for recognizing and reporting revenues. The standard also requires additional financial statement disclosures that enable usersSegment Reporting (Topic 280): Improvements to understand the nature, amount, timing and uncertainty of revenues and cash flows relating to customer contracts. The standard allows for two methods of adoption: the full retrospective adoption, which requires the standard to be applied to each prior period presented, or the modified retrospective adoption, which requires the cumulative effect of adoption to be recognized as an adjustment to opening retained earnings in the period of adoption. | As a result of the adoption, we recorded an adjustment to opening retained earnings of approximately $121 million. | February 2016Reportable Segment Disclosures
Leases
| January 1, 2019Annual period starting in 2024 and interim periods starting in 2025
Effective Date Method
Retrospective basis
| The new standard replacesrequires enhanced segment disclosures but does not change the existingdefinition of a segment for the guidance on leases and requiresfor determining a reportable segment. The amendments require disclosure of significant segment expenses regularly provided to the lessee to recognize a ROU assetCODM included within segment operating profit or loss and a lease liability for all leases with lease terms greater than twelve months. For finance leases,description of how the lessee recognizes interest expenseCODM utilizes segment operating profit or loss to assess segment performance and amortizationallocating resources. The new standard also allows companies to disclose multiple measures of segment profit or loss if those measures are used to allocate resources. | The Company is currently evaluating the impact of the ROU asset, and for operating leases, the lessee recognizes total lease expensenew standard on a straight-line basis. The standard offers several practical expedients for transition and certain expedients specific to lessees or lessors. The standard allows for two methods of adoption: retrospective to each prior reporting period presented with the cumulative effect of adoption recognized at the beginning of the earliest period presented or the effective date method, which is retrospective to the beginning of the period of adoption through a cumulative-effect adjustment. | As a result of the adoption, we recorded an increase to total assets of $758 million, total liabilities of $756 million, and opening retained earnings of $2 million.its related disclosures. | December 2023 June 2016
Financial Instruments-Credit Losses
Income Taxes (Topic 740): Improvements to Income Tax Disclosures
| Annual period starting in 2025 January 1, 2020
Modified Retrospective
Prospective basis although retrospective application is permitted
| The new standard requires the measurement and recognition of expected credit losses using the current expected credit loss model for financial assets held at amortized cost, which includes the Company’s trade accounts receivable, certain financial instruments and contract assets. It replaces the existing incurred loss impairment model with an expected loss methodology. The recorded credit losses are adjusted each period for changes in expected lifetime credit losses. The standard requires a cumulative effect adjustmentenhanced income tax disclosures primarily related to the statement of financial position asrate reconciliation and income taxes paid information. | The Company is currently evaluating the impact of the beginning of the first reporting period in which the guidance is effective.new standard on its related disclosures. | | As a result of the adoption, we recorded an increase to our opening retained earnings and "Trade accounts receivable, net" of $1 million each.
Prior year amounts are not adjusted and continue to be reported in accordance with our historical accounting policies.
| | |
Disaggregation of Revenues
The tables below present disaggregated revenues from contracts with clients by client location, service line and contract-typecontract type for each of our reportable business segments. We believe this disaggregation best depicts how the nature, amount, timing and uncertainty of our revenues and cash flows are affected by industry, market and other economic factors. Our consulting and technology services include consulting, application development, systems integration, quality engineering and application testingassurance services as well as software solutions and related services while our outsourcing services include application maintenance, infrastructure and security as well as business process services. Revenues are attributed to geographic regions based upon client location.location, which is the client's billing address. Substantially all of the revenuerevenues in our North America region relatesrelate to operationsclients in the United States. | | | | | | | | | | | | | | | | | | | | | | | | | | | | | | | | | | | Year Ended | | | December 31, 2020 | | | Financial Services | | Healthcare | | Products and Resources | | Communications, Media and Technology | | Total | | | (in millions) | | Revenues | | | | | | | | | | | | Geography: | | | | | | | | | | | | North America | | $ | 4,013 | | | $ | 4,181 | | | $ | 2,650 | | | $ | 1,737 | | | $ | 12,581 | | | United Kingdom | | 463 | | | 157 | | | 371 | | | 344 | | | 1,335 | | | Continental Europe | | 629 | | | 434 | | | 413 | | | 177 | | | 1,653 | | | Europe - Total | | 1,092 | | | 591 | | | 784 | | | 521 | | | 2,988 | | | Rest of World | | 516 | | | 80 | | | 262 | | | 225 | | | 1,083 | | | Total | | $ | 5,621 | | | $ | 4,852 | | | $ | 3,696 | | | $ | 2,483 | | | $ | 16,652 | | | | | | | | | | | | | | Service line: | | | | | | | | | | | | Consulting and technology services | | $ | 3,691 | | | $ | 2,786 | | | $ | 2,249 | | | $ | 1,456 | | | $ | 10,182 | | | Outsourcing services | | 1,930 | | | 2,066 | | | 1,447 | | | 1,027 | | | 6,470 | | | Total | | $ | 5,621 | | | $ | 4,852 | | | $ | 3,696 | | | $ | 2,483 | | | $ | 16,652 | | | | | | | | | | | | | | Type of contract: | | | | | | | | | | | | Time and materials | | $ | 3,548 | | | $ | 1,950 | | | $ | 1,548 | | | $ | 1,515 | | | $ | 8,561 | | | Fixed-price | | 1,736 | | | 1,777 | | | 1,741 | | | 871 | | | 6,125 | | | Transaction or volume-based | | 337 | | | 1,125 | | | 407 | | | 97 | | | 1,966 | | | Total | | $ | 5,621 | | | $ | 4,852 | | | $ | 3,696 | | | $ | 2,483 | | | $ | 16,652 | |
| | | | | | | | | | Cognizant | F-15 | December 31, 2023 Form 10-K |
| | | Year Ended December 31, 2023 | | | | Year Ended December 31, 2023 | | | Year Ended | | December 31, 2019 | | Financial Services | | Healthcare | | Products and Resources | | Communications, Media and Technology | | Total | | (in millions) | | (in millions) | | | (in millions) | | | (in millions) | | | FS | | HS | | P&R | | CMT | | Total | | Revenues | Revenues | | | Geography: | Geography: | | | Geography: | | | Geography: | | | North America | | | North America | | | North America | North America | | $ | 4,137 | | | $ | 4,147 | | | $ | 2,678 | | | $ | 1,764 | | | $ | 12,726 | | | United Kingdom | United Kingdom | | 484 | | | 130 | | | 380 | | | 319 | | | 1,313 | | | Continental Europe | Continental Europe | | 728 | | | 341 | | | 453 | | | 169 | | | 1,691 | | | Europe - Total | Europe - Total | | 1,212 | | | 471 | | | 833 | | | 488 | | | 3,004 | | | Rest of World | Rest of World | | 520 | | | 77 | | | 259 | | | 197 | | | 1,053 | | | Total | Total | | $ | 5,869 | | | $ | 4,695 | | | $ | 3,770 | | | $ | 2,449 | | | $ | 16,783 | | | | Service line: | Service line: | | | Service line: | | | Service line: | | | Consulting and technology services | | | Consulting and technology services | | | Consulting and technology services | Consulting and technology services | | $ | 3,782 | | | $ | 2,564 | | | $ | 2,295 | | | $ | 1,305 | | | $ | 9,946 | | | Outsourcing services | Outsourcing services | | 2,087 | | | 2,131 | | | 1,475 | | | 1,144 | | | 6,837 | | | Total | Total | | $ | 5,869 | | | $ | 4,695 | | | $ | 3,770 | | | $ | 2,449 | | | $ | 16,783 | | | | Type of contract: | Type of contract: | | | Type of contract: | | | Type of contract: | | | Time and materials | | | Time and materials | | | Time and materials | Time and materials | | $ | 3,651 | | | $ | 1,845 | | | $ | 1,632 | | | $ | 1,528 | | | $ | 8,656 | | | Fixed-price | Fixed-price | | 1,922 | | | 1,635 | | | 1,730 | | | 803 | | | 6,090 | | | Transaction or volume-based | Transaction or volume-based | | 296 | | | 1,215 | | | 408 | | | 118 | | | 2,037 | | | Total | Total | | $ | 5,869 | | | $ | 4,695 | | | $ | 3,770 | | | $ | 2,449 | | | $ | 16,783 | |
| | | | | | | | | | | | | | | | | | | | | | | | | | | | | | | | | | | Year Ended | | | December 31, 2018 | | | Financial Services | | Healthcare | | Products and Resources | | Communications, Media and Technology | | Total | | | (in millions) | | Revenues | | | | | | | | | | | | Geography: | | | | | | | | | | | | North America | | $ | 4,162 | | | $ | 4,254 | | | $ | 2,397 | | | $ | 1,480 | | | $ | 12,293 | | | United Kingdom | | 481 | | | 91 | | | 358 | | | 344 | | | 1,274 | | | Continental Europe | | 666 | | | 270 | | | 440 | | | 187 | | | 1,563 | | | Europe - Total | | 1,147 | | | 361 | | | 798 | | | 531 | | | 2,837 | | | Rest of World | | 536 | | | 53 | | | 220 | | | 186 | | | 995 | | | Total | | $ | 5,845 | | | $ | 4,668 | | | $ | 3,415 | | | $ | 2,197 | | | $ | 16,125 | | | | | | | | | | | | | | Service line: | | | | | | | | | | | | Consulting and technology services | | $ | 3,571 | | | $ | 2,553 | | | $ | 2,024 | | | $ | 1,161 | | | $ | 9,309 | | | Outsourcing services | | 2,274 | | | 2,115 | | | 1,391 | | | 1,036 | | | 6,816 | | | Total | | $ | 5,845 | | | $ | 4,668 | | | $ | 3,415 | | | $ | 2,197 | | | $ | 16,125 | | | | | | | | | | | | | | Type of contract: | | | | | | | | | | | | Time and materials | | $ | 3,762 | | | $ | 1,836 | | | $ | 1,506 | | | $ | 1,366 | | | $ | 8,470 | | | Fixed-price | | 1,859 | | | 1,852 | | | 1,521 | | | 734 | | | 5,966 | | | Transaction or volume-based | | 224 | | | 980 | | | 388 | | | 97 | | | 1,689 | | | Total | | $ | 5,845 | | | $ | 4,668 | | | $ | 3,415 | | | $ | 2,197 | | | $ | 16,125 | |
| | | | | | | | | | | | | | | | | | | | | | | | | | | | | | | | | | | Year Ended December 31, 2022 | | | | | (in millions) | | FS | | HS | | P&R | | CMT | | Total | | Revenues | | | | | | | | | | | | Geography: | | | | | | | | | | | | North America | | $ | 4,312 | | | $ | 4,853 | | | $ | 3,078 | | | $ | 2,192 | | | $ | 14,435 | | | United Kingdom | | 599 | | | 171 | | | 521 | | | 519 | | | 1,810 | | | Continental Europe | | 590 | | | 483 | | | 585 | | | 137 | | | 1,795 | | | Europe - Total | | 1,189 | | | 654 | | | 1,106 | | | 656 | | | 3,605 | | | Rest of World | | 571 | | | 124 | | | 382 | | | 311 | | | 1,388 | | | Total | | $ | 6,072 | | | $ | 5,631 | | | $ | 4,566 | | | $ | 3,159 | | | $ | 19,428 | | | | | | | | | | | | | | Service line: | | | | | | | | | | | | Consulting and technology services | | $ | 4,207 | | | $ | 3,226 | | | $ | 3,017 | | | $ | 1,775 | | | $ | 12,225 | | | Outsourcing services | | 1,865 | | | 2,405 | | | 1,549 | | | 1,384 | | | 7,203 | | | Total | | $ | 6,072 | | | $ | 5,631 | | | $ | 4,566 | | | $ | 3,159 | | | $ | 19,428 | | | | | | | | | | | | | | Type of contract: | | | | | | | | | | | | Time and materials | | $ | 3,516 | | | $ | 2,010 | | | $ | 1,856 | | | $ | 1,797 | | | $ | 9,179 | | | Fixed-price | | 2,265 | | | 2,471 | | | 2,357 | | | 1,206 | | | 8,299 | | | Transaction or volume-based | | 291 | | | 1,150 | | | 353 | | | 156 | | | 1,950 | | | Total | | $ | 6,072 | | | $ | 5,631 | | | $ | 4,566 | | | $ | 3,159 | | | $ | 19,428 | |
| | | | | | | | | | Cognizant | F-16 | December 31, 2023 Form 10-K |
In the fourth quarter of 2020, we made an offer to settle and exit a large customer engagement in Financial Services in Continental Europe. The offer includes, among other terms, a proposed payment and the forgiveness of certain receivables. The 2020 impact of the Proposed Exit was a reduction ofrevenues of $118 million and additional expenses of $33 million, primarily related to the impairment of long-lived assets. While the amounts recorded are based on our best estimate of the expected terms of the exit, the negotiations are ongoing and, as such, we may not reach an agreement or the final terms of the agreement that is reached may materially differ from those contemplated in our accounting. In either instance, there could be additional impacts to our statement of operations, financial condition and our cash flows. | | | | | | | | | | | | | | | | | | | | | | | | | | | | | | | | | | | Year Ended December 31, 2021 | | | | | (in millions) | | FS | | HS | | P&R | | CMT | | Total | | Revenues | | | | | | | | | | | | Geography: | | | | | | | | | | | | North America | | $ | 4,204 | | | $ | 4,571 | | | $ | 2,937 | | | $ | 1,924 | | | $ | 13,636 | | | United Kingdom | | 547 | | | 168 | | | 471 | | | 456 | | | 1,642 | | | Continental Europe | | 745 | | | 477 | | | 539 | | | 158 | | | 1,919 | | | Europe - Total | | 1,292 | | | 645 | | | 1,010 | | | 614 | | | 3,561 | | | Rest of World | | 555 | | | 121 | | | 329 | | | 305 | | | 1,310 | | | Total | | $ | 6,051 | | | $ | 5,337 | | | $ | 4,276 | | | $ | 2,843 | | | $ | 18,507 | | | | | | | | | | | | | | Service line: | | | | | | | | | | | | Consulting and technology services | | $ | 4,079 | | | $ | 3,090 | | | $ | 2,725 | | | $ | 1,693 | | | $ | 11,587 | | | Outsourcing services | | 1,972 | | | 2,247 | | | 1,551 | | | 1,150 | | | 6,920 | | | Total | | $ | 6,051 | | | $ | 5,337 | | | $ | 4,276 | | | $ | 2,843 | | | $ | 18,507 | | | | | | | | | | | | | | Type of contract: | | | | | | | | | | | | Time and materials | | $ | 3,613 | | | $ | 2,063 | | | $ | 1,785 | | | $ | 1,679 | | | $ | 9,140 | | | Fixed-price | | 2,063 | | | 2,157 | | | 2,085 | | | 1,032 | | | 7,337 | | | Transaction or volume-based | | 375 | | | 1,117 | | | 406 | | | 132 | | | 2,030 | | | Total | | $ | 6,051 | | | $ | 5,337 | | | $ | 4,276 | | | $ | 2,843 | | | $ | 18,507 | |
Costs to Fulfill The following table presents information related toshows significant movements in the capitalized costs to fulfill, such as setup or transition activities. Costsfulfill: | | | | | | | | | | | | | | | | (in millions) | | 2023 | | 2022 | | Beginning balance | | $ | 265 | | | $ | 394 | | | Costs capitalized | | 67 | | | 39 | | | Amortization expense | | (87) | | | (109) | | Impairment charges (1) | | — | | | (59) | | | Ending balance | | $ | 245 | | | $ | 265 | |
(1) The impairment charges in 2022 are related to fulfill are recorded in "Other noncurrent assets" in our consolidated statements of financial position and the amortization expense of costs to fulfill is included in "Cost of revenues" in our consolidated statement of operations. a large volume-based contract with a Health Sciences client. Costs to obtain contracts were immaterial for the periodperiods disclosed. | | | | | | | | | | | | | | | | | 2020 | | 2019 | | | (in millions) | | Beginning balance | | $ | 485 | | | $ | 400 | | | Costs capitalized | | 98 | | | 189 | | | Amortization expense | | (102) | | | (79) | | | Impairment charge | | (14) | | | (25) | | | Ending balance | | $ | 467 | | | $ | 485 | |
Contract Balances
A contract asset is a right to consideration that is conditional upon factors other than the passage of time. Contract assets are presented in "Other current assets" in our consolidated statements of financial position and primarily relate to unbilled amounts on fixed-price contracts utilizing the cost to cost method of revenue recognition. The table below shows significant movements in contract assets:assets (current and noncurrent): | | | | | | | | | | | | | | | | | 2020 | | 2019 | | | (in millions) | | Beginning balance | | $ | 334 | | | $ | 305 | | | Revenues recognized during the period but not billed | | 289 | | | 313 | | | Amounts reclassified to trade accounts receivable | | (308) | | | (284) | | | | | | | | Ending balance | | $ | 315 | | | $ | 334 | |
Our contract | | | | | | | | | | | | | | | | (in millions) | | 2023 | | 2022 | | Beginning balance | | $ | 326 | | | $ | 310 | | | Revenues recognized during the period but not billed | | 308 | | | 308 | | | Amounts reclassified to trade accounts receivable | | (327) | | | (285) | | | Amounts acquired in business combinations | | 9 | | | — | | | Effect of foreign currency exchange movements | | — | | | (7) | | | Ending balance | | $ | 316 | | | $ | 326 | |
| | | | | | | | | | Cognizant | F-17 | December 31, 2023 Form 10-K |
Contract liabilities, or deferred revenue, consist of advance payments and billings in excess of revenues recognized. The table below shows significant movements in the deferred revenue balances (current and noncurrent): | | | | | | | | | | | | | | | | | 2020 | | 2019 | | | (in millions) | | Beginning balance | | $ | 336 | | | $ | 348 | | | Amounts billed but not recognized as revenues | | 368 | | | 319 | | | Revenues recognized related to the opening balance of deferred revenue | | (285) | | | (261) | | Other (1) | | 0 | | | (70) | | | Ending balance | | $ | 419 | | | $ | 336 | |
(1) See the Business Combinations section in Note 1. | | | | | | | | | | | | | | | | (in millions) | | 2023 | | 2022 | | Beginning balance | | $ | 417 | | | $ | 443 | | | Amounts billed but not recognized as revenues | | 406 | | | 397 | | | Revenues recognized related to the beginning balance of deferred revenue | | (409) | | | (416) | | | Amounts acquired in business combinations | | 13 | | | — | | | Effect of foreign currency exchange movements | | — | | | (7) | | | Ending balance | | $ | 427 | | | $ | 417 | |
Revenues recognized during the year ended December 31, 20202023 for performance obligations satisfied or partially satisfied in previous periods were immaterial.
Remaining Performance Obligations As of December 31, 2020,2023, the aggregate amount of transaction price allocated to remaining performance obligations, was $1,446$4,007 million,, of which approximately 75%55% is expected to be recognized as revenues within 2 years and 85% is expected to be recognized as revenues within 5 years. Disclosure is not required for performance obligations that meet any of the following criteria: (1)contracts with a duration of one year or less as determined under the New Revenue Standard,ASC Topic 606 "Revenue from Contracts with Customers," (2)contracts for which we recognize revenues based on the right to invoice for services performed, (3)variable consideration allocated entirely to a wholly unsatisfied performance obligation or to a wholly unsatisfied promise to transfer a distinct good or service that forms part of a single performance obligation in accordance with ASC 606-10-25-14(b), for which the criteria in ASC 606-10-32-40 have been met, or (4)variable consideration in the form of a sales-based or usage based royalty promised in exchange for a license of intellectual property. Many of our performance obligations meet one or more of these exemptions and therefore are not included in the remaining performance obligation amount disclosed above. Trade Accounts Receivable and Allowance for Doubtful AccountsCredit Losses We calculate expected credit losses for our trade accounts receivable based on historical credit loss rates for each aging category as adjusted for the current market conditions and forecasts about future economic conditions. The following table presents the activity in the allowance for ourcredit losses for the trade accounts receivable:
| | 2020 | | 2019 | | (in millions) | | (in millions) | | (in millions) | | 2023 | | 2022 | | 2021 | | Beginning balance | Beginning balance | | $ | 67 | | | $ | 78 | | | Impact of adoption of the Credit Loss Standard | | (1) | | | — | | | Provision for expected credit losses | | 8 | | | (11) | | Credit loss expense (1) | | | Write-offs charged against the allowance | Write-offs charged against the allowance | | (17) | | | 0 | | | | Ending balance | Ending balance | | $ | 57 | | | $ | 67 | | | Ending balance | | | Ending balance | |
| | | | | | | | | | Cognizant | F-18 | December 31, 2023 Form 10-K |
| | | | | | | | | | | | | | | | Note 3 — Business Combinations |
Acquisitions completed during each of the three years ended December 31, 2020, 20192023, 2022 and 20182021 were not individually or in the aggregate material to our operations. Accordingly, pro forma results have not been presented. We have allocated the purchase price related to these transactions to tangible and intangible assets acquired and liabilities assumed, including deductible and non-deductible goodwill, based on their estimated fair values. The primary items that generated goodwill are the value of the acquired assembled workforces and synergies between the acquired companies and us, neither of which qualify as an amortizableidentifiable intangible asset.
20202023
In 2020,2023, we acquired 100% ownership of: •ownersCode Zero, a providerhip in each of consulting and implementation services acquired to strengthen our cloud solutions portfolio and Salesforce Configure-Price-Quote and billing capabilities (acquired on January 31, 2020);the following:
•Lev,certain net assets of OneSource Virtual, the professional and application management services business of OneSource Virtual, Inc. and OneSource Virtual (UK) Ltd., a Salesforce Platinum Partner specializing in digital marketing consultancyleading provider of Workday services, solutions and implementation of custom cloud solutionsproducts, acquired to further expandcomplement our global Salesforce practiceexisting finance and human resources advisory implementation services related to Workday (acquired on March 27, 2020);January 1, 2023), and •EI-Technologies, a digital technology consulting firm and leading Salesforce specialistMobica, an IoT software engineering services provider, acquired to expand our global Salesforce practiceIoT embedded software engineering capabilities (acquired on May 29, 2020);March 10, 2023). •Collaborative Solutions, a provider of Workday enterprise cloud applications for finance and human resources acquired to strengthen our portfolio of cloud offerings (acquired on June 10, 2020);
•New Signature, an independent Microsoft public cloud transformation company acquired to expand our hyperscale cloud advisory services and provide the foundation for our new, dedicated practice centered on Microsoft cloud solutions (acquired on August 18, 2020);
•the net assets of Tin Roof, a custom software and digital product development services company acquired to expand our software product engineering footprint in the United States (acquired on September 16, 2020);
•10th Magnitude, a leading cloud specialist focused on the Microsoft Azure cloud computing platform acquired to expand our Microsoft Azure expertise (acquired on September 30, 2020);
•the net assets of Bright Wolf, a technology service provider specializing in customer Industrial IoT solutions acquired to expand our smart products offering and expertise in architecting and implementing Industrial IoT solutions (acquired on November 2, 2020); and
•Inawisdom, an Amazon Web Services consulting partner with expertise in AI, machine learning, and data analytics acquired to expand our client services in Europe and strengthen our end-to-end cloud-native AI and machine learning solutions portfolio (acquired on December 18, 2020).
The allocations of preliminary purchase price to the fair value of the aggregate assets acquired and liabilities assumed were as follows:
| | | | | | | | | | | | | | | | | | | | | | | | | | | | | | | | | | | | | | | | | | | Collaborative Solutions | | New Signature | | Tin Roof | | 10th Magnitude | | Others | | Total | | Weighted Average Useful Life | | (dollars in millions) | | | | Cash | $ | 10 | | | $ | 13 | | | $ | 0 | | | $ | 2 | | | $ | 10 | | | $ | 35 | | | | | Trade accounts receivable | 38 | | | 13 | | | 10 | | | 7 | | | 21 | | | 89 | | | | | Property and equipment and other assets | 6 | | | 6 | | | 1 | | | 2 | | | 15 | | | 30 | | | | | Operating lease assets, net | 6 | | | 7 | | | 2 | | | 4 | | | 13 | | | 32 | | | | | Non-deductible goodwill | 44 | | | 292 | | | 0 | | | 90 | | | 66 | | | 492 | | | | | Deductible goodwill | 281 | | | 0 | | | 86 | | | 39 | | | 92 | | | 498 | | | | | Customer relationship intangible assets | 37 | | | 8 | | | 69 | | | 10 | | | 21 | | | 145 | | | 9.8 years | | Other intangible assets | 8 | | | 1 | | | 0 | | | 0 | | | 2 | | | 11 | | | 5.4 years | | Current liabilities | (25) | | | (20) | | | (13) | | | (15) | | | (23) | | | (96) | | | | | Noncurrent liabilities | (5) | | | (8) | | | (2) | | | (5) | | | (15) | | | (35) | | | | Purchase price, inclusive of contingent consideration (1) | $ | 400 | | | $ | 312 | | | $ | 153 | | | $ | 134 | | | $ | 202 | | | $ | 1,201 | | | |
(1)The purchase price for our acquisitions includes contingent consideration components with a collective maximum payout of $59 million, valued at $42 million at the date of acquisition, which is contingent upon achieving certain performance thresholds during the first two calendar years following the date of acquisition.
For the year ended December 31, 2020, revenues from acquisitions completed in 2020, since the dates of acquisition, were $222 million. For acquisitions completed in 2020, the allocation is preliminary and will be finalized as soon as practicable within the measurement period, but in no event later than one year following the date of acquisition.
2019
In 2019, we acquired 100% ownership of:
•Mustache, a creative content agency based in the United States, acquired to extend our capabilities in creating original and branded content for digital, broadcast and social mediums (acquired on January 15, 2019);
•Meritsoft, a financial software company based in Ireland, acquired to complement our service offerings to capital markets institutions (acquired on March 4, 2019);
•Samlink, a developer of services and solutions for the financial sector based in Finland, acquired to strengthen our banking capabilities and create a strategic partnership with three Finnish financial institutions to transform and operate a shared core banking platform (acquired on April 1, 2019);
•Zenith, a life sciences company based in Ireland, acquired to extend our service capabilities for connected biopharmaceutical and medical device manufacturers (acquired on July 29, 2019); and
•Contino, a technology consulting firm acquired to extend our capabilities in enterprise DevOps and cloud transformation (acquired on October 31, 2019).
The allocations of purchase price to the fair value of the aggregate assets acquired and liabilitiesliabilities assumed were as follows: | | | | | | | | | | | | | | | | | | | | | | | | | (in millions) | OneSource Virtual | | Mobica | | Total | | Weighted Average Useful Life | | Cash | $ | — | | | $ | 20 | | | $ | 20 | | | | | Trade accounts receivable | — | | | 10 | | | 10 | | | | | Other current assets | 4 | | | 8 | | | 12 | | | | | Property and equipment and other assets | 1 | | | 6 | | | 7 | | | | | | | | | | | | | Non-deductible goodwill | 18 | | | 202 | | | 220 | | | | | Tax-deductible goodwill | 88 | | | — | | | 88 | | | | | Customer relationship assets | 11 | | | 120 | | | 131 | | | 10.9 years | | | | | | | | | | | | | | | | | | Current liabilities | (18) | | | (9) | | | (27) | | | | | Noncurrent liabilities | (1) | | | (32) | | | (33) | | | | | Purchase price | $ | 103 | | | $ | 325 | | | $ | 428 | | | |
| | | | | | | | | | | | | | | | | | | | | | | | | | | | | | | | | | | | | Contino | | Meritsoft | | Zenith | | Others | | Total | | Weighted Average Useful Life | | (dollars in millions) | | | | Cash | $ | 7 | | | $ | 14 | | | $ | 9 | | | $ | 15 | | | $ | 45 | | | | | Current assets | 16 | | | 6 | | | 52 | | | 21 | | | 95 | | | | | Property and equipment and other noncurrent assets | 4 | | | 1 | | | 6 | | | 14 | | | 25 | | | | | Non-deductible goodwill | 198 | | | 147 | | | 76 | | | 21 | | | 442 | | | | | Customer relationship intangible assets | 29 | | | 46 | | | 73 | | | 19 | | | 167 | | | 10.7 years | | Other intangible assets | 2 | | | 29 | | | 4 | | | 6 | | | 41 | | | 6.1 years | | Current liabilities | (11) | | | (3) | | | (35) | | | (22) | | | (71) | | | | | Noncurrent liabilities | (10) | | | (12) | | | (17) | | | (10) | | | (49) | | | | | Purchase price, inclusive of contingent consideration | $ | 235 | | | $ | 228 | | | $ | 168 | | | $ | 64 | | | $ | 695 | | | |
| | | | | | | | | | Cognizant | F-19 | December 31, 2023 Form 10-K |
2022 In 2022, we acquired 100% ownership in each of the following: •AustinCSI, a digital transformation consultancy specializing in enterprise cloud and data analytics advisory services, acquired to complement our technology and industry expertise (acquired December 15, 2022); and •Utegration, a full service consulting and solutions provider specializing in SAP technology and SAP-certified products for the energy and utilities sectors, acquired to expand and strengthen our industry expertise in our SAP practice (acquired December 19, 2022). The allocations of purchase price to the fair value of the assets acquired and liabilities assumed were as follows: | | | | | | | | | | | | | | | | | | | | | | | | | | | (dollars in millions) | AustinCSI | | Utegration | | | | Total | | Weighted Average Useful Life | | Cash | $ | — | | | $ | 5 | | | | | $ | 5 | | | | | Trade accounts receivable | 9 | | | 19 | | | | | 28 | | | | | Property and equipment and other assets | 4 | | | 6 | | | | | 10 | | | | | | | | | | | | | | | Non-deductible goodwill | — | | | 23 | | | | | 23 | | | | | Tax-deductible goodwill | 83 | | | 98 | | | | | 181 | | | | | Customer relationship assets | 69 | | | 82 | | | | | 151 | | | 12.7 years | | Other intangible assets | — | | | 2 | | | | | 2 | | | 6.7 years | | Current liabilities | (3) | | | (18) | | | | | (21) | | | | | Noncurrent liabilities | (1) | | | (3) | | | | | (4) | | | | | Purchase price | $ | 161 | | | $ | 214 | | | | | $ | 375 | | | |
For the year ended December 31, 2022, revenues from acquisitions completed in 2022, since the dates of acquisition, were immaterial. 2021 In 2021, we acquired 100% ownership in each of the following: •Linium, a cloud transformation consultancy group specializing in the ServiceNow platform and solutions for smart digital enterprise workflows, acquired to broaden our enterprise service management capabilities (acquired January 31, 2021); •Magenic, a provider of agile software and cloud development, DevOps, experience design and advisory services across a range of industries, acquired to enhance our global software engineering expertise (acquired February 1, 2021); •Servian, an Australia-based enterprise transformation consultancy specializing in data analytics, AI, digital services, experience design and cloud, acquired to enhance our digital portfolio and market presence in Australia and New Zealand (acquired April 1, 2021); •ESG Mobility, a digital automotive engineering research and development provider for connected, autonomous and electric vehicles, acquired to expand our digital engineering expertise, particularly in connected vehicles (acquired June 1, 2021); •TQS, a global industrial data and intelligence company, acquired to accelerate our growth in IoT, data and analytics (acquired July 30, 2021); •Hunter, a provider of digital engineering and project management services, acquired to extend our talent network in key markets, expanding our digital engineering resources in the United States (acquired August 16, 2021); and •Devbridge, a software consultancy and product development company, acquired to expand our software product engineering capabilities and global delivery footprint (acquired December 9, 2021). | | | | | | | | | | Cognizant | F-20 | December 31, 2023 Form 10-K |
The allocations of purchase price to the fair value of the assets acquired and liabilities assumed were as follows: | | | | | | | | | | | | | | | | | | | | | | | | | | | | | | | | | | | | | | | | | | | | | | | | | (dollars in millions) | Devbridge | | Servian | | Magenic | | ESG Mobility | | Linium | | Other | | Total | | Weighted Average Useful Life | | Cash | $ | 7 | | | $ | 4 | | | $ | 13 | | | $ | 28 | | | $ | — | | | $ | 2 | | | $ | 54 | | | | | Trade accounts receivable | 12 | | | 15 | | | 17 | | | 30 | | | 5 | | | 12 | | | 91 | | | | | Property and equipment and other assets | 5 | | | 6 | | | 4 | | | 8 | | | 1 | | | 4 | | | 28 | | | | | Operating lease assets, net | 11 | | | 5 | | | 10 | | | 27 | | | — | | | 1 | | | 54 | | | | | Non-deductible goodwill | 41 | | | 184 | | | 10 | | | 26 | | | — | | | 18 | | | 279 | | | | | Tax-deductible goodwill | 140 | | | — | | | 137 | | | 24 | | | 57 | | | 10 | | | 368 | | | | | Customer relationship assets | 72 | | | 77 | | | 90 | | | 77 | | | 24 | | | 32 | | | 372 | | | 9.8 years | | Other intangible assets | — | | | 2 | | | 1 | | | — | | | — | | | — | | | 3 | | | 3.8 years | | | | | | | | | | | | | | | | | | Current liabilities | (11) | | | (12) | | | (29) | | | (22) | | | (2) | | | (7) | | | (83) | | | | | Noncurrent liabilities | (9) | | | (29) | | | (7) | | | (66) | | | — | | | (6) | | | (117) | | | | | Purchase price, inclusive of contingent consideration | $ | 268 | | | $ | 252 | | | $ | 246 | | | $ | 132 | | | $ | 85 | | | $ | 66 | | | $ | 1,049 | | | |
For the year ended December 31, 2021, revenues from acquisitions completed in 2021, since the dates of acquisition, were $301 million.
| | | | | | | | | | | | | | | | Note 4 — Restructuring Charges |
During 2020, we incurred costs related to both our realignment program and our 2020 Fit for Growth Plan. Our realignment program, which began in 2017, improved our client focus, our cost structure andIn the efficiency and effectiveness of our delivery while continuing to drive revenue growth. Our 2020 Fit for Growth Plan, which began in the fourthsecond quarter of 2019, simplified2023, we initiated the NextGen program aimed at simplifying our organizationaloperating model, optimizing corporate functions and optimized our cost structure in orderconsolidating and realigning office space to partially fundreflect the investments requiredpost-pandemic hybrid work environment. We expect the NextGen program to execute on our strategy and advance our growth agenda and included our decision to exit certain content-related services that were not in line with our strategic vision forbe completed by the Company. end of 2024.
The total costs related to our realignmentNextGen program and our 2020 Fit for Growth Plan are reported in "Restructuring charges" in our audited consolidated statements of operations. We do not allocate these charges to individual segments in internal management reports used by the chief operating decision maker.CODM. Accordingly, such expenses are includedseparately disclosed in our segment reporting as “unallocated costs”. See Note 1918. Charges related to our realignment program and our 2020 Fit for Growth Plan were as follows:
| | | | | | | | | | | | | | | | | | | | Years Ended December 31, | | | 2020 | | 2019 | | 2018 | | (in millions) | | Realignment Program: | | | | | | | Employee separation costs | $ | 0 | | | $ | 64 | | | $ | 18 | | | Executive Transition Costs | 0 | | | 22 | | | 0 | | | Employee retention costs | 15 | | | 45 | | | 0 | | | Professional fees | 27 | | | 38 | | | 1 | | | 2020 Fit for Growth Plan: | | | | | | | Employee separation costs | 127 | | | 45 | | | 0 | | | Employee retention costs | 5 | | | 2 | | | 0 | | Facility exit costs and other charges (1) | 41 | | | 1 | | | 0 | | | Total restructuring charges | $ | 215 | | | $ | 217 | | | $ | 19 | |
| | | | | | | | | | | | | Year Ended | | | | | | | | (in millions) | December 31, 2023 | | | | | | | | | | | | | | | | | | | | | | | | | | | | | | Employee separation costs | $ | 115 | | | | | | | | | | | | | | | | Facility exit costs (1) | 108 | | | | | | | | Third party and other costs (2) | 6 | | | | | | | | | Total restructuring charges | $ | 229 | | | | | | | |
(1)Includes $7For the year ended December 31, 2023, facility exit costs include lease restructuring of $71 million, related accelerated depreciation of $36 million and impairment of long-lived assets of $1 million. (2)Third party and other costs include certain non-facility related asset impairments, as well as legal and other professional services fees directly related to the NextGen program. We expect to record total costs of approximately $300 million in connection with the NextGen program, inclusive of the $229 million of accelerated depreciationcosts incurred for the year ended December 31, 2020. The 2020 Fit for Growth Plan charges include $23 million and $5 million of costs incurred in 2020 and 2019, respectively, related to our exit from certain content-related services.
Changes in our accrued employee separation costs for both our realignment program and our 2020 Fit for Growth Plan, included in "Accrued expenses and other current liabilities" in our consolidated statements of financial position are presented in the table below.below for the year ended December 31: | | | | | | | | | | | | | | | | | 2020 | | 2019 | | | (in millions) | | Beginning balance | | $ | 47 | | | $ | 0 | | | Employee separation costs accrued | | 127 | | | 109 | | | Payments made | | 157 | | | 62 | | | Ending balance | | $ | 17 | | | $ | 47 | |
| | | | | | | | | | | | (in millions) | | 2023 | | | | | | | Beginning balance | | $ | — | | | | | Employee separation costs accrued | | 115 | | | | | Payments made | | (73) | | | | | Ending balance | | $ | 42 | | | |
There were no restructuring charges during 2022 or 2021.
| | | | | | | | | | Cognizant | F-21 | December 31, 2023 Form 10-K |
Our investments were as follows as of December 31: | | 2020 | | 2019 | | (in millions) | | (in millions) | | (in millions) | 2023 | | 2022 | | Short-term investments: | Short-term investments: | | | Equity investment security | Equity investment security | $ | 27 | | | $ | 26 | | | | Equity investment security | | | Equity investment security | | | Available-for-sale investment securities | | | Held-to-maturity investment securities | Held-to-maturity investment securities | 14 | | | 287 | | Time deposits (1) | 3 | |
| 466 | | | Time deposits | | | Total short-term investments | Total short-term investments | $ | 44 | | | $ | 779 | |
| | | | | | | | | | | | | Long-term investments: | | | | | Equity and cost method investments | $ | 35 | | | $ | 17 | | Time deposits (1) | 405 | | | 0 | | | Total long-term investments | $ | 440 | | | $ | 17 | |
| | | | | | | | | | | | | Long-term investments: | | | | | Other investments | $ | 80 | | | $ | 70 | | Restricted time deposits(1) | 355 | | | 357 | | | Total long-term investments | $ | 435 | | | $ | 427 | |
(1)As of December 31, 2020, $405 million in2023 the balance of restricted time deposits related to deposits under lien with the ITD were classified as long-term.contains $96 million of restricted cash equivalents. As of December 31, 2019, $414 million in2022 the balance consisted solely of restricted time deposits were classified as short-term. investments. See Note 11.
Equity Investment Security
Our equity investment security is a U.S. dollar denominated investment in a fixed income mutual fund. During 2022, we sold $15 million of our investment in the fund. Realized and unrealized gains and losses were immaterial for each of the years ended December 31, 20202023, 2022 and 2019.2021.
Available-for-Sale Investment Securities
During 2019, allAs of ourDecember 31, 2023, we had no available-for-sale investment securities. As of December 31, 2022, the amortized cost and fair value of the available-for-sale investments were each $225 million. Our available-for-sale investment securities either maturedconsisted of highly rated U.S. dollar denominated investments in certificates of deposit and commercial paper maturing within one year. Unrealized losses were immaterial as of December 31, 2022. There were no realized gains or were sold. We determinelosses related to the costavailable-for-sale investment securities during each of the securities sold based on the specific identification method. Proceeds fromyears ended December 31, 2023, 2022 and 2021. There were no sales of available-for-sale investment securities during each of the years ended December 31, 2023, 2022 and the gross gains and losses that have been included in earnings as a result of those sales were as follows:
| | | | | | | | | | | | | | | | | | | | | | | 2020 | | 2019 | | 2018 | | | (in millions) | | Proceeds from sales of available-for-sale investment securities | | $ | 0 | | | $ | 1,712 | | | $ | 1,285 | | | | | | | | | | Gross gains | | $ | 0 | | | $ | 6 | | | $ | 0 | | | Gross losses | | 0 | | | (5) | | | (4) | | | Net realized gains (losses) on sales of available-for-sale investment securities | | $ | 0 | | | $ | 1 | | | $ | (4) | |
Held-to-Maturity Investment Securities Our held-to-maturity investment securities consist of Indian rupee denominated investments primarily in commercial paper and international corporate bonds. Our investment guidelines are to purchase securities that are investment grade at the time of acquisition. The basis for the measurement of fair value of our held-to-maturity investments is Level 2 in the fair value hierarchy. The amortized cost and fair value of held-to-maturity investmentcommercial paper securities were as follows as of December 31: | | | | | | | | | | | | | | | | | | | | | | | | | | | | | 2020 | | 2019 | | | Amortized
Cost | | | | | | Fair
Value | | Amortized
Cost | | Fair
Value | | (in millions) | | Short-term investments, due within one year: | | | | | | | | | | | | | Corporate and other debt securities | $ | 14 | | | | | | | $ | 14 | | | $ | 101 | | | $ | 101 | | | Commercial paper | 0 | | | | | | | 0 | | | 186 | | | 186 | | | Total short-term held-to-maturity investments | $ | 14 | | | | | | | $ | 14 | | | $ | 287 | | | $ | 287 | |
31, 2023 and 2022 were each $3 million and $12 million, respectively. As of December 31, 2020,2023, there were 0 held-to-maturity investmentno corporate debt securities. As of December 31, 2022 the amortized cost and fair value of corporate debt securities was $12 million. As of December 31, 2023, our portfolio of $3 million included a single commercial paper security in an unrealized loss position. As of December 31, 2019, $70 million in commercial paper and $42 million in corporate and other debt securities were in an unrealized loss position, theThe total unrealized loss was less than $1 million and NaNthe security had not been in an unrealized loss position for longer than 12 months. As of December 31, 2022, $12 million of corporate debt securities and $12 million of commercial paper were in an unrealized loss position. The total unrealized loss was less than $1 million and none of the securities had been in an unrealized loss position for longer than 12 months. The securitiessecurities in our portfolio are highly rated and short-term in nature. As of December 31, 2020, our corporate and other debt securities were2023, the commercial paper security was rated AAAA-1+ by CRISIL, an Indian subsidiary of S&P Global.
Equity and Cost MethodOther Investments
As of December 31, 20202023 and 2019,2022, we had equity method investments of $31$74 million and $9$68 million, respectively. During 2020, we acquired a $26 million equity methodrespectively, primarily related to an investment in the technology sector. In addition, we have an equity method investment which consists of a 49% ownership interest in a strategic consulting firm specializing in the use of human sciences to help business leaders better understand customer behavior. During 2019, as a result of events indicating one of our investments experienced an other-than-temporary impairment, we assessed its fair value and determined that the carrying value exceeded the fair value. As such, we recorded an impairment charge of $57 million in the fourth quarter of 2019 within the caption "Income (loss) from equity method investments" in our consolidated statement of operations. In determining the fair value of the equity method investment we considered results from the following valuation methodologies: income approach, based on discounted future cash flows, market approach, based on current market multiples and net asset value approach, based on the assets and liabilities of the investee. The basis for the measurement of fair value for this equity method investment is Level 3 in the fair value hierarchy. As of December 31, 20202023 and 2019,2022, we had cost method investmentsequity securities without a readily determinable fair value of $4$6 million and $8$2 million, respectively. | | | | | | | | | | Cognizant | F-22 | December 31, 2023 Form 10-K |
| | | | | | | | | | | | | | | | Note 6 — Property and Equipment, net |
Property and equipment were as follows as of December 31: | | Estimated Useful Life | | 2020 | | 2019 | | (in years) | | (in millions) | | | Estimated Useful Life | | | | Estimated Useful Life | | 2023 | | 2022 | | | (in years) | | | | (in years) | | (in millions) | | Buildings | Buildings | | 30 | | $ | 783 | | | $ | 790 | | | Computer equipment | Computer equipment | | 3 – 5 | | 636 | | | 516 | | | Computer software | Computer software | | 3 – 8 | | 840 | | | 820 | | | Furniture and equipment | Furniture and equipment | | 5 – 9 | | 761 | | | 702 | | | Land | Land | | 7 | | | 11 | | | | Capital work-in-progress | Capital work-in-progress | | 122 | | | 133 | | | Capital work-in-progress | | | Capital work-in-progress | | | Leasehold improvements | Leasehold improvements | | Shorter of the lease term or
the life of the asset | | 424 | | | 379 | | | Sub-total | Sub-total | | 3,573 | | | 3,351 | | | Accumulated depreciation and amortization | Accumulated depreciation and amortization | | (2,322) | | | (2,042) | | | Property and equipment, net | Property and equipment, net | | $ | 1,251 | | | $ | 1,309 | |
Depreciation and amortization expense related to property and equipment was $407$390 million, $363$385 million and $347$392 million for the years ended December 31, 2020, 20192023, 2022 and 2018,2021, respectively. For the year ended December 31, 2023, $36 million of our depreciation and amortization expense was reported in "Restructuring charges". The gross amount of property and equipment recorded under finance leases was $37$25 million and $30$17 million as of December 31, 20202023 and 2019,2022, respectively. Accumulated amortization for our ROU finance lease assets was $23$13 million and $14$9 million as of December 31, 20202023 and 2019,2022, respectively. Amortization expense related to our ROU finance lease assets was $7$4 million, $4 million and $11$7 million for the yearyears ended December 31, 20202023, 2022 and 2019,2021, respectively. Amortization expense related to our capital lease assets was immaterial for the year ended December 31, 2018.
The gross amount of property and equipment recorded for software to be sold, leased or marketed reported in the caption "Computer software" above was $159$279 million and $129$241 million as of December 31, 20202023 and 2019,2022, respectively. Accumulated amortization for software to be sold, leased or marketed was $73$177 million and $46$143 million as of December 31, 20202023 and 2019,2022, respectively. Amortization expense for software to be sold, leased or marketed recorded as property and equipment was $30$37 million, $22$37 million and $14$33 million for the years ended December 31, 2020, 20192023, 2022 and 2018,2021, respectively.
The following table provides information on the components of our operating and finance leases included in our consolidated statement of financial position as of December 31: | | Leases | Leases | | Location on Statement of Financial Position | | 2020 | | 2019 | Leases | | Location on Statement of Financial Position | | 2023 | | 2022 | | Assets | Assets | | | | (in millions) | Assets | | | | (in millions) | | ROU operating lease assets | ROU operating lease assets | | Operating lease assets, net | | $ | 1,013 | | | $ | 926 | | | ROU finance lease assets | ROU finance lease assets | | Property and equipment, net | | 14 | | | 16 | | | Total | | $ | 1,027 | | | 942 | | | | Total | | | | Liabilities | Liabilities | | | Liabilities | | | Liabilities | | | Current | Current | | | Current | | | Current | | | Operating lease | | | Operating lease | | | Operating lease | Operating lease | | Operating lease liabilities | | $ | 211 | | | 202 | | | Finance lease | Finance lease | | Accrued expenses and other current liabilities | | 11 | | | 11 | | | Noncurrent | Noncurrent | | | Operating lease | Operating lease | | Operating lease liabilities, noncurrent | | 846 | | | 745 | | | Operating lease | | | Operating lease | | | Finance lease | Finance lease | | Other noncurrent liabilities | | 11 | | | 15 | | | Total | | $ | 1,079 | | | $ | 973 | | | | Total | |
| | | | | | | | | | Cognizant | F-23 | December 31, 2023 Form 10-K |
For the years ended December 31, 20202023, 2022 and 2019,2021, our operating lease costs were $302$304 million, $256 million and $264$293 million, respectively, including variable lease costs of $14$21 million, $17 million and $18$10 million, respectively. respectively. Our short-term lease rental expense was $20$15 million, $21 million and $16$22 million for the years ended December 31, 20202023, 2022 and 2019,2021, respectively. Lease interest expense related to our finance leases for years ended December 31, 20202023, 2022 and 20192021 was immaterial. The following table provides information on the weighted average remaining lease term and weighted average discount rate for our operating leases as of December 31: | | | | | | | | | | | | | | | | Operating Lease Term and Discount Rate | | 2020 | | 2019 | | | | | | | Weighted average remaining lease term | | 6.2 years | | 6.0 years | | | | | | | | | | | | Weighted average discount rate | | 5.7 | % | | 6.0 | % | | | | | | | | | | |
| | | | | | | | | | | | | | | | Operating Lease Term and Discount Rate | | 2023 | | 2022 | | | | | | | Weighted average remaining lease term | | 5.6 years | | 6.2 years | | | | | | | | | | | | Weighted average discount rate | | 5.4 | % | | 5.4 | % | | | | | | | | | | |
The following table provides supplemental cash flow and non-cash information related to our operating leases as of December 31: | | 2020 | | 2019 | | (in millions) | | (in millions) | | (in millions) | 2023 | | 2022 | | 2021 | | Cash paid for amounts included in the measurement of operating lease liabilities | Cash paid for amounts included in the measurement of operating lease liabilities | $ | 271 | | | $ | 232 | | | ROU assets obtained in exchange for operating lease liabilities | ROU assets obtained in exchange for operating lease liabilities | 273 | | | 274 | | | Reduction of ROU assets and lease liabilities as a result of our NextGen program | |
Cash paid for amounts included in the measurement of finance lease liabilities and ROU assets obtained in exchange for finance lease liabilities were each immaterial for each of the years ended December 31, 20202023, 2022 and 2019.2021.
The following table provides the schedule of maturities of our operating lease liabilities and a reconciliation of the undiscounted cash flows to the operating lease liabilities recognized in the statement of financial position as of December 31: | | | | | | | | | | | 2020 | | | (in millions) | | 2021 | | $ | 260 | | | 2022 | | 218 | | | 2023 | | 180 | | | 2024 | | 143 | | | 2025 | | 121 | | | Thereafter | | 349 | | | Total lease payments | | 1,271 | | | Interest | | (214) | | | Total lease liabilities | | $ | 1,057 | |
| | | | | | | | | | (in millions) | | 2023 | | 2024 | | $ | 183 | | | 2025 | | 155 | | | 2026 | | 128 | | | 2027 | | 104 | | | 2028 | | 72 | | | Thereafter | | 138 | | | Total operating lease payments | | 780 | | | Interest | | (104) | | | Total operating lease liabilities | | $ | 676 | |
As of December 31, 2020,2023, we had $92$21 million of additional obligations related to operating leases whose lease term had yet to commence and which are therefore not included in our statement of financial position. These leases are primarily related to real estate and will commence in various months in 2021 and 20222024 with lease terms of 1 year5 to 1110 years.
| | | | | | | | | | | | | | | | Note 8 — Goodwill and Intangible Assets, net |
Changes in goodwill by our reportable business segments were as follows for the years ended December 31, 20202023 and 2019:2022: | | | | | | | | | | | | | | | | | | | | | | | | | | | | Segment | | January 1, 2020 | | Goodwill Additions and Adjustments | | Foreign Currency Translation Adjustments | | December 31, 2020 | | | (in millions) | | Financial Services | | $ | 700 | | | $ | 204 | | | $ | 28 | | | $ | 932 | | | Healthcare | | 2,595 | | | 149 | | | 11 | | | 2,755 | | | Products and Resources | | 417 | | | 346 | | | 17 | | | 780 | | | Communications, Media and Technology | | 267 | | | 289 | | | 8 | | | 564 | | | Total goodwill | | $ | 3,979 | | | $ | 988 | | | $ | 64 | | | $ | 5,031 | |
| | | | | | | | | | | | | | | | | | | | | | | | | | | | Segment | | January 1, 2023 | | Goodwill Additions and Adjustments | | Foreign Currency Translation Adjustments | | December 31, 2023 | | | (in millions) | | Financial Services | | $ | 1,073 | | | $ | 19 | | | $ | 17 | | | $ | 1,109 | | | Health Sciences | | 2,819 | | | 15 | | | 6 | | | 2,840 | | | Products and Resources | | 1,062 | | | 137 | | | 18 | | | 1,217 | | | Communications, Media and Technology | | 756 | | | 148 | | | 15 | | | 919 | | | Total goodwill | | $ | 5,710 | | | $ | 319 | | | $ | 56 | | | $ | 6,085 | |
| | | | | | | | | | Cognizant | F-24 | December 31, 2023 Form 10-K |
| | Segment | Segment | | January 1, 2019 | | Goodwill Additions and Adjustments | | Foreign Currency Translation Adjustments | | Other(1) | | December 31, 2019 | | (in millions) | | Segment | | | Segment | | | January 1, 2022 | | Goodwill Additions and Adjustments | | Foreign Currency Translation Adjustments | | | | December 31, 2022 | | | (in millions) | | | | (in millions) | | Financial Services | Financial Services | | $ | 411 | | | $ | 288 | | | $ | (2) | | | $ | 3 | | | $ | 700 | | | Healthcare | | 2,469 | | | 86 | | | 0 | | | 40 | | | 2,595 | | | Health Sciences | | | Products and Resources | Products and Resources | | 384 | | | 18 | | | 1 | | | 14 | | | 417 | | | Communications, Media and Technology | Communications, Media and Technology | | 217 | | | 49 | | | 1 | | | 0 | | | 267 | | | Total goodwill | Total goodwill | | $ | 3,481 | | | $ | 441 | | | $ | 0 | | | $ | 57 | | | $ | 3,979 | |
(1) See the Business Combinations section in Note 1.Beginning with the first quarter of 2020, COVID-19 negatively affected all major economic and financial markets and, although there is a wide range of possible outcomes and the associated impact is highly dependent on variables that are difficult to forecast, we deemed the deterioration in general economic conditions sufficient to trigger an interim impairment testing of goodwill as of March 31, 2020. Our interim test results as of March 31, 2020 indicated that the fair values of all of our reporting units exceeded their carrying values and thus, no impairment of goodwill existed as of March 31, 2020. Based on our most recent goodwill impairment assessment performed as ofof October 31, 2020,2023, we concluded that the goodwill in each of our reporting units was not at risk of impairment. We have not recognized any impairment losses on our goodwill.
Components of intangible assets were as follows as of December 31: | | | | | 2020 | | 2019 | | | 2023 | | 2022 | | | | Gross Carrying
Amount | | Accumulated
Amortization | | Net Carrying
Amount | | Gross Carrying
Amount | | Accumulated
Amortization | | Net Carrying
Amount | | (in millions) | | (in millions) | | (in millions) | | Gross Carrying
Amount | | Accumulated
Amortization | | Net Carrying
Amount | | Gross Carrying
Amount | | Accumulated
Amortization | | Net Carrying
Amount | | Customer relationships | Customer relationships | | $ | 1,333 | | | $ | (490) | | | $ | 843 | | | $ | 1,181 | | | $ | (390) | | | $ | 791 | | | Developed technology | Developed technology | | 388 | | | (286) | | | 102 | | | 388 | | | (239) | | | 149 | | | Indefinite lived trademarks | Indefinite lived trademarks | | 72 | | | — | | | 72 | | | 72 | | | — | | | 72 | | | Finite lived trademarks and other | Finite lived trademarks and other | | 80 | | | (51) | | | 29 | | | 71 | | | (42) | | | 29 | | | Total intangible assets | Total intangible assets | | $ | 1,873 | | | $ | (827) | | | $ | 1,046 | | | $ | 1,712 | | | $ | (671) | | | $ | 1,041 | |
Other than certain trademarks with indefinite lives, our intangible assets have finite lives and, as such, are subject to amortization. Amortization of intangible assets totaled $152$165 million, $184 million and $182 million for 2020, $162 million for 2019the years ended December 31, 2023, 2022 and $151 million for 2018.2021, respectively. The following table provides the estimated amortization expense related to our existing intangible assets for the next five years. | | | | | | | | | | | Estimated Amortization | | | (in millions) | | 2021 | | $ | 159 | | | 2022 | | 150 | | | 2023 | | 107 | | | 2024 | | 102 | | | 2025 | | 99 | |
| | | | | | | | | | (in millions) | | Estimated Amortization | | 2024 | | $ | 162 | | | 2025 | | 159 | | | 2026 | | 155 | | | 2027 | | 144 | | | 2028 | | 121 | |
| | | | | | | | | | | | | | | | Note 9 — Accrued Expenses and Other Current Liabilities |
Accrued expenses and other current liabilities were as follows as of December 31: | | | | | | | | | | | | | 2020 | | 2019 | | (in millions) | | Compensation and benefits | $ | 1,607 | | | $ | 1,239 | | | Customer volume and other incentives | 266 | | | 251 | | | Derivative financial instruments | 1 | | | 8 | | | Income taxes | 34 | | | 152 | | | Professional fees | 143 | | | 137 | | | Travel and entertainment | 7 | | | 24 | | | Other | 461 | | | 380 | | | Total accrued expenses and other current liabilities | $ | 2,519 | | | $ | 2,191 | |
| | | | | | | | | | | | | (in millions) | 2023 | | 2022 | | Compensation and benefits | $ | 1,511 | | | $ | 1,446 | | | Customer volume and other incentives | 241 | | | 222 | | | Income taxes | 27 | | | 217 | | | Professional fees | 146 | | | 165 | | | Other | 500 | | | 357 | | | Total accrued expenses and other current liabilities | $ | 2,425 | | | $ | 2,407 | |
| | | | | | | | | | Cognizant | F-25 | December 31, 2023 Form 10-K |
In 2018,2022, we entered into ainto the Credit Agreement providing for a $750the $650 million Term Loan and a $1,750$1,850 million unsecuredunsecured revolving credit facility, which are each due to mature in November 2023.October 2027. We are required under the Credit Agreement to make scheduled quarterly principal payments on the Term Loan.
The Credit Agreement requires interest to be paid, at our option, at either the ABRTerm Benchmark, Adjusted Daily Simple RFR or the EurocurrencyABR Rate (each as defined in the Credit Agreement), plus, in each case, an Applicable Margin (as defined in the Credit Agreement). Initially, the Applicable Margin is 0.875% with respect to Eurocurrency RateTerm Benchmark loans and RFR loans and 0.00% with respect to ABR loans. Subsequently, the Applicable Margin with respect to Eurocurrency RateTerm Benchmark loans and RFR loans will be determined quarterly and may range from 0.75% to 1.125%, depending on our public debt ratings (or,or, if we have not received public debt ratings, from 0.875% to 1.125%, depending on our Leverage Ratio, which is the ratio of indebtedness for borrowed money to Consolidated EBITDA, as defined in the Credit Agreement). Our Credit Agreement also provides a mechanism for determining an alternative rate of interest to the Eurocurrency rate after LIBOR is no longer available. Under the Credit Agreement, we are required to pay commitment fees on the unused portionAgreement. Since issuance of the revolving credit facility, which vary based on our public debt ratings (or, if we have not received public debt ratings, on the Leverage Ratio). As the interest rates on our Term Loan, and any notes outstanding under the revolving credit facility are variable, the fair value of our debt balances approximates their carrying value as of December 31, 2020 and 2019.the Term Loan has been a Term Benchmark loan.
The Credit Agreement contains customary affirmative and negative covenants as well as a financial covenant. The financial covenant is tested at the end of each fiscal quarter and requires us to maintain a Leverage Ratio which is the ratio of indebtedness for borrowed money to Consolidated EBITDA, as defined in the Credit Agreement, not in excess of 3.50 to 3.50:1.00, or for a period of up to four quarters following certain material acquisitions, 3.75 to 3.75:1.00. We were in compliance with all debt covenants and representations of the Credit Agreement as of December 31, 2020.2023. In February 2020,March 2023, our India subsidiary renewed its 13working capital facility at 15 billion Indian rupeeIndian rupees ($178180 million at the December 31, 20202023 exchange rate) working capital. The facility which requires us to repay any balances within 90 days from the date of disbursement. There is a 1.0% prepayment penalty applicable to payments made within 30 days of disbursement. This working capital facility contains affirmative and negative covenants and may be renewed annually in February.annually. As of December 31, 2020,2023, we have not borrowed funds under this facility.facility or any of its predecessor facilities. Short-term Debt The following summarizes ourAs of December 31, 2023 and 2022, we had $33 million and $8 million of short-term debt balances asrelated to current maturities of December 31:
| | | | | | | | | | | | | | | | | | | | | | | 2020 | | 2019 | | | Amount | Weighted Average Interest Rate | | Amount | Weighted Average Interest Rate | | | (in millions) | | | (in millions) | | | | | | | | | | Term Loan - current maturities | | $ | 38 | | 1.0 | % | | $ | 38 | | 2.6 | % |
6.3% and 5.2%, respectively. Long-term Debt The following summarizes our long-term debt balances as of December 31: | | 2020 | | 2019 | | (in millions) | | (in millions) | | (in millions) | | 2023 | | 2022 | | Term Loan | Term Loan | | $ | 703 | | | $ | 741 | | | Less: | Less: | | | Current maturities | Current maturities | | (38) | | | (38) | | | Deferred financing costs | | (2) | | | (3) | | | Current maturities | | | Current maturities | | | Unamortized deferred financing costs | | | Long-term debt, net of current maturities | Long-term debt, net of current maturities | | $ | 663 | | | $ | 700 | |
The following represents the schedule of maturities of our term loan:Term Loan: | | | | | | | | | | Year | | Amounts | | | (in millions) | | 2021 | | $ | 38 | | | 2022 | | 38 | | | 2023 | | 627 | | | | $ | 703 | |
| | | | | | | | | | Year | | Amounts (in millions) | | | | | 2024 | | 33 | | | 2025 | | 33 | | | 2026 | | 33 | | | 2027 | | 543 | | | Total | | $ | 642 | |
| | | | | | | | | | Cognizant | F-26 | December 31, 2023 Form 10-K |
Income before provision for income taxes shown below is based on the geographic location to which such income was attributed for years ended December 31: | | 2020 | | 2019 | | 2018 | | (in millions) | | (in millions) | | (in millions) | | 2023 | | 2022 | | 2021 | | United States | United States | | $ | 814 | | | $ | 931 | | | $ | 947 | | | Foreign | Foreign | | 1,282 | | | 1,612 | | | 1,850 | | | Income before provision for income taxes | Income before provision for income taxes | | $ | 2,096 | | | $ | 2,543 | | | $ | 2,797 | |
The provision for income taxes consisted of the following components for the years ended December 31: | | 2020 | | 2019 | | 2018 | | (in millions) | | (in millions) | | (in millions) | | 2023 | | 2022 | | 2021 | | Current: | Current: | | | Federal and state | | | Federal and state | | | Federal and state | Federal and state | | $ | 137 | | | $ | 549 | | | $ | 241 | | | Foreign | Foreign | | 383 | | | 400 | | | 449 | | | Total current provision | Total current provision | | 520 | | | 949 | | | 690 | | | Deferred: | Deferred: | | | | | | | | Federal and state | Federal and state | | (77) | | | (320) | | | 1 | | | Federal and state | | | Federal and state | | | Foreign | Foreign | | 261 | | | 14 | | | 7 | | | Total deferred provision (benefit) | | 184 | | | (306) | | | 8 | | | Total deferred (benefit) provision | | | Total provision for income taxes | Total provision for income taxes | | $ | 704 | | | $ | 643 | | | $ | 698 | |
In March 2020, the Indian parliament enacted the Budget of India, which contained a number of provisions related to income tax, including a replacement of the DDT, previously due from the dividend payer, with a tax payable by the shareholder receiving the dividend. This provision reduced the tax rate applicable to us for cash repatriated from India. Following this change, during the first quarter of 2020, we limited our indefinite reinvestment assertion to India earnings accumulated in prior years. In July 2020, the U.S. Treasury Department and the IRS released final regulations on Global Intangible Low-Taxed Income ("GILTI"), which became effective in September 2020, that reduced the tax applicable on our accumulated Indian earnings upon repatriation. As a result, during the third quarter of 2020, after a thorough analysis of the impact of these changes in law on the cost of earnings repatriation and considering our strategic decision to increase our investments to accelerate growth in various international markets and expand our global delivery footprint, we reversed our indefinite reinvestment assertion on Indian earnings accumulated in prior years and recorded a $140 million Tax on Accumulated Indian Earnings. The recorded income tax expense reflects the India withholding tax on unrepatriated Indian earnings, which were $5.2 billion as of December 31, 2019, net of applicable U.S. foreign tax credits. On October 28, 2020, our subsidiary in India remitted a dividend
of $2.1 billion, which resulted in a net payment of $2.0 billion to its shareholders (non-Indian Cognizant entities), after payment of $106 million of India withholding tax.
We are involved in antwo separate ongoing disputedisputes with the ITD in connection with a previously disclosed 2016 share repurchase transactiontransactions undertaken by CTSCTS India in 2013 and 2016 to repurchase shares from its shareholders (non-Indian Cognizant entities) valued at $523 million and $2.8 billion. As a result of thatbillion, respectively. The 2016 transaction which was undertaken pursuant to a plan approved by the High Court in Chennai, India, we previously paidand resulted in the payment of $135 million in Indian income taxes - an amount we believe includes all the applicable taxes owed for this transaction under Indian law. In March 2018, we received a communication from the ITD assertingasserted that the ITDit is owed an additional 33 billion Indian rupees ($452397 million at the December 31, 20202023 exchange rate) on the 2016 transaction. Immediately thereafter, the ITD placed an attachment on certain of our India bank accounts. In addition to the dispute on the 2016 transaction, we are also involved in another ongoing dispute with the ITD relating to a 2013 transaction undertaken by CTS India to repurchase shares from its shareholders valued at $523 million (the two disputes collectively referred to as the "ITD Dispute"). In April 2018, the High Court admitted our writ petition for a stay of the actions of the ITD and lifted the ITD’s attachment on our bank accounts. As part of the interim stay order, weWe deposited 5 billion Indian rupees, ($68 million at the December 31, 2020 exchange rate and $70 million at the December 31, 2019 exchange rate) representing 15% of the disputed tax amount related to the 2016 transaction, with the ITD. In addition,As of both December 31, 2023 and 2022, the Court also placed a lien ondeposit with the ITD was $60 million, presented in "Other noncurrent assets." Additionally, certain time deposits of CTS India were placed under lien in favor of the amount of 28 billion Indian rupees ($384 million at the December 31, 2020 exchange rate and $393 million at the December 31, 2019 exchange rate), which isITD, representing the remainder of the disputed tax amount related to the 2016 transaction. In June 2019, the High Court dismissed our previously admitted writ petitions on the ITD Dispute, holding that the Company must exhaust other remedies, such as pursuing the matter before other appellate bodies, for resolution of the ITD Dispute prior to intervention by the High Court. The High Court did not issue a ruling on the substantive issue of whether we owe additional tax as a result of either the 2016 or the 2013 transaction. In July 2019, we appealed the High Court’s orders before the Division Bench. In September 2019, the Division Bench partly allowed the Company’s appeal with respect to the 2016 transaction, but did not issue a ruling on the substantive issue of the tax implications of the transactions. In October 2019, we filed a SLP before the SCI with respect to the 2016 transaction.
In March 2020, the SCI referred the case based on the 2016 transaction back to the ITD with directions to carry out the assessment following the due process of law. Further, until the conclusion of the assessment, the SCI maintained in place the lien on our 28 billion Indian rupees time deposit and did not order the release of the 5 billion Indian rupees deposit held by the ITD. In April 2020, we received an assessment from the ITD, which is consistent with its previous assertions regarding our 2016 transaction. In June 2020, we filed an appeal against this assessment. The ruling of the SCI and the ITD's assessment created additional uncertainty as to the timing of the resolution of this case and, as a result, in the first quarter of 2020 we reclassified the deposits under lien, which are considered restricted assets, and the deposit with the ITD to noncurrent assets.amount. As of December 31, 20202023 and 2019,2022, the balance of deposits under lien was $40530 billion Indian rupees, including previously earned interest, or $355 million and $357 million, respectively, as presented in "Long-term investments" and $414 million presented in "Short-term investments", respectively, including a portion of the interest previously earned.investments." As of December 31, 2023, $96 million of the $355 million deposits under lien were held in time deposits with a maturity of less than 30 days qualifying as cash equivalent instruments and thus are presented as restricted cash equivalents on the consolidated statement of cash flows for the year ended December 31, 2023.
In April 2020, and 2019,we received a formal assessment from the depositITD on the 2016 transaction, which was consistent with the ITD's previous assertions. Our appeal was ruled on unfavorably by the CITA in March 2022 and by the ITAT in September 2023. We filed an appeal against the order of the ITAT with the High Court. On January 8, 2024, the SCI ruled that, in order to proceed with the appeal, we must deposit 30 billion Indian rupees ($355 million at the December 31, 2023 exchange rate), representing the time deposits of CTS India under lien, on the condition that, if CTS India prevails at the High Court, the amount deposited will be returned to CTS India, along with interest accrued, within 4 weeks of the judgment. The SCI also requested the High Court to consider and dispose of the appeal as expeditiously as possible, preferably within 6 weeks of the January 8, 2024 ruling. We made the required deposit in January 2024. The dispute in relation to the 2013 share repurchase transaction is also in litigation. At this time, the ITD was $68 million presented in "Other noncurrent assets" and $70 million presented in "Other current assets", respectively.has not made specific demands with regards to the 2013 transaction.
We continue to believe we have paid all applicable taxes owed on both the 2016 and the 2013 transactions.transactions and we continue to defend our positions with respect to both matters. Accordingly, we have not recorded any reserves for these matters as of December 31, 2020.2023. | | | | | | | | | | Cognizant | F-27 | December 31, 2023 Form 10-K |
The reconciliation between the U.S. federal statutory rate and our effective income tax rate and the U.S. federal statutory rate were as follows for the years ended December 31: | | | | | | | | | | | | | | | | | | | | | | | | | | | | | | | | | | | | | | | | (Dollars in millions) | | 2023 | | % | | 2022 | | % | | 2021 | | % | | Tax expense, at U.S. federal statutory rate | | $ | 585 | | | 21.0 | | | $ | 633 | | | 21.0 | | | $ | 594 | | | 21.0 | | | State and local income taxes, net of federal benefit | | 55 | | | 2.0 | | | 63 | | | 2.1 | | | 50 | | | 1.8 | | | Non-taxable income for Indian tax purposes | | — | | | — | | | (6) | | | (0.2) | | | (36) | | | (1.3) | | | Rate differential on foreign earnings | | 95 | | | 3.4 | | | 98 | | | 3.2 | | | 137 | | | 4.8 | | | | | | | | | | | | | | | | Recognition of benefits related to uncertain tax positions | | (33) | | | (1.2) | | | (43) | | | (1.4) | | | (14) | | | (0.5) | | | Credits and other incentives | | (37) | | | (1.3) | | | (17) | | | (0.6) | | | (42) | | | (1.5) | | | | | | | | | | | | | | | | Other | | 3 | | | 0.1 | | | 2 | | | 0.1 | | | 4 | | | 0.2 | | | Total provision for income taxes | | $ | 668 | | | 24.0 | | | $ | 730 | | | 24.2 | | | $ | 693 | | | 24.5 | |
| | | | | | | | | | | | | | | | | | | | | | | | | | | | | | | | | | | | | | | | | 2020 | | % | | 2019 | | % | | 2018 | | % | | | (Dollars in millions) | | Tax expense, at U.S. federal statutory rate | | $ | 440 | | | 21.0 | | | $ | 534 | | | 21.0 | | | $ | 587 | | | 21.0 | | | State and local income taxes, net of federal benefit | | 52 | | | 2.5 | | | 59 | | | 2.3 | | | 56 | | | 2.0 | | | Non-taxable income for Indian tax purposes | | (48) | | | (2.3) | | | (90) | | | (3.5) | | | (146) | | | (5.2) | | | Rate differential on foreign earnings | | 178 | | | 8.5 | | | 145 | | | 5.7 | | | 206 | | | 7.4 | | | Net impact related to the implementation of the Tax Reform Act | | 0 | | | 0 | | | 0 | | | 0 | | | (5) | | | (0.2) | | | Net impact related to the India Tax Law | | 0 | | | 0 | | | 21 | | | 0.8 | | | 0 | | | 0 | | | Recognition of previously unrecognized income tax benefits related to uncertain tax positions | | 0 | | | 0 | | | 0 | | | 0 | | | (12) | | | (0.4) | | | Credits and other incentives | | (51) | | | (2.4) | | | (57) | | | (2.2) | | | (19) | | | (0.7) | | | Reversal of indefinite reinvestment assertion | | 140 | | | 6.6 | | | 0 | | | 0 | | | 0 | | | 0 | | | Other | | (7) | | | (0.3) | | | 31 | | | 1.2 | | | 31 | | | 1.1 | | | Total provision for income taxes | | $ | 704 | | | 33.6 | | | $ | 643 | | | 25.3 | | | $ | 698 | | | 25.0 | |
Our Indian subsidiaries are primarily export-oriented and, through March 31, 2022, benefited from certain income tax holiday benefits granted by the government of India for export activities conducted within SEZs. In December 2019, India enacted the India Tax Law, which enables Indian companies to elect to be taxed at a lower income tax rate of 25.17%, as compared to the otherwise applicable income tax rate of 34.94%. Once a company elects into the lower income tax rate, a company may not benefit from any income tax holidays associated with SEZs and certain other tax incentives and carryforwards, and may not reverse its election. We elected into the new tax regime starting with the India fiscal year beginning on April 1, 2022, and as a result, there was no impact from income tax holidays on our income tax provision or net income for the year ended December 31, 2023. For the years ended December 31, 2022 and 2021, the effect of the income tax holidays granted by the Indian government was to reduce the overall income tax provision and increase net income by $6 million and $36 million, respectively, and increase diluted EPS by $0.01 and $0.07, respectively. During 2023, we reached an agreement with the IRS, which settled tax years 2017 and 2018, as well as a settlement related to U.S. state income taxes, each of which decreased our effective income tax rate for 2023. The significant components of deferred income tax assets and liabilities recorded on the consolidated statements of financial position were as follows as of December 31: | | 2020 | | 2019 | | (in millions) | | (in millions) | | (in millions) | | 2023 | | 2022 | | Deferred income tax assets: | Deferred income tax assets: | | | Net operating losses | Net operating losses | | $ | 36 | | | $ | 27 | | | Revenue recognition | | 41 | | | 39 | | | Net operating losses | | | Net operating losses | | | Revenue recognition (including intercompany revenue) | | | Compensation and benefits | Compensation and benefits | | 259 | | | 171 | | | | MAT and credit carryforwards | | 109 | | | 307 | | | Credit carryforwards | | | Credit carryforwards | | | Credit carryforwards | | | | Expenses not currently deductible | Expenses not currently deductible | | 147 | | | 352 | | | Expenses not currently deductible | | | Expenses not currently deductible | | | | 592 | | | 896 | | | | 1,038 | | | | 1,038 | | | | 1,038 | | | Less: valuation allowance | Less: valuation allowance | | (29) | | | (24) | | | Deferred income tax assets, net | Deferred income tax assets, net | | 563 | | | 872 | | | Deferred income tax liabilities: | Deferred income tax liabilities: | | | | | | Depreciation and amortization | | | Depreciation and amortization | | | Depreciation and amortization | Depreciation and amortization | | 198 | | | 187 | | | Deferred costs | Deferred costs | | 105 | | | 110 | | | Other | Other | | 21 | | | 25 | | | Deferred income tax liabilities | Deferred income tax liabilities | | 324 | | | 322 | | | Net deferred income tax assets | Net deferred income tax assets | | $ | 239 | | | $ | 550 | |
At December 31, 2020,2023, we had foreign and U.S. net operating loss carryforwards of approximately $55$128 million and $98$103 million, respectively. We have recorded valuation allowances on certain net operating loss carryforwards. As of December 31, 2020 and 2019, deferred income tax assets related to the MAT carryforwards were $98 million and $176 million, respectively. The calculation of the MAT includes all profits realized by our Indian subsidiaries and any MAT paid is creditable against future corporate income tax, subject to certain limitations. Our Indian subsidiaries are primarily export-oriented and are eligible for certain income tax holiday benefits granted by the government of India for export activities conducted within SEZs for periods of up to 15 years. Our SEZ income tax holiday benefits are currently scheduled to expire in whole or in part through the year 2028 and may be extended on a limited basis for an additional five years per unit if certain reinvestment criteria are met. Our Indian profits ineligible for SEZ benefits are subject to corporate income tax at the rate of 34.94%. In addition, all Indian profits, including those generated within SEZs, are subject to the MAT. The current rate of MAT is 17.47%. For the years ended December 31, 2020, 2019 and 2018, the effect of the income tax holidays granted by the Indian government was to reduce the overall income tax provision and increase net
| | | | | | | | | | Cognizant | F-28 | December 31, 2023 Form 10-K |
incomeProvisions enacted in the Tax Reform Act in December 2017 related to the capitalization of research and experimental expenditures became effective on January 1, 2022. These provisions require us to capitalize research and experimental expenditures and amortize them for tax purposes over five or fifteen years, depending on where the research is conducted. Previously these expenses could be deducted in the year incurred. The implementation of these provisions increased our deferred tax asset in the United States on a year-over-year basis by $48 million, $90approximately $206 million and $146 million, respectively, and increase diluted EPS by $0.09, $0.16 and $0.25, respectively.
In December 2019, the Government of India enacted the India Tax Law effective retroactively to April 1, 2019 that enables Indian companies to elect to be taxed at a lower income tax rate of 25.17%, as compared to the current income tax rate of 34.94%. Once a company elects into the lower income tax rate, a company may not benefit from any tax holidays associated with SEZs and certain other tax incentives, including MAT carryforwards, and may not reverse its election. Our current intent is to elect into the new tax regime once our MAT carryforwards are fully or substantially utilized. While our existing MAT carryforwards expire between March 2027 and March 2032, we expect to fully or substantially utilize our existing MAT carryforwards in or after the India financial year starting April 1, 2022. Our intent is based on a number of assumptions and financial projections. An election into the new tax law regime prior to utilization of our MAT carryforwards would result in a write-off of any remaining deferred income tax assets relating to the MAT carryforwards. As a result of the enactment of the India Tax Law, we recorded a one-time net income tax expense of $21$300 million in 2019, due to the revaluation to the lower income tax rate of our India net deferred income tax assets that are expected to reverse after we expect to elect into the new tax regime.2023 and 2022, respectively.
We conduct business globally and file income tax returns in the United States, including federal and state, as well as various foreign jurisdictions. Tax years that remain subject to examination by the IRS are 20122019 and onward, and years that remain subject to examination by state authorities vary by state. Years under examination by foreign tax authorities are 20012003 and onward. In addition, transactions between our affiliated entities are arranged in accordance with applicable transfer pricing laws, regulations and relevant guidelines. As a result, and due to the interpretive nature of certain aspects of these laws and guidelines, we have pending applications for APAs before the taxing authorities in some of our most significant jurisdictions. We record incremental tax expense, based upon the more-likely-than-not standard, for any uncertain tax positions. In addition, when applicable, we adjust the previously recorded income tax expense to reflect examination results when the position is effectively settled or otherwise resolved. Our ongoing evaluations of the more-likely-than-not outcomes of the examinations and related tax positions require judgment and can result in adjustments that increase or decrease our effective income tax rate, as well as impact our operating results. The specific timing of when the resolution of each tax position will be reached is uncertain. Changes in unrecognized income tax benefits were as follows for the years ended December 31: | | 2020 | | 2019 | | 2018 | | (in millions) | | (in millions) | | (in millions) | | 2023 | | 2022 | | 2021 | | Balance, beginning of year | Balance, beginning of year | | $ | 152 | | | $ | 117 | | | $ | 97 | | | Additions based on tax positions related to the current year | Additions based on tax positions related to the current year | | 28 | | | 22 | | | 8 | | | Additions for tax positions of prior years | Additions for tax positions of prior years | | 10 | | | 14 | | | 19 | | | Additions for tax positions of acquired subsidiaries | Additions for tax positions of acquired subsidiaries | | 3 | | | 0 | | | 6 | | | | Reductions for tax positions due to lapse of statutes of limitations | Reductions for tax positions due to lapse of statutes of limitations | | 0 | | | 0 | | | (12) | | | Reductions for tax positions of prior years | | 0 | | | (1) | | | 0 | | | Reductions for tax positions due to lapse of statutes of limitations | | | Reductions for tax positions due to lapse of statutes of limitations | | | Reductions for tax positions related to prior years | | | Settlements | Settlements | | 0 | | | 0 | | | 0 | | | Foreign currency exchange movement | Foreign currency exchange movement | | 0 | | | 0 | | | (1) | | | Balance, end of year | Balance, end of year | | $ | 193 | | | $ | 152 | | | $ | 117 | |
In the third quarter of 2022, we recognized an income tax benefit of $36 million related to a specific uncertain tax position that was previously unrecognized in our prior year consolidated financial statements. The recognition of the benefit in the third quarter of 2022 was based on management’s reassessment regarding whether this unrecognized tax benefit met the more-likely-than-not threshold in light of the lapse in the statute of limitations as to a portion of such benefit. In 2021, we reached an agreement with the IRS, which settled tax years 2012 through 2016. As a result of this settlement, in the first quarter of 2021, we recorded a $14 million discrete benefit to the provision for income taxes. The unrecognized income tax benefits would affect our effective income tax rate, if recognized. While the Company believes uncertain tax positions may be settled or resolved within the next twelve months, it is difficult to estimate the income tax impact of these potential resolutions at this time. We recognize accrued interest and any penalties associated with uncertain tax positions as part of our provision for income taxes. The total amount of accrued net interest and penalties at both December 31, 20202023 and 20192022 was approximately $22$33 million, and $16 million, respectively, and relatesrelated to U.S. and foreign tax matters. The amountstotal amount of net interest and penalties recorded in the provision for income taxes in 2020, 2019each of 2023, 2022 and 2018 were2021 was immaterial.
| | | | | | | | | | Cognizant | F-29 | December 31, 2023 Form 10-K |
| | | | | | | | | | | | | | | | Note 12 — Derivative Financial Instruments |
In the normal course of business, we use foreign exchange forward and option contracts to manage foreign currency exchange rate risk. Derivatives may give rise to credit risk from the possible non-performance by counterparties. Credit risk is limited to the fair value of those contracts that are favorable to us. We have limited our credit risk by limiting the amount of credit exposure with any one financial institution and conducting ongoing evaluation of the creditworthiness of the financial institutions with which we do business. In addition, all the assets and liabilities related to ourthe foreign exchange derivative contracts set forth in the below table are subject to master netting arrangements, such as the International Swaps and Derivatives Association Master Agreement, with each individual counterparty. These master netting arrangements generally provide for net settlement of all outstanding contracts with the counterparty in the case of an event of default or a termination event. We have presented all the assets and liabilities related to ourthe foreign exchange derivative contracts, as applicable, on a gross basis, with no offsets, in our consolidated statements of financial position. There is no financial collateral (including cash collateral) posted or received by us related to ourthe foreign exchange derivative contracts. The following table provides information on the location and fair values of derivative financial instruments included in our consolidated statements of financial position as of December 31: | | | | | | 2020 | | 2019 | | (in millions) | | (in millions) | | | | 2023 | | 2022 | | Designation of Derivatives | Designation of Derivatives | | Location on Statement of
Financial Position | | Assets | | Liabilities | | Assets | | Liabilities | Designation of Derivatives | | Location on Statement of
Financial Position | | Assets | | Liabilities | | Assets | | Liabilities | | | | | (in millions) | | Foreign exchange forward and option contracts – Designated as cash flow hedging instruments | Foreign exchange forward and option contracts – Designated as cash flow hedging instruments | | Other current assets | | $ | 45 | | | $ | — | | | $ | 32 | | | $ | — | | | Other noncurrent assets | | 26 | | | — | | | 8 | | | — | | | Accrued expenses and other current liabilities | | — | | | 0 | | | — | | | 7 | | | Other noncurrent liabilities | | — | | | 0 | | | — | | | 2 | | | Total | | 71 | | | 0 | | | 40 | | | 9 | | | Foreign exchange forward contracts - Not designated as cash flow hedging instruments | | Other current assets | | 1 | | | — | | | 3 | | | — | | | Accrued expenses and other current liabilities | | — | | | 1 | | | — | | | 1 | | | Total | | 1 | | | 1 | | | 3 | | | 1 | | | | Other noncurrent assets | | | | Accrued expenses and other current liabilities | | | | Other noncurrent liabilities | | | Total | Total | | $ | 72 | | | $ | 1 | | | $ | 43 | | | $ | 10 | | | Foreign exchange forward contracts - Not designated as hedging instruments | | | | Accrued expenses and other current liabilities | | | | Total | | | Total | |
Cash Flow Hedges We have entered into a series of foreign exchange derivative contracts that are designated as cash flow hedges of Indian rupee denominated payments in India. These contracts are intended to partially offset the impact of movement of the Indian rupee against the U.S. dollar on future operating costs and are scheduled to mature each month during 20212024 and 2022.2025. The changes in fair value of these contracts are initially reported in "Accumulated other comprehensive income (loss)" in our consolidated statements of financial position and are subsequently reclassified to earnings within the captions "Cost of revenues" and "Selling, general and administrative expenses" in our consolidated statements of operations in the same period thatthat the forecasted Indian rupee denominated payments are recorded in earnings. As of December 31, 2020,2023, we estimate that $35$6 million, net of tax, of the net gains relatedrelated to derivatives designated as cash flow hedges reported in the caption "Accumulated other comprehensive income (loss)" in our consolidated statements of financial position is expected to be reclassified into earnings within the next 12 months.
The notional value of our outstanding contracts by year of maturity and the net unrealized gains and losses included in the caption "Accumulated other comprehensive income (loss)" in our consolidated statements of financial position, for such contracts werewas as follows as of December 31: | | | | | | | | | | | | | 2020 | | 2019 | | (in millions) | | 2020 | $ | 0 | | | $ | 1,505 | | | 2021 | 1,470 | | | 883 | | | 2022 | 803 | | | 0 | | Total notional value of contracts outstanding (1) | $ | 2,273 | | | $ | 2,388 | | | Net unrealized gains included in accumulated other comprehensive income (loss), net of taxes | $ | 55 | | | $ | 26 | |
| | | | | | | | | | | | | (in millions) | 2023 | | 2022 | | 2023 | $ | — | | | $ | 1,865 | | | 2024 | 1,878 | | | 1,010 | | | 2025 | 1,020 | | | — | | Total notional value of contracts outstanding (1) | $ | 2,898 | | | $ | 2,875 | |
(1)Includes $133$45 million notional value of option contracts as of December 31, 2020,2023, with the remaining notional value related to forward contracts. There were no option contracts outstanding as of December 31, 2022. | | | | | | | | | | Cognizant | F-30 | December 31, 2023 Form 10-K |
The following table provides information on the location and amounts of pre-tax losses and gains on our cash flow hedges for the year ended December 31: | | | | | | | | | | | | | | | | | | | | | | | | | | | | | | | | Change in
Derivative Gains Recognized
in Accumulated Other
Comprehensive Income (Loss)
(effective portion) | | Location of Net Derivative
Gains Reclassified
from Accumulated Other
Comprehensive Income (Loss)
into Income
(effective portion) | | Net Gains Reclassified
from Accumulated Other
Comprehensive Income (Loss)
into Income
(effective portion) | | | 2020 | | 2019 | | | | 2020 | | 2019 | | (in millions) | | Foreign exchange forward and option contracts – Designated as cash flow hedging instruments | $ | 39 | | | $ | 39 | | | Cost of revenues | | $ | 3 | | | $ | 3 | | | | | | | Selling, general and administrative expenses | | 0 | | | 1 | | | | | | | Total | | $ | 3 | | | $ | 4 | |
| | | | | | | | | | | | | | | | | | | | | | | | | | | | | | | (in millions) | Change in Derivative Gains and Losses Recognized in Accumulated Other Comprehensive Income (Loss) (effective portion) | | Location of Net (Losses) Reclassified from Accumulated Other Comprehensive Income (Loss) into Income (effective portion) | | Net (Losses) Reclassified from Accumulated Other Comprehensive Income (Loss) into Income (effective portion) | | | 2023 | | 2022 | | | | 2023 | | 2022 | | | | Foreign exchange forward and option contracts – Designated as cash flow hedging instruments | $ | 55 | | | $ | (153) | | | Cost of revenues | | $ | (23) | | | $ | (13) | | | | | | | SG&A expenses | | (3) | | | (1) | | | | | | | Total | | $ | (26) | | | $ | (14) | |
The activity related to the change in net unrealized gains and losses on ourthe cash flow hedges included in "Accumulated other comprehensive income (loss)" in our consolidated statements of stockholders' equity is presented in Note 14.
Other Derivatives We use foreign exchange forward contracts to provide an economic hedge against balance sheet exposures to certain monetary assets and liabilities denominated in currencies other than the functional currency of our foreign subsidiaries, primarily the Indian rupee, the British Pound and the Euro.subsidiaries. We entered into foreign exchange forward contracts that are scheduled to mature in 2021.the first quarter of 2024. Realized gains or losses and changes in the estimated fair value of these derivative financial instruments are recorded in the caption "Foreign currency exchange gains (losses), net" onin our consolidated statements of operations. Additional information related to our outstanding foreign exchange forward contracts not designated as hedging instruments was as follows as of December 31: | | | | | | | | | | | | | | | | | | | | | | | | | 2020 | | 2019 | | Notional | | Fair Value | | Notional | | Fair Value | | (in millions) | | Contracts outstanding | $ | 637 | | | $ | 0 | | | $ | 702 | | | $ | 2 | |
| | | | | | | | | | | | | | | | | | | | | | | | | (in millions) | 2023 | | 2022 | | Notional | | Fair Value | | Notional | | Fair Value | | Contracts outstanding | $ | 1,317 | | | $ | (8) | | | $ | 1,433 | | | $ | (1) | |
The following table provides information on the location and amounts of realized and unrealized pre-tax (losses) gains and losses on our other derivative financial instruments for the year ended December 31: | | | | | | | | | | | | | | | | | | | | | | | | Location of Net (Losses) Gains
on Derivative Instruments | | Amount of Net (Losses) Gains
on Derivative Instruments | | | | | | 2020 | | 2019 | | | | | (in millions) | | Foreign exchange forward contracts - Not designated as hedging instruments | | Foreign currency exchange gains (losses), net | | $ | (63) | | | $ | 8 | |
| | | | | | | | | | | | | | | | | | | | | | (in millions) | | Location of Net (Losses) Gains on Derivative Instruments | | Amount of Net (Losses) Gains on Derivative Instruments | | | | | | 2023 | | 2022 | | Foreign exchange forward contracts - Not designated as hedging instruments | | Foreign currency exchange gains (losses), net | | $ | (40) | | | $ | 23 | |
The related cash flow impacts of all of ourthe derivative activities are reflected as cash flows from operating activities.
| | | | | | | | | | Cognizant | F-31 | December 31, 2023 Form 10-K |
| | | | | | | | | | | | | | | | Note 13 — Fair Value Measurements |
We measure our cash equivalents, certain investments, contingent consideration liabilities and foreign exchange forward and option contracts at fair value. The authoritative guidance defines fairFair value asis the exit price, or the amount that would be received to sell an asset or paid to transfer a liability in an orderly transaction between market participants as of the measurement date. The authoritative guidance also establishes a fair value hierarchy that is intended to increase consistency and comparability in fair value measurements and related disclosures. The fair value hierarchy is based on inputs to valuation techniques that are used to measure fair value that are either observable or unobservable. Observable inputs reflect assumptions market participants would use in pricing an asset or liability based on market data obtained from independent sources while unobservable inputs reflect a reporting entity’s pricing based upon their own market assumptions. The fair value hierarchy consists of the following three levels: •Level 1 – Inputs are quoted prices in active markets for identical assets or liabilities. •Level 2 – Inputs are quoted prices for similar assets or liabilities in an active market, quoted prices for identical or similar assets or liabilities in markets that are not active, inputs other than quoted prices that are observable and market-corroborated inputs which are derived principally from or corroborated by observable market data. •Level 3 – Inputs are derived from valuation techniques in which one or more significant inputs or value drivers are unobservable.
The following table summarizes ourthe financial assets and (liabilities) measured at fair value on a recurring basis as of December 31, 2020: | | | | | | | | | | | | | | | | | | | | | | | | | Level 1 | | Level 2 | | Level 3 | | Total | | (in millions) | | Cash equivalents: | | | | | | | | | Money market funds | $ | 209 | | | $ | — | | | $ | — | | | $ | 209 | | | Time deposits | — | | | 203 | | — | | | 203 | | | Commercial paper | — | | | 200 | | — | | | 200 | | | Short-term investments: | | | | | | | | | Time deposits | 0 | | | 3 | | | 0 | | | 3 | | | Equity investment security | 27 | | | 0 | | | 0 | | | 27 | | | Other current assets | | | | | | | | | Foreign exchange forward and option contracts | 0 | | | 46 | | | 0 | | | 46 | | | Long-term investments: | | | | | | | | Time deposits (1) | — | | | 405 | | | — | | | 405 | | | Other noncurrent assets | | | | | | | | | Foreign exchange forward and option contracts | 0 | | | 26 | | | 0 | | | 26 | | | Accrued expenses and other current liabilities: | | | | | | | | | Foreign exchange forward contracts | 0 | | | (1) | | | 0 | | | (1) | | | Contingent consideration liabilities | 0 | | | 0 | | | (11) | | | (11) | | | Other noncurrent liabilities | | | | | | | | | | | | | | | | | Contingent consideration liabilities | 0 | | | 0 | | | (43) | | | (43) | |
| | | | | | | | | | | | | | | | | | | | | | | | | (in millions) | Level 1 | | Level 2 | | Level 3 | | Total | | Cash equivalents: | | | | | | | | | Money market funds | $ | 327 | | | $ | — | | | $ | — | | | $ | 327 | | | Time deposits | — | | | 834 | | | — | | | 834 | | | | | | | | | | | Short-term investments: | | | | | | | | | | | | | | | | | Equity investment security | 11 | | | — | | | — | | | 11 | | | | | | | | | | | | | | | | | | | Other current assets | | | | | | | | | Foreign exchange forward contracts | — | | | 15 | | | — | | | 15 | | | Long-term investments: | | | | | | | | Restricted time deposits (1) | — | | | 355 | | | — | | | 355 | | | Other noncurrent assets | | | | | | | | | Foreign exchange forward contracts | — | | | 5 | | | — | | | 5 | | | Accrued expenses and other current liabilities: | | | | | | | | | Foreign exchange forward contracts | — | | | (14) | | | — | | | (14) | | | Contingent consideration liabilities | — | | | — | | | (30) | | | (30) | | | Other noncurrent liabilities | | | | | | | | | Foreign exchange forward contracts | — | | | (1) | | | — | | | (1) | | | | | | | | | |
(1) Balance represents restricted time deposits. See Note 11.
| | | | | | | | | | Cognizant | F-32 | December 31, 2023 Form 10-K |
The following table summarizes ourthe financial assets and (liabilities) measured at fair value on a recurring basis as of December 31, 2019:2022: | | | | | | | | | | | | | | | | | | | | | | | | | Level 1 | | Level 2 | | Level 3 | | Total | | (in millions) | | Cash equivalents: | | | | | | | | | Money market funds | $ | 1,646 | | | $ | 0 | | | $ | 0 | | | $ | 1,646 | | | Short-term investments: | | | | | | | | Time deposits(1) | 0 | | | 466 | | | 0 | | | 466 | | | Equity investment security | 26 | | | 0 | | | 0 | | | 26 | | | | | | | | | | | | | | | | | | | | | | | | | | | | | | | | | | | | | | | | | | | | | | | | | | | Other current assets: | | | | | | | | | Foreign exchange forward contracts | 0 | | | 35 | | | 0 | | | 35 | | | Other noncurrent assets: | | | | | | | | | Foreign exchange forward contracts | 0 | | | 8 | | | 0 | | | 8 | | | Accrued expenses and other current liabilities: | | | | | | | | | Foreign exchange forward contracts | 0 | | | (8) | | | 0 | | | (8) | | | Contingent consideration liabilities | 0 | | | 0 | | | (8) | | | (8) | | | Other noncurrent liabilities: | | | | | | | | | Foreign exchange forward contracts | 0 | | | (2) | | | 0 | | | (2) | | | Contingent consideration liabilities | 0 | | | 0 | | | (30) | | | (30) | |
| | | | | | | | | | | | | | | | | | | | | | | | | (in millions) | Level 1 | | Level 2 | | Level 3 | | Total | | Cash equivalents: | | | | | | | | | Money market funds | $ | 367 | | | $ | — | | | $ | — | | | $ | 367 | | | Time deposits | — | | | 359 | | | — | | | 359 | | | Commercial paper | — | | | 512 | | | — | | | 512 | | | Short-term investments: | | | | | | | | | Time deposits | — | | | 51 | | | — | | | 51 | | | Equity investment security | 10 | | | — | | | — | | | 10 | | | Available-for-sale investment securities: | | | | | | | | | Certificates of deposit and commercial paper | — | | | 225 | | | — | | | 225 | | | Other current assets: | | | | | | | | | Foreign exchange forward contracts | — | | | 5 | | | — | | | 5 | | | Long-term investments | | | | | | | | Restricted time deposits (1) | — | | | 357 | | | — | | | 357 | | | Other noncurrent assets: | | | | | | | | | Foreign exchange forward contracts | — | | | 1 | | | — | | | 1 | | | Accrued expenses and other current liabilities: | | | | | | | | | Foreign exchange forward contracts | — | | | (58) | | | — | | | (58) | | | Contingent consideration liabilities | — | | | — | | | (9) | | | (9) | | | Other noncurrent liabilities: | | | | | | | | | Foreign exchange forward contracts | — | | | (17) | | | — | | | (17) | | | Contingent consideration liabilities | — | | | — | | | (13) | | | (13) | |
(1)Includes $414 million in restricted time deposits. See Note 11
The following table summarizes the changes in Level 3 contingent consideration liabilities:
| | | | | | | | | | | | | | | | | 2020 | | 2019 | | | (in millions) | | Beginning balance | | $ | 38 | | | $ | 23 | | | Initial measurement recognized at acquisition | | 42 | | | 33 | | | Change in fair value recognized in SG&A expenses | | (23) | | | (4) | | | Payments | | (3) | | | (14) | | | Ending balance | | $ | 54 | | | $ | 38 | |
| | | | | | | | | | | | | | | | (in millions) | | 2023 | | 2022 | | Beginning balance | | $ | 22 | | | $ | 35 | | | Initial measurement recognized at acquisition | | — | | | 1 | | | Change in fair value recognized in SG&A expenses | | 17 | | | (1) | | | Payments and other adjustments | | (9) | | | (13) | | | Ending balance | | $ | 30 | | | $ | 22 | |
We measure the fair value of money market funds based on quoted prices in active markets for identical assets and measure the fair value of our equity investment security based on the published daily net asset value at which investors can freely subscribe to or redeem from the fund. The fair value of certificates of deposit and commercial paper is measured based on relevant trade data, dealer quotes, or model-driven valuations using significant inputs derived from or corroborated by observable market data, such as yield curves and credit spreads. The carrying value of the time deposits approximated fair value as of each of December 31, 20202023 and 2019.
We estimate the fair value of each foreign exchange forward contract by using a present value of expected cash flows model. This model calculates the difference between the current market forward price and the contracted forward price for each foreign exchange forward contract and applies the difference in the rates to each outstanding contract. The market forward rates include a discount and credit risk factor. We estimate the fair value of each foreign exchange option contract by using a variant of the Black-Scholes model. This model uses present value techniques and reflects the time value and intrinsic value based on observable market rates. We estimate the fair value of our contingent consideration liabilities associated with our acquisitions using a variation of the income approach, which utilizes one or more significant inputs that are unobservable. This approach calculates the fair value of such liabilities based on the probability-weighted expected performance of the acquired entity against the target performance metric, discounted to present value when appropriate. During the years ended December 31, 2020, 20192023, 2022 and 20182021 there were no transfers among Level 1, Level 2 or Level 3 financial assets and liabilities. | | | | | | | | | | Cognizant | F-33 | December 31, 2023 Form 10-K |
| | | | | | | | | | | | | | | | Note 14 — Accumulated Other Comprehensive Income (Loss) |
Changes in "Accumulated other comprehensive income (loss)" by component were as follows for the year ended December 31, 2020:2023: | | | 2020 | | | Before Tax
Amount | | Tax
Effect | | Net of Tax
Amount | | (in millions) | | 2023 | | | 2023 | | (in millions) | | (in millions) | Before Tax
Amount | | Tax
Effect | | Net of Tax
Amount | | Foreign currency translation adjustments: | Foreign currency translation adjustments: | | | Beginning balance | | | Beginning balance | | | Beginning balance | Beginning balance | $ | (63) | | | $ | (1) | | | $ | (64) | | | Change in foreign currency translation adjustments | Change in foreign currency translation adjustments | 119 | | | 0 | | | 119 | | | Ending balance | Ending balance | $ | 56 | | | $ | (1) | | | $ | 55 | | | | Unrealized gains on cash flow hedges: | | | | | | | Unrealized (losses) gains on cash flow hedges: | | | | Unrealized (losses) gains on cash flow hedges: | | | | Unrealized (losses) gains on cash flow hedges: | | | Beginning balance | | | Beginning balance | | | Beginning balance | Beginning balance | $ | 31 | | | $ | (5) | | | $ | 26 | | | Unrealized gains arising during the period | Unrealized gains arising during the period | 39 | | | (8) | | | 31 | | | Reclassifications of net (gains) to: | | | Reclassifications of net losses to: | | | Cost of revenues | Cost of revenues | (3) | | | 1 | | | (2) | | | | Cost of revenues | | | Cost of revenues | | | SG&A expenses | | | Net change | Net change | 36 | | | (7) | | | 29 | | | Ending balance | Ending balance | $ | 67 | | | $ | (12) | | | $ | 55 | | | Accumulated other comprehensive income (loss): | Accumulated other comprehensive income (loss): | | | | | | | Beginning balance | Beginning balance | $ | (32) | | | $ | (6) | | | $ | (38) | | | Beginning balance | | | Beginning balance | | | Other comprehensive income (loss) | Other comprehensive income (loss) | 155 | | | (7) | | | 148 | | | Ending balance | Ending balance | $ | 123 | | | $ | (13) | | | $ | 110 | |
Changes in "Accumulated other comprehensive income (loss)" by component were as follows for the years ended December 31, 20192022 and 2018:2021: | | | 2019 | | 2018 | | | Before Tax
Amount | | Tax
Effect | | Net of Tax
Amount | | Before Tax
Amount | | Tax
Effect | | Net of Tax
Amount | | (in millions) | | | 2022 | | | | 2022 | | 2021 | | (in millions) | | (in millions) | | Before Tax
Amount | | Tax
Effect | | Net of Tax
Amount | | Before Tax
Amount | | Tax
Effect | | Net of Tax
Amount | | Foreign currency translation adjustments: | Foreign currency translation adjustments: | | | Beginning balance | | | Beginning balance | | | Beginning balance | Beginning balance | $ | (108) | | | $ | 5 | | | $ | (103) | | | $ | (38) | | | $ | 0 | | | $ | (38) | | | Change in foreign currency translation adjustments | Change in foreign currency translation adjustments | 45 | | | (6) | | | 39 | | | (70) | | | 5 | | | (65) | | | Ending balance | Ending balance | $ | (63) | | | $ | (1) | | | $ | (64) | | | $ | (108) | | | $ | 5 | | | $ | (103) | | | Unrealized (losses) on available-for-sale investment securities: | | | | | | | | | | | | | Unrealized gains (losses) on cash flow hedges: | | | Beginning balance | Beginning balance | $ | (12) | | | $ | 4 | | | $ | (8) | | | $ | (11) | | | $ | 4 | | | $ | (7) | | | Cumulative effect of change in accounting principle | — | | | — | | | — | | | — | | | (1) | | | (1) | | | Net unrealized gains (losses) arising during the period | 13 | | | (4) | | | 9 | | | (5) | | | 2 | | | (3) | | | Reclassification of net (gains) losses to Other, net | (1) | | | 0 | | | (1) | | | 4 | | | (1) | | | 3 | | | Net change | 12 | | | (4) | | | 8 | | | (1) | | | 0 | | | (1) | | | Ending balance | $ | 0 | | | $ | 0 | | | $ | 0 | | | $ | (12) | | | $ | 4 | | | $ | (8) | | | Unrealized (loses) gains on cash flow hedges: | | | | | | | | | | | | | Beginning balance | Beginning balance | $ | (4) | | | $ | 1 | | | $ | (3) | | | $ | 154 | | | $ | (39) | | | $ | 115 | | | Unrealized gains (losses) arising during the period | 39 | | | (7) | | | 32 | | | (87) | | | 23 | | | (64) | | | Reclassifications of net gains to: | | | Beginning balance | | | Unrealized (losses) gains arising during the period | | | Reclassifications of net losses (gains) to: | | | Cost of revenues | | | Cost of revenues | | | Cost of revenues | Cost of revenues | (3) | | | 1 | | | (2) | | | (61) | | | 15 | | | (46) | | | SG&A expenses | SG&A expenses | (1) | | | 0 | | | (1) | | | (10) | | | 2 | | | (8) | | | Net change | Net change | 35 | | | (6) | | | 29 | | | (158) | | | 40 | | | (118) | | | Ending balance | Ending balance | $ | 31 | | | $ | (5) | | | $ | 26 | | | $ | (4) | | | $ | 1 | | | $ | (3) | | | Accumulated other comprehensive income (loss): | Accumulated other comprehensive income (loss): | | | | | | | | | | | | | Beginning balance | Beginning balance | $ | (124) | | | $ | 10 | | | $ | (114) | | | $ | 105 | | | $ | (35) | | | $ | 70 | | | Beginning balance | | | Beginning balance | | | Other comprehensive income (loss) | Other comprehensive income (loss) | 92 | | | (16) | | | 76 | | | (229) | | | 45 | | | (184) | | | Ending balance | Ending balance | $ | (32) | | | $ | (6) | | | $ | (38) | | | $ | (124) | | | $ | 10 | | | $ | (114) | |
| | | | | | | | | | Cognizant | F-34 | December 31, 2023 Form 10-K |
| | | | | | | | | | | | | | | | Note 15 — Commitments and Contingencies |
We are involved in various claims and legal proceedings arising in the ordinary course of business. We accrue a liability when a loss is considered probable and the amount can be reasonably estimated. When a material loss contingency is reasonably possible but not probable, we do not record a liability, but instead disclose the nature and the amount of the claim, and an estimate of the loss or range of loss, if such an estimate can be made. Legal fees are expensed as incurred. While we do not expect that the ultimate resolution of any existing claims and proceedings (other than the specific matters described below, if decided adversely), individually or in the aggregate, will have a material adverse effect on our financial position, an unfavorable outcome in some or all of these proceedings could have a material adverse impact on results of operations or cash flows for a particular period. This assessment is based on our current understanding of relevant facts and circumstances. As such, our view of these matters is subject to inherent uncertainties and may change in the future.
On January 15, 2015, Syntel sued TriZetto and Cognizant in the United States District Court for the Southern District of New York.USDC-SDNY. Syntel’s complaint alleged breach of contract against TriZetto, and tortious interference and misappropriation of trade secrets against Cognizant and TriZetto, stemming from Cognizant’s hiring of certain former Syntel employees. Cognizant and TriZetto countersued on March 23, 2015, for breach of contract, misappropriation of trade secrets and tortious interference, based on Syntel’s misuse of TriZetto confidential information and abandonment of contractual obligations. Cognizant and TriZetto subsequently added federal Defend Trade Secrets ActDTSA and copyright infringement claims for Syntel’s misuse of TriZetto’s proprietary technology. The parties’ claims were narrowed by the court and the case was tried before a jury, which on October 27, 2020, returned a verdict in favor of Cognizant in the amount of $854$855 million, including $570 million in punitive damages. On April 20, 2021, the USDC-SDNY issued a post-trial order that, among other things, affirmed the jury’s award of $285 million in actual damages, but reduced the award of punitive damages from $570 million to $285 million, thereby reducing the overall damages award from $855 million to $570 million. The USDC-SDNY subsequently issued a final judgment consistent with the April 20th We expectorder. On May 26, 2021, Syntel filed a notice of appeal to appthe Second Circuit, and on June 3, 2021 the USDC-SDNY stayed execution of judgment pending appeal. ealOn May 25, 2023, the decisionSecond Circuit issued an opinion affirming in part and thus wevacating in part the judgment of the USDC-SDNY and remanding the case for further proceedings consistent with its opinion. The Second Circuit affirmed the judgment in all respects on liability but vacated the $570 million award that had been based on avoided development costs under the DTSA, and it remanded the case to the USDC-SDNY for further evaluation of damages. On June 23, 2023, the Second Circuit issued its mandate returning the case to the USDC-SDNY, and the proceedings there regarding damages remain ongoing. We will not record theany gain in our financial statements until it becomes realizable.
On February 28, 2019, a ruling of the SCI interpreting the India Defined Contribution Obligation altered historical understandings of the obligation, extending it to cover additional portions of the employee’s income. As a result, the ongoing contributions of our affected employees and the Company were required to be increased. In the first quarter of 2019, we accrued $117 million with respect to prior periods, assuming retroactive application of the Supreme Court’sSCI’s ruling, in "Selling, general and administrative expenses" in our audited consolidated statement of operations. There is significant uncertainty as to how the liability should be calculated as it is impacted by multiple variables, including the period of assessment, the application with respect to certain current and former employees and whether interest and penalties may be assessed. Since the ruling, a variety of trade associations and industry groups have advocated to the Indian government, highlighting the harm to the information technology sector, other industries and job growth in India that would result from a retroactive application of the ruling. It is possible the Indian government will review the matter and there is a substantial question as to whether the Indian government will apply the SCI’s ruling on a retroactive basis. As such, the ultimate amount of our obligation may be materially different from the amount accrued.
On October 5, 2016, October 27, 2016 and November 18, 2016, three putative securities class action complaints were filed in the United States District Court for the District of New Jersey, naming us and certain of our current and former officers as defendants. These complaints were consolidated into a single action and on April 7, 2017, the lead plaintiffs filed a consolidated amended complaint on behalf of a putative class of persons and entities who purchased our common stock during the period between February 27, 2015 and September 29, 2016, naming us and certain of our current and former officers as defendants and alleging violations of the Exchange Act, based on allegedly false or misleading statements related to potential violations of the FCPA, our business, prospects and operations, and the effectiveness of our internal controls over financial reporting and our disclosure controls and procedures. The lead plaintiffs seek an award of compensatory damages, among other relief, and their reasonable costs and expenses, including attorneys’ fees. Defendants filed a motion to dismiss the consolidated amended complaint on June 6, 2017. On August 8, 2018, the United States District Court for the District of New Jersey issued an order which granted the motion to dismiss in part, including dismissal of all claims against current officers of the Company, and denied them in part. On September 7, 2018, we filed a motion in the United States District Court for the District of New Jersey to certify the August 8, 2018 order for immediate appeal to the United States Court of Appeals for the Third Circuit pursuant to 28 U.S.C. § 1292(b). On October 18, 2018, the District Court issued an order granting our motion, and staying the action pending the outcome of our appeal petition to the Third Circuit. On October 29, 2018, we filed a petition for permission to appeal with the United States Court of Appeals for the Third Circuit. On March 6, 2019, the Third Circuit denied our petition without prejudice. In an order dated March 19, 2019, the District Court directed the lead plaintiffs to provide the defendants with a proposed amended complaint. On April 26, 2019, lead plaintiffs filed their second amended complaint. We filed a motion to dismiss the second amended complaint on June 10, 2019. On June 7, 2020, the District Court issued an order denying our motion to dismiss the second amended complaint. On July 10, 2020, we filed our answer to the second amended complaint. On July 23, 2020, the DOJ filed a motion on consent for leave to intervene and to stay all discovery through the conclusion of the criminal proceedings in United States v. Gordon J. Coburn and Steven Schwartz, Crim. No. 19-120 (KM), except for
documents produced by us to the DOJ in connection with those criminal proceedings. On July 24, 2020, the District Court granted the DOJ’s motion; and on that same day, we filed a motion in the District Court to certify the June 7, 2020 order for immediate appeal to the Third Circuit pursuant to 28 U.S.C. 1292(b), which motion is now fully briefed.
On October 31, 2016, November 15, 2016 and November 18, 2016, three putative shareholder derivative complaints were filed in New Jersey Superior Court, Bergen County, naming us, all of our then current directors and certain of our current and former officers at that time as defendants. These actions were consolidated in an order dated January 24, 2017. The complaints assert claims for breach of fiduciary duty, corporate waste, unjust enrichment, abuse of control, mismanagement, and/or insider selling by defendants. On March 16, 2017, the parties filed a stipulation deferring all further proceedings pending a final, non-appealable ruling on the then anticipated motion to dismiss the consolidated putative securities class action. On April 26, 2017, in lieu of ordering the stipulation filed by the parties, the New Jersey Superior Court deferred further proceedings by dismissing the consolidated putative shareholder derivative litigation without prejudice but permitting the parties to file a motion to vacate the dismissal in the future.
On February 22, 2017, April 7, 2017, and May 10, 2017 threeand March 11, 2019, four additional putative shareholder derivative complaints alleging similar claims were filed in the United States District Court for the District of New Jersey,USDC-NJ, naming us and certain of our current and former directors and officers at that time as defendants. These complaints asserted claims similar to thoseactions were consolidated in the previously-filed putative shareholder derivative actions. In an order dated June 20, 2017, the United States District Court for the District of New Jersey consolidated these actions into a single action, appointedMay 14, 2019. On August 3, 2020, lead plaintiff and lead counsel, and stayed all further proceedings pending a final, non-appealable ruling on the motions to dismiss the consolidated putative securities class action. On October 30, 2018, lead plaintiffplaintiffs filed a consolidated verified derivativeamended complaint.
On March 11, 2019, a seventh putative shareholder derivative The consolidated amended complaint was filed in the United States District Court for the District of New Jersey, naming us, certain of our current and former directors, and certain of our current and former officers as defendants. The complaint in that action asserts claims similar to those in the previously-filed putative shareholder derivative actions. On MayFebruary 14, 2019,2022, we and certain of our current and former directors and officers moved to dismiss the United States District Court forconsolidated amended complaint. On September 27, 2022, the DistrictUSDC-NJ granted those motions and
| | | | | | | | | | Cognizant | F-35 | December 31, 2023 Form 10-K |
dismissed the consolidated amended complaint in its entirety with prejudice. Plaintiffs filed a stipulationnotice of appeal on October 27, 2022.
On June 1, 2021, an eighth putative shareholder derivative complaint was filed in the USDC-NJ, naming us and certain of our current and former directors and officers at that (i) consolidated this action withtime as defendants. The complaint asserts claims similar to those in the previously-filed putative shareholder derivative suits that were previously filed in the United States District Court for the Districtactions. On March 31, 2022, we and certain of New Jersey;our current and (ii) stayed all of these suits pending order on the motionformer directors and officers moved to dismiss the second amended complaint incomplaint. On November 30, 2022, the securities class action. On August 3, 2020, lead plaintiffs filed an amended complaint.USDC-NJ denied without prejudice those motions. The USDC-NJ ordered the parties to conduct limited discovery related to the issue of whether our board of directors wrongfully refused the plaintiff’s earlier litigation demand and, after the conclusion of such limited discovery, to file targeted motions for summary judgment on the issue of wrongful refusal.
We are presently unable to predict the duration, scope or result of the consolidated putative securities class action,shareholder derivative actions. Although the Company continues to defend the putative shareholder derivative actions or any other lawsuits. As such, we are presently unable to develop a reasonable estimate of a possible loss or range of losses, if any, and thus have not recorded any accruals related to these matters. While the Company intends to defend the lawsuits vigorously, these lawsuits and any other relatedthese lawsuits are subject to inherent uncertainties, the actual cost of such litigation will depend upon many unknown factors and the outcome of the litigation is necessarily uncertain.
We have indemnification and expense advancement obligations pursuant to our bylaws and indemnification agreements with respect to certain current and former members of senior management and the Company’s board of directors. In connection with the matters that were the subject of our previously disclosed internal investigation, the DOJ and SEC investigations and the related litigation, we have received and expect to continue to receive requests under such indemnification agreements and our bylaws to provide funds for legal fees and other expenses. We have expensed such costs incurred through December 31, 2020.
We have maintainedThere are no amounts remaining available to us under applicable insurance policies for our ongoing indemnification and advancement obligations with respect to certain of our current and former officers and directors or incremental legal fees and officers insurance and have recordedan insurance receivable of $7 million and $20 million as of December 31, 2020 and 2019, respectively, in "Other current assets" on our consolidated statement of financial positionother expenses related to the recovery of a portion of the indemnification expenses and costs related to the putative securities class action complaints. We are unable to make a reliable estimate of the eventual cash flows by period related to the indemnification and expense advancement obligations described here.above matters.
See Note 11 for information relating to the ITD Dispute. Many of our engagements involve projects that are critical to the operations of our clients’ business and provide benefits that are difficult to quantify. Any failure in a client’s systems or our failure to meet our contractual obligations to our clients, including any breach involving a client’s confidential information or sensitive data, or our obligations under applicable laws or regulations could result in a claim for substantial damages against us, regardless of our responsibility for such failure. Although we attempt to contractually limit our liability for damages arising from negligent acts, errors, mistakes, or omissions in rendering our services, there can be no assurance that the limitations of liability set forth in our contracts will be enforceable in all instances or will otherwise protect us from liability for damages. Although we have general liability insurance coverage, including coverage for errors or omissions, thereomissions, we retain a significant portion of risk through our insurance deductibles and there can be no assurance that such coverage will cover all types of claims, continue
to be available on reasonable terms or will be available in sufficient amounts to cover one or more large claims, or that the insurer will not disclaim coverage as to any future claim. The successful assertion of one or more large claims against us that exceed or are not covered by our insurance coverage or changes in our insurance policies, including premium increases or the imposition of large deductible or co-insurance requirements, could have a material adverse effect on our business, results of operations, financial position and cash flows for a particular period.
In the normal course of business and in conjunction with certain client engagements, we have entered into contractual arrangements through which we may be obligated to indemnify clients or other parties with whom we conduct business with respect to certain matters. These arrangements can include provisions whereby we agree to hold the indemnified party and certain of their affiliated entities harmless with respect to third-party claims related to such matters as our breach of certain representations or covenants, our intellectual property infringement, our gross negligence or willful misconduct or certain other claims made against certain parties. Payments by us under any of these arrangements are generally conditioned on the client making a claim and providing us with full control over the defense and settlement of such claim. It is not possible to determine the maximum potential liability under these indemnification agreements due to the unique facts and circumstances involved in each particular agreement. Historically, we have not made material payments under these indemnification agreements and therefore they have not had a material impact on our operating results, financial position, or cash flows. However, if events arise requiring us to make payment for indemnification claims under our indemnification obligations in contracts we have entered, such payments could have a material adverse effect on our business, results of operations, financial position and cash flows for a particular period.
| | | | | | | | | | Cognizant | F-36 | December 31, 2023 Form 10-K |
| | | | | | | | | | | | | | | | Note 16 — Employee Benefits |
We contribute to defined contribution plans, in the United States and Europe, including 401(k) savings and supplemental retirement plans in the United States. Total expenses for our contributions to these plans, excluding the India plans described below, were $118$185 million, $117$172 million and $108$135 million for the years ended December 31, 2020, 20192023, 2022 and 2018,2021, respectively. WeIn addition, we maintain employee benefit plans that cover substantially all India-based employees. The employees’ provident fund, pension and family pension plans are statutorily defined contribution retirement benefit plans. Under the plans, employees contribute up to 12.0% of their eligible compensation, which is matched by an equal contribution by the Company. For these plans, we recognized a contribution expense of $98$149 million, $101$143 million and $88$121 million for the years ended December 31, 2020, 20192023, 2022 and 2018,2021, respectively. On February 28, 2019, a ruling of the SCI altered historical understandings of the obligation under these plans, extending them to cover additional portions of the employee’s income. In the first quarter of 2019, we accrued $117 million with respect to prior periods, assuming retroactive application of the SCI’s ruling, in "Selling, general and administrative expenses" in our consolidated statements of operations. See Note 15 for further information.We also maintain a gratuity plan in India that is a statutory post-employment benefit plan providing defined lump sum benefits. We make annual contributions to the employees’ gratuity fund established with a government-owned insurance corporation to fund a portion of the estimated obligation. Accordingly, ourOur liability for the gratuity plan reflected the undiscounted benefit obligation payable as of the balance sheet date, which was based upon the employees’ salary and years of service. As of December 31, 20202023 and 2019,2022, the amount accrued under the gratuity plan was $124$130 million and $135$99 million, which is net of fund assets of $186$221 million and $160$206 million, respectively. Expense recognized by us was $35$56 million, $38$45 million and $53$70 million for the years ended December 31, 2020, 20192023, 2022 and 2018,2021, respectively.
| | | | | | | | | | | | | | | | Note 17 — Stock-Based Compensation Plans |
The Company'sOur 2023 Incentive Plan provides for the issuance of a total of 25.0 million shares of Class A common stock to eligible employees, less (i) the number of shares granted under the 2017 Incentive Plan between March 24, 2023 and June 6, 2023, plus (ii) any shares subject to awards under the prior 2017 and 2009 Incentive Plans that are forfeited after June 6, 2023. The Purchase Plan provideprovides for the issuance of up to 48.850.0 million (plus any shares underlying outstanding awards that are forfeited under the 2009 Incentive Plan) and 40.0 million shares, respectively, of Class A common stock to eligible employees. The 20172023 Incentive Plan does not affect any awards outstanding under the 2009 Incentive Plan.prior plans. As of December 31, 2020,2023, we have 28.825.1 million and 5.911.5 million shares available for grant under the 20172023 Incentive Plan and the Purchase Plan, respectively.
The allocation of total stock-based compensation expense between cost of revenues, and selling, general and administrative expenses and restructuring charges as well as the related income tax benefit were as follows for the three years ended December 31: | | | | | | | | | | | | | | | | | | | | | | | 2020 | | 2019 | | 2018 | | | (in millions) | | Cost of revenues | | $ | 51 | | | $ | 54 | | | $ | 62 | | | SG&A expenses | | 181 | | | 163 | | | 205 | | | Total stock-based compensation expense | | $ | 232 | | | $ | 217 | | | $ | 267 | | | Income tax benefit | | $ | 48 | | | $ | 39 | | | $ | 66 | |
| | | | | | | | | | | | | | | | | | | | | | (in millions) | | 2023 | | 2022 | | 2021 | | Cost of revenues | | $ | 30 | | | $ | 33 | | | $ | 49 | | | SG&A expenses | | 153 | | | 228 | | | 197 | | | Restructuring charges | | (7) | | | — | | | — | | | Total stock-based compensation expense | | $ | 176 | | | $ | 261 | | | $ | 246 | | | Income tax benefit | | $ | 34 | | | $ | 59 | | | $ | 59 | |
Restricted Stock Units and Performance Stock Units We granted RSUs that vest proportionately in quarterly or annual installments ranging from one yearover periods of up to four years to employees, including our executive officers. Stock-based compensation expense relating to RSUs is recognized on a straight-line basis over the requisite service period. A summary of the activity for RSUs granted under our stock-based compensation plans as of December 31, 20202023 and changes during the year then ended is presented below: | | | | | | | | | | | | | | | | | Number of
Units
(in millions) | | Weighted Average
Grant Date
Fair Value
(in dollars) | | Unvested at January 1, 2023 | | 3.4 | | | $ | 74.54 | | | Granted | | 3.6 | | | 65.95 | | | Vested | | (2.7) | | | 70.99 | | | Forfeited | | (1.0) | | | 71.32 | | | Unvested at December 31, 2023 | | 3.3 | | | $ | 69.10 | |
| | | | | | | | | | Cognizant | F-37 | December 31, 2023 Form 10-K |
| | | | | | | | | | | | | | | | | Number of
Units
(in millions) | | Weighted Average
Grant Date
Fair Value
(in dollars) | | Unvested at January 1, 2020 | | 4.5 | | | $ | 67.07 | | | Granted | | 3.9 | | | 61.85 | | | Vested | | (3.0) | | | 65.42 | | | Forfeited | | (1.0) | | | 64.91 | | | Unvested at December 31, 2020 | | 4.4 | | | $ | 64.09 | |
The weighted-average grant date fair value of RSUs granted in 2020, 20192023, 2022 and 20182021 was $61.85, $64.12$65.95, $78.20 and $74.94,$74.66, respectively. As of December 31, 2020, $2472023, $159 million of total remaining unrecognized stock-based compensation cost related to RSUs is expected to be recognized over the weighted-average remaining requisite service period of 1.81.6 years.
We granted PSUs that vest over periods ranging from one yearup to four years to employees, including our executive officers. The vesting of PSUs is contingent on both meeting certain financial performance targets, market conditions and continued service. A summary of the activity for PSUs granted under our stock-based compensation plans as of December 31, 20202023 and changes during the year then ended is presented below. The presentation reflects the number of PSUs at the maximum performance milestones. | | Number of
Units
(in millions) | | Weighted Average
Grant Date
Fair Value
(in dollars) | | Unvested at January 1, 2020 | | 2.0 | | | $ | 69.73 | | | | Number of
Units
(in millions) | | | | Number of
Units
(in millions) | | Weighted Average
Grant Date
Fair Value
(in dollars) | | Unvested at January 1, 2023 | | | Granted | Granted | | 1.9 | | | 62.00 | | | Vested | Vested | | (0.2) | | | 60.63 | | | Forfeited | Forfeited | | (0.9) | | | 67.59 | | | Adjustment at the conclusion of the performance measurement period | Adjustment at the conclusion of the performance measurement period | | (1.1) | | | 70.67 | | | Unvested at December 31, 2020 | | 1.7 | | | $ | 62.60 | | | Unvested at December 31, 2023 | |
The weighted-average grant date fair value of PSUs granted in 2020, 20192023, 2022 and 20182021 was $62.00, $70.77$67.82, $90.92 and $81.98,$73.38, respectively. As of December 31, 2020, $342023, $13 million of the total remaining unrecognized stock-based compensation cost related to PSUs is expected to be recognized over the weighted-average remaining requisite service period of 2.01.3 years.
All RSUs and PSUs have dividend equivalent rights, which entitle holders to the same dividend value per share as holders of common stock. Dividend equivalent rights are subject to the same vesting and other terms and conditions as the corresponding unvested RSUs and PSUs and are accumulated and paid when the underlying shares vest. The Purchase Plan
TheFor the years ended December 31, 2023 and 2022, the Purchase Plan providesprovided for eligible employees to purchase shares of Class A common stock at a price equal to 95% of the fair market value per share of our Class A common stock on the last date of the purchase period. This plan has been deemed non-compensatory and, therefore, no compensation expense has been recorded. During the years ended December 31, 2023 and 2022, we issued 1.1 million shares and 1.3 million shares, respectively, of Class A common stock under the Purchase Plan.
For the year ended December 31, 2021, the Purchase Plan provided for eligible employees to purchase shares of Class A common stock at a price of 90% of the lesser of: (a) the fair market value of a share of Class A common stock on the first date of the purchase period or (b) the fair market value of a share of Class A common stock on the last date of the purchase period. Stock-based compensation expense for the Purchase Plan iswas recognized over the vesting period of three months on a straight-line basis.
The fair values of the options granted under the Purchase Plan were estimated at the date of grant during the yearsyear ended December 31, 2020, 2019, and 20182021, based upon the following assumptions, and were as follows: | | | | | | | | | | | | | | | | | | | | | | | 2020 | | 2019 | | 2018 | | Dividend yield | | 1.1 | % | | 1.3 | % | | 1.0 | % | | Weighted average volatility factor | | 35.9 | % | | 24.9 | % | | 21.0 | % | | Weighted average risk-free interest rate | | 0.6 | % | | 2.2 | % | | 1.9 | % | | Weighted average expected life (in years) | | 0.25 | | 0.25 | | 0.25 | | Weighted average grant date fair value | | $ | 9.38 | | | $ | 9.82 | | | $ | 10.87 | |
During the year ended December 31, 2020, we issued 3.0 million shares of Class A common stock under the Purchase Plan with a total fair value of approximately $28 million.
| | | | | | | | | | | 2021 | | Dividend yield | | 1.3 | % | | Weighted average volatility factor | | 27.5 | % | | Weighted average risk-free interest rate | | 0.03 | % | | Weighted average expected life (in years) | | 0.25 | | Weighted average grant date fair value | | $ | 11.72 |
| | | | | | | | | | Cognizant | F-38 | December 31, 2023 Form 10-K |
| | | | | | | | | | | | | | | Note 18 — Related Party Transactions |
In 2018, we provided $100 million of initial funding to the Cognizant U.S. Foundation. The expense was reported in the caption "Selling, general and administrative expenses" in our consolidated statement of operations. Additionally, two of our executive officers served as directors of the Cognizant U.S. Foundation in 2020, 2019 and 2018.
| | | | | | | | | | | | | | | Note 19 — Segment Information |
OurWe have seven industry-based operating segments, which are aggregated into four reportable segments are:business segments:
•Financial Services, which consists of ourthe banking and insurance operating segments; •Healthcare,Health Sciences (previously referred to as Healthcare), which consists of our healthcare and life sciencesa single operating segments;segment of the same name; •Products and Resources, which consists of ourthe retail and consumer goods; manufacturing, logistics, energy, and utilities; and travel and hospitality operating segments; and •Communications, Media and Technology, which includes our communications and mediaconsists of a single operating segment and our technology operating segment.of the same name. Our segments are industry-based, and as such, we report revenue from clients in the segment with which our clients are most closely aligned. Our client partners, account executives and client relationship managers are aligned in accordance with the specific industries they serve. Our chief operating decision makerCODM evaluates the Company's performance and allocates resources based on segment revenues and operating profit. Segment operating profit is defined as income from operations before unallocated costs. Generally, operating expenses for each operating segment have similar characteristics and are subject to the same factors, pressures and challenges. However, the economic environment and its effects on industries served by ourthe operating segments may affect revenues and operating expenses to differing degrees. Expenses included inIn 2023, we made certain changes to the internal measurement of segment operating profit consist principallyfor the purpose of direct sellingevaluating segment performance and deliveryresource allocation. The primary reason for the change was to reflect a more complete cost of delivery. Specifically, segment operating profit now includes an allocation of both SG&A costs (including stock-based compensation expense) as well as a per employee charge for use ofrelated to our global delivery centersintegrated practices and infrastructure. Certain SG&A expenses, the excess or shortfall of incentive-based compensation for commercial and delivery employees as compared to target, restructuring costs, COVID-19 Charges, costswhich were previously included in "unallocated costs." We have reported 2023 segment operating profits using the new allocation methodology and have recast the 2022 and 2021 results to conform to the new methodology.
Corporate expenses, expenses related to the ransomware attack,our NextGen program, a portion of depreciation and amortization and the impact of the settlements of ourthe cash flow hedges are not allocated to individual segments in internal management reports used by the chief operating decision maker.CODM. Accordingly, such expenses are excluded from segment operating profit and are included below as “unallocated costs” and adjusted against our total income from operations. The incremental accrual related to the India Defined Contribution Obligation recorded in 2019 has been excluded from segment operating profits for the year ended December 31, 2019. These costs are included in "unallocated costs" in the table below. Additionally, management has determined that it iswe do not practical to allocate identifiabledisclose assets by segment since suchas a significant portion of the assets areis used interchangeably among the segments.segments and the CODM does not review such information. For revenues by reportable business segment and geographic area see Note 2.
Segment operating profits by reportable business segment were as follows: | | | 2020 | | 2019 | | 2018 | | (in millions) | | (in millions) | | (in millions) | 2023 | | 2022 | | 2021 | | Financial Services | Financial Services | $ | 1,449 | | | $ | 1,605 | | | $ | 1,713 | | | Healthcare | 1,383 | | | 1,261 | | | 1,416 | | | Health Sciences | | | Products and Resources | Products and Resources | 1,078 | | | 1,028 | | | 1,023 | | | Communications, Media and Technology | Communications, Media and Technology | 794 | | | 732 | | | 692 | | | Total segment operating profit | Total segment operating profit | 4,704 | | | 4,626 | | | 4,844 | | | Less: unallocated costs | Less: unallocated costs | 2,590 | | | 2,173 | | | 2,043 | | | Income from operations | Income from operations | $ | 2,114 | | | $ | 2,453 | | | $ | 2,801 | |
Geographic Area Information Long-lived assets by geographic area are as follows: | | | | | | | | | | | | | | | | | | | | 2020 | | 2019 | | 2018 | | (in millions) | Long-lived Assets:(1) | | | | | | North America(2) | $ | 399 | | | $ | 445 | | | $ | 436 | | | Europe | 88 | | | 104 | | | 105 | | Rest of World(3) | 764 | | | 760 | | | 853 | | | Total | $ | 1,251 | | | $ | 1,309 | | | $ | 1,394 | |
| | | | | | | | | | | | | | | | | | | (in millions) | 2023 | | 2022 | | 2021 | Long-lived Assets:(1) | | | | | | North America(2) | $ | 335 | | | $ | 354 | | | $ | 377 | | | Europe | 90 | | | 86 | | | 75 | | Rest of World(3) | 623 | | | 661 | | | 719 | | | Total | $ | 1,048 | | | $ | 1,101 | | | $ | 1,171 | |
(1) Long-lived assets include property and equipment, net of accumulated depreciation and amortization. (2) Substantially all relates to the United States. (3) Substantially all relates to India.
| | | | | | | | | | Cognizant | F-39 | December 31, 2023 Form 10-K |
| | | | | | | | | | | | | | | Note 2019 — Subsequent Events |
Dividend On February 3, 2021,5, 2024, our Board of Directors approved the Company's declaration of a $0.24$0.30 per share dividend with a record date of February 18, 202120, 2024 and a payment date of February 26, 2021.28, 2024. Acquisitions In January 2021,2024, we completedacquired 100% ownership in Thirdera, an Elite ServiceNow Partner specializing in advisory, implementation and optimization solutions related to the acquisition of LiniumServiceNow platform, for a preliminary purchase price of $85$430 million. Linium is a cloud transformation consultancy group specializing in theThis acquisition augments our on-and-near-shore global ServiceNow platform and solutions for smart digital enterprise workflows, acquired to broaden our enterprise service management capabilities. In January 2021, we entered into an agreement to acquire Servian for a preliminary purchase price of $240 million. Servian is an Australia-based enterprise transformation consultancy specializing in data analytics, AI, digital services, experience design and cloud, which is expected to enhance our digital portfolio and market presence in Australia and New Zealand. The transaction is expected to close during the first quarter of 2021.
In February 2021, we completed the acquisition of Magenic Technologies, Inc. for a preliminary purchase price of $240 million, excluding contingent consideration. Magenic provides agile software and cloud development, DevOps, experience design and advisory services across a range of industries and was acquired to enhance our global software engineering expertise.
| | | | | | | | | | Cognizant | F-40 | December 31, 2023 Form 10-K |
Cognizant Technology Solutions Corporation Valuation and Qualifying Accounts For the Years Ended December 31, 2020, 20192023, 2022 and 20182021 (in millions) | | | | | | | | | | | | | | | | | | | | | | | | | | | | | | | | | | Description | | Balance at
Beginning of
Period | | Charged to
Costs and
Expenses | | Charged to
Other
Accounts | | Deductions
/Other | | Balance at
End of
Period | | | (in millions) | | | | | | | | | | | | | | | | | | | | | | | | | | | | | | | | | | | | | | | | | | | | | | Warranty accrual: | | | | | | | | | | | | 2020 | | $ | 33 | | | $ | 32 | | | $ | 0 | | | $ | 33 | | | $ | 32 | | | 2019 | | $ | 32 | | | $ | 33 | | | $ | 0 | | | $ | 32 | | | $ | 33 | | | 2018 | | $ | 30 | | | $ | 32 | | | $ | 0 | | | $ | 30 | | | $ | 32 | | | Valuation allowance—deferred income tax assets: | | | | | | | | | | | | 2020 | | $ | 24 | | | $ | 5 | | | $ | 0 | | | $ | 0 | | | $ | 29 | | | 2019 | | $ | 11 | | | $ | 15 | | | $ | 0 | | | $ | 2 | | | $ | 24 | | | 2018 | | $ | 10 | | | $ | 1 | | | $ | 0 | | | $ | 0 | | | $ | 11 | |
| | | | | | | | | | | | | | | | | | | | | | | | | | | | | | | | | | Description | | Balance at
Beginning of
Period | | Charged to
Costs and
Expenses | | Charged to
Other
Accounts | | Deductions
/Other | | Balance at
End of
Period | | | (in millions) | | | | | | | | | | | | | | | | | | | | | | | | | | | | | | | | | | | | | | | | | | | | | | Warranty accrual: | | | | | | | | | | | | 2023 | | $ | 41 | | | $ | 40 | | | $ | — | | | $ | 41 | | | $ | 40 | | | 2022 | | $ | 39 | | | $ | 41 | | | $ | — | | | $ | 39 | | | $ | 41 | | | 2021 | | $ | 32 | | | $ | 36 | | | $ | 3 | | | $ | 32 | | | $ | 39 | | | Valuation allowance—deferred income tax assets: | | | | | | | | | | | | 2023 | | $ | 41 | | | $ | 14 | | | $ | — | | | $ | 2 | | | $ | 53 | | | 2022 | | $ | 46 | | | $ | 3 | | | $ | — | | | $ | 8 | | | $ | 41 | | | 2021 | | $ | 29 | | | $ | 17 | | | $ | — | | | $ | — | | | $ | 46 | |
| | | | | | | | | | Cognizant | F-41 | December 31, 2023 Form 10-K |
|