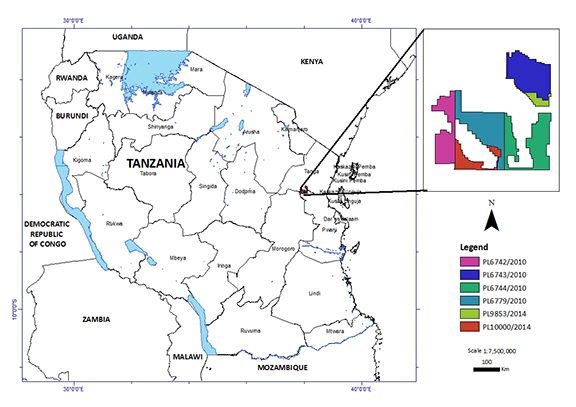
Fig. 1: Location Map: Handeni Property in Tanzania.
UNITED STATES
SECURITIES AND EXCHANGE COMMISSION
Washington, D.C. 20549
FORM 10-K
[X] ANNUAL REPORT PURSUANT TO SECTION 13 OR 15(d) OF THE SECURITIES EXCHANGE ACT OF 1934
For the Fiscal Year Ended May 31, 20142015
[ ] TRANSITION REPORT PURSUANT TO SECTION 13 OR 15(d) OF THE SECURITIES EXCHANGE ACT OF 1934
For the transition period from ________________ to ________________.
Commission file number 000-50907
HANDENI GOLD INC.
(Exact name of registrant as specified in its charter)
| Nevada | 98-0430222 |
| (State or other jurisdiction of incorporation or organization) | (I.R.S. Employer Identification No.) |
| P.O. Box 33507, | |
| Plot 82A, ITV Road, Mikocheni Light Industrial Area, | N/A |
| Dar es Salaam, the United Republic of Tanzania | ________ |
| (Address of principal executive offices) | (Zip Code) |
+255-222-70-00-84
(Registrant’s telephone number, including area code)
228 Regent Estate
Dar es Salaam, Republic of Tanzania (Former(Former name, former address and former fiscal year, if changed since last report
Securities registered pursuant to Section 12(b) of the Act:None
Securities registered pursuant to Section 12(g) of the Act:
Common Stock, Par Value $0.001
(Title of class)
Indicate by check mark if the registrant is a well-known seasoned issuer, as defined in Rule 405 of the Securities Act.
[ ] Yes [X] No
Indicate by check mark if the registrant is not required to file reports pursuant to Section 13 or 15(d) of the Exchange Act.
[ ] Yes [X] No
Indicate by check mark whether the registrant (1) filed all reports required to be filed by Section 13 or 15(d) of the Exchange Act during the preceding 12 months (or for such shorter period that the registrant was required to file such reports), and (2) has been subject to such filing requirements for the past 90 days.
[X] Yes [ ] No
Indicate by check mark whether the registrant has submitted electronically and posted on its corporate Website, if any, every Interactive Data File required to be submitted and posted pursuant to Rule 405 of Regulation S-T during the preceding 12 months (or for such shorter period that the registrant was required to submit and post such files.
[X] Yes [ ] No
Indicate by check mark if disclosure of delinquent filers in response to Item 405 of Regulation S-K is not contained herein, and will not be contained, to the best of registrant’s knowledge, in definitive proxy or information statements incorporated by reference in Part III of this Form 10-K or any amendment to this Form 10-K.
[ ]
Indicate by check mark whether the registrant is a large accelerated filer, an accelerated filer, a non-accelerated filer, or a smaller reporting company. See the definitions of “large accelerated filer”, “accelerated filer” and “smaller reporting company” in Rule 12b-2 of the Exchange Act.
i
| Large accelerated filer [ ] | Accelerated filer [ ] |
| Non-accelerated filer [ ] (do not check if a smaller reporting company) | Smaller reporting company [X] |
Indicate by checkmark whether the registrant is a shell company (as defined in Rule 12b-2 of the Exchange Act).
Yes [ ] YesNo [X]XNo]
The aggregate market value of the registrant’s stock held by non-affiliates of the registrant as of the last business day of the registrant’s most recently completed second fiscal quarter ended November 30, 2013,2014, computed by reference to the price at which such stock was last sold on the OTC Bulletin Board ($0.00420.0017 per share) on that date, was approximately $724,430.$293,222.
The registrant had 321,416,654 shares of common stock outstanding as of August 18, 2014.
__________2015.
ii
TABLE OF CONTENTS
__________
iii
FORWARD LOOKING STATEMENTS
This annual report on Form 10-K and the documents incorporated herein by reference contain forward-looking statements that involve risks and uncertainties. Such forward-looking statements concern our anticipated results and developments in our operations in future periods, planned exploration and, if warranted, development of our properties, plans related to our business and other matters that may occur in the future. These statements relate to analyses and other information that are based on forecasts of future results, estimates of amounts not yet determinable and assumptions of management.
Any statements contained herein that are not statements of historical fact and that express or involve discussions with respect to predictions, expectations, beliefs, plans, projections, objectives, assumptions or future events or performance may be deemed to be forward-looking statements. In some cases, you can identify forward-looking statements by terminology such as “may”, “might”, “could”, “will”, “would”, “should”, “expect”, “plan”, “intend”���intend”, “anticipate”, “believe”, “estimate”, “predict”, “potential” or “continue”, the negative of such terms or other comparable terminology. In evaluating these statements, you should consider various factors, including the assumptions, risks and uncertainties outlined in this annual report under “Risk Factors”. These factors or any of them may cause our actual results to differ materially from any forward-looking statement made in this annual report. Forward-looking statements in this annual report include, among others, statements regarding:
| • | our capital needs; | |
| • | business plans; | |
| • | drilling plans, timing of drilling and costs; | |
| • | results of our various projects; | |
| • | ability to lower cost structure in certain of our projects; | |
| • | our growth expectations; | |
| • | timing of exploration of the Company’s properties; | |
| • | the performance and characteristics of the Company’s mineral properties; | |
| • | capital expenditure programs; | |
| • | the impact of national, federal, provincial, and state governmental regulation on the Company; | |
| • | expected levels of exploration costs, general administrative costs, costs of services and other costs and expenses; | |
| • | expectations regarding our ability to raise capital and to add reserves through acquisitions, exploration and development; and | |
| • | other expectations. |
While these forward-looking statements, and any assumptions upon which they are based, are made in good faith and reflect our current judgment regarding future events, the forward-looking statements are subject to a variety of known and unknown risks, uncertainties and other factors. Our actual results will likely vary, sometimes materially, from any estimates, predictions, projections, assumptions or other future performance suggested herein. Some of the risks and assumptions include, without limitation:
| • | our need for additional financing; | |
| • | our limited operating history; | |
| • | our history of operating losses; | |
| • | our exploration activities may not result in commercially exploitable quantities of ore on our current or any future mineral properties; | |
| • | the risks inherent in the exploration for minerals such as geologic formation, weather, accidents, equipment failures and governmental restrictions; | |
| • | the competitive environment in which we operate; | |
| • | changes in governmental regulation and administrative practices; | |
| • | our dependence on key personnel; | |
| • | conflicts of interest of our directors and officers; | |
| • | our ability to fully implement our business plan; | |
| • | our ability to effectively manage our growth; | |
| • | risks related to our ability to execute projects being dependent on factors outside our control; | |
| • | risks related to seasonal factors and unexpected weather; | |
| • | risks related to title to our properties; | |
| • | risks related to our being able to find, acquire, develop and commercially produce mineral reserves; |
1
| • | risks related to our stock price being volatile; and | |
| • | other regulatory, legislative and judicial developments. |
This list is not exhaustive of the factors that may affect any of our forward-looking statements. We advise the reader that these cautionary remarks expressly qualify in their entirety all forward-looking statements attributable to us or persons acting on our behalf. Important factors that you should also consider, include, but are not limited to, the factors discussed under “Risk Factors” in this annual report. If one or more of these risks or uncertainties materializes, or if underlying assumptions prove incorrect, our actual results may vary materially from those expected, estimated or projected.
1
Forward-looking statements in this document are not a prediction of future events or circumstances, and those future events or circumstances may not occur. Given these uncertainties, users of the information included herein, including investors and prospective investors are cautioned not to place undue reliance on such forward-looking statements. Investors should consult our quarterly and annual filings with U.S. securities commissions for additional information on risks and uncertainties relating to forward-looking statements. We do not assume responsibility for the accuracy and completeness of these statements.
The forward-looking statements in this annual report are made as of the date of this annual report and based on our beliefs, opinions and expectations at the time they are made. We do not assume any obligation to update our forward-looking statements if those beliefs, opinions, or expectations, or other circumstances, should change, to conform these statements to actual results, except as required by applicable law, including the securities laws of the United States.
AVAILABLE INFORMATION
Handeni Gold Inc. files annual, quarterly and current reports, proxy statements, and other information with the Securities and Exchange Commission (the “Commission” or “SEC”). You may read and copy documents referred to in this Annual Report on Form 10-K that have been filed with the Commission at the Commission’s Public Reference Room, 450 Fifth Street, N.W., Washington, D.C. You may obtain information on the operation of the Public Reference Room by calling the Commission at 1-800-SEC-0330. You can also obtain copies of our Commission filings by going to the Commission’s website at http://www.sec.gov.
REFERENCES
As used in this annual report on Form 10-K: (i) the terms “we”, “us”, “our”, “Handeni”, “Handeni Gold”, and the “Company” mean Handeni Gold Inc.; (ii) “SEC” refers to the Securities and Exchange Commission; (iii) “Securities Act” refers to the United States Securities Act of 1933, as amended; (iv) “Exchange Act” refers to the United States Securities Exchange Act of 1934, as amended; and (v) all dollar amounts refer to United States dollars unless otherwise indicated.
2
PART I
| ITEM 1. | BUSINESS |
Corporate Organization
We were incorporated on January 5, 2004 under the laws of the State of Nevada. Effective January 21, 2009, we effected a five for one stock split of our common stock and increased our authorized capital to 500,000,000 shares of common stock having a $0.001 par value. On February 14, 2012, the Company changed its name from Douglas Lake Minerals Inc. to Handeni Gold Inc.
Our principal office is currently located at P.O. Box 33507, Plot 82A, ITV Road, Mikocheni Light Industrial Area, Dar es Salaam, the United Republic of Tanzania, with the phone number of +255 222 70 0084 and the fax number of +255 222 70 00 52. Our CanadaCanadian office is located at Suite 500, 666 Burrard200, 5700 Yonge Street, Vancouver, British Columbia, V6C 3P6,Toronto, ON, Canada, M2M 4K2, with the telephone number of (604) 642-6164 and the fax number of (604) 642-6168.647-560-5548.
General
Handeni Gold Inc. is an exploration stage company engaged in the acquisition and exploration of mineral properties. Our principal area of focus is the Handeni Gold Project located in the Handeni district, within the Tanga region of the Republic of Tanzania in East Africa, in which we have interests in mineral claims through prospecting licenses (“PLs”) and/or primary mining licenses (“PMLs”) issued by the government of the Republic of Tanzania.
None of our mineral claims contain any substantiated mineral deposits, resources or reserves of minerals to date. Exploration, including drilling of more than 10,000 meter of core, has been carried out on these claims, in particular the 4 PLs in the Handeni District. Accordingly, additional exploration of these mineral claims is required before any conclusion can be drawn as to whether any commercially viable mineral deposit may exist on any of our mineral claims. Our plan of operations is to continue exploration and drilling work in order to ascertain whether our mineral claims warrant further advanced exploration to determine whether they possess commercially exploitable deposits of minerals. We will not be able to determine whether or not any of our mineral claims contain a commercially exploitable mineral deposit, resource or reserve, until appropriate exploratory work has been completed and an economic evaluation based on that work concludes economic viability.
We are considered an exploration or exploratory stage company, because we are involved in the examination and investigation of land that we believe may contain valuable minerals, for the purpose of discovering the presence of ore, if any, and its extent. There is no assurance that a commercially viable mineral deposit exists on the properties underlying our mineral claim interests, and considerable further exploration will be required before a final evaluation as to the economic and legal feasibility for our future exploration is determined.
Our Mineral Claims
Handeni District Gold Project
Handeni PLs
Currently, our primary focus is on the Handeni District Project. Effective September 21, 2010, our Board of Directors ratified the entering into and immediate closing of a certain Mineral Property Acquisition Agreement (the “Acquisition Agreement”) dated September 15, 2010 with IPP Gold Limited (“IPP Gold”), pursuant to which we acquired an undivided 100% legal, beneficial and registerable interest in and to four PLs, totaling approximately 800 square kilometers (now approximately 360 km2), located in the Handeni District of Tanzania and which were owned or controlled by IPP Gold and its affiliates.
In accordance with the terms of the Acquisition Agreement, effective September 21, 2010, IPP Gold has now become a major stakeholder in our Company. Pursuant to the terms of the Acquisition Agreement, we issued 133,333,333 restricted shares of common stock to IPP Gold in exchange for 100% interest in the four PLs of the Handeni Project, with no further payments in shares or cash required.
The Commissioner for Minerals of Tanzania confirmed the recording in the Central Register and the transfer of 100% of each of the Prospecting License Nos. 6742/2010, 6743/2010, 6744/2010 and 6779/2010, which comprise the Handeni Project, from IPP Gold to our Company, and that such transfer has been duly recorded on the terms and conditions contained in such Prospecting Licenses. In accordance with the stipulations of the Tanzanian Mining Act, these properties have been reduced in size to approximately 50% or less of their original size after 3 years of exploration. Accordingly we retained portions considered to contain the best target areas of each of PL6742/2010, PL6743/2010, PL6744/2010 and PL6779/2010 totaling approximately 360 km2. The company is in the process of acquiring some portions of the relinquished areas deemed to be of interest to its continued exploration program.
We obtained a Technical Report on the Handeni Property (the “Handeni Report”), dated April 25, 2011, as prepared at our request by Avrom E. Howard, MSc, FGA, PGeol (Ontario), Principal Consultant at Nebu Consulting LLC. Mr. Howard is a Qualified Person in accordance with Canadian National Instrument 43-101 “Standards for Disclosure of Mineral Projects” and its Companion Policy (collectively, “NI 43-101”) and is a Practicing Professional Geologist registered with the Association of Professional Geoscientists of Ontario (registration number 0380). The Handeni Report follows on the heels of a detailed geological compilation and exploration report prepared in 2010 by Dr. Reyno Scheepers, a South African professional geologist who has been a director of our Company since 2010 and is our current Chief Executive Officer. Upon independent review by, and to the satisfaction of Mr. Howard, much of the content from Dr. Scheepers’ report has been referred to and referenced in the Handeni Report.
3
Under Tanzanian law, 50% of the area of PLs need to be relinquished following a period of three years after allocation of the PLs to the Company (1998 Mining Act applicable to the Companies’ PLs during their first period of allocation). On August 16, 2013, the Company applied for renewal of two of the licenses that expired in September 2013 and two of the licenses that expired in October 2013. The Company has received four renewal PLs of the renewal areas under PL6742/2010, PL6744/2010, PL6743/2010 and PL6779/2010 effective on October 5, 2013, September 13, 2013, October 13, 2013 and September 13, 2013, respectively. These four PLs are valid until October 4, 2016, September 12, 2016, October 12, 2016 and September 12, 2016, respectively. The total area occupied by the renewal licenses is approximately 359.80 km2 or 45% of the original area. In addition to applying for the remainder of the license areas, the Company submitted application for additional license areas taking our total license area to approximately 52% of the original 800 km2. To date two of the applications have been successfully granted on July 2, 2014 as PL9853/2014 (12.32 km2) and July 22, 2014 as PL10000/2014 (33.62 km2) bringing the total area held by the Company in the Handeni district to 405.74 km2.
Handeni District PMLs
On August 5, 2011, the Company entered a Mineral Property Acquisition Agreement (the “2011 Acquisition Agreement”) with Handeni Resources Limited (“Handeni Resources”), a limited liability company registered under the laws of Tanzania. The Chairman of the Board of Directors of the Company has an existing ownership and/or beneficial interest(s) in Handeni Resources. Pursuant to the 2011 Acquisition Agreement, the Company had an exclusive option to acquire from Handeni Resources a 100% interest in mineral licenses covering an area of approximately 2.67 square kilometers to the east of Magambazi Hill, which is adjacent to the area covered by the Company’s four existing prospecting licenses in the Handeni District.
On November 30, 2011, the Company completed the 2011 Acquisition Agreement and issued 15,000,000 restricted common shares to Handeni Resources as payment. As at November 30, 2011, the fair market price of the Company’s common stock was $0.11 per share; accordingly, the Company recorded a total fair market value of $1,650,000 as the mineral licenses acquisition cost.
To comply with the laws and regulations of the Republic of Tanzania whereby foreign companies may not own PMLs, on July 19, 2012, the Company:
| ||
|
Handeni District Project
Much of the information regarding the Handeni District Project as provided below is based on information provided in the Handeni Report.
The author of the Handeni Report visited the Handeni property on February 26, 2011, accompanied by Dr. Scheepers. Given the almost total absence of outcrop across the property area, on the one hand, and the abundance of district to regional scale geological data, recent exploration data, intensive artisanal mining activity in the boundary area between the Company’s Handeni property and the adjacent Magambazi property belonging to Canaco Resources Inc. (now East Africa Metals Inc.) and their well-publicized news releases and developments, on the other, the author of the Handeni Report determined that he was able to complete a meaningful property visit within the timeframe of a single day to his technical satisfaction sufficient for the purpose of preparing the Handeni Report.
Location and Access
The Handeni property liesGold properties lie within the historic Handeni artisanal gold mining district, located in Tanga Province, roughly 175 kilometerskm northwest of Tanzania’s largest city, Dar Es Salaam, and 100 kilometerskm southwest of the more northerly coastal city of Tanga (Fig. 1). The road from Dar Es Salaam to Tanga is paved; the secondary road that heads northwest from this road to the town of Handeni, a distance of 65 kilometers, is currently being upgraded andkm, has recently been paved. The Handeni property is located roughly 35 kilometerskm south of the town of Handeni.Handeni along a secondary gravel road. From this point, a number of dirt roads head south across various portions of the Handeni property and beyond. Driving time from Dar Es Salaam to the Handeni Gold properties is approximately five hours, depending on traffic and the weather.
Access during the dry season is not difficult and does not even require a 4X4 vehicle. Roads within the licenses are mostly tracks, some of which are not accessible during the rainy season. The area experiences two rainy seasons, namely a short wet period during November and December and the main rain season lasting from April to June. Exploration conditions during the rainy periods may be difficult, specifically during the April to June period. Fuel is available at a number of points along the north - south portion of the journey and in Handeni town itself.
4
The average elevation in the Company’s license area is 450 meters above sea level. The area is densely vegetated with tall trees and grass over undulating hills of gneiss that comprise the main topographic feature in the area. Muddy, slow moving rivers and creeks crisscross the valleys and plains; some of the larger streams may experience high flow during intense rainfalls.
The area is scarcely populated with occasional small villages where people are engaged in small scale mixed farming and artisanal gold mining. Handeni town is a community of several thousand inhabitants haphazardly spread over a series of small, rounded hills, where basic services and accommodation are available.
Fig. 1: Location Map: Handeni Property in Tanzania.
Property DescriptionProspecting Licenses (PLs)
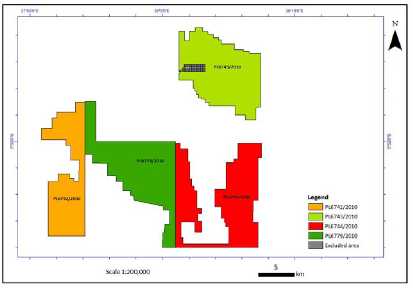
Currently, our primary focus is on the undivided 100% legal, beneficial and registerable interest in and to eight PLs, located in the Handeni District of Tanzania. The following table provides details about each PL prior tototal area held by the renewalCompany in the Handeni district is now 423.03 km2 (Fig. 2) (Table 1).
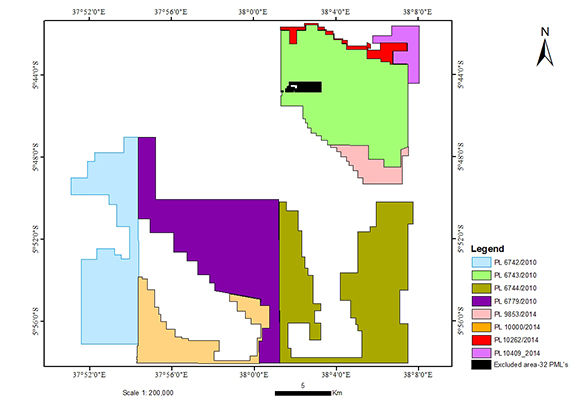
Fig. 2. Outline of Handeni Gold PLs in the licensesHandeni district. An area containing 32 PMLs is represented in 2013 as described above.black
Table 1: List of Prospecting Licenses, Handeni Property (prior to the 2013 renewal of the licenses)
| PL No. | Area (Sq Km) | Issue Date | Original Recipient | Transfer Date (To IPP Gold) | Transfer Date (To Handeni Gold) | Expiry Date | Renewal Date |
| 6742/2010 | 197.98 | 05/10/10 | Diamonds Africa Ltd. | 18/11/10 | 12/12/10 | 04/10/13 | 05/10/13 |
| 6743/2010 | 195.48 | 13/10/10 | Gold Africa Ltd. | 18/11/10 | 12/12/10 | 12/10/13 | 13/10/13 |
| 6744/2010 | 198.70 | 13/09/10 | M-Mining Ltd. | 18/11/10 | 12/12/10 | 12/09/13 | 13/09/13 |
| 6779/2010 | 197.74 | 13/09/10 | Tanzania Gem Center Ltd. | 18/11/10 | 12/12/10 | 12/09/13 | 13/09/13 |
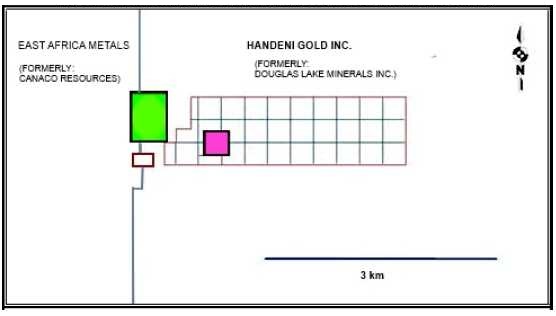
Within the property are several, smaller areas that belong to small scale artisanal miners, all of which are indicated in red in the license map presented below (Fig. 2). The areas found within PL 6742/2010 predate the arrival of IPP Gold and remain in the hands of the local artisanal miners to whom Primary Licenses, or what are informally known as “Primary Mining Licenses” or PMLs have been issued. The rectangular area in red on PL6743/2010 is discussed below. Artisanal gold mining activity remains ongoing in some of these areas.
5
Fig. 2: License Map, Handeni Property Prospecting Licenses, showing excluded areas in red(Prior to the 2013 renewal of the licenses)
Toward the western edge of PL 6743/2010 are several more PMLs that do not belong to the Company. The area colored in green in the figure below (Fig. 3) is a unitized block of four PMLs that were acquired by Canaco Resources Inc. (“CRI”) (now East Africa Metals Inc.) from their owners; this is where the most intensive artisanal gold mining activity is currently taking place, with laborers working at a variety of mining and milling sites adjacent to and up the hill from a shanty town of huts that is found just north of Magambazi hill.
Ownership of a single, isolated claim block, depicted in fuchsia below remains uncertain; and which is something that IPP Gold and the Company are attempting to ascertain. Ownership of the smaller, rectangular red block that overlies the CRI-Company boundary also remains unknown; and which again is another matter that IPP Gold and the Company are currently pursuing. The remaining block of 32 PMLs, shown as a grid of blue lines below, belongs to the Company as described above.
Fig. 3: Exclusion areas within PL6743/2010 (prior to the 2013 renewal of the licenses)
Under Tanzanian law, 50% of the area of PLs need to be relinquished following a period of three years after allocation of the PLs to the Company (1998 Mining Act applicable to the Companies’ PLs). On August 16, 2013, the Company applied for renewal of two of the licenses that expired in September 2013 and two of the licenses that expired in October 2013. The Company has received four renewal PLs of the renewal areas under PL6742/2010, PL6744/2010, PL6743/2010 and PL6779/2010 effective on October 5, 2013, September 13, 2013, October 13, 2013 and September 13, 2013, respectively. These four PLs are valid until October 4, 2016, September 12, 2016, October 12, 2016 and September 12, 2016, respectively. The total area occupied by the renewal licenses is approximately 359.80 km2 or 45% of the original area.
6
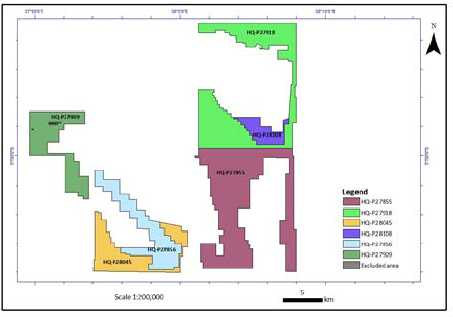
Following the 2013 renewal of the properties and acquisition of PLs in the current period, the Company now holds interests in PLs with details as described in the Table and figure below (Fig. 4).2, below.
Table 2: Handeni Gold Prospecting Licenses
| Granted Date | Expiry Date | Area Size (km2) | |
| 6742/2010 6743/2010 6744/2010 6779/2010 9853/2014 10000/2014 10262/2014 10409/2014 | 5/10/2013 13/10/2013 13/9/2013 13/9/2013 2/7/2014 22/7/2014 25/9/2014 02/12/2014 | 4/10/2016 12/10/2016 12/9/2016 12/9/2016 1/7/2018 21/7/2018 24/9/2018 01/12/2018 | 70.32 95.08 97.56 96.84 12.32 33.62 6.97 10.32 |
Primary Mining Licenses (PMLs)
On November 30, 2011, the Company acquired from Handeni Resources a 100% interest in primary mining licenses covering an area of approximately 2.67 square kilometers to the east of Magambazi Hill (Figs. 2 and 3). To comply with the laws and regulations of the Republic of Tanzania whereby foreign companies may not own PMLs, on July 19, 2012, the Company:
| (1) | entered into an Addendum agreement to the 2011 Acquisition Agreement whereby Handeni Resources will administer the 32 PMLs until such time as a mining license (“ML”) on the 32 PMLs (2.67 km2) have been allocated; and |
4
| (2) | during this period Handeni Resources will be conducting exploration and mining activities on the PMLs as directed by the Company. |
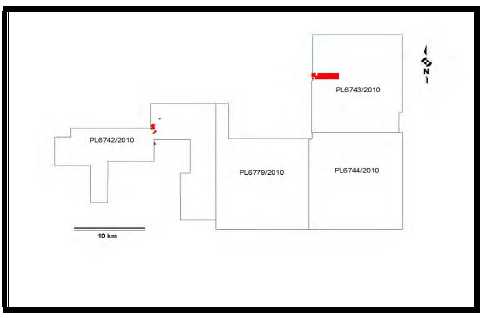
An enlargement of the “excluded area” as delineated on Fig. 4: Diagrammatic presentation2 is presented below (Fig. 3). An area within the outline of property outlines following the 2013 subdivision.
Significant portions32 PML’s without a PML number (Fig. 3) has now been confirmed to be part of relinquished ground (which was re-applied for) is currently on offerPL6743/2010. The block of 32 PMLs, shown in grey below, belongs to the Company as described above and are being explored
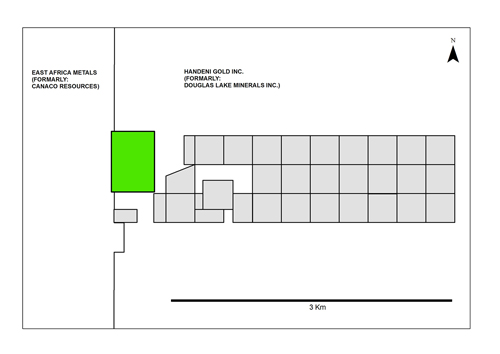
Fig. 3: Exclusion areas within PL6743/2010. Note area in white within PML’s is part of PL6743/2010.
West of the western border of PL 6743/2010 are several more PMLs that do not belong to the Company. The area colored in green (Fig. 5)3) is a unitized block of four PMLs that were apparently acquired by Canaco Resources Inc. (“CRI”) (now East Africa Metals Inc.) from their owners.
Handeni District Project
We obtained a Technical Report on the Handeni Property (the “Handeni Report”), dated April 25, 2011, as prepared at our request by Avrom E. Howard, MSc, FGA, PGeol (Ontario), Principal Consultant at Nebu Consulting LLC. Mr. Howard is a Qualified Person in accordance with Canadian National Instrument 43-101 “Standards for Disclosure of Mineral Projects” and we areits Companion Policy (collectively, “NI 43-101”) and is a Practicing Professional Geologist registered with the Association of Professional Geoscientists of Ontario (registration number 0380).
Subsequent to the publishing of the April 25, 2011 NI 43-101 report by Mr. Howard, the Company produced numerous in-house technical reports and is in the process of finalizing applicationscompiling an updated NI 43-101 report that will include the updated model for mineralization on portions of these offers deemed to be significant toour Handeni property. The drilling conducted by the Company’s future exploration program.
Fig. 5: Areas on offer to the Company
Offer HQ-P28045 has been granted as PL10000/2014 (33.62 km2) was done implementing and offer HQ-P28108 has been granted as PL9853/2014 (12.32 km2) (Fig. 6). PL10000/2014 was granted on July 22, 2014following Quality Control and PL9853/2014 was granted on July 2, 2014Quality Assessment procedures recommended by SRK (Stephen, Robertson and the licenses are valid till July 21, 2018 and July 1, 2018, respectively. The acquisitions of the two additional PLs bring the total of land held by Handeni Gold in the Handeni district to 405.74 km2 (Fig. 6)Kirsten).
7
HistoryProperty Description
General.General
Mining in Tanzania in the modern era dates back over one hundred years, first under German colonial rule; during the First World War a number of military engagements took place there. After the war endedrule and then under British control of the area was ceded to the British, under whose colonial authority mining and other activities continued and expanded. Mining focused on gold, diamonds and a variety of colored gemstones, notably including the discovery and development of the world’s largest diamondiferous kimberlite pipe (to date) by Canadian geologist John Williamson, a deposit that remains in production to this day. Shortly after achieving independence from the British in 1961, Tanzania nationalized most private sector industries, in turn resulting in the exodus of foreign investment and private capital and the consequent decline in economic activity in all sectors, including mining. Finally, beginningBeginning in the 1990s, in line with many other developing countries around the world, the Tanzanian government instituted several reforms to move towards a free market economy, privatize the mining industry and encourage both domestic and foreign investment in all economic sectors. In the case of the mining industry, this was supplemented, in 1998, through the passage of a new, more industry-friendly mining code. This code has been streamlined under the Mining Act of 1998 (revised 2010) (the “Mining Act”) currently controlling exploration, mining and related activities in the country.
Tanzania is a significant producer of gold, diamonds and a variety of colored gemstones including tanzanite; the trade name for generally heat treated, bluish-purple zoisite. The Merelani Hills, east of Arusha, is the only place on earth where this gemstone variety of V-rich zoisite is found in commercial quantities. A recently discovered uranium deposit is currently under development, as well, in the southeast area of the country. Tanzania is Africa’s thirdfourth leading gold producer, after Ghana and South Africa, with several major and junior companies producing and exploring for gold, mostly in northwestern Tanzania, south of Lake Victoria, in an area informally known as the Lake Victoria gold belt.
The Handeni Property.Property
Gold has been known in the Handeni area for many years with some attributing its discovery to the Germans prior to World War One; however, it was the increase in gold prices and consequent increase in artisanal gold mining activity in the Handeni area that led to the discovery of larger deposits of placer gold, in turn leading in 2003 to a classic gold rush. The discovery and mining of lode deposits followed, soon after, along with the growth of a shanty mining town at the northern base of Magambazi Hill.
In 2005, the Company’s majority shareholder, IPP Gold, entered into negotiations with a group of 34 local artisanal miners that collectively controlled four PMLs on and near Magambazi Hill, site of the area’s known lode mineralization, and upon failing in this endeavor acquired a number of PMLs east of Magambazi Hill from other local owners. A portion of a large (1,200 km2) Prospecting Reconnaissance License (“PLR”) which belonged to Midlands Minerals Tanzania Limited was also acquired by IPP Gold.
Between 2005 and 2010, IPP Gold carried out exploration over its PLR leading to the upgrading of its holdings from one PLR to four PLsPL’s of 800 km2, in August 2010. Exploration work included airborne magnetic and radiometric surveys, ground magnetic surveys, reconnaissance geological mapping, soil sampling, pitting and trenching. It is these four PLs that were acquired by the Company from IPP Gold.Gold under a September 2010 agreement.
5
Geological Setting
Regional Geology.GeologyThe geological framework of Tanzania reflects the geologic history of the African continent as a whole. Its present appearance is a result of a series of events that began with the evolution of the Archean shield, followed by its modification through metamorphic reworking and accretion of other continental rocks, in turn covered by continentally derived sediments. Pre-rift magmatism followed by active rifting has also left a major mark upon the Tanzanian landscape.
Several regionalRegional geological mapping programs have been carried out across the country over the past one hundred plus years, which has led to the recognition of several major litho-structural provinces from Archean to recent age.age in Tanzania. The Archean craton covers most of the western two thirds of the country, roughly bounded to the east by the East African Rift. Archean rocks host all of the country’s kimberlite pipes and contained lode diamond deposits, and most of its lode gold deposits. The Archean basement terrain is bounded to the east and west by a series of Proterozoic mobile belts; this area, particularly that to the east, hosts most of the country’s wide variety of colored gemstone deposits. Some recent research suggests that portions of this assumed Proterozoic terrane may actually consist of Archean crust that has undergone a later phase of higher grade metamorphism.
The PhanerozoicHandeni district forms part of the Tanzanian Mozambique belt. The belt was subjected to four tectonothermal events at 830-800Ma, ~760Ma, 630-580Ma and 560-520Ma. All except the last attained upper amphibolites / granulite grade.
Property Geology
The Handeni area is represented by a series of sedimentary units of Paleozoic to Mesozoic age, in turn followed by a pre-rift period of kimberlitic and related, alkalic, mantle-derived intrusive and extrusive activity that presaged active rifting. Rocks related to this event intrude up to Upper Mesozoic and Lower Cenozoic sedimentary formations. Next came a period of rift-related intrusive and extrusive activity concentratedsituated in the Arusha area – toPalaeoproterozoic Usugaran/Ubendian Metamorphic Terrane of Tanzania, along the northeast and Mbeya area – tonorthern extension of the southwest, which is responsible for volcanoes such as Mt. Meru and Mt. Kilimanjaro. Finally, a wide variety of recent and largely semi- to un-consolidated wind, water and weathering-derived recent formations are found across the country, a number of which host placer gold, diamond and colored gemstone deposits.north–trending Proterozoic Mozambique Mobile Belt.
Property Geology.The geology of the Handeni area comprises amphibolite to granulite facies metamorphic rocks interpreted to originally have formed a sequence of ultramafic to felsic volcanic flows, black shales and quartz-bearing sedimentary rocks. It is furthermore interpreted to comprise a metamorphosed/overprinted eastern extension/remnant of the Lake Victoria cratonic greenstone belt. High grade metamorphism has converted these original lithologies to a variety of metamorphic equivalents, including biotite-hornblende-garnet-pyroxene gneiss, migmatitic augen garnet- hornblende-pyroxene gneiss, quartzo-feldspathic hornblende-biotite-pyroxene gneiss, pyroxene-hornblende-biotite-garnet granulite and others. The entire assemblage has been folded into a synform with a northwest-southeast axis, complicated by numerous faults, some of which are spatially associated with gold mineralization.
8
Recent research by geologists from the University of Western Australia suggests that much of what has previously been considered to be of Proterozic age (Usagaran System) may in fact be overprinted Archean crust. This hypothesis has been invoked to help interpret the geology within which gold in this area is found and as the basis for an analogy between this gold mineralization and that found in less metamorphosed, bona fide Archean rocks in the Lake Victoria gold district, a few hundred km to the northwest. However, this is a hypothesis, only, one that may be used for exploration modeling purposes but one that still requires more work.
Mineralization
The Handeni property is at an early stage of exploration. There are no known mineral resources or reserves on the Handeni property, nor are there any known economically mineable deposits on the property.
Insufficient work has been completed on the Company’s property to be able to comment to any significant extent about the nature of gold mineralization found and that may be found therein. However, comments regarding mineralization may be made upon the basis of information released by East African Metals (EAM) (formerly Canaco Resources), the Company that owns the immediately adjacent Magambazi gold deposit, a deposit that remains the subject of an ongoing drilling program and geological studies and which is considered to be the type occurrence/deposit for the evolving Handeni district. The hill within which this deposit is found extends southeast onto the Company’s property.
According to the aforementioned report prepared by Dr. Scheepers, gold Gold is found within garnet-amphibolite zones within biotite-feldspar gneiss at three k n o w n locations in the Company’s property, locations where historical lode gold occurrences have been documented. Gold occurs in quartz veins as well as within the garnet amphibolites adjacent to the quartz veins. Proof of this association is informally corroborated by the testimony of local, illegal artisanal miners, who apparently recover gold both from quartz veins and gold-bearing gneiss that is not quartz vein bearing. Gold in the Company’s property has also been documented in soils and placers, at a variety of locations, as well.
Exploration ActivitiesOur geophysical and structural geological interpretation on which the drilling program conducted in 2012 was based, supported the mineralization model described above in broad terms.
Whereas gold was known in the Handeni area prior to the arrival in 2005 of the Company’s predecessor, IPP Gold, there is no history of any formal exploration in the area aside from limited work at Magambazi Hill itself. IPP Gold’sitself and the work conducted in recent years by Canaco (East African Metals) in the region
The foundation for modern exploration activities on the Company’s properties were laid by the exploration work conducted by IPP. Their initial work consisted of soil sampling and a ground magnetic survey over an area of 200 square kilometers covering the area now located within PL6743/2010 immediately east of Magambazi Hill. Over the five years that ensued, this was followed by a series of exploration campaigns involving a variety of exploration methods, in turn followed by interpretation and further work in an iterative fashion. A table summarizingNotable programs during this period included a fixed – wing airborne Magnetic and Radiometric Survey, a ground magnetic survey, geological mapping and structural interpretation as well as several large soil sampling and geochemical surveys.
Handeni Gold’s intensive early exploration program following the work completed byCompany’s September 2010 agreement with IPP Gold (muchachieved the following in terms of which was completed under the supervision of Dr. Scheepers) may be found below.
Summary of Historical Exploration Work, Handeni Property
Several exploration targets were delineatedmineralization on the basis of the aforementioned work either based upon anomalous gold soil geochemical results alone, or other features singly or in combination, that based upon gold deposit models have been deemed significant. Paramount among these are structural features are folds, shear zones, faults and thrust faults that have been interpreted on the basis of the magnetic and radiometric data, particularly where they have been seen to be coincident with anomalous gold in soils or locations of historical artisanal mining. Regardless of the gold deposit model one favors, structure is of fundamental significance as a conduit for and host to gold bearing solutions and, in this light therefore, all locations where anomalous gold has been found coincident with interpreted structures must be considered significant, particularly at this early stage of exploration on the Handeni property and in the district as a whole.
9
Conclusions and Recommendations
The author of the Handeni Report indicated that the most important conclusions to be derived at this juncture are:properties:
| ||
| ||
| ||
| ||
Processed airborne magnetic and radiometric data have delineated linear features that have been interpreted to represent a variety of structures such as shears, thrust faults and cross | ||
| ||
Gold | ||
|
6
The Company’s Exploration Activities Conducted in 2011/2012conducted during the fiscal years 2011 to 2013
During our fiscal year ended May 31, 2012, we achieved the following:The foregoing exploration by IPP was used as a foundation and followed by:
A helicopter based TEM electromagnetic and radiometric aerial survey program was completed by FUGRO over the entire Company licence area (800 km2) at 200 meter spaced flight lines in a north-south direction. Electromagnetic (TEM) as well as radiometric data for K (Potassium), U (Uranium) | |
The interpreted data clearly delineated subsurface geological features of importance to gold and base metal mineralization in this high grade metamorphic terrain. The data proved to be invaluable in the definition of structurally important sites and target definition. | |
An intensive ground based geophysical program on the Magambazi East as well as the Kwandege target zones was completed. This data (combined with geochemical results) were used to create drill targets on the two selected areas, the results of which are reported below. | |
A multi-element soil geochemical program was completed on the Kwandege target delineating the extent of the mineralization zone and assisting the interpretation of the geophysical data to locate drill positions. | |
A large soil sampling program of two targets in PL6743/2010 was | |
|
10
Fig. 6: Drill hole positions for the 28 drilled Magambazi core drill holes.

The drilling program on the Magambazi East targets outlined the following:
| ||
| ||
| ||
| • | Evaluation of the economic potential of the three mineralization zones will only be possible with closely spaced directional drilling to follow out the mineralization. We | |
|
11
Fig. 7: Kwandege drill hole positions.

Of the three drill holes drilled on the chargeability zone (outlined in purple on figure above (KW3_01, KW3_02 and KW3_03) (Fig. 1), all three intersected the zone associated with gold mineralization in the Handeni area but only KW3_01 yielded anomalous gold values of 0.24 g/t over 1 m intersections. Thus, despite large percentages of pyrite, as well as some arsenopyrite being present in most of the core intersected on the chargeability anomaly as outlined, general gold values over this anomaly are unexpectedly low. The potential for gold on the perimeter of the chargeability zone however remains high and further drilling is required.
Anomalous gold values were intercepted over large portions of drill core in KW2_10, drilled on a potential south eastern extension of the main Kwandege mineralization zone. Although no values of economic grade are present in this single drill hole, the garnet amphibolite (the favourable zone for gold mineralization) was intersected. The lower values are most likely due to an unfavourable sub-surface structural intersection and further drilling is necessary to assess the (new) south eastern extension of the main Kwandege target.
The best intersections obtained on the first phase of the Kwandege drilling project (32 holes) were:
| ||
| ||
| ||
| ||
| ||
|
An important feature of the Kwandege target is the fact that low level gold values (0.5 g/t to 1 g/t) were encountered in numerous intersections in the drill holes and also confirmed by the latest assay results. Anomalous gold with some potentially economic intersections have been encountered in an E - W (strike) direction of 1,501 meters (based on the results of the completed phase 1 drilling program). The open ended nature of the mineralization in an E-W direction was confirmed.
The results of the completed phase 1 drilling program)soil sampling program on Target 5 yielded gold in soil values of up to 200 ppb. Au (gold) assay results received for 2331 samples coincides with a magnetic and electro-magnetic geophysical anomaly on surface over an area of approximately 1.8 km (N-S) by 900 m (E-W). The open ended natureevaluation of the mineralization in an E-W direction was confirmed. The structural control on the gold mineralizationthis target is an important feature of mineralization at Kwandege. Based on the current results, gold is particularly enriched in the upper of two garnet amphibolite layers separatedto be continued by a felsic gneiss unit. Within the garnet amphibolite, gold is most likely concentrated in the proximity of fold noses. The package of garnet amphibolite as well as felsic gneiss units are contained within a SSW towards NNE thrust unit.pitting, trenching and ground IP.
|
During our fiscal year ended May 31, 2013, the Company focused its exploration efforts on:
12
| ||
| ||
|
DuringExploration conducted during the fiscal year ended May 31, 2013, we:2014:
During this period, we achieved the following:
collected a total of 5,050 soil samples (including blanks and standards) from targets in PL6743 that | |
| |
| • | An area to the east of Magambazi hill was selected as a first target and pilot study area to test the gold distribution in various secondary geological regimes in the Handeni terrain. The |
| a) | The fluvial environment has the largest potential for the extraction of coarse grained gold. | |
| b) |
| |
| c) |
| |
| d) | Allowing for a mere 50% efficiency of the applied processes and the overburden, the grade as well as consistency of gold on this target indicated that it is not economically mineable as an alluvial mining program. |
Plans to investigate the alluvial potential of the area surrounding the Kwandege project anomaly as well as several other alluvial targets identified using airborne techniques did not progress due to lack of funding and the resulting shortage of personnel to conduct the program.
| • | completed the geophysical evaluation of our four |
7
completed a detailed structural investigation into structural controls on gold mineralization on our | |
| |
| |
completed a ground geophysics investigation on the Mjembe target to the southeast of Magambazi. |
During the fiscal year ended May 31, 2014, we:
| • | Completed our evaluation process of the application of XRF to identify soil samples with a high likelihood to contain anomalous gold |
Mjembe target. Following the success of the XRF program described |
Identify more potential gold bearing intersections in the core than that was previously analyzed. | ||
Combine the results of the soil sample XRF results with the |
| |
Completed a detailed structural interpretation of the Kwandege target with the aim of completion the final recommendations for the further drilling of this target. | |
Submitted 84 samples for gold assay as a pilot investigation on one of the targets on PL6743/2010. In combination with the large amount of XRF results conducted on this target the soil sampling method will be adapted to yield the best possible results in the Handeni district. | |
Completed mapping and lithogeochemical sampling on Target 5 and submitted samples for gold assays. This remains a target with high potential based on the results of the lithogeochemical gold assays and soil sample results combined with the geophysics. | |
Completed a detailed geological map, a preliminary structural interpretation, a ground magnetic survey as well as detailed soil sampling and XRF analyses on our Mjembe |
13
| • | Initiated mapping programs on Target |
| • | An extensive soil sampling program and ground magnetic survey on the Mjembe target has been completed. Mjembe is located on PL6744/2010 and is a known illegal artisanal mining site. The selected survey and sample area consisted of an approximately 23 km2block. A total of 5,068 soil samples have been analysed for a suite of major and trace elements by desk top Energy Dispersive XRF. Preliminary interpretation suggests that the Mjembe anomalous area represents a target within a plunging sheeth fold on a scale of 10 km by 3.5 km. The geophysics indicates the continuation of this structure in depth to the east of the surface geochemical anomaly. Exploration on each of the anomalies within this structure will now focus on more detailed ground geophysics and mapping to be able to prepare drill targets within the larger Mjembe target area. |
| • | Completed mapping and soil sampling programs on target 15 along 47 km line traverses and collected 932 soil samples. XRF analyses on soil samples completed. Selected samples submitted for Au assays. |
| • | Initiated and completed mapping programs on Target 10 and completed a preliminary soil sampling program on this target (673 samples). XRF analyses were completed and samples selected for Au assays. |
| • | Initiated and completed mapping programs on target 16 and planning of soil sampling program. |
Mkuvia Alluvial Gold Project
The Mkuvia Alluvial Gold Project is comprised of four PLs covering a total area of 380 square kilometers and is located inExploration conducted during the Nachingwea District, Lindi Region of the Republic of Tanzania. The Company is aware that the four prospecting licenses expired during May and June of 2012. The Company is currently evaluating whether any viable interest remains in these PLs, but no final determination has been made as of yet.fiscal year 2015:
| • | The Company now has 5 high potential drill targets of the 17 areas investigated in detail on its approximately 423 km2 license areas in the Handeni district. Significant anomalous results have been achieved on 3 additional targets. |
| • | In addition to the geological and geophysical maps produced using remote sensing techniques, a total of 143 km2(35%) of the license area has been mapped in detail (1:2500 and 1:5000 scale). To date, a total of 37,153 drill and soil samples were taken of which 16,212 were assayed for gold and 19,992 by XRF. |
| • | Target 5 is now a fully fledged drill target based on the geochemistry and geophysics results obtained. Grab samples on this target yielded a maximum of 3.12 g/t of gold. |
| • | Nine hundred and thirty five (935) soil samples collected on Target 6 have been analysed by XRF. The results are discouraging and this target did not receive priority status. |
| • | Exploration on Target 7 (Mjembe) was highly successful and 3 potential drill sites have been delineated within the larger Mjembe target area. The Company is experiencing serious interference and illegal mining activities on all of its Mjembe targets which pose a serious restriction on our exploration activities and the future of our exploration on this target as reported under “Risk Factors - Risks Related to Our Company”. |
| • | Target 8 has been mapped in detail covering an area of approximately 36 km2. The Company is currently evaluating this target for selection of a soil sampling and potential detail geophysics program. The outcome of this will be based on prioritizing this area in relation to the Gole structure program as discussed below. |
| • | Target 10 has been mapped in detail and 674 soil samples taken of which 149 were selected based on our XRF screening technique. Although some elevated gold values were obtained the Company will follow this area up utilizing a newly developed assay technique developed and successfully applied to target 16 as reported below. Due to a lack of funding we cannot immediately embark on this planned work. |
8
| • | Mapping and XRF analyses on 793 samples from Target 15 (Dolly) have been completed. Mineralization and structural features on this anomaly show many similarities with that of Magambazi hill. |
| • | Geological mapping on target 16 has been completed and a preliminary 1,923 soil samples taken. Of these 20 high priority samples were selected for evaluation of a specialized technique designed to detect gold anomalies in geological terrains with a complex gold in soil distribution profile. The results were highly encouraging and values of up to 8 g/t in soils were obtained. The Company will undoubtedly apply this technique to some selected other targets as funding becomes available. |
| • | Detail geological mapping on the Gole sheath fold, a structural feature of 11 km by 4.5 km (Targets 12, 13, 14 and 17), have commenced and is continuing. Potential gold bearing amphibolite zones have been identified, which will be the focus of further investigation. |
| • | Further detailed mapping was conducted on Target 16. This was followed by gold assays using specialized geochemical techniques to test the potential of increasing the effectivity of the Company’s soil sampling program. The results were highly successful and the Company will implement this technique on Target 10 when funds become available. |
Glossary of Terms
The definitions of geological and technical terms used in this Annual Report on Form 10-K are provided below:
| Archaean | The 3,800 million to 2,500 million years period in the earth’s history. |
| Feldspars | A group of minerals most abundant on earth and consisting mainly of K, Na, Ca and Al as well as O (oxygen). |
| Ferromagnesian minerals | Minerals with Fe or Mg as a major chemical component in their composition. |
| Granulites | Granulites are medium to coarse–grained metamorphic rocks that have experienced high temperature metamorphism, composed mainly of feldspars sometimes associated with quartz and anhydrous ferromagnesian minerals. |
| Metamorphic rocks | Rocks that have been subjected to pressure, temperature or chemical conditions different from which they were formed under. |
| Mobile belt | A long, relatively narrow crustal region of tectonic activity. |
| PL | Prospecting license. |
| PLR | Reconnaissance prospecting license. |
| PML | Primary mining license. |
| Proterozoic | The time period from 2,500 million years to 500 million years in the history of the earth. |
| Quartz | A mineral Group consisting mainly of Si and O (oxygen). |
| Ubendian | A phase of mountain building whose precise dates are uncertain but which probably occurred about 1800–1700 Ma ago, producing what is now a NW—SE belt in southern Tanzania, northern Zambia, and the eastern Congo. |
| |
| Usagaran | A metamorphic belt in Tanzania in which deformation took place at about 2,000 million years ago. |
14
Compliance with Government Regulation
We are subject to local laws and regulation governing the exploration, development, mining, production, importing and exporting of minerals; taxes; labor standards; occupational health; waste disposal; protection of the environment; mine safety; toxic substances; and other matters. We require licenses and permits to conduct exploration and mining operations. Amendments to current laws and regulations governing operations and activities of mining companies or more stringent implementation thereof could have a material adverse impact on our Company. Applicable laws and regulations will require us to make certain capital and operating expenditures to initiate new operations. Under certain circumstances, we may be required to close an operation once it is started until a particular problem is remedied or to undertake other remedial actions. This would have a material adverse effect on our results and financial condition.
OurFour of our mineral interests in Tanzania are currently held under PLs granted pursuant to the Mining Act for an initial period of three years and are renewable in two successive periods of two years only. The annual rental fees followingremaining four PL’s are being held under the 2010 Mining Act and are valid for an initial period of 4 years (the initial period expiring in 2018 (Table 2)). Following this the first renewal will be US$150 per square kilometer per yearis for 3 years and following the second renewal for 2 years, each renewal accompanied by a mandatory relinquishment of at least 50% of the rental fee will be US$200 per square kilometer per year.license area. The application fees are $300 on initial application and $300 for each renewal. There is also an initial one-time “preparation fee” of $200 per license. Upon renewal, we pay a preparation fee of $300 per$500 applicable on each license. Renewals of our PLs can take many monthsThe annual rent for the licenses are $100/km2 (initial period), $150/km2 (1st renewal) and even years to process by the regulatory authority in Tanzania.$200/km2 (2nd renewal).
9
All PLs in Tanzania require the holder to employ and train local residents, typically amounting to $5,000 per year, and make exploration expenditures, as set out in the Mining Act. At each renewal, at least 50% of our licensed area must be relinquished. If we wish to keep the relinquished one-half portion, we must file a new application for the relinquished portion.
The geographical area covered by a PL may contain one or more previously granted PML’s. A PML is a mining license granted only to a Tanzanian citizen consisting of an area of not to exceed 10 hectares. Once a PL is granted, no additional PMLs can be granted within the geographical area covered by the PL. The PL is subject to the rights of previously granted and existing PMLs. The holder of a PL will have to work around the geographical area of the PML unless the PL holder acquires the PML and any rights to the land covered by the PML.
We must hold a mining license to carry onout mining activities, which are granted only to the holder of a PL covering a particular area. A mining license is granted for a period of 25 years or the life of the mine. It is renewable after 10 years for a period not exceeding 15 years. Other than the PMLs being held under Handeni Resources, we do not hold any mining licenses, only PL’s. An application for the 32 PMLs being held under agreement by Handeni Resources to be changed into a MLmining license (ML) is underway. Prospecting and mining license holders must submit regular reports in accordance with mining regulations. Upon commercial production, the government of Tanzania imposes a royalty on the gross value of all production at the rate of 3% of all gold produced. The applicable regulatory body in Tanzania is the Ministry of Energy and Minerals.
In July 1999, environmental management and protection regulations under the Mining Act came into force. An environmental impact statement and an environmental management plan must accompany special mining license, mining license and gemstone mining license applications for mineral rights. In addition to the establishment of environmental regulations, the Tanzanian government has improved management procedures for effective monitoring and enforcement of these regulations by strengthening the institutional capacity, especially in the field offices. The government has provided rules for the creation of reclamation funds to reinstate land to alternative uses after mining and it has developed guidelines for mining in restricted areas, such as forest reserves, national parks, near sources of water and other designated areas. These regulations have not had any material effect on our operations to date.
Competition
We operate in a highly competitive industry, competing with other mining and exploration companies, and institutional and individual investors, which are actively seeking minerals exploration properties throughout the world together with the equipment, labour and materials required to exploit such properties. Many of our competitors have financial resources, staff and facilities substantially greater than ours. The principal area of competition is encountered in the financial ability to cost effectively acquire prime minerals exploration prospects and then exploit such prospects. Competition for the acquisition of minerals exploration properties is intense, with many properties available in a competitive bidding process in which we may lack technological information or expertise available to other bidders. Therefore, we may not be successful in acquiring, exploring and developing profitable properties in the face of this competition. No assurance can be given that a sufficient number of suitable minerals exploration properties will be available for acquisition, exploration and development.
Employees
Other than our directors and executive officers, we had approximate sixfour full-time equivalent employees and consultants as of May 31, 20142015 located in Tanzania. We also retainutilize independent geologists and consultants on a contract basis to conduct the work programs on our mineral properties in order to carry out our plan of operations.
Research and Development Expenditures
We have not incurred any research or development expenditures since our incorporation.
15
Subsidiaries
The Company has two subsidiaries, both of which are Tanzanian companies: (i) HG Limited (formerly DLM Tanzania Limited); and (ii) Douglas Lake Tanzania Limited, which is inactive.
Patents and Trademarks
We do not own, either legally or beneficially, any patent or trademark.
| ITEM 1A. | RISK FACTORS |
An investment in a company engaged in mineral exploration involves an unusually high amount of risk, both unknown and known, present and potential, including, but not limited to the risks enumerated below. An investment in our common stock involves a number of very significant risks. You should carefully consider the following risks and uncertainties in addition to other information in this annual report in evaluating our Company and its business before purchasing shares of our common stock. Our business, operating results and financial condition could be seriously harmed or cause actual results to differ materially from those projected in any forward-looking statements due to any of the following risks. The risks described below may not be all of the risks facing our Company. Additional risks not presently known to us or that we currently considerimmaterial may also impair our business operationsand we cannot assure you that we will successfully address these risks or other unknown risks that may affect our business. You could lose all or part of your investment due to any of these risks.
10
Risks Related to Our Company
We have incurred net losses since our inception and expect losses to continue.
We have not been profitable since our inception. For the fiscal year ended May 31, 2014,2015, we had a net loss of $2,293,595.$1,165,962. Since our inception on January 5, 2004 to May 31, 2014,2015, we had an accumulated net loss of $115,942,287.$117,108,249. We have not generated revenues from operations and do not expect to generate revenues from operations unless and until we are able to bring a mineral property into production. The expenditures to be made by us in the exploration of our properties may not result in discoveries of commercially recoverable mineral reserves. There is a risk that we may never bring a mineral property into production that our operations will not be profitable in the future and you could lose your entire investment.
We may not be able to continue as a going concern if we do not obtain additional financing or attain profitable operations.
Our independent accountants’ audit report states that there is substantial doubt about our ability to continue as a going concern. The Company's ability to continue as a going concern is dependent upon attaining profitable operations and obtaining sufficient financing to meet obligations and continue exploration and development activities. We have incurred only losses since our inception. Whether and when the Company can attain profitability is uncertain. These uncertainties cast significant doubt upon the Company’s ability to continue as going concern, because we will be required to obtain additional funds in the future to continue our operations and there is no assurance that we will be able to obtain such funds, through equity or debt financing, or any combination thereof, or we are able to raise additional funds, that such funds will be in the amounts required or on terms favourable to us.
Our exploration activities are highly speculative and involve substantial risks.
The mineral properties that we held interests in during our year ended May 31, 20142015 are in the exploration stage and no proven mineral reserves have been established. Our exploration work may not result in the discovery of mineable deposits of ore in a commercially economical manner. There may be limited availability of water, which is essential to mining operations, and interruptions may be caused by adverse weather conditions. Our operations are subject to a variety of existing laws and regulations relating to exploration and development, permitting procedures, safety precautions, property reclamation, employee health and safety, air quality standards, pollution and other environmental protection controls. Our exploration activities are subject to substantial hazards, some of which are not insurable or may not be insured for economic reasons. Any of these factors could have a material adverse effect on our results and financial condition.
We cannot accurately predict whether commercial quantities of ores will be established.
Whether an ore body will be commercially viable depends on a number of factors beyond our control, including the particular attributes of the deposit such as size, grade and proximity to infrastructure, as well as mineral prices and government regulations, including regulations relating to prices, taxes, royalties, land tenure, land use, importing and exporting of minerals and environmental protection. We cannot predict the exact effect of these factors, but the combination of these factors may result in a mineral deposit being unprofitable which would have a material adverse effect on our business. We have no mineral producing properties at this time. We have not defined or delineated any proven or probable reserves or resources on any of our properties to date.
16
We may not be able to establish the presence of minerals on a commercially viable basis.
Substantial expenditures will be required to develop the exploration infrastructure at any site chosen for exploration, to establish ore reserves through drilling, to carry out environmental and social impact assessments, and to develop metallurgical processes to extract the metal from the ore. We may not be able to discover minerals in sufficient quantities to justify commercial operation, and we may not be able to obtain funds required for exploration on a timely basis. Accordingly, you could lose your entire investment.
We will need to incur substantial expenditures in an attempt to establish the economic feasibility of mining operations by identifying mineral deposits and establishing ore reserves through drilling and other techniques, developing metallurgical processes to extract metals from ore, designing facilities and planning mining operations. The economic feasibility of a project depends on numerous factors beyond our control, including the cost of mining and production facilities required to extract the desired minerals, the total mineral deposits that can be mined using a given facility, the proximity of the mineral deposits to a user of the minerals, and the market price of the minerals at the time of sale. Our existing or future exploration programs or acquisitions may not result in the identification of deposits that can be mined profitably and you could lose your entire investment.
Our competition is intense in all phase of our business.
We operate in a highly competitive industry, competing with other mining and exploration companies, and institutional and individual investors, which are actively seeking minerals exploration properties throughout the world together with the equipment, labour and materials required to exploit such properties. Many of our competitors have financial resources, staff and facilities substantially greater than ours. The principal area of competition is encountered in the financial ability to cost effectively acquire prime minerals exploration prospects and then exploit such prospects. Competition for the acquisition of minerals exploration properties is intense, with many properties available in a competitive bidding process in which we may lack technological information or expertise available to other bidders. Therefore, we may not be successful in acquiring, exploring and developing profitable properties in the face of this competition. No assurance can be given that a sufficient number of suitable minerals exploration properties will be available for acquisition, exploration and development.
11
Our exploration activities are subject to various local laws and regulations
We are subject to local laws and regulation governing the exploration, development, mining, production, importing and exporting of minerals; taxes; labor standards; occupational health; waste disposal; protection of the environment; mine safety; toxic substances; and other matters. We require licenses and permits to conduct exploration and mining operations. Amendments to current laws and regulations governing operations and activities of mining companies or more stringent implementation thereof could have a material adverse impact on our Company. Applicable laws and regulations will require us to make certain capital and operating expenditures to initiate new operations. Under certain circumstances, we may be required to close an operation once it is started until a particular problem is remedied or to undertake other remedial actions. This would have a material adverse effect on our results and financial condition.
We have uninsurable risks.
We may be subject to unforeseen hazards such as unusual or unexpected formations and other conditions. We may become subject to liability for pollution, cave-ins or hazards against which we cannot insure or against which we may elect not to insure. The payment of such liabilities may have a material adverse effect on our financial position.
Exploration activities, including test mining and operating activities are inherently hazardous.
Mineral exploration activities, including test mining activities, involve many risks that even a combination of experience, knowledge and careful evaluation may not be able to overcome.
Operations that we undertake will be subject to all the hazards and risks normally incidental to exploration, test mining and recovery of gold and other metals, any of which could result in work stoppages, damage to property and possible environmental damage. The nature of these risks are such that liabilities might result in us being forced to incur significant costs that could have a material adverse effect on our financial condition and business prospects.
We depend on key management personnel.
The success of our operations and activities is dependent to a significant extent on the efforts and abilities to attract and maintain qualified key management and technical personnel. Competition for such personnel is intense and we may not be able to attract and retain such personnel. We do not maintain key-man life insurance on any of our officers. A loss of any of them could adversely affect our business.
Our officers and directors may have potential conflicts of interest due to their responsibilities with other entities.
The officers and directors of the Company serve as officers and/or directors of other companies in the mining industry, which may create situations where the interests of the director or officer may become conflicted. The companies to which some of our officers and directors provide services may be potential competitors with the Company at some point in the future. The directors and officers owe the Company fiduciary duties with respect to any current or future conflicts of interest.
17
We may experience difficulty managing our anticipated growth.
We may be subject to growth-related risks including capacity constraints and pressure on our internal systems and controls. Our ability to manage growth effectively will require us to continue to implement and improve our operational and financial systems and to attract and retain qualified management and technical personnel to meet the needs of our anticipated growth. Our inability to deal with this growth could have a material adverse effect on our business, financial condition, results of operations and prospects.
We are subject to the volatility of metal and mineral prices.
The economics of developing metal and mineral properties are affected by many factors beyond our control including, without limitation, the cost of operations, variations in the grade ore or resource mined, and the price of such resources. The market prices of the metals for which we are exploring are highly speculative and volatile. Depending on the price of gold or other resources, we may determine that it is impractical to commence or continue commercial production. The price of gold has fluctuated widely in recent years. The price of gold and other metals and minerals may not remain stable, and such prices may not be at levels that will make it feasible to continue our exploration activities, or commence or continue commercial production.
We may not have clear title to our properties.
Acquisition of title to mineral properties is a very detailed and time-consuming process, and title to our properties may be affected by prior unregistered agreements or transfer, or undetected defects. Our prospecting licenses are subject to renewal by the Ministry of Energy and Minerals of Tanzania. There is a risk that we may not have clear title to all our mineral property interests, or they may be subject to challenge or impugned in the future, which would have a material adverse effect on our business.
We are currently experiencing an unprecedented influx of illegal artisanal activity on our Kwandege target area as well as (particularly) on several high priority targets on our larger Mjembe target area. We have lodged formal complaints on several occasions to local, regional and central government authorities including the Commissioner of Energy and Minerals at the Ministry of Energy and Minerals. To date, we have had little success with the removal of the illegal artisanal miners from our target areas. Despite our having clearly defined rights and there being no dispute that the activities of the artisanal miners are illegal, the political will to address the issue seems to be lacking. We see this as a serious threat to our on-going activities in Tanzania.
12
Our mineral property interests may be subject to other mining licenses.
Local residents in Tanzania may have registered the right to mine in small areas located within a prospecting license,license; such rights are evidenced by a mining license. There can be no guarantee that we will be successful in negotiating with mining license owners to acquire their rights if we determine that we need their permission to drill or mine on the land covered by such mining licenses.
We have requirements for and there is an uncertainty of access to additional capital.
At May 31, 2014,2015, we had cash of $532,694$85,985 and a working capital deficitdeficiency of $875,519.$382,358. We will continue to incur exploration costs to fund our plan of operations and intend to fund our plan of operations from working capital, equity subscriptions and debt financing. Ultimately, our ability to continue our exploration activities depends in part on our ability to commence operations and generate revenues or to obtain financing through joint ventures, debt financing, equity financing, production sharing agreements or some combination of these or other means. There can be no assurance that we will be able to obtain any such financing.
We have no cash flow from operations and depend on equity financing for our operations.
Our current operations do not generate any cash flow. Any work on our properties may require additional equity financing. If we seek funding from existing or new joint venture partners, our project interests will be diluted. If we seek additional equity financing, the issuance of additional shares will dilute the current interests of our shareholders. We may not be able to obtain additional funding to allow us to fulfill our obligations on our existing exploration property or any future exploration properties. Our failure to obtain such additional financing could result in delay or indefinite postponement of further exploration and the possible partial or total loss of our potential interest in certain properties or dilution of our interest in certain properties which would have a material adverse effect on our business.
Our directors and officers are indemnified for any monies they pay in settlement of actions performed while a director or officer.
Sections 78.7502 and 78.751 of the Nevada Revised Statutes provide for indemnification of our officers and directors in certain situations where they might otherwise personally incur liability, judgments, penalties, fines and expenses in connection with a proceeding or lawsuit to which they might become parties because of their position with our Company. We have authorized the indemnification of our officers and directors to the full extent available under the Nevada Revised Statutes.
Risks related to government controls and regulations
We are subject to complex federal, provincial, state, local and other laws, controls and regulations that could adversely affect the cost, manner and feasibility of conducting our operations.
Mineral exploration, production, marketing and transportation activities are subject to extensive controls and regulations imposed by various levels of government, which may be amended from time to time. Governments may regulate or intervene with respect to price, taxes, and the exportation. Regulations may be changed from time to time in response to economic or political conditions. The implementation of new regulations or the modification of existing regulations affecting the mining industry could increase our costs, any of which may have a material adverse effect on our business, financial condition, results of operations and prospects. In addition, in order to conduct operations, we require licenses from various governmental authorities. We cannot assure you that we will be able to obtain all of the licenses and permits that may be required to conduct operations that we may desire to undertake.
18
Our business activities are conducted in Tanzania.
Our mineral exploration activities in Tanzania may be affected in varying degrees by political stability and government regulations relating to the mining industry and foreign investment in that country. The government of Tanzania may institute regulatory policies that adversely affect the exploration and development (if any) of our properties. Any changes in regulations or shifts in political conditions in this country are beyond our control and may materially adversely affect our business. While the Company’s management will propose a measure to mitigate the effects, our operations may be affected in varying degrees by government regulations with respect to restrictions on production, price controls, export controls, foreign exchange controls, income taxes, expropriation of property, environmental legislation and mine safety.
As a public company, our compliance costs and risks have increased in recent years.
Legal, accounting and other expenses associated with public company reporting requirements have increased significantly in the past few years. We anticipate that general and administrative costs associated with regulatory compliance will continue to increase with on-going compliance requirements under the Sarbanes-Oxley Act of 2002, as well as any new rules implemented by the SEC in the future. These rules and regulations have significantly increased our legal and financial compliance costs and made some activities more time consuming and costly. We cannot assure you that we will effectively meet all of the requirements of these regulations, including Section 404 of the Sarbanes-Oxley Act. Any failure to effectively implement internal controls, or to resolve difficulties encountered in their implementation, could harm our operating results, cause us to fail to meet reporting obligations, or result in our principal executive officer and principal financial officer being required to give a qualified assessment of our internal control over financial reporting. Any such result could cause investors to lose confidence in our reported financial information, which could have a material adverse effect on the trading price of our common stock and our ability to raise capital. These rules and regulations have made it more difficult and more expensive for us to obtain director and officer liability insurance in the future. As a result, it may be more difficult for us to attract and retain qualified individuals to serve on our board of directors or as executive officers.
13
Risks Related to Our Common Stock
The trading price of our common stock may be volatile.
The price of our common shares may increase or decrease in response to a number of events and factors, including: trends in the mineral sector in which we operate; changes in the market price of gold; current events affecting the global economic situation; changes in financial estimates; our acquisitions and financings; quarterly variations in our operating results; the operating and share price performance of other companies that investors may deem comparable; and purchase or sale of blocks of our common shares. These factors, or any of them, may materially adversely affect the prices of our common shares regardless of our operating performance.
A decline in the price of our common stock could affect our ability to raise further working capital and adversely impact our operations.
A decline in the price of our common stock could result in a reduction in the liquidity of our common stock and a reduction in our ability to raise additional capital for our operations. Because our operations to date have been principally financed through the sale of equity securities, a decline in the price of our common stock could have an adverse effect upon our liquidity and our continued operations. A reduction in our ability to raise equity capital in the future would have a material adverse effect upon our business plan and operations, including our ability to continue our current operations. If our stock price declines, we may not be able to raise additional capital or generate funds from operations sufficient to meet our obligations.
We could be required to rescind an offering of our shares.
On January 23, 2006, the Pennsylvania Securities Commission (“PSC”) issued an inquiry letter to our Company. The inquiry alleged that we offered and sold securities to investors without being in compliance with Regulation D and without registration. The PSC notified us that an acceptable course of action was for us to offer the Pennsylvania state residents an opportunity to rescind their investment with us. While the Pennsylvania state residents have rejected our offer to repurchase their shares, we do not plan to make the same offer to our other US investors, residents of California, or our British Columbia resident investors. If the investors invoke their rescission right or if any securities commission requires us to offer a right of rescission to the investors, we may have to refund the related funds.
Our stock is a penny stock. Trading of our stock may be restricted by the SEC’s penny stock regulations and FINRA’s sales practice requirements, which may limit a stockholder’s ability to buy and sell our stock.
Our common stock will be subject to the “Penny Stock” Rules of the SEC, which will make transactions in our common stock cumbersome and may reduce the value of an investment in our common stock.
19
Our common stock is quoted on the OTC Pink, which is generally considered to be a less efficient market than markets such as NASDAQ or the national exchanges, and which may cause difficulty in conducting trades and difficulty in obtaining future financing. Further, our securities will be subject to the “penny stock rules” adopted pursuant to Section 15(g) of the Securities Exchange Act of 1934, as amended (the “Exchange Act”). The penny stock rules apply generally to companies whose common stock trades at less than $5.00 per share, subject to certain limited exemptions. Such rules require, among other things, that brokers who trade “penny stock” to persons other than “established customers” complete certain documentation, make suitability inquiries of investors and provide investors with certain information concerning trading in the security, including a risk disclosure document and quote information under certain circumstances. Many brokers have decided not to trade “penny stock” because of the requirements of the “penny stock rules” and, as a result, the number of broker-dealers willing to act as market makers in such securities is limited. In the event that we remain subject to the “penny stock rules” for any significant period, there may develop an adverse impact on the market, if any, for our securities. Because our securities are subject to the “penny stock rules”, investors will find it more difficult to dispose of our securities. Further, it is more difficult: (i) to obtain accurate quotations, (ii) to obtain coverage for significant news events because major wire services, such as the Dow Jones News Service, generally do not publish press releases about such companies, and (iii) to obtain needed capital.
In addition to the “penny stock” rules promulgated by the SEC, the Financial Industry Regulatory Authority (“FINRA”) has adopted rules that require a broker-dealer to have reasonable grounds for believing that an investment is suitable for a customer when recommending the investment to that customer. Prior to recommending speculative low-priced securities to their non-institutional customers, broker-dealers must make reasonable efforts to obtain information about the customer’s financial status, tax status, investment objectives and other information. Under interpretations of these rules, FINRA believes that there is a high probability that speculative low priced securities will not be suitable for at least some customers. FINRA requirements make it more difficult for broker-dealers to recommend that their customers buy our common stock, which may limit your ability to buy and sell our stock and have an adverse effect on the market for our shares.
| ITEM 1B. | UNRESOLVED STAFF COMMENTS |
None.
| ITEM 2. | PROPERTIES |
Our principal office is currently located at P.O. Box 33507, Plot 82A, ITV Road, Mikocheni Light Industrial Area, Dar es Salaam, the United Republic of Tanzania and our Canada office is located at Suite 500-666 Burrard200, 5700 Yonge Street, Vancouver, British Columbia, V6C 3P6,Toronto, Ontario, M2M 4K2, Canada.
Our mineral claim interests and the properties underlying such interests are described above under Item 1, “Business”.
14
| ITEM 3. | LEGAL PROCEEDINGS |
Except as disclosed below, management is not aware of any legal proceedings contemplated by any governmental authority or any other party involving us or our properties. As of the date of this report, no director, officer or affiliate is (i) a party adverse to us in any legal proceeding or (ii) has an adverse interest to us in any legal proceedings. Management is not aware of any other legal proceedings pending or that have been threatened against us or our properties.
On February 8, 2012, Ruby Creek Resources Inc. (“RCR”) filed a lawsuit against the Company in the Supreme Court, State of New York, in which RCR alleges that the Company participated in a fraudulent transfer of certain mineral property interests in Tanzania that RCR had the right to purchase pursuant to a series of agreements with the Company. The Company is of the view that such allegations arewere without merit and intends to continue to vigorously contestcontested the action.
On February 23, 2012, the Company filed a lawsuit against RCR in the Supreme Court of British Columbia (the “British Columbia Action”), seeking relief for RCR’s breach of its payment obligations under the above-referenced agreements and seeking an order that RCR remove the U.S. restrictive legend from 4,000,000 RCR shares issued to the Company under the agreements. To date, RCR is in default with respect to over $1.3 million in scheduled payments due to the Company under the agreements.
In addition to the British Columbia Action, on May 21, 2012 in answering RCR’s claim in New York, the Company counter claimedcounterclaimed against RCR on the basis of the alleged breaches set out in the British Columbia Action (the “New York Counter Claim”). On November 19, 2012, the British Columbia Action was dismissed on the grounds that the Court in British Columbia did not have jurisdiction and further that the dismissal was without prejudice to either of the Company’s and RCR’s respective actions in New York against one another. This Order was granted by consent of both the Company and RCR.
On January 13, 2015, the Company and RCR reached a binding settlement regarding the above-referenced litigation. The New York actionsettlement does not require any monetary payment by the Company to RCR. Under the terms of the settlement, the Company will turn over its interest in Ruby Creek Resources (Tanzania) Limited and has agreed to return to RCR the 4,000,000 shares of restricted RCR common stock previously issued to the Company. Both parties have agreed to dismiss their respective claims, with prejudice, and the litigation is now inconcluded. Although the deposition phaseCompany has not yet received formal settlement documents from RCR as agreed, the settlement is binding and the litigation is proceeding toward the end of discovery.concluded.
On October 25, 2012, Craig Alford filed a lawsuit against the Company in the Supreme Court of British Columbia for breach of an alleged employment agreement. Mr. Alford claims the agreement was for a term of three years, commencing on March 1, 2011, with a monthly salary of $12,500. Mr. Alford claims that the Company wrongfully terminated the agreement in October 2011 and is seeking judgment in the amount of $362,500. The Company is of the view that the allegation is without merit and intends to vigorously contest the action. On February 4, 2013 the Company filed its response to Mr. Alford’s claim with the Supreme Court of British Columbia.
20
| ITEM 4. | MINE SAFETY DISCLOSURES |
Not applicable.
PART II
| ITEM 5. | MARKET FOR REGISTRANT’S COMMON EQUITY, RELATED STOCKHOLDER MATTERSAND ISSUER PURCHASES OF EQUITY SECURITIES |
Market Information
Our shares of common stock were quoted for trading on the OTC Bulletin Board under the symbol “DLKM.OB” on March 23, 2005. On February 14, 2012, the Company changed its name to Handeni Gold Inc., and its trading symbol was changed to “HNDI”. Our common stock is currently trading on OTCPINKOTC Pink market tier. The market for our common stock is limited, volatile and sporadic. The following table sets forth the high and low prices relating to our common stock for the periods indicated, as provided by the OTC Bulletin Board. These quotations reflect inter-dealer prices without retail mark-up, mark-down, or commissions, and may not reflect actual transactions.
| QUARTER ENDED | HIGH | LOW | HIGH | LOW |
| May 31, 2015 | $0.007 | $0.002 | ||
| February 28, 2015 | $0.017 | $0.002 | ||
| November 30, 2014 | $0.004 | $0.002 | ||
| August 31, 2014 | $0.007 | $0.002 | ||
| May 31, 2014 | $0.025 | $0.003 | $0.025 | $0.003 |
| February 28, 2014 | $0.010 | $0.002 | $0.010 | $0.002 |
| November 30, 2013 | $0.024 | $0.003 | $0.024 | $0.003 |
| August 31, 2013 | $0.020 | $0.007 | $0.020 | $0.007 |
| May 31, 2013 | $0.029 | $0.008 | $0.029 | $0.008 |
| February 28, 2013 | $0.040 | $0.008 | ||
| November 30, 2012 | $0.030 | $0.002 | ||
| August 31, 2012 | $0.049 | $0.020 | ||
| May 31, 2012 | $0.129 | $0.029 | ||
15
Holders
As at August 18, 2014,2015, we had 321,416,654 shares of our common stock issued and outstanding, which were held by approximately 147152 registered holders.
Our transfer agent is Transhare Corporation, whose address is 4626 S. Broadway, Englewood, CO 80113, U.S.A., telephone phone number is 303-662-1112 and fax number is 303-662-1113.
Dividend Policy
No dividends have been declared or paid on our common stock. We have incurred recurring losses and do not currently intend to pay any cash dividends in the foreseeable future.
Securities Authorized For Issuance Under Compensation Plans
We adopted a Stock Option Plan, dated April 27, 2007 (the “2007 Stock Option Plan”), under which we were authorized to grant stock options to acquire up to a total of 10,000,000 shares of common stock. No more options may be granted or exercised under the 2007 Stock Option Plan.
We adopted an additional Stock Option Plan, dated October 20, 2008 (the “2008 Stock Option Plan”), under which we were authorized to grant stock options to acquire up to a total of 10,000,000 shares of common stock. No more options may be granted or exercised under the 2008 Stock Option Plan.
We adopted an additional Stock Option Plan, dated August 11, 2010 (the “August 2010 Stock Option Plan”), under which we were authorized to grant stock options to acquire up to a total of 10,000,000 shares of common shares. No more options may be granted or exercised under the August 2010 Stock Option.
We adopted an additional Stock Incentive Plan, dated November 29, 2010 (the “November 2010 Stock Incentive Plan”), under which we are authorized to grant stock and/or stock options to acquire up to a total of 40,000,000 shares of common shares. The following summary of the November 2010 Stock Incentive Plan is not complete and is qualified in its entirety by reference to the November 2010 Stock Incentive Plan, a copy of which is incorporated by reference to our Annual Report on Form 10-K for the year ended May 31, 2011.
The November 2010 Stock Incentive Plan provides for the granting of stock options, stock appreciation rights, stock and other equity awards as set out in the November 2010 Stock Incentive Plan to our directors, officers, employees or consultants. The maximum number of shares that may be issued under the November 2010 Stock Incentive Plan are 40,000,000 shares of our common stock. As of May 31, 20142015 and the date of this report, there remained 10,700,000 shares of common stock available to be issued under the November 2010 Stock Incentive Plan. No insider of the Company is eligible to receive an award under the Plan where (i) the insider is not a director or senior officer of the Company, (ii) any award, together with all of the Company’s previously established or proposed awards under the Plan could result at any time in (a) the number of shares reserved for issuance pursuant to options granted to the insider exceeding 50% of the outstanding issue of common stock or (b) the issuance to the insider pursuant to the exercise of options within a one-year period of the number of shares exceeding 50% of the outstanding issue of our common stock. Unless the administrator under the Plan determines that an award to a grantee is not designed to qualify as performance-based compensation, the maximum number of shares with respect to options and/or stock appreciation rights that may be granted during any one calendar year under the November 2010 Stock Option Plan to any one grantee is 20,000,000, all of which may be granted as incentive stock options, and the maximum aggregate grant of restricted stock, unrestricted shares, restricted stock units and deferred stock units in any one calendar year to any one grantee is 20,000,000. The November 2010 Stock Incentive Plan is administered by a committee consisting of two or more members of our Board of Directors, who have the authority to, among other things, interpret the November 2010 Stock Option Plan, select eligible participants, determine whether and to what extent awards are granted under the November 2010 Stock Option Plan, approve award agreements under the November 2010 Stock Incentive Plan and amend the terms of any outstanding award granted under the November 2010 Stock Incentive Plan.
21
The table set forth below presentspresenting information relating to our equity compensation plans as of the date of May 31, 2014:2015:
Plan Category | Number of Securities to be Issued Upon Exercise of Outstanding Options, Warrants and Rights (a) | Weighted-Average Exercise Price of Outstanding Options, Warrants and Rights (b) | Number of Securities Remaining Available for Future Issuance Under Equity Compensation Plans (excluding column (a)) |
| Equity Compensation Plans to be Approved by Security Holders | N/A | N/A | N/A |
Equity Compensation Plans Not Approved by Security Holders (2007, 2008, August 2010 and November 2010 Stock Incentive Plans) | 28,300,000 | $0.23 | 10,700,000 |
| Plan Category | Number of Securities to be Issued Upon Exercise of Outstanding Options, Warrants and Rights (a) | Weighted-Average Exercise Price of Outstanding Options, Warrants and Rights (b) | Number of Securities Remaining Available for Future Issuance Under Equity Compensation Plans (excluding column (a)) |
| Equity Compensation Plans to be Approved by Security Holders | N/A | N/A | N/A |
| Equity Compensation Plans Not Approved by Security Holders (2007, 2008, August 2010 and November 2010 Stock Incentive Plans) | 28,300,000 | $0.23 | 10,700,000 |
16
Recent Sales of Unregistered Securities
None.
No Repurchases
Neither we nor any affiliated purchaser has made any purchases of our equity securities during the fourth quarter of our fiscal year ended May 31, 2014.2015.
| ITEM 6. | SELECTED FINANCIAL DATA |
We are a smaller reporting company as defined by Rule 12b-2 of the Exchange Act and are not required to provide the information required under this item.
22
| ITEM 7. | MANAGEMENT’S DISCUSSION AND ANALYSIS OF FINANCIAL CONDITION AND RESULTS OFOPERATIONS |
The following discussion of our financial condition, changes in financial position, plan of operations and results of operations should be read in conjunction with (i) our audited consolidated financial statements as at May 31, 2014, May 31, 20132015 and for the period from inception (January 5, 2004) to May 31, 2014 and (ii) the section entitled “Business” included in this annual report. All financial information in this Management’s Discussion and Analysis (“MD&A” or the “discussion”) is expressed and prepared in conformity with U.S. generally accepted accounting principles. All dollar references are to the U.S. dollar, the Company’s reporting currency, unless otherwise noted. Some numbers in this MD&A have been rounded to the nearest thousand for discussion purposes.
FORWARD-LOOKING STATEMENTS
This MD&A contains forward-looking statements that involve risks, uncertainties and assumptions with respect to the Company’s activities and future financial results, which are made based upon management’s current expectations and beliefs. These forward-looking statements involve risks and uncertainties, including statements regarding the Company’s capital needs, business plans and expectations. Our actual results may differ materially from those anticipated in these forward-looking statements as a result of many factors, including, but not limited to, those set forth under “Risk Factors” and elsewhere in this annual report. Any statements contained herein that are not statements of historical facts may be deemed to be forward-looking statements. Management disclaims any obligation to publicly update these statements, or disclose any difference between its actual results and those reflected in these statements. Given these uncertainties, readers are cautioned not to place undue reliance on such forward-looking statements.
Overview
To take advantage of Tanzania’s rich natural resources, theThe Company is engaged in the acquisition and exploration of mineral properties in the United Republic of Tanzania, Africa, through its wholly-owned subsidiaries, HG Limited (formerly: DLM Tanzania Limited), and Douglas Lake Tanzania Limited which is inactive. Over these years, the Company has built strong relationships with the Ministry of Mines, the Geological Survey of Tanzania, and other government agencies in Tanzania.
In the past fourfive years, the Company has focused exclusively on its Handeni Gold Project located in Tanzania. The Company’s exploration activities conducted in the past two fiscal years were outlined under Item 1. Business – Our Mineral Claims, above.
Our exploration program and achievements during our fiscal year ended May 31, 20142015 are highlighted as follows:
| a) | The Company now has 5 high potential drill targets (1, 2, 5, 7 and 16) of the 17 areas investigated in detail on its approximately 423 km2license areas in the Handeni district. Significant anomalous results have been achieved on 3 additional targets. We consider this a major achievement, specifically with reference to the Handeni terrane and complexity of gold occurrences in the district. We envisage drilling programs on each of these targets. |
| b) | Three (3) more targets (8, 10 and 15) have significant gold anomalies based on exploration conducted thus far. Progress in terms of soil sampling, detail ground geophysics, pitting, trenching and assaying on these are hampered by a lack of funding and the Company may need to re-evaluate its exploration program by relinquishing lower priority targets (such as those on the Gole structure) to focus on those on which anomalous gold have already been delineated. |
| c) | Targets 4 and 11 are considered lower priority, but work on them will continue as funds become available. The major effort for the time being on these areas will be focused on XRF analyses. |
| d) | Mapping and geophysics conducted thus far on the four (4) Gole targets (12, 13, 14 and 17) point towards the need for an intensive ground geophysics program followed by trenching and pitting over a large area. The Company is not currently in a position to fund thus and will, for the time being, focus its efforts on higher priority areas. |
| e) | We completed our evaluation process of the application of XRF to identify soil samples with a high likelihood to contain anomalous gold |
17
| f) | We analysed a total of | |
We completed the XRF analyses of 5,672 soil samples, standards and blanks of | ||
We completed a detailed structural interpretation of the Kwandege target with the aim of completion the final recommendations for the further drilling of this target. | ||
We submitted 84 samples for gold assay as a pilot investigation on one of the targets on PL6743/2010. In combination with the large amount of XRF results conducted on this target the soil sampling method will be adapted to yield the best possible results in the Handeni district. | ||
We completed mapping and lithogeochemical sampling on Target 5 and submitted samples for gold assays. This remains a target with high potential based on the results of the lithogeochemical gold assays and soil sample results combined with the geophysics. | ||
We completed a detailed geological map, a preliminary structural interpretation, a ground magnetic survey as well as detailed soil sampling and XRF analyses on our Mjembe target. The results defined a significant potential gold mineralization zone with a high correlation between geochemical, structural and geophysical data. | ||
We | ||
|
23
Plan of Operations
Our plan of operations through our next fiscal year ending May 31, 20152016 is to continue to focus on the exploration of our Handeni mineral property in Tanzania, and the budget for this plan requires approximately $0.8$0.6 million for our plan of the exploration work, $100,000 for mineral licenses fees and $0.9a minimum of $0.6 million for our general and administration expenses, professional and consulting fees and other operating expenses.
Handeni Gold Inc. has clearly identifiable goals for its exploration program in Tanzania:
| a) | As previously reported the Company will focus on its regional target identification for the remainder of the fiscal year 2016 on the Gole 11 km by 4.5 km sheath fold, a feature with a combination of geological elements rendering it having high potential for gold mineralization based on experience in the district. This will conclude the Company’s regional target identification program in the Handeni area. |
| b) | Continue exploration on drill targets simultaneously with the completing of the regional program. |
| c) | Reduce the Company’s license holding in the Handeni district significantly by the end of the fiscal year 2016 to include only identified drill targets. |
| d) | Continue efforts to secure funding for drilling on drill targets. |
Management believes that the Company is on its way to achieve these goals.
Illegal artisanal activity on the Company’s license areas is increasing. The Company is addressing this issue with responsible local and central government authorities. The Company will follow all available legal structures to protect its interests.
Other low cost exploration related activities currently under waybeing conducted on a continuous basis on the Company’s Handeni licenses include:
| a) | Identification of potential alluvial mining areas other than those currently known and being evaluated by utilizing remote sensing activities. | |
| b) | A detailed interpretation of already collected geophysical data, specifically aimed at Target 8 and the Mjembe target. | |
| c) | A petrological, geochemical and mineralogical investigation of the Kwandege drill core to understand the style of gold mineralization at this locality. | |
| d) | The planning and siting of drill holes as a follow up Reverse Circulation program to evaluate the near – surface potential of the Kwandege target. | |
| ||
| ||
| ||
|
The estimated budget for the completion of these exploration programs is provided below:
18
| EXPLORATION WORK | BUDGET (US$) |
| Ground Geophysics | |
| Mapping, trenching, sampling, etc. | |
| Drilling | |
| Geologists, field personnel and general exploration | |
| Sundry & contingencies | |
| TOTAL | $ |
At May 31, 2014,2015, we had cash of $533,000$86,000 but a working capital deficit of $876,000. On June 18, 2014, the Company’s $1.07 million loan repayment due date has been extended from June 30, 2014$382,000. In addition, we have a total of $285,000 funds available to June 30, 2015. We assume suchbe withdrawn pursuant to a facility agreement with a related party loan to the Company would not be demanded for the repayment by the Company’s major shareholder at the due date on June 30, 2015.party. As such, we estimated that we will still need a minimum of $1.5$1.4 million additional funds in order to cover our planned operations over the next twelve months ending May 31, 2015.2016. Our actual expenditures may exceed our estimations.
We anticipate that we will not generate any revenues for so long as we are an exploration stage company. Accordingly, we will be required to obtain additional financing in order to pursue our plan of operations.
We believe that external debt financing will not be an alternative for funding our next fiscal year exploration, as we do not have significant tangible assets to secure any debt financing. Therefore, we anticipate that additional funding will be in the form of equity financing from the sale of our common stock and/or related parties debt financing. We cannot provide investors with any assurance that we will be able to obtain sufficient financing to fund our acquisition and exploration program going forward. In the absence of sufficient funding, we will not be able to continue acquisition and exploration of mineral claims and we will be forced to abandon our mineral claims and our plan of operations. Even if we are successful in obtaining financing to fund our acquisition and exploration program, there is no assurance that we will obtain the funding necessary to pursue any advanced exploration of any mineral claims.
Results of Operations
During the year ended May 31, 2014,2015, we spent approximately $222,000 (2013$214,000 (2014 - $659,000)$222,000) cash on exploration, annual property rental and licenses renewal fees. We were not able to make further expenditures aswith respect to our 2015 plan of operations due to our funding limitation. During the year ended May 31, 2014,2015, we also spent approximately $799,000 (2013$543,000 (2014 - $1,271,000)$799,000) cash expenditures on other operating expenses.
24
We have had no operating revenues since our inception (January 5, 2004) to May 31, 2014.2015. The following table sets out our losses for the periods indicated:
| Accumulated from | |||||||||||||||
| January 5, 2004 | |||||||||||||||
| For the Years Ended, | (Date of Inception) to | For the Years Ended, | |||||||||||||
| May 31, 2014 | May 31, 2013 | May 31, 2014 | May 31, 2015 | May 31, 2014 | |||||||||||
| Revenue | $ | - | $ | - | $ | - | $ | - | $ | - | |||||
| Expenses | |||||||||||||||
| Consulting fees | 22,500 | 594,608 | 24,092,224 | 17,070 | 22,500 | ||||||||||
| Depreciation | 189,200 | 202,726 | 631,809 | 53,822 | 189,200 | ||||||||||
| Exploration expenses | 221,977 | 658,756 | 8,277,590 | 213,953 | 221,977 | ||||||||||
| (Gain) / Loss on disposal or write-down of equipment | (3,210 | ) | 2,687 | 18,530 | |||||||||||
| General and administrative | 524,088 | 786,042 | 3,682,234 | 442,966 | 524,088 | ||||||||||
| Impairment of mineral property | - | - | 77,492,074 | ||||||||||||
| Interest expenses | 89,869 | 28,379 | 118,248 | ||||||||||||
| Interest expense | 92,487 | 89,869 | |||||||||||||
| Professional | 141,356 | 186,661 | 2,696,376 | 124,552 | 141,356 | ||||||||||
| Rent | 83,994 | 94,096 | 525,672 | 59,924 | 83,994 | ||||||||||
| Travel and investor relations | 24,111 | 99,110 | 2,012,507 | 36,435 | 24,111 | ||||||||||
| Total Expenses | 1,293,885 | 2,653,065 | 119,547,264 | 1,041,209 | 1,297,095 | ||||||||||
| Loss From Operations | (1,293,885 | ) | (2,653,065 | ) | (119,547,264 | ) | (1,041,209 | ) | (1,297,095 | ) | |||||
| Other Income (Expenses) | |||||||||||||||
| Gain on write-down of accrued liabilities | - | - | 458,058 | ||||||||||||
| Impairment of marketable securities (Note 6) | (1,000,000 | ) | (1,600,000 | ) | (2,600,000 | ) | |||||||||
| Gain on disposal or write-down of equipment | 35,058 | 3,210 | |||||||||||||
| Impairment of restricted marketable securities (Note 6) | (140,000 | ) | (1,000,000 | ) | |||||||||||
| Loss on restricted marketable securities (Note 6) | (20,000 | ) | - | ||||||||||||
| Interest income | 290 | 664 | 1,744 | 189 | 290 | ||||||||||
| Loss on sale of investment securities | - | - | (57,071 | ) | |||||||||||
| Recovery (Loss) on write-down of amounts receivable | - | 14,870 | (66,771 | ) | |||||||||||
| Mineral property option payments received | - | - | 3,616,017 | ||||||||||||
| Recovery of mineral property costs for stock not issuable | - | - | 2,253,000 | ||||||||||||
| Total other (Expenses) / Income | (999,710 | ) | (1,584,466 | ) | 3,604,977 | (124,753 | ) | (996,500 | ) | ||||||
| Net Loss | $ | (2,293,595 | ) | $ | (4,237,531 | ) | $ | (115,942,287 | ) | $ | (1,165,962 | ) | $ | (2,293,595 | ) |
Year Ended May 31, 2015 Compared to Year Ended May 31, 2014
Our net loss for the fiscal year ended May 31, 2015 was $1,166,000, compared to $2,294,000 for the same period ended May 31, 2014, mainly due to $160,000 (2014 - $1,000,000) loss and permanent impairment of marketable securities and the changes in operating expenses set forth below.
Our operating expenses for the fiscal year ended May 31, 2015 decreased by $256,000 to $1,041,000 from $1,297,000 for the fiscal year ended May 31, 2014, as follows:
19
| • | our consulting, general and administrative fees decreased by $87,000 to $460,000 during the fiscal year ended May 31, 2015 (2014 - $547,000), primarily due to decreased independent directors’ fees, fewer employees and consultants, and continuing cost management; At May 31, 2015, approximately $455,000 (2014 - $278,000) of general and administrative fees remained as payables due to related parties; |
| • | depreciation decreased by $135,000 to $54,000 during the fiscal year ended May 31, 2015 (2014 - $189,000) mainly due to less net book value on equipment; |
| • | our exploration expenses decreased by $8,000 to $214,000 during the fiscal year ended May 31, 2015 (2014 - $222,000) due to further decreased exploration and drilling activities caused by our funding limitation during the fiscal year ended May 31, 2015; |
| • | our professional fees decreased by $17,000 to $124,000 during the fiscal year ended May 31, 2015 (2014 - $141,000) primarily due to continuing decreased legal and accounting services as a result of more work performed in-house by management to reduce costs. |
| • | our rent expenses decreased by $24,000 to $60,000 during the fiscal year ended May 31, 2015 (2014 - $84,000) due to a significant decrease on office rent as a result of our Tanzania office moving to a small office in March 2014 and the Vancouver office lease expiry in September 2014. Included in the fiscal year ended May 31, 2015, there was an increased rent of $36,000 (2014 - $25,200) representing 60% of the rental expense associated with renting our Chief Executive Officer’s family house in Tanzania; |
| • | our travel and investor relations expenses increased by $12,000 to $36,000 during the fiscal year ended May 31, 2015 (2014 - $24,000) primarily due to travel expenses incurred for an in-person Board of Directors meeting held in Dar es Salaam, Tanzania. |
Year Ended May 31, 2014 Compared to Year Ended May 31, 2013
Our net loss for the fiscal year ended May 31, 2014 was $2,294,000, compared to $4, 238,000$4,238,000 for the same period ended May 31, 2013, mainly due to $1,000,000 (2013 - $1,600,000) permanent impairment of marketable securities and the following operation expenses changes.
Our operating expenses for the fiscal year ended May 31, 2014 decreased by $1.36 million to $1,294,000$1,297,000 from $2,653,000 for the fiscal year ended May 31, 2013, as follows:
| • | our consulting, general and administrative fees decreased by $834,000 to $547,000 during the fiscal year ended May 31, 2014 (2013 - $1,381,000), primarily due to decreases of $345,000 in cash expenditures and $489,000 in stock-based compensation. The stock-based compensation included in consulting, general and administrative fees was $Nil during the fiscal year ended May 31, 2014 (2013 - $489,000); Excluding the stock-based compensation, our other consulting, general and administrative fees was decreased to $547,000 during the fiscal year ended May 31, 2014 (2013 - $892,000), primarily due to decreased independent directors’ fees, less employees and consultants, and continuing cost management; At May 31, 2014, approximately $278,000 (2013 - $145,000) of general and administrative fees remained as payables due to the related parties; |
| • | depreciation increased by $14,000 to $189,000 during the fiscal year ended May 31, 2014 (2013 - $203,000) mainly due to less net book value on the equipment; |
| • | our exploration expenses decreased by $437,000 to $222,000 during the fiscal year ended May 31, 2014 (2013 - $659,000) due to further decreased exploration and drilling activities caused by our funding limitation during the fiscal year ended May 31, 2014; |
| • | interest expenses increased to $90,000 during the fiscal year ended May 31, 2014 (2013 - $28,000), mainly due to increased deemed interest on an interest free unsecured loan from a related party. Such deemed interest was recorded as donated capital; |
25
| • | our professional fees decreased by $45,000 to $141,000 during the fiscal year ended May 31, 2014 (2012 - $186,000) primarily due to continuing decreased legal and accounting services as a result of more work performed in-house by management to save the cost. |
| • | our rent expenses decreased by $10,000 to $84,000 during the fiscal year ended May 31, 2014 (2013 - $94,000) mainly due to our Tanzania office reduced to half commencing March 2013 and further moved to a smaller office commencing March 2014. In addition, included in the fiscal year ended May 31, 2014, there was $25,200 rent representing 60% of rental expense associated with renting our Chief Executive Officer’s family house in Tanzania pursuant to the Executive Services Agreement. Such rent for 2012 was paid and included in the fiscal year ended May 31, 2012. |
| • | our travel and investor relations expenses decreased by $75,000 to $24,000 during the fiscal year ended May 31, 2014 (2013 - $99,000) primarily due to significantly less travel expenses and investor relations expenses and cost management. |
Year Ended May 31, 2013 Compared to Year Ended May 31, 2012
Our net loss for the fiscal year ended May 31, 2013 was $4, 238,000, compared to $6,904,000 for the same period ended May 31, 2012, mainly due to $1,600,000 permanent impairment of marketable securities and the following operation expenses changes.
Our operating expenses for the fiscal year ended May 31, 2013 decreased by $6.8 million to $2,653,000 from $9,448,000 for the fiscal year ended May 31, 2012, as follows:
| |
| |
| |
| |
| |
| |
|
Liquidity and Capital Resources
The Company has been reviewing its budgets for its current business needs and its further exploration. We estimate that our total expenditures for our fiscal year ending May 31, 20152016 will be approximately $1.7$1.3 million, as outlined above under the heading “Plan of Operations”. At May 31, 2014,2015, we had cash of $533,000$86,000 but a working capital deficit of $876,000.$382,000. We believe that we have insufficient capital to fund our plan of operations in the next 12 months. If we exclude $1.07 million of the related party loan from the current liabilities, then we have working capital of $195,000 for our fiscal year ending May 31, 2015. As such,months and we estimate we will be required to obtain a minimum of $1.5$1.4 million additional funds in order to pursue our planned operations over the fiscal year ending May 31, 2015.
26
On December 7, 2012, we entered into a facility agreement with IPP Ltd. a private company controlled by our Chairman of the Board of Directors. The funding is in the form of an interest free unsecured loan to the Company of up to $720,000 through and including June 2013. As of the date of this report, we received a total of $695,683. In June 2014, the loan repayment due date has been further extended to June 30, 2015 by the Company and IPP Ltd.2016.
On October 9, 2013,November 20, 2014, the Company entered into a credit facility agreement with Consultancy & Finance Company Associates Ltd, a private company controlled by our Chairman of the Board of Directors. The funding is also in the form of an interest freeinterest-free unsecured loan to the Company of up to $405,000.$500,000 due May 31, 2017. As of the date of this report, we received a total of $375,000 which is due$350,000, with $150,000 available to be repaid on or before June 30, 2015withdrawn pursuant to this facility agreement, as amended.agreement.
20
During the fiscal year ended May 31, 2015, we received $47,000$10,000 of recoverable goods and services tax/harmonized sales tax from Canada Revenue Agency. We also received $538,000Based on requirements of the Tanzania Revenue Authority (“TRA”), we had submitted recoverable value added tax from(“VAT”) refund certificates in January 2015 with TRA to request a VAT refund of $24,000 (TZS 49,061,634). However, as of the Tanzania Revenue Authority and realized a lossdate of $23,000 on Tanzanian shillings foreign exchange.this report, we have not received the claimed refund yet.
As ofat May 31, 2014,2015, there was $23,000$29,000 of recoverable value added taxVAT paid in Tanzania and $10,000 of recoverable goods and services tax paid in Canada. Such recoverable amounts were included in our working capital and expected to be refunded during the fiscal year 2015.2016.
We have not generated revenues since the date of inception on January 5, 2004, and our cash has been generated primarily from the sale of our securities. During the 12-month period following the date of this annual report, we anticipate that we will not generate any revenue. We anticipate that additional funding will be in the form of equity financing from the sale of our common stock, debt financing, joint ventures or some combination of these or other means. We believe that external debt financing will not be an alternative at this stage for funding additional phases of our exploration as we do not have significant tangible assets to secure any debt financing.
We cannot provide investors with any assurance that we will be able to raise sufficient funding to continue our acquisition and exploration program going forward. If we are not able to obtain financing in the amounts required or on terms that are acceptable to us, we may be forced to scale back, or abandon, our plan of operations. Even if we are successful in obtaining equity and/or debt financing to fund our acquisition and exploration program, there is no assurance that we will obtain the funding necessary to pursue any advanced exploration of any mineral claims. If we do not continue to obtain additional funding, we will be forced to abandon our mineral claims and our plan of operations.
Net Cash Used in Operating Activities
Net cash used in operating activities was $762,000 during the fiscal year ended May 31, 2015, as compared to $203,000 during the fiscal year ended May 31, 2014, as compared2014. The increase was mainly due to $1.8 million during$538,000 of recoverable VAT received from TRA in the fiscal year ended May 31, 2013. 2014.
During the fiscal quarter ended May 31, 2014, net cash provided in operating activities was $342,000, while2015, net cash used in operating activities was $401,000$147,000, while net cash provided by operating activities was $342,000 during the same period in 2013.2014. Net cash used in operating activities from our inception on January 5, 2004 to May 31, 20142015 was $19.4$20.2 million.
Net Cash Used in Investing Activities
Net cash used inprovided by investing activities was $4,000$46,000 during the fiscal year ended May 31, 2014.2015. During the year, we received $35,000 from disposal of vehicles and $11,000 from redemption of restricted cash equivalent. During the year ended May 31, 2014, we purchased $3,000 of office equipment and computer software, and received $7,000 from disposal of office furniture and vehicle. During the fiscal year ended May 31, 2013, net cash used in investing activities was $41,000 primarily due to $9,000 of office equipment purchase and received $50,000 from disposal of vehicle and redemption of restricted cash equivalent.
During the fiscal quarter ended May 31, 2015, we received $15,000 from disposal of vehicle. During the same period in 2014, net cash used in investing activities was $896. During the same period in 2013, net cash received in investing activities was $28,726 from redemption of restricted cash equivalent.$1,000. Net cash used in investing activities from our inception on January 5, 2004 to May 31, 20142015 was $831,000$786,000 mainly used in purchase of property and equipment.
Net Cash from Financing Activities
During the fiscal year ended May 31, 2014,2015, we received $525,000 (2013$269,000 (2014 – 546,000)$525,000) cash from a related party as interest-free loans. During the fiscal year ended May 31, 2013, we also received $500,000 net cash from financing activities (receipt of stock subscriptions). During the fiscal quarter ended May 31, 2014,2015, net cash from financing activities was $475,000$135,000 (2014 - $50,000) received from a related party as a loan, as compared to $396,000 received from an interest-free loan and $500,000 received from a stock subscription during the same period in 2012.loans. We have funded our business to date primarily from sales of our common stock. From our inception on January 5, 2004 to May 31, 2014,2015, net cash provided by financing activitiessales of our common stock was $20,784,000.$20 million and interest-free loans from a related party were $1.3 million.
There are no assurances that we will be able to achieve further sales of our common stock or any other form of additional financing. If we are unable to achieve the financing necessary to continue our plan of operations, then we will not be able to continue our exploration of the property underlying our mineral claim interest and our venture will fail.
27
Going Concern
We have not attained profitable operations and are dependent upon obtaining financing to pursue any extensive exploration activities. The Company has not generated any revenues and has accumulated losses of $115,942,287$117 million since inception to May 31, 2014.2015. In addition, we had working capital deficit of $876,000$382,000 as of May 31, 2014.2015. For these reasons our auditors stated in their report on our audited consolidated financial statements for the year ended May 31, 20142015 that they have substantial doubt we will be able to continue as a going concern.
Future Financings
We anticipate continuing to rely on equity sales of our common shares, debt financing from our related parties, and/or other financing in order to continue to fund our business operations over next fiscal year ending May 31, 2015.2016. Issuances of additional shares will result in dilution to our existing shareholders. There is no assurance that we will achieve any additional sales of our equity securities or arrange for debt or other financing to fund our planned exploration activities.
21
Off-Balance Sheet Arrangements
We have no significant off-balance sheet arrangements that have or are reasonably likely to have a current or future effect on our financial condition, changes in financial condition, revenues or expenses, results of operations, liquidity, capital expenditures or capital resources that is material to stockholders.
Related Party Transactions
The details of related party transactions are disclosed in footnote 9 of our Company’s audited consolidated financial statements for the fiscal year ended May 31, 20142015 (Item 8 – FINANCIAL STATEMENTS, below).
Segment Disclosures
The Company operates in one reportable segment, located in Tanzania Africa, being the acquisition and exploration of mineral properties. The details of segment disclosures are disclosed in footnote 1715 of our Company’s audited consolidated financial statements for the fiscal year ended May 31, 20142015 (Item 8 – FINANCIAL STATEMENTS, below).
Inflation
We do not believe that inflation has had a significant impact on our consolidated results of operations or financial condition.
Contractual Obligations
| a) | On December 7, 2012, and as amended on September 4, 2013, June 18, 2014 and March 20, 2015, the Company entered into a facility agreement with IPP Ltd., a private company controlled by the |
| b) | On October 9, 2013, and as amended on June 18, 2014 and March 20, 2015, the Company entered into a facility agreement with Consultancy & Finance Company Associates Ltd. (“C&F”), a private company controlled by the |
| c) |
|
| d) | On June 23, 2014, the Company’s Tanzania subsidiary, HG Limited, entered into a lease agreement |
Critical Accounting Policies
Our consolidated financial statements and accompanying notes have been prepared in accordance with United States generally accepted accounting principles applied on a consistent basis. The preparation of consolidated financial statements in conformity with U.S. generally accepted accounting principles requires management to make estimates and assumptions that affect the reported amounts of assets and liabilities, the disclosure of contingent assets and liabilities at the date of the consolidated financial statements and the reported amounts of revenues and expenses during the reporting periods.
We regularly evaluate the accounting policies and estimates that we use to prepare our consolidated financial statements. In general, management’s estimates are based on historical experience, on information from third party professionals, and on various other assumptions that are believed to be reasonable under the facts and circumstances. Actual results could differ from those estimates made by management.
We believe the followingour critical accounting policies require us to make significant judgments and estimates in the preparation of our consolidated financial statements.
28
BasisThe details of Presentation
Theour critical accounting policies are disclosed in footnote 2 of our Company’s audited consolidated financial statements and related notes are presented in accordance with accounting principles generally accepted in the United States, and are expressed in U.S. dollars. The Company’s consolidated financial statements include the accounts of the Company and its subsidiaries described as follows. In June 2011, the Company incorporated in Tanzania a new wholly-owned subsidiary, DLM Tanzania Limited (now known as HG Limited), which undertakes mineral property exploration activities in Tanzania. The Company also has a wholly-owned non-operating Tanzanian subsidiary (Douglas Lake Tanzania Limited).
All significant intercompany transactions and balances have been eliminated. The Company’s fiscal year-end is May 31.
Use of Estimates
The preparation of consolidated financial statements in accordance with United States generally accepted accounting principles requires management to make estimates and assumptions that affect the reported amounts of assets and liabilities at the date of the consolidated financial statements and the reported amounts of revenue and expenses in the reporting period. The Company regularly evaluates estimates and assumptions related to the recoverability and useful life of long-lived assets, recoverability of mineral prospecting licenses, valuation of stock-based compensation, deferred income tax asset valuation allowances and determination of a fair value interest rate on non-interest bearing loans from related parties and recognition of contingent liabilities. The Company bases its estimates and assumptions on current facts, historical experience and various other factors that it believes to be reasonable under the circumstances, the results of which form the basis for making judgments about the carrying values of assets and liabilities and the accrual of costs and expenses that are not readily apparent from other sources. The actual results experienced by the Company may differ materially and adversely from the Company’s estimates. To the extent there are material differences between the estimates and the actual results, future results of operations will be affected.
Basic and Diluted Net Income (Loss) Per Share
The Company computes net income (loss) per share in accordance with ASC 260,Earnings per Share which requires presentation of both basic and diluted earnings per share (“EPS”) on the face of the income statement. Basic EPS is computed by dividing net income (loss) available to common shareholders (numerator) by the weighted average number of shares outstanding (denominator) during the period. Diluted EPS gives effect to all dilutive potential common shares outstanding during the period using the treasury stock method and convertible preferred stock using the if-converted method. In computing diluted EPS, the average stock price for the period is used in determining the number of shares assumed to be purchased from the exercise of stock options or warrants. Diluted EPS excludes all dilutive potential shares if their effect is anti-dilutive.
Comprehensive Income (Loss)
ASC 220,Comprehensive Income establishes standards for the reporting and display of comprehensive income (loss) and its components in the financial statements.
Cash and Cash Equivalents
Cash and cash equivalents are carried at fair value and they comprise cash on hand, deposits held with banks and other highly liquid investments. Highly liquid investments are readily convertible to cash and generally have maturities of three months or less from the time acquired. The Company places its cash and cash equivalents with high quality financial institutions which the Company believes limits credit risk.
Marketable Securities
The Company reports investments in marketable equity securities at fair value based on quoted market prices. All investment securities are designated as available for sale with unrealized gains and losses included in stockholders’ equity. Realized gains and losses are accounted for on the specific identification method.
The Company periodically reviews these investments for other-than-temporary declines in fair value based on the specific identification method. When an other-than- temporary decline has occurred, unrealized losses that are other than temporary are recognized in earnings. When determining whether a decline is other-than-temporary, the Company examines (i) the length of time and the extent to which the fair value of an investment has been lower than its carrying value: (ii) the financial condition and near-term prospects of the investee, including any specific events that may influence the operations of the investee such as changes in technology that may impair the earnings potential of the investee: and (iii) the Company’s intent and ability to retain its investment in the investee for a sufficient period of time to allow for any anticipated recovery in market value. The Company generally believes that an other-than-temporary decline has occurred when the fair value of the investment is below the carrying value for onefiscal year absent of evidence to the contrary.
Property and Equipment
Property and equipment are recorded at cost and depreciated on a straight-line basis as follows:
29
Mineral Property Costs
The Company has been in the exploration stage since its inception on January 5, 2004 and has not yet realized any revenues from its planned operations. It is primarily engaged in the acquisition and exploration of mining properties. Mineral property exploration costs are expensed as incurred. Mineral property acquisition costs are initially capitalized. The Company assesses the carrying costs for impairment under ASC 360,Property, Plant, and Equipment at each fiscal quarter end. When it has been determined that a mineral property can be economically developed as a result of establishing proven and probable reserves, the costs then incurred to develop such property, are capitalized. Such costs will be amortized using the units-of-production method over the estimated life of the probable reserve. If mineral properties are subsequently abandoned or impaired, any capitalized costs will be charged to operations.
Long-Lived Assets
In accordance with ASC 360,Property Plant and Equipment the Company tests long-lived assets or asset groups for recoverability when events or changes in circumstances indicate that their carrying amount may not be recoverable. Circumstances which could trigger a review include, but are not limited to: significant decreases in the market price of the asset; significant adverse changes in the business climate or legal factors; accumulation of costs significantly in excess of the amount originally expected for the acquisition or construction of the asset; current period cash flow or operating losses combined with a history of losses or a forecast of continuing losses associated with the use of the asset; and current expectation that the asset will more likely than not be sold or disposed significantly before the end of its estimated useful life. Recoverability is assessed based on the carrying amount of the asset and its fair value which is generally determined based on the sum of the undiscounted cash flows expected to result from the use and the eventual disposal of the asset, as well as specific appraisal in certain instances. An impairment loss is recognized when the carrying amount is not recoverable and exceeds fair value.
Asset Retirement Obligations
The Company accounts for asset retirement obligations in accordance with the provisions of ASC 440Asset Retirement and Environmental Obligations which requires the Company to record the fair value of an asset retirement obligation as a liability in the period in which it incurs a legal obligation associated with the retirement of tangible long-lived assets that result from the acquisition, construction, development and/or normal use of the assets.
Financial Instruments
ASC 825,Financial Instruments requires an entity to maximize the use of observable inputs. The fair value of certain financial instruments, which include cash and cash equivalents, restricted cash equivalent and accounts payable were estimated to approximate their carrying values due to the immediate or short-term maturities of these financial instruments.
The Company’s operations are in Canada and Africa, which results in exposure to market risks from changes in foreign currency rates. The financial risk is the risk to the Company’s operations that arise from fluctuations in foreign exchange rates and the degree of volatility of these rates. Currently, the Company does not use derivative instruments to reduce its exposure to foreign currency risk.
Income Taxes
The Company accounts for income taxes using the asset and liability method in accordance with ASC 740,Income Taxes. The asset and liability method provides that deferred tax assets and liabilities are recognized for the expected future tax consequences of temporary differences between the financial reporting and tax bases of assets and liabilities, and for operating loss and tax credit carry-forwards. Deferred tax assets and liabilities are measured using the currently enacted tax rates and laws that will be in effect when the differences are expected to reverse. The Company records a valuation allowance to reduce deferred tax assets to the amount that is believed more likely than not to be realized.
Foreign Currency Translation
The functional and reporting currency of the Company is the United States dollar. Monetary assets and liabilities denominated in foreign currencies are translated to United States dollars in accordance with ASC 830,Foreign Currency Translation Matters, using the exchange rate prevailing at the balance sheet date. Non-monetary assets and liabilities denominated in foreign currencies are translated at rates of exchange in effect at the date of the transaction. Average rates are used to translate revenues and expenses.
30
Gains and losses arising on translation or settlement of foreign currency denominated transactions or balances are included in the determination of income. The Company has not, to the date of these financial statements, entered into derivative instruments to offset the impact of foreign currency fluctuations.
To the extent that the Company incurs transactions that are not denominated in its functional currency, they are undertaken in Canadian dollars and Tanzanian shillings. The Company has not, to the date of these financial statements, entered into derivative instruments to offset the impact of foreign currency fluctuations.
Stock-based Compensation
The Company records stock-based compensation in accordance with ASC 718,Compensationended May 31, 2015 (Item 8 – Stock Based Compensation and ASC 505, Equity Based Payments to Non-Employees, which requires the measurement and recognition of compensation expense based on estimated fair values for all share-based awards made to employees and directors, including stock options.FINANCIAL STATEMENTS, below).
ASC 718 requires companies to estimate the fair value of share-based awards on the date of grant using an option-pricing model. The Company uses the Black-Scholes option-pricing model as its method of determining fair value. This model is affected by the Company’s stock price as well as assumptions regarding a number of subjective variables. These subjective variables include, but are not limited to the Company’s expected stock price volatility over the term of the awards, and actual and projected employee stock option exercise behaviours. The value of the portion of the award that is ultimately expected to vest is recognized as an expense in the statement of operations over the requisite service period.
All transactions in which goods or services are the consideration received for the issuance of equity instruments are accounted for based on the fair value of the consideration received or the fair value of the equity instrument issued, whichever is more reliably measurable.
Recent Issued Accounting Pronouncements
The Company has adopted all new accounting pronouncements that are mandatorily effective and none impact its consolidated financial statements. The Company does not believe that there are any new accounting pronouncements that have been issued that are expected to have a material impact on its financial position or results of operations.
Reclassification
Certain reclassifications have been made to the prior years’ financial statements to conform to the current year’s presentation.
| ITEM 7A. | QUANTITATIVE AND QUALITATIVE DISCLOSURES ABOUT MARKET RISK |
We are a smaller reporting company as defined by Rule 12b-2 of the Exchange Act and are not required to provide the information required under this item.
22
| ITEM 8. | FINANCIAL STATEMENTS AND SUPPLEMENTARY DATA |
| Report of Independent Registered Public Accounting Firm | F-1 |
| Consolidated Balance Sheets, May 31, | F-2 |
Consolidated Statements of Operations and Comprehensive Loss for the years ended May 31, | F-3 |
| Consolidated Statements of Stockholders’ Equity (Deficiency) for the years ended May 31, 2015 and 2014 | F-4 |
Consolidated Statements of Cash Flows for the years ended May 31, | |
| F-5 |
| Notes to the Consolidated Financial Statements |
3123


Report of Independent Registered Public Accounting Firm
To the Stockholders of
Handeni Gold Inc.(An Exploration Stage Company)
We have audited the accompanying consolidated balance sheets of Handeni Gold Inc. (An Exploration Stage Company) as of May 31, 20142015 and 20132014 and the related consolidated statements of operations and comprehensive loss, cash flows and stockholders' equity (deficit)(deficiency) for the years then ended and accumulated for the period from January 5, 2004 (Date of Inception) to May 31, 2014.ended. These consolidated financial statements are the responsibility of the Company's management. Our responsibility is to express an opinion on these consolidated financial statements based on our audits.
We conducted our audits in accordance with the standards of the Public Company Accounting Oversight Board (United States). Those standards require that we plan and perform the audits to obtain reasonable assurance about whether the consolidation financial statements are free of material misstatement. An audit includes examining, on a test basis, evidence supporting the amounts and disclosures in the consolidated financial statements. The Company is not required to have, nor were we engaged to perform, an audit of its internal control over financial reporting. An audit includes consideration of internal control over financial reporting as a basis for designing audit procedures that are appropriate in the circumstances, but not for the purpose of expressing an opinion on the effectiveness of internal control over financial reporting. Accordingly, we express no such opinion. An audit also includes assessing the accounting principles used and significant estimates made by management, as well as evaluating the overall financial statement presentation.
In our opinion, the consolidated financial statements referred to above present fairly, in all material respects, the financial position of Handeni Gold Inc. (An Exploration Stage Company) as of May 31, 20142015 and 2013,2014, and the results of its operations and its cash flows for the years then ended, and accumulated for the period from January 5, 2004 (Date of Inception) to May 31, 2014 in conformity with accounting principles generally accepted in the United States.
The accompanying consolidated financial statements have been prepared assuming the Company will continue as a going concern. As discussed in Note 1 to the consolidated financial statements, the Company has not generated any revenues and has incurred operating losses since inception. These factors raise substantial doubt about the Company’s ability to continue as a going concern. Management’s plans in regard to these matters are also discussed in Note 1. The consolidated financial statements do not include any adjustments that might result from the outcome of this uncertainty.
| /s/ “Manning Elliott LLP” |
| CHARTERED PROFESSIONAL ACCOUNTANTS |
| Vancouver, Canada |
| August 18, 2015 |
/s/ “Manning Elliott LLP”
CHARTERED ACCOUNTANTS
Vancouver, Canada
August 15, 2014
F - 1F-1
| Handeni Gold Inc. |
| Consolidated Balance Sheets |
| (Expressed in U.S. dollars) |
| May 31, 2014 | May 31, 2013 | |||||||||||
| May 31, 2015 | May 31, 2014 | |||||||||||
| ASSETS | ||||||||||||
| Current Assets | ||||||||||||
| Cash and cash equivalents | $ | 532,694 | $ | 206,402 | ||||||||
| Cash | $ | 85,985 | $ | 532,694 | ||||||||
| Amounts receivable (Note 3) | 34,326 | 625,945 | 38,751 | 34,326 | ||||||||
| Prepaid expenses and deposits (Note 4) | 15,076 | 87,786 | 306 | 15,076 | ||||||||
| Total Current Assets | 582,096 | 920,133 | 125,042 | 582,096 | ||||||||
| Restricted cash equivalent (Note 5) | 26,522 | 27,805 | 13,858 | 26,522 | ||||||||
| Restricted marketable securities (Note 6) | 73,600 | 140,000 | - | 73,600 | ||||||||
| Mineral licenses (Note 7) | 1,650,000 | 1,650,000 | 1,650,000 | 1,650,000 | ||||||||
| Property and equipment, net (Note 8) | 55,446 | 245,473 | 1,474 | 55,446 | ||||||||
| TOTAL ASSETS | $ | 2,387,664 | $ | 2,983,411 | $ | 1,790,374 | $ | 2,387,664 | ||||
| LIABILITIES AND STOCKHOLDERS' EQUITY | ||||||||||||
| LIABILITIES AND STOCKHOLDERS' DEFICIENCY | ||||||||||||
| Current Liabilities | ||||||||||||
| Accounts payable and accrued liabilities | $ | 109,432 | $ | 87,369 | $ | 52,785 | $ | 109,432 | ||||
| Accounts payable and accrued liabilities - related parties (Note 9) | 277,500 | 145,431 | 454,615 | 277,500 | ||||||||
| Current portion of loans from related parties (Note 9 (a)) | - | 1,070,683 | ||||||||||
| Total Current Liabilities | 507,400 | 1,457,615 | ||||||||||
| Loans from related parties (Note 9 (a)) | 1,070,683 | 545,683 | 1,340,000 | - | ||||||||
| Total Current Liabilities | 1,457,615 | 778,483 | ||||||||||
| Commitments and Contingencies (Notes 1, 7 and 13) | ||||||||||||
| Subsequent Events (Note 19) | ||||||||||||
| Stockholders' Equity | ||||||||||||
| Common stock (Note 10) Authorized: 500,000,000 shares, $0.001 par value Issued and outstanding: 321,416,654 shares (May 31, 2013 – 321,416,654 shares) | 321,417 | 321,417 | ||||||||||
| Total Liabilities | 1,847,400 | 1,457,615 | ||||||||||
| Nature of Operations and Going Concern (Note 1) | ||||||||||||
| Commitments and Contingencies (Notes 7 and 13) | ||||||||||||
| Stockholders' Equity (Deficiency) | ||||||||||||
| Common stock (Note 10) Authorized: 500,000,000 shares, $0.001 par value Issued and outstanding: 321,416,654 shares (May 31, 2014 – 321,416,654 shares) | 321,417 | 321,417 | ||||||||||
| Additional paid-in capital (Note 10) | 116,414,824 | 116,414,824 | 116,414,824 | 116,414,824 | ||||||||
| Donated capital | 222,495 | 137,379 | 314,982 | 222,495 | ||||||||
| Accumulated other comprehensive loss | (86,400 | ) | (1,020,000 | ) | - | (86,400 | ) | |||||
| Deficit accumulated during the exploration stage | (115,942,287 | ) | (113,648,692 | ) | (117,108,249 | ) | (115,942,287 | ) | ||||
| Total Stockholders' Equity | 930,049 | 2,204,928 | ||||||||||
| Total Stockholders' (Deficiency) / Equity | (57,026 | ) | 930,049 | |||||||||
| TOTAL LIABILITIES AND STOCKHOLDERS' EQUITY | $ | 2,387,664 | $ | 2,983,411 | ||||||||
| TOTAL LIABILITIES AND STOCKHOLDERS' DEFICIENCY | $ | 1,790,374 | $ | 2,387,664 | ||||||||
(The accompanying notes are an integral part of these consolidated financial statements)
F - 2F-2
| Handeni Gold Inc. |
| Consolidated Statements of Operations and Comprehensive Loss |
| (Expressed in U.S. dollars) |
| Accumulated from | |||||||||||||||
| For the Years Ended, | January 5, 2004 | ||||||||||||||
| (Date of Inception) to | |||||||||||||||
| May 31, 2014 | May 31, 2013 | May 31, 2014 | For the Years Ended, | ||||||||||||
| May 31, 2015 | May 31, 2014 | ||||||||||||||
| Revenue | $ | - | $ | - | $ | - | $ | - | $ | - | |||||
| Expenses | |||||||||||||||
| Consulting fees | 22,500 | 594,608 | 24,092,224 | 17,070 | 22,500 | ||||||||||
| Depreciation | 189,200 | 202,726 | 631,809 | 53,822 | 189,200 | ||||||||||
| Exploration expenses | 221,977 | 658,756 | 8,277,590 | 213,953 | 221,977 | ||||||||||
| (Gain) / Loss on disposal or write-down of equipment | (3,210 | ) | 2,687 | 18,530 | |||||||||||
| General and administrative | 524,088 | 786,042 | 3,682,234 | 442,966 | 524,088 | ||||||||||
| Impairment of mineral property | - | - | 77,492,074 | ||||||||||||
| Interest expenses | 89,869 | 28,379 | 118,248 | ||||||||||||
| Interest expense | 92,487 | 89,869 | |||||||||||||
| Professional | 141,356 | 186,661 | 2,696,376 | 124,552 | 141,356 | ||||||||||
| Rent | 83,994 | 94,096 | 525,672 | 59,924 | 83,994 | ||||||||||
| Travel and investor relations | 24,111 | 99,110 | 2,012,507 | 36,435 | 24,111 | ||||||||||
| Total Expenses | 1,293,885 | 2,653,065 | 119,547,264 | 1,041,209 | 1,297,095 | ||||||||||
| Loss From Operations | (1,293,885 | ) | (2,653,065 | ) | (119,547,264 | ) | (1,041,209 | ) | (1,297,095 | ) | |||||
| Other Income (Expenses) | |||||||||||||||
| Gain on disposal of equipment | 35,058 | 3,210 | |||||||||||||
| Impairment of restricted marketable securities (Note 6) | (140,000 | ) | (1,000,000 | ) | |||||||||||
| Loss on restricted marketable securities (Note 6) | (20,000 | ) | - | ||||||||||||
| Interest income | 189 | 290 | |||||||||||||
| Total other Expenses | (124,753 | ) | (996,500 | ) | |||||||||||
| Other Income (Expenses) | |||||||||||||||
| Gain on write-down of accrued liabilities | - | - | 458,058 | ||||||||||||
| Impairment of marketable securities (Note 6) | (1,000,000 | ) | (1,600,000 | ) | (2,600,000 | ) | |||||||||
| Interest income | 290 | 664 | 1,744 | ||||||||||||
| Loss on sale of investment securities | - | - | (57,071 | ) | |||||||||||
| Recovery (Loss) on write-down of amounts receivable | - | 14,870 | (66,771 | ) | |||||||||||
| Mineral property option payments received | - | - | 3,616,017 | ||||||||||||
| Recovery of mineral property costs for stock not issuable | - | - | 2,253,000 | ||||||||||||
| Total other (Expenses) / Income | (999,710 | ) | (1,584,466 | ) | 3,604,977 | ||||||||||
| Net Loss | (2,293,595 | ) | (4,237,531 | ) | (115,942,287 | ) | (1,165,962 | ) | (2,293,595 | ) | |||||
| Other Comprehensive Loss | |||||||||||||||
| Unrealized gain (loss) on marketable securities | (66,400 | ) | (1,020,000 | ) | (86,400 | ) | |||||||||
| Unrealized loss on marketable securities | - | (66,400 | ) | ||||||||||||
| Comprehensive Loss | $ | (2,359,995 | ) | $ | (5,257,531 | ) | $ | (116,028,687 | ) | $ | (1,165,962 | ) | $ | (2,359,995 | ) |
| Net Loss per Share - Basic and Diluted | $ | (0.01 | ) | $ | (0.01 | ) | $ | (0.00 | ) | $ | (0.01 | ) | |||
| Basic and Diluted Weighted Average Number of Common Shares Outstanding | 321,416,654 | 312,898,846 | 321,416,654 | 321,416,654 | |||||||||||
(The accompanying notes are an integral part of these consolidated financial statements)
F - 3F-3
| Handeni Gold Inc. |
| Consolidated Statements of Stockholders’ Equity (Deficiency) |
| ( |
| Deficit | |||||||||||||||||||||
| Accumulated | Accumulated | ||||||||||||||||||||
| Additional | Other | During the | |||||||||||||||||||
| Paid-in | Donated | Comprehensive | Exploration | ||||||||||||||||||
| Shares | Amount | Capital | Capital | Income (Loss) | Stage | Total | |||||||||||||||
| # | $ | $ | $ | $ | $ | $ | |||||||||||||||
| Balance – May 31, 2013 | 321,416,654 | 321,417 | 116,414,824 | 137,379 | (1,020,000 | ) | (113,648,692 | ) | 2,204,928 | ||||||||||||
| Deemed interest on interest-free loan from a related party | – | – | – | 85,116 | – | – | 85,116 | ||||||||||||||
| Impairment of restricted marketable securities | – | – | – | – | 1,000,000 | – | 1,000,000 | ||||||||||||||
| Unrealized loss on restricted marketable securities | – | – | – | – | (66,400 | ) | – | (66,400 | ) | ||||||||||||
| Net loss for the year | – | – | – | – | – | (2,293,595 | ) | (2,293,595 | ) | ||||||||||||
| Balance – May 31, 2014 | 321,416,654 | 321,417 | 116,414,824 | 222,495 | (86,400 | ) | (115,942,287 | ) | 930,049 | ||||||||||||
| Deemed interest on interest-free loan from a related party | – | – | – | 92,487 | – | – | 92,487 | ||||||||||||||
| Impairment of restricted marketable securities | – | – | – | – | 66,400 | – | 66,400 | ||||||||||||||
| Realized loss on restricted marketable securities | – | – | – | – | 20,000 | – | 20,000 | ||||||||||||||
| Net loss for the year | – | – | – | – | – | (1,165,962 | ) | (1,165,962 | ) | ||||||||||||
| Balance – May 31, 2015 | 321,416,654 | 321,417 | 116,414,824 | 314,982 | – | (117,108,249 | ) | (57,026 | ) |
(The accompanying notes are an integral part of these consolidated financial statements)
F-4
| Handeni Gold Inc. |
| Consolidated Statements of Cash Flows |
| (Expressed in U.S. dollars) |
| Accumulated from | |||||||||
| January 5, 2004 | |||||||||
| For the Years Ended, | (Date of Inception) to | ||||||||
| May 31, 2014 | May 31, 2013 | May 31, 2014 | |||||||
| CASH AND CASH EQUIVALENTS PROVIDED BY (USED IN): | |||||||||
| Operating Activities: | |||||||||
| Net loss | $ | (2,293,595 | ) | $ | (4,237,531 | ) | $ | (115,942,287 | ) |
| Adjustments for non-cash items in net loss: | |||||||||
| Depreciation | 189,200 | 202,726 | 631,809 | ||||||
| Donated capital, services, interest and rent | 85,116 | 28,379 | 122,495 | ||||||
| Impairment of marketable securities | 1,000,000 | 1,600,000 | 2,600,000 | ||||||
| Impairment of mineral property acquisition costs | - | - | 77,492,074 | ||||||
| Loss on sale of investment securities | - | - | 57,071 | ||||||
| Mineral property option payments | - | - | (156,017 | ) | |||||
| Stock-based compensation | - | 488,982 | 20,275,633 | ||||||
| Loss (Gain) on unrealized foreign exchange | 1,283 | - | 1,283 | ||||||
| Gain on write-down of accrued liabilities | - | - | (458,058 | ) | |||||
| (Recovery) / Loss on write-down of amounts receivable | - | (14,870 | ) | 66,771 | |||||
| (Gain) / Loss on disposal or write-down of equipment | (3,210 | ) | 2,687 | 18,530 | |||||
| Recovery of mineral property costs for stock not issuable | - | - | (2,253,000 | ) | |||||
| Shares received from mineral property option payment | - | - | (2,760,000 | ) | |||||
| Changes in non-cash operating working capital: | |||||||||
| Amount receivable | 591,619 | (8,789 | ) | (101,097 | ) | ||||
| Prepaid expenses and deposits | 72,710 | 102,151 | (15,076 | ) | |||||
| Accounts payable and accrued liabilities | 22,063 | (46,697 | ) | (101,468 | ) | ||||
| Due to related parties | 132,069 | 115,431 | 1,101,443 | ||||||
| Cash Used in Operating Activities | (202,745 | ) | (1,767,531 | ) | (19,419,894 | ) | |||
| Investing Activities: | |||||||||
| Mineral property acquisition costs | - | - | (697,677 | ) | |||||
| Proceeds from mineral property options | - | - | 600,000 | ||||||
| Proceeds from disposal of equipment | 7,013 | 21,578 | 28,591 | ||||||
| Purchase of restricted cash equivalent | - | 28,726 | (27,805 | ) | |||||
| Purchase of property and equipment | (2,976 | ) | (8,943 | ) | (734,376 | ) | |||
| Cash Provided (Used) in Investing Activities | 4,037 | 41,361 | (831,267 | ) | |||||
| Financing Activities: | |||||||||
| Loan from a related party | 525,000 | 545,683 | 1,070,683 | ||||||
| Proceeds from issuance of common stock | - | 500,000 | 21,034,363 | ||||||
| Share issuance costs | - | - | (1,321,191 | ) | |||||
| Cash Provided by Financing Activities | 525,000 | 1,045,683 | 20,783,855 | ||||||
| (Decrease) / Increase in cash and cash equivalents | 326,292 | (680,487 | ) | 532,694 | |||||
| Cash and cash equivalents, at beginning of the period | 206,402 | 886,889 | - | ||||||
| Cash and cash equivalents, at end of the period | $ | 532,694 | $ | 206,402 | $ | 532,694 | |||
Supplemental Cash Flow Information (Note 16)
| For the Years Ended, | ||||||
| May 31, 2015 | May 31, 2014 | |||||
| CASH AND CASH EQUIVALENTS PROVIDED BY (USED IN): | ||||||
| Operating Activities: | ||||||
| Net loss | $ | (1,165,962 | ) | $ | (2,293,595 | ) |
| Adjustments for non-cash items in net loss: | ||||||
| Depreciation | 53,822 | 189,200 | ||||
| Donated interest | 92,487 | 85,116 | ||||
| Impairment of marketable securities | 140,000 | 1,000,000 | ||||
| Loss on restricted marketable securities | 20,000 | - | ||||
| Loss on unrealized foreign exchange | 2,280 | 1,283 | ||||
| Gain on disposal of equipment | (35,058 | ) | (3,210 | ) | ||
| Changes in non-cash operating working capital: | ||||||
| Amounts receivable | (4,425 | ) | 591,619 | |||
| Prepaid expenses and deposits | 14,770 | 72,710 | ||||
| Accounts payable and accrued liabilities | (56,647 | ) | 22,063 | |||
| Due to related parties | 177,115 | 132,069 | ||||
| Cash Used in Operating Activities | (761,618 | ) | (202,745 | ) | ||
| Investing Activities: | ||||||
| Proceeds from disposal of equipment | 35,208 | 7,013 | ||||
| Redemption of restricted cash equivalent | 10,384 | - | ||||
| Purchase of property and equipment | - | (2,976 | ) | |||
| Cash Provided by Investing Activities | 45,592 | 4,037 | ||||
| Financing Activities: | ||||||
| Loan from a related party | 269,317 | 525,000 | ||||
| Cash Provided by Financing Activities | 269,317 | 525,000 | ||||
| (Decrease) / increase in cash | (446,709 | ) | 326,292 | |||
| Cash, at beginning of the year | 532,694 | 206,402 | ||||
| Cash, at end of the year | $ | 85,985 | $ | 532,694 | ||
(The accompanying notes are an integral part of these consolidated financial statements)
F - 4
| Deficit | |||||||||||||||||||||||||||
| Accumulated | Accumulated | ||||||||||||||||||||||||||
| Additional | Stock | Common | Other | During the | |||||||||||||||||||||||
| Paid-in | Subscriptions | Stock | Donated | Comprehensive | Exploration | ||||||||||||||||||||||
| Shares | Amount | Capital | Receivable | Subscribed | Capital | Income (Loss) | Stage | Total | |||||||||||||||||||
| # | $ | $ | $ | $ | $ | $ | $ | $ | |||||||||||||||||||
| Balance – January 5, 2004 (Date of Inception) | – | – | – | – | – | – | – | – | – | ||||||||||||||||||
| Issuance of common shares for cash: | |||||||||||||||||||||||||||
| At $0.001 per share | 2,000,000 | 2,000 | – | – | – | – | – | – | 2,000 | ||||||||||||||||||
| At $0.05 per share | 1,050,000 | 1,050 | 51,450 | – | – | – | – | – | 52,500 | ||||||||||||||||||
| At $0.25 per share | 41,000 | 41 | 10,209 | – | – | – | – | – | 10,250 | ||||||||||||||||||
| Share issuance costs | – | – | (6,475 | ) | – | – | – | – | – | (6,475 | ) | ||||||||||||||||
| Donated services | – | – | – | – | – | 2,500 | – | – | 2,500 | ||||||||||||||||||
| Net loss for the period | – | – | – | – | – | – | – | (36,874 | ) | (36,874 | ) | ||||||||||||||||
| Balance – May 31, 2004 | 3,091,000 | 3,091 | 55,184 | – | – | 2,500 | – | (36,874 | ) | 23,901 | |||||||||||||||||
| Issuance of common shares for cash: | |||||||||||||||||||||||||||
| At $0.01 per share | 22,000 | 22 | 198 | – | – | – | – | – | 220 | ||||||||||||||||||
| At $0.25 per share | 945,400 | 945 | 228,217 | – | – | – | – | – | 229,162 | ||||||||||||||||||
| Common stock subscribed | – | – | – | – | 336,766 | – | – | – | 336,766 | ||||||||||||||||||
| Donated services | – | – | – | – | – | 3,500 | – | – | 3,500 | ||||||||||||||||||
| Net loss for the year | – | – | – | – | – | – | – | (430,090 | ) | (430,090 | ) | ||||||||||||||||
| Balance – May 31, 2005 | 4,058,400 | 4,058 | 283,599 | – | 336,766 | 6,000 | – | (466,964 | ) | 163,459 | |||||||||||||||||
| Issuance of common shares for cash at $0.30 per share | 1,322,332 | 1,323 | 395,377 | – | (336,766 | ) | – | – | – | 59,934 | |||||||||||||||||
| Share issuance costs | – | – | (2,974 | ) | – | – | – | – | – | (2,974 | ) | ||||||||||||||||
| Issuance of common shares to acquire mineral properties | 16,000,000 | 16,000 | 5,604,000 | – | – | – | – | – | 5,620,000 | ||||||||||||||||||
| Shares gifted to the Company to settle accounts payable | – | – | – | – | – | 100,000 | – | – | 100,000 | ||||||||||||||||||
| Net loss for the year | – | – | – | – | – | – | – | (5,985,395 | ) | (5,985,395 | ) | ||||||||||||||||
| Balance – May 31, 2006 | 21,380,732 | 21,381 | 6,280,002 | – | – | 106,000 | – | (6,452,359 | ) | (44,976 | ) |
(The accompanying notes are an integral part of these consolidated financial statements)
F - 5
| Deficit | |||||||||||||||||||||||||||
| Accumulated | Accumulated | ||||||||||||||||||||||||||
| Additional | Stock | Common | Other | During the | |||||||||||||||||||||||
| Paid-in | Subscriptions | Stock | Donated | Comprehensive | Exploration | ||||||||||||||||||||||
| Shares | Amount | Capital | Receivable | Subscribed | Capital | Income (Loss) | Stage | Total | |||||||||||||||||||
| # | $ | $ | $ | $ | $ | $ | $ | $ | |||||||||||||||||||
| Balance – May 31, 2006 | 21,380,732 | 21,381 | 6,280,002 | – | – | 106,000 | – | (6,452,359 | ) | (44,976 | ) | ||||||||||||||||
| Issuance of common shares for cash at $0.70 per share | 2,430,133 | 2,430 | 1,698,670 | – | – | – | – | – | 1,701,100 | ||||||||||||||||||
| Share issuance costs | – | – | (143,900 | ) | – | – | – | – | – | (143,900 | ) | ||||||||||||||||
| Common shares issued for consulting services | 150,000 | 150 | 105,600 | – | – | – | – | – | 105,750 | ||||||||||||||||||
| Common shares issued for mineral licenses acquired | 11,650,000 | 11,650 | 8,265,100 | – | – | – | – | – | 8,276,750 | ||||||||||||||||||
| Common shares subscribed for mineral licenses acquired | – | – | – | – | 2,837,500 | – | – | – | 2,837,500 | ||||||||||||||||||
| Common shares subscribed for consulting services | – | – | – | – | 50,000 | – | – | – | 50,000 | ||||||||||||||||||
| Fair value of stock options granted | – | – | 2,482,998 | – | – | – | – | – | 2,482,998 | ||||||||||||||||||
| Donated rent | – | – | – | – | – | 3,000 | – | – | 3,000 | ||||||||||||||||||
| Net loss for the year | – | – | – | – | – | – | – | (16,342,946 | ) | (16,342,946 | ) | ||||||||||||||||
| Balance – May 31, 2007 | 35,610,865 | 35,611 | 18,688,470 | – | 2,887,500 | 109,000 | – | (22,795,305 | ) | (1,074,724 | ) | ||||||||||||||||
| Shares issued for mineral licenses acquired | 900,000 | 900 | 633,600 | – | (634,500 | ) | – | – | – | – | |||||||||||||||||
| Issuance of common shares for cash at $0.30 per share | 300,000 | 300 | 89,700 | – | – | – | – | – | 90,000 | ||||||||||||||||||
| Share issuance costs | – | – | (27,000 | ) | – | – | – | – | – | (27,000 | ) | ||||||||||||||||
| Common shares issued upon cashless exercise of options | 4,575,000 | 4,575 | (4,575 | ) | – | – | – | – | – | – | |||||||||||||||||
| Common shares subscribed for cash at $0.10 per share | – | – | – | – | 50,000 | – | – | – | 50,000 | ||||||||||||||||||
| Common shares subscribed for cash at $0.15 per share | – | – | – | – | 195,000 | – | – | – | 195,000 | ||||||||||||||||||
| Net loss for the year | – | – | – | – | – | – | – | (491,929 | ) | (491,929 | ) | ||||||||||||||||
| Balance – May 31, 2008 | 41,385,865 | 41,386 | 19,380,195 | – | 2,498,000 | 109,000 | – | (23,287,234 | ) | (1,258,653 | ) |
(The accompanying notes are an integral part of these consolidated financial statements)
F - 6
| Deficit | |||||||||||||||||||||||||||
| Accumulated | Accumulated | ||||||||||||||||||||||||||
| Additional | Stock | Common | Other | During the | |||||||||||||||||||||||
| Paid-in | Subscriptions | Stock | Donated | Comprehensive | Exploration | ||||||||||||||||||||||
| Shares | Amount | Capital | Receivable | Subscribed | Capital | Income (Loss) | Stage | Total | |||||||||||||||||||
| # | $ | $ | $ | $ | $ | $ | $ | $ | |||||||||||||||||||
| Balance – May 31, 2008 | 41,385,865 | 41,386 | 19,380,195 | – | 2,498,000 | 109,000 | – | (23,287,234 | ) | (1,258,653 | ) | ||||||||||||||||
| Issuance of common shares for cash at $0.10 per share | 1,000,000 | 1,000 | 99,000 | – | (50,000 | ) | – | – | – | 50,000 | |||||||||||||||||
| Issuance of common shares for cash at $0.15 per share | 12,000,013 | 12,001 | 1,787,999 | – | (195,000 | ) | – | – | – | 1,605,000 | |||||||||||||||||
| Issuance of common shares for cash at $0.20 per share | 6,462,500 | 6,462 | 1,286,038 | – | – | – | – | – | 1,292,500 | ||||||||||||||||||
| Issuance of common shares for cash at $0.25 per share | 1,400,404 | 1,400 | 348,700 | – | – | – | – | – | 350,100 | ||||||||||||||||||
| Issuance of common shares for cash at $0.30 per share | 500,000 | 500 | 149,500 | – | – | – | – | – | 150,000 | ||||||||||||||||||
| Issuance of common shares for cash at $0.40 per share | 362,500 | 362 | 144,638 | – | – | – | – | – | 145,000 | ||||||||||||||||||
| Share issuance costs | – | – | (141,000 | ) | – | – | – | – | – | (141,000 | ) | ||||||||||||||||
| Common shares issued upon cashless exercise of options | 3,365,000 | 3,365 | (3,365 | ) | – | – | – | – | – | – | |||||||||||||||||
| Issuance of common shares upon the exercise of options at $0.30 per share | 170,000 | 170 | 50,830 | – | – | – | – | – | 51,000 | ||||||||||||||||||
| Common shares subscribed for cash at $0.25 per share | – | – | – | – | 323,000 | – | – | – | 323,000 | ||||||||||||||||||
| Stock-based compensation | – | – | 1,188,706 | – | – | – | – | – | 1,188,706 | ||||||||||||||||||
| Net loss for the year | – | – | – | – | – | – | – | (4,759,010 | ) | (4,759,010 | ) | ||||||||||||||||
| Balance – May 31, 2009 | 66,646,282 | 66,646 | 24,291,241 | – | 2,576,000 | 109,000 | – | (28,046,244 | ) | (1,003,357 | ) |
(The accompanying notes are an integral part of these consolidated financial statements)
F - 7
| Deficit | |||||||||||||||||||||||||||
| Accumulated | Accumulated | ||||||||||||||||||||||||||
| Additional | Stock | Common | Other | During the | |||||||||||||||||||||||
| Paid-in | Subscriptions | Stock | Donated | Comprehensive | Exploration | ||||||||||||||||||||||
| Shares | Amount | Capital | Receivable | Subscribed | Capital | Income (Loss) | Stage | Total | |||||||||||||||||||
| # | $ | $ | $ | $ | $ | $ | $ | $ | |||||||||||||||||||
| Balance – May 31, 2009 | 66,646,282 | 66,646 | 24,291,241 | – | 2,576,000 | 109,000 | – | (28,046,244 | ) | (1,003,357 | ) | ||||||||||||||||
| Issuance of common shares for cash at $0.20 per share | 75,000 | 75 | 14,925 | – | – | – | – | – | 15,000 | ||||||||||||||||||
| Issuance of common shares for cash at $0.25 per share | 1,392,000 | 1,392 | 346,608 | – | (323,000 | ) | – | – | – | 25,000 | |||||||||||||||||
| Share issuance costs | – | – | (13,400 | ) | – | – | – | – | – | (13,400 | ) | ||||||||||||||||
| Common shares issued upon cashless exercise of options | 4,200,000 | 4,200 | (4,200 | ) | – | – | – | – | – | – | |||||||||||||||||
| Stock-based compensation | – | – | 1,519,382 | – | – | – | – | – | 1,519,382 | ||||||||||||||||||
| Net loss for the year | – | – | – | – | – | – | – | (2,049,304 | ) | (2,049,304 | ) | ||||||||||||||||
| Balance – May 31, 2010 | 72,313,282 | 72,313 | 26,154,556 | – | 2,253,000 | 109,000 | – | (30,095,548 | ) | (1,506,679 | ) | ||||||||||||||||
| Issuance of common shares for cash at $0.05 per share | 22,000,000 | 22,000 | 1,078,000 | – | – | – | – | – | 1,100,000 | ||||||||||||||||||
| Issuance of common shares for cash at $0.45 per share | 27,173,372 | 27,174 | 12,200,843 | – | – | – | – | – | 12,228,017 | ||||||||||||||||||
| Share issuance costs | – | – | (1,477,401 | ) | – | – | – | – | – | (1,477,401 | ) | ||||||||||||||||
| Common shares issued upon cashless exercise of options | 13,800,000 | 13,800 | (13,800 | ) | – | – | – | – | – | – | |||||||||||||||||
| Issuance of common shares upon the exercise of options at $0.30 per share | 130,000 | 130 | 38,870 | – | – | – | – | – | 39,000 | ||||||||||||||||||
| Issuance of common shares upon the exercise of warrants at $0.075 per share | 2,000,000 | 2,000 | 148,000 | – | – | – | – | – | 150,000 | ||||||||||||||||||
| Issuance of common shares to acquire mineral properties | 150,000,000 | 150,000 | 59,850,000 | – | – | – | – | – | 60,000,000 | ||||||||||||||||||
| Issuance of common shares for debt | 5,000,000 | 5,000 | 3,780,505 | (13,814 | ) | – | – | – | – | 3,771,691 | |||||||||||||||||
| Issuance of finders’ fee warrants | – | – | 490,960 | – | – | – | – | – | 490,960 | ||||||||||||||||||
| Stock-based compensation | – | – | 9,675,441 | – | – | – | – | – | 9,675,441 | ||||||||||||||||||
| Unrealized gain on marketable securities | – | – | – | – | – | – | 1,240,000 | – | 1,240,000 | ||||||||||||||||||
| Net loss for the year | – | – | – | – | – | – | – | (72,412,056 | ) | (72,412,056 | ) | ||||||||||||||||
| Balance – May 31, 2011 | 292,416,654 | 292,417 | 111,925,974 | (13,814 | ) | 2,253,000 | 109,000 | 1,240,000 | (102,507,604 | ) | 13,298,973 |
(The accompanying notes are an integral part of these consolidated financial statements)
F - 8
| Deficit | |||||||||||||||||||||||||||
| Accumulated | Accumulated | ||||||||||||||||||||||||||
| Additional | Stock | Common | Other | During the | |||||||||||||||||||||||
| Paid-in | Subscriptions | Stock | Donated | Comprehensive | Exploration | ||||||||||||||||||||||
| Shares | Amount | Capital | Receivable | Subscribed | Capital | Income (Loss) | Stage | Total | |||||||||||||||||||
| # | $ | $ | $ | $ | $ | $ | $ | �� | $ | ||||||||||||||||||
| Balance – May 31, 2011 | 292,416,654 | 292,417 | 111,925,974 | (13,814 | ) | 2,253,000 | 109,000 | 1,240,000 | (102,507,604 | ) | 13,298,973 | ||||||||||||||||
| Issuance of common shares for property | 15,000,000 | 15,000 | 1,635,000 | – | – | – | – | – | 1,650,000 | ||||||||||||||||||
| Cancellation of share issue obligation | – | – | – | – | (2,253,000 | ) | – | – | – | (2,253,000 | ) | ||||||||||||||||
| Subscription received | – | – | – | 13,814 | 150,000 | – | – | – | 163,814 | ||||||||||||||||||
| Stock-based compensation | – | – | 1,728,868 | – | – | – | – | – | 1,728,868 | ||||||||||||||||||
| Unrealized loss on marketable securities | – | – | – | – | – | – | (2,840,000 | ) | – | (2,840,000 | ) | ||||||||||||||||
| Net loss for the year | – | – | – | – | – | – | – | (6,903,557 | ) | (6,903,557 | ) | ||||||||||||||||
| Balance – May 31, 2012 | 307,416,654 | 307,417 | 115,289,842 | – | 150,000 | 109,000 | (1,600,000 | ) | (109,411,161 | ) | 4,845,098 | ||||||||||||||||
| Issuance of common shares for independent compensation | 1,000,000 | 1,000 | 39,000 | – | – | – | – | – | 40,000 | ||||||||||||||||||
| Issuance of common shares for cash at $0.05 | 13,000,000 | 13,000 | 637,000 | – | (150,000 | ) | – | – | – | 500,000 | |||||||||||||||||
| Stock-based compensation | – | – | 448,982 | – | – | – | – | – | 448,982 | ||||||||||||||||||
| Deemed interest on interest-free loan from a related party | – | – | – | – | – | 28,379 | – | – | 28,379 | ||||||||||||||||||
| Realized loss on marketable securities | – | – | – | – | – | – | 1,600,000 | – | 1,600,000 | ||||||||||||||||||
| Impairment of marketable securities | – | – | – | – | – | – | (1,020,000 | ) | – | (1,020,000 | ) | ||||||||||||||||
| Net loss for the year | – | – | – | – | – | – | – | (4,237,531 | ) | (4,237,531 | ) | ||||||||||||||||
| Balance – May 31, 2013 | 321,416,654 | 321,417 | 116,414,824 | – | – | 137,379 | (1,020,000 | ) | (113,648,692 | ) | 2,204,928 | ||||||||||||||||
| Deemed interest on interest-free loan from a related party | – | – | – | – | – | 85,116 | – | – | 85,116 | ||||||||||||||||||
| Realized loss on marketable securities | – | – | – | – | – | – | 1,000,000 | – | 1,000,000 | ||||||||||||||||||
| Impairment of marketable securities | – | – | – | – | – | – | (66,400 | ) | – | (66,400 | ) | ||||||||||||||||
| Net loss for the year | – | – | – | – | – | – | – | (2,293,595 | ) | (2,293,595 | ) | ||||||||||||||||
| Balance – May 31, 2014 | 321,416,654 | 321,417 | 116,414,824 | – | – | 222,495 | (86,400 | ) | (115,942,287 | ) | 930,049 |
(The accompanying notes are an integral part of these consolidated financial statements)
F - 9F-5
| Handeni Gold Inc. |
| (An Exploration Stage Company) |
| Notes to the Consolidated Financial Statements as of May 31, |
| (Expressed in U.S. dollars) |
| 1. | Nature of Operations and |
| |
|
The Company was incorporated in the State of Nevada on January 5, 2004. On February 14, 2012, the Company changed its name from Douglas Lake Minerals Inc. to Handeni Gold Inc. (the “Company”). The Company’s principal business is the acquisition and exploration of mineral resources located in Tanzania, Africa. The Company has not presently determined whether its properties contain mineral reserves that are economically recoverable.
These consolidated financial statements have been prepared on a going concern basis, which implies the Company will continue to realize its assets and discharge its liabilities in the normal course of business. The Company has never generated revenues since inception and has never paid any dividends and is unlikely to pay dividends or generate earnings in the immediate or foreseeable future. The continuation of the Company as a going concern is dependent upon the continued financial support from its stockholders, the ability of the Company to obtain necessary equity financing to continue operations and to determine the existence, discovery and successful exploitation of economically recoverable reserves in its resource properties, confirmation of the Company’s interests in the underlying properties, and the attainment of profitable operations.
As at May 31, 2015, the Company has not generated any revenues, has a working capital deficiency of $382,358, and has accumulated losses of $117,108,249 since inception. These factors raise substantial doubt regarding the Company’s ability to continue as a going concern. The Company plans to raise equity and/or debt financing to fund its operations which may result in substantial dilution to the Company’s stockholders or may not be available, if at all, in amounts or on terms acceptable to the Company. If additional capital is not obtained, the Company may be forced to cease operations. These consolidated financial statements do not include any adjustments to the recoverability and classification of recorded asset amounts and classification of liabilities that might be necessary should the Company be unable to continue as a going concern.
| 2. | Summary of Significant Accounting Policies |
| a) | Basis of Presentation | |
These consolidated financial statements and related notes are presented in accordance with accounting principles generally accepted in the United States, and are expressed in | ||
All significant intercompany transactions and balances have been eliminated. The Company’s fiscal year-end is May 31. | ||
| b) | Use of Estimates | |
The preparation of consolidated financial statements in accordance with United States generally accepted accounting principles requires management to make estimates and assumptions that affect the reported amounts of assets and liabilities at the date of the consolidated financial statements and the reported amounts of revenue and expenses in the reporting period. The Company regularly evaluates estimates and assumptions related to the estimated deemed interest rates on interest-free related party loans, recoverability and useful life of long-lived assets, | ||
| c) | Basic and Diluted Net Income (Loss) Per Share | |
The Company computes net income (loss) per share in accordance with ASC 260,Earnings per Sharewhich requires presentation of both basic and diluted earnings per share (EPS) on the face of the | ||
| d) | Comprehensive Income (Loss) | |
ASC 220,Comprehensive Incomeestablishes standards for the reporting and display of comprehensive income (loss) and its components in the consolidated financial statements. | ||
| e) | Cash and Cash Equivalents | |
Cash and cash equivalents are carried at fair value and they comprise cash on hand, deposits held with banks and other highly liquid investments. Highly liquid investments are readily convertible to cash and generally have maturities of three months or less from the time acquired. The Company places its cash and cash equivalents with high quality financial institutions which the Company believes limits credit risk. |
F - 106
| Handeni Gold Inc. |
| (An Exploration Stage Company) |
| Notes to the Consolidated Financial Statements as of May 31, |
| (Expressed in U.S. dollars) |
| 2. | Summary of Significant Accounting Policies (continued) |
| f) | Marketable Securities | |
The Company reports investments in marketable equity securities at fair value based on quoted market prices. All investment securities are designated as available for sale with unrealized gains and losses included in stockholders’ equity. Realized gains and losses are accounted for based on the specific identification method. | ||
The Company periodically reviews these investments for other-than-temporary declines in fair value based on the specific identification method. When an other-than-temporary decline has occurred, unrealized losses that are other than temporary are recognized in earnings. When determining whether a decline is other-than-temporary, the Company examines (i) the length of time and the extent to which the fair value of an investment has been lower than its carrying | ||
| g) | Property and Equipment | |
Property and equipment |
| Automobiles | 3 years | |
| Camp and equipment | 3 years | |
| Office furniture and equipment | 3 years | |
| Software | 1 year |
| h) | Mineral Property Costs | |
The Company has been in the exploration stage since its inception on January 5, 2004 and has not yet realized any revenues from its planned operations. It is primarily engaged in the acquisition and exploration of mining properties. Mineral property exploration costs are expensed as incurred. Mineral prospecting licenses and mineral property acquisition costs are initially | ||
When it has been determined that a mineral property can be economically developed as a result of establishing proven and probable reserves, the costs then incurred to develop such property, are capitalized. Such costs will be amortized using the units-of- production method over the estimated life of the probable reserve. If mineral properties are subsequently abandoned or impaired, any capitalized costs will be charged to operations. | ||
| i) | Long-Lived Assets | |
In accordance with ASC 360, Property, Plant and Equipmentthe Company tests long-lived assets or asset groups for recoverability when events or changes in circumstances indicate that their carrying amount may not be recoverable. Circumstances which could trigger a review include, but are not limited to: significant decreases in the market price of the asset; significant adverse changes in the business climate or legal factors; accumulation of costs significantly in excess of the amount originally expected for the acquisition or construction of the asset; current period cash flow or operating losses combined with a history of losses or a forecast of continuing losses associated with the use of the asset; and current expectation that the asset will more likely than not be sold or disposed significantly before the end of its estimated useful life. Recoverability is assessed based on the carrying amount of the asset and its fair value, which is generally determined based on the sum of the undiscounted cash flows expected to result from the use and the eventual disposal of the asset, as well as specific appraisal in certain instances. An impairment loss is recognized when the carrying amount is not recoverable and exceeds fair value. | ||
| j) | Asset Retirement Obligations | |
The Company accounts for asset retirement obligations in accordance with the provisions of ASC 440Asset Retirement and Environmental Obligationswhich requires the Company to record the fair value of an asset retirement obligation as a liability in the period in which it incurs a legal obligation associated with the retirement of tangible long-lived assets that result from the acquisition, construction, development and/or normal use of the assets. The Company did not have any asset retirement obligations as |
F - 117
| Handeni Gold Inc. |
| (An Exploration Stage Company) |
| Notes to the Consolidated Financial Statements as of May 31, |
| (Expressed in U.S. dollars) |
| 2. | Summary of Significant Accounting Policies (continued) |
| k) | Financial Instruments | |
ASC 825,Financial Instrumentsrequires an entity to maximize the use of observable | ||
The Company’s operations are in Canada and Africa, which results in exposure to market risks from changes in foreign currency rates. The financial risk is the risk to the Company’s operations that arise from fluctuations in foreign exchange rates and the degree of volatility of these rates. Currently, the Company does not use derivative instruments to reduce its exposure to foreign currency risk. | ||
| l) | Income Taxes | |
The Company accounts for income taxes using the asset and liability method in accordance with ASC 740,Income Taxes.The asset and liability method provides that deferred tax assets and liabilities are recognized for the expected future tax consequences of temporary differences between the financial reporting and tax bases of assets and liabilities, and for operating loss and tax credit carry-forwards. Deferred tax assets and liabilities are measured using the currently enacted tax rates and laws that will be in effect when the differences are expected to reverse. The Company records a valuation allowance to reduce deferred tax assets to the amount that is believed more likely than not to be realized. | ||
| m) | Foreign Currency Translation | |
The functional and reporting currency of the Company is the United States dollar. The functional currency of the Company’s subsidiaries is Tanzania shillings. Monetary assets and liabilities denominated in foreign currencies are translated to United States dollars in accordance with ASC 830Foreign Currency Translation Matters, using the exchange rate prevailing at the consolidated balance sheet date. Non-monetary assets and liabilities denominated in foreign currencies are translated at rates of exchange in effect at the date of the transaction. Average rates are used to translate revenues and expenses. | ||
Gains and losses arising on translation or settlement of foreign currency denominated transactions or balances are included in the determination of income. The Company has not, to the date of these consolidated financial statements, entered into derivative instruments to offset the impact of foreign currency fluctuations. | ||
To the extent that the Company incurs transactions that are not denominated in its functional currency, they are undertaken in Canadian dollars (“Cdn$”) and Tanzanian | ||
| n) | Stock-based Compensation | |
The Company records stock-based compensation in accordance with ASC 718,Compensation – Stock Based Compensationand ASC 505,Equity Based Payments to Non-Employees, which requires the measurement and recognition of compensation expense based on estimated fair values for all share-based awards made to employees and directors, including stock options. | ||
ASC 718 requires companies to estimate the fair value of share-based awards on the date of grant using an option-pricing model. The Company uses the Black-Scholes option-pricing model as its method of determining fair value. This model is affected by the Company’s stock price as well as assumptions regarding a number of subjective variables. These subjective variables include, but are not limited to the Company’s expected stock price volatility over the term of the awards, and actual and projected employee stock option exercise behaviours. The value of the portion of the award that is ultimately expected to vest is recognized as an expense in the consolidated statement of operations and comprehensive loss over the requisite service period. | ||
All transactions in which goods or services are the consideration received for the issuance of equity instruments are accounted for based on the fair value of the consideration received or the fair value of the equity instrument issued, whichever is more reliably measurable. | ||
| o) | Reclassification | |
Certain reclassifications have been made to the prior year’s consolidated financial statements to conform to the current year’s presentation. | ||
| p) | Recently Issued Accounting Pronouncements | |
The Company has adopted all new accounting pronouncements that are mandatorily effective and none have a material impact on its consolidated financial statements. | ||
New accounting pronouncements effective June 1, 2015 | ||
During the year ended May 31, 2015, the Company elected to early adopt Accounting Standards Update No. 2014-10, Development Stage Entities (Topic 915): Elimination of Certain Financial Reporting Requirements. The adoption of this standard allowed the Company to remove the previously disclosed inception-to-date information and all references to exploration stage. | ||
The Company does not believe that there are any other new accounting pronouncements that have been issued that are expected to have a material impact on its financial position or results of operations. | ||
| ||
|
F - 128
Handeni Gold Inc.
| (An Exploration Stage Company) |
| 3. | Amounts Receivable |
|
| May 31, | May 31, | ||||||
| 2014 | 2013 | ||||||
| $ | $ | ||||||
| Recoverable value added tax | 23,202 | 579,121 | |||||
| Recoverable goods and services tax / harmonized sales tax | 9,765 | 46,588 | |||||
| Other receivables | 1,359 | 236 | |||||
| 34,326 | 625,945 |
The components of amounts receivable are as follows:
| May 31, 2015 | May 31, 2014 | ||||||
| $ | $ | ||||||
| Recoverable value added tax | 28,797 | 23,202 | |||||
| Recoverable harmonized sales tax | 9,830 | 9,765 | |||||
| Other receivable | 124 | 1,359 | |||||
| 38,751 | 34,326 |
The Company had recoverable value added tax (“VAT”) of $28,797 (TZS 57,511,042) as at May 31, 2015 and $23,202 (TZS 38,566,758) as at May 31, 2014 and $579,1212014. In January 2015, the Company submitted VAT refund certificates to the Tanzania Revenue Authority requesting $24,566 (TZS 920,601,669) as at49,061,634) recoverable VAT refund. As of May 31, 2013.2015, the Company had not received such entitled VAT refund. During the year ended May 31, 2014, the Company had received from the Tanzania Revenue Authority $507,916 (TZS 845,117,520) recoverable value added taxVAT refund, net of taxes and interest.
| 4. | Prepaid Expenses and Deposits |
|
| May 31, | May 31, | ||||||
| 2014 | 2013 | ||||||
| $ | $ | ||||||
| General and administrative | 2,343 | 7,768 | |||||
| Rent | 12,733 | 80,018 | |||||
| 15,076 | 87,786 |
The components of prepaid expenses and deposits are as follows:
| May 31, 2015 | May 31, 2014 | ||||||
| $ | $ | ||||||
| General and administrative | - | 2,343 | |||||
| Rent | 306 | 12,733 | |||||
| 306 | 15,076 |
| 5. | Restricted Cash Equivalent |
|
As of May 31, 2015, the Company has pledged a GIC of $13,858 (May 31, 2014: $26,522) as security held on a corporate credit card.
| 6. | Restricted Marketable Securities |
| May 31, 2014 | May 31, 2013 | |||||||||||||||||||||
| Fair Value | Other-than- | Fair Value | Other-than- | |||||||||||||||||||
| Based On | temporary | Accumulated | Based On | temporary | Accumulated | |||||||||||||||||
| Quoted | Impairment | Unrealized | Quoted | Impairment | Unrealized | |||||||||||||||||
| Cost | Market Price | Loss | Loss | Market Price | Loss | Loss | ||||||||||||||||
| Ruby Creek | $ | $ | $ | $ | $ | $ | $ | |||||||||||||||
| Resources Inc., 4,000,000 shares | 2,760,000 | 73,600 | (2,600,000 | ) | (86,400 | ) | 140,000 | (1,600,000 | ) | (1,020,000 | ) | |||||||||||
| May 31, 2015 | May 31, 2014 | ||||||||||||||||||
| Other-than- | Fair Value | Other-than- | |||||||||||||||||
| temporary | Loss on | Based On | temporary | Accumulated | |||||||||||||||
| Impairment | Marketable | Quoted | Impairment | Unrealized | |||||||||||||||
| Cost | Loss | Securities | Market Price | Loss | Loss | ||||||||||||||
| Ruby Creek | $ | $ | $ | $ | $ | $ | |||||||||||||
| Resources Inc., 4,000,000 shares | 2,760,000 | (2,740,000 | ) | (20,000 | ) | 73,600 | (2,600,000 | ) | (86,400 | ) | |||||||||
The four million4,000,000 restricted shares of common stock of Ruby Creek Resources Inc. (“RCR”) were issued to the Company on December 16, 2010 as partial consideration to purchase the mineral property interests under the agreements between RCR and the Company. The initial fair market value of these shares was $2,760,000 based on RCR’s quoted stock price on the issuance date. Refer
On January 13, 2015, the Company reached a binding settlement to Note 7b) for details on the agreementsits litigation with RCR. Under the terms of the settlement, the Company will return the 4,000,000 restricted shares of RCR common stock to RCR (see Note 13, below). As a result, the Company has recorded a loss on marketable securities of $20,000 related to the pending return of these shares. As of May 31, 2014, the fair market value of these shares was $73,600 (May 31, 2013: $140,000) based on RCR’s quoted stock price and recorded as non-current assets. During the year ended May 31, 2014,2015, the Company determined that $1,000,000 (May 31, 2013: $1,600,000) of unrealized losses were other than temporary and were recognized in net loss, and were removed from accumulated other comprehensive loss. As at May 31, 2014, the Companyhas recognized a total of $2,600,000 other-than-temporary$2,740,000 (May 31, 2014: $2,600,000) in other than temporary impairment oflosses on these RCR restricted shares.
F - 13
| 7. | Mineral Properties and Licenses |
| a) | Handeni Properties, Tanzania, Africa | |
Prospecting Licenses (“PLs”)
On September 21, 2010, the Company completed a Mineral Property Acquisition Agreement with IPP Gold Limited (“IPP Gold”), and the Company acquired four PLs totaling approximately 800 square kilometers, located in the Handeni District of Tanzania (the “Handeni Properties”). IPP Gold retained a 2.5% net smelter royalty (“NSR”) on the Handeni Properties and the Company has the option to reduce the NSR to 1.25% by paying $5,000,000. If the NSR is reduced to 1.25% the maximum NSR for any year is capped at $1,000,000. In any year the NSR payment is less than $1,000,000 the difference between the actual NSR payment and $1,000,000 will be carried forward to subsequent years. In addition if the London spot price for gold is equal to or greater than $1,500 then the NSR will increase from 2.5% to 3%. The Company issued 133,333,333 restricted shares of common stock to IPP Gold to acquire the Handeni Properties and no further payments to IPP Gold in shares or cash are required.
F - 9
Handeni Gold Inc.
(An Exploration Stage Company)
Notes to the Consolidated Financial Statements as of May 31, 2015
(Expressed in U.S. dollars)
| 7. | Mineral Properties and Licenses (continued) |
| a) | Handeni Properties, Tanzania, Africa (continued) |
Prospecting Licenses (“PLs”) (continued)
On September 1, 2010, the Company entered into a Transaction Fee Agreement with a consultant for services related to soliciting offers from and in assisting in the negotiation with potential Company financiers, purchasers, acquisition targets and/or joint venture development partners (each such party being a “Potential Investor”). The initial term of the agreement iswas a period of 60 days and automatically renews monthly unless otherwise specifically renewed in writing by each party or terminated by the Company. Pursuant to the agreement, the Company agreed to pay the consultant a transaction fee for each completed property acquisition transaction in Tanzania (a “Completed Transaction”). The transaction fee is 12.5% of the shares issuable under each Completed Transaction, payable in restricted common shares at the lowest priced security issuable under each Completed Transaction. On September 30, 2010, the Company issued 16,666,667 restricted shares of common stock pursuant to the Transaction Fee Agreement in relation to the acquisition of the Handeni Properties.
The fair value of the 133,333,333 shares of the Company’s common stock issued to IPP Gold pursuant to the Acquisition Agreement and the 16,666,667 shares of the Company’s common stock issued pursuant to the Transaction Fee Agreement totaled $60,000,000.
On November 30, 2010, the capitalized acquisition costs of the Handeni Properties were tested for impairment by the Company’s management as required by ASC 360. Management determined that no positive cash flows from the Handeni Properties could be identified or supported and a full impairment loss was recognized in expenses for the $60,000,000 acquisition cost.
Under Tanzanian law, 50% of the area of PLs need to be relinquished following a period of three years after allocation of the PLs to the Company (1998 Mining Act applicable to the Companies’ PLs). On August 16, 2013, the Company applied for renewal of two of the licenses that expired in September 2013 and two of the licenses that expired in October 2013. The Company has received four renewal PLs of the renewal areas under PL6742/2010, PL6744/2010, PL6743/2010 and PL6779/2010 effective on October 5, 2013, September 13, 2013, October 13, 2013 and September 13, 2013, respectively. These four PLs are valid until October 4, 2016, September 12, 2016, October 12, 2016 and September 12, 2016, respectively. The total area occupied by the renewal licenses is approximately 359.80 km2 or 45% of the original area.
In addition to applyingthe renewal areas, the Company had also applied for the remainder of the license areas theand has received four additional PLs. The Company submitted application for additional license areas taking ournow holds a total license area toof approximately 52%423.03 km2(53% of theits original 800 km2license area). The outcome of these applications is still pending.
During the year ended May 31, 2015, the Company paid $62,584 (2014: $59,333) in annual rental and licenses renewal fees for PLs. Such license related fees have been recorded as exploration expenses.
Primary Mining Licenses (“PMLs”),
On August 5, 2011, the Company entered a Mineral Property Acquisition Agreement (the “2011 Acquisition Agreement”) with Handeni Resources Limited (“Handeni Resources”), a limited liability company registered under the laws of Tanzania. The Chairman of the Board of Directors of the Company has an existing ownership and/or beneficial interest(s) in Handeni Resources. Pursuant to the 2011 Acquisition Agreement, the Company had an exclusive option to acquire from Handeni Resources a 100% interest in mineral licenses covering an area of approximately 2.67 square kilometers to the east of Magambazi Hill, which is adjacent to the area covered by the Company’s four existing PLs in the Handeni District.
On November 30, 2011, the Company completed the 2011 Acquisition Agreement and issued 15,000,000 restricted common shares to Handeni Resources as payment. As at November 30, 2011, the fair market price of the Company’s common stock was $0.11 per share; accordingly, the Company recorded a total fair market value of $1,650,000 as the mineral licenses acquisition cost.
To comply with the laws and regulations of the Republic of Tanzania whereby foreign companies may not own PMLs, on July 19, 2012, the Company entered into an Addendum agreement to the 2011 Acquisition Agreement whereby Handeni Resources, on behalf of the Company, administers the 32 PMLs until such time as a mining license on the 32 PMLs (2.67 km2) have been allocated. During this period Handeni Resources is conducting exploration and mining activities on the PMLs as directed by the Company.
During the year ended May 31, 2014, the Company paid $59,333 of annual rental and license renewal application fees for PLs, and during the year ended May 31, 2013, the Company paid $106,081 in annual rental and license renewal fees related to the Company’s four PLs and 32 PMLs. Such license related fees were recorded as exploration expenses.
F - 14
| ||
| b) | Mkuvia Alluvial Gold Project, Tanzania, Africa | |
The Mkuvia Alluvial Gold Project was comprised of four PLs covering a total area of 380 square kilometers located in the Nachingwea District, Lindi Region of the Republic of Tanzania. The Company is aware that the four PLs expired during May and June of 2012. The Company is currently evaluating whether any viable interest remains in these PLs, but no final determination has been made as of yet. As at May 31, 20142015 and 2013,2014, the Company has no capitalized costs related to the Mkuvia Alluvial Gold Project.
By way of background, on June 27, 2008,On January 13, 2015, the Company entered intoreached a Joint Venture Agreement that grantsbinding settlement agreement with regards to its litigation with RCR (see Note 13, below). Based on this agreement with RCR, the Company the right to explore for minerals on properties in Liwale and Nachigwea Districts of Tanzania known as the Mkuvia Alluvial Gold Project, in consideration for the payment of $1,000,000 (paid) upon signing the agreement and $540,000 over five years beginning July 15, 2008. The $540,000 is payable in stages on a quarterly basis of which $80,000 must be paid in the first year, and $460,000 over the next five years. The holder of the property licenses retains a net smelter royalty return of 3%.
On June 5, 2009, the Company entered into a new joint venture which reduced the area covered by the original agreement to approximately 380 square kilometers. Pursuant to the new joint venture agreement, the Company was required to pay $40,000 upon the signing of the new agreement. In addition, the joint venture partner is still entitled to receive a perpetual net smelter royalty return of 3% from any product realized from the property underlying the prospecting licenses. By entering into the new joint venture agreement, the Company is no longer required to pay the balance of the $460,000 previously due under the prior joint venture agreement. The new joint venture agreement covers prospecting licenses No. 5673/2009, No. 5669/2009, No. 5664/2009, and No. 5662/2009, all of which were renewed on June 12, 2009 for a period of three years.
On November 7, 2009, the Company entered intowill relinquish its first agreement with Ruby Creek Resources Inc. (“RCR”) in which RCR has the right to acquire a 70% interest in 125 square kilometers of the Company’s interest in the 380 square kilometers covered by the four prospecting licenses in the Mkuvia Alluvial Gold Project in consideration for $3,000,000 payable as follows:
| ||
| ||
| ||
| ||
| ||
| ||
|
During fiscal 2010, the Company recognized $350,000 in other income for the receipt of option payments.
On May 24, 2010, in a second agreement (fully executed on June 16, 2010) between RCR and the Company, RCR has to the right to earn a 70% interest in the remaining 255 square kilometers of the 380 square kilometer Mkuvia Alluvial Gold Project by making additional payments totaling $6,000,000 to the Company.
The schedule by which RCR is to pay such $6,000,000 to the Company is as follows:
| ||
| ||
| ||
| ||
|
Thus, the combined payments under the November 7, 2009 and the May 24, 2010 agreements provided for a total commitment of $9,000,000 payable to the Company by RCR to purchase a 70% interest in the entire 380 square kilometer Mkuvia Alluvial Gold Project. The ownership structure of the interest in the Mkuvia Alluvial Gold Project shall be a 70% interestafter the formal agreement delivered by RCR a 25% interest for the Company, and a 5% interest for Mr. Mkuvia Maita, the original owner of the underlying prospecting licenses. In addition, Mr. Maita retains a 3% net smelter royalty.as agreed.
F - 1510
Handeni Gold Inc.
| (An Exploration Stage Company) Notes to the Consolidated Financial Statements as of May 31, 2015 (Expressed in U.S. dollars) |
| ||
On June 3, 2010, the Company and RCR incorporated Ruby Creek Resources (Tanzania) Limited (“Ruby Creek Tanzania”) to manage the mining operations in the Mkuvia Gold Project in Tanzania. Ruby Creek Resources (Tanzania) Limited, a joint venture company (the “Joint Venture Company”), is owned by Ruby Creek Resources (70%), the Company (25%) and Mr. Mkuvia Maita (5%).
During fiscal 2011 the Company recognized a total of $3,110,000 in other income for the receipt of the shares at fair market value and the option payments (i) and (ii). The Company has not yet received the $450,000 option payment (iii) nor received the $1,000,000 option payment (iv) which are overdue and the agreement is in default. Prospecting licenses numbered 5664/2009 and 5669/2009, which form a part of the joint venture project, were allegedly registered to a third party without the Company’s approval.
RCR filed a lawsuit against the Company in the Supreme Court, State of New York, on February 8, 2012, alleging the Company’s involvement in a fraudulent transfer and breach of agreements. On May 21, 2012, in answering RCR’s claim in New York, the Company counter claimed against RCR. The Company is of the view that such allegations are without merit and intends to continue vigorously contest the action in New York. (More details see Note 13, below).
| 8. | Property and Equipment |
| May 31, 2014 | May 31, 2013 | ||||||||||||
| Accumulated | Net Book | Net Book | |||||||||||
| Cost | Depreciation | Value | Value | ||||||||||
| $ | $ | $ | $ | ||||||||||
| Automobile vehicles | 338,928 | 334,345 | 4,583 | 98,149 | |||||||||
| Camp and equipment | 197,011 | 154,769 | 42,242 | 107,913 | |||||||||
| Office furniture and equipment | 100,222 | 93,587 | 6,635 | 37,325 | |||||||||
| Software | 8,080 | 6,094 | 1,986 | 2,086 | |||||||||
| 644,241 | 588,795 | 55,446 | 245,473 | ||||||||||
| May 31, 2015 | May 31, 2014 | ||||||||||||
| Accumulated | Net Book | Net Book | |||||||||||
| Cost | Depreciation | Value | Value | ||||||||||
| $ | $ | $ | $ | ||||||||||
| Automobiles | 257,300 | 257,300 | - | 4,583 | |||||||||
| Camp and equipment | 197,011 | 197,011 | - | 42,242 | |||||||||
| Office furniture and equipment | 100,222 | 98,970 | 1,252 | 6,635 | |||||||||
| Software | 7,930 | 7,708 | 222 | 1,986 | |||||||||
| 562,463 | 560,989 | 1,474 | 55,446 | ||||||||||
| 9. | Related Party Transactions |
| a) | The Company has entered into the following facility agreements with related parties: |
On December 7, 2012, and as amended on September 4, 2013, June 18, 2014 and March 20, 2015, the Company entered into a facility agreement with IPP Ltd., a private company controlled by the | ||
| ii) | On October 9, 2013, and as amended on June 18, 2014 and March 20, 2015, the Company entered into a facility agreement with Consultancy & Finance Company Associates Ltd. (“C&F”), a private company controlled by the | |
| iii) |
|
For the year ended May 31, 2015, $92,487 of deemed interest was calculated at an annual interest rate of 8% (2014: $85,116 calculated at an annual interest rate of 10%). Such deemed interest was calculated at an annual interest rate of 10% which approximates the fair market value of the borrowings and was recorded as interest expense and donated capital.
| b) | During the year ended May 31, 2015 and 2014, the Company incurred administration and professional services fees of $144,000 | |
During the year ended May 31, | ||
| c) | During the year ended May 31, |
F - 16
| ||
| d) | During the year ended May 31, | |
| ||
| ||
| ||
| ||
|
Accordingly, the Company incurred independent directors’ fees of $65,000 during the year ended May 31, 2014 (May 31, 2013 - $190,250). As at May 31, 2014, the Company had $88,750 (May 31, 2013 - $93,250) payable.
During the year ended May 31, 2013, the Company granted to each independent director 200,000 stock options at a price of $0.08 per share exercisable for 10 years for a total of 1,000,000 stock options and 200,000 shares of the Company’s common stock with a fair value of $0.04 per share for a total of 1,000,000 shares as stock-based compensation. Such stock options and shares were granted under the Company’s November 2010 Stock Incentive Plan. Two of these independent directors resigned respectively during the fiscal year ended May 31, 2013 and the related 400,000 granted stock options were forfeited.
| 10. | Common Stock and Additional Paid-in Capital |
The authorized common stock of the Company consists of 500,000,000 shares, with $0.001 par value. The following is a summary of the Company’s issued and outstanding common stock during the fiscal years ended May 31, 2014 and 2013:
| Common Stock | Additional Paid-In | |||||||||
| Shares | Par Value | Capital | ||||||||
| # | $ | $ | ||||||||
| Balance as at May 31, 2012 | 307,416,654 | 307,417 | 115,289,842 | |||||||
| Shares Issued for Independent Directors’ Compensation | 1,000,000 | 1,000 | 39,000 | |||||||
| Shares Issued for cash at $0.05 per share | 13,000,000 | 13,000 | 637,000 | |||||||
| Value Assigned to Options Granted or Vested | - | - | 448,982 | |||||||
| Balance as at May 31, 2013 | 321,416,654 | 321,417 | 116,414,824 | |||||||
| Shares Issued | - | - | - | |||||||
| Balance as at May 31, 2014 | 321,416,654 | 321,417 | 116,414,824 | |||||||
For the Year ended May 31, 2014
During the year ended May 31, 2015 and 2014, the Company had no changes in its common stock and additional paid-in capital.
ForF - 11
Handeni Gold Inc.
(An Exploration Stage Company)
Notes to the Year EndedConsolidated Financial Statements as of May 31, 20132015
(Expressed in U.S. dollars)
During the year ended May 31, 2013, the Company received proceeds of $500,000 for share subscriptions pursuant to the Company’s private placements. In January 2013, the Company completed these private placements and issued 13,000,000 shares of the Company’s common stock at $0.05 per share.
Pursuant to the Board of Directors approved compensation package to its independent directors, on July 4, 2012, the Company granted each independent director, as fully paid and non-assessable, 200,000 shares of the Company’s common stock with a fair value of $0.04 per share for a total of 1,000,000 shares as stock-based compensation. Such shares were granted under the Company’s November 2010 Stock Incentive Plan.
F - 17
| 11. | Stock Options |
| |
|
| Weighted | |||||||||||||
| Average | |||||||||||||
| Weighted | Remaining | Aggregate | |||||||||||
| Number of | Average | Contractual | Intrinsic | ||||||||||
| Options | Exercise Price | Term | Value | ||||||||||
| # | $ | (years) | $ | ||||||||||
| Outstanding, May 31, 2012 | 28,300,000 | 0.24 | 8.53 | - | |||||||||
| Granted | 1,000,000 | 0.08 | 9.10 | - | |||||||||
| Forfeited | (1,000,000 | ) | 0.15 | 8.14 | - | ||||||||
| Outstanding, May 31, 2013 | 28,300,000 | 0.23 | 7.56 | - | |||||||||
| Granted | - | - | - | - | |||||||||
| Forfeited | - | - | - | - | |||||||||
| Outstanding, May 31, 2014 | 28,300,000 | 0.23 | 6.56 | - | |||||||||
| Exercisable, May 31, 2014 | 28,300,000 | 0.23 | 6.56 | - |
The Company adopted a Stock Option Plan, dated November 29, 2010 (the “November 2010 Stock Incentive Plan”), under which the Company is authorized to grant stock options to acquire up to a total of 40,000,000 shares of common shares. During the year ended May 31, 2015 and 2014, there were no stock options granted. At May 31, 2015 and 2014, the Company had 10,700,000 shares of common stock available to be issued under the November 2010 Stock Incentive Plan.
There were no stock options exercised during the year ended May 31, 2015 and 2014, and there were no intrinsic values of outstanding options at May 31, 2015 and 2014. As at May 31, 2015 and 2014, all stock options were fully vested. The following table summarizes the continuity of the Company’s stock options:
| Weighted | Weighted Average | Aggregate | |||||||||||
| Number of | Average | Remaining | Intrinsic | ||||||||||
| Options | Exercise Price | Contractual Term | Value | ||||||||||
| # | $ | (years) | $ | ||||||||||
| Outstanding, May 31, 2013 | 28,300,000 | 0.23 | 7.56 | - | |||||||||
| Outstanding, May 31, 2014 | 28,300,000 | 0.23 | 6.56 | - | |||||||||
| Outstanding and exercisable, May 31, 2015 | 28,300,000 | 0.23 | 5.56 | - |
The stock options outstanding are exercisable for cash or on a cashless exercise basis using a prorated formula whereby the number of shares issuable is equal to (a) the average closing price for the five days prior to exercise date (“ACP”) in excess of the exercise price, divided by (b) the exercise price multiplied by (c) the number of options exercised. During the yearsyear ended May 31, 20142015 and 2013,2014, no cashless stock options were exercised.
As at May 31, 2014 and 2013, all non-vested stock options were vested and there was $Nil of unrecognized compensation costs related to non-vested stock option agreements.
| 12. | Common Stock Purchase Warrants |
|
| Weighted | Weighted Average | |||||||||
| Average | Remaining Contractual | |||||||||
| Number of Warrants | Exercise Price | Life | ||||||||
| # | $ | (years) | ||||||||
| Balance, May 31, 2012 | 53,716,417 | 0.33 | 0.67 | |||||||
| Expired | (40,162,262 | ) | 0.26 | - | ||||||
| Balance, May 31, 2013 | 13,554,155 | 0.52 | 0.33 | |||||||
| Expired | (13,554,155 | ) | - | - | ||||||
| Balance, May 31, 2014 | - | - | - |
F - 18During the year ended May 31, 2015 and 2014, there were no stock purchase warrants granted. During the year ended May 31, 2014, 13,554,155 stock purchase warrants expired. The following table summarizes the continuity of the Company’s share purchase warrants:
| Weighted Average | Weighted Average Remaining | |||||||||
| Number of Warrants | Exercise Price | Contractual Life | ||||||||
| # | $ | (years) | ||||||||
| Balance, May 31, 2013 | 13,554,155 | 0.52 | 0.33 | |||||||
| Expired | (13,554,155 | ) | - | - | ||||||
| Balance, May 31, 2015 and 2014 | - | - | - |
| 13. | Commitments and |
| |
| |
| |
|
On February 8, 2012, RCR filed a lawsuit against the Company in the Supreme Court, State of New York, in which RCR alleged that the Company participated in a fraudulent transfer of certain mineral property interests in Tanzania that RCR had the right to purchase pursuant to a series of agreements with the Company.
On January 13, 2015, the Company reached a binding settlement of its litigation with RCR, and is currently waiting for RCR to finalize the formal settlement documentation. The settlement does not require any monetary payment by the Company to RCR. Under the terms of the settlement, the Company will turn over its interest in Ruby Creek Resources (Tanzania) Limited and has agreed to return the 4,000,000 shares of restricted RCR common stock to RCR (See Note 6, above). Both parties have agreed to dismiss their respective claims, with prejudice, and the litigation is now concluded.
| 14. | Fair Value Measurements |
ASC 820,Fair Value Measurements and Disclosures, requires an entity to maximize the use of observable inputs and minimize the use of unobservable inputs when measuring fair value. ASC 820 establishes a fair value hierarchy based on the level of independent, objective evidence surrounding the inputs used to measure fair value. A financial instrument’s categorization within the fair value hierarchy is based upon the lowest level of input that is significant to the fair value measurement. ASC 820 prioritizes the inputs into three levels that may be used to measure fair value:
Level 1 applies to assets or liabilities for which there are quoted prices in active markets for identical assets or liabilities.
Level 2 applies to assets or liabilities for which there are inputs other than quoted prices that are observable for the asset or liability such as quoted prices for similar assets or liabilities in active markets; quoted prices for identical assets or liabilities in markets with insufficient volume or infrequent transactions (less active markets); or model-derived valuations in which significant inputs are observable or can be derived principally from, or corroborated by, observable market data.
Level 3 applies to assets or liabilities for which there are unobservable inputs to the valuation methodology that are significant to the measurement of the fair value of the assets or liabilities.
Pursuant to ASC 820, the fair value of our cash, and cash equivalents, restricted cash equivalent and restricted marketable securities are determined based on “Level 1”Level 1 inputs, which consist of quoted prices in active markets for identical assets. Management believes that the recorded values of all of the Company’s other financial instruments approximate their current fair values because of their nature and respective maturity dates or durations.
F - 12
Handeni Gold Inc.
(An Exploration Stage Company)
Notes to the Consolidated Financial Statements as of May 31, 2015
(Expressed in U.S. dollars)
| 14. | Fair Value Measurements (continued) |
As at May 31, 2015, there were no liabilities measured at fair value on a recurring basis presented on the Company’s consolidated balance sheet. Assets measured at fair value on a recurring basis were presented on the Company’s consolidated balance sheet as of May 31, 2015, as follows:
| Fair Value Measurements Using | |||||||||||||
| Quoted Prices in | Significant | ||||||||||||
| Active Markets | Other | Significant | |||||||||||
| For Identical | Observable | Unobservable | Balance as of | ||||||||||
| Instruments | Inputs | Inputs | May 31, | ||||||||||
| (Level 1 | ) | (Level 2 | ) | (Level 3 | ) | 2015 | |||||||
| Assets: | |||||||||||||
| Cash | $ | 85,985 | $ | – | $ | – | $ | 85,985 | |||||
| Restricted cash equivalent | 13,858 | – | – | 13,858 | |||||||||
| Total assets measured at fair value | $ | 99,843 | $ | – | $ | – | $ | 99,843 | |||||
As at May 31, 2014, there were no liabilities measured at fair value on a recurring basis presented on the Company’s consolidated balance sheet. Assets measured at fair value on a recurring basis were presented on the Company’s consolidated balance sheet as atof May 31, 2014, as follows:
| Fair Value Measurements Using | |||||||||||||
| Quoted Prices in | Significant | ||||||||||||
| Active Markets | Other | Significant | |||||||||||
| For Identical | Observable | Unobservable | Balance as of | ||||||||||
| Instruments | Inputs | Inputs | May 31, | ||||||||||
| (Level 1 | ) | (Level 2 | ) | (Level 3 | ) | 2014 | |||||||
| Assets: | |||||||||||||
| Cash and cash equivalents | $ | 532,694 | $ | – | $ | – | $ | 532,694 | |||||
| Restricted cash equivalent | 26,522 | – | – | 26,522 | |||||||||
| Restricted marketable securities | 73,600 | – | – | 73,600 | |||||||||
| Total assets measured at fair value | $ | 632,816 | $ | – | $ | – | $ | 632,816 | |||||
F - 19
| |
|
| Fair Value Measurements Using | |||||||||||||
| Quoted Prices in | Significant | ||||||||||||
| Active Markets | Other | Significant | |||||||||||
| For Identical | Observable | Unobservable | Balance as of | ||||||||||
| Instruments | Inputs | Inputs | May 31, | ||||||||||
| (Level 1 | ) | (Level 2 | ) | (Level 3 | ) | 2013 | |||||||
| Assets: | |||||||||||||
| Cash and cash equivalents | $ | 206,402 | $ | – | $ | – | $ | 206,402 | |||||
| Restricted cash equivalent | 27,805 | – | – | 27,805 | |||||||||
| Restricted marketable securities | 140,000 | – | – | 140,000 | |||||||||
| Total assets measured at fair value | $ | 374,207 | $ | – | $ | – | $ | 374,207 | |||||
| Fair Value Measurements Using | |||||||||||||
| Quoted Prices in | Significant | ||||||||||||
| Active Markets | Other | Significant | |||||||||||
| For Identical | Observable | Unobservable | Balance as of | ||||||||||
| Instruments | Inputs | Inputs | May 31, | ||||||||||
| (Level 1 | ) | (Level 2 | ) | (Level 3 | ) | 2014 | |||||||
| Assets: | |||||||||||||
| Cash | $ | 532,694 | $ | – | $ | – | $ | 532,694 | |||||
| Restricted cash equivalent | 26,522 | – | – | 26,522 | |||||||||
| Restricted marketable securities | 73,600 | – | – | 73,600 | |||||||||
| Total assets measured at fair value | $ | 632,816 | $ | – | $ | – | $ | 632,816 | |||||
| 15. | Segment Disclosures |
The fair values for stock options granted were estimated atCompany operates in one reportable segment, being the dateacquisition and exploration of grant usingmineral properties. Segmented information has been compiled based on the Black-Scholes option pricing model undergeographic regions that the following weighted average assumptions:Company and its subsidiary registered and performed exploration and administration activities. Assets by geographical segment are as follows:
| Canada | Tanzania, Africa | Total | ||||||||
| Current assets | $ | 61,447 | $ | 63,595 | $ | 125,042 | ||||
| Restricted cash equivalent | 13,858 | - | 13,858 | |||||||
| Mineral licenses | - | 1,650,000 | 1,650,000 | |||||||
| Equipment, net | 332 | 1,142 | 1,474 | |||||||
| Total assets, at May 31, 2015 | $ | 75,637 | $ | 1,714,737 | $ | 1,790,374 |
| Canada | Tanzania, Africa | Total | ||||||||
| Current assets | $ | 147,957 | $ | 434,139 | $ | 582,096 | ||||
| Restricted cash equivalent | 26,522 | - | 26,522 | |||||||
| Restricted marketable securities | 73,600 | - | 73,600 | |||||||
| Mineral licenses | - | 1,650,000 | 1,650,000 | |||||||
| Property and equipment, net | 4,061 | 51,385 | 55,446 | |||||||
| Total assets, at May 31, 2014 | $ | 252,140 | $ | 2,135,524 | $ | 2,387,664 |
| For the Year Ended May 31, 2015 | ||||||||||
| Net Loss | $ | 692,604 | $ | 473,358 | $ | 1,165,962 |
| For the Year Ended May 31, 2014 | ||||||||||
| Net Loss | $ | 1,421,669 | $ | 871,926 | $ | 2,293,595 |
F - 13
Handeni Gold Inc.
(An Exploration Stage Company)
Notes to the Consolidated Financial Statements as of May 31, 2015
(Expressed in U.S. dollars)
| 16. | |||
Income Taxes | |||
The weighted average fair valueCompany accounts for income taxes under ASC 740,Income Taxes. Deferred income tax assets and liabilities are determined based upon differences between financial reporting and tax bases of stock options granted duringassets and liabilities and are measured using the year endedenacted tax rates and laws that will be in effect when the differences are expected to reverse. The measurement of deferred income tax assets is reduced, if necessary, by a valuation allowance for any tax benefits, which are, on a more likely than not basis, not expected to be realized. The effect on deferred income tax assets and liabilities of a change in tax rates is recognized in the period that such tax rate changes are enacted.
The Company is subject to U.S. federal and state income tax and has concluded substantially all U.S. federal and state income tax matters for tax years through May 31, 2014 was $Nil (May 31,2012. The tax filings for years from 2013 - $0.03 per share). Duringto 2015 are subject to audit by U.S. jurisdictions. The Company’s Canadian office has filed its Canadian corporate income tax returns under the “Voluntary Disclosure Program”, and the tax filings for years from 2013 to 2015 are subject to audit by Canadian jurisdictions. The Company’s Tanzania subsidiaries are subject to Tanzania income tax, the tax filings for the years from 2013 to 2015 are subjected to audit by Tanzania jurisdictions.
Income tax expense differs from the amount that would result from applying the U.S. federal income tax rates to earnings before income taxes. The Company has net operating losses carried forward of approximately $29 million available to offset taxable income in future years which begin expiring in fiscal 2026. Pursuant to ASC 740, the potential benefits of the net operating losses carried forward has not been recognized in the consolidated financial statements since the Company cannot be assured that it is more likely than not that such benefit will be utilized in future years.
The income tax benefit differs from the amount computed by applying the federal income tax rate of 35% to net loss before income taxes for the years ended May 31, 2015 and 2014 and 2013,as a result of the Company expensed the following stock-based compensation as consulting fees or general and administrative fees.following:
F - 20
| |
|
| Accumulated from | ||||||||||
| January 5, 2004 | ||||||||||
| For the Years Ended, | (Date of Inception) to | |||||||||
| May 31, 2014 | May 31, 2013 | May 31, 2014 | ||||||||
| Changes in non-cash financing and investing activities: | ||||||||||
| Common stock issued to settle related party payable | $ | - | $ | - | $ | 619,306 | ||||
| Common stock issued for an former executive's compensation | - | - | 3,035,505 | |||||||
| Common stock issued for independent directors' compensation | - | 40,000 | 40,000 | |||||||
| Common stock issued for mineral licenses acquired | - | - | 76,446,750 | |||||||
| Common stock gifted to the Company to settle liabilities | - | - | 100,000 | |||||||
| Investment securities received and sold | - | - | 79,603 | |||||||
| Other cash flow information: | ||||||||||
| Interest paid | $ | 4,753 | $ | - | $ | 4,753 | ||||
| Income taxes paid | - | - | - | |||||||
| |
| |
|
| Canada | Tanzania, Africa | Total | ||||||||
| Current assets | $ | 147,957 | $ | 434,139 | $ | 582,096 | ||||
| Restricted cash equivalent | 26,522 | - | 26,522 | |||||||
| Restricted marketable securities | 73,600 | - | 73,600 | |||||||
| Mineral licenses | - | 1,650,000 | 1,650,000 | |||||||
| Equipment, net | 4,061 | 51,385 | 55,446 | |||||||
| Total assets, at May 31, 2014 | $ | 252,140 | $ | 2,135,524 | $ | 2,387,664 |
| Canada | Tanzania, Africa | Total | ||||||||
| Current assets | $ | 191,292 | $ | 728,841 | $ | 920,133 | ||||
| Restricted cash equivalent | 27,805 | - | 27,805 | |||||||
| Restricted marketable securities | 140,000 | - | 140,000 | |||||||
| Mineral licenses | - | 1,650,000 | 1,650,000 | |||||||
| Equipment, net | 7,722 | 237,751 | 245,473 | |||||||
| Total assets, at May 31, 2013 | $ | 366,819 | $ | 2,616,592 | $ | 2,983,411 |
Net loss by geographical segment is as follows:
| For the Year Ended May 31, 2014 | ||||||||||
| Net Loss | $ | 1,421,669 | $ | 871,926 | $ | 2,293,595 |
| For the Year Ended May 31, 2013 | ||||||||||
| Net Loss | $ | 2,767,929 | $ | 1,469,602 | $ | 4,237,531 |
F - 21
| |
| |
| |
| |
|
| May 31, | May 31, | ||||||
| 2014 | 2013 | ||||||
| $ | $ | ||||||
| Loss before taxes | (2,293,595 | ) | (4,237,531 | ) | |||
| Statutory rate | 35% | 35% | |||||
| Computed expected tax recovery | (802,758 | ) | (1,483,136 | ) | |||
| Permanent differences | 305,184 | 953,241 | |||||
| Foreign tax rate differences | 43,597 | 59,789 | |||||
| Valuation allowance change | 453,977 | 470,106 | |||||
| Provision for income taxes | – | – |
| May 31, | May 31, | ||||||
| 2015 | 2014 | ||||||
| $ | $ | ||||||
| Loss before taxes | (1,165,962 | ) | (2,293,595 | ) | |||
| Statutory rate | 35% | 35% | |||||
| Computed expected tax recovery | (408,087 | ) | (802,758 | ) | |||
| Permanent differences | 397,865 | 305,184 | |||||
| Foreign tax rate differences | (27,168 | ) | 43,597 | ||||
| Valuation allowance change | 37,390 | 453,977 | |||||
| Provision for income taxes | – | – |
The significant components of deferred income tax assets and liabilities at May 31, 20142015 and 2013,2014, after applying enacted federal income tax rates, are as follows:
| May 31, | May 31, | ||||||
| 2014 | 2013 | ||||||
| $ | $ | ||||||
| Net operating losses carried forward | 9,979,715 | 8, 857,785 | |||||
| Capital losses available | 19,975 | 19,975 | |||||
| Mineral properties tax basis in excess of book value | 2,935,354 | 3,603,307 | |||||
| Valuation allowance | (12,935,044 | ) | (12,481,067 | ) | |||
| Net deferred income tax asset | – | – |
| May 31, | May 31, | ||||||
| 2015 | 2014 | ||||||
| $ | $ | ||||||
| Net operating losses carried forward | 10,734,304 | 9,979,715 | |||||
| Capital losses available | 19,975 | 19,975 | |||||
| Mineral properties tax basis in excess of book value | 2,218,155 | 2,935,354 | |||||
| Valuation allowance | (12,972,434 | ) | (12,935,044 | ) | |||
| Net deferred income tax assets | – | – |
The Company has recognized a valuation allowance for the deferred income tax asset since the Company cannot be assured that it is more likely than not that such benefit will be utilized in future years. When circumstances change and which cause a change in management’s judgment about the realizability of deferred income tax assets, the impact of the change on the valuation allowance is generally reflected in current income.
F - 22
|
| ||
|
|
F - 2314
| ITEM 9. | CHANGESIN AND DISAGREEMENTSWITHACCOUNTANTSONACCOUNTINGANDFINANCIAL DISCLOSURE |
We have had no disagreements with our principal independent accountants.
| ITEM 9A. | CONTROLS AND PROCEDURES |
Disclosure Controls and Procedures
An evaluation was performed under the supervision and with the participation of the Company’s management, including the Company’s Chief Executive Officer (“CEO”), Reyno Scheepers, and the Company’s Chief Financial Officer (“CFO”), Melinda Hsu, of the effectiveness of the design and operation of the Company’s disclosure controls and procedures pursuant to Rules 13a-15b) and 15d-15b) under the Exchange Act as of the end of the period covered by this annual report. Based upon the evaluation, the Company’s CEO and CFO have concluded that our disclosure controls and procedures (as defined in Rules 13a-15(e) and 15d-15(e) under the Exchange Act) were not effective as of the end of the period covered by this annual report, due to the deficiencies in our internal control over financial reporting as described below under Management’s Annual Report on Internal Control over Financial Reporting.
Management’s Annual Report on Internal Control over Financial Reporting
The Company’s management is responsible for establishing and maintaining adequate internal control over financial reporting, as defined in Rules 13a-15(f) under the Exchange Act.
The management of the Company assessed the effectiveness of the Company’s internal control over financial reporting based on the criteria for effective internal control over financial reporting established in Internal Control—Integrated Framework issued by the Committee of Sponsoring Organizations of the Treadway Commission (“COSO”) and SEC guidance on conducting such assessments. Based on this assessment, management concluded that, as of the end of our fiscal year ended May 31, 2014,2015, our internal control over financial reporting was not effective due to material weaknesses, as more fully described below.
Management identified the following material weaknesses in internal control over financial reporting:
| 1. | Certain entity level controls establishing a “tone at the top” were considered material weaknesses. | |
| 2. | The Company’s board of directors and executive officers are located in multiple countries, which have caused limited segregation of duties and are not consistent with good internal control procedures. | |
| 3. | The Company has a limited management team with limited employees to establish sufficient segregation of duties, which was considered a material weakness. |
Management believes that the material weaknesses set forth above did not have a material impact on the Company’s financial results and information required to be disclosed by the Company in its reports that it files or submits to the SEC under the Exchange Act within the time period specified in applicable rules and forms. However, management believes that these material weaknesses resulting in ineffective oversight in the establishment and monitoring of required internal control over financial reporting can impact the Company’s financial statements for future years. As a result material errors could occur.
The Company and its management are endeavoring to correct the above noted weaknesses in internal control over financial reporting. We have established an audit committee, corporate governance and compensation committee with sufficient independent members, and we have identified an “expert” for the audit committee to advise other members as to correct accounting and reporting procedures. In addition, we are establishing written policies outlining the duties of each of the directors and officers of the Company to facilitate better internal control procedures.
Management will continue to monitor and evaluate the effectiveness of the Company’s internal controls and procedures and its internal controls over financial reporting on an ongoing basis and is committed to taking further action and implementing additional enhancements or improvements, as necessary and as funds allow.
Changes in Internal Control Over Financial Reporting
There were no changes to our internal control over financial reporting that occurred during the last quarter of our fiscal quarter ended May 31, 2014,2015, that have materially affected, or are reasonably likely to materially affect, our internal control over financial reporting.
| ITEM 9B. | OTHER INFORMATION |
None.
3224
| ITEM 10. | DIRECTORS, EXECUTIVE OFFICERS AND CORPORATE GOVERNANCE |
Our executive officers and directors and their respective ages as of the date of this annual report are as follows:
| Name | Age | Position Held | Board Committee Memberships |
| Reginald Mengi | Chairman and Director | N/A | |
| Reyno Scheepers | President, Chief Executive Officer and a director | N/A | |
| William Lamarque | Vice Chairman and Director Director | Audit Committee (Chair) | |
| Emmanuel Ole Naiko | Corporate Governance and Compensation Committee (Chair); Audit Committee | ||
| Douglas Boateng | Director | Corporate Governance and Compensation Committee | |
| Gizman Abbas | Director | Audit Committee | |
| Melinda Hsu | Financial Officer, Secretary and Treasurer | N/A | |
The following describes the business experience of each of our directors and executive officers, including other directorships held in reporting companies:
Reginald Mengi has served as our Chairman of our Board of Directors since September 21, 2010. Mr. Reginald Mengi is the Chairman and owner of IPP Gold Limited. He also chairs IPP Ltd., one of the largest private sector holding companies in Tanzania. Mr. Mengi commenced IPP Ltd.’s business in the mid 1980’s manufacturing ball point pens. Today the IPP group of companies is engaged in various areas including bottling of Coca Cola products, drinking water, manufacturing and bottling of drinks and spirits, mining of minerals and gemstones, gemstone cutting, lapidary and media.
Until 1985, Mr. Mengi also worked as a Chartered Accountant for Coopers & Lybrand Tanzania where he served in the role as Chairman and Managing Partner and led auditing and consultancy teams and participated in the establishment of companies and institutions.
Reyno Scheepers has served as a director since September 21, 2010 and as our President and Chief Executive Officer since November 21, 2011. Dr. Reyno Scheepers’ involvement with the mining industry stretches for a period of 29 years. He started off as a researcher at the Fuel Research Institute (CSIR) of South Africa where he gained experience in the composition and characteristics of various South African coal fields. This was followed by a two year period as a geologist at a South African gold mine where he gained experience in underground geology, underground and surface exploration and gold exploration project planning. He then joined the University of Stellenbosch where he became a professor in petrology/mineralogy in 1999.
Since 1995 Dr. Scheepers directed his efforts towards the investigation of gemstone deposits covering alluvial and kimberlitic diamond deposits in South Africa, the Democratic Republic of the Congo and in Tanzania. One of his major achievements in Tanzania was the investigation of the geology and technical aspects of the Merelani tanzanite deposit which eventually led to the successful listing of the first colored gemstone company on the Johannesburg Stock Exchange.
Dr. Scheepers is also closely involved in the application and development of geochemical analytical techniques and was in charge of the running of an XRF laboratory, an ICP=AES laboratory and a micro thermometric laboratory. He participated in the development of international geochemical reference standards and completed numerous challenging analytical problems for the industry over the years.
Dr. Scheepers’ interest in providing small scale miners with the necessary skills to conduct safe and effective mining led to the establishment of the Gemstone Research Centre at Stellenbosch University.Dr. Scheepers received his B.Sc. (Hons), Cum Laude in 1979, his M.Sc, Cum Laude in 1982 and his PhD in 1990 from the University of Stellenbosch.
33
William Lamarque has served as a director since March 15, 2012, our Vice Chairman of the Board of Directors and the Chairman of the Audit Committee since April 10, 2012. Mr. Lamarque currently serves as the Chief Executive Officer of Ecometals Ltd. He is also a Partner and co-founder of Balor Capital Management, LLC. Mr. Lamarque is, prior to his Handeni Gold appointment, on the board of three privately held and one publicly traded mining company, and President of Hanson Capital Asia Ltd.
On graduating from Cambridge University where he won an Open Exhibition in Classics, Mr Lamarque joined Jardine Matheson and Co, a Hong Kong based group with interests in trading, shipping, civil aviation, engineering, construction, property and financial services, focused on East Asia. He had postings in London, Hong Kong and Shanghai and studied Chinese at the Mandarin Daily News Institute in Taipei, before becoming the General Manager responsible for the Group's overall activities in the Peoples’ Republic of China (“PRC”).
25
Mr Lamarque joined NM Rothschild and Sons, the London based investment bank, in 1986, as PRC country manager, on the boards of the bank's affiliates in Hong Kong and Singapore. Returning to London in 1989, Mr Lamarque became a main board director of the bank and held various positions within the Treasury Division, with an emphasis on precious and LME metals trading and mine finance, and the bank's activities in emerging markets, in particular with the official sector. He moved to New York in 2000, to head the Group's Treasury activities in the Americas. Mr Lamarque left Rothschilds in 2002 to join Hanson Capital, a London based boutique investment bank and was a founding partner of Balor Capital, a private trading and derivative advisory business based on Wall Street in 2006. Mr Lamarque sits on various mining company boards including those of Ecometals (for which he is also CEO) and Ivanplats, a large privately held exploration company with interests in the DRC and South Africa. He is also a non-executive director of a UK-based warehousing and trucking company, Hanson Logistics. At various times Mr Lamarque has served on the World Gold Council's Central Bank Committee and the China Committee of British Invisibles and has chaired the Public Affairs Committee of the London Bullion Market Association. He was also for several years a Member of the Comex.
Emmanuel Ole Naikohas served as a director since April 16, 2012. Mr. Naiko currently serves as the managing director of Stesta Consulting, a firm focusing on among other things, mining advisory services. Mr. Naiko is a qualified mining and metallurgical engineer and a professional member of the American Society of Mining Engineers and Metallurgists. In 2011, Mr. Naiko retired after five years as Chief Executive Officer of the Tanzanian Investment Centre. Mr. Naiko’s extensive experience during the course of his career includes serving in the following positions: Vice President, World Association of Investment Promotion Agencies (WAIPA); board member, Tanzania State Mining Corporation; board member, Tanzania Petroleum Development Corporation; board member, Bank of Africa; board member, Tanzania Private Sector Foundation; board member, Maganga-Mtatitu Iron Project; and board member, University of Dar-es-Salaam Investment Committee.
Mr. Naiko graduated from the Haileybury School of Mines (Canada) and Colorado School of Mines (USA). He also holds investment educational certificates from the Centre for Applied Studies on International Negotiations (Switzerland), Nanning Technological University (Singapore) and the Hans Seidel Foundation (Germany).
Douglas Boateng has served as a director since September 21, 2010 and as our President and Chief Executive Officer from August 18, 2011 to November 20, 2011. Dr. Douglas Boateng has over 18 years of extensive multi-sector international experience. His career includes positions as a CEO, director and senior level consulting in Technology (ICT), Chemicals/Pharma-chemical, Pharmaceutical and Biotechnology, Aviation, Engineering, Business management, Mergers and Acquisitions, Strategic alliance and partnerships, Logistics and Supply Chain Management, Media, Consulting, Corporate and Strategic Business Development, Corporate Governance and Advisory services to selected Government ministries. Dr. Boateng has also successfully worked and consulted for some of the world’s leading corporation’s in Europe, the United States and Africa.
Prior to joining the Company, Dr. Boateng founded PanAvest International, an organization with a vision to assist companies profitably extend their market reach through the application of innovative Business Development Logistics and Supply Chain Management solutions. He has acted as an independent advisor and consultant to one of Scandinavia’s largest generic pharmaceutical companies on logistics, supply chain and business development and strategies and one of Africa’s leading healthcare distributors. Dr. Boateng is also a post graduate visiting professor on logistics and supply chain management and a Masters and Doctoral project supervisor at one of Africa’s largest and most respected business schools. He current sits on the editorial board of Smart Procurement, the largest supply chain related portal in Africa and the Middle East.
Dr. Boateng holds a Graduate Diploma in Company Direction from the Institute of Directors, a Doctorate in Engineering Business Management from the University of Warwick-UK, an MSc in Industrial Logistics from the University of Central England-UK and a post graduate diploma in transport and logistics from Cranfield Institute of Technology, UK.
Gizman Abbashas served as a director since February 1, 2012. Mr. Gizman Abbas is Managing Partner, DI Development LLC, a development company focusing on the New York City real estate market, which he founded in 2011 to take advantage of the opportunities resulting from the 2008 financial downturn. Before DI Development, Mr. Abbas was a Partner at Apollo Commodities Partners, L.P., where he helped build Apollo Global Management’s newly established commodities business. He joined Apollo from Goldman Sachs where he was a Vice President in the Commodities Asset Investment business. While at Goldman, he worked on transactions involving resources, power, biofuels, emissions and agriculture. Prior to joining Goldman, he was a banker at Morgan Stanley where he spent time in the power and energy banking group.
34
Mr. Abbas began his career at Southern Company working at a coal-fired power plant, followed by a period as an oil and gas engineer at Exxon Mobil. Mr. Abbas graduated with a B.S. in Electrical Engineering from Auburn University and received his MBA from the Kellogg School of Management at Northwestern University.
Melinda Hsu has served as our Secretary, Treasurer and Chief Financial Officer since March 1, 2012 and as our controller since November 2011. Ms. Hsu has been the president and principal of AMICA Resource Inc. (“AMICA”), a private company, since September 2007. Ms. Hsu had worked for various public and private companies, including Dejour Energy Inc. as a senior consultant from February 2011to April 2013 and as a controller from September 2007 to April 2008, Silverado Gold Mines Ltd. as a controller from April 2008 to October 2010 and Manex Resource Group from December 2005 to September 2007.
26
Ms. Hsu has been directly involved in mining and oil and gas industries for more than ten years, with strengths in Canadian and U.S. public financial reporting and regulatory compliance, Canadian and U.S. tax, internal control policies, budgeting and strategic planning. In addition, Ms. Hsu has over 25 years of diversified business experience in areas of accounting, finance, budget, corporate development, marketing and administration experience in Canada and China. She received her Certified General Accountant designation from the CGA Association of British Columbia, Canada, in 2004 and graduated from the People’s University of China in 1988 with a Master’s degree in Business Administration.
Term of Office
Our directors are appointed for a one-year term to hold office until the next annual general meeting of our stockholders or until removed from office in accordance with our bylaws. Our officers are appointed by our Board of Directors and hold office until removed by the Board.
Board of Directors Meetings
During the fiscal year ended May 31, 2014,2015, our board of directors had fourtwo Board of Directors meetings, four Audit Committee meetings, and none of Corporate Governance and Compensation Committee meetings through teleconference calls.meetings.
Significant Employees
Other than the officers and directors described above, as at May 31, 2014,2015, we had approximate sixfour full-time equivalent employees and consultants located in Tanzania. We also retain independent geologists and consultants on a contract basis to conduct the work programs on our mineral properties in order to carry out our plan of operations.
Family Relationships
There are no family relationships among our directors or officers.
Involvement in Certain Legal Proceedings
To the best of our knowledge and belief, none of our directors or executive officers has been involved in any of the following events during the past ten years that is material to an evaluation of the ability of such person to serve as an executive officer or director of our Company:
| 1. | a petition under the Federal bankruptcy laws or any state insolvency law was filed by or against, or a receiver, fiscal agent or similar officer was appointed by a court for the business or property of such person, or any partnership in which he was a general partner at or within two years before the time of such filing, or any corporation or business association of which he was an executive officer at or within two years before the time of such filing; | |
| 2. | such person was convicted in a criminal proceeding or is a named subject of a pending criminal proceeding (excluding traffic violations and other minor offenses); | |
| 3. | such person was the subject of any order, judgment, or decree, not subsequently reversed, suspended or vacated, of any court of competent jurisdiction, permanently or temporarily enjoining him from, or otherwise limiting, the following activities: |
35
| (i) | acting as a futures commission merchant, introducing broker, commodity trading advisor, commodity pool operator, floor broker, leverage transaction merchant, any other person regulated by the Commodity Futures Trading Commission, or an associated person of any of the foregoing, or as an investment adviser, underwriter, broker or dealer in securities, or as an affiliated person, director or employee of any investment company, bank, savings and loan association or insurance company, or engaging in or continuing any conduct or practice in connection with such activity; | |
| (ii) | engaging in any type of business practice; or | |
| (iii) | engaging in any activity in connection with the purchase or sale of any security or commodity or in connection with any violation of Federal or State securities laws or Federal commodities laws; |
| 4. | such person was the subject of any order, judgment or decree, not subsequently reversed, suspended or vacated, of any Federal or State authority barring, suspending or otherwise limiting for more than 60 days the right of such person to engage in any activity described in paragraph 3(i) above, or to be associated with persons engaged in any such activity; | |
| 5. | such person was found by a court of competent jurisdiction in a civil action or by the Commission to have violated any Federal or State securities law, and the judgment in such civil action or finding by the Commission has not been subsequently reversed, suspended, or vacated; | |
| 6. | such person was found by a court of competent jurisdiction in a civil action or by the Commodity Futures Trading Commission to have violated any Federal commodities law, and the judgment in such civil action or finding by the Commodity Futures Trading Commission has not been subsequently reversed, suspended or vacated; | |
| 7. | such person was the subject of, or a party to, any Federal or State judicial or administrative order, judgment, decree, or finding, not subsequently reversed, suspended or vacated, relating to an alleged violation of: |
| (i) | any Federal or State securities or commodities law or regulation; | |
27
| (ii) | any law or regulation respecting financial institutions or insurance companies including, but not limited to, a temporary or permanent injunction, order of disgorgement or restitution, civil money penalty or temporary or permanent cease-and-desist order, or removal or prohibition order; or | |
| (iii) | any law or regulation prohibiting mail or wire fraud or fraud in connection with any business entity; or |
| 8. | such person was the subject of, or a party to, any sanction or order, not subsequently reversed, suspended or vacated, of any self-regulatory organization (as defined in Section 3(a)(26) of the Exchange Act), any registered entity (as defined in Section 1(a)(29) of the United StatesCommodity Exchange |
We are not aware of any material legal proceedings in which any of the following persons is a party adverse to our Company or has a material interest adverse to our Company: (a) any current director, officer, or affiliate of the Company, or any owner of record or beneficial owner of more than five percent of any class of voting securities of the Company; (b) any person proposed for appointment or election as a director or officer of our Company; or (c) any associate of any such person.
Compliance with Section 16(a) of the Exchange Act
Section 16(a) of the Exchange Act requires our directors and officers, and the persons who beneficially own more than ten percent of our common stock, to file reports of ownership and changes in ownership with the SEC. Copies of all filed reports are required to be furnished to us pursuant to Rule 16a-3 promulgated under the Exchange Act. Based solely on the reports received by us and on the representations of the reporting persons with respect to our most recent fiscal year, we believe that these persons have complied with all applicable filing requirements during the fiscal year ended May 31, 2014.2015.
Code of Ethics
We have adopted a code of ethics applicable to our directors, principal executive officer, principal financial officer, principal accounting officer or controller, or persons performing similar functions. A copy of our code of ethics is incorporated by reference as an exhibit to this Report and can be reviewed on our corporate website located atwww.handenigold.com. If we make any amendments to our Code of Ethics other than technical, administrative, or other non-substantive amendments, or grant any waivers, including implicit waivers, from a provision of our Code of Ethics, we will disclose the nature of the amendment or waiver, its effective date and to whom it applies on our website or in a report on Form 8-K filed with the SEC.
36
Committees
Audit Committee
The Company’s Board of Directors has a separately-designated standing Audit Committee established for the purpose of overseeing the accounting and financial reporting processes of the Company and audits of the Company’s annual financial statements in accordance with Section 3(a)(58)(A) of the Exchange Act. As of the date of this annual report on Form 10-K, the Company’s Audit Committee is comprised of William Lamarque (who acts as Chairman), Gizman Abbas and Emmanuel Ole Naiko.
In the opinion of the Company’s Board of Directors, all the members of the Audit Committee are independent (as defined under Rule 5605(c)(2) of the NASDAQ listing rules and as determined under Rule 10A-3 of the Exchange Act). Mr. William Lamarque services as the Chairman of the Audit Committee and is qualified as an audit committee financial expert pursuant to the definition adopted by SEC and Sections 407 of the Sarbanes-Oxley Act. All three members of the Audit Committee are financially literate, meaning they are able to read and understand the Company’s financial statements and to understand the breadth and level of complexity of the issues that can reasonably be expected to be raised by the Company’s financial statements.
The members of the Audit Committee do not have fixed terms and are appointed and replaced from time to time by resolution of the Board of Directors.
The Audit Committee is to assist the Board of Directors in fulfilling its oversight responsibilities and its primary duties and responsibilities are to:
| • | review management’s identification of principal financial risks and monitor the process to manage such risks; | |
| • | oversee and monitor the Company’s compliance with legal and regulatory requirements; | |
| • | receive and review the reports of the Audit Committee of any subsidiary with public securities; | |
| • | oversee and monitor the integrity of the Company’s accounting and financial reporting processes, financial statements and system of internal controls regarding accounting and financial reporting and accounting compliance; | |
| • | oversee the audit of the Company’s financial statements; | |
| • | oversee and monitor the qualifications, independence and performance of the Company’s external auditors and internal auditing department; | |
| • | provide an avenue of communication among the external auditors, management, the internal auditing department and the Board of Directors; and | |
| • | report to the Board of Directors regularly. |
The Audit Committee has the authority to conduct any review or investigation appropriate to fulfilling its responsibilities. It shall have unrestricted access to personnel and information, and any resources necessary to carry out its responsibility. In this regard, the Audit Committee may direct internal audit personnel to particular areas of examination.
28
Corporate Governance and Compensation Committee
The Company has combined the Corporate Governance Committee and the Compensation Committee into a Corporate Governance and Compensation Committee since January 22, 2013. As of the date of this annual report on Form 10-K, the Company’s Corporate Governance and Compensation Committee is comprised of twothree directors, Emmanuel Ole Naiko (who acts as Chairman), Reyno Scheepers and Douglas Boateng. Mr. Reyno Scheepers and Mr. Douglas Boateng isare not independent as defined under Rule 5605(c)(2) of the NASDAQ listing rules and as determined under Rule 10A-3 of the Exchange Act.
The Corporate Governance and Compensation Committee is to (i) identify and recommend to the Board individuals qualified to be nominated for election to the Board, (ii) recommend to the Board the members and Chair for each Board committee and (iii) periodically review and assess the Corporation’s corporate governance principles and make recommendations for changes thereto to the Board, (iv) assist the Board in fulfilling its oversight responsibilities relating to officer and director compensation, succession planning for senior managements, development and retention of senior management, and such other duties as directed by the Board.
37
Steering Committee
Since January 2013, the Steering Committee has been specifically established for the purpose of overseeing, directing and monitoring administrative and financial affairs, corporate priorities and future direction, key business issues and major operation activities through weekly meetings.conference meetings when needed.
Currently the Company’s Steering Committee consists of the following members:
William Lamarque (who acts as Chairman), Vice Chairman and
Director Reyno Scheepers, President, Chief Executive Officer and Director
Gizman Abbas, Director
Melinda Hsu, Chief Financial Officer
| • | William Lamarque (who acts as Chairman), Vice Chairman and Director | |
| • | Reyno Scheepers, President, Chief Executive Officer and Director | |
| • | Gizman Abbas, Director | |
| • | Melinda Hsu, Chief Financial Officer |
Technical Advisory Committee
The Technical Advisory Committee has been specifically constituted to enable the Company to effectively operate in the geological environments associated with mineralized systems in Archaean and Proterozoic terranes. Additional expertise comprising other disciplines may be co-opted to the committee from time to time, as the situation may require.
Currently the Company’s Technical Committee consists of the following members:
Dr. P.G. Gresse (Structural- and Exploration Geology) is a renowned structural geologist with a lifetime experience in Africa. He has extensive experience in field geological mapping, structural geology and basin analysis. Dr. Gresse has been involved in various international research and mapping programs specialising in Late Proterozoic geology. Dr. Gresse has published widely in local and international journals (33) and has attended and presented papers at numerous international conferences and symposia (25).
Mr. C. Lötter (Geophysics and Exploration Geology) has 30 years’ experience in mining and exploration geophysics and has run his own consulting and contracting business for 20 years. He has extensive experience in the Greenstone terrains of southern, eastern and western Africa as well as the Zambian and Botswana Copper belts. Mr. Lotter is involved in survey planning and design and QC/QA and interpretation, including 2D/3D forward and inversion modelling, on a daily basis.
Mr. E. D. Ole Naiko (Mining Engineering and Mineral Economics) conducted his post graduate studies in Mineral Economics and Metallurgical Engineering at the Colorado School of Mines. He has been an executive director of the Tanzania Investment Centre and the manager of various state mining companies, including gold mining companies, as well as an executive director of the TIC (Tanzania Investment Centre) in Tanzania. Mr. Naiko plays a major role in promoting the minerals industry of the country and attracting investment to the sector.
Mr. B. McDonald (Exploration- and Economic Geology) is an exploration geologist with vast experience in Africa, South America, Mexico, and Cuba. He has been exploration manager on numerous successful projects for various prestigious companies including Billiton S.A.(aka BHP Billiton) and GENCOR S.A. as well as managing exploration projects for smaller companies including Trans Hex, the O’Okiep Copper Company, and along with numerous others. The commodities within his experience portfolio span from base metals, gold, precious metals, asbestos, uranium, diamonds, and coloured gemstones. His gold experience covers the spectrum from sedimentary to high grade metamorphic related gold. Complementing his geological achievements are his people skills, often successfully managing a work force of more than 100 people, including several teams of professionals concurrently under difficult operational conditions.
Dr. R. Scheepers (Petrology, Geochemistry, Exploration Geology) has beeninvolved with geology and the mining industry over a period of 28 years. He is the Company’s CEO and a director. Dr. Scheepers is a registered Professional Natural Scientist in Geological Science and a member of:
| • | Geological Society of South Africa (since 1984); | |
| • | SACNASP Registered (since 1984); | |
| • | The Mineralogical Society of South Africa (1996 to 2001); | |
| • | Geological Society Western Province Branch (1985 to 2002); |
29
| • | Society of Geology Applied to Mineral Deposits (1989 to 1997); | |
| • | Council member: Geological Society of South Africa (1996 to 1999); | |
| • | Council member: The Mineralogical Society of South Africa (2002); | |
| • | Committee member: Geological Society Western Province Branch (1985 to 1989); and | |
| • | Committee member: The S.A. Code for Stratigraphy Committee, since 1993. |
38
| ITEM 11. | EXECUTIVE COMPENSATION |
Compensation Discussion and Analysis
The table below summarizes all compensation awarded to, earned by or paid to our executive officers by any person for all services rendered in all capacities to us during our fiscal years ended May 31, 20142015 and 2013.2014.
Summary Compensation Table
Name and Principal Position | Year | Salary ($) | Bonus ($) | Stock Awards ($) | Option Awards ($) | Non- Equity Incentive Plan Comp- ensation ($) | Non- qualified Deferred Comp- ensation Earnings ($) | All Other Compensation ($) | Total ($) | Year | Salary ($) | Bonus ($) | Stock Awards ($) | Option Awards ($) | Non- Equity Incentive Plan Comp- ensation ($) | Non- qualified Deferred Comp- ensation Earnings ($) | All Other Compensation ($) | Total ($) |
| Reyno Scheepers(1) President & Chief Executive Officer | 2014 | Nil | 169,200(1a) | 169,200 | 2015 | Nil | 180,000(1a) | 169,200 | ||||||||||
| 2013 | Nil | 144,000(1b) | 144,000 | 2014 | Nil | 169,200(1b) | 169,200 | |||||||||||
| Melinda Hsu(2) Chief Financial Officer, Secretary and Treasurer | 2014 | 50,662 | Nil | 84,438(2a) | 135,100 | 2015 | 47,553 | Nil | 77,644(2a) | 125,197 | ||||||||
| 2013 | 13,056 | Nil | 128,420(2b) | 141,476 | 2014 | 50,662 | Nil | 84,438(2b) | 135,100 | |||||||||
| Douglas Boateng(3) Former President & Chief Executive Officer | 2014 | Nil | 3,750(3a) | 3,750 | 2015 | Nil | 7,500(3a) | 7,500 | ||||||||||
| 2013 | Nil | 68,000(3b) | 68,000 | 2014 | Nil | 3,750(3b) | 3,750 | |||||||||||
| (1) | Mr. Scheepers was appointed as our President and Chief Executive Officer effective on November 21, 2011 and as our Chief Operating Officer effective on October 6, 2011. Mr. Scheepers has been a director since September 21, 2010. The “Other Compensation” to Mr. Scheepers consists of: |
| a) | $144,000 in executive and administration service fees incurred during the fiscal year ended May 31, 2015 and $36,000 which represents the payment of 60% of rental expenses associated with renting Mr. Scheepers’ family house in Dar Es Salaam, Tanzania pursuant to his Executive Services Agreement with the Company; As at May 31, 2015, a total of $306,000 remained as payable. | |
| b) | $144,000 in executive and administration service fees incurred during the fiscal year ended May 31, 2014 and $25,200 which represents the payment of 60% of rental expenses associated with renting Mr. Scheepers’ family house in Dar Es Salaam, Tanzania pursuant to his Executive Services Agreement with the Company; As at May 31, 2014, | |
|
| (2) | Ms. Hsu was appointed as our Chief Financial Officer, Secretary and Treasurer effective on March 1, 2012. The “Other Compensation” to Ms. Hsu consists of: |
| a) | $77,644 in executive and administration service fees during the fiscal year ended May 31, 2015 earned by a private company controlled by Ms. Hsu. As at May 31, 2015, a total of $3,615 remained as a payable. | |
| b) | $84,438 in executive and administration service fees during the fiscal year ended May 31, 2014 earned by a private company controlled by Ms. Hsu. | |
|
| (3) | Mr. Boateng was appointed as our President and Chief Executive Officer effective on August 18, 2011 and resigned effective on November 21, 2011. Mr. Boateng has been a director since September 21, 2010. The “Other Compensation” to Mr. Boateng consists of: |
| a) | $7,500 of director’s fees incurred during the fiscal year ended May 31, 2015; a total of $21,250 fees remained as payable as at May 31, 2015. | |
| b) | $3,750 of director’s fees incurred during the fiscal year ended May 31, 2014; | |
|
Compensation of Directors
Effective on June 1, 2013, the Board of Directors (the “Board”) approved a reduction of monetary compensation to independent directors and/or non-executive directors of the Company as follows:
| (1) | annual independent director fees of $30,000 has been reduced to $15,000, subject to attending a minimum of four Board meeting a year; any applicable director’s fees shall be reduced by 25% for each board meeting less than four which is not attended. |
| (2) | meeting attendance fees of $1,000 per meeting has been waived; |
| (3) | additional annual fees of $10,000 to the Company’s Board Committee Chairperson has been reduced to $5,000; and |
| (4) | additional annual fees of $20,000 to the Vice Chairman of the Board has been reduced to $10,000. |
3930
The table below summarizes all compensation awarded to, earned by or paid to our current or former directors during our fiscal year ended May 31, 2014.2015. Certain of our current or former directors served or have served as officers of the Company and any compensation they received due to their services are disclosed in the tablestable above and are not included in the table below.
Director Compensation
| Name and Principal Position | Fees earned or paid in cash ($) | Stock Awards ($) | Option Awards ($) | Non-Equity Incentive Plan Compen- sation ($) | Nonqualified Deferred Compen- sation Earnings ($) | All Other Compen- sation ($) | Total ($) |
| Reginald Mengi | Nil | Nil | Nil | Nil | Nil | Nil | Nil |
| Reyno Scheepers(1) | N/A | N/A | N/A | N/A | N/A | N/A | N/A |
| Douglas Boateng(1) | N/A | N/A | N/A | N/A | N/A | N/A | N/A |
| William Lamarque(2) | 30,000 | Nil | Nil | Nil | Nil | Nil | 30,000 |
| Emmanuel Naiko(3) | 20,000 | Nil | Nil | Nil | Nil | Nil | 20,000 |
| Gizman Abbas(4) | 15,000 | Nil | Nil | Nil | Nil | Nil | 15,000 |
| (1) | See summary compensation table above. |
| (2) |
|
| (3) |
|
| (4) |
|
Outstanding Equity Awards
The following table sets forth information at our fiscal year ended May 31, 20142015 relating to outstanding equity awards that have been granted to the directors and named executive officers listed in the tables above:
| OUTSTANDING EQUITY AWARDS AT FISCAL YEAR-END | ||||||||||
| OPTION AWARDS | STOCK AWARDS | |||||||||
| Equity | Equity | |||||||||
| Incentive | Incentive | |||||||||
| Plan | Plan | |||||||||
| Awards: | Awards: | |||||||||
| Equity | Number | Market or | ||||||||
| Incentive | of | Payout | ||||||||
| Plan | Market | Unearned | Value of | |||||||
| Awards: | Value of | Shares, | Unearned | |||||||
| Number of | Number of | Number of | Number of | Shares or | Units or | Shares, | ||||
| Securities | Securities | Securities | Shares or | Units of | Other | Units or | ||||
| Underlying | Underlying | Underlying | Units of | Stock | Rights | Other | ||||
| Unexercised | Unexercised | Unexercised | Option | Stock That | That | That | Rights | |||
| Options | Options | Unearned | Exercise | Option | Have Not | Have Not | Have Not | That Have | ||
| Name | Exercisable | Unexercisable | Options | Price | Expiration | Vested | Vested | Vested | Not Vested | |
| (#) | (#) | (#) | ($) | Date | (#) | ($) | (#) | (#) | ||
| Reginald Mengi | 10,000,000 | N/A | N/A | $0.20 | 11/29/2020 | N/A | N/A | N/A | N/A | |
| Reyno Scheepers | 4,000,000 | N/A | N/A | $0.20 | 11/29/2020 | N/A | N/A | N/A | N/A | |
| 1,500,000 | N/A | N/A | $0.45 | 11/30/2021 | N/A | N/A | N/A | N/A | ||
| Melinda Hsu | 1,000,000 | N/A | N/A | $0.11 | 03/01/2017 | N/A | N/A | N/A | N/A | |
| Douglas Boateng | 4,500,000 | N/A | N/A | $0.20 | 11/29/2020 | N/A | N/A | N/A | N/A | |
| 3,000,000 | N/A | N/A | $0.45 | 11/30/2021 | N/A | N/A | N/A | N/A | ||
| William Lamarque | 200,000 | N/A | N/A | $0.08 | 07/04/2022 | N/A | N/A | N/A | N/A | |
| Emmanuel Naiko | 200,000 | N/A | N/A | $0.08 | 07/04/2022 | N/A | N/A | N/A | N/A | |
| Gizman Abbas | 200,000 | N/A | N/A | $0.08 | 07/04/2022 | N/A | N/A | N/A | N/A | |
| ITEM 12. | SECURITY OWNERSHIP OF CERTAIN BENEFICIAL OWNERS AND MANAGEMENT ANDRELATED STOCKHOLDER MATTERS |
The following table sets forth certain information concerning the number of shares of our common stock owned beneficially as of the date of this annual report by: (i) each person (including any group) known to us to own more than 5% of any class of our voting securities, (ii) each of our directors, (iii) each of our officers and (iv) our officers and directors as a group. Each stockholder listed possesses sole voting and investment power with respect to the shares shown.
4031
Officers and Directors
| Title of class | Name and address of beneficial owner(1) | Amount and nature of beneficial owner(2) | Percentage of class(3) |
| Common Stock | Reginald Mengi(1) | 158,333,333(4) | 49.26% |
| Common Stock | Reyno Scheepers(1) | 5,500,000(5) | 1.71% |
| Common Stock | Douglas Boateng(1) | 7,500,000(6) | 2.33% |
| Common Stock | William Lamarque(1) | 400,000(7) | 0.12% |
| Common Stock | Emmanuel Naiko(1) | 400,000(7) | 0.12% |
| Common Stock | Gizman Abbas(1) | 400,000(7) | 0.12% |
| Common Stock | Melinda Hsu(1) | 1,000,000(8) | 0.31% |
| Common Stock | All executive officers and directors as a group | 173,533,333 | 53.99% |
5% or Greater Shareholders:
| Title of class | Name and address of beneficial owner | Amount and nature of beneficial owner(2) | Percentage of class(3) |
| Common Stock | Reginald Mengi(1) | 158,333,333(4) | 49.26% |
| Common Stock | Zoeb Hassuji(9) | 16,666,667 | 5.19% |
| 1. | The address of our officers and directors is our Company’s address, which is P.O. Box 33507, Plot |
| 2. | Under Rule 13d-3 of the Exchange Act a beneficial owner of a security includes any person who, directly or indirectly, through any contract, arrangement, understanding, relationship or otherwise has or shares: (i) voting power, which includes the power to vote or to direct the voting of shares; and (ii) investment power, which includes the power to dispose or direct the disposition of shares. Certain shares may be deemed to be beneficially owned by more than one person (if, for example, persons share the power to vote or the power to dispose of the shares). In addition, shares are deemed to be beneficially owned by a person if the person has the right to acquire the shares (for example, upon exercise of an option) within 60 days of the date as of which the information is provided. In computing the percentage ownership of any person, the amount of shares outstanding is deemed to include the amount of shares beneficially owned by such person (and only such person) by reason of these acquisition rights. |
| 3. | Based on 321,416,654 shares of our common stock issued and outstanding as of August |
| 4. | Includes 133,333,333 shares held by IPP Gold Limited, 15,000,000 shares held by Handeni Resources Limited, and 10,000,000 fully vested stock options held by Mr. Mengi with an exercise price at $0.20 per share exercisable by November 29, 2020. |
| 5. | Represents 4,000,000 fully vested stock options with an exercise price at $0.20 per share exercisable by November 29, 2020 and 1,500,000 fully vested stock options with an exercise price at $0.45 per share exercisable by November 30, 2021. |
| 6. | Represents 4,500,000 fully vested stock options with an exercise price at $0.20 per share exercisable by November 29, 2020 and 3,000,000 fully vested stock options with an exercise price at $0.45 per share exercisable by November 30, 2021. |
| 7. | Represents 200,000 shares of our common stock and 200,000 fully vested stock options with an exercise price at $0.08 per share exercisable by July 4, 2022. |
| 8. | Represents fully vested stock options with an exercise price at $0.11 per share exercisable by March 1, 2017. |
| 9. | The registered address of this shareholder is Bonite Bottlers, Moshi, Kilimanjaro, Tanzania. |
Changes in Control
We are unaware of any contract, or other arrangement or provision of our Articles, the operation of which may at any subsequent date result in a change in control of the Company.
Securities Authorized for Issuance Under Equity Compensation Plans
The details referRefer to Item 5. above.
41
| ITEM 13. | CERTAIN RELATIONSHIPS AND RELATED TRANSACTIONS AND DIRECTORINDEPENDENCE |
Except as described below, none of the following parties has, in the last two fiscal years, had any material interest, direct or indirect, in any transaction with us or in any presently proposed transaction that has or will materially affect us:
| 1. | any of our directors or officers; | |
| 2. | any person proposed as a nominee for election as a director; | |
| 3. | any person who beneficially owns, directly or indirectly, shares carrying more than 10% of the voting rights attached to our outstanding shares of common stock; or |
32
| 4. | any member of the immediate family (including spouse, parents, children, siblings and in-laws) of any of the above persons. |
Related Party Transactions
| a) | The Company has entered into the following facility agreements with related parties: |
| i) | On December 7, 2012, and as amended on September 4, 2013, June 18, 2014 and March 20, 2015, the Company entered into a facility agreement with IPP Ltd., a private company controlled by the | |
| ii) | On October 9, 2013, and as amended on June 18, 2014 and March 20, 2015, the Company entered into a facility agreement with Consultancy & Finance Company Associates Ltd. (“C&F”), a private company controlled by the | |
| iii) | On November 20, 2014, the Company entered into a facility agreement with C&F. The funding is in the form of an interest-free unsecured loan to the Company of up to $500,000 due May 31, 2017. As of May 31, 2015, C&F has advanced $215,000 to the Company pursuant to this facility agreement. |
| b) | During the year ended May 31, 2015 and 2014, the Company incurred administration and professional services fees of $144,000 |
| c) | During the year ended May 31, |
During the year ended May 31, | |
| |
| e) |
|
| ||
| ||
| ||
|
Accordingly, the Company incurred independent directors’ fees of $65,000 during the year ended May 31, 2014 (May 31, 2013 - $190,250). As at May 31, 2014, the Company had $88,750 (May 31, 2013 - $93,250)payable.
During the year ended May 31, 2013, the Company granted to each independent director 200,000 stock options at a price of $0.08 per share exercisable for 10 years for a total of 1,000,000 stock options and 200,000 shares of the Company’s common stock with a fair value of $0.04 per share for a total of 1,000,000 shares as stock-based compensation. Such stock options and shares were granted under the Company’s November 2010 Stock Incentive Plan. Two of these independent directors resigned respectively during the fiscal year ended May 31, 2013 and the related 400,000 granted stock options were forfeited.
42
Director Independence
The Board has analyzed the independence of each director and has determined that the members of the Board listed below are independent as that term is defined under Rule 5605(a)(2) of the NASDAQ listing rules. Each director is free of relationships that would interfere with the individual exercise of independent judgment. Based on these standards, the Board determined that each of the following directors is independent and has no relationship with the Company, except as a director and shareholder:
| • | William Lamarque; | |
| • | Emmanuel Ole Naiko; and | |
| • | Gizman Abbas. |
| ITEM 14. | PRINCIPAL ACCOUNTING FEES AND SERVICES |
Manning Elliott LLP served as our independent registered public accounting firm and audited our consolidated financial statements for the fiscal years ended May 31, 20142015 and 2013.2014. Aggregate fees billed during fiscal years ended May 31, 20142015 and 20132014 to the Company by Manning Elliott LLP for rendered professional services are set forth below:
| Year Ended May 31, 2014 | Year Ended May 31, 2013 | Year Ended May 31, 2015 | Year Ended May 31, 2014 | |
| Audit Fees | $24,400 | $58,010 | $28,833 | $24,400 |
| Audit-Related Fees | -- | $900 | -- | |
| Tax Fees | $3,290 | $3,240 | $3,058 | $3,290 |
| All Other Fees | -- | $720 | -- | |
| Total | $27,690 | $62,870 | $31,892 | $27,690 |
33
Audit Fees
Audit fees are the aggregate fees billed for professional services rendered by our independent auditors for the audit of our annual consolidated financial statements, the review of the interim consolidated financial statements included in each of our quarterly reports and services provided in connection with statutory and regulatory filings or engagements.
Audit Related Fees
Audit related fees are the aggregate fees billed by our independent auditors for assurance and related services that are reasonably related to the performance of the audit or review of our consolidated financial statements and are not described in the preceding category.
Tax Fees
Tax fees are billed by our independent auditors for tax compliance, tax advice and tax planning.
All Other Fees
All other fees include fees billed by our independent auditors for products or services other than as described in the immediately preceding three categories.
Policy on Pre-Approval of Services Performed by Independent Auditors
It is our Board of Directors’ policy to pre-approve all audit and permissible non-audit services performed by the independent auditors. The Board of Directors approved all services that our independent accountants provided to us in the past two fiscal years.
The Audit Committee is responsible for appointing, setting compensation for and overseeing the work of the independent registered public accounting firm. The Audit Committee requires its pre-approval of all audit and permissible non-audit services provided by the independent registered public accounting firm. The Audit Committee considers whether such services are consistent with the rules of the SEC on auditor independence.
43
| ITEM 15. | EXHIBITS |
The following exhibits are filed with this Annual Report on Form 10-K:
| Exhibit | Description of Exhibit |
| Number | |
| 3.1(1) | Articles of Incorporation. |
| 3.2(12) | Certificate of Amendment to Articles of Incorporation. |
| 3.3(21) | Articles of Merger as filed with the Nevada Secretary of State. |
| 3.3(3) | Amended Bylaws, as amended on September 5, 2006. |
| 10.1(4) | Asset Purchase Agreement with KBT Discovery Group Tanzania Ltd. |
| 10.2(4) | Asset Purchase Agreement with Hydro-Geos Consulting Group Tanzania Ltd. |
| 10.3(4) | Asset Purchase Agreement with Megadeposit Explorers Ltd. |
| 10.4(5) | Amendment No. 1 to Asset Purchase Agreement with KBT Discovery Group Tanzania Ltd. |
| 10.5(5) | Amendment No. 1 to Asset Purchase Agreement with Hydro-Geos Consulting Group Tanzania Ltd. |
| 10.6(5) | Amendment No. 1 to Asset Purchase Agreement with Megadeposit Explorers Ltd. |
| 10.7(6) | Amendment No. 2 to Asset Purchase Agreement with KBT Discovery Group Tanzania Ltd. |
| 10.8(6) | Amendment No. 2 to Asset Purchase Agreement with Hydro-Geos Consulting Group Tanzania Ltd. |
| 10.9(6) | Amendment No. 2 to Asset Purchase Agreement with Megadeposit Explorers Ltd. |
| 10.10(7) | Strategic Alliance Agreement between the Company and Canaco Resources Inc. |
| 10.11(8) | Option Agreement between the Company and Canaco Resources Inc. |
| 10.12(9) | Amendment No. 1 to Strategic Alliance Agreement between the Company and Canaco Resources Inc. |
| 10.13(9) | Kwadijava Option Agreement. |
34
| 10.14(9) | Negero Option Agreement. |
| 10.15(10) | Joint Venture Agreement with Mkuvia Maita. |
| 10.16(11) | 2007 Stock Incentive Plan. |
| 10.17(14) | 2008 Stock Incentive Plan. |
| 10.18(11) | Consulting Agreement with Harpreet Sangha. |
| 10.19(11) | Consulting Agreement with Rovingi. |
| 10.20(13) | Joint Venture Agreement with Mkuvia Maita dated June 5, 2009. |
| 10.21(15) | Agreement with Ruby Creek Resources, Inc. dated November 7, 2009. |
| 10.22(16) | Purchase Agreement with Ruby Creek Resources, Inc., dated for reference May 19, 2010. |
| 10.23(17) | August 2010 Stock Incentive Plan. |
| 10.24(18) | Mineral Property Acquisition Agreement between the Company and IPP Gold Limited, dated September 15, 2010, ratified by the Company’s Board of Directors on September 21, 2010. |
| 10.26(19) | November 2010 Stock Incentive Plan. |
| 10.27(20) | Mineral Property Acquisition Agreement between the Company and Handeni Resources Limited, dated August 5, 2011. |
| 10.28(22) | Executive Consulting Services Agreement between the Company and Amica Resource Inc., dated February 28, 2012. |
44
| 10.29(23) | Unsecured Term Loan Facility Agreement between the Company and IPP Ltd. dated December 7, 2012 |
| 10.30(24) | Unsecured Term Loan Facility Agreement between the Company and Consultancy & Finance Company Associates Ltd. dated October 9, 2013 |
| 14.1(2) | Code of Ethics. |
| 21.1 | Subsidiaries of the Registrant: |
| a. Douglas Lake Tanzania Limited (Tanzania); and | |
| b. HG Limited (Tanzania) (formerly: DLM Tanzania Limited (Tanzania)). | |
| 23.1* | Consent of Auditor. |
| 31.1* | Certifications of Chief Executive Officer Pursuant to Section 302 of the Sarbanes-Oxley Act of 2002. |
| 31.2* | Certifications of Chief Financial Officer Pursuant to Section 302 of the Sarbanes-Oxley Act of 2002. |
| 32.1* | Certifications of Chief Executive Officer and Chief Financial Officer Pursuant to Section 906 of the Sarbanes- Oxley Act of 2002. |
| * | Filed herewith. |
| (1) | Incorporated by reference to Form SB-2 Registration Statement filed on July 22, 2004. |
| (2) | Incorporated by reference to Annual Report on Form 10-KSB for year ended May 31, 2005. |
| (3) | Incorporated by reference to Annual Report on Form 10-KSB for year ended May 31, 2006. |
| (4) | Incorporated by reference to Current Report on Form 8-K filed on August 4, 2005. |
| (5) | Incorporated by reference to Current Report on Form 8-K filed on November 21, 2005. |
| (6) | Incorporated by reference to Quarterly Report on Form 10-SB for quarterly period ended November 30, 2005. |
| (7) | Incorporated by reference to Current Report on Form 8-K filed on May 4, 2006. |
| (8) | Incorporated by reference to Quarterly Report on Form 10-SB for quarterly period ended August 31, 2006. |
| (9) | Incorporated by reference to Quarterly Report on Form 10-SB for quarterly period ended August 31, 2007. |
| (10) | Incorporated by reference to Current Report on Form 8-K filed on August 6, 2008. |
| (11) | Incorporated by reference to Annual Report on Form 10-KSB for year ended May 31, 2007. |
| (12) | Incorporated by reference to Current Report on Form 8-K filed on January 27, 2009 |
| (13) | Incorporated by reference to Current Report on Form 8-K filed on July 16, 2009 |
| (14) | Incorporated by reference to Registration Statement Form S-8 filed on December 30, 2008. |
| (15) | Incorporated by reference to Current Report on Form 8-K filed on November 13, 2009. |
| (16) | Incorporated by reference to Current Report on Form 8-K filed on June 21, 2010. |
| (17) | Incorporated by reference to Annual Report on Form 10-K for the year ended May 31, 2010. |
| (18) | Incorporated by reference to Current Report on Form 8-K filed on September 27, 2010. |
| (19) | Incorporated by reference to Annual Report on Form 10-K for the year ended May 31, 2011. |
35
| (20) | Incorporated by reference to Current Report on Form 8-K filed on August 10, 2011. |
| (21) | Incorporated by reference to Current Report on Form 8-K filed on February 15, 2012. |
| (22) | Incorporated by reference to Current Report on Form 8-K filed on March 2, 2012. |
| (23) | Incorporated by reference to Quarterly Report on Form 10-Q for the quarterly period ended November 30, 2012. |
| (24) | Incorporated by reference to Quarterly Report on Form 10-Q for the quarterly period ended August 31, 2013. |
4536
SIGNATURES
Pursuant to the requirements of Section 13 and 15 (d) of the Securities Exchange Act of 1934, the registrant has duly caused this report to be signed on its behalf by the undersigned, thereunto duly authorized.
| HANDENI GOLD INC. | |
| By: | “Reyno Scheepers” |
| Reyno Scheepers | |
| President, Chief Executive Officer (Principal Executive Officer) and | |
| a director | |
| Date: August 18, | |
| By: | “Melinda Hsu” |
| Melinda Hsu | |
| Chief Financial Officer (Principal Financial Officer and Principal | |
| Accounting Officer), Secretary and Treasurer | |
| Date: August 18, | |
__________
4637
SIGNATURES
Pursuant to the requirements of the Securities Exchange Act of 1934, this report has been signed below by the following persons on behalf of the registrant and in the capacities and on the dates indicated.
| Signature | Title | Date |
| “Reyno Scheepers” | President, Chief Executive Officer (Principal Executive | August 18, |
| Reyno Scheepers | Officer) and a director | |
| “Reginald Mengi” | August 18, 2015 | |
| Reginald Mengi | Chairman of the Board of Directors and a director | |
| “William Lamarque” | August 18, 2015 | |
| William Lamarque | Vice Chairman of the Board of Directors and a director | |
| Douglas Boateng” | August 18, | |
| Douglas Boateng | Director | |
| “Emmanuel Naiko” | August 18, | |
| Emmanuel Naiko | ||
| Director | ||
| August 18, | ||
| “Melinda Hsu” | ||
| Melinda Hsu | Chief Financial Officer (Principal Financial Officer and | |
| Principal Accounting Officer), Secretary and Treasurer |
__________
4738