UNITED STATES
SECURITIES AND EXCHANGE COMMISSION
Washington, D.C. 20549
FORM 10-K
[X]
☒ ANNUAL REPORT PURSUANT TO SECTION 13 OR 15(d) OF THE SECURITIES EXCHANGE ACT OF 1934
For the fiscal year ended:December 31, 20162020
[_]
☐ TRANSITION REPORT PURSUANT TO SECTION 13 or 15(d) OF THE SECURITIES EXCHANGE ACT OF 1934
For the transition period from ____________ to ____________
Commission File Number:001-34449
AMERICAN LORAIN CORPORATIONPLANET GREEN HOLDINGS CORP.
(Exact name of registrant as specified in its charter)
| Nevada | 87-0430320 | |
| (State or other jurisdiction of | (I.R.S. Employer | |
| incorporation or organization) | Identification Number) |
36-10 Union St. 2nd Floor
BeihuanZhong RoadJunan CountyShandong, People’s Republic of China, 276600Flushing, NY 11345
(Address of principal executive office and zip code)
(86) 539-7317959(718) 799-0380
(Registrant’s telephone number, including area code)
Securities registered pursuant to Section 12(b) of the Act:
| Title of each class | Trading Symbol(s) | Name of each exchange on which registered | ||
| Common Stock, par value $0.001 per share | PLAG | NYSE American |
Securities registered pursuant to Section 12(g) of the Act:None
Indicate by check mark if the registrant is a well-known seasoned issuer, as defined in Rule 405 of the Securities Act. Yes ☐ No ☒
Yes [ ] No [X]
Indicate by check mark if the registrant is not required to file reports pursuant to Section 13 or Section 15(d) of the Act. Yes ☐ No ☒
Yes [ ] No [X]
Indicate by check mark whether the registrant (1) has filed all reports required to be filed by Section 13 or 15(d) of the Securities Exchange Act of 1934 during the preceding 12 months (or for such shorter period that the issuer was required to file such reports), and (2) has been subject to such filing requirements for the past 90 days. Yes ☒ No ☐
Yes [X] No [ ]
Indicate by check mark whether the registrant has submitted electronically and posted on its corporate Web site, if any, every Interactive Data File required to be submitted and posted pursuant to Rule 405 of Regulation S-T (§ 232.405 of this chapter) during the preceding 12 months (or for such shorter period that the registrant was required to submit and post such files). Yes ☒ No ☐
Yes [ ] No [X]
Indicate by check mark whether the registrant is a large accelerated filer, an accelerated filer, a non-accelerated filer, a smaller reporting company, or an emerging growth company. See definitions of “large accelerated filer,” “accelerated filer,” “smaller reporting company,” and “emerging growth company” in Rule 12b-2 of the Exchange Act.
| Large accelerated filer | ☐ | Accelerated filer | ☐ | |
| Non-accelerated filer | ☒ | Smaller reporting company | ☒ | |
| Emerging growth company | ☐ | |||
If an emerging growth company, indicate by check mark if the registrant has elected not to use the extended transition period for complying with any new or revised financial accounting standards provided pursuant to Section 13(a) of the Exchange Act. [ ]☐
Indicate by check mark whether the registrant has filed a report on and attestation to its management’s assessment of the effectiveness of its internal control over financial reporting under Section 404(b) of the Sarbanes-Oxley Act (15 U.S.C.7262(b)) by the registered public accounting firm that prepared or issued its audit report. ☐
Indicate by check mark whether the registrant is a shell company (as defined in Rule 12b-2 of the Exchange Act). Yes ☐ No ☒
Yes [ ] No [X]
The number of shares and aggregate market value of common stock held by non-affiliates as of the last business day of the registrant’s most recently completed second fiscal quarter were 19,259,5703,881,060 and $7,318,636.6$18,163,361, respectively.
There were 38,274,49020,009,930 shares of common stock outstanding as of SeptemberMarch 29, 2017.2021.
Documents Incorporated by Reference: PortionsNone.
EXPLANATORY NOTE
The registrant is relying on the Securities and Exchange Commission’s Order under Section 36 of the registrant'sSecurities Exchange Act of 1934 Modifying Exemptions from the Reporting and Proxy Statement related to its 2017 Annual Stockholders' Meeting to be filed subsequently are incorporated by reference into Part IIIDelivery Requirements for Public Companies (Release No. 34-88465 dated March 25, 2020), which concerns exemptions from certain filing deadlines in light of COVID-19. The registrant could not file this Annual Report on Form 10-K. Except as expressly incorporated by reference,10-K for the registrant's Proxy Statement shall not be deemedfiscal year ended December 31, 2019 on a timely basis because the outbreak of COVID-19 in China and restrictions on travel and operations, which included, among others, finance team were unable to be partcomplete the preparation of the report.registrant’s consolidated financial statements for the fiscal year ended December 31, 2019, caused delays in completing the required work.
1
FORM 10-K INDEX
i
Use of Certain Defined Terms
In this annual report on Form 10-K:
| “Beijing Lorain” refers to Beijing Green Foodstuff Co., Ltd. |
| ● | “China” and “PRC” refer to the People’s Republic of China (excluding Hong Kong, Macau and Taiwan for the purposes of this report only). |
| ● | “ | |
| ● | “Jiayi Technologies” or “WFOE” refers to Jiayi Technologies (Xianning) Co., Ltd, a PRC limited liability company and a wholly foreign-owned enterprise, formerly known as Lucky Sky Petrochemical Technology (Xianning) Co. |
| ● | “Jilin Chuangyuan” refers to Jilin Chuangyuan Chemical Co., Ltd., a PRC limited liability company. |
| ● | “Jinshan Sanhe Luckysky” refers to Jingshan Sanhe Luckysky New Energy Technologies Co., Ltd., a PRC limited company. |
| ● | “Lucky Sky HK” refers to Lucky Sky Holdings Corporations (HK) Limited, a company incorporated in Hong Kong and formerly known as JianShi Technology Holding Limited. |
| ● | “Lucky Sky Petrochemical” or “WFOE” refers to Lucky Sky Petrochemical Technology (Xianning) Co., Ltd., a PRC limited liability company and a wholly foreign-owned enterprise. |
| ● | “Luotian Lorain” refers to Luotian Green Foodstuff Co., Ltd., a PRC limited liability company. |
| ● | “PLAG,” “we,” “us”, “our” and |
“ |
| ||
| ||
| ||
| ||
| ||
| ||
| ||
“Shandong Greenpia” refers to Shandong Greenpia Foodstuff Co., Ltd., a PRC limited liability company. | ||
“ |
| “Shanghai Xunyang” refers to Shanghai Xunyang Internet Technology Co., Ltd., a PRC limited liability company. |
| ● | “Shenzhen Lorain” refers to Lorain Food Stuff (Shenzhen) Co., Ltd., a PRC limited liability company. |
| ● | “Taishan Muren” refers to Taishan Muren Agriculture Co. Ltd., a PRC limited liability company. |
| ● | “U.S. dollar”, “$” and “US$” refer to the legal currency of the United States. |
“ |
| ● | “Xianning Bozhuang” refers to Xianning Bozhuang Tea Products Co., Ltd., a PRC limited liability company. |
| ● | “Lucky Sky Planet Green” refers to Lucky Sky Planet Green Holdings Co., Limited,a company incorporated in Hong Kong. |
This report contains forward-looking statements within the meaning of Section 27A of the Securities Act of 1933 and Section 21E of the Securities Exchange Act of 1934 (“Exchange Act”), including, without limitation, statements regarding our expectations, beliefs, intentions or future strategies that are signified by the words “expect,” “anticipate,” “intend,” “believe,” or similar language. All forward-looking statements included in this document are based on information available to us on the date hereof, and we assume no obligation to update any such forward-looking statements. Our business and financial performance are subject to substantial risks and uncertainties. Actual results could differ materially from those projected in the forward-looking statements. In evaluating our business, you should carefully consider the information set forth under the heading “Risk Factors.” Readers are cautioned not to place undue reliance on these forward-looking statements.
2
Overview of Our Business
Planet Green is a Nevada company established in 1986 and is headquartered in Flushing, New York. We are an integrated food manufacturinga diversified technology and consumer products company headquarteredwith presence in Shandong Province, China. We develop, manufactureNorth America and sellChina in the following types of food products:follow businesses: Chemical Products, Tea Products and Online Advertising Services.
Planet Green manages its operation in three business segments which include:
|
|
|
We conduct
Coronavirus (COVID-19) Update
Recently, there is an ongoing outbreak of a novel strain of coronavirus (COVID-19) first identified in China and has since spread rapidly globally. The pandemic has resulted in quarantines, travel restrictions, and the temporary closure of stores and business facilities globally for the past few months. In March 2020, the World Health Organization declared the COVID-19 as a pandemic. Given the rapidly expanding nature of the COVID-19 pandemic, and because substantially all of our business operations and our workforce are concentrated in China, our business, results of operations and financial condition have been and will continue to be adversely affected. Potential impact to our results of operations will also depend on future developments and new information that may emerge regarding the duration and severity of the COVID-19 and the actions taken by government authorities and other entities to contain the COVID-19 or mitigate its impact, almost all of which are beyond our control.
The impacts of COVID-19 on our business, financial condition, and results of operations include, but are not limited to, the following:
| ● | We temporally closed our offices and production facilities to adhere to the policy from February 2020 until April 2020, as required by relevant PRC regulatory authorities. Our offices are slowly reopening pursuant to local guidelines. In the first quarter of 2020, the COVID-19 outbreak has caused disruptions in our manufacturing operations, which have resulted in delays in the shipment of products to certain of our customers. |
| ● | Some of our employees were in mandatory self-quarantine from January 2020 to April 2020. |
| ● | Our customers have been negatively impacted by the outbreak, which may reduce the demand of our products. As a result, our revenue and income may be negatively impacted in 2020. |
| ● | The situation may worsen if the COVID-19 pandemic continues. We continued to closely monitor our collections throughout 2020. |
A prolonged disruption or any further unforeseen delay in our operations of the manufacturing, delivery and assembly process within any of our production activitiesfacilities could continue to result in China. Our products are sold in Chinese domestic markets as well as exported to foreign countries and regions such as Japan, South Korea and Europe. We derive most of our revenues from sales in China, Japan and South Korea. In 2017, our primary strategy is to continue building our brand recognition in China through consistent marketing efforts towards supermarkets, wholesalers, and significant customers, enhancing the cooperation with other manufacturers and factories and enhancing the turnover for our existing chestnut, convenience and frozen food products. In addition, we are working to develop new products and new sales channels. We currently have limited sales and marketing activitydelays in the United States, although our long-term plan is to significantly expand our activities there.
Recent Developments
The Company has discovered errors in the timing of revenues recognized during the year ended December 31, 2015. The Company recognizes revenue upon shippingshipment of products to our customers, increased costs and reduced revenue.
We cannot foresee whether the outbreak of COVID-19 will be effectively contained, nor can we predict the severity and duration of its customers where title of the goods passes upon departure from the Company’s facilities; however, in certain instances, contractual terms dictate that the customers are afforded seven days after the receipt of goods at their premises to inspect the goods for defects or spoilage and notify the Company.impact. If the Companyoutbreak of COVID-19 is not contacted within those seven days, the Company’s obligation to the customer are considered fully dischargedeffectively and revenue shouldtimely controlled, our business operations and financial condition may be recognized. Given the timing of these seven days, the Company believes that certain sales transactions have been erroneously recognized during the year ended December 31, 2015. The Company has rectified this errormaterially and the impact of the Company’s financial position and result of operations
On December 22, 2016, the Company entered into a Share Exchange Agreement with Shengrong Environmental Protection Holding Company Limited, a business company incorporated in the British Virgin Islands with limited liability (“Shengrong”), and each of Shengrong’s shareholders (collectively, the “Sellers”), pursuant to which, among other things and subject to the terms and conditions contained therein, the Company agreed to effect an acquisition of Shengrong and its subsidiaries, including Hubei Shengrong Environmental Protection Energy-Saving and Technology Co. Ltd., a registered company in Hubei China by acquiring from the Sellers all outstanding equity interests of Shengrong. However, such agreement was terminated and abandoned in June 2017.
Revenues from sales in the China domestic market decreased by approximately $79.2 million, or approximately 46.05%, in 2016. The reasons for the decrease in revenues in China decreased are:
| ||
|
We liquidated our French operations in 2016 following an investigation with respect to the origin of canned chestnuts sold by Conserverie Minerve (“Minerve”, a former subsidiary of Athena) issued Centre Technique Conservation of Produits Agricoles (“CTCPA”), an industry trade association for canned, preserved and dehydrated food products in France. CTCPA stated that only chestnuts based on the European or Japanese cultivars can be used in canned chestnut products sold in France according to CTCPA policies and that canned chestnut products must also have received certification from the International Featured Standards (“IFS”), a qualified third party certification agency in Europe that certifies food products, especially for retail industry.
3
Asadversely affected as a result of such liquidation,the deteriorating market outlook, the slowdown in regional and national economic growth, weakened liquidity and financial condition of our exportscustomers or other factors that we cannot foresee. Any of these factors and other factors beyond our control could have decreased substantially due to weak demandan adverse effect on the overall business environment, cause uncertainties in the international market. Revenue from salesregions where we conduct business, cause our business to suffer in international markets decreased by approximately $29.1 million, or approximately 67.12% . We mainly relied on Athena,ways that we cannot predict and materially and adversely impact our French subsidiary,business, financial condition and results of operations. Now that we are closer to sell our products in European market. But since we suffered a significant loss from the result of investigation of CTCPA during 2015 and 2016, we decided to shut down the operation of Athena. As a result, the export amount of chestnuts to Europe markets decreased markedly by 95.40% in 2016.
Revenues from sales of convenience food decreased by approximately 65.0% in 2016 due to increasing market competition. Since 2015, more competitors entered the convenience food industry that develop more types of products. Our current products have not met customers’ demand in the most recent year due to our failure to invest in research and development. In addition, we have faced significant competition from Chinese online ordering platforms since 2015, which platforms offer convenient and efficient meals directly from restaurants. In addition, Dongguan Lorain ceased operations in October 2016 due to its high cost of environmental compliance, the overlap of products and market with Luotian Lorain, both of which focus on the southern market of China, and poor performance of sales revenue.
Revenues from sales of our frozen food products decreased by 10.9% compared with that in 2015. The decrease is mainly due to the fact that the sales amount declined, becausecontainment of the relocationCOVID-19 pandemic with the emergence of Shandong Lorain, one of our frozen food producing and sales company, discussed above.several very effective vaccines, market participants expect the economy will fully recover over the next year or two.
Our general and administrative expenses increased approximately $35.1 million, or 620.0%, to $ 40.8 million in 2016 from $5.7 million in 2015. The increase mainly due to the bad debt including $35,590,795 unrecovered trade receivables and other receivables that management determined cannot be recovered, which accounted for 87.2% of total general and administrative expenses in 2016, respectively. In 2016, the credit terms for many of our domestic customers was between 30 and 60 days; international customers are typically extended 90 days credit. Our cash flow suffered while waiting for such payments. Many of our direct clients, such as supermarkets and restaurants, did not make payments promptly due to poor sales. In addition, third party distributors’ ability to collect accounts receivable was worsened due to the bad sales performance and such distributors’ inability to collect receivables from their own clients. Other receivables that become bad debt include (i) raw materials we paid for but the suppliers did not provide the raw materials ordered by us and refused to refund the advance payment, or we did not agree on the quality of the raw materials and (ii) advance payments made by our procurement department for raw materials, and such salesmen left the company before we could confirm that the goods had been warehoused. Most of the aforementioned receivables were incurred after 2014, and under accounting principles we determined that 2016 was a suitable time to increase the ratio of provision for bad debts exceeding half a year to 50% and to 100% for over one year.
Organizational Structure
ALN is a Nevada corporation that
PLAG was incorporated on February 4, 1986 and was formerly known as “Millennium Quest, Inc.“American Lorain Corporation.” Effective November 12, 2009, ALNPLAG reincorporated in Nevada from Delaware.
ALN owns 100%
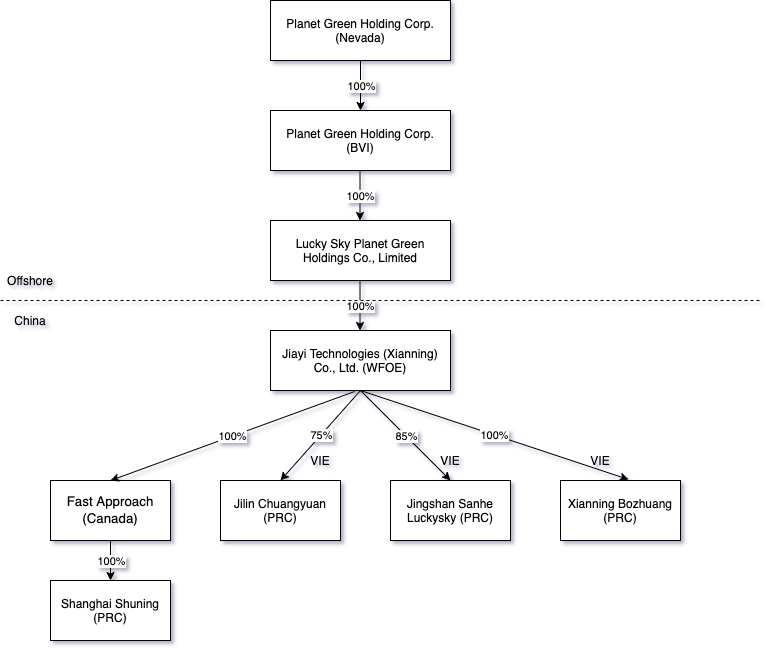
The following diagram illustrates our corporate structure as of ILH. ILH wholly owns two Chinese operating subsidiaries, Luotian Lorain and Junan Hongrun, directly. Junan Hongrun, in turn, owns 100% and 51%the date of Dongguan Lorain and Athena respectively. In addition, together with Junan Hongrun, ILH wholly owns Beijing Lorain, Shandong Greenpia, and owns approximately 80% of Shandong Lorain (Shandong Economic Development Investment Co. Ltd. owns approximately 20%). We sometimes refer to our six Chinese operating subsidiaries and the Athena Group throughout this annual report on Form 10-K, including our subsidiaries and our VIEs.
Subsidiary
We are a company that continuously strives to create new value and relentlessly to capture new opportunities, which is why we are growing and strengthening the internet-based business as another pillar towards the next growth stage. In addition to our Chinese domestic business, we set out for global market by acquiring 100% shares of Fast Approach in Canada on June 5, 2020 to embark on demand-side platform (DSP) business in North America. A demand-side platform is a system that allows buyers of digital advertising inventory to manage multiple advertisement exchange and data exchange through one interface. Fast Approach is the first North America demand side platform that directly connects to Chinese market without middleman and is supported by world class data science researchers among some well-respected universities in North America. Fast Approach owns 100% equity of Shanghai Shuning in China. We believe this acquisition will accelerate our global business growth, leading to further increasing the Planet Green enterprise value as well.
On May 29, 2020, the Planet Green Holdings Corporation (BVI) incorporated Lucky Sky Planet Green Holdings Co., Limited, a limited company incorporated in Hong Kong. On June 16, 2020, Lucky Sky Holdings Corporations (H.K.) transferred its 100% equity interest in Lucky Sky Petrochemical to Lucky Sky Planet Green Holdings Co., Limited (H.K.).
On August 10, 2020, as part of the reorganization, Planet Green Holdings Corporation (BVI) transferred its 100% equity interest in Lucky Sky Holdings Corporations (H.K.) Limited to Rui Tang, a unrelated party, at nominal price.
VIE Arrangement
On September 27, 2018, through Shanghai Xunyang, the Company entered into exclusive VIE agreements with Beijing Lorain, Luotian Lorain, Shandong Greenpia, Taishan Muren, and Shenzhen Lorain and their shareholders that give the Company the ability to substantially influence those companies’ daily operations and financial affairs and appoint their senior executives. The Company is considered the primary beneficiary of these operating companies.
On May 14, 2019, through Shanghai Xunyang, the Company entered into a series of VIE agreements with Xianning Bozhuang and its equity holders to obtain control and became the primary beneficiary of Xianning Bozhuang. The Company consolidated Xianning Bozhuang’s accounts as its VIE.
On December 20, 2019, we sold 100% of equity interest in Shanghai Xunyang and terminated its VIE agreements with Xianning Bozhuang, Shenzhen Lorain and Taishan Muren.
On December 20, 2019, through Lucky Sky Petrochemical, the Company entered into exclusive VIE agreements (“VIE Agreements”) with Taishan Muren, Xianning Bozhuang and Shenzhen Lorain, as well as their shareholders, which give the Company the ability to substantially influence those companies’ daily operations and financial affairs and appoint their senior executives. The Company is considered the primary beneficiary of these operating companies and it consolidates their accounts as VIEs.
On September 8, 2020, the Company’s Board of Directors resolved to discontinue the operation of Shenzhen Lorain and Taishan Muren due to the continued loss of such two subsidiaries. On September 15, 2020, Lucky Sky Petrochemical terminated the VIE agreements with Shenzhen Lorain and Taishan Muren.
On January 4, 2021, through Jiayi Technologies, formerly known as Lucky Sky Petrochemical, the Company entered into a series of VIE agreements with Jingshan Sanhe Luckysky as well as its shareholders, which gives the Company the ultimate control of Jingshan Sanhe Luckysky and its shareholders, making it operate in accordance with the will of the Company. The Company is considered the primary beneficiary of Jingshan Sanhe Luckysky and it consolidates its accounts as VIEs.
On March 9, 2021, through Jiayi Technologies, the Company entered into a series of VIE agreements with Jilin Chuangyuan as well as its shareholders, which gives the Company the ultimate control of Jilin Chuangyuan and its shareholders, making it operate in accordance with the will of the Company. The Company is considered the primary beneficiary of Jilin Chuangyuan and it consolidates its accounts as VIEs. Each of the VIE Agreements is described in detail below:
Consultation and Service Agreement. Pursuant to the Consultation and Service Agreement, WFOE has the exclusive right to provide consultation and services to the operating entities in China in the area of business management, human resource, technology and intellectual property rights. WFOE exclusively owns any intellectual property rights arising from the performance of this Consultation and Service Agreement. The amount of service fees and payment term can be amended by the WFOE and operating companies’ consultation and the implementation. The term of the Consultation and Service Agreement is 20 years. WFOE may terminate this agreement at any time by giving 30 day’s prior written notice.
Business Cooperation Agreement. Pursuant to the Business Cooperation Agreement, WFOE has the exclusive right to provide complete technical support, business support and related consulting services, including but not limited to technical services, business consultations, equipment or property leasing, marketing consultancy, system integration, product research and development, and system maintenance. WFOE exclusively owns any intellectual property rights arising from the performance of this Business Cooperation Agreement. The rate of service fees may be adjusted based on the services rendered by WFOE in that month and the operational needs of the operating entities. The Business Cooperation Agreement shall maintain effective unless it was terminated or was compelled to terminate under applicable PRC laws and regulations. WFOE may terminate this Business Cooperation Agreement at any time by giving 30 day’s prior written notice.
Equity Pledge Agreements. Pursuant to the Equity Pledge Agreements among WFOE, operating entities and each of operating entities’ shareholder, shareholders of the operating entities pledge all of their equity interests in the operating entities to WFOE to guarantee their performance of relevant obligations and indebtedness under the Technical Consultation and Service Agreement and other control agreements. In addition, shareholders of the operating entities are in the process of registering the equity pledge with the competent local authority.
Equity Option Agreements. Pursuant to the Equity Option Agreements, WFOE has the exclusive right to require each shareholder of the operating companies to fulfill and complete all approval and registration procedures required under PRC laws for WFOE to purchase, or designate one or more persons to purchase, each shareholder’s equity interests in the operating companies, once or at multiple times at any time in part or in whole at WFOE’s sole and absolute discretion. The purchase price shall be the lowest price allowed by PRC laws. The Equity Option Agreements shall remain effective until all the equity interest owned by each operating entities shareholder has been legally transferred to WFOE or its designee(s).
Voting Rights Proxy Agreements. Pursuant to the Voting Rights Proxy Agreements, each shareholder irrevocably appointed WFOE or WFOE’s designee to exercise all his or her rights as the Lorain Group Companies. Below is an organizational chart of ALN, ILH and the Lorain Group Companies:
4

*Athena is a holding company which holds majorityshareholders of the capitaloperating entities under the Articles of Association of each operating entity, including but not limited to the power to exercise all shareholder’s voting rights with respect to all matters to be discussed and the voting shares of Conserverie Minerve, a company organized under French law. Conserverie Minerve specializesvoted in the processing and saleshareholders’ meeting. The term of chestnut and prepared foods products in Europe. Conserverie Minerve operates its businesses througheach Voting Rights Proxy Agreement is 20 years. WOFE has the right to extend each Voting Proxy Agreement by giving written notification.
As of December 31, 2020, the following directentities were de-consolidated from the structure as a result of the termination agreements: Beijing Lorain, Luotian Lorain, Shandong Greenpia, Shenzhen Lorain and indirect, wholly owned subsidiaries:
| ||
| ||
| ||
|
On June 6, 2015, Athena approvedTaishan Muren. Shanghai Xunyang was sold to one unrelated party in the merger of its wholly owned subsidiary Conserverie Minerve into Athena. Athena assumed all contracts, rights, assets and liabilities of Conserverie Minerve after the merger. Athena was a holding company with no operations and its only asset was the equity of Conserverie Minerve. On August 8, 2015, the merger was completed. In April 2016, Athena ceased operations as discussed above.reorganization process.
Products
We grow, produce and distribute Cyan brick tea, black tea and green tea in China. In addition, we also research, develop, manufacture and sell products of formaldehyde, urea formaldehyde adhesive, methylal, ethanol fuel, fuel additives and clean fuel.
Our ethanol fuel and fuel additives products are categorized into the following three segments:business is carried on by our newly acquired VIE company, Jingshan Sanhe Luckysky.
| ||
| ||
|
We produced 214
Our formaldehyde, urea formaldehyde adhesive, methylal, and clean fuel products in 2016, including 1 new product in frozen food products. We also discontinued 25 products in 2016 in the convenience a foods products.business is carried out by our newly acquired VIE company, Jilin Chuangyuan.
5
Chestnut ProductsService
We have developed brand equity for our chestnut products in China, Japanprovide a demand-side platform which allows buyers of digital advertising inventory to manage multiple advertisement exchange and South Korea over the past 18 years. We produced 60 high value-added processed chestnut products in 2016. In 2016 and 2015, this segment contributed 57% and 53.6% of our total revenues, respectively.data exchange through one interface.
Our best selling products in 2016 includeddigital service is provided by our frozen chestnuts. The majority of our chestnut products are natural and do not contain chemical additives.newly acquired company, Fast Approach.
The chestnut, in contrast to many other tree nuts, contains small quantities of oil and is very high in complex carbohydrates. This makes them useful for a wider food range than other common nuts. Chestnuts are commonly steamed, boiled, sugar stir-fried, roasted or added into dishes or desserts as an ingredient.
We position our chestnut products as middle to high end products. We differentiate our chestnut products based on production process, high quality raw materials inputs, flavor, size and method of packaging. For instance, some of our chestnut products that are sold in Japan are packaged in plastic bags or tin cans, each considered a different product. Similarly, some of our chestnut products are processed with hot water or cold water, each considered a different product.
Chestnut season in China lasts from September to January. We purchase and produce raw chestnuts during these months and store them in our refrigerated storage facilities throughout the year. Once we obtain a purchase order during the rest of the year, we remove the chestnuts from storage, process them and ship them within one day of production.
Convenience Foods
Our convenience food products are characterized as follows:
| ||
|
These products are intended to meet the current demands of our customers for safe, wholesome and tasty foods that are easily prepared.
RTCs can be served after a few easy cooking procedures. Typically, when preparing a RTC, customers need only to heat the food in a microwave or boil it for several minutes before eating. Our best-selling RTCs in 2016 were French fries.
RTEs can be served without any cooking. Our best-selling RTEs in 2016 were various bean products and various fried vegetables.
We produced 92 convenience food products in 2016. In 2016 and 2015, this segment contributed 20.3% and 25.3%, respectively, of our total revenues.
Frozen Food Products
We produce a variety of frozen foods, mostly frozen vegetables and frozen fruits. We produced 62 frozen food products in 2016. Our best-selling frozen food products in 2016 was sweet corn products.
Our frozen food business allows us to mitigate the significant production seasonality of chestnut products and to increase the utilization rate of our production capacity. Through our sales network, we are seeking to further penetrate into domestic and overseas market for our frozen food segment as it may not only raise our spare production capacity without additional heavy capital investment, but also boost our brand equity as we are selected to be the provider for international fast food giants. The frozen foods accounted for in our total revenue increased from 21.0% in 2016 to 22.7% in 2015. Gross margins in this segment are lower than the margins for chestnut products and convenience foods.
6
Our Manufacturing Facilities
General
We currently manufacture our products in four facilities in China, two of which are located in Junan County, ShandongMeihekou City, Jilin Province, one in Luotian County,Jingshan City and Xianning City, Hubei Province, and one in Miyun County, Beijing. As described above, in 2016, we ceased operations in France, Dongguang and Shandong.China.
The following table indicates the year that operations commenced at each of the facilities and the size of the facilities.
| Year Operations Facility Size | ||||||
| Facility | Commenced | (square meters) | ||||
| Junan Hongrun | 2002 | 38,865 | ||||
| Beijing Lorain | 2003 | 21,000 | ||||
| Luotian Lorain | 2003 | 9,558 | ||||
| Shandong Greenpia | 2010 | 9,179 | ||||
| Facility | Year Operations Commenced | Facility Size (square meters) | ||||||
| Xianning Bozhuang * | 2013 | 33,333 | ||||||
| Jingshan Sanhe Luckysky ** | 2018 | 11,018 | ||||||
| Jilin Chuangyuan*** | 2013 | 59,690 | ||||||
| * | Became a VIE in May 2019. |
| ** | Became a VIE in January 2021 |
| *** | Became a VIE in March 2021. |
Production Lines
We currently manufacture our different products using 29 production lines. Except Chinese doughnuts production lines each production line is used to produce between 10 and 50 products. We currently run four types of product lines:operated through our subsidiaries.
| ||
| ||
| ||
|
The production process for our chestnutcyan brick tea products initially involves, primary processing of fresh leaves, piling and fermenting, storing and aging, picking, pressing, and baking. The production process for our black tea products involves selecting and sorting the fresh leaves, withering, rolling, fermenting, baking and cleaningdrying, grading according to color, prompting fragrance, packing and warehousing. The production process for our green tea products involves selecting and sorting the raw chestnuts purchased during the chestnut season. We then store the raw chestnuts in our refrigerated storage facilities throughout the year. Once we obtain a purchase order, we remove the chestnuts from storagefresh leaves, airing, fixating, cooling, rolling, stir drying, selecting and process them by steaming, decladdinggrading, prompting fragrance, packing and deep-freezing the chestnuts, depending on the particular product. We then package and ship the processed chestnuts within one day of production.warehousing.
The production process for our formaldehyde products is illustrated as follows. The raw material methanol, after being injected into the high position tank, enters the methanol evaporator through the filter, mixes with the air from the roots blower to form the binary mixture, and then adds steam to form the ternary mixture, which is heated by the superheater to 120 ℃ and enters the oxidizer, carries out oxidation and dehydrogenation reaction through the silver catalyst to form the formaldehyde gas, and then absorbs the formaldehyde solution through the first absorption tower and the second absorption tower. The excess waste gas is burned out by the exhaust gas boiler.
The production process for our methyl starting with the raw materials methanol and formaldehyde are pumped into the reaction distillation tower according to the proportion. At the bottom of the tower, formaldehyde and methanol are indirectly heated by steam. The reaction liquid vapor from the tower upwards through the catalyst reaction to produce methyl acetal, and then through the distillation tower separation, cooling, the final product methyl acetal.
The production process for our convenience products generally involvesurea-formaldehyde glue is demonstrated as follows. Formaldehyde is pumped from the formaldehyde workshop into the tank of formaldehyde storage, and then pumped into the metering tank through the feed pump of formaldehyde. After the PH value is adjusted by adding alkali, it is sent into the reaction kettle. At the same time, urea is also added into the kettle according to the corresponding proportion, heating the reaction kettle. After heating up the kettle, melamine is added, so that the material can undergo addition reaction in the kettle. After the PH value is adjusted by dropping formic acid in the kettle, the material is sent into the condensation kettle through the transfer pump. Urea and additives are added into the condensation kettle according to a certain proportion for condensation reaction, and the finished product is formed after cooling treatment.
The production process for our clean fuel oil is illustrated as follows. The self-control design of the facilities for storage of raw materials and addition of additives shall, in accordance with the requirements of the process, conduct centralized indication and adjustment of the temperature, flow rate and liquid level of the raw oil tanks, raw oil metering tanks, product oil allocation tanks and finished oil tanks during the fuel blending process; realize remote monitoring of the whole fuel production process, and conduct on-the-spot indication of pressure and partial flow rate.
The production process for our construction rubber powder (re-dispersible latex powder) is demonstrated as follows. Using polymer emulsion (VAE emulsion) as raw material, all kinds of additives are added, and then transported to the reaction kettle through diaphragm pump to warm up and mix evenly, and then transported to the mixing kettle with additives through diaphragm pump to mix evenly, then transported to the high-speed reactor through diaphragm pump to emulsify, emulsified and then transported to the spare material tank through the diaphragm pump, and then transported to the spray drying tower through the spare material tank through the diaphragm pump to form polymer powder after spray drying, and the polymer powder and various steps, including soaking, boiling, coating, drying, deep freezing, packing, sealingadditives are mixed and sterilizing.screened through the mixer to be packed into the warehouse.
The following table shows the number and types of production lines, the types of products produced and the production capacity at each facility:as of the date of this report:
| Production Lines | Capacity | |||||
| There are two production lines: the production line |
| Two production lines with | ||||
| Xianning Bozhuang | There are six production lines: the production line of cyan brick tea with traditional handicraft; the production line of cyan brick tea; the production line of teabag; the production line of green tea and the production line of black tea | Cyan brick tea, black tea and green tea | Production line with 5,020 tons of production capacity | |||
| Jilin Chuangyuan | The company has two formaldehyde production lines, | Formaldehyde, urea formaldehyde adhesive, methylal and clean fuel oil | Annual production capacity | |||
| ||||||
| ||||||
|
7
* Shandong Lorain relocated its convenience food product line, completed in December 2016, to Junan Hongrun due to the local government land seizures requirement.
We allocate our production lines based upon the location of our facilities to take advantage of efficiencies in the transportation of required raw materials. For example, Junan Hongrun and Shandong Lorain, which manufacture primarily chestnut and frozen products, are located in Shandong Province, which is China’s largest supplier of fresh products by volume. Shandong Province is also a major chestnut producing region.
Our production lines and facilities have all been designed to meet the standards and requirements of our largest customers in South Korea and Japan, with Japan being our top overseas markets in value term.
We employ advanced methods of quality control and have obtained various certifications for many of our products, packages and processes, including ISO 9000 or ISO 9001 certification for certain of our chestnut and frozen vegetable products, BRC certification for certain of our frozen fruit and vegetable products and HACCP certification for certain of our frozen vegetable, fruit and chestnut products and our bottom-open chestnuts. We believe that our quality controls and standards of products distinguish us from other manufacturers in both domestic and international markets.
With limited exception, we operate our production lines year round. In the past, when our production was focused almost exclusively on chestnuts, we experienced seasonal underutilization of our product lines. However, our current facilities have multiple-function designs allowing us to use our production lines for our convenience and frozen products when we are not producing chestnuts at full capacity. Consequently, as we have increased our processed and convenience food offerings over the last several years, we have generally been able to run our production lines at increasing efficiency.year-round.
We believe our facilities are adequate for our current levels of production. We anticipate, however, that we may require additional facilities and/or product lines as our business grows. We are exploring the possibility of alliances with one or more OEM partners for the production, in the short-term, of some of our convenience food products and frozen products should our facilities be inadequate to meet increasing demand. We are also exploring the possibility of leasing additional production lines to expand our production capacity. We did not lease any production facility during 2016. We may decide to lease additional facilities in 2017, should circumstances require and subject to acceptable costing. In the long-term, we plan to increase our own production capacity by acquiring or building new facilities, subject to the availability of adequate sources of funding.
Storage Capacity
Storage of our raw materials and inventory is a critical element of our business. Our raw materials and partially finished products need to be preserved in frozen storages (-18ºC to -20ºC) or constant temperature storages (-5ºC to 5ºC). Storage is particularly critical for our chestnut products because chestnuts are a seasonal fruit.
The following table illustrates on a facility by facility basis the type and capacity of our storage resources:
| Number of | Capacity | ||
| Facility | Storage Type | Storage Units | (metric tons) |
| Junan Hongrun | Frozen Storage | 19 | 20,100 |
| Constant Temperature | 11 | 5,300 | |
| Beijing Lorain | Frozen Storage | 6 | 2,850 |
| Constant Temperature | 3 | 1,800 | |
| Luotian Lorain | Frozen Storage | 8 | 4,500 |
| Constant Temperature | 4 | 2,000 | |
| Shandong Greenpia | Constant Temperature | 4 | 1,500 |
| TOTAL | 60 | 41,050 |
* Shandong Lorain move its convenience food product line, completed in December 2016, to Junan Hongrun due to the local government land seizures requirement.
All of the listed storage facilities are owned by us. We did not add to our storage capacity during 2016.
8
Agricultural Operations
We grow or set up agricultural co-ops with local farmers to supply ourselves with a small portion of chestnut, fruit and vegetable products. For the year ended December 31, 2016, the supplies coming from agricultural operations is still a low proportion of the total. We believe that we will continue to develop more agricultural facilities in the long-term. We anticipate that self-grown agricultural products and agricultural products grown in cooperation with local farmers will enable us to assure adequacy of supply, promote quality and reduce cost, particularly for our high margin offerings. For example, by growing Korean cultivar chestnuts domestically, we expect to significantly reduce our supply costs for this premium product, while ensuring superior quality.
Lands in which we grow our agricultural products for such products are shown in the following table.
We began growing chestnuts in Shandong Province in 2003. Unlike most vegetables and fruits, chestnut trees have a 3-5 year growing phase before they can be harvested. Our current chestnut planting base has been self-supplying limited quantities of chestnuts to our production since 2007. In the end of 2016, we leased two woods in Junan County Shandong Province, China to plant more chestnuts trees, which we expect will expand the production of our self-supplied chestnuts in a near future. However, there is no guarantee that we will be successful in that regard.
We began growing strawberries in 2008 in Shandong and peaches, apricots, pears and blackberries in 2009 in Beijing. We use these fruits in some of our frozen fruit products.
We plan to continue to expand our agricultural operations over the next a few years. Among other things, we plan to increase our self-production in China of Korean cultivar chestnuts. We expect to obtain funding for this expansion through a combination of commercial and government loans, including loans under Chinese government programs to promote agricultural industrialization. There is no assurance, however, that adequate funding for these purposes will be available to us.
Raw Materials
In 2015 and 2016, approximately 78% and 85% of our procured raw materials, respectively, consisted of agricultural products, including primarily chestnuts and vegetables, approximately 7% and 6%, respectively, consisted of packaging materials and approximately 15% and 9% consisted of condiments such as sugar, salt and flour.
Our Supply Sources
Our business depends on obtaining a reliable supply of various agricultural products, including chestnuts, vegetables, red meat, fish, eggs, ricetea, refined methanol, methanol, formaldehyde and flour.polymer emulsion. Because of the diversity of available sources of these raw materials, we believe that our raw materials are currently in adequate supply and will continue to be so in the future.supply.
9
We
For our tea operation, we obtain our agricultural raw materials from three sources: domestic procurement (excluding self-supply), overseas markets, and self-supply. Domestic and overseas procurement accounted for 91% and 6.8%, respectively, of our total raw material costs in 2016, while self-supply accounted for 2.2% . We obtained substantially all of our agricultural raw materialsprimarily from domestic sources during 2016.
In 2016 and 2015, respectively, we procuredprocurement. We purchase approximately 31,892 and 44,383 metric400 tons of chestnutstea from suppliers in 2020. For our business lines of ethanol fuel and fuel additive, we purchased approximately 32,487 and 53,106 metric710 tons of vegetablesadditive material from suppliers in 2020. For our business lines of formaldehyde, rubber and other raw materials from a number of third party suppliers, domestic and overseas, and producedmethylal products, we purchased approximately 438 and 568 metric18,547 tons of chestnutsmethanol and other products146 tons of urea from our own agricultural operations.suppliers in 2020.
We select suppliers based on price and product quality. We typically rely on numerous domestic and international suppliers, including some with whom we have a long-term relationship. Our top 10 suppliers accounted for 13.4% and 13.6% of the total procurement in 2015 and 2016 in value terms respectively. We purchase from suppliers and farmers pursuant to supply contracts and underlying purchase orders. We have not entered into any long-term contracts with any of our suppliers.
Our suppliers generally include wholesale agricultural product companies, agricultural associationsfood production companies, tea bag processing companies and distributors. Some raw materials must be imported at higher costs, however. Occasionally, we also work directly with farmers. For instance, we operate an initiative which involves a series of cooperation and lease agreements between Shandong Lorain, Beijing Lorain and local farmers. This initiative involves approximately 1,000 acres of land which is used primarily to produce Japanese and Korean style chestnuts, sticky corn and pumpkins for our operations.chemical products wholesale companies.
Procurement Cost and Quality Control
To control procurement costs, we have built our facilities near domestic sources of agricultural raw materials. For example, Junan Hongrun and Shandong Lorain are located in Shandong Province, which is China’s largest supplier of fresh products by volume. Shandong Province is also a major chestnut producing region. Local procurement reduces our costs, especially transportation costs. It also gives us first-hand harvest and market information, which provides us with an advantage in price negotiations with suppliers.
Some raw materials must be imported at higher cost. As discussed, we have begun to develop our agricultural capabilities in order to control costs, particularly with respect to imported raw materials such as Korean-style chestnuts.
Pricing for agricultural products reflects several external factors, such as weather conditions and commodity market fluctuations, which are beyond our control. We obtain contemporaneous information on local harvests and collect daily reported price information on harvests in other markets from which we procure our products. We also attempt to predict harvest yields in advance based on our information gathering. We use this harvest information to negotiate best pricing with our suppliers.
We impose strict standards on our suppliers. During the harvest season, our internal procurement function personnel may visit our sources of supply to assure that the products we are purchasing comply with our standards.
Our Customers
Our tea and chemical products are sold exclusively in Chinese domestic markets as well as exported to foreign countries and regions such as Japan and South Korea. In 2015 and 2016, approximately 80.1% and 82.1%, respectively of our sales were made domestically in China and approximately 19.9% and 17.9% were to international customers, primarily Japan and South Korea. Our top ten customers contributed 12.3% and 12.1% of our total revenues in 2015 and 2016 respectively.markets.
Domestic
In China, we sell our products through our own sales team and through third-party distributors. We have 26 sales offices in 31 provinces in China. In 2015 and 2016, we sold approximately 60.0% and 72.6%, respectively, of our products directly to our Chinese and overseas customers and approximately 40.0% and 27.4% through third-party distributors. In view of a significant decline in our sales volume in 2016, we decided to cut spending. By comparison, the performance of our third-party distributors is far from expected, and our direct-selling business is the main source of revenue. In addition, due to the low demand of the market, the third-party distributors need less the products, which result that our relationship not as close as the previous years, leading to the increase of bad debts. Therefore, we decided to reduce the proportion of third-party distributors and enhance our own sales team.
10
We sell our products in all first-tier cities in China, including Beijing, Shanghai, Tianjin and Guangzhou. Our sales team sells our products directly to supermarket chains, mass merchandisers, large wholesalers and others in these markets. In second-tier and third-tier cities, we currently sell ourtea products to third-party distributors, such as food companies or trading companies with established distribution channels in such regions, rather than through our own sales team, in order to enable us to penetrate such markets more quickly without spending significant capital. We also sell to small customers through independent sales representatives.
channels. The terms of a typical sales contract between us and our distributors provide that we are responsible for transportation costs and the distributors are responsible for storage costs. Furthermore, the distributors have the right to return products that fail to satisfy specified quality standards, at our cost. The majority of such contracts require the distributors to pay us in cash in full upon delivery, and the remaining contracts provide for short-term credit, usually two to three weeks. In addition,
As to our formaldehyde products, vehicles gasoline and diesel products, we typically offer distributors performance-based incentives, such asare a cash bonus equal to 1% to 1.5%leading regional chemical products provider in north eastern China area, and we are the sole provider of total revenues generated by such distributor which exceed previously established sales targets.
International
Our export sales destinations include:
| ||
| ||
| ||
|
Outside China, salesformaldehyde in Europe decreased by 95.4% in 2016 as a result of a bad sales performance in France and Portugal and the shutdown of Athena Group. Sales in Asia countries also decreased by 19.2% due to weak demand in Asia countries.
Jilin Province, China. We sell oursuch products to international markets primarilyend user directly and through exportlocal distributors.
When it comes to the sales of synthetic fuel products, we do business through direct sales, constructing refuel facilities and tradingconducting technical cooperation with other companies.
For our DSP business line, we obtain clients through advertising agents and companies in China, as well as our own sales team located infrom China and Japan. Our sales team sells directly to wholesalers, food processors and mass merchandisers. Many of our customers are well known in their local food market. We have established long-term relationships with many international customers, especially in Japan and South Korea.Canada.
Our Sales and Marketing Efforts
We seek to expand our customer base by:
| ||
| ||
| ||
|
We have not spent a significant amount of capital on advertising in the past, and our advertising budget continues to be limited. In 20162020, our marketing and branding efforts included supermarket advertising andmainly focus on internet advertising.
We intend to increase our advertising and branding efforts given the consumer nature for many of our products. For the near future, our marketing efforts will continue to focus primarily on the domestic Chinese, Japan and South Korea markets for our chestnut and convenience food products.
Competition and Market Position
The overall food market is diverse, both globally and in China. We do not have a significant market share in anyChina.
Black tea is produced in Guangxi, Sichuan, Yunnan, Hunan, Hubei, Shanxi and Anhui provinces in China. Our black tea products are processed in our factory in Hubei province and distributed nationwide. There are few large players on the market but we face fierce competition from numerous small black tea manufactures and distributors. However, as our brand has over hundreds of year’s history, we have accumulated loyal consumers and gained favorable market reputation over years.
Competitive factors in our business segments.industry include product innovation, product quality, price, brand recognition and loyalty, product variety and ingredients, product packaging and package design, effectiveness of marketing and promotional activity, and our ability to identify and satisfy consumer tastes and preferences.
Chestnut Products
Since its inception, the company has developed rapidly relying on advanced enterprise management and safe, effective, exclusive patented products and strong marketing strength. The production scale of formaldehyde is ranking top three among provinces in northeast China. The production scale of urea-formaldehyde glue attains the first place in China. Our enterprise comprehensive strength is considered first tier among all companies in northeast China.
We sell clean fuel and fuel additive in local reginal market. We compete in the chestnut market primarily on the basis of the uniqueness of our products, quality, pricewith other reginal players and brand recognition. We also utilize our proprietary, patented and patent-pending technology in the production of our chestnut products to our competitive advantage.national players.
11
The world market for chestnut products is highly fragmented. Our principal competitors in the chestnut product market are currently Hebei Liyuan, a Chinese company, and Foodwell Corporation, a South Korean company and Concept Fruit, a European company.
Convenience Food Products
The market competition for convenience food products is based mostly upon quality and product variety. We attempt to use our modern food processing technology, such as nitrogen preservation, to produce a wide variety of high quality convenience foods.
The convenience food market in China is highly fragmented and we do not face competitive pressure from any particular competitor or small group of competitors.
Frozen Food Products
In the frozen food product market, competition is based primarily upon quality, ability to provide a reliable product supply and customer relationships.
Our strongest competitors in the frozen food products market are currently Beijing Liliangzi Food Co. Ltd., Hangzhou Dadi Food Co. Ltd. and Tianjin Jinkaili Food Co. Ltd., all of which are located in China.
Competitive Advantages
We believe that we enjoy a number of competitive advantages, both domestically and internationally.
We have developed brand equity for our chestnut products in China, Japan and South Korea over the past 18 years. Our customers are willing to pay a premium for some of our chestnut products because of our brand equity. In addition, we believe that we have a strong distribution channel for our products in the markets in which we currently operate.
We believe that we are able to provide our customers with greater selection and a more reliable supply than many of our competitors, which is especially important for our supermarket chain and large wholesaler customers. We produced 60 chestnut products in 2016. We believe that we are the only provider of certain bottom-open chestnut and sweetheart chestnut products in China.
Labor is a large portion of total operating costs for food companies. We believe that we have a lower labor cost structure and a more abundant labor supply than many of our international competitors.
We are focused on managing our costs in other ways as well. We seek to locate our production facilities in close proximity to our main domestic sources of raw material supply to reduce transportation costs and give us first-hand knowledge of market factors affecting our cost of raw material supply. Our agricultural self-supply program, while modest at present, is expected to grow and to become a significant element of our cost containment efforts.
We use modern food processing technology and innovation in our formulation and manufacturing processes to create high quality products. Nitrogen preservation in particular, used in the production of convenience foods, is an innovative technology which has not been widely applied in China.
We are dedicated to innovation of our products. From 2012 to 2016, we were successfully granted 4 new patents. We applied for three patents to State Intellectual Property Office of the PRC during 2015. In addition, As of December 31, 2016, we possessed 16 patents for utility models and 15 patents for appearance design. See “Intellectual Property” below. We believe that our technology gives us an advantage over our Chinese and international competitors, allowing us to produce chestnut and convenience food products that are superior in quality and to offer more product varieties.
We believe that our reputation for quality contributes to our competitiveness. We maintain high food safety standards, in order to satisfy both domestic and international requirements. We also regularly conduct tests for quality of our products and compliance with standards.
12
Intellectual Property
TrademarksWe have registered in the PRC the trademark![]() which we use on all of our products sold in China.
which we use on all of our products sold in China.
Patents
We were granted two patents by
The company vigorously implements scientific and technological innovation and obtains 12 practical patent certificates from the State Intellectual Property Office of the PRC during 2012, includingPRC. These patents are registered under Jingshan Sanhe Luckysky, which includes a diesel exhaust cleaner and its preparation method, a kind of automobile exhaust cleaner and preparation method, a kind of filtering device for exhaust port of cleaning liquid production plant, a kind of automobile cleaner dispensing device, a kind of liquid dispensing equipment, a kind of mixing and stirring tank, a kind of cleaning brush for cleaning agent storage tank, a kind of reactor for producing auto cleaner, a kind of cleaning brush for cleaning agent mixing kettle, a kind of mixing tank, a cleaning tool for cleaning the preparationreactor for detergent production and a kind of aerated snack beansmixing and frozen bottom open chestnuts. One patent for preparationdefoaming tank. The company will give full play to the advantages of liquor preserved fishindependent intellectual property rights, continue to innovate, maintain the leading technology and soup was approved in 2013. In 2014, our patent application during 2012 forenhance the preservation, storage and processing procedures for chestnuts was approved. We made application for three patents to State Intellectual Property Officecore competitiveness of the PRC during 2015.company.
In addition to the above-mentioned patents, we also possess 16 patents for utility models and 15 patents for appearance design.
We take reasonable steps to protect our proprietary information and trade secrets, such as limiting disclosure of proprietary plans, methods and other similar information on a need-to-know basis and requiring employees with access to our proprietary technology to enter into confidentiality arrangements. We believe that our proprietary technology and trade secrets are adequately protected.
Our Employees
As of December 31, 2016,2020, we had a total of 1,425148 employees. Approximately 1,075148 of our full-time employees are directly employed by our subsidiary companiessubsidiaries and the remaining employees are employed by outsourcing agents that we use to meet our staffing needs.VIEs. Compared to 2015,2019, the total employees decreased by 54.8%36% due to our significant production capacity decliningdisposal of Taishan Muren, Shanzhen Lorain and bad operating performance. Allacquisition of the departments were hit as a result of huge loss, especially the production department and domestic sales department, because (a) all the part-time employees belong to production department. Since our revenue from main business decreased significantly, we dismissed almost all of part-time workers, approximately 1,500 workers in 2016. (b) we shut down 12 sales offices in 2016 to reduce the personnel and administrative expenses. As required by Chinese law, all employees are party to a written employment contract. We compensate the employees outsourced from agents directly and pay agents a service fee. Agents are responsible for the pension and social insurance benefits of the leased employees, as described below.Fast Approach.
The following table sets forth the allocation of employees both direct and leased, by job function.
| Number of | ||||
| Department | Employees | |||
| Production | ||||
| Human Resources | 3 | |||
| Research and Development | 19 | |||
| 35 | ||||
| Finance | 9 | |||
| Procurement | 4 | |||
| Administration | ||||
| 36 | ||||
| Total | 148 | |||
We believe that the relationship between management and our employees is good.
We have not experienced any significant problems or disruption to our operations due to labor disputes, nor have we experienced any difficulties in recruitment and retention of experienced staff.
Our Shandong Lorain subsidiary has an employee relations department for the purpose of advancing employee welfare, encouraging employee participation in decision making and enhancing relations among employees and between employees and our management team.
We compensate our production line employees by unit produced (piece work) and compensate other employees with a base salary and bonus based on performance. We also provide training for our staffs from time to time to enhance their technical and product knowledge, including knowledge of industry quality standards.
13
Our employees participate in state pension scheme and various types of social insurance organized by municipal and provincial governments. Outsourcing agents are responsible for contributions on behalf of the leased employees.
Our Research and Development Activities
Our research and development efforts are focused on three objectives:
| ||
| ||
|
We have research and development staffs at each of our facilities. In total, 3219 employees are dedicated to research and development.development for different business lines.
Jingshan Sanhe Luckysky contains a professional laboratory which includes 17 sets of professional experimental equipment operated by 6 high-end scientific research experts to ensure the high quality of raw materials and products.
Jilin Chuanyuan was jointly awarded by Jilin Provincial Department of education and Jilin Provincial Department of industry and information technology as Jilin University enterprise joint technology innovation laboratory. The company currently carries out a project of transformation of scientific and technological achievements with Beihua University. Specifically, it is a kind of urea formaldehyde resin adhesive with ultra-low formaldehyde emission and its preparation process, ZL 201510055885x. At the same time, as a participant, the project is applying for the national science and technology progress award. Beihua University has set up a teaching and research practice base in our company. On top of that, the company also successfully developed the urea formaldehyde resin for E1 grade waterproof particleboard, E0 grade and F grade particleboard, as well as the UF resin for E0 grade and F grade particleboard with UFC.
We rely heavily on customer feedback to assist us in the modification and development of our products. We also utilize customer feedback to assist us in the development of new products. In 2016, we added 1 new product in our frozen foods segments.
The amount we spent on research and development activities during the years ended December 31, 20162020 and 20152019 was not a material portion of our total expenses for those years.
Government Regulation
As a manufacturercompany that continuously strives to create new value. We have been doing business in three areas: tea product cultivation, packaging, and distributorsales; manufacturing and sales of foodsynthetic fuel products, we areformaldehyde products, vehicles gasoline and diesel products in Chinese market and providing on-line advertising services in Canada and China.
Our tea product cultivation, packaging, and sales business is subject to regulations of China’s Agricultural Ministry and Ministry of Health. This regulatory scheme governs the manufacture (including composition and ingredients), labeling, packaging and safety of food. It also regulates manufacturing practices, including quality assurance programs, for foods through its current manufacturing practice regulations, and specifies the standards of identity for certain foods.
We have obtained approvals from Chinese authorities for products that requires the approval under regulations, including chestnuts, frozen vegetables and fruits, fish, and canned products. Production of new products that do not fall into categories of products would require separatequality safety approval from the appropriate Chinese authorities.government.
Our manufacturing and sales of chemical products business is subject to multiple regulations under PRC law. We have consistently obtained such approvals for our newly developed products incomplete certificates, including the pastwork safety license, production license and do not anticipate any difficulties in obtaining new approvals in the future if needed.
In addition, we are required to obtain governmental approval, and to register with the State Administration for Industry and Commerce, in order to open a new facility in China.emission license. We have consistently obtained such approvals,passed the environmental assessment acceptance and made such registrations, for our new facilitiescurrently works on the promotion to the second level of work safety standardization from the third level. Our operation meets the requirements of relevant national laws, regulations, standards and specifications, as well as other the requirements of national management departments at all levels.
Our online advertising business line is operated in the past and do not anticipate any difficulties in filing new registrations and obtaining new approvals in the future if needed.
Under the relevant PRC sanitation laws governing food export, unless an exporter’s products are exempted from inspection, products must be inspected in accordance with the Law of the PRC on Import and Export Commodity Inspection. We have not been exempted from inspection. In the past, we were authorized by the relevant authorities to conduct self-inspection of certain of our export products. However, currently, the relevant authorities have imposed tighter food safety control in China, and as a result, all of our exported food products must be inspected by relevant government agencies. We believe that all of our exported products are currently in compliance with such requirementsCanada and we do not anticipate any difficultiesmeet the requirement of related regulations in complying with such rules in the future.Canada.
In addition, we are required to obtain a license from the local branch of the Entry-Exit Inspection and Quarantine Bureau of China for our exported products. We have consistently obtained such licenses in the past and we do not anticipate any difficulties in obtaining such licenses in the future.
RISK FACTORS
Business Risks
We may be forced to delisting from NYSE Exchange if we are failure to satisfy a continued listing rule or standard.
On April 18, 2017, we received a letter from NYSE MKT LLC (the “Exchange”) stating that the Exchange has determined that we are not in compliance with Sections 134 and 1101 of the NYSE MKT Company Guide (the “Company Guide”) due to we are failure to timely file with the SEC its Annual Report on Form 10-KNot required for the year ended December 31, 2016. The letter also states that the failure to timely file its Annual Report on Form 10-K is a material violation of its listing agreement with the Exchange and, therefore, pursuant to Section 1003(d) of the Company Guide, the Exchange is authorized to suspend and, unless prompt corrective action is taken, remove the Company’s securities from the Exchange. The Exchange has informed us that, in order to maintain its listing on the Exchange, we must, by May 18, 2017, submit a plan of compliance (the “Plan”) advising the Exchange of actions it has taken or will take to regain compliance with Sections 134 and 1101 of the Company Guide by October 18, 2017 (the “Plan Period”). The Plan was submitted and accepted by the Exchange, allowing us to be able to continue listing during the Plan Period. However, based on recent discussions with the Exchange, the Exchange staff may initiate delisting proceedings. Because we have not filed all of our required SEC reports as of the close of the Plan Period, among other concerns.
14
Our operating results may have been material adverse effected during the year ended December 31, 2015 due to the restatement of prior financial statements
We have discovered errors in the timing of revenues recognized during the year ended December 31, 2015. We recognize revenue upon shipping of products to its customers where title of the goods passes upon departure from our facilities; however, in certain instances, contractual terms dictate that the customers are afforded seven days after the receipt of goods at their premises to inspect the goods for defects or spoilage and notify us. If we are not contacted within those seven days, our obligation to the customer are considered fully discharged and revenue should be recognized. Given the timing of these seven days, we believe that certain sales transactions have been erroneously recognized during the year ended December 31, 2015. We have rectified this error and the impact of our financial position and result of operations during the year ended December 31, 2015, which may result in material adverse effect.
We lack the ability to sustain our operations if our cash flow continues to decline and cannot be replenished through financing
Our financial statements have been prepared on a going-concern basis. The going-concern basis assumes that assets will be realized and liabilities will be settled in the ordinary course of business in the amounts disclosed in the financial statements. Our ability to continue as a going concern is greatly dependent on our ability to realize its non-cash current assets such as receivables and inventory into cash in order to settle its current obligations. For the year ended December 31, 2016, we incurred a substantial loss of $136,361,080. As of December 31, 2016, we had a working capital deficit of approximately $21,271,226. These conditions raise substantial doubt as to whether we may continue as a going concern. To improve our solvency, we are working to obtain new working capital through private placements of our common stock or convertible debt securities to qualified investors. But we cannot assure the financing succeed.
We may not be able to obtain an adequate supply of high quality raw materials.
Our business depends on obtaining a reliable supply of various agricultural products, including chestnuts, vegetables, fruits, red meat, fish, eggs, rice, flour and packaging products. During 2016, the cost of our raw materials decreased from $143,226,607 to $85,249,363, a decrease of approximately 40.48% . We may have to increase the number of our suppliers of raw materials and expand our own agricultural operations in the future to meet growing production demands. Despite our efforts to control our supply of raw materials and maintain good relationships with our suppliers, we could lose one or more of our suppliers at any time. The loss of several suppliers may be difficult to replace and could increase our reliance on higher cost or lower quality suppliers, which could negatively affect our profitability. In addition, if we have to increase the number of our suppliers of raw materials in the future to meet growing production demands, we may not be able to locate new suppliers who could provide us with sufficient materials to meet our needs. Any interruptions to, or decline in, the amount or quality of our raw materials supply could materially disrupt our production and adversely affect our business and financial condition and financial prospects.
The prices that we have paid for our raw materials recently have experienced significant fluctuation. If these price fluctuations continue, our profit margins may be materially adversely affected.
The average price that we paid for chestnuts in China in 2015 and 2016 was approximately $1,600 per metric ton and $1,765 per metric ton, respectively, excluding value added taxes. We do not currently hedge against changes in our raw material prices. Consequently, if the costs of our raw materials increase further, and we are unable to offset these increases by raising the prices of our products, our profit margins and financial condition could be adversely affected.
Price inflation in China could affect our results of operation if we are unable to pass along raw material price increases to our customers.
Inflation in China has been consistently increasing in recent years. Because we purchase raw materials from suppliers in China, price inflation directly causes an increase in the cost of our raw materials. Price inflation could affect our results of operation if we are unable to pass along raw material price increases to customers. In addition, if inflationary trends continue in China, China could lose its competitive advantage as a low-cost manufacturing venue, which could in turn lessen some of the competitive advantages of our being based in China. Accordingly, inflation in China may weaken our competitiveness domestically or in international markets.
Our sales and reputation may be affected by product liability claims, litigation or, product recalls in relation to our products.
The sale of products for human consumption involves an inherent risk of injury to consumers. We face risks associated with product liability claims, litigation, or product recalls, if our products cause injury or become adulterated or misbranded. Our products are subject to product tampering and contamination, such as mold, bacteria, insects, shell fragments and off-flavor contamination, during any of the procurement, production, transportation and storage processes. If any of our products were to be tampered with, or become tainted in any of these respects, and we were unable to detect this, our products could be subject to product liability claims or product recalls. Our ability to sell products could be reduced if certain pesticides, herbicides or other chemicals used by growers have left harmful residues on portions of our raw materials or if our raw materials have been contaminated by other agents.
15
We have never had any major product recall in the past but we have experienced product liability claims that were made by our customers. The amounts of such claims were immaterial. However, claims of product defect or product liability for material amounts, individually or in the aggregate, may be made in the future.
We have not procured a product liability or general liability insurance policy for our business, as the insurance industry in China is still in an early stage of development. To the extent that we suffer a loss of a type which would normally be covered by product liability or general liability insurance in the United States, we would incur significant expenses in defending any action against us and in paying any claims that result from a settlement or judgment against us. Product liability claims and product recalls could have a material adverse effect on the demand for our products and on our business goodwill and reputation. Adverse publicity could result in a loss of consumer confidence in our products.
Our expansion strategy may not prove successful and could adversely affect our existing business.
Our growth strategy includes the expansion of our manufacturing operations, including new production lines and agricultural operations. We plan to expand our sales in China and internationally. We will need to engage in various forms of promotional and marketing activities in order to further develop the branding of our products and to increase our market share in new and existing markets. The implementation of this strategy may involve large transactions and present financial, managerial and operational challenges. We could also experience financial or other setbacks if any of our growth strategies incur problems of which we are not presently aware. If we fail to generate sufficient sales in new markets or increase our sales in existing markets, we may not be able to recover the production, distribution, promotional and marketing expenses, as well as administrative costs we have incurred in developing such markets.
Our results of operations could be affected by natural events in the locations in which our customers operate.
Several of our customers have operations in locations that are subject to natural disasters, such as severe weather and geological events, which could disrupt the operations of those customers and suppliers as well as our operations. If our customers suffer from these events, their operations may be negatively impacted. As a result, some or all of those customers may reduce their orders for our products, which could adversely affect our revenue and results of operations.
The acquisition of other businesses could pose risks to our profitability.
We may try to grow through acquisitions in the future. Any proposed acquisition could result in accounting charges, potentially dilutive issuances of equity securities, and increased debt and contingent liabilities, any of which could have a material adverse effect on our existing business and the market price of our common stock. Acquisitions, in general, entail many risks, including risks relating to the failed integration of the acquired operations, diversion of management’s attention, and the potential loss of key employees of the acquired organizations. We may be unable to successfully integrate businesses or the personnel of any business that might be acquired in the future, and our failure to do so could have a material adverse effect on our business and on the market price of our common stock.
A significant amount of our revenues is dependent on a limited number of customers and the loss of any one of our major customers could materially and adversely affect our growth and our revenues.
A significant portion of our revenues has historically been derived from a limited number of customers, particularly in our chestnut products segment. Sales to our ten largest customers accounted for approximately 12.3% and 12.1% of our total revenues in 2015 and 2016, respectively. The loss of any one of these customers, or a material decrease in purchases by any one of these customers, could adversely impact our revenues.
We rely primarily on distributors to sell our products. Any delays in delivery or poor handling by our distributors or third-party transport operators may affect our sales and damage our reputation.
In 2016, we sold our products through over 130 distribution service providers. The services provided could be suspended and could cause interruption to the supply of our products to domestic or overseas customers. Delivery disruptions may occur for various reasons beyond our control, including poor handling by service providers or third party transport operators, transportation bottlenecks, natural disasters and labor strikes, and could lead to delayed, damaged or lost deliveries. If our products are not delivered in a timely manner, our reputation could be harmed. If our products are damaged in the process of being delivered, we may be liable to pay for such damages incurred.
16
Failure of the market to accept our new products, or failure to obtain regulatory approval for our new products, may cause us to lose our competitive position in the food industry.
We introduced 7 new products in 2012, 6 new products in 2013, 3 new products in 2014, 6 new products in 2015 and 1 new product in 2016. We plan to introduce approximately 5 new products in 2017. The success of the new products we introduce depends on our ability to anticipate the tastes and dietary habits of consumers and to offer products that appeal to their preferences. We intend to introduce new products as well as alternative flavors, sizes and packaging for our existing products. We may not be able to gain market acceptance for our new products. Consumer preferences change, and any new products that we introduce may fail to meet the particular tastes or requirements of consumers, or may be unable to replace their existing preferences. Our failure to anticipate, identify or react to these particular tastes or changes could result in reduced demand for our products, which could in turn cause us to be unable to recover our development, production and marketing costs.
We are dependent on certain key personnel and loss of these key personnel could have a material adverse effect on our research and development, operations and revenue.
The Lorain Group Companies were founded in 1994 by Si Chen, our chairman and chief executive officer. Mr. Chen, together with other senior management, has been a key driver of our strategy and has been fundamental to our achievements to date. The successful management of our business is, to a considerable extent, dependent on the services of Mr. Chen and other senior management. We compete for qualified personnel with other food processing companies, food retailers and research institutions. Consequently, we may either lose key employees to our competitors or we may need to significantly increase the compensation of such employees in order to retain them. The loss of the services of any key management employee or failure to recruit a suitable or comparable replacement could have a significant impact upon our ability to manage our business effectively, and our business and future growth may be adversely affected.
We face increasing competition from domestic and foreign companies.
The food industry in China is fragmented. Our ability to compete against other national and international enterprises is, to a significant extent, dependent on our ability to distinguish our products from those of our competitors by providing large volumes of high quality products that appeal to consumers’ tastes and preferences at reasonable prices. Some of our competitors have been in business longer than we have and are more established. Our competitors may provide products comparable or superior to those we provide or adapt more quickly than we do to evolving industry trends or changing market requirements. Increased competition may result in price reductions, higher raw materials prices, reduced margins and loss of market share, any of which could materially adversely affect our profit margins.
An increase in the cost of energy could affect our profitability.
Although energy costs were stable in 2016, we might experience significant increases in energy costs in the future, which would result in higher distribution, freight and other operating costs. Our future operating expenses and margins will be dependent on our ability to manage the impact of cost increases.
Our products are subject to counterfeiting or imitation, which could impact our reputation.
To date, we have experienced limited counterfeiting and imitation of our products. However, counterfeiting or imitation of our products may occur in the future and we may not be able to detect it and deal with it effectively. Any occurrence of counterfeiting or imitation could impact negatively upon our reputation, particularly if the counterfeit or imitation products cause sickness, or injury to consumers. In addition, counterfeit or imitation products could result in our need to incur costs with respect to the detection or prosecution of such activities.
We may face challenges in expanding our cross-border operations
As we continue expanding our existing cross-border operations into existing and other markets, we will face risks associated with expanding into markets in which we have limited or no experience. The expansion of our cross-border business will also expose us to risks relating to staffing and managing cross-border operations, tariffs and other trade barriers, differing and potentially adverse tax consequences, increased and conflicting regulatory compliance requirements and policies, lack of acceptance of our products, challenges caused by distance, language and cultural differences, exchange rate risk and political instability. Accordingly, any efforts we make to expand our cross-border operations may not be successful, which could limit our ability to grow our revenue, net income and profitability.
17
We may have liquidity risk in relating to the decrease of cash flow and the bad debt loss.
We have a markedly decrease on our revenue from sales in 2016. At December 31, 2016 and 2015, cash and cash equivalents (including restricted cash) were $1.4 million and $25.5 million, respectively. The decrease of cash and cash equivalents (including restricted cash) are by $18.7 million, or by 36.5% due to the bad debt loss. If we cannot increase the quantity of our products sales, we may not be available to manage cash flow.
We may no longer be able to compete in Europe and have suffered significant losses in China.
We terminated the French operation due to its operational loss. We suffered from the investigation with respect to the origin of canned chestnuts sold by Conserverie Minerve (“Minerve”, a former subsidiary of Athena) issued Centre Technique Conservation of Produits Agricoles (“CTCPA”), an industry trade association for canned, preserved and dehydrated food products in France. CTCPA stated that only chestnuts based on the European or Japanese cultivars can be used in canned chestnut products sold in France according to CTCPA policies and that canned chestnut products must also have received certification from the International Featured Standards (“IFS”), a qualified third party certification agency in Europe that certifies food products, especially for retail industry. Although, a proceeding from local court provided Minerve (now Athena) protection from creditors initiating any actions against Athena until March 2016, Athena still cost a lot to recycle market products, seal the finished products, and thousands of tons of chestnuts during 2016.
Since the sales of revenue from Chinese market decreased by 46.05% in 2016 and we may lose our Europe market due to the termination of our French company, our competition advantage has been greatly weakened.
Chinese chestnut sales declined due to natural hazard and fierce market competition.
Chinese Domestic sales of chestnuts has decreased due to competition from the market and the raw material expense increased. In 2016, Luotian, Hubei, our main chestnuts supply area, has been hit by flooding, cutting chestnuts production by about 50% and the purchase price increased by 20% to 30%. As in previous years, the annual chestnuts output was 40,000 tons in Luotian, accounted for 8% of the Chinese chestnut production. About 50% chestnuts in Luotian supplied to Luotian market to further processing, and about 20% of which supplied to Wuhan market. But, due to the rise in price in 2016, less than 20% will be supplied to Luotian market. However, other main chestnuts producing area in China were harvest in China which result in a much lower price compared with that in Luotian. Our chestnuts purchased in Luotian much increased by 20% and the sales revenue in Luotian Lorain was deceased by 44.9 % in 2016.
Regulatory Risks
We are subject to extensive regulations by the Chinese government.
The food industry is subject to extensive regulations by Chinese government agencies. Among other things, these regulations govern the manufacturing, importation, processing, packaging, storage, exportation, distribution and labeling of our products. New or amended statutes and regulations, increased production at our existing facilities, and our expansion into new operations and jurisdictions may require us to obtain new licenses and permits and could require us to change our methods of operations at costs that could be substantial.
Our failure to comply with PRC environmental laws may require us to incur significant costs.
We carry on our business in an industry that is subject to PRC environmental protection laws and regulations. These laws and regulations require enterprises engaged in manufacturing and construction that may cause environmental waste to adopt effective measures to control such waste. In addition, such enterprises are required to pay fines, or to cease operations entirely under extreme circumstances, should they discharge waste substances. The Chinese government may also change the existing laws or regulations or impose additional or stricter laws or regulations, compliance with which may cause us to incur significant capital expenditures, which we may be unable to pass on to our customers through higher prices for our products.
Our failure to comply with PRC hygiene laws may require us to incur significant costs.
Manufacturers in the Chinese food industry are subject to compliance with PRC food hygiene laws and regulations. These food hygiene laws require all enterprises engaged in the production of chestnuts and various vegetables and fruits to obtain a hygiene license for each of their production facilities. Such laws also require manufacturers to comply with regulations with respect to food, food additives, packaging, and food production sites, facilities and equipment. Failure to comply with PRC food hygiene laws may result in fines, suspension of operations, loss of hygiene licenses and, in more extreme cases, criminal proceedings against an enterprise and its management. The Chinese government may also change the existing laws or regulations or impose additional or stricter laws or regulations, compliance with which may cause us to incur significant capital expenditures, which we may be unable to pass on to our customers through higher prices for our products.
18
Chinese government forcing relocation may require us to incur significant costs.
Shandong Lorain was demanded to move its production lines to the factory of Junan Hongrun according to a new city zoning plan where Shandong Lorain resident, so that the land can be used for other urban use. Shandong Lorain has started this relocation process in July 2016 and finished this process in December,2016. During the relocation process, we were not allowed to produce our products with full capacity. As a result, the revenue from sales of chestnuts food products was $ 30.4 million and $54.3 million in 2016 and in 2015, respectively, decreasing by approximately 44%.
We cannot predict when the compensation for relocation will be received and whether the amount of compensation for land requisition can make up for our loss during the relocation period. If we cannot receive sufficient compensation next year, the relocation will cost us a significant loss.
Financial Risks
Our operations are cash intensive, and our business could be adversely affected if we fail to maintain sufficient levels of working capital.
We spend a significant amount of cash on our operations, principally to procure raw materials for our products. Many of our suppliers, including chestnut, vegetable and fruit farmers, and suppliers of packaging materials, do not allow us to pay on credit. However, some of the suppliers with whom we have a long-standing business relationship allow us to pay on credit. We fund the majority of our working capital requirements out of cash flow generated from operations. If we fail to generate sufficient sales, or if our suppliers stop offering us credit terms, we may not have sufficient liquidity to fund our operating costs and our business could be adversely affected.
We also fund approximately 30.2% of our working capital requirements from the proceeds of short-term loans from Chinese and overseas banks. Our average loan balance from short-term bank loans in 2016 was approximately $30.7 million. We expect to continue to do so in the future. Such loans are generally secured by our fixed assets, receivables and/or guarantees by third parties. The term of almost all such loans is one year or less. Historically, we have rolled over such loans on an annual basis. However, we may not be able to roll over such loans in the future or may not have sufficient funds available to pay all of our borrowings upon maturity. Failure to roll over our short-term borrowings at maturity or to service our debt could result in the imposition of penalties, including increases in rates of interest, legal actions against us by our creditors, or even insolvency.
Management anticipates that our existing capital resources and cash flows from operations and current and expected short-term bank loans will be adequate to satisfy our liquidity requirements through 2017. However, if available liquidity is not sufficient to meet our operating and loan obligations as they come due, our plans include considering pursuing alternative financing arrangements or further reducing expenditures as necessary to meet our cash requirements. However, there is no assurance that, if required, we will be able to raise additional capital or reduce discretionary spending to provide the required liquidity. Currently, the capital markets for small capitalization companies are difficult and banking institutions have become stringent in their lending requirements. Accordingly, we cannot be sure of the availability or terms of any third party financing.
We are subject to credit risk in respect of accounts receivables.
In 2008 and 2009, some of our customers, including some of our large supermarket customers, delayed their payments for up to 60 to 90 days beyond their term. Our cash flow suffered while waiting for such payments. Consequently, at times we had to delay payments to our suppliers and to postpone business expansion as a result of these delayed payments. Starting in 2008 and through 2016, we gradually shortened credit terms for many of our domestic customers from between 30 and 180 days to between 30 and 60 days; international customers are typically extended 90 days credit. Our large customers may fail to meet these shortened credit terms, in which case we may not have sufficient cash flow to fund our operating costs and our business could be adversely affected.
19
We may enter into additional financing agreements which may have a dilutive effect to our earnings per share and the rights of certain stockholders.
Additional financings could result in significant dilution to our earnings per share or the issuance of securities with rights superior to our current outstanding securities. We may also grant registration rights to investors purchasing our equity or debt securities in the future.
We may be unable to raise additional capital.
If we are unable to raise additional financing when needed, we may be unable to implement our long-term business plan, develop or enhance our products and services, take advantage of future opportunities or respond to competitive pressures on a timely basis, if at all. In addition, a lack of additional financing could force us to substantially curtail or cease operations.
We may be exposed to potential risks relating to our internal control over financial reporting and our ability to have such controls attested to by our independent auditors.
The SEC, under Section 404 of the Sarbanes-Oxley Act of 2002, adopted rules requiring public companies to provide in their annual reports on Form 10-K a report by management with respect to the company’s disclosure controls and procedures and internal control over financial reporting. We are currently required to comply with this requirement. In addition, such rules require the independent registered public accounting firm auditing a company’s financial statements to attest to the operating effectiveness of such company’s internal controls. However, because we are a smaller reporting company, we are not required to receive an attestation report from a registered public accounting firm. We can provide no assurance that we will comply with all of the requirements imposed thereby. Further, we cannot assure that we will receive a positive attestation from our independent auditors. Investors and others may lose confidence in the reliability of our financial statements in the event we identify significant deficiencies or material weaknesses in our internal controls that we cannot remediate in a timely manner or if we are unable to receive a positive attestation from our independent auditors with respect to our internal controls.companies.
We defaulted on debt relating to our bad operation performance and lack of finance from funding activities.
Pursuant to a Share Pledge Agreement, dated October 19, 2010 (the “Share Pledge Agreement”), Mr. Si Chen, our chief executive officer and chairman, has pledged 5,313,574 shares of Common Stock (the “Pledged Shares”) for the benefit of DEG-Deutsche Investitions- und Entwicklungsgesellshaft mbH (“DEG”) in order to secure the obligations of the Company and its subsidiary Junan Hongrun Foodstuff Co., Ltd. (“Junan Hongrun”) under a Loan Agreement, dated May 31, 2010, among the Company, DEG and Mr. Si Chen (the “Loan Agreement”). In the event that the value of the pledged assets is less than 150% of the amounts made available to the Junan Hongrun under the Loan Agreement, DEG has the right to require additional security in the form of fixed assets or shares under the Loan Agreement and Share Pledge Agreement. Pursuant to a letter agreement, dated November 15, 2012, Mr. Si Chen has pledged an additional 5,480,492 shares of Common Stock to DEG under the Pledge Agreement in order to secure the obligations of the Borrower under the Loan Agreement. The total number of shares pledged under the Pledge Agreement is now 10,794,066 shares of Common Stock. For so long as no event of default under the Loan Agreement has occurred, Mr. Si Chen continues to retain all voting rights with respect to the Pledged Shares.
On September 7, 2016, DEG acquired beneficial ownership of 10,794,066 shares of Common Stock upon foreclosure of the pledge from Mr. Si Chen. Such shares constitute approximately 28.2% of the total number of shares of Common Stock of the Issuer outstanding as of September 30, 2016.
If we were unable to pay off the loan on time to DEG due to the bad performance of our operation and decrease of our revenue in the near future, DEG has right to acquired more shares of Common Stock pledged by Mr. Si Chen.
We may suffer other defaults on our debt due to our poor performance.
Risks Related To Doing Business In China
Changes in China’s political or economic situation could harm us and our operating results.
Economic reforms adopted by the Chinese government have had a positive effect on the economic development of the country. However, the Chinese government could change these economic reforms at any time. Such changes could negatively impact our operations and profitability.
20
The structure of the Chinese economy may inhibit our ability to expand our business.
The Chinese economy differs from the economies of most countries belonging to the Organization for Economic Cooperation and Development, or OECD, in several ways. For example, state-owned enterprises constitute a large portion of the Chinese economy. In addition, weak corporate governance practices and the lack of flexible currency exchange policies continue to persist. As a result of these differences, we may not develop in the same way or at the same rate as might be expected if the Chinese economy were similar to those of the OECD member countries.
Our business is largely subject to the uncertain legal environment in China.
The Chinese legal system is a civil law system based on written statutes. Unlike common law systems, it is a system in which precedents set in earlier legal cases are not generally used. Laws, regulations and legal requirements relating to foreign investments in China are still evolving, and their interpretation and enforcement involve uncertainties. These uncertainties could limit the legal protections available to foreign investors, such as the right of foreign enterprises to hold required business licenses and permits.
It may be difficult for our stockholders to effect service of process against our subsidiaries or our officers and directors.
Our operating subsidiaries were organized under the laws of China and France and substantially all of their assets are located outside the U.S. In addition, our executive officers and directors are residents of China and substantially all of their assets are located outside the U.S. As a result, it could be difficult for our stockholders to effect service of process in the U.S., or to enforce a judgment obtained in the U.S., against our officers and directors in China.
Restrictions on currency exchange may limit our ability to receive and use our revenues effectively.
The majority of our revenues are settled in Renminbi and U.S. dollars, and any future restrictions on currency exchanges may limit our ability to use revenue generated in Renminbi to fund any future business activities outside China or to make dividends or other payments in U.S. dollars. Although the Chinese government introduced regulations in 1996 to allow greater convertibility of the Renminbi for current account transactions, significant restrictions still remain. For instance, foreign enterprises may only buy, sell or remit foreign currencies after providing valid commercial documents at banks in China authorized to conduct foreign exchange business. In addition, conversion of Renminbi for capital account items, including direct investment and loans, is subject to governmental approval in China, and companies are required to open and maintain separate foreign exchange accounts for capital account items. The Chinese regulatory authorities may impose more stringent restrictions on the convertibility of the Renminbi in the future.
Failure to comply with PRC regulations relating to the establishment of offshore special purpose companies by PRC residents may have negative effects on our company.
In October 2005, the PRC State Administration of Foreign Exchange, or SAFE, issued the Notice on Relevant Issues in the Foreign Exchange Control over Financing and Return Investment Through Special Purpose Companies by Residents Inside China, generally referred to as Circular 75, which required PRC residents to register with the local SAFE branch before establishing or acquiring control over an offshore special purpose vehicle, or SPV, for the purpose of engaging in an equity financing outside of China on the strength of domestic PRC assets originally held by those residents. Internal implementing guidelines issued by SAFE, which became public in June 2007 (known as Notice 106), further expanded the reach of Circular 75.
ILH acquired certain interests in the Lorain Group Companies controlled by Si Chen, our Chairman and Chief Executive Officer. Pursuant to Circular 75 and Notice 106, if a PRC resident has completed a round-trip investment through its established SPV but has not yet completed the required procedures of SAFE registration for offshore investment of the SPV, he must retroactively register the SPV with SAFE.
In order to avoid such SAFE registration requirements, a Japanese individual, Hisashi Akazawa, was designated as a nominee holder of ILH when ILH was established. Mr. Akazawa granted an option to our Chairman and Chief Executive Officer, Mr. Chen, allowing Mr. Chen to buy 90% of Mr. Akazawa’s interest in the Company at a fixed price at a future time in accordance with the terms of an option agreement between the two parties. On December 22, 2008, Mr. Chen exercised this option. In addition, on that date, Mr. Chen acquired all of the remaining shares of our company held by Mr. Akazawa. As a result, Mr. Chen is the beneficiary of ILH and may be required to register with and obtain approvals from SAFE or its agency with respect to the direct offshore investment activities related to the acquisition of the Lorain Group Companies.
21
If the failure to identify and characterize Mr. Chen as a beneficial owner of ILH is determined by the PRC authorities to be a serious violation of the requirements of the PRC Company Law and the PRC Regulation of Registration of Companies, the Lorain Group Companies may be ordered by the company registration authority in the PRC to make corrections on its filed registration, to be fined an amount no less than RMB 5,000 and no more than RMB 50,000 or, in the worse scenario, to have its company registration certificate revoked or its business licenses canceled.
On July 14, 2014, the SAFE issued the Circular Relating to Foreign Exchange Administration of Offshore Investment, Financing and Roundtrip Investment by Domestic Residents Through Special Purpose Vehicles, or Circular 37. Circular 37 repeals and replaces the Notice Concerning Foreign Exchange Controls on Domestic Residents’ Financing and Roundtrip Investment Through Offshore Special Purpose Vehicles, or Circular 75. Under Circular 37, PRC residents are required to register with the SAFE or its local branches prior to establishing, or acquiring control of, an offshore company for the purpose of investment or financing that offshore company with equity interests in, or assets of, a PRC enterprise or with offshore equity interest or assets legally held by such PRC resident. In addition, PRC residents are required to amend their registrations with the SAFE and its local branches to reflect any material changes with respect to such PRC resident’s investment in such offshore company, including changes to basic information of such PRC resident, increase or decrease in capital, share transfer or share swap, merger or division. In the event that a PRC shareholder fails to make the required registration or update the previously filed registration, the PRC subsidiaries of that offshore special purpose vehicle may be prohibited from distributing their profits and the proceeds from any reduction in capital, share transfer or liquidation to their offshore parent company, and the offshore parent company may also be prohibited from contributing additional capital into its PRC subsidiaries. Furthermore, failure to comply with the various foreign exchange registration requirements described above could result in liability under the PRC laws for evasion of applicable foreign exchange restrictions.
We have requested our relevant shareholders who are subject to the SAFE regulations to make the necessary registrations under the SAFE regulations. However, we may not be fully informed of the identities of the beneficial owners of our company. We do not have control over our beneficial owners and cannot assure you that all of our PRC resident beneficial owners will comply with SAFE regulations. The failure of our beneficial owners who are PRC residents to comply with these SAFE registrations may subject such beneficial owners or our PRC subsidiaries to fines and legal sanctions. Furthermore, since Circular 37 was recently promulgated and it is unclear how this regulation, and any future regulation concerning offshore or cross-border transactions, will be interpreted, amended and implemented by the relevant PRC government authorities, we cannot predict how these regulations will affect our business operations or future strategy. Failure to register or comply with relevant requirements may also limit our ability to contribute additional capital to our PRC subsidiaries and limit our PRC subsidiaries’ ability to distribute dividends to our company. These risks may have a material adverse effect on our business, financial condition and results of operations.
If the failure to identify, characterize and register Mr. Chen as a beneficial owner of ILH is determined by the PRC authorities to be a violation of the requirements of registration and disclosure under new Circular 37, the Lorain Group Companies may be ordered by the authority in the PRC to make corrections on its filed registration, to be fined an amount up to RMB 50,000 for Mr. Chen and up to RMB 300,000 for the Lorain Group Companies.
Furthermore, since Circular 37 was recently promulgated and it is unclear how this regulation, and any future regulation concerning offshore or cross-border transactions, will be interpreted, amended and implemented by the relevant PRC government authorities, we cannot predict how these regulations will affect our business operations or future strategy. Failure to register or comply with relevant requirements may also limit our ability to contribute additional capital to our PRC subsidiaries and limit our PRC subsidiaries’ ability to distribute dividends to our company. These risks may have a material adverse effect on our business, financial condition and results of operations.
Our financial condition is affected by the foreign exchange rate between the U.S. dollar and the Renminbi.
Our financial condition is affected by the foreign exchange rates, primarily the rate between the U.S. dollar and the Renminbi, as well as Euro and Renminbi. In the event that the Renminbi appreciates against the U.S. dollar and Euro, our costs will increase.
We may encounter credit risks from our suppliers in China.
Our Procurement staff left before goods were verified and received into inventory. We did not place significant new orders or make additional payments to vendors and suppliers, especially, peasant suppliers whom do not abide by contract law and have not fulfilled their obligations.
Risks Related To the Market For Our Stock
Certain of our stockholders have the ability to delay or prevent adoption of important business decisions based on their ownership of a significant percentage of our outstanding voting securities.
DEG is the record owner of approximately 28.2% of our outstanding voting securities. As a result, DEG possesses significant influence over our business.
22
Certain provisions of our Articles of Incorporation may make it more difficult for a third party to effect a change-in-control.
Our Articles of Incorporation authorize our board of directors to issue up to 5,000,000 shares of preferred stock without stockholder approval. The preferred stock may be issued in one or more series, the terms of which may be determined at the time of issuance by the board of directors without further action by the stockholders. These terms may contain voting rights, including the right to vote as a series on particular matters, preferences as to dividends and liquidation, conversion rights and redemption rights provisions. The issuance of any preferred stock could diminish the rights of holders of our common stock, and therefore could reduce the value of such common stock. In addition, specific rights granted to future holders of preferred stock could be used to restrict our ability to merge with, or sell assets to, a third party. The ability of our board of directors to issue preferred stock could make it more difficult to acquire our company and could negatively affect the market price of our common stock.
We do not expect to pay dividends in the future, and any return on your investment may be limited to the value of the shares you acquire.
Other than a special cash dividend which we paid to holders of our common stock as of April 16, 2007, we have never declared or paid cash dividends. We do not anticipate paying any cash dividends on our common stock in the foreseeable future and any return on your investment may be limited to the value of the shares of our common stock that you acquire. We currently intend to retain and use any future earnings for the development and expansion of our business.
ITEM 1B. UNRESOLVED STAFF COMMENTS
None.
Our primary facilities, which are owned except where otherwise indicated, are as follows:
| Facility | Location | Approximate Size (Square Meters) | Owned or Leased | ||||
| Xianning City, Hubei Province, PRC | Land Use Rights Obtained | ||||||
| Jingshan City, Hubei Province, PRC | Leased | ||||||
| Meihekou City, Jilin Province, PRC | |||||||
As described above, in 2016, we ceased operations in France, Dongguan and Shandong.
| * | Became a VIE in May 2019. |
| ** | Became a VIE in January 2021. |
| *** | Became a VIE in March 2021. |
In the aggregate, we currently have land use rights to, or lease, 703 properties with approximately 307,897104,041 square meters, consisting of manufacturing facilities and office buildings and land reserved for future expansion. We believe our current facilities provide adequate capacity for our current and projected needs.
All land in China is owned by the State.government. Individuals and companies are permitted to acquire land use rights for specific purposes. In the case of land used for industrial purposes, the land use rights are granted for a period of up to 50 years. This period may be renewed at the expiration of the initial and any subsequent terms. Granted land use rights are transferable and may be used as security for borrowings and other obligations.
There is a lawsuit currently pending in the Supreme Court of Shandong Province, which was initially filed by Shandong Lorain, a subsidiary of the Company, against Junan Hengji Real Estate Development Co., Ltd. ("Junan Hengji") in November 2013 at Linyi City Intermediate People's Court of Shandong Province (the "Linyi Court").
23Not Applicable.
Shandong Lorain added Jiangsu Hengan Industrial Investment Group Co., Ltd. ("Heng An Investment") as a co-defendant after the case was first filed at Linyi Court.
In September 2010, Shandong Lorain and Junan Hengji entered into a cooperative development agreement (the "Agreement") and in March 2011, Heng An Investment, an affiliated company of Junan Hengji also entered into the Agreement with Shandong Lorain to jointly develop the project with Junan Hengji. Pursuant to the Agreement, Junan Henji and Heng An Investment are required to pay Shandong Lorain a total RMB 20 million (approximately $3,225,806) fixed return according to the development status of the project developed by Junan Hengji and Heng An Investment. The payment was due and unpaid to Shandong Lorain. Shandong Lorain and the Company evaluated the potential claims against Junan Hengji and Heng An Investment, disputes between the parties with respect to out of pocket expenses paid by Junan Hengji, as well as the litigation fee that is required to be paid to the court based upon the amount claimed. Ultimately, Shandong Lorain decided to file the lawsuit with Linyi Court to claim a fixed return of RMB 10 million (approximately $1,636,902) first.
In January 2014, the Linyi Court had its first trial session. During the trial, Heng An Investment filed a counterclaim against Shandong Lorain for repayment of out of pocket expenses which would off-set the entire fixed return plus additional unpaid expenses of RMB 4,746,927 (approximately $765,633). Shandong Lorain responded that Heng An Investment does not have standing to file the counter-claim because the out of pocket payments was made by Junan Hengji. In November 2014, the court had a second trial session and completed its discovery process. On March 21, 2015, Shandong Lorain received Linyi Court's decision that rejected Shandong Lorain's claim for RMB 10,000,000 against Junan Hengji and Heng An Investment. On April 3, 2015, Shandong Lorain appealed the decision to the Supreme Court of Shandong Province. In November 2015, Supreme Court of Shandong Province vacated the decision of the Linyi Court and remanded the case back to the Linyi Court for a retrial. The retrial took place on April 25, 2016, at the Linyi City Intermediate People’s Court, and the decision thereon is currently pending. The Company anticipates that Shandong Lorain will prevail on retrial.
ITEM 4. MINE SAFETY DISCLOSURES
Not applicable.
ITEM 5. MARKET FOR REGISTRANT’S COMMON EQUITY, RELATED STOCKHOLDER MATTERS AND ISSUER PURCHASES OF EQUITY SECURITIES.
Market for our Common Stock
Our common stock is quoted on the NYSE American (formerly known as the American Stock Exchange, the NYSE Amex Equities Exchange and the NYSE MKT) under the symbol “ALN”“PLAG”. As of October 14, 2017 the closing price for our common stock was $0.37 per share.
The following table sets forth, for the periods indicated, the high and low sales prices of our common stock. These prices reflect inter-dealer prices, without retail mark-up, mark-down or commission, and may not represent actual transactions.
| Common Stock | ||||||
| Market Prices | ||||||
| High | Low | |||||
| Fiscal Year Ended December 31, 2016 | ||||||
| First Quarter | $ | 1.22 | $ | 1.07 | ||
| Second Quarter | $ | 1.30 | $ | 1.06 | ||
| Third Quarter | $ | 1.15 | $ | 0.62 | ||
| Fourth Quarter Fiscal Year Ended December 31, 2015 | $ | 0.72 | $ | 0.50 | ||
| First Quarter | $ | 1.37 | $ | 0.91 | ||
| Second Quarter | $ | 1.88 | $ | 1.20 | ||
| Third Quarter | $ | 1.88 | $ | 0.89 | ||
| Fourth Quarter | $ | 1.24 | $ | 0. 92 | ||
24
Approximate Number of Holders of Our Common Stock
As of September 30, 2017,March 29, 2021, there were 311341 stockholders of record of our common stock. This does not include the holders whose shares are held in a depository trust in “street” name.
Dividend Policy
We have not declared or paid cash dividends other than the payment of a dividend in April 2007 in connection with our reverse merger. Any future decisions regarding dividends will be made by our boardBoard of directors.Directors. We currently intend to retain and use any future earnings for the development and expansion of our business and do not anticipate paying any cash dividends in the foreseeable future.
Issuances of Unregistered Securities
We issued $3.5 million Convertible Promissory Note
On February 10, 2020, the Company entered into a Securities Purchase Agreement, pursuant to Jade Lane Group Limitedwhich two individuals residing in March 2014. Under the termsPeople’s Republic of China agreed to purchase an aggregate of 1,350,000 shares of the Note, interestCompany’s common stock, par value $0.001 per share, for an aggregate purchase price of $3,510,000, representing a purchase price of $2.60 per share. The transaction was closed on February 28, 2020.
On June 5, 2020, the outstanding Principal Amount accrues atCompany has entered into a rateShare Exchange Agreement with Fast Approach Inc. and each shareholder of 4.5% per annum, and all accrued but unpaid interest is due and payable on June 30, 2014 and on the last day of each quarter thereafter. If the Note is not converted pursuantFast Approach. Pursuant to the terms of the Note, additional interest on the outstanding Principal Amount shall accrue at a rate of 4.5% per annum and payable at the maturity of the Note. Unless the Note is otherwise accelerated or converted, the unpaid Principal Amount of the Note, together with all accrued but unpaid interest, is due and payable, at the election of the Holder, on September 13, 2014 or March 13, 2015 (“Maturity Date”), provided, however, if Holder fails to notify the Company in writing by August 13, 2014 that it elects the maturity date of September 13, 2014, then the Maturity Date will be extended to March 13, 2015.
In addition, under the terms of the Note, at any time commencing on or after September 13, 2014 and before March 13, 2015, the Holder, at Holder’s option and upon five (5) days prior written notice to the Company, may convert in whole or in part the outstanding Principal Amount into a number of shares of Common Stock of the Company (“Common Stock”) on a per share conversion price of $1.15 per share, as may be adjusted from time to time pursuant to the terms and conditions of the Note (“Conversion Price”); provided, however,Share Exchange Agreement, the Company will not effect any conversionacquire all outstanding equity interests of Target. The acquisition closed on June 5, 2020. At the Note, and the Holder will not have the right to convert any portion of the Note, to the extent (but only to the extent) that the Holder would beneficially own in excess of the Beneficial Ownership Limitation (as defined below), which beneficial ownership will be calculated in accordance with Section 13(d) of the Securities Exchange Act of 1934, as amended. The “Beneficial Ownership Limitation” is 9.99% of the number of shares of Common Stock outstanding immediately after giving effect to the issuance of shares of Common Stock issuable upon conversion of the Note.
The Note was secured by the personal guarantee of Si Chen, the Company’s chief executive officer and chairman.
On March 12, 2015,closing, the Company and Jade Lane Group Limited entered intoissued an agreement to repayment termsaggregate of the promissory note in the amount of $3,500,000 issued to the Company on March 13, 2014. On April 20, 2015, the Company repaid the promissory note in form of both cash payment of $791,433 and conversion of 2,355,2761,800,000 shares of common stock at a conversion price of $1.15 per share.the Company to the original shareholders of Fast Approach in exchange for the transfer of all of the equity interests of the Fast Approach to the Company.
On February 19, 2014, the Company’s board of directors approved the 2014 Equity Incentive Plan (“2014 Plan”), which was approved at the annual stockholders meeting on June 9, 2014. Subject to adjustment as provided in the 2014 Plan, the total number of shares of Common Stock reserved and available for delivery in connection with awards under the 2014 Plan is 3,000,000. In 2015, 987,500 shares were issued to employees as stock awards under the 2014 plan.
Securities Authorized for Issuance under Equity Compensation Plans
The information in Item 12
On November 24, 2020, shareholders approved the 2020 Equity Incentive Plan, under which there is 1,654,165 shares of this report is incorporated herein by reference.common available for issuance. On December 30, 2020, Company issued 782,165 common shares to its employees under the 2020 Equity Incentive Plan.
ITEM 6. SELECTED FINANCIAL DATA
Not applicable.
25
ITEM 7. MANAGEMENT’S DISCUSSION AND ANALYSIS OF FINANCIAL CONDITION AND RESULTS OF OPERATIONS
Overview
We are an integrated food manufacturing company headquartered in ShandongFlushing, NY. For the fiscal year 2020, our primary business, which is carried out by Fast Approach Inc and Xianning Bozhuang, is:
| ● | Black tea product cultivation, packaging, and sales; |
| ● | Multimedia design and online advertising services; |
Reorganization
On May 18, 2018, the Company incorporated Planet Green Holdings Corporation, a limited company incorporated in the British Virgin Islands. On September 28, 2018, Planet Green BVI acquired JianShi Technology Holding Limited, a limited company incorporated in Hong Kong on February 21, 2012, and Shanghai Xunyang Internet Tech Co., Ltd., a wholly-owned foreign entity incorporated in Shanghai, PRC, on August 29, 2012 (“Shanghai Xunyang”).
On May 9, 2019, the Company entered into a share exchange agreement to acquire Xianning Bozhuang Tea Products Co., Ltd, Then the Company’s business activities added the production line of green tea and black tea and sales of tea products, of which business activities are carried out in Xianning City, Hubei Province, China. We develop, manufacture
On August 12, 2019, through Lucky Sky Holdings Corporations (H.K.) Limited, formerly known as JianShi Technology Holding Limited, Company established Lucky Sky Petrochemical Technology (Xianning) Co., Ltd., a wholly foreign-owned enterprise incorporated in Xianning City, Hubei Province, China.
On December 20, 2019, The Lucky Sky Holdings Corporations (H.K.) Limited sold 100% of equity interest in Shanghai Xunyang.
On May 29, 2020, the Planet Green Holdings Corporation (BVI) incorporated Lucky Sky Planet Green Holdings Co., Limited, a limited company incorporated in Hong Kong.
On June 5, 2020, the Company issued an aggregate of 1,800,000 shares of our common stock to acquire all of the outstanding equity interest of Fast Approach Inc. As a result, the Planet Green Holdings Corporation (BVI) acquired all of the outstanding equity interests of Fast Approach Inc. It was incorporated under Canada’s laws and sell the business of operation of a demand-side platform targeting the Chinese education market in North America, besides, Shanghai Shuning Advertising Co., Ltd, a PRC entity as the subsidiary of Fast Approach Inc, conducted the multimedia design, advertising, import, and export business in China.
On June 16, 2020, Lucky Sky Holdings Corporations (H.K.) transferred its 100% equity interest in Lucky Sky Petrochemical to Lucky Sky Planet Green Holdings Co., Limited (H.K.).
On August 10, 2020, Planet Green Holdings Corporation (BVI) transferred its 100% equity interest in Lucky Sky Holdings Corporations (H.K.) Limited to Rui Tang, an unrelated party, at nominal price.
On September 15, 2020, Lucky Sky Petrochemical terminated the VIE agreements with Shenzhen Lorain and Taishan Muren.
On December 9, 2020, Lucky Sky Petrochemical Technology (Xianning) Co., Ltd. changed its name to Jiayi Technologies (Xianning) Co., Ltd.
On January 4, 2021, the Company and Jiayi Technologies (Xianning) Co., Ltd. (the “Subsidiary”), a subsidiary of the Company, entered into a Share Exchange Agreement (the “Share Exchange Agreement”) with Jingshan Sanhe Luckysky New Energy Technologies Co., Ltd. (“Target”), and each of shareholders of the Target (collectively, the “Sellers”), pursuant to which, among other things and subject to the terms and conditions contained therein, the Subsidiary agreed to effect an acquisition of the Target by acquiring from the Sellers 85% of the outstanding equity interests of the Target (the “Acquisition”). Jingshan Sanhe Luckysky New Energy Technologies Co., Ltd, engaged in researching, manufacturing, and selling high-grade synthetic fuel products. Jingshan Sanhe has four production lines on an 11,000-square-meter facility and capacities to complete manufacturing, labeling, and packaging. It is the primary facility for Green Energy products. Besides, this facility also serves research and sales purpose with an office space of 3,400 square meters. On January 4, 2021, the Company closed the Acquisition.
On March 9, 2021, Planet Green Holdings Corp. (the “Company”) and Jiayi Technologies (Xianning) Co., Ltd. (the “Subsidiary”), a subsidiary of the Company, entered into a Share Exchange Agreement (the “Share Exchange Agreement”) with Jilin Chuangyuan Chemical Co., Ltd. (“Target”). Each of shareholders of the Target (collectively, the “Sellers”), under which, among other things and subject to the terms and conditions contained therein, the subsidiary agreed to effect an acquisition of the Target by acquiring from the Sellers 75% of the outstanding equity interests of the Target (the “Acquisition”). Jilin Chuangyuan Chemical Co., Ltd’s main products are formaldehyde, urea-formaldehyde glue, methylal, and clean fuel oil; it has two formaldehyde production lines, eight rubber production lines methylal production line, and one clean fuel oil production line. There are 367 sets of leading production equipment, the entire plant covering an area of 43,661 square meters, construction area of 16,090 square meters. On March 10, 2021, the Company closed the acquisition.
After that, through Jiayi Technologies (Xianning) Co., Ltd, the Company entered into a new variable interest entity agreement. Jingshan Sanhe Luckysky New Energy Technologies Co., Ltd and Jilin Chuangyuan Chemical Co., Ltd became the Company’s new contractually controlled affiliate. The New VIE Agreements allow us to:
| a. | exercise effective control over Jingshan Sanhe Luckysky New Energy Technologies Co., Ltd and Jilin Chuangyuan Chemical Co., Ltd; |
| b. | receive 85% of the economic benefits of Jingshan Sanhe Luckysky New Energy Technologies Co., Ltd and receive 75% of the economic benefits of Jilin Chuangyuan Chemical Co., Ltd substantially; |
| c. | have an exclusive option to purchase all or part of the equity interests in Jingshan Sanhe Luckysky New Energy Technologies Co., Ltd and Jilin Chuangyuan Chemical Co., Ltd when and to the extent permitted by the laws of the PRC; |
As a result of the New VIE Agreements, The Company has become the primary beneficiary of Jingshan Sanhe Luckysky New Energy Technologies Co., Ltd and Jilin Chuangyuan Chemical Co., Ltd; They treat these above entities as its variable interest entity under U.S. GAAP. The Company will continue to consolidate the financial results of Xianning Bozhuang Tea Products Co., Ltd in our consolidated financial statements following types of food products:U.S. GAAP.
The table below illustrates the business the Company conduct through our subsidiaries and consolidated affiliated entities:
| Attributable equity | Place of | ||||||
| Name of Company | Principal Business | interest % | incorporation | ||||
| Shanghai Shuning Advertising Co., Ltd | Multimedia design, advertising, import, and export business | 100 | PRC | ||||
| Jingshan Sanhe Luckysky New Energy Technologies Co., Ltd | Manufacturing and sales of Synthetic fuel products |
VIE | PRC | ||||
| Jilin Chuangyuan Chemical Co., Ltd | Production and sales of formaldehyde products, vehicles gasoline and diesel products | 75% VIE | PRC | ||||
| Xianning Bozhuang Tea Products Co., Ltd. | Tea product cultivation, packaging, and sales | 100% VIE | PRC | ||||
| Fast Approach Inc. | Multiple media design and online advertising | 100 | Canada |
The above reorganization which occurred during the subsequent period after December 31, 2020 does not affect the Company’s consolidated financial statements for the current period.
Coronavirus (COVID-19) Update
Recently, an ongoing outbreak of a novel strain of coronavirus (COVID-19) was first identified in China and has since spread rapidly globally. The pandemic has resulted in quarantines, travel restrictions, and the temporary closure of stores and business facilities globally for the past few months. In March 2020, the World Health Organization declared the COVID-19 as a pandemic. Given the rapidly expanding nature of the COVID-19 pandemic, and because substantially all of our business operations and workforce are concentrated in China, our business, results of operations, and financial condition have been and will continue to be adversely affected. Potential impact to the results of our operations will also depend on future developments and new information that may emerge regarding the duration and severity of the COVID-19 and the actions taken by government authorities and other entities to contain the COVID-19 or mitigate its impact, almost all of which are beyond our control.
| 1) | The impacts of COVID-19 on our business, financial condition, and results of operations include, but are not limited to, the following: |
| 2) | We temporally closed our offices and production facilities to adhere to the policy from February 2020 until April 2020, as required by relevant PRC regulatory authorities. Our offices are slowly reopening pursuant to local guidelines. During the past 12 months in the fiscal year 2020, the COVID-19 outbreak had caused disruptions in our manufacturing operations, which had resulted in delays in the shipment of products to certain of our customers. |
| 3) | Some of our employees were in mandatory self-quarantine from January 2020 to April 2020. |
| 4) | Our customers have been negatively impacted by the outbreak, which may reduce the demand for our products. As a result, our revenue and income have been being negatively impacted in 2020. |
| ||
|
We conductA prolonged disruption or any further unforeseen delay in our operations of the manufacturing, delivery, and assembly process within any of our production activitiesfacilities could continue to result in China. Our products are solddelays in the Chinese domestic marketsshipment of products to our customers, increased costs, and reduced revenue.
We cannot foresee whether the outbreak of COVID-19 will be effectively contained, nor can we predict the severity and duration of its impact. If the outbreak of COVID-19 is not effectively and timely controlled, our business operations and financial condition may be materially and adversely affected as well as exported to foreign countriesa result of the deteriorating market outlook, the slowdown in regional and regions such as Japannational economic growth, weakened liquidity, and South Korea. We have developed brand equity for our chestnut products in China, Japan and South Korea over the past 18 years. We produced 214 products in 2016. We derive mostfinancial condition of our revenues from sales in China, South Koreacustomers or other factors that we cannot foresee. Any of these factors and Japan. In 2017,other factors beyond our primary strategy is to continue building our brand recognition in China through consistent marketing efforts towards supermarkets, wholesalers, and significant customers, enhancingcontrol could have an adverse effect on the cooperation with other manufacturers and factories, and enhancing the turnover for our existing chestnut, convenience and frozen food products. In addition, we are working to expand our marketing efforts in Asia and Europe. We currently have limited sales and marketing activityoverall business environment, cause uncertainties in the United States, althoughregions where we conduct business, cause our long-term plan isbusiness to significantly expandsuffer in ways that we cannot predict, and materially and adversely impact our activities there.business, financial condition and results of operations.
Results of Operations
The following discussion should be read in conjunction with the company’s audited consolidated financial statement for the years ended December 31, 2020, and 2019 and related notes to that.
| Increase / | Increase / | |||||||||||||||
| Decrease | Decrease | |||||||||||||||
| 2020 | 2019 | ($) | (%) | |||||||||||||
| Net revenues | 3,638,801 | 1,106,482 | 2,532,319 | 229 | ||||||||||||
| Cost of revenues | 2,369,736 | 464,402 | 1,905,334 | 410 | ||||||||||||
| Gross profit | 1,269,065 | 642,080 | 626,985 | 98 | ||||||||||||
| Operating expenses: | ||||||||||||||||
| Selling and marketing expenses | 160,109 | 40,069 | 120,040 | 300 | ||||||||||||
| General and administrative expenses | 3,896,489 | 904,913 | 2,991,576 | 331 | ||||||||||||
| Total operating expenses | 4,056,598 | 944,982 | 3,111,616 | 329 | ||||||||||||
| Operating loss | (2,787,533 | ) | (302,902 | ) | (2,484,631 | ) | 820 | |||||||||
| Interest income (expenses), net. | (23,407 | ) | (9,725 | ) | (13,682 | ) | 141 | |||||||||
| Other income (expenses), net. | 27,318 | 68,376 | (41,058 | ) | (60 | ) | ||||||||||
| Impairment of goodwill | (2,339,829 | ) | - | (2,339,829 | ) | - | ||||||||||
| Write off receivables from the disposal of former subsidiaries | (6,078,623 | ) | 8,783,848 | (14,862,471 | ) | (169 | ) | |||||||||
| Total other (expenses) income | (8,414,541 | ) | 8,842,499 | (17,257,040 | ) | (195 | ) | |||||||||
| Loss before taxes | (11,202,074 | ) | (8,539,597 | ) | (19,741,671 | ) | (231 | ) | ||||||||
| Discontinued Operations: | ||||||||||||||||
| Income (loss) from continuing operations | 150,911 | (5,592,401 | ) | 5,743,312 | (103 | ) | ||||||||||
| Net income(loss)from discontinuing operations | 150,911 | (5,592,401 | ) | 5,743,312 | (103 | ) | ||||||||||
| Net income(loss) | (11,051,163 | ) | 2,947,196 | (13,998,359 | ) | (475 | ) | |||||||||
Year Ended December 31, 2020, Compared to Year Ended December 31, 2019
Net Revenues. Our net revenues amounted to $3.64 million in 2020, representing an increase of approximately $2.53 million, from 2019, in which our net revenue was $1.11 million. This increase was attributable to the fact that the Company has acquired Xianning Bozhuang Tea Products Co., Ltd in May 2019 and expanded enterprise sales distribution channel in the fiscal year 2020.
Cost of Revenues. In addition,2020, we are working to developing new products and developing new sales channels.
Production Factors that Affect our Financial and Operational Condition
Our business depends on obtaining a reliable supply of various agricultural products, including chestnuts, vegetables, fruits, red meat, fish, eggs, rice, flour and packaging products. During 2016,experienced an increase in the cost of our raw materials decreasedrevenues of $1.91 million compared to 2019, from $143,226,607approximately $0.46 million to $85,249,363.35 for a decrease$2.37 million. This soaring in cost of approximately 40.48% . We may have togoods sold was in line with the increase the number of our suppliers of raw materials and expand our own agricultural operationsin sales in the futurefiscal year 2020.
Gross Profit. Our gross profit increased by $0.63 million, or 98%, to meet growing production demands. Despite$1.27 million in 2020 from $0.64 million in 2019, For the years ended December 31, 2020, and 2019, our effortsoverall gross margin was 35% and 58%, respectively. The decrease in gross margin was primarily due to controlthe reshaping of the brand and the adjustment of the product lines.
Operating Expenses
Selling and Marketing Expenses. Our selling and marketing expenses increased by $0.12 million or 300%, to $0.16 million in 2020, compared to $0.04 million in 2019. The increase in our supplyselling and marketing expenses is mainly due to the development of raw materialsnew sales channels; it includes the adjustment of promotion strategies, marketing strategies, and maintain good relationships with our suppliers, we could lose one or more of our suppliers at any time. The loss of several suppliers may be difficult to replace and could increase our reliance on higher cost or lower quality suppliers, which could negatively affect our profitability. In addition, if we have to increase the number of our suppliers of raw materialsChannel strategies. Specifically, in the futurefiscal year 2020, the Company began to meet growing production demands, we may not be ableengage in online wholesales business.
General and Administrative Expenses. We experienced an increase in general and administrative expenses of $2.99 million from $0.90 million to locate new suppliers who could provide us with sufficient materialsapproximately $3.90 million in 2020, compared to meet2019. The increase was mainly because the Company incurred approximately $1.75million on stock compensation expense concerning our needs. Any interruptionsordinary shares issued to or declinethe management.
Net Income
For the 12 months ended December 31, 2020, our net loss amounted to approximately $11 million, comparing approximately 3 million net income in the amount or qualityfiscal year 2019. This decrease in net income was attributable to the outbreak of COVID-19 and the disposal of certain VIEs.
Liquidity and Capital Resources
In assessing our raw materials supply could materially disruptliquidity, we monitor and analyze our productioncash-on-hand and adversely affect our businessoperating and financial condition and financial prospects.
The average price that we paid for chestnuts in the China domestic market in 2016 and 2015 was approximately $1,765 metric ton and $1,600 per metric ton, respectively, excluding value added taxes. In the past few years, increasing inflation pressures weighed on the Chinese economy which reflected on agricultural product prices. We do not have effective means and do not currently hedge against changes in our raw material prices. Consequently, if the costs of our raw materials increase further and wecapital expenditure commitments. Our liquidity needs are unable to offset these increases by raising the prices of our products, our profit margins and financial condition could be adversely affected.
Uncertainties that Affect our Financial Condition
We spend a significant amount of cash on our operations, principally to procure raw materials for our products. Many of our suppliers, including chestnut, vegetable and fruit farmers, and suppliers of packaging materials, require us to pay for their supplies in cash on the same day that such supplies are delivered to us. However, some of the suppliers with whom we have a long-standing business relationship allow us to pay on credit. We fund the majority ofmeet our working capital requirements, outoperating expenses, and capital expenditure obligations. In the reporting period in the fiscal year 2020, our primary sources of financing have been cash flow generated from operations. Ifoperations and private placements.
On February 10, 2020, we failentered into a securities purchase agreement with Mengru Xu and Zhichao Du, pursuant to generate sufficient sales, or if our suppliers stop offering us credit terms, we may not have sufficient liquiditywhich Mr. Xu and Mr. Du agreed to fund our operating costs and our business could be adversely affected.
We also funded approximately 37.7% and 30.2%invest an aggregate of $3.51 million in the Company in exchange for an aggregate of 1,350,000 shares of our working capital requirements in 2015 and 2016, respectively, from the proceedscommon stock, representing a purchase price of short-term loans from Chinese and foreign banks. We expect to continue to do so in the future. Such loans are generally secured by our fixed assets, receivables and/or guarantees by third parties. Our average loan balance from short-term bank loans in 2016 and 2015were approximately $30.7 million and $39.0 million, respectively. The term of almost all such loans is one year or less. Historically, we have rolled over such loans on an annual basis. However, in recent years, the Chinese government has implemented more stringent credit policies to curb inflation and soaring property prices, which could negatively impact our ability to obtain or roll over these short term loans, and hence not having sufficient funds available to pay all of our borrowings upon maturity. Failure to roll over our short-term borrowings at maturity or to service our debt could result in the imposition of penalties, including increases in rates of interest, legal actions against us by our creditors, or even insolvency. We obtained long term loans, private placement financing and a convertible promissory note during the period 2011 to 2014. We can provide no assurances that we will be able to enter into any future financing or refinancing agreements on terms favorable to us, especially considering the current instability of the capital markets.$2.60 per share.
26
We anticipateManagement anticipates that our existing capital resources includingand anticipated cash flows from operations current and expected short-term bank loans will beare adequate to satisfy our liquidity requirements through 2017. However, if available liquidity is not sufficient to meet our operating and loan obligations as they come due, our plans include considering pursuing alternative financing arrangements or further reducing expenditures as necessary to meet our cash requirements. However, there is no assurance that, if required, we will be able to raise additional capital or reduce discretionary spending to provide the required liquidity. Currently, the capital markets for small capitalization companies are difficult and banking institutions have become stringent in their lending requirements. Accordingly, we cannot be sure of the availability or terms of any third party financing.
In 2008 and 2009, some of our customers, including some of our large supermarket customers, delayed their payments for up to 60 to 90 days beyond their term. Our cash flow suffered while waiting for such payments. Consequently, at times we had to delay payments to our suppliers and to postpone business expansion as a result of these delayed payments. Starting in 2008 and through 2016 we gradually shortened credit terms for many of our domestic customers from between 30 and 180 days to between 30 and 60 days; international customers are typically extended 90 days credit. Our large customers may fail to meet these shortened credit terms, in which case we may not have sufficient cash flow to fund our operating costs and our business could be adversely affected.
Restatement of prior financial statements
We have discovered errors in the timing of revenues recognized during the year ended December 31, 2015. We recognize revenue upon shipping of products to its customers where title of the goods passes upon departure from our facilities; however, in certain instances, contractual terms dictate that the customers are afforded seven days after the receipt of goods at their premises to inspect the goods for defects or spoilage and notify us. If we are not contacted within those seven days, our obligation to the customer are considered fully discharged and revenue should be recognized. Given the timing of these seven days, we believe that certain sales transactions have been erroneously recognized during the year ended December 31, 2015. We have rectified this error and the impact of our financial position and result of operations during the year ended December 31, 2015.
Results of Operations
The following tables set forth key components of our results of operations for the periods indicated, and the differences between the two periods expressed in dollars and percentages.
| Year Ended | ||||||||||||
| December 31, | Increase/(Decrease) | Increase/(Decrease) | ||||||||||
| (In thousands of U.S. dollars) | 2016($) | 2015($) | ($) | (%) | ||||||||
| Net Revenue | 79,667 | 140,712 | (61,045 | ) | (43.4% | ) | ||||||
| Cost of Revenue | 69,165 | 114,730 | (45,565 | ) | (39.7% | ) | ||||||
| Gross profit | 10,502 | 25,982 | (15,480 | ) | (59.6% | ) | ||||||
| Operating Expenses: | ||||||||||||
| Selling and Marketing | 6,126 | 6,859 | (733 | ) | (10.7% | ) | ||||||
| General and administrative | 40,797 | 5,666 | 35,131 | 620.0% | ||||||||
| Income from continuingoperations | (87,173 | ) | 6,923 | (94,096 | ) | (1359.2% | ) | |||||
| Non-operating Income(Expenses): | ||||||||||||
| Government grant | 1,232 | 1,999 | (767 | ) | (38.4% | ) | ||||||
| Interest income | 47 | 117 | (70 | ) | (59.8% | ) | ||||||
| Other income | 348 | 350 | (2 | ) | (0.6% | ) | ||||||
| Other expense | (45,911 | ) | (393 | ) | 45,518 | 11582.2% | ||||||
| Interest Expense | (4,569 | ) | (5,245 | ) | (676 | ) | (12.9% | ) | ||||
| Income before taxes | (85,275 | ) | 10,286 | (95,561 | ) | (929.0% | ) | |||||
| Income Taxes | (1,899 | ) | (3,363 | ) | (1,464 | ) | (43.5% | ) | ||||
| Net Loss | (85,173 | ) | 6,923 | (90,299 | ) | (1304.3% | ) | |||||
| Non-Controlling Interest | (49,188 | ) | (9,609 | ) | (58,797 | ) | (611.0% | ) | ||||
| Incomeof common stockholders | (87,173 | ) | 6,923 | (94,096 | ) | (1359.2% | ) | |||||
27
Year Ended December 31, 2016 Compared to Year Ended December 31, 2015
Revenue
Net Revenues. Net revenues decreased by $61.0 million, or approximately 43.4%, to $79.7 million in 2016 from $140.7 million in 2015.
Since 2015, more competitors entered the convenience food industry that develop more types of products. Our current products have not met customers’ demand in the most recent year due to our failure to invest in research and development. In addition, we have faced significant competition from Chinese online ordering platforms since 2015, which platforms offer convenient and efficient meals directly from restaurants. In addition, Dongguan Lorain ceased operations in October 2016 due to its high cost of environmental compliance cost, the overlap of products and market with Luotian Lorain, both of which focus on the southern market of China, and poor performance of sales revenue.
28
Cost of Revenues. Our cost of revenues decreased $45.6 million, or approximately 39.7%, to $69.2 million in 2016 from $114.7 million in 2015, as a result of decrease of net revenue.
Gross Profit. Our gross profit decreased $15.5 million, or 59.6%, to $10.5 million in 2016 from $26.0 million in 2015, mainly attributed to the fact that revenues decreased by $79.2 million. The gross profit ratio decreased from 12.6% to 7.1% in 2016, it is mainly attributes to the reason that we ceased to sell convenience foods products since 2016, shut Athena Group and Dongguan Lorain, the cost of chestnuts slightly increased and the sales of chestnuts in China declined.
Operating Expenses
Selling and Marketing Expenses. Our selling and marketing expenses decreased approximately $0.7 million, or 10.7%, to $6.1 million in 2016 from $6.9 million in 2015. The decrease is attributable to decreases of employee salary, travel expense, entertainment expense and storage charge by 19.03%, 52.23%, 71.27% and 60.05%, respectively, in 2016.
General and Administrative Expenses. Our general and administrative expenses increased approximately $35.1 million, or 620.0%, to $ 40.8 million in 2016 from $5.7 million in 2015. The increase mainly due to the bad debt including unrecovered trade receivables and other receivables $ 35,590,795 that management determined cannot be recovered, which accounted for 87.2% of total general and administrative expenses in 2016, respectively. In 2016, the credit terms for many of our domestic customers was between 30 and 60 days; international customers are typically extended 90 days credit. Our cash flow suffered while waiting for such payments. Many of our direct clients, such as supermarkets and restaurants, did not make payments promptly due to poor sales. In addition, third party distributors’ ability to collect accounts receivable was worsened due to the bad sales performance and such distributors’ inability to collect receivables from their own clients. Other receivables that become bad debt include (i) raw materials we paid for but the suppliers did not provide the raw materials ordered by us and refused to refund the advance payment, or we did not agree on the quality of the raw materials and (ii) advance payments made by our salesmen for raw materials, and such salesmen left the company before we could confirm that the goods had been warehoused. Most of the aforementioned receivables were incurred after 2014, and under accounting principles we determined that 2016 was a suitable time to increase the ratio of provision for bad debts exceeding half a year to 50% and to 100% for over one year.
Government Subsidy Income
Government subsidy income decreased from approximately $1.9 million in 2015 to $1.2 million in 2016, representing grants received mostly from the Junan County, Beijing and Luotian government to assist us in our research and business development.
Income Before Taxation and Non-Controlling Interest
Income before taxation and non-controlling interest decreased $90.6 million, or 1820%, to negative $85.6 million in 2016 from $4.9 million in 2015, mainly due to provision for $45.6 million cost of revenue in 2016. In addition, decrease of gross profit and increase of general and administrative expense also leads to the decrease of income before taxation and non-controlling interest.
On December 1, 2016, we entered into two contracts of Transfer of Land Contract Right with village committee of Lanling County Jinling Town Qiaoshangou Village and village committee of Junan County Zhubian Town Huanheya Village, respectively, according to which, we contracted about 515 acres and 208 acres woods respectively to plant chestnut trees. The valid period of both of the contracts are 30 years. The consideration of contract is $543,809 (RMB3,750,000) and $200,992 (RMB1,386,000), respectively.
On November 6, 2016, we entered in to a nursery stock purchase agreement with Linyi Lingang Development District Runfa Nursery Stock Cooperation, according to which we purchased 812,500 chestnut seedlings in a consideration of $12,470,634 (RMB85,995,000). We paid to the seller $1,247,063 (RMB8,559,500) upon the execution of the agreement and agreed to pay the rest purchase fee when over 95% of the chestnut seedlings survived.
On December 1, 2016, we entered in to a nursery stock purchase agreement with Linyi Lingang Development District Runfa Nursery Stock Cooperation, according to which we purchased 327,600 chestnut seedlings in a consideration of $5,027,843 (RMB34,671,000). We paid to the seller $502,784 (RMB3,467,100) upon the execution of the agreement and agreed to pay the rest purchase fee when over 95% of the chestnut seedlings survived.
29
Income Taxes
Income taxes decreased approximately $1.5 million, or 43.5%, to $1.9 million in 2016, as compared to $3.4 million in 2015. This decrease was attributable to the lower income (excluding impairment) earned in 2016 as compared to 2015.
Non-Controlling Interest
Shandong Economic Development Investment holds 19.8% of the equity of our subsidiary Shandong Lorain, and Biobranco II, Alcides Branco, and Nuno Branco hold 49% of the equity of the Athena Group, which is reflected in the non-controlling interest of $7.3million in 2016 and $7.7million in 2015.
Loss attributable to common stockholders
Loss attributable to common stockholders decreased $138.6 million, or 5,290.7%, to negative $135.9 million in 2016 from $2.6 million in 2015. As our 51% controlled overseas subsidiaries suffered loss in 2016, its minority shareholders bore their proportion of loss.
Liquidity and Capital Resources General
The financial statements have been prepared on a going-concern basis. The going-concern basis assumes that assets will be realized and liabilities will be settled in the ordinary course of business in the amounts disclosed in the financial statements. Our ability to continue as a going concern is greatly dependent on our ability to realize its non-cash current assets such as receivables and inventory into cash in order to settle its current obligations. For the year ended December 31, 2016, we incurred a substantial loss of $136,361,080. As of December 31, 2016, we had a working capital deficit of approximately $21,271,226. These conditions raise substantial doubt as to whether we may continue as a going concern.
next 12 months. Our primary capital needs have been to fund theour working capital requirements necessitated by our sales growth, adding new products and expanding our facilities.requirements. In the past, our primary sources of financing have been cash generated from operations and short-term loans from banks in China. In addition, we obtained long term loans, private placement financing and convertible promissory note during the period 2011 to 2015.activities.
At
As of December 31, 2016 and 2015,2020, we had cash and cash equivalents (including restricted cash) were $1.4of $3.42 million and $25.5compared to $7.4 million respectively.as of December 31, 2019. The debt to assets ratio was 55.4%16.7% and 31.3%19.9% as of December 31, 20162020, and 2015, respectively.2019. We expect to continue to finance our operations and working capital needs in 20172021 from cash generated from operations short-term bank loans. As such, we are in discussions regarding potential financing transactions.and, if needed, private financings. If available liquidity is not sufficient to meet our operating and loan obligations as they come due,due. In that case, our plans include pursuing alternative financing arrangements or reducing expenditures as necessary to meet our cash requirements.
However, there is no assurance that we will be able to raise additional capital or reduce discretionary spending to provide liquidity if needed. Currently, the capital markets for small capitalization companies are difficult. Accordingly, weWe cannot be sure of the availability or terms of any alternative financing arrangements.
The following table provides detailed information about our net cash flow for all financial statement periods presented in this report.
| Cash Flows Data: | For year ended December 31, | |||||
| (In thousands of U.S. dollars) | 2016 | 2015 | ||||
| Net cash flows provided by operating activities | (29,785 | ) | 18,290 | |||
| Net cash flows (used in) investing activities | 8,906 | (9,097 | ) | |||
| Net cash flows (used in) financing activities | 3,043 | (14,682 | ) | |||
Cash Flows Data:
| For the year ended December 31, | ||||||||
| (In thousands of U.S. dollars) | 2020 | 2019 | ||||||
| Net cash flows used in operating activities | (3,499 | ) | (5,419 | ) | ||||
| Net cash flows used in investing activities | (853 | ) | (516 | ) | ||||
| Net cash flows provided by financing activities | 238 | 13,203 | ||||||
Operating Activities
Net
For the year ended December 31, 2020, net cash provided byused in operating activities for 2016 and 2015 was $29.7$3.5 million, which consisted primarily of net loss of $11.1 million, and $18.3was adjusted by depreciation and amortization of $0.4 million, respectively. write off receivables of $6.1 million, impairment of goodwill of $2.3 million and exchange loss of $1.8 million.
The decreaseCompany had an increase of approximately $48.0$1.5 million in net cash flows provided by operating activities resulted primarily from the increase in tradeaccounts and other receivables, an increase of approximately $13.0$4.1 million in 2016.prepayments and other current assets and an increase of $0.9 million in payables and other current liabilities.
30
For the year ended December 31, 2019, net cash used in operating activities was $5.4 million, which consisted primarily of net income of $8.5 million, and was adjusted by depreciation and amortization of $0.2 million, gain from disposal of investment and subsidiaries of $8.8 million.
The Company had an increase of $1.5 million in prepayments and other current assets and a reduction of $3.5 million in payables and other current liabilities.
Investing Activities
Net cash used in investing activities for 2016 and 2015 were $8.92020 was $0.9 million, and $9.1 million, respectively, with therepresenting an increase of approximately $18.0$0.4 million in net cash providedused in investing activities primarily from a decrease in restricted cash$0.5 million for the same period of $7.1 million2019. This is mainly due to the purchasing of plant and disposition of an investment for $1.9 million in 2016.equipment and intangible assets.
Financing Activities
Net cash used inprovided by financing activities for 2016 and 2015 were $3.0the year ended December 31, 2020, was $0.2million, representing a decrease of $13.0 million and $14.7 million, respectively, with the increase of $17.7 millionin net cash provided inby financing activities from loan proceeds$13.2 million for the same period of 2019. This is mainly due to repayment to related party and decrease from bank borrowings and debentures for approximately $3.1 million and no repayment long-term borrowings and notes payable in 2016.proceed from issuance of common stock.
Loan Facilities
As of December 31, 2016 and 2015, we carried $22.7 million and $21.4 million short term bank loans from foreign and Chinese domestic banks.
Critical Accounting Policies
The preparation of financial statements in conformity with the United States generally accepted accounting principles requires our management to make assumptions, estimates, and judgments that affect the amounts reported in the financial statements, including the notes thereto,to that, and related disclosures of commitments and contingencies, if any.
We consider our critical accounting policies to be those that require the more significant judgments and estimates in the preparation of financial statements, including those outlined in Note 2 to the following:
Restatement of prior financial statements --included herein.
The Company has discovered errors inevaluated the timing of revenues recognized during the year ended December 31, 2015. The Company recognizes revenue upon shipping of products to its customers where title of the goods passes upon departure from the Company’s facilities; however, in certain instances, contractual terms dictate that the customers are afforded seven days after the receipt of goods at their premises to inspect the goods for defects or spoilage and notify the Company. If the Company is not contacted within those seven days, the Company’s obligation to the customer are considered fully discharged and revenue should be recognized. Given the timing of these seven days, the Company believes that certain sales transactions have been erroneously recognized during the year ended December 31, 2015. The Company has rectified this error and the impact of the Company’s financial position and result of operations.
Method of Accounting -- We maintains its general ledger and journals with the accrual method accounting for financial reporting purposes. The financial statements and notes are representations of management. Accounting policies adopted by the Company conform to generally accepted accounting principles in the United States of America and have been consistently applied in the presentation of financial statements, which are compiledguidance above on the accrual basis of accounting.financial statements.
Use of estimates --The preparation of the financial statements in conformity with generally accepted accounting principles in the United States of America requires management to make estimates and assumptions that affect the reported amounts of assets and liabilities and disclosure of contingent assets and liabilities at the date of the financial statements and the reported amounts of revenues and expenses during the reporting periods. Management makes these estimates using the best information available at the time the estimates are made; however, actual results could differ materially from those estimates.
The use of estimates is critical to the carrying value of asset accounts such as accounts receivable, inventory, fixed assets, and intangible assets. We use estimates to account for the related bad debt allowance, inventory impairment charges, depreciation and amortization of our assets. In the food processing industry, these accounts have a significant impact on the valuation of our balance sheet and the results of our operations.
Principles of consolidation -- The consolidated financial statements are presented in US Dollars and include the accounts of the Company and its commonly controlled entity. All significant inter-company balances and transactions are eliminated in combination.
As of December 31, 2016, the particulars of the commonly controlled entities are as follows:
31
| Place of | Attributable equity | Registered | |||||||
| Name of Company | incorporation | interest | capital | ||||||
| % | $ | ||||||||
| International Lorain Holding Inc. | Cayman Islands | 100 | 46,659,135 | ||||||
| Junan Hongrun Foodstuff Co., Ltd. | PRC | 100 | 44,861,741 | ||||||
| Shandong Lorain Co., Ltd. | PRC | 80.2 | 12,123,985 | ||||||
| Beijing Lorain Co., Ltd. | PRC | 100 | 1,540,666 | ||||||
| Luotian Lorain Co., Ltd. | PRC | 100 | 3,797,774 | ||||||
| Shandong Greenpia Foodstuff Co., Ltd. | PRC | 100 | 2,303,063 | ||||||
| Dongguan Lorain Co., Ltd. | PRC | 100 | 149,939 |
In 2014, the Company invested $2,100,000 in Athena/Minerve Group whereby the Company controlling shareholder of Minerve. Minerve conducted operations in manufacturing, packaging and sales activities in France and import and storage operations in Portugal. During the years ended December 31, 2015, the financial position and results of operations of Minerve2020, there were accounted for as subsidiaries in the Company’s financial statements; however, during the year ended December 31, 2016, Minerve became insolvent and compelled into bankruptcy by creditors, and, ultimately liquidation. Accordingly, the Company lost control of Minerve and written of the value of its investment in Minerve. All receivables due by Minerve to subsidiaries still controlled by the Company have been written off. The Company’s consolidated financial statements at December 31, 2015 have been recast to provide improved comparability for the Company’s continuing operations.
Management has eliminated all significant inter-company balances and transactions in preparing the accompanying consolidated financial statements. Ownership interests of subsidiaries that the Company does not wholly-own are accounted for as non-controlling interests.
Shandong Economic Development Investment Corporation, which is a PRC state-owned entity, holds 19.8% equity interest in Shandong Lorain.
Accounting for the Impairment of Long-Lived Assets -- The long-lived assets held and used by us are reviewed for impairment whenever events or changes in circumstances indicate that the carrying amount of assets may not be recoverable. It is reasonably possible that these assets could become impaired as a result of technology or other industry changes. Determination of recoverability of assets to be held and used is by comparing the carrying amount of an asset to future net undiscounted cash flows to be generated by the assets.
If such assets are considered to be impaired, the impairment to be recognized is measured by the amount by which the carrying amount of the assets exceeds the fair value of the assets. Assets to be disposed of are reported at the lower of the carrying amount or fair value less costs to sell. The Company recognized impairment losses on certain long-lived assets during 2016.
Revenue recognition --The Company's revenue recognition policies are in compliance with Staff accounting bulletin (SAB) 104. Sales revenue is recognized at the date of shipment to customers when a formal arrangement exists, the price is fixed or determinable, the delivery is completed, no other significant obligations of the Company exist and collectibility is reasonably assured. Payments received before all of the relevant criteria for revenue recognition are satisfied are recorded as unearned revenue.
The Company's revenue consists of invoiced value of goods, net of a value-added tax (VAT). The Company allows its customers to return products if they are defective. However, this rarely happens and amounts returned have been de minimis.
Financial Instruments
The Company’s financial instruments, including cash and equivalents, accounts and other receivables, accounts and other payables, accrued liabilities and short-term debt, have carrying amounts that approximate their fair values due to their short maturities. ASC Topic 820, “Fair Value Measurements and Disclosures,” requires disclosure of the fair value of financial instruments held by the Company. ASC Topic 825, “Financial Instruments,” defines fair value, and establishes a three-level valuation hierarchy for disclosures of fair value measurement that enhances disclosure requirements for fair value measures. The carrying amounts reported in the consolidated balance sheets for receivables and current liabilities each qualify as financial instruments and are a reasonable estimate of their fair values because of the short period of time between the origination of such instruments and their expected realization and their current market rate of interest. The three levels of valuation hierarchy are defined as follows:
32
| ||
| ||
|
The Company analyzes all financial instruments with features of both liabilities and equity under ASC 480, “Distinguishing Liabilities from Equity,” and ASC 815. As of December 31, 2016 and 2015, the Company did not identify any assets and liabilities whose carrying amounts were required to be adjusted in order to present them at fair value.
Recent accounting pronouncements
In January 2015, The FASB issued ASU No. 2015-01, “Income Statement—Extraordinary and Unusual Items (Subtopic 225-20)”. This Update eliminates from GAAP the concept of extraordinary items. Subtopic 225-20, Income Statement—Extraordinary and Unusual Items, required that an entity separately classify, present, and disclose extraordinary events and transactions. Presently, an event or transaction is presumed to be an ordinary and usual activity of the reporting entity unless evidence clearly supports its classification as an extraordinary item. Paragraph 225-20-45-2 contains the following criteria that must both be met for extraordinary classification:
| ||
|
If an event or transaction meets the criteria for extraordinary classification, an entity is required to segregate the extraordinary item from the results of ordinary operations and show the item separately in the income statement, net of tax after income from continuing operations. The entity also is required to disclose applicable income taxes and either present or disclose earnings-per-share data applicable to the extraordinary item.
The amendments in this Update are effective for fiscal years, and interim periods within those fiscal years, beginning after December 15, 2015. A reporting entity may apply the amendments prospectively. A reporting entity also may apply the amendments retrospectively to all prior periods presented in the financial statements. Early adoption is permitted provided that the guidance is applied from the beginning of the fiscal year of adoption. The effective date is the same for both public business entities and all other entities.
The Company adopted ASU No. 2015-01 prospectively and has applied it to the presentation of the financial statements.
In September 2015, the FASB issued ASU 2015-16, the guidance eliminates the requirement to restate prior period financial statements for measurement period adjustments following a business combination. The new guidance requires that the cumulative impact of a measurement period adjustment (including the impact on prior periods) be recognized in the reporting period in which the adjustment is identified. The prior period impact of the adjustment should be either presented separately on the face of the income statement or disclosed in the notes. The Company is currently evaluating the impact the pronouncement will have on the Company’s consolidated financial statements.
As of December 31, 2016, there are no other recently issued accounting standards not yet adopted that would or could have a material effect on the Company’s consolidated financial statements.
Off-Balance Sheet Arrangements
We do not have any off-balance arrangements.
33
Correction of Error
The Company discovered errors in the timing of revenues recognized during the year ended December 31, 2015. The Company recognizes revenue upon shipping of products to its customers where title of the goods passes upon departure from the Company’s facilities; however, in certain instances, contractual terms dictate that the customers are afforded seven days inspection period after the receipt of goods at their premises to inspect the goods for defects or spoilage and notify the Company. If the Company is not contacted within those seven days, the Company’s obligation to the customer are considered fully discharged and revenue should be recognized. Given the timing of these seven days inspection period, the Company believes that certain sales transactions have been erroneously recognized during the year ended December 31, 2015. The Company has corrected this error and adjusted for the impact upon the Company’s financial position and result of operations as detailed below, which include the regrouping of amounts attributable to Discontinued Operations.
The effect of correction of these errors on results of operations for the above mentioned financial statements is as follows for 2015.
| As previously reported | Adjustment | Restated | |||||||
| Sales | $ | 215,315,437 | $ | (8,571,793 | ) | $ | 206,743,644 | ||
| Cost of sales | 179,197,430 | (7,076,892 | ) | 172,120,538 | |||||
| Gross profit | 36,118,006 | (1,494,900 | ) | 34,623,106 | |||||
| Operating income | 14,052,920 | (1,494,900 | ) | 12,558,020 | |||||
| Total other expense | (10,728,224 | ) | - | (10,728,224 | ) | ||||
| Loss before tax | 3,324,696 | (1,494,900 | ) | 1,829,796 | |||||
| Net loss | $ | (1,191,239 | ) | $ | (1,494,900 | ) | $ | (2,686,139 | ) |
The effect of correction of these errors on retained earnings and significant asset and liability accounts is as follows:
| As previously reported | Adjustment | Restated | |||||||
| Accounts receivable | 62,532,017 | (9,269,327 | ) | 53,262,690 | |||||
| Inventory | 43,712,048 | 6,779,018 | 50,491,066 | ||||||
| Total current asset | 191,049,927 | (2,449,159 | ) | 188,600,768 | |||||
| Total asset | 309,537,530 | (2,449,159 | ) | 307,088,371 | |||||
| Taxes payable | 5,863,261 | (1,017,181 | ) | 4,846,080 | |||||
| Total current liabilities | 97,003,426 | (1,017,181 | ) | 95,986,245 | |||||
| Total liabilities | 107,569,431 | (1,017,181 | ) | 106,552,250 | |||||
| Retained earnings | 101,389,920 | (1,370,586 | ) | 100,019,334 | |||||
| Total stockholders’ equity | 201,968,099 | (1,431,978 | ) | 200,536,121 | |||||
| Total liabilities andstockholders’ equity | 309,537,531 | (2,449,160 | ) | 307,088,371 |
34
ITEM 7A. QUANTITATIVE AND QUALITATIVE DISCLOSURE ABOUT MARKET RISK
Not applicable.
ITEM 8. FINANCIAL STATEMENTS AND SUPPLEMENTARY FINANCIAL DATA
The full text of our audited consolidated financial statements Asas of December 31, 20162020, begins on page F-1 of this Annual Reportannual report on Form 10-K.
ITEM 9. CHANGES IN AND DISAGREEMENTS WITH ACCOUNTANTS ON ACCOUNTING AND FINANCIAL DISCLOSURE.
None.
ITEM 9A. CONTROLS AND PROCEDURES
Disclosure Controls and Procedures
We maintain disclosure controls and procedures (as defined in Rule 13a-15(e) under the Securities and Exchange Act of 1934 (“Exchange Act”))Act) that are designed to ensure that information required to be disclosed in Exchange Act reports is recorded, processed, summarized and reported within the time periods specified in the SEC’s rules and forms, and that such information is accumulated and communicated to our management, including to our Chief Executive Officer and Chief Financial Officer, as appropriate, to allow timely decisions regarding required disclosure.
As required by Rule 13a-15 under the Exchange Act, our management, including our Chief Executive Officer and Chief Financial Officer, evaluated the effectiveness of our disclosure controls and procedures Asas of December 31, 2016.2020. Based on that evaluation, our Chief Executive Officer and Chief Financial Officer concluded that Asas of December 31, 2016,2020, our disclosure controls and procedures were not effective due to the material weakness in our internal control over financial reporting described below.
Internal Controls Overover Financial Reporting
Management’s Annual Report on Internal Control over Financial Reporting.
Our management is responsible for establishing and maintaining adequate internal control over financial reporting, as such term is defined in Rule 13a-15(f) of the Exchange Act. Under the supervision and with the participation of our management, including our Chief Executive Officer and Chief Financial Officer, we conducted an evaluation of the effectiveness of our internal control over financial reporting based upon the framework in Internal Control—IntegratedControl-Integrated Framework issued by the Committee of Sponsoring Organizations of the Treadway Commission (COSO). Based on that evaluation, our management concluded that, Asas of December 31, 2016,2020, our internal controls over financial reporting arewere not effective.
The material weakness and significant deficiency identified by our management Asas of December 31, 20162020, relates to the ability of the Company to record transactions and provide disclosures in accordance with generally accepted accounting principles in the United States (“U.S. GAAP.GAAP”). We did not have sufficient and skilled accounting personnel with an appropriate level of experience in the application of U.S. GAAP commensurate with our financial reporting requirements. For example, our staff members do not hold licenses such as Certified Public Accountant or Certified Management Accountant in the U.S., have not attended U.S. institutions for training as accountants, and have not attended extended educational programs that would provide sufficient relevant education relating to U.S. GAAP. Our staff will require substantial training to meet the demands of a U.S. public company and our staff’s understanding of the requirements of U.S. GAAP-based reporting are inadequate.
35
Remediation Initiative
We plan to provide U.S. GAAP training sessions to our accounting team. The training sessions will be organized to help our corporate accounting team gain experience in U.S. GAAP reporting and to enhance their awareness of new and emerging pronouncements with potential impact overon our financial reporting. We plan to continue to recruit experienced and professional accounting and financial personnel and participate in educational seminars, tutorials, and conferences and employ more qualified accounting staff in the future.
Changes in Internal Controls over Financial Reporting.Reporting
Other than as described above, during the fiscal year ended December 31, 2016,2020, there were no material changes in our internal control over financial reporting identified in connection with the evaluation performed during the fiscal year covered by this Annual Reportannual report that has materially affected or is reasonably likely to materially affect, our internal control over financial reporting.
Inherent Limitations over Internal Controls.
Our internal control over financial reporting is designed to provide reasonable assurance regarding the reliability of financial reporting and the preparation of financial statements for external purposes in accordance withunder U.S. GAAP. Our internal control over financial reporting includes those policies and procedures that:
(i) pertain to the maintenance of records that, in reasonable detail, accurately and fairly reflect the transactions and dispositions of our assets;
| (i) | pertain to the maintenance of records that, in reasonable detail, accurately and fairly reflect the transactions and dispositions of our assets; |
(ii) provide reasonable assurance that transactions are recorded as necessary to permit preparation of financial statements in accordance with U.S. GAAP, and that our receipts and expenditures are being made only in accordance with authorizations of our management and directors; and
| (ii) | provide reasonable assurance that transactions are recorded as necessary to permit preparation of financial statements under U.S. GAAP, and that our receipts and expenditures are being made only under authorizations of our management and directors; and |
(iii) provide reasonable assurance regarding prevention or timely detection of unauthorized acquisition, use, or disposition of our assets that could have a material effect on
| (iii) | provide reasonable assurance regarding prevention or timely detection of unauthorized acquisition, use, or disposition of our assets that could affect the financial statements. |
Management, including our Chief Executive Officer and Chief Financial Officer, does not expect that our internal controls willto prevent or detect all misstatements. A control system, noNo matter how well designed and operated, a control system can provide only reasonable, not absolute, assurance that the objectives of the control system are met. Further, the design of a control system must reflect the fact that there are resource constraints, and the benefits of such controls must be considered relative to their costs. Because of the inherent limitations in all control systems, no evaluation of internal controls can provide absolute assurance that all control issues and instances of misstatements, if any, have been detected or prevented. Also, projections of any evaluation of the effectiveness of controls in future periods are subject to the risk that those internal controls may become inadequate because of changes in conditions or that the degree of compliance with the policies or procedures may deteriorate.
Restatement of prior financial statements
The Company has discovered errors in the timing of revenues recognized during the year ended December 31, 2015. The Company recognizes revenue upon shipping of products to its customers where title of the goods passes upon departure from the Company’s facilities; however, in certain instances, contractual terms dictate that the customers are afforded seven days after the receipt of goods at their premises to inspect the goods for defects or spoilage and notify the Company. If the Company is not contacted within those seven days, the Company’s obligation to the customer are considered fully discharged and revenue should be recognized. Given the timing of these seven days, the Company believes that certain sales transactions have been erroneously recognized during the year ended December 31, 2015. The Company has rectified this error and the impact of the Company’s financial position and result of operations.
None.
ITEM 10. DIRECTORS, EXECUTIVE OFFICERS AND CORPORATE GOVERNANCE
Directors and Officers
The following table sets forth the name, age and position of each of our current directors as well as the date that each officer began their serviceand officers.
| Name | Age | Position | ||
| Bin Zhou | 30 | Chairman and Chief Executive Officer | ||
| Lili Hu | 41 | Chief Financial Officer | ||
| Chao Chen | 34 | Director | ||
| King Fai Leung | 48 | Director | ||
| Yang Cao | 28 | Director |
Mr. Bin Zhou has served as a director.
| Name | Age | Position | Director Since |
| Si Chen | 48 | Chairman, Chief Executive Officer, President and Director | 2007 |
| Yundong Lu | 36 | Chief Operating Officer and Director | 2008 |
| Yunqiang Sun | 44 | Chief Financial Officer | 2016 |
| Dekai Yin | 58 | Director | 2009 |
| Maoquan Wei | 64 | Director | 2008 |
| Hongxiang Yu | 37 | Director | 2016 |
36
MR. SI CHEN. Mr. Chen became our chief executive officer and director inof the Company since May 2007 upon the completion of our recapitalization, and was also appointed our president in September 2009. Mr. Chen founded Shandong Lorain, our first subsidiary, in 1994, and2019. He has served as the chairman of our subsidiaries since that time. Mr. Chen earned an associate degree from Linyi Normal University. Mr. Chen has been our Company’s founder and Chairman and Chief Executive Officer since inception. He is the individual most familiar with our business and industry, including the regulatory structure and other industry-specific matters, as well as being most capable of effectively identifying strategic priorities and leading the discussion and execution of strategy.
MR. YUNDONG LU. Mr. Lu was appointed as our Chief Operating Officer and was elected as a member of our board of directors effective August 1, 2008.of Xianning Bozhuang since March 2019. Mr. Lu joined the Company in 1994 and has held various positions since then. From April 2003 to May 2005, Mr. LuZhou was the General Managergeneral manager and legal representative of Beijing Lorain and the Deputy General ManagerHubei Qianding Equipment Manufacturing Co., Ltd., a mechanical equipment manufacturing company, from March 2016 to March 2019. He also served as supervisor of our subsidiaries. From May 2005Hubei Henghao Real Estate Development Co., Ltd., a real estate development company, from April 2014 to February 2007,June 2018. Mr. Lu was the General Manager of Lorain International Trading and the Deputy General Manager of our subsidiaries. From February to August 2008, Mr. Lu was the General Manager of our subsidiaries. Mr. Lu was recognized as an Outstanding Entrepreneur in Shandong Province in 2007. Mr. Lu earned an MBA from Shandong University and aZhou received his Bachelor of ArtsLaw degree from Shandong University. Mr. Lu, has been our Company’s Chief Operating Officer since 2008 and he has worked with our Company since 1994. Because of his tenure with the Company, he is familiar with our business and industry, including the regulatory structure and other industry-specific matters.National Judges College in Beijing, China.
MR. YUNQIANG SUN.Ms. Lili Hu Mr. Sun has been an accounting manager of Shandong Lorain Co., Ltd. since 2014. From 2009was appointed to 2014, Mr. Yunqiang Sun servedserve as the Chief Financial officerOfficer of Shandong Quanrixing Foodthe Company in June 2019. She has over ten years of accounting experience. Ms. Hu has served as the financial director of Xianning Bozhuang Tea Products Co., Ltd., a wholly-owned subsidiary of the Company, since July 2018. From 2007June 2016 to June 2018, Ms. Hu worked as an audit project manager with Hubei Puhua Lixin LLP, an audit firm in Hubei, China. From May 2014 to May 2016, Ms. Hu was a financial manager of Houfu Medical Device Co., Ltd., a medical device company in China. From January 2009 heto December 2013, Ms. Hu served as Account Managerthe financial director of Shandong Linyi Kaijia FoodHebei Rentian Gaopeng Mechanical Co., Ltd., a manufacturing company in China. From 1992January 2006 to 2007, he served asJune 2008, Ms. Hu was the Chief Financial Officer of Shandong Chunyuan FoodHubei Hongfa Telecommunications Co., Ltd. Mr. Yunqiang holds, a degreetelecommunications company in EconomicsChina. Ms. Hu graduated from Linyi Trading College.Hubei University of Science and Technology with a major in accounting. Ms. Hu is a Certified Public Accountant in China.
MR. MAOQUAN WEI.Ms. Chao Chen Mr. Wei, who has served as a memberdirector of our boardthe Company since April 2019. She has been an attorney at Beijing QianCheng law firm since August 2019. Prior to that, she was an attorney at Beijing Lanpeng Law Firm from May 2015 to August 2019. Her practice includes litigation, mergers and acquisitions and general corporate representation. Ms. Chen served as the legal manager of directors since 2008,LightInTheBox Holding Co., Ltd., an international online retail company that is listed on New York Stock Exchange, from November 2018 to January 2019. From September 2013 to May 2015, Ms. Chen served as the senior project manager of China Aviation Supplies Holding Company, a retired government official who held various positions in the government of Junan County, Shandong Province, China from 1990 to 2003, during which time Mr. Weicompany that provides aircraft procurement and support services on aviation supplies, and was responsible for overseeing the agricultural developmentplanning, procurement and execution of Junan County in the Shandong Provincecross-border projects. Ms. Chen received her Master of China. Most recently,Law degree from 1998 to 2003, Beijing Institute of Technology and her Bachelor of Law degree from Southwest University for Nationalities.
Mr. Wei was the ChairmanKing Fai Leung has served as a director of the Political Conservative Conference of Junan County. Mr. Wei also served as the Deputy Secretary of County CommitteeCompany since July 2019. He has over 20 years’ experience in finance and Deputy Chairman of Junan County. Mr. Wei has helped lead Junan County to win numerous honors, including Top 100 National Fruit Products County and National Chestnut Base County. Although retired, Mr. Wei’s expertise and experience with the agricultural economy and resources in the countryside is invaluable to our business.
MR. DEKAI YIN. Mr. Yin was appointed one of our directors in September 2009.accounting. He has been working as the Presidentexecutive director of Zibo branch of the Agricultural Bank of ChinaMaxima Energy Limited, an energy company in Hong Kong, since 2004. Before that position, Mr. Yin served as the Vice President and the President at Linyi branch of the Agricultural Bank of China from 1995-2004. Mr. Yin has a degree in economic management and is regarded as a senior economist due to his distinguished expertise in the banking and accounting industries and economic development. Our company greatly benefits from Mr. Yin’s invaluable expertise in banking and accounting systems and operations.
MR. HONGXIANG YU. Hongxiang Yu, age 37, has served as the head of the internal auditing department of Hongrun Construction Group Co., Ltd., a company listed on the Shenzhen Stock Exchange, and as general manager for Hongrun’s foundation engineering subsidiary from August 2006. In September 2015, Mr. Yu established and has been the Chairman of Shanghai Highlights Asset Management Co., Ltd., a company engaged in assets management and private equity investment in China. Since April 1, 2016, Mr. YuDecember 2018. He has also served as an independent director, chairman of the Vice Chairmanaudit committee and a member of Tianjin Dragon Film Limited,the remuneration and nomination committee of Daisho Microline Holdings Ltd., a Hong Kong-based investment holding company principally engaged in the manufacture and sales of printed circuit boards (HKG: 0567), since June 2015. In addition, Mr. Leung served as directors in various public companies, including Kirin Group Holdings Limited, an investment holding company principally engaged in film industry including the both upstreamfinancial related business (HKG: 8109), Chineseinvestors.com, Inc., a financial information website for Chinese-speaking investors (OTCQB: CIIX).Biostar Pharmaceuticals, Inc., a pharmaceutical and downstream chainmedical nutrient products company (OTC Pink: BSPM), and Hao Wen Holdings Limited, an investment holding company principally engaged in the manufacture and trading of film production businessbiomass fuel in China.China (HKG: 8019). Mr. Yu receivedLeung earned his Bachelor of Commerce in Accounting and Finance from Deakin University in Victoria, Australia. He is a Certified Public Account in both Hong Kong and Australia.
Ms. Yang Cao has served as a director of the Company since March 2020. She has been practicing commercial law as an attorney with Hubei Kaicheng Law Office since November 2019. Prior to that, she served as a legal counsel to Xianning High-Tech Industrial Zone, a municipal government authority providing infrastructure and resources to high-tech companies, from November 2016 to November 2019. From October 2015 to November 2016, Ms. Cao worked as a compliance officer at Qingdao Inter-Credit Group Wuhan Branch, a business consulting company. Ms. Cao received her LL.B. degree in International Trade in 2004 from University of PortsmouthHankou College and his Masteran LL.M. degree in International Human Resources Management in 2006 from Central China Normal University of Portsmouth in U.K.
There are no arrangements or understandings between any of our directors, officers and any other person pursuant to which any director was selected to serve as a director or officers of our company. Directors are elected until their successors are duly elected and qualified. There are no family relationships among our directors or officers.
37
Executive Officers
Our executive officers are appointed by our Board and serve at their discretion. The following table sets forth the name, age and position of each of our current executive officers as well as the date that each officer began their service as an executive officer.
| Name | Age | Position | Executive Officer Since |
| Si Chen | 48 | Chairman, Chief Executive Officer, President and Director | 2007 |
| Yunqiang Sun | 44 | Chief Financial Officer | 2016 |
| Yundong Lu | 36 | Chief Operating Officer and Director | 2008 |
See “Directors” on page 1 above for information on Messrs. Chen, Lu and Sun.
There are no arrangementsfamily relationships among our directors or understandings between anyofficers.
Board of Directors
Our Board met on five occasions during fiscal year 2020. Each of the members of our executive officersBoard attended more than 75% of the total number of meetings held by our Board and any other person pursuant tothe committees on which any executive officer was selected to serve as an executive officereach director served during fiscal year 2020.
Committees of our company.the Board
Audit Committee
The Audit Committee assists our boardBoard in monitoring:
| - | our accounting, auditing, and financial reporting processes; | |
| - | the integrity of our financial statements; | |
| - | internal controls and procedures designed to promote our compliance with accounting standards and applicable laws and regulations; and | |
| - | the appointment and evaluation of the qualifications and independence of our independent auditors. |
Dekai Yin, Hongxiang Yu,
King Fai Leung, Yang Cao and Maoquan Wei,Chao Chen, all of whom are independent directors under SEC rules and the rules of NYSE Amex,American, are currently serving as members of the Audit Committee. Mr. YuLeung is the chairman of the Audit Committee and is our audit committee financial expert.
The Audit Committee has adopted a written charter, a copy of which is available on our website on the Corporate Governance page under the Investor link at http://www.americanlorain.com,www.planetgreenholdings.com, and a printed copy of which is available to any shareholderstockholder requesting a copy by writing to: American Lorain Corporation,Planet Green Holdings Corp., c/o Board of Director Office, Beihuan Zhong Road, Junan County, Shandong, People’s Republic36-10 Union St. 2nd Floor, Flushing, NY, 11345. During the fiscal year ended December 31, 2020, our Audit Committee held 5 meetings.
Compensation Committee
The functions of China, 276600the Compensation Committee are as follows:
| ● | to assist our Board in discharging its responsibilities with respect to compensation of our executive officers and directors; |
| ● | to evaluate the performance of our executive officers; |
| ● | to assist our Board in developing succession plans for executive officers; and |
| ● | to administer our stock and incentive compensation plans and recommend changes in such plans to our Board as needed. |
The current members of the Compensation Committee are Chao Chen, King Fai Leung and Yang Cao. Ms. Chen is the chairman of the Compensation Committee. All current members of the Compensation Committee are independent directors, and all past members were independent directors at all times during their service on such Committee. None of the past or present members of our Compensation Committee are present or past employees or officers of the Company or any of our subsidiaries. No member of the Compensation Committee has had any relationship with us requiring disclosure under Item 404 of Regulation S-K. None of our executive officers serves on the Board of Directors or compensation committee of a company that has an executive officer that serves on our Board of Directors or Compensation Committee.
The Compensation Committee may not delegate its responsibilities to another committee, individual director or member of management.
The Compensation Committee meets on an annual basis and holds special meetings as needed. The Compensation Committee meetings may be called by the Committee chairman, the Chairman of the Board of Directors or a majority of Committee members. The Chief Executive Officer and Chief Financial Officer also provide recommendations to the Compensation Committee relating to compensation of other executive officers. The Compensation Committee held five meetings in fiscal year 2020.
ShareholderNominating and Corporate Governance
The Nominating and Corporate Governance assists the Board of Directors in identifying individuals qualified to become our directors and in determining the composition of the Board of Directors and its committees. The Nominating and Corporate Governance is responsible for, among other things:
| ● | to make recommendations to the Board of Directors with respect to the size and composition of the Board of Directors; |
| ● | to make recommendations to the Board of Directors on the minimum qualifications and standards for director nominees and the selection criteria for the Board members; |
| ● | to review the qualifications of potential candidates for the Board of Directors; |
| ● | to make recommendations to the Board of Directors on nominees to be elected at the annual meeting of stockholders; and |
| ● | to seek and identify a qualified director nominee, in the event that a director vacancy occurs, to be recommended to the Board of Directors for either appointment by the Board of Directors to serve the remainder of the term of a director position that is vacant or election at the annual meeting of the stockholders. |
The current members of the Nominating and Corporate Governance are Yang Cao, Chao Chen and King Fai Leung. Ms. Cao is the chairman of the Compensation Committee. During the fiscal year 2020, our Nominating and Corporate Governance Committee held five meetings.
Stockholder Nominations for Director
Shareholders
Stockholders may propose candidates for board membership by writing to American Lorain Corporation,to: Planet Green Holdings Corp., c/o Board of Director Office, Beihuan Zhong Road, Junan County, Shandong, People’s Republic of China, 276600.36-10 Union St. 2nd Floor, Flushing, NY, 11345. Any such proposal shall contain the name, holdings of our securities and contact information of the person making the nomination; the candidate'scandidate’s name, address and other contact information; any direct or indirect holdings of our securities by the nominee; any information required to be disclosed about directors under applicable securities laws and/or stock exchange requirements; information regarding related party transactions with our company and/or the stockholder submitting the nomination; any actual or potential conflicts of interest; the nominee'snominee’s biographical data, current public and private company affiliations, employment history and qualifications and status as "independent"“independent” under applicable securities laws and stock exchange requirements. Nominees proposed by stockholders will receive the same consideration as other nominees.
Section 16(a) Beneficial Ownership Reporting ComplianceCompensation Committee Interlocks and Insider Participation
Section 16(a)
None of our officers currently serves, or in the past year has served, as a member of the Exchange Act requires our executiveBoard of Directors or compensation committee of any entity that has one or more officers directors and persons who beneficially own more than 10% of our common stock to file initial reports of ownership and reports of changes in ownership with the Securities and Exchange Commission, which we also refer to throughout this report as the SEC. Based solelyserving on our reviewBoard of the copies of such forms furnished to us and written representations from our executive officers, directors and such beneficial owners, we believe that all filing requirements of Section 16(a) of the Exchange Act were timely complied with during the fiscal year ended December 31, 2016Directors.
38
Code of Ethics
Our Board adopted a Code of Ethics that applies to all of our directors, executive officers, including our principal executive officer, principal financial officer and principal accounting officer, and employees. The Code of Ethics addresses, among other things, honesty and ethical conduct, conflicts of interest, compliance with laws, regulations and policies, including disclosure requirements under the federal securities laws, confidentiality, trading on inside information, and reporting of violations of the code. The Code of Ethics is available on the Corporate Governance page of our website under the Investor link at www.americanlorain.com,http://www.planetgreenholdings.com, and a copy of the Code of Ethics is available to any shareholderstockholder requesting a copy by writing to: American Lorain Corporation,Planet Green Holdings Corp., c/o Board of Director Office, Beihuan Zhong Road, Junan County, Shandong, China 276600.36-10 Union St. 2nd Floor, Flushing, NY, 11345. We intend to disclose on our website, in accordance with all applicable laws and regulations, amendments to, or waivers from, our Code of Ethics.
Legal Proceedings
To the Company’s knowledge, there are no material proceedings to which any of our directors and officers or affiliates of the Company is a party adverse to the Company or has a material interest adverse to the Company.
ITEM 11. EXECUTIVE COMPENSATION
Summary Compensation Table
The following table sets forth information concerning all forms of compensation earned by our named executive officers during the fiscal years ended December 31, 20152019 and 20162018 for services provided to us and our subsidiaries.subsidiaries and VIEs. None of our current executive officers earned compensation that exceeded $100,000 during the fiscal years ended December 31, 20152019 or 2016.2018.
| Name and Principal | Stock | Option | All Other | ||||||||||||||||||
| Position | Year | Salary | Bonus | Awards | Awards | Compensation | Total | ||||||||||||||
| (a) | (b) | (c) | (d) | (e) | (f) | (g) | (h) | ||||||||||||||
| Si Chen, | 2016 | $ | 66,000 | $ | -0- | $ | -0- | $ | -0- | $ | -0- | $ | 66,000 | ||||||||
| Chairman of Board of Directors, and Chief Executive Officer | 2015 | $ | 66,000 | $ | -0- | $ | -0- | $ | -0- | $ | -0- | $ | 66,000 | ||||||||
| Yundong Lu, Chief | 2016 | $ | 16,154 | $ | -0- | $ | -0- | $ | -0- | $ | -0- | $ | 16,154 | ||||||||
| Operating Officer and Director | 2015 | $ | 16,154 | $ | -0- | $ | -0- | $ | -0- | $ | -0- | $ | 16,154 | ||||||||
| Yunqiang Sun, Chief Financial Officer | 2016 | $ | 27,096 | $ | -0- | $ | -0- | $ | -0- | $ | -0- | $ | 27,096 |
| Stock | Option | All Other | ||||||||||||||||||||||||||
| Name and Principal Position | Year | Salary | Bonus | Awards | Awards | Compensation | Total | |||||||||||||||||||||
| (a) | (b) | (c) | (d) | (e) | (f) | (g) | (h) | |||||||||||||||||||||
| Bin Zhou, | 2020 | $ | 96,000 | $ | - | $ | - | $ | - | $ | - | $ | 96,000 | |||||||||||||||
| Chairman, Chief Executive Officer | 2019 | $ | 96,000 | $ | - | $ | - | $ | - | $ | - | $ | 48,000 | |||||||||||||||
| and Director | ||||||||||||||||||||||||||||
| - | - | - | - | |||||||||||||||||||||||||
| Lili Hu, | 2020 | $ | 48,000 | $ | - | $ | - | $ | - | $ | - | $ | 48,000 | |||||||||||||||
| Chief Financial Officer | 2019 | $ | 48,000 | $ | - | $ | - | $ | - | $ | - | $ | 48,000 | |||||||||||||||
| - | - | - | - | |||||||||||||||||||||||||
| Daqi Cui, | 2020 | $ | 96,000 | $ | - | $ | - | $ | - | $ | - | $ | 96,000 | |||||||||||||||
| Chief Operating Officer | 2019 | $ | 96,000 | $ | - | $ | - | $ | - | $ | - | $ | 96,000 | |||||||||||||||
On June 24, 2019, the Board appointed Lili Hu to serve as the Chief Financial Officer. Pursuant to Mr. Chen’sthe employment agreement with Ms. Hu, we paid Mr. Chenare obligated to pay Ms. Hu a base salarycompensation of $66,000 in cash during fiscal years ended December 31, 2016 and 2015. Mr. Chen’s$48,000 per year.
On June 18, 2019, the Board appointed Daqi Cui to serve as the Chief Operating Officer. Pursuant to the employment agreement does not provide any change in control or severance benefits and we do not have any separate change-in-control agreements with Mr. Chen or anyCui, we are obligated to pay Mr. Cui a compensation of our other executive officers.$96,000 per year. Mr. Cui resigned as Chief Operating Office on October 21, 2020 due to his personal health reason and he continued to be employed by the Company.
On May 14 and October 25, 2019, the Board appointed Bin Zhou as a member of the Board and the Chief Executive Officer, respectively. Pursuant to Mr. Sun’sthe employment agreement with Mr. Zhou, we are obligated to pay Mr. Zhou a base salarycompensation of RMB 15,000$96,000 per month ($2,258 at then current exchange rate).year.
ITEM 12. SECURITY OWNERSHIP OF CERTAIN BENEFICIAL OWNERS AND MANAGEMENT AND RELATED STOCKHOLDERSHAREHOLDER MATTERS
The following table sets forth information regarding beneficial ownership of our common stock as of September 29, 2016May 13, 2020 (i) by each person who is known by us to beneficially own more than 5% of our common stock; (ii) by each of our named executive officers and directors and (iii) by all of our officers and directors as a group. Beneficial ownership is determined in accordance with the rules of the SEC that deem shares to be beneficially owned by any person who has voting or investment power with respect to such shares. Except as otherwise indicated, the persons listed below have advised us that they have direct sole voting and investment power with respect to the shares listed as owned by them.
Unless otherwise specified, the address of each of the persons set forth below is c/o American Lorain Corporation, Beihuan Zhong Road, Junan County, Shandong, China 276600.Planet Green Holdings Corp., c/o Board of Director Office, 36-10 Union St. 2nd Floor, Flushing, NY, 11345.
In the table below, percentage ownership is based on 38,259,49020,009,930 shares of our common stock outstanding as of SeptemberMarch 29, 2016.2021.
| Amount and nature | Percent of | |||||
| of | class | |||||
| Name and title of beneficial owner | beneficial ownership | |||||
| Mr. Si Chen, Chairman, CEO and President(1) | 3,978,988 | 10.4% | ||||
| DEG-Deutsche Investitions- und Entwicklungsgesellshaft mbH(2) | 10,794,066 | 28.2% | ||||
| Tongley Investments Ltd.(3) | 4,183,234 | 10.9% | ||||
| Jade Lane Group Limited(4) | 2,355,276 | 6.2% | ||||
| Mr. Yundong Lu, COO and Director | 727 | * | ||||
| Mr. Dekai Yin, Director | - | * | ||||
| Mr. Maoquan Wei, Director | 174 | * | ||||
| Mr. Hongxiang Yu, Director(5) | - | * | ||||
| Mr. Yunqiang Sun(6) | - | * | ||||
| All officers and directors as a group (6 persons) | 3,979,889 | 10.4% |
39
| Name and title of beneficial owner | Amount and nature of beneficial ownership | Percent of class | ||||||
| 5% or Greater Stockholders | ||||||||
| Xiaodong Cai (1) | 1,320,000 | 6.5 | % | |||||
| Yongsheng Chen(1) | 1,980,000 | 9.8 | % | |||||
| Zhichao Du(2) | 1,200,000 | 5.9 | % | |||||
| Xue Wang (2) | 1,320,000 | 6.5 | % | |||||
| Executive Officers, Directors and Director Nominees | ||||||||
| Bin Zhou, Chairman, Chief Executive Officer and Director (3) | 1,622,000 | 8.1 | % | |||||
| Lili Hu, Chief Financial Officer | - | - | ||||||
| Chao Chen, Director | - | - | ||||||
| King Fai Leung, Director | - | - | ||||||
| Yang Cao, Director | - | - | ||||||
| All executive officers, directors and director nominees as a group (five individuals) | 1,622,000 | 8.1 | % | |||||
* Less than 1%
| (1) | On March 9, 2021, the Company entered into a Share Exchange Agreement with Jilin Chuangyuan Chemical and Mr. Xiaodong Cai and Mr. Yongsheng Chen, shareholders of Jilin Chuangyuan Chemical Co., Ltd. Pursuant to the Share Exchange Agreement, among other things and subject to the terms and conditions contained therein, the Company agreed to effect an acquisition of the Jilin Chuangyuan by acquiring from the sellers 75% of the outstanding equity interests of the Jilin Chuanyuan in exchange of 3,300,000 common shares. On March 10, 2021, the Company closed the Acquisition. |
| (2) |
|
| (3) | 972,000 shares of common stock, |
| |
| |
| |
| |
|
Changes in Control
There are currently no arrangements which would result in a change in control of us.
ITEM 13. CERTAIN RELATIONSHIPS AND RELATED TRANSACTIONS, AND DIRECTOR INDEPENDENCE.
Related Party Transactions
Pursuant to a Share Pledge Agreement, dated October 19, 2010 (the “Share Pledge Agreement”),
On May 14, 2019, Bin Zhou, the Mr. Si Chen, our chief executive officerChief Executive Officer and chairman, has pledged 5,313,574 shares of Common Stock (the “Pledged Shares”) for the benefit of DEG-Deutsche Investitions- und Entwicklungsgesellshaft mbH (“DEG”) in order to secure the obligationsChairman of the Company and its subsidiary Junan Hongrun Foodstuff Co., Ltd. (“Junan Hongrun”) under a Loan Agreement, dated May 31, 2010, among the Company, DEG andacquired 972,000 shares of common stock, in exchange for Mr. Si Chen (the “Loan Agreement”). In the event that the value of the pledged assets is less than 150% of the amounts made available to the Junan Hongrun under the Loan Agreement, DEG has the right to require additional securityZhou’s 90% equity ownership in the form of fixed assets or shares under the Loan Agreement and Share Pledge Agreement. PursuantXianning Bozhuang, pursuant to a lettershare exchange agreement, dated November 15, 2012, Mr. Si Chen has pledged an additional 5,480,492 shares of Common Stock to DEG under the Pledge Agreement in order to secure the obligations of the Borrower under the Loan Agreement. The total number of shares pledged under the Pledge Agreement is now 10,794,066 shares of Common Stock. For so long as no event of default under the Loan Agreement has occurred, Mr. Si Chen continues to retain all voting rights with respect to the Pledged Shares.
40
On March 13, 2014, Mr. Si Chen, our chief executive officer and chairman, provided a personal guaranty of the March 13, 2014 Convertible Promissory Note issued by the Company to an investor in the principal amount of $3.5 million.
On September 7, 2016, DEG acquired beneficial ownership of 10,794,066 shares of Common Stock upon foreclosure of the pledge from Mr. Si Chen. Such shares constitute approximately 28.2% of the total number of shares of Common Stock of the Issuer outstanding as of September 30, 2015.May 9, 2019.
Policy for Approval of Related Party Transactions
Our Audit Committee Charter provides that all related party transactions required to be disclosed under SEC rules are to be reviewed by the Audit Committee.
Director Independence
NYSE American listing standards require that a majority of our Board of Directors be independent. An “independent director” is defined generally as a person other than an officer or employee of the company or its subsidiaries or any other individual having a relationship which in the opinion of the company’s board of directors, would interfere with the director’s exercise of independent judgment in carrying out the responsibilities of a director. Our Board of Directors has determined that Chao Chen, King Fai Leung, Yang Cao are “independent directors” as defined in the NYSE American listing standards and applicable SEC rules.
ITEM 14. PRINCIPAL ACCOUNTING FEES AND SERVICESSERVICES..
WWC.,
WWC, P.C. is the Company’s independent registered public accounting firm for the fiscal year endingyears ended December 31, 20162019 and 2020 and the accounting fees is $170,000.in each such period were $160,000 and $180,000. Such fees related to audit services provided by WWC, P.C. No audit-related or tax services were provided by WWC, P.C. during such periods.
ITEM 15. EXHIBITS, FINANCIAL STATEMENT SCHEDULES
(a) (1 and 2)Financial Statement and Schedules
The financial statements contained in the “Audited Financial Statements” beginning on page F-1 of this Annual Reportannual report on Form 10-K.
(b)Exhibits
41
| ||
|
| Exhibit No. | Description | |
| ||
| ||
| ||
| ||
| ||
| ||
| ||
| ||
| ||
|
42
| List of subsidiaries of the registrant | ||
| Certification of Chief Financial Officer, pursuant to Section 302 of the Sarbanes-Oxley Act of 2002 * | ||
| Certification of Chief Executive Officer, pursuant to 18 U.S.C. Section 1350, as adopted pursuant to Section 906 of the Sarbanes-Oxley Act of 2002 | ||
| Certification of Chief Financial Officer, pursuant to 18 U.S.C. Section 1350, as adopted pursuant to Section 906 of the Sarbanes-Oxley Act of 2002 | ||
| XBRL Instance | ||
| XBRL Taxonomy Extension | ||
| XBRL Taxonomy Calculation | ||
| XBRL Taxonomy Label | ||
| XBRL Definition Linkbase | ||
| XBRL Definition Linkbase |
*
| * | Filed herewith |
| ** | Furnished herewith |
** Furnished herewithITEM 16. FORM 10-K SUMMARY
† Management contract, compensatory plan or arrangement.
43Not applicable.
SIGNATURES
Pursuant to the requirements of Section 13 or 15(d) of the Securities Exchange Act of 1934, the registrant has duly caused this report to be signed on its behalf by the undersigned, thereunto duly authorized.
| Date: | By: | /s/ |
| Bin Zhou, Chief Executive Officer and Chairman (Principal Executive Officer) | ||
| By: | /s/ Lili Hu | |
Lili Hu, Chief Financial Officer (Principal Financial and Accounting Officer) |
Pursuant to the requirements of the Securities Exchange Act of 1934, this annual report has been signed by the following persons in the capacities and on the dates indicated.
| Signature | Title | Date | ||
| /s/ | ||||
| March 31, 2021 | ||||
| (Principal Executive Officer) | ||||
44
American Lorain CorporationAudited Consolidated Financial StatementsDecember 31, 2016 and 2015
45
| /s/ Lili Hu | Chief Financial Officer and Director | March 31, 2021 | ||
| Lili Hu | (Principal Financial Officer and Principal Accounting Officer) | |||
| /s/ Chao Chen | Director | March 31, 2021 | ||
| Chao Chen | ||||
| /s/ King Fai Leung | Director | March 31, 2021 | ||
| King Fai Leung | ||||
| /s/ Yang Cao | Director | March 31, 2021 | ||
| Yang Cao |
PLANET GREEN HOLDINGS CORP.
AUDITED CONSOLIDATED FINANCIAL STATEMENTS
DECEMBER 31, 2020 AND 2019
(Stated in US Dollars)
F-1


Report of Independent Registered Public Accounting Firm
| To: | The Board of Directors and Stockholders of |
Opinion on the Financial Statements
We have audited the accompanying consolidated balance sheets of American Lorain CorporationPlanet Green Holdings Corp. and its subsidiaries (collectively the “Company”)(the Company) as of December 31, 20162020 and 2015,2019, and the related consolidated statements of income,operations and comprehensive income, stockholders’changes in shareholders’ equity, and cash flows for each of the years in the two-year period ended December 31, 2016. The2020, and the related notes (collectively referred to as the financial statements). In our opinion, the financial statements present fairly, in all material respects, the financial position of the Company as of December 31, 2020 and 2019, and the results of its operations and its cash flows for the two-year period ended December 31, 2020, in conformity with accounting principles generally accepted in the United States of America.
Basis for Opinion
These financial statements are the responsibility of the Company’s management is responsible for these financial statements.management. Our responsibility is to express an opinion on thesethe Company’s financial statements based on our audits. We are a public accounting firm registered with the Public Company Accounting Oversight Board (United States) (PCAOB) and are required to be independent with respect to the Company in accordance with the U.S. federal securities laws and the applicable rules and regulations of the Securities and Exchange Commission and the PCAOB.
We conducted our audits in accordance with the standards of the Public Company Accounting Oversight Board (United States).PCAOB. Those standards require that we plan and perform the audit to obtain reasonable assurance about whether the financial statements are free of material misstatement.misstatement, whether due to error or fraud. The companyCompany is not required to have, nor were we engaged to perform, an audit of its internal control over financial reporting. Our audit included considerationAs part of our audits, we are required to obtain an understanding of internal control over financial reporting, as a basis for designing audit procedures that are appropriate in the circumstances, but not for the purpose of expressing an opinion on the effectiveness of the company’sCompany’s internal control over financial reporting. Accordingly, we express no such opinion. An audit also includes
Our audits included performing procedures to assess the risks of material misstatement of the financial statements, whether due to error or fraud, and performing procedures that respond to those risks. Such procedures included examining, on a test basis, evidence supportingregarding the amounts and disclosures in the financial statements, assessingstatements. Our audits also included evaluating the accounting principles used and significant estimates made by management, as well as evaluating the overall presentation of the financial statement presentation.statements. We believe that our audits provide a reasonable basis for our opinion.
In our opinion,
Critical Audit Matters
The critical audit matter communicated below is matter arising from the current period audit of the consolidated financial statements referredthat were communicated or required to above present fairly, in allbe communicated to the audit committee and that: (1) relate to accounts or disclosures that are material respects,to the financial position of the Company as of December 31, 2016 and 2015, and the results of its operations and its cash flows for each of the years in the two-year period ended December 31, 2016, in conformity with accounting principles generally accepted in the United States of America.
The Company identified an error in itsconsolidated financial statements asand (2) involved our especially challenging, subjective, or complex judgments. The communication of December 31, 2015 and for the year then ended. It has rectified the errorcritical audit matters does not alter in the accompanying financial statements. For further details, refer to Note 22. We do not qualifyany way our opinion on the accompanyingconsolidated financial statements, in regards to this matter.
The accompanying financial statements have been prepared assuming that the Company will continuetaken as a going concern. whole, and we are not, by communicating the critical audit matters below, providing separate opinions on the critical audit matters or on the accounts or disclosures to which they relate.
Evaluation of the carrying value of goodwill in the Canadian reporting unit
As discussed in Note 32 to the consolidated financial statements, the Company had incurred substantial losses duringperforms a goodwill impairment test on an annual basis or whenever events or changes in circumstances indicate that the yearcarrying value of a reporting unit might exceed its fair value. The discount rate applied to projected cash flows is important elements used by the Company in determining the fair value of the reporting unit and had working capital deficit, which raises substantial doubt about its abilitythe amount of goodwill impairment losses. In the last quarter of 2020, the Company performed an annual goodwill impairment test in response to continuethe decline in current market conditions as a going concern. Management’s plansresult of the COVID-19 pandemic. The goodwill was determined to be impaired, and impairment losses of $2.34 million was recorded.
We identified the evaluation of the discount rate applied to projected cash flows used in regardsthe assessment of the carrying value of goodwill for the reporting unit, for which such assumptions are used by the Company in the determination of goodwill impairment losses, as a critical audit matter. Specifically, the evaluation of these assumptions required the application of subjective auditor judgment because changes to these matters are also describedassumptions may have a substantial impact on the determination of fair value of the reporting unit. We gathered data and evidence to performed sensitivity analyses to determine the significance of the assumptions used to determine the fair value of the reporting unit, which required a higher degree of auditor judgment.
Addressing the matter involved evaluating the Company’s assessment of the value of the reporting unit under the discounted cash flow method. We gathered data and evidence, performed independent analysis, and exercised professional judgment during our evaluation process.
/s/ WWC, P.C.
WWC, P.C.
Certified Public Accountants
We have served as the Company’s auditor since 2007
San Mateo, California
March 31, 2021

PLANET GREEN HOLDINGS CORP.
NOTES TO AUDITED CONSOLIDATED FINANCIAL STATEMENTS
FOR THE YEARS ENDED DECEMBER 31, 2020 AND 2019
(Stated in Note 3. These financial statements do not include any adjustments that might result fromU.S. Dollars)
| 2020 | 2019 | |||||||
| Assets | ||||||||
| Current assets | ||||||||
| Cash and cash equivalents | $ | 3,415,751 | $ | 7,272,510 | ||||
| Trade receivables, net | 835,384 | 66,673 | ||||||
| Inventories | 2,251,628 | 1,939,025 | ||||||
| Advances and prepayments to suppliers | 5,922,562 | 1,558,922 | ||||||
| Other receivables and other current assets | 1,091,815 | 270,421 | ||||||
| Related party receivable | - | - | ||||||
| Discontinued operations - current assets | - | 7,050,047 | ||||||
| Total current assets | $ | 13,517,140 | $ | 18,157,598 | ||||
| Non-current assets | ||||||||
| Property, plant and equipment, net | 4,596,637 | 4,152,708 | ||||||
| Intangible assets, net | 1,516,467 | 1,533,927 | ||||||
| Construction in progress, net | - | - | ||||||
| Goodwill | 2,340,111 | - | ||||||
| Discontinued operations – non-current assets | - | 2,053,865 | ||||||
| Total non-current assets | 8,453,215 | 7,740,500 | ||||||
| Total Assets | $ | 21,970,355 | $ | 25,898,098 | ||||
| Liabilities and Stockholders’ Equity | ||||||||
| Current liabilities | ||||||||
| Accounts payable | $ | 1,302,850 | $ | 765,427 | ||||
| Taxes payable | 198,683 | 106,315 | ||||||
| Accrued liabilities and other payables | 1,848,598 | 1,485,365 | ||||||
| Customers deposits | 241,893 | 52,722 | ||||||
| Related party payables | 19,850 | 2,003,390 | ||||||
| Deferred income | 15,682 | - | ||||||
| Discontinued operations - current liabilities | - | 376,645 | ||||||
| Total current liabilities | $ | 3,627,556 | $ | 4,789,864 | ||||
| Non-current liabilities | ||||||||
| Long-term payables | 31,364 | - | ||||||
| Discontinued operations – non-current liabilities | - | 373,728 | ||||||
| Total non-current liabilities | $ | 31,364 | $ | 373,728 | ||||
| Total Liabilities | $ | 3,658,919 | $ | 5,163,592 | ||||
| Stockholders’ Equity | ||||||||
| Preferred Stock, $0.001 par value, 5,000,000 shares authorized; 0 shares issued and outstanding as of December 31, 2020 and 2019, respectively | - | - | ||||||
| Common Stock, $0.001 par value, 200,000,000 shares authorized; 11,809,930 and 7,877,765 shares issued and outstanding as of December 31, 2020 and 2019, respectively | 11,810 | 7,878 | ||||||
| Additional paid-in capital | 95,659,360 | 85,803,421 | ||||||
| Accumulated deficit | (84,331,897 | ) | (73,280,734 | ) | ||||
| Accumulated other comprehensive income | 6,972,163 | 8,203,941 | ||||||
| Total Stockholders’ Equity | $ | 18,311,436 | $ | 20,734,506 | ||||
| Total Liabilities and Stockholders’ Equity | $ | 21,970,355 | $ | 25,898,098 | ||||
See Accompanying Notes to the outcome of this uncertainty.Financial Statements
![]()
PLANET GREEN HOLDINGS CORP.American Lorain CorporationAUDITED CONSOLIDATED STATEMENTS OF OPERATIONSConsolidated Balance SheetsAND COMPREHENSIVE INCOME (LOSS)As of DecemberFOR THE YEARS ENDED DECEMBER 31, 2016 and 20152020 AND 2019
(Stated in US Dollars)
| 2016 | 2015 | |||||
| Assets | (Restated) | |||||
| Current assets | ||||||
| Cash and cash equivalents | $ | 426,054 | $ | 17,142,234 | ||
| Restricted cash | 971,471 | 8,309,971 | ||||
| Trade receivables, net | 3,253,333 | 36,707,352 | ||||
| Inventories | 11,840,748 | 28,251,212 | ||||
| Advances and prepayments to suppliers | 29,873,479 | 25,972,384 | ||||
| Other receivables and other current assets | 708,892 | 1,646,762 | ||||
| Discontinued operations – assets held for sale | 19,745,847 | 70,570,853 | ||||
| Total current assets | $ | 66,819,824 | $ | 188,600,768 | ||
| Non-current assets | ||||||
| Investment | 118,471 | - | ||||
| Plant and equipment, net | 51,897,283 | 58,754,754 | ||||
| Intangible assets, net | 12,586,515 | 13,808,576 | ||||
| Construction in progress, net | 468,501 | 13,873,227 | ||||
| Discontinued operations – long term assets held for sale | 16,362,855 | 32,051,046 | ||||
| Total Assets | $ | 148,253,449 | $ | 307,088,371 | ||
| Liabilities and Stockholders’ Equity | ||||||
| Current liabilities | ||||||
| Short-term bank loans | $ | 22,667,482 | $ | 21,446,069 | ||
| Long-term debt – current portion | 28,948,300 | 21,031,659 | ||||
| Capital lease – current portion | 1,007,185 | 464,090 | ||||
| Accounts payable | 5,514,477 | 4,367,605 | ||||
| Taxes payable | 248,807 | 2,527,899 | ||||
| Accrued liabilities and other payables | 8,611,816 | 2,746,569 | ||||
| Customers deposits | 1,347,136 | 237,311 | ||||
| Discontinued operations - liabilities | 13,811,908 | 43,165,043 | ||||
| Total current liabilities | $ | 82,157,111 | $ | 95,986,245 | ||
| Long-term liabilities | ||||||
| Notes payable and debenture | - | 9,544,425 | ||||
| Capital lease – long term portion | - | 694,989 | ||||
| Discontinued operations – long-term liabilities | - | 326,591 | ||||
| Total Liabilities | $ | 82,157,111 | $ | 106,552,250 | ||
| Stockholders’ Equity | ||||||
| Preferred Stock, $0.001 par value, 5,000,000 shares authorized; 0 shares issued and outstanding at December 31, 2016 and 2015, respectively | $ | - | $ | - | ||
| Common Stock, $0.001 par value, 200,000,000 shares authorized; 38,274,490 and 38,260,000 shares issued and outstanding as of December 31, 2016 and 2015, respectively | 38,275 | 38,260 | ||||
| Additional paid-in capital | 57,852,249 | 57,842,064 | ||||
| Statutory reserves | 25,103,354 | 24,660,666 | ||||
| (Accumulated deficit)/ retained earnings | (36,396,455 | ) | 100,019,334 | |||
| Accumulated other comprehensive income | 12,171,006 | 10,259,909 | ||||
| Non-controlling interests | 7,327,909 | 7,715,888 | ||||
| Total Stockholders’ Equity | $ | 66,096,338 | $ | 200,536,121 | ||
| Total Liabilities and Stockholders’ Equity | $ | 148,253,449 | $ | 307,088,371 |
| 2020 | 2019 | |||||||
| Net revenues | $ | 3,638,801 | $ | 1,106,482 | ||||
| Cost of revenues | 2,369,736 | 464,402 | ||||||
| Gross profit | 1,269,065 | 642,080 | ||||||
| Operating expenses: | - | - | ||||||
| Selling and marketing expenses | 160,109 | 40,069 | ||||||
| General and administrative expenses | 3,896,489 | 904,913 | ||||||
| Total operating expenses | 4,056,598 | 944,982 | ||||||
| Operating loss | (2,787,533 | ) | (302,902 | ) | ||||
| Other income (expenses): | ||||||||
| Interest income(expenses), net. | (23,407 | ) | (9,725 | ) | ||||
| Other income(expenses), net. | 27,318 | 68,376 | ||||||
| Impairment of goodwill | (2,339,829 | ) | - | |||||
| Write off receivables from disposal of former subsidiaries | (6,078,623 | ) | 8,783,848 | |||||
| Total other (expenses) income | (8,414,541 | ) | 8,842,499 | |||||
| Loss before taxes | (11,202,074 | ) | 8,539,597 | |||||
| Income tax expense | - | - | ||||||
| Income (loss) from continuing operations | (11,202,074 | ) | 8,539,597 | |||||
| Discontinued Operations: | ||||||||
| Income (loss) from discontinued operations | 150,911 | (5,592,401 | ) | |||||
| Net income (loss) from discontinuing operations | 150,911 | (5,592,401 | ) | |||||
| Net (loss) income | (11,051,163 | ) | 2,947,196 | |||||
| Other comprehensive income: | ||||||||
| Foreign currency translation adjustment | (1,231,778 | ) | (1,588,342 | ) | ||||
| Comprehensive (loss) income | (12,282,941 | ) | $ | 1,358,854 | ||||
| (Loss) income per share from continuing operations - Basic and diluted | (1.11 | ) | 1.24 | |||||
| Income (loss) per share from discontinued operations-Basic and diluted | 0.01 | (0.81 | ) | |||||
| (Loss) income per share - Basic and diluted | (1.09 | ) | 0.43 | |||||
| Basic and diluted weighted average shares outstanding | 10,112,648 | 6,897,710 | ||||||
See Accompanying Notes to the Financial Statements
American Lorain CorporationPLANET GREEN HOLDINGS CORP.
Consolidated Statements of Operations and Comprehensive LossStockholders’ Equity
For the years ended December 31, 20162020 and 20152019
| 2016 | 2015 | |||||
| (Restated) | ||||||
| Net revenues | $ | 79,666,740 | $ | 140,711,561 | ||
| Cost of revenues | 69,164,801 | 114,729,666 | ||||
| Gross profit | 10,501,939 | 25,981,895 | ||||
| Operating expenses: | ||||||
| Selling and marketing expenses | 6,125,771 | 6,859,449 | ||||
| General and administrative expenses | 40,797,058 | 5,665,793 | ||||
| Total operating expenses | 46,922,829 | 12,525,242 | ||||
| Operating (loss) income | (36,420,890 | ) | 13,456,653 | |||
| Other income (expenses): | ||||||
| Government subsidy | 1,231,521 | 1,999,480 | ||||
| Interest income | 47,188 | 117,103 | ||||
| Interest expense | (4,569,019 | ) | (5,244,766 | ) | ||
| Other income | 348,138 | 350,127 | ||||
| Other expenses | (45,911,455 | ) | (392,683 | ) | ||
| (48,853,627 | ) | (3,170,738 | ) | |||
| (Loss)/income before taxes from continuing operations | (85,274,517 | ) | 10,285,915 | |||
| Provision for income taxes | 1,898,616 | 3,362,784 | ||||
| (Loss)/income from continuing operations | (87,173,133 | ) | 6,923,130 | |||
| Discontinued operations: | ||||||
| (Loss) income from discontinued operations | (48,733,531 | ) | (8,456,119 | ) | ||
| Provision for income taxes | (454,416 | ) | (1,153,150 | ) | ||
| Loss from discontinued operations, net of taxes | (49,187,947 | ) | (9,609,269 | ) | ||
| Net loss | $ | (136,361,080 | ) | $ | (2,686,139 | ) |
| Net loss attributable to: | ||||||
| - Common shareholders | (135,973,101 | ) | 2,619,528 | |||
| - Non-controlling interests | (387,979 | ) | (5,305,667 | ) | ||
| Other comprehensive income: | ||||||
| Foreign currency translation loss | 1,911,097 | (10,536,511 | ) | |||
| Comprehensive loss | $ | (134,449,983 | ) | $ | (13,222,650 | ) |
| (Loss) income per share from continuing operations | ||||||
| - Basic and diluted | (2.28 | ) | 0.19 | |||
| Loss per share from discontinued operations | ||||||
| - Basic and diluted | (1.28 | ) | (0.12 | ) | ||
| Loss per share | ||||||
| - Basic and diluted | (3.55 | ) | 0.07 | |||
| Basic and diluted weighted average shares outstanding | 38,264,874 | 37,108,688 |
| Accumulated | ||||||||||||||||||||||||||||||||
| Additional | Other | Non- | ||||||||||||||||||||||||||||||
| Number | Common | Paid-in | Statutory | Accumulated | Comprehensive | Controlling | ||||||||||||||||||||||||||
| of Shares | Stock | Capital | Reserves | Deficit | Income | Interests | Total | |||||||||||||||||||||||||
| Balance, January 1, 2019 | 5,497,765 | $ | 5,498 | $ | 74,739,031 | $ | 2,810,953 | $ | (79,038,883 | ) | $ | 9,792,283 | $ | (1,019,552 | ) | $ | 7,289,330 | |||||||||||||||
| Net income | - | - | - | - | 2,947,196 | - | - | 2,947,196 | ||||||||||||||||||||||||
| Issuance of shares for acquisition | 1,080,000 | 1,080 | 4,783,212 | - | - | - | - | 4,784,292 | ||||||||||||||||||||||||
| Issuance of common stock for cash | 1,300,000 | 1,300 | 5,458,700 | - | - | - | - | 5,460,000 | ||||||||||||||||||||||||
| Disposition | - | - | - | (2,810,953 | ) | 2,810,953 | - | 1,019,552 | 1,019,552 | |||||||||||||||||||||||
| Acquiring corporation | - | - | 822,478 | - | - | - | - | 822,478 | ||||||||||||||||||||||||
| Foreign currency translation adjustment | - | - | - | - | - | (1,588,342 | ) | - | (1,588,342 | ) | ||||||||||||||||||||||
| Balance, December 31, 2019 | 7,877,765 | 7,878 | 85,803,421 | - | (73,280,734 | ) | 8,203,941 | - | 20,734,506 | |||||||||||||||||||||||
| Balance, January 1, 2020 | 7,877,765 | $ | 7,878 | $ | 85,803,421 | $ | - | $ | (73,280,734 | ) | $ | 8,203,941 | $ | - | $ | 20,734,506 | ||||||||||||||||
| Net income | - | - | - | - | (11,051,163 | ) | - | - | (11,051,163 | ) | ||||||||||||||||||||||
| Issuance of shares for acquisition | 1,800,000 | 1,800 | 4,588,200 | - | - | - | - | 4,590,000 | ||||||||||||||||||||||||
| Issuance of common stock for cash | 1,350,000 | 1,350 | 3,508,650 | - | - | - | - | 3,510,000 | ||||||||||||||||||||||||
Issuance of common stock for employee stock compensation | 782,165 | 782 | 1,759,089 | - | - | - | - | 1,759,871 | ||||||||||||||||||||||||
| Foreign currency translation adjustment | - | - | - | - | - | (1,231,778 | ) | - | (1,231,778 | ) | ||||||||||||||||||||||
| Balance, December 31, 2020 | 11,809,930 | $ | 11,810 | $ | 95,659,360 | $ | - | $ | (84,331,897 | ) | $ | 6,972,163 | $ | - | $ | 18,311,436 | ||||||||||||||||
See Accompanying Notes to the Financial Statements
AUDITED CONSOLIDATED STATEMENTS OF CASH FLOWS
FOR THE YEARS ENDED DECEMBER 31, 2020 AND 2019
(STATED IN US DOLLARS)
American LorainCorporationConsolidatedStatements ofStockholders’ EquityFor
| 2020 | 2019 | |||||||
| Cash flows from operating activities | ||||||||
| Net (Loss) income | $ | (11,051,163 | ) | $ | 8,539,597 | |||
| Gain from disposal of investment and subsidiaries | - | (8,783,848 | ) | |||||
| Write off receivables | 6,078,623 | - | ||||||
| Exchange loss | 1,830,579 | - | ||||||
| Impairment of goodwill | 2,339,829 | - | ||||||
| Stock base compensation | 1,759,871 | - | ||||||
| Bad debt expenses | 43,694 | - | ||||||
| Amortization | 173,825 | 13,319 | ||||||
| Depreciation | 275,228 | 200,727 | ||||||
| Accounts and other receivables | (1,526,888 | ) | 58,127 | |||||
| Inventory | (295,975 | ) | (434,411 | ) | ||||
| Prepayments and other current assets | (4,065,395 | ) | (1,486,828 | ) | ||||
| Payables and other current liabilities | 938,670 | (3,525,853 | ) | |||||
| Net cash used in operating activities | $ | (3,499,103 | ) | $ | (5,419,170 | ) | ||
| Cash flows from investing activities | ||||||||
| Purchase of plant and equipment and construction in progress | (695,544 | ) | (578,595 | ) | ||||
| Purchase of intangible assets | (157,293 | ) | 62,274 | |||||
| Net cash used in investing activities | $ | (852,837 | ) | $ | (516,321 | ) | ||
| Cash flows from financing activities | ||||||||
| Proceeds from issuance of common stock | 3,016,204 | 12,319,834 | ||||||
| Repayment of borrowings | - | (1,108,584 | ) | |||||
| (Repayment to) proceeds from related party | (2,777,808 | ) | 1,991,296 | |||||
| Net cash provided by financing activities | $ | 238,396 | $ | 13,202,546 | ||||
| Net (decrease) increase in cash | (4,113,544 | ) | 7,267,055 | |||||
| Effect of foreign currency translation on cash | 256,785 | (11,432 | ) | |||||
| Cash and cash equivalents–beginning of year | 7,272,510 | 16,887 | ||||||
| Cash and cash equivalents–end of year | $ | 3,415,751 | $ | 7,272,510 | ||||
| Supplementary cash flow information: | ||||||||
| Interest received | $ | - | $ | 186 | ||||
| Interest paid | $ | 23,407 | $ | 9,911 | ||||
| Income taxes paid | $ | - | $ | - | ||||
See Accompanying Notes to the years endedFinancial Statements
DecemberPLANET GREEN HOLDINGS CORP.
NOTES TO AUDITED CONSOLIDATED FINANCIAL STATEMENTS
FOR THE YEARS ENDED DECEMBER 31, 2016 and 20152020 AND 2019
(Stated in US Dollars)
| (Accumulated | Accumulated | |||||||||||||||||||||||
| Number | Additional | Deficit)/ | Other | Non- | ||||||||||||||||||||
| of | Common | Paid-in | Statutory | Retained | Comprehensive | Controlling | ||||||||||||||||||
| Shares | Stock | Capital | Reserves | Earnings | Income | Interests | Total | |||||||||||||||||
| Balance, January 1, 2015 | 34,916,714 | 34,917 | 53,853,089 | 23,038,917 | 99,021,555 | 20,796,420 | 13,021,555 | 209,766,453 | ||||||||||||||||
| Net loss | - | - | - | - | (2,686,139 | ) | - | - | (2,686,139 | ) | ||||||||||||||
| Conversion of loan debenture to common stock | 2,355,276 | 2,355 | 2,706,213 | - | - | - | - | 2,708,568 | ||||||||||||||||
| Issuance of share based compensation | 987,500 | 988 | 1,282,762 | - | - | - | - | 1,283,750 | ||||||||||||||||
| Appropriations to statutory reserve | - | - | - | 1,621,749 | (1,621,749 | ) | - | - | - | |||||||||||||||
| Allocation to non-controlling interests | - | - | - | - | 5,305,667 | - | (5,307,667 | ) | - | |||||||||||||||
| Foreign currency translation adjustment | - | - | - | - | - | (10,536,511 | ) | - | (10,536,511 | ) | ||||||||||||||
| Balance, December 31, 2015(RESTATED) | 38,259,490 | 38,260 | 57,842,064 | 24,660,666 | 100,019,334 | 10,259,909 | 7,715,888 | 200,536,121 | ||||||||||||||||
| Balance, January 1, 2016 | 38,259,490 | 38,260 | 57,842,064 | 24,660,666 | 100,019,334 | 10,259,909 | 7,715,888 | 200,536,121 | ||||||||||||||||
| Net loss | (136,361,080 | ) | (136,361,080 | ) | ||||||||||||||||||||
| Issuance of share based compensation | 15,000 | 15 | 10,185 | - | - | - | - | 10,200 | ||||||||||||||||
| Appropriations to statutory reserve | - | - | - | 442,688 | (442,688 | ) | - | - | - | |||||||||||||||
| Allocation to non-controlling interests | - | - | - | - | 387,979 | - | (387,979 | ) | - | |||||||||||||||
| Foreign currency translation adjustment | - | - | - | - | - | 1,911,097 | - | 1,911,097 | ||||||||||||||||
| Balance, December 31, 2016 | 38,274,490 | 38,275 | 57,852,249 | 25,103,354 | (36,396,455 | ) | 12,171,006 | 7,327,909 | 66,096,338 |
American Lorain CorporationConsolidated Statements of Cash FlowsFor the years ended December 31, 2016 and 2015
| 2016 | 2015 | |||||
| Cash flows from operating activities | ||||||
| Net (loss) income from continuing operations | $ | (87,173,133 | ) | $ | 6,923,130 | |
| Impairment of construction in progress | 13,207,563 | - | ||||
| Impairment of leased plant and equipment | 1,184,309 | - | ||||
| Impairment of inventory - raw materials | 20,383,366 | - | ||||
| Write off trade receivables, other receivables, advances to suppliers, and other current assets | 35,590,795 | - | ||||
| Stock compensation expense | 10,200 | 3,994,673 | ||||
| Depreciation of fixed assets | 1,934,411 | 2,075,599 | ||||
| Amortization of intangible assets | 299,177 | 682,391 | ||||
| Increase in trade and other receivables | (12,996,841 | ) | (1,027,370 | ) | ||
| Increase in inventories | (5,156,603 | ) | (2,426,131 | ) | ||
| (Increase)/decrease in advances to suppliers and prepayments | (5,848,784 | ) | 4,129,003 | |||
| Decrease in deferred tax asset | 132,058 | - | ||||
| Increase in accounts and other payables | 9,681,273 | 2,645,878 | ||||
| (Decrease)/increase in taxes payable | (2,209,871 | ) | 1,105,731 | |||
| Increase in customer deposits | 1,176,244 | 187,091 | ||||
| Net cash (used in)/provided by operating activities | (29,785,836 | ) | 18,289,995 | |||
| Cash flows from investing activities | ||||||
| Decrease/(increase) in restricted cash | 7,103,997 | (6,142,420 | ) | |||
| Purchase of plant and equipment | - | (1,919,600 | ) | |||
| Payment of construction in progress | (142,126 | ) | (330,454 | ) | ||
| Payments for the purchase of intangible assets | - | (329,217 | ) | |||
| Disposal of investments | 1,944,420 | - | ||||
| Increase in deposits | - | (375,252 | ) | |||
| Net cash provided by/(used in) investing activities | 8,906,291 | (9,096,943 | ) | |||
| Cash flows from financing activities | ||||||
| Repayment of bank borrowings and notes | - | (15,892,196 | ) | |||
| Proceeds from bank borrowings and debentures | 3,122,729 | - | ||||
| Proceeds from lease obligations | - | 1,210,009 | ||||
| Repayment of capital lease | (79,729 | ) | - | |||
| Net cash provided by/(used in) financing activities | $ | 3,043,000 | $ | (14,682,187 | ) | |
| Net decrease in cash and cash equivalents | (17,836,545 | ) | (5,489,135 | ) | ||
| Effect of foreign currency translation on cash and cash equivalents | 1,120,365 | (1,054,102 | ) | |||
| Cash and cash equivalents–beginning of year | 17,142,234 | 23,685,471 | ||||
| Cash and cash equivalents–end of year | $ | 426,054 | $ | 17,142,234 | ||
| Supplementary cash flow information: | ||||||
| Interest received | $ | 47,188 | $ | 117,103 | ||
| Interest paid | $ | 1,137,063 | $ | 2,889,304 | ||
| Income taxes paid | $ | 3,408,119 | $ | 2,324,179 |
| 1. | Organization and Principal Activities |
|
Planet Green Holdings Corp. (the “Company” or “PLAG”) is a holding company incorporated in Nevada. We are engaged in various businesses through our subsidiaries and controlled entities in China.
| 2. | Summary of Significant Accounting Policies |
Method of accounting
Management has prepared the accompanying financial statements and these notes in accordance to generally accepted accounting principles in the United States (“GAAP”). The Company maintains its general ledger and journals with the accrual method accounting.
Principles of consolidation
Management has prepared the accompanying financial statements and these notes in accordance to generally accepted accounting principles in the United States of America; the Company maintains its general ledger and journals with the accrual method accounting.
Restatement of prior financial statements
The Company has discovered errors in the timing of revenues recognized during the year ended December 31, 2015. The Company recognizes revenue upon shipping of products to its customers where title of the goods passes upon departure from the Company’s facilities; however, in certain instances, contractual terms dictate that the customers are afforded seven days after the receipt of goods at their premises to inspect the goods for defects or spoilage and notify the Company. If the Company is not contacted within those seven days, the Company’s obligation to the customer are considered fully discharged and revenue should be recognized. Given the timing of these seven days, the Company believes that certain sales transactions have been erroneously recognized during the year ended December 31, 2015. The Company has rectified this error and the impact of the Company’s financial position and result of operations are detailed below.
Principles of consolidation
The accompanying consolidated financial statements include the assets, liabilities, and results of operations of the Company, and its subsidiaries, which are listed below:
| Place of | Attributable equity | Registered | ||||||||
| Name of Company | incorporation | interest % | capital | |||||||
| International Lorain Holding Inc. | Cayman Islands | 100.0 | $ | 46,659,135 | ||||||
| Junan Hongrun Foodstuff Co., Ltd. | PRC | 100.0 | 44,861,741 | |||||||
| Shandong Lorain Co., Ltd. | PRC | 80.2 | 12,123,985 | |||||||
| Beijing Lorain Co., Ltd. | PRC | 100.0 | 1,540,666 | |||||||
| Luotian Lorain Co., Ltd. | PRC | 100.0 | 3,797,774 | |||||||
| Shandong Greenpia Foodstuff Co., Ltd. | PRC | 100.0 | 2,303,063 | |||||||
| Dongguan Lorain Co., Ltd. | PRC | 100.0 | 149,939 |
In 2014, the Company invested $2,100,000 in Athena/Minerve Group whereby the Company controlling shareholder of Minerve. Minerve conducted operations in manufacturing, packaging and sales activities in France and import and storage operations in Portugal. During the years ended December 31, 2015, the financial position and results of operations of Minerve were accounted for as subsidiaries in the Company’s financial statements; however, during the year ended December 31, 2016, Minerve became insolvent and compelled into bankruptcy by creditors, and, ultimately liquidation. Accordingly, the Company lost control of Minerve and written of the value of its investment in Minerve. All receivables due by Minerve to subsidiaries still controlled by the Company have been written off. The Company’s consolidated financial statements at December 31, 2015 have been recast to provide improved comparability forreflect the Company’s continuing operations.activities of Planet Green Holdings Corp. and each of the following entities:
| Place of | Attributable equity | Registered | |||||||||
| Name of Company | incorporation | interest % | capital | ||||||||
| Planet Green Holdings Corporation | British Virgin Islands | 100 | $ | 10,000 | |||||||
| Lucky Sky Planet Green Holdings Co., Limited (H.K.) | Hong Kong | 100 | 1 | ||||||||
| Jiayi Technologies (Xianning) Co., Ltd. | PRC | 100 | 2,000,000 | ||||||||
| Fast Approach Inc. | Canada | 100 | 79 | ||||||||
| Shanghai Shuning Advertising Co., Ltd. (a subsidiary of FAST) | PRC | 100 | - | ||||||||
| Lorain Food Stuff (Shenzhen) Co., Ltd (terminated the VIE) | PRC | VIE | 1,913,049 | ||||||||
| Taishan Muren Agriculture Co. Ltd. (terminated the VIE) | PRC | VIE | 80,000 | ||||||||
| Xianning Bozhuang Tea Products Co., Ltd. | PRC | VIE | 6,277,922 | ||||||||
Management has eliminated all significant inter-company balances and transactions in preparing the accompanying consolidated financial statements. Ownership interests of subsidiaries that the Company does not wholly-own are accounted for as non-controllingnoncontrolling interests.
F-8
Shandong Economic Development InvestmentOn May 18, 2018, the Company incorporated Planet Green Holdings Corporation, which is a limited company incorporated in the British Virgin Islands. On September 28, 2018, Planet Green BVI acquired JianShi Technology Holding Limited, a limited company inc orporated in Hong Kong on February 21, 2012, and Shanghai Xunyang Internet Tech Co., Ltd., a wholly-owned foreign entity incorporated in Shanghai, PRC, state-owned entity, holds 19.8%on August 29, 2012 (“Shanghai Xunyang”).
On August 12, 2019, through Lucky Sky Holdings Corporations (H.K.) Limited, formerly known as JianShi Technology Holding Limited, Company established Lucky Sky Petrochemical Technology (Xianning) Co., Ltd., a wholly foreign-owned enterprise incorporated in Xianning City, Hubei Province, China.
On December 20, 2019, The Lucky Sky Holdings Corporations (H.K.) Limited sold 100% of equity interest in Shanghai Xunyang.
On May 29, 2020, the Planet Green Holdings Corporation (BVI) incorporated Lucky Sky Planet Green Holdings Co., Limited, a limited company incorporated in Hong Kong.
On June 5, 2020, the Planet Green Holdings Corporation (BVI) acquired all of the outstanding equity interests of Fast Approach Inc. It was incorporated under Canada’s laws and the business of operation of a demand-side platform targeting the Chinese education market in North America.
On June 16, 2020, Lucky Sky Holdings Corporations (H.K.) transferred its 100% equity interest in Lucky Sky Petrochemical to Lucky Sky Planet Green Holdings Co., Limited (H.K.).
On September 15, 2020, Lucky Sky Petrochemical terminated the VIE agreements with Shenzhen Lorain and Taishan Muren
On August 10, 2020, Planet Green Holdings Corporation(BVI) transferred its 100% equity interest in Lucky Sky Holdings Corporations (H.K.) Limited to Rui Tang.
On December 9, 2020, Lucky Sky Petrochemical Technology (Xianning) Co., Ltd. changed its name to Jiayi Technologies (Xianning) Co., Ltd.
Consolidation of Variable Interest Entity
On September 27, 2018, through Shanghai Xunyang, the Company entered into exclusive VIE agreements with Beijing Lorain, Luotian Lorain, Shandong Lorain.Greenpia, Taishan Muren, and Shenzhen Lorain and their shareholders that give the Company the ability to substantially influence those companies’ daily operations and financial affairs and appoint their senior executives. The Company is considered the primary beneficiary of these operating companies.
On May 14, 2019, through Shanghai Xunyang, the Company entered into a series of VIE agreements with Xianning Bozhuang and its equity holders to obtain control and became the primary beneficiary of Xianning Bozhuang. The Company consolidated Xianning Bozhuang’s accounts as its VIE.
On December 20, 2019, we sold 100% of equity interest in Shanghai Xunyang and terminated its VIE agreements with Xianning Bozhuang, Shenzhen Lorain and Taishan Muren.
On December 20, 2019, through Lucky Sky Petrochemical, the Company entered into exclusive VIE agreements (“VIE Agreements”) with Taishan Muren, Xianning Bozhuang and Shenzhen Lorain, as well as their shareholders, which give the Company the ability to substantially influence those companies’ daily operations and financial affairs and appoint their senior executives. The Company is considered the primary beneficiary of these operating companies and it consolidates their accounts as VIEs.
As of December 31, 2020, the following entities were de-consolidated from the structure as a result of the sale agreement executed on September 15, 2020:
| Name | Place of incorporation | Ownership | ||
| Taishan Muren Agriculture Co., Ltd. | PRC | VIE of Jiayi Technologies (Xianning) Co., Ltd | ||
| Lorain Food Stuff (Shenzhen) Co., Ltd | PRC | VIE of Jiayi Technologies (Xianning) Co., Ltd |
As a result of sale agreement, the accumulated deficit of Taishan Muren Agriculture Co., Ltd. and Lorain Food Stuff (Shenzhen) Co., Ltd with total amount of $6,479,978 are written off, and it also had a net loss of $12,407,690 due to the waiver of receivables. In addition, the Company also recognized a long-term investment loss with total amount of $2,153,111. The net effect is a loss on disposal of VIEs with the total amount of $5,927,712.
Discontinued operations
See financial note 16.
Each of the VIE Agreements is described in detail below:
Consultation and Service Agreement
Under the Consultation and Service Agreement, WFOE has the exclusive right to provide consultation and services to the operating entities in China in business management, human resource, technology, and intellectual property rights. WFOE exclusively owns any intellectual property rights arising from the performance of this Consultation and Service Agreement. The number of service fees and payment terms can be amended by the WFOE and operating companies’ consultation and implementation. The duration of the Consultation and Service Agreement is 20 years. WFOE may terminate this agreement at any time by giving 30 day’s prior written notice.
Business Cooperation Agreement
Pursuant to the Business Cooperation Agreement, WFOE has the exclusive right to provide complete technical support, business support, and related consulting services, including but not limited to specialized services, business consultations, equipment or property leasing, marketing consultancy, system integration, product research and development, and system maintenance. WFOE exclusively owns any intellectual property rights arising from the performance of this Business Cooperation Agreement. The rate of service fees may be adjusted based on the services rendered by WFOE in that month and the operational needs of the operating entities. The Business Cooperation Agreement shall maintain effective unless it was terminated or was compelled to release under applicable PRC laws and regulations. WFOE may terminate this Business Cooperation Agreement at any time by giving 30 day’s prior written notice.
Equity Pledge Agreements
According to the Equity Pledge Agreements among WFOE, operating entities, and each of operating entities’ shareholders, shareholders of the operating entities pledge all of their equity interests in the functional entities to WFOE to guarantee their performance of relevant obligations and indebtedness under the Technical Consultation and Service Agreement and other control agreements. Besides, shareholders of the operating entities are in the process of registering the equity pledge with the competent local authority.
Equity Option Agreements
According to the Equity Option Agreements, WFOE has the exclusive right to require each shareholder of the operating companies to fulfill and complete all approval and registration procedures required under PRC laws for WFOE to purchase or designate one or more persons to buy, each shareholder’s equity interests in the operating companies, once or at multiple times at any time in part or in whole at WFOE’s sole and absolute discretion. The purchase price shall be the lowest price allowed by PRC laws. The Equity Option Agreements shall remain effective until all the equity interest owned by each operating entity shareholder has been legally transferred to WFOE or its designee(s).
Voting Rights Proxy Agreements
According to the Voting Rights Proxy Agreements, each shareholder irrevocably appointed WFOE or WFOE’s designee to exercise all his or her rights as the shareholders of the operating entities under the Articles of Association of each operating entity, including but not limited to the power to exercise all shareholder’s voting rights concerning all matters to be discussed and voted in the shareholders’ meeting. The term of each Voting Rights Proxy Agreement is 20 years. WOFE has the right to extend each Voting Proxy Agreement by giving written notification.
Use of estimates
The preparation of the financial statementsstatements’ preparation requires management to make estimates and assumptions that affect the reported amounts of assets and liabilities and disclosure of contingent assets and liabilities at the date of the financial statements and the reported amounts of revenues and expenses during the reporting periods. Management makes these estimates using the best information available atwhen the time the estimatescalculations are made; however, actual results could differ materially from those estimates.
Cash and cash equivalents
The Company considers all highly liquid investments purchased with original maturities of three months or less to be cash equivalents.
Investment securities
The Company classifies securities it holds for investment purposes into trading or available-for-sale. Trading securities are bought and held principally for the purpose of selling them in the near term. All securitiesdeposits not included in trading securities are classified as available-for-sale.
Trading and available-for-sale securities are recorded at fair value. Unrealized holding gains and losses on trading securities are included in the net income. Unrealized holding gains and losses, net of the related tax effect, on available for sale securities are excluded from net income andincome. They are reported as a separate component of other comprehensive income until realized. Realized gains and losses from the sale of available-for-sale securities are determined on a specific-identificationspecific identification basis.
A decline in the market value of any available-for-sale security below cost that is deemed to be other-than-temporary results in a reduction in carrying amount to fair value. The impairment is charged as an expense to the statement of income and comprehensive income, and a new cost basis for the security is established. To determine whether the impairment is other-than-temporary, the Company considers whether it has the ability and intent to hold the investment until a market price recovery and considersbelieves whether evidence indicating the cost of the investmentasset is recoverable outweighs evidence to the contrary. Evidence considered in this assessment includes the reasons for the impairment, the severity and duration of the impairment, changes in value subsequent to year end,after year-end, and forecasted performance of the investee.
Premiums and discounts are amortized or accreted over the life of the related available-for-sale security as an adjustment to yield using the effective-interest method. Dividend and interest income are recognized when earned.
Trade receivables
Trade receivables are recognized and carried at the original invoice amount less allowance for any uncollectible amounts. An estimate for doubtful accounts is made when the collection of the fulltotal amount is no longer probable. Bad debts are written off as incurred.
Inventories
Inventories consist of raw materials and finished goods, which are stated at the lower of cost or market value. Finished goods are comprised of direct materials, direct labor, inbound shipping costs, and allocated overhead. The Company applies the weighted average cost method to its inventory.
F-9
Advances and prepayments to suppliers
The Company makes an advance payment to suppliers and vendors for the procurement of raw materials. Upon physical receipt and inspection of the raw materials from suppliers, the applicable amount is reclassified from advances and prepayments to suppliers to inventory.
Plant and equipment
Plant and equipment are carried at cost less accumulated depreciation. Depreciation is provided over their estimated useful lives, using the straight-line method. The Company’sCompany typically applies a salvage value of 0% to 10%. The estimated useful lives of the plant and equipment are as follows:
| Buildings | 20-40 years | |||
| Landscaping, plant, and tree | 30 years | |||
| Machinery and equipment | 1-10 years | |||
| Motor vehicles | 5-10 years | |||
| Office equipment | 5-20 years |
The cost and related accumulated depreciation of assets sold or otherwise retired are eliminated from the accounts, and any gain or loss are included in the Company’s results of operations. The costs of maintenance and repairs are recognized to expenses as incurred; significant renewals and betterments are capitalized.
Intangible assets
Intangible assets are carried at cost less accumulated amortization. Amortization is provided over their useful lives, using the straight-line method. The estimated useful lives of the intangible assets are as follows:
| Land use rights | 50 years | |||
| Software licenses | 2 years | |||
| Trademarks | 10 years |
Construction in progress and prepayments for equipment
Construction in progress and prepayments for equipment represent direct and indirect acquisition and construction costs for plants and costsfees of acquisitionpurchase and installation of related equipment. Amounts classified as construction in progress and prepayments for equipment are transferred to plant and equipment when substantially all the activities necessary to prepare the assets for their intended use are completed. Depreciation is not provided for assets classified in this account.
Land use rights
Land use rights are carried at cost and amortized on a straight-line basis over a specified period. Amortization is provided using the straight-line method over 40-50 years.Goodwill
Goodwill
Goodwill represents the excess of the purchase price over the fair value of the net identifiable assets acquired in a business combination. The Company conducts an annual assessment of its goodwill for impairment. If the carrying value of its goodwill exceeds its fair value, then impairment has incurred; accordingly, a charge to the Company’s operations results of operations will be recognized during the period. Impairment losses on goodwill are not reversed. Fair value is generally determined using a discounted expected future cash flow analysis.In 2020, the Company recorded approximately $2.34 million in impairment to its Canadian operating units Fast Approach. Fast Approach’s main business is operated in China in which were materially adversely impacted by the COVID 19 virus.
Accounting for the impairment of long-lived assets
The Company annually reviews its long-lived assets for impairment or whenever events or changes in circumstances indicate that the carrying amount of assets may not be recoverable. Impairment may be the result of becomingbecome obsolete from a changedifference in the industry, introduction of new technologies, or if the Company has inadequate working capital to utilize the long-lived assets to generate the adequate profits. Impairment is present if the carrying amount of an asset is less than its expected future undiscounted cash flows.
If an asset is considered impaired, a loss is recognized based on the amount by which the carrying amount exceeds the fair market value of the asset. Assets to be disposed of are reported at the lower of the carrying amount or fair value lessfewer costs to sell.selling.
Statutory reserves
Statutory reserves are referring to the amount appropriated from the net income in accordance withfollowing laws or regulations, which can be used to recover losses and increase capital, as approved, and are to be used to expand production or operations. PRC laws prescribe that an enterprise operating at a profit must appropriate and reserve, on an annual basis, an amount equal to 10% of its profit. Such an appropriation is necessary until the reserve reaches a maximum that is equal to 50% of the enterprise’s PRC registered capital.
F-10
Foreign currency translation
The accompanying financial statements are presented in United States dollars. The functional currenciescurrency of the Company areis the Renminbi (RMB) and the Euro (EUR). The Company’s assets and liabilities are translated into United States dollars from RMB and EUR at year-end exchange rates, and itsrates. Its revenues and expenses are translated at the average exchange rate during the period. Capital accounts are translated at their historical exchange rates when the capital transactions occurred.
| 12/31/2016 | 12/31/2015 | ||||||
| Period/year end RMB: US$ exchange rate | 6.9437 | 6.4907 | |||||
| Period/annual average RMB: US$ exchange rate | 6.6430 | 6.2175 | |||||
| Period/year end EUR: US$ exchange rate | 0.8919 | 0.9168 | |||||
| Period/annual average EUR: US$ exchange rate | 0.8960 | 0.9011 |
| 12/31/2020 | 12/31/2019 | |||||||
| Period-end US$: CDN$ exchange rate | 1.2754 | 1.2988 | ||||||
| Period-end US$: RMB exchange rate | 6.5326 | 6.9762 | ||||||
| Period average US$: CDN$ exchange rate | 1.3409 | 1.3269 | ||||||
| Period average US$: RMB exchange rate | 6.8996 | 6.8967 | ||||||
The RMB is not freely convertible into foreign currencies, and all foreign exchange transactions must be conducted through authorized financial institutions.
Revenue recognition
The Company recognizesadopted ASC 606 “Revenue Recognition” and recognized revenue in accordance to guidance found in Staff Accounting Bulletin (SAB) 104, where persuasive evidence of arrangement exists, the price has been fixed or is determinable, the delivery has been completed and no other significant obligationswhen control of the promised goods or services is transferred to customers, in an amount that reflects the consideration we expect to be entitled to in exchange for those goods or services.
The Company exists,derives its revenues from selling fresh foods, spices, convenience foods, and collectabilitytea products. The Company applies the following five steps to determine the appropriate amount of payment is reasonably assured. Payments received priorrevenue to allbe recognized as it fulfills its obligations under each of the foregoing criteria are recorded as customer deposits. Recorded revenue is derived from the value of goods invoiced less value-added tax (VAT).its agreements:
| ● | identify the contract with a customer; |
| ● | identify the performance obligations in the contract; |
| ● | determine the transaction price; |
| ● | allocate the transaction price to performance obligations in the contract; and |
| ● | Recognize revenue as the performance obligation is satisfied. |
Advertising
All advertising costs are expensed as incurred.
Shipping and handling
All outbound shipping and handling costs are expensed as incurred.
Research and development
All research and development costs are expensed as incurred.
Retirement benefits
Retirement benefits in the form of mandatory government sponsoredgovernment-sponsored defined contribution plans are charged to the either expensesexpense as incurred or allocated to inventory as part of overhead.
Stock-based compensation
The Company records stock compensation expense for employees at fair value on the grant date and recognizes the expense one time because there is no employee’s requisite service period requirement. On December 30, 2020, 782,165 shares of common stocks are granted to six employees of the Company for stock compensation. The closing stock price on December 30, 2020 is $2.25 per share. Total amount of $1,759,871 are recorded as stock compensation expenses.
Income taxes
The Company accounts for income tax using an asset and liability approach and allows for recognition ofrecognizes deferred tax benefits in future years. Under the asset and liability approach, deferred taxes are provided for the net tax effects of temporary differences between the carrying amounts of assets and liabilities for financial reporting purposes and the amounts used for income tax purposes. A valuation allowance is provided for deferred tax assets ifassets. If it is more likely than not, these items will either expire before the Company is able tocan realize their benefits or that future realization is uncertain.
F-11
Comprehensive income
The Company uses FASBFinancial Accounting Standards Board (“FASB”) ASC Topic 220, “Reporting Comprehensive Income”.Income.” Comprehensive income is comprised of net income and all changes to the statements of stockholders’ equity, except the changes in paid-in capital and distributions to stockholders due to investments by stockholders.
Earnings per share
The Company computes earnings per share (“EPS”) in accordance withfollowing ASC Topic 260, “Earnings per share”.share.” Basic EPS is measured as the income or loss available to common shareholders divided by the weighted average common shares outstanding for the period. Diluted EPS presents the dilutive effect on a per shareper-share basis from the potential conversion of convertible securities or the exercise of options and or warrants; the dilutive effectsimpacts of potentially convertible securities are calculated using the as-if method; the potentially dilutive effect of options or warrantswarranties are calculatedcomputed using the treasury stock method. Securities that are potentially an anti-dilutive effect (i.e., those that increase income per share or decrease loss per share) are excluded from the calculation of diluted EPS.EPS calculation.
Financial instruments
The Company’s financial instruments, including cash and equivalents, accounts and other receivables, accounts and other payables, accrued liabilities, and short-term debt, have carrying amounts that approximate their fair values due to their short maturities. ASC Topic 820, “Fair Value Measurements and Disclosures,” requires disclosure ofdisclosing the fair value of financial instruments held by the Company. ASC Topic 825, “Financial Instruments,” defines fair value and establishes a three-level valuation hierarchy for disclosures of fair value measurement that enhances disclosure requirements for fair value measures. The carrying amounts reported in the consolidated balance sheets for receivables and current liabilities each qualify as financial instruments and are a reasonable estimate of their fair values because of the short period of time between the origination of such instruments and their expected realization and their current market rate of interest. The three levels of valuation hierarchy are defined as follows:
Level 1 - inputs to the valuation methodology used quoted prices for identical assets or liabilities in active markets. |
Level 2 - inputs to the valuation methodology include quoted prices for similar assets and liabilities in active markets and |
Level 3 - inputs to the valuation methodology are unobservable and significant to the fair value measurement. |
The Company analyzes all financial instruments with features of both liabilities and equity under ASC 480, “Distinguishing Liabilities from Equity,” and ASC 815.
Commitments and contingencies
Liabilities for loss contingencies arising from claims, assessments, litigation, fines and penalties, and other sources are recorded when it is probable that a liability has been incurred and the amount of the assessment can be reasonably estimated.
Recent accounting pronouncements
In January 2017,February 2018, the FASB issued guidanceASU 2018-02, Income Statement - Reporting Comprehensive Income (Topic 220): Reclassification of Certain Tax Effects from Accumulated Other Comprehensive Income. The amendments in this Update affect any entity required to apply the provisions of Topic 220, Income Statement – Reporting Comprehensive Income and has items of other comprehensive income for which simplifies the accountingrelated tax effects are presented in other comprehensive income required by GAAP. The amendments in this Update are effective for goodwill impairment. The updated guidance eliminates Step 2all entities for fiscal years beginning after December 15, 2018, and interim periods within those fiscal years. Early adoption of the impairment test,amendments in this Update is permitted, including adoption in any interim period, (1) for public business entities for reporting periods for which requiresfinancial statements have not yet been issued and (2) for all other entities for reporting periods for which financial statements have not however been made available for issuance. The amendments in this Update should be applied either in the period of adoption or retrospectively to calculateeach period (or periods) in which the impliedeffect of the change in the U.S. federal corporate income tax rate in the Tax Cuts and Jobs Act is recognized. The Company does not believe the adoption of this ASU would affect the Company’s financial statements.
In August 2018, the FASB issued ASU 2018-13, “Fair Value Measurement (Topic 820), – Disclosure Framework – Changes to the Disclosure Requirements for Fair Value Measurement,” which makes several changes meant to add, modify or remove specific disclosure requirements associated with the movement amongst or hierarchy associated with Level 1, Level 2 and Level 3 fair value measurements. The amendments in this Update modify the disclosure requirements on fair value measurements based on the concepts in FASB Concepts Statement, Conceptual Framework for Financial Reporting—Chapter 8: Notes to Financial Statements, including the consideration of costs and benefits. The amendments on changes in unrealized gains and losses, the range and weighted average of significant unobservable inputs used to develop Level 3 fair value measurements, and the narrative description of measurement uncertainty should be applied prospectively for only the most recent interim or annual period presented in the initial fiscal year of adoption. All other amendments should be applied retrospectively to all periods presented upon their effective date. The modifications are effective for all entities for fiscal years beginning after December 15, 2019, and interim periods within those fiscal years, with early adoption, permitted. The Company does not believe the adoption of this ASU would have a material effect on the Company’s condensed financial statements.
The Company does not believe other recently issued but not yet effective accounting standards, if currently adopted, would have a material effect on the Company’s balance sheets, statements of income and comprehensive income and statements of cash flows.
| 3. | Restricted Cash |
Restricted cash represents interest-bearing deposits placed with banks to secure banking facilities in the form of loans and notes payable. The funds are restricted from immediate use and are designated for settlement of loans or notes when they become due.
| 4. | Variable interest entity (“VIE”) |
A VIE is an entity that has either a total equity investment that is insufficient to permit the entity to finance its activities without additional subordinated financial support or whose equity investors lack the characteristics of a controlling financial interest, such as through voting rights, right to receive the expected residual returns of the entity or obligation to absorb the expected losses of the entity. If any, the variable interest holder that has a controlling financial interest in a VIE is deemed to be the primary beneficiary and must consolidate the VIE. PLAG WOFE is deemed to have the controlling financial interest and be the primary beneficiary of Xianning Bozhuang Tea Products Co., Ltd because it has both of the following characteristics:
| 1) | The power to direct activities at Xianning Bozhuang Tea Products Co., Ltd that most significantly impact such entity’s economic performance, and |
| 2) | The obligation to absorb losses of, and the right to receive benefits from Xianning Bozhuang Tea Products Co., Ltd that could potentially be significant to such entity. |
Pursuant to the Contractual Arrangements, Xianning Bozhuang Tea Products Co., Ltd pays service fees equal to all of its net income to PLAG WFOE. At the same time, PLAG WFOE is obligated to absorb all of Xianning Bozhuang Tea Products Co., Ltd’s losses. The Contractual Arrangements are designed so that Xianning Bozhuang Tea Products Co., Ltd operate for the benefit of PLAG WFOE and ultimately, the Company. Accordingly, the accounts of Xianning Bozhuang Tea Products Co., Ltd are consolidated in the accompanying consolidated financial statements. In addition, its financial positions and results of operations are included in the Company’s consolidated financial statements.
The carrying amount of VIE’s consolidated assets and liabilities are as follows:
| 12/31/2020 | 12/31/2019 | |||||||
| Cash and cash equivalents | $ | 528,048 | $ | 5,269,076 | ||||
| Note and Accounts receivable, net | 835,384 | 66,673 | ||||||
| Other receivables - third party | 7,726,607 | 270,421 | ||||||
| Inventories, net | 2,251,628 | 1,939,025 | ||||||
| Prepayments | 1,215,089 | 1,558,922 | ||||||
| TOTAL CURRENT ASSETS | 12,556,756 | 9,104,117 | ||||||
| Plan and equipment, net | 4,592,615 | 4,152,708 | ||||||
| Intangible assets, net | 1,491,614 | 1,533,927 | ||||||
| Total Non-Current Assets | 6,084,229 | 5,686,635 | ||||||
| TOTAL ASSETS | $ | 18,640,985 | $ | 14,790,752 | ||||
| Accounts payable | $ | 1,017,373 | $ | 486,241 | ||||
| Accounts payable - related party | - | - | ||||||
| Advance from customer | 213,469 | 52,722 | ||||||
| Other payables and accrued liabilities | 8,951,117 | 8,963,091 | ||||||
| Other payables - related party | 2,716,537 | - | ||||||
| Taxes payable | 171,231 | 106,315 | ||||||
| Deferred income | - | - | ||||||
| TOTAL CURRENT LIABILITIES | 13,069,728 | 9,608,369 | ||||||
| Long term payable | - | - | ||||||
| TOTAL LIABILITIES | $ | 13,069,728 | $ | 9,608,369 | ||||
| Paid-in capital | 6,314,908 | 6,314,908 | ||||||
| Retained earnings | (793,601 | ) | (834,993 | ) | ||||
| Accumulated other comprehensive income | 49,950 | (297,532 | ) | |||||
| Total Equity | 5,571,257 | 5,182,383 | ||||||
| TOTAL LIABILITIES AND SHAREHOLDERS’ EQUITY | $ | 18,640,985 | $ | 14,790,752 | ||||
The summarized operating results of the VIE’s are as follows:
| 12/31/2020 | 12/31/2019 | |||||||
| Operating revenues | $ | 3,804,595 | $ | 1,106,482 | ||||
| Gross profit | 1,336,228 | 706,292 | ||||||
| Income from operations | 41,392 | (244,194 | ) | |||||
| Net income (loss) | $ | 41,392 | $ | (244,194 | ) | |||
| 5. | Business Combination |
On June 5, 2020, the Company and its wholly owned subsidiary the Planet Green Holdings Corporation (BVI) acquired all of the outstanding equity interests of Fast Approach Inc. It was incorporated under Canada’s laws and the business of operation of a demand-side platform targeting the Chinese education market in North America.
The Company’s acquisition of Fast Approach Inc. was accounted for as a business combination in accordance with ASC 805. The Company has allocated the purchase price of Fast Approach Inc. based upon the fair value of goodwill to measure a goodwill impairment charge. Instead, entities will record an impairment charge basedthe identifiable assets acquired and liabilities assumed on the excessacquisition date. Other current assets and current liabilities were valued using the cost approach. Management of a reporting unit’s carrying amount over itsthe Company is responsible for determining the fair value determined in Step 1. The Company is currently evaluating the impact on the financial statements of this guidance.
In January 2017, the FASB amended the existing accounting standards for business combinations. The amendments clarify the definition of a business with the objective of adding guidance to assist entities with evaluating whether transactions should be accounted for as acquisitions (or disposals) of assets or businesses. The Company is currently evaluatingacquired, liabilities assumed, plant and equipment, and intangible assets identified as of the impact on the financial statementsacquisition date and considered a number of this guidance.
F-12
In November 2016, the FASB issued guidance, which addresses the presentation of restricted cash in the statement of cash flows. The guidance requires entities to show the changes in the total of cash, cash equivalents, restricted cash, and restricted cash equivalents in the statement of cash flows. As a result, entities will no longer present transfers between cash and cash equivalents and restricted cash and restricted cash equivalents in the statement of cash flows. The Company is currently evaluating the timing and the impact of this guidance on the financial statements.
In October 2016, the FASB issued guidance, which amends the existing accounting for Intra-Entity Transfers of Assets Other Than Inventory. The guidance requires an entity to recognize the income tax consequences of intra-entity transfers, other than inventory, when the transfer occurs The Company is currently evaluating the timing and the impact of this guidance on the financial statements.
In August 2016, the FASB issued guidance, which amends the existing accounting standardsfactors including valuations from independent appraisers. Acquisition-related costs incurred for the classificationacquisitions are not material and have been expensed as incurred in general and administrative expense.
The following table summarizes the fair value of certain cash receiptsthe identifiable assets acquired and cash payments on the statement of cash flows. The Company is currently evaluating the timing and the impact of this guidance on the financial statements.
In June 2016, the FASB issued guidance, which requires credit losses on financial assets measured at amortized cost basis to be presentedliabilities assumed at the acquisition date, which represents the net amount expected to be collected, not based on incurred losses. Further, credit losses on available-for-sale debt securities should be recorded through an allowance for credit losses limited topurchase price allocation at the amount by which fair value is below amortized cost. The Company is currently evaluatingdate of the timing and the impactacquisition of this guidance on the financial statements.Fast Approach Inc.:
In February 2016, the FASB issued guidance, which amends the existing accounting standards for leases. Consistent with current guidance, the recognition, measurement, and presentation of expenses and cash flows arising from a lease by a lessee primarily will depend on its classification. Under the new guidance, a lessee will be required to recognize assets and liabilities for all leases with lease terms of more than twelve months. The Company is currently evaluating the timing and the impact of this guidance on the financial statements.
In January 2016, the FASB issued guidance, which amends the existing accounting standards for the recognition and measurement of financial assets and financial liabilities. The updated guidance primarily addresses certain aspects of recognition, measurement, presentation, and disclosure of financial instruments. The Company is currently evaluating the timing and the impact of this guidance on the financial statements.
| ||
| $ | 4,679,940 | |
|
| Fair Value | ||||
| Cash | $ | 3,936 | ||
| Other current assets | 2,260 | |||
| Plant and equipment | 1,037 | |||
| Other noncurrent assets | 43,777 | |||
| Total asset | 51,010 | |||
| Total liabilities | (140,950 | ) | ||
| Net asset acquired | $ | (89,940 | ) | |
As of the date of the acquisition, the net asset acquired negative $89,940 is less than total consideration at fair value $4,679,940. The difference of $4,679,940 will be added to the goodwill and additional paid in capital.
To improve its solvency, the Company is working to obtain new working capital through private placements of its common stock or convertible debt securities to qualified investors.
| |
|
F-13
|
The Company extends credit terms of 15 to 60 days to the majority of its domestic customers, which include third-party distributors, supermarkets, and wholesalers; international customers are typically extended 90 days credit.wholesalers
| 2016 | 2015 | ||||||
| Trade accounts receivable | $ | 3,948,880 | $ | 37,127,548 | |||
| Less:Allowance for doubtful accounts | (695,547 | ) | (420,196 | ) | |||
| $ | 3,253,333 | $ | 36,707,352 | ||||
| Allowance for bad debt: | |||||||
| Beginning balance | $ | (5,901,811 | ) | $ | (421,464 | ) | |
| Additions to allowance | - | - | |||||
| Bad debt written-off against allowance | 5,206,263 | 1,268 | |||||
| Ending balance | $ | (695,547 | ) | $ | (420,196 | ) |
| |||||||||||||||||||||||||||||||||||||||||||||||||||||||||||||||||||||||||||||||||||||||||||
| 2016 | 2015 | ||||||
| Raw materials | $ | - | $ | 16,562,185 | |||
| Finished goods | 11,840,748 | 11,689,027 | |||||
| $ | 11,840,748 | $ | 28,251,212 |
| 7. | Advances to suppliers |
The advances to suppliers balance of $5,922,562 and $1,558,922 as of December 31, 2020 and December 31, 2019, respectively, mainly represents the advanced payment to the suppliers for raw materials.
| 8. | Inventories |
Inventories consisted of the following as of December 31, 2020, and 2019.
| 12/31/2020 | 12/31/2019 | |||||||
| Raw materials | $ | 240,468 | $ | 640,990 | ||||
| Inventory of supplies | 13,873 | 12,489 | ||||||
| Work in progress | 1,991,749 | 1,071,363 | ||||||
| Finished goods | 5,538 | 214,183 | ||||||
| Total | $ | 2,251,628 | $ | 1,939,025 | ||||
| 9. | Plant and Equipment |
| 2016 | 2015 | ||||||
| At Cost: | |||||||
| Buildings | $ | 58,866,129 | $ | 62,883,574 | |||
| Machinery and equipment | 6,917,774 | 8,484,858 | |||||
| Office equipment | 418,048 | 430,317 | |||||
| Motor vehicles | 154,687 | 165,483 | |||||
| $ | 66,356,368 | $ | 71,964,232 | ||||
| Less: Accumulated depreciation | (14,459,355 | ) | (13,209,478 | ) | |||
| $ | 51,897,283 | $ | 58,754,754 |
Plant, and equipment consisted of the following as of December 31, 2020, and 2019:
| 12/31/2020 | 12/31/2019 | |||||||
| At Cost: | ||||||||
| Buildings | $ | 3,952,207 | $ | 3,616,207 | ||||
| Machinery and equipment | 1,103,152 | 785,487 | ||||||
| Office equipment | 82,670 | 42,772 | ||||||
| Motor vehicles | 161,590 | 120,534 | ||||||
| $ | 5,299,619 | $ | 4,565,000 | |||||
| Less: Accumulated depreciation | (702,982 | ) | (412,292 | ) | ||||
| $ | 4,596,637 | $ | 4,152,708 | |||||
Depreciation expense for the years ended December 31, 20162020, and 20152019 was $1,934,411$290,690 and $2,075,599,$193,399 respectively.
Intangible Assets |
| 2016 | 2015 | ||||||
| At Cost: | |||||||
| Land use rights | 14,208,013 | 15,356,397 | |||||
| Utilities rights | 4,800 | 47,926 | |||||
| $ | 14,252,813 | $ | 15,404,323 | ||||
| Less: Accumulated amortization | (1,666,298 | ) | (1,595,747 | ) | |||
| $ | 12,586,515 | $ | 13,808,576 |
F-14
All land is owned by the government in China.
| 12/31/2020 | 12/31/2019 | |||||||
| At Cost: | ||||||||
| Land use rights | 801,170 | 750,224 | ||||||
| Software licenses | 56,949 | 2,552 | ||||||
| Trademark | 955,974 | 895,187 | ||||||
| $ | 1,814,093 | $ | 1,647,963 | |||||
| Less: Accumulated amortization | (297,626 | ) | (114,036 | ) | ||||
| $ | 1,516,467 | $ | 1,533,927 | |||||
Land use rights: the land use rights represent the Company’s purchase of usage rights for a parcel of industrial land forof 31,585 square meters was obtained on April 15, 2019 with a specified durationconsideration of time, typically 50 years. $750,224, located at Xianning City, Hubei Province, China with the land use right until June 12, 2068.
Trademark: a tea brand trademark was obtained on March 28, 2014 with a consideration of $895,187, registered with the China National Intellectual Property Administration, registration number is 16964992A.
Amortization expense for the years ended December 31, 20162020 and 2015 were $299,1772019 was $183,590 and $682,391,$10,127, respectively.
| |
|
| |
|
| Short-term Bank Loans | 12/31/2016 | 12/31/2015 | |||||
| Loan from Industrial and Commercial Bank of China, | |||||||
| • Interest rate at 6.305% per annum; due 1/4/2016 | - | 1,016,839 | |||||
| • Interest rate at 6.955% per annum; due 4/20/2016* | 3,596,461 | 3,851,665 | |||||
| • Interest rate at 6.02% per annum; due 12/26/2016 | - | - | |||||
| • Interest rate at 4.30% per annum; due 4/30/2017 | 1,080,116 | - | |||||
| • Interest rate at 4.30% per annum; due 6/29/2017 | 1,134,842 | - | |||||
| • Interest rate at 4.30% per annum; due 6/29/2017 | 1,080,116 | - | |||||
| • Interest rate at 4.30% per annum; due 8/2/2017 | 950,502 | - | |||||
| Loan from China Minsheng Bank Corporation, Linyi Branch | |||||||
| •Interest rate at 5.98% per annum due 9/22/2016* | 1,440,154 | 1,540,666 | |||||
| Loan from Agricultural Bank of China, Junan Branch | |||||||
| • Interest rate at 5.52% per annum due 9/5/2016* | - | 3,081,332 | |||||
| • Interest rate at 5.655% per annum due 1/31/2017 | - | - | |||||
| Loan from Agricultural Bank of China, Luotian Branch | |||||||
| • Interest rate at 5.65% per annum due 4/22/2017 | 1,440,154 | - | |||||
| China Agricultural Development Bank, | |||||||
| •Interest rate at 5.6% per annum due 1/6/2016 | - | 770,333 | |||||
| Luotian Sanliqiao Credit Union, | |||||||
| • Interest rate at 9.72% per annum due 1/14/2017 | 1,440,154 | 2,002,866 | |||||
| • Interest rate at 9.72% per annum due 2/4/2017 | 432,046 | - | |||||
| • Interest rate at 9.72% per annum due 9/7/2017 | 432,046 | - | |||||
| Bank of Ningbo, | |||||||
| • Interest rate at 7.80% per annum due 10/27/2016* | 1,152,124 | 1,232,533 | |||||
| Hankou Bank, Guanggu Branch, | |||||||
| • Interest rate at 6.85% per annum due 10/24/2016* | 1,347,047 | 1,540,666 | |||||
| Postal Savings Bank of China, | |||||||
| • Interest rate at 9.72% per annum due 7/27/2016* | 374,440 | 400,573 | |||||
| Bank of Rizhao, | |||||||
| • Interest rate at 7.28% per annum due 1/19/2016 | - | 1,540,666 | |||||
| China Construction Bank, | |||||||
| • Interest rate at 6.18% per annum due 11/29/2016* | 720,077 | 770,333 | |||||
| Luotian County Ministry of Finance, | |||||||
| • Interest rate at 6.18% per annum due 11/29/2016 | - | 616,266 | |||||
| Huaxia Bank, | |||||||
| • Interest rate at 5.66% per annum due 5/19/2017 | 1,440,154 | 1,540,666 | |||||
| City of Linyi Commercial Bank, Junan Branch, | |||||||
| • Interest rate at 8.4% per annum due 2/16/2016* | 1,438,707 | 1,540,666 | |||||
| • Interest rate at 8.4% per annum due 11/24/2016* | 2,880,310 | - | |||||
| Hubei Jincai Credit and Financial Services Co. Ltd. | |||||||
| • Interest rate at 9.00% per annum due 1/12/2017 | 288,032 | - | |||||
| $ | 22,667,482 | $ | 21,446,069 |
F-15
American Lorain CorporationNotes to Financial Statements
The short-term loans, which are denominated in Renminbi and Euros, were primarily obtained for general working capital. If not otherwise specifically indicated above, short-term bank loans are guaranteed either by other companies within the group, or by personnel in senior management positions within the group.
* Note: As of December 31, 2016, these loans have not been repaid2020 and are considered in default. The Company2019, the outstanding balance due to related parties is in negotiations to renew these loans or modify the repayment terms.$19,850 and $2,003,390, respectively.
| |
|
| 2016 | 2015 | ||||||
| Debenture issued by 5 private placement holders underwritten byGuoyuan Securities Co., Ltd. | |||||||
| • Interest rate at 10% per annum due 8/28/2016 | $ | 8,921,756 | $ | - | |||
| Debenture issued by 2 private placement holders underwritten byDaiwa SSC Securities Co. Ltd. | |||||||
| • Interest rate at 9.5% per annum due 11/8/2015 | 14,401,544 | 15,406,658 | |||||
| Loans from Deutsche Investitions-und EntwicklungsgesellschaftmbH (“DEG”) | |||||||
| • Interest rate at 5.510% per annum due 3/15/2015 | 1,875,000 | 1,875,000 | |||||
| • Interest rate at 5.510% per annum due 9/15/2015 | 1,875,000 | 1,875,000 | |||||
| • Interest rate at 5.510% per annum due 3/15/2016 | 1,875,000 | 1,875,000 | |||||
| $ | 28,948,300 | $ | $21,031,659 |
F-16
The Company began repaying its loan with DEG in semi-annual installments on December 15, 2012. As of December 31, 2016,2020 and 2015,2019, the outstanding balance of $19,850 and $Nil, respectively. The balance as of December 31, 2020 due to Yong Yang, an executive of a subsidiary, was advances for working capital of the Company, had not repaid any principal. The loannon-interest bearing, and unsecured, unless further disclosed.
As of December 31, 2020 and 2019, the outstanding balance was collateralized with$Nil and $2,003,390 due to Mr. Bin Zhou, Chief Executive Officer and Chairman of the following terms:Company, respectively, is advances for working capital of the Company which are fully paid off as of December 31, 2020.
| 12. |
| |
| ||
| ||
The
On May 9, 2019, the Company defaulted onand its loanwholly owned subsidiary Shanghai Xunyang Internet Technology Co., Ltd. (“Subsidiary”) entered into a Share Exchange Agreement with DEG; accordingly, on December 7, 2016, DEG exercised its rights to foreclose on 10,794,066shares pledged by Mr. Si Chen.
The Company is in defaultXianning Bozhuang Tea Products Co., Ltd. (“Target”) and each of the debenturesshareholders of Target (collectively, “Sellers”). Such transaction closed on May 14, 2019. Pursuant to the Share Exchange Agreement, the Subsidiary acquired all outstanding equity interests of Target, a company that were issued by Guoyuan Securitiesproduces tea products and Daiwa SSC Securities and negotiating withsells such products in China. Pursuant to the debenture holders to extend repayment terms.
| |
|
| 2016 | 2015 | ||||||
| Value added tax | $ | 10,562 | $ | 731,080 | |||
| Corporate income tax | 16,151 | 1,678,568 | |||||
| Employee payroll tax withholdings | 13,684 | 5,046 | |||||
| Property tax | 72,245 | 40,058 | |||||
| Stamp duty | 161 | 172 | |||||
| Land use tax | 134,827 | 72,974 | |||||
| Local tax | 1,176 | - | |||||
| $ | 248,807 | $ | 2,527,899 |
| |
|
| 2016 | 2015 | ||||||
| Debenture issued by 5 private placement holders underwritten byGuoyuan Securities Co., Ltd. | |||||||
| • Interest rate at 10% per annum due 8/28/2016 | - | 9,544,425 | |||||
| $ | - | $ | 9,544,425 |
| |
|
F-17
For the year ended December 31, 2016,Share Exchange Agreement, the Company issued 15,000an aggregate of 1,080,000 shares asof common stock of the Company to the Sellers in exchange for the transfer of all of the equity interest of the Target to the Subsidiary.
On June 17, 2019, the Company entered into a securities purchase agreement, pursuant to which five individuals residing in the PRC agreed to purchase an aggregate of 1,300,000 shares of the Company’s common stock, par value $0.001 per share, for an aggregate purchase price of $5,460,000, representing a purchase price of $4.20 per share. The transaction closed on June 19, 2019.
On February 10, 2020, the Company entered into a securities purchase agreement with Mengru Xu and Zhichao Du, pursuant to which Ms. Xu and Mr. Du agreed to invest an aggregate of $3.51 million in the Company in exchange for an aggregate of 1,350,000 shares of common stock, representing a purchase price of approximately $2.60 per share. On February 28, 2020, the Company closed the transaction.
On June 5, 2020, the Company issued an aggregate of 1,800,000 shares of its common stock to acquire all the outstanding equity interest of Fast Approach Inc., a corporation incorporated under the laws of Canada and in the business of operating a demand side platform targeting the Chinese education market in North America.
On December 30, 2020, the Company issued a total of 782,165 ordinary shares to six employees of the Company. Total fair value of these ordinary shares was approximately $1.75 million and the compensation expenses are to employees.be recognized in the fiscal year 2020 because there is no employee’s requisite service period requirement.
As of December 31, 2020, there were 11,809,930 shares of common stock outstanding.
Income Taxes | |
| |
|
| 2016 | 2015 | ||||||
| (Loss) income attributed to PRC continuing operations | $ | (84,936,317 | ) | $ | 11,806,807 | ||
| Loss attributed to U.S. operations | (338,200 | ) | (1,520,892 | ) | |||
| (Loss) income before tax | (85,274,517 | ) | 10,285,915 | ||||
| PRC Statutory Tax at 25% Rate | 1,898,616 | 3,362,784 | |||||
| Effect of tax exemption granted | - | - | |||||
| Income tax | $ | 1,898,616 | $ | 3,362,784 |
Per Share Effect
The Company’s primary operations are located in Canada and the PRC. The corporate income tax rate was 13% in Canada and 25% in the PRC as of Tax ExemptionDecember 31, 2020.
| 2016 | 2015 | ||||||
| Effect of tax exemption granted | $ | - | $ | - | |||
| Weighted-average shares outstanding basic | 38,264,874 | 37,108,688 | |||||
| Per share effect | $ | - | $ | - |
The following tables provide the reconciliation of the differences between the statutory and effective tax expenses following as of December 31, 2020 and 2019.
| 12/31/2020 | 12/31/2019 | |||||||
| Loss attributed to PRC continuing operations | $ | (34,348 | ) | $ | (5,836,652 | ) | ||
| Loss attributed to Canada operations | (417,271 | ) | - | |||||
| Income attributed to BVI | 9,779,542 | 8,783,848 | ||||||
| Loss attributed to U.S. operations | (20,529,997 | ) | - | |||||
| (Loss) income before tax | $ | (11,202,074 | ) | $ | 2,947,196 | |||
| PRC Statutory Tax at 25% | - | - | ||||||
| Canada Statutory Tax at 13% | - | - | ||||||
| U.S. Federal Statutory Income Tax at 21% | - | - | ||||||
| Effect of tax exemption granted | - | |||||||
| Income tax | $ | - | $ | - | ||||
| Per Share Effect of Tax Exemption | - | - | ||||||
| Effect of tax exemption granted | $ | - | $ | - | ||||
| Weighted-Average Shares Outstanding Basic | 10,112,648 | 6,897,710 | ||||||
| Per share effect | $ | - | $ | - | ||||
The difference between the U.S. federal statutory income tax rate and the Company’s effective tax rate was as follows for the years ended December 31, 2016 and 2015:
| 2016 | 2015 | ||||||
| U.S. federal statutory income tax rate | 35% | 35% | |||||
| Lower rates in PRC, net | -10% | -10% | |||||
| Non-deductible GAAP expenses in the PRC | -27.22% | -27.23% | |||||
| The Company’s effective tax rate | -2.22% | -2.23% |
| |
|
| 2016 | 2015 | ||||||
| Basic and diluted (loss) earnings per share numerator | |||||||
| (Loss attributable) income available to common stockholders | $ | (135,973,101 | ) | $ | 2,619,528 | ||
| Original Shares: | 38,259,490 | 34,916,714 | |||||
| Additions from Actual Events | |||||||
| -Issuance of common stock | 15,000 | 3,342,776 | |||||
| Basic weighted average shares outstanding | 38,264,874 | 37,108,688 | |||||
| Dilutive Shares: | |||||||
| Additions from Potential Events | |||||||
| - Exercise of warrants | - | - | |||||
| Diluted weighted average shares outstanding: | 38,264,874 | 37,108,688 | |||||
| (Loss) earnings per share from continuing operations | |||||||
| - Basic and diluted | (2.28 | ) | 0.19 | ||||
| Loss per share from discontinued operations | |||||||
| - Basic and diluted | (1.28 | ) | (0.12 | ) | |||
| Loss per share | |||||||
| - Basic and diluted | (3.55 | ) | (0.07 | ) | |||
| Weighted average shares outstanding | |||||||
| - Basic and diluted | 38,264,874 | 37,108,688 |
F-18
| |
| |
|
| Period | Greenhouse 1 | Greenhouse 2 | Greenhouse 3 | |||||||
| Year 1 | $ | 74,420 | $ | 89,258 | $ | 10,711 | ||||
| Year 2 | 74,420 | 89,258 | 10,711 | |||||||
| Year 3 | 74,420 | 89,258 | 10,711 | |||||||
| Year 4 | 74,420 | 89,258 | 10,711 | |||||||
| Year 5 | 74,420 | 89,258 | 10,711 | |||||||
| Year 6 and thereafter | 843,427 | 1,019,029 | 123,177 | |||||||
| $ | 1,215,527 | $ | 1,465,319 | $ | 176,732 |
The outstanding lease commitments for the three greenhouses as of December 31, 2016 was $2,857,577.2020 and 2019:
| 12/31/2020 | 12/31/2019 | |||||||
| U.S. federal statutory income tax rate | 21 | % | 21 | % | ||||
| Higher (lower) rates in PRC, net | 4 | % | 4 | % | ||||
| Expenses not deductible to taxable income | (25 | )% | (25 | )% | ||||
| The Company’s effective tax rate | 0 | % | 0 | % | ||||
Deferred tax assets
Bad debt allowances must be approved by the Chinese tax authority prior to being deducted as an expense item on the tax return. Therefore, deferred tax assets are not likely realized.
| |
|
F-19
Components of basic and diluted earnings per share were as follows:
| For the years ended December 31, | ||||||||
| 2020 | 2019 | |||||||
| (Loss) income from continuing operations | $ | (11,202,074 | ) | $ | 8,539,597 | |||
| Income (loss) from discontinued operations | $ | 150,911 | $ | (5,592,401 | ) | |||
| Basic and diluted (loss) earnings per share denominator: | ||||||||
| Original Shares: | 7,877,765 | 5,497,765 | ||||||
| Additions from Actual Events -issuance of common stock for cash | 1,202,055 | 701,644 | ||||||
| Additions from Actual Events – issuance of common stock for acquisition | 1,030,685 | 698,301 | ||||||
| Additions from Actual Events – issuance of common stock for stock compensation | 2,143 | - | ||||||
| Basic Weighted Average Shares Outstanding | 10,112,648 | 6,897,710 | ||||||
| (Loss) income per share from continuing operations - Basic and diluted | $ | (1.11 | ) | $ | 1.24 | |||
| Income (loss) per share from discontinued operations-Basic and diluted | $ | 0.01 | $ | (0.81 | ) | |||
| (Loss) income per share - Basic and diluted | $ | (1.09 | ) | $ | 0.43 | |||
Customers Concentrations | ||
| ||
| ||
| ||
| ||
|
The following is a schedule showing the future minimum lease payments under capital leases together with the present valuetable sets forth information as to each customer that accounted for 10% or more of the net minimum lease paymentsCompany’s revenues as of December 31, 2016:2020 and 2019.
| For the years ended | |||||||||||||||||
| Customers | December 31, 2020 | December 31, 2019 | |||||||||||||||
| Amount $ | % | Amount $ | % | ||||||||||||||
| A | 3,161,520 | 88 | - | - | |||||||||||||
| B | - | - | 283,822 | 27 | |||||||||||||
| C | - | - | 210,716 | 20 | |||||||||||||
| D | - | - | 207,273 | 20 | |||||||||||||
| E | - | - | 277,302 | 25 | |||||||||||||
| Year 1 | $ | 1,007,185 | |
| Year 2 | - | ||
| Year 3 | - | ||
| Total minimum lease payments | 1,007,185 | ||
| Less: Amount representing estimated executory costs (such as taxes, maintenance, and insurance), including profit thereon, included in total minimum lease payments | - | ||
| Net minimum lease payments | 1,007,185 | ||
| Less: Amount representing interest | |||
| Present value of net minimum lease payments | $ | 1,007,185 |
Suppliers Concentrations
The following table sets forth information as to each supplier that accounted for 10% or more of the Company’s purchase as of December 31, 2020 and December 31, 2019.
| For the periods ended | |||||||||||||||||
| Suppliers | December 31, 2020 | December 31, 2019 | |||||||||||||||
| Amount $ | % | Amount $ | % | ||||||||||||||
| A | 307,817 | 50 | - | - | |||||||||||||
| B | 225,577 | 37 | - | - | |||||||||||||
| C | - | - | 196,899 | 36 | |||||||||||||
| D | - | - | 79,878 | 15 | |||||||||||||
| 16. | Discontinued Operations |
As of December 31, 2016,2020, the present valueCompany has reclassified the results of minimum lease payments due within one year is $1,007,185. operations and the financial position of Taishan Muren and Shenzhen Lorain as discontinued operations. Selected details regarding those discontinued operations are provided below.
| For the years ended December 31 | ||||||||
| Results of Operations | 2020 | 2019 | ||||||
| Net revenues | $ | 38,748 | $ | 3,006,595 | ||||
| Cost of revenues | 33,111 | 2,515,326 | ||||||
| Gross profit | 5,637 | 491,269 | ||||||
| Operating expenses: | ||||||||
| Selling and marketing expenses | - | 224 | ||||||
| General and administrative expenses | 152,104 | 1,013,542 | ||||||
| Total operating expenses | 152,104 | 1,013,766 | ||||||
| Operating loss | (146,467 | ) | (522,497 | ) | ||||
| Other income (expenses): | ||||||||
| Interest income(expenses), net. | (4,444 | ) | 169 | |||||
| Other income(expenses), net. | - | (45,039 | ) | |||||
| Impairment for goodwill | - | - | ||||||
| Write off receivables from disposal of former subsidiaries | - | (5,025,034 | ) | |||||
| Total other (expenses) income | (4,444 | ) | (5,069,904 | ) | ||||
| Loss before taxes | (150,911 | ) | (5,592,401 | ) | ||||
| Taxes | - | - | ||||||
| Net income(loss) | $ | (150,911 | ) | $ | (5,592,401 | ) | ||
| As of December 31, | ||||||||
| Financial Position | 2020 | 2019 | ||||||
| Assets | ||||||||
| Current assets | ||||||||
| Cash and cash equivalents | $ | - | $ | 130,813 | ||||
| Trade receivables, net | - | 1,049,538 | ||||||
| Inventories | - | 7,523 | ||||||
| Advances and prepayments to suppliers | - | 5,855,144 | ||||||
| Other receivables and other current assets | - | 4,867 | ||||||
| Related party receivable | - | 2,162 | ||||||
| Total current assets | $ | - | $ | 7,050,047 | ||||
| Non-current assets | ||||||||
| Property, plant and equipment, net | - | 819,992 | ||||||
| Construction in progress, net | - | 834,337 | ||||||
| Deposits | - | 1,454 | ||||||
| Right-of-use assets | - | 398,082 | ||||||
| Total non-current assets | - | 2,053,865 | ||||||
| Total Assets | $ | - | $ | 9,103,912 | ||||
| Liabilities and Stockholders’ Equity | ||||||||
| Current liabilities | ||||||||
| Short-term bank loans | $ | - | $ | 136,044 | ||||
| Accounts payable | - | 187,093 | ||||||
| Taxes payable | - | 108 | ||||||
| Accrued liabilities and other payables | - | 4,300 | ||||||
| Customers deposits | - | - | ||||||
| Related party otherpayables | - | 24,339 | ||||||
| Lease payable-current portion | - | 24,761 | ||||||
| Total current liabilities | $ | - | $ | 376,645 | ||||
| Lease payable- non-current | - | 373,728 | ||||||
| Total non-current liabilities | $ | - | $ | 373,728 | ||||
| Total Liabilities | $ | - | $ | 750,373 | ||||
| Net Assets | $ | - | $ | 8,353,539 | ||||
| 17. | Segment Reporting |
The Company recorded impairmentfollows ASC 280, Segment Reporting, which requires that companies disclose segment data based on the leased assets that underlie these lease obligations; thehow management makes decision about allocating resources to segments and evaluating their performance. The Company’s management evaluates performance and determines resource allocations based on a number of factors, the primary measure being income from operations.
The Company’s main business segment and operations are Xianning Bozhuang and Fast Approach. The Company’s consolidated results of operations and consolidated financial position from continuing operations are almost all attributable to Xianning Bozhuang and Fast Approach. Accordingly, management believes it is appropriatethat the consolidated balance sheets and statement of operations provide the relevant information to account for all remaining lease obligationsassess Xianning Bozhuang and Fast Approach’s performance.
The following represents assets by division as current given that these leased assets are no longer generating long term benefits to the Company.of:
| Total assets as of | December 31, 2020 | December 31, 2019 | ||||||
| Fast Approach and Shanghai Xunyang | $ | 572,509 | $ | - | ||||
| Xianning Bozhuang | 11,968,553 | 14,790,752 | ||||||
| Jiayi Technologies (Xianning) Co., Ltd. | 6,563,580 | 2,003,135 | ||||||
| Planet Green Holdings Corporation (BVI) | - | - | ||||||
| Planet Green Holdings Corporation | 853,486 | 100 | ||||||
| Lucky Sky Planet Green Holdings Co., Limited (H.K.). | 2,012,228 | 2,012,228 | ||||||
| Total Assets | $ | 21,970,355 | $ | 19,331,066 | ||||
| ||
| ||
| ||
F-20
American Lorain CorporationNotes to Financial Statements
In January 2014, the Linyi Court held its first trial session. During the trial, Heng An Investment filed a counterclaim against Shandong Lorain for repayment of out-of-pocket expenses which would offset the entire fixed return plus additional unpaid expenses of RMB 4,746,927 (approximately $765,633). Shandong Lorain responded that Heng An Investment does not have standing to file the counter-claim because the out-of-pocket payments were made by Junan Hengji. In November 2014, the court held a second trial session and completed its discovery process. On March 21, 2015, Shandong Lorain received the Linyi Court's decision that rejected Shandong Lorain's claim for RMB 10,000,000 against Junan Hengji and Heng An Investment. On April 3, 2015, Shandong Lorain appealed the decision to the Supreme Court of Shandong Province.
In November 2015, the Supreme Court of Shandong Province vacated the decision of the Linyi Court and remanded the case back to the Linyi Court for a retrial. The retrial took place on April 25, 2016, at the Linyi City Intermediate People’s Court, and the decision thereon is currently pending.
| |
|
| 2016 | 2015 | ||||||
| Impairment of investment | $ | 8,833,130 | $ | - | |||
| Impairment of inventory | 20,838,366 | - | |||||
| Impairment of property and equipment | 1,184,309 | - | |||||
| Impairment of construction in progress | 13,207,563 | ||||||
| Other | 1,848,087 | 392,683 | |||||
| $ | 45,911,455 | $ | 392,683 |
| |
|
| Results of Operations For the years ended December31, | 2016 | 2015 | |||||
| Sales | $ | 35,178,846 | $ | 66,032,083 | |||
| Cost of sales | 29,629,863 | 57,390,872 | |||||
| Gross profit | 5,548,982 | 8,641,211 | |||||
| Operating expenses | 24,576,521 | 9,539,844 | |||||
| Other income (expenses) | (29,705,992 | ) | (7,557,485 | ) | |||
| Loss before taxes | (48,733,531 | ) | (8,456,119 | ) | |||
| Taxes | 454,416 | 1,153,151 | |||||
| Net loss | $ | (49,187,947 | ) | $ | (9,609,269 | ) | |
F-21
| Other income (expenses) | 2016 | 2015 | |||||
| Other income | $ | 245,778 | 1,077,521 | ||||
| Impairment of investment | (1,505,342 | ) | - | ||||
| Impairment of inventory | (8,578,662 | ) | - | ||||
| Impairment of property and equipment | (19,284,481 | ) | - | ||||
| Impairment of goodwill | - | (6,786,928 | ) | ||||
| Other | (583,285 | ) | (1,848,078 | )- | |||
| $ | (29,705,992 | ) | $ | (7,557,485 | ) |
| Financial Position | |||||||
| At December 31, | 2016 | 2015 | |||||
| Current Assets | $ | 19,745,847 | $ | 70,570,853 | |||
| Non-Current Assets | 16,362,855 | 32,051,046 | |||||
| Total Assets | $ | 36,108,702 | $ | 102,621,899 | |||
| Current Liabilities | $ | 13,811,908 | $ | 43,165,043 | |||
| Total Long-Term Liabilities | - | 326,591 | |||||
| Total Liabilities | $ | 13,811,908 | $ | 43,491,634 | |||
| Net Assets | $ | 22,296,795 | $ | 59,130,265 | |||
| Total Liabilities & Net Assets | $ | 36,108,702 | $ | 102,621,899 |
| 2016 | 2015 | ||||||
| Trade receivables | $ | 1,966,135 | $ | 22,036,952 | |||
| Less: Allowance for doubtful accounts | - | (5,481,615 | ) | ||||
| $ | 1,966,135 | $ | 16,555,337 |
| Inventories | 2016 | 2015 | |||||
| Raw materials | 4,503,460 | 13,488,996 | |||||
| Finished goods | - | 8,750,858 | |||||
| $ | 4,503,460 | $ | 22,239,854 |
| Plant and equipment | 2016 | 2015 | |||||
| At Cost: | |||||||
| Buildings | $ | 12,603,279 | $ | 19,794,637 | |||
| Land | - | 209,010 | |||||
| Landscaping, plant and tree | - | 10,331,020 | |||||
| Machinery and equipment | 6,201,595 | 13,703,772 | |||||
| Office equipment | 2,170 | 628,952 | |||||
| Motor vehicles | 377,456 | 426,562 | |||||
| $ | 19,184,500 | $ | 45,093,953 | ||||
| Less:Accumulated depreciation | (6,566,417 | ) | (21,738,392 | ) | |||
| $ | 12,618,083 | $ | 23,355,561 |
| Intangible assets | 2016 | 2015 | |||||
| At Cost: | |||||||
| Land use rights | 1,134,128 | 1,213,281 | |||||
| Utilities rights | - | - | |||||
| Software | 102,761 | 463,246 | |||||
| Patent | 1,358 | 1,419,428 | |||||
| $ | 1,238,247 | $ | 3,095,955 | ||||
| Less: Accumulated amortization | (373,784 | ) | (718,017 | ) | |||
| $ | 864,463 | $ | 2,377,938 |
F-22
| |
| |
|
| As previously reported | Adjustment | Restated | ||||||||
| Sales | $ | 215,315,437 | $ | (8,571,793 | ) | $ | 206,743,644 | |||
| Cost of sales | 179,197,430 | (7,076,892 | ) | 172,120,538 | ||||||
| Gross profit | 36,118,006 | (1,494,900 | ) | 34,623,106 | ||||||
| Operating income | 14,052,920 | (1,494,900 | ) | 12,558,020 | ||||||
| Total other expense | (10,728,224 | ) | - | (10,728,224 | ) | |||||
| Loss before tax | 3,324,696 | (1,494,900 | ) | 1,829,796 | ||||||
| Net loss | $ | (1,191,239 | ) | $ | (1,494,900 | ) | $ | (2,686,139 | ) |
The effect of correction of these errors on retained earnings and significant asset and liability accounts is as follows:
| As previously reported | Adjustment | Restated | ||||||||
| Accounts receivable | 62,532,017 | (9,269,327 | ) | 53,262,690 | ||||||
| Inventory | 43,712,048 | 6,779,018 | 50,491,066 | |||||||
| Total current asset | 191,049,927 | (2,449,159 | ) | 188,600,768 | ||||||
| Total asset | 309,537,530 | (2,449,159 | ) | 307,088,371 | ||||||
| Taxes payable | 5,863,261 | (1,017,181 | ) | 4,846,080 | ||||||
| Total current liabilities | 97,003,426 | (1,017,181 | ) | 95,986,245 | ||||||
| Total liabilities | 107,569,431 | (1,017,181 | ) | 106,552,250 | ||||||
| Retained earnings | 101,389,920 | (1,370,586 | ) | 100,019,334 | ||||||
| Total stockholders’ equity | 201,968,099 | (1,431,978 | ) | 200,536,121 | ||||||
| Total liabilities and stockholders’ equity | 309,537,531 | (2,449,160 | ) | 307,088,371 |
F-23
Risks |
| ||
| A. | Credit risk | |
| The Company’s deposits are made with banks located in the PRC. They do not carry federal deposit insurance and may be subject to loss of the banks become insolvent. | ||
Since the Company’s inception, the age of account receivables has been less than one year indicating that the Company is subject to minimal risk borne from credit extended to customers. | ||
| B. | Interest risk | |
| �� | ||
The |
| C. | Economic and political risks |
| ||
The Company’s operations are conducted in the PRC. Accordingly, the Company’s business, financial condition, and results of operations may be influenced by changes in the political, economic, and legal environments in the PRC. | ||
The Company’s operations in the PRC are subject to special considerations and significant risks not typically associated with companies in North America and Western Europe. These include risks associated with, among others, the political, economic and legal environment and foreign currency exchange. The Company’s results may be adversely affected by changes in the political and social conditions in the PRC, and by changes in governmental policies with respect to laws and regulations, anti-inflationary measures, currency conversion, remittances abroad, and rates and methods of taxation, among other things. |
| D. | Environmental risks | |
| ||
The Company has procured environmental licenses required by the PRC government. The Company has both a water treatment facility for water used in its production process and secure transportation to remove waste off site. In the event of an accident, the Company has purchased insurance to cover potential damage to employees, equipment, and local environment. | ||
| E. | Inflation Risk | |
Management monitors changes in prices levels. Historically inflation has not materially impacted the |
F-24
| 19. | Subsequent Events |
Acquisition of Jingshan Sanhe Luckysky New Energy Technologies Co., Ltd
In January 2021, the Company and its wholly-owned subsidiary Jiayi Technologies (Xianning) Co., Ltd, formerly known as Lucky Sky Petrochemical Technology (Xianning) Co., Ltd., entered into a series of VIE agreements with Jingshan Sanhe Luckysky New Energy Technologies Co., Ltd and its equity holders to obtain control and become the primary beneficiary of Jingshan Sanhe Luckysky New Energy Technologies Co., Ltd. The Company consolidated Jingshan Sanhe Luckysky New Energy Technologies Co., Ltd’s accounts as its VIE. According to the VIE agreements, the Company issued an aggregate of 2,200,000 shares of common stock of the Company to the equity holders of Jingshan Sanhe Luckysky New Energy Technologies Co., Ltd in exchange for the transfer of 85% of the equity interest of Jingshan Sanhe Luckysky New Energy Technologies Co., Ltd to the Jiayi Technologies (Xianning) Co., Ltd. The significant terms of these VIE agreements are summarized in “Note 2 - Summary of Significant Accounting Policies” above.
The Company’s acquisition of Jingshan Sanhe Luckysky New Energy Technologies Co., Ltd was accounted for as a business combination following ASC 805. The Company has allocated the purchase price of Jingshan Sanhe based upon the fair value of the identifiable assets acquired and liabilities assumed on the acquisition date. The Company estimated the fair values of the assets acquired and liabilities taken at the acquisition date following the business combination standard issued by the FASB with the valuation methodologies using level 3 inputs, except for other current assets and current liabilities were valued using the cost approach. Management of the Company is responsible for determining the fair value of assets acquired, liabilities assumed, and intangible assets identified as the acquisition date and considered several other available factors. Acquisition-related costs incurred for the acquisitions are not material and expensed as incurred in general and administrative expense.
Acquisition of Jilin Chuangyuan Chemical Co., Ltd
In March 2021, the Company and its wholly-owned subsidiary Jiayi Technologies (Xianning) Co., Ltd, formerly known as Lucky Sky Petrochemical Technology (Xianning) Co., Ltd., entered into a series of VIE agreements with Jilin Chuangyuan Chemical Co., Ltd and its equity holders to obtain control and become the primary beneficiary of Jilin Chuangyuan Chemical Co., Ltd. The Company consolidated Jilin Chuangyuan Chemical Co., Ltd’s accounts as its VIE. Under the VIE agreements, the Company issued an aggregate of 3,300,000 shares of common stock of the Company to the equity holders of Jilin Chuangyuan Chemical Co., Ltd in exchange for the transfer of 75% of the equity interest of Jilin Chuangyuan Chemical Co., Ltd to the Jiayi Technologies (Xianning) Co., Ltd. The significant terms of these VIE agreements are summarized in “Note 2 - Summary of Significant Accounting Policies” above.
The Company’s acquisition of Jilin Chuangyuan Chemical Co., Ltd was accounted for as a business combination following ASC 805. The Company has allocated the purchase price of Jilin Chuangyuan based upon the fair value of the identifiable assets acquired and liabilities assumed on the acquisition date. The Company estimated the fair values of the assets acquired and liabilities taken at the acquisition date following the business combination standard issued by the FASB with the valuation methodologies using level 3 inputs, except for other current assets and current liabilities were valued using the cost approach. Management of the Company is responsible for determining the fair value of assets acquired, liabilities assumed, and intangible assets identified as of the acquisition date and considered several other available factors. Acquisition-related costs incurred for the acquisitions are not material and expensed as incurred in general and administrative expenses.
The following table sets forth the unaudited pro forma condensed combined balance sheet for the purpose of providing a brief description of the respective identifiable assets and liabilities of the two companies and the impact on the overall statement of PLAG assuming that the merger date was on December 31, 2020.
Planet Green Holdings Corp.
Unaudited Pro Forma Condensed Combined Balance Sheet
AS OF DECEMBER 31, 2020
(Stated in US Dollars)
| PLAG | JSSH | JLCY | Adjustments | Combined | ||||||||||||||||
| ASSETS | ||||||||||||||||||||
| Cash | $ | 3,415,751 | $ | 21,973 | $ | 95,237 | $ | - | $ | 3,532,961 | ||||||||||
| Accounts receivable | 835,384 | - | 868,874 | - | 1,704,258 | |||||||||||||||
| Advances and prepayments to suppliers | 5,922,562 | 298,381 | 388,349 | - | 6,609,292 | |||||||||||||||
| Other receivables and other current assets | 1,091,815 | 282878 | 123,969 | - | 1,498,663 | |||||||||||||||
| Due from related parties | - | - | 212,594 | - | 212,594 | |||||||||||||||
| Inventory | 2,251,628 | 400,012 | 581,569 | - | 3,233,209 | |||||||||||||||
| Total Current Assets | 13,517,140 | 1,003,245 | 2,270,593 | - | 16,790,977 | |||||||||||||||
| Property, plant and equipment, net. | 4,596,637 | 4,021,195 | 11,109,220 | - | 19,727,053 | |||||||||||||||
| Intangible assets, net | 1,516,467 | 12,893 | 2,149,910 | - | 3,679,269 | |||||||||||||||
| Right-of-use assets | - | 976,605 | - | - | 976,605 | |||||||||||||||
| Other assets and goodwill | 2,340,111 | - | - | 4,220,888 | 6,560,999 | |||||||||||||||
| Deferred Tax Asset | - | 728,743 | 415,154 | - | 1,143,897 | |||||||||||||||
| Total Non-Current Assets | 8,453,215 | 5,739,436 | 13,674,284 | 4,220,888 | 32,087,823 | |||||||||||||||
| Total Assets | $ | 21,970,355 | $ | 6,742,680 | $ | 15,944,877 | $ | 4,220,888 | $ | 48,878,800 | ||||||||||
| LIABILITIES, MINORITY INTEREST & STOCKHOLDERS’ EQUITY | ||||||||||||||||||||
| Liabilities | ||||||||||||||||||||
| Short term loans | $ | - | $ | 459,235 | $ | 3,826,934 | $ | - | $ | 4,286,169 | ||||||||||
| Accounts payable | 1,302,850 | 153,439 | 575,495 | - | 2,031,784 | |||||||||||||||
| Customer advances and deposits | 241,893 | 6,904 | 291,655 | - | 540,452 | |||||||||||||||
| Other payable | 1,848,598 | 1,071,967 | 2,722,428 | - | 5,642,993 | |||||||||||||||
| Due to related parties | 19,850 | - | 765,387 | - | 785,237 | |||||||||||||||
| Taxes payable | 198,683 | - | 1,073 | - | 199,756 | |||||||||||||||
| Deferred tax liabilities | 15,682 | - | 73,477 | - | 89,159 | |||||||||||||||
| Lease payables | - | 406,410 | - | - | 406,410 | |||||||||||||||
| Total Current Liabilities | 3,627,556 | 2,097,954 | 8,256,449 | - | 13,981,959 | |||||||||||||||
| Long term debt | 31,364 | - | - | - | 31,364 | |||||||||||||||
| Long term payable | - | - | 1,162,355 | - | 1,162,355 | |||||||||||||||
| Lease payables-non current | - | 425,715 | - | - | 425,715 | |||||||||||||||
| Total Non-Current Liabilities | 31,364 | 425,715 | 1,162,355 | - | 1,619,434 | |||||||||||||||
| Total Liabilities | $ | 3,658,919 | $ | 2,523,669 | $ | 9,418,804 | $ | - | $ | 15,601,392 | ||||||||||
| Stockholders’ Equity | ||||||||||||||||||||
| Registered capital | $ | - | $ | 4,710,254 | $ | 9,280,493 | $ | (13,990,747 | ) | $ | - | |||||||||
| Common stock | 11,810 | - | - | 5,500 | 17,310 | |||||||||||||||
| Additional paid in capital | 95,659,360 | - | - | 15,941,766 | 111,601,126 | |||||||||||||||
| Statutory reserves | - | - | - | - | - | |||||||||||||||
| Retained earnings | (84,331,897 | ) | (281,646 | ) | (2,129,776 | ) | - | (86,743,319 | ) | |||||||||||
| Accumulated other comprehensive income | 6,972,163 | (209,597 | ) | (624,645 | ) | - | 6,137,921 | |||||||||||||
| Total stockholders’ equity | 18,311,436 | 4,219,011 | 6,526,073 | 1,956,519 | 31,013,038 | |||||||||||||||
| Non-controlling interest | - | - | - | 2,264,370 | 2,264,370 | |||||||||||||||
| Total Equity | $ | 18,311,436 | $ | 4,219,011 | $ | 6,526,073 | $ | 4,220,888 | $ | 33,277,408 | ||||||||||
| Total Liabilities & Stockholders’ Equity | $ | 21,970,355 | $ | 6,742,680 | $ | 15,944,877 | $ | 4,220,888 | $ | 48,878,800 | ||||||||||