0001069157us-gaap:CommercialPortfolioSegmentMemberewbc:FinancingAssets1To89DaysPastDueMemberewbc:CommercialAndIndustrialLoanMember2020-12-3100010691572023FYfalsehttp://fasb.org/us-gaap/2023#AccountingStandardsUpdate202202Memberhttp://www.eastwestbank.com/20231231#Lendingfeeshttp://fasb.org/us-gaap/2023#OtherAssetshttp://fasb.org/us-gaap/2023#AccruedLiabilitiesAndOtherLiabilitieshttp://fasb.org/us-gaap/2023#OtherAssetshttp://fasb.org/us-gaap/2023#AccruedLiabilitiesAndOtherLiabilities
UNITED STATES
SECURITIES AND EXCHANGE COMMISSION
Washington, D.C. 20549
FORM 10-K
☒ ANNUAL REPORT PURSUANT TO SECTION 13 OR 15(d) OF
THE SECURITIES EXCHANGE ACT OF 1934
For the fiscal year ended December 31, 20202023
OR
☐ TRANSITION REPORT PURSUANT TO SECTION 13 OR 15(d) OF
THE SECURITIES EXCHANGE ACT OF 1934
For the transition period from to
Commission file number 000-24939
EAST WEST BANCORP, INC.
(Exact name of registrant as specified in its charter)
Delaware
(State or other jurisdiction of incorporation or organization)
95-4703316
(I.R.S. Employer Identification No.)
135 North Los Robles Ave., 7th Floor, Pasadena, California, 91101
(Address of principal executive offices) (Zip Code)
(626) 768-6000
(Registrant’s telephone number, including area code)
Securities registered pursuant to Section 12(b) of the Act:
| | | | | | | | | | | | | | | | | |
| Title of each class | | Trading Symbol(s) | | Name of each exchange on which registered |
Common Stock,stock, par value $0.001 Par Valueper share | | EWBC | | Nasdaq Global Select Market |
Securities registered pursuant to Section 12(g) of the Act: None
Indicate by check mark if the registrant is a well-known seasoned issuer, as defined in Rule 405 of the Securities Act. Yes ☒ No ☐
Indicate by check mark if the registrant is not required to file reports pursuant to Section 13 or Section 15(d) of the Act. Yes ☐ No ☒
Indicate by check mark whether the registrant (1) has filed all reports required to be filed by Section 13 or 15(d) of the Securities Exchange Act of 1934 during the preceding 12 months (or for such shorter period that the registrant was required to file such reports), and (2) has been subject to such filing requirements for the past 90 days. Yes ☒ No ☐
Indicate by check mark whether the registrant has submitted electronically every Interactive Data File required to be submitted pursuant to Rule 405 of Regulation S-T (§ 232.405 of this chapter) during the preceding 12 months (or for such shorter period that the registrant was required to submit such files). Yes ☒ No ☐
Indicate by check mark whether the registrant is a large accelerated filer, an accelerated filer, a non-accelerated filer, a smaller reporting company, or an emerging growth company. See the definitions of “large accelerated filer,” “accelerated filer,” “smaller reporting company,” and “emerging growth company” in Rule 12b-2 of the Exchange Act.
| | | | | | | | | | | | | | | | | | | | |
| Large accelerated filer | ☒ | Accelerated filer | ☐ | Smaller reporting company | ☐ | | | |
| Non-accelerated filer | ☐ | | | Emerging growth company | ☐ | | | |
If an emerging growth company, indicate by check mark if the registrant has elected not to use the extended transition period for complying with any new or revised financial accounting standards provided pursuant to Section 13(a) of the Exchange Act. ☐
Indicate by check mark whether the registrant has filed a report on and attestation to its management’s assessment of the effectiveness of its internal control over financial reporting under Section 404(b) of the Sarbanes-Oxley Act (15 U.S.C. 7262(b)) by the registered public accounting firm that prepared or issued its audit report. ☒
If securities are registered pursuant to Section 12(b) of the Act, indicate by check mark whether the financial statements of the registrant included in the filing reflect the correction of an error to previously issued financial statements. ☐
Indicate by check mark whether any of those error corrections are restatements that required a recovery analysis of incentive-based compensation received by any of the registrant’s executive officers during the relevant recovery period pursuant to § 240.10D-1(b). ☐
Indicate by check mark whether the registrant is a shell company (as defined in Rule 12b-2 of the Exchange Act). Yes ☐ No ☒
The aggregate market value of the registrant’s common stock held by non-affiliates was approximately $5,090,501,829$7,396,326,818 (based on the June 30, 20202023 closing price of Common Stock of $36.24$52.79 per share). As of January 31, 2021, 141,565,4732024, 140,030,010 shares of East West Bancorp, Inc. Common Stock were outstanding.
DOCUMENT INCORPORATED BY REFERENCE
Portions of the registrant’s definitive proxy statement to be filed with the Securities and Exchange Commission pursuant to Regulation 14A relating to its 20212024 Annual Meeting of Stockholders are incorporated by reference into Part III of this Form 10-K.
EAST WEST BANCORP, INC.
20202023 ANNUAL REPORT ON FORM 10-K
TABLE OF CONTENTS
PART I
Forward-Looking Statements
This Annual Report on Form 10-K (“this Form 10-K”) contains certain “forward-looking information about usstatements” that isare intended to be covered by the safe harbor for “forward-looking statements”such statements provided by the Private Securities Litigation Reform Act of 1995. East West Bancorp, Inc. (referred to herein on an unconsolidated basis as “East West” and on a consolidated basis as the “Company,” “we”, “us”, “our” or “EWBC”) may make forward-looking statements in other documents that it files with, or furnishes to, the United States (“U.S.”) Securities and Exchange Commission (“SEC”) and management may make forward-looking statements to analysts, investors, media members and others. Forward-looking statements are statementsthose that aredo not relate to historical facts and that are based on current assumptions, beliefs, estimates, expectations estimates and projections, about the Company’s industry, management’s beliefs and certain assumptions made by management, many of which, by their nature, are inherently uncertain and beyond the Company’s control, particularly with regardcontrol. Forward-looking statements may relate to developments related to the Coronavirus Disease 2019 (“COVID-19”) pandemic. These statements relate tovarious matters, including the Company’s financial condition, results of operations, plans, objectives, future performance, business or business. Theyindustry, and usually can be identified by the use of forward-looking language,words, such as “likely result in,“anticipates,” “assumes,” “believes,” “can,” “continues,” “could,” “estimates,” “expects,” “anticipates,“forecasts,” “estimates,“goal,” “forecasts,“intends,” “likely,” “may,” “might,” “objective,” “plans,” “potential,” “projects,” “intends to,“remains,” “assumes,“should,” or may include other similar words or phrases, such as “believes,” “plans,“target,” “trend,” “objective,“will,” “continues,” “remains,“would,” or similar expressions or future or conditional verbs, such as “will,” “would,” “should,” “could,” “may,” “might,” “can,” or similar verbs,variations thereof, and the negative thereof.thereof, but these terms are not the exclusive means of identifying such statements. You should not place undue reliance on theseforward-looking statements, as they are subject to risks and uncertainties, including, but not limited to, those described in the documents incorporated by reference.below. When considering these forward-looking statements, you should keep in mind these risks and uncertainties, as well as any cautionary statements the Company may make. Moreover, you should treat these statements as speaking only as of the date they are made and based only on information then actually known to the Company.
There are a number ofvarious important factors that could cause future results to differ materially from historical performance and theseany forward-looking statements. Factors that might cause such differences, some of which are beyond the Company’s control, include, but are not limited to:
•the impact of disease pandemics, such as the resurgences and subsequent waves of the COVID-19 pandemic on the Company, its operations and its customers, employees and the markets in which the Company operates and in which its loans are concentrated; and the measures that international, federal, state and local governments, agencies, law enforcement and/or health authorities implement to address it, which may precipitate or exacerbate one or more of the below-mentioned and/or other risks, and significantly disrupt or prevent the Company from operating its business in the ordinary course for an extended period;
•changes in governmental policy and regulation, including measures taken in response to economic, business, political and social conditions, such as the Small Business Administration’s (“SBA”) Paycheck Protection Program (“PPP”), the Coronavirus Aid, Relief, and Economic Security Act (“CARES Act”) and any similar or related rules and regulations, the Board of Governors of the Federal Reserve System (“Federal Reserve”) efforts to provide liquidity to the United States (“U.S.”) financial system, including changes in government interest rate policies, and to provide credit to private commercial and municipal borrowers, and other programs designed to address the effects of the COVID-19 pandemic, as well as the resulting effect of all such items on the Company’s operations, liquidity and capital position, and on the financial condition of the Company’s borrowers and other customers;
•changes in the U.S.global economy, including an economic slowdown, capital or recession,financial market disruption, supply chain disruption, level of inflation, deflation, housinginterest rate environment, residential and commercial property prices, employment levels, rate of growth and general business conditions;conditions, which could result in, among other things, reduced demand for loans, reduced availability of funding or increased funding costs, declines in asset values and/or recognition of allowance for credit losses;
•changes in local, regional and global business, economic and political conditions and geopolitical events, such as political unrest, wars and acts of terrorism;
•the soundness of other financial institutions and the impacts related to or resulting from bank failures and other economic and industry volatility, including potential increased regulatory requirements, Federal Deposit Insurance Corporation (“FDIC”) insurance premiums and assessments, deposit withdrawals, or other adverse consequences of negative market perceptions of the banking industry or us;
•changes in laws or the regulatory environment, including regulatory reform initiatives and policies of the U.S. Department of the Treasury, the Board of Governors of the Federal Reserve the System (“Federal Deposit Insurance Corporation (“FDIC”Reserve”), the Office ofFDIC, the Comptroller of the Currency, the U.S. Securities and Exchange Commission (“SEC”),SEC, the Consumer Financial Protection Bureau (“CFPB”) and, the California Department of Financial Protection and Innovation (“DFPI”) - Division of Financial Institutions, the People’s Bank of China (“PBOC”), China’s National Administration of Financial Regulation (“NAFR”), the Hong Kong Monetary Authority (“HKMA”), the Hong Kong Securities and SBA;Futures Commission (“HKSFC”), and the Monetary Authority of Singapore (“MAS”);
•the changes and effects thereof in trade, monetary and fiscal policies and laws, including the ongoing trade, disputeeconomic and political disputes between the U.S. and the People’s Republic of China and the monetary policies of the Federal Reserve;
•changes in the commercial and consumer real estate markets;
•changes in consumer or commercial spending, savings and savings habits;borrowing habits, and patterns and behaviors;
•fluctuations in the Company’s stock price;
•impact from changes into income tax laws and regulations;regulations, federal spending and economic stimulus programs;
•the impact of any future U.S. federal government shutdown and uncertainty regarding the U.S. federal government’s debt limit and credit rating;
•the Company’s ability to compete effectively against other financial institutions in its banking markets;and other entities, including as a result of emerging technologies;
•the success and timing of the Company’s business strategies;
•the Company’s ability to retain key officers and employees;
•the impact on the Company’s funding costs, net interest income and net interest margin from changes in key variable market interest rates, competition, regulatory requirements and the Company’s product mix;
•changes in the Company’s costs of operation, compliance and expansion;
•the Company’s ability to adopt and successfully integrate new initiatives or technologies into its business in a strategic manner;
•the impact of benchmark interest rate reform in the U.S. that resulted in the Secured Overnight Financing Rate (“SOFR”) being selected as the preferred alternative reference rate to the London Interbank Offered Rate (“LIBOR”);
•impact of a communications or technology disruption, failure in, or breach of, the Company’s operational or security systems or infrastructure, or those of third partiesthird-party vendors with whomwhich the Company does business, including as a result of cyber-attacks;cyber-attacks, and other similar matters which could result in, among other things, confidential, and/proprietary, or proprietarypersonally identifiable information being disclosed or misused, and materially impact the Company’s ability to provide services to its clients;
•the adequacy of the Company’s risk management framework, disclosure controls and procedures and internal control over financial reporting;
•future credit quality and performance, including the Company’s expectations regarding future credit losses and allowance levels;
•the impact of adverse changes to the Company’s credit ratings from major credit rating agencies;
•the impact of adverse judgments or settlements in litigation;litigation and other proceedings;
•the impact on the Company’s international operations due toof political developments, disease pandemics, wars, civil unrest, terrorism or other hostilities that may disrupt or increase volatility in securities or otherwise affect business and economic conditions;conditions on the Company and its customers;
•heightened regulatory and governmental oversight and scrutiny of the Company’s business practices, including dealings with consumers;
•the impact of reputational risk from negative publicity, fines, and penalties and other negative consequences from regulatory violations, and legal actions and from the Company’s interactions with business partners, counterparties, service providers and other third parties;
•the impact of regulatory investigations, regulatory agreements, supervisory criticisms, and enforcement actions;
•changes in accounting standards as may be required by the Financial Accounting Standards Board (“FASB”) or other regulatory agencies and their impact on the Company’s critical accounting policies and assumptions;
•impact of other potential federal tax changes and spending cuts;
•the Company’s capital requirements and its ability to generate capital internally or raise capital on favorable terms;
•the impact on the Company’s liquidity due to changes in the Company’s ability to receive dividends from its subsidiaries;
•any future strategic acquisitions or divestitures;
•continuing consolidation indivestitures and the financial services industry;introduction of new or expanded products and services;
•changes in the equity and debt securities markets;
•fluctuations in the Company’s stock price;
•fluctuations in foreign currency exchange rates;
•a recurrencethe impact of significant turbulence or disruption inincreased focus on social, environmental and sustainability matters, which may affect the capital or financial markets, which could result in, among other things, a reduction inoperations of the availability of funding or increases in funding costs, a reduction in investor demand for mortgage loansCompany and declines in asset values and/or recognition of other-than-temporary impairment (“OTTI”) on securities held inits customers and the Company’s available-for-sale (“AFS”) debt securities portfolio;economy more broadly; and
•the impact of climate change, natural or man-made disasters or calamities, such as wildfires, droughts, hurricanes, flooding and earthquakes which are particular to California, or conflicts or other events that may directly or indirectly result in a negative impact on the Company’s financial performance.
Given the ongoing and dynamic natureperformance of the COVID-19 pandemic circumstances, it is difficult to predict the full impact of the COVID-19 pandemic on the Company’s business. The extent to which the COVID-19 pandemic impacts the Company will depend on future developments that are uncertain and unpredictable, including the scope, severity and duration of the pandemic and its impact on the Company’s customers, the actions taken by governmental authorities in response to the pandemic as well as its impact on global and regional economies, and the pace of recovery when the COVID-19 pandemic subsides, among others.customers.
For a more detailed discussion of some of the factors that might cause such differences, see Item 1A. Risk Factors presented elsewhere in this report.Form 10-K. You should treat forward-looking statements as speaking only as of the date they are made and based only on information then actually known to the Company. The Company does not undertake, and specifically disclaims, any obligation to update or revise any forward-looking statements to reflect the occurrence of events or circumstances after the date of such statements except as required by law.
ITEM 1. BUSINESS
Organization
East West Bancorp, Inc. (referred to herein on an unconsolidated basis as “East West” and on a consolidated basis as the “Company,” “we” or “EWBC”) is a bank holding company incorporated in Delaware on August 26, 1998, and is registered under the Bank Holding Company Act of 1956, as amended (“BHC Act”). The Company commenced business on December 30, 1998 when, pursuant to a reorganization, it acquired all of the voting stock of East West Bank (the(“East West Bank” or the “Bank”), which became its principal asset. East West’s principal business is to serve as a holding company for the Bank and other banking or banking-related subsidiaries that East West may establish or acquire. As of December 31, 2023, the Company had $69.6 billion in total assets, $51.5 billion in total net loans, $56.1 billion in total deposits, and $7.0 billion in total stockholders’ equity.
The Company operates in more thanover 120 locations in the U.S. and Greater China.Asia. In the U.S., the Bank’s corporate headquarters and main administrative offices are located in California,California; its U.S. branches and its branchesoffices are located in California, Texas, New York, Washington, Georgia, Massachusetts, Illinois and Nevada. TheIn Asia, the Bank has a banking subsidiary basedfour full-service branches in China - East West Bank (China) Limited.
As of December 31, 2020, the Company had $52.16 billionHong Kong, Shanghai, Shantou and Shenzhen; five representative offices in total assets, $37.77 billionBeijing, Chongqing, Guangzhou, Xiamen and Singapore; and administrative support offices in total loans (including loans held-for-sale, net of allowance), $44.86 billion in total deposits,Beijing and $5.27 billion in total stockholders’ equity.Shanghai.
Strategy
We are committed to enhancing long-term stockholder value by growing loans, deposits and revenue, improving profitability, and investing for the future while managing risks, expenses and capital. Our business model is built on customer loyalty and engagement, understanding our customers’ financial goals, and meeting our customers’ financial needs through our diverse products and services. Our strategy focuses on seeking out and deepening client relationships that meet our risk/return parameters. This guides our decision-making across every aspect of our operations: the products and services we develop, the expertise we cultivate, and the infrastructure we build to help our customers conduct their businesses. We expect our relationship-focused business model to continue to generate organic growth from existing customers and to expand our targeted customer bases. We constantly invest in technology to improve the customer user experience, strengthen critical business infrastructure, and streamline core processes, while properly managing operating expenses. Our risk management activities are focused on ensuring that the Bank identifies and manages risks to sustain safety and soundness while maximizing profitability.
East West Bank has a commercial business operating license in China through its subsidiary, East West Bank (China) Limited, which makes it unique among U.S.-based regional banks. This license allows the Bank to open branches, make loans and collect deposits in the country. The Bank continues to develop its international banking presence in Asia with its network of overseas branches and representative offices that include four full-service branches in Greater China, located in Hong Kong, Shanghai, Shantou and Shenzhen. The Bank also has four representative offices in Greater China, located in Beijing, Chongqing, Guangzhou and Xiamen.offices. In addition to facilitating traditional letters of credit and trade financing to businesses, these representative offices allow the Bank to assist existing clients and to develop new business relationships. Through theseits branches and offices, the Bank is focusedfocuses on growing its cross-border client base between the U.S. and Greater China,Asia, helping U.S. basedU.S.-based businesses expand in Greater ChinaAsia, and assisting companies based in Greater ChinaAsia pursue business opportunities in the U.S.
The Bank believes that its customers benefit from the Bank’s understanding of the Greater China marketsAsian market through its physical presence, corporate and organizational ties in Greater China,Asia, as well as the Bank’s international banking products and services. The Bank believes that this approach, combined with its senior management’smanagement and Board of Directors’ extensive ties to ChineseAsian business opportunities and Chinese-AmericanAsian American communities, provides the Bank with a competitive advantage. The Bank utilizes its presence in Greater Chinaoverseas to identify and build corporate relationships, which the Bank may leverage to create business opportunities in California and other U.S. markets.
The Bank continues to explore opportunities to establish other foreign offices, subsidiaries, strategic investments and partnerships to expand its international banking capabilities and to capitalize on long-term cross-border business opportunities between the U.S. and Greater China.
Banking Services
As of December 31, 2020, the2023, East West Bank was the fourth largest independent commercial bank headquartered in Southern California based on total assets. The Bank is the largest independent bank in the U.S. focused on the financial service needs of individuals and businesses that operate both in the U.S. and Greater China. The Bank alsoAsia, and has a strong focus on the Chinese-AmericanAsian American community. Through its network of over 120 banking locations in the U.S. and Greater China,Asia, the Bank provides a wide range of personal and commercial banking services to businessesindividuals and individuals.businesses. The Bank provides services to its customers in English and in over 10 other languages. In addition to offering traditional deposit products that include personal and business checking and savings accounts, money market, and time deposits, the Bank also offers foreign exchange, treasury management and wealth management services. The Bank’s lending activities include commercial and residential real estate lending, construction finance, commercial business lending, working capital lines of credit, construction, trade finance, letters of credit, commercial business, affordable housing lending, asset-based lending, asset-backed finance, project finance, equipment financing and equipment financing. In addition, theloan syndication. The Bank is focused on providingalso provides financing services to clients in need of a financial bridge to facilitate their business transactions between the U.S. and Greater China.Asia. Additionally, to support the business needs of its customers, the Bank offers hedging advisory and various derivative contracts such as interest rate, energy commodity and foreign exchange contracts.
The integration of digital channels and brick and mortarwith brick-and-mortar channels has been our focus, and an area of investment for the bank,Bank, for both commercial and consumer banking platforms.banking. Our strategic priorities include the use of technology to innovate and expand commercial payments, and treasury management products and services.services, and consumer banking. We have developed mobile and online banking platforms, which are also developing a digital consumer banking platformcontinually enhanced to enhanceenrich our customer user experience, and which offer a full suite of banking services tailored to our customers’ unique needs. TheIn our view, the omnichannel banking service approach increases efficiency enables us to provide a better customer experience and deependeepens customer relationships.
Operating Segments
The Bank’s three operating segments, (1) Consumer and Business Banking, (2) Commercial Banking and (3) Other, are based on the Bank’s core strategy. The Consumer and Business Banking segment primarily provides financial products and services to consumer and commercial customers through the Company’s domestic branch network.network and digital banking platforms. The Commercial Banking segment primarily generates commercial loans and deposits. The remaining centralized functions, including the corporate treasury activities of the Company and eliminations of inter-segment amounts, are aggregated and included in the Other segment. For complete discussion and disclosure, see Item 7. Management’s Discussion and Analysis of Financial Condition and Results of Operations (“MD&A”) — Results of Operation — Operating Segment Results and Note 1817 — Business Segments to the Consolidated Financial Statements in this Form 10-K.
Competition
The Bank operates in a highly competitive environment. The Company faces intense competition from domestic and foreign lending institutions, and numerous other financial services providers and other entities, including as a result of financial services.emerging technologies. Competition is based on a number of factors including, among others, customer service and convenience, quality and range of products and services offered, reputation, fees, interest rates on loans and deposits and lending limits. Competition also varies based on the types of customers and locations served. The Company is a leader of banking market share amongin the Chinese-American community, andAsian American community. The Company maintains a differentiated presence within selected markets by providing cross-border commercial banking expertise to customers in a number of industry specializations between the U.S. and Greater China.Asia.
While the Company believes it is well positioned within a highly competitive industry, the industry could become even more competitive as a result of legislative, regulatory, economic, and technological changes, as well as continuing consolidation.
Human Capital
As a company that delivers relationship-driven financial solutions to a diverse customer base, we believe that the strength of our workforce is one of the most significant contributors to our success. Our key human capital objectives are to attract, retaindevelop and developretain quality talent who we reward through competitive payembody our values and benefits.enable us to serve our customers. To achieve these objectives, our human resource programs have been designed based on our core values and the attributes we seek to foster, which include absolute integrity, customer-centric principles, creativity,integrity; customer orientation; creativity; respect teamwork,and fairness; teamwork; expertise and professionalism; and selflessness. TheseWe use these core values to better service our customers and attributes are used to prepare our employees for leadership positions and to advance their careers. East West isWe are also committed to promoting diversity in employment and advancement.advancement, and recognizing our employees for their contributions and service to our bank.
As of December 31, 2020,2023, we had approximately 3,2003,206 full-time equivalent employees, of which 220 are229 were located in China, Hong Kong and Hong Kong.Singapore. Nearly all of our workforce were full-time employees, predominantly located in our core markets of California, Texas and New York. The Company’s compensation and employee benefits expense was $509 million and $478 million, or 50% and 56% of total noninterest expense in 2023 and 2022, respectively. None of our employees are subject to a collective bargaining agreement.
Diversity and Inclusion
East West Bank was founded in 1973 in Chinatown, Los Angeles, California as a savings & loan association for immigrants who were underserved by mainstream banks, and, as such, we have a long history of, and commitment to, diversity and inclusion.banks. As of December 31, 2020,2023, the Bank had grown to bewas the largest FDIC-insured, minority-operated depository institution headquartered in the continental United States,U.S., serving communities with diverse ethnicities and socio-economic backgrounds in seveneight states across the nation. Our operations are concentrated in areas that include larger numbers of immigrants and minorities. We proudly offer financing for affordable housing,home loans and other products and services that support low-to-moderate income, minority and immigrant communities. We also provide community development loans, and partner with a diverse list of nonprofit and community-based organizations to promote wealth generation and entrepreneurship in underserved communities. Throughout our history,Our focus on basic, fair-priced products and alternative credit criteria supports the diversityunder-banked, which is part of our employees has been essential to successfully grow customer relationships.
founding mission.
Our commitment to diversity is reflected in the composition of our employees. In 2020, 74% of the Company’s employees are Asian or Asian-American, 15% are other minorities of color, and 11% are Caucasian. Nearly two-thirds of our employees are women. Our managers are equally as diverse as our employees: 75% of our managers are Asian or Asian-American and 11% are other minorities of color, and 57% of our managers are women. In addition, given our diverse customer base and the diversity of the communities that we serve, our retail bankers are able to assist customers in English and in over 10 other languages.
ThePromoting diversity and inclusion in our workforce and executive leadership is critical to our continued growth and success, and is at the core of our guiding principles. Our commitment to this mission is reflected in the composition of our employees. In addition, we have adopted an Environmental and Social Policy Framework that governs our mission to support diversity, and formed an LGBTQ+ & Allies employee resource group in addition to our two existing employee resource groups that focus on cultural awareness and empowering women to pursue leadership development and opportunities. As of December 31, 2023, the composition of our workforce was as follows:
| | | | | | | | | | | | | | |
| | | | |
| | % of Total Workforce | | % of Total Managers |
Gender (1): | | | | |
| Female | | 62% | | 58% |
| Male | | 38% | | 42% |
| | | | |
| Race/ethnicity: | | | | |
| Minorities: | | | | |
| Asian minorities | | 74% | | 74% |
| Non-Asian minorities | | 15% | | 12% |
| White | | 11% | | 14% |
| | | | |
(1)Presented as a percentage of the respective populations who self-identified.
To put our diversity in context, minorities made up 46% of the workforce and 18% of the managers of FDIC-regulated institutions, according to the most recently available 2020 Diversity Self-Assessment from the FDIC’s Financial Institution Diversity Self-Assessment program. Our organizational commitment to diversity, under the leadership and oversight of our Board of Directors, exemplifiesis further reflected by the composition of our 11-member Board, which is presented in the following table as of December 31, 2023. This commitment to diversity. Ofdiversity was acknowledged in Bank Director’s 2022 “RankingBanking” study, in which we received the “Best Board” ranking due to our eight directors, six are minorities, representing four ethnic groups,strong corporate governance practices, and three are women.the diversity and expertise of our directors.
| | | | | | | | | | | | | | |
| | | | |
| | Female | | Male |
| | | | |
| | | | |
| | | | |
| | | | |
| Race/ethnicity: | | | | |
| Minorities: | | | | |
| Asian minorities | | 2 | | 2 |
| Non-Asian minorities | | 1 | | 2 |
| White | | — | | 4 |
| Sexual orientation: | | | | |
| | | | |
| LGBTQ+ | | — | | 1 |
| | | | |
Talent Acquisition, Development, Promotion and PromotionEngagement
An experienced and well-qualified workforce is essential to delivering high quality and reliable banking services to our customers and to managing the Company in a safe and sound manner. We endeavor to attract, develop, and retain and develop diverse, motivated talent as part of our ongoing commitment to building a stronger workforce to serve our customers and communities. As a result, we were able to continue our quality hiring efforts with over 500 external new hires in 2023.
The focus on leadership development and promoting from within is a critical part of our succession planning for key roles throughout the organization and fostering organizational stability. We offer a total compensation package, including salary, benefitsrecognize the importance of employee development and incentive pay,career growth in fostering retention of our employees, which is competitive with those offered byone of the Company's strategic objectives. In 2023, 18% of our peersemployees advanced their careers within the Bank through over 550 internal promotions or new opportunities. We provide a variety of resources to help all employees grow in their current roles and build new skills for future advancement, including the encouragement of continuing education and providing benefits such as tuition reimbursement.
We celebrate our employees’ dedicated years of service to the Bank through our Milestone Anniversary Program, which offers rewards and recognition through gifts and events when our employees reach certain service milestones. As of December 31, 2023, approximately 300 of our employees have celebrated 20 years or more of service. In 2023, we commemorated our 50th anniversary. With our employees’ commitment, strength, expertise and contribution, we earned the “No. 1 Performing Bank” ranking in the businesses$50 billion and markets where we operate.above asset category in Bank Director’s 2023 RankingBanking study. We were also ranked among the top 5 in Fortune’s Best Workplaces for Women in 2023 and were named one of Newsweek’s 100 Most Loved Workplaces in 2022 and 2023. We were also recognized as one of five banks featured in ARTnews’ 75 Top Art World Professionals in 2023.
Fair and Equitable Compensation
Our compensation and benefits program provides both short- and long-term awards, incentivizing performance, and aligning employee and stockholder interests. Employee compensation packages include a competitive base salary and, subject to Company and individual performance, may include an annual cash and stock incentive bonus. We are committed to fair and equitable compensation programs, and regularly assess the current business environment and labor markets to review our compensation and benefits programsprogram for pay equity. We sponsor a 401(k) plan for U.S. employees, provide a Company matching contribution, and maintain other defined contribution retirement plans. As of December 31, 2023, 98% of employees participated in our 401(k) plan.
To foster a strong sense of ownership and to align the interests of our employees with our shareholders,stockholders, restricted stock units are awarded to eligible employees under our stock incentive programs. We also award stock grants under our “Spirit of Ownership” program to all of our employees, regardless of job title or part-time/full-time status. The program allows each employee to share directly in the success they help create. The fact that all our employees are also owners is a source of pride for EWBC.us.
We recognizeIn 2023, the importanceCompany granted over 600 thousand restricted stock units as part of employee development and career growth in achieving personal development for our employees and also the Company’s strategic objectives. We provide a variety of resources to help our employees grow in their current roles and build new skills for future advancement, including tuition reimbursement and a management trainee program. Our success in talent development is evident by our internal promotions into leadership positions.its stock compensation programs.
Health Safety and WellnessWell-being
We are committed to supporting our employees’ well-being by offering flexible and competitive benefits. We offer a hybrid schedule to promote flexibility and enhance productivity among our associates. Comprehensive health insurance coverage (medical, dental and vision) is offered to employees working at least 30 hours or more each week. Prior to the COVID-19 pandemic, we offered a variety of programs We offer life insurance, disability insurance, parental leave, wellness and benefits programs designed to assist employees in maintaining a healthy work-life balance, paid time off such as vacation hours, and 10 days of annual sick time, which is more than the required allotment from any of the states in which we do business. We also offer an Employee Assistance Program, which aids benefits-eligible employees and their household members with personal and professional issues. We apply a consistent approach towards employee policies, opportunities, benefits, and protections to all employees regardless of their locations, except if there are contradictions between individual state laws.
Commitment to Community
We are committed to making positive and lasting impacts in our communities through our business activities and our volunteer and charitable efforts. We aim to enhance the quality of life in our communities by engaging in meaningful and effective programs that help increase homeownership, preserve affordable housing, promote employee wellness. In addition,wealth building, enable more inclusive access to banking services and help alleviate homelessness. We are a vital part of the communities in which we live and work, and we encourage our employees to engage with our local communities by leading or participating in events to foster community development.
Information about our Executive Officers
The following table presents the Company’s executive officers’ names, ages, positions and development,offices, and business experience during the last five years as COVID-19of February 28, 2024. There is no family relationship between any of the Company’s executive officers or directors. The Board of Directors of the Company appointed each of the executive officers.
| | | | | | | | | | | | | | | | |
| | | | | | |
| Name | | Age | | Positions and Offices, and Business Experience | | |
| Dominic Ng | | 65 | | Chairman and Chief Executive Officer of the Company and the Bank since 1992. | | |
| Christopher J. Del Moral-Niles | | 53 | | Executive Vice President and Chief Financial Officer of the Company and the Bank since October 2023; 2012 - 2022 Executive Vice President and Chief Financial Officer of Associated Bancorp and Associated Bank, N.A. | | |
| Irene H. Oh | | 46 | | Executive Vice President and Chief Risk Officer of the Company and the Bank since October 2023; 2010 - 2023: Executive Vice President and Chief Financial Officer of the Company and the Bank. | | |
| Lisa L. Kim | | 59 | | Executive Vice President, General Counsel and Corporate Secretary of the Company and the Bank since 2020; 2014 - 2020: Executive Vice President, General Counsel and Secretary of Cathay General Bancorp and Cathay Bank. | | |
| Douglas P. Krause | | 67 | | Vice Chairman and Chief Corporate Officer of the Company and the Bank since 2020; 2018 - 2020: Executive Vice President, General Counsel and Corporate Secretary; 2010 - 2018: Executive Vice President, Chief Risk Officer and General Counsel. | | |
| Parker Shi | | 54 | | Executive Vice President and Chief Operating Officer of the Company and the Bank since December 2021; June 2021 - November 2021: Executive Vice President & Chief Strategy, Growth and Technology Officer; March 2021 - June 2021: Consultant of the Bank; 2020: Senior Advisor at PharmScript; 2018 - 2019: Senior Managing Director at Accenture; 2013 - 2018: Senior Partner at McKinsey & Company. | | |
| | | | | | |
| Gary Teo | | 51 | | Executive Vice President and Chief Human Resources Officer of the Company and the Bank since February 2022; 2015 - 2022: Senior Vice President and Head of Human Resources. | | |
| | |
Supervision and Regulation
Overview
East West and the Bank are subject to extensive and comprehensive regulations under U.S. federal and state laws. Regulation and supervision by the federal and state banking agencies are intended primarily for the protection of depositors, the Deposit Insurance Fund (“DIF”) administered by the FDIC, consumers, and the banking system as a whole, and not for the protection of our investors. As a bank holding company, East West is subject to primary regulation, supervision, and examination by the Federal Reserve under the BHC Act. The Bank is regulated, supervised, and examined by the Federal Reserve, the DFPI, and, with respect to consumer laws, the CFPB. As the insurer of the Bank’s deposits, the FDIC has back-up examination authority of the Bank as well. In addition, the Bank and its wholly-owned subsidiary, East West Bank (China) Limited, are regulated by foreign regulatory agencies in international jurisdictions where we have a presence, including China, Hong Kong and Singapore. East West also has a wholly-owned nonbank subsidiary, East West Markets, LLC ("East West Markets"), which is an SEC-registered broker-dealer and a member of the Financial Industry Regulatory Authority, Inc. ("FINRA"). East West Markets is subject to regulatory requirements from several regulatory bodies, including the SEC, FINRA, and state securities regulators.
The Company is also subject to the disclosure and regulatory requirements under the Securities Act of 1933, as amended (the “Securities Act”), and Section 21E of the Securities Exchange Act of 1934, as amended (the “Exchange Act”), and the rules and regulations adopted by the SEC thereunder. Our common stock is listed on the Nasdaq Global Select Market under the trading symbol “EWBC” and subject to Nasdaq rules for listed companies.
Described below are certain provisions of selected statutes and regulations applicable to East West and the Bank. The descriptions are not intended to be complete, nor are they meant to fully address the statutes and regulations’ effects and potential effects on East West and the Bank, and the descriptions are qualified in their entirety by reference to the full text of the statutes and regulations. A change in applicable statutes, regulations or regulatory policies may have a material effect on the Company’s business.
East West
As a bank holding company and pursuant to its election of financial holding company status, East West is subject to regulation, supervision, and examination by the Federal Reserve under the BHC Act. The BHC Act provides a federal framework for the regulation and supervision of bank holding companies and their nonbank subsidiaries. The BHC Act and other federal statutes grant the Federal Reserve authority to, among other things:
•require periodic reports and such additional information as the Federal Reserve may require in its discretion;
•require bank holding companies to maintain certain levels of capital and, under the Dodd-Frank Wall Street Reform and Consumer Protection Act (the “Dodd-Frank Act”), limit the ability of bank holding companies to pay dividends or bonuses unless their capital levels exceed the capital conservation buffer (see the section captioned “Regulatory Capital Requirements” included elsewhere under this item);
•require bank holding companies to serve as a source of financial and managerial strength to subsidiary banks and commit resources, as necessary, to support each subsidiary bank, including at times when bank holding companies may not be inclined to do so, and the failure to do so generally may be considered by the Federal Reserve to be an unsafe and unsound banking practice and a violation of Federal Reserve regulations;
•restrict dividends and other distributions from subsidiary banks to their parent bank holding companies;
•require bank holding companies to terminate an activity or terminate control of or liquidate or divest certain nonbank subsidiaries, affiliates or investments if the Federal Reserve believes that the activity, ownership, or control of the nonbank subsidiary or affiliate constitutes a serious risk to the financial safety, protocols permit.soundness or stability of the bank holding company, or if the activity, ownership, or control is inconsistent with the purposes of the BHC Act;
•regulate provisions of certain bank holding company debt, including by imposing interest ceilings and reserve requirements and requiring a bank holding company to obtain prior approval to purchase or redeem its securities in certain situations;
•approve in advance senior executive officer or director changes and prohibit certain golden parachute payments to officers and employees, including change in control agreements and new employment agreements, that are contingent upon termination; and
•approve in advance the acquisitions of and mergers with bank holding companies, banks and other financial companies, and consider competitive, managerial resources, financial stability and other factors in granting these approvals. DFPI approval may also be required for certain acquisitions and mergers involving a California state-chartered bank such as the Bank.
East West has elected to be a financial holding company as permitted under the Gramm-Leach-Bliley Act of 1999 (“GLBA”). Financial holding companies are generally allowed to engage in any activity that the Federal Reserve has determined to be financial in nature or incidental or complementary to activities that are financial in nature, or acquire and retain the shares of a company engaged in any such activity, without prior Federal Reserve approval. Activities that are considered financial in nature include securities underwriting and dealing, insurance agency and underwriting, merchant banking activities and activities that the Federal Reserve, in consultation with the U.S. Secretary of the Treasury, determines to be financial in nature or incidental to such financial activity. To maintain financial holding company status and continue to be able to engage in new activities or investments that are financial in nature, a financial holding company and all its depository institution subsidiaries must be “well capitalized” and “well managed,” and the financial holding company’s depository institution subsidiaries must have Community Reinvestment Act (“CRA”) ratings of at least “Satisfactory.” A depository institution subsidiary is considered “well capitalized” if it satisfies the requirements for this status discussed in the sections captioned “Regulatory Capital Requirements”and“Prompt Corrective Action,” included elsewhere under this item. A depository institution subsidiary is considered “well managed” if it received a composite rating and a management rating of at least “Satisfactory” in its most recent examination. See the section captioned “Community Reinvestment Act” included elsewhere under this item.
The Bank and its Subsidiaries
East West Bank is a California state-chartered bank and a member of the Federal Reserve System, and its deposits are insured by the FDIC. The Bank’s operations in the U.S. are primarily regulated and supervised by the Federal Reserve and the DFPI, and its activities outside the U.S. are regulated and supervised by its U.S. regulators and the applicable regulatory authority in the host country in which each overseas office is located. Specific federal and state laws and regulations that are applicable to banks monitor, among other things, their regulatory capital levels, the scope of their business, their investments, their reserves against deposits, the timing of the availability of deposited funds, and the nature and amount of collateral for certain loans. Bank regulatory agencies also have extensive discretion to impose various restrictions on management or operations and to issue policies and guidance in connection with their supervisory and enforcement activities and examination policies. California law permits state-chartered commercial banks to engage in any activity permissible for national banks, unless such activity is expressly prohibited by state law. The Bank may also form subsidiaries to engage in many activities commonly conducted by national banks in operating subsidiaries. Further, pursuant to the GLBA, the Bank may conduct certain “financial” activities in a subsidiary to the same extent permitted for a national bank, provided the Bank is “well capitalized” and “well managed” and has a CRA rating of at least “Satisfactory.”
Regulation of Foreign Subsidiaries and Branches
The Bank’s foreign subsidiary, East West Bank (China) Limited, is subject to applicable foreign laws and regulations, such as those implemented by the PBOC and the NAFR. East West Bank’s Hong Kong branch is subject to applicable foreign laws and regulations, such as those implemented by the HKMA and the HKSFC. The Bank’s Singapore representative office is subject to applicable foreign laws and regulations, such as those implemented by the MAS.
Regulatory Capital Requirements
The federal banking agencies have imposed capital adequacy requirements, known as the Basel III Capital Rules, intended to ensure that banking organizations maintain capital that is commensurate with the degree of risk associated with their operations. The Basel III Capital Rules define the components of regulatory capital, including Common Equity Tier 1 (“CET1”), Tier 1 and 2 capital, and set forth minimum capital adequacy ratios of capital to risk-weighted assets and total assets. The Basel III Capital Rules also prescribe a standardized approach for risk-weighting assets and include a number of risk-weighting categories that affect the denominator in banking institutions’ regulatory capital ratios.
Under the Basel III Capital Rules, to be considered adequately capitalized, standardized approach banking organizations, such as the Company and the Bank are required to maintain minimum capital ratios of at least 4.5% CET1 capital to risk-weighted assets, 6.0% Tier 1 capital to risk-weighted assets, 8.0% total risk-based capital (i.e., Tier 1 plus Tier 2 capital) to risk-weighted assets and a 4.0% Tier 1 leverage ratio of Tier 1 capital to average total consolidated assets. The Basel III Capital Rules also include a “capital conservation buffer” of 2.5% on top of each of the minimum risk-based capital ratios. Banking institutions with a risk-based capital ratio that meets or exceeds the minimum requirement but does not exceed the capital conservation buffer will face constraints on dividends, equity repurchases and discretionary bonus payments based on the amount of the shortfall. As of December 31, 2023, the Company’s and the Bank’s capital ratios exceeded the minimum capital adequacy requirements of the federal banking agencies, including the capital conservation buffer, and the Company and the Bank were classified as “well capitalized.” For additional discussion and disclosure see Item 7. MD&A — Regulatory Capital and Ratios and Note 16 — Regulatory Requirements and Matters to the Consolidated Financial Statements in this Form 10-K.
The Bank is also subject to additional capital requirements under the Prompt Corrective Action (“PCA”) regulations that implement Section 38 of the Federal Deposit Insurance Act (“FDIA”), as discussed below under the Prompt Corrective Action section.
Regulatory Capital-Related Developments
From time to time, the regulatory agencies propose changes and amendments to, and issue interpretations of, risk-based capital requirements and related reporting instructions. Such proposals and interpretations could, if implemented in the future, affect our regulatory capital requirements and reported capital ratios.
Pursuant to the five-year transition rule approved by the U.S. federal banking agencies in March 2020, the effects of the current expected credit loss accounting standard (“CECL”) on the Company’s and the Bank’s regulatory capital were delayed through the year 2021, after which the effects are being phased-in over a three-year period from January 1, 2022 through December 31, 2024. For additional discussion and disclosure on CECL, see Item 7. MD&A — Regulatory Capital and Ratios and Note 16 — Regulatory Requirements and Matters to the Consolidated Financial Statements in this Form 10-K.
On July 27, 2023, the federal banking agencies jointly released a proposed rule to implement the international capital standards issued by the Basel Committee on Banking Supervision and known as “Basel III Endgame.” The Basel III Endgame proposal would revise the capital framework applicable to large banking organizations with $100 billion or more in total consolidated assets or with significant trading activity and, if finalized, would likely result in meaningfully increased capital requirements for those organizations. The Company has total consolidated assets of less than $100 billion and does not have significant trading activity, and therefore would not be subject to the Basel III Endgame requirements if they are finalized as proposed. However, by imposing additional costs on banking organizations with $100 billion or more in total consolidated assets, this rule proposal could reduce the benefits of growth beyond that size for a banking organization that has less than $100 billion in total consolidated assets, such as the Company.
Prompt Corrective Action
The FDIA, as amended, requires federal banking agencies to take PCA with respect to insured depository institutions (“IDIs”) that do not meet minimum capital requirements. The FDIA includes the following five capital tiers: “well capitalized,” “adequately capitalized,” “undercapitalized,” “significantly undercapitalized” and “critically undercapitalized.” A depository institution’s capital tier will depend upon how its capital levels compare with various relevant capital measures and certain other factors, as established by regulations. The capital tiers in the PCA framework do not apply directly to bank holding companies (such as the Company). Under the federal banking agencies’ regulations implementing the PCA provisions of the FDIA, an IDI (such as the Bank) generally is classified in the following categories based on the capital measures indicated:
| | | | | | | | | | | | | | | | | | | | | | | | | | |
|
| | Risk-Based Capital Ratios | | |
| PCA Category | | Total Capital | | Tier 1 Capital | | CET1 Capital | | Tier 1 Leverage |
Well capitalized (1) | | ≥ 10% | | ≥ 8% | | ≥ 6.5% | | ≥ 5% |
| Adequately capitalized | | ≥ 8% | | ≥ 6% | | ≥ 4.5% | | ≥ 4% |
| Undercapitalized | | < 8% | | < 6% | | < 4.5% | | < 4% |
| Significantly undercapitalized | | < 6% | | < 4% | | < 3.0% | | < 3% |
| Critically undercapitalized | | Tangible equity/Total assets ≤ 2% |
|
(1)Additionally, to be classified as “well capitalized”, an IDI may not be subject to any written agreement, order, capital directive, or PCA directive issued by its primary federal regulator to meet and maintain a specific capital level for any capital measure.
An institution may be downgraded to, or deemed to be in, a capital category that is lower than indicated by its capital ratios, if it is determined to be in an unsafe or unsound condition or if it receives an unsatisfactory examination rating with respect to certain matters. A bank’s capital category is determined solely for the purpose of applying PCA regulations and the capital category may not constitute an accurate representation of the bank’s overall financial condition or prospects for other purposes.
The FDIA generally prohibits a depository institution from making any capital distributions (including payment of any dividend) or paying any management fee to its parent holding company, if the depository institution would thereafter be “undercapitalized.” Undercapitalized institutions are subject to growth limitations and are required to submit capital restoration plans. If a depository institution fails to submit an acceptable plan, it is treated as if it is “significantly undercapitalized.” Significantly undercapitalized depository institutions may be subject to several requirements and restrictions, including orders to sell sufficient voting stock to become “adequately capitalized,” requirements to reduce total assets, cessation of receipt of deposits from correspondent banks and/or restrictions on interest rates paid on deposits. “Critically undercapitalized” institutions are subject to the appointment of a receiver or conservator. The FDIA also generally permits only “well capitalized” IDIs to accept brokered deposits, although an “adequately capitalized” institution may apply to the FDIC for a waiver of this restriction.
Economic Growth, Regulatory Relief, and Consumer Protection Act and Stress Testing
In May 2018, the enactment of the Economic Growth, Regulatory Relief, and Consumer Protection Act (“EGRRCPA”) amended certain provisions in the Dodd-Frank Act and other statutes administered by the Federal Reserve and other federal banking agencies. The EGRRCPA lifted the asset size threshold for many of the Dodd-Frank Act enhanced prudential standards that had previously applied to banks and bank holding companies with total consolidated assets between $50 billion and $100 billion, except for the requirement to maintain a risk committee. The EGRRCPA also raised the asset size threshold for required company-run stress testing at banks and bank holding companies from $10 billion to $250 billion. Additionally, based on authority provided in the EGRRCPA, the Federal Reserve raised the asset size threshold for required supervisory stress testing at bank holding companies from $50 billion to $100 billion. Although the Company and the Bank are not required to conduct company-run or supervisory stress tests, we continue to conduct annual capital and quarterly liquidity stress tests.
Consumer Financial Protection Bureau Supervision
The Dodd-Frank Act established the CFPB, which has the authority to implement, examine and enforce compliance with federal consumer financial laws that apply to banking institutions with total consolidated assets exceeding $10 billion (such as the Bank) and their affiliates. The CFPB focuses its supervisory, examination, and enforcement efforts on, among other things:
•risks to consumers and compliance with federal consumer financial laws when evaluating the policies and practices of a financial institution;
•unfair, deceptive, or abusive acts or practices;
•rulemaking to implement various federal consumer statutes such as the Home Mortgage Disclosure Act, Truth in Lending Act, Real Estate Settlement Procedures Act, Electronic Fund Transfer Act, Equal Credit Opportunity Act, Fair Credit Billing Act, and the Consumer Financial Protection Act; and
•the markets in which firms operate and risks to consumers posed by activities in those markets.
The statutes and regulations that the CFPB enforces mandate certain disclosure and other requirements, and regulate the manner in which financial institutions must deal with consumers when taking deposits, making loans, collecting payments on loans, and providing other services. The CFPB’s rulemaking, examination and enforcement authority has affected and will continue to impact financial institutions that provide consumer financial products and services, including the Company and the Bank. These regulatory activities may limit the types of financial services and products the Company may offer. Failure to comply with federal and state laws prohibiting unfair, abusive, or fraudulent business practices, untrue or misleading advertising and unfair competition, can subject the Bank to various penalties, including, but not limited to, enforcement actions, injunctions, fines or criminal penalties, punitive damages, restitution to consumers, and the loss of certain contractual rights or business opportunities and may also result in significant reputational harm.
Federal Home Loan Bank and the Federal Reserve’s Reserve Requirements
The Bank is a member of the Federal Home Loan Bank (“FHLB”) of San Francisco. As an FHLB member, the Bank is required to own a certain amount of capital stock in the FHLB. The Bank may also access the FHLB for both short- and long-term secured credit.
The Federal Reserve requires all depository institutions to maintain reserves at specified levels against their transaction accounts either in the form of vault cash or an interest-bearing account at the Federal Reserve Bank, or a pass-through account as defined by the Federal Reserve. Effective March 26, 2020, the Federal Reserve reduced reserve requirement ratios to zero percent, eliminating the reserve requirement for all depository institutions, an action that provides liquidity in the banking system to support lending to households and businesses. The Bank is a member bank and stockholder of the Federal Reserve Bank of San Francisco (“FRBSF”).
Dividends and Other Transfers of Funds
The principal source of liquidity of East West is dividends received from the Bank. The Bank is subject to various statutory and regulatory restrictions on its ability to pay dividends. In addition, the banking agencies may prohibit or limit the Bank from paying dividends, depending upon the Bank’s financial condition, if such payment is deemed to constitute an unsafe or unsound practice. Furthermore, under the federal PCA regime, the Federal Reserve or FDIC may prohibit a bank holding company from paying any dividends if the holding company’s bank subsidiary is classified as “significantly undercapitalized” or, in some circumstances, “undercapitalized.” It is the Federal Reserve’s policy that a bank holding company should generally pay dividends on common stock only if the company’s net income available to common stockholders over the past four quarters, net of distributions, would be sufficient to fully fund the dividends, and if the prospective rate of earnings retention appears consistent with the company’s capital needs, asset quality and overall financial condition. It is also the Federal Reserve’s policy that a bank holding company should not maintain dividend levels that undermine the company’s ability to be a financial source of strength to its banking subsidiaries. The Federal Reserve requires bank holding companies to continuously review their dividend policy in light of their organizations’ financial condition and in compliance with regulatory capital requirements, and has discouraged payment ratios that are at maximum allowable levels, unless both asset quality and capital are strong.
Transactions with Affiliates and Insiders
Pursuant to Sections 23A and 23B of the Federal Reserve Act, as implemented by the Federal Reserve’s Regulation W, banks are subject to restrictions that limit their ability to engage in transactions with their affiliates, including their parent bank holding companies. Regulation W limits the types, terms and amounts of these transactions and generally requires the transactions to be on an arm’s-length basis. In general, Regulation W requires that “covered transactions,” which include a bank’s extension of credit to or purchase of assets from an affiliate, be limited to 10% of the bank’s capital and surplus with respect to any one affiliate, and 20% of the bank’s capital and surplus with respect to the aggregate of all covered transactions with all affiliates. In addition, a bank generally may not extend credit to an affiliate unless the extension of credit is secured by specified amounts of collateral. The Dodd-Frank Act expanded the coverage and scope of the limitations on affiliate transactions, including by treating derivative transactions resulting in a bank’s credit exposure to an affiliate as covered transactions. In addition, the Volcker Rule under the Dodd-Frank Act establishes certain prohibitions, restrictions and requirements (known as “Super 23A” and “Super 23B”) on transactions between a covered fund and a banking entity that serves as an investment manager, investment adviser, organizer and offeror, or sponsor with respect to that covered fund, regardless of whether the banking entity has an ownership interest in the fund.
Federal law also limits a bank’s authority to extend credit to its directors, executive officers and principal stockholders, as well as to entities controlled by such persons (collectively, “insiders”). Among other things, extensions of credit to insiders are required to be made on terms that are substantially the same as, and follow credit underwriting procedures that are not less stringent than, those prevailing for comparable transactions with unaffiliated persons. The terms of such extensions of credit may not involve more than the normal risk of repayment or present other unfavorable features and may not exceed certain limitations on the amount of credit extended to such persons, individually and in the aggregate, which limits are based, in part, on the amount of the bank’s capital.
Community Reinvestment Act
Under the CRA, an IDI has a continuing and affirmative obligation to help serve the credit needs of its communities, including low- and moderate-income borrowers and neighborhoods. The Federal Reserve periodically evaluates a state member bank’s performance under applicable performance criteria and assign a rating of “outstanding,” “satisfactory,” “needs to improve” or “substantial noncompliance.” The Federal Reserve takes this performance into account when reviewing applications by banks and their parent companies to expand branches, relocate, add subsidiaries and affiliates, expand into new financial activities and merge with or acquire other financial institutions. Unsatisfactory CRA performance may result in the denial of such applications. Based on the guidance from health authorities regardingmost recent CRA examination as of March 8, 2021, the COVID-19 pandemic, we provided resourcesBank was rated “outstanding”.
On October 24, 2023, the federal banking agencies issued a final rule revising their framework for evaluating banks’ records of community reinvestment under the CRA. Under the revised framework, banks with assets of at least $2 billion, such as the Bank, are considered large banks and implementedtheir retail lending, retail services and products, community development financing, and community development services will be subject to periodic evaluation. Depending on a large bank’s geographic distribution of lending, the evaluation of retail lending may include assessment areas in which the bank extends loans but does not operate any deposit-taking facilities, in addition to assessment areas in which the bank has deposit taking facilities. The rule becomes effective April 1, 2024. Compliance with most provisions of the final rule will be required beginning January 1, 2026, and compliance with the remaining provisions will be required beginning January 1, 2027. The Company is evaluating the impact of the final rule.
FDIC Deposit Insurance Assessments
The FDIC insures the Bank’s customer deposits through the DIF up to $250,000 for each depositor, per FDIC-insured bank, for each account ownership category. The DIF is funded mainly through quarterly insurance assessments on insured banks based on their assessment base. The Dodd-Frank Act revised the FDIC’s fund management authority by establishing a minimum Designated Reserve Ratio of 1.35 percent of total estimated insured deposits and redefining the assessment base to be calculated as average consolidated total assets minus average tangible equity. The Bank’s DIF quarterly assessment is calculated by multiplying its assessment base by the applicable assessment rate. The assessment rate is calculated based on an institution’s risk profile, including capital adequacy, asset quality, management, earnings, liquidity and sensitivity to market risk ratings, certain financial measures to limitassess an institution’s ability to withstand asset related stress and funding related stress, and a measure of loss severity that estimates the riskrelative magnitude of exposurepotential losses to our employees,the FDIC in the event of the Bank’s failure.
In October 2022, the FDIC adopted a final rule, applicable to all IDIs, to increase the initial base deposit insurance assessment rate schedules uniformly by two basis points (“bps”) to increase the likelihood that the DIF reserve ratio reaches the statutory minimum of 1.35 percent by the statutory deadline of September 30, 2028. The increase in rates took effect in the first quarterly assessment period of 2023.
In November 2023, the FDIC approved a final rule to implement a special deposit insurance assessment to recover losses to the DIF arising from the protection of uninsured depositors following the receiverships of failed institutions in the spring of 2023. Under the final rule, the assessment base for the special assessment is equal to an IDI’s estimated uninsured deposits, reported for the quarter ended December 31, 2022, minus the first $5 billion in estimated uninsured deposits. The FDIC will collect the special assessment over eight quarterly assessment periods starting with the first quarter of 2024, at a quarterly rate of 3.36 bps. The Company recognized the entire assessment expense of approximately $70 million in the fourth quarter of 2023. Depending on future adjustments to the DIF’s estimated loss, the FDIC has retained the ability to cease collection early, extend the special assessment collection period, or impose a one-time final shortfall assessment.
The FDIC may terminate a depository institution’s deposit insurance upon a finding that the institution’s financial condition is unsafe or unsound, that the institution has engaged in unsafe or unsound practices, or that the institution has violated any applicable rule, regulation, condition, or order imposed by the FDIC.
Bank Secrecy Act and Anti-Money Laundering
The Bank Secrecy Act (“BSA”), Uniting and Strengthening America by Providing Appropriate Tools Required to Intercept and Obstruct Terrorism (USA PATRIOT) Act of 2001 (“PATRIOT Act”), the Anti-Money Laundering Act of 2020 and other federal laws and regulations impose obligations on U.S. financial institutions to implement and maintain a program reasonably designed to prevent, detect and report money laundering and the communitiesfinancing of terrorism, verify the identity of their customers, and comply with recordkeeping and other requirements. Regulatory agencies require that the Bank have an effective governance structure for the program that includes effective oversight by our Board of Directors and management. We regularly evaluate and continue to enhance our program to comply with the BSA, the PATRIOT Act and other anti-money laundering (“AML”) laws, regulations and initiatives. Failure of a financial institution to maintain and implement adequate BSA/AML programs, or to comply with all applicable laws or regulations, could have serious legal, compliance, operational, financial and reputational consequences for the institution.
Office of Foreign Assets Control Regulation
The U.S. Department of the Treasury’s Office of Foreign Assets Control (“OFAC”) is responsible for helping to ensure that U.S. financial institutions do not engage in which they livetransactions with certain prohibited parties, as defined by various executive orders and work. ReferActs of Congress. Federal banking regulators also examine banks for compliance with regulations administered by the OFAC for economic sanctions against designated foreign countries, designated nationals, and others. OFAC publishes lists of persons and organizations suspected of aiding, harboring or engaging in terrorist acts, known as Specially Designated Nationals and Blocked Persons. Generally, if a bank identifies a transaction or account relating to Item 7 MD&A — Overview — Our responsea person or entity on an OFAC list, it must freeze the account or block the transaction, file a suspicious activity report and notify the appropriate authorities. Failure to comply with these sanctions could have serious legal, compliance, operational, financial, and reputational consequences, and result in civil monetary penalties on the COVID-19 pandemicCompany and the Bank.
Privacy and Cybersecurity
Federal statutes and regulations, including the GLBA, require banking organizations to take certain actions to protect nonpublic consumer financial information. The Bank has a privacy policy that it must disclose to consumers annually. In some cases, the Bank must obtain a consumer’s consent before sharing information with an unaffiliated third party, and the Bank must allow a consumer to opt out of the Bank’s sharing of information with its affiliates for marketing and certain other purposes. These additional conditions affect the Bank’s information exchanges with credit reporting agencies. The Bank’s privacy practices and the effectiveness of its systems to protect consumer privacy are subjects covered in the Federal Reserve’s periodic compliance examinations.
The Federal Reserve and state regulators, as well as the SEC, CFPB and other self-regulatory organizations, regularly issue guidance on cybersecurity practices and procedures that is intended to enhance cybersecurity risk management among financial institutions and their holding companies and affiliates. For example, the interagency council of the federal banking agencies, the Federal Financial Institutions Examination Council (“FFIEC”), has issued several policy statements and other guidance for banks in light of the growing risk posed by cybersecurity threats. The FFIEC has recently focused on such matters as compromised customer credentials, cyber resilience and business continuity planning. Examinations by the banking agencies now include review of an institution’s information technology and its ability to thwart or mitigate cyber-attacks. The federal banking agencies require banking organizations to notify their primary federal regulator of significant computer security incidents within 36 hours of determining that such an incident has occurred. Effective December 2023, the SEC also has imposed Form 8-K disclosure obligations for further discussion.a material cybersecurity incident, among other cybersecurity related disclosure obligations.
Consumer data privacy and data protection are also the subject of state laws. For example, the Bank is subject to the California Consumer Privacy Act (“CCPA”). This statute grants consumers several rights, including the right to request disclosure of information collected about them and whether that information has been sold or shared with others, the right to request correction of information, the right to request deletion of personal information (subject to certain exceptions), and the right to opt out of the sale of their personal information. However, a consumer does not have these rights with respect to information that is collected, processed, sold, or disclosed pursuant to the GLBA or the California Financial Information Privacy Act. The CCPA was amended by the California Privacy Rights Act. A new agency, the California Privacy Protection Agency, was established to enforce California privacy law.
The privacy and data protection regime in China is in a period of change and there has been significant activity in the field of privacy and cybersecurity legislation in recent years. The Personal Information Protection Law (“PIPL”), the Cybersecurity Law and the Data Security Law form a regulatory framework for privacy and data protection in China. The PIPL establishes guiding principles on the protection of a Chinese citizen’s personal information and applies to entities operating in China, foreign organizations, and individuals processing personal information outside China. The Cybersecurity Law focuses on cybersecurity concerns and requires network operators to implement measures to safeguard the security of networks and systems. The Data Security Law complements the PIPL and Cybersecurity Law by addressing broader data security issues, emphasizing the protection of critical data infrastructure and promoting a risk-based approach to data security. New supporting guidelines and standards are expected as China's cybersecurity, data security, and personal information protection framework continues to evolve. All these changes have potential impact on the business and operations of our Bank and its subsidiary, East West Bank (China) Limited.
Climate-Related Risk Management
In recent years, the federal banking agencies have increased their focus on climate-related risks affecting the operations of banks, the communities they serve and the broader financial system. The agencies have begun to enhance their supervisory expectations regarding banks’ climate risk management practices, including by proposing guidance that would encourage banking organizations to, among other things: evaluate the potential impact of climate-related risks on the bank’s financial condition, operations and business objectives as part of its strategic planning process; account for the effects of climate change in stress testing scenarios and systemic risk assessments; revise expectations for credit portfolio concentrations based on climate-related factors; and prepare for the transition risks to the bank associated with the adjustment to a low-carbon economy and related changes in laws, regulations, governmental policies, technology, and consumer behavior and expectations.
In October 2023, the federal banking agencies released interagency guidance, “Principles for Climate-Related Financial Risk Management for Large Financial Institutions” (the “Principles”), which are intended to encourage banking organizations with $100 billion or more in assets to focus on key aspects of climate-related financial risk management. The Principles cover six areas: governance; policies, procedures, and limits; strategic planning; risk management; data, risk measurement, and reporting; and scenario analysis. The Principles also describe how large banking organizations should manage climate-related financial risks that can arise in risk categories such as credit, liquidity, and other financial risk, and operational, legal and compliance, and other nonfinancial risk. While the agencies’ efforts to-date, including the Principles, have focused on banking organizations with $100 billion or more in total assets, their supervisory expectations on climate risk management practices ultimately may apply to smaller banking organizations such as the Bank.
In addition, states such as California, are taking similar actions on climate-related financial risks. In October 2023, California Governor Gavin Newsom signed into law Senate Bill 253, the Climate Corporate Data Accountability Act (“CCDAA”) and Senate Bill 261, the Climate-Related Financial Risk Act (“CRFRA”). The CCDAA is applicable to U.S.-organized entities that do business in California with annual revenue in excess of $1 billion. Subject to the adoption of implementing regulations by the California Air Resources Board, these entities will need to file annual reports publicly disclosing their direct greenhouse gas (“GHG”) emissions from operations (“Scope 1 emissions”), indirect GHG emissions from energy use (“Scope 2 emissions”) and indirect upstream and downstream supply-chain GHG emissions (“Scope 3 emissions”). The reporting requirements related to Scope 1 and 2 emissions will begin in 2026, while the reporting requirements of Scope 3 emissions will begin in 2027. The CRFRA requires U.S.-organized entities that do business in California, with annual revenues over $500 million to prepare biennial reports disclosing climate-related financial risk and the measures they have adopted to reduce and adapt to that risk. The initial round of the climate risk disclosure reports will be due by January 1, 2026. The Company is a reporting entity under both laws and may incur compliance, maintenance and remediation costs to conform to such requirements.
Potential Regulatory Reforms
On August 29, 2023, the FDIC released a proposed rule that would require covered IDIs to develop and submit detailed plans demonstrating how they could be resolved in an orderly and timely manner in the event of receivership. IDIs with total assets of $100 billion or more would be required to submit full resolution plans, and IDIs with total assets between $50 billion and $100 billion, including the Bank, would be required to submit more limited informational filings. Under the proposal, if the FDIC deemed a resolution plan or informational filing not credible and the IDI failed to resubmit a credible plan, the IDI could become subject to an enforcement action.The Company is evaluating the impact of this proposal.
The federal banking agencies also jointly released a proposed rule on August 29, 2023 that would require bank holding companies and non-consolidated banks with total assets of $100 billion or more to issue and maintain minimum amounts of long-term debt. The Company has total consolidated assets of less than $100 billion and would not be subject to the long-term debt requirements if they are finalized as proposed. However, by imposing additional costs on bank holding companies with $100 billion or more in total consolidated assets, this rule proposal could reduce the benefits of growth beyond that size for a bank holding company that has less than $100 billion in total consolidated assets, such as the Company.
Future Legislation, Regulation and Supervision Activities
New statutes, regulations and policies that contain wide-ranging proposals for altering the structures, regulations and competitive relationships of financial institutions and public companies operating in the U.S. are regularly adopted. Such changes to applicable statutes, regulations, and policies may change the Company’s operating environment in substantial and unpredictable ways, increase the Company’s cost of conducting business, impede the efficiency of internal business processes, subject the Company to increased supervision activities and disclosure and reporting requirements, and restrict or expand the activities in which the Company may engage. Accordingly, such changes may have a significant influence on our operations and activities, financial condition, results of operations, growth plans or future prospects, and the overall growth and distribution of loans, investments and deposits. We cannot predict whether or in what form any statute, regulation or policy will be proposed or adopted or the extent to which our business may be affected by any new statute, regulation or policy.
Available Information
The Company’s website is www.eastwestbank.com. The Company’s Annual Reports on Form 10-K, Quarterly Reports on Form 10-Q, proxy statements, Current Reports on Form 8-K, amendments to those reports filed or furnished pursuant to Section 13(a) or 15(d) of the Securities Exchange Act of 1934, as amended (the “Exchange Act”),Bank and other filings with the SEC are available free of charge at http://investor.eastwestbank.com under the heading “SEC Filings”, as soon as reasonably practicable after the Company electronically files such material with, or furnishes it to, the SEC. These reports are also available for free on the SEC’s website at www.sec.gov. In addition, the Company’s Code of Conduct, Corporate Governance Guidelines, charters of the Audit Committee, Compensation Committee, Executive Committee, Risk Oversight Committee and Nominating/Corporate Governance Committee, and other corporate governance materials are available on the Investor Relations section of the Company’s website. The information contained on the Company’s website as referenced in this report is not part of this report.
Shareholders may also request a copy of any of the above-referenced reports and corporate governance documents free of charge by writing to: Investor Relations, East West Bancorp, Inc., 135 N. Los Robles Avenue, 7th Floor, Pasadena, California 91101; by calling (626) 768-6000; or by sending an e-mail to InvestorRelations@eastwestbank.com.
Supervision and Regulation
Overviewits Subsidiaries
East West Bank is a California state-chartered bank and a member of the Federal Reserve System, and its deposits are insured by the FDIC. The Bank’s operations in the U.S. are primarily regulated and supervised by the Federal Reserve and the DFPI, and its activities outside the U.S. are regulated and supervised by its U.S. regulators and the applicable regulatory authority in the host country in which each overseas office is located. Specific federal and state laws and regulations that are applicable to banks monitor, among other things, their regulatory capital levels, the scope of their business, their investments, their reserves against deposits, the timing of the availability of deposited funds, and the nature and amount of collateral for certain loans. Bank regulatory agencies also have extensive discretion to impose various restrictions on management or operations and to issue policies and guidance in connection with their supervisory and enforcement activities and examination policies. California law permits state-chartered commercial banks to engage in any activity permissible for national banks, unless such activity is expressly prohibited by state law. The Bank may also form subsidiaries to engage in many activities commonly conducted by national banks in operating subsidiaries. Further, pursuant to the GLBA, the Bank may conduct certain “financial” activities in a subsidiary to the same extent permitted for a national bank, provided the Bank is “well capitalized” and “well managed” and has a CRA rating of at least “Satisfactory.”
Regulation of Foreign Subsidiaries and Branches
The Bank’s foreign subsidiary, East West Bank (China) Limited, is subject to applicable foreign laws and regulations, such as those implemented by the PBOC and the NAFR. East West Bank’s Hong Kong branch is subject to applicable foreign laws and regulations, such as those implemented by the HKMA and the HKSFC. The Bank’s Singapore representative office is subject to applicable foreign laws and regulations, such as those implemented by the MAS.
Regulatory Capital Requirements
The federal banking agencies have imposed capital adequacy requirements, known as the Basel III Capital Rules, intended to ensure that banking organizations maintain capital that is commensurate with the degree of risk associated with their operations. The Basel III Capital Rules define the components of regulatory capital, including Common Equity Tier 1 (“CET1”), Tier 1 and 2 capital, and set forth minimum capital adequacy ratios of capital to risk-weighted assets and total assets. The Basel III Capital Rules also prescribe a standardized approach for risk-weighting assets and include a number of risk-weighting categories that affect the denominator in banking institutions’ regulatory capital ratios.
Under the Basel III Capital Rules, to be considered adequately capitalized, standardized approach banking organizations, such as the Company and the Bank are subjectrequired to extensivemaintain minimum capital ratios of at least 4.5% CET1 capital to risk-weighted assets, 6.0% Tier 1 capital to risk-weighted assets, 8.0% total risk-based capital (i.e., Tier 1 plus Tier 2 capital) to risk-weighted assets and comprehensive regulation under U.S. federala 4.0% Tier 1 leverage ratio of Tier 1 capital to average total consolidated assets. The Basel III Capital Rules also include a “capital conservation buffer” of 2.5% on top of each of the minimum risk-based capital ratios. Banking institutions with a risk-based capital ratio that meets or exceeds the minimum requirement but does not exceed the capital conservation buffer will face constraints on dividends, equity repurchases and state laws. Regulationdiscretionary bonus payments based on the amount of the shortfall. As of December 31, 2023, the Company’s and supervision bythe Bank’s capital ratios exceeded the minimum capital adequacy requirements of the federal and state banking agencies, are intended primarily forincluding the protection of depositors, the Deposit Insurance Fund (“DIF”) administered by the FDIC, consumerscapital conservation buffer, and the banking systemCompany and the Bank were classified as a whole,“well capitalized.” For additional discussion and not fordisclosure see Item 7. MD&A — Regulatory Capital and Ratios and Note 16 — Regulatory Requirements and Matters to the protection of our investors. As a bank holding company, East West is subject to primary regulation, supervision, and examination by the Federal Reserve under the BHC Act. Consolidated Financial Statements in this Form 10-K.
The Bank is regulated, supervised, and examined byalso subject to additional capital requirements under the Prompt Corrective Action (“PCA”) regulations that implement Section 38 of the Federal Reserve,Deposit Insurance Act (“FDIA”), as discussed below under the DFPI, and, with respectPrompt Corrective Action section.
Regulatory Capital-Related Developments
From time to consumer laws,time, the CFPB. As insurer of the Bank’s deposits, the FDIC has back-up examination authority of the Bank as well. In addition, the Bank is regulated by certain foreign regulatory agencies in international jurisdictions where we now, or maypropose changes and amendments to, and issue interpretations of, risk-based capital requirements and related reporting instructions. Such proposals and interpretations could, if implemented in the future, wish to conduct business, including Chinaaffect our regulatory capital requirements and Hong Kong.reported capital ratios.
Pursuant to the five-year transition rule approved by the U.S. federal banking agencies in March 2020, the effects of the current expected credit loss accounting standard (“CECL”) on the Company’s and the Bank’s regulatory capital were delayed through the year 2021, after which the effects are being phased-in over a three-year period from January 1, 2022 through December 31, 2024. For additional discussion and disclosure on CECL, see Item 7. MD&A — Regulatory Capital and Ratios and Note 16 — Regulatory Requirements and Matters to the Consolidated Financial Statements in this Form 10-K.
On July 27, 2023, the federal banking agencies jointly released a proposed rule to implement the international capital standards issued by the Basel Committee on Banking Supervision and known as “Basel III Endgame.” The Basel III Endgame proposal would revise the capital framework applicable to large banking organizations with $100 billion or more in total consolidated assets or with significant trading activity and, if finalized, would likely result in meaningfully increased capital requirements for those organizations. The Company is alsohas total consolidated assets of less than $100 billion and does not have significant trading activity, and therefore would not be subject to the disclosureBasel III Endgame requirements if they are finalized as proposed. However, by imposing additional costs on banking organizations with $100 billion or more in total consolidated assets, this rule proposal could reduce the benefits of growth beyond that size for a banking organization that has less than $100 billion in total consolidated assets, such as the Company.
Prompt Corrective Action
The FDIA, as amended, requires federal banking agencies to take PCA with respect to insured depository institutions (“IDIs”) that do not meet minimum capital requirements. The FDIA includes the following five capital tiers: “well capitalized,” “adequately capitalized,” “undercapitalized,” “significantly undercapitalized” and regulatory requirements“critically undercapitalized.” A depository institution’s capital tier will depend upon how its capital levels compare with various relevant capital measures and certain other factors, as established by regulations. The capital tiers in the PCA framework do not apply directly to bank holding companies (such as the Company). Under the federal banking agencies’ regulations implementing the PCA provisions of the Securities ActFDIA, an IDI (such as the Bank) generally is classified in the following categories based on the capital measures indicated:
| | | | | | | | | | | | | | | | | | | | | | | | | | |
|
| | Risk-Based Capital Ratios | | |
| PCA Category | | Total Capital | | Tier 1 Capital | | CET1 Capital | | Tier 1 Leverage |
Well capitalized (1) | | ≥ 10% | | ≥ 8% | | ≥ 6.5% | | ≥ 5% |
| Adequately capitalized | | ≥ 8% | | ≥ 6% | | ≥ 4.5% | | ≥ 4% |
| Undercapitalized | | < 8% | | < 6% | | < 4.5% | | < 4% |
| Significantly undercapitalized | | < 6% | | < 4% | | < 3.0% | | < 3% |
| Critically undercapitalized | | Tangible equity/Total assets ≤ 2% |
|
(1)Additionally, to be classified as “well capitalized”, an IDI may not be subject to any written agreement, order, capital directive, or PCA directive issued by its primary federal regulator to meet and maintain a specific capital level for any capital measure.
An institution may be downgraded to, or deemed to be in, a capital category that is lower than indicated by its capital ratios, if it is determined to be in an unsafe or unsound condition or if it receives an unsatisfactory examination rating with respect to certain matters. A bank’s capital category is determined solely for the purpose of 1933, as amended,applying PCA regulations and Section 21Ethe capital category may not constitute an accurate representation of the Exchange Act, as amended, both as administered bybank’s overall financial condition or prospects for other purposes.
The FDIA generally prohibits a depository institution from making any capital distributions (including payment of any dividend) or paying any management fee to its parent holding company, if the SEC. Our common stock is listed on the Nasdaq Global Select Market under the trading symbol “EWBC” anddepository institution would thereafter be “undercapitalized.” Undercapitalized institutions are subject to Nasdaq rules for listed companies. The Companygrowth limitations and are required to submit capital restoration plans. If a depository institution fails to submit an acceptable plan, it is alsotreated as if it is “significantly undercapitalized.” Significantly undercapitalized depository institutions may be subject to several requirements and restrictions, including orders to sell sufficient voting stock to become “adequately capitalized,” requirements to reduce total assets, cessation of receipt of deposits from correspondent banks and/or restrictions on interest rates paid on deposits. “Critically undercapitalized” institutions are subject to the accounting oversight and corporate governanceappointment of a receiver or conservator. The FDIA also generally permits only “well capitalized” IDIs to accept brokered deposits, although an “adequately capitalized” institution may apply to the Sarbanes-Oxley ActFDIC for a waiver of 2002.this restriction.
Described below are material elements of selected laws
Economic Growth, Regulatory Relief, and regulations applicable to East WestConsumer Protection Act and the Bank. The descriptions are not intended to be complete and are qualified in their entirety by reference to the full text of the statutes and regulations described. A change in applicable statutes, regulations or regulatory policies may have a material effect on the Company’s business.Stress Testing
East West
As a bank holding companyIn May 2018, the enactment of the Economic Growth, Regulatory Relief, and pursuant to its election of financial holding company status, East West is subject to regulation, supervision,Consumer Protection Act (“EGRRCPA”) amended certain provisions in the Dodd-Frank Act and examinationsother statutes administered by the Federal Reserve underand other federal banking agencies. The EGRRCPA lifted the BHC Act. The BHCasset size threshold for many of the Dodd-Frank Act provides a federal framework for the regulationenhanced prudential standards that had previously applied to banks and supervision of all bank holding companies with total consolidated assets between $50 billion and their nonbank subsidiaries.$100 billion, except for the requirement to maintain a risk committee. The BHC ActEGRRCPA also raised the asset size threshold for required company-run stress testing at banks and other federal statutes grantbank holding companies from $10 billion to $250 billion. Additionally, based on authority provided in the EGRRCPA, the Federal Reserve raised the asset size threshold for required supervisory stress testing at bank holding companies from $50 billion to $100 billion. Although the Company and the Bank are not required to conduct company-run or supervisory stress tests, we continue to conduct annual capital and quarterly liquidity stress tests.
Consumer Financial Protection Bureau Supervision
The Dodd-Frank Act established the CFPB, which has the authority to implement, examine and enforce compliance with federal consumer financial laws that apply to banking institutions with total consolidated assets exceeding $10 billion (such as the Bank) and their affiliates. The CFPB focuses its supervisory, examination, and enforcement efforts on, among other things:
•require periodic reportsrisks to consumers and such additional information ascompliance with federal consumer financial laws when evaluating the Federal Reserve may require in its discretion;policies and practices of a financial institution;
•require bank holding companies to maintain certain levels of capital and, under the Dodd-Frank Wall Street Reform and Consumer Protection Act (the “Dodd-Frank Act”), limit the ability of bank holding companies to pay dividendsunfair, deceptive, or bonuses unless their capital levels exceed the capital conservation buffer (see Item 1. Business — Supervision and Regulation — Capital Requirements);abusive acts or practices;
•require bank holding companiesrulemaking to serveimplement various federal consumer statutes such as a source of financial and managerial strength to subsidiary banks and commit resources, as necessary, to support each subsidiary bank, including at times when bank holding companies may not be inclined to do so,the Home Mortgage Disclosure Act, Truth in Lending Act, Real Estate Settlement Procedures Act, Electronic Fund Transfer Act, Equal Credit Opportunity Act, Fair Credit Billing Act, and the failure to do so generally may be considered by the Federal Reserve to be an unsafe and unsound banking practice or a violation of Federal Reserve regulations or both;
•restrict dividends and other distributions from subsidiary banks to their parent bank holding companies;
•require bank holding companies to terminate an activity or terminate control of or liquidate or divest certain nonbank subsidiaries, affiliates or investments if the Federal Reserve believes that the activity or the control of the nonbank subsidiary or affiliate constitutes a serious risk to the financial safety, soundness or stability of the bank holding company, or if the activity, ownership, or control is inconsistent with the purposes of the BHCConsumer Financial Protection Act;
•regulate provisions of certain bank holding company debt, including by imposing interest ceilings and reserve requirements on such debt and requiring a bank holding company to obtain prior approval to purchase or redeem its securities in certain situations;
•approve in advance senior executive officer or director changes and prohibit (under certain circumstances) golden parachute payments to officers and employees, including change in control agreements and new employment agreements, that are contingent upon termination; and
•approvethe markets in advance acquisitions ofwhich firms operate and mergers with bank holding companies, banks and other financial companies, and consider certain competitive, management, financial, financial stability and other factorsrisks to consumers posed by activities in granting these approvals. DFPI approval may also be required for certain acquisitions and mergers involving a California-chartered bank such as the Bank.those markets.
East West’s electionThe statutes and regulations that the CFPB enforces mandate certain disclosure and other requirements, and regulate the manner in which financial institutions must deal with consumers when taking deposits, making loans, collecting payments on loans, and providing other services. The CFPB’s rulemaking, examination and enforcement authority has affected and will continue to beimpact financial institutions that provide consumer financial products and services, including the Company and the Bank. These regulatory activities may limit the types of financial services and products the Company may offer. Failure to comply with federal and state laws prohibiting unfair, abusive, or fraudulent business practices, untrue or misleading advertising and unfair competition, can subject the Bank to various penalties, including, but not limited to, enforcement actions, injunctions, fines or criminal penalties, punitive damages, restitution to consumers, and the loss of certain contractual rights or business opportunities and may also result in significant reputational harm.
Federal Home Loan Bank and the Federal Reserve’s Reserve Requirements
The Bank is a financial holding company as permitted undermember of the Gramm-Leach-Bliley ActFederal Home Loan Bank (“FHLB”) of 1999 (“GLBA”), generally allows East WestSan Francisco. As an FHLB member, the Bank is required to engageown a certain amount of capital stock in any activity thatthe FHLB. The Bank may also access the FHLB for both short- and long-term secured credit.
The Federal Reserve requires all depository institutions to maintain reserves at specified levels against their transaction accounts either in the form of vault cash or an interest-bearing account at the Federal Reserve has determined to be financial in natureBank, or incidental or complementary to activities that are financial in nature, or acquire and retaina pass-through account as defined by the shares of a company engaged in any such activity, without prior Federal Reserve approval. Activities that are considered to be financial in nature include securities underwriting and dealing, insurance agency and underwriting, merchant banking activities and activities thatReserve. Effective March 26, 2020, the Federal Reserve reduced reserve requirement ratios to zero percent, eliminating the reserve requirement for all depository institutions, an action that provides liquidity in consultation with the U.S. Secretarybanking system to support lending to households and businesses. The Bank is a member bank and stockholder of the Treasury, determines to be financial in nature or incidental to such financial activity. To maintain financial holding company status and continue to be able to engage in new activities or investments that are financial in nature, a financial holding company and allFederal Reserve Bank of its depository institution subsidiaries must be “well capitalized” and “well managed”, and the financial holding company’s depository institution subsidiaries must have Community Reinvestment ActSan Francisco (“CRA”FRBSF”) records of at least “satisfactory.” A depository institution subsidiary is considered to be “well capitalized” if it satisfies the requirements for this status discussed in the sections captioned “Capital Requirements”and“Prompt Corrective Action,” included elsewhere under this item. A depository institution subsidiary is considered “well managed” if it received a composite rating and a management rating of at least “satisfactory” in its most recent examination. See the section captioned “Community Reinvestment Act” included elsewhere under this item. As of December 31, 2020, East West is a financial holding company and has financial subsidiaries, as discussed in Item 1. Business — Organization.
Dividends and Other Transfers of Funds
The principal source of liquidity of East West is dividends received from the Bank. The Bank is subject to various statutory and regulatory restrictions on its ability to pay dividends. In addition, the banking agencies may prohibit or limit the Bank from paying dividends, depending upon the Bank’s financial condition, if such payment is deemed to constitute an unsafe or unsound practice. Furthermore, under the federal PCA regime, the Federal Reserve or FDIC may prohibit a bank holding company from paying any dividends if the holding company’s bank subsidiary is classified as “significantly undercapitalized” or, in some circumstances, “undercapitalized.” It is the Federal Reserve’s policy that a bank holding company should generally pay dividends on common stock only if the company’s net income available to common stockholders over the past four quarters, net of distributions, would be sufficient to fully fund the dividends, and if the prospective rate of earnings retention appears consistent with the company’s capital needs, asset quality and overall financial condition. It is also the Federal Reserve’s policy that a bank holding company should not maintain dividend levels that undermine the company’s ability to be a financial source of strength to its banking subsidiaries. The Federal Reserve requires bank holding companies to continuously review their dividend policy in light of their organizations’ financial condition and in compliance with regulatory capital requirements, and has discouraged payment ratios that are at maximum allowable levels, unless both asset quality and capital are strong.
Transactions with Affiliates and Insiders
Pursuant to Sections 23A and 23B of the Federal Reserve Act, as implemented by the Federal Reserve’s Regulation W, banks are subject to restrictions that limit their ability to engage in transactions with their affiliates, including their parent bank holding companies. Regulation W limits the types, terms and amounts of these transactions and generally requires the transactions to be on an arm’s-length basis. In general, Regulation W requires that “covered transactions,” which include a bank’s extension of credit to or purchase of assets from an affiliate, be limited to 10% of the bank’s capital and surplus with respect to any one affiliate, and 20% of the bank’s capital and surplus with respect to the aggregate of all covered transactions with all affiliates. In addition, a bank generally may not extend credit to an affiliate unless the extension of credit is secured by specified amounts of collateral. The Dodd-Frank Act expanded the coverage and scope of the limitations on affiliate transactions, including by treating derivative transactions resulting in a bank’s credit exposure to an affiliate as covered transactions. In addition, the Volcker Rule under the Dodd-Frank Act establishes certain prohibitions, restrictions and requirements (known as “Super 23A” and “Super 23B”) on transactions between a covered fund and a banking entity that serves as an investment manager, investment adviser, organizer and offeror, or sponsor with respect to that covered fund, regardless of whether the banking entity has an ownership interest in the fund.
Federal law also limits a bank’s authority to extend credit to its directors, executive officers and principal stockholders, as well as to entities controlled by such persons (collectively, “insiders”). Among other things, extensions of credit to insiders are required to be made on terms that are substantially the same as, and follow credit underwriting procedures that are not less stringent than, those prevailing for comparable transactions with unaffiliated persons. The terms of such extensions of credit may not involve more than the normal risk of repayment or present other unfavorable features and may not exceed certain limitations on the amount of credit extended to such persons, individually and in the aggregate, which limits are based, in part, on the amount of the bank’s capital.
Community Reinvestment Act
Under the CRA, an IDI has a continuing and affirmative obligation to help serve the credit needs of its communities, including low- and moderate-income borrowers and neighborhoods. The Federal Reserve periodically evaluates a state member bank’s performance under applicable performance criteria and assign a rating of “outstanding,” “satisfactory,” “needs to improve” or “substantial noncompliance.” The Federal Reserve takes this performance into account when reviewing applications by banks and their parent companies to expand branches, relocate, add subsidiaries and affiliates, expand into new financial activities and merge with or acquire other financial institutions. Unsatisfactory CRA performance may result in the denial of such applications. Based on the most recent CRA examination as of March 8, 2021, the Bank was rated “outstanding”.
On October 24, 2023, the federal banking agencies issued a final rule revising their framework for evaluating banks’ records of community reinvestment under the CRA. Under the revised framework, banks with assets of at least $2 billion, such as the Bank, are considered large banks and their retail lending, retail services and products, community development financing, and community development services will be subject to periodic evaluation. Depending on a large bank’s geographic distribution of lending, the evaluation of retail lending may include assessment areas in which the bank extends loans but does not operate any deposit-taking facilities, in addition to assessment areas in which the bank has deposit taking facilities. The rule becomes effective April 1, 2024. Compliance with most provisions of the final rule will be required beginning January 1, 2026, and compliance with the remaining provisions will be required beginning January 1, 2027. The Company is evaluating the impact of the final rule.
FDIC Deposit Insurance Assessments
The FDIC insures the Bank’s customer deposits through the DIF up to $250,000 for each depositor, per FDIC-insured bank, for each account ownership category. The DIF is funded mainly through quarterly insurance assessments on insured banks based on their assessment base. The Dodd-Frank Act revised the FDIC’s fund management authority by establishing a minimum Designated Reserve Ratio of 1.35 percent of total estimated insured deposits and redefining the assessment base to be calculated as average consolidated total assets minus average tangible equity. The Bank’s DIF quarterly assessment is calculated by multiplying its assessment base by the applicable assessment rate. The assessment rate is calculated based on an institution’s risk profile, including capital adequacy, asset quality, management, earnings, liquidity and sensitivity to market risk ratings, certain financial measures to assess an institution’s ability to withstand asset related stress and funding related stress, and a measure of loss severity that estimates the relative magnitude of potential losses to the FDIC in the event of the Bank’s failure.
In October 2022, the FDIC adopted a final rule, applicable to all IDIs, to increase the initial base deposit insurance assessment rate schedules uniformly by two basis points (“bps”) to increase the likelihood that the DIF reserve ratio reaches the statutory minimum of 1.35 percent by the statutory deadline of September 30, 2028. The increase in rates took effect in the first quarterly assessment period of 2023.
In November 2023, the FDIC approved a final rule to implement a special deposit insurance assessment to recover losses to the DIF arising from the protection of uninsured depositors following the receiverships of failed institutions in the spring of 2023. Under the final rule, the assessment base for the special assessment is equal to an IDI’s estimated uninsured deposits, reported for the quarter ended December 31, 2022, minus the first $5 billion in estimated uninsured deposits. The FDIC will collect the special assessment over eight quarterly assessment periods starting with the first quarter of 2024, at a quarterly rate of 3.36 bps. The Company recognized the entire assessment expense of approximately $70 million in the fourth quarter of 2023. Depending on future adjustments to the DIF’s estimated loss, the FDIC has retained the ability to cease collection early, extend the special assessment collection period, or impose a one-time final shortfall assessment.
The FDIC may terminate a depository institution’s deposit insurance upon a finding that the institution’s financial condition is unsafe or unsound, that the institution has engaged in unsafe or unsound practices, or that the institution has violated any applicable rule, regulation, condition, or order imposed by the FDIC.
Bank Secrecy Act and Anti-Money Laundering
The Bank Secrecy Act (“BSA”), Uniting and Strengthening America by Providing Appropriate Tools Required to Intercept and Obstruct Terrorism (USA PATRIOT) Act of 2001 (“PATRIOT Act”), the Anti-Money Laundering Act of 2020 and other federal laws and regulations impose obligations on U.S. financial institutions to implement and maintain a program reasonably designed to prevent, detect and report money laundering and the financing of terrorism, verify the identity of their customers, and comply with recordkeeping and other requirements. Regulatory agencies require that the Bank have an effective governance structure for the program that includes effective oversight by our Board of Directors and management. We regularly evaluate and continue to enhance our program to comply with the BSA, the PATRIOT Act and other anti-money laundering (“AML”) laws, regulations and initiatives. Failure of a financial institution to maintain and implement adequate BSA/AML programs, or to comply with all applicable laws or regulations, could have serious legal, compliance, operational, financial and reputational consequences for the institution.
Office of Foreign Assets Control Regulation
The U.S. Department of the Treasury’s Office of Foreign Assets Control (“OFAC”) is responsible for helping to ensure that U.S. financial institutions do not engage in transactions with certain prohibited parties, as defined by various executive orders and Acts of Congress. Federal banking regulators also examine banks for compliance with regulations administered by the OFAC for economic sanctions against designated foreign countries, designated nationals, and others. OFAC publishes lists of persons and organizations suspected of aiding, harboring or engaging in terrorist acts, known as Specially Designated Nationals and Blocked Persons. Generally, if a bank identifies a transaction or account relating to a person or entity on an OFAC list, it must freeze the account or block the transaction, file a suspicious activity report and notify the appropriate authorities. Failure to comply with these sanctions could have serious legal, compliance, operational, financial, and reputational consequences, and result in civil monetary penalties on the Company and the Bank.
Privacy and Cybersecurity
Federal statutes and regulations, including the GLBA, require banking organizations to take certain actions to protect nonpublic consumer financial information. The Bank has a privacy policy that it must disclose to consumers annually. In some cases, the Bank must obtain a consumer’s consent before sharing information with an unaffiliated third party, and the Bank must allow a consumer to opt out of the Bank’s sharing of information with its affiliates for marketing and certain other purposes. These additional conditions affect the Bank’s information exchanges with credit reporting agencies. The Bank’s privacy practices and the effectiveness of its systems to protect consumer privacy are subjects covered in the Federal Reserve’s periodic compliance examinations.
The Federal Reserve and state regulators, as well as the SEC, CFPB and other self-regulatory organizations, regularly issue guidance on cybersecurity practices and procedures that is intended to enhance cybersecurity risk management among financial institutions and their holding companies and affiliates. For example, the interagency council of the federal banking agencies, the Federal Financial Institutions Examination Council (“FFIEC”), has issued several policy statements and other guidance for banks in light of the growing risk posed by cybersecurity threats. The FFIEC has recently focused on such matters as compromised customer credentials, cyber resilience and business continuity planning. Examinations by the banking agencies now include review of an institution’s information technology and its ability to thwart or mitigate cyber-attacks. Thefederal banking agencies require banking organizations to notify their primary federal regulator of significant computer security incidents within 36 hours of determining that such an incident has occurred. Effective December 2023, the SEC also has imposed Form 8-K disclosure obligations for a material cybersecurity incident, among other cybersecurity related disclosure obligations.
Consumer data privacy and data protection are also the subject of state laws. For example, the Bank is subject to the California Consumer Privacy Act (“CCPA”). This statute grants consumers several rights, including the right to request disclosure of information collected about them and whether that information has been sold or shared with others, the right to request correction of information, the right to request deletion of personal information (subject to certain exceptions), and the right to opt out of the sale of their personal information. However, a consumer does not have these rights with respect to information that is collected, processed, sold, or disclosed pursuant to the GLBA or the California Financial Information Privacy Act. The CCPA was amended by the California Privacy Rights Act. A new agency, the California Privacy Protection Agency, was established to enforce California privacy law.
The privacy and data protection regime in China is in a period of change and there has been significant activity in the field of privacy and cybersecurity legislation in recent years. The Personal Information Protection Law (“PIPL”), the Cybersecurity Law and the Data Security Law form a regulatory framework for privacy and data protection in China. The PIPL establishes guiding principles on the protection of a Chinese citizen’s personal information and applies to entities operating in China, foreign organizations, and individuals processing personal information outside China. The Cybersecurity Law focuses on cybersecurity concerns and requires network operators to implement measures to safeguard the security of networks and systems. The Data Security Law complements the PIPL and Cybersecurity Law by addressing broader data security issues, emphasizing the protection of critical data infrastructure and promoting a risk-based approach to data security. New supporting guidelines and standards are expected as China's cybersecurity, data security, and personal information protection framework continues to evolve. All these changes have potential impact on the business and operations of our Bank and its subsidiary, East West Bank (China) Limited.
Climate-Related Risk Management
In recent years, the federal banking agencies have increased their focus on climate-related risks affecting the operations of banks, the communities they serve and the broader financial system. The agencies have begun to enhance their supervisory expectations regarding banks’ climate risk management practices, including by proposing guidance that would encourage banking organizations to, among other things: evaluate the potential impact of climate-related risks on the bank’s financial condition, operations and business objectives as part of its strategic planning process; account for the effects of climate change in stress testing scenarios and systemic risk assessments; revise expectations for credit portfolio concentrations based on climate-related factors; and prepare for the transition risks to the bank associated with the adjustment to a low-carbon economy and related changes in laws, regulations, governmental policies, technology, and consumer behavior and expectations.
In October 2023, the federal banking agencies released interagency guidance, “Principles for Climate-Related Financial Risk Management for Large Financial Institutions” (the “Principles”), which are intended to encourage banking organizations with $100 billion or more in assets to focus on key aspects of climate-related financial risk management. The Principles cover six areas: governance; policies, procedures, and limits; strategic planning; risk management; data, risk measurement, and reporting; and scenario analysis. The Principles also describe how large banking organizations should manage climate-related financial risks that can arise in risk categories such as credit, liquidity, and other financial risk, and operational, legal and compliance, and other nonfinancial risk. While the agencies’ efforts to-date, including the Principles, have focused on banking organizations with $100 billion or more in total assets, their supervisory expectations on climate risk management practices ultimately may apply to smaller banking organizations such as the Bank.
In addition, states such as California, are taking similar actions on climate-related financial risks. In October 2023, California Governor Gavin Newsom signed into law Senate Bill 253, the Climate Corporate Data Accountability Act (“CCDAA”) and Senate Bill 261, the Climate-Related Financial Risk Act (“CRFRA”). The CCDAA is applicable to U.S.-organized entities that do business in California with annual revenue in excess of $1 billion. Subject to the adoption of implementing regulations by the California Air Resources Board, these entities will need to file annual reports publicly disclosing their direct greenhouse gas (“GHG”) emissions from operations (“Scope 1 emissions”), indirect GHG emissions from energy use (“Scope 2 emissions”) and indirect upstream and downstream supply-chain GHG emissions (“Scope 3 emissions”). The reporting requirements related to Scope 1 and 2 emissions will begin in 2026, while the reporting requirements of Scope 3 emissions will begin in 2027. The CRFRA requires U.S.-organized entities that do business in California, with annual revenues over $500 million to prepare biennial reports disclosing climate-related financial risk and the measures they have adopted to reduce and adapt to that risk. The initial round of the climate risk disclosure reports will be due by January 1, 2026. The Company is a reporting entity under both laws and may incur compliance, maintenance and remediation costs to conform to such requirements.
Potential Regulatory Reforms
On August 29, 2023, the FDIC released a proposed rule that would require covered IDIs to develop and submit detailed plans demonstrating how they could be resolved in an orderly and timely manner in the event of receivership. IDIs with total assets of $100 billion or more would be required to submit full resolution plans, and IDIs with total assets between $50 billion and $100 billion, including the Bank, would be required to submit more limited informational filings. Under the proposal, if the FDIC deemed a resolution plan or informational filing not credible and the IDI failed to resubmit a credible plan, the IDI could become subject to an enforcement action.The Company is evaluating the impact of this proposal.
The federal banking agencies also jointly released a proposed rule on August 29, 2023 that would require bank holding companies and non-consolidated banks with total assets of $100 billion or more to issue and maintain minimum amounts of long-term debt. The Company has total consolidated assets of less than $100 billion and would not be subject to the long-term debt requirements if they are finalized as proposed. However, by imposing additional costs on bank holding companies with $100 billion or more in total consolidated assets, this rule proposal could reduce the benefits of growth beyond that size for a bank holding company that has less than $100 billion in total consolidated assets, such as the Company.
Future Legislation, Regulation and Supervision Activities
New statutes, regulations and policies that contain wide-ranging proposals for altering the structures, regulations and competitive relationships of financial institutions and public companies operating in the U.S. are regularly adopted. Such changes to applicable statutes, regulations, and policies may change the Company’s operating environment in substantial and unpredictable ways, increase the Company’s cost of conducting business, impede the efficiency of internal business processes, subject the Company to increased supervision activities and disclosure and reporting requirements, and restrict or expand the activities in which the Company may engage. Accordingly, such changes may have a significant influence on our operations and activities, financial condition, results of operations, growth plans or future prospects, and the overall growth and distribution of loans, investments and deposits. We cannot predict whether or in what form any statute, regulation or policy will be proposed or adopted or the extent to which our business may be affected by any new statute, regulation or policy.
The Bank and its Subsidiaries
East West Bank is a California state-chartered bank and a member of the Federal Reserve System, and its deposits are insured by the FDIC. The Bank’s operations in the U.S. are primarily regulated and supervised by the Federal Reserve and the DFPI, and its activities outside the U.S. are regulated and supervised by both its U.S. regulators and the applicable regulatory authority in the host country in which each overseas office is located. Specific federal and state laws and regulations that are applicable to banks regulate,monitor, among other things, their regulatory capital levels, the scope of their business, their investments, their reserves against deposits, the timing of the availability of deposited funds, and the nature and amount of collateral for certain loans. Bank regulatory agencies also have extensive discretion to impose various restrictions on management or operations and to issue policies and guidance in connection with their supervisory and enforcement activities and examination policies. California law permits state-chartered commercial banks to engage in any activity permissible for national banks, unless such activity is expressly prohibited by state law. The Bank may also form subsidiaries to engage in the many activities commonly conducted by national banks in operating subsidiaries. Further, pursuant to the GLBA, the Bank may conduct certain “financial” activities in a subsidiary to the same extent permitted for a national bank, provided the Bank is “well capitalized” and “well managed” and has a CRA rating of at least “satisfactory.“Satisfactory.”
Regulation of Foreign Subsidiaries and Branches
The Bank’s foreign-basedforeign subsidiary, East West Bank (China) Limited, is subject to applicable foreign laws and regulations, such as those implemented by the China BankingPBOC and Insurance Regulatory Commission.the NAFR. East West Bank’s Hong Kong branch is subject to applicable foreign laws and regulations, such as those implemented by the Hong Kong Monetary AuthorityHKMA and the SecuritiesHKSFC. The Bank’s Singapore representative office is subject to applicable foreign laws and Futures Commission of Hong Kong.regulations, such as those implemented by the MAS.
Regulatory Capital Requirements
The federal banking agencies have imposed risk-based capital adequacy requirements, known as the Basel III Capital Rules, intended to ensure that banking organizations maintain capital that is commensurate with the degree of risk associated with their operations. In July 2013, the federal banking agencies adopted final rules (the “Basel III Capital Rules”) establishing a comprehensive capital framework for U.S. banking organizations that became effective for the Company and the Bank beginning January 1, 2015. The Basel III Capital Rules define the components of regulatory capital, include a required ratio ofincluding Common Equity Tier 1 (“CET1”), Tier 1 and 2 capital, and set forth minimum capital adequacy ratios of capital to risk-weighted assets and restrict the type of instruments that may be recognized in Tier 1 and 2 capital (including by phasing out trust preferred securities from Tier 1 capital for bank holding companies).total assets. The Basel III Capital Rules also prescribe a standardized approach for risk weightingrisk-weighting assets and include a number of risk weightingrisk-weighting categories that affect the denominator in banking institutions’ regulatory capital ratios.
Under the Basel III Capital Rules, to be considered adequately capitalized, standardized approach banking organizations, such as the Company and the Bank are required to maintain minimum capital ratios of at least 4.5% CET1 capital to risk-weighted assets, 6.0% Tier 1 capital to risk-weighted assets, 8.0% total risk-based capital (Tier(i.e., Tier 1 plus Tier 2)2 capital) to risk-weighted assets and a 4.0% Tier 1 leverage ratio of Tier 1 capital to average total consolidated assets. The Basel III Capital Rules also include a “capital conservation buffer” of 2.5% that fully phased in on January 1, 2019, on top of each of the minimum risk-based capital ratios. Banking institutions with a risk-based capital ratio that meets or exceeds the minimum requirement but does not meetexceed the capital conservation buffer will face constraints on dividends, equity repurchases and discretionary bonus payments based on the amount of the shortfall. To avoid these constraints, a banking organization must meet or exceed the following risk-based capital ratios (after any distribution): (i) CET1 capital to risk-weighted assets of 7.0%, (ii) Tier 1 capital to risk-weighted assets of 8.5%, and (iii) total risk-based capital to risk-weighted assets of 10.5%.
As of December 31, 2020,2023, the Company’s and the Bank’s capital ratios exceeded the minimum capital adequacy requirements of the federal banking agencies, including the capital conservation buffer, and the Company and the Bank were classified as “well capitalized.” For additional discussion and disclosure see Item 7. MD&A — Regulatory Capital and Ratios and Note 1716 — Regulatory Requirements and Matters to the Consolidated Financial Statements in this Form 10-K.
The Bank is also subject to additional capital requirements under the Prompt Corrective Action (“PCA”) regulations that implement Section 38 of the Federal Deposit Insurance Act (“FDIA”), as discussed below under the Prompt Corrective Action section.
Recent Regulatory Capital-Related Developments
From time to time, the regulatory agencies propose changes and amendments to, and issue interpretations of, risk-based capital requirements and related reporting instructions. Such proposals and interpretations could, if implemented in the future, affect our regulatory capital requirements and reported capital ratios.
Pursuant to the five-year transition rule approved by the U.S. federal banking agencies issued a final rule (the “Capital Simplifications Rule”) to reduce regulatory compliance burden by simplifying certain risk-based and leverage capital requirementsin March 2020, the effects of the Basel III Capital Rules for non-advanced approaches banking organizations (i.e., banking organizations with less than $250 billion in total consolidated assets and with less than $10 billion of on-balance sheet foreign exposures), including the Company and the Bank. The Capital Simplifications Rule became effective for the Company and the Bank on April 1, 2020. Application of the Capital Simplifications Rule to our consolidated balance sheet did not have a significant impact on the capital ratios of the Company and the Bank.
In light of the recent disruptions in economic conditions caused by COVID-19 pandemic, the federal banking agencies have also revised the definition of eligible retained income to be the greater of (1) a banking organization’s net income for the four preceding calendar quarters, net of any distributions and associated tax effects not already reflected in net income, and (2) the average of a banking organization’s net income over the preceding four quarters. This revision reduces the likelihood that a banking organization is suddenly subject to abrupt and restrictive distribution limitations in a scenario where its capital ratios fall below an applicable minimum risk-based capital ratio requirement plus capital conservation buffer, and instead makes the application of these limitations more gradual. The revision became effective on March 20, 2020.
In April 2020, in recognition of the CARES Act requirements and to facilitate the use of the Paycheck Protection Program Liquidity Facility (“PPPLF”), the U.S. banking agencies issued an interim final rule that allows banking organizations to exclude from risk-based and leverage capital requirements any eligible assets sold or pledged to the Federal Reserve on a non-recourse basis through the PPPLF. The interim final rule states that PPP loans originated by a banking organization under the PPP will be risk-weighted at zero percent for regulatory capital purposes and PPP loans pledged as collateral to PPPLF may be excluded from the denominator of the Tier 1 leverage ratio. In addition, the CARES Act, the banking agencies’ “Interagency Statement on Loan Modifications and Reporting for Financial Institutions Working with Customer Affected by the Coronavirus (Revised)” (the “Interagency Statement”) issued on March 22, 2020 and April 7, 2020, and the Consolidated Appropriations Act, 2021 (the “CAA”), enacted December 27, 2020, provided options for financial institutions to elect to temporarily suspend troubled debt restructurings (“TDR”) accounting under Accounting Standards Codification (“ASC”) Subtopic 310-40. For additional information, see Note 1 — Summary of Significant Accounting Policies, Troubled Debt Restructurings, to the Consolidated Financial Statements in this Form 10-K. The election to apply the TDR relief under these regulatory guidance provided banking organizations such as the Bank a capital benefit by increasing its regulatory capital ratios as the loan modifications related to the COVID-19 pandemic are not adjusted to a higher risk weighting normally associated with a TDR classification.
In December 2018, the regulatory agencies approved a final rule to address changes to credit loss accounting, including with respect to banking organizations’ implementation of the Accounting Standards Update (“ASU”) 2016-13 Financial Instruments — Credit Losses (Topic 326) Measurement of Credit Losses on Financial Instruments, which introduced the current expected credit lossesloss accounting standard (“CECL”) methodology. The final rule among other things provides banking organizations with the option to phase in over a three-year period the day-one adverse effects on regulatory capital upon the adoption of ASU 2016-13. On March 31, 2020, the federal banking agencies issued an interim final rule that provided banking organizations that adopted CECL during 2020, the option to delay for two years the estimated impact of CECL on regulatory capital, followed by a three-year transition period to phase out the aggregate amount of the capital benefit provided during the initial two-year delay (i.e., a five-year transition, in total). The Company adopted the five-year transition in 2020. As a result, the effects of CECL on the Company’s and the Bank’s regulatory capital will bewere delayed through the year 2021, after which the effects will beare being phased-in over a three-year period from January 1, 2022 through December 31, 2024. For additional discussion and disclosure on CECL, see Item 7. MD&A — Regulatory Capital and Ratios and Note 16 — Regulatory Requirements and Matters to the Consolidated Financial Statements in this Form 10-K.
On July 27, 2023, the federal banking agencies jointly released a proposed rule to implement the international capital standards issued by the Basel Committee on Banking Supervision and known as “Basel III Endgame.” The Basel III Endgame proposal would revise the capital framework applicable to large banking organizations with $100 billion or more in total consolidated assets or with significant trading activity and, if finalized, would likely result in meaningfully increased capital requirements for those organizations. The Company has total consolidated assets of less than $100 billion and does not have significant trading activity, and therefore would not be subject to the Basel III Endgame requirements if they are finalized as proposed. However, by imposing additional costs on banking organizations with $100 billion or more in total consolidated assets, this rule proposal could reduce the benefits of growth beyond that size for a banking organization that has less than $100 billion in total consolidated assets, such as the Company.
Prompt Corrective Action
The FDIA, as amended, requires federal banking agencies to take PCA with respect to insured depository institutions (“IDIs”) that do not meet minimum capital requirements. The FDIA includes the following five capital tiers: “well capitalized,” “adequately capitalized,” “undercapitalized,” “significantly undercapitalized” and “critically undercapitalized.” A depository institution’s capital tier will depend upon how its capital levels compare with various relevant capital measures and certain other factors, as established by regulation.regulations. The capital tiers in the PCA framework do not apply directly to bank holding companies (such as the Company). Under the federal banking agencies’ regulations implementing the PCA provisions of the FDIA, an insured depository institutionIDI (such as the Bank) generally is classified in the following categories based on the capital measures indicated:
| | | | | | | | | | | | | | | | | | | | | | | | | | |
|
| | Risk-Based Capital Ratios | | |
| PCA Category | | Risk-Based Capital Ratios | | |
| Total Capital | | Tier 1 Capital | | CET1 Capital | | Tier 1 Leverage |
Well capitalized (1) | | ≥ 10% | | ≥ 8% | | ≥ 6.5% | | ≥ 5% |
| Adequately capitalized | | ≥ 8% | | ≥ 6% | | ≥ 4.5% | | ≥ 4% |
| Undercapitalized | | < 8% | | < 6% | | < 4.5% | | < 4% |
| Significantly undercapitalized | | < 6% | | < 4% | | < 3.0% | | < 3% |
| Critically undercapitalized | | Tangible Equity/equity/Total Assetsassets ≤ 2% |
|
(1)Additionally, to be classified as well capitalized,“well capitalized”, an insured depository institutionIDI may not be subject to any written agreement, order, capital directive, or PCA directive issued by its primary federal regulator to meet and maintain a specific capital level for any capital measure.
An institution may be downgraded to, or deemed to be in, a capital category that is lower than indicated by its capital ratios, if it is determined to be in an unsafe or unsound condition or if it receives an unsatisfactory examination rating with respect to certain matters. A bank’s capital category is determined solely for the purpose of applying PCA regulations and the capital category may not constitute an accurate representation of the bank’s overall financial condition or prospects for other purposes.
The FDIA generally prohibits a depository institution from making any capital distributions (including payment of any dividend) or paying any management fee to its parent holding company, if the depository institution would thereafter be “undercapitalized.” Undercapitalized institutions are subject to growth limitations and are required to submit capital restoration plans. If a depository institution fails to submit an acceptable plan, it is treated as if it is “significantly undercapitalized.” Significantly undercapitalized depository institutions may be subject to a number ofseveral requirements and restrictions, including orders to sell sufficient voting stock to become “adequately capitalized,” requirements to reduce total assets, cessation of receipt of deposits from correspondent banks and/or restrictions on interest rates paid on deposits. “Critically undercapitalized” institutions are subject to the appointment of a receiver or conservator. The FDIA also generally permits only “well capitalized” insured depository institutionsIDIs to accept brokered deposits, howeveralthough an “adequately capitalized” institution may apply to the FDIC for a waiver of this restriction.
Economic Growth, Regulatory Relief, and Consumer Protection Act and Stress Testing
In May 2018, the enactment of the Economic Growth, Regulatory Relief, and Consumer Protection Act (“EGRRCPA”) amended certain provisions in the Dodd-Frank Act and other statutes administered by the Federal Reserve. AmongstReserve and other things, the EGRRCPA provided regulatory relief, including from risk committee requirements, for bank holding companies and state member banks with total consolidated assets between $10 billion and $50 billion. We were among the bank holding companies and banks in this range until we exceeded $50 billion in total consolidated assets as of September 30, 2020.
federal banking agencies. The EGRRCPA also lifted the asset size threshold for many of the Dodd-Frank Act enhanced prudential standards that had previously applied to banks and provided relief for banksbank holding companies with total consolidated assets between $50 billion and $100 billion, with respect to many of the Dodd-Frank Act’s enhanced prudential standards, except for the requirement to maintain a risk committee requirements.committee. The EGRRCPA also raised the asset size threshold for required company-run stress testing at banks and bank holding companies from $10 billion to $250 billion. Additionally, based on authority provided in the EGRRCPA, the Federal Reserve raised the asset size threshold for required supervisory stress testing at bank holding companies from $50 billion to $100 billion. Although the Company and the Bank are not required to conduct company-run or supervisory stress tests, we continue to conduct annual capital and quarterly liquidity stress tests.
Consumer Financial Protection Bureau Supervision
The Dodd-Frank Act established the CFPB, which has the authority to implement, examine and enforce compliance with federal consumer financial laws that apply to banking institutions and certain other companies. The CFPB has exclusive authority to examine insured depository institutions with total consolidated assets exceeding $10 billion (such as the Bank) and their affiliates with respect to these consumer financial laws, and may also take enforcement action.affiliates. The CFPB may focusfocuses its supervisory, examination, and enforcement efforts on, among other things:
•risks to consumers and compliance with federal consumer financial laws when evaluating the policies and practices of a financial institution;
•unfair, deceptive, or abusive acts or practices, which the Dodd-Frank Act empowers the CFPB to prevent through rulemaking, enforcement and examination;practices;
•rulemaking to implement various federal consumer statutes such as the Home Mortgage Disclosure Act, Truth in Lending Act, Real Estate Settlement Procedures Act, Electronic Fund Transfer Act, Equal Credit Opportunity Act, and Fair Credit Billing Act, and the Consumer Financial Protection Act; and
•the markets in which firms operate and risks to consumers posed by activities in those markets.
The statutes and regulations that the CFPB enforces mandate certain disclosure and other requirements, and regulate the manner in which financial institutions must deal with consumers when taking deposits, making loans, collecting payments on loans, and providing other services. The CFPB’s rulemaking, examination and enforcement authority has affected and will continue to impact financial institutions that provide consumer financial products and services, including the Company and the Bank. These regulatory activities may limit the types of financial services and products the Company may offer. Failure to comply with thesefederal and state laws prohibiting unfair, abusive, or fraudulent business practices, untrue or misleading advertising and unfair competition, can subject the Bank to various penalties, including, but not limited to, enforcement actions, injunctions, fines or criminal penalties, punitive damages, or restitution to consumers, and the loss of certain contractual rights. The Companyrights or business opportunities and the Bank aremay also subject to federal and state laws prohibiting unfair or fraudulent business practices, untrue or misleading advertising and unfair competition.result in significant reputational harm.
Federal Home Loan Bank and the Federal Reserve’s Reserve Requirements
The Bank is a member of the Federal Home Loan Bank (“FHLB”) of San Francisco. As aan FHLB member, the Bank is required to own a certain amount of capital stock in the FHLB. The Bank may also access the FHLB for both short-termshort- and long-term secured credit.
The Federal Reserve requires all depository institutions to maintain reserves at specified levels against their transaction accounts either in the form of vault cash or an interest-bearing account at the Federal Reserve Bank, or a pass-through account as defined by the Federal Reserve. OnEffective March 26, 2020, in response to the COVID-19 pandemic, the Federal Reserve reduced reserve requirement ratios to zero percent, eliminating the reserve requirement for all depositdepository institutions, an action that provides liquidity in the banking system to support lending to households and businesses. The Bank is also a member bank and stockholder of the Federal Reserve Bank of San Francisco (“FRBSF”).
Dividends and Other Transfers of Funds
The principal source of liquidity of East West is dividends received from the Bank. The Bank is subject to various statutory and regulatory restrictions on its ability to pay dividends. In addition, the banking agencies have an authority tomay prohibit or limit the Bank from paying dividends, depending upon the Bank’s financial condition, if such payment is deemed to constitute an unsafe or unsound practice. Furthermore, under the federal PCA regime, the Federal Reserve or FDIC may prohibit a bank holding company from paying any dividends if the holding company’s bank subsidiary is classified as “significantly undercapitalized” or, in some circumstances, “undercapitalized.” It is the Federal Reserve’s policy that a bank holding company should generally pay dividends on common stock only if the company’s net income available to common stockholders over the past four quarters, net of distributions, would be sufficient to fully fund the dividends, and if the prospective rate of earnings retention appears consistent with the company’s capital needs, asset quality and overall financial condition. It is also the Federal Reserve’s policy that a bank holding company should not maintain dividend levels that undermine the company’s ability to be a financial source of strength to its banking subsidiaries. The Federal Reserve requires bank holding companies to continuously review their dividend policy in light of their organizations’ financial condition and in compliance with regulatory capital requirements, and has discouraged payment ratios that are at maximum allowable levels, unless both asset quality and capital are very strong.
Transactions with Affiliates and Insiders
Pursuant to Sections 23A and 23B of the Federal Reserve Act, as implemented by the Federal Reserve’s Regulation W, banks are subject to restrictions that strictly limit their ability to engage in transactions with their affiliates, including their parent bank holding companies. Regulations promulgated by the Federal Reserve limitRegulation W limits the types, terms and amounts of these transactions and generally requirerequires the transactions to be on an arm’s-length basis. In general, these regulations requireRegulation W requires that “covered transactions,” which include a bank’s extensionsextension of credit to or purchase of assets from an affiliate, be limited to 10% of the bank’s capital and surplus with respect to any one affiliate, and 20% of the bank’s capital and surplus with respect to the aggregate of all covered transactions with all affiliates. In addition, a bank generally may not extend credit to an affiliate unless the extension of credit is secured by specified amounts of collateral. The Dodd-Frank Act expanded the coverage and scope of the limitations on affiliate transactions, including by treating derivative transactions resulting in a bank’s credit exposure to an affiliate as covered transactions. In addition, the Volcker Rule under the Dodd-Frank Act establishes certain prohibitions, restrictions and requirements (known as “Super 23A” and “Super 23B”) on transactions between a covered fund and a banking entity that serves as an investment manager, investment adviser, organizer and offeror, or sponsor with respect to that covered fund, regardless of whether the banking entity has an ownership interest in the fund.
Federal law also limits a bank’s authority to extend credit to its directors, executive officers and 10% shareholders,principal stockholders, as well as to entities controlled by such persons.persons (collectively, “insiders”). Among other things, extensions of credit to insiders are required to be made on terms that are substantially the same as, and follow credit underwriting procedures that are not less stringent than, those prevailing for comparable transactions with unaffiliated persons. The terms of such extensions of credit may not involve more than the normal risk of repayment or present other unfavorable features and may not exceed certain limitations on the amount of credit extended to such persons, individually and in the aggregate, which limits are based, in part, on the amount of the bank’s capital.
Community Reinvestment Act
Under the CRA, an insured depository institutionIDI has a continuing and affirmative obligation to help serve the credit needs of its communities, including low- and moderate-income borrowers and neighborhoods. The Federal Reserve periodically evaluates a state member bank’s performance under applicable performance criteria and assign a rating of “outstanding,” “satisfactory,” “needs to improve” or “substantial noncompliance.” The Federal Reserve takes this performance into account when reviewing applications by banks and their parent companies to expand branches, relocate, add subsidiaries and affiliates, expand into new financial activities and merge with or acquire other financial institutions. Unsatisfactory CRA performance may result in the denial of such applications. Based on the most recent CRA examination as of March 8, 2021, the Bank was rated “outstanding”.
On September 21, 2020,October 24, 2023, the Federal Reservefederal banking agencies issued an Advance Noticea final rule revising their framework for evaluating banks’ records of Proposed Rulemaking that invitescommunity reinvestment under the publicCRA. Under the revised framework, banks with assets of at least $2 billion, such as the Bank, are considered large banks and their retail lending, retail services and products, community development financing, and community development services will be subject to commentperiodic evaluation. Depending on its proposala large bank’s geographic distribution of lending, the evaluation of retail lending may include assessment areas in which the bank extends loans but does not operate any deposit-taking facilities, in addition to modernize CRA regulations by strengthening, clarifying, and tailoring them to reflectassessment areas in which the current banking landscape and better meet the core purposebank has deposit taking facilities. The rule becomes effective April 1, 2024. Compliance with most provisions of the CRA.final rule will be required beginning January 1, 2026, and compliance with the remaining provisions will be required beginning January 1, 2027. The Company is evaluating the impact onof the Company from any changes in CRA regulations will depend on how they are implemented and applied.final rule.
FDIC Deposit Insurance Assessments
The FDIC insures the Bank’s customer deposits through the DIF up to $250,000 for each depositor, per FDIC-insured bank, for each account ownership category. The DIF is funded mainly through quarterly insurance assessments on insured banks based on their assessment base. The Dodd-Frank Act revised the FDIC’s fund management authority by establishing a minimum Designated Reserve Ratio of 1.35 percent of total estimated insured deposits and redefining the assessment base to be calculated as average consolidated total assets minus average tangible equity. The Bank’s DIF quarterly assessment is calculated by multiplying its assessment base by the applicable assessment rate. The assessment rate is calculated based on an institution’s risk profile, including capital adequacy, asset quality, management, earnings, liquidity and sensitivity to market risk ratings, certain financial measures to assess an institution’s ability to withstand asset related stress and funding related stress, and a measure of loss severity that estimates the relative magnitude of potential losses to the FDIC in the event of the Bank’s failure.
As of June 30, 2020,In October 2022, the FDIC adopted a final rule, applicable to all IDIs, to increase the initial base deposit insurance assessment rate schedules uniformly by two basis points (“bps”) to increase the likelihood that the DIF reserve ratio fell to 1.30 percent, belowreaches the statutory minimum of 1.35 percent.percent by the statutory deadline of September 30, 2028. The declineincrease in rates took effect in the ratio was due to extraordinary insured deposit growth, which was resulted mainly from the COVID-19 pandemic, specifically monetary policy action, direct government assistance to the consumers and businesses, and an overall reduction in spending. The FDIC projects that the DIF reserve ratio would return to 1.35 percent without further action by the FDIC and has continued to maintain existing schedulefirst quarterly assessment period of assessment rates.2023.
In June 2020,November 2023, the FDIC publishedapproved a final rule that mitigates theto implement a special deposit insurance assessment effectsto recover losses to the DIF arising from the protection of participatinguninsured depositors following the receiverships of failed institutions in the PPP, PPPLF and the Money Market Mutual Fund Liquidity Facility (“MMLF”).spring of 2023. Under the final rule, the assessment base for the special assessment is equal to an IDI’s estimated uninsured deposits, reported for the quarter ended December 31, 2022, minus the first $5 billion in estimated uninsured deposits. The FDIC providedwill collect the special assessment over eight quarterly assessment periods starting with the first quarter of 2024, at a quarterly rate of 3.36 bps. The Company recognized the entire assessment expense of approximately $70 million in the fourth quarter of 2023. Depending on future adjustments to the risk based premium formula and certain of its risk ratios, and an offsetDIF’s estimated loss, the FDIC has retained the ability to an insured institution’s totalcease collection early, extend the special assessment amount due for the increase to its assessment base attributable to participation in the PPP and MMLF. Absent suchcollection period, or impose a change to the assessment rules, an insured depository institution could have become subject to increased deposit insurance assessments based on its participation in the PPP, PPPLF or MMLF programs. Thisone-time final rule became effective on April 1, 2020, which applied the changes to deposit insurance assessments starting in the second quarter of 2020.shortfall assessment.
The FDIC may terminate a depository institution’s deposit insurance upon a finding that the institution’s financial condition is unsafe or unsound, that the institution has engaged in unsafe or unsound practices, or that the institution has violated any applicable rule, regulation, condition, or order imposed by the FDIC.
Bank Secrecy Act and Anti-Money Laundering
The Bank Secrecy Act (“BSA”), USA PATRIOTUniting and Strengthening America by Providing Appropriate Tools Required to Intercept and Obstruct Terrorism (USA PATRIOT) Act of 2001 (“PATRIOT Act”), the Anti-Money Laundering Act of 2020 and other federal laws and regulations impose obligations on U.S. financial institutions to implement and maintain appropriate policies, procedures and controls, which area program reasonably designed to prevent, detect and report instances of money laundering and the financing of terrorism, verify the identity of their customers, and to comply with the recordkeeping and reportingother requirements. Regulatory agencies expectrequire that the Bank will have an effective governance structure for the program whichthat includes effective oversight by our Board of Directors and management. We regularly evaluate and continue to enhance our systems and proceduresprogram to comply with the BSA, the PATRIOT Act and other anti-money laundering (“AML”) laws, regulations and initiatives. Failure of a financial institution to maintain and implement adequate BSA/AML programs, or to comply with all of the relevantapplicable laws or regulations, could have serious legal, compliance, operational, financial and reputational consequences for the institution. The Anti-Money Laundering Act of 2020, which became law in January 2021, made a number of changes to anti-money laundering laws, including increasing penalties for anti-money laundering violations. The Bank regularly evaluates and continues to enhance its systems and procedures to ensure compliance with the regulations.
Office of Foreign Assets Control Regulation
The U.S. Department of the Treasury’s Office of Foreign Assets Control (“OFAC”) is responsible for helping to ensure that U.S. financial institutions do not engage in transactions with certain prohibited parties, as defined by various Executive Ordersexecutive orders and Acts of Congress. BankingFederal banking regulators also examine banks for compliance with regulations administered by the OFAC for economic sanctions against designated foreign countries, designated nationals, and others. OFAC publishes lists of persons and organizations suspected of aiding, harboring or engaging in terrorist acts, known as Specially Designated Nationals and Blocked Persons. Generally, if a bank identifies a transaction account or wire transferaccount relating to a person or entity on an OFAC list, it must freeze the account or block the transaction, file a suspicious activity report and notify the appropriate authorities. Failure to comply with these sanctions could have serious legal, strategic,compliance, operational, financial, and reputational consequences, and result in civil moneymonetary penalties on the Company and the Bank.
Privacy and Cybersecurity
Federal statutes and regulations, including the GLBA, require banking organizations to take certain actions to protect nonpublic consumer financial information. The Bank has prepared a privacy policy that it must disclose to consumers annually. In some cases, the Bank must obtain a consumer’s consent before sharing information with an unaffiliated third party, and the Bank must allow a consumer to opt out of the Bank’s sharing of information with its affiliates for marketing and certain other purposes. AdditionalThese additional conditions affect the Bank’s information exchanges with credit reporting agencies. The Bank'sBank’s privacy practices and the effectiveness of its systems to protect consumer privacy are subjects covered in the Federal Reserve’s periodic compliance examinations.
The Federal Reserve and state regulators, as well as the SEC, CFPB and other self-regulatory organizations, regularly issue guidance on cybersecurity practices and procedures that is intended to enhance cybersecurity risk management among financial institutions and their holding companies and affiliates. For example, the interagency council of the federal banking agencies, the Federal Financial Institutions Examination Council (“FFIEC”), has issued several policy statements and other guidance for banks in light of the growing risk posed by cybersecurity threats. The FFIEC has recently focused on such matters as compromised customer credentials, cyber resilience and business continuity planning. Examinations by the banking agencies now include review of an institution’s information technology and its ability to thwart or mitigate cyber-attacks. Thefederal banking agencies require banking organizations to notify their primary federal regulator of significant computer security incidents within 36 hours of determining that such an incident has occurred. Effective December 2023, the SEC also has imposed Form 8-K disclosure obligations for a material cybersecurity incident, among other cybersecurity related disclosure obligations.
Consumer data privacy and data protection are also the subject of state laws. For example, on January 1, 2020, the Bank becameis subject to the California Consumer Privacy Act (“CCPA”). This statute grants consumers several rights, including the right to request disclosure of information collected about them and whether that information has been sold or shared with others, the right to request correction of information, the right to request deletion of personal information (subject to certain exceptions), and the right to opt out of the sale of their personal information. However, a consumer does not have these rights with respect to information that is collected, processed, sold, or disclosed pursuant to the GLBA or the California Financial Information Privacy Act. The CCPA was amended by the California Attorney GeneralPrivacy Rights Act. A new agency, the California Privacy Protection Agency, was established to enforce California privacy law.
The privacy and data protection regime in China is in a period of change and there has adopted regulationsbeen significant activity in the field of privacy and cybersecurity legislation in recent years. The Personal Information Protection Law (“PIPL”), the Cybersecurity Law and the Data Security Law form a regulatory framework for privacy and data protection in China. The PIPL establishes guiding principles on the protection of a Chinese citizen’s personal information and applies to entities operating in China, foreign organizations, and individuals processing personal information outside China. The Cybersecurity Law focuses on cybersecurity concerns and requires network operators to implement measures to safeguard the CCPA.security of networks and systems. The Data Security Law complements the PIPL and Cybersecurity Law by addressing broader data security issues, emphasizing the protection of critical data infrastructure and promoting a risk-based approach to data security. New supporting guidelines and standards are expected as China's cybersecurity, data security, and personal information protection framework continues to evolve. All these changes have potential impact on the business and operations of our Bank and its subsidiary, East West Bank (China) Limited.
Climate-Related Risk Management
In recent years, the federal banking agencies have increased their focus on climate-related risks affecting the operations of banks, the communities they serve and the broader financial system. The Federal Reserve pays close attentionagencies have begun to enhance their supervisory expectations regarding banks’ climate risk management practices, including by proposing guidance that would encourage banking organizations to, among other things: evaluate the potential impact of climate-related risks on the bank’s financial condition, operations and business objectives as part of its strategic planning process; account for the effects of climate change in stress testing scenarios and systemic risk assessments; revise expectations for credit portfolio concentrations based on climate-related factors; and prepare for the transition risks to the cybersecurity practices of state member banksbank associated with the adjustment to a low-carbon economy and their holding companies and affiliates. The interagency council of the agencies, the Federal Financial Institutions Examination Council (“FFIEC”), has issued a number of policy statements and other guidance for banksrelated changes in light of the growing threat posed by cybersecurity threats. FFIEC has recently focused on such matters as compromised customer credentials, cyber resilience and business continuity planning. Examinations by the banking agencies now include review of an institution’s informationlaws, regulations, governmental policies, technology, and its ability to thwart or mitigate cyber-attacks. Additionally, on December 18, 2020,consumer behavior and expectations.
In October 2023, the federal banking agencies released interagency guidance, “Principles for Climate-Related Financial Risk Management for Large Financial Institutions” (the “Principles”), which are intended to encourage banking organizations with $100 billion or more in assets to focus on key aspects of climate-related financial risk management. The Principles cover six areas: governance; policies, procedures, and limits; strategic planning; risk management; data, risk measurement, and reporting; and scenario analysis. The Principles also describe how large banking organizations should manage climate-related financial risks that can arise in risk categories such as credit, liquidity, and other financial risk, and operational, legal and compliance, and other nonfinancial risk. While the agencies’ efforts to-date, including the Principles, have focused on banking organizations with $100 billion or more in total assets, their supervisory expectations on climate risk management practices ultimately may apply to smaller banking organizations such as the Bank.
In addition, states such as California, are taking similar actions on climate-related financial risks. In October 2023, California Governor Gavin Newsom signed into law Senate Bill 253, the Climate Corporate Data Accountability Act (“CCDAA”) and Senate Bill 261, the Climate-Related Financial Risk Act (“CRFRA”). The CCDAA is applicable to U.S.-organized entities that do business in California with annual revenue in excess of $1 billion. Subject to the adoption of implementing regulations by the California Air Resources Board, these entities will need to file annual reports publicly disclosing their direct greenhouse gas (“GHG”) emissions from operations (“Scope 1 emissions”), indirect GHG emissions from energy use (“Scope 2 emissions”) and indirect upstream and downstream supply-chain GHG emissions (“Scope 3 emissions”). The reporting requirements related to Scope 1 and 2 emissions will begin in 2026, while the reporting requirements of Scope 3 emissions will begin in 2027. The CRFRA requires U.S.-organized entities that do business in California, with annual revenues over $500 million to prepare biennial reports disclosing climate-related financial risk and the measures they have adopted to reduce and adapt to that risk. The initial round of the climate risk disclosure reports will be due by January 1, 2026. The Company is a notice ofreporting entity under both laws and may incur compliance, maintenance and remediation costs to conform to such requirements.
Potential Regulatory Reforms
On August 29, 2023, the FDIC released a proposed rulemakingrule that would require covered IDIs to develop and submit detailed plans demonstrating how they could be resolved in an orderly and timely manner in the event of receivership. IDIs with total assets of $100 billion or more would be required to submit full resolution plans, and IDIs with total assets between $50 billion and $100 billion, including the Bank, would be required to submit more limited informational filings. Under the proposal, if the FDIC deemed a banking organizationresolution plan or informational filing not credible and the IDI failed to notify its primary federal regulator within 36 hoursresubmit a credible plan, the IDI could become subject to an enforcement action.The Company is evaluating the impact of a significant cybersecurity incident.this proposal.
The federal banking agencies also jointly released a proposed rule on August 29, 2023 that would require bank holding companies and non-consolidated banks with total assets of $100 billion or more to issue and maintain minimum amounts of long-term debt. The Company has total consolidated assets of less than $100 billion and would not be subject to the long-term debt requirements if they are finalized as proposed. However, by imposing additional costs on bank holding companies with $100 billion or more in total consolidated assets, this rule proposal could reduce the benefits of growth beyond that size for a bank holding company that has less than $100 billion in total consolidated assets, such as the Company.
Future Legislation, Regulation and RegulationSupervision Activities
New statutes, regulations and policies that contain wide-ranging proposals for altering the structures, regulations and competitive relationships of financial institutions and public companies operating in the U.S. are regularly adopted. Such changes to applicable status,statutes, regulations, and policies may change the Company’s operating environment in substantial and unpredictable ways, increase the Company’s cost of conducting business, impede the efficiency of the internal business processes, subject the Company to increased supervision activities and disclosure and reporting requirements, and restrict or expand the activities in which the Company may engage. Accordingly, such changes may have a significant influence on our operations and activities, financial condition, results of operations, growth plans or future prospects, and the overall growth and distribution of loans, investments and deposits. We cannot predict whether or in what form any statute, regulation or policy will be proposed or adopted or the extent to which our businessesbusiness may be affected by any new statute, regulation or regulation.policy.
Available Information
The Company’s website is www.eastwestbank.com. The Company’s Annual Reports on Form 10-K, Quarterly Reports on Form 10-Q, Proxy Statements, Current Reports on Form 8-K, amendments to those reports filed or furnished pursuant to Section 13(a) or 15(d) of the Exchange Act, and other filings with the SEC are available free of charge at http://investor.eastwestbank.com under the heading “SEC Filings,” as soon as reasonably practicable after the Company electronically files such material with, or furnishes it to, the SEC. These reports are also available on the SEC’s website at www.sec.gov. In addition, the Company’s Code of Conduct, Corporate Governance Guidelines, charters of the Audit Committee, Compensation and Management Development Committee, Executive Committee, Risk Oversight Committee and Nominating/Corporate Governance Committee, and other corporate governance materials are available on the Investor Relations section of the Company’s website. The information contained on the Company’s website as referenced in this report is not part of this report.
Stockholders may also request a copy free of charge of any of the above-referenced reports and corporate governance documents by writing to: Investor Relations, East West Bancorp, Inc., 135 N. Los Robles Avenue, 7th Floor, Pasadena, California 91101; by calling (626) 768-6000; or by sending an e-mail to InvestorRelations@eastwestbank.com.
ITEM 1A. RISK FACTORS
In the course of conducting its businesses, the Company isWe are exposed to a variety of risks, some of which are inherent to the financial services industry and others of which are more specific to the Company’s businesses. The Company’sour business. Our enterprise risk management (“ERM”) program incorporates risk management throughout the organization in identifying, managing, monitoring, and reporting risks. Our ERM program identifies the Company’s major risk categories as risks related to the COVID-19 pandemic; geopolitical uncertainties; financial risks; capitalin our business as: capital; market; liquidity; credit; operational; compliance; legal; strategic; technology; and liquidity risks; credit risk; operational risk; regulatory, compliance and legal risks; accounting and tax risks; and strategic and reputational risks. The ERM is comprised of senior management of the Company and chaired by the Chief Risk Officer.reputational.
The discussion below addresses material factors, of which we are currently aware, that could have a material and adverse effect on our businesses,business, results of operations, and financial condition. Many of the following risks and uncertainties are, and will be, exacerbated by the COVID-19 pandemic and any worsening of the global business and economic environment as a result. These risk factors and other forward-looking statements thatincluded in this Form 10-K relate to future events, expectations, trends, and operating periods, and involve certain factors that are subject to change, and important risks and uncertainties that could cause actual results to differ materially. These risks and uncertainties should not be considered a complete discussion of all the risks and uncertainties the Company maythat we might face, but are intended to highlight risks that we believe are important factors to consider when evaluating our business and although thean investment in our securities. Although these risks are organized by headings and each risk is discussed separately, many are interrelated.
Risks Related to the COVID-19 Pandemic
The effects of the COVID-19 pandemic have impacted, In addition, there may be additional risks and may continue to impact, the Company’s businesses, financial condition, liquidity, capital and results of operations, and the extent and duration of these impacts depend on future developments, which remain uncertain and cannot be predicted. The COVID-19 pandemic and governmental responses to the pandemic have had and will likely continue to have a severe impact on global economic conditions, including disruption and volatility in the financial markets, disruption of global supply chains, temporary closures or failures of businesses, increased unemployment, and the imposition of social distancing and restrictions on movement in the U.S. and other countries.
East West Bank is considered an essential business in the seven states where we have branches or office locations. In response to the COVID-19 pandemic and to enhanced health and safety measures, the Company has implemented business continuity plans, prepared all East West Bank facilities with employee safety protocols, including personal protection equipment, visual safety reminders related to social distancing, social distancing markers, temperature checks and sanitary products, and continued to provide financial services to our customers. Subsequent waves of the COVID-19 pandemic may negativelyuncertainties that adversely affect our ability to provide services due to increased illnesses among our employees, quarantines, new “stay-at-home” orders or other restrictions on our employees, or the safety measures implemented to prevent illnesses of our employees, including the potential closure of particular branches and certain employees working remotely.
Governments and regulatory authorities worldwide have taken and may continue to take measures to stabilize the markets and support economic growth. However, the success of these measures is unknown, and these measures may not be sufficient to address the negative economic effects of the COVID-19 pandemic or to avert severe and prolonged slowdowns in economic activity.
We may face increased cybersecurity risks due to the shifting of a majority of our corporate and division office functions to operating remotely in regions impacted by “stay-at-home” orders.Increased levels of remote access may create additional opportunities for cybercriminals to attempt to exploit vulnerabilities, and our employees may be more susceptible to phishing and social engineering attempts due to increased stress caused by the crisis and from balancing family and work responsibilities at home. In addition, our technological resources may be strained due to the number of remote users.
The conditions caused by the COVID-19 pandemic could continue to adversely affect the ability of the Company’s borrowers to satisfy their obligations. Given that many of the Company’s loans are secured by real estate, a potential decline in real estate markets could further impact the Company’s business, and financial condition, and the credit quality of the Company’s loan portfolio. In addition, some of the Company’s business customers are in volatile businesses and industries, which are sensitive to global economic conditions, supply chain disruptions and/or commodity prices. Any decline in these businesses and industries could cause decreased borrowings and potentially increase credit losses, which in turn could adversely affect the Company’s financial condition. If unemployment continues to rise and our customers experience credit deterioration, including inability to pay loans as they come due or a decrease in the value of collateral and/or higher than usual draws on outstanding lines of credit, our level of charge-offs and provision for credit losses could continue to increase. Further, the disruptions related to the COVID-19 pandemic may decrease our borrowers’ confidence with respect to purchasing real estate or homes and adversely affect the demand for the Company’s loans and other products and services, the valuation of our loans, securities, derivatives portfolios, goodwill and intangibles, the carrying value of our deferred tax assets, our capital levels and liquidity, and our results of operations.
In addition, the unprecedented developments relating to the COVID-19 pandemic have contributed to heightened volatility in financial markets in the U.S. and worldwide. The continuation of prolonged adverse economic conditions primarily in the U.S. and/or Greater China can be expected to have adverse effects on the Company’s businesses, results of operations and financial condition. Market declines or volatility due to the COVID-19 pandemic could have material impacts on the value of securities, derivatives and other financial instruments which the Company owns. The Company executes transactions with various counterparties in the financial industry, including broker-dealers, commercial banks and investment banks, and defaults by financial services institutions and uncertainty in the financial services industry in general could lead to market-wide liquidity problems and may expose the Company to credit risk in the event of default of its counterparties or clients and further increase the possibility of downgrades in the Company’s credit ratings. Any further measures undertaken by governmental authorities to address the COVID-19 pandemic could significantly disrupt or prevent us from operating our business in the ordinary course for an extended period, which could have a significant adverse effect on our results of operations and financial condition. Economic distress due to the COVID-19 pandemic could exacerbate these effects.Additionally, the earnings impact from recent and continued emergency interest rate cuts could further compress interest margins, which could potentially have an adverse effect on our results of operations and financial condition.
The extent to which the COVID-19 pandemic and associated economic downturn continue to impact our businesses, results of operations, and financial condition is uncertain and will depend on numerous evolving factors that are outside our control and cannotnot presently known, that are not currently believed to be accurately predicted, including the scope, severity and duration of the pandemic, the governmental, business and individual actions in responsesignificant, or that are common to the pandemic, the impact of those actions on global economic activities, and the pace of economic recovery when the COVID-19 pandemic subsides.all businesses.
The impact of the U.S. federal government actions to mitigate the effects of the COVID-19 pandemic, and our participation in those efforts, may materially and adversely affect our businesses, results of operations and financial condition. The U.S. federal government has taken significant action to address the economic and financial effects of the COVID-19 pandemic. The Federal Reserve has sharply reduced interest rates and instituted quantitative easing measures, as well as domestic and global capital market support programs. In addition, Congress, various federal agencies and state governments have taken measures to address the economic and social consequences of the pandemic, including the enactment on March 27, 2020 of the CARES Act, which, among other things, established various initiatives to protect individuals, businesses and local economies in an effort to lessen the impact of the COVID-19 pandemic on consumers and businesses. These initiatives included the PPP, funding and authority for the Federal Reserve and U.S. Department of Treasury to establish the Main Street Lending Program (“MSLP”), relief with respect to TDRs, mortgage forbearance, and extended unemployment benefits. In response to the continued market disruption and economic impact of the COVID-19 pandemic, the President signed into law the CAA on December 27, 2020. The CAA extended some of these relief provisions in certain respects as well as provided other forms of relief.
The PPP permitted small businesses, sole proprietorships, independent contractors and self-employed individuals to apply for forgivable loans from existing SBA lenders and other approved regulated lenders that enroll in the program, subject to numerous limitations and eligibility criteria. The CARES Act appropriated $349 billion to fund the PPP, and Congress appropriated an additional $310 billion for PPP commitments on April 24, 2020, and amended the PPP on June 5, 2020 to make the terms of the PPP loans and loan forgiveness more flexible. From April to August 2020, we accepted PPP applications and originated loans to qualified small businesses under this program. Consistent with the terms of the PPP, these loans carry an interest rate of 1% and are 100% guaranteed by the SBA. The substantial majority of the Company’s PPP loans have a term of two years. The Federal Reserve established the PPPLF to enable Federal Reserve Banks to extend credit to financial institutions that originate PPP loans, while taking the PPP loans as collateral. Earlier in 2020, we borrowed under the PPPLF by pledging PPP loans as collateral, and paid down all borrowings in the month of October 2020. The CAA provided additional funding to the PPP, expanded eligibility of business for the PPP, extended the PPP to March 31, 2021, and allowed eligible borrowers to obtain a second PPP loan with a maximum amount of $2 million. In January 2021, the Company began processing applications under this latest round of the SBA’s PPP. The Bank was also a participating lender in the MSLP, which was established by the Federal Reserve to support lending to small- and medium-sized businesses and nonprofit organizations that were in sound financial condition before the onset of the COVID-19 pandemic. The Company’s participation in these programs could subject us to increased governmental and regulatory scrutiny, negative publicity or increased exposure to litigation, which could increase our operational, legal and compliance costs and damage our reputation. Moreover, if the federal stimulus measures are not effective in mitigating the effect of the COVID-19 pandemic, credit issues for our loan customers may be severe and adversely affect our businesses, results of operations, and financial condition more substantially over a longer period of time.
The CARES Act, as amended by the CAA, and related guidance from the federal banking agencies provide financial institutions the option to temporarily suspend requirements under the U.S. Generally Accepted Accounting Principles (“GAAP”) related to classification of certain loan modifications as TDRs, to account for the current and anticipated effects of the COVID-19 pandemic. The CARES Act also includes a range of other provisions designed to support the U.S. economy and mitigate the impact of the COVID-19 pandemic on financial institutions and their customers. Among other provisions, sections 4022 and 4023 of the CARES Act, respectively, require mortgage servicers to grant, on a borrower’s request, forbearance for up to 180 days (which can be extended for an additional 180 days) on a federally-backed single-family mortgage loan or forbearance up to 30 days (which can be extended for two additional 30-day periods) on a federally-backed multifamily mortgage loan when the borrowers experience financial hardship due to the COVID-19 pandemic.
Further, in response to the COVID-19 pandemic, the Federal Reserve implemented a number of facilities in addition to the PPPLF and MSLP to provide emergency liquidity to various segments of the U.S. economy and financial markets. Many of these facilities expired December 31, 2020, or were extended for brief periods into 2021. The expiration of these facilities could have adverse effect on U.S. economy and ultimately on our businesses,financial condition and results of operations.
In response to the COVID-19 pandemic, all of the federal banking regulatory agencies have encouraged lenders to extend additional loans, and the federal government is considering additional stimulus and support legislation focused on providing aid to various sectors, including small businesses. The full impact on our business activities as a result of government and regulatory policies, programs and guidelines, as well as regulators’ reactions to such activities, remains uncertain.
Risks Related to Geopolitical Uncertainties
Unfavorable general economic, market, political or industry conditions, either domestically or internationally, may adversely affect our businesses,business, results of operations, and financial condition.
Our businessesbusiness and results of operations are affected by the financial markets and general economic conditions globally, particularly in the U.S. and Greater China,Asia, including factors such as the level and volatility of short-termshort- and long-term interest rates, inflation, deflation, homeresidential and commercial property prices, collateral asset prices, unemployment and under-employment levels, rental rates and occupancy levels, market or supply chain disruption, labor shortages, bankruptcies, household income, consumer behavior, fluctuations in both debt and equity capital markets and currencies, liquidity of the global financial markets, the availability and cost of capital and credit, government spending and the federal debt ceiling, investor sentiment and confidence in the financial markets, and sustainability of economic growth in the U.S. and Greater China.Asia. The deterioration of any of these conditions could adversely affect our consumer and commercial businesses, ourbusiness, securities and derivatives portfolios, ourthe level of charge-offs and provision for credit losses, the carrying value of our deferred tax assets, our capital levels, liquidity, and our results of operations. In addition, because the Company’sour operations and the collateral securing itsour real estate lending portfolio are primarily concentrated in Northern and Southern California, the Companywe may be particularly susceptible to the adverse economic conditions in the state of California. Any unfavorable changeseconomic, market, political, or industry conditions in the economicCalifornia and market conditionsother regions where we operate could lead to the following risks:outcomes, among others:
•the process the Company uses to estimate thegreater than expected losses in the Company’sour credit exposure requires difficult, subjective and complex judgments, including consideration of how thesedue to unforeseen economic conditions, might impair the ability of the borrowers to repay their loans. The level of uncertainty concerning economic conditions may adversely affect the accuracy of the Company’s estimates of expected losses in the Company’s credit exposure which may, in turn, adversely impact the Company’sour results of operations and financial condition;
•the Company’s commercial and residentialfailure of our borrowers may not be able to make timely repayments of their loans, or a decrease in the value of real estate collateral securing the payment of such loans, which could result in credit losses, delinquencies, foreclosures and customer bankruptcies, any of which couldand in turn have a material adverse effect on the Company’sour results of operations and financial condition;
•a decrease in deposit balances and in the demand for loans and other products and services;
•a decrease in deposit balances;
•future disruptions in the capital markets or other events, including adverse actions by rating agencies and deteriorating investor expectations, which may result in an inability to borrow on favorable terms or at all from other financial institutions;
•an adverse effect on the value of the AFS debt securities portfolio that the Company holds may be adversely affected byas a result of debt defaults; and
•a loss of confidence in the financial services industry, our market sector and the equity markets by investors, placing pressure on the Company’sour stock price.
Changes in the economic and political relations between the U.S. and Greater China, including trade policies, includingdisputes and the imposition of tariffs and retaliatory tariffs,other trade restrictions, may adversely impact the Company’sour business, results of operations, and financial condition.
There have been ongoing discussions regarding potential changes to
Economic trade and political tensions, including tariffs and other punitive trade policies legislation, treaties and tariffsdisputes, between the U.S. and Greater China. TariffsChina pose a risk to our business and customers. The imposition of tariffs, retaliatory tariffs, have been imposed and proposed. Changes in tariffs, retaliatory tariffsexport controls or other trade restrictions on products and materials that the Company’sour customers import or export could cause the prices of their products to increase, possibly reduce demand, and hence may negatively impact the Company’s customerour customers’ margins and their ability to service debt. The CompanyWe may also experience a decrease in the demand for loans and other financial products or experience a deterioration in the credit quality of the loans extended to the customers whosein industry sectors that are most sensitive to the tariffs.trade restrictions.
We face risks associated with international operations.
A substantial number of our customers have economic and cultural ties to Asia. The Bank’s international presence includes four full-service brancheslocations in Hong Kong, China and four representative offices in Greater China.Singapore. Our presence in Greater ChinaAsia carries certain risks, including risks arising from the uncertainty regarding our ability to generate revenues from foreign operations and risks associated with leveraging and conducting business on an international basis, including among others,basis. These risks include: legal, regulatory, and tax requirements and restrictions, cross-borderrestrictions; tariffs, trade restrictionsbarriers, or tariffs,other trade restrictions; uncertainties regarding liability, trade barriers,liability; difficulties in staffing and managing foreign operations,operations; political and economic risks, and financial risks including currency and payment risks. Additionally, our business could be adversely affected by the effects ofFurther, a widespread outbreak of disease pandemics, including the current spread of the COVID-19 pandemic. Any outbreak of disease pandemics,downturn in economic growth and other adverse public health developments, particularlyreal estate markets in Asia, could have a materialChina and adverse effect on our business operations. These could include temporary closures of our branches and offices and reduced consumer spending in the impacted regions or in the U.S., depending upon the severity, globally, which could adversely impact our operating results and the performance of loans to impacted borrowers in Greater China or in the U.S. In addition, a significant outbreak of disease pandemics in the human population, specifically the COVID-19 pandemic, has resulted in a widespread health crisis that have had and continue to adversely affect the economies and financial markets of many countries, resulting in an economic downturn that could adversely affect our customers’ financial results. Further, volatility in the Shanghai and Hong Kong stock exchanges, and/or a potential fall in real estate prices in China, among other things, may negatively impact asset values and the profitability and liquidity of the Company’sour customers operating in this region. These risks could adversely affect the success of our international operations and could have a material adverse effect on our overall business, results of operations, and financial condition. In addition, we face risks that our employees and affiliates may fail to comply with applicable laws and regulations governing our international operations, including the U.S. Foreign Corrupt Practices Act, anti-corruption laws, and other U.S. and foreign laws and regulations. Failure to comply with such laws and regulations could, among other things, result in enforcement actions and fines against us, as well as limitations on our conduct and reputational harm, any of which could have a material adverse effect on our businesses,business, results of operations and financial condition.
Natural disasters and geopolitical events beyond the Company’sour control could adversely affect the Company.our business, results of operations, and financial condition.
Natural disasters such as wildfires, earthquakes, extreme weather conditions, hurricanes, floods, droughts, widespread health emergencies or disease pandemics, and other acts of nature and geopolitical events involving political unrest, terrorism, or military conflicts could adversely affect the Company’sour business operations and those of the Company’sour customers and cause substantial damage and loss to real and personal property. For example, California, in which the Company’s operations and the collateral securing its real estate lending portfolio are concentrated, contains active earthquake zones and has been, and continues to be, subject to numerous devastating wildfires. These naturalNatural disasters and geopolitical events could impair borrowers’ ability to service their loans, decrease the level and duration of deposits by customers, erode the value of loan collateral, and result in an increase in the amount of nonperforming assets, net charge-offs, and provision for credit losses, which could adversely affect the Company’s businesses,and otherwise cause a material adverse effect on our results of operations and financial condition.
Macroeconomic challenges caused by the COVID-19 pandemic and geopolitical events have been persistent and are difficult to predict, including supply-chain shortages, volatile energy prices, tightening monetary policy and inflation, and heightened cybersecurity risks. The extent of the continuing impact of these events on our business, results of operations and financial condition will depend on future developments, which are highly uncertain and difficult to predict.
Additionally, political unrest, wars and acts of terrorism have heightened geopolitical tensions, which continue to disrupt the global supply chain and increase economic uncertainty and inflationary pressures. Instability in global economic conditions and geopolitical matters could have a material adverse effect on our results of operations and financial condition.
The effects of climate change could adversely impact our operations, business and customers.
The risks of climate change can be divided into physical and transition risks. The physical risks of climate change include discrete weather events, changing climate patterns and other disruptions caused by climate change affecting the regions, countries and locations in which we or our customers have operations or other interests. Climate change concerns could result in transition risk, which are risks that arise from the process of adjusting to a low-carbon economy, including changes in climate policy or in the regulation of financial institutions with respect to risks posed by climate change. Transition risks could also negatively affect our customers in certain industries, which may increase our credit risk and reduce the demand from these customers for our products and services. These climate-related physical and transition risks could have a direct financial impact on our business and operations. Material adverse impacts to our customers, including declines in asset values, reduced availability of insurance, significant interruptions to business operations, and negative consequences to business models and the need to make changes in responses to those consequences could also affect us. The risks of regulatory changes and additional compliance and disclosure requirements related to climate change may impose operational burdens and increased compliance costs, capital requirements, or the risk of litigation, which could adversely affect our business, results of operations and financial condition. Climate change also presents reputational risk from stakeholder concerns about our practices related to climate change. Our business, reputation, and ability to attract and retain employees may also be harmed if our response to climate change is perceived to be ineffective or insufficient.
Risks Related to Financial Matters
A significantportion of the Company’sour loan portfolio is secured by real estate and thus the Company hasat a higher degree of risk from a downturn in real estate markets.
Because
Since many of the Company’sour loans are secured by real estate, a decline in the real estate markets could impact the Company’sour business and financial condition. Real estate values and real estate markets are generally affected by changes in general economic conditions and employment levels, fluctuations in interest rates, and the availability of loans to potential purchasers and the availability and demand for types of real property investments, changes in tax laws and other governmental statutes, regulations and policies, and natural disasters, such as wildfires and earthquakes, which are particular toparticularly prevalent in California, where a significant portion of the Company’sour real estate collateral is located. If real estate values decline, the value of real estate collateral securing the Company’sour loans could be significantly reduced. The Company’sOur ability to recover on defaulted loans by foreclosing and selling the real estate collateral would be further diminished, and the Companywe would be more likely to suffer losses on defaulted loans. Furthermore, commercial real estate (“CRE”) and multifamily residential loans typically involve largelarger balances to single borrowers or groups of related borrowers. Since payments on these loans are often dependent on the successful operation or management of the properties, as well as the business and financial condition of the borrowers, repayment of such loans may be subject to adverse conditions in the real estate market, adverse economic conditions, shifts in demand for different types of properties, or changes in applicable government regulations. Borrowers’ inability to repay such loans may have an adverse effect on the Company’s businesses,our business, results of operations and financial condition.
The Company’s businesses areOur business is subject to interest rate risk and variations in interest rates may have a material adverse effect on the Company’sour financial performance.
Our financial results depend substantially on net interest income, which is the difference between the interest income we earn on interest-earning assets and the interest expense we pay on interest-bearing liabilities. Interest-earning assets primarily include loans extended, securities held in our investment portfolio, and excess cash held to manage short-term liquidity. We fund our assets using deposits and borrowings. While weWe offer interest-bearing deposit products, and a portion of our deposit balances are from noninterest-bearing products. Overall, theWe also enter into interest rate derivatives to manage interest rate risk exposure. The interest rates we receive on our interest-earning assets and pay on our interest-bearing liabilities could be affected by a variety ofvarious factors, including macroeconomic challenges, Federal Reserve policies, market interest rate changes in response to inflation, competition, regulatory requirements andor a change in our product mix. Changes in key variable market interest rates, such as the Federal Funds, National Prime, LIBORfederal funds, national prime, or U.S. Treasury rates generally impact our interest rate spread. Because of the differences in maturities and repricing characteristics of the Company’sour interest-earning assets and interest-bearing liabilities, changes in interest rates do not produce equivalent changes in interest income earned on interest-earning assets and interest expense paid on interest-bearing liabilities. Increases in interest rates may result in a change in the mix of noninterest and interest-bearing deposit accounts. Rising interest rates may cause our funding costs to increase at a faster pace than the yield we earn onfrom our assets, ultimately causing our net interest margin to decrease. Higher interest rates may also result in lower mortgageloan production income and increased charge-offs in certain segments of the loan portfolio, such as CRE and home equity. In contrast, decliningportfolio. Declining interest rates could lead to higher loan refinancing activity, which, in turn, would increase the Bank’s lending capacity, decrease funding cost, increaselikelihood of prepayments of loans and mortgage related securities. Changes in interest rates also impact the value of our investments in debt securities, as borrowers refinance to reduce borrowing costs.particularly debt securities with longer maturities. Accordingly, changes in levels of interest rates could materially and adversely affect our net interest income, net interest margin, cost of deposits, loan origination volume, average loan portfolio balance, asset quality, liquidity, and overall profitability.
Inflation can have an adverse impact on our business and on our customers.
Reforms
Inflation risk is the risk that the value of assets or income from investments will be worth less in the future as inflation decreases the value of money. In 2023 inflation persisted and was slow to decrease despite multiple increases to the federal funds rate by the Federal Reserve. As inflation increases and uncertainty regarding LIBORinterest rates rise, the value of our investment securities, particularly those with longer maturities, decreases, although this effect is less pronounced for floating rate instruments. Prolonged periods of inflation also may impact our profitability by negatively impacting our costs and expenses, including increasing funding costs and expense related to talent acquisition and retention, and negatively impacting the demand for our products and services. Moreover, our customers are also affected by inflation and the rising costs of goods and services used in their households and businesses, which could have a negative impact on their ability to repay their loans. Further adverse changes in inflation and interest rates could negatively impact consumer and business confidence, and adversely affect our business. On July 27, 2017, the United Kingdom (“U.K.”)’s Financial Conduct Authority (“FCA”), which regulates LIBOR, announced that it will no longer compel banks to submit rates for the calculation of LIBOR after 2021. In June 2017, U.S. Federal Reserve Bank's Alternative Reference Rates Committee (“ARRC”) selected the SOFR as the preferred alternative rate to LIBOR. SOFR differs from LIBOR in two key respects: SOFR is a single overnight rate, while LIBOR includes rates of several tenors; and SOFR is deemed a credit risk-free rate, while LIBOR incorporates an evaluation of credit risk. In addition, the SOFR methodology has not been tested for an extended period of time, which may limit market acceptance of the use of SOFR. The ARRC and other entities intend for the transition to be economically neutral. During 2020, the ARRC has issued updated hardwired fallback language for bilateral business loans and syndicated loans, and a recommended spread methodology for non-consumer cash products,economy as well as guidance on several matters related to the transition. On October 23, 2020, the International Swaps and Derivatives Association, Inc. (“ISDA”) launched its 2020 IBOR Fallbacks Supplement (“Supplement”) and IBOR Fallbacks Protocol (“Protocol”). The Supplement amended ISDA’s standard definitions for interest rate derivatives to incorporate robust fallbacks for derivatives linked to certain IBORs, with the changes effective on January 25, 2021. From that date, all new cleared and non-cleared derivatives that reference the definitions include the fallbacks. The Protocol enabled market participants to incorporate the revisions into their legacy non-cleared derivatives trades with other counterparties that choose to adhere to the Protocol. The Protocol was open for adherence beginning October 23, 2020 and became effective on the same date as the Supplement, January 25, 2021. The ARRC supports the ISDA Protocol. On November 30, 2020, LIBOR’s administrator, the ICE Benchmark Administration (“IBA”), in coordination with U.K. and U.S. regulators, announced the IBA’s intention to cease publication of the one-week and two-month U.S. dollar (“USD”) LIBOR settings immediately following the LIBOR publication on December 31, 2021, and the remaining USD LIBOR settings immediately following the LIBOR publication on June 30, 2023. Banks are encouraged to cease entering new contracts that use USD LIBOR as a reference rate as soon as practicable and in any event by December 31, 2021. The Company created a cross-functional team to manage the communication of the Company’s transition plans with both internal and external stakeholders and to ensure that the Company appropriately updates itsour business, processes, analytical tools, information systems and contract language to minimize disruption during and after the LIBOR transition. However, due to the uncertainty surrounding the future of LIBOR, the transition is anticipated to span several reporting periods through the end of 2021 and potentially into 2023 with newly released timing of LIBOR cessation. Since the volume of our products that are indexed to LIBOR is significant, the transition, if not sufficiently planned for and managed by our cross-functional teams, could adversely affect the Company’s financial condition and results of operations. Although implementation of the SOFR benchmark is intended to have minimal economic effect on the parties to a LIBOR-based contract, the transition from LIBOR to a new benchmark rate could result in significant increased systems compliance and legal costs. Inconsistent approaches to a transition from LIBOR to an alternative rate among different market participants and for different financial products may cause market disruption and operational problems, which could adversely affect us, including by exposing us to increased basis risk and resulting costs in connection with remediating these problems, and by creating the possibility of disagreements with counterparties. This transition may also result in our customers challenging the determination of their interest payments or entering into fewer transactions or postponing their financing needs, which could reduce the Company’s revenue and adversely impact our business. In addition, the uncertainty regarding the future of LIBOR as well as the transition from LIBOR to another benchmark rate or rates could have adverse impacts on floating-rate obligations, loans, deposits, derivatives, and other financial instruments that currently use LIBOR as a benchmark rate and, ultimately, adversely affect the Company’s results of operations and financial condition.
The monetary policies of the federal government and its agencies could have a material adverse effect on our earnings.
The Federal Reserve Board regulates the supply of money and credit in the U.S. Its policies determine in large part the cost of funds for lending and investing and also affect the return earned on those loans and investments, both of which in turn affect our net interest margin. They can also materially decrease the value of financial assets we hold. Federal Reserve policies may also adversely affect borrowers, potentially increasing the risk that they may fail to repay their loans, or could adversely create asset bubbles which resultresulting from prolonged periods of accommodative policy. This, in turn, may result in volatile markets and rapidly declining collateral values. Changes in Federal Reserve policies are beyond our control and difficult to predict.control. Consequently, the impact of these changes on our business and results of operations is difficult to predict.
Further downgrades of the U.S. credit rating, potential automatic spending cuts or a government shutdown could negatively impact our business, results of operation and financial condition.
Over the past few years, U.S. debt ceiling and budget deficit concerns have increased the possibility of additional credit rating downgrades and economic slowdowns, or a recession in the U.S. Although U.S. lawmakers passed legislation to raise the federal debt ceiling in 2023, there is risk of continuing political disagreement over the federal debt limit and budget. In August 2023, Fitch Ratings Inc. downgraded the long-term sovereign credit rating of the U.S. to “AA+” from “AAA” and in November 2023 Moody’s Investor Service changed its outlook on U.S. credit to negative. The Company isimpact of this or any further downgrades to the U.S. government’s sovereign credit rating or its perceived creditworthiness could adversely affect the U.S. and global financial markets and economic conditions. In addition, disagreement over the federal budget may cause a full or partial U.S. federal government shutdown. Continued adverse political and economic conditions could have an adverse effect on our business, results of operation and financial condition.
We are subject to fluctuations in foreign currency exchange rates.
The Company’s
Our foreign currency translation exposure relates primarily to itsderives, in part, from our China subsidiary that has its functional currency denominated in Chinese Renminbi (“RMB”). In addition, as the Company continueswe continue to expand its businessesour cross-border business, we have a higher volume of customer transactions in China and Hong Kong, certain transactions are conducted in currencies other than the USD. Although the Company hasforeign currencies. We have entered into derivative instruments to offset some of the impact of the foreign exchange fluctuations,fluctuations. However, given the volatility of exchange rates, there is no assurance that the Companywe will be able to effectively manage foreign currency translation risk. Fluctuations in foreign currency exchange rates could have a material unfavorable impact on the Company’sour net income, therefore adversely affecting the Company’sour business, results of operations, and financial condition.
Risks Related to Our Capital Resources and Liquidity
As a regulated entity, we are subject to capital requirements, and a failure to meet these standards could adversely affect our financial condition. The Company
We and the Bank are subject to certain capital and liquidity rules, including the Basel III Capital Rules, which establish the minimum capital adequacy requirements and may require us to increase our regulatory capital or liquidity targets, increase regulatory capital ratios, or change how we calculate regulatory capital. We may be required to increase our capital levels, even in the absence of actual adverse economic conditions or forecasts, and enhance capital planning based on hypothetical future adverse economic scenarios. As of December 31, 2020,2023, we met the requirements of the Basel III Capital Rules, including the capital conservation buffer. Compliance with these capital requirements may limit capital-intensive operations and increase operational costs, and we may be limited or prohibited from distributing dividends or repurchasing our stock. This could adversely affect our ability to expand or maintain present business levels, which may adversely affect our businesses,business, results of operations and financial condition. Additional information on the regulatory capital requirements applicable to the Companyus and the Bank is set forth in Item 1. Business — Supervision and Regulation — Regulatory Capital Requirements in this Form 10-K.
The Company’sOur dependence on dividends from the Bank could affect the Company’sour liquidity and ability to pay dividends.
East West is dependent on the Bank for dividends, distributions, and other payments. Our principal source of cash flows, including cash flows to pay dividends to our stockholders and principal and interest on our outstanding debt, is dividends received from the Bank. TheHowever, federal and California law limit the Bank’s ability of the Bank to pay dividends to East West is limited by federal and California law.West. Subject to the Bank meeting or exceeding regulatory capital requirements, regulatory approval is required under federal law if the total of all dividends declared by the Bank in any calendar year would exceed the sum of the Bank’s net income for that year and its retained earnings for the preceding two years. Although we have historically declared cash dividends on our common stock, we are not required to do so and there may be circumstances under which we would reduce or eliminate our common stock dividend in the future. This could adversely affect the market price of our common stock.
Federal law also prohibits the Bank from paying dividends that would be greater than its undivided profits unless the Bank has received prior approval offrom the Federal Reserve and of at least two-thirds of the shareholdersstockholders of each class of stock. Likewise, California law imposes its own limitations on capital distributions by California-charted banks that could require the Bank to obtain the approval of the DFPI prior to making a distribution to the Company.East West. In addition, Federal Reserve guidance sets forth the supervisory expectation that bank holding companies will inform and consult with the Federal Reserve in advance of issuing a dividend that exceeds earnings for the quarter and should not pay dividends in a rolling four quarter period in an amount that exceeds net income, net of distributions, for the period. Further description of regulatory requirements applicable to dividends by us and the Bank is set forth in Item 1. Business — Supervision and Regulation — Dividends and Other Transfers of Funds in this Form 10-K.
The Company isWe are subject to liquidity risk, which could negatively affect the Company’sour funding levels.
Market conditions or other events could negatively affect the level of or cost of funding, which in turn could affect the Company’sour ongoing ability to accommodate liability maturities and deposit withdrawals, meet contractual obligations, or fund asset growth and new business initiatives at a reasonable cost, in a timely manner and without adverse consequences. Although the Company haswe have implemented strategies to maintain sufficient and diverse sources of funding to accommodate planned, as well as unanticipated changes in assets, liabilities, and off-balance sheet commitments under various economic conditions, a substantial, unexpected or prolonged change in the level or cost of liquidity could have a material adverse effect on the Company’s businesses,our business, results of operations, and financial condition. If the cost effectiveness or the availability of supply in the credit markets is reduced for a prolonged period of time, the Company’sour funding needs may require the Companyus to access funding and manage liquidity by other means. These alternatives may include generating client deposits, securitizing or selling loans, and further managing loan growth and investment opportunities. These alternative means of funding may not be available under stressed market conditions or realized in a timely fashion.
Any downgrades in our credit ratings could have a material adverse effect on our liquidity, cost of funding, cash flows, results of operations and financial condition.
Credit rating agencies regularly evaluate us regularly, and their ratings are based on a number ofseveral factors, including our financial strength, capital adequacy, liquidity, asset quality and ability to generate earnings. Some of these factors are not entirely within our control, including conditions affecting the financial services industry as a whole. Several banks were subject to a credit rating downgrade during 2023 following the failures of Silicon Valley Bank, Signature Bank, and First Republic Bank, and in response to economic conditions, and others have been placed on a negative credit outlook by the rating agencies. Severe downgrades in our credit ratings could impact our business and reduce the Company’sour profitability in different ways, including a reduction in the Company’sour access to capital markets, triggering additional collateral or funding obligations which could negatively affect our liquidity. In addition, our counterparties, as well as our clients, rely on our financial strength and stability and evaluate the risks of doing business with us.us on a regular basis. If we experience a decline in our credit rating,ratings, this could result in a decrease in the number of counterparties and clients who may be willing to transact with us. Our borrowing costs may also be affected by various external factors, including market volatility and concerns or perceptions about the financial services industry. There can be no assurance that we can maintain our credit ratings nor that they will not be loweredchanged in the future.
The proportion of our deposit account balances that exceed FDIC insurance limits may expose us to enhanced liquidity risk.
A significant factor in the bank failures in early 2023 appears to have been the proportion of the deposits held by each institution that exceeded applicable FDIC insurance limits, and the withdrawal of such deposits over a short period of time. The ease and speed of the electronic withdrawals may accelerate this process. If a significant portion of our deposits were to be withdrawn within a short period of time such that additional sources of funding would be required to meet withdrawal demands, we may be unable to obtain funding at favorable terms, which may have an adverse effect on our net interest margin. Moreover, obtaining adequate funding to meet our deposit obligations may be more challenging during periods of elevated interest rates and financial industry instability. Our ability to attract depositors during a time of actual or perceived distress or instability in the marketplace may be limited. Further, interest rates paid for borrowing generally exceed the interest rates paid on deposits. This spread may be exacerbated by higher prevailing interest rates. In addition, because our available-for-sale (“AFS”) debt securities lose value when interest rates rise, our ability to cover liquidity needs from sale or pledging of these securities may be negatively impacted during periods of elevated interest rates. Under these circumstances, we may be required to access additional funding from other sources in order to manage our liquidity risk.
Risks Related to Credit Matters
The Company’sOur allowance for credit losses level may not be adequate to cover actual losses.
In accordance with the U.S. GAAP,Generally Accepted Accounting Principles (“GAAP”), we maintainestablish an allowance for credit losses, which includes the allowance for loan losses to provide for loan defaults and nonperformance, and an allowancethe reserve for unfunded credit commitments which, when combined, are referred to as the allowance for credit losses.commitments. Our allowance for loan losses is based on our evaluation of risks associated with our loans held-for-investment portfolio, including historical loss experience, current borrower characteristics, current economic conditions, reasonable and supportable forecasts of future economic conditions, delinquencies, performing status, the size and composition of the loan portfolio, and concentrations within the portfolio. The allowance estimation process requires subjective and complex judgments, including analysis of economic conditions and how these economic conditions might impair the ability of our borrowers to repay their loans. Current economic conditions in the U.S. and in the international markets could further deteriorate, which could result in, among other things, greater than expected deterioration in credit quality of our loan portfolio or in the value of collateral securing these loans. OurDue to the inherent risk associated with accounting estimates, our allowance for credit losses may not be adequate to absorb actual credit losses, and future provisions for credit losses could materially and adversely affect our operating results. The amount of future losses is influenced by changes in economic, operating and other conditions, including changes in interest rates that may be beyond our control, and thesesuch losses may exceed current estimates.
Moreover, we adopted new guidance for estimating credit losses on loans receivable, held-to-maturity debt securities, and unfunded loan commitments effective January 1, 2020.The CECL model significantly changed how entities recognize impairment of many financial assets by requiring immediate recognition of estimated credit losses that occur over the life of the financial asset. This requires reserves over the life of the loan rather than the loss emergence period used in the prior model.The CECL guidance requires the implementation of new modeling to quantify this estimate by using principles of not only relevant historical experience and current conditions, but also reasonable and supportable forecasts of future events and circumstances, thus incorporating a broad range of estimates and assumptions in developing credit loss estimates, which could result in significant changes to both the timing and amount of credit loss expense and allowance.Adoption of, and efforts to implement this guidance has caused and may in the future cause our allowance for credit losses to change, which could have a material adverse effect on our businesses, financial condition, results of operations and future prospects.
Additionally, in order to maximize the collection of loan balances, we sometimes modify loan terms when there is a reasonable chance that an appropriate modification would allow the borrower to continue servicing the debt. If such modifications ultimately are less effective at mitigating loan losses than we expect, we may incur losses in excess of the specific amount of allowance for loan losses associated with a modified loan, and this would result in additional provision for loan losses. In addition, we establish a reserve for losses associated with our unfunded credit commitments. The level of the allowance for unfunded credit commitments is determined by following a methodology similar to that used to establish our allowance for loan losses in our loans held-for-investment portfolio. There can be no assurance that our allowance for unfunded credit commitments will be adequate to provide for the actual losses associated with our unfunded credit commitments. An increase in the allowance for unfunded credit commitments in any period may result in a charge to earnings.earnings and could have a material adverse effect on our business, results of operations, and financial condition.
We may be subject to increased credit risk and higher credit losses to the extent that our loans are concentrated by loan type, industry segment, borrower type, or location of the borrower or collateral.
Our credit risk and credit losses can increase if our loans are concentrated in borrowers affected byengaged in the same or similar activities, industries, or geographies or to borrowers who as a group may be uniquely or disproportionately affected by economic conditions in the markets in which we operate or elsewhere,market conditions, which could result in materially higher credit losses. For example, the Bank has a concentration of real estate loans in California. Potential deterioration in the California commercial or residential real estate marketmarkets or economic conditions could result in additional loan charge-offs and provision for loan losses, which could have a material adverse effect on the Company’sour business, results of operations, and financial condition. If any particular industry or market sector were to experience economic difficulties, loan collectability from customers operating in those industries or sectors may differ from what we expected,deteriorate, which could have a material adverse impact on our business, results of operations, and financial condition.
Risks Related to Our Operations
A failure in or breach of our operational or security systems or infrastructure, or those of third parties,third-party vendors, could disrupt our businesses,business, and adversely impact our results of operations, financial condition, cash flows, and liquidity, as well as cause reputational harm. damage our reputation.
We face risks of loss resulting from, but not limited to, errors relating to transaction processing and technology, breaches of the internal control system and compliance requirement, the risk of fraud by employees or third parties, the execution of unauthorized transactions by employees, cybersecurity incidents, business continuation and disaster recovery. In the event of such operational failures, we could suffer financial loss, face regulatory action, and suffer damage to our reputation.
The potential for operational riskloss exposure exists throughout our organization and fromamong our interactions with third parties. Our operational, and security systems, infrastructure, including our computer systems, network infrastructure, data management and internal processes,infrastructure, as well as those of third parties,third-party vendors, are integral to our performance. In addition, our ongoing operations rely on our employees and third parties, who may, as a result of human error or malfeasance or failure or breach of third-party systems or infrastructure, expose us to risk. We have taken measures to implement backup systems and safeguards to support our operations, but our ability to conduct business may be adversely affected by any significant disruptions to us or to the third parties with whom we interact. In addition, our ability to implement backup systems and other safeguards with respect to third-party systems is more limited than with respect to our own systems. Our financial, accounting, data processing, backup or other operating or security systems and infrastructure may fail to operate properly or may become disabled or damaged as a result ofvendors. Such disruptions could be caused by a number of factors including events that are wholly or partially beyond our control which could adversely affect our ability to process transactions or provide certain services. There could beThese factors include, and are not limited to, electrical, telecommunications, or other major physical infrastructure outages, cybersecurity incidents, disease pandemics, natural disasters such as wildfires, disease pandemics, earthquakes, tornadoes, hurricanes and floods, and events arising from local or larger scale political or social matters, including terrorist acts. We continuouslyFurthermore, we frequently update these systems to support our operations and growth, and this entailsrequiring significant costs and createscreating risks associated with implementing new systems and integrating them with existing ones. Operational
Third parties that facilitate our business activities could also be sources of operational and security risks to us. Our ability to implement backup systems or other safeguards with respect to third-party systems is limited. Furthermore, an attack on or failure of a third-party system may not be revealed to us in a timely manner, which could compromise our ability to respond effectively. Some of these third parties may engage vendors of their own, which introduces the risk that these “fourth parties” could be the source of operational and security failures. In addition, if a third party or fourth party obtains access to the customer account data on our systems, and that party experiences a breach or misappropriates such data, we and our customers could suffer material harm, including heightened risk of fraudulent transactions, losses from fraudulent transactions, increased operational costs to remediate any security breach, and reputational harm.
Our business and many of our customers may have experienced, and may experience again in the future, losses incurred due to fraud or theft related to customers, employees, or third parties. These losses may negatively affect our business, results of operations, financial condition, reputation or prospects. Furthermore, increased use of the internet and telecommunications technologies (including mobile devices) to conduct financial and other business transactions and operations, coupled with the increased sophistication and activities of threat actors, will subject us to increased security risks.
These operational risk exposures, if realized, could adversely impact our results of operations, financial condition, cash flows, and liquidity, and may result in loss of confidence, significant litigation exposure and harm to our reputation. These risks are expected to continue to increase as we expand our interconnectivity with our customers and other third parties.
A cyber-attack, information or security breach, or a technology failure of our systems or of a third party’s systems could adversely affect our ability to conduct business, manage our exposure to risk or expand our businesses. Thisbusiness, and could also result in the misuse of confidential or proprietary information, increase our costs to maintain and update our operational and security systems and infrastructure, and adversely impact our results of operations, financial condition, cash flows and liquidity, as well as result incause reputational harm.
The Company offers various internet-based services to its clients, including online banking services. The secure transmission of confidential information over the internet is essential in maintaining our clients’ confidence in the Company’s online services. In addition, our
Our business is highly dependent on the security and efficacy of our infrastructure, computer and data management systems, as well as those of third parties with whomwhich we interact. Cyber security risks, including ransomware and malware attacks, for financial institutions have significantly increased in recent years in part because of the proliferation of new technologies, the use of the internet and telecommunication technologies to conduct financial transactions, especially as morethe significant increased use of remote workstations by employees are working remotely,in recent years, and the increased sophistication and activities of organized crime, hackers, terrorists, nation-states, and other external parties.threat actors. Our business relyrelies on the secure processing, transmission, storage and retrieval of confidential, proprietary, and other information in our computer email and data management systems and networks, and in the computer and data management systems and networksincluding those of third parties.our third-party vendors. We rely on digital technologies, computer, database and email systems, software and networks; notwithstanding our defensive systems and processes that are designed to prevent security breaches and periodically test the Company’s security. The Company employsemploy a combination of preventative and detective controls such as firewalls, intrusion detection systems, data loss prevention, anti-malware, endpoint detection and response solutions to safeguard against cyber-attacks. There iscybersecurity incidents. To date, we have not experienced any known cybersecurity incidents resulting in a material impact on our business, financial condition, or operating results. However, we can provide no assurance that all of our security measures will be effective, especiallyeffective. The industry has seen an increase in ransomware attacks, data breaches, social engineering, phishing attacks, and fraud and other scams that have placed the Bank, employees, our customers, and third-party vendors at heightened risk levels. These risks may increase in the future as we continue to increase our digital product offerings and expand our internal usage of cloud-based products and applications. In addition, our customers often use their own devices to make payments and manage their accounts, and are subject to cyberattacks including data breaches, social engineering, phishing attacks, fraud and other scams, that threaten the safety and security of their banking transactions with us. We have limited ability to assure the safety and security of our customers’ transactions with us to the extent they are using their own devices or are a victim of cyberattacks, fraud or other scams by threat from cyber-attacks is continuous and severe, attacks are becoming more sophisticated and increasing in volume, and attackers respond rapidly to changes in defensive measures. actors.
Failure to mitigate breaches of security, or to comply with frequent imposition of increasingly demanding new and changing industry standards and regulatory requirements, could result in violation of applicable privacy laws, reputational damage, regulatory fines, litigation exposure, increaseincreased security compliance costs, adversely affect the Company’sour ability to offer and grow the online services, and could have an adverse effect on the Company’s businesses,our business, results of operations and financial condition. We have not experienced any known attacks on our information technology systems that have resulted in any material system failure, incident or security breach to date.
Failure to keep pace with technological change could adversely affect the Company’s businesses. The Companyour business. We may face risks associated with the ability to utilizeutilization of information technology systems to support our operations effectively.
The financial services industry is continuously undergoing rapid technological change with frequent introductions of new technology-driven products and services.services, including financial technology and non-banking entities. The effective use of technology increases efficiency and enables financial institutions to better serve customers and to reduce costs. The Company’sOur future success depends, in part, upon itsour ability to address the needs of itsour customers by using technology to provide products and services that will satisfy customer demands, as well as to create additional efficiencies in the Company’sour operations. Many of the Company’sour competitors have substantially greater resources to invest in technological improvements. The Companysolutions. We may not be able to effectively implement new technology-driven products and services or be successful in marketing these products and services to itsour customers. Failure to successfully keep pace with technological change affecting the financial services industry could have a material adverse impact on the Company’s businessesour business and, in turn, the Company’sour results of operations and financial condition. In addition, if we do not implement systems effectively or if our outsourcing business partners do not perform their functions properly, there could be an adverse effect on us. There can be no assurance that we will be able to effectively maintain or improve our systems and processes, or utilize outsourced talent, to meet our business needs efficiently.successfully. Any such failure could adversely affect our businesses,business, results of operations, financial condition and reputation.
We could face material legal and reputational harm if we fail to safeguard personal information.
The
We are subject to complex and evolving laws and regulations, both inside and outside the U.S., governing the privacy and protection of personal information. Individuals whose personal information may be protected by law can include our customers (and in some cases our customers’ customers), prospective customers, job applicants, employees, and the employees of our suppliers, and third parties. Complying with laws and regulations applicable to our collection, use, transfer, and storage of personal information can increase operating costs, impact the development and marketing of new products or services, and reduce operational efficiency. Any mishandling or misuse of personal information by us or a third party affiliated with us could expose us to litigation or regulatory fines, penalties or other sanctions.
We may be impacted by the actions, and soundness or creditworthiness of other financial institutions, could affectwhich can cause disruption within the Company.industry and increase expenses.
Financial services institutions are interrelated as a result of trading, clearing, counterparty, or other relationships. The Company executesWe execute transactions with various counterparties in the financial industry, including broker-dealers, commercial banks, and investment banks. Defaults byor failures of financial services institutions and uncertaintyinstability in the financial services industry in general couldcan lead to market-wide liquidity problems, and may expose the Company to credit risk. Further, the Company’sincreased credit risk may increase whenand withdrawals of uninsured deposits. The failures of Silicon Valley Bank, Signature Bank, and First Republic Bank in 2023 resulted in significant disruption in the underlying collateral held cannot be realized or is liquidated atfinancial services industry and negative media attention, which has also adversely impacted the volatility and market prices not sufficient to recover the full amount of the loan or derivative exposure duesecurities of financial institutions and resulted in outflows of deposits for us and many other financial institutions. These events have adversely impacted and could continue to the Company. Any such losses could materially and adversely affect the Company’s businesses,our business, results of operations, and financial condition.condition, as well as the market price and volatility of our common stock.
Bank failures may increase the risk of a recession or lead to regulatory changes and initiatives, such as enhanced capital, liquidity, or risk management requirements, that could adversely impact the Company. Changes to laws or regulations, or the impositions of additional restrictions through supervisory or enforcement activities, could have a material impact on our business. Regulatory changes could also adversely impact our ability to access funding, increase the cost of funding, limit our access to capital markets, and negatively impact our overall financial condition. The Company’srecent bank failures also have resulted in a special assessment by the FDIC to replenish the DIF.
Our controls and procedures could fail or be circumvented.
Management regularly reviews and updates the Company’sour internal controls, reportingdisclosure controls and procedures, and corporate governance and ERM policies and procedures. Any system of controls, however well designed and operated, is based in part on certain assumptions and can provide only reasonable, but not absolute, assurances of the effectiveness of these systems and controls, and that the objectives of these controls have been met. Any failure or circumvention of the Company’sour controls and procedures, and any failure to comply with regulations or supervisory expectations related to controls and procedures could adversely affect the Company’s businesses,our business, results of operations, and financial condition.
Our enterprise risk management program may not be effective at mitigating the risks to which we are subject, based upon our size, scope, and complexity.
The Company is
We have established processes and procedures intended to identify, measure, monitor, report, and analyze the types of risk to which we are subject, including capital, market, liquidity, credit, operational, compliance, legal, strategic, technology and reputational risks. Although we seek to manage our exposure to such risks, and employ a broad and diverse set of risk monitoring and mitigation techniques in the process, those techniques are inherently limited because they cannot anticipate the existence or development of risks that are currently unknown or unanticipated. Further, any system of control and any system to reduce risk exposure, however well designed and operated, can provide only reasonable, not absolute, assurance that the objectives of the system are met. Further, in some cases we use analytical or forecasting models in our management of risks. If the models are inadequate, or are subject to ineffective governance, our risk management program may also prove ineffective. Actions taken to mitigate identified risks may prove less effective than anticipated. If our risk management program proves ineffective, we could suffer unexpected losses and reputational damage.
We are dependent on key personnel and the loss of one or more of those key personnel may materially and adversely affect the Company’sour prospects.
Competition for qualified personnel in the banking industry is intense and there isare a limited number of qualified persons with knowledge of, and experience in, the regional banking industry, especially in the West Coast market.markets, and in international banking operations, especially in Asia. The process of recruiting personnel with the combination of skills and attributes required to carry out the Company’sour strategies is often lengthy. The Company’sOur success depends, to a significant degree, upon itson our ability to attract and retain qualified management, loan origination, finance, administrative, marketing, and technical personnel, as well as upon the continued contributions of its management and personnel.those individuals. In particular, the Company’sour success has been and continues to be highly dependent upon the abilities of certain key executives. Accordingly, we believe that our future success is dependent upon the development and, when needed, implementation of adequate succession plans. Although both the Board of Directors and management monitor our succession planning for our senior management team, unexpected departures of key personnel or disruptions in future leadership transitions could negatively impact our business and prospects.
We face strong competition in the financial services industry, and we could lose business or suffer margin declines as a result.
The Company operates
We operate in a highly competitive environment. The Company conducts the majority of its operations in California. Our competitors include, but are not limited to, commercial banks, savings and loan associations, finance companies, brokerage firms, insurance companies, credit unions, mortgage banks, nonbank financial institutions, and other regional, national, and global financial institutions. Some of theour major competitors include multinational financial service companies whose greater resources may afford them a marketplace advantage by enabling them to maintain numerous locations and mount extensive promotional and advertising campaigns. Areas of competition include interest rates on loans and deposits, customer services, and a range of price and quality of products and services, including new technology-driven products and services. Ongoing or increased competition may put pressure on the pricing for our products and services or may cause us to lose market share, particularly with respect to traditional banking products such as loans and deposits. Failure to attract and retain banking customers may adversely impact the Company’sour loan and deposit growth.growth and in turn, our revenues.
The Company hasWe have engaged in and may continue to engage in further expansion through acquisitions, which could negatively affect the Company’s businessescause disruption to our business and earnings.may dilute existing stockholders’ interests.
There are risks associated with expanding through acquisitions. These risks include, among others, incorrectly assessing the asset quality of a bank acquired in a particular transaction, encounteringincurring greater than anticipated costs in integrating acquired businesses,business, failing to retain customers or employees, and being unablethe inability to profitably deploy assets acquired in theor realize synergies from a transaction. Additional country or region-specific risks are associated with transactions outside the U.S., including in Greater China. To the extent the Company issueswe issue capital stock in connection with additional transactions, these transactions and related stock issuances may have a dilutive effect on earnings per share (“EPS”) and share ownership.
New products and services may subject us to additional risks.
From time to time, we may seek to implement new business arrangements or new lines of business or offer new products and services within existing lines of business. There are substantial risks and uncertainties associated with these efforts, particularly in instances where the markets are not fully developed. In developing and marketing new business arrangements, lines of business and/or new products and services, we may invest significant time and resources. Initial timetables for the introduction and development of new business initiatives, new lines of business and/or new products or services may not be achieved, and price and profitability targets may not prove feasible, which could in turn have a material negative effect on our operating results. New business arrangements, new lines of business and/or new products or services also could subject us to additional regulatory requirements, increased scrutiny by our regulators and other legal risks. For example, we and other regional banks are increasingly partnering with fintech and other providers to distribute or market our products and services. Bank regulators have, and may in the future, hold banks responsible for the activities of these fintech companies, including in respect of BSA/AML and consumer compliance matters, or may take the view that these relationships present safety and soundness issues.
Our investments in certain tax-advantaged projects may not generate returns as anticipated and may have an adverse impact on our results of operations.
We invest in certain tax-advantaged investments that support qualified affordable housing projects, community development, and renewable energy resources. Our investments in these projects are designed to generate a return in part through the realization of federal and state income tax credits, and other tax benefits, over specified time periods. We are subject to the risk that previously recorded tax credits, which remain subject to recapture by taxing authorities based on compliance features required to be met at the project level, may fail to meet certain government compliance requirements and may not be able to be realized. The risk of not being able to realize, or of subsequently incurring a recapture of, the tax credits and other tax benefits depends on various factors, some of which are outside of our control, including changes in the applicable tax code, as well as the continued economic viability of the project and project operator. The possible inability to realize these tax credits and other tax benefits would have a negative impact on our financial results.
Risks Related to Regulatory, Compliance and Legal Matters
Changes in current and future legislation and regulation may require the Companyus to change itsour business practices, increase costs, limit the Company’sour ability to make investments and generate revenue, or otherwise adversely affect business operations and/or competitiveness.
EWBC is
We are subject to extensive regulation under federal and state laws, as well as supervision and examination by the DFPI, FDIC, Federal Reserve, SEC, CFPB in the U.S. and foreign regulators and other government agencies and self-regulatory organizations.authorities. We are also subject to enforcement oversight by the U.S. Department of Justice and state attorneys general. Our overseas operationsIn addition, we face certain legal, reputational, and financial risks as a result of serving customers in Greater Chinanew or evolving industries that are subject to extensive regulation under the laws of those jurisdictions as well as supervisionchanging, and examinations by financial regulators for those jurisdictions. Moreover, regulation of the financial services industry continues to undergo major changes.at times conflicting laws. Changes to statutes, regulations or regulatory policies, including changes in interpretation or implementation of statutes, regulations, or policies could affect the manner in which EWBC conductswe conduct business. In addition, suchSuch changes could also subject us to additional costs and may limit the types of financial services and products we offer, and the investments we make.
Given that banks operate in an extensively regulated environment under federal and state law, good standing with our regulators is of fundamental importance to the continuation and growth of our businesses.business. In the performance of their supervisory and enforcement duties, the U.S. federal and state regulators, and non-U.S. regulators, have significant discretion and power to initiate enforcement actions for violations of laws and regulations, and unsafe and unsound practices. Further, regulators and bank supervisors continue to exercise qualitative supervision of our industry and specific business operations and related matters. Violations of laws and regulations or deemed deficiencies in risk management or other qualitative practices also may be incorporated into the Company’sour confidential bank supervisory ratings. A downgrade in these ratings, or other regulatory settlements, enforcement actions or supervisory criticisms, could impose additional risk management and other regulatory oversight requirements, limit the Company’sour ability to pursue acquisitions or conduct other expansionary activities, and require new or additional regulatory approvals before engaging in certain other business activities, as well asand result in civil monetary penalties, other sanctions, and damage to our reputation, all of which could adversely affect our business, financial condition, results of operations and future prospects.
Failure to comply with laws, regulations, or policies could result in civil or criminal sanctions by U.S. federal and state, and non-U.S. agencies, the loss of FDIC insurance, the revocation of our banking charter, civil or criminal monetary penalties, and/or reputational damage, which could have a material adverse impact on the Company’s businesses,our business, results of operations, and financial condition. We continue to adjust to our businessesbusiness and operations, capital, policies, procedures, and controls to comply with these laws and regulations, final rulemaking, supervisory requirements and interpretations from the regulatory authorities. See Item 1. Business — Supervision and Regulationin this Form 10-K for more information about the regulations to which we are subject.
Changes to fiscal policies and tax legislation may adversely affect our business.
From time to time, the U.S. government may introduce new fiscal policies and tax laws or make substantial changes to existing tax legislation. These changes could have a material impact on our business and our customers’ business, results of operations, and financial condition. Our positions or our actions taken prior to such changes may be compromised by such changes. In addition, our actions taken in response to, or in reliance upon, such changes in the tax laws may impact our tax position in a manner that may result in an adverse financial condition. We facealso provide for current and deferred taxes in our financial statements, based on our results of operations and financial condition. We may take tax return filing positions for which the final determination of tax is uncertain, and our income tax expense could be increased if a federal, state, or local authority were to assess additional taxes that have not been provided for in our consolidated financial statements. There can be no assurance that we will achieve our anticipated effective tax rate. The U.S. government could further introduce new tax legislation or amend current tax laws in a manner that would adversely affect us. In addition, continued political disagreements over the federal budget and the risk of noncompliancea full or partial government shutdown could create uncertainty about the U.S. economy, ultimately having an adverse effect on our business, results of operations, and enforcement actionfinancial condition.
Complying with the Bank Secrecy Act and other anti-money laundering and sanctions statutes and regulations. regulations can increase our compliance costs and risks.
The BSA, the PATRIOT Act, and other laws and regulations require us and other financial institutions among other duties, to institute and maintain an effective AML program and file suspicious activity reports and currency transaction reports when appropriate. We are also requiredmay provide banking services to customers considered to be higher risk customers, which subjects us to greater enforcement risk under the BSA and requires us to ensure our third partythird-party vendors adhere to the BSA laws and related regulations. The Financial Crimes Enforcement Network is authorized to implement, administer, and enforce compliance with the BSA and associated regulations. It has the authority tomay impose significant civil moneymonetary penalties for violations of those requirements and has been engaging in coordinated enforcement efforts with the federal and state banking regulators, as well as the U.S. Department of Justice, Drug Enforcement Administration, and the Internal Revenue Service (“IRS”). Further, we may provide banking services to customers considered to be higher risk customers, which subjects us to greater enforcement risk under the BSA.Service.
We are also required to comply with the U.S. economic and trade sanctions administered by the OFAC regarding, among other things, the prohibition of transacting business with, and the need to freeze assets of, certain persons and organizations identified as a threat to the national security, foreign policy, or economy of the U.S. A violation of any AML or OFAC-related law or regulation could subject us to significant civil and criminal penalties as well as regulatory enforcement actions, which may include restrictions on our ability to pay dividends and the necessity to obtain regulatory approvals to proceed with certain aspects of our business plan, including any acquisition plans. Any of these violations could have a material adverse effect on our businesses,business, results of operations, financial condition, reputation, and future prospects.
We are subject to significant financial and reputational risk arising from lawsuits and other legal proceedings.
We operate in a heavily regulated industry and face significant risk from lawsuits and claimsproceedings brought by consumers,customers, borrowers, bank regulators and counterparties. These actions include claims for monetary damages, penalties, and fines, as well asand demands for injunctive relief. If these lawsuits or claims,proceedings, whether founded or unfounded, are not resolved in a favorable manner to us, they could lead to significant financial obligations for the Company,us, as well as restrictions or changes to how we conduct our businesses.business. Although we establish accruals for legal matters when and as required by U.S. GAAP and certain expenses and liabilities in connection with such matters may or may not be covered by insurance, the amount of loss ultimately incurred in relation to those matters may be substantially higher than the amounts accrued and/or insured. As a participant in the financial services industry, we expect to continue to incur significant risks arising from litigation and government scrutiny related to our businesses and operations. Substantial legal liability and government scrutiny could adversely affect our business, results of operations, and financial condition. In addition, we may suffer significant reputational harm as a result of lawsuits and claims,proceedings, adversely impacting our ability to attract and retain customers and investors. Moreover, it may be difficult to predict the outcome of certain legal proceedings, which may present additional uncertainty to our business prospects.
Risks Related to Accounting and Tax Matters
Changes in accounting standards or changes in how the accounting standards are interpreted or applied could materially impact the Company’s financial statements. The preparation of the Company’s financial statements is based on accounting standards established by the FASB and the SEC. From time to time, these accounting standards may change and such changes may have a material impact on the Company’s financial statements. In addition, the FASB, SEC, banking regulators and the Company’s independent registered public accounting firm may amend or reverse their previous interpretations or positions on how various standards should be applied. These changes may be difficult to predict and could impact how we prepare and report the Company’s financial statements. In some cases, the Company could be required to adopt a new or revised standard retroactively, potentially resulting in restatements to a prior period’s financial statements.
The Company’s consolidated financial statements are based in part on assumptions and estimates which, if incorrect, could cause unexpected losses in the future. Pursuant to GAAP, we are required to use certain assumptions and estimates in preparing our financial statements, including in determining credit loss reserves, reserves related to litigation and the fair value of certain assets and liabilities, among other items. Accounting policies related to these estimates and assumptions are critical because they require management to make subjective and complex judgments about matters that are inherently uncertain. If these estimates and assumptions are incorrect, we may be required to restate prior-period financial statements. For a description of these policies, refer to Note 1 — Summary of Significant Accounting Policies to the Consolidated Financial Statements in this Form 10-K.
Changes to fiscal policies and tax legislation may adversely affect our business. From time to time, the U.S. government may introduce new fiscal policies and tax laws or make substantial changes to existing tax legislation. These changes could have a material impact on the Company’s businesses, results of operations and financial condition. The Company’s positions or its actions taken prior to such changes, may be compromised by such changes. In addition, the Company’s actions taken in response to, or in reliance upon, such changes in the tax laws may impact our tax position in a manner that may result in adverse financial conditions. The Company also provides for current and deferred taxes in our financial statements, based on our results of operations and financial condition. We may take tax return filing positions for which the final determination of tax is uncertain and our income tax expense could be increased if a federal, state, or local authority were to assess additional taxes that have not been provided for in our consolidated financial statements. There can be no assurance that we will achieve our anticipated effective tax rate. The CARES Act included a number of tax relief provisions for eligible individuals and businesses. It is possible that the U.S. government could further introduce new tax legislation or amend current tax laws that would adversely affect the Company. In addition, the President’s proposed budget, negotiations with Congress over the details of the budget, and the terms of the approved budget could create uncertainty about the U.S. economy, ultimately having an adverse effect on our business.
The Company’s investments in certain tax-advantaged projects may not generate returns as anticipated and may have an adverse impact on the Company’s results of operations. The Company invests in certain tax-advantaged investments that support qualified affordable housing projects, community development and renewable energy resources. The Company’s investments in these projects are designed to generate a return primarily through the realization of federal and state income tax credits, and other tax benefits, over specified time periods. Due diligence review is performed both prior to the initial investment and on an ongoing basis, however, there may be assessments that we failed or were unable to discover or identify in the course of performing due diligence review. The Company is subject to the risk that previously recorded tax credits, which remain subject to recapture by taxing authorities based on compliance features required to be met at the project level, may fail to meet certain government compliance requirements and may not be able to be realized. The possible inability to realize these tax credits and other tax benefits may have a negative impact on the Company’s financial results. The risk of not being able to realize the tax credits and other tax benefits depends on many factors outside the Company’s control, including changes in the applicable tax code and the ability of the projects to be completed.
General Risk Factors
Changes in accounting standards or changes in how the accounting standards are interpreted or applied could materially impact our financial statements.
The preparation of our financial statements is based on accounting standards established by the FASB and the SEC. From time to time, these accounting standards may change, and such changes may have a material impact on our financial statements. In addition, the FASB, SEC, banking regulators, and our independent registered public accounting firm may amend or reverse their previous interpretations or positions on how various standards should be applied. These changes may be difficult to predict and could impact how we prepare and report our financial statements. In some cases, we could be required to adopt a new or revised standard retrospectively, potentially resulting in restatements to a prior period’s financial statements.
Our consolidated financial statements are based in part on assumptions and estimates which, if incorrect, could cause unexpected losses in the future.
Pursuant to U.S. GAAP, we are required to use certain assumptions and estimates in preparing our financial statements, including in determining the allowance for credit loss, accrued liability for litigation, and the fair value of certain financial assets and liabilities, among other items. Our assumptions and estimates may be inaccurate or subjective, particularly in times of market stress or under unforeseen circumstances. Inaccurate assumptions or inadequate design of our forecasting models could result in incorrect or misleading information, and in turn could lead to inappropriate business decisions, such as an inadequate reserve for credit losses, and adversely impact our business, results of operations, and financial condition. Our significant accounting policies and use of estimates are fundamental to understanding our results of operations and financial condition. Some accounting policies, by their nature, are inherently subject to estimation techniques, valuation assumptions and other subjective assessments. In addition, some significant accounting policies require significant judgments in applying complex accounting principles to individual transactions and determining the most appropriate treatment. We have procedures and processes in place to facilitate making these judgments. For a description of these policies, refer to Note 1 — Summary of Significant Accounting Policies to the consolidated financial statements and Item 7. MD&A – Critical Accounting Estimates in this Form 10-K.
Impairment of goodwill could result in a charge against earnings and thus a reduction in stockholders’ equity.
We test goodwill for impairment on an annual basis, or more frequently, if necessary. A significant decline in our expected future cash flows, a material change in interest rates, a significant adverse change in the business climate, slower growth rates, or a significant or sustained decline in the price of our common stock may necessitate taking future charges related to the impairment of goodwill. If we determine that a future write-down of goodwill is necessary, the amount of such an impairment charge could be significant and could adversely affect earnings as well as capital.
Anti-takeover provisions could negatively impact the Company’sour stockholders.
Provisions of Delaware and California law and of the Company’sour certificate of incorporation, as amended, and bylaws, as amended and restated, could make it more difficult for a third party to acquire control of the Companyus or could have the effect of discouraging a third party from attempting to acquire control of the Company.us. For example, the Company’sour certificate of incorporation, as amended, requires the approval of the holders of at least two-thirds of the outstanding shares of voting stock to approve certain business combinations. The Company isWe are also subject to Section 203 of the Delaware General Corporation Law, which would make it more difficult for another party to acquire the Companyus without the approval of the Board of Directors. Additionally, the Company’sour certificate of incorporation, as amended, authorizes the Board of Directors to issue preferred stock which could be issued as a defensive measure in response to a takeover proposal.
Further,Additionally, prior approval of the Federal Reserve and the DFPI is required for any person to acquire control of us, and control for these purposes may be presumed to exist when a person owns 10% or more of our outstanding common stock. Federal Reserve approval is also required for a bank holding company to acquire more than 5% of our outstanding common stock. These and other provisions could make it more difficult for a third party to acquire the Company,us, even if an acquisition might be in the best interest of the stockholders.
Managing reputational risk is important to attracting and maintaining customers, investors, and employees.
Threats to the Company’sour reputation can come from many sources, including unethical practices, employee misconduct, failure to deliver minimum standards of service or quality, compliance deficiencies, and questionable or fraudulent activities of the Company’s customers. The Company hasour customers or other threat actors. We have policies and procedures, including our Code of Conduct, in place to protect its reputationgovern the personal conduct, action and promote ethical conduct, butwork relationship of our employees with customers, fellow employees, competitors, governmental officials, and suppliers under both official and unofficial situations, in which employees may reasonably be perceived by others as acting as representatives of us. In addition, employees who fail to comply with the Code of Conduct may be subject to disciplinary action, termination of employment, and/or prosecution. However, these policies and procedures may not be fully effective. Negative publicity regarding the Company’s businesses,our business, employees or customers, with or without merit, may result in the loss of customers, investors and employees, costly litigation, a decline in revenues and increased governmental regulation.scrutiny.
Increasing scrutiny and evolving expectations relating to environmental, social and governance considerations may expose us to additional costs, reputational harm, and other adverse effects on our business.
Regulators, investors, employees, customers and other stakeholders are increasingly focused on environmental, social and governance (“ESG”) practices relating to business, including climate change, human rights, health and safety, diversity, and labor conditions. A failure to comply with regulatory requirements, or to meet evolving investor or stakeholder expectations and standards, could result in legal or regulatory proceedings and negatively impact our business, reputation, results of operations, financial conditions, and stock price. California has passed legislation that would impact the amount of required reporting of ESG practices, refer to Item 1. Business — Supervision and Regulation in this Form 10-K for more information. The SEC has proposed climate disclosure rules to require public issuers to include enhanced disclosure regarding corporate climate-related information in their periodic reports and registration statements. The enacted and proposed new government regulations could also cause new or more stringent forms of ESG oversight and expanding mandatory and voluntary reporting, diligence, and disclosures.
The price of the Company’sour common stock may be volatile or may decline.
The price of the Company’sour common stock may fluctuate in response to a number ofvarious factors, some of which are outside the Company’sour control. These factors include among other things:the risk factors discussed herein, as well as:
•actual or anticipated quarterly fluctuations in the Company’sour results of operations and financial condition;
•changes in revenue or earnings estimates or publication of research reports and recommendations by financial analysts and rating agencies;
•speculation or changes in perception in the press or investment community;
•strategic actions and announcements by the Companyus or itsour competitors, such as acquisitions or restructurings;
•actions by institutional stockholders;
•addition or departure of key personnel;
•fluctuations in the stock price and operating results of the Company’sour competitors;
•general market conditions and, in particular, developments related to market conditions in the financial services industry;
•anticipated, proposed or adopted regulatory changes or developments;
•cyclical fluctuations;
•trading volume of the Company’sour common stock; and
•anticipated or pending investigations, proceedings or litigation that involve or affect the Company.us.
Industry factors, general economic and political conditions and events, such as cyber or terrorist attacks, economic downturn or recessions, interest rate changes, credit default trends, currency fluctuations, changes to fiscal, monetary or trade policies, or public health issues could also cause our stock price to decline regardless of our operating results. A significant decline in the Company’sour stock price could result in substantial losses for stockholders.
If the Company’s goodwill was determined to be impaired, it would result in a charge against earnings and thus a reduction in stockholders’ equity. The Company tests goodwill for impairment on an annual basis, or more frequently, if necessary. A significant decline in our expected future cash flows, a material change in interest rates, a significant adverse change in the business climate, slower growth rates, or a significant or sustained decline in the price of the Company’s common stock may necessitate taking charges in the future related to the impairment of goodwill. If the Company determines that a future write-down of goodwill is necessary, the amount of such impairment charge could be significant and could adversely affect earnings as well as capital.
ITEM 1B. UNRESOLVED STAFF COMMENTS
None.
ITEM 1C. CYBERSECURITY
The Company maintains an Information Security Program to support the management of cybersecurity risk as an integral component of the Company’s ERM framework. The Information Security Program encompasses the Company’s cybersecurity policies and practices, which focus on prevention, detection, mitigation and recovery from cybersecurity incidents. In addition, as part of the Information Security Program, the Company has a Security Incident Response Policy and Plan to enable a coordinated response to protect the integrity, security and resiliency of the Company’s information systems, to mitigate the risk of cybersecurity incidents and to escalate information regarding certain cybersecurity incidents to the appropriate management personnel and Board members in a timely fashion. The Information Security Program follows established industry frameworks, including the National Institute of Standards and Technology Cybersecurity Framework, and standards set by the relevant legal and regulatory authorities.
The Board’s Risk Oversight Committee has primary oversight responsibility for management’s efforts to mitigate cybersecurity risk and respond to cybersecurity incidents. The Risk Oversight Committee receives quarterly cybersecurity reports, including any reportable incidents, and reviews and approves the Information Security Program at least annually or whenever significant changes to the program are made. The full Board of Directors also receives quarterly cybersecurity reports. These updates include information regarding management’s ongoing efforts to manage cybersecurity risk and the steps management has taken to address and mitigate the evolving cybersecurity threat environment. The Risk Oversight Committee members are independent directors and have expertise in areas relevant to their responsibilities over cybersecurity, including senior leadership experience in financial services and information technology.
At the management level, the Company has designated the Chief Risk Officer as the Chief Privacy Officer, who has oversight for managing cybersecurity risk. The Chief Privacy Officer coordinates with the Chief Information Security Officer to ensure the Company’s cybersecurity risk profile is managed in a manner consistent with its risk appetite. The Chief Privacy Officer also provides periodic reports to the Board’s Risk Oversight Committee, outlining the overall status of the Company’s Information Security Program and its compliance with regulatory guidelines, and coordinating and reporting on incident response. The Chief Information Security Officer is responsible for the day-to-day management of the Information Security Program and Security Incident Response Policy and Plan. The Chief Privacy Officer has held various leadership roles at the bank, including over 13 years previously serving as the Company’s Chief Financial Officer. The Chief Information Security Officer has over 20 years of work experience in cybersecurity at financial institutions.
The Information Security Program is supported by three lines of defense. The Information Security Team is the first line of defense under the Chief Information Security Officer and provides the day-to-day cybersecurity operations including identification and reporting of internal and external threats, access control, data security, protective controls, detection of malicious or unauthorized activity, incident response, recovery planning, performing vulnerability and third party information security assessments, and employee awareness and training programs. In addition, the Information Security Team works in coordination with the individual business lines that have direct and primary responsibility and accountability for identifying, controlling and monitoring cybersecurity risk embedded in their business activities. The Information Security Team uses reputable industry service providers for security operations, monitoring, investigation and incident response. The internal Information Risk Management team conducts periodic assessments in collaboration with consulting services with expertise in the cybersecurity domains. Furthermore, the Third Party Risk Management Team, in conjunction with the Information Security Team, oversees, identifies, monitors, investigates and addresses material risks from cybersecurity threats associated with the Company’s use of third-party service providers. As the second line of defense, the ERM Team under the Chief Privacy Officer independently monitors cybersecurity risk across the Company, as well as the effectiveness of the Information Security Program, third party vendors’ vulnerability and penetration tests against the Company’s network. The ERM Team reports the status of the annual assessment of the effectiveness of the Information Security Program to the Chief Privacy Officer, who reports to the Board’s Risk Oversight Committee. When applicable, the Company obtains Statement on Standards for Attestation Engagement 18 reports or equivalent reports for vendor products and services hosted by third parties. Internal Audit serves as the third line of defense and provides additional independent assurance and evaluates the effectiveness of cybersecurity risk management.
In addition, the Company uses several internal training methods, through annual mandatory courses on security and privacy for all employees, as well as multiple simulated phishing attacks and regularly providing information security awareness materials throughout the year. The Company also maintains cybersecurity insurance. To date, the Company has not experienced cybersecurity incidents that have materially affected its business strategy, results of operations or financial condition. For additional information regarding cybersecurity threats, please refer to Item 1, Business – Supervision and Regulation – Privacy and Cybersecurity and Item 1A, Risk Factors – Risks Related to Our Operations.
ITEM 2. PROPERTIES
East West’s corporate headquarters is located at 135 North Los Robles Avenue, Pasadena, California, an eight-story office building, thatof which it owns.owns 50%. The Company operates in 11621 owned and 90 leased locations in the U.S. and eight, as well as 11 leased locations in Greater China.Asia. In the U.S., the Bank’s corporate headquarters and main administrative offices are located in California, and its branches and offices are located in California, Texas, New York, Washington, Georgia, Massachusetts, Illinois and Nevada. In Greater China,Asia, East West’s presence includes full service branches in Hong Kong, Shanghai, Shantou and Shenzhen, and representative offices in Beijing, Chongqing, Guangzhou, Xiamen, and Xiamen.
As of December 31, 2020, the Bank owns approximately 154,000 square feet of property at 19 U.S. locationsSingapore, and leases approximately 783,000 square feet in the remaining U.S. locations. Expiration dates for these leases range from 2021 to 2036, exclusive of renewal options. The Bank leases all of its branches andadministrative support offices in Greater China, totaling approximately 58,000 square feet. Expiration dates for these leases range from 2021 to 2026.Beijing and Shanghai. All properties occupied by the Bank are used across all business segments and for corporate purposes.
On an ongoing basis, theThe Company believes that its facilities are adequate and suitable for its business needs. It evaluates its current and projected space requirementsneeds and from time to time, it may determine that certain premises or facilities are no longer necessary for its operations. The Company believes that, if necessary, it could secure alternative properties on similar terms without adversely affecting its operations.
ITEM 3. LEGAL PROCEEDINGS
See Note 12 — Commitments Contingencies and Related Party TransactionsContingencies — Litigation to the Consolidated Financial Statements in this Form 10-K, which is incorporated herein by reference.
ITEM 4. MINE SAFETY DISCLOSURES
Not applicable.
PART II
ITEM 5. MARKET FOR REGISTRANT’S COMMON EQUITY, RELATED STOCKHOLDER MATTERS AND ISSUER PURCHASES OF EQUITY SECURITIES
Market Information, Holders of Common Stock and Dividends
The Company’s common stock is traded on the Nasdaq Global Select Market under the symbol “EWBC.”“EWBC”. As of January 31, 2021,2024, the Company had 712702 stockholders of record holding 141,565,473 shares of the Company’s common stock, not including beneficial owners whose shares are held in record names of brokers or other nominees.
Holders of the Company’s common stock are entitled to receive cash dividends when declared by the Company’s Board of Directors out of legally available funds. The Board of Directors presently intends to continue the policy of paying quarterly cash dividends, however, there can be no assurance as to future dividends because they are dependent on the Company’s future earnings, capital requirements and financial condition.
Securities Authorized for Issuance under Equity Compensation Plans
For information regarding securities authorized for issuance under the Company’s equity compensation plans, see Note 13 — Stock Compensation Plans to the Consolidated Financial Statements and Item 12. Security Ownership of Certain Beneficial Owners and Management and Related Stockholder Matters presented elsewhere in this Form 10-K, which are incorporated herein by reference.
Five-Year Stock Performance
The following graph and table compare the Company’s cumulative total return on its common stock with the cumulative total return of the Standard & Poor’s (“S&P”) 500 Index and the Keefe, Bruyette and WoodsKBW Nasdaq Regional BankingBank Index (“KRX”BKX”) over the five-year period through December 31, 2020. 2023. The cumulative total shareholder return assumes the investment of $100 in the Company’s common stock and in each index on December 31, 2018 and the reinvestment of common stock dividends.
The S&P 500 Index is utilized as a benchmark against performance and is a commonly referenced U.S. equity benchmark consisting of leading companies from different economic sectors. The KRXBKX is useddesigned to align EWBC with those companies of a relatively similar size. This index seeks to reflecttrack the performance of publicly tradedthe leading banks and thrifts that are publicly-traded in the U.S. companies that do business as, and comprises 24 banking stocks representing the large U.S. national money centers, regional banks or thrifts, and is composed of 50 companies. thrift institutions.
| | | | | | | | | | | | | | | | | | | | | | | | | | | | | | | | | | | | | | |
|
| | December 31, |
| Index | | 2018 | | 2019 | | 2020 | | 2021 | | 2022 | | 2023 |
| East West Bancorp, Inc. | | $100.00 | | $114.36 | | $122.62 | | $193.73 | | $165.75 | | $186.84 |
| BKX | | $100.00 | | $136.13 | | $122.08 | | $168.88 | | $132.75 | | $131.56 |
| S&P 500 Index | | $100.00 | | $131.49 | | $155.68 | | $200.37 | | $164.08 | | $207.21 |
| | | | | | | | | | | | |
| | | | | | | | | | | | |
|
The graph and table below assume that on December 31, 2015, $100 was invested in EWBC’s common stock, the S&P 500 Index and the KRX, and that all dividends were reinvested. Historical stock price performance shown on the graph is not necessarily indicative of future stock price performance. The information set forth under the heading “Five-Year Stock Performance” shall not be deemed to be “soliciting material” or to be “filed” with the SEC or subject to the liabilities of Section 18 of the Exchange Act, except to the extent that the Company specifically requests that such information to be treated as soliciting material or specifically to be incorporated by reference into a filing under the Securities Act or the Exchange Act.
| | | | | | | | | | | | | | | | | | | | | | | | | | | | | | | | | | | | | | |
|
| | December 31, |
| Index | | 2015 | | 2016 | | 2017 | | 2018 | | 2019 | | 2020 |
| East West Bancorp, Inc. | | $100.00 | | $124.90 | | $151.60 | | $110.20 | | $126.10 | | $135.50 |
| KRX | | $100.00 | | $139.00 | | $141.50 | | $116.70 | | $144.50 | | $131.90 |
| S&P 500 Index | | $100.00 | | $112.00 | | $136.40 | | $130.40 | | $171.50 | | $203.00 |
| | | | | | | | | | | | |
| | | | | | | | | | | | |
|
Repurchases of Equity Securities by the Issuer and Affiliated Purchasers
The following table summarizes the Company’s common stock repurchase activity during the fourth quarter of 2023:
| | | | | | | | | | | | | | | | | | | | | | | | | | |
|
| Calendar Month | | Total Number of Shares Purchased (1) | | Average Price Paid per Share of Common Stock | | Total Number of Shares Purchased as Part of Publicly Announced Plans or Programs | | Approximate Dollar Value of Shares that May Yet Be Purchased Under the Plans or Programs (in millions) (2) |
| October | | 590,696 | | | $ | 52.63 | | | 590,696 | | | $ | 223 | |
| November | | 768,649 | | | $ | 54.44 | | | 768,649 | | | $ | 181 | |
| December | | 146,746 | | | $ | 63.00 | | | 146,746 | | | $ | 172 | |
| Fourth quarter | | 1,506,091 | | | $ | 54.56 | | | 1,506,091 | | | |
|
(1)Excludes the repurchase of common stock pursuant to various stock compensation plans and agreements.
(2)On March 3, 2020, the Company’s Board of Directors authorized, and the Company announced, a stock repurchase ofprogram under which the Company may repurchase up to $500.0$500 million of the Company’sits common stock. This $500.0 million repurchase authorization is inclusive of the unused portion of the Company’s $100.0 millionThe stock repurchase authorization previously outstanding in 2013. The share repurchase authorization has no expiration date. In March 2020,
Refer to Item 7.MD&A — Balance Sheet Analysis — Capital and Item 8. Financial Statements — Note 14 — Stockholders’ Equity and Earnings Per Share for information regarding repurchases under the Company repurchased 4,471,682 shares at an average price of $32.64 per share and a total cost of $146.0 million. The Company’s total remaining availablecommon share repurchase authorization as of December 31, 2020 was $354.0 million. The Company did not repurchase any shares during 2019 and 2018.program.
ITEM 6. SELECTED FINANCIAL DATA
Information in response to this Item 6 can be found in Item 7. MD&A — Five-Year Summary of Selected Financial Data, which is incorporated herein by reference.
EAST WEST BANCORP, INC.
ITEM 7. MANAGEMENT’S DISCUSSION AND ANALYSIS OF FINANCIAL
CONDITION AND RESULTS OF OPERATIONS
TABLE OF CONTENTS
Overview
The following discussion provides information about the results of operations, financial condition, liquidity and capital resources of East West Bancorp, Inc. (referred to herein on an unconsolidated basis as “East West” and on a consolidated basis as the “Company,” “we” or “EWBC”), and its subsidiaries,Company, including its subsidiary bank, East West Bank and its subsidiaries (referred to herein as “East West Bank” or the “Bank”).Bank. This information is intended to facilitate the understanding and assessment of significant changes and trends related to the Company’s results of operations and financial condition. This discussion and analysis should be read in conjunction with the Consolidated Financial Statements and the accompanying notes presented elsewhere in this Form 10-K.
Company Overview
East West is a bank holding company incorporated in Delaware on August 26, 1998 and is registered under the BHC Act. The Company commenced business on December 30, 1998 when, pursuant to a reorganization, it acquired all of the voting stock of the Bank, which became its principal asset. The Bank is an independent commercial bank headquartered in California that has a strong focus on the financial service needs of the Asian-American community. Through over 120 locations in the U.S. and Greater China, the Company provides a full range of consumer and commercial products and services through three business segments: Consumer and Business Banking, Commercial Banking, with the remaining operations included in Other. The Company’s principal activity is lending to and accepting deposits from businesses and individuals. The primary source of revenue is net interest income, which is principally derived from the difference between interest earned on loans and debt securities and interest paid on deposits and other funding sources. As of December 31, 2020, the Company had $52.16 billion in assets and approximately 3,200 full-time equivalent employees. For additional information on products and services provided by the Bank,our business, see Item 1. Business — Banking Services.
Corporate Strategy
We are committed to enhancing long-term shareholder value by executing on the fundamentals of growing loans, deposits and revenue, improving profitability, and investing for the future while managing risks, expenses and capital. Our business model is built on customer loyalty and engagement, understanding of our customers’ financial goals, and meeting our customers’ financial needs through our diverse products and services. The Company’s approach is concentrated on seeking out and deepening client relationships that meet our risk/return measures. This focus guides our decision-making across every aspect of our operations: the products we develop, the expertise we cultivate and the infrastructure we build to help our customers conduct businesses. We expect our relationship-focused business model to continue to generate organic growth and to expand our targeted customer bases. On an ongoing basis, we invest in technology to improve the customer user experience, strengthen critical business infrastructure, and streamline core processes, while appropriately managing operating expenses. Our risk management activities are focused on ensuring that the Company identifies and manages risks to maintain safety and soundness while maximizing profitability.
Coronavirus Disease 2019 Global Pandemic
The COVID-19 pandemic has caused significant disruption around the world, as well as economic and financial market deterioration, which did not exist at the beginning of 2020. These economic and operating conditions caused by the COVID-19 pandemic have created financial difficulties for many of the Company’s commercial and consumer customers. As a result, some borrowers may not be able to satisfy their obligations to us. As many of the Company’s loans are secured by real estate, a potential decline in the real estate markets could also negatively impact the Company’s business, financial condition and the credit quality of the Company’s loan portfolio. It has adversely affected, and is likely continue to adversely affect, our business, financial condition and results of operations. We cannot predict at this time the scope and duration of the pandemic as the COVID-19 pandemic has not yet been contained. While there have been various governmental and other responses to slow or control the spread of the COVID-19 pandemic, and to mitigate its adverse impacts, such as stay-at-home orders, restrictions on business activities, economic relief for individuals and businesses, and monetary policy measures, these responses have met varying degrees of success, and it remains uncertain whether these actions will be successful as the pandemic continues. Although effective vaccines have been developed, their distribution is still in the early stages and it is uncertain how long the process will take to complete, nationally or globally.
Regulatory Developments Relating to the COVID-19 Pandemic
Coronavirus Aid, Relief, and Economic Security Act —The CARES Act was enacted on March 27, 2020 to lessen the economic impact of the COVID-19 pandemic on individuals, businesses and local economies. The CARES Act initiatives included extended unemployment benefits, mortgage forbearance, the SBA PPP and funding and authorization for the MSLP. The Company participated in the Federal Reserve’s MSLP and funded $233.6 million in MSLP loans as of December 31, 2020. The related Main Street special purpose vehicle purchased participations in these loans which amounted to $221.9 million or 95%. The CARES Act also required mortgage servicers to grant, on a borrower’s request, forbearance for up to 180 days (which could be extended for up to another 180 days) on a federally-backed single-family mortgage loan or forbearance up to 30 days (which could be extended for two additional 30-day periods) on a federally-backed multifamily mortgage loan when the borrowers experience financial hardship due to the COVID-19 pandemic.
In response to the continued market disruption and economic impact of the COVID-19 pandemic, President Trump signed into law the CAA on December 27, 2020. The CAA contains a variety of provisions for emergency relief to individuals and business related to the COVID-19 pandemic, including measures to, among other things, provide additional funding to businesses, facilitate emergency capital investments by community development financial institutions, fund rental assistance for certain individuals and extend regulatory relief relating to the adoption of CECL until the earlier of the first day of the fiscal year of the institution that begins after the national emergency termination date or January 1, 2022. The CAA provided additional funding to the PPP, expanded eligibility of businesses for the PPP, extended the PPP to March 31, 2021, and allows eligible borrowers to obtain a second PPP loan (“second draw”) up to a maximum amount of $2 million. Second draw PPP borrowers are eligible for loan forgiveness on the same terms as the first draw borrowers. The CAA also simplified the loan forgiveness process for first and second draw borrowers with PPP loans of $150,000 or less and includes a “hold harmless” provision, which provides that a lender may rely on any certification or documentation submitted by a borrower for a PPP loan and that no enforcement action may be taken against the lender, and the lender will not be subject to any penalties relating to loan origination or forgiveness, if (i) the lender acts in good faith relating to loan origination or forgiveness and (ii) all other applicable statutory and regulatory requirements are satisfied.
Paycheck Protection Program — The PPP provides forgivable loans to businesses in order to keep their employees on the payroll and make certain other eligible payments. The SBA guarantees 100% of the PPP loans made to eligible borrowers, and the entire principal amount and any accrued interest on the loans are eligible to be forgiven if certain conditions are met, at which point the SBA will pay the bank that originated the PPP loan the forgiven amount. The Company is a participant in the PPP. As of December 31, 2020, the Company had approximately 6,200 PPP loans outstanding with balances totaling $1.57 billion, which were recorded in the commercial and industrial (“C&I”) portfolio. Related to the PPP loans made in 2020, as of February 25, 2021, the Company has submitted and received approval from the SBA for forgiveness approximately 2,700 PPP loan applications, totaling $341.9 million. In January 2021, the Company began processing applications under the newly funded PPP, largely second draw PPP loans. Since the start of the second draw PPP through February 25, 2021, the Company has funded over 4,300 new PPP loans, totaling $700.3 million.
Other U.S. Government Facilities and Programs—In connection with our participation in the PPP under the CARES Act as discussed above, the Company participated in the PPPLF. During the second quarter of 2020, the Federal Reserve established the PPPLF to allow eligible lenders to facilitate lending under the SBA’s PPP, taking PPP loans as collateral. The Company drew down $1.44 billion from the Federal Reserve PPPLF and pledged the same amount in PPP loans as collateral during the second quarter of 2020. The Company paid off the outstanding amounts under the PPPLF in full during the fourth quarter of 2020.
Loan Modifications — The CARES Act and related guidance from the federal banking agencies provide financial institutions the option to temporarily suspend requirements under GAAP related to classification of certain loan modifications as TDRs to account for the current and anticipated effects of the COVID-19 pandemic. The CARES Act, as amended by the CAA, specified that COVID-19 related loan modifications executed between March 1, 2020 and the earlier of (i) 60 days after the date of termination of the national emergency declared by the President and (ii) January 1, 2022, on loans that were current as of December 31, 2019 are not TDRs. Additionally, under guidance from the federal banking agencies, other short-term modifications made on a good faith basis in response to the COVID-19 pandemic to borrowers that were current prior to any relief are not TDRs under ASC Subtopic 310-40, “Troubled Debt Restructuring by Creditors.” These modifications include short-term (e.g., up to six months) modifications such as payment deferrals, fee waivers, extensions of repayment terms, or delays in payment that are insignificant. We have granted loan modifications to our customers in the form of maturity extensions, payment deferrals and forbearance. For a summary of the loans that we have modified in response to the COVID-19 pandemic, please refer to Item 7. MD&A — Risk Management — Credit Risk Management in this Form 10-K.
Regulatory Capital — The CARES Act requires PPP loans to be assigned a zero percent risk weight under the federal banking agencies’ risk-based capital rules. Additionally, under an interim final rule of the federal banking agencies, PPP loans that an institution pledges as collateral to the PPPLF may be deducted from the institution’s average total consolidated assets for purposes of the Tier 1 leverage ratio.
Federal Reserve Requirements — On March 26, 2020, the Federal Reserve reduced reserve requirement ratios to zero percent, eliminating the reserve requirement for all depository institutions, an action that provides liquidity in the banking system to support lending to households and businesses, in response to the economic stress stemming from the COVID-19 pandemic.
Our Response to the COVID-19 Pandemic
In response to the pandemic, the Company has implemented protocols and processes to execute its business continuity plans to help protect its employees and support its customers. The Company is managing its response to the COVID-19 pandemic according to its Enterprise Business Continuity Policy, which invokes centralized management of the crisis event and the integration of its response. The CEO and key members of the Company’s management team meet regularly with senior executives to help drive decisions, communication and consistency of response across all businesses and functions. In addition, we have implemented measures to assist our employees and customers as discussed below:
•Employees:
The majority of the Company’s employees are able to work from home. The Company continues to evaluate its continuity plans and work-from-home strategy to best protect the health and safety of its employees. For employees with jobs that are required to be performed on-site, we have taken significant actions to ensure employee safety by providing personal protection equipment, adopting social distancing measures, placing visual safety reminders related to social distancing, implementing an enhanced cleaning program, installing plexiglass panels, and requiring temperature screenings and the wearing of masks for all employees.
•Customers:
We assisted our commercial, consumer and small business clients affected by the COVID-19 pandemic through payment deferrals, suspension of foreclosures on certain residential mortgage loans, and participation in the SBA PPP and the MSLP.We intend to evaluate participation in additional new government-sponsored programs, as they are established. In addition, the Company continues to make a wide range of banking services accessible to customers through mobile and other digital channels to reduce the need for in-person branch visits.
Impact on our Financial Position and Results of Operations— Our financial position and results of operations are sensitive to the ability of our loan customers to meet loan obligations, the availability of our workforce and the decline in the value of assets held by us. While its effects continue to materialize, the COVID-19 pandemic has resulted in a significant decrease in commercial activity throughout our operating footprint. This decrease in commercial activity has caused and may continue to cause our customers to be unable to meet existing payment or other obligations to us. The greatest impact of the COVID-19 pandemic on our financial condition has been in the increase of the provision for credit losses and the allowance for loan losses. We recorded approximately $210.7 million of provision for credit losses during 2020, bringing our allowance for loan losses to $620.0 million as of December 31, 2020, with an allowance for loan losses to loans held-for-investment ratio of 1.61%. Despite the impact of the increased provision for credit losses, we maintained solid profitability for the full year of 2020, earning 1.16% on return on average assets (“ROA”) and 11.17% on return on average equity (“ROE”). Our capital ratios are strong, and we remain well-positioned from a liquidity perspective, enabling us to weather adverse economic scenarios while continuing to support our customers and invest in our business.
For additional information, see Item 7. MD&A — Risk Management — Credit Risk Management and — Liquidity Risk Management, and — Balance Sheet Analysis — Regulatory Capital and Ratios in this Form 10-K. Further discussion of the potential impacts on our business from the COVID-19 pandemic is provided under Part I, Item 1A — Risk Factors in this Form 10-K.
Accounting Standards Update 2016-13 Adoption
On January 1, 2020, the Company adopted ASU 2016-13, Financial Instruments — Credit Losses, which establishes a single allowance framework for all financial assets carried at amortized cost, and for certain off-balance sheet exposures. Replacing the prior incurred loss model, this framework requires that management estimate credit losses over the full remaining expected life of a loan, and consider expected future changes in macroeconomic conditions. The adoption of CECL on January 1, 2020 increased the allowance for loan losses by $125.2 million, and the allowance for unfunded credit commitments by $10.5 million, and an after-tax decrease to retained earnings of $98.0 million.
Five-Year Summary of Selected Financial Data
| | | | | | | | | | | | | | | | | | | | | | | | | | | | | | | | |
|
| ($ and shares in thousands, except per share, ratio and headcount data) | | 2020 | | 2019 | | 2018 | | 2017 | | 2016 |
| Summary of operations: | | | | | | | | | | |
| | | | | | | | | | |
| | | | | | | | | | |
Net interest income before provision for credit losses (1) | | $ | 1,377,193 | | | $ | 1,467,813 | | | $ | 1,386,508 | | | $ | 1,185,069 | | | $ | 1,032,638 | |
Noninterest income (2) | | 235,547 | | | 222,245 | | | 217,433 | | | 263,654 | | | 186,921 | |
| Total revenue | | 1,612,740 | | | 1,690,058 | | | 1,603,941 | | | 1,448,723 | | | 1,219,559 | |
| Provision for credit losses | | 210,653 | | | 98,685 | | | 64,255 | | | 46,266 | | | 27,479 | |
| | | | | | | | | | |
Noninterest expense (3) | | 716,322 | | | 747,456 | | | 720,990 | | | 667,357 | | | 619,892 | |
| Income before income taxes | | 685,765 | | | 843,917 | | | 818,696 | | | 735,100 | | | 572,188 | |
Income tax expense (4) | | 117,968 | | | 169,882 | | | 114,995 | | | 229,476 | | | 140,511 | |
| | | | | | | | | | |
Net income (1)(2)(3)(4) | | $ | 567,797 | | | $ | 674,035 | | | $ | 703,701 | | | $ | 505,624 | | | $ | 431,677 | |
| Per common share: | | | | | | | | | | |
| Basic earnings | | $ | 3.99 | | | $ | 4.63 | | | $ | 4.86 | | | $ | 3.50 | | | $ | 3.00 | |
| Diluted earnings | | $ | 3.97 | | | $ | 4.61 | | | $ | 4.81 | | | $ | 3.47 | | | $ | 2.97 | |
| Dividends declared | | $ | 1.10 | | | $ | 1.06 | | | $ | 0.86 | | | $ | 0.80 | | | $ | 0.80 | |
| Book value | | $ | 37.22 | | | $ | 34.46 | | | $ | 30.52 | | | $ | 26.58 | | | $ | 23.78 | |
Non-GAAP tangible common equity per share (5) | | $ | 33.85 | | | $ | 31.15 | | | $ | 27.15 | | | $ | 23.13 | | | $ | 20.27 | |
| Weighted-average number of shares outstanding: | | | | | | | | | | |
| Basic | | 142,336 | | | 145,497 | | | 144,862 | | | 144,444 | | | 144,087 | |
| Diluted | | 142,991 | | | 146,179 | | | 146,169 | | | 145,913 | | | 145,172 | |
| Common shares outstanding at period-end | | 141,565 | | | 145,625 | | | 144,961 | | | 144,543 | | | 144,167 | |
| Performance metrics: | | | | | | | | | | |
| ROA | | 1.16 | % | | 1.59 | % | | 1.83 | % | | 1.41 | % | | 1.30 | % |
| ROE | | 11.17 | % | | 14.16 | % | | 17.04 | % | | 13.71 | % | | 13.06 | % |
Return on average non-GAAP tangible equity (5) | | 12.42 | % | | 15.88 | % | | 19.48 | % | | 16.03 | % | | 15.62 | % |
| Total average equity to total average assets | | 10.38 | % | | 11.21 | % | | 10.72 | % | | 10.30 | % | | 9.97 | % |
| Common dividend payout ratio | | 27.97 | % | | 23.04 | % | | 17.90 | % | | 23.14 | % | | 27.01 | % |
| Net interest margin | | 2.98 | % | | 3.64 | % | | 3.78 | % | | 3.48 | % | | 3.30 | % |
Efficiency ratio (6) | | 44.42 | % | | 44.23 | % | | 44.95 | % | | 46.07 | % | | 50.83 | % |
Non-GAAP efficiency ratio (5) | | 39.30 | % | | 38.14 | % | | 39.39 | % | | 41.26 | % | | 44.04 | % |
| At year end: | | | | | | | | | | |
| Total assets | | $ | 52,156,913 | | | $ | 44,196,096 | | | $ | 41,042,356 | | | $ | 37,121,563 | | | $ | 34,788,840 | |
Total loans (7) | | $ | 38,392,743 | | | $ | 34,778,973 | | | $ | 32,385,464 | | | $ | 29,053,935 | | | $ | 25,526,215 | |
| AFS debt securities | | $ | 5,544,658 | | | $ | 3,317,214 | | | $ | 2,741,847 | | | $ | 3,016,752 | | | $ | 3,335,795 | |
| Total deposits | | $ | 44,862,752 | | | $ | 37,324,259 | | | $ | 35,439,628 | | | $ | 31,615,063 | | | $ | 29,890,983 | |
| Long-term debt and finance lease liabilities | | $ | 151,739 | | | $ | 152,270 | | | $ | 146,835 | | | $ | 171,577 | | | $ | 186,327 | |
| FHLB advances | | $ | 652,612 | | | $ | 745,915 | | | $ | 326,172 | | | $ | 323,891 | | | $ | 321,643 | |
Stockholders’ equity (8) | | $ | 5,269,175 | | | $ | 5,017,617 | | | $ | 4,423,974 | | | $ | 3,841,951 | | | $ | 3,427,741 | |
Non-GAAP tangible common equity (5) | | $ | 4,791,579 | | | $ | 4,535,841 | | | $ | 3,936,062 | | | $ | 3,343,693 | | | $ | 2,922,638 | |
| Head count (full-time equivalent) | | 3,214 | | | 3,294 | | | 3,196 | | | 2,933 | | | 2,838 | |
| EWBC capital ratios: | | | | | | | | | | |
| CET1 capital | | 12.7 | % | | 12.9 | % | | 12.2 | % | | 11.4 | % | | 10.9 | % |
| Tier 1 capital | | 12.7 | % | | 12.9 | % | | 12.2 | % | | 11.4 | % | | 10.9 | % |
| Total capital | | 14.3 | % | | 14.4 | % | | 13.7 | % | | 12.9 | % | | 12.4 | % |
| Tier 1 leverage capital | | 9.4 | % | | 10.3 | % | | 9.9 | % | | 9.2 | % | | 8.7 | % |
| Total stockholders’ equity to total assets | | 10.1 | % | | 11.4 | % | | 10.8 | % | | 10.3 | % | | 9.9 | % |
Non-GAAP tangible common equity to tangible assets (5) | | 9.3 | % | | 10.4 | % | | 9.7 | % | | 9.1 | % | | 8.5 | % |
|
(1)2020 includes $43.3 million of interest income related to PPP loans.
(2)2018 includes $31.5 million of gain recognized from the sale of the Desert Community Bank (“DCB”) branches. 2017 includes $71.7 million and $3.8 million of gains recognized from the sales of a commercial property in California and EWIS’s insurance brokerage business, respectively.
(3)2020 includes $10.7 million of recovery related to DC Solar and affiliates (“DC Solar”) tax credit investments, of which $1.1 million was recorded as an impairment recovery. 2020 also includes $8.7 million in extinguishment costs related to assets sold under repurchase agreements’ (“repurchase agreements”). 2019 includes $7.0 million in impairment charge related to DC Solar, of which $1.6 million was subsequently recovered.
(4)2020 includes $5.1 million of tax expense to record an uncertain tax position related to DC Solar. 2019 includes $30.1 million of additional tax expense to reverse certain previously claimed tax credits related to DC Solar. 2017 includes an additional $41.7 million in income tax expense recognized due to the enactment of the Tax Cuts and Jobs Act of 2017.
(5)For a discussion of non-GAAP tangible common equity per share, return on average non-GAAP tangible equity, non-GAAP efficiency ratio, non-GAAP tangible common equity and total non-GAAP tangible common equity to tangible assets, refer to Item 7. MD&A — Reconciliation of GAAP to Non-GAAP Financial Measures in this Form 10-K.
(6)The efficiency ratio is noninterest expense divided by total revenue.
(7)Includes $1.57 billion of PPP loans as of December 31, 2020.Current Developments
(8)On January 1, 2020, the Company adopted ASU 2016-13, Financial Instruments — Credit Losses (Topic 326): Measurement of Credit Losses on Financial Instruments using the modified retrospective approach. The Company recorded $125.2 million increase to allowance for loan losses and $98.0 million after-tax decrease to opening retained earnings as of January 1, 2020.
Economic Developments
Our MD&A reviews
Although recent external data indicates that inflation remains above the financial conditionFederal Reserve’s 2% target, the steadily slowing pace of inflation could point to receding fears of a recession in 2024. The likelihood of a “soft landing” scenario appears more likely given the Federal Reserve’s commitment to this outcome. The Federal Reserve has held interest rates steady over the latter half of 2023 and resultsrecently indicated the potential for rate cuts in 2024 and beyond. However, the higher interest rate environment continues to negatively impact the market value of operationsbank-held securities, and the CRE industry has slowed due to tighter credit conditions and decreased demand. Other factors such as the economic impacts of unrest, wars, and acts of terrorism could lead to higher oil prices and increased inflationary pressures, along with the possibility that the Federal Reserve could maintain high interest rates longer than anticipated. While a U.S. government shutdown was averted in 2023, a future shutdown is possible and could negatively impact the economy. The Company monitors changes in economic and industry conditions and their impacts on the Company’s business, customers, employees, communities, and markets.
For additional discussion of the Company for 2020 and 2019. Some tables include additional periodspotential impacts on the Company’s business due to comply with disclosure requirements orinterest rate hikes, see Item 1A. — Risk Factors — Risks Related to illustrate trends in greater depth. When reading the discussion in the MD&A, readers should also refer to the consolidated financial statements and related notes Financial Matters in this Form 10-K. The page locations of specific sections that we refer to are presented in the table of contents. To review our financial condition and results of operations for 2018 and a comparison between 2018 and 2019 results, see Item 7. MD&A of our 2019 Form 10-K filed with the SEC on February 27, 2020.
Financial Review
Our MD&A analyzes the financial condition and results of operations of the Company for 2023 and 2022. Some tables include additional periods to comply with disclosure requirements or to illustrate trends in greater depth. The page locations of specific sections that we refer to are presented in the table of contents. To review our financial condition and results of operations for 2022 and a comparison between 2022 and 2021 results, see Item 7. MD&A of our 2022 Form 10-K, which was filed with the SEC on February 27, 2023.
| | | | | | | | | | | | | | | | | | | | |
|
| ($ and shares in thousands, except per share, and ratio data) | | 2023 | | 2022 | | | | | | |
| Summary of operations: | | | | | | | | | | |
| | | | | | | | | | |
| | | | | | | | | | |
| Net interest income before provision for credit losses | | $ | 2,312,254 | | | $ | 2,045,881 | | | | | | | |
| Noninterest income | | 295,264 | | | 298,666 | | | | | | | |
| Total revenue | | 2,607,518 | | | 2,344,547 | | | | | | | |
| Provision for credit losses | | 125,000 | | | 73,500 | | | | | | | |
| | | | | | | | | | |
| Noninterest expense | | 1,022,748 | | | 859,393 | | | | | | | |
| Income before income taxes | | 1,459,770 | | | 1,411,654 | | | | | | | |
| Income tax expense | | 298,609 | | | 283,571 | | | | | | | |
| | | | | | | | | | |
| Net income | | $ | 1,161,161 | | | $ | 1,128,083 | | | | | | | |
| Per share: | | | | | | | | | | |
| Basic earnings | | $ | 8.23 | | | $ | 7.98 | | | | | | | |
| Diluted earnings | | $ | 8.18 | | | $ | 7.92 | | | | | | | |
Adjusted diluted earnings (1) | | $ | 8.56 | | | $ | 7.92 | | | | | | | |
| Dividends declared | | $ | 1.92 | | | $ | 1.60 | | | | | | | |
| Weighted-average number of shares outstanding: | | | | | | | | | | |
| Basic | | 141,164 | | | 141,326 | | | | | | | |
| Diluted | | 141,902 | | | 142,492 | | | | | | | |
| Performance metrics: | | | | | | | | | | |
| Return on average assets (“ROA”) | | 1.71 | % | | 1.80 | % | | | | | | |
| Return on average common equity (“ROE”) | | 17.91 | % | | 19.51 | % | | | | | | |
Return on average tangible common equity (“TCE”) (1) | | 19.35 | % | | 21.29 | % | | | | | | |
| | | | | | | | | | |
| Common dividend payout ratio | | 23.62 | % | | 20.32 | % | | | | | | |
| Net interest margin | | 3.61 | % | | 3.45 | % | | | | | | |
Efficiency ratio (2) | | 39.22 | % | | 36.65 | % | | | | | | |
Adjusted efficiency ratio (1) | | 31.63 | % | | 31.74 | % | | | | | | |
| At year end: | | | | | | | | | | |
| Total assets | | $ | 69,612,884 | | | $ | 64,112,150 | | | | | | | |
| Total loans | | $ | 52,210,898 | | | $ | 48,228,074 | | | | | | | |
| | | | | | | | | | |
| Total deposits | | $ | 56,092,438 | | | $ | 55,967,849 | | | | | | | |
| Common shares outstanding at period-end | | 140,027 | | | 140,948 | | | | | | | |
| Book value per share | | $ | 49.64 | | | $ | 42.46 | | | | | | | |
Tangible book value per share (1) | | $ | 46.27 | | | $ | 39.10 | | | | | | | |
| | | | | | | | | | |
| | | | | | | | | | |
| | | | | | | | | | |
| | | | | | | | | | |
| | | | | | | | | | |
| | | | | | | | | | |
| | | | | | | | | | |
| | | | | | | | | | |
| | | | | | | | | | |
| | | | | | | | | | |
| | | | | | | | | | |
| | | | | | | | | | |
|
(1)For additional information regarding the reconciliation of these non-U.S. GAAP financial measures, refer to Item 7. MD&A — Reconciliation of GAAP to Non-GAAP Financial Measures in this Form 10-K.
(2)Efficiency ratio is calculated as noninterest expense divided by total revenue.
The Company’s 2023 net income was $1.2 billion, an increase of $33 million, or 3%, from 2022 net income of $1.1 billion. The increase was primarily due to higher net interest income before provision for credit losses, partially offset by increases in the noninterest expense, provision for credit losses and income tax expense. Noteworthy items about the Company’s performance for 20202023 included:
•Earnings: 2020 net income was $567.8 million, or $3.97 per diluted share, compared with 2019 net income of $674.0 million, or $4.61 per diluted share, a decrease of $106.2 million or 16%. The decrease primarily came from a higher provision for credit losses and lower net interest income, partially offset by a decrease in income tax expense.
•Adjusted Earnings:Net interest income growth and net interest margin expansion. Year-over-year net interest income before provision for credit losses grew by $266 million 2020 non-GAAPor 13% to $2.3 billion in 2023, from $2.0 billion in 2022. Full year 2023 net incomeinterest margin was $565.23.61%, up 16 bps year-over-year.
•Earnings Per Share growth. Basic, diluted and adjusted diluted EPS for 2023 increased to $8.23, $8.18 and $8.56, respectively, compared with $7.98, $7.92 and $7.92, respectively, in 2022. The adjusted diluted EPS for 2023 excluded the $70 million or $3.95 per diluted share,pre-tax FDIC special assessment-related charge (the “FDIC charge”) incurred as a decrease of 20% from 2019 non-GAAP net income of $707.9 million, or $4.84 per diluted share. Non-GAAP adjustments in 2020 and 2019 exclude the impactsresult of the impairment, recoveriesfinal rule implemented by the FDIC to recover losses in the DIF, and income tax items relateda net loss of $7 million pre-tax on an AFS debt security. Adjusted diluted EPS is a non-GAAP financial measure. For additional details, see the reconciliation of non-GAAP financial measures presented under Item 7. MD&A — Reconciliation of GAAP to Non-GAAP Financial Measures in this Form 10-K.
•Efficiency ratios. The efficiency ratio was 39.22% in 2023, or 257 bps higher compared with 2022, while the adjusted efficiency ratio was 31.63% in 2023, an improvement of 11 bps from 2022. The higher efficiency ratio in 2023 was due to the Company’s investment in DC Solar. For 2020, DC Solar-related adjustments consisted of $10.7 million in recoveries, $3.0 million of income tax expense related to the recoveries, and $5.1 million of income tax expense booked for an uncertain tax position. For 2019, DC Solar-related adjustments consisted of $7.0 million in impairmentFDIC charge $1.6 million in recovery, $1.6 million of income tax expense related to the impairment and recovery, and $30.1 million of income tax expense booked for the reversal of certain previously claimed tax credits.discussed above. Adjusted efficiency ratio is a non-GAAP financial measure. For additional detail, referdetails, see the reconciliation of non-GAAP financial measures presented under Item 7. MD&A — Reconciliation of GAAP to Non-GAAP Financial Measures in this Form 10-K.
•Asset growth. Total assets reached $69.6 billion, an increase of $5.5 billion or 9% year-over-year, primarily driven by loan growth of $4.0 billion or 8%, and an increase in cash and cash equivalents of $1.1 billion or 33%. The increase in cash and cash equivalents was primarily funded with borrowings from the reconciliationsBank Term Funding Program (“BTFP”).
•Loan growth. Total loans were $52.2 billion as of December 31, 2023, a year-over-year increase of $4.0 billion or 8% from $48.2 billion. This was primarily driven by growth in the residential mortgage, CRE, and commercial and industrial (“C&I”) loan segments.
•Strong capital levels. Stockholders’ equity was $7.0 billion or $49.64 per share as of December 31, 2023, up from $6.0 billion or $42.46 per share as of December 31, 2022. Tangible book value per share of $46.27 as of December 31, 2023, increased $7.17 or 18% from $39.10 as of December 31, 2022. Tangible book value per share is a non-GAAP financial measure. For additional details, see the reconciliation of non-GAAP financial measures presented under Item 7. MD&A — Reconciliation of GAAP to Non-GAAP Financial Measures in this Form 10-K.
•Revenue: Revenue, or the sum of net interest income before provision for credit losses and noninterest income, was $1.61 billion in 2020, compared with $1.69 billion in 2019, a decrease of $77.3 million or 5%. This decrease was primarily due to lower net interest income, partially offset by an increase in noninterest income.
•Net Interest Income and Net Interest Margin: 2020 net interest income was $1.38 billion, a decrease of $90.6 million or 6%, compared with 2019 net interest income of $1.47 billion. 2020 net interest margin was 2.98%, a decrease of 66 basis points from 3.64% for 2019. The decreases in the net interest income and net interest margin reflected significantly lower interest rates year-over-year, including a 150 basis points reduction to the target federal funds rate in March 2020.
•Provision for credit losses: 2020 provision for credit losses was $210.7 million, an increase of $112.0 million or 113%, compared with $98.7 million for 2019. The year-over-year increase in the provision for credit losses reflected the deteriorating macroeconomic conditions and outlook due to the COVID-19 pandemic. Provision expense in the first half of 2020 was $176.3 million, compared with $34.4 million in the second half of 2020.
•Tax: 2020 income tax expense was $118.0 million and the effective income tax rate was 17.2%, compared with income tax expense of $169.9 million and an effective tax rate of 20.1%, for 2019. 2020 income tax expense included $8.1 million of income tax expense related to DC Solar tax credit investments; $5.1 million due to an uncertain tax position and $3.0 million of tax expense for $10.7 million of recoveries included in Amortization of tax credit and other investments. 2019 income tax expense included $30.1 million for the reversal of certain previously claimed tax credits related to DC Solar and $1.6 million of income tax benefit related to an impairment and recovery related to DC Solar.
•Profitability: 2020 ROA was 1.16%, compared with 1.59% for 2019. 2020 ROE was 11.17%, compared with 14.16% for 2019. Adjusted for the non-recurring items related to DC Solar in 2020 and 2019, 2020 non-GAAP ROA was 1.16%, compared with 1.67% for 2019. 2020 non-GAAP ROE was 11.12%, compared with 14.87% for 2019. For additional detail, refer to the reconciliations of non-GAAP measures presented under Item 7. MD&A — Reconciliation of GAAP to Non-GAAP Financial Measures in this Form 10-K.
•Loans: Total loans were $38.39 billion as of December 31, 2020, an increase of $3.61 billion or 10% from $34.78 billion as of December 31, 2019. Loan growth was well-diversified across each of the Company’s major loan portfolios of C&I, driven by PPP loan funding, single-family residential and CRE.
•Deposits: Total deposits were $44.86 billion as of December 31, 2020, an increase of $7.54 billion or 20% from $37.32 billionas of December 31, 2019. Growth was primarily driven by noninterest-bearing demand deposits and money market accounts, partially offset by a decrease in time deposits.
•Allowance for Loan Losses: The allowance for loan losses was $620.0 million, or 1.61% of loans held-for-investment, as of December 31, 2020, compared with $358.3 million, or 1.03% of loans held-for-investment, as of December 31, 2019. On January 1, 2020, the allowance for loan losses increased by $125.2 million, reflecting the adoption of ASU 2016-13. Between January 2 and December 31, 2020, the allowance for loan losses increased by $136.5 million, primarily reflecting the negative impact of the COVID-19 pandemic and a deterioration of the macroeconomic forecast for the first half of 2020.
•Asset Quality Metrics: Nonperforming assets were $234.9 million or 0.45% of total assets, as of December 31, 2020, an increase of $113.4 million or 93% from $121.5 million or 0.27% of total assets, as of December 31, 2019. For 2020, net charge-offs were $63.2 million or 0.17% of average loans held-for-investment, compared with net charge-offs of $52.8 million or 0.16% of average loans held-for-investment for 2019.
•Capital Levels: Our capital levels are strong. As of December 31, 2020, all of the Company’s and the Bank’s regulatory capital ratios were well above the required well-capitalized levels. See Item 7. MD&A — Balance Sheet Analysis — Regulatory Capital and Ratios in this Form 10-Kfor more information regarding capital.
•Capital Return: The annual cash dividend on common stock was $1.10 per share in 2020, compared with $1.055 per share in 2019. The Company returned $158.2 million and $155.1 million in cash dividends to stockholders during 2020 and 2019, respectively. On March 3, 2020, the Company’s Board of Directors authorized a stock repurchase program to buy back up to $500.0 million of the Company’s common stock. During the first quarter of 2020, the Company repurchased 4,471,682 shares at an average price of $32.64 per share and a total cost of $146.0 million. As of December 31, 2020, $354.0 million remains available under the outstanding authorization.10-K.
Results of Operations
Net Interest Income
The Company’s primary source of revenue is net interest income, which is the interest income earned on interest-earning assets less interest expense paid on interest-bearing liabilities. Net interest margin is the ratio of net interest income to average interest-earning assets. Net interest income and net interest margin are impacted by several factors, including changes in average balances and the composition of interest-earning assets and funding sources, market interest rate fluctuations and the slope of the yield curve, repricing characteristics and maturity of interest-earning assets and interest-bearing liabilities, the volume of noninterest-bearing sources of funds, and asset quality.
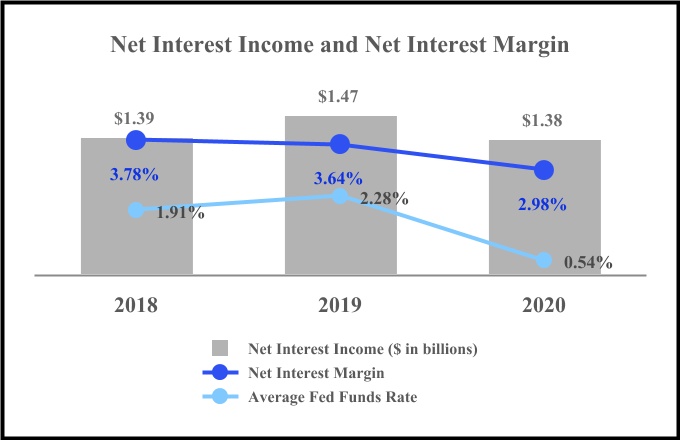
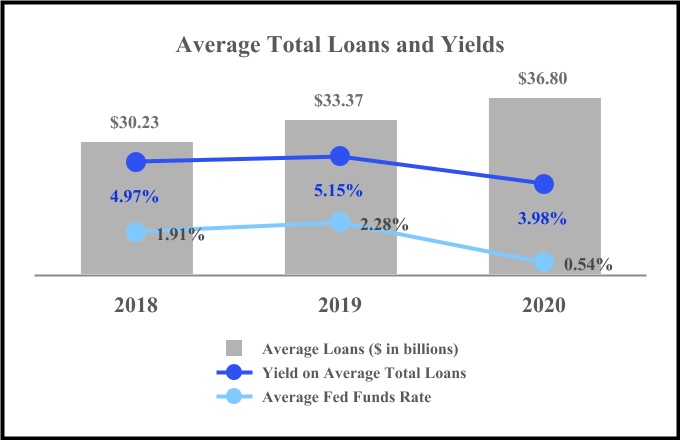
Net interest income for 2020 was $1.38 billion, a decrease of $90.6 million or 6%, compared with $1.47 billion in 2019. The decrease inand net interest incomemargin for 2020 was due to lower interest-earning asset2023 increased year-over-year, which primarily reflected higher loan yields, reflecting significantly lower benchmark interest rates in 2020,increased loan volume, and higher yields on interest-bearing cash and deposits with banks, and AFS debt securities, partially offset by a lowerhigher cost of funds. Netinterest-bearing deposits and higher short-term borrowings. The changes in yields and rates reflected higher benchmark interest margin for 2020 was 2.98%, a decrease of 66 basis points from 3.64% in 2019.rates.

Average interest-earning assets were $46.24$64.0 billion in 2020,2023, an increase of $5.92$4.7 billion or 15%8% from $40.32$59.3 billion in 2019. This was2022. The increase in average interest-earning assets primarily due toreflected loan growth, as well as increases of $1.19 billion in averageand higher interest-bearing cash and deposits with banks, and $1.17 billionpartially offset by decreases in averageassets purchased under resale agreements (“resale agreements”) and AFS debt securities. Average loans were $36.80 billion in 2020, an increase of $3.43 billion or 10% from $33.37 billion in 2019.
The yield on average interest-earning assets for 2020 was 3.45%, a decrease5.77% in 2023, an increase of 122 basis points186 bps from 4.67%3.91% in 2019.2022. The year-over-year increase in the yield compression reflected the loweron average loan yield, as well as yield compression for all other earning asset categories, in response to the lowinterest-earning assets primarily resulted from higher benchmark interest rate environment. rates.

The average loan yield for 2020 was 3.98%, a decrease6.40% in 2023, an increase of 117 basis points188 bps from 5.15%4.52% in 2019.2022. The year-over-year change in the average loan yield compression reflected materially lowerthe loan portfolio’s sensitivity to higher benchmark interest rates, including a 150 basis points reduction to the target federal funds rate in March 2020.rates. Approximately 65%58% and 64%62% of loans held-for-investment were variable-rate or hybrid loans in their adjustable rate period as of December 31, 20202023 and 2019,2022, respectively.
Deposits are an important source of funds and impact both net interest income and net interest margin. Average total deposits were $40.76$55.0 billion in 2020,2023, an increase of $4.71$663 million or 1% from $54.3 billion in 2022. Average noninterest-bearing deposits were $17.2 billion in 2023, a decrease of $5.6 billion or 13%25% from $36.05$22.8 billion in 2019.2022. Average noninterest-bearing demand deposits were $13.82 billionmade up 31% and 42% of average deposits for 2023 and 2022, respectively.
The average cost of deposits was 2.19% in 2020,2023, an increase of $3.32 billion or 32%173 bps from $10.50 billion0.46% in 2019. Average2022. The average cost of interest-bearing deposits were $26.94 billionwas 3.19% in 2020,2023, an increase of $1.39 billion or 5%239 bps from $25.55 billion0.80% in 2019. Due2022. The year-over-year increases reflected higher rates paid on time deposits, money market and checking deposits, and the customer migration to higher yielding deposit products in response to the strong growth in average noninterest-bearing deposits, the share of noninterest-bearing demand deposits increased to 34% of average total deposits in 2020, compared with 29% in 2019.higher interest rate environment.
The average cost of funds calculation includes deposits, short-term borrowings, FHLB advances, assets sold under repurchase agreements (“repurchase agreements”) and long-term debt. In 2023, the average cost of funds was 2.35%, an increase of 185 bps from 0.50% in 20202022. The year-over-year increase was 0.51%, a decrease of 61 basis points from 1.12% in 2019. The decreasemainly driven by the change in the average cost of funds primarily reflected a 150 basis points reduction to the target federal funds rate in March 2020. The average cost of interest-bearing deposits decreased 78 basis points to 0.69% in 2020, from 1.47% in 2019. Other sources of funding included in the calculation of the average cost of funds primarily consist of long-term debt, FHLB advances, repurchase agreements, and short-term borrowings.discussed above.
The Company utilizes various tools to manage interest rate risk. Refer to the “Interest Rate Risk Management” section of Item 7. MD&A — Risk Management — Market Risk Management for details.
The following table presents the interest spread, net interest margin, average balances, interest income and expense, and the average yield/rate by asset and liability component in 2020, 20192023, 2022 and 2018:2021:
| | | ($ in thousands) | | Year Ended December 31, |
| 2020 | | 2019 | | 2018 |
| | | Year Ended December 31, | |
| | Year Ended December 31, | |
| | Year Ended December 31, | |
| | Year Ended December 31, | |
| | Year Ended December 31, | |
| | Year Ended December 31, | |
| | Year Ended December 31, | |
| | Year Ended December 31, | |
| | Year Ended December 31, | |
| | Year Ended December 31, | |
| | Year Ended December 31, | |
| | Year Ended December 31, | |
| | Year Ended December 31, | |
| | Year Ended December 31, | |
| | Year Ended December 31, | |
| | Year Ended December 31, | |
| | Year Ended December 31, | |
| | Year Ended December 31, | |
| | Year Ended December 31, | |
| | Year Ended December 31, | |
| | Year Ended December 31, | |
| | Year Ended December 31, | |
| | Year Ended December 31, | |
| | Year Ended December 31, | |
| | Year Ended December 31, | |
| | Year Ended December 31, | |
| | Year Ended December 31, | |
| | Year Ended December 31, | |
| | Year Ended December 31, | |
| | Year Ended December 31, | |
| | Year Ended December 31, | |
| | Year Ended December 31, | |
| | Year Ended December 31, | |
| | Year Ended December 31, | |
| | Year Ended December 31, | |
| | Year Ended December 31, | |
| | Year Ended December 31, | |
| | Year Ended December 31, | |
| | Year Ended December 31, | |
| | Year Ended December 31, | |
| | Year Ended December 31, | |
| | Year Ended December 31, | |
| | Year Ended December 31, | |
| | Year Ended December 31, | |
| | Year Ended December 31, | |
| | Year Ended December 31, | |
| | Year Ended December 31, | |
| | Year Ended December 31, | |
| | Year Ended December 31, | |
| | Year Ended December 31, | |
| | Year Ended December 31, | |
| | Year Ended December 31, | |
| | Year Ended December 31, | |
| | Year Ended December 31, | |
| | Year Ended December 31, | |
| | Year Ended December 31, | |
| | 2023 | | | | 2023 | | 2022 | | 2021 |
| ($ in thousands) | ($ in thousands) | | Average
Balance | | Interest | | Average
Yield/
Rate | | Average
Balance | | Interest | | Average
Yield/
Rate | | Average
Balance | | Interest | | Average
Yield/
Rate | ($ in thousands) | | Average Balance | | Interest | | Average Yield/Rate | | Average Balance | | Interest | | Average Yield/Rate | | Average Balance | | Interest | | Average Yield/Rate |
| | Interest-earning assets: | |
| Interest-earning assets: | |
| Interest-bearing cash and deposits with banks | Interest-bearing cash and deposits with banks | | $ | 4,236,430 | | | $ | 25,175 | | | 0.59 | % | | $ | 3,050,954 | | | $ | 66,518 | | | 2.18 | % | | $ | 2,609,463 | | | $ | 54,700 | | | 2.10 | % |
Assets purchased under resale agreements (“resale agreements”) (1) | | 1,101,434 | | | 21,389 | | | 1.94 | % | | 969,384 | | | 28,061 | | | 2.89 | % | | 1,020,822 | | | 29,432 | | | 2.88 | % |
AFS debt securities (2)(3) | | 4,023,668 | | | 82,553 | | | 2.05 | % | | 2,850,476 | | | 67,838 | | | 2.38 | % | | 2,773,152 | | | 60,911 | | | 2.20 | % |
Loans (4)(5) | | 36,799,017 | | | 1,464,382 | | | 3.98 | % | | 33,373,136 | | | 1,717,415 | | | 5.15 | % | | 30,230,014 | | | 1,503,514 | | | 4.97 | % |
| Interest-bearing cash and deposits with banks | |
| Interest-bearing cash and deposits with banks | | | $ | 4,638,630 | | | $ | 220,643 | | | 4.76 | % | | $ | 3,127,234 | | | $ | 41,113 | | | 1.31 | % | | $ | 6,071,896 | | | $ | 15,531 | | | 0.26 | % |
| Resale agreements | | Resale agreements | | 691,223 | | | 20,164 | | | 2.92 | % | | 1,398,080 | | | 29,767 | | | 2.13 | % | | 2,107,157 | | | 32,239 | | | 1.53 | % |
AFS debt securities (1)(2) | | AFS debt securities (1)(2) | | 6,105,999 | | | 225,592 | | | 3.69 | % | | 6,629,945 | | | 152,514 | | | 2.30 | % | | 8,281,234 | | | 143,983 | | | 1.74 | % |
Held-to-maturity (“HTM”) debt securities (1) | | Held-to-maturity (“HTM”) debt securities (1) | | 2,976,237 | | | 50,598 | | | 1.70 | % | | 2,756,382 | | | 46,392 | | | 1.68 | % | | — | | | — | | | — | % |
| Loans: | |
| C&I | |
| C&I | |
| C&I | | | 15,499,899 | | | 1,190,940 | | | 7.68 | % | | 15,013,560 | | | 715,778 | | | 4.77 | % | | 13,656,720 | | | 472,260 | | | 3.46 | % |
| CRE | | CRE | | 19,824,272 | | | 1,227,795 | | | 6.19 | % | | 17,896,853 | | | 791,839 | | | 4.42 | % | | 15,322,059 | | | 514,921 | | | 3.36 | % |
| Residential mortgage | | Residential mortgage | | 14,155,784 | | | 750,813 | | | 5.30 | % | | 12,315,334 | | | 538,255 | | | 4.37 | % | | 10,601,638 | | | 435,264 | | | 4.11 | % |
| Other consumer | | Other consumer | | 65,181 | | | 3,198 | | | 4.91 | % | | 93,711 | | | 2,429 | | | 2.59 | % | | 136,280 | | | 2,455 | | | 1.80 | % |
Total loans (3)(4) | | Total loans (3)(4) | | 49,545,136 | | | 3,172,746 | | | 6.40 | % | | 45,319,458 | | | 2,048,301 | | | 4.52 | % | | 39,716,697 | | | 1,424,900 | | | 3.59 | % |
| Restricted equity securities | Restricted equity securities | | 79,160 | | | 1,543 | | | 1.95 | % | | 76,854 | | | 2,468 | | | 3.21 | % | | 73,691 | | | 3,146 | | | 4.27 | % | Restricted equity securities | | 82,177 | | | 4,062 | | 4,062 | | | 4.94 | | 4.94 | % | | 77,963 | | | 3,144 | | 3,144 | | | 4.03 | | 4.03 | % | | 79,404 | | | 2,081 | | 2,081 | | | 2.62 | | 2.62 | % |
| Total interest-earning assets | Total interest-earning assets | | $ | 46,239,709 | | | $ | 1,595,042 | | | 3.45 | % | | $ | 40,320,804 | | | $ | 1,882,300 | | | 4.67 | % | | $ | 36,707,142 | | | $ | 1,651,703 | | | 4.50 | % | Total interest-earning assets | | $ | 64,039,402 | | | $ | | $ | 3,693,805 | | | 5.77 | | 5.77 | % | | $ | 59,309,062 | | | $ | | $ | 2,321,231 | | | 3.91 | | 3.91 | % | | $ | 56,256,388 | | | $ | | $ | 1,618,734 | | | 2.88 | | 2.88 | % |
| Noninterest-earning assets: | Noninterest-earning assets: | | | | | | | | | | | | | | | | | | |
| Cash and due from banks | Cash and due from banks | | 528,406 | | | 471,060 | | | 445,768 | | |
| Cash and due from banks | |
| Cash and due from banks | |
| Allowance for loan losses | |
| Allowance for loan losses | |
| Allowance for loan losses | Allowance for loan losses | | (577,560) | | | (330,125) | | | (298,600) | | |
| Other assets | Other assets | | 2,747,238 | | | 2,023,146 | | | 1,688,259 | | |
| Other assets | |
| Other assets | |
| Total assets | |
| Total assets | |
| Total assets | Total assets | | $ | 48,937,793 | | | $ | 42,484,885 | | | $ | 38,542,569 | | |
| LIABILITIES AND STOCKHOLDERS’ EQUITY | LIABILITIES AND STOCKHOLDERS’ EQUITY | | | | | |
| LIABILITIES AND STOCKHOLDERS’ EQUITY | |
| LIABILITIES AND STOCKHOLDERS’ EQUITY | |
| Interest-bearing liabilities: | Interest-bearing liabilities: | |
Checking deposits (6) | | $ | 5,357,934 | | | $ | 24,213 | | | 0.45 | % | | $ | 5,244,867 | | | $ | 58,168 | | | 1.11 | % | | $ | 4,477,793 | | | $ | 34,657 | | | 0.77 | % |
Money market deposits (6) | | 9,881,284 | | | 42,720 | | | 0.43 | % | | 8,220,236 | | | 111,081 | | | 1.35 | % | | 7,985,526 | | | 83,696 | | | 1.05 | % |
Saving deposits (6) | | 2,234,913 | | | 6,398 | | | 0.29 | % | | 2,118,060 | | | 9,626 | | | 0.45 | % | | 2,245,644 | | | 8,621 | | | 0.38 | % |
Time deposits (6) | | 9,465,608 | | | 111,411 | | | 1.18 | % | | 9,961,289 | | | 196,927 | | | 1.98 | % | | 7,431,749 | | | 107,778 | | | 1.45 | % |
| Short-term borrowings | | 108,398 | | | 1,504 | | | 1.39 | % | | 44,881 | | | 1,763 | | | 3.93 | % | | 32,222 | | | 1,398 | | | 4.34 | % |
| Interest-bearing liabilities: | |
| Interest-bearing liabilities: | |
| Checking deposits | |
| Checking deposits | |
| Checking deposits | | | $ | 7,658,414 | | | $ | 179,200 | | | 2.34 | % | | $ | 6,696,200 | | | $ | 29,808 | | | 0.45 | % | | $ | 6,543,817 | | | $ | 13,023 | | | 0.20 | % |
| Money market deposits | | Money market deposits | | 11,680,540 | | | 399,482 | | | 3.42 | % | | 12,443,437 | | | 107,442 | | | 0.86 | % | | 12,428,025 | | | 15,041 | | | 0.12 | % |
| Saving deposits | | Saving deposits | | 2,128,943 | | | 15,573 | | | 0.73 | % | | 2,901,940 | | | 8,550 | | | 0.29 | % | | 2,746,933 | | | 7,496 | | | 0.27 | % |
| Time deposits | | Time deposits | | 16,301,856 | | | 611,295 | | | 3.75 | % | | 9,473,744 | | | 106,038 | | | 1.12 | % | | 8,493,511 | | | 33,599 | | | 0.40 | % |
| Federal funds purchased and other short-term borrowings | | Federal funds purchased and other short-term borrowings | | 3,591,114 | | | 157,002 | | | 4.37 | % | | 81,719 | | | 1,801 | | | 2.20 | % | | 1,584 | | | 42 | | | 2.65 | % |
| FHLB advances | FHLB advances | | 664,370 | | | 13,792 | | | 2.08 | % | | 592,257 | | | 16,697 | | | 2.82 | % | | 327,435 | | | 10,447 | | | 3.19 | % | FHLB advances | | 123,288 | | | 6,430 | | 6,430 | | | 5.22 | | 5.22 | % | | 105,966 | | | 1,754 | | 1,754 | | | 1.66 | | 1.66 | % | | 404,789 | | | 6,881 | | 6,881 | | | 1.70 | | 1.70 | % |
Repurchase agreements (1) | | 350,849 | | | 11,766 | | | 3.35 | % | | 74,926 | | | 13,582 | | | 18.13 | % | | 50,000 | | | 12,110 | | | 24.22 | % |
| Repurchase agreements | | Repurchase agreements | | 34,443 | | | 1,497 | | | 4.35 | % | | 467,413 | | | 14,362 | | | 3.07 | % | | 306,845 | | | 7,999 | | | 2.61 | % |
| Long-term debt and finance lease liabilities | Long-term debt and finance lease liabilities | | 734,921 | | | 6,045 | | | 0.82 | % | | 152,445 | | | 6,643 | | | 4.36 | % | | 159,185 | | | 6,488 | | | 4.08 | % | Long-term debt and finance lease liabilities | | 152,790 | | | 11,072 | | 11,072 | | | 7.25 | | 7.25 | % | | 152,325 | | | 5,595 | | 5,595 | | | 3.67 | | 3.67 | % | | 151,955 | | | 3,082 | | 3,082 | | | 2.03 | | 2.03 | % |
| Total interest-bearing liabilities | Total interest-bearing liabilities | | $ | 28,798,277 | | | $ | 217,849 | | | 0.76 | % | | $ | 26,408,961 | | | $ | 414,487 | | | 1.57 | % | | $ | 22,709,554 | | | $ | 265,195 | | | 1.17 | % | Total interest-bearing liabilities | | $ | 41,671,388 | | | $ | | $ | 1,381,551 | | | 3.32 | | 3.32 | % | | $ | 32,322,744 | | | $ | | $ | 275,350 | | | 0.85 | | 0.85 | % | | $ | 31,077,459 | | | $ | | $ | 87,163 | | | 0.28 | | 0.28 | % |
| Noninterest-bearing liabilities and stockholders’ equity: | Noninterest-bearing liabilities and stockholders’ equity: | | | | | | | | | | | | | | |
Demand deposits (6) | | 13,823,152 | | | 10,502,618 | | | 11,089,537 | | |
| Demand deposits | |
| Demand deposits | |
| Demand deposits | |
| Accrued expenses and other liabilities | |
| Accrued expenses and other liabilities | |
| Accrued expenses and other liabilities | Accrued expenses and other liabilities | | 1,234,178 | | | 812,461 | | | 612,656 | | |
| Stockholders’ equity | Stockholders’ equity | | 5,082,186 | | | 4,760,845 | | | 4,130,822 | | |
| Stockholders’ equity | |
| Stockholders’ equity | |
| Total liabilities and stockholders’ equity | Total liabilities and stockholders’ equity | | $ | 48,937,793 | | | $ | 42,484,885 | | | $ | 38,542,569 | | |
| Total liabilities and stockholders’ equity | |
| Total liabilities and stockholders’ equity | |
| Interest rate spread | |
| Interest rate spread | |
| Interest rate spread | Interest rate spread | | | | 2.69 | % | | | | 3.10 | % | | | | 3.33 | % | | | | | | 2.45 | % | | | | | | 3.06 | % | | | | | | 2.60 | % |
| Net interest income and net interest margin | Net interest income and net interest margin | | $ | 1,377,193 | | | 2.98 | % | | $ | 1,467,813 | | | 3.64 | % | | $ | 1,386,508 | | | 3.78 | % | Net interest income and net interest margin | | | | $ | 2,312,254 | | | 3.61 | | 3.61 | % | | | | $ | 2,045,881 | | | 3.45 | | 3.45 | % | | | | $ | 1,531,571 | | | 2.72 | | 2.72 | % |
|
(1)Average balances of resale and repurchase agreements are reported net, pursuant to ASC 210-20-45-11, Balance Sheet Offsetting: Repurchase and Reverse Repurchase Agreements. The weighted-average yields of gross resale agreements were 1.94%, 2.66% and 2.63% for 2020, 2019 and 2018, respectively. The weighted-average interest rates of gross repurchase agreements were 3.25%, 4.74% and 4.46% for 2020, 2019 and 2018, respectively.
(2)Yields on tax-exempt debt securities are not presented on a tax-equivalent basis.
(3)(2)Includes the amortization of net premiums on AFS debt securities of $33.9$31 million, $10.9$72 million and $16.1$93 million for 2020, 20192023, 2022 and 2018,2021, respectively.
(4)(3)Average balances include nonperforming loans and loans held-for-sale.
(5)(4)Loans include the accretion of net deferred loan fees unearned fees and amortization of net premiums, which totaled $52.4$53 million, $36.8$50 million and $39.2$62 million for 2020, 20192023, 2022 and 2018,2021, respectively.
(6)Average balance of deposits for 2018 includes average deposits held-for-sale related to the sale of DCB branches.
The following table summarizes the extent to which changes in (1) interest rates;rates, and (2) volume of average interest-earning assets and average interest-bearing liabilities affected the Company’s net interest income for the periods presented. The total change for each category of interest-earning assets and interest-bearing liabilities is segmented into changes attributable to variations in volume and yield/rate. Changes that are not solely due to either volume or yield/rate are allocated proportionally based on the absolute value of the change related to average volume and average yield/rate.
| | | ($ in thousands) | | Year Ended December 31, |
| 2020 vs. 2019 | | 2019 vs. 2018 |
| Total
Change | | Changes Due to | | Total
Change | | Changes Due to |
| | | Year Ended December 31, | |
| | Year Ended December 31, | |
| | Year Ended December 31, | |
| | Year Ended December 31, | |
| | Year Ended December 31, | |
| | Year Ended December 31, | |
| | Year Ended December 31, | |
| | Year Ended December 31, | |
| | Year Ended December 31, | |
| | Year Ended December 31, | |
| | Year Ended December 31, | |
| | Year Ended December 31, | |
| | Year Ended December 31, | |
| | Year Ended December 31, | |
| | Year Ended December 31, | |
| | Year Ended December 31, | |
| | Year Ended December 31, | |
| | Year Ended December 31, | |
| | Year Ended December 31, | |
| | Year Ended December 31, | |
| | Year Ended December 31, | |
| | Year Ended December 31, | |
| | Year Ended December 31, | |
| | Year Ended December 31, | |
| | Year Ended December 31, | |
| | Year Ended December 31, | |
| | Year Ended December 31, | |
| | Year Ended December 31, | |
| | Year Ended December 31, | |
| | Year Ended December 31, | |
| | Year Ended December 31, | |
| | Year Ended December 31, | |
| | Year Ended December 31, | |
| | Year Ended December 31, | |
| | Year Ended December 31, | |
| | Year Ended December 31, | |
| | Year Ended December 31, | |
| | Year Ended December 31, | |
| | 2023 vs. 2022 | | | | 2023 vs. 2022 | | 2022 vs. 2021 |
| | Total Change | | | | Total Change | | Changes Due to | | Total Change | | Changes Due to |
| ($ in thousands) | ($ in thousands) | | Total
Change | | Volume | | Yield/Rate | | Total
Change | | Volume | | Yield/Rate | ($ in thousands) | | | Volume | | Yield/Rate | | | Volume | | Yield/Rate |
| | $ | (41,343) | | | $ | 19,300 | | | $ | (60,643) | | | $ | 11,818 | | | $ | 9,554 | | | $ | 2,264 | |
| | Interest-bearing cash and deposits with banks | |
| Resale agreements | Resale agreements | | (6,672) | | | 3,454 | | | (10,126) | | | (1,371) | | | (1,489) | | | 118 | |
| AFS debt securities | AFS debt securities | | 14,715 | | | 25,037 | | | (10,322) | | | 6,927 | | | 1,734 | | | 5,193 | |
| Loans | | (253,033) | | | 163,842 | | | (416,875) | | | 213,901 | | | 160,392 | | | 53,509 | |
| HTM debt securities | |
| Loans: | |
| C&I | |
| C&I | |
| C&I | |
| CRE | |
| Residential mortgage | |
| Other consumer | |
| Total loans | |
| Restricted equity securities | Restricted equity securities | | (925) | | | 72 | | | (997) | | | (678) | | | 130 | | | (808) | |
| Total interest and dividend income | Total interest and dividend income | | $ | (287,258) | | | $ | 211,705 | | | $ | (498,963) | | | $ | 230,597 | | | $ | 170,321 | | | $ | 60,276 | |
| Interest-bearing liabilities: | Interest-bearing liabilities: | |
| Checking deposits | Checking deposits | | $ | (33,955) | | | $ | 1,228 | | | $ | (35,183) | | | $ | 23,511 | | | $ | 6,666 | | | $ | 16,845 | |
| Checking deposits | |
| Checking deposits | |
| Money market deposits | Money market deposits | | (68,361) | | | 18,949 | | | (87,310) | | | 27,385 | | | 2,526 | | | 24,859 | |
| Saving deposits | Saving deposits | | (3,228) | | | 506 | | | (3,734) | | | 1,005 | | | (511) | | | 1,516 | |
| Time deposits | Time deposits | | (85,516) | | | (9,365) | | | (76,151) | | | 89,149 | | | 43,130 | | | 46,019 | |
| Short-term borrowings | | (259) | | | 1,387 | | | (1,646) | | | 365 | | | 507 | | | (142) | |
| Federal funds purchased and short-term borrowings | |
| FHLB advances | FHLB advances | | (2,905) | | | 1,864 | | | (4,769) | | | 6,250 | | | 7,590 | | | (1,340) | |
| Repurchase agreements | Repurchase agreements | | (1,816) | | | 16,640 | | | (18,456) | | | 1,472 | | | 5,028 | | | (3,556) | |
| Long-term debt and finance lease liabilities | Long-term debt and finance lease liabilities | | (598) | | | 8,397 | | | (8,995) | | | 155 | | | (282) | | | 437 | |
| Total interest expense | Total interest expense | | $ | (196,638) | | | $ | 39,606 | | | $ | (236,244) | | | $ | 149,292 | | | $ | 64,654 | | | $ | 84,638 | |
| Change in net interest income | Change in net interest income | | $ | (90,620) | | | $ | 172,099 | | | $ | (262,719) | | | $ | 81,305 | | | $ | 105,667 | | | $ | (24,362) | |
|
Noninterest Income
The following table presents the components of noninterest income for the periods indicated:
| | | | Year Ended December 31, | |
| | | Year Ended December 31, | |
| | | Year Ended December 31, | |
| | ($ in thousands) | ($ in thousands) | | Year Ended December 31, |
| | Change from 2019 | |
| 2020 | | 2019 | | $ | | % | | 2018 | | 2023 | | 2022 | | | | % Change from 2022 | | 2021 |
| Lending fees | Lending fees | | $ | 74,842 | | | $ | 63,670 | | $ | 11,172 | | 18 | % | | $ | 59,758 |
| Deposit account fees | Deposit account fees | | 48,148 | | | 38,648 | | 9,500 | | 25 | % | | 39,176 |
| Interest rate contracts and other derivative income | | 31,685 | | | 39,865 | | (8,180) | | (21) | % | | 18,980 |
| Customer derivative income | |
| Foreign exchange income | Foreign exchange income | | 22,370 | | | 26,398 | | (4,028) | | (15) | % | | 21,259 |
| Wealth management fees | Wealth management fees | | 17,494 | | | 16,547 | | 947 | | 6 | % | | 13,624 |
| Net gains on sales of loans | Net gains on sales of loans | | 4,501 | | | 4,035 | | 466 | | 12 | % | | 6,590 |
| Gains on sales of AFS debt securities | | 12,299 | | | 3,930 | | 8,369 | | 213 | % | | 2,535 |
| Net (losses) gains on AFS debt securities | |
| | Net gain on sale of business | | — | | | — | | — | | — | % | | 31,470 |
| | Other investment income | |
| | Other investment income | |
| | Other investment income | Other investment income | | 10,641 | | | 18,117 | | (7,476) | | (41) | % | | 7,731 |
| Other income | Other income | | 13,567 | | | 11,035 | | 2,532 | | 23 | % | | 16,310 |
| Total noninterest income | Total noninterest income | | $ | 235,547 | | | $ | 222,245 | | $ | 13,302 | | 6 | % | | $ | 217,433 |
|
NM - Not meaningful
Noninterest income comprised 15%11% and 13% of total revenue in 20202023 and 2019,2022, respectively. 2020 noninterestNoninterest income for 2023 was $235.5$295 million, compared with $299 million in 2022. The decrease was primarily due to lower customer derivative income and net losses on AFS debt securities, partially offset by increases in other income, lending fees, and foreign exchange income.
Lending fees were $84 million in 2023, an increase of $13.3$5 million or 6%, compared with $222.2$79 million in 2019. This2022. The year-over-year increase was driven by higher unused commitment and letter of credit facility fees.
Customer derivative income was $20 million in 2023, a decrease of $9 million or 30%, compared with $29 million in 2022. The year-over-year decrease was primarily due to unfavorable credit valuation adjustments, partially offset by higher transaction volume, interest received on derivative collateral posted and energy contract income.
Foreign exchange income was $52 million, an increase of $4 million or 9%, compared with $48 million in 2022. The year-over-year increase was primarily due to increases in lending fees, deposit account fees andhigher gains on salesforeign exchange trades, partially offset by the unfavorable valuation of certain foreign currency denominated balance sheet items.
Net losses on AFS debt securities of $7 million in 2023 were due to a $10 million write-off of an impaired subordinated AFS debt security during the first quarter of 2023, partially offset by decreasesa $3 million gain when the security was sold in interest rate contracts and other derivative income, and other investment income.the fourth quarter of 2023. In comparison, net gains on AFS debt securities were $1 million in 2022.
Lending fees were $74.8Other income was $16 million in 2020,2023, an increase of $11.1$5 million or 18%41%, compared with $63.7$11 million in 2019. This2022. The year-over-year increase was primarily due to valuation gains on warrants received as part of lending relationships and the subsequent exercise of warrants during the fourth quarter of 2020.higher income from bank-owned life insurance policies.
Deposit account fees were $48.1 million in 2020, an increase of $9.5 million or 25%, compared with $38.6 million in 2019. This increase was primarily due to an increase in customer-driven transactions.
Interest rate contracts and other derivative income was $31.7 million in 2020, a decrease of $8.2 million or 21%, compared with $39.9 million in 2019. This decrease was primarily due to the impact of negative credit valuation adjustments, which reflected higher loss probabilities for borrowers impacted by the COVID-19 pandemic, as well as a decline in customer interest rate swap transactions.
Gains on sales of AFS debt securities were $12.3 million in 2020, an increase of $8.4 million or 213%, compared with $3.9 million in 2019. This increase primarily reflected gains recorded from $131.6 million in sales of municipal bonds during the second quarter of 2020.
Other investment income was $10.6 million in 2020, a decrease of $7.5 million or 41%, compared with $18.1 million in 2019. This decrease was due to reduced earnings from CRA tax credit investments accounted for under the equity method, and decreased distributions from investments in qualified affordable housing partnerships.
Noninterest Expense
The following table presents the components of noninterest expense for the periods indicated:
| | | | | | | | | | | | | | | | | | | | | | | | | | | | | | | | |
|
| ($ in thousands) | | Year Ended December 31, |
| | | | | Change from 2019 | | |
| 2020 | | 2019 | | $ | | % | | 2018 |
| Compensation and employee benefits | | $ | 404,071 | | | $ | 401,700 | | | $ | 2,371 | | | 1 | % | | $ | 379,622 | |
| Occupancy and equipment expense | | 66,489 | | | 69,730 | | | (3,241) | | | (5) | % | | 68,896 | |
| Deposit insurance premiums and regulatory assessments | | 15,128 | | | 12,928 | | | 2,200 | | | 17 | % | | 21,211 | |
| Deposit account expense | | 13,530 | | | 14,175 | | | (645) | | | (5) | % | | 11,244 | |
| Data processing | | 16,603 | | | 13,533 | | | 3,070 | | | 23 | % | | 13,177 | |
| Computer software expense | | 29,033 | | | 26,471 | | | 2,562 | | | 10 | % | | 22,286 | |
| Consulting expense | | 5,391 | | | 9,846 | | | (4,455) | | | (45) | % | | 11,579 | |
| Legal expense | | 7,766 | | | 8,441 | | | (675) | | | (8) | % | | 8,781 | |
| Other operating expense | | 79,489 | | | 92,249 | | | (12,760) | | | (14) | % | | 88,042 | |
| Amortization of tax credit and other investments | | 70,082 | | | 98,383 | | | (28,301) | | | (29) | % | | 96,152 | |
| Repurchase agreements’ extinguishment cost | | 8,740 | | | — | | | 8,740 | | | 100 | % | | — | |
| Total noninterest expense | | $ | 716,322 | | | $ | 747,456 | | | $ | (31,134) | | | (4) | % | | $ | 720,990 | |
Efficiency ratio (1) | | 44.42 | % | | 44.23 | % | | | | | | 44.95 | % |
|
(1)Refer to Item 7. MD&A — Reconciliation of GAAP to Non-GAAP Financial Measures in this Form 10-K for the detailed calculation of GAAP and non-GAAP efficiency ratios. | | | | | | | | | | | | | | | | | | | | | | | | | | | | | | | | |
| | | | |
| | Year Ended December 31, | | | | |
| | | | | | | | | | | | | | |
| ($ in thousands) | | 2023 | | 2022 | | | | % Change from 2022 | | 2021 | | | | |
| Compensation and employee benefits | | $ | 508,538 | | | $ | 477,635 | | | | | 6 | % | | $ | 433,728 | | | | | |
| Occupancy and equipment expense | | 62,763 | | | 62,501 | | | | | 0 | % | | 62,996 | | | | | |
| Deposit insurance premiums and regulatory assessments | | 103,308 | | | 19,449 | | | | | 431 | % | | 17,563 | | | | | |
| Deposit account expense | | 43,143 | | | 25,508 | | | | | 69 | % | | 16,152 | | | | | |
| | | | | | | | | | | | | | |
| | | | | | | | | | | | | | |
| | | | | | | | | | | | | | |
| | | | | | | | | | | | | | |
| Computer software and data processing expenses | | 44,475 | | | 42,776 | | | | | 4 | % | | 46,863 | | | | | |
| Other operating expense | | 140,222 | | | 118,166 | | | | | 19 | % | | 96,330 | | | | | |
| Amortization of tax credit and other investments | | 120,299 | | | 113,358 | | | | | 6 | % | | 122,457 | | | | | |
| | | | | | | | | | | | | | |
| Total noninterest expense | | $ | 1,022,748 | | | $ | 859,393 | | | | | 19 | % | | $ | 796,089 | | | | | |
| | | | |
2020 noninterestNoninterest expense was $716.3 million, a decrease$1.0 billion in 2023, an increase of $31.2$163 million or 4%19%, compared with $747.5$859 million in 2019. This decrease2022. The increase was primarily due to decreases in amortization of tax credithigher deposit insurance premiums and other investments,regulatory assessments, compensation and employee benefits, other operating expense, partially offset by repurchase agreements’ extinguishment cost.and deposit account expense.
Amortization of tax creditCompensation and other investments was $70.1employee benefits were $509 million in 2020, a decrease2023, an increase of $28.3$31 million or 29%6%, compared with $98.4$478 million in 2019. This2022. The year-over-year changeincrease was primarily due to the recognition pattern of productionwage increases and renewable energy tax credit investments placed in service; $10.7 million of recoveries recorded in the fourth quarter of 2020 related to DC Solar tax credit investments, and lower OTTI charges. In 2020, there were $5.2 million of OTTI charges related to three historic tax credit investments and a CRA investment. In comparison, during 2019, there were $7.6 million of OTTI charges related to five historic tax credit investments and a CRA investment, as well as $5.4 million of net OTTI charges related to DC Solar tax credit investments.staffing growth.
41Deposit insurance premiums and regulatory assessments were $103 million in 2023, an increase of $84 million or 431%, compared with $19 million in 2022. The year-over-year increase was primarily due to a $70 million FDIC charge incurred as a result of the final rule implemented to recover losses in the DIF following the failures of financial institutions in the first quarter of 2023, and a two bps increase in the base deposit insurance assessment rate under the FDIC’s Amended Restoration Plan.
Deposit account expense was $43 million in 2023, an increase of $18 million or 69%, compared with $26 million in 2022. The year-over-year increase primarily reflected an increase in deposit referral fees which were driven by higher interest rates and an increase in insured cash sweep product fees due to higher deposit balances. Such deposit referral fees are variable fees, sensitive to market rates and paid in lieu of interest on a small portion of the Bank’s deposit balances.
Other operating expense primarily consists of telecommunications and postage, loan related expenses, marketing, other real estate owned expense (“OREO”), charitable contributions, travel, and other miscellaneous expense categories. Other operating expense was $79.5$140 million in 2020, a decrease2023, an increase of $12.7$22 million or 14%19%, compared with $92.2$118 million in 2019. This decrease2022. The year-over-year increase was largely driven by lower travelprimarily due to higher corporate expenses and marketing expenses,an increase in interest expense paid on cash collateral, partially offset by a write-down on OREO.
In the second quarter of 2020, the Company prepaid $150.0 million of repurchase agreements and incurred a debt extinguishment cost of $8.7 million. No such expense was incurredreduction in 2019.
Efficiency ratio, calculated as noninterest expense divided by total revenue, was 44.42% and 44.23% in 2020 and 2019, respectively. Non-GAAP efficiency ratio, adjusted for the amortization of tax credit and other investments, the amortization of core deposit intangibles, and repurchase agreements’ extinguishment cost (where applicable), was 39.30% in 2020, an increase of 116 basis points from 38.14% in 2019. For additional detail, see the reconciliations of non-GAAP measures presented under Item 7. MD&A — Reconciliation of GAAP to Non-GAAP Financial Measures in this Form 10-K.foreclosure expenses.
Income Taxes
| | | | | | | | | | | | | | | | | | | | |
|
| ($ in thousands) | | Year Ended December 31, |
| 2020 | | 2019 | | 2018 |
| Income before income taxes | | $ | 685,765 | | | $ | 843,917 | | | $ | 818,696 | |
| Income tax expense | | $ | 117,968 | | | $ | 169,882 | | | $ | 114,995 | |
| Effective tax rate | | 17.2 | % | | 20.1 | % | | 14.0 | % |
|
2020The following table presents the income before income taxes, income tax expense was $118.0 million, and the effective tax rate for the periods indicated:
| | | | | | | | | | | | | | | | | | | | |
|
| | Year Ended December 31, |
| ($ in thousands) | | 2023 | | 2022 | | 2021 |
| Income before income taxes | | $ | 1,459,770 | | | $ | 1,411,654 | | | $ | 1,056,377 | |
| Income tax expense | | $ | 298,609 | | | $ | 283,571 | | | $ | 183,396 | |
| Effective tax rate | | 20.5 | % | | 20.1 | % | | 17.4 | % |
|
Income tax expense was 17.2%,$299 million in 2023, compared with 2019 income tax expense of $169.9$284 million andin 2022, resulting in an effective tax rate of 20.5% and 20.1%. 2020, respectively. The increase in the income tax expense included $5.1 million in uncertain tax position related to the Company’s investment in DC Solar. The higher effective tax rate in 2019 was primarily due to $30.1 million of additional income tax expense recorded to reverse certain previously claimed tax credits related to the Company’s investment in DC Solar.
Management regularly reviews the Company’s tax positions and deferred tax balances. Factors considered in this analysis include the Company’s ability to generate future taxable income, implement tax-planning strategies (as defined in ASC 740, Income Taxes) and utilize taxable income from prior carryback years (if such carryback is permitted under the applicable tax law), as well as future reversals of existing taxable temporary differences. The Company accounts for income taxes using the asset and liability approach, the objective of which is to establish deferred tax assets and liabilities for the temporary differences between the financial reporting basis and the tax basis of the Company’s assets and liabilities at enacted tax rates expected to be in effect when such amounts are realized and settled. Net deferred tax assets increased $57.3 million or 53.8% to $163.8 million as of December 31, 2020, compared with $106.5 million as of December 31, 2019. This increase was mainly due to an increase in allowance for credit losses due to the Company’s CECL adoption,pre-tax net income, which was partially offset by an increase in deferred tax liabilities arisingcredits. The differences between the 2023 and 2022 effective tax rates from net unrealized loss on securities. For additional details on the componentsfederal statutory rate of net deferred21% were primarily due to tax assets, seecredits associated with renewable energy, historic and new market tax credit related projects and state taxes as described in Note 11 — Income Taxes to the Consolidated Financial Statements in this Form 10-K.
A valuation allowance is used, as needed, to reduce the deferred tax assets to the amount that is more-likely-than-not to be realized. To determine whether a valuation allowance is needed, the Company considers evidence such as the Company’s ability to generate future taxable income, implement tax-planning strategies (as defined in ASC 740, Income Taxes), and utilize taxable income from prior carryback years (if such carryback is permitted under the applicable tax law), as well as future reversals of existing taxable temporary differences. The Company expects to have sufficient taxable income in future years to fully realize its deferred tax assets. The Company also performed an overall assessment by weighing all positive evidence against all negative evidence, and concluded that it is more-likely-than-not that all of the benefits of the deferred tax assets will be realized, with the exception of the deferred tax assets related to certain state net operating losses (“NOL”) carryforwards. As of December 31, 2020, management released $21 thousand of valuation allowance provided as of December 31, 2019, which related to the state NOL carryforwards. No additional valuation allowance was recorded as of December 31, 2020. For additional details on the components of net deferred tax assets, see Note 11 — Income Taxes to the Consolidated Financial Statements in this Form 10-K.
Impact of Investment in DC Solar Tax Credit Funds
The Company invested in four solar energy tax credit funds in the years 2014, 2015, 2017 and 2018 as a limited member. These tax credit funds engaged in the acquisition and leasing of mobile solar generators through DC Solar entities. The Company’s investments in the DC Solar tax credit funds qualified for federal energy tax credit under Section 48 of the Internal Revenue Code of 1986, as amended. The Company also received a “should” level legal opinion from an external law firm supporting the legal structure of the investments for tax credit purposes. These investments were recorded in Investments in tax credit and otherinvestments, net on the Consolidated Balance Sheet and were accounted for under the equity method of accounting. DC Solar had its assets frozen in December 2018 and filed for bankruptcy protection in February 2019. In February 2019, an affidavit from the Federal Bureau of Investigation special agent stated that DC Solar was operating a fraudulent “Ponzi-like scheme” and that the majority of the mobile solar generators sold to investors and managed by DC Solar, as well as the majority of the related lease revenues claimed to have been received by DC Solar might not have existed. In January 2020, the owners of DC Solar pleaded guilty to charges of conspiracy to commit wire fraud and money laundering in a Ponzi scheme related to DC Solar.
During 2019, the Company fully wrote off the remainder of its tax credit investments related to DC Solar, recorded a $7.0 million OTTI charge and a subsequent $1.6 million recovery. During 2020, the Company further recorded $10.7 million in recoveries, of which $1.1 million is recorded as an impairment recovery. The recoveries were recorded in Amortization of tax credit and other investments, net on the Consolidated Statement of Income. There were no balances in Accrued expenses and other liabilities — Unfunded commitments related to DC Solar as of December 31, 2020 and 2019. More discussion on the Company’s impairment evaluation and monitoring process of tax credit investments is provided in Note 2 — Fair Value Measurement and Fair Value of Financial Instruments to the Consolidated Financial Statements in this Form 10-K.
ASC 740-10-25-6 states in part, that an entity shall initially recognize the financial statement effects of a tax position when it is more-likely-than-not, based on the technical merits, that the position will be sustained upon examination. The term “more-likely-than-not” means a likelihood of more than 50 percent; the terms “examined” and “upon examination” include resolution of the related appeals or litigation processes, if any. The level of evidence that is necessary and appropriate to support the technical merits of a tax position is subject to judgment and depends on available information as of the balance sheet date. The Company received a “should” level legal opinion from an external law firm supporting the legal structure of these investments for tax credit purposes. A subsequent measurement of a tax position is based on management’s best judgment given the facts, circumstances and information available at the latest quarterly reporting date. A change in judgment that results in a subsequent derecognition or change in measurement of a tax position is recognized as a discrete item in the period in which the change occurs.
Investors in DC Solar funds, including the Company, received tax credits for making renewable energy investments. Between 2014 and 2018, the Company had invested in four DC Solar energy tax credit funds and claimed tax credits of approximately $53.9 million, partially reduced by a deferred tax liability of $5.7 million related to the 50% tax basis reduction, for a net impact of $48.2 million to the Consolidated Financial Statements.
In 2019, the Company, in coordination with other fund investors, engaged an unaffiliated third-party inventory firm to investigate the actual number of mobile solar generators in existence. Based on the inventory report, none of the mobile service generators that had been purchased by the Company’s 2017 and 2018 tax credit funds were found. On the other hand, a vast majority of the mobile solar generators purchased by the Company’s 2014 and 2015 tax credit funds were found. In 2019, the Company reversed $33.6 million out of $53.9 million in previously claimed tax credits, and $3.5 million out of $5.7 million deferred tax liability, resulting in $30.1 million of additional income tax expense. Based on management’s best judgments regarding the future settlement of the related tax positions with the IRS, the Company recorded $5.1 million in uncertain tax position related to its investments in DC Solar in 2020. The Company’s investigation related to this matter is ongoing. For additional information on the risks surrounding the Company’s investments in tax-advantaged projects, see Item 1A. Risk Factors in this Form 10-K.
Operating Segment Results
The Company organizes its operations into three reportable operating segments: (1) Consumer and Business Banking; (2) Commercial Banking; and (3) Other. These segments are defined by the type of customers served, and the related products and services provided. The segments reflect how financial information is currently evaluated by management. For additionala description of the Company’s internal management reporting process, including the segment cost allocation methodology, see Note 1817 — Business Segments to the Consolidated Financial Statements in this Form 10-K.
Segment net interest income represents the difference between actual interest earned on assets and interest incurred on liabilities of the segment, adjusted for funding charges or credits through the Company’s internal funds transfer pricing (“FTP”) process. The process was effective in the current market conditions as of December 31, 2020.
The following tables presenttable presents the results by operating segment for the periods indicated:
| | | | Year Ended December 31, | |
| | Year Ended December 31, |
| | Year Ended December 31, | |
| | Consumer and Business Banking | | Commercial Banking | | Other | |
| | Year Ended December 31, | |
| | Consumer and Business Banking | |
| | ($ in thousands) | ($ in thousands) | | 2020 | | 2019 | | 2018 | | 2020 | | 2019 | | 2018 | | 2020 | | 2019 | | 2018 | |
| Total revenue | | $ | 597,944 | | | $ | 754,471 | | | $ | 812,822 | | | $ | 845,651 | | | $ | 786,035 | | | $ | 715,937 | | | $ | 169,145 | | | $ | 149,552 | | | $ | 75,182 | | |
| Provision for credit losses | | 3,885 | | | 14,178 | | | 9,364 | | | 206,768 | | | 84,507 | | | 54,891 | | | — | | | — | | | — | | |
| | ($ in thousands) | |
| | ($ in thousands) | |
| Total revenue (loss) | |
| Total revenue (loss) | |
| Total revenue (loss) | |
| Provision for (reversal of) credit losses | |
| Provision for (reversal of) credit losses | |
| Provision for (reversal of) credit losses | |
| Noninterest expense | |
| Noninterest expense | |
| Noninterest expense | Noninterest expense | | 331,750 | | | 343,001 | | | 341,396 | | | 266,923 | | | 263,064 | | | 237,520 | | | 117,649 | | | 141,391 | | | 142,074 | | |
| Segment income (loss) before income taxes | Segment income (loss) before income taxes | | 262,309 | | | 397,292 | | | 462,062 | | | 371,960 | | | 438,464 | | | 423,526 | | | 51,496 | | | 8,161 | | | (66,892) | | |
| Segment income (loss) before income taxes | |
| Segment income (loss) before income taxes | |
| Segment net income | |
| Segment net income | |
| Segment net income | Segment net income | | $ | 187,931 | | | $ | 284,161 | | | $ | 330,683 | | | $ | 266,342 | | | $ | 313,833 | | | $ | 303,553 | | | $ | 113,524 | | | $ | 76,041 | | | $ | 69,465 | | |
|
Consumer and Business Banking
The Consumer and Business Banking segment primarily provides financial products and services to consumer and commercial customers through the Company’s domestic branch network.network and digital banking platform. This segment offers consumer and commercial deposits, mortgage and home equity loans, and other products and services. It also originates commercial loans for small- and medium-sized enterprises.enterprises through the Company’s branch network. Other products and services provided by this segment include wealth management, treasury management, interest rate risk hedging and foreign exchange services. The integration of digital channels and our brick and mortar channels has been a priority for the Bank. The Company is developing a digital consumer banking platform to enhance the customer user experience and offer a full suite of banking services. Customer adoption of the digital banking application is in progress, and has contributed to growth in segment fee income and deposit growth in 2020.
The following table presents additional financial information for the Consumer and Business Banking segment for the periods indicated:
| | | | Year Ended December 31, | |
| | Year Ended December 31, | |
| | Year Ended December 31, | |
| | Year Ended December 31, | |
| | Year Ended December 31, | |
| | Year Ended December 31, | |
| | Year Ended December 31, | |
| | Year Ended December 31, | |
| | Year Ended December 31, | |
| | Year Ended December 31, | |
| | Year Ended December 31, | |
| | Year Ended December 31, | |
| | Year Ended December 31, | |
| | Year Ended December 31, | |
| | Year Ended December 31, | |
| | Year Ended December 31, | |
| | Year Ended December 31, | |
| | Year Ended December 31, | |
| | Year Ended December 31, | |
| | Year Ended December 31, | |
| | Year Ended December 31, | |
| | Year Ended December 31, | |
| | Year Ended December 31, | |
| | Year Ended December 31, | |
| | Year Ended December 31, | |
| | Year Ended December 31, | |
| | Year Ended December 31, | |
| | Year Ended December 31, | |
| | Year Ended December 31, | |
| | Year Ended December 31, | |
| | Year Ended December 31, | |
| | Year Ended December 31, | |
| | Year Ended December 31, | |
| | | | | | Change from 2022 | |
| ($ in thousands) | ($ in thousands) | | Year Ended December 31, |
| | Change from 2019 | |
| 2020 | | 2019 | | $ | | % | | 2018 | | 2023 | | 2022 | | $ | | % | | 2021 |
| Net interest income before provision for credit losses | | $ | 530,829 | | | $ | 696,551 | | | $ | (165,722) | | | (24) | % | | $ | 727,215 | |
| Net interest income before provision for (reversal of) credit losses | |
| Noninterest income | Noninterest income | | 67,115 | | | 57,920 | | | 9,195 | | | 16 | % | | 85,607 | |
| Total revenue | Total revenue | | 597,944 | | | 754,471 | | | (156,527) | | | (21) | % | | 812,822 | |
| Provision for credit losses | | 3,885 | | | 14,178 | | | (10,293) | | | (73) | % | | 9,364 | |
| Provision for (reversal of) credit losses | |
| Noninterest expense | Noninterest expense | | 331,750 | | | 343,001 | | | (11,251) | | | (3) | % | | 341,396 | |
| Segment income before income taxes | Segment income before income taxes | | 262,309 | | | 397,292 | | | (134,983) | | | (34) | % | | 462,062 | |
| Income tax expense | |
| Segment net income | Segment net income | | $ | 187,931 | | | $ | 284,161 | | | $ | (96,230) | | | (34) | % | | $ | 330,683 | |
| Average loans | Average loans | | $ | 12,056,987 | | | $ | 10,647,814 | | | $ | 1,409,173 | | | 13 | % | | $ | 9,469,764 | |
| Average deposits | Average deposits | | $ | 27,201,737 | | | $ | 25,124,827 | | | $ | 2,076,910 | | | 8 | % | | $ | 24,700,474 | |
|
Consumer and Business Banking segment net income decreased $96.2by $12 million or 34%,2% year-over-year to $187.9$596 million in 2020 compared with 2019, primarily2023, due to loweran increase in noninterest expense, partially offset by an increase in net interest income before provision for credit losses.
income. Net interest income before provision for credit losses decreased $165.7increased $68 million or 24%,6% year-over-year to $530.8 million in 2020, primarily reflecting a lower credit assigned to deposits under the FTP system in a near-zero interest environment. Noninterest income increased $9.2 million, or 16%, to $67.1 million in 2020,$1.2 billion. This increase was primarily driven by higher deposit account feesFTP credits due to the year-over-year increase in market rates. Noninterest expense increased by $80 million or 20%, to $478 million, primarily due to higher customer-driven transactions.deposit insurance premiums and regulatory assessments from the FDIC charge in the fourth quarter of 2023 and allocated corporate overhead expenses.
The provision for credit losses decreased $10.3 million, to $3.9 million in 2020, primarily driven by the methodology change to credit loss estimates under CECL. The loan portfolio in the Consumer and Business Banking segment is predominantly made up of residential mortgage loans, with a long history of low loan losses.
Noninterest expense decreased $11.3 million, or 3%, to $331.8 million in 2020, primarily due to lower allocated corporate overhead expense.
Commercial Banking
The Commercial Banking segment primarily generates commercial loansloan and deposits.deposit products. Commercial loan products include CRE lending, construction finance, commercial business loans andlending, working capital lines of credit, trade finance, loans and letters of credit, CRE loans, construction and land lending, affordable housing loans and letters of credit,lending, asset-based lending, asset-backed finance, project finance and equipment financing. Commercial deposit products and other financial services include treasury management, foreign exchange services, and interest rate and commodity risk hedging.
The following table presentpresents additional financial information for the Commercial Banking segment for the periods indicated:
| | | | Year Ended December 31, | |
| | Year Ended December 31, | |
| | Year Ended December 31, | |
| | Year Ended December 31, | |
| | Year Ended December 31, | |
| | Year Ended December 31, | |
| | Year Ended December 31, | |
| | Year Ended December 31, | |
| | Year Ended December 31, | |
| | Year Ended December 31, | |
| | Year Ended December 31, | |
| | Year Ended December 31, | |
| | Year Ended December 31, | |
| | Year Ended December 31, | |
| | Year Ended December 31, | |
| | Year Ended December 31, | |
| | Year Ended December 31, | |
| | Year Ended December 31, | |
| | Year Ended December 31, | |
| | Year Ended December 31, | |
| | Year Ended December 31, | |
| | Year Ended December 31, | |
| | Year Ended December 31, | |
| | Year Ended December 31, | |
| | Year Ended December 31, | |
| | Year Ended December 31, | |
| | Year Ended December 31, | |
| | Year Ended December 31, | |
| | Year Ended December 31, | |
| | Year Ended December 31, | |
| | Year Ended December 31, | |
| | Year Ended December 31, | |
| | Year Ended December 31, | |
| | | | | | Change from 2022 | |
| ($ in thousands) | ($ in thousands) | | Year Ended December 31, |
| | Change from 2019 | |
| 2020 | | 2019 | | $ | | % | | 2018 | | 2023 | | 2022 | | $ | | % | | 2021 |
| Net interest income before provision for credit losses | | $ | 706,286 | | | $ | 651,413 | | | $ | 54,873 | | | 8 | % | | $ | 605,650 | |
| Net interest income before provision for (reversal of) credit losses | |
| Noninterest income | Noninterest income | | 139,365 | | | 134,622 | | | 4,743 | | | 4 | % | | 110,287 | |
| Total revenue | Total revenue | | 845,651 | | | 786,035 | | | 59,616 | | | 8 | % | | 715,937 | |
| Provision for credit losses | | 206,768 | | | 84,507 | | | 122,261 | | | 145 | % | | 54,891 | |
| Provision for (reversal of) credit losses | |
| Noninterest expense | Noninterest expense | | 266,923 | | | 263,064 | | | 3,859 | | | 1 | % | | 237,520 | |
| Segment income before income taxes | Segment income before income taxes | | 371,960 | | | 438,464 | | | (66,504) | | | (15) | % | | 423,526 | |
| Income tax expense | |
| Segment net income | Segment net income | | $ | 266,342 | | | $ | 313,833 | | | $ | (47,491) | | | (15) | % | | $ | 303,553 | |
| Average loans | Average loans | | $ | 24,742,030 | | | $ | 22,725,322 | | | $ | 2,016,708 | | | 9 | % | | $ | 20,760,250 | |
| Average deposits | Average deposits | | $ | 10,811,020 | | | $ | 8,591,285 | | | $ | 2,219,735 | | | 26 | % | | $ | 6,897,424 | |
|
SegmentCommercial Banking segment net income decreased $47.5by $29 million or 15%,6% year-over-year to $266.3$478 million in 2020 compared with 2019, reflecting a2023. This decrease was primarily driven by higher noninterest expense and provision for credit losses, partially offset by higher net interest income before provision for credit losses.
income. Net interest income before provision for credit losses increased $54.9by $100 million or 8%,11% to $706.3$993 million, in 2020, primarily driven by lower FTP charges assessed for loans, partially offset by lower interest income earned on loans due to the lower interest rate environment. Noninterest income increased $4.7 million, or 4%, to $139.4 million in 2020, primarily driven by higher lending fees, partially offset by lowerloan interest rate contracts and other derivative income.
The provisionincome from commercial loan growth. Provision for credit losses increased $122.3by $60 million or 130% year-over-year to $206.8$107 million, in 2020,primarily driven by loan growth and changes to the macroeconomic outlook. Noninterest expense increased by $69 million or 22% to $383 million, primarily due to deteriorating macroeconomic conditionshigher deposit insurance premiums and outlookregulatory assessments from the FDIC charge in the first halffourth quarter of 2020, as a result of the COVID-19 pandemic. The loan portfolio in the Commercial Banking segment primarily consists of commercial2023, deposit account expense, and CRE loans, the loss estimates for which are highly sensitive to changes in the macroeconomic conditions.
Noninterest expense increased $3.9 million in 2020, primarily due to a write-down on OREO.allocated corporate overhead expenses.
Other
Centralized functions, including the corporate treasury activities of the Company and eliminations of inter-segment amounts, have been aggregated and included in the Other segment, which provides broad administrative support to the two core segments, namely the Consumer and Business Banking and the Commercial Banking segments.
The following table presents additional financial information for the Other segment for the periods indicated:
| | | | Year Ended December 31, | |
| | Year Ended December 31, | |
| | Year Ended December 31, | |
| | Year Ended December 31, | |
| | Year Ended December 31, | |
| | Year Ended December 31, | |
| | Year Ended December 31, | |
| | Year Ended December 31, | |
| | Year Ended December 31, | |
| | Year Ended December 31, | |
| | Year Ended December 31, | |
| | Year Ended December 31, | |
| | Year Ended December 31, | |
| | Year Ended December 31, | |
| | Year Ended December 31, | |
| | Year Ended December 31, | |
| | Year Ended December 31, | |
| | Year Ended December 31, | |
| | Year Ended December 31, | |
| | Year Ended December 31, | |
| | Year Ended December 31, | |
| | Year Ended December 31, | |
| | Year Ended December 31, | |
| | Year Ended December 31, | |
| | Year Ended December 31, | |
| | Year Ended December 31, | |
| | Year Ended December 31, | |
| | Year Ended December 31, | |
| | Year Ended December 31, | |
| | Year Ended December 31, | |
| | Year Ended December 31, | |
| | Year Ended December 31, | |
| | Year Ended December 31, | |
| | | | | | Change from 2022 | |
| ($ in thousands) | ($ in thousands) | | Year Ended December 31, |
| | Change from 2019 | |
| 2020 | | 2019 | | $ | | % | | 2018 | | 2023 | | 2022 | | $ | | % | | 2021 |
| Net interest income before provision for credit losses | | $ | 140,078 | | | $ | 119,849 | | | $ | 20,229 | | | 17 | % | | $ | 53,643 | |
| Net interest income (loss) | |
| Noninterest income | Noninterest income | | 29,067 | | | 29,703 | | | (636) | | | (2) | % | | 21,539 | |
| Total revenue | | 169,145 | | | 149,552 | | | 19,593 | | | 13 | % | | 75,182 | |
| Total revenue (loss) | |
| | Noninterest expense | Noninterest expense | | 117,649 | | | 141,391 | | | (23,742) | | | (17) | % | | 142,074 | |
| Segment income (loss) before income taxes | | 51,496 | | | 8,161 | | | 43,335 | | | 531 | % | | (66,892) | |
| Noninterest expense | |
| Noninterest expense | |
| Segment loss before income taxes | |
| Income tax benefit | |
| Segment net income | Segment net income | | $ | 113,524 | | | $ | 76,041 | | | $ | 37,483 | | | 49 | % | | $ | 69,465 | |
| | Average deposits | Average deposits | | $ | 2,750,134 | | | $ | 2,330,958 | | | $ | 419,176 | | | 18 | % | | $ | 1,632,351 | |
| Average deposits | |
| Average deposits | |
|
NM - Not meaningful
SegmentThe Other segment reported segment loss before income taxes of $63 million and segment net income increased $37.5of $86 million, or 49%, to $113.5reflecting an income tax benefit of $149 million in 2020 compared with 2019,2023. The decrease in segment loss before income taxes was primarily driven by lower noninterest expense and higher net interest income before provision for credit losses.
Netincome. The $98 million year-over-year increase in net interest income before provision for credit losses increased $20.2 million, or 17%, to $140.1 million in 2020,was primarily driven by lower deposit costs,a higher yield on interest-bearing cash and deposits with banks and debt securities in 2023, partially offset by lower interest income on investments. Noninterest income remained relatively flat year-over-year.
Noninterest expense decreased $23.7 million, or 17%, to $117.6 million in 2020, reflecting lower amortizationhigher costs of tax credit and other investments.borrowings.
The income tax expense or benefit in the Other segment consists of the remaining unallocated income tax expense or benefit after allocating income tax expense to the two core segments.segments, and reflects the impact of tax credit investment activity. Income tax expense is allocated to the Consumer and Business Banking and the Commercial Banking segments based onby applying statutory income tax rates applied to the segment income before income taxes. Tax credit investment amortization is allocated to the Other segment.
Balance Sheet Analysis
The following table presents a discussion of the significant changes between December 31, 2020 and 2019:
Selected Consolidated Balance Sheet Data
| | | | | | | | | | | | | | | | | | | | | | | | | | |
|
| ($ in thousands) | | December 31, | | Change |
| 2020 | | 2019 | | $ | | % |
| | | | | | | | |
| ASSETS | | | | | | | | |
| | | | | | | | |
| | | | | | | | |
| Cash and cash equivalents | | $ | 4,017,971 | | | $ | 3,261,149 | | | $ | 756,822 | | | 23 | % |
| Interest-bearing deposits with banks | | 809,728 | | | 196,161 | | | 613,567 | | | 313 | % |
| Resale agreements | | 1,460,000 | | | 860,000 | | | 600,000 | | | 70 | % |
| AFS debt securities, at fair value (amortized cost of $5,470,523 in 2020 and $3,320,648 in 2019) | | 5,544,658 | | | 3,317,214 | | | 2,227,444 | | | 67 | % |
| | | | | | | | |
| Restricted equity securities, at cost | | 83,046 | | | 78,580 | | | 4,466 | | | 6 | % |
| Loans held-for-sale | | 1,788 | | | 434 | | | 1,354 | | | 312 | % |
Loans held-for-investment (net of allowance (1) for loan losses of $619,983 in 2020 and $358,287 in 2019) | | 37,770,972 | | | 34,420,252 | | | 3,350,720 | | | 10 | % |
| Investments in qualified affordable housing partnerships, net | | 213,555 | | | 207,037 | | | 6,518 | | | 3 | % |
| Investments in tax credit and other investments, net | | 266,525 | | | 254,140 | | | 12,385 | | | 5 | % |
| Premises and equipment | | 103,251 | | | 118,364 | | | (15,113) | | | (13) | % |
| Goodwill | | 465,697 | | | 465,697 | | | — | | | — | % |
| Operating lease right-of-use assets | | 95,460 | | | 99,973 | | | (4,513) | | | (5) | % |
| Other assets | | 1,324,262 | | | 917,095 | | | 407,167 | | | 44 | % |
| TOTAL | | $ | 52,156,913 | | | $ | 44,196,096 | | | $ | 7,960,817 | | | 18 | % |
| LIABILITIES | | | | | | | | |
| | | | | | | | |
| Noninterest-bearing | | $ | 16,298,301 | | | $ | 11,080,036 | | | $ | 5,218,265 | | | 47 | % |
| Interest-bearing | | 28,564,451 | | | 26,244,223 | | | 2,320,228 | | | 9 | % |
| Total deposits | | 44,862,752 | | | 37,324,259 | | | 7,538,493 | | | 20 | % |
| | | | | | | | |
| Short-term borrowings | | 21,009 | | | 28,669 | | | (7,660) | | | (27) | % |
| FHLB advances | | 652,612 | | | 745,915 | | | (93,303) | | | (13) | % |
| Repurchase agreements | | 300,000 | | | 200,000 | | | 100,000 | | | 50 | % |
| Long-term debt and finance lease liabilities | | 151,739 | | | 152,270 | | | (531) | | | 0 | % |
| Operating lease liabilities | | 102,830 | | | 108,083 | | | (5,253) | | | (5) | % |
| Accrued expenses and other liabilities | | 796,796 | | | 619,283 | | | 177,513 | | | 29 | % |
| Total liabilities | | 46,887,738 | | | 39,178,479 | | | 7,709,259 | | | 20 | % |
| | | | | | | | |
| | | | | | | | |
| | | | | | | | |
| | | | | | | | |
| | | | | | | | |
| | | | | | | | |
| | | | | | | | |
STOCKHOLDERS’ EQUITY (1) | | 5,269,175 | | | 5,017,617 | | | 251,558 | | | 5 | % |
| TOTAL | | $ | 52,156,913 | | | $ | 44,196,096 | | | $ | 7,960,817 | | | 18 | % |
|
(1)On January 1, 2020, the Company adopted ASU 2016-13, Financial Instruments — Credit Losses (Topic 326): Measurement of Credit Losses on Financial Instruments using the modified retrospective approach. The Company recorded $125.2 million increase to allowance for loan losses and $98.0 million after-tax decrease to opening retained earnings as of January 1, 2020.
As of December 31, 2020, total assets were $52.16 billion, an increase of $7.96 billion or 18% from $44.20 billion as of December 31, 2019, primarily due to loan growth, and an increase in purchases of AFS debt securities.The loan growth came from C&I lending, driven by originations of PPP loans, single-family residential and CRE.
As of December 31, 2020, total liabilities were $46.89 billion, an increase of $7.71 billion or 20% from $39.18 billion as of December 31, 2019, primarily due to deposit growth, driven by strong growth in noninterest-bearing deposits.
As of December 31, 2020, total stockholders’ equity was $5.27 billion, an increase of $251.6 million or 5% from $5.02 billion as of December 31, 2019, primarily due to $567.8 million in 2020 net income, partially offset by cash dividends declared on common stock and common stock repurchases.
Debt Securities
The Company maintains a portfolio of high quality and liquid debt securities with relatively short durations to minimizea moderate duration profile. It closely manages the overall portfolio credit, interest rate and liquidity risks. The Company’s debt securities provide:
•interest income for earnings and yield enhancement;
•funding availability for funding needs arising during the normal course of business;
•the ability to execute interest rate risk management strategies in response to changes in economic or market conditions; and
•collateral to support pledging agreements as required and/or to enhance the Company’s borrowing capacity.
Available-for-Sale Debt SecuritiesWhile the Company does not intend to sell its debt securities, it may sell AFS debt securities in response to changes in the balance sheet and related interest rate risk to meet liquidity, regulatory and strategic requirements.
Debt securities classified as AFS are carried at their fair value with the corresponding changes in fair value recorded in Accumulated other comprehensive income (loss), net of tax, as a component of Stockholders’ equity on the Consolidated Balance Sheet.
The following table presents the distribution of the Company’s AFS and HTM debt securities portfolio by fair value and percentage of fair value as of December 31, 20202023 and 2019,2022, and by credit ratings as of December 31, 2020:2023:
| | | | | December 31, 2023 | |
| | | December 31, 2023 | |
| | | December 31, 2023 | |
| ($ in thousands) | ($ in thousands) | | December 31, | | | Ratings (2) | |
| 2020 | | 2019 | | | As of December 31, 2020 | |
| Fair
Value | | | % of Total | | Fair
Value | | | % of Total | | | AAA/AA | | A | | BBB | | | No Rating | |
| AFS debt securities: | AFS debt securities: | | | | | | | | | | | | | | | | | | | | | |
| AFS debt securities: | |
| AFS debt securities: | |
| U.S. Treasury securities | |
| U.S. Treasury securities | |
| U.S. Treasury securities | U.S. Treasury securities | | $ | 50,761 | | | | 1 | % | | $ | 176,422 | | | | 5 | % | | | 100 | % | | — | % | | — | % | | | — | % | |
| U.S. government agency and U.S. government-sponsored enterprise debt securities | U.S. government agency and U.S. government-sponsored enterprise debt securities | | 814,319 | | | | 15 | % | | 581,245 | | | | 18 | % | | | 100 | % | | — | % | | — | % | | | — | % | |
| U.S. government agency and U.S. government-sponsored enterprise debt securities | |
| U.S. government agency and U.S. government-sponsored enterprise debt securities | |
| U.S. government agency and U.S. government-sponsored enterprise mortgage-backed securities | |
| U.S. government agency and U.S. government-sponsored enterprise mortgage-backed securities | |
| U.S. government agency and U.S. government-sponsored enterprise mortgage-backed securities | U.S. government agency and U.S. government-sponsored enterprise mortgage-backed securities | | 2,814,664 | | | | 51 | % | | 1,607,368 | | | | 48 | % | | | 100 | % | | — | % | | — | % | | | — | % | |
| Municipal securities | Municipal securities | | 396,073 | | | | 7 | % | | 102,302 | | | | 3 | % | | | 91 | % | | 5 | % | | — | % | | | 4 | % | |
| Municipal securities | |
| Municipal securities | |
| Non-agency mortgage-backed securities | |
| Non-agency mortgage-backed securities | |
| Non-agency mortgage-backed securities | Non-agency mortgage-backed securities | | 529,617 | | | | 10 | % | | 135,098 | | | | 4 | % | | | 89 | % | | — | % | | — | % | | | 11 | % | |
| | Corporate debt securities | Corporate debt securities | | 405,968 | | | | 7 | % | | 11,149 | | | | — | % | | | — | % | | 30 | % | | 70 | % | | | — | % | |
Foreign government bonds (1) | | 182,531 | | | | 3 | % | | 354,172 | | | | 11 | % | | | 17 | % | | 83 | % | | — | % | | | — | % | |
Asset-backed securities (1) | | 63,231 | | | | 1 | % | | 64,752 | | | | 2 | % | | | 100 | % | | — | % | | — | % | | | — | % | |
CLOs (1) | | 287,494 | | | | 5 | % | | 284,706 | | | | 9 | % | | | 92 | % | | 8 | % | | — | % | | | — | % | |
| | Corporate debt securities | |
| | Corporate debt securities | |
| Foreign government bonds | |
| Foreign government bonds | |
| Foreign government bonds | |
| Asset-backed securities | |
| Asset-backed securities | |
| Asset-backed securities | |
| Collateralized loan obligations | |
| Collateralized loan obligations | |
| Collateralized loan obligations | |
| | Total AFS debt securities | Total AFS debt securities | | $ | 5,544,658 | | | | 100 | % | | $ | 3,317,214 | | | | 100 | % | | | 88 | % | | 6 | % | | 5 | % | | | 1 | % | |
| | Total AFS debt securities | |
| | Total AFS debt securities | |
| HTM debt securities: | |
| HTM debt securities: | |
| HTM debt securities: | |
| U.S. Treasury securities | |
| U.S. Treasury securities | |
| U.S. Treasury securities | |
| U.S. government agency and U.S. government-sponsored enterprise debt securities | |
| U.S. government agency and U.S. government-sponsored enterprise debt securities | |
| U.S. government agency and U.S. government-sponsored enterprise debt securities | |
| U.S. government agency and U.S. government-sponsored enterprise mortgage-backed securities | |
| U.S. government agency and U.S. government-sponsored enterprise mortgage-backed securities | |
| U.S. government agency and U.S. government-sponsored enterprise mortgage-backed securities | |
| Municipal securities | |
| Municipal securities | |
| Municipal securities | |
| Total HTM debt securities | |
| Total HTM debt securities | |
| Total HTM debt securities | |
| Total debt securities | |
| Total debt securities | |
| Total debt securities | |
|
(1)There were no securitiesCredit ratings express opinions about the credit quality of a single non-governmental agency issuer that exceeded 10%debt security. The Company determines the credit rating of stockholder’s equity as of both December 31, 2020 and December 31, 2019.
(2)Primarily based upona security according to the lowest ofcredit rating made available by nationally recognized statistical rating organizations (“NRSROs”). Debt securities rated investment grade, which are those with ratings similar to BBB- or above (as defined by NRSROs), are generally considered by the rating agencies and market participants to be low credit ratings issued by S&P, Moody’s Investors Service (“Moody’s”) or Fitchrisk. Ratings (“Fitch”). Rating percentages are allocated based on fair value.
(2)For debt securities not rated by NRSROs, the Company uses other factors which include but are not limited to the priority in collections within the securitization structure, and whether the contractual payments have historically been on time.
As of December 31, 2023, the Company’s AFS and HTM debt securities portfolios had an effective duration (defined as the sensitivity of the value of the portfolio to interest rate changes) of 3.6 and 7.5, respectively, compared with 4.1 and 8.0, respectively, as of December 31, 2022. The modest decreases in both the AFS and HTM effective durations were due to the portfolio seasoning.
Available-for-Sale Debt Securities
The fair value of AFS debt securities totaled $5.54$6.2 billion as of December 31, 2020,2023, an increase of $2.23 billion$153 million or 67%3% from $3.32$6.0 billion as of December 31, 2019.2022. The largest net change came from U.S. government agency and U.S. government-sponsored enterprise mortgage-backed securities, which increased $1.21 billion, followed by corporate debt securities, which increased $394.8 million, and non-agency mortgage-backed securities, which increased $394.5 million.
The Company’s debt securities portfolio had an effective duration of 4.2 years as of December 31, 2020 which increased from 3.1 years as of December 31, 2019, primarily due to an increase in the target duration of securities purchases to achieve enhancement in portfolio yield. As of December 31, 2020, 88% of the carrying value of the Company’s debt securities portfolio was rated “AA-” or “Aa3” or higher by nationally recognized credit rating agencies, compared with 97% as of December 31, 2019. The decrease in higher-rated securities was primarily due to the strategic growth in non-agency securities within the portfolio mix. Credit ratings of BBB- or higher by S&P and Fitch, or Baa3 or higher by Moody’s, are considered investment grade.
yield curve movement. The Company’s AFS debt securities are carried at fair value with noncredit-relatednon-credit related unrealized gains and losses, net of tax, reported in Other comprehensive income (loss) on the Consolidated Statement of Comprehensive Income. Pre-tax net unrealized gainlosses on AFS debt securities was $74.1were $728 million as of December 31, 2020, a net improvement of $77.6 million from pre-tax net unrealized losses of $3.42023, compared with $844 million as of December 31, 2019. This change was primarily due to a decrease in benchmark interest rates as of December 31, 2020. Gross unrealized losses on AFS debt securities totaled $22.5 million as of December 31, 2020, compared with $23.2 million as of December 31, 2019. As of December 31, 2020, the Company had no intention to sell securities with unrealized losses and believed it is more-likely-than-not that it would not be required to sell such securities before recovery of their amortized costs.2022.
As of both December 31, 2023 and 2022, 97% of the carrying value of the AFS debt securities portfolio was rated investment grade by NRSROs. Of the AFS debt securities with gross unrealized losses, substantially all were rated investment grade as of both December 31, 20202023 and 2019, as classified based upon the lowest of the2022. There was no allowance for credit ratings issued by S&P, Moody’s, or Fitch. The Company believes that the gross unrealized losses were due to non-credit related factors and the gross unrealized losses were primarily attributable to yield curve movement and widened spreads. The Company believes that the credit support levels ofprovided against the AFS debt securities are strongas of both December 31, 2023 and based on current assessments and macroeconomic forecasts, expects that full contractual cash flows will be received, even if near term credit performance is impacted by the COVID-19 pandemic.
If a credit loss exists,2022. During 2023, the Company records anrecognized $7 million in net losses on AFS debt securities, consisting of a $10 million impairment related to credit losses through the allowance for credit losses withwrite-off on a corresponding Provision for credit lossessubordinated debt security, partially offset by a $3 million gain on the Consolidated Statementsale of Income.the same security. There were no credit losses recognized in earnings for 20202022.
Held-to-Maturity Debt Securities
All HTM debt securities were issued, guaranteed, or supported by the U.S. government or government-sponsored enterprises. Accordingly, the Company applied a zero credit loss assumption for these securities and no OTTI credit losses were recognized in earnings for 2019. The Company assesses individual securitiesallowance for credit losses for each reporting period. loss was recorded as of both December 31, 2023 and 2022.
For additional information of the Company’s accounting policies, valuationon AFS and composition,HTM securities, see Note 1— Summary of Significant Accounting Policies,, Note 2 — Fair Value Measurement and Fair Value of Financial Instruments, and Note 4 — Securities to the Consolidated Financial Statements in this Form 10-K.
The following table presents the weighted-average yields and contractual maturity distribution, excluding periodic principal payments, of the Company’s AFS debt securities as of December 31, 2020 and 2019. Actual maturities of certain securities can differ from contractual maturities as the borrowers have the right to prepay obligations with or without prepayment penalties. In addition, factors such as prepayments and interest rates may affect the yields on the carrying values of these securities.
| | | | | | | | | | | | | | | | | | | | | | | | | | | | | | | | | | | | | | |
|
| ($ in thousands) | | December 31, |
| 2020 | | 2019 |
| Amortized
Cost | | Fair
Value | | Yield (1) | | Amortized
Cost | | Fair
Value | | Yield (1) |
| AFS debt securities: | | | | | | | | | | | | |
| U.S. Treasury securities: | | | | | | | | | | | | |
| Maturing in one year or less | | $ | 50,310 | | | $ | 50,761 | | | 1.26 | % | | $ | — | | | $ | — | | | — | % |
| Maturing after one year through five years | | — | | | — | | | — | % | | 177,215 | | | 176,422 | | | 1.33 | % |
| | | | | | | | | | | | |
| | | | | | | | | | | | |
| Total | | 50,310 | | | 50,761 | | | 1.26 | % | | 177,215 | | | 176,422 | | | 1.33 | % |
| U.S. government agency and U.S. government-sponsored enterprise debt securities: | | | | | | | | | | | | |
| Maturing in one year or less | | 640,153 | | | 640,366 | | | 1.78 | % | | 328,628 | | | 326,341 | | | 2.62 | % |
| Maturing after one year through five years | | 118,053 | | | 122,012 | | | 2.38 | % | | 158,490 | | | 156,431 | | | 2.69 | % |
| Maturing after five years through ten years | | 11,091 | | | 11,697 | | | 2.54 | % | | 44,908 | | | 45,189 | | | 2.38 | % |
| Maturing after ten years | | 37,517 | | | 40,244 | | | 2.74 | % | | 52,249 | | | 53,284 | | | 2.78 | % |
| Total | | 806,814 | | | 814,319 | | | 1.92 | % | | 584,275 | | | 581,245 | | | 2.63 | % |
| U.S. government agency and U.S. government-sponsored enterprise mortgage-backed securities: | | | | | | | | | | | | |
| Maturing in one year or less | | 4,185 | | | 4,232 | | | 3.46 | % | | 112 | | | 113 | | | 2.72 | % |
| Maturing after one year through five years | | 21,566 | | | 22,668 | | | 2.72 | % | | 23,144 | | | 23,289 | | | 2.29 | % |
| Maturing after five years through ten years | | 216,332 | | | 222,905 | | | 2.17 | % | | 85,970 | | | 88,261 | | | 2.72 | % |
| Maturing after ten years | | 2,517,644 | | | 2,564,859 | | | 2.11 | % | | 1,489,035 | | | 1,495,705 | | | 2.66 | % |
| Total | | 2,759,727 | | | 2,814,664 | | | 2.12 | % | | 1,598,261 | | | 1,607,368 | | | 2.66 | % |
Municipal securities (2): | | | | | | | | | | | | |
| Maturing in one year or less | | 18,663 | | | 18,868 | | | 3.04 | % | | 37,136 | | | 37,291 | | | 2.67 | % |
| Maturing after one year through five years | | 36,000 | | | 37,716 | | | 2.89 | % | | 18,699 | | | 18,948 | | | 2.52 | % |
| Maturing after five years through ten years | | 230,851 | | | 239,883 | | | 2.07 | % | | 12,151 | | | 12,451 | | | 3.15 | % |
| Maturing after ten years | | 97,059 | | | 99,606 | | | 2.08 | % | | 33,635 | | | 33,612 | | | 2.63 | % |
| Total | | 382,573 | | | 396,073 | | | 2.20 | % | | 101,621 | | | 102,302 | | | 2.69 | % |
| Non-agency mortgage-backed securities: | | | | | | | | | | | | |
| Maturing in one year or less | | 7,920 | | | 7,920 | | | 0.63 | % | | — | | | — | | | — | % |
| Maturing after one year through five years | | 49,704 | | | 49,870 | | | 3.80 | % | | 7,920 | | | 7,914 | | | 3.78 | % |
| Maturing after five years through ten years | | 21,332 | | | 21,376 | | | 1.50 | % | | — | | | — | | | — | % |
| Maturing after ten years | | 444,529 | | | 450,451 | | | 2.48 | % | | 125,519 | | | 127,184 | | | 3.21 | % |
| Total | | 523,485 | | | 529,617 | | | 2.48 | % | | 133,439 | | | 135,098 | | | 3.24 | % |
| Corporate debt securities: | | | | | | | | | | | | |
| Maturing in one year or less | | 126,250 | | | 124,846 | | | 1.71 | % | | 1,250 | | | 1,262 | | | 5.20 | % |
| Maturing after one year through five years | | 276,073 | | | 277,103 | | | 3.56 | % | | 10,000 | | | 9,887 | | | 4.00 | % |
| Maturing after five years through ten years | | 4,000 | | | 4,019 | | | 4.50 | % | | — | | | — | | | — | % |
| | | | | | | | | | | | |
| Total | | 406,323 | | | 405,968 | | | 2.99 | % | | 11,250 | | | 11,149 | | | 4.13 | % |
| Foreign government bonds: | | | | | | | | | | | | |
| Maturing in one year or less | | 45,681 | | | 45,655 | | | 0.85 | % | | 354,481 | | | 354,172 | | | 2.22 | % |
| Maturing after one year through five years | | 138,147 | | | 136,876 | | | 2.41 | % | | — | | | — | | | — | % |
| Total | | 183,828 | | | 182,531 | | | 2.02 | % | | 354,481 | | | 354,172 | | | 2.22 | % |
| Asset-backed securities: | | | | | | | | | | | | |
| Maturing after ten years | | 63,463 | | | 63,231 | | | 0.85 | % | | 66,106 | | | 64,752 | | | 2.65 | % |
| | | | | | | | | | | | |
| | | | | | | | | | | | |
| CLOs: | | | | | | | | | | | | |
| Maturing after ten years | | 294,000 | | | 287,494 | | | 1.34 | % | | 294,000 | | | 284,706 | | | 3.08 | % |
| Total AFS debt securities | | $ | 5,470,523 | | | $ | 5,544,658 | | | 2.13 | % | | $ | 3,320,648 | | | $ | 3,317,214 | | | 2.60 | % |
| | | | | | | | | | | | |
| Total aggregated by maturities: | | | | | | | | | | | | |
| Maturing in one year or less | | $ | 893,162 | | | $ | 892,648 | | | 1.72 | % | | $ | 721,607 | | | $ | 719,179 | | | 2.43 | % |
| Maturing after one year through five years | | 639,543 | | | 646,245 | | | 3.05 | % | | 395,468 | | | 392,891 | | | 2.11 | % |
| Maturing after five years through ten years | | 483,606 | | | 499,880 | | | 2.12 | % | | 143,029 | | | 145,901 | | | 2.65 | % |
| Maturing after ten years | | 3,454,212 | | | 3,505,885 | | | 2.08 | % | | 2,060,544 | | | 2,059,243 | | | 2.76 | % |
| Total AFS debt securities | | $ | 5,470,523 | | | $ | 5,544,658 | | | 2.13 | % | | $ | 3,320,648 | | | $ | 3,317,214 | | | 2.60 | % |
|
(1)Weighted-average yields are computed based on amortized cost balances.
(2)Yields on tax-exempt securities are not presented on a tax-equivalent basis.
Loan Portfolio
The Company offers a broad range of financial products designed to meet the credit needs of its borrowers. The Company’s loan portfolio segments include commercial loans, which consist of C&I, CRE, multifamily residential, and construction and land loans; andloans, as well as consumer loans, which consist of single-family residential, home equity lines of credit (“HELOCs”) and other consumer loans. Total net loans, including loans held-for-sale, were $37.77Loans held-for-investment totaled $52.2 billion as of December 31, 2020,2023, an increase of $3.35$4.0 billion, or 10%8%, from $34.42$48.2 billion as of December 31, 2019.2022. This increase was primarily driven by increases of $1.48$1.8 billion or 12%13% in total residential mortgage loans, $1.4 billion or 7% in total CRE loans, and $870 million or 6% in C&I loans, driven by PPP loan growth; $1.08 billion or 15% in single-family residential loans and $896.2 million or 9% in CRE loans. The composition of the loan portfolio as of December 31, 20202023 was similar to the composition as of December 31, 2019.2022.
The following table presents the composition of the Company’s total loan portfolio by loan type as of the periods indicated:December 31, 2023 and 2022:
| | | | December 31, | |
| | | December 31, | |
| | | December 31, | |
| | 2023 | |
| ($ in thousands) | ($ in thousands) | | December 31, |
| 2020 | | 2019 | | 2018 | | 2017 | | 2016 |
| Amount (1) | | % | | Amount (1) | | % | | Amount (1) | | % | | Amount (1) | | % | | Amount (1) | | % |
| Commercial: | Commercial: | | | | | | | | | | | | | | | | | | | | |
C&I (2) | | $ | 13,631,726 | | | 36 | % | | $ | 12,150,931 | | | 35 | % | | $ | 12,056,970 | | | 37 | % | | $ | 10,697,231 | | | 37 | % | | $ | 9,640,563 | | | 38 | % |
| Commercial: | |
| Commercial: | |
| C&I | |
| C&I | |
| C&I | |
| CRE: | |
| CRE: | |
| CRE: | CRE: | |
| CRE | CRE | | 11,174,611 | | | 29 | % | | 10,278,448 | | | 30 | % | | 9,260,199 | | | 28 | % | | 8,758,818 | | | 31 | % | | 7,890,368 | | | 31 | % |
| CRE | |
| CRE | |
| Multifamily residential | |
| Multifamily residential | |
| Multifamily residential | Multifamily residential | | 3,033,998 | | | 8 | % | | 2,856,374 | | | 8 | % | | 2,470,668 | | | 8 | % | | 2,094,255 | | | 7 | % | | 1,711,680 | | | 6 | % |
| Construction and land | Construction and land | | 599,692 | | | 2 | % | | 628,499 | | | 2 | % | | 538,794 | | | 2 | % | | 659,697 | | | 2 | % | | 674,754 | | | 3 | % |
| Construction and land | |
| Construction and land | |
| Total CRE | |
| Total CRE | |
| Total CRE | Total CRE | | 14,808,301 | | | 39 | % | | 13,763,321 | | | 40 | % | | 12,269,661 | | | 38 | % | | 11,512,770 | | | 40 | % | | 10,276,802 | | | 40 | % |
| Total commercial | Total commercial | | 28,440,027 | | | 75 | % | | 25,914,252 | | | 75 | % | | 24,326,631 | | | 75 | % | | 22,210,001 | | | 77 | % | | 19,917,365 | | | 78 | % |
| Total commercial | |
| Total commercial | |
| Consumer: | |
| Consumer: | |
| Consumer: | Consumer: | | | | | | | | | | | | | | | | | | | | |
| Residential mortgage: | Residential mortgage: | |
| Residential mortgage: | |
| Residential mortgage: | |
| Single-family residential | |
| Single-family residential | |
| Single-family residential | Single-family residential | | 8,185,953 | | | 21 | % | | 7,108,590 | | | 20 | % | | 6,036,454 | | | 19 | % | | 4,646,289 | | | 16 | % | | 3,509,779 | | | 14 | % |
| HELOCs | HELOCs | | 1,601,716 | | | 4 | % | | 1,472,783 | | | 4 | % | | 1,690,834 | | | 5 | % | | 1,782,924 | | | 6 | % | | 1,760,776 | | | 7 | % |
| HELOCs | |
| HELOCs | |
| Total residential mortgage | |
| Total residential mortgage | |
| Total residential mortgage | Total residential mortgage | | 9,787,669 | | | 25 | % | | 8,581,373 | | | 24 | % | | 7,727,288 | | | 24 | % | | 6,429,213 | | | 22 | % | | 5,270,555 | | | 21 | % |
| Other consumer | Other consumer | | 163,259 | | | — | % | | 282,914 | | | 1 | % | | 331,270 | | | 1 | % | | 336,504 | | | 1 | % | | 315,219 | | | 1 | % |
| Other consumer | |
| Other consumer | |
| Total consumer | Total consumer | | 9,950,928 | | | 25 | % | | 8,864,287 | | | 25 | % | | 8,058,558 | | | 25 | % | | 6,765,717 | | | 23 | % | | 5,585,774 | | | 22 | % |
| Total loans held-for-investment | | 38,390,955 | | | 100 | % | | 34,778,539 | | | 100 | % | | 32,385,189 | | | 100 | % | | 28,975,718 | | | 100 | % | | 25,503,139 | | | 100 | % |
| Total consumer | |
| Total consumer | |
Total loans held-for-investment (1) | |
Total loans held-for-investment (1) | |
Total loans held-for-investment (1) | |
| Allowance for loan losses | Allowance for loan losses | | (619,983) | | | | | (358,287) | | | | | (311,322) | | | | | (287,128) | | | | | (260,520) | | | |
Loans held-for-sale (3) | | 1,788 | | | 434 | | | 275 | | | 78,217 | | | 23,076 | | |
| Allowance for loan losses | |
| Allowance for loan losses | |
Loans held-for-sale (2) | |
Loans held-for-sale (2) | |
Loans held-for-sale (2) | |
| Total loans, net | |
| Total loans, net | |
| Total loans, net | Total loans, net | | $ | 37,772,760 | | | $ | 34,420,686 | | | $ | 32,074,142 | | | $ | 28,766,807 | | | $ | 25,265,695 | | |
|
(1)On January 1, 2020, the Company adopted ASU 2016-13. Total loans includeIncludes $71 million and $70 million of net deferred loan fees unearned fees,and net unamortized premiums and unaccreted discounts of $(58.8) million, $(43.2) million, $(48.9) million, $(34.0) million and $1.2 million as of December 31, 2020, 2019, 2018, 20172023, and 2016,2022, respectively. Net origination fees related to PPP loans were $(12.7) million
(2)Consists of a single-family residential loan as of December 31, 2020.
(2)Includes $1.57 billion of PPP2023 and C&I loans as of December 31, 2020.
(3)Includes $78.1 million of loans held-for-sale in Branch assets held-for-sale as of December 31, 2017.
Actions to Support Customers during the COVID-19 Pandemic
In response to the COVID-19 pandemic, the Company assisted customers by offering SBA PPP loans to help struggling businesses in our communities pay their employees and sustain their businesses, and by providing payment relief through various loan modification programs. For a summary of the loans that the Company has modified in response to the COVID-19 pandemic, refer to Item 7. MD&A — Risk Management — Credit Risk Management in this Form 10-K.
As of December 31, 2020, the Company had approximately 6,200 SBA PPP loans outstanding with balances totaling $1.57 billion, which were included in the C&I portfolio. These loans carry an interest rate of 1%, and are 100% guaranteed by the SBA. The substantial majority of the Company’s PPP loans have a term of two years. Related to the PPP loans made in 2020, as of February 25 2021, the Company has submitted and received approval from the SBA for forgiveness approximately 2,700 PPP loan applications, totaling $341.9 million.2022.
In January 2021, the Company began processing applications to provide additional support for those in need under the latest round of the SBA’s PPP in response to the CAA signed by the President on December 27, 2020. Year-to-date through February 25, 2021, the Company funded over 4,300 new PPP loans, totaling $700.3 million. For more information on PPP loans, refer to Item 7. MD&A — Overview — Regulatory Developments Relating to the COVID-19 Pandemic — Paycheck Protection Program and Note 1 — Summary of Significant Accounting Policies — Paycheck Protection Program to the Consolidated Financial Statements in this Form 10-K.
Commercial
The commercial loan portfolio comprised 75%71% and 72% of total loans as of both December 31, 20202023 and 2019.2022, respectively. The Company actively monitors the commercial lending portfolio for elevated levels of credit risk and reviews credit exposures for sensitivity to changing economic conditions.
Commercial — Commercial and Industrial Loans.Total C&I loan commitments were $24.6 billion as of December 31, 2023, an increase of $1.8 billion or 8% from $22.8 billion as of December 31, 2022, with a utilization rate of 67% as of December 31, 2023, compared with 69% as of December 31, 2022. Total C&I loans totaled $13.63were $16.6 billion as of December 31, 2023, an increase of $870 million or 36%6% from $15.7 billion as of December 31, 2022. Total C&I loans made up 32% and 33% of total loans held-for-investment as of December 31, 2020, compared with $12.15 billion, or 35% of total loans held-for-investment, as of December 31, 2019. Year-over-year, C&I loans increased $1.48 billion, or 12%, driven by PPP loan funding.2023 and 2022, respectively. The C&I loan portfolio includes loans and financing for businesses inacross a wide spectrum of industries, and includes asset-basedindustries. The Company offers a variety of C&I products, including commercial business lending, equipment financing and leasing, project-based finance, revolvingworking capital lines of credit, SBAtrade finance, letters of credit, asset-based lending, structuredasset-backed finance, term loansproject finance and trade finance. Theequipment financing. Additionally, the Company also has a portfolio of broadly syndicated C&I loans, which represent revolving or term loan facilities that are marketed and sold primarily Term B, whichto institutional investors. This portfolio totaled $892.1$645 million and $894.6$856 million as of December 31, 20202023 and 2019,2022, respectively. The majority of the C&I loans havehad variable interest rates.rates as of both December 31, 2023, and 2022.
The C&I portfolio is well-diversified by industry. The Company monitors concentrations within the C&I loan portfolio by industry and customer exposure, and industry classification, setting diversification targets andhas exposure limits by industry orand loan product. The following charts illustratetable presents the industry mix within ourthe Company’s C&I loan portfolio as of December 31, 20202023, and 2019.2022:
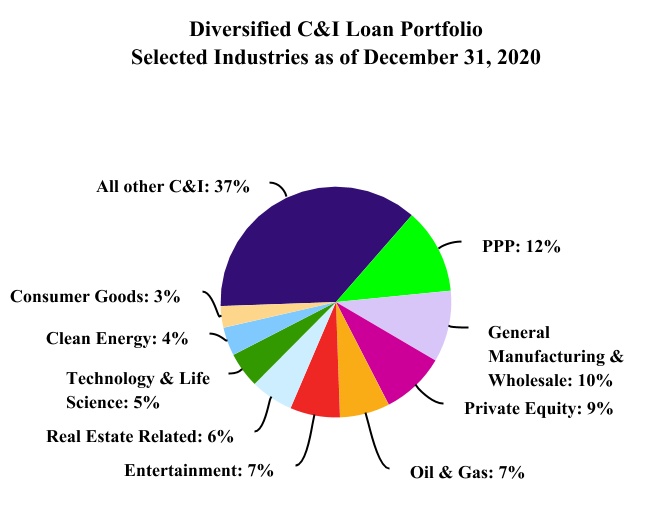
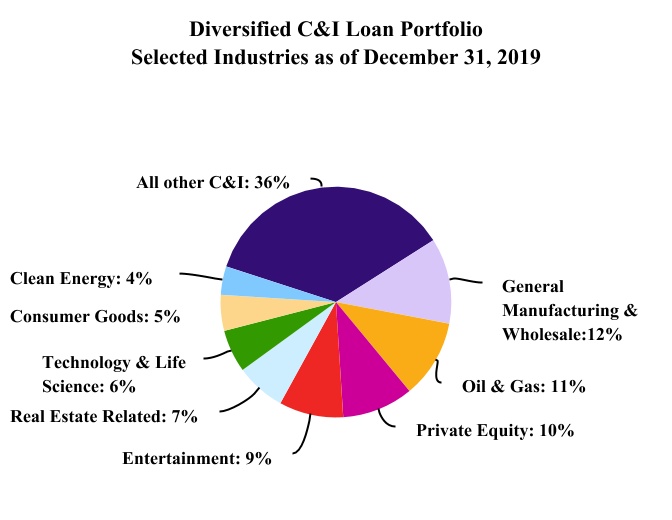
| | | | | | | | | | | | | | | | | | | | | | | | | | | | | | | | |
| | | | | | | | | | |
| | December 31, 2023 | | | | December 31, 2022 |
| ($ in thousands) | | Amount | | % | | ($ in thousands) | | Amount | | % |
| Industry: | | | | | | Industry: | | | | |
| Private equity | | $ | 2,553,718 | | | 16 | % | | Private equity | | $ | 2,238,723 | | | 14 | % |
| Media & entertainment | | 1,891,199 | | | 12 | % | | Media & entertainment | | 1,841,719 | | | 12 | % |
| Real estate investment & management | | 1,540,516 | | | 9 | % | | Real estate investment & management | | 1,272,169 | | | 8 | % |
| Infrastructure & clean energy | | 890,307 | | | 5 | % | | Manufacturing & wholesale | | 1,091,933 | | | 7 | % |
| Manufacturing & wholesale | | 803,606 | | | 5 | % | | Infrastructure & clean energy | | 820,095 | | | 5 | % |
| Tech & telecom | | 729,922 | | | 4 | % | | Food production & distribution | | 738,636 | | | 5 | % |
| Food production & distribution | | 655,340 | | | 4 | % | | Tech & telecom | | 618,719 | | | 4 | % |
| Hospitality & leisure | | 576,328 | | | 4 | % | | Hospitality & leisure | | 562,234 | | | 4 | % |
| Oil & gas | | 563,350 | | | 3 | % | | Oil & gas | | 519,784 | | | 3 | % |
| Consumer nondurable goods | | 378,583 | | | 2 | % | | Consumer nondurable goods | | 425,214 | | | 3 | % |
| All other C&I | | 5,998,210 | | | 36 | % | | All other C&I | | 5,581,869 | | | 35 | % |
| Total C&I | | $ | 16,581,079 | | | 100 | % | | Total C&I | | $ | 15,711,095 | | | 100 | % |
| | | | | | | | | | |
Oil & gas
Commercial — Total Commercial Real Estate Loans. Total CRE loans outstanding comprisedtotaled $20.5 billion as of December 31, 2023, which grew by $1.4 billion, or 7%, from $19.1 billion as of C&I loansDecember 31, 2022, and 3%accounted for 39% of total loans held-for-investment as of both December 31, 2020, a decrease from 11% of C&I loans2023 and 4% of2022. The total loans held-for-investment as of December 31, 2019. As of December 31, 2020, oil & gas outstanding totaled $1.03 billion, a decrease of 23% from $1.33 billion as of December 31, 2019. Unfunded commitments to oil & gas borrowers were $312.1 million as of December 31, 2020, a decrease of 35% from $477.6 million as of December 31, 2019. Based on total commitment as of December 31, 2020, the oil & gas portfolio mix was: 59% exploration and production (“E&P”) companies, 34% midstream and downstream companies, and 7% oilfield services and other companies. In comparison, the oil & gas portfolio mix was: 64% E&P companies, 29% midstream and downstream companies, and 7% oilfield services and other companies as of December 31, 2019. The COVID-19 pandemic, fallen global commodity demand, and oil & gas price volatility have unfavorably impacted the credit risk of the oil & gas industry sector. Accordingly, the Company increased its allowance for loan loss coverage for oil & gas loans outstanding to 11% as of December 31, 2020, up from 5% as of December 31, 2019.
Commercial — Commercial Real Estate Loans. The CRE portfolio consists of income-producing CRE, multifamily residential, and construction and land loans. Total CRE loans, outstanding were $14.81 billion, or 39% of total loans held-for-investment as of December 31, 2020, compared with $13.76 billion, or 40% of total loans held-for-investment as of December 31, 2019. Year-over-year,and affordable housing lending. The increase in total CRE loans increased $1.04 billion, or 8%, primarilywas driven by well-diversified growth across our major property types, partially offset by a decrease in income-producing CRE.office CRE loans. The Company’s underwriting parameters for CRE loans are established in compliance with supervisory guidance, including: property type, geography and loan-to-value (“LTV”). The consistency of the Company’s low LTV underwriting standards has historically resulted in lower credit losses.
The Company’s total CRE loan portfolio is granular and broadly diversifiedwell-diversified by property type which serves to mitigate a portion of its geographical concentration in California. Thewith an average CRE loan size of total CRE loans was $2.4 million and $2.1$3 million as of both December 31, 20202023 and 2019, respectively.2022. The following table summarizes the Company’s total CRE loans by property type as of December 31, 20202023 and 2019:2022:
| | | | | | | | | | | | | | | | | | | | | | | | | | |
|
| ($ in thousands) | | December 31, 2020 | | December 31, 2019 |
| Amount | | % | | Amount | | % |
| Property types: | | | | | | | | |
| Retail | | $ | 3,466,141 | | | 23 | % | | $ | 3,300,106 | | | 24 | % |
| Multifamily | | 3,033,998 | | | 20 | % | | 2,856,374 | | | 21 | % |
| Offices | | 2,747,082 | | | 19 | % | | 2,375,087 | | | 17 | % |
| Industrial | | 2,407,594 | | | 16 | % | | 2,163,769 | | | 16 | % |
| Hospitality | | 1,888,797 | | | 13 | % | | 1,865,031 | | | 14 | % |
| Construction and land | | 599,692 | | | 4 | % | | 628,499 | | | 4 | % |
| Other | | 664,997 | | | 5 | % | | 574,455 | | | 4 | % |
| Total CRE loans | | $ | 14,808,301 | | | 100 | % | | $ | 13,763,321 | | | 100 | % |
|
| | | | | | | | | | | | | | | | | | | | | | | | | | |
|
| | December 31, 2023 | | December 31, 2022 |
| ($ in thousands) | | Amount | | % | | Amount | | % |
| Property type: | | | | | | | | |
| Multifamily | | $ | 5,023,164 | | | 25 | % | | $ | 4,573,068 | | | 24 | % |
Retail (1) | | 4,297,569 | | | 21 | % | | 4,075,768 | | | 22 | % |
Industrial (1) | | 3,997,764 | | | 20 | % | | 3,617,086 | | | 19 | % |
Hotel (1) | | 2,446,504 | | | 12 | % | | 2,085,910 | | | 11 | % |
Office (1) | | 2,271,508 | | | 11 | % | | 2,522,554 | | | 13 | % |
Healthcare (1) | | 852,362 | | | 4 | % | | 796,577 | | | 4 | % |
| Construction and land | | 663,868 | | | 3 | % | | 638,420 | | | 3 | % |
Other (1) | | 911,373 | | | 4 | % | | 759,975 | | | 4 | % |
| Total CRE loans | | $ | 20,464,112 | | | 100 | % | | $ | 19,069,358 | | | 100 | % |
|
(1)Included in CRE loans, which are a subset of Total CRE loans.
The weighted-average loan-to-value (“LTV”)LTV ratio of the total CRE loan portfolio was 50% as of December 31, 2023, compared with 51% as of December 31, 2020, compared with 50% as of December 31, 2019. The low weighted-average2022. Weighted average LTV ratio was consistent by CRE property type.is based on the most recent LTV, which is based on the latest available appraisal and current loan commitment. Approximately 89%91% and 90% of total CRE loans had an LTV ratio of 65% or lower as of December 31, 2020, compared with 85% as of December 31, 2019. The consistency of the Company’s low LTV underwriting standards has historically resulted in lower credit losses for income-producing CRE2023 and multifamily residential loans.2022, respectively.
The following tables provide a summary of the Company’s income-producing CRE, multifamily residential, and construction and land loans by geography as of December 31, 20202023 and 2019.2022. The distribution of the total CRE loan portfolio largely reflects the Company’s geographical branch footprint, which is primarily concentrated in California:
| | | ($ in thousands) | | December 31, 2020 |
| | | December 31, 2023 | |
| | December 31, 2023 | |
| | December 31, 2023 | |
| | December 31, 2023 | |
| | December 31, 2023 | |
| | December 31, 2023 | |
| | December 31, 2023 | |
| | December 31, 2023 | |
| | December 31, 2023 | |
| | December 31, 2023 | |
| | December 31, 2023 | |
| | December 31, 2023 | |
| | December 31, 2023 | |
| | December 31, 2023 | |
| | December 31, 2023 | |
| | December 31, 2023 | |
| | December 31, 2023 | |
| | December 31, 2023 | |
| | December 31, 2023 | |
| | December 31, 2023 | |
| | December 31, 2023 | |
| | December 31, 2023 | |
| | December 31, 2023 | |
| | December 31, 2023 | |
| | December 31, 2023 | |
| | December 31, 2023 | |
| | December 31, 2023 | |
| | December 31, 2023 | |
| | December 31, 2023 | |
| | December 31, 2023 | |
| | December 31, 2023 | |
| | December 31, 2023 | |
| | December 31, 2023 | |
| | December 31, 2023 | |
| | December 31, 2023 | |
| | December 31, 2023 | |
| | December 31, 2023 | |
| | December 31, 2023 | |
| | December 31, 2023 | |
| | December 31, 2023 | |
| | December 31, 2023 | |
| | December 31, 2023 | |
| | December 31, 2023 | |
| | December 31, 2023 | |
| | December 31, 2023 | |
| | December 31, 2023 | |
| | December 31, 2023 | |
| | December 31, 2023 | |
| | December 31, 2023 | |
| | December 31, 2023 | |
| ($ in thousands) | ($ in thousands) | | CRE | | % | | Multifamily
Residential | | % | | Construction
and Land | | % | | Total | | % | ($ in thousands) | | CRE | | % | | Multifamily Residential | | % | | Construction and Land | | % | | Total | | % |
| | Southern California | Southern California | | $ | 5,884,691 | | | $ | 1,867,646 | | | $ | 249,282 | | | $ | 8,001,619 | | |
| Southern California | |
| Southern California | | | $ | 7,604,053 | | | 51 | % | | $ | 2,295,592 | | | 46 | % | | $ | 294,879 | | | 44 | % | | $ | 10,194,524 | | | 50 | % |
| Northern California | Northern California | | 2,476,510 | | | 674,813 | | | 197,195 | | | 3,348,518 | | | Northern California | | 2,737,635 | | | 19 | | 19 | % | | 1,055,852 | | | 21 | | 21 | % | | 147,031 | | | 22 | | 22 | % | | 3,940,518 | | | 19 | | 19 | % |
| California | California | | 8,361,201 | | | 75 | % | | 2,542,459 | | | 84 | % | | 446,477 | | | 74 | % | | 11,350,137 | | | 77 | % | California | | 10,341,688 | | | 70 | | 70 | % | | 3,351,444 | | | 67 | | 67 | % | | 441,910 | | | 66 | | 66 | % | | 14,135,042 | | | 69 | | 69 | % |
| Texas | | Texas | | 1,122,428 | | | 8 | % | | 445,391 | | | 9 | % | | 41,768 | | | 6 | % | | 1,609,587 | | | 8 | % |
| New York | New York | | 696,712 | | | 6 | % | | 137,114 | | | 4 | % | | 93,806 | | | 16 | % | | 927,632 | | | 6 | % | New York | | 696,950 | | | 5 | | 5 | % | | 287,961 | | | 6 | | 6 | % | | 43,227 | | | 7 | | 7 | % | | 1,028,138 | | | 5 | | 5 | % |
| Texas | | 864,639 | | | 8 | % | | 116,367 | | | 4 | % | | 2,581 | | | 0 | % | | 983,587 | | | 7 | % |
| Washington | Washington | | 341,374 | | | 3 | % | | 91,824 | | | 3 | % | | 22,724 | | | 4 | % | | 455,922 | | | 3 | % | Washington | | 495,577 | | | 3 | | 3 | % | | 173,367 | | | 3 | | 3 | % | | 10,375 | | | 2 | | 2 | % | | 679,319 | | | 3 | | 3 | % |
| Arizona | Arizona | | 147,187 | | | 1 | % | | 12,406 | | | 0 | % | | — | | | — | % | | 159,593 | | | 1 | % | Arizona | | 355,047 | | | 2 | | 2 | % | | 148,970 | | | 3 | | 3 | % | | 38,897 | | | 6 | | 6 | % | | 542,914 | | | 3 | | 3 | % |
| Nevada | Nevada | | 88,959 | | | 1 | % | | 86,644 | | | 3 | % | | 22,384 | | | 4 | % | | 197,987 | | | 1 | % | Nevada | | 257,105 | | | 2 | | 2 | % | | 142,133 | | | 3 | | 3 | % | | 6,325 | | | 1 | | 1 | % | | 405,563 | | | 2 | | 2 | % |
| Other markets | Other markets | | 674,539 | | | 6 | % | | 47,184 | | | 2 | % | | 11,720 | | | 2 | % | | 733,443 | | | 5 | % | Other markets | | 1,508,286 | | | 10 | | 10 | % | | 473,897 | | | 9 | | 9 | % | | 81,366 | | | 12 | | 12 | % | | 2,063,549 | | | 10 | | 10 | % |
| Total loans | Total loans | | $ | 11,174,611 | | | 100 | % | | $ | 3,033,998 | | | 100 | % | | $ | 599,692 | | | 100 | % | | $ | 14,808,301 | | | 100 | % | Total loans | | $ | 14,777,081 | | | 100 | | 100 | % | | $ | 5,023,163 | | | 100 | | 100 | % | | $ | 663,868 | | | 100 | | 100 | % | | $ | 20,464,112 | | | 100 | | 100 | % |
|
| | | | | | | | | | | | | | | | | | | | | | | | | | | | | | | | | | | | | | | | | | | | | | | | | | |
|
| ($ in thousands) | | December 31, 2019 |
| CRE | | % | | Multifamily
Residential | | % | | Construction
and Land | | % | | Total | | % |
| Geographic markets: | | | | | | | | | | | | | | | | |
| Southern California | | $ | 5,446,786 | | | | | $ | 1,728,086 | | | | | $ | 247,170 | | | | | $ | 7,422,042 | | | |
| Northern California | | 2,359,808 | | | | | 603,135 | | | | | 203,706 | | | | | 3,166,649 | | | |
| California | | 7,806,594 | | | 76 | % | | 2,331,221 | | | 82 | % | | 450,876 | | | 72 | % | | 10,588,691 | | | 77 | % |
| New York | | 701,902 | | | 7 | % | | 116,923 | | | 4 | % | | 79,962 | | | 13 | % | | 898,787 | | | 7 | % |
| Texas | | 628,576 | | | 6 | % | | 124,646 | | | 4 | % | | 8,604 | | | 1 | % | | 761,826 | | | 6 | % |
| Washington | | 306,247 | | | 3 | % | | 55,913 | | | 2 | % | | 37,552 | | | 6 | % | | 399,712 | | | 3 | % |
| Arizona | | 149,151 | | | 1 | % | | 37,208 | | | 1 | % | | 6,951 | | | 1 | % | | 193,310 | | | 1 | % |
| Nevada | | 102,891 | | | 1 | % | | 138,577 | | | 5 | % | | 40 | | | 0 | % | | 241,508 | | | 2 | % |
| Other markets | | 583,087 | | | 6 | % | | 51,886 | | | 2 | % | | 44,514 | | | 7 | % | | 679,487 | | | 4 | % |
Total loans (1) | | $ | 10,278,448 | | | 100 | % | | $ | 2,856,374 | | | 100 | % | | $ | 628,499 | | | 100 | % | | $ | 13,763,321 | | | 100 | % |
|
(1)Loans net of ASC 310-30 discount. | | | | | | | | | | | | | | | | | | | | | | | | | | | | | | | | | | | | | | | | | | | | | | | | | | |
|
| | December 31, 2022 |
| ($ in thousands) | | CRE | | % | | Multifamily Residential | | % | | Construction and Land | | % | | Total | | % |
| Geographic markets: | | | | | | | | | | | | | | | | |
| Southern California | | $ | 7,233,902 | | | 52 | % | | $ | 2,215,632 | | | 48 | % | | $ | 222,425 | | | 35 | % | | $ | 9,671,959 | | | 51 | % |
| Northern California | | 2,798,840 | | | 20 | % | | 890,002 | | | 20 | % | | 235,732 | | | 37 | % | | 3,924,574 | | | 20 | % |
| California | | 10,032,742 | | | 72 | % | | 3,105,634 | | | 68 | % | | 458,157 | | | 72 | % | | 13,596,533 | | | 71 | % |
| Texas | | 1,150,401 | | | 8 | % | | 410,872 | | | 9 | % | | 2,153 | | | 0 | % | | 1,563,426 | | | 8 | % |
| New York | | 682,096 | | | 5 | % | | 221,253 | | | 5 | % | | 99,595 | | | 16 | % | | 1,002,944 | | | 5 | % |
| Washington | | 449,423 | | | 3 | % | | 173,611 | | | 4 | % | | 15,557 | | | 2 | % | | 638,591 | | | 3 | % |
| Arizona | | 291,114 | | | 2 | % | | 95,460 | | | 2 | % | | 297 | | | 0 | % | | 386,871 | | | 2 | % |
| Nevada | | 159,092 | | | 1 | % | | 108,060 | | | 2 | % | | 30,673 | | | 5 | % | | 297,825 | | | 2 | % |
| Other markets | | 1,093,002 | | | 9 | % | | 458,178 | | | 10 | % | | 31,988 | | | 5 | % | | 1,583,168 | | | 9 | % |
| Total loans | | $ | 13,857,870 | | | 100 | % | | $ | 4,573,068 | | | 100 | % | | $ | 638,420 | | | 100 | % | | $ | 19,069,358 | | | 100 | % |
|
Since 77% theseAs of December 31, 2023 and 2022, 69% and 71%, respectively, of total CRE loans were concentrated in California as of both December 31, 2020 and 2019, changesCalifornia. Changes in California’s economy and real estate values could have a significant impact on the collectability of these loans and the required level of allowance for loan losses. For additional information related to the higher degree of risk from a downturn in the California real estate markets, in California, see Item 1A. Risk Factors — Risks Related to Geopolitical Uncertainties in this Form 10-K.
Commercial — Income-Producing Commercial Real Estate Loans. The Company focuses on providing financing to experienced real estate investors and developers who have moderate levels of leverage, many of whom are long-time customers of the Bank. Income-producing CRE loans totaled $11.17$14.8 billion oras of December 31, 2023, compared with $13.9 billion as of December 31, 2022, and accounted for 28% and 29% of total loans held-for-investment as of December 31, 2020, compared with $10.28 billion, or 30% of total loans held-for-investment as of December 31, 2019.2023 and 2022, respectively. Interest rates on CRE loans may be fixed, variable or hybrid. As of December 31, 2023, 58% of our CRE portfolio was variable rate, of which 50% had customer-level interest rate derivative contracts in place. These were hedging contracts offered by the Company to help our customers manage their interest rate risk while the Bank’s own exposure remained variable rate. In comparison, as of December 31, 2022, 65% of our CRE portfolio was variable rate, of which 47% had customer-level interest rate derivative contracts in place. Loans are underwritten with conservative standards for cash flows, debt service coverage and LTV.
Owner-occupied properties comprised 20% of the income-producing CRE loans as of both December 31, 20202023 and 2019.2022. The remainder were non-owner-occupied properties, where 50% or more of the debt service for the loan is typically provided by unaffiliated rental income from aan unaffiliated third party.
Commercial — Multifamily Residential Loans. The multifamily residential loan portfolio is largely made upcomprised of loans secured by residential properties with five or more units. Multifamily residential loans totaled $3.03$5.0 billion as of December 31, 2020,2023, compared with $2.86$4.6 billion as of December 31, 2019,2022, and accounted for 8%10% and 9% of total loans held-for-investment as of both dates.December 31, 2023 and 2022, respectively. The Company offers a variety of first lien mortgages, including fixed- and variable-rate loans, as well as hybrid loans with interest rates that adjust annually after an initial fixed rate period of three to seventen years. As of December 31, 2023, 48% of our multifamily residential portfolio was variable rate, of which 40% had customer-level interest rate derivative contracts in place. These were hedging contracts offered by the Company to help our customers manage their interest rate risk while the Bank’s own exposure remained variable rate. In comparison, as of December 31, 2022, 57% of our multifamily residential loan portfolio was variable rate, of which 34% had customer-level interest rate derivative contracts in place.
Commercial — Construction and Land Loans. Construction and land loans provide financing for a portfolio of projects diversified by real estate property type. TheseConstruction and land loans totaled $599.7 million December 31, 2020, compared with $628.5$664 million as of December 31, 2019,2023, compared with $638 million as of December 31, 2022, and accounted for 2%1% of total loans held-for-investment as of both dates. Construction loan exposure was made up of $554.7$526 million in loans outstanding plus $288.2and $672 million in unfunded commitments, as of December 31, 2020,2023, compared with $558.2$537 million in loans outstanding plus $351.4and $611 million in unfunded commitments as of December 31, 2019.2022. Land loans totaled $138 million as of December 31, 2023, compared with $102 million as of December 31, 2022.
Consumer
Residential mortgage loans are primarily originated through the Bank’s branch network. The average total residential loan size was $436 thousand and $434 thousand as of December 31, 2023 and 2022, respectively. The following tables summarize the Company’s single-family residential and HELOCsHELOC loan portfolios by geography as of December 31, 20202023 and 2019:2022:
| | | ($ in thousands) | | December 31, 2020 |
| | | December 31, 2023 | |
| | December 31, 2023 | |
| | December 31, 2023 | |
| | December 31, 2023 | |
| | December 31, 2023 | |
| | December 31, 2023 | |
| | December 31, 2023 | |
| | December 31, 2023 | |
| | December 31, 2023 | |
| | December 31, 2023 | |
| | December 31, 2023 | |
| | December 31, 2023 | |
| | December 31, 2023 | |
| | December 31, 2023 | |
| | December 31, 2023 | |
| | December 31, 2023 | |
| | December 31, 2023 | |
| | December 31, 2023 | |
| | December 31, 2023 | |
| | December 31, 2023 | |
| | December 31, 2023 | |
| | December 31, 2023 | |
| | December 31, 2023 | |
| | December 31, 2023 | |
| | December 31, 2023 | |
| | December 31, 2023 | |
| | December 31, 2023 | |
| | December 31, 2023 | |
| | December 31, 2023 | |
| | December 31, 2023 | |
| | December 31, 2023 | |
| | December 31, 2023 | |
| | December 31, 2023 | |
| | December 31, 2023 | |
| | December 31, 2023 | |
| | December 31, 2023 | |
| | December 31, 2023 | |
| | December 31, 2023 | |
| ($ in thousands) | ($ in thousands) | | Single-
Family
Residential | | % | | HELOCs | | % | | Total Residential Mortgage | | % | ($ in thousands) | | Single-Family Residential | | % | | HELOCs | | % | | Total Residential Mortgage | | % |
| | Southern California | |
| Southern California | |
| Southern California | Southern California | | $ | 3,462,067 | | | $ | 728,733 | | | $ | 4,190,800 | | | | $ | 4,990,848 | | | 37 | | 37 | % | | $ | 799,571 | | | 46 | | 46 | % | | $ | 5,790,419 | | | 38 | | 38 | % |
| Northern California | Northern California | | 1,059,832 | | | 354,014 | | | 1,413,846 | | | Northern California | | 1,650,905 | | | 13 | | 13 | % | | 370,989 | | | 22 | | 22 | % | | 2,021,894 | | | 13 | | 13 | % |
| California | California | | 4,521,899 | | | 55 | % | | 1,082,747 | | | 68 | % | | 5,604,646 | | | 57 | % | California | | 6,641,753 | | | 50 | | 50 | % | | 1,170,560 | | | 68 | | 68 | % | | 7,812,313 | | | 51 | | 51 | % |
| New York | New York | | 2,277,722 | | | 28 | % | | 244,425 | | | 15 | % | | 2,522,147 | | | 26 | % | New York | | 4,376,416 | | | 33 | | 33 | % | | 247,202 | | | 14 | | 14 | % | | 4,623,618 | | | 31 | | 31 | % |
| Washington | Washington | | 597,231 | | | 7 | % | | 180,765 | | | 11 | % | | 777,996 | | | 8 | % | Washington | | 696,028 | | | 5 | | 5 | % | | 184,843 | | | 11 | | 11 | % | | 880,871 | | | 6 | | 6 | % |
| Massachusetts | Massachusetts | | 259,368 | | | 3 | % | | 44,633 | | | 3 | % | | 304,001 | | | 3 | % | Massachusetts | | 391,666 | | | 3 | | 3 | % | | 67,016 | | | 4 | | 4 | % | | 458,682 | | | 3 | | 3 | % |
| Georgia | | Georgia | | 432,258 | | | 3 | % | | 17,123 | | | 1 | % | | 449,381 | | | 3 | % |
| Nevada | | Nevada | | 404,837 | | | 3 | % | | 33,959 | | | 2 | % | | 438,796 | | | 3 | % |
| Texas | Texas | | 209,737 | | | 3 | % | | — | | | — | % | | 209,737 | | | 2 | % | Texas | | 423,972 | | | 3 | | 3 | % | | — | | | — | | — | % | | 423,972 | | | 3 | | 3 | % |
| Other markets | Other markets | | 319,996 | | | 4 | % | | 49,146 | | | 3 | % | | 369,142 | | | 4 | % | Other markets | | 16,130 | | | 0 | | 0 | % | | 1,501 | | | 0 | | 0 | % | | 17,631 | | | 0 | | 0 | % |
| Total | Total | | $ | 8,185,953 | | | 100 | % | | $ | 1,601,716 | | | 100 | % | | $ | 9,787,669 | | | 100 | % | Total | | $ | 13,383,060 | | | 100 | | 100 | % | | $ | 1,722,204 | | | 100 | | 100 | % | | $ | 15,105,264 | | | 100 | | 100 | % |
| Lien priority: | Lien priority: | | | | | | | | | | | | |
| First mortgage | First mortgage | | $ | 8,185,953 | | | 100 | % | | $ | 1,372,270 | | | 86 | % | | $ | 9,558,223 | | | 98 | % |
| First mortgage | |
| First mortgage | | | $ | 13,383,060 | | | 100 | % | | $ | 1,331,509 | | | 77 | % | | $ | 14,714,569 | | | 97 | % |
| Junior lien mortgage | Junior lien mortgage | | — | | | — | % | | 229,446 | | | 14 | % | | 229,446 | | | 2 | % | Junior lien mortgage | | — | | | — | | — | % | | 390,695 | | | 23 | | 23 | % | | 390,695 | | | 3 | | 3 | % |
| Total | Total | | $ | 8,185,953 | | | 100 | % | | $ | 1,601,716 | | | 100 | % | | $ | 9,787,669 | | | 100 | % | Total | | $ | 13,383,060 | | | 100 | | 100 | % | | $ | 1,722,204 | | | 100 | | 100 | % | | $ | 15,105,264 | | | 100 | | 100 | % |
|
| | | | | | | | | | | | | | | | | | | | | | | | | | | | | | | | | | | | | | |
|
| ($ in thousands) | | December 31, 2019 |
| Single-
Family
Residential | | % | | HELOCs | | % | | Total Residential Mortgage | | % |
| Geographic markets: | | | | | | | | | | | | |
| Southern California | | $ | 3,081,368 | | | | | $ | 702,915 | | | | | $ | 3,784,283 | | | |
| Northern California | | 1,038,945 | | | | | 309,883 | | | | | 1,348,828 | | | |
| California | | 4,120,313 | | | 58 | % | | 1,012,798 | | | 69 | % | | 5,133,111 | | | 60 | % |
| New York | | 1,657,732 | | | 23 | % | | 257,344 | | | 17 | % | | 1,915,076 | | | 22 | % |
| Washington | | 630,307 | | | 9 | % | | 133,625 | | | 9 | % | | 763,932 | | | 9 | % |
| Massachusetts | | 235,393 | | | 3 | % | | 31,310 | | | 2 | % | | 266,703 | | | 3 | % |
| Texas | | 188,838 | | | 3 | % | | — | | | — | % | | 188,838 | | | 2 | % |
| Other markets | | 276,007 | | | 4 | % | | 37,706 | | | 3 | % | | 313,713 | | | 4 | % |
Total (1) | | $ | 7,108,590 | | | 100 | % | | $ | 1,472,783 | | | 100 | % | | $ | 8,581,373 | | | 100 | % |
| Lien priority: | | | | | | | | | | | | |
| First mortgage | | $ | 7,108,588 | | | 100 | % | | $ | 1,238,186 | | | 84 | % | | $ | 8,346,774 | | | 97 | % |
| Junior lien mortgage | | 2 | | | 0 | % | | 234,597 | | | 16 | % | | 234,599 | | | 3 | % |
Total (1) | | $ | 7,108,590 | | | 100 | % | | $ | 1,472,783 | | | 100 | % | | $ | 8,581,373 | | | 100 | % |
|
(1)Loans net of ASC 310-30 discount. | | | | | | | | | | | | | | | | | | | | | | | | | | | | | | | | | | | | | | |
|
| | December 31, 2022 |
| ($ in thousands) | | Single-Family Residential | | % | | HELOCs | | % | | Total Residential Mortgage | | % |
| Geographic markets: | | | | | | | | | | | | |
| Southern California | | $ | 4,142,623 | | | 37 | % | | $ | 959,632 | | | 45 | % | | $ | 5,102,255 | | | 38 | % |
| Northern California | | 1,294,721 | | | 11 | % | | 492,921 | | | 23 | % | | 1,787,642 | | | 14 | % |
| California | | 5,437,344 | | | 48 | % | | 1,452,553 | | | 68 | % | | 6,889,897 | | | 52 | % |
| New York | | 3,964,779 | | | 35 | % | | 286,285 | | | 14 | % | | 4,251,064 | | | 32 | % |
| Washington | | 632,892 | | | 6 | % | | 236,434 | | | 11 | % | | 869,326 | | | 7 | % |
| Massachusetts | | 299,051 | | | 3 | % | | 85,590 | | | 4 | % | | 384,641 | | | 3 | % |
| Georgia | | 303,615 | | | 3 | % | | 21,493 | | | 1 | % | | 325,108 | | | 2 | % |
| Texas | | 316,771 | | | 3 | % | | — | | | — | % | | 316,771 | | | 2 | % |
| Nevada | | 253,702 | | | 2 | % | | 40,300 | | | 2 | % | | 294,002 | | | 2 | % |
| Other markets | | 14,873 | | | 0 | % | | — | | | — | % | | 14,873 | | | 0 | % |
| Total | | $ | 11,223,027 | | | 100 | % | | $ | 2,122,655 | | | 100 | % | | $ | 13,345,682 | | | 100 | % |
| Lien priority: | | | | | | | | | | | | |
| First mortgage | | $ | 11,223,027 | | | 100 | % | | $ | 1,770,741 | | | 83 | % | | $ | 12,993,768 | | | 97 | % |
| Junior lien mortgage | | — | | | — | % | | 351,914 | | | 17 | % | | 351,914 | | | 3 | % |
| Total | | $ | 11,223,027 | | | 100 | % | | $ | 2,122,655 | | | 100 | % | | $ | 13,345,682 | | | 100 | % |
|
Consumer — Single-Family Residential Loans. Single-family residential loans totaled $8.19$13.4 billion or 21%26% of total loans held-for-investment as of December 31, 2020,2023, compared with $7.11$11.2 billion or 20%23% of total loans held-for-investment as of December 31, 2019.2022. Year-over-year, single-family residential loans increased $1.08$2.2 billion or 15%19%, primarily driven by organic growth in mortgages and residential properties in California and New York and Southern California.York. The Company was in a first lien position for virtually all of its single-family residential loans as of both December 31, 20202023 and 2019.2022. Many of these loans are reduced documentation loans, for which a substantial down payment is required, resulting in a low LTV ratio at origination, typically 65% or less. The weighted-average LTV ratio was 53% as of both December 31, 2023 and 2022. These loans have historically experienced low delinquency and loss rates. The Company offers a variety of single-family residential first lien mortgage loan programs, including fixed- and variable-rate loans, as well as hybrid loans with interest rates that adjust on a regular basis, typically annually, after an initial fixed ratefixed-rate period.
Consumer — Home Equity Lines of Credit. HELOCs totaled $1.60Total HELOC commitments were $5.2 billion as of December 31, 2020, compared with $1.472023, which decreased by $274 million or 5% from $5.5 billion as of December 31, 2019,2022, with a utilization rate of 33% as of December 31, 2023, compared with 39% as of December 31, 2022. Substantially all of the Company’s unfunded HELOC commitments are unconditionally cancellable. HELOCs outstanding totaled $1.7 billion as of December 31, 2023, compared with $2.1 billion as of December 31, 2022, and accounted for 4%3% and 5% of total loans held-for-investment as of both dates.December 31, 2023 and 2022, respectively. Year-over-year, HELOCs increased $128.9outstanding decreased $400 million, or 9%, primarily driven by growth in California and Washington.19%. The Company was in a first lien position for 86%77% and 84%83% of itstotal outstanding HELOCs as of December 31, 20202023 and 2019,2022, respectively. The weighted-average LTV ratio was 48% on HELOC commitments as of December 31, 2023, compared with 49% as of December 31, 2022. Weighted-average LTV ratio represents the loan’s balance divided by the estimated current property value. Combined LTV ratios are used for junior lien home equity loans. Many of thethese loans within this portfolio are reduced documentation loans, for which a substantial down payment is required, resulting in a low LTV ratio at origination, typically 60%65% or less. TheseAs a result, these loans have historically experienced low delinquency and loss rates. VirtuallySubstantially all of the Company’s HELOCs were variable-rate loans.loans as of both December 31, 2023 and 2022.
All originated commercial and consumer loans are subject to the Company’s conservative underwriting guidelines and loan origination standards. Management believes that the Company’s underwriting criteria and procedures adequately consider the unique risks associated with these products. The Company conducts a variety of quality control procedures and periodic audits, including the review of lending and legal requirements, to ensure that the Company is compliantin compliance with these requirements.
The following table presents the contractual loan maturities by loan category and the contractual distribution of loans to changes in interest rates as of December 31, 2020:2023:
| | | | | | | | | | | | | | | | | | | | | | | | | | |
|
| ($ in thousands) | | Due within
one year | | Due after one
year through
five years | | Due after
five years | | Total |
| Commercial: | | | | | | | | |
| C&I | | $ | 4,648,509 | | | $ | 7,697,855 | | | $ | 1,285,362 | | | $ | 13,631,726 | |
| CRE: | | | | | | | | |
| CRE | | 808,302 | | | 5,047,922 | | | 5,318,387 | | | 11,174,611 | |
| Multifamily residential | | 167,854 | | | 580,924 | | | 2,285,220 | | | 3,033,998 | |
| Construction and land | | 323,627 | | | 221,375 | | | 54,690 | | | 599,692 | |
| Total CRE | | 1,299,783 | | | 5,850,221 | | | 7,658,297 | | | 14,808,301 | |
| Total commercial | | 5,948,292 | | | 13,548,076 | | | 8,943,659 | | | 28,440,027 | |
| Consumer: | | | | | | | | |
| Residential mortgage: | | | | | | | | |
| Single-family residential | | 329 | | | 6,696 | | | 8,178,928 | | | 8,185,953 | |
| HELOCs | | — | | | 366 | | | 1,601,350 | | | 1,601,716 | |
| Total residential mortgage | | 329 | | | 7,062 | | | 9,780,278 | | | 9,787,669 | |
| Other consumer | | 59,496 | | | 98,268 | | | 5,495 | | | 163,259 | |
| Total consumer | | 59,825 | | | 105,330 | | | 9,785,773 | | | 9,950,928 | |
| Total loans held-for-investment | | $ | 6,008,117 | | | $ | 13,653,406 | | | $ | 18,729,432 | | | $ | 38,390,955 | |
| | | | | | | | |
| Distribution of loans to changes in interest rates: | | | | | | | | |
| Variable-rate loans | | $ | 4,864,904 | | | $ | 10,762,372 | | | $ | 9,332,028 | | | $ | 24,959,304 | |
| Fixed-rate loans | | 1,143,213 | | | 2,693,339 | | | 3,296,293 | | | 7,132,845 | |
| Hybrid adjustable-rate loans | | — | | | 197,695 | | | 6,101,111 | | | 6,298,806 | |
| Total loans held-for-investment | | $ | 6,008,117 | | | $ | 13,653,406 | | | $ | 18,729,432 | | | $ | 38,390,955 | |
|
Purchased Credit Deteriorated Loans
The Company adopted ASU 2016-13 using the prospective transition approach for purchased financial assets with credit deterioration that were previously classified as purchased credit impaired (“PCI”) and accounted for under ASC 310-30. On January 1, 2020, the amortized cost basis of the purchased credit deteriorated (“PCD”) loans was adjusted to reflect a $1.2 million addition of allowance for loan losses. The Company did not acquire any PCD loans during 2020. For additional details regarding PCD loans, see Note 1 — Summary of Significant Accounting Policies and Note 6 — Loans Receivable and Allowance for Credit Losses to the Consolidated Financial Statements in this Form 10-K. Prior to the adoption of ASU 2016-13, the carrying value of PCI loans totaled $222.9 million as of December 31, 2019. | | | | | | | | | | | | | | | | | | | | | | | | | | | | | | | | |
|
| ($ in thousands) | | Due within one year | | Due after one year through five years | | Due after five years through fifteen years | | Due after fifteen years | | Total |
| Commercial: | | | | | | | | | | |
| C&I | | $ | 6,377,460 | | | $ | 9,423,384 | | | $ | 615,317 | | | $ | 164,918 | | | $ | 16,581,079 | |
| CRE: | | | | | | | | | | |
| CRE | | 1,335,154 | | | 6,980,010 | | | 6,324,116 | | | 137,801 | | | 14,777,081 | |
| Multifamily residential | | 215,519 | | | 1,352,396 | | | 1,604,163 | | | 1,851,085 | | | 5,023,163 | |
| Construction and land | | 298,450 | | | 334,460 | | | 30,734 | | | 224 | | | 663,868 | |
| Total CRE | | 1,849,123 | | | 8,666,866 | | | 7,959,013 | | | 1,989,110 | | | 20,464,112 | |
| Total commercial | | 8,226,583 | | | 18,090,250 | | | 8,574,330 | | | 2,154,028 | | | 37,045,191 | |
| Consumer: | | | | | | | | | | |
| Residential mortgage: | | | | | | | | | | |
| Single-family residential | | 638 | | | 6,423 | | | 1,453,334 | | | 11,922,665 | | | 13,383,060 | |
| HELOCs | | — | | | 1,557 | | | 126,301 | | | 1,594,346 | | | 1,722,204 | |
| Total residential mortgage | | 638 | | | 7,980 | | | 1,579,635 | | | 13,517,011 | | | 15,105,264 | |
| Other consumer | | 33,234 | | | 24,744 | | | 2,349 | | | — | | | 60,327 | |
| Total consumer | | 33,872 | | | 32,724 | | | 1,581,984 | | | 13,517,011 | | | 15,165,591 | |
| Total loans held-for-investment | | $ | 8,260,455 | | | $ | 18,122,974 | | | $ | 10,156,314 | | | $ | 15,671,039 | | | $ | 52,210,782 | |
| | | | | | | | | | |
| Distribution of loans to changes in interest rates: | | | | | | | | | | |
| Variable-rate loans | | $ | 6,769,986 | | | $ | 14,464,347 | | | $ | 4,439,201 | | | $ | 4,513,263 | | | $ | 30,186,797 | |
| Fixed-rate loans | | 1,445,872 | | | 3,050,536 | | | 2,677,252 | | | 4,166,473 | | | 11,340,133 | |
| Hybrid adjustable-rate loans | | 44,597 | | | 608,091 | | | 3,039,861 | | | 6,991,303 | | | 10,683,852 | |
| Total loans held-for-investment | | $ | 8,260,455 | | | $ | 18,122,974 | | | $ | 10,156,314 | | | $ | 15,671,039 | | | $ | 52,210,782 | |
|
Loans Held-for-Sale
As of December 31, 2020 and 2019, loans held-for-sale totaled $1.8 million and $434 thousand, respectively, and consisted of single-family residential loans. At the time of commitment to originate or purchase a loan, a loan is determined to be held-for-investment if it is the Company’s intent to hold the loan to maturity or for the “foreseeable future,” subject to periodic reviews under the Company’s evaluation processes, including liquidity and credit risk management. If the Company subsequently changes its intent to hold certain loans, those loans are transferred from held-for-investment to held-for-sale at the lower of cost or fair value.
Sales of Originated Loans and Purchased Loans
All loans originated by the Company are underwritten pursuant to the Company’s policies and procedures. Although the Company’s primary focus is on directly originated loans, in certain circumstances, the Company also purchases loans and participates in loans with other banks. The Company also participates out interests in directly originated commercial loans to other financial institutions or sells loans in the normal course of business.
The following tables provide information on loan sales during the years ended December 31, 2020, 2019 and 2018. Refer to Note 6 — Loans Receivable and Allowance for Credit Losses to the Consolidated Financial Statements in this Form 10-K for additional information on loan purchases and transfers.
| | | | | | | | | | | | | | | | | | | | | | | | | | | | | | | | | | | | | | | | | | |
|
| ($ in thousands) | | Year Ended December 31, 2020 |
| Commercial | | Consumer | | Total |
| | | CRE | | Residential Mortgage | | | |
| C&I | | CRE | | Multifamily
Residential | | Construction
and Land | | Single-Family
Residential | | | | | |
| Loans sold: | | | | | | | | | | | | | | | | |
| Originated loans: | | | | | | | | | | | | | | | | |
| Amount | | $ | 291,740 | | | $ | 26,994 | | | $ | 1,398 | | | $ | — | | | $ | 80,309 | | | | | | | $ | 400,441 | |
| Net gains | | $ | 565 | | | $ | 2,940 | | | $ | — | | | $ | — | | | $ | 996 | | | | | | | $ | 4,501 | |
| | | | | | | | | | | | | | | | |
| Purchased loans: | | | | | | | | | | | | | | | | |
Amount (1) | | $ | 11,780 | | | $ | — | | | $ | — | | | $ | — | | | $ | — | | | | | | | $ | 11,780 | |
| | | | | | | | | | | | | | | | |
| | | | | | | | | | | | | | | | |
|
| | | | | | | | | | | | | | | | | | | | | | | | | | | | | | | | | | | | | | | | | | |
|
| ($ in thousands) | | Year Ended December 31, 2019 |
| Commercial | | Consumer | | Total |
| | | CRE | | Residential Mortgage | | | |
| C&I | | CRE | | Multifamily
Residential | | Construction
and Land | | Single-Family
Residential | | | | | |
| Loans sold: | | | | | | | | | | | | | | | | |
| Originated loans: | | | | | | | | | | | | | | | | |
| Amount | | $ | 179,280 | | | $ | 39,062 | | | $ | — | | | $ | 1,573 | | | $ | 10,410 | | | | | | | $ | 230,325 | |
| Net gains | | $ | 875 | | | $ | 3,045 | | | $ | — | | | $ | — | | | $ | 115 | | | | | | | $ | 4,035 | |
| | | | | | | | | | | | | | | | |
| Purchased loans: | | | | | | | | | | | | | | | | |
Amount (1) | | $ | 66,511 | | | $ | — | | | $ | — | | | $ | — | | | $ | — | | | | | | | $ | 66,511 | |
| | | | | | | | | | | | | | | | |
| | | | | | | | | | | | | | | | |
|
| | | | | | | | | | | | | | | | | | | | | | | | | | | | | | | | | | | | | | | | | | |
|
| ($ in thousands) | | Year Ended December 31, 2018 |
| Commercial | | Consumer | | Total |
| | | CRE | | Residential Mortgage | | | |
| C&I | | CRE | | Multifamily
Residential | | Construction
and Land | | Single-Family
Residential | | | | | |
| Loans sold: | | | | | | | | | | | | | | | | |
| Originated loans: | | | | | | | | | | | | | | | | |
| Amount | | $ | 212,485 | | | $ | 62,291 | | | $ | — | | | $ | — | | | $ | 34,966 | | | | | | | $ | 309,742 | |
| Net gains | | $ | 1,129 | | | $ | 4,876 | | | $ | — | | | $ | — | | | $ | 552 | | | | | | | $ | 6,557 | |
| | | | | | | | | | | | | | | | |
| Purchased loans: | | | | | | | | | | | | | | | | |
| Amount | | $ | 201,359 | | | $ | — | | | $ | — | | | $ | — | | | $ | — | | | | | | | $ | 201,359 | |
| Net gains | | $ | 33 | | | $ | — | | | $ | — | | | $ | — | | | $ | — | | | | | | | $ | 33 | |
| | | | | | | | | | | | | | | | |
|
(1)Net gains on sales of purchased loans were insignificant or none.
Foreign Outstandings
The Company’s overseas offices, which include the branch in Hong Kong and the subsidiary bank in China, are subject to the general risks inherent in conducting business in foreign countries, such as regulations, orregulatory, economic and political uncertainties. As such, the Company’s international operation risk exposure is largely concentrated in China and Hong Kong. In addition, the Company’s financial assets held in the Hong Kong branch and the subsidiary bank in China may be affected by fluctuations in currency exchange rates or other factors. The Company’s country risk exposure is largely concentrated in China and Hong Kong. The following table presents the major financial assets held in the Company’s overseas offices as of December 31, 2020, 20192023 and 2018:2022:
| | | | December 31, | |
| | | December 31, | |
| | | December 31, | |
| | 2023 | |
| ($ in thousands) | ($ in thousands) | | December 31, |
| 2020 | | 2019 | | 2018 |
| Amount | | % of Total
Consolidated
Assets | | Amount | | % of Total
Consolidated
Assets | | Amount | | % of Total
Consolidated
Assets |
| Hong Kong branch: | Hong Kong branch: | | | | | | | | | | | | |
| Hong Kong branch: | |
| Hong Kong branch: | |
| Cash and cash equivalents | Cash and cash equivalents | | $ | 647,883 | | | 1 | % | | $ | 511,639 | | | 1 | % | | $ | 360,786 | | | 1 | % |
| Cash and cash equivalents | |
| Cash and cash equivalents | |
| Interest-bearing deposits with banks | |
| Interest-bearing deposits with banks | |
| Interest-bearing deposits with banks | |
AFS debt securities (1) | |
AFS debt securities (1) | |
AFS debt securities (1) | AFS debt securities (1) | | $ | 66,170 | | | 0 | % | | $ | 204,948 | | | 0 | % | | $ | 221,932 | | | 1 | % |
Loans held-for-investment (2) | Loans held-for-investment (2) | | $ | 704,415 | | | 1 | % | | $ | 573,305 | | | 1 | % | | $ | 653,860 | | | 2 | % |
Loans held-for-investment (2) | |
Loans held-for-investment (2) | |
| Total assets | |
| Total assets | |
| Total assets | Total assets | | $ | 1,426,479 | | | 3 | % | | $ | 1,361,652 | | | 3 | % | | $ | 1,247,207 | | | 3 | % |
| | Subsidiary bank in China: | Subsidiary bank in China: | |
| | Subsidiary bank in China: | |
| | Subsidiary bank in China: | |
| Cash and cash equivalents | Cash and cash equivalents | | $ | 611,088 | | | 1 | % | | $ | 548,930 | | | 1 | % | | $ | 695,527 | | | 2 | % |
| Interest-bearing deposits with banks | | $ | 74,079 | | | 0 | % | | $ | 142,587 | | | 0 | % | | $ | 221,000 | | | 1 | % |
| Cash and cash equivalents | |
| Cash and cash equivalents | |
| AFS debt securities (3) | |
| AFS debt securities (3) | |
| AFS debt securities (3) | AFS debt securities (3) | | $ | 152,219 | | | 0 | % | | $ | — | | | — | % | | $ | — | | | — | % |
Loans held-for-investment (2) | Loans held-for-investment (2) | | $ | 796,153 | | | 2 | % | | $ | 819,110 | | | 2 | % | | $ | 777,412 | | | 2 | % |
Loans held-for-investment (2) | |
Loans held-for-investment (2) | |
| Total assets | |
| Total assets | |
| Total assets | Total assets | | $ | 1,634,896 | | | 3 | % | | $ | 1,520,627 | | | 3 | % | | $ | 1,700,357 | | | 4 | % |
|
(1)Primarily comprisedComprised of U.S. Treasury securities and foreign government bonds as of both December 31, 2020, 20192023 and 2018.2022.
(2)Primarily comprised of C&I loans as of both December 31, 2020, 20192023 and 2018.2022.
(3)Comprised of foreign government bonds as of both December 31, 2020.2023 and 2022.
The following table presents the total revenue generated by the Company’s overseas offices in 2020, 20192023, 2022 and 2018:2021:
| | | | Year Ended December 31, | |
| | | Year Ended December 31, | |
| | | Year Ended December 31, | |
| | 2023 | |
| ($ in thousands) | ($ in thousands) | | Year Ended December 31, |
| 2020 | | 2019 | | 2018 |
| Amount | | % of Total
Consolidated
Revenue | | Amount | | % of Total
Consolidated
Revenue | | Amount | | % of Total
Consolidated
Revenue |
| Hong Kong Branch: | Hong Kong Branch: | | | | | | | | | | | | |
| Hong Kong Branch: | |
| Hong Kong Branch: | |
| Total revenue | |
| Total revenue | |
| Total revenue | Total revenue | | $ | 22,947 | | | 1 | % | | $ | 33,791 | | | 2 | % | | $ | 31,122 | | | 2 | % |
| | Subsidiary Bank in China: | Subsidiary Bank in China: | |
| | Subsidiary Bank in China: | |
| | Subsidiary Bank in China: | |
| Total revenue | |
| Total revenue | |
| Total revenue | Total revenue | | $ | 20,178 | | | 1 | % | | $ | 32,071 | | | 2 | % | | $ | 34,143 | | | 2 | % |
|
Capital
The Company maintains a strong capital base to support its anticipated asset growth, operating needs, and credit risks, and to ensure that the Company and the Bank are compliantin compliance with all regulatory capital guidelines. The Company engages in regular capital planning processes on at least an annual basis to optimize the use of available capital and to appropriately plan for future capital needs, allocating capital to existing and future business activities. Furthermore, the Company conducts capital stress tests as part of its capital planning process. The stress tests enable the Company to assess the impact of adverse changes in the economy and interest rates on its capital base.
InOn March 3, 2020, the Company’s Board of Directors authorized the repurchase of up to $500.0$500 million of the Company’s common stock. This $500.0 million repurchase authorization was inclusive of the Company’s $100.0 million stock repurchase authorization previously outstanding. The Company determines the timing and amount of stock repurchases, based on its assessment of various factors, including prevailing market conditions, alternate uses of capital, liquidity and the economic environment. During the firstfourth quarter of 2020,2023, the Company repurchased 4,471,682$82 million of common stock or 1,506,091 shares, at an average price of $32.64$54.56 per share. In comparison, the Company repurchased $100 million of common stock or 1,385,517 shares, at an average price of $72.17 per share and a total cost of $146.0 million. in 2022. The Company did not repurchase any shares during the remainder of 2020. As of December 31, 2020, the total remaining available capital authorized for repurchase as of December 31, 2023 was $354.0$172 million.
The Company’s stockholders’ equity was $5.27$7.0 billion as of December 31, 2020,2023, an increase of $251.6$966 million or 5%16% from $5.02$6.0 billion as of December 31, 2019.2022. The increase in the Company’s stockholders’ equity was primarily due to 20202023 net income of $567.8 million,$1.2 billion, partially offset by cash dividends declared of $158.8 million and share repurchases of $146.0$274 million. For other factors that contributed to the changes in stockholders’ equity, refer to Item 8. Financial Statements and Supplementary Data — Consolidated Statement of Changes in Stockholders’ Equity in this Form 10-K.
Book value was $37.22$49.64 per common share as of December 31, 2020,2023, an increase of 8%17% from $34.46$42.46 per common share as of December 31, 2019. 2022, primarily due to the factors described above. Tangible book value per share was $46.27 as of December 31, 2023, compared with $39.10 as of December 31, 2022. For additional details, see the reconciliation of non-GAAP measures presented under Item 7. MD&A — Reconciliation of GAAP to Non-GAAP Financial Measures in this Form 10-K.
The Company paid a cash dividendsdividend of $1.100 per common share in 2020, compared with $1.055$1.92 per share in 2019.2023, compared with $1.60 per share in 2022, an increase of 20%. In January 2021,2024, the Company’s Board of Directors declared a first quarter 20212024 cash dividendsdividend of $0.330$0.55 per common share, which represents a 20%15% increase or 5.5seven cents per share, from the previous quarterly cash dividend of $0.275$0.48 per common share. The dividend was paid on February 23, 202115, 2024, to stockholders of record as of February 9, 2021.2, 2024.
Deposits and Other Sources of FundsFunding
Deposits are the Company’s primary source of funding, the cost of which has a significant impact on the Company’s net interest income and net interest margin. Additional funding is provided by short- and long-term borrowings, and long-term debt. See Item 7. MD&A — Risk Management — Liquidity Risk Management — Liquidity in this Form 10-K for a discussion of the Company’s liquidity management. The following table summarizes the Company’s sources of funds as of December 31, 20202023 and 2019:2022:
| | | ($ in thousands) | | December 31, | | Change |
| 2020 | | 2019 | |
| | | December 31, 2023 | |
| | December 31, 2023 | |
| | December 31, 2023 | |
| | December 31, 2023 | |
| | December 31, 2023 | |
| | December 31, 2023 | |
| | December 31, 2023 | |
| | December 31, 2023 | |
| | December 31, 2023 | |
| | December 31, 2023 | |
| | December 31, 2023 | |
| | December 31, 2023 | |
| | December 31, 2023 | |
| | December 31, 2023 | |
| | December 31, 2023 | |
| | December 31, 2023 | |
| | December 31, 2023 | |
| | December 31, 2023 | |
| | December 31, 2023 | |
| | December 31, 2023 | |
| | December 31, 2023 | |
| | December 31, 2023 | |
| | December 31, 2023 | |
| | December 31, 2023 | |
| | December 31, 2023 | |
| | December 31, 2023 | |
| | December 31, 2023 | |
| | December 31, 2023 | |
| | December 31, 2023 | |
| | December 31, 2023 | |
| | December 31, 2023 | |
| | December 31, 2023 | |
| | December 31, 2023 | |
| | December 31, 2023 | |
| | December 31, 2023 | |
| | December 31, 2023 | |
| | December 31, 2023 | |
| | December 31, 2023 | | | December 31, 2022 | | Change |
| ($ in thousands) | ($ in thousands) | | Amount | | % | | Amount | | % | | $ | | % | ($ in thousands) | | Amount | | % | | Amount | | % | | $ | | % |
| | | Deposits | | | | | | | | | | | | |
| Deposits: | |
| | Deposits: | |
| | Deposits: | |
| Noninterest-bearing demand | |
| Noninterest-bearing demand | |
| Noninterest-bearing demand | Noninterest-bearing demand | | $ | 16,298,301 | | | 36 | % | | $ | 11,080,036 | | | 30 | % | | $ | 5,218,265 | | | 47 | % | | $ | 15,539,872 | | | 28 | | 28 | % | | $ | 21,051,090 | | | 38 | | 38 | % | | $ | (5,511,218) | | | (26) | | (26) | % |
| Interest-bearing checking | Interest-bearing checking | | 6,142,193 | | | 14 | % | | 5,200,755 | | | 14 | % | | 941,438 | | | 18 | % | Interest-bearing checking | | 7,558,908 | | | 14 | | 14 | % | | 6,672,165 | | | 12 | | 12 | % | | 886,743 | | | 13 | | 13 | % |
| Money market | Money market | | 10,740,667 | | | 24 | % | | 8,711,964 | | | 23 | % | | 2,028,703 | | | 23 | % | Money market | | 13,108,727 | | | 23 | | 23 | % | | 12,265,024 | | | 22 | | 22 | % | | 843,703 | | | 7 | | 7 | % |
| Savings | Savings | | 2,681,242 | | | 6 | % | | 2,117,196 | | | 6 | % | | 564,046 | | | 27 | % | Savings | | 1,841,467 | | | 3 | | 3 | % | | 2,649,037 | | | 4 | | 4 | % | | (807,570) | | | (30) | | (30) | % |
| Time deposits | Time deposits | | 9,000,349 | | | 20 | % | | 10,214,308 | | | 27 | % | | (1,213,959) | | | (12) | % | Time deposits | | 18,043,464 | | | 32 | | 32 | % | | 13,330,533 | | | 24 | | 24 | % | | 4,712,931 | | | 35 | | 35 | % |
| Total deposits | Total deposits | | $ | 44,862,752 | | | 100 | % | | $ | 37,324,259 | | | 100 | % | | $ | 7,538,493 | | | 20 | % | Total deposits | | $ | 56,092,438 | | | 100 | | 100 | % | | $ | 55,967,849 | | | 100 | | 100 | % | | $ | 124,589 | | | 0 | | 0 | % |
| Other Funds | | | | | | | | | | | |
| Other Funds: | |
| Short-term borrowings | Short-term borrowings | | $ | 21,009 | | | $ | 28,669 | | | $ | (7,660) | | | (27) | % |
| FHLB advances | | 652,612 | | | 745,915 | | | (93,303) | | | (13) | % |
| Short-term borrowings | |
| Short-term borrowings | | | $ | 4,500,000 | | | 97 | % | | $ | — | | | — | % | | $ | 4,500,000 | | | 100 | % |
| | Repurchase agreements | |
| Repurchase agreements | |
| Repurchase agreements | Repurchase agreements | | 300,000 | | | 200,000 | | | 100,000 | | | 50 | % | | — | | | — | | — | % | | 300,000 | | | 67 | | 67 | % | | (300,000) | | | (100) | | (100) | % |
| Long-term debt | Long-term debt | | 147,376 | | | 147,101 | | | 275 | | | 0 | % | Long-term debt | | 148,249 | | | 3 | | 3 | % | | 147,950 | | | 33 | | 33 | % | | 299 | | | 0 | | 0 | % |
| Total other funds | Total other funds | | $ | 1,120,997 | | | $ | 1,121,685 | | | $ | (688) | | | 0 | % | Total other funds | | $ | 4,648,249 | | | 100 | | 100 | % | | $ | 447,950 | | | 100 | | 100 | % | | $ | 4,200,299 | | | NM | | NM |
| Total sources of funds | Total sources of funds | | $ | 45,983,749 | | | $ | 38,445,944 | | | $ | 7,537,805 | | | 20 | % | Total sources of funds | | $ | 60,740,687 | | | | | $ | | | | $ | 56,415,799 | | | | | $ | | | | $ | 4,324,888 | | | 8 | | 8 | % |
|
NM — Not meaningful.
Deposits
The Company’s strategy is to grow and retain relationship-based deposits to provide a stable and low-cost source of funding and liquidity. Accordingly, the Company offers a wide variety of deposit products to meet the needs of its consumer and commercial customers. The Company’sAs a result, we believe our deposit strategybase is to grow and retain relationship-based deposits, which provide aseasoned, stable and low-cost sourcewell-diversified. The following chart presents the Company’s deposits by customer segment as of fundingDecember 31, 2023 and liquidity to the Company.2022.

Total deposits reached $44.86were $56.1 billion as of December 31, 2020, an2023, a slight increase of $7.54 billion or 20%$125 million from $37.32$56.0 billion as of December 31, 2019. Deposit growth2022. The increase in deposits was well-diversified across our commercial sectors and branch network, including cross-border clients,primarily driven by an increase in customer deposits, partially offset by a reductiondecrease in higher-cost timebrokered deposits. The strongest growth was in noninterest-bearing demandCompany paid down a portion of its brokered deposits, which increased by $5.22 billion or 47% year-over-year. Noninterest-bearing demanddecreased the percentage of brokered deposits reached $16.30 billion, or 36%to 3% of total deposits as of December 31, 2020, up from $11.082023, compared with 6% as of December 31, 2022. Noninterest-bearing demand deposits decreased $5.5 billion or 30%year-over-year and comprised 28% and 38% of total deposits as of December 31, 2019. 2023 and 2022, respectively. Time deposits increased $4.7 billion year-over-year and comprised 32% and 24% of total deposits as of December 31, 2023 and 2022, respectively. The shift in deposit mix is primarily due to customer migration to higher yielding deposit products in response to the higher interest rate environment.
As of December 31, 2023, customer deposits of $52.9 billion were held in the Company’s domestic offices and $1.6 billion were held in each of the subsidiary bank in China and the branch in Hong Kong. Customer deposit accounts in the U.S. offices are insured by the FDIC for up to $250,000. The deposits in the Company’s subsidiary bank in China and the branch in Hong Kong are insured by each jurisdiction’s deposit insurance authority for up to 500,000 RMB and 500,000 HKD, respectively. Uninsured deposits represent the portion of deposit accounts that exceed the insurance limits of the FDIC and each foreign jurisdiction. The Company calculates its uninsured deposits based on the methodologies and assumptions used for regulatory reporting.
The following table presents total uninsured deposits by location as of December 31, 2023 and 2022:
| | | | | | | | | | | | | | | | | | | | | | | | | | |
|
| | | | | | | | |
| ($ in thousands) | | Domestic | | China | | Hong Kong | | Total |
| | | | | | | | |
| Uninsured deposits as of 12/31/2023 | | $ | 27,592,714 | | | $ | 1,572,592 | | | $ | 1,487,833 | | | $ | 30,653,139 | |
| Uninsured deposits as of 12/31/2022 | | $ | 31,036,308 | | | $ | 1,569,671 | | | $ | 1,520,686 | | | $ | 34,126,665 | |
| | | | | | |
Uninsured time deposits totaled $10.4 billion as of December 31, 2023. The following table presents the maturity distribution for uninsured customer time deposits by location as of December 31, 2023:
| | | | | | | | | | | | | | | | | | | | | | | | | | |
|
| ($ in thousands) | | Domestic | | China | | Hong Kong | | Total |
| Three months or less | | $ | 3,821,200 | | | $ | 73,432 | | | $ | 888,336 | | | $ | 4,782,968 | |
| Over three months through six months | | 2,335,839 | | | 185,106 | | | 88,831 | | | 2,609,776 | |
| Over six months through 12 months | | 2,202,842 | | | 328,482 | | | 32,509 | | | 2,563,833 | |
| Over 12 months | | 15,660 | | | 388,752 | | | 6 | | | 404,418 | |
| Total | | $ | 8,375,541 | | | $ | 975,772 | | | $ | 1,009,682 | | | $ | 10,360,995 | |
| | | | | | |
Management believes that presenting uninsured domestic deposits as reported on Schedule RC-OM item 2 of the Bank’s Call Report, with an adjustment to exclude collateralized and affiliate deposits provides a more accurate view of the deposits at risk, given that collateralized deposits are secured, and affiliate deposits are not customer-facing and are eliminated in consolidation. The Company’s domestic uninsured deposits, excluding collateralized and affiliate deposits, ratio improved to 42% as of December 31, 2023, compared with 51% as of December 31, 2022. The Company is a participant in the IntraFi Network, a network that offers deposit placement services such as CDARS and ICS, that qualify large deposits for FDIC insurance. These reciprocal deposit structures provide protection to depositors by fully insuring deposits with other network banks and give the Company additional funding stability. The increasing use of these products during 2023 contributed to the improvement in the uninsured deposits, excluding collateralized and affiliate deposits ratio.
The following table summarizes the Company’s uninsured domestic deposit balances reported on Schedule RC-OM item 2 of the Bank’s Call Report as of December 31, 2023 and 2022, after certain adjustments:
| | | | | | | | | | | | | | | | | |
| | | | | |
| ($ in thousands) | | | December 31, 2023 | | December 31, 2022 |
| Uninsured deposits, per regulatory reporting requirements | | | $ | 27,592,714 | | | $ | 31,036,308 | |
| Less: Collateralized deposits | | | (4,631,047) | | | (3,780,329) | |
| Affiliate deposits | | | (491,992) | | | (352,977) | |
| Uninsured deposits, excluding collateralized and affiliate deposits | (a) | | $ | 22,469,675 | | | $ | 26,903,002 | |
| | | | | |
| Total domestic deposits per the Call Report | (b) | | $ | 53,486,990 | | | $ | 53,225,764 | |
| Uninsured deposits, excluding collateralized and affiliate deposits, ratio | (a) / (b) | | 42 | % | | 51 | % |
| | | | | |
Additional information regarding the impact of deposits on net interest income, with a comparison of average deposit balances and rates, is provided in Item 7 — MD&A — Results of Operations — Net Interest Income in this Form 10-K.
Domestic time deposits of $100,000 or more totaled $7.17 billion, representing 16% of the total deposit portfolio as of December 31, 2020. The following table presents the maturity distribution of domestic time deposits of $100,000 or more:
| | | | | | | | |
|
($ in thousands) | | December 31, 2020 |
3 months or less | | $ | 4,111,699 | |
Over 3 months through 6 months | | 1,219,791 | |
Over 6 months through 12 months | | 1,684,566 | |
Over 12 months | | 149,527 | |
Total | | $ | 7,165,583 | |
|
As of December 31, 2020, foreign time deposits of $100,000 or more consisted of $312.4 million of deposits held in the Company’s branch in Hong Kong and $522.7 million of deposits held in the Company’s subsidiary bank in China. This compares with $611.0 million of deposits held in the Company’s branch in Hong Kong and $595.1 million of deposits held in the Company’s subsidiary bank in China as of December 31, 2019.
Other Sources of Funding
Short-termThe Company had $4.5 billion of short-term borrowings consist of borrowings entered into by the Company’s subsidiary, East West Bank (China) Limited, which amounted to $21.0 millionoutstanding as of December 31, 2020, compared with $28.7 million2023, consisting of funds borrowed from the BTFP in March 2023. These borrowings were more cost effective than other borrowing sources and have a positive carry as cash placed at the Federal Reserve Bank. There were no short-term borrowings outstanding as of December 31, 2019. As of December 31, 2020, short-term borrowings entered into by East West Bank (China) Limited had a fixed interest rate of 3.70%2022. Refer to Note 10— Short-Term Borrowings and mature in the first quarter of 2021.
Long-Term Debt
The following table presents selected information for short-term borrowings as of the periods indicated:
| | | | | | | | | | | | | | |
|
| ($ in thousands) | | 2020 | | 2019 |
| Year-end balance | | $ | 21,009 | | | $ | 28,669 | |
| Weighted-average rate on amount outstanding at year-end | | 3.70 | % | | 3.69 | % |
| Maximum month-end balance | | $ | 68,843 | | | $ | 59,225 | |
| Average amount outstanding | | $ | 45,290 | | | $ | 44,511 | |
| Weighted-average rate | | 3.69 | % | | 3.90 | % |
|
FHLB advances were $652.6 million as of December 31, 2020, a decrease of $93.3 million or 13% from $745.9 million as of December 31, 2019. As of December 31, 2020, FHLB advances had fixed and floating interest rates ranging from zero percent to 2.34% and remaining maturities between four months and 1.9 years. Of these, $405.0 million have a blended interest rate of 2.22% and mature in the second quarter of 2021.
Gross repurchase agreements totaled $300.0 million and $450.0 million as of December 31, 2020 and 2019, respectively. The decrease was due to the extinguishment of $150.0 million of repurchase agreementsConsolidated Financial Statements in this Form 10-K for additional information on the second quarter of 2020. ResaleBTFP and repurchase agreements are reported net, pursuant to ASC 210-20-45-11, Balance Sheet Offsetting: Repurchase and Reverse Repurchase Agreements. As of December 31, 2020, the Company did not have gross resale agreements that were eligible for netting pursuant to ASC 210-20-45-11. In comparison, net repurchase agreements totaled $200.0 million as of December 31, 2019, after netting gross repurchase agreements of $250.0 million against gross resale agreements. As of December 31, 2020, gross repurchase agreements had interest rates ranging from 2.46% to 2.48%, with original terms between 4.0 years and 8.5 years and remaining maturities between 2.6 years and 2.7 years.Company’s related borrowings.
Repurchase agreements are accounted forwere $300 million as collateralized financing transactions and recorded as liabilities based on the values at which the assets are sold. As of December 31, 2020, the collateral for the2022. The Company extinguished $300 million of repurchase agreements was comprisedduring the first quarter of U.S. government agency2023, and U.S. government-sponsored enterprise mortgage-backed securities, and U.S. Treasury securities. To ensure the market valuerecorded $4 million of the underlying collateral remains sufficient, the Company monitors the fair value of collateral pledged relative to the principal amounts borrowed under repurchase agreements. The Company manages liquidity riskscharges related to the extinguishment of repurchase agreements by sourcing funds from a diverse group of counterparties, and entering into repurchase agreements with longer durations, when appropriate.agreements. For additional details, see Note 3—Assets Purchased under Resale Agreements and Sold under Repurchase Agreements to the Consolidated Financial Statements in this Form 10-K.
The Company uses long-term debt to provide funding to acquire interest-earning assets, and to enhance liquidity and regulatory capital adequacy. Long-term debt totaled $147.4 million and $147.1 million as of December 31, 2020 and 2019, respectively. Long-term debt consists of junior subordinated debt, which qualifies as Tier 2 capital for regulatory capital purposes. TheRefer to Note 10— Short-Term Borrowings and Long-Term Debt and Note 19— Subsequent Events to the Consolidated Financial Statements in this Form 10-K for additional information on the junior subordinated debt was issued in connection with the Company’s various pooled trust preferred securities offerings, as well as with common stock issued by the six wholly owned subsidiaries of the Company in conjunction with these offerings. The junior subordinated debt had a weighted-average interest rate of 2.26% and 3.98% during 2020 and 2019, respectively, with remaining maturities ranging between 13.9 years and 16.7 years as of December 31, 2020. In October 2020, the Company paid off the $1.43 billion in borrowing from the Federal Reserve PPPLF. This debt was included in long-term debt on the Company’s Consolidated Balance Sheet as of June 30 and September 30, 2020.debt.
Regulatory Capital and Ratios
The federal banking agencies have risk-based capital adequacy guidelinesrequirements intended to ensure that banking organizations maintain capital that is commensurate with the degree of risk associated with a banking organization’stheir operations. The Company and the Bank are each subject to these regulatory capital adequacy requirements. See Item 1. Business — Supervision and Regulation — Regulatory Capital Requirementsand Regulatory Capital-Related Development in this Form 10-K for additional details.
The Company adopted ASUAccounting Standards Update 2016-13 on January 1, 2020.2020, which requires the measurement of the allowance for credit losses to be based on management’s best estimate of lifetime expected credit losses inherent in the Company’s relevant financial assets. The Company has elected the phase-in option provided by a rule that permits certain banking organizations to exclude from regulatory guidance,capital the initial adoption impact of CECL, plus 25% of the cumulative changes in the allowance for credit losses under CECL for each period until December 31, 2021, followed by a three-year phase-out period in which delaysthe aggregate benefit is reduced by 25% in 2022, 50% in 2023 and 75% in 2024. Accordingly, our capital ratios as of December 31, 2023 reflect a delay of 50% of the estimated impact of CECL on regulatory capital for two years and phases the impact over three years. As a result, the effects of CECL on the Company’s and the Bank’s regulatory capital will be delayed through the year 2021, after which the effects will be phased-in over a three-year period from January 1, 2022 through December 31, 2024. In April 2020, in recognition of CARES Act requirements, and to facilitate the use of the PPPLF, the U.S banking agencies issued an interim final rule that banking organizations may exclude from leverage and risk-based capital requirements any eligible assets sold or pledged to the Federal Reserve on a non-recourse basis as part of the PPPLF. In addition, under the CARES Act, loans originated by a banking organization under the PPP (whether or not sold or pledged in the PPPLF) will be risk-weighted at zero percent for regulatory capital purposes. Accordingly, the December 31, 2020 capital ratios exclude the impact of the increased allowance for loan losses due to CECL, and PPP loans are risk weighted at zero percent. In addition, the quarterly average PPP loan balances that were pledged as collateral to PPPLF was excluded from the Tier 1 leverage ratio.capital.
The following table presents the Company’s and the Bank’s capital ratios as of December 31, 20202023 and 20192022 under the Basel III Capital Rules, and those required by regulatory agencies for capital adequacy and well-capitalized classification purposes:
| | | | | | | | | | | | | | | | | | | | | | | | | | | | | | | | | | | | | | | | | | | | |
|
| | Basel III Capital Rules |
| December 31, 2020 | | December 31, 2019 | | Minimum
Regulatory
Requirements | | Fully Phased-in Minimum Regulatory Requirements (2) | | Well-
Capitalized
Requirements |
| Company | | East West Bank | | Company | | East West Bank | | | |
| Risk-Based Capital Ratios: | | | | | | | | | | | | | | |
| CET 1 capital | | 12.7 | % | | 12.1 | % | | 12.9 | % | | 12.9 | % | | 4.5 | % | | 7.0 | % | | 6.5 | % |
| Tier 1 capital | | 12.7 | % | | 12.1 | % | | 12.9 | % | | 12.9 | % | | 6.0 | % | | 8.5 | % | | 8.0 | % |
| Total capital | | 14.3 | % | | 13.4 | % | | 14.4 | % | | 13.9 | % | | 8.0 | % | | 10.5 | % | | 10.0 | % |
Tier 1 leverage (1) | | 9.4 | % | | 9.0 | % | | 10.3 | % | | 10.3 | % | | 4.0 | % | | 4.0 | % | | 5.0 | % |
|
| | | | | | | | | | | | | | | | | | | | | | | | | | | | | | | | | | | | | | | | | | | | |
|
| | Basel III Capital Rules |
| | December 31, 2023 | | December 31, 2022 | | | | | | |
| | Company | | East West Bank | | Company | | East West Bank | | Minimum Regulatory Requirements | | Minimum Regulatory Requirements including Capital Conservation Buffer | | Well-Capitalized Requirements |
| Risk-based capital ratios: | | | | | | | | | | | | | | |
CET 1 capital (1) | | 13.3 | % | | 12.6 | % | | 12.7 | % | | 12.5 | % | | 4.5 | % | | 7.0 | % | | 6.5 | % |
Tier 1 capital (1) | | 13.3 | % | | 12.6 | % | | 12.7 | % | | 12.5 | % | | 6.0 | % | | 8.5 | % | | 8.0 | % |
| Total capital | | 14.8 | % | | 13.8 | % | | 14.0 | % | | 13.5 | % | | 8.0 | % | | 10.5 | % | | 10.0 | % |
Tier 1 leverage (1) | | 10.2 | % | | 9.6 | % | | 9.8 | % | | 9.7 | % | | 4.0 | % | | 4.0 | % | | 5.0 | % |
|
(1)The CET1 capital and Tier 1 leverage well-capitalized requirement appliesrequirements apply only to the Bank since there is no CET1 capital component or Tier 1 leverage ratio component in the definition of a well-capitalized bank holding company.
(2)As of January The well-capitalized Tier 1 2019,capital ratio requirements for the 2.5% capital conservation buffer aboveCompany and the minimum capital ratios was required in order to avoid limitations on distributions, including dividend paymentsBank are 6.0% and certain discretionary bonus payments to executive officers.8.0%, respectively.
The Company is committed to maintaining strong capital levels to assure the Company’sits investors, customers and regulators that the Company and the Bank are financially sound. As of both December 31, 20202023 and 2019, both2022, the Company and the Bank continued to exceed all “well-capitalized” capital requirements and the required minimum capital requirements under the Basel III Capital Rules. Total risk-weighted assets were $38.41$53.7 billion as of December 31, 2020, an increase of $3.27 billion or 9% from $35.142023, compared with $50.0 billion as of December 31, 2019.2022. The increase in the risk-weighted assets was primarily due to growth across all major loan growth.portfolios.
Other Matters
LIBOR Transition
On July 27, 2017, the FCA, which regulates LIBOR, announced that it will no longer persuade or require banks to submit rates for the calculation of LIBOR after 2021. The ARRC has proposed the SOFR as its preferred alternative rate for LIBOR. On November 30, 2020, LIBOR’s administrator, the IBA, in coordination with U.K. and U.S. regulators, announced the IBA’s intention to cease publication of the one-week and two-month USD LIBOR settings immediately following the LIBOR publication on December 31, 2021, and the remaining USD LIBOR settings immediately following the LIBOR publication on June 30, 2023. Banks are encouraged to cease entering new contracts that use USD LIBOR as a reference rate as soon as practicable by December 31, 2021.
Given LIBOR’s extensive use across financial markets, the transition away from LIBOR presents various risks and challenges to financial markets and institutions, including to the Company. A portion of the Company’s loans, derivatives, debt securities, resale agreements, FHLB advances, as well as junior subordinated debt and repurchase agreements are indexed to LIBOR and mature after 2021. The volume of the Company’s products that are indexed to LIBOR is significant and, if not sufficiently planned for, the discontinuation of LIBOR could result in financial, operational, legal, reputational or compliance risks to the Company.
Due to the uncertainty surrounding the future of LIBOR, the transition is anticipated to span several reporting periods through the end of 2021 and potentially into 2023 with the newly released LIBOR cessation timing. The Company has created a cross-functional team to manage the communication of the Company’s transition plans with both internal and external stakeholders and to ensure that the Company appropriately updates its business processes, analytical tools, information systems and contract language to minimize disruptions during and after the LIBOR transition. The Company has completed a review of LIBOR contracts maturing after 2021 and has begun taking steps to convert these contracts to alternative rates. For additional information related to the potential impact surrounding the transition from LIBOR on the Company’s business, see Item 1A. Risk Factors in this Form 10-K.
Off-Balance Sheet Arrangements and Contractual Obligations
In the course of the Company’s business, the Company may enter into or be a party to transactions that are not recorded on the Consolidated Balance Sheet and are considered to be off-balance sheet arrangements. Off-balance sheet arrangements are any contractual arrangements to which a nonconsolidated entity is a party and under which the Company has: (1) any obligation under a guarantee contract; (2) a retained or contingent interest in assets transferred to an unconsolidated entity or similar arrangement that serves as credit, liquidity or market risk support to that entity for such assets; (3) any obligation under certain derivative instruments; or (4) any obligation under a material variable interest held by the Company in a nonconsolidated entity that provides financing, liquidity, market risk or credit risk support to the Company, or engages in leasing, hedging or research and development services with the Company.
Off-Balance Sheet Arrangements
Commitments to Extend Credit
As a financial service provider, the Company routinely enters into commitments to extend credit such as loan commitments, commercial letters of credit for foreign and domestic trade, standby letters of credit (“SBLCs”), and financial guarantees to meet the financing needs of our customers. Many of these commitments to extend credit may expire without being drawn upon. The credit policies used in underwriting loans to customers are also used to extend these commitments. Under some of these contractual agreements, the Company may also have liabilities contingent upon the occurrence of certain events. The Company’s liquidity sources have been, and are expected to be, sufficient to meet the cash requirements of its lending activities. Information about the Company’s loan commitments, commercial letters of credit and SBLCs is provided in Note 12 — Commitments, Contingencies and Related Party Transactions to the Consolidated Financial Statements in this Form 10-K.
Guarantees
In the ordinary course of business, the Company enters into various guarantee agreements in which the Company sells or securitizes loans with recourse. Under these guarantee arrangements, the Company is contingently obligated to repurchase the recourse component of the loans when the loans default. Additional information regarding guarantees is provided in Note 12 — Commitments, Contingencies and Related Party Transactions to the Consolidated Financial Statements in this Form 10-K.
Contractual Obligations
The following table presents the Company’s significant fixed and determinable contractual obligations, along with the categories of payment dates as of December 31, 2020:
| | | | | | | | | | | | | | | | | | | | | | | | | | | | | | | | | | | | | | |
|
| ($ in thousands) | | Payment Due by Period |
| Less than
1 year | | 1-3 years | | 3-5 years | | After
5 years | | Indeterminate
Maturity (1) | | Total |
| On-balance sheet obligations: | | | | | | | | | | | | |
| Deposits | | $ | 8,608,547 | | | $ | 373,987 | | | $ | 17,800 | | | $ | 15 | | | $ | 35,862,403 | | | $ | 44,862,752 | |
| FHLB advances | | 405,000 | | | 247,612 | | | — | | | — | | | — | | | 652,612 | |
| Gross repurchase agreements | | — | | | 300,000 | | | — | | | — | | | — | | | 300,000 | |
| Affordable housing partnership and other tax credit investment commitments | | 125,142 | | | 51,674 | | | 2,496 | | | 3,414 | | | — | | | 182,726 | |
| Short-term borrowings | | 21,009 | | | — | | | — | | | — | | | — | | | 21,009 | |
Long-term debt (2) | | — | | | — | | | — | | | 147,376 | | | — | | | 147,376 | |
| Operating lease liabilities | | 30,811 | | | 36,652 | | | 21,780 | | | 13,587 | | | — | | | 102,830 | |
| Finance lease liabilities | | 975 | | | 1,000 | | | 161 | | | 2,227 | | | — | | | 4,363 | |
| | | | | | | | | | | | |
| Projected cash payments for post-retirement benefit plan | | 349 | | | 729 | | | 774 | | | 6,710 | | | — | | | 8,562 | |
| Total on-balance sheet obligations | | 9,191,833 | | | 1,011,654 | | | 43,011 | | | 173,329 | | | 35,862,403 | | | 46,282,230 | |
| | | | | | | | | | | | |
| Off-balance sheet obligations: | | | | | | | | | | | | |
| | | | | | | | | | | | |
Contractual interest payments (3) | | 181,038 | | | 39,234 | | | 6,990 | | | 29,158 | | | — | | | 256,420 | |
| Total off-balance sheet obligations | | 181,038 | | | 39,234 | | | 6,990 | | | 29,158 | | | — | | | 256,420 | |
| Total contractual obligations | | $ | 9,372,871 | | | $ | 1,050,888 | | | $ | 50,001 | | | $ | 202,487 | | | $ | 35,862,403 | | | $ | 46,538,650 | |
|
(1)Includes deposits with no defined maturity, such as noninterest-bearing demand, interest-bearing checking, money-market and savings accounts.
(2)Represents junior subordinated debt, which is subject to call options where early redemption requires appropriate notice.
(3)Represents the future interest obligations related to interest-bearing time deposits, FHLB, gross repurchase agreements, short-term borrowings and long-term debt in the normal course of business. These interest obligations assume no early debt redemption. The Company estimated variable interest rate payments using December 31, 2020 rates, which the company held constant until maturity.
Risk Management
Overview
In conducting its businesses,the normal course of business, the Company is exposed to a variety of risks, some of which are inherent to the financial services industry and others of which are more specific to the Company’s businesses.business. The Company operates under a Board-approved ERM framework, which outlines the company-wide approach to risk management and oversight, and describes the structures and practices employed to manage the current and emerging risks inherent to the Company. The Company’s ERM program incorporates risk management throughout the organization in identifying, managing, monitoring and reporting risks. It identifies the Company’s major risk categories asas: credit, risk; liquidity, risk; capital, risk; market, risk; operational, risk; regulatory, compliance, legal, strategic, technology and legal risks; accounting and tax risks, and strategic and reputational risks.reputational.
The Risk Oversight Committee of the Board of Directors monitors the ERM program to ensure independent reviewthrough such identified risk categories and provides oversight of the Company’s risk appetite and control environment. The Risk Oversight Committee provides focused oversight of the Company’s identified enterprise risk categories on behalf of the full Board of Directors. Under the direction of the Risk Oversight Committee, management committees apply targeted strategies to reducemanage the risks to which the Company’s operations are exposed.
The Company’s ERM program is executed along the three lines of defense model, which provides for a consistent and standardized risk management control environment across the enterprise. The first line of defense is comprised of production, operational, and support units. The second line of defense is comprised of various risk management and control functions charged with monitoring and managing specific major risk categories and/or risk subcategories. The third line of defense is comprised of the Internal Audit function and Independent Asset Review.Review (“IAR”) functions. Internal Audit reports to the Chief Audit Executive (“CAE”) who reports to the Board’s Audit Committee. Internal Audit provides assurance and evaluates the effectiveness of risk management, control, and governance processes as established by the Company. Internal Audit has organizational independenceIAR serves as an internal loan review and objectivity, reporting directlyindependent credit risk monitoring function within the Bank that works under the direction of the CAE and reports to the Board’s Audit Committee.Risk Oversight Committee (“ROC”). IAR provides management and the ROC with an objective and independent assessment of the Bank’s credit profile and credit risk management process. Further discussion and analysis of each majorselected primary risk areaareas are includeddiscussed in the following sub-sectionssubsections of Risk Management.
Credit Risk Management
Credit risk is the risk that a borrower or a counterparty will fail to perform according to the terms and conditions of a loan or investment and expose the Company to loss. Credit risk exists with many of the Company’s assets and exposures such as loans, debt securities and certain derivatives. The majority of the Company’s credit risk is associated with lending activities.
The Risk Oversight CommitteeROC has primary oversight responsibility of identifyingfor identified enterprise risk categories including credit risk. The Risk Oversight CommitteeROC monitors management’s assessment of asset quality, and credit risk trends, credit quality administration, and underwriting standards; as well asstandards, and portfolio credit risk management strategies and processes, such as diversification and liquidity;liquidity, all of which enable management to control credit risk. At the management level, the Credit Risk Management Committee has primary oversight responsibility for credit risk. The Senior Credit Supervision function manages credit policy and provides the resources to managefor the line of business transactional credit risk, assuring that all exposure is risk-rated according to the requirements of the credit risk rating policy. The Senior Credit Supervision function evaluates and reports the overall credit risk exposure to senior management and the Risk Oversight Committee. The Independent Asset ReviewROC. Reporting directly to the Board’s ROC, the IAR function supports aprovides additional support to the Company’s strong credit risk management culture by providingperforming an independent and objective assessment of underwriting and documentation quality, reporting directly to the Board’s Risk Oversight Committee.quality. A key focus of our credit risk management is adherence to a well-controlled underwriting and loan monitoring process.
The Company assesses the overall credit quality performance of the loanloans held-for-investment portfolio through an integrated analysis of specific performance ratios. This approach forms the basis of the discussion in the sections immediately following: Credit Quality, Nonperforming Assets, TDRs and Allowance for Credit Losses.
Credit Quality
The Company utilizes a credit risk rating system to assist in monitoring credit quality. Loans are evaluated using the Company’s internal credit risk rating of 1 through 10. For more information on the Company’s credit quality indicators and internal credit risk ratings, refer to Note 6 — Loans Receivable and Allowance for Credit Losses to the Consolidated Financial Statements in this Form 10-K.
The following table presents the Company’s criticized loans as of December 31, 2023 and 2022:
| | | | | | | | | | | | | | | | | | | | | | | | | | |
|
| | | | Change |
| ($ in thousands) | | December 31, 2023 | | December 31, 2022 | | $ | | % |
| Criticized loans: | | | | | | | | |
| Special mention loans | | $ | 404,241 | | | $ | 468,471 | | | $ | (64,230) | | | (14) | % |
Classified loans (1) | | 573,969 | | | 427,509 | | | 146,460 | | | 34 | % |
Total criticized loans (2) | | $ | 978,210 | | | $ | 895,980 | | | $ | 82,230 | | | 9 | % |
| | | | | | | | |
| Special mention loans to loans held-for-investment | | 0.77 | % | | 0.97 | % | | | | |
| Classified loans to loans held-for-investment | | 1.10 | % | | 0.89 | % | | | | |
| Criticized loans to loans held-for-investment | | 1.87 | % | | 1.86 | % | | | | |
| | | | | | | | |
(1)Consists of substandard, doubtful and loss categories.
(2)Excludes loans held-for-sale.
Nonperforming Assets
Nonperforming assets are comprised of nonaccrual loans, OREO,other real estate owned (“OREO”) and other nonperforming assets. Other nonperforming assets and OREO are repossessed assets and properties, respectively, acquired through foreclosure, or through full or partial satisfaction of loans held-for-investment. Nonperforming assets were $114 million or 0.16% of total assets as of December 31, 2023, an increase of $14 million or 14%, compared with $100 million or 0.16% of total assets as of December 31, 2022.
The following table presents nonperforming assets information as of December 31, 2023 and 2022:
| | | | | | | | | | | | | | | | | | | | | | | | | | |
|
| | | | Change |
| ($ in thousands) | | December 31, 2023 | | December 31, 2022 | | $ | | % |
| Commercial: | | | | | | | | |
| C&I | | $ | 37,036 | | | $ | 50,428 | | | $ | (13,392) | | | (27) | % |
| CRE: | | | | | | | | |
| CRE | | 23,249 | | | 23,244 | | | 5 | | | 0 | % |
| Multifamily residential | | 4,669 | | | 169 | | | 4,500 | | | NM |
| | | | | | | | |
| Total CRE | | 27,918 | | | 23,413 | | | 4,505 | | | 19 | % |
| Consumer: | | | | | | | | |
| Residential mortgage: | | | | | | | | |
| Single-family residential | | 24,377 | | | 14,240 | | | 10,137 | | | 71 | % |
| HELOCs | | 13,411 | | | 11,346 | | | 2,065 | | | 18 | % |
| Total residential mortgage | | 37,788 | | | 25,586 | | | 12,202 | | | 48 | % |
| Other consumer | | 132 | | | 99 | | | 33 | | | 33 | % |
| Total nonaccrual loans | | 102,874 | | | 99,526 | | | 3,348 | | | 3 | % |
| OREO, net | | 11,141 | | | 270 | | | 10,871 | | | NM |
| | | | | | | | |
| Total nonperforming assets | | $ | 114,015 | | | $ | 99,796 | | | $ | 14,219 | | | 14 | % |
| Nonperforming assets to total assets | | 0.16 | % | | 0.16 | % | | | | |
| Nonaccrual loans to loans held-for-investment | | 0.20 | % | | 0.21 | % | | | | |
| Allowance for loan losses to nonaccrual loans | | 650.06 | % | | 598.48 | % | | | | |
| | | | | | | | |
| | | | | | | | |
|
NM — Not meaningful.
Loans are generally placed on nonaccrual status when they become 90 days past due or when the full collection of principal or interest becomes uncertain regardless of the length of past due status. Collectability is generally assessed based on economic and business conditions, the borrower’s financial condition and the adequacy of collateral, if any. For additional details regarding the Company’s nonaccrual loan policy, see Note 1 — Summary of Significant Accounting Policies — Significant Accounting Policies — Loans Held-for-Investment to the Consolidated Financial Statements in this Form 10-K.
The following table presents information regarding nonperforming assets as of the periods indicated:
| | | | | | | | | | | | | | | | | | | | | | | | | | | | | | | | |
|
| ($ in thousands) | | December 31, |
| Nonaccrual Loans | | Non-PCI Nonaccrual Loans |
| 2020 | | 2019 | | 2018 | | 2017 | | 2016 |
| Commercial: | | | | | | | | | | |
| C&I | | $ | 133,939 | | | $ | 74,835 | | | $ | 43,840 | | | $ | 69,213 | | | $ | 81,256 | |
| CRE: | | | | | | | | | | |
| CRE | | 46,546 | | | 16,441 | | | 24,218 | | | 26,986 | | | 26,907 | |
| Multifamily residential | | 3,668 | | | 819 | | | 1,260 | | | 1,717 | | | 2,984 | |
| Construction and land | | — | | | — | | | — | | | 3,973 | | | 5,326 | |
| Total CRE | | 50,214 | | | 17,260 | | | 25,478 | | | 32,676 | | | 35,217 | |
| Consumer: | | | | | | | | | | |
| Residential mortgage: | | | | | | | | | | |
| Single-family residential | | 16,814 | | | 14,865 | | | 5,259 | | | 5,923 | | | 4,214 | |
| HELOCs | | 11,696 | | | 10,742 | | | 8,614 | | | 4,006 | | | 2,130 | |
| Total residential mortgage | | 28,510 | | | 25,607 | | | 13,873 | | | 9,929 | | | 6,344 | |
| Other consumer | | 2,491 | | | 2,517 | | | 2,502 | | | 2,491 | | | — | |
| Total nonaccrual loans | | 215,154 | | | 120,219 | | | 85,693 | | | 114,309 | | | 122,817 | |
| OREO, net | | 15,824 | | | 125 | | | 133 | | | 830 | | | 6,745 | |
| Other nonperforming assets | | 3,890 | | | 1,167 | | | 7,167 | | | — | | | — | |
| Total nonperforming assets | | $ | 234,868 | | | $ | 121,511 | | | $ | 92,993 | | | $ | 115,139 | | | $ | 129,562 | |
| Nonperforming assets to total assets | | 0.45 | % | | 0.27 | % | | 0.23 | % | | 0.31 | % | | 0.37 | % |
| Nonaccrual loans to loans held-for-investment | | 0.56 | % | | 0.35 | % | | 0.26 | % | | 0.39 | % | | 0.48 | % |
| Allowance for loan losses to nonaccrual loans | | 288.16 | % | | 298.03 | % | | 363.30 | % | | 251.19 | % | | 212.12 | % |
| Net charge-offs to average loans held-for-investment | | 0.17 | % | | 0.16 | % | | 0.13 | % | | 0.08 | % | | 0.15 | % |
| TDRs included in nonperforming loans | | $ | 71,924 | | | $ | 54,566 | | | $ | 30,315 | | | $ | 62,909 | | | $ | 38,983 | |
|
Period-over-period changes to nonaccrual loans represent loans that are placed on nonaccrual status in accordance with the Company’s accounting policy, offset by reductions from loans that are repaid, paid down, charged off, sold, foreclosed, or no longer classified as nonaccrual as a result of continued performance and improvement in the borrowers’ financial condition and loan repayment capabilities. Nonaccrual loans were $215.2$103 million or 0.56% of loans held-for-investments,and $100 million as of December 31, 2020, compared with $120.2 million or 0.35% of loans held-for-investments, as of December 31, 2019. Year-over-year, nonaccrual loans increased by $94.9 million or 79%, primarily driven by inflows of C&I oil & gas loans2023 and CRE loans to nonaccrual status, partially offset by charge-offs2022, respectively. Increases in single-family, multifamily residential and sales of C&I loans, as well as a transfer of a CRE loan to OREO. C&IHELOC nonaccrual loans were 62%predominantly offset by higher charge-offs of total nonaccrual loans as of both December 31, 2020 and 2019.C&I loans. As of December 31, 2020, $106.42023, $40 million or 49%39% of nonaccrual loans were less than 90 days delinquent. In comparison, $35.6$68 million or 30%69% of nonaccrual loans were less than 90 days delinquent as of December 31, 2019.2022.
OREO was $15.8 million as of December 31, 2020, an increase of $15.7 million from $125 thousand as of December 31, 2019 due to the Company taking possession of one retail CRE property located in Southern California.
The following table presents the accruing loans past due by loan portfolio segmentssegment as of December 31, 20202023 and 2019:2022:
| | | | | | | | | | | | | | | | | | | | | | | | | | | | | | | | | | | | | | | | |
|
| ($ in thousands) | | | | Total Accruing Past Due Loans (1) | | Change | | Percentage of
Total Loans Outstanding |
| | | December 31, | | | December 31, |
| | | 2020 | | 2019 | | $ | | % | | 2020 | | 2019 |
| Commercial: | | | | | | | | | | | | | | |
| C&I | | | | $ | 9,717 | | | $ | 48,155 | | | $ | (38,438) | | | (80) | % | | 0.07 | % | | 0.40 | % |
| CRE: | | | | | | | | | | | | | | |
| CRE | | | | 375 | | | 24,807 | | | (24,432) | | | (98) | % | | 0.00 | % | | 0.24 | % |
| Multifamily residential | | | | 1,818 | | | 729 | | | 1,089 | | | 149 | % | | 0.06 | % | | 0.03 | % |
| Construction and land | | | | 19,900 | | | — | | | 19,900 | | | 100 | % | | 3.32 | % | | — | % |
| Total CRE | | | | 22,093 | | | 25,536 | | | (3,443) | | | (13) | % | | 0.15 | % | | 0.19 | % |
| Total commercial | | | | 31,810 | | | 73,691 | | | (41,881) | | | (57) | % | | 0.11 | % | | 0.29 | % |
| Consumer: | | | | | | | | | | | | | | |
| Residential mortgage: | | | | | | | | | | | | | | |
| Single-family residential | | | | 12,494 | | | 20,517 | | | (8,023) | | | (39) | % | | 0.15 | % | | 0.29 | % |
| HELOCs | | | | 6,052 | | | 7,064 | | | (1,012) | | | (14) | % | | 0.38 | % | | 0.48 | % |
| Total residential mortgage | | | | 18,546 | | | 27,581 | | | (9,035) | | | (33) | % | | 0.19 | % | | 0.32 | % |
| Other consumer | | | | 234 | | | 11 | | | 223 | | | NM | | 0.14 | % | | 0.00 | % |
| Total consumer | | | | 18,780 | | | 27,592 | | | (8,812) | | | (32) | % | | 0.19 | % | | 0.31 | % |
| Total | | | | $ | 50,590 | | | $ | 101,283 | | | $ | (50,693) | | | (50) | % | | 0.13 | % | | 0.29 | % |
|
NM — Not meaningful. | | | | | | | | | | | | | | | | | | | | | | | | | | | | | | | | | | | | | | | | |
|
| | | | Total Accruing Past Due Loans (1) | | Change | | Percentage of
Total Loans Outstanding |
| | | | | | | | | | |
| ($ in thousands) | | | | December 31, 2023 | | December 31, 2022 | | $ | | % | | December 31, 2023 | | December 31, 2022 |
| Commercial: | | | | | | | | | | | | | | |
| C&I | | | | $ | 35,649 | | | $ | 9,355 | | | $ | 26,294 | | | 281 | % | | 0.21 | % | | 0.06 | % |
| CRE: | | | | | | | | | | | | | | |
| CRE | | | | 3,517 | | | 14,185 | | | (10,668) | | | (75) | % | | 0.02 | % | | 0.10 | % |
| Multifamily residential | | | | 597 | | | 1,000 | | | (403) | | | (40) | % | | 0.01 | % | | 0.02 | % |
| Construction and land | | | | 13,251 | | | — | | | 13,251 | | | 100 | % | | 2.00 | % | | — | % |
| Total CRE | | | | 17,365 | | | 15,185 | | | 2,180 | | | 14 | % | | 0.08 | % | | 0.08 | % |
| Total commercial | | | | 53,014 | | | 24,540 | | | 28,474 | | | 116 | % | | 0.14 | % | | 0.07 | % |
| Consumer: | | | | | | | | | | | | | | |
| Residential mortgage: | | | | | | | | | | | | | | |
| Single-family residential | | | | 45,228 | | | 25,653 | | | 19,575 | | | 76 | % | | 0.34 | % | | 0.23 | % |
| HELOCs | | | | 21,492 | | | 8,786 | | | 12,706 | | | 145 | % | | 1.25 | % | | 0.41 | % |
| Total residential mortgage | | | | 66,720 | | | 34,439 | | | 32,281 | | | 94 | % | | 0.44 | % | | 0.26 | % |
| Other consumer | | | | 3,265 | | | 3,192 | | | 73 | | | 2 | % | | 5.41 | % | | 4.18 | % |
| Total consumer | | | | 69,985 | | | 37,631 | | | 32,354 | | | 86 | % | | 0.46 | % | | 0.28 | % |
| Total | | | | $ | 122,999 | | | $ | 62,171 | | | $ | 60,828 | | | 98 | % | | 0.24 | % | | 0.13 | % |
|
(1)There were no accruing loans past due 90 days or more as of both December 31, 20202023 and 2019.2022.
Troubled Debt Restructurings
TDRs are loans for which contractual terms have been modified by the Company for economic or legal reasons related to a borrower’s financial difficulties, and for which a concession to the borrower was granted that the Company would not otherwise consider. The Company’s loan modifications are handled on a case-by-case basis and are negotiated to achieve mutually agreeable terms that maximize loan collectability and meet the borrower’s financial needs. The following table presents the performing and nonperforming TDRs by loan portfolio segments as of December 31, 2020 and 2019. The allowance for loan losses for TDRs was $10.3 million as ofDecember 31, 2020 and $400 thousand as of December 31, 2019.
| | | | | | | | | | | | | | | | | | | | | | | | | | | | | | | | |
|
| ($ in thousands) | | December 31, | | | | | | |
| 2020 | | 2019 | | | | | | |
| Performing
TDRs | | Nonperforming
TDRs | | Performing
TDRs | | Nonperforming
TDRs | | | | | | |
| Commercial: | | | | | | | | | | | | | | |
| C&I | | $ | 85,767 | | | $ | 68,451 | | | $ | 39,208 | | | $ | 41,014 | | | | | | | |
| CRE: | | | | | | | | | | | | | | |
| CRE | | 24,851 | | | — | | | 5,177 | | | 11,503 | | | | | | | |
| Multifamily residential | | 3,310 | | | 1,448 | | | 3,644 | | | 229 | | | | | | | |
| Construction and land | | 19,900 | | | — | | | 19,691 | | | — | | | | | | | |
| Total CRE | | 48,061 | | | 1,448 | | | 28,512 | | | 11,732 | | | | | | | |
| Consumer: | | | | | | | | | | | | | | |
| Residential mortgage: | | | | | | | | | | | | | | |
| Single-family residential | | 6,748 | | | 1,169 | | | 7,346 | | | 1,098 | | | | | | | |
| HELOCs | | 2,631 | | | 856 | | | 2,832 | | | 722 | | | | | | | |
| Total residential mortgage | | 9,379 | | | 2,025 | | | 10,178 | | | 1,820 | | | | | | | |
| | | | | | | | | | | | | | |
| Total TDRs | | $ | 143,207 | | | $ | 71,924 | | | $ | 77,898 | | | $ | 54,566 | | | | | | | |
| | | | | | |
Performing TDRs were $143.2 million as of December 31, 2020, an increase of $65.3 million or 84% from $77.9 million as of December 31, 2019. This increase reflected $68.4 million in newly designated C&I TDRs, primarily from general manufacturing & wholesale, and oil & gas sectors, and $21.2 million in newly designated CRE TDRs. Over 85% of the performing TDRs were current as of both December 31, 2020 and 2019.
Nonperforming TDRs were $71.9 million as of December 31, 2020, an increase of $17.4 million or 32% from $54.6 million as of December 31, 2019. This increase primarily reflected additions to nonperforming TDR, from C&I oil & gas loans, partially offset by a sale of one C&I loan and a transfer of one CRE loan to OREO.
Existing TDRs that were subsequently modified in response to the COVID-19 pandemic continue to be classified as TDRs. As of December 31, 2020, there were four TDRs totaling $11.8 million that were provided subsequent modifications related to the COVID-19 pandemic.
Loan Modifications Due to the COVID-19 Pandemic
Beginning in late March 2020, the Company granted various commercial and consumer loan accommodation programs, predominantly in the form of payment deferrals, to provide relief to borrowers experiencing financial hardship due to COVID-19 pandemic. Section 4013 of the CARES Act, as amended by the CAA, permits a financial institution to elect to temporarily suspend TDR accounting under ASC Subtopic 310-40 in certain circumstances. To be eligible under Section 4013 of the CARES Act, a loan modification must be (1) related to the COVID-19 pandemic; (2) executed on a loan that was not more than 30 days past due as of December 31, 2019; and (3) executed between March 1, 2020, and the earlier of (a) 60 days after the date of termination of the federal National Emergency or (b) January 1, 2022. The federal banking regulators, in consultation with the FASB, issued the Interagency Statement on April 7, 2020 confirming that, for loans not subject to Section 4013 of the CARES Act, short-term modifications (i.e. six months or less) made on a good faith basis in response to the COVID-19 pandemic to borrowers who were current as of the implementation date of a loan modification, or modifications granted under government mandated modification programs, are not considered as TDRs under ASC Subtopic 310-40. See additional information in Note 1 — Summary of Significant Accounting Policies — Troubled Debt Restructurings in this Form 10-K.
The delinquency aging of loans modified related to the COVID-19 pandemic is frozen at the time of the modification. As a result, the recognition of delinquent loans, nonaccrual status, and loan net charge-offs may be delayed for certain borrowers who are enrolled in these loan modification programs, which would have otherwise moved into past due or nonaccrual status. Interest income continues to be recognized over the accommodation period.
The following table provides a summary of the COVID-19 pandemic-related loan modifications that remained under their modified terms as of December 31, 2020. The amounts represent loan modifications that meet the criteria under Section 4013 of the CARES Act, as amended by the CAA, or Interagency Statement and therefore are not considered TDRs. The amounts exclude loan modifications related to the COVID-19 pandemic made on existing TDRs. A loan is counted once in the table regardless of the number of accommodations received.
| | | | | | | | | | | | | | | | | | | | | | | | | | | | | | | | | | | | | | |
| | | | |
| ($ in thousands) | | | | | | | | | | | | | | December 31, 2020 | | | | |
| | | | | | | | | | | | | | | |
| | | | | | | | | | | | | Number of Loans | | Outstanding Balance | | | | % of Balance
of Respective Loan Portfolio | | | | |
| Payment deferral and forbearance | | | | | | | | | | | | | | | | | | | | | | | | |
| Commercial: | | | | | | | | | | | | | | | | | | | | | | | | |
| C&I | | | | | | | | | | | | | | 14 | | $ | 36,266 | | | | | 0 | % | | | | |
| CRE: | | | | | | | | | | | | | | | | | | | | | | | | |
| CRE | | | | | | | | | | | | | | 63 | | 597,972 | | | | 5 | % | | | | |
| Multifamily residential | | | | | | | | | | | | | | 4 | | 17,111 | | | | 1 | % | | | | |
| Construction and land | | | | | | | | | | | | | | 3 | | 66,629 | | | | 11 | % | | | | |
| Total CRE | | | | | | | | | | | | | | 70 | | 681,712 | | | | 5 | % | | | | |
| Total commercial | | | | | | | | | | | | | | 84 | | 717,978 | | | | 3 | % | | | | |
| Consumer: | | | | | | | | | | | | | | | | | | | | | | | | |
| Residential mortgage: | | | | | | | | | | | | | | | | | | | | | | | | |
| Single-family residential | | | | | | | | | | | | | | 501 | | 208,347 | | | | 3 | % | | | | |
| HELOCs | | | | | | | | | | | | | | 102 | | 39,469 | | | | 2 | % | | | | |
| Total residential mortgage | | | | | | | | | | | | | | 603 | | 247,816 | | | | 3 | % | | | | |
| Total consumer | | | | | | | | | | | | | | 603 | | 247,816 | | | | 2 | % | | | | |
| Total | | | | | | | | | | | | | | 687 | | $ | 965,794 | | | | | 3 | % | | | | |
| | | | |
The above table excludes loan modifications related to the COVID-19 pandemic that did not meet the criteria provided under Section 4013 of the CARES Act, as amended by the CAA, or the Interagency Statement, and that were evaluated and deemed to not be classified as TDRs. The determination to not consider a modification a TDR was made on the premise that the amount of the delayed restructured payments was insignificant relative to the unpaid principal or collateral value of the loan, resulting in an insignificant shortfall in the contractual amount due from the borrower, or an insignificant delay in the timing of the restructured payment period relative to the payment frequency under the loan’s original contractual maturity or expected duration. The above table also excludes loan modifications related to the COVID-19 pandemic made on existing TDRs.
The COVID-19 pandemic-related loan modifications primarily consisted of payment deferrals three months or less in duration, in the form of either principal payment deferrals, where the borrower was still paying interest, or full principal and interest payment deferrals. Other forbearance programs consisted of interest rate concessions. The deferred payments for commercial loans are either repaid at contractual maturity, or spread over the remaining contractual term of the loan. The deferred payments for consumer loans are repaid under defined payment plans between six to 36 months after the deferral period ends, or the loan term is extended beyond the contractual maturity by the number of payments deferred.
As of December 31, 2020, the Company had $965.8 million of loans under payment deferral and forbearance programs, a decrease of $602.1 million or 38% from $1.57 billion as of September 30, 2020, and a decrease of $1.86 billion or 66% from $2.82 billion as of June 30, 2020. The CRE COVID-19 loan modifications outstanding as of December 31, 2020 were primarily concentrated in the hotel and retail CRE portfolios. Of the CRE COVID-19 loan modifications, 73% were making partial payments, generally as interest payments, while 27% were under full payment deferral. Modifications are considered to have exited active accommodation after the borrower exited the modification program or after the modification period expired. The loans with expired COVID-19 modifications were predominantly current as of December 31, 2020. The Company monitors the delinquency status of loans exiting relief programs on an ongoing basis. The impacts of the COVID-19 loan modifications were considered in determination of the allowance for credit loss.
Allowance for Credit Losses
Effective January 1, 2020, the Company adopted ASU 2016-13, Financial Instruments — Credit Losses that requires the measurement of the allowance for credit losses to be based on management’s best estimate of lifetime expected credit losses inherent in the Company’s relevant financial assets. The allowance for credit losses estimate uses various models and estimation techniques based on historical loss experience, current borrower characteristics, current conditions, reasonable and supportable forecasts, and other relevant factors. On January 1, 2020, the adoption of the new accounting standard increased the allowance for loan losses by $125.2 million, and the allowance for unfunded credit commitments by $10.5 million. Corresponding with the increase to the allowance due the adoption of ASU 2016-13, there was an after-tax decrease to opening retained earnings of $98.0 million.
The Company’s methodology for determining the allowance for loan losses includes an estimate of expected credit losses on a collective basis for loan groups with similar risk characteristics, and a specific allowance for loans that are individually evaluated. For collectively evaluated loans, the Company uses quantitative models to forecast expected credit losses and these models consider historical credit loss experience, current market and economic conditions, and forecasted changes in market and economic conditions, if such forecasts are considered reasonable and supportable. The Company also considers qualitative factors in determining the allowance for loan losses. Qualitative adjustments are used to capture characteristics in the portfolio that impact expected credit losses, and which are not otherwise fully captured within the Company’s expected credit loss models.
In addition to the allowance for loan losses, the Company maintains an allowance for unfunded credit commitments. The Company has three general areas for which it provides the allowance for unfunded credit commitments: recourse obligations for loans sold, letters of credit, and unfunded lending commitments. The Company’s methodology for determining the allowance for unfunded lending commitments calculation uses the lifetime loss rates of the on-balance sheet commitment. Recourse obligations for loans sold and letters of credit use the weighted loss rates for the segment of the individual credit.
The Company employs a disciplined process and methodology to establish its allowance for loan losses each quarter. The process for estimating the allowance for loan losses takes into consideration many factors, including historical and forecasted loan loss trends, loan-level credit quality ratings and loan-specific risk characteristics. In addition to regular quarterly reviews of the adequacy of the allowance for loan losses, the Company performs ongoing assessments of the risks inherent in the loan portfolio. Determining the appropriateness of the allowance for loan losses is complex and requires judgement by management about the effect of matters that are inherently uncertain.
The Company is committed to maintaining the allowance for credit losses at a level that is commensurate with thesufficient to provide appropriate reserves to absorb estimated inherentfuture credit losses in the loan portfolio, including unfunded credit facilities. While the Company believes that the allowance for credit losses was appropriate as of December 31, 2020, future allowance levels may increase or decrease basedaccordance with GAAP. For additional information on a variety of factors, including but not limited to, accounting standard and regulatory changes, loan growth, portfolio performance and general economic conditions. For a description of the policies, methodologies and judgements used to determine the allowance for credit losses, see Item 7. MD&A — Critical Accounting Policies and Estimates, Note 1 — Summary of Significant Accounting Policiesand and Note 6 — Loans Receivable and Allowance for Credit Losses to the Consolidated Financial Statements in this Form 10-K.
The following table presents an allocation of the allowance for loan losses by loan portfolio segments as of the periods indicated:
| | | | | | | | | | | | | | | | | | | | | | | | | | | | | | | | | | | | | | | | | | | | | | | | | | | | | | | | | | | | | | | | | | |
|
| ($ in thousands) | | December 31, |
| 2020 | | 2019 | | 2018 | | 2017 | | 2016 | | |
| Allowance
Allocation | | | | % of Loan Type to
Total Loans | | Allowance
Allocation | | % of Loan Type to
Total Loans | | Allowance
Allocation | | % of Loan Type to
Total Loans | | Allowance
Allocation | | % of Loan Type to
Total Loans | | Allowance
Allocation | | % of Loan Type to
Total Loans | | |
| Commercial: | | | | | | | | | | | | | | | | | | | | | | | | |
| C&I | | $ | 398,040 | | | | | 36 | % | | $ | 238,376 | | | 35 | % | | $ | 189,117 | | | 37 | % | | $ | 163,058 | | | 37 | % | | $ | 142,167 | | | 38 | % | | |
| CRE: | | | | | | | | | | | | | | | | | | | | | | | | |
| CRE | | 163,791 | | | | | 29 | % | | 40,509 | | | 30 | % | | 40,666 | | | 28 | % | | 40,809 | | | 31 | % | | 47,559 | | | 31 | % | | |
| Multifamily residential | | 27,573 | | | | | 8 | % | | 22,826 | | | 8 | % | | 19,885 | | | 8 | % | | 19,537 | | | 7 | % | | 17,911 | | | 6 | % | | |
| Construction and land | | 10,239 | | | | | 2 | % | | 19,404 | | | 2 | % | | 20,290 | | | 2 | % | | 26,881 | | | 2 | % | | 24,989 | | | 3 | % | | |
| Total CRE | | 201,603 | | | | | 39 | % | | 82,739 | | | 40 | % | | 80,841 | | | 38 | % | | 87,227 | | | 40 | % | | 90,459 | | | 40 | % | | |
| Total Commercial | | 599,643 | | | | | 75 | % | | 321,115 | | | 75 | % | | 269,958 | | | 75 | % | | 250,285 | | | 77 | % | | 232,626 | | | 78 | % | | |
| Consumer: | | | | | | | | | | | | | | | | | | | | | | | | |
| Residential mortgage: | | | | | | | | | | | | | | | | | | | | | | | | |
| Single-family residential | | 15,520 | | | | | 21 | % | | 28,527 | | | 20 | % | | 31,340 | | | 19 | % | | 26,362 | | | 16 | % | | 19,795 | | | 14 | % | | |
| HELOCs | | 2,690 | | | | | 4 | % | | 5,265 | | | 4 | % | | 5,774 | | | 5 | % | | 7,354 | | | 6 | % | | 7,506 | | | 7 | % | | |
| Total residential mortgage | | 18,210 | | | | | 25 | % | | 33,792 | | | 24 | % | | 37,114 | | | 24 | % | | 33,716 | | | 22 | % | | 27,301 | | | 21 | % | | |
| Other consumer | | 2,130 | | | | | 0 | % | | 3,380 | | | 1 | % | | 4,250 | | | 1 | % | | 3,127 | | | 1 | % | | 593 | | | 1 | % | | |
| Total Consumer | | 20,340 | | | | | 25 | % | | 37,172 | | | 25 | % | | 41,364 | | | 25 | % | | 36,843 | | | 23 | % | | 27,894 | | | 22 | % | | |
| Total | | $ | 619,983 | | | | | 100 | % | | $ | 358,287 | | | 100 | % | | $ | 311,322 | | | 100 | % | | $ | 287,128 | | | 100 | % | | $ | 260,520 | | | 100 | % | | |
| | | | |
| | |
| | 2020 | | 2019 | | 2018 | | 2017 | | 2016 | | |
| Average loans held-for-investment | | $ | 36,796,989 | | | $ | 33,372,890 | | | $ | 30,209,219 | | | $ | 27,237,981 | | | $ | 24,223,535 | | | |
| Loans held-for-investment | | $ | 38,390,955 | | | $ | 34,778,539 | | | $ | 32,385,189 | | | $ | 28,975,718 | | | $ | 25,503,139 | | | |
| Allowance for loan losses to loans held-for-investment | | 1.61 | % | | 1.03 | % | | 0.96 | % | | 0.99 | % | | 1.02 | % | | |
| Net charge-offs to average loans held-for-investment | | 0.17 | % | | 0.16 | % | | 0.13 | % | | 0.08 | % | | 0.15 | % | | |
|
The allowance for loan losses was $620.0 million as of December 31, 2020, an increase of $261.7 million from $358.3 million as of December 31, 2019. This increase to allowance reflects a deterioration in the macroeconomic conditions and outlook as a result of the COVID-19 pandemic, and the adoption of CECL. The change is comprised of the following:
•a net $125.2 million increase due to the adoption of CECL on January 1, 2020,
•subsequent to January 1, 2020, a net $150.1 million addition in the allowance against commercial loans, predominantly in C&I and CRE income-producing, and
•a net $13.6 million reduction in the allowance against consumer loans, predominantly in single-family residential and other consumer. | | | | | | | | | | | | | | | | | | | | | | | | | | | | | | | | | | | | | | | | | | |
|
| | December 31, |
| | 2023 | | 2022 | | | | | | | | |
| ($ in thousands) | | Allowance Allocation | | | | % of Loan Type to Total Loans | | Allowance Allocation | | % of Loan Type to Total Loans | | | | | | | | | | | | | | |
| Allowance for loan losses | | | | | | | | | | | | | | | | | | | | | | | | |
| Commercial: | | | | | | | | | | | | | | | | | | | | | | | | |
| C&I | | $ | 392,685 | | | | | 32 | % | | $ | 371,700 | | | 33 | % | | | | | | | | | | | | | | |
| CRE: | | | | | | | | | | | | | | | | | | | | | | | | |
| CRE | | 170,592 | | | | | 28 | % | | 149,864 | | | 29 | % | | | | | | | | | | | | | | |
| Multifamily residential | | 34,375 | | | | | 10 | % | | 23,373 | | | 10 | % | | | | | | | | | | | | | | |
| Construction and land | | 10,469 | | | | | 1 | % | | 9,109 | | | 1 | % | | | | | | | | | | | | | | |
| Total CRE | | 215,436 | | | | | 39 | % | | 182,346 | | | 40 | % | | | | | | | | | | | | | | |
| Total commercial | | 608,121 | | | | | 71 | % | | 554,046 | | | 73 | % | | | | | | | | | | | | | | |
| Consumer: | | | | | | | | | | | | | | | | | | | | | | | | |
| Residential mortgage: | | | | | | | | | | | | | | | | | | | | | | | | |
| Single-family residential | | 55,018 | | | | | 26 | % | | 35,564 | | | 23 | % | | | | | | | | | | | | | | |
| HELOCs | | 3,947 | | | | | 3 | % | | 4,475 | | | 4 | % | | | | | | | | | | | | | | |
| Total residential mortgage | | 58,965 | | | | | 29 | % | | 40,039 | | | 27 | % | | | | | | | | | | | | | | |
| Other consumer | | 1,657 | | | | | 0 | % | | 1,560 | | | 0 | % | | | | | | | | | | | | | | |
| Total consumer | | 60,622 | | | | | 29 | % | | 41,599 | | | 27 | % | | | | | | | | | | | | | | |
| Total allowance for loan losses | | $ | 668,743 | | | | | 100 | % | | $ | 595,645 | | | 100 | % | | | | | | | | | | | | | | |
| Allowance for unfunded credit commitments | | $ | 37,699 | | | | | | | $ | 26,264 | | | | | | | | | | | | | | | | | |
| Total allowance for credit losses | | $ | 706,442 | | | | | | | $ | 621,909 | | | | | | | | | | | | | | | | | |
| Loans held-for-investment | | $ | 52,210,782 | | | | | | | $ | 48,202,430 | | | | | | | | | | | |
| Allowance for loan losses to loans held-for-investment | | 1.28 | % | | | | | | 1.24 | % | | | | | | | | | | |
| | | | | | | | | | | | |
|
The Company considers multiple economic scenariosfollowing table presents net charge-offs and the net charge-offs to developaverage loans ratios based on the estimateloan categories as of the allowance for loans. The scenarios consist of a base forecast representing management's view of the most likely outcome, combined with downside and upside scenarios reflecting possible worsening or improving economic conditions. The base forecast assumed near-term economic stress and the economy beginning to recover in 2021, based on anticipated economic stimulus from the government and the Federal Reserve maintaining its target fed funds range. The downside scenario assumed more sustained adverse economic impact resulting from the COVID-19 pandemic, as compared to the base forecast. The upside scenario assumed a more optimistic view for the economic recovery, as compared with the base forecast, including travel, business and other restrictions ending sooner, and improved consumer optimism based on more rapid distribution of COVID-19 vaccines. The Company applies management judgment to add qualitative factors for the impact of COVID-19 pandemic on industry and CRE sectors that are affected by the pandemic.periods indicated:
| | | | | | | | | | | | | | | | | | | | | | | | | | | | | | | | | | | | | | | | |
| | |
| | December 31, | | |
| | 2023 | | 2022 | | |
| ($ in thousands) | | Net Charge-Offs (Recoveries) | | Average Loans Held-for-Investment | | % of Net Charge-Offs (Recoveries) to Average Loans Held-for-Investment | | Net Charge-Offs (Recoveries) | | Average Loans Held-for-Investment | | % of Net Charge-Offs (Recoveries) to Average Loans Held-for-Investment | | |
| Commercial: | | | | | | | | | | | | | | |
| C&I | | $ | 29,770 | | | $ | 15,497,693 | | | 0.19 | % | | $ | 1,914 | | | $ | 15,010,984 | | | 0.01 | % | | |
| CRE: | | | | | | | | | | | | | | |
| CRE | | 6,616 | | | 14,312,459 | | | 0.05 | % | | 9,288 | | | 13,145,204 | | | 0.07 | % | | |
| Multifamily residential | | (542) | | | 4,756,885 | | | (0.01) | % | | 6,678 | | | 4,249,600 | | | 0.16 | % | | |
| Construction and land | | 10,177 | | | 754,928 | | | 1.35 | % | | (74) | | | 499,044 | | | (0.01) | % | | |
| Total CRE | | 16,251 | | | 19,824,272 | | | 0.08 | % | | 15,892 | | | 17,893,848 | | | 0.09 | % | | |
| Total commercial | | 46,021 | | | 35,321,965 | | | 0.13 | % | | 17,806 | | | 32,904,832 | | | 0.05 | % | | |
| Consumer: | | | | | | | | | | | | | | |
| Residential mortgage: | | | | | | | | | | | | | | |
| Single-family residential | | (69) | | | 12,274,773 | | | 0.00 | % | | 463 | | | 10,106,349 | | | 0.00 | % | | |
| HELOCs | | 105 | | | 1,881,008 | | | 0.01 | % | | 84 | | | 2,208,725 | | | 0.00 | % | | |
| Total residential mortgage | | 36 | | | 14,155,781 | | | 0.00 | % | | 547 | | | 12,315,074 | | | 0.00 | % | | |
| Other consumer | | 197 | | | 65,181 | | | 0.30 | % | | 106 | | | 93,711 | | | 0.11 | % | | |
| Total consumer | | 233 | | | 14,220,962 | | | 0.00 | % | | 653 | | | 12,408,785 | | | 0.01 | % | | |
| Total | | $ | 46,254 | | | $ | 49,542,927 | | | 0.09 | % | | $ | 18,459 | | | $ | 45,313,617 | | | 0.04 | % | | |
| | | | | | | | | | | | | | |
As of December 31, 2020, PPP loans outstanding were $1.57 billion. As these loans are 100% guaranteed by SBA, the Company expects these loans will have zero expected loss. Accordingly, as of December 31, 2020, these loans had no related allowance for loan losses.
20202023 net charge-offs were $63.2$46 million, or 0.17%0.09% of average loans-held-for-investment,loans held-for-investment, compared with $52.8$18 million, or 0.16%0.04% of average loanloans held-for-investment in 2019.2022. The year-over-year change in net loan charge-offsincrease was largelyprimarily due to higher CRE charge-offs, compared withlosses in the C&I and construction and land portfolios, as well as lower recoveries in 2019. The COVID-19 pandemic may continue to impact the credit quality of our loanC&I portfolio. Although the potential impactsThese increases were considered in our allowance for loan losses, payment deferral activities instituted in response to the COVID-19 pandemic could delay the recognition of some loan charge-offs.
The following tables summarize activitypartially offset by lower charge-offs in the allowance for loan losses for loans by loan portfolio segments for the periods indicated:
| | | | | | | | | | | | | | | | | | | | | | | | | | | | | | | | | | | | | | | | | | | | | | | | | | | | | | |
|
| ($ in thousands) | | Year Ended December 31, 2020 |
| Commercial | | Consumer | | Total | | | | |
| C&I | | CRE | | Residential Mortgage | | Other
Consumer | | | | | |
| | CRE | | Multifamily
Residential | | Construction
and Land | | Single-
Family
Residential | | HELOCs | | | | | | |
| | | | | | | | | | | | | | | | | | | | |
| Allowance for loan losses, beginning of period | | $ | 238,376 | | | $ | 40,509 | | | $ | 22,826 | | | $ | 19,404 | | | $ | 28,527 | | | $ | 5,265 | | | $ | 3,380 | | | $ | 358,287 | | | | | |
| Impact of ASU 2016-13 adoption | | 74,237 | | | 72,169 | | | (8,112) | | | (9,889) | | | (3,670) | | | (1,798) | | | 2,221 | | | 125,158 | | | | | |
| Provision for (reversal of) credit losses on loans | (a) | 145,212 | | | 55,864 | | | 10,879 | | | 644 | | | (9,922) | | | (605) | | | (3,381) | | | 198,691 | | | | | |
| Gross charge-offs | | (66,225) | | | (15,206) | | | — | | | — | | | — | | | (221) | | | (185) | | | (81,837) | | | | | |
| Gross recoveries | | 5,428 | | | 10,455 | | | 1,980 | | | 80 | | | 585 | | | 49 | | | 95 | | | 18,672 | | | | | |
| Total net (charge-offs) recoveries | | (60,797) | | | (4,751) | | | 1,980 | | | 80 | | | 585 | | | (172) | | | (90) | | | (63,165) | | | | | |
| Foreign currency translation adjustment | | 1,012 | | | — | | | — | | | — | | | — | | | — | | | — | | | 1,012 | | | | | |
| Allowance for loan losses, end of period | | $ | 398,040 | | | $ | 163,791 | | | $ | 27,573 | | | $ | 10,239 | | | $ | 15,520 | | | $ | 2,690 | | | $ | 2,130 | | | $ | 619,983 | | | | | |
| | | | |
| | | | | | | | | | | | | | | | | | | | | | | | | | | | | | | | | | | | | | | | | | | | | | | | | | | | | | |
|
| ($ in thousands) | | Year Ended December 31, 2019 |
| Commercial | | Consumer | | Total | | | | |
| C&I | | CRE | | Residential Mortgage | | Other
Consumer | | | | | |
| | CRE | | Multifamily
Residential | | Construction
and Land | | Single-
Family
Residential | | HELOCs | | | | | | |
| | | | | | | | | | | | | | | | | | | | |
| Allowance for loan losses, beginning of period | | $ | 189,117 | | | $ | 40,666 | | | $ | 19,885 | | | $ | 20,290 | | | $ | 31,340 | | | $ | 5,774 | | | $ | 4,250 | | | $ | 311,322 | | | | | |
| Provision for (reversal of) credit losses on loans | (a) | 109,068 | | | (4,345) | | | 1,085 | | | (1,422) | | | (2,938) | | | (516) | | | (839) | | | 100,093 | | | | | |
| Gross charge-offs | | (73,985) | | | (1,021) | | | — | | | — | | | (11) | | | — | | | (50) | | | (75,067) | | | | | |
| Gross recoveries | | 14,501 | | | 5,209 | | | 1,856 | | | 536 | | | 136 | | | 7 | | | 19 | | | 22,264 | | | | | |
| Total net (charge-offs) recoveries | | (59,484) | | | 4,188 | | | 1,856 | | | 536 | | | 125 | | | 7 | | | (31) | | | (52,803) | | | | | |
| Foreign currency translation adjustment | | (325) | | | — | | | — | | | — | | | — | | | — | | | — | | | (325) | | | | | |
| Allowance for loan losses, end of period | | $ | 238,376 | | | $ | 40,509 | | | $ | 22,826 | | | $ | 19,404 | | | $ | 28,527 | | | $ | 5,265 | | | $ | 3,380 | | | $ | 358,287 | | | | | |
| | | | |
| | | | | | | | | | | | | | | | | | | | | | | | | | | | | | | | | | | | | | | | | | | | | | | | | | | | | | |
|
| ($ in thousands) | | Year Ended December 31, 2018 |
| Commercial | | Consumer | | Total | | | | |
| C&I | | CRE | | Residential Mortgage | | Other
Consumer | | | | | |
| | CRE | | Multifamily
Residential | | Construction
and Land | | Single-
Family
Residential | | HELOCs | | | | | | |
| | | | | | | | | | | | | | | | | | | | |
| Allowance for loan losses, beginning of period | | $ | 163,058 | | | $ | 40,809 | | | $ | 19,537 | | | $ | 26,881 | | | $ | 26,362 | | | $ | 7,354 | | | $ | 3,127 | | | $ | 287,128 | | | | | |
| Provision for (reversal of) credit losses on loans | (a) | 75,629 | | | (5,337) | | | (1,409) | | | (7,331) | | | 3,765 | | | (1,618) | | | 1,308 | | | 65,007 | | | | | |
| Gross charge-offs | | (59,244) | | | — | | | — | | | — | | | (1) | | | — | | | (188) | | | (59,433) | | | | | |
| Gross recoveries | | 10,417 | | | 5,194 | | | 1,757 | | | 740 | | | 1,214 | | | 38 | | | 3 | | | 19,363 | | | | | |
| Total net (charge-offs) recoveries | | (48,827) | | | 5,194 | | | 1,757 | | | 740 | | | 1,213 | | | 38 | | | (185) | | | (40,070) | | | | | |
| Foreign currency translation adjustment | | (743) | | | — | | | — | | | — | | | — | | | — | | | — | | | (743) | | | | | |
| Allowance for loan losses, end of period | | $ | 189,117 | | | $ | 40,666 | | | $ | 19,885 | | | $ | 20,290 | | | $ | 31,340 | | | $ | 5,774 | | | $ | 4,250 | | | $ | 311,322 | | | | | |
| | | | |
| | | | | | | | | | | | | | | | | | | | | | | | | | | | | | | | | | | | | | | | | | | | | | | | | | | | | | |
|
| ($ in thousands) | | Year Ended December 31, 2017 |
| Commercial | | Consumer | | Total | | | | |
| C&I | | CRE | | Residential Mortgage | | Other
Consumer | | | | | |
| | CRE | | Multifamily
Residential | | Construction
and Land | | Single-
Family
Residential | | HELOCs | | | | | | |
| | | | | | | | | | | | | | | | | | | | |
| Allowance for loan losses, beginning of period | | $ | 142,167 | | | $ | 47,559 | | | $ | 17,911 | | | $ | 24,989 | | | $ | 19,795 | | | $ | 7,506 | | | $ | 593 | | | $ | 260,520 | | | | | |
| Provision for (reversal of) credit losses on loans | (a) | 46,944 | | | (8,861) | | | 904 | | | 1,782 | | | 6,022 | | | (121) | | | 2,399 | | | 49,069 | | | | | |
| Gross charge-offs | | (38,118) | | | — | | | (635) | | | (149) | | | (1) | | | (55) | | | (17) | | | (38,975) | | | | | |
| Gross recoveries | | 11,371 | | | 2,111 | | | 1,357 | | | 259 | | | 546 | | | 24 | | | 152 | | | 15,820 | | | | | |
| Total net (charge-offs) recoveries | | (26,747) | | | 2,111 | | | 722 | | | 110 | | | 545 | | | (31) | | | 135 | | | (23,155) | | | | | |
| Foreign currency translation adjustment | | 694 | | | — | | | — | | | — | | | — | | | — | | | — | | | 694 | | | | | |
| Allowance for loan losses, end of period | | $ | 163,058 | | | $ | 40,809 | | | $ | 19,537 | | | $ | 26,881 | | | $ | 26,362 | | | $ | 7,354 | | | $ | 3,127 | | | $ | 287,128 | | | | | |
| | | | |
| | | | | | | | | | | | | | | | | | | | | | | | | | | | | | | | | | | | | | | | | | | | | | | | | | | | | | |
|
| ($ in thousands) | | Year Ended December 31, 2016 |
| Commercial | | Consumer | | Total | | | | |
| C&I | | CRE | | Residential Mortgage | | Other
Consumer | | | | | |
| | CRE | | Multifamily
Residential | | Construction
and Land | | Single-
Family
Residential | | HELOCs | | | | | | |
| | | | | | | | | | | | | | | | | | | | |
| Allowance for loan losses, beginning of period | | $ | 134,606 | | | $ | 58,623 | | | $ | 19,630 | | | $ | 22,915 | | | $ | 19,665 | | | $ | 8,745 | | | $ | 775 | | | $ | 264,959 | | | | | |
| Provision for (reversal of) credit losses on loans | (a) | 46,847 | | | (12,088) | | | (3,166) | | | 1,988 | | | (134) | | | (1,237) | | | (492) | | | 31,718 | | | | | |
| Gross charge-offs | | (47,739) | | | (464) | | | (29) | | | (117) | | | (137) | | | (9) | | | (13) | | | (48,508) | | | | | |
| Gross recoveries | | 9,003 | | | 1,488 | | | 1,476 | | | 203 | | | 401 | | | 7 | | | 323 | | | 12,901 | | | | | |
| Total net (charge-offs) recoveries | | (38,736) | | | 1,024 | | | 1,447 | | | 86 | | | 264 | | | (2) | | | 310 | | | (35,607) | | | | | |
| Foreign currency translation adjustment | | (550) | | | — | | | — | | | — | | | — | | | — | | | — | | | (550) | | | | | |
| Allowance for loan losses, end of period | | $ | 142,167 | | | $ | 47,559 | | | $ | 17,911 | | | $ | 24,989 | | | $ | 19,795 | | | $ | 7,506 | | | $ | 593 | | | $ | 260,520 | | | | | |
| | | | |
The following table summarizes activity in the allowance for unfunded credit commitments for the periods indicated:
| | | | | | | | | | | | | | | | | | | | | | | | | | | | | | | | |
|
| ($ in thousands) | | Year Ended December 31, |
| 2020 | | 2019 | | 2018 | | 2017 | | 2016 |
| Unfunded credit facilities | | | | | | | | | | |
| Allowance for unfunded credit commitments, beginning of period | | $ | 11,158 | | | $ | 12,566 | | | $ | 13,318 | | | $ | 16,121 | | | $ | 20,360 | |
| Impact of ASU 2016-13 adoption | | 10,457 | | | — | | | — | | | — | | | — | |
| | | | | | | | | | |
| Provision for (reversal of) credit losses on unfunded credit commitments | (b) | 11,962 | | | (1,408) | | | (752) | | | (2,803) | | | (4,239) | |
| Allowance for unfunded credit commitments, end of period | | $ | 33,577 | | | $ | 11,158 | | | $ | 12,566 | | | $ | 13,318 | | | $ | 16,121 | |
| | | | | | | | | | |
| Provision for credit losses | (a) + (b) | $ | 210,653 | | | $ | 98,685 | | | $ | 64,255 | | | $ | 46,266 | | | $ | 27,479 | |
|
The allowance for unfunded credit commitments was $33.6 million as of December 31, 2020, compared with $11.2 million as of December 31, 2019. The Company believes the allowance for credit losses as of December 31, 2020multifamily residential and 2019 was adequate.
Upon adoption of ASU 2016-13, allowance for loan losses for PCD loans is determined using the same methodology as other loans held-for-investment. As of December 31, 2019, the Company had no allowance for loan losses against $222.9 million of PCI loans.CRE portfolios.
Liquidity Risk Management
Liquidity
Liquidity is a financial institution’s capacityrisk arises from the Company’s inability to meet its customer deposit withdrawals and obligations to other counterparties’ obligationscounterparties as they come due, or to obtain adequate funding at a reasonable cost to meet those obligations. Liquidity risk also considers the stability of deposits. The objective of liquidity management is to manage the potential mismatch of asset and liability cash flows. Maintaining an adequate level of liquidity depends on the institution’s ability to efficiently meet both expected and unexpected cash flows,flow and collateral needs without adversely affecting daily operations or the financial condition of the institution. To achieve this objective, the Company analyzes its liquidity risk, maintains readily available liquid assets and utilizes diverse funding sources including its stable core deposit base.
The Board of Directors’ Risk Oversight CommitteeROC has primary oversight responsibility.responsibility over liquidity risk management. At the management level, the Company’s Asset/Liability Committee (“ALCO”) establishes the liquidity guidelines that govern the day-to-day active management of the Company’s liquidity position by requiring sufficient asset-based liquidity to cover potential funding requirements and avoid over-dependence on volatile, less reliable funding markets. These guidelines are established and monitored for both the Bank and for East West, the parent company, on a stand-alone basis to ensure that the Company iscan serve as a source of strength for its subsidiaries. The ALCO regularly monitors the Company’s liquidity status and related management processes, providingand provides regular reports on the Company’s liquidity position relative to policy limits and guidelines to the Board of Directors. The Company’s liquidity management practices have been effective under normal operating and stressed market conditions such as the financial stress caused by the COVID-19 pandemic.conditions.
The Company also maintains a Liquidity Contingency Plan that provides an early-warning methodology to detect liquidity problems and provide a timely response. The Liquidity Contingency Plan describes the procedures, roles and responsibilities, and communication protocols for managing any identified liquidity problem. Management monitors the early-warning indicators defined in the Liquidity Contingency Plan, which include metrics for measuring the Company’s internal liquidity status as well as company-specific and market-wide external factors. When early-warning signals are detected, the ALCO is informed, and the problem is evaluated for severity. The ALCO will determine the course of action and appropriate contingency funding sources, if any, that are needed.
Liquidity Risk — Liquidity SourcesSources. The Company’s primary source of funding is from deposits, generated by its banking business, which arewe believe is a relatively stable and low-cost. Totallow-cost source of funding. Our loans are funded by deposits, which amounted to $44.86$56.1 billion as of December 31, 2020,2023, compared with $37.32$56.0 billion as of December 31, 2019.2022. The Company’s loan-to-deposit ratio was 86% December 31, 2020, compared with 93% as of December 31, 2019.2023, compared with 86% as of December 31, 2022.
In addition to deposits, the Company has access to various sources of wholesale funding, as well asfinancing, including borrowing capacity atwith the FHLB and FRBSF, such as under the BTFP, unsecured federal funds lines of credit with various correspondent banks, and several master repurchase agreements with major brokerage companies to sustain an adequate liquid asset portfolio, meet daily cash demands and allow management flexibility to execute its business strategy. EconomicHowever, general financial market and economic conditions and the stability of capital marketscould impact the Company’sour access to and the cost of wholesale financing. Theexternal funding. Additionally, the Company’s access to capital markets is also affected by the ratings received from various credit rating agencies. See Item 7— MD&A — Balance Sheet Analysis — Deposits and Other Sources of Funds in this Form 10-K for further detail related to the Company’s funding sources.
The Company maintains liquidity in the form of cash and cash equivalents, interest-bearing deposits with banks, short-term resale agreements, and unencumbered high-quality and liquid AFS debt securities. The following table presents the Company’s liquid assets as of December 31, 2020 and 2019:
| | | | | | | | | | | | | | | | | | | | | | | | | | | | | | | | | | | | | | |
|
| ($ in thousands) | | December 31, 2020 | | December 31, 2019 |
| Encumbered | | Unencumbered | | Total | | Encumbered | | Unencumbered | | Total |
| Cash and cash equivalents | | $ | — | | | $ | 4,017,971 | | | $ | 4,017,971 | | | $ | — | | | $ | 3,261,149 | | | $ | 3,261,149 | |
| Interest-bearing deposits with banks | | — | | | 809,728 | | | 809,728 | | | — | | | 196,161 | | | 196,161 | |
| Short-term resale agreements | | — | | | 900,000 | | | 900,000 | | | — | | | 400,000 | | | 400,000 | |
| | | | | | | | | | | | |
| U.S. Treasury, and U.S. government agency and U.S. government-sponsored enterprise debt securities | | 91,637 | | | 773,443 | | | 865,080 | | | 142,203 | | | 615,464 | | | 757,667 | |
| U.S. government agency and U.S. government-sponsored enterprise mortgage-backed securities | | 494,132 | | | 2,320,532 | | | 2,814,664 | | | 334,194 | | | 1,273,174 | | | 1,607,368 | |
| Foreign government bonds | | — | | | 182,531 | | | 182,531 | | | — | | | 354,172 | | | 354,172 | |
| Municipal securities | | 1,033 | | | 395,040 | | | 396,073 | | | 1,040 | | | 101,262 | | | 102,302 | |
| Non-agency mortgage-backed securities, asset-backed securities and CLOs | | 434 | | | 879,908 | | | 880,342 | | | 733 | | | 483,823 | | | 484,556 | |
| Corporate debt securities | | 1,249 | | | 404,719 | | | 405,968 | | | 1,262 | | | 9,887 | | | 11,149 | |
| | | | | | | | | | | | |
| | | | | | | | | | | | |
| | | | | | | | | | | | |
| Total | | $ | 588,485 | | | $ | 10,683,872 | | | $ | 11,272,357 | | | $ | 479,432 | | | $ | 6,695,092 | | | $ | 7,174,524 | |
|
Unencumbered liquid assets totaled $10.68 billion as of December 31, 2020, compared with $6.70 billion as of December 31, 2019. AFS debt securities included as part of liquidity sources consists of high quality and liquid securities with relatively short durations to minimize overall interest rate and liquidity risks. The Company believes these AFS debt securities provide quick sources of liquidity to obtain financing, regardless of market conditions, through sale or pledging.
As a means to generate incremental liquidity, the Company maintains available borrowing capacity under secured borrowing lines with the FHLB and FRBSF, unsecured federal funds lines of credit with various correspondent banks, and several master repurchase agreements with major brokerage companies. As of December 31, 2020, the Company had total available borrowing capacity of $17.04 billion. The Company believes that its liquidity sources are sufficient to meet all reasonably foreseeable short-term needs over the next 12 months
As of December 31, 2020, the Company had available borrowing capacity of $6.33 billion with the FHLB and $5.54 billion with the FRBSF. Unencumbered loans and/or debt securities were pledged to the FHLB, and the FRBSF discount window, and the FRBSF BTFP as collateral. The Company has established operational procedures to enable borrowing against these assets, including regular monitoring of the total pool of loans and debt securities eligible as collateral. Eligibility of collateral is defined in guidelines from the FHLB and FRBSF and is subject to change at their discretion. See Item 7.— MD&A — Balance Sheet Analysis — Deposits and Other Sources of Funding in this Form 10-K for further details related to the Company’s funding sources. The Bank’s unsecured federal funds linesCompany believes its cash and cash equivalents and available borrowing capacity described below provide sufficient liquidity above its expected cash needs.
The Company maintains its source of creditliquidity in the form of cash and cash equivalents and borrowing capacity with correspondent banks, subject to availability, totaled $976.0 millionits eligible loans and debt securities as collateral. The following table presents the Company’s total cash and cash equivalents and borrowing capacity as of December 31, 2020. Estimated2023 and 2022:
| | | | | | | | | | | | | | | | | | | | | | | | | | |
| | | | |
| | | | | | Change |
| ($ in thousands) | | December 31, 2023 | | December 31, 2022 | | $ | | % |
| Cash and cash equivalents | | $ | 4,614,984 | | | $ | 3,481,784 | | | $ | 1,133,200 | | | 33 | % |
| Interest-bearing deposits with banks | | 10,498 | | | 139,021 | | | (128,523) | | | (92) | % |
| Borrowing capacity: | | | | | | | | |
| FHLB | | 12,373,002 | | | 12,773,996 | | | (400,994) | | | (3) | % |
| FRBSF | | 9,830,769 | | | 2,049,048 | | | 7,781,721 | | | 380 | % |
| Unpledged available securities | | 1,988,526 | | | 6,939,591 | | | (4,951,065) | | | (71) | % |
| Federal funds facility | | 946,000 | | | 1,136,000 | | | (190,000) | | | (17) | % |
| Total | | $ | 29,763,779 | | | $ | 26,519,440 | | | $ | 3,244,339 | | | 12 | % |
| | | | |
The Company’s cash and cash equivalents and borrowing capacity from unpledged AFS debt securities totaled $4.18$29.8 billion as of December 31, 2020.2023, compared with $26.5 billion as of December 31, 2022. The increase was primarily related to an increase in collateral available at the FRBSF and an increase in cash and cash equivalents, which was funded by borrowings from the BTFP in the first quarter of 2023. The BTFP borrowings were secured by pledged securities and reflected the Company’s conservative liquidity management practices in response to the volatility in the banking industry earlier in the year.
Liquidity Risk — Cash Requirements. In the ordinary course of business, the Company enters contractual obligations that require future cash payments, including funding for customer deposit withdrawals, repayments for short- and long-term borrowings and other cash commitments. For additional information on these obligations, see the following Notes to the Consolidated Financial Statements in this Form 10-K:
•Note 3 — Assets Purchased under Resale Agreements and Sold under Repurchase Agreements
•Note 7 — Investments in Qualified Affordable Housing Partnerships, Tax Credit and Other Investments, Net and Variable Interest Entities
•Note 9 — Deposits
•Note 10 — Short-Term Borrowings and Long-Term Debt
In connectionJanuary 2024, the Company provided notice that it would redeem $113 million of the principal face value of junior subordinated debt and $4 million of the principal face value of trust preferred securities issued by the East West Capital Trusts. Of these amounts, $16 million was redeemed in February 2024 and the remaining $101 million is scheduled to be redeemed in March 2024.
The Company also has off-balance sheet arrangements which represent transactions that are not recorded on the Consolidated Balance Sheet. The Company’s off-balance sheet arrangements include (1) commitments to extend credit, such as loan commitments, commercial letters of credit for foreign and domestic trade, standby letters of credit (“SBLCs”), and financial guarantees, to meet the financing needs of its customers, (2) future interest obligations related to customer deposits and the Company’s borrowings, and (3) transactions with unconsolidated entities that provide financing, liquidity, market risk or credit risk support to the Company, or engage in leasing, hedging or research and development services with the Company’s participation inCompany. Because many of these commitments are expected to expire without being drawn upon, the PPP under the CARES Act, the Company has the ability to pledge loans originated under the SBA’s PPP program to the PPPLF, and receive termtotal commitment amounts do not necessarily represent future funding matching the balance and term of the pledged loans. In the second quarter of 2020, the Company drew down $1.44 billion from the Federal Reserve PPPLF and pledged the same amount in PPP loans as collateral.requirements. The Company paid offdoes not expect the outstandingtotal commitment amounts under the PPPLF in full during the fourth quarter of 2020. Asas of December 31, 2020,2023 to have a material current or future impact on the Company did not have anyCompany’s financial conditions or results of operations. Information about the Company’s loan commitments, commercial letters of credit and SBLCs is provided in Note 12 — Commitments and Contingencies to the Consolidated Financial Statements in this Form 10-K.
The Consolidated Statement of Cash Flows summarizes the Company’s sources and uses of cash by type of activity for 2023, 2022 and 2021. Excess cash generated by operating and investing activities may be used to repay outstanding balance under the PPPLF.debt or invest in liquid assets.
Liquidity Risk — Liquidity for East WestWest. In addition to bank level liquidity management, the Company manages liquidity at the parent company level for various operating needs including payment of dividends, repurchases of common stock, principal and interest payments on its borrowings, acquisitions and additional investments in its subsidiaries. East West’s primary source of liquidity is from cash dividends distributed by its subsidiary, East West Bank. The Bank is subject to various statutory and regulatory restrictions on its ability to pay dividends as discussed in Item 1. Business — Supervision and Regulation — Dividends and Other Transfers of Funds in this Form 10-K. As of December 31, 2020, East West held $439.1$446 million and $229 million in cash and cash equivalents after receiving $511.0 million in dividends from the Bank. In comparison, as of December 31, 2019,2023 and 2022, respectively. Management believes that East West held $166.1 million inhas sufficient cash and cash equivalents after receiving $190.0 million in dividends from the Bank. Each year, the dividends from the Bank to East West are sufficient to meet the projected cash obligations of the parent company for the coming year.
Liquidity Risk — Liquidity Stress TestingTesting. LiquidityThe Company utilizes liquidity stress testing is performedanalysis to determine the appropriate amounts of liquidity to maintain at the Company, level, as well as at the foreign subsidiary and foreign branch levels. Stress teststo meet contractual and scenario analyses are intended to quantify the potential impactcontingent cash outflows under a range of a liquidity event on the financial and liquidity position of the entity.scenarios. Scenario analyses include assumptions about significant changes in key funding sources, market triggers, potential uses of funding and economic conditions in certain countries. In addition, Company specific events are incorporated into the stress testing. For example, based on the Company’s analysis of the banking industry disruption earlier in 2023, deposit runoffs were assumed to be more front-loaded to trigger earlier remediation actions. Liquidity stress tests are conducted to ascertain potential mismatches between liquidity sources and uses over a variety of time horizons, both immediate and longer term, and over a variety of stressed conditions. Given the range of potential stresses, the Company maintains contingency funding plans on a consolidated basis and for individual entities.
Liquidity Risk — COVID-19 Pandemic In response to the ongoing developments related to the COVID-19 pandemic, the Company continues to closely monitor the impact of the pandemic on its business. The uncertainty surrounding the COVID-19 pandemic, and its impact on the financial services industry, could potentially impact the liquidity of the Company. The prolonged strained economic, capital, credit and/or financial market conditions may expose the Company to liquidity risk. However, the Company believes that market conditions have shown signs of improvement after the Federal Reserve stepped in with a broad array of actions to stabilize financial markets and to lower borrowing costs. In December 2020, the CAA was signed into law which issued new relief provisions, extended certain provisions of the CARES Act, and provided additional stimulus funding. Additional government stimulus assistance may be passed in 2021. The combination of the CAA and any additional stimulus legislation in 2021 may further enhance economic recovery.
As of December 31, 2020,2023, the Company was not aware of any material commitments for capital expenditures in the foreseeable future and believes it has adequate liquidity resources to conduct operations and meet other needs in the ordinary course of business.business, and is not aware of any events that are reasonably likely to have a material adverse effect on its liquidity, capital resources or operations. Given the uncertaintyuncertain and the rapidly changing market and economic conditions, related to the COVID-19 pandemic, the Company will continue to actively evaluate the nature and extent of impact on its business and financial position.
Consolidated Cash Flows Analysis
The following table presents a summary of the Company’s Consolidated Statement of Cash Flows for the periods indicated. While this information For more details on how economic conditions may be helpful to highlight business strategies and certain macroeconomic trends, the cash flow analysis may not be as relevant when analyzing changes in the Company’s net earnings and assets. The Company believes that in addition to this traditional cash flow analysis, the discussion related toimpact our liquidity, insee Item 7. MD&A1A. Risk Factors — Risk Management — Liquidity Risk Management — Liquidity may provide a useful context in evaluating the Company’s liquidity position and related activity.
| | | | | | | | | | | | | | | | | | | | |
|
| ($ in thousands) | | Year Ended December 31, |
| 2020 | | 2019 | | 2018 |
| Net cash provided by operating activities | | $ | 693,325 | | | $ | 735,829 | | | $ | 883,172 | |
| Net cash used in investing activities | | (6,848,716) | | | (2,571,176) | | | (3,832,412) | |
| Net cash provided by financing activities | | 6,908,793 | | | 2,124,962 | | | 3,800,808 | |
| Effect of exchange rate changes on cash and cash equivalents | | 3,420 | | | (29,843) | | | (24,783) | |
| Net increase in cash and cash equivalents | | 756,822 | | | 259,772 | | | 826,785 | |
| Cash and cash equivalents, beginning of year | | 3,261,149 | | | 3,001,377 | | | 2,174,592 | |
| Cash and cash equivalents, end of year | | $ | 4,017,971 | | | $ | 3,261,149 | | | $ | 3,001,377 | |
| | | | | | |
Operating Activities — Net cash provided by operating activities was $693.3 million, $735.8 million and $883.2 million in 2020, 2019 and 2018, respectively. During 2020, 2019 and 2018, net cash provided by operating activities mainly reflected inflows of net income, in the amounts of $567.8 million, $674.0 million and $703.7 million for each of the respective years. During 2020, net operating cash inflows also benefited from noncash adjustments of $285.0 million to reconcile net income to net operating cash, as well as net changes in accrued expenses and other liabilities of $170.4 million, partially offset by net changes in accrued interest receivable and other assets of $339.9 million. The net changes in accrued interest receivable and other assets of $339.9 million during 2020 were primarily due to changes in derivative asset fair values. In comparison, during 2019, net operating cash inflows benefited from noncash adjustments of $221.6 million to reconcile net income to net operating cash, partially offset by net changes in accrued interest receivable and other assets of $170.8 million. Net operating cash inflows for 2018 benefited from $150.4 million in noncash adjustments to reconcile net income to net operating cash, as well as net changes in accrued expenses and other liabilities of $88.1 million, partially offset by net changes in accrued interest receivable and other assets of $60.8 million.this Form 10-K.
Investing Activities — Net cash used in investing activities was $6.85 billion, $2.57 billion and $3.83 billion in 2020, 2019 and 2018, respectively. During 2020, net cash used in investing activities primarily reflected cash outflows of $3.62 billion from loans held-for-investment, $2.16 billion from AFS debt securities, $577.6 million from interest-bearing deposits with banks, $350.0 million from resale agreements, and $154.9 million from investments in qualified affordable housing partnerships, tax credit and other investments. In comparison, during 2019, net cash used in investing activities primarily reflected cash outflows of $2.42 billion from loans held-for-investment, $521.2 million from AFS debt securities, and $146.9 million from investments in qualified affordable housing partnerships, tax credit and other investments. These investing cash outflows were partially offset by cash inflows of $325.0 million from resale agreements and $193.5 million from interest-bearing deposits with banks. During 2018, net cash used in investing activities primarily reflected $3.43 billion increase in net loans held-for-investment, a $503.7 million payment for the sale of the Bank’s eight DCB branches to Flagstar Bank, and $132.6 million in net funding of investments in qualified affordable housing partnerships, tax credit and other investments, partially offset by $217.7 million of net cash inflows from AFS debt securities.
Financing Activities —Net cash provided by financing activities was $6.91 billion, $2.12 billion and $3.80 billion in2020, 2019 and 2018, respectively. During 2020, net cash provided by financing activities primarily reflected net increases of $7.48 billion in deposits, and $1.44 billion in PPPLF advances, partially offset by $1.44 billion repayment of PPPLF advances, $158.7 million net repayment in repurchase agreements, $158.2 million in cash dividends paid, $146.0 million in shares repurchased, and $95.0 million net repayment in FHLB advances. In comparison, net cash inflows in 2019 primarily reflected net increases of $1.90 billion in deposits and $418.0 million in FHLB advances, partially offset by $155.1 million in cash dividends paid. Net cash inflows in 2018 primarily reflected net increases in deposits of $3.90 billion, partially offset by cash dividends paid of $126.0 million.
Market Risk Management
Market risk isrefers to the risk that the Company’s financial condition may change resulting fromof potential loss due to adverse movements in market rates or pricesrisk factors, including interest rates, foreign exchange rates, commodity prices, and credit spreads. The Company is primarily exposed to interest rate contracts, investment securities prices, credit spreads,risk through its core business activities of extending loans and related risk resulting from mismatches in rate sensitive assets and liabilities. In the event of market stress, the risk could have a material impact on our results of operations and financial condition.
acquiring deposits. The Board’s Risk Oversight Committee of the Company’s Board of Directors has primary oversight responsibility. At the management level,responsibility and has given the ALCO the task of market risk management. The ALCO establishes guidelines, risk measures and limits, and monitors compliance with the policies and risk limits pertaining to market risk management activities. Corporate Treasury supports the ALCO in measuring, monitoring and managing interest rate risk as well as all other market risks.
Interest Rate Risk Management
Interest rate risk results primarily from the Company’s traditional banking activities of gathering deposits and extending loans; it is the primaryrisk that market risk for the Company. Economic and financial conditions, movements in interest rates, and consumer preferences impact the level of noninterest-bearing funding sources at the Company, as well as affect the difference between the interest the Company earns on interest-earning assets and pays on interest-bearing liabilities. In addition, changesfluctuations in interest rates can influencehave a negative impact on the Company’s earnings and capital stemming from mismatches in the Company’s asset and liability cash flows primarily arising from customer-related activities such as lending and deposit-taking. The Company is subject to interest rate of principal prepayments on loansrisk because:
•Assets and liabilities may mature or reprice at different times. If assets reprice faster than liabilities and interest rates are generally rising, earnings will initially increase;
•Assets and liabilities may reprice at the speed of deposit withdrawals. Due to the pricing term mismatchessame time but by different amounts;
•Short- and the embedded options inherent in certain products, changes inlong-term market interest rates not onlymay change by different amounts. For example, the shape of the yield curve may affect expected near-term earnings, but also the economicyield of new loans and funding costs differently;
•The remaining maturity of various assets or liabilities may shorten or lengthen as interest rates change. For example, if long-term mortgage interest rates increase sharply, mortgage-related products may pay down at a slower rate than anticipated, which could impact portfolio income and valuation; or
•Interest rates may have a direct or indirect effect on loan demand, collateral values, mortgage origination volume, and the fair value of these interest-earning assets and interest-bearing liabilities. Other market risks include foreign currency exchange risk and equity price risk. These risks are not considered significant to the Company and no separate quantitative information concerning these risks is presented herein.other financial instruments.
With oversight by the Company’s Board of Directors, theThe ALCO coordinates the overall management of the Company’s interest rate risk. The ALCOrisk, meets regularly and is responsible for reviewingto review the Company’s open market positions and establishingestablishes policies to monitor and limit exposure to market risk. Management of interestInterest rate risk management is carried out primarily through strategies involving the Company’s loan portfolio, debt securities portfolio, loan portfolio, available funding channels and capital market activities. In addition, the Company’s policies permit the use of derivative instruments to assist in managing interest rate risk.
TheWe measure and monitor interest rate risk exposure is measured and monitored through various risk management tools, which include a simulation model that performs interest rate sensitivity analyses under multiple interest rate scenarios.scenarios against a baseline. The simulation model incorporates the Company’s cash instruments, loans, debt securities, resale agreements, deposits, borrowingsmarket’s forward rate expectations and repurchase agreements, as well as financial instruments from the Company’s foreign operations.earning assets and liabilities. The Company uses both a static balance sheet and a forward growth balance sheet to perform thesethe interest rate sensitivity analyses. The simulated interest rate scenarios include aan instantaneous non-parallel shift in the yield curve (“rate shock”) and a gradual non-parallel shift in the yield curve (“rate ramp”). In addition, the Company also performs simulations using other alternative interest rate scenarios, including various permutations of the yield curve flattening, steepening or inverting. ResultsThe Company uses the results of these various simulations are used to formulate and gauge strategies to achieve a desired risk profile within the Company’sits capital and liquidity guidelines.
The net interest income simulation model is based on the actual maturity and repricing characteristics of the Company’s interest-rateinterest rate sensitive assets, liabilities, and related derivative contracts. ItThis model also incorporates various assumptions, which management believes to be reasonable but that may have a significant impact on the results. These key assumptions include but are not limited to, the timing and magnitude of changes in interest rates, the yield curve evolution and shape, the correlation between various interest rate indices, financial instrumentinstruments’ future repricing characteristics and spread relative to benchmark rates, and the effect of interest rate floors and caps. The modeled results are highly sensitive to deposit decay and deposit beta assumptions, which are derivedwe derive from a regression analysis of the Company’s historical deposit data. Deposit beta commonly refers to the correlation of the changes in interest rates paid on deposits to changes in benchmark market interest rates. The model is also sensitive to the loan and investment prepayment assumptions, based on an independent model and the Company’s historical prepayment data, which consider anticipated prepayments under different interest rate environments.
Simulation results are highly dependent on modeled behaviors and input assumptions. To the extent that actual behavior isbehaviors are different from the assumptions used in the models, there could be a material change inchanges to the interest rate sensitivity.sensitivity results. The key behavioral models impacting interest rate sensitivity simulations include deposit repricing, deposit balance forecasts, and mortgage prepayments. These models and assumptions applied in the model are documented, and supported, for reasonableness, and periodically back-tested to assess theirthe reasonableness and effectiveness. The Company also regularly monitors the sensitivity of the other important modeling assumptions, such as loan and security prepayments and early withdrawal on fixed-rate customer liabilities. The Company makes appropriate calibrations to the model as needed and continually refiningvalidates the model, methodology and results. Changes to key model assumptions are reviewed by the ALCO. Scenario results do not reflect strategies that the management could employ to limit the impact of changing interest rate expectations. The simulation does not represent a forecast of the Company’s net interest income but is a tool utilized to assess the risk of the impact of changing market interest rates across a range of interest rate environments.
Since the federal funds rate range was loweredThe Company employs a variety of quantitative and qualitative approaches to near zero in March 2020capture historical deposit repricing and balance behaviors. These historical observations are performed at a granular level based on key product characteristics, including distinctions for brokered, public, and large commercial deposits, which are then combined with forward-looking market expectations and the Federal Reserve has committedcompetitive landscape to generate the deposit repricing and balance forecasting models. The Company uses these deposit repricing models to forecast deposit interest expense. The repricing models provide sufficient granularity to reflect key behavioral differences across product and customer types. The deposit beta is a key parameter of the deposit rate forecast. The deposit beta defines the sensitivity of deposit rates to changes in the Effective Fed Funds Rate (“EFFR”).
The Company recalibrated its resourcesdeposit repricing models and betas in December 2022, and qualitatively increased the long run (through the cycle) betas during 2023 to supportbetter reflect increased competition and higher terminal fed funds rates than previously observed in the financial markets, businesses, and state and local governments, it is not expected that rates will decline further, nor is it expected that rates will enter intohistorical data. Overall, the negative territory. Consequently,Company observed a weighted-average increase of approximately 17% during the simulation results for the downward interest rate scenariosyear to total deposit beta of 51% as of December 31, 20202023. These increases reflected the Company’s forward-looking views of deposit rates given the expected EFFR at the time. The Company also modified deposit balance runoff models in December 2022, to better capture behavioral differences across product and customer types and carved out stable and non-stable balances to reflect the volatility and interest rate sensitivity of such deposit balances. The assumptions used for the identification of stable balances were updated in June and September 2023 to reflect a larger portion of potential non-stable balances. The assumptions for the identification of stable balances had no significant updates in December 2023.
Additionally, to reflect changes in interest expense due to the shift from noninterest-bearing to interest-bearing accounts in the deposit mix, the Company utilized a qualitative assumption in March 2023. This assumption considered the amount of surplus noninterest-bearing deposits assumed to be rate sensitive and migrated them to interest-bearing deposits. This assumption was included in the net interest income volatility simulations to reflect more realistic net interest income volatility in rising rate scenarios. The qualitative assumption was enhanced in June 2023 with a more robust quantitative approach. This updated approach incorporated internally observed historical data reflecting the evolution of noninterest-bearing deposits as a percent of total deposits, based on the historical behavior observed during the prior rising interest rate cycle. The assumption forecasts that a portion of noninterest-bearing deposits would migrate to interest-bearing certificates of deposits as the 12-month moving average of the overnight indexed swap rate increases. No further enhancements to the deposit mix assumption were made in December 2023.
In the net interest income simulations, the Company also makes assumptions on the yield related to the re-investment of investment securities and the yields on new loan originations. These assumptions are updated quarterly to reflect recent market conditions as well as forward-looking expectations but generally do not provided.have significant impact to NII sensitivity. During 2023, loans and deposits with cash flows indexed to China related benchmark interest rates were removed from the interest rate scenario shocks. The associated change to the net interest income sensitivity was insignificant.
As loan and security prepayment assumptions are key components of the Company’s model, the Company incorporates third-party vendor models to forecast prepayment behavior on mortgage loans and securities which have mortgage loans as underlying collateral. These third-party vendor models have access to more comprehensive industry-level data which can capture specific borrower and collateral characteristics over a variety of interest rate cycles. The Company will periodically assess and adjust the vendor models when appropriate to include its own available observations and expectations. During 2023, the Company updated its version of the asset liability management simulation tool and vendor prepayment model. This change updated the calibration of the vendor model to better fit recent data and better supported the transition from London Interbank Offered Rate (“LIBOR”) to Secured Overnight Financing Rate (“SOFR”) indexed loans. Overall, the update had minimal impact on forecasted prepayments. During 2023, the Company updated the vendor prepayment model tuning factors to slow down prepayment speeds on single-family residential mortgages so that it better aligned with actual and expected prepayments.
During the third quarter of 2023, the Company replaced the U.S. dollar (“USD”) LIBOR Swap curve and rates with the respective SOFR Swap and SOFR reference rates. This change had a minimal impact on the overall results of net interest income and economic value of equity (“EVE”) simulations as the overall yields and discount rates were not impacted.
Twelve-Month Net Interest Income Simulation
Net interest income simulation modeling looks atmeasures interest rate risk through earnings. Itearnings volatility. The simulation projects the cash flow changes in interest rate sensitive assetassets and liability cash flows,liabilities, expressed in terms of net interest income, over a specified time horizon for defined interest ratesrate scenarios. Net interest income simulations generateprovide insight into the impact of market ratesrate changes on earnings, andwhich help guide risk management decisions. The Company assesses interest rate risk by comparing the changes of net interest income usingin different interest rate scenarios.
The federal funds rate range was between 0.00% and 0.25% as of December 31, 2020 and between 1.50% and 1.75% as of December 31, 2019. After lowering the range to between 0.00% and 0.25% in March 2020, the Federal Open Market Committee (“FOMC”) pledged to maintain monetary support for the economy. Moreover, in December 2020, acknowledging the uncertain and likely lengthy path to a full post-pandemic economic recovery, the majority of FOMC members projected that the federal funds rate range will likely remain unchanged through 2023.The FOMC statement indicated that the federal funds target rate will remain unchanged until maximum employment has been reached and inflation rises to and remains at 2% for some time.
The following table presents the Company’s net interest income sensitivity related to an instantaneous and sustained non-parallel shift in market interest rates ofby 100 and 200 basis points in an upward directionbps as of December 31, 20202023 and in both directions as2022, on a balance sheet assuming flat forward rates and flat loan and deposit growth on the date of December 31, 2019.analysis. The non-parallel shift scenarios were calibrated internally based on historical analysis.
| | | | | | | | | | | | | | |
|
Change in Interest Rates
(Basis Points) | | Net Interest Income Volatility (1) |
| December 31, |
| 2020 | | 2019 |
| +200 | | 12.6 | % | | 13.2 | % |
| +100 | | 5.6 | % | | 6.7 | % |
| -100 | | NM | | (5.5) | % |
| -200 | | NM | | (8.7) | % |
|
NM — Not meaningful. | | | | | | | | | | | | | | | | | | |
|
| | | | Net Interest Income Volatility (1) |
| | | | December 31, |
| | | | 2023 | | | | 2022 |
| Change in Interest Rates (in bps) | | | | % | | | | % |
| +200 | | | | 1.3 | % | | | | 11.6 | % |
| +100 | | | | 1.2 | % | | | | 5.9 | % |
| -100 | | | | (1.8) | % | | | | (5.3) | % |
| -200 | | | | (4.1) | % | | | | (8.6) | % |
|
(1)The percentage change represents net interest income change over 12 monthsa 12-month period in a stable interest rate environment versus net interest income in the various interest rate scenarios.
The composition of the Company’s loan portfolio creates sensitivity to interest rate movements due to a mismatch of repricing behavior between the floating-rate loan portfolio and deposit products. In the table above, net interest income volatility expressed in relation to base-case net interest income decreased as of December 31, 2023. This decrease reflected updates to the deposit repricing assumptions and deposit product mix. Noninterest-bearing deposit account balances are assumed to be sensitive to interest rate levels and migrate to interest-bearing deposit accounts.
The Company also models scenarios based on gradual shifts in interest rates and assesses the corresponding impacts. These interest rate scenarios provide additional information to estimate the Company’s underlying interest rate risk. The rate ramp table below shows the net interest income volatility under a gradual non-parallel shift of the yield curve, in even monthly increments over the first 12 months, followed by rates held constant thereafter based on a flat balance sheet as of the date of the analysis.
| | | | | | | | | | | | | | | | | | |
|
| | | | Net Interest Income Volatility |
| | | | December 31, |
| | | | 2023 | | | | 2022 |
| Change in Interest Rates (in bps) | | | | % | | | | % |
| +200 Rate ramp | | | | 0.8 | % | | | | 6.3 | % |
| +100 Rate ramp | | | | 0.5 | % | | | | 3.4 | % |
| -100 Rate ramp | | | | (0.6) | % | | | | (2.4) | % |
| -200 Rate ramp | | | | (1.3) | % | | | | (4.9) | % |
|
As of December 31, 2023, the Company’s net interest income profile as of December 31, 2020 reflects ana modestly asset sensitive position.position, where assets reprice faster or more significantly than liabilities. Net interest income would beis expected to increase ifwhen interest rates rise and to decrease if interest rates decline. The potential impact of rate decreases is somewhat muted due toas the current low rate environment with the federal funds rate floored and the federal funds rate range between 0.00% and 0.25%. The Company is naturally asset sensitive due to thehas a large sharepopulation of variable rate loans, in its loan portfolio, which are primarily linkedtied to Prime and LIBORTerm SOFR indices. The Company’s interest income is vulnerablesensitive to changes in short-term interest rates. As of December 31, 2023However, given, the current low levelCompany designated interest rate contracts with a notional amount of $5.3 billion as cash flow hedges, which reduced net interest rates,income volatility by approximately 1.6% of the potentialbase net interest income for furtherevery 100 bps change in interest rate decreases is limited which reduces the Bank’s exposure to risks associated with falling rates. .
The Company’s deposit portfolio is primarily comprisedcomposed of non-maturity deposits, which are not directly tied to short-term interest rate indices, but are, nevertheless, sensitive to changes in short-term interest rates.
The Company’s estimated twelve-monthmodeled results are highly sensitive to modeled behavior and assumptions. Actual net interest income sensitivity as of December 31, 2020 was lower thanresults may deviate from the sensitivity as of December 31, 2019 under both higher rate scenarios. This reflects reduced upward repricing in the Company’s rate sensitive assets due to a higher proportion of floating rate loans at rate floors under a near-zero interest rate environment, as compared with the proportion at rate floors as of December 31, 2019.
While an instantaneous and sustained non-parallel shift in market interest rates was used in the simulation model described in the preceding paragraphs, the Company believes that any shift in interest rates would likely be more gradual and would therefore have a more modest impact. The rate ramp table below shows the net income volatility under a gradual non-parallel shift of the yield curve upward and downward, in even quarterly increments over the first 12 months, followed by rates held constant thereafter:
| | | | | | | | | | | | | | |
|
Change in Interest Rates
(Basis Points) | | Net Interest Income Volatility (1) |
| December 31, |
| 2020 | | 2019 |
| +200 Rate Ramp | | 4.9 | % | | 6.0 | % |
| +100 Rate Ramp | | 2.2 | % | | 3.0 | % |
| -100 Rate Ramp | | NM | | (2.6) | % |
| -200 Rate Ramp | | NM | | (5.1) | % |
|
NM — Not meaningful.
(1)The percentage change representsmodel’s net interest income underdue to earning asset growth variation and deposit mix changes based on customer preferences relative to the interest rate environment. During a gradual non-parallel shift in even quarterly increments over 12 months.
The Company believes that the rate ramp table, shown above, when evaluated together with the resultsperiod of the rate shock simulation, presents a more meaningful indication of the potential impact of risingdeclining interest rates, balance sheet growth could offset headwinds to the Company’s twelve-month net interest income. During 2020, the Company’s modeled asset sensitivity decreased under a ramp simulation for the higher interest rate scenarios.income from yield compression.
Economic Value of Equity at Risk
Economic value of equity (“EVE”)EVE is a cash flow calculation that takes the present value of all asset cash flows and subtracts the present value of all liability cash flows. This calculation is used for asset/liability management and measures changes in the economic value of the bank. The fair market values of a bank'sbank’s assets and liabilities are directly linkeddue to changes in interest rates.
The economic value approach provides a comparatively broader scope than the net interest income volatility approach since it captures all anticipated cash flows.
EVE simulation reflectsrepresents the effect of interest rate shifts on thediscounted present value of cash flows over the Company andexpected life of the instruments. Due to this longer horizon, EVE is useduseful to assess the degree of interest rate risk exposure. In contrast to the earnings perspective, the economic perspective identifiesidentify risks arising from repricing, orprepayment and maturity gaps between assets and liabilities on the balance sheet, as well as from off-balance sheet derivative exposures, over their lifetime. This long-term economic perspective into the lifeCompany’s interest rate risk profile allows the Company to identify anticipated negative effects of interest rate fluctuations. However, the difference in time horizons can cause the EVE analysis to diverge from the shorter-term net interest income analysis presented above. Given the uncertainty of the balance sheet. Changes in economic value indicate anticipated changes inmagnitude, timing and direction of future interest rate movements, the valueshape of the bank’s future cash flows. Thus,yield curve, and potential changes to the economic perspective can provide a leading indicator ofbalance sheet, actual results may vary from those predicted by the bank’s future earnings and capital values. The economic value method also reflects sensitivity across the full maturity spectrum of the bank’s assets and liabilities.Company’s model.
The following table presents the Company’s EVE sensitivity related to an instantaneous and sustained non-parallel shift in market interest rates ofby 100 and 200 basis points in an upward directionbps as of December 31, 20202023 and in both directions as of December 31, 2019:2022. The non-parallel shift scenarios were calibrated internally based on historical analysis.
| | | | | | | | | | | | | | |
|
Change in Interest Rates
(Basis Points) | | EVE Volatility (1) |
| December 31, |
| 2020 | | 2019 |
| +200 | | 9.6 | % | | 7.0 | % |
| +100 | | 4.8 | % | | 3.6 | % |
| -100 | | NM | | (1.4) | % |
| -200 | | NM | | (3.5) | % |
|
NM — Not meaningful. | | | | | | | | | | | | | | | | | | | | |
| | |
| | | | Economic Value of Equity Volatility (1) | | |
| | | | December 31, | | |
| | | | 2023 | | | | 2022 | | |
| Change in Interest Rates (in bps) | | | | % | | | | % | | |
| +200 | | | | (10.3) | % | | | | (6.0) | % | | |
| +100 | | | | (5.4) | % | | | | (2.9) | % | | |
| -100 | | | | 3.0 | % | | | | 1.1 | % | | |
| -200 | | | | 6.0 | % | | | | 2.3 | % | | |
| | |
(1)The percentage change represents net portfolio value change of the Company in a stable interest rate environment versus net portfolio value in the various interest rate scenarios.
The Company’s EVE sensitivity for the upward interest rate scenarios increased asAs of December 31, 2020, compared with2023, the results as of December 31, 2019.Company’s EVE is expected to decrease when interest rates rise. The changeschange in EVE sensitivity during this period were primarilywas due to changes in the levelshorter deposit durations as a result of deposit modeling assumptions, slower prepayments on fixed-rate mortgages and shape of the yield curve,mortgage-backed securities, and an increased proportion of low cost and noninterest-bearing deposits in total deposits.
The Company’s EVE profile as of December 31, 2020 reflects an asset sensitive EVE position under the higheradditional cash flow hedges to reduce net interest rate scenarios. Given the uncertainty of the magnitude, timing and direction of future interest rate movements, and the shape of the yield curve, actual results may vary from those predicted by the Company’s model.income volatility.
Derivatives
It is the Company’s policy not to speculate on the future direction of interest rates, foreign currency exchange rates and commodity prices. However, the Company will periodically enterenters into derivative transactions in order to reducemanage its exposure to market risks,risk, primarily interest rate risk and foreign currency risk. The Company believes that these derivative transactions, when properly structured and managed, may provide a hedge against inherent risk in certain assets and liabilities andor against risk in specific transactions. Hedging transactions may be implemented using a variety of derivative instruments such as swaps, forwards, options and options.collars. The Company uses interest rate swaps to hedge the variability in interest received on certain floating-rate commercial loans and interest paid on certain floating-rate borrowings. Foreign exchange derivatives are used in net investment hedging strategies to mitigate the risk of changes in the USD equivalent value of a designated monetary amount of the Company’s net investment in East West Bank (China) Limited. Prior to entering into any hedgingaccounting hedge activities, the Company analyzes the costs and benefits of the hedge in comparison to alternative strategies. The Company also repositions its hedging derivatives portfolio based on the current assessment of economic and financial conditions, including the interest rate and foreign currency environments, balance sheet composition and trends, and the relative mix of its cash and derivative positions.
In addition, the Company enters into derivative transactions in order to accommodate its customers with their business needs or to assist customers with their risk management objectives, such as managing exposure to fluctuations in interest rates, foreign currencies, and commodity prices. To economically hedge against the derivative contracts entered into with the Company’s customers, the Company enters into mirroredoffsetting derivative contracts with third-party financial institutions.institutions, some of which are cleared through central clearing organizations. The exposures from derivative transactions are collateralized by cash and/or eligible securities based on limits as set forth in the respective agreements entered between the Company and counterparty financial institutions. The fair value changes of the derivative contracts traded with third-party financial institutions are expected to be largely comparable to the fair value changes of the derivative transactions executed with customers throughout the terms of these contracts, except for the credit valuation adjustment component in the contracts and the spread variances between the customer derivatives and the offsetting financial counterparty positions. The Company also utilizes foreign exchange contracts that are not designated as hedging instruments to mitigate the economic effect of fluctuations in certain foreign currency on-balance sheet assets and liabilities, primarily foreign currency denominated deposits offered to its customers.
The Company is subject to credit risk associated with the counterparties to the derivative contracts. This counterparty credit risk is a multi-dimensional form of risk, affected by both the exposure and credit quality of the counterparty, both of which are sensitive to market-induced changes. The Company’s Credit Risk Management Committee provides oversight of credit risksrisk and the Company has guidelines in place to manage counterparty concentration, tenor limits, and collateral. The Company manages the credit risk of its derivative positions by diversifying its positions among various counterparties, by entering into legally enforceable master netting arrangements,agreements and by requiring collateral arrangements, where possible. The Company may also transfer counterparty credit risk-relatedrisk related to interest rate swaps to institutional third partiesthird-party financial institutions through the use of credit risk participation agreements. Certain derivative contracts are required to be centrally cleared through central clearinghouses, to further mitigate counterparty credit risk. Therisk, where variation margin is applied daily as settlement to the fair value of the derivative contracts. In addition, the Company incorporates credit value adjustments and other market standard methodologies to appropriately reflect its own nonperformance riskthe counterparty’s and the respective counterparty’sCompany’s own nonperformance risk in the fair value measurementsmeasurement of its derivatives. As of December 31, 2023, the Company anticipates performance by all its counterparties and has not incurred any related credit losses.
The following table summarizes certain information concerningon derivative financial instruments designated as accounting hedges and utilized by the Company in its management of interest rate risk and foreign currency riskrisks as of December 31, 20202023 and 2019:2022:
| | | | | | | | | | | | | | | | | | | | | | | | | | |
|
| | December 31, |
| ($ in thousands) | | 2020 | | 2019 |
| | Interest Rate Contracts(1) | | Foreign Exchange Contracts | | Interest Rate Contracts(2) | | Foreign Exchange Contracts |
| Derivatives designated as hedging instruments: | | Cash Flow Hedges | | Net Investment Hedges | | Fair Value Hedges | | Net Investment Hedges |
| Notional amounts: | | $ | 275,000 | | | $ | 84,269 | | | $ | 31,026 | | | $ | 86,167 | |
| Fair value: | | | | | | | | |
| Recognized as an asset | | — | | | — | | | — | | | — | |
| Recognized as a liability | | 1,864 | | | 235 | | | 3,198 | | | 1,586 | |
| Net fair value | | $ | (1,864) | | | $ | (235) | | | $ | (3,198) | | | $ | (1,586) | |
| Weighted average interest rates: | | | | | | | | |
| Pay fixed (receive floating) | | 0.483%
(3-month USD-LIBOR) | | NM | | NM | | NM |
| Weighted average remaining term to maturity (in months): | | 25.8 | | | 2.6 | | | 165.1 | | | 2.7 | |
| Derivatives not designated as hedging instruments: | | Interest Rate Contracts | | Foreign Exchange Contracts | | Interest Rate Contracts | | Foreign Exchange Contracts |
| Notional amounts: | | $ | 18,155,678 | | | $ | 3,108,488 | | | $ | 15,489,692 | | | $ | 4,839,661 | |
| Fair value: | | | | | | | | |
| Recognized as an asset | | 489,132 | | 30,300 | | 192,883 | | 54,637 |
| Recognized as a liability | | 315,834 | | 22,524 | | 124,119 | | 47,024 |
| Net fair value | | $ | 173,298 | | | $ | 7,776 | | | $ | 68,764 | | | $ | 7,613 | |
|
| | | | | | | | | | | | | | | | | | | | | | | | | | |
|
| | December 31, 2023 | | December 31, 2022 |
| ($ in thousands) | | Interest Rate Contracts Hedging Loans (1) | | Interest Rate Contracts Hedging Borrowings (2) | | Interest Rate Contracts Hedging Loans (1) | | Interest Rate Contracts Hedging Borrowings (2) |
| Cash flow hedges | | | | | | | | |
| Notional amount | | $ | 4,000,000 | | (3)(4) | $ | — | | | $ | 3,000,000 | | (3) | $ | 200,000 | |
| Weighted average: | | | | | | | | |
| Receive rate | | 4.95 | % | | NA | | 4.91 | % | | 3.83 | % |
| Pay rate | | 7.32 | % | | NA | | 6.23 | % | | 0.48 | % |
| Remaining term (in months) | | 35.8 | | | NA | | 46.6 | | | 3.2 | |
| | | | | | | | |
| | | | | | | | |
| ($ in thousands) | | Foreign Exchange Contracts | | Foreign Exchange Contracts |
| Net investment hedges | | | | | | | | |
| Notional amount | | $ | 81,480 | | | | $ | 84,832 | | |
Hedged percentage (5) | | 44 | % | | | | 44 | % | | |
| Remaining term (in months) | | 2.7 | | | | 2.6 | | |
|
NM NA — Not meaningful.applicable.
(1)AsRepresents receive-fixed/pay-floating interest rate swaps and excludes interest rate collars. Floating rates paid are based on SOFR, or Prime.
(2)Represents receive-floating/pay-fixed interest rate swaps. Floating rate received was based on three-month LIBOR. The hedge was terminated during the first quarter of 2023.
(3)Excludes interest rate collars in total notional amount of $250 million as of both December 31, 2020, there2023 and 2022.
(4)Excludes forward-starting swaps in total notional amount of $1.0 billion, which were no interest rate contracts designated as fair value hedges. The interest rate contracts designated as fair value hedgesnot effective as of December 31, 2019 were dedesignated when the certificates of deposits were called during 2020.2023.
(2)(5)AsRepresents percentage between the notional of December 31, 2019, there were no interest rate contracts designated as cash flow hedges.
Derivatives Designated as Hedging Instruments — Interest rate andoutstanding foreign exchange derivative contracts are utilized in our asset and liability management activities and serve as an efficient tool to manage the Company’s interest rate risk and foreign exchange risk. We use derivatives to hedge the risk of variable cash flows that the Company is exposed tonet RMB exposure from its variable interest rate borrowings, including repurchase agreements and FHLB advances. The Company also uses derivatives to hedge the risk of changes in the USD equivalent value of a designated monetary amount of the Company’s net investment in East West Bank (China) Limited. For both cash flow and net investment hedges, the change in the fair value of the hedging instruments is recognized in AOCI, net of tax, on the Consolidated Balance Sheet.
The fluctuation in foreign currency translation of the hedged exposure is expected to be offset by changes in the fair value of the forwards. As of December 31, 2020, the outstanding foreign currency forwards effectively hedged approximately 50% of the RMB exposure in East West Bank (China) Limited.
Changes to the composition of the Company’s derivatives designated as hedging instruments during 2020 reflect actions taken for interest rate risk and foreign exchange rate risk management. The decisions to reposition our derivatives portfolio are based on the current assessment of economic and financial conditions, including the interest rate and foreign currency environments, balance sheet composition and trends, and the relative mix of our cash and derivative positions.
Derivatives Not Designated as Hedging Instruments — The Company enters into interest rate, foreign exchange and energy commodity contracts to support the business requirements of its customers. When derivative transactions are executed with its customers, the derivative contracts are offset by paired trades with third-party financial institutions. The Company may enter into derivative contracts that are either exchange-traded, centrally cleared through a clearinghouse or over-the counter.
The Company offers various interest rate derivative contracts to its customers. For the interest rate contracts entered into with its customers, the Company managed its interest rate risk by entering into offsetting interest rate contracts with third-party financial institutions including with central clearing organizations. Certain derivative contracts entered with central clearing organizations are settled-to-market daily to the extent the central clearing organizations’ rulebooks legally characterize the variation margin as settlement. Derivative contracts allow borrowers to lock in attractive intermediate and long-term fixed rate financing while not increasing the interest rate risk to the Company. These transactions are not linked to specific Company assets or liabilities on the Consolidated Balance Sheet, or to forecasted transactions in a hedging relationship, and are therefore economic hedges. The contracts are marked-to-market at each reporting period. The changes in fair values of the derivative contracts traded with third-party financial institutions are expected to be largely comparable to the changes in fair values of the derivative transactions executed with customers throughout the terms of these contracts, except for the credit valuation adjustment component. The Company records credit valuation adjustments on derivatives to properly reflect the variances of credit worthiness between the Company and the counterparties, considering the effects of enforceable master netting agreements and collateral arrangements.
The Company enters into foreign exchange contracts with its customers, consisting of forward, spot, swap and option contracts to accommodate the business needs of its customers. For the foreign exchange contracts entered into with its customers, the Company managed its foreign exchange and credit exposures by entering into offsetting foreign exchange contracts with third-party financial institutions and/or entering into bilateral collateral and master netting agreements with customer counterparties. The changes in the fair values entered with third-party financial institutions are expected to be largely comparable to the changes in fair values of the foreign exchange transactions executed with the customers throughout the terms of these contracts. As of December 31, 2020, the Company anticipates performance by all counterparties and has not experienced nonperformance by any of its counterparties, and therefore did not incur any related losses. The Company also utilizes foreign exchange contracts that are not designated as hedging instruments to mitigate the economic effect of fluctuations in certain foreign currency on-balance sheet assets and liabilities, primarily foreign currency denominated deposits offered to its customers. The Company’s policies permit taking proprietary currency positions within approved limits, in compliance with exemptions to proprietary trading restrictions provided under Section 619 of the Dodd-Frank Act, or the Volcker Rule. The Company does not speculate in the foreign exchange markets, and actively manages its foreign exchange exposures within prescribed risk limits and defined controls.
The Company enters into energy commodity contracts with its customers to allow them to hedge against the risk of fluctuation in energy commodity prices. To economically hedge against the risk of fluctuation in commodity prices in the products offered to its customers, the Company enters into offsetting commodity contracts with third-party financial institutions, including with central clearing organizations. Certain derivative contracts entered into with central clearing organizations are settled to market daily, to the extent the central clearing organizations’ rulebooks legally characterize the variation margin as settlement. The changes in fair values of the energy commodity contracts traded with third-party financial institutions are expected to be largely comparable to the changes in fair values of the energy commodity transactions executed with customers throughout the terms of these contracts.
Additional information on the Company’s derivatives is presented in Note 1 — Summary of Significant Accounting Policies—Policies — Significant Accounting Policies — Derivatives, Note 2 — Fair Value Measurement and Fair Value of Financial Instruments, and Note 5 — Derivatives to the Consolidated Financial Statements in this Form 10-K.
Impact of Inflation
The consolidated financial statements and related financial data presented in this report have been prepared according to GAAP, which require the measurement of financial and operating results in terms of historical dollars without considering the change in the relative purchasing power of money over time due to inflation. The primary impact of inflation on our operations is reflected in increased operating costs and in the effect that inflation may have on both short-term and long-term interest rates. Since almost all the assets and liabilities of a financial institution are monetary in nature, interest rates generally have a more significant impact on a financial institution's performance than inflation. While inflation expectations do affect interest rates, interest rates do not necessarily move in the same direction, or to the same extent, as the prices of goods and services.
Critical Accounting Policies and Estimates
The Company’s significant accounting policies and useare described in Note 1 — Summary of Significant Accounting Policies to the Consolidated Financial Statements in this Form 10-K. Certain of these policies include critical accounting estimates, which are fundamentalsubject to understanding its results of operations and financial condition. Some accounting policies, by their nature,valuation assumptions, subjective or complex judgments about matters that are inherently subject to estimation techniques, valuationuncertain, and it is likely that materially different amounts could be reported under different assumptions and other subjective assessments. In addition, some significant accounting policies require significant judgments in applying complex accounting principles to individual transaction and determining the most appropriate treatment.conditions. The Company has procedures and processes in place to facilitate making these judgments. The following is a brief description of the Company’s critical accounting estimates involving significant judgments.
Certain accounting policies are considered to have a critical effect on
Allowance for Credit Losses
The Company’s allowance for credit losses represents management’s estimate of expected credit losses over the remaining expected life of the Company’s financial assets measured at amortized cost, including loans and certain lending-related commitments. The allowance for credit losses involves significant judgment on a number of matters including development and weighting of macroeconomic forecasts, incorporation of historical loss experience, assessment of key credit risk characteristics, assignment of risk ratings, valuation of collateral, and the determination of remaining expected life. For additional information on these judgements and the Company’s policies and methodologies used to determine the allowance for credit losses, see Note 1— Summary of Significant Accounting Policies — Significant Accounting Policies — Allowance for Loan Losses and Unfunded Credit Commitments,and Note 6— Loans Receivable and Allowance for Credit Losses to the Consolidated Financial Statements. Critical accounting policies are defined as those that requireStatements in this Form 10-K.
A critical judgement in the most complex or subjective judgments and are reflective of significant uncertainties, and whose actual results could differ fromprocess is estimating the Company’s estimates. Futureallowance for credit losses related to macroeconomic forecasts that are incorporated into quantitative methods. As any one economic outlook is inherently uncertain, the Company utilizes a baseline and upside or downside scenarios which are applied based on a probability weighting, to better reflect management’s estimate of the expected credit losses given existing market conditions and the changes in the economic environment. Changes in the Company’s assumptions and economic forecasts could significantly affect its estimate of expected credit losses, which could potentially lead to significant changes in the estimate from one reporting period to the next. For further discussion on the economic forecast incorporated into the 2023 model, see Item 7. MD&A — Risk Management — Credit Risk Management — Allowance for Credit Losses.
The allowance for credit losses is sensitive to changes in macroeconomic forecast assumptions. Given the dynamic relationship between macroeconomic variables within the Company’s models, it is difficult to estimate the impact of a change in any one factor or input on the allowance. Changes in the factors and inputs considered may not occur at the same rate and may not be consistent across all geographies or product types, and changes in factors and input may be directionally inconsistent, such that improvement in one factor may offset deterioration in others. However, to provide additional context regarding the sensitivity of the allowance for credit losses to changes in key variables, could change future valuations and impact the results of operations. The following accounting policies are criticalCompany compared the quantitative modeled estimate when applying a 100% probability weighting to the Company’s Consolidated Financial Statements as they require managementdownside scenario rather than the weighting of multiple scenarios used to make subjectiveestimate the allowance for credit losses at December 31, 2023. Without considering model overlays and complex judgments about matters that are inherently uncertain where actual resultsqualitative adjustments which could differresult in a materially fromdifferent estimate, this sensitivity analysis would have been approximately $343 million higher.
This analysis demonstrates the Company’s estimates. In each area,sensitivity to the Company has identified the most important variablesallowance for credit losses to key quantitative assumptions and is not intended to estimate changes in the estimation process. The Company has usedoverall allowance for credit losses as it does not capture all the best information available to makepotential unknown variables that could arise in the estimations necessaryforecast period, but it provides an approximation of a possible outcome under hypothetical severe conditions. Management believes that the estimate for the related assetsallowance for credit losses was reasonable and liabilities.appropriate as of December 31, 2023.
Fair Value Estimates
Certain financial instruments are carried at fair value on the Consolidated Balance Sheet on a recurring basis, including AFS debt securities, certain equity securities and derivatives. Changes in fair value are recorded either through earnings or other comprehensive income (loss). Other financial instruments, such as certain individually evaluated loans held-for-investment, loans held-for-sale, investments in qualified affordable housing partnerships, tax credit and other investments, OREO and other nonperforming assets, are not carried at fair value each period but may require nonrecurring fair value adjustments primarily due to application of Financial Instrumentslower of cost or fair value accounting or write-downs of individual assets.
In determining the fair value of financial instruments, the Company uses market prices of the same or similar instruments whenever such prices are available. The Company does not use prices involving distressed sellers in determining fair value. Changes in the market conditions such as reduced liquidity in the capital markets or changes in secondary market activities, may increase variability or reduce the availability of market prices used to determine fair value. If observable market prices are unavailable or impracticable to obtain, then fair value is estimated using modeling techniques such as discounted cash flows analysis. These modeling techniques incorporate management’s assessments regarding assumptions that market participants would use in pricing the asset or the liability, including the risks inherent in a particular valuation technique and the risk of nonperformance. The use of methodologies or assumptions different than those used by the Company could result in different estimates of fair value of financial instruments.
Significant judgment is also required to determine the fair value hierarchy for certain financial instruments. When fair values are based on valuation techniques that require inputs that are both unobservable and significant to the overall fair value measurement, the financial assets and liabilities are classified as Level 3 underof the fair value hierarchy. Total recurring Levelhierarchy established under Accounting Standards Codification (“ASC”) 820-10, Fair Value Measurement.
The following table presents the Company’s assets recorded at fair value and the portion of such assets that are classified within level 3 assets were $273 thousand and $421 thousand as of December 31, 2020 and 2019, respectively, and there were no recurring Level 3 liabilities as of December 31, 2020 and 2019. the fair value hierarchy.
| | | | | | | | | | | | | | | | | | | | | | | | | | | | | | | | |
|
| | December 31, | | | | | | |
| | 2023 | | 2022 | | | | | | |
| ($ in thousands) | | Total Balance (1) | | Level 3 | | Total Balance (1) | | Level 3 | | | | | | |
| Total assets measured at fair value on a recurring basis | | $ | 6,823,916 | | | $ | 336 | | | $ | 6,814,275 | | | $ | 323 | | | | | | | |
| Total assets measured at fair value on a nonrecurring basis | | 46,760 | | | 46,760 | | | 72,614 | | | 72,614 | | | | | | | |
| Total assets measured at fair value | (a) | $ | 6,870,676 | | (b) | $ | 47,096 | | (d) | $ | 6,886,889 | | (f) | $ | 72,937 | | | | | | | |
| Total assets | (c) | $ | 69,612,884 | | | | (e) | $ | 64,112,150 | | | | | | | | | |
| Level 3 assets at fair value as a percentage of total assets | | (b)/(c) | 0.1 | % | | (f)/(e) | 0.1 | % | | | | | | |
| Level 3 assets at fair value as a percentage of total assets at fair value | | (b)/(a) | 0.7 | % | | (f)/(d) | 1.1 | % | | | | | | |
| | | | | | |
(1)Before derivative netting adjustments.
For a complete discussion on the Company’s fair value hierarchy of financial instruments, fair value measurement techniques and assumptions, and the impact on the Consolidated Financial Statements, see Note 1— Summary of Significant Accounting Policies — Significant Accounting Policies — Fair Value and Note 2 — Fair Value Measurement and Fair Value of Financial Instruments to the Consolidated Financial Statements in this Form 10-K.
Allowance for Loan Losses and Unfunded Credit Commitments
On January 1, 2020, the Company adopted ASU 2016-13, Financial Instruments - Credit Losses (Topic 326): Measurement of Credit Losses on Financial Instruments, which requires the measurement of the allowance for credit losses to be based on management’s best estimate of lifetime expected credit losses inherent in the Company’s relevant financial assets. The Company’s lifetime expected credit losses are determined using macroeconomic forecast assumptions and management judgments applicable to and through the expected life of the loan portfolios, and are net of expected recoveries on loans that were previously charged off.
The Company’s allowance for loan losses and the allowance for unfunded credit commitments are calculated with the objective of maintaining a reserve sufficient to absorb losses inherent in our credit portfolio. Management’s determination of the appropriateness of the allowance is based on periodic evaluation of the loan portfolio, lending-related commitments and other relevant factors. This evaluation is inherently subjective as it requires numerous estimates as further discussed below.
The Company develops and documents the allowance for loan losses methodology at the portfolio segment level. The commercial loan portfolio is comprised of C&I, CRE, multifamily residential, and construction and land loans; and the consumer loan portfolio is comprised of single-family residential, HELOCs, and other consumer loans. When similar risk characteristics exist, the Company measures the expected loan losses on a collective pool basis. Lifetime loss rate models have been adopted for the portfolios, which use historical loss rates and forecast economic variables to calculate the expected credit losses for each loan pool. Models consisting of quantitative and qualitative components are designed for each pool to develop the expected credit loss estimate. Quantitative methods consider a variety of factors such as historical loss experience, the current credit quality of the portfolio as well as an economic outlook over the life of the loan. The Company incorporates forward-looking information using macroeconomic scenarios applied over the forecasted life of the loans. These macroeconomic scenarios, which are applied over a reasonable and supportable forecast period, may consist of a base forecast representing management’s review of the most likely outcome, combined with downside and upside scenarios reflecting possible worsening or improving economic conditions. Additionally, the Company utilizes qualitative factors and environmental factors that are not already included in the quantitative models. The Company reviews the existing qualitative factors for appropriateness and examines the portfolio for any new qualitative factors that may be topical or appropriate. As the economy and risks in the loan portfolio change, management recommends adjustments to these factors as appropriate.
When loans do not share risk characteristics, the Company evaluates the expected credit losses on an individual basis if, based on current information and events, it is probable that the Company will be unable to collect all amounts due according to the original contractual terms of the loan agreement. The following three different asset valuation measurement methods are available: (1) the present value of expected future cash flows, (2) the fair value of collateral less costs to sell, and (3) the loan’s observable market price. The allowance for loan losses for collateral-dependent loans is determined based on the fair value of the collateral less costs to sell. For loans that are not collateral-dependent, the Company applies the present value of expected future cash flows valuation or the market value of the loan.
The allowance for unfunded credit commitments includes reserves provided for unfunded loan commitments, letters of credit, SBLCs and recourse obligations for loans sold. For all off-balance sheet instruments and commitments, the unfunded credit exposure is calculated using utilization assumptions based on the Company's historical utilization experience in related portfolio segments. Loss rates are applied to the calculated exposure balances to estimate the allowance for unfunded credit commitments. Other elements such as credit risk factors for loans outstanding, terms and expiration dates of the unfunded credit facilities, and other pertinent information are considered to determine the adequacy of the allowance.
The evaluation of allowance is inherently subjective, as it requires numerous estimates and judgments that are susceptible to revision as more information becomes available. To the extent actual results differ from estimates or management’s judgments, the allowance for credit losses may be greater or less than future charge-offs. As the Company adds new products, increases the complexity of the loan portfolio and expands the geographic coverage, the Company expects to continue to enhance its methodologies to keep pace with the changing credit environment and the size and complexity of the loan portfolio and unfunded credit commitments. Changes in any of the factors cited above could have a significant impact on the allowance for credit loss calculation. For additional information on allowance for credit losses, see Note 1 — Summary of Significant Accounting Policies and Note 6 — Loans Receivable and Allowance for Credit Losses to the Consolidated Financial Statements in this Form 10-K.
Goodwill Impairment
The accounting forvaluation and testing methodologies used in the Company’s analysis of goodwill isimpairment are discussed in Note 1—Summary of Significant Accounting Policies and— Significant Accounting Policies — Goodwill, Note 8 — Goodwill, and Other Intangible Assets Note 17 — Business Segments to the Consolidated Financial Statements in this Form 10-K. 10-K.
The Company assessesperformed its annual goodwill for impairment annually, or more frequently if events or circumstances change that indicatetest on all three reporting units using a potential impairment at the reporting unit level. The Company has the option to perform a qualitative assessmentcombination of goodwill or elect to bypass the qualitative test and proceed directly to a quantitative test. Factors considered in qualitative assessments may include but are not limited to macroeconomic conditions, industryincome and market considerations, financial performance of the respective operating segment and other specific reporting unit considerations. If the qualitative analysis indicates that it is more likely than not that a reporting unit’s fair value is less than its carrying fair value, the Company is requiredapproaches to perform a quantitative assessment to determine if there is goodwill impairment. A quantitative valuation involves determiningestimate the fair value of each reporting unit and comparingunit. The Company concluded that the fair valuegoodwill allocated to its corresponding carrying value. In order to determine thereporting units was not impaired as of December 31, 2023. The fair value of theeach reporting units,unit exceeded its carrying amount and there was no indication of a combined income approach and market approach is used.significant risk of goodwill impairment based on current projections.
Significant judgments are appliedAnalyzing goodwill includes consideration of various factors that continue to evolve and assumptions are made when estimating the fair value of the reporting units. Estimates of fair value are dependent upon various factorsfor which significant uncertainty remains, including estimates of the profitability of the Company’s reporting units, long term growth rates and the estimated market cost of equity.equity, such as the discount rate and price multiples of comparable companies. Imprecision in estimating these factors can affect the estimated fair value of the reporting units. Certain events or circumstances could have a negative effect on the estimated fair value of the reporting units, including declines in business performance, increases in credit losses, as well as deterioration in economic or market conditions and adverse regulatory or legislative changes, which could result in a material impairment charge to earnings in a future period.
In light of the COVID-19 pandemic impact and market volatility, an interim goodwill impairment analysis was conducted as of March 31, 2020. In addition, the Company performed its annual goodwill impairment test on all reporting units as of December 31, 2020. There was no goodwill impairment for its business segments as of March 31, 2020 and December 31, 2020.
Income Taxes
The Company is subject tofiles income tax laws ofreturns in the various tax jurisdictions in which it conducts business and evaluates income tax expense in two components: current and deferred income tax expense. Accrued taxes represent the net estimated amount due to or due from various tax jurisdictions in the current year and deferred tax assets represent amounts available to reduce income taxes payable in future years. The Company’s interpretations of the tax laws, including the U.S., its states and the municipalities, and the tax jurisdictions in Hong Kong and China. The Company estimates incomeChina, are complex and subject to audit by taxing authorities that disputes may occur regarding its view on a tax expense based on amounts expected to be owed to these various tax jurisdictions. The estimated income tax expense or benefit is reported onposition taken by the Consolidated Statement of Income.Company.
Accrued taxes represent the net estimated amount due to or due from various tax jurisdictions and are reported in
Accrued expenses and other liabilities or Other assets on the Consolidated Balance Sheets. In estimating accrued taxes, the Company assesses the appropriate tax treatment of transactions and filing positions after considering statutes, regulations, judicial precedent, and other pertinent information. The income tax laws are complex and subject to different interpretations by the Company and the relevant government taxing authorities. Significant judgment is required in determining the tax accruals and in evaluating the tax positions, including evaluating uncertain tax positions. Changes in the estimate of accrued taxes occur periodically due to changes in tax rates, tax credits, interpretations of tax laws, the status of examinations by the tax authorities, and newly enacted statutory, judicial, and regulatory guidance that could impact the relative merits and risks of tax positions. These changes, when they occur, impact tax expense and can materially affect our operating results and financial condition. The Company reviews its tax positions on a quarterly basis and makes adjustments to accrued taxes as new information becomes available.
Deferred tax assets represent amounts available to reduce income taxes payable in future years. Such assets arise due to temporary differences between the financial accounting basis and the income tax basis of assets and liabilities, as well as from NOL and tax credit carryforwards. The Company regularly evaluates the realizability of deferred tax assets. The available evidence used in connection with the evaluations includes taxable income, potential tax-planning strategies, and projected future reversals of deferred tax items. A valuation allowance is established for deferred tax assets if, based on the weight of available evidence, it is more-likely-than-not that some portion or all of the deferred tax assets will not be realized.
The Company reports a liability for unrecognized tax benefits resulting from uncertain tax positions taken, or expected to be taken, in an income tax return. Uncertain tax positions that meet the more-likely-than-not recognition threshold are measured to determine the amount of benefit to recognize. An uncertain tax position is measured at the largest amount of benefit that management believes has a greater than 50% likelihood of realization upon settlement. Tax benefits not meeting our realization criteria represent unrecognized tax benefits. The Company establishes a liability for potential taxes, interest and penalties related to uncertain tax positions based on facts and circumstances, including the interpretation of existing law, new judicial or regulatory guidance, and the status of tax audits. The Company believes that adequate provisions have been recorded for all income tax uncertainties consistent with ASC 740, Income Taxes as of December 31, 20202023. SeeFor further information on the Company’s accounting for income taxes and significant tax attributes, see Note 1— Summary of Significant Accounting Policies — Significant Accounting Policies — Income Taxes and Note 11 — Income Taxes to the Consolidated Financial Statements in this Form 10-K for additional information on income taxes.10-K.
Recently IssuedAdopted Accounting Standards
For detailed discussion and disclosure on new accounting pronouncements adopted, and recent accounting standards, see Note 1 — Summary of Significant Accounting Policies to the Consolidated Financial Statements in this Form 10-K.
Reconciliation of GAAP to Non-GAAP Financial Measures
To supplement the Company’s Consolidated Financial Statements presented in accordance with U.S. GAAP, the Company uses certain non-GAAP measures of financial performance. Non-GAAP financial measures are not prepared in accordance with, or as an alternative to U.S. GAAP. Generally, a non-GAAP financial measure is a numerical measure of a company’s performance that either excludes or includes amounts, or is subject to adjustments that have such an effect, that are not normally excluded or included in the most directly comparable financial measure that is calculated and presented in accordance with U.S. GAAP. AThe non-GAAP financial measure maymeasures discussed in this Form 10-K are return on average TCE, adjusted efficiency ratio, adjusted diluted EPS, and tangible book value per share. Certain additional non-GAAP financial measures that are components of the foregoing non-GAAP financial measures are also be a financial metric that is not required by GAAP or other applicable requirements.set forth and reconciled in the table below. The Company believes these non-GAAP financial measures, when taken together with the corresponding U.S. GAAP financial measures, provide meaningful supplemental information regarding its performance, and allow comparability to prior periods. These non-GAAP financial measures may be different from non-GAAP financial measures used by other companies, limiting their usefulness for comparison purposes.
During 2020, the Company recorded $10.7 million in recoveries, of which $1.1 million was recorded as an impairment recovery, and $5.1 million in uncertain tax position related to the Company’s investment in DC Solar. In addition, the Company prepaid $150.0 million of repurchase agreements and incurred a debt extinguishment cost of $8.7 million in 2020. During 2019, the Company recorded a $7.0 million impairment charge, reversed $30.1 million of certain previously claimed tax credits and subsequently recovered $1.6 million related to DC Solar. During 2018, the Company sold its eight DCB branches and recognized a pre-tax gain on sale of $31.5 million.
The following tables present the reconciliation of U.S. GAAP to non-GAAP financial measures in 2020, 2019for 2023, 2022 and 2018:2021:
| | | | | | | | | | | | | | | | | | | | | | | | | | | |
|
| ($ and shares in thousands, except per share data) | | | | | Year Ended December 31, |
| | | | | 2020 | | 2019 | | 2018 |
| Net income | (a) | | | | | | $ | 567,797 | | | $ | 674,035 | | | $ | 703,701 | |
Add: Impairment charge related to DC Solar (1) | | | | | | | — | | | 6,978 | | | — | |
Less: Recoveries related to DC Solar (1) | | | | | | | (10,739) | | | (1,583) | | | — | |
| Less: Gain on sale of business | | | | | | | — | | | — | | | (31,470) | |
Tax effect of adjustments (2) | | | | | | | 3,047 | | | (1,595) | | | 9,303 | |
| Add: Reversal of certain previously claimed tax credits related to DC Solar | | | | | | | — | | | 30,104 | | | — | |
| Add: Uncertain tax position recorded in income tax expense related to DC Solar | | | | | | | 5,127 | | | — | | | — | |
| Non-GAAP net income | (b) | | | | | | $ | 565,232 | | | $ | 707,939 | | | $ | 681,534 | |
| | | | | | | | | | | |
| Diluted weighted-average number of shares outstanding | | | | | | | 142,991 | | | 146,179 | | | 146,169 | |
| | | | | | | | | | | |
| Diluted EPS | | | | | | | $ | 3.97 | | | $ | 4.61 | | | $ | 4.81 | |
| | | | | | | | | | | |
| Diluted EPS impact of impairment charge related to DC Solar, net of tax | | | | | | | — | | | 0.03 | | | — | |
| Diluted EPS impact of recoveries related to DC Solar, net of tax | | | | | | | (0.06) | | | (0.01) | | | — | |
| Diluted EPS impact of reversal of certain previously claimed tax credits related to DC Solar | | | | | | | — | | | 0.21 | | | — | |
| Diluted EPS impact of uncertain tax position recorded in income tax expense related to DC Solar | | | | | | | 0.04 | | | — | | | — | |
| Diluted EPS impact of gain on sale of business, net of tax | | | | | | | — | | | — | | | (0.15) | |
| Non-GAAP diluted EPS | | | | | | | $ | 3.95 | | | $ | 4.84 | | | $ | 4.66 | |
| | | | | | | | | | | |
| Average total assets | (c) | | | | | | $ | 48,937,793 | | | $ | 42,484,885 | | | $ | 38,542,569 | |
| Average stockholders’ equity | (d) | | | | | | $ | 5,082,186 | | | $ | 4,760,845 | | | $ | 4,130,822 | |
| ROA | (a)/(c) | | | | | | 1.16 | % | | 1.59 | % | | 1.83 | % |
| Non-GAAP ROA | (b)/(c) | | | | | | 1.16 | % | | 1.67 | % | | 1.77 | % |
| ROE | (a)/(d) | | | | | | 11.17 | % | | 14.16 | % | | 17.04 | % |
| Non-GAAP ROE | (b)/(d) | | | | | | 11.12 | % | | 14.87 | % | | 16.50 | % |
|
| | | | | | | | | | | | | | | | | | | | | | | | | | | |
|
| | | | | Year Ended December 31, |
| ($ in thousands) | | | | | | | 2023 | | 2022 | | 2021 |
| Net income | (a) | | | | | | $ | 1,161,161 | | | $ | 1,128,083 | | | $ | 872,981 | |
| Add: Amortization of core deposit intangibles | | | | | | | 1,763 | | | 1,865 | | | 2,749 | |
| Amortization of mortgage servicing assets | | | | | | | 1,328 | | | 1,425 | | | 1,679 | |
Tax effect of amortization adjustments (1) | | | | | | | (914) | | | (966) | | | (1,274) | |
| Tangible net income (non-GAAP) | (b) | | | | | | $ | 1,163,338 | | | $ | 1,130,407 | | | $ | 876,135 | |
| | | | | | | | | | | |
| | | | | | | | | | | |
| | | | | | | | | | | |
| | | | | | | | | | | |
| | | | | | | | | | | |
| Average stockholders’ equity | (c) | | | | | | $ | 6,482,985 | | | $ | 5,783,025 | | | $ | 5,559,212 | |
| Less: Average goodwill | | | | | | | (465,697) | | | (465,697) | | | (465,697) | |
Average other intangible assets (2) | | | | | | | (6,542) | | | (8,695) | | | (10,535) | |
| Average tangible book value (non-GAAP) | (d) | | | | | | $ | 6,010,746 | | | $ | 5,308,633 | | | $ | 5,082,980 | |
| | | | | | | | | | | |
| ROE | (a)/(c) | | | | | | 17.91 | % | | 19.51 | % | | 15.70 | % |
| Return on average TCE (non-GAAP) | (b)/(d) | | | | | | 19.35 | % | | 21.29 | % | | 17.24 | % |
| | | | | | | | | | | |
|
| | | | | | | | | | | | | | | | | | | | | | | | | | | | |
|
| | | | | | Year Ended December 31, |
| ($ in thousands) | | | | | | | | 2023 | | 2022 | | 2021 |
| Net interest income before provision for (reversal of) credit losses | | (a) | | | | | | $ | 2,312,254 | | | $ | 2,045,881 | | | $ | 1,531,571 | |
| Total noninterest income | | | | | | | | 295,264 | | | 298,666 | | | 285,895 | |
| Total revenue | | (b) | | | | | | $ | 2,607,518 | | | $ | 2,344,547 | | | $ | 1,817,466 | |
| Noninterest income | | | | | | | | $ | 295,264 | | | $ | 298,666 | | | $ | 285,895 | |
Add: Net loss on AFS debt security (3) | | | | | | | | 6,862 | | | — | | | — | |
| | | | | | | | | | | | |
| Adjusted noninterest income (non-GAAP) | | (c) | | | | | | 302,126 | | | 298,666 | | | 285,895 | |
| Adjusted revenue (non-GAAP) | | (a)+(c)=(d) | | | | | | $ | 2,614,380 | | | $ | 2,344,547 | | | $ | 1,817,466 | |
| | | | | | | | | | | | |
| Total noninterest expense | | (e) | | | | | | $ | 1,022,748 | | | $ | 859,393 | | | $ | 796,089 | |
| Less: Amortization of tax credit and other investments | | | | | | | | (120,299) | | | (113,358) | | | (122,457) | |
| Amortization of core deposit intangibles | | | | | | | | (1,763) | | | (1,865) | | | (2,749) | |
FDIC charge (4) | | | | | | | | (69,986) | | | — | | | — | |
Repurchase agreements’ extinguishment cost (5) | | | | | | | | (3,872) | | | — | | | — | |
| Adjusted noninterest expense (non-GAAP) | | (f) | | | | | | $ | 826,828 | | | $ | 744,170 | | | $ | 670,883 | |
| | | | | | | | | | | | |
| Efficiency ratio | | (e)/(b) | | | | | | 39.22 | % | | 36.65 | % | | 43.80 | % |
| Adjusted efficiency ratio (non-GAAP) | | (f)/(d) | | | | | | 31.63 | % | | 31.74 | % | | 36.91 | % |
|
| | | | | | | | | | | | | | | | | | | | | | | | | | | |
|
| | | | | Year Ended December 31, |
| ($ and shares in thousands, except per share data) | | | | | | | 2023 | | 2022 | | 2021 |
| Net income | (a) | | | | | | $ | 1,161,161 | | | $ | 1,128,083 | | | $ | 872,981 | |
Add: FDIC charge (4) | | | | | | | 69,986 | | | — | | | — | |
Net loss on AFS debt security (3) | | | | | | | 6,862 | | | — | | | — | |
Tax effect of adjustment (1) | | | | | | | (22,716) | | | — | | | — | |
| Adjusted net income (non-GAAP) | (b) | | | | | | $ | 1,215,293 | | | $ | 1,128,083 | | | $ | 872,981 | |
| | | | | | | | | | | |
| Diluted weighted-average number of shares outstanding | (c) | | | | | | $ | 141,902 | | | $ | 142,492 | | | $ | 143,140 | |
| Diluted EPS | (a)/(c) | | | | | | 8.18 | | | 7.92 | | | 6.10 | |
Add: FDIC charge (4) | | | | | | | 0.35 | | | — | | | — | |
Net loss on AFS debt security (3) | | | | | | | 0.03 | | | — | | | — | |
| Adjusted diluted EPS (non-GAAP) | (b)/(c) | | | | | | $ | 8.56 | | | $ | 7.92 | | | $ | 6.10 | |
| | | | | | | | | | | |
|
(1)Included in AmortizationApplied statutory rate of tax credit29.56% for 2023, 29.37% for 2022, and other investments on the Consolidated Statement of Income.28.77% for 2021.
(2)Applied statutory tax rates of 28.37% for 2020 and 29.56%.for both 2019 and 2018.
| | | | | | | | | | | | | | | | | | | | | | | | | | | | | | |
|
| ($ in thousands) | | | | | Year Ended December 31, |
| | | | | 2020 | | 2019 | | 2018 |
| Net interest income before provision for credit losses | | (a) | | | | | | $ | 1,377,193 | | | $ | 1,467,813 | | | $ | 1,386,508 | |
Total noninterest income (1) | | | | | | | | 235,547 | | | 222,245 | | | 217,433 | |
| Total revenue | | (b) | | | | | | $ | 1,612,740 | | | $ | 1,690,058 | | | $ | 1,603,941 | |
Total noninterest income (1) | | | | | | | | $ | 235,547 | | | $ | 222,245 | | | $ | 217,433 | |
| | | | | | | | | | | | |
| Less: Gain on sale of business | | | | | | | | — | | | — | | | (31,470) | |
| Non-GAAP noninterest income | | (c) | | | | | | $ | 235,547 | | | $ | 222,245 | | | $ | 185,963 | |
| Non-GAAP revenue | | (a)+(c)=(d) | | | | | | $ | 1,612,740 | | | $ | 1,690,058 | | | $ | 1,572,471 | |
| | | | | | | | | | | | |
Total noninterest expense (1) | | (e) | | | | | | $ | 716,322 | | | $ | 747,456 | | | $ | 720,990 | |
Less: Amortization of tax credit and other investments (1) | | | | | | | | (70,082) | | | (98,383) | | | (96,152) | |
| Amortization of core deposit intangibles | | | | | | | | (3,634) | | | (4,518) | | | (5,492) | |
| Repurchase agreements’ extinguishment cost | | | | | | | | (8,740) | | | — | | | — | |
| Non-GAAP noninterest expense | | (f) | | | | | | $ | 633,866 | | | $ | 644,555 | | | $ | 619,346 | |
| | | | | | | | | | | | |
| Efficiency ratio | | (e)/(b) | | | | | | 44.42 | % | | 44.23 | % | | 44.95 | % |
| Non-GAAP efficiency ratio | | (f)/(d) | | | | | | 39.30 | % | | 38.14 | % | | 39.39 | % |
|
(1)In the fourth quarter of 2020, the Company reclassified certain income/losses from equity-method investments from Amortization of tax credit and other investments to Other investment income, with no effect on net income. Prior-period amounts have been revised to conform with the current presentation.
| | | | | | | | | | | | | | | | | | | | | | | | | | |
|
| ($ and shares in thousands, except per share data) | | | December 31, |
| 2020 | | 2019 | | 2018 |
| | | | | | | |
| Stockholders’ equity | | (a) | | $ | 5,269,175 | | | $ | 5,017,617 | | | $ | 4,423,974 | |
| Less: Goodwill | | | | (465,697) | | | (465,697) | | | (465,547) | |
Other intangible assets (1) | | | | (11,899) | | | (16,079) | | | (22,365) | |
| Non-GAAP tangible common equity | | (b) | | $ | 4,791,579 | | | $ | 4,535,841 | | | $ | 3,936,062 | |
| | | | | | | | |
| Total assets | | (c) | | $ | 52,156,913 | | | $ | 44,196,096 | | | $ | 41,042,356 | |
| Less: Goodwill | | | | (465,697) | | | (465,697) | | | (465,547) | |
Other intangible assets (1) | | | | (11,899) | | | (16,079) | | | (22,365) | |
| Non-GAAP tangible assets | | (d) | | $ | 51,679,317 | | | $ | 43,714,320 | | | $ | 40,554,444 | |
| | | | | | | | |
| Total stockholders’ equity to total assets | | (a)/(c) | | 10.10 | % | | 11.35 | % | | 10.78 | % |
| Non-GAAP tangible common equity to tangible assets | | (b)/(d) | | 9.27 | % | | 10.38 | % | | 9.71 | % |
| | | | | | | | |
| Number of common shares, at period-end | | (e) | | 141,565 | | | 145,625 | | | 144,961 | |
| Non-GAAP tangible common equity per share | | (b)/(e) | | $ | 33.85 | | | $ | 31.15 | | | $ | 27.15 | |
|
(1)Includes core deposit intangibles and mortgage servicing assets.
(3)Represents the net loss related to an AFS debt security that was written-off in the first quarter of 2023 and subsequently sold during the fourth quarter of 2023.
(4)During the fourth quarter of 2023, the Company recorded $70 million pre-tax FDIC charge (included in Deposit insurance premiums and regulatory assessments on the Consolidated Statement of Income).
(5)In 2023, the Company prepaid $300 million of repurchase agreements and incurred a debt extinguishment cost of $4 million.
| | | | | | | | | | | | | | | | | | | | | | | | | | | |
|
| ($ in thousands) | | | | | Year Ended December 31, |
| | | | | 2020 | | 2019 | | 2018 |
| Net income | | | | | | | $ | 567,797 | | | $ | 674,035 | | | $ | 703,701 | |
| Add: Amortization of core deposit intangibles | | | | | | | 3,634 | | | 4,518 | | | 5,492 | |
| Amortization of mortgage servicing assets | | | | | | | 1,920 | | | 2,738 | | | 1,814 | |
Tax effect of adjustments (1) | | | | | | | (1,575) | | | (2,145) | | | (2,160) | |
| Non-GAAP tangible net income | (a) | | | | | | $ | 571,776 | | | $ | 679,146 | | | $ | 708,847 | |
| | | | | | | | | | | |
| Average stockholders’ equity | | | | | | | $ | 5,082,186 | | | $ | 4,760,845 | | | $ | 4,130,822 | |
| Less: Average goodwill | | | | | | | (465,697) | | | (465,663) | | | (466,346) | |
Average other intangible asset (2) | | | | | | | (13,769) | | | (19,340) | | | (25,337) | |
| Average non-GAAP tangible equity | (b) | | | | | | $ | 4,602,720 | | | $ | 4,275,842 | | | $ | 3,639,139 | |
| | | | | | | | | | | |
| Return on average non-GAAP tangible equity | (a)/(b) | | | | | | 12.42 | % | | 15.88 | % | | 19.48 | % |
|
| | | | | | | | | | | | | | | | | | | | | | | | |
|
| | | | December 31, |
| ($ and shares in thousands, except per share data) | | | | 2023 | | 2022 | | 2021 |
| | | | | | | |
| Stockholders’ equity | | (a) | | $ | 6,950,834 | | | $ | 5,984,612 | | | $ | 5,837,218 | |
| Less: Goodwill | | | | (465,697) | | | (465,697) | | | (465,697) | |
Other intangible assets (1) | | | | (6,602) | | | (7,998) | | | (9,334) | |
| Tangible book value (non-GAAP) | | (b) | | $ | 6,478,535 | | | $ | 5,510,917 | | | $ | 5,362,187 | |
| | | | | | | | |
| Number of common shares at period-end | | (c) | | 140,027 | | | 140,948 | | | 141,908 | |
| Book value per share | | (a)/(c) | | $ | 49.64 | | | $ | 42.46 | | | $ | 41.13 | |
| Tangible book value per share (non-GAAP) | | (b)/(c) | | $ | 46.27 | | | $ | 39.10 | | | $ | 37.79 | |
|
(1)Applied statutory rate of 28.37% for 2020 and 29.56% for both 2019 and 2018.
(2)Includes core deposit intangibles and mortgage servicing assets.
ITEM 7A. QUANTITATIVE AND QUALITATIVE DISCLOSURES ABOUT MARKET RISK
For quantitative and qualitative disclosures regarding market risk in the Company’s portfolio, see Item 7. MD&A — Risk Management — Market Risk Management and Note 5 — Derivatives to the Consolidated Financial Statements in this Form 10-K.
EAST WEST BANCORP, INC.
ITEM 8. FINANCIAL STATEMENTS AND SUPPLEMENTARY DATA
TABLE OF CONTENTS
REPORT OF INDEPENDENT REGISTERED PUBLIC ACCOUNTING FIRM
To the Stockholders and Board of Directors
East West Bancorp, Inc.:
Opinion on the Consolidated Financial Statements
We have audited the accompanying consolidated balance sheetsheets of East West Bancorp, Inc. and subsidiaries (the Company) as of December 31, 20202023 and 2019,2022, the related consolidated statements of income, comprehensive income, changes in stockholders’ equity, and cash flows for each of the years in the three‑year period ended December 31, 2020,2023, and the related notes (collectively, the consolidated financial statements). In our opinion, the consolidated financial statements present fairly, in all material respects, the financial position of the Company as of December 31, 20202023 and 2019,2022, and the results of its operations and its cash flows for each of the years in the three‑year period ended December 31, 2020,2023, in conformity with U.S. generally accepted accounting principles.
We also have audited, in accordance with the standards of the Public Company Accounting Oversight Board (United States) (PCAOB), the Company’s internal control over financial reporting as of December 31, 2020,2023, based on criteria established in Internal Control — Integrated Framework (2013) issued by the Committee of Sponsoring Organizations of the Treadway Commission, and our report dated February 26, 202128, 2024 expressed an unqualified opinion on the effectiveness of the Company’s internal control over financial reporting.
Change in Accounting Principle
As discussed in Note 6 to the consolidated financial statements, the Company has changed its method of accounting for the recognition and measurement of credit losses as of January 1, 2020 due to the adoption of ASU 2016-13, Financial Instruments — Credit Losses (Topic 326): Measurement of Credit Losses on Financial Instruments.
Basis for Opinion
These consolidated financial statements are the responsibility of the Company’s management. Our responsibility is to express an opinion on these consolidated financial statements based on our audits. We are a public accounting firm registered with the PCAOB and are required to be independent with respect to the Company in accordance with the U.S. federal securities laws and the applicable rules and regulations of the Securities and Exchange Commission and the PCAOB.
We conducted our audits in accordance with the standards of the PCAOB. Those standards require that we plan and perform the audit to obtain reasonable assurance about whether the consolidated financial statements are free of material misstatement, whether due to error or fraud. Our audits included performing procedures to assess the risks of material misstatement of the consolidated financial statements, whether due to error or fraud, and performing procedures that respond to those risks. Such procedures included examining, on a test basis, evidence regarding the amounts and disclosures in the consolidated financial statements. Our audits also included evaluating the accounting principles used and significant estimates made by management, as well as evaluating the overall presentation of the consolidated financial statements. We believe that our audits provide a reasonable basis for our opinion.
Critical Audit Matter
The critical audit matter communicated below is a matter arising from the current period audit of the consolidated financial statements that was communicated or required to be communicated to the audit committee and that: (1) relates to accounts or disclosures that are material to the consolidated financial statements and (2) involved our especially challenging, subjective, or complex judgments. The communication of a critical audit matter does not alter in any way our opinion on the consolidated financial statements, taken as a whole, and we are not, by communicating the critical audit matter below, providing a separate opinionsopinion on the critical audit matter or on the accounts or disclosures to which it relates.
Allowance for loan losses for loans evaluated on a collective pool basis
As discussed in Notes 1 and 6 to the consolidated financial statements, the Company adopted ASU No. 2016-13, Financial Instruments — Credit Losses (ASC Topic 326) as of January 1, 2020. As of January 1, 2020, theCompany’s allowance for loan losses (ALL) was $483 million, which includesis established as management’s estimate of expected credit losses inherent in the ALL for commercial loans and residential mortgage loans evaluated on a collective pool basis (the January 1, 2020 collective ALL).Company’s lending activities. As of December 31, 2020,2023 the ALL was $620$669 million, which includes the ALL for commercial loans evaluated on a collective pool basis (the December 31, 2020 commercial collective ALL). The ALL is the portion of the loan’s amortized cost basis that the Company does not expect to collect due to anticipated credit losses over the loan’s contractual life, adjusted for estimated prepayments. The Company measured the expected credit losses on a collective pool basis when similar risk characteristics existed. The January 1, 2020 collective ALL and the December 31, 20202023 commercial collective ALL included quantitative and qualitative components (together, the collective ALL). The Company developed and documented the collective ALL methodology at the portfolio segment level. The collective ALL methodology used various models and estimation techniques based on the Company’s historical loss experience, current borrower characteristics, which included internal risk ratings, current conditions, and reasonable and supportable macroeconomic forecasts. The commercial loan portfolio is comprised of commercial and industrial (C&I) and commercial real estate (CRE), which also included multifamily residential, and construction and land loans. The residential mortgage portfolio is comprised of single-family residential and home equity line of credit (HELOC) loans. The Company’s C&I lifetime loss rate model estimated credit losses by estimating a loss rate expected over the life of a loan
which is applied to the amortized cost basis, excluding accrued interest receivables, to determine expected credit losses. The Company’s CRE and residential mortgage projected probability of defaults (PDs)(“PDs”) and loss given defaults (LGDs)(“LGDs”) are applied to the estimated exposure at default, considering the term and payment structure of the loan, to generate estimates of expected loss. The Company incorporated forward-looking information using macroeconomic scenarios, which included variables that are considered key drivers of increases and decreases in credit losses. A probability-weighted multiple scenario forecast over a reasonable and supportable forecast period is incorporated into both the quantitative models. The Company’s C&I lifetime loss rate model reverts to the historical average loss rate, expressed through the loan-level lifetime loss rate, after the reasonable and supportable forecast period. The Company’s CRE and residential mortgage models considermodel considers the contractual life of the loans and the forecast of future economic conditions return to long-run historical economic trends within the reasonable and supportable period. In order to estimate the life of a loan under both quantitative models, the contractual term of the loan is adjusted for estimated prepayments based on historical prepayment experience. The Company also considered qualitative factors in determining the commercial collective ALL. Qualitative adjustments were used to capture characteristics inALL, if these factors have not already been captured by the portfolio that impact expected credit losses which were not fully captured within the Company’s quantitative expected credit loss models.
We identified the assessment of the January 1, 2020 collective ALL and the December 31, 20202023 commercial collective ALL as a critical audit matter. A high degree of audit effort, including specialized skills and knowledge, and subjective and complex auditor judgment was involved in the assessment due to significant measurement uncertainty. Specifically, the assessment encompassed the evaluation of the collective ALL methodology, including an evaluation of the conceptual soundness and performance of the methods and models used to estimate (1) the quantitative component and its significant data elements and assumptions, which included portfolio segments, historic loss experience, reasonable and supportable forecast period, internal risk ratings, probability-weighted macroeconomic forecast scenarios, contractual term of the loan adjusted for estimated prepayments, and (2) the qualitative component. In addition, auditor judgment was required to evaluate the sufficiency of audit evidence obtained.
The following are the primary procedures we performed to address this critical audit matter. We evaluated the design and tested the operating effectiveness of certain internal controls related to the Company’s measurement of the collective ALL estimates, including controls over the:
•development of the collective ALL methodology
•developmentcontinued use and appropriateness of changes made to the quantitative models
•performance monitoring of the quantitative models for the December 31, 20202023 commercial collective ALL
•identification and determination of the significant data elements and assumptions used in the quantitative models
•development of the qualitative component
•analysis of the collective ALL results, trends, and ratios.
We evaluated the Company’s process to develop the collective ALL estimates by testing the models, significant data elements and assumptions that the Company used, and considered the relevance and reliability of such models, data, factors, and assumptions. We performed ratio and trend analysis over key ratios and peer comparison information relevant to the collective ALL. In addition, we involved credit risk professionals with specialized skills and knowledge, who assisted in:
•evaluating the Company’s collective ALL methodology for compliance with U.S. generally accepted accounting principles
•evaluating judgments made by the Company relative to the development,assessment, conceptual soundness and performance testing of the quantitative models, which are based on historical loss experience by comparing them to relevant Company-specific metrics and trends and the applicable industry and regulatory practices
•evaluating the judgments made by the Company in selecting the macroeconomic forecast scenarios, including the reasonable and supportable period and the related probability-weighted macroeconomic forecast scenarios assessing the macroeconomic forecast scenarios through comparison to publicly available forecasts
•determining whether the loan portfolio is pooled based on loans with similar risk characteristics by comparing to the Company’s business environment and relevant industry practices
•evaluating risk ratings for a selection of collectively evaluated loans
•evaluating the conceptual soundness of the framework used to develop the qualitative factors and the effect of those factors on the collective ALL compared with relevant credit risk factors and consistency with credit trends and identified limitations of the underlying quantitative models.
We also assessed the sufficiency of the audit evidence obtained related to the collective ALL estimates by evaluating the:
•cumulative results of audit procedures
•qualitative aspects of the Company’s accounting practices
•potential bias in accounting estimates.
/s/ KPMG LLP
We have served as the Company’s auditor since 2009.
Los Angeles, California
February 26, 202128, 2024
EAST WEST BANCORP, INC. AND SUBSIDIARIES
CONSOLIDATED BALANCE SHEETSHEETS
($ in thousands, except shares)
| | | December 31, |
| 2020 | | 2019 |
| | December 31, | |
| | December 31, | |
| | December 31, | |
| | December 31, | |
| | December 31, | |
| | December 31, | |
| | December 31, | |
| | December 31, | |
| | December 31, | |
| | December 31, | |
| | December 31, | |
| | December 31, | |
| | December 31, | |
| | December 31, | |
| | December 31, | |
| | 2023 | | | | 2023 | | 2022 |
| ASSETS | ASSETS | | | | |
| Cash and due from banks | |
| Cash and due from banks | |
| Cash and due from banks | Cash and due from banks | | $ | 592,117 | | | $ | 536,221 | |
| Interest-bearing cash with banks | Interest-bearing cash with banks | | 3,425,854 | | | 2,724,928 | |
| Cash and cash equivalents | Cash and cash equivalents | | 4,017,971 | | | 3,261,149 | |
| Interest-bearing deposits with banks | Interest-bearing deposits with banks | | 809,728 | | | 196,161 | |
| Assets purchased under resale agreements (“resale agreements”) | Assets purchased under resale agreements (“resale agreements”) | | 1,460,000 | | | 860,000 | |
| Securities: | Securities: | |
| Available-for-sale (“AFS”) debt securities, at fair value (amortized cost of $5,470,523 in 2020 and $3,320,648 in 2019; includes assets pledged as collateral of $588,484 in 2020 and $479,432 in 2019) | | 5,544,658 | | | 3,317,214 | |
| Restricted equity securities, at cost | | 83,046 | | | 78,580 | |
| Available-for-sale (“AFS”) debt securities, at fair value (amortized cost of $6,916,491 and $6,879,225) | |
| Available-for-sale (“AFS”) debt securities, at fair value (amortized cost of $6,916,491 and $6,879,225) | |
| Available-for-sale (“AFS”) debt securities, at fair value (amortized cost of $6,916,491 and $6,879,225) | |
| Held-to-maturity (“HTM”) debt securities, at amortized cost (fair value of $2,453,971 and $2,455,171) | |
| Loans held-for-sale | Loans held-for-sale | | 1,788 | | | 434 | |
Loans held-for-investment (net of allowance for loan losses of $619,983 in 2020 and $358,287 in 2019; includes assets pledged as collateral of $23,263,517 in 2020 and $22,431,092 in 2019) | | 37,770,972 | | | 34,420,252 | |
| Investments in qualified affordable housing partnerships, net | | 213,555 | | | 207,037 | |
| Investments in tax credit and other investments, net | | 266,525 | | | 254,140 | |
| Premises and equipment (net of accumulated depreciation of $127,884 in 2020 and $116,790 in 2019) | | 103,251 | | | 118,364 | |
| Loans held-for-investment (net of allowance for loan losses of $668,743 and $595,645) | |
| Investments in qualified affordable housing partnerships, tax credit and other investments, net | |
| Premises and equipment (net of accumulated depreciation of $157,622 and $148,126) | |
| Goodwill | Goodwill | | 465,697 | | | 465,697 | |
| Operating lease right-of-use assets | Operating lease right-of-use assets | | 95,460 | | | 99,973 | |
| Other assets | Other assets | | 1,324,262 | | | 917,095 | |
| TOTAL | TOTAL | | $ | 52,156,913 | | | $ | 44,196,096 | |
| LIABILITIES | LIABILITIES | | | | |
| Deposits: | Deposits: | |
| Deposits: | |
| Deposits: | |
| Noninterest-bearing | |
| Noninterest-bearing | |
| Noninterest-bearing | Noninterest-bearing | | $ | 16,298,301 | | | $ | 11,080,036 | |
| Interest-bearing | Interest-bearing | | 28,564,451 | | | 26,244,223 | |
| Total deposits | Total deposits | | 44,862,752 | | | 37,324,259 | |
| | Short-term borrowings | Short-term borrowings | | 21,009 | | | 28,669 | |
| Federal Home Loan Bank (“FHLB”) advances | | 652,612 | | | 745,915 | |
| Assets sold under repurchase agreements (“repurchase agreements”) | Assets sold under repurchase agreements (“repurchase agreements”) | | 300,000 | | | 200,000 | |
| Long-term debt and finance lease liabilities | Long-term debt and finance lease liabilities | | 151,739 | | | 152,270 | |
| Operating lease liabilities | Operating lease liabilities | | 102,830 | | | 108,083 | |
| Accrued expenses and other liabilities | Accrued expenses and other liabilities | | 796,796 | | | 619,283 | |
| Total liabilities | Total liabilities | | 46,887,738 | | | 39,178,479 | |
| COMMITMENTS AND CONTINGENCIES (Note 12) | COMMITMENTS AND CONTINGENCIES (Note 12) | | 0 | | 0 | COMMITMENTS AND CONTINGENCIES (Note 12) | | |
| STOCKHOLDERS’ EQUITY | STOCKHOLDERS’ EQUITY | |
| Common stock, $0.001 par value, 200,000,000 shares authorized; 167,240,600 and 166,621,959 shares issued in 2020 and 2019, respectively | | 167 | | | 167 | |
| Common stock, $0.001 par value, 200,000,000 shares authorized; 169,372,230 and 168,459,045 shares issued | |
| Common stock, $0.001 par value, 200,000,000 shares authorized; 169,372,230 and 168,459,045 shares issued | |
| Common stock, $0.001 par value, 200,000,000 shares authorized; 169,372,230 and 168,459,045 shares issued | |
| Additional paid-in capital | Additional paid-in capital | | 1,858,352 | | | 1,826,345 | |
| Retained earnings | Retained earnings | | 4,000,414 | | | 3,689,377 | |
| Treasury stock, at cost 25,675,371 shares in 2020 and 20,996,574 shares in 2019 | | (634,083) | | | (479,864) | |
| Accumulated other comprehensive income (loss) (“AOCI”), net of tax | | 44,325 | | | (18,408) | |
| Treasury stock, at cost 29,344,863 and 27,511,199 shares | |
| Accumulated other comprehensive loss (“AOCI”), net of tax | |
| Total stockholders’ equity | Total stockholders’ equity | | 5,269,175 | | | 5,017,617 | |
| TOTAL | TOTAL | | $ | 52,156,913 | | | $ | 44,196,096 | |
|
See accompanying Notes to Consolidated Financial Statements.
9482
EAST WEST BANCORP, INC. AND SUBSIDIARIES
CONSOLIDATED STATEMENT OF INCOME
($ and shares in thousands, except per share data)
| | | Year Ended December 31, |
| 2020 | | 2019 | | 2018 |
| | Year Ended December 31, | |
| | Year Ended December 31, | |
| | Year Ended December 31, | |
| | Year Ended December 31, | |
| | Year Ended December 31, | |
| | Year Ended December 31, | |
| | Year Ended December 31, | |
| | Year Ended December 31, | |
| | Year Ended December 31, | |
| | Year Ended December 31, | |
| | Year Ended December 31, | |
| | Year Ended December 31, | |
| | Year Ended December 31, | |
| | Year Ended December 31, | |
| | Year Ended December 31, | |
| | Year Ended December 31, | |
| | Year Ended December 31, | |
| | Year Ended December 31, | |
| | Year Ended December 31, | |
| | Year Ended December 31, | |
| | Year Ended December 31, | |
| | 2023 | | | | 2023 | | 2022 | | 2021 |
| INTEREST AND DIVIDEND INCOME | INTEREST AND DIVIDEND INCOME | | | | | | |
| Loans receivable, including fees | Loans receivable, including fees | | $ | 1,464,382 | | | $ | 1,717,415 | | | $ | 1,503,514 | |
| AFS debt securities | | 82,553 | | | 67,838 | | | 60,911 | |
| Loans receivable, including fees | |
| Loans receivable, including fees | |
| Debt securities | |
| Resale agreements | Resale agreements | | 21,389 | | | 28,061 | | | 29,432 | |
| Restricted equity securities | Restricted equity securities | | 1,543 | | | 2,468 | | | 3,146 | |
| Interest-bearing cash and deposits with banks | Interest-bearing cash and deposits with banks | | 25,175 | | | 66,518 | | | 54,700 | |
| Total interest and dividend income | Total interest and dividend income | | 1,595,042 | | | 1,882,300 | | | 1,651,703 | |
| INTEREST EXPENSE | INTEREST EXPENSE | | | | | | |
| Deposits | Deposits | | 184,742 | | | 375,802 | | | 234,752 | |
| Short-term borrowings | | 1,504 | | | 1,763 | | | 1,398 | |
| FHLB advances | | 13,792 | | | 16,697 | | | 10,447 | |
| Deposits | |
| Deposits | |
| Federal funds purchased and other short-term borrowings | |
| Federal Home Loan Bank (“FHLB”) advances | |
| Repurchase agreements | Repurchase agreements | | 11,766 | | | 13,582 | | | 12,110 | |
| Long-term debt and finance lease liabilities | Long-term debt and finance lease liabilities | | 6,045 | | | 6,643 | | | 6,488 | |
| Total interest expense | Total interest expense | | 217,849 | | | 414,487 | | | 265,195 | |
| Net interest income before provision for credit losses | | 1,377,193 | | | 1,467,813 | | | 1,386,508 | |
| Provision for credit losses | | 210,653 | | | 98,685 | | | 64,255 | |
| Net interest income after provision for credit losses | | 1,166,540 | | | 1,369,128 | | | 1,322,253 | |
| Net interest income before provision for (reversal of) credit losses | |
| Provision for (reversal of) credit losses | |
| Net interest income after provision for (reversal of) credit losses | |
| NONINTEREST INCOME | NONINTEREST INCOME | | | | | | |
| | Lending fees | |
| Lending fees | |
| Lending fees | Lending fees | | 74,842 | | | 63,670 | | | 59,758 | |
| Deposit account fees | Deposit account fees | | 48,148 | | | 38,648 | | | 39,176 | |
| Interest rate contracts and other derivative income | | 31,685 | | | 39,865 | | | 18,980 | |
| Customer derivative income | |
| Foreign exchange income | Foreign exchange income | | 22,370 | | | 26,398 | | | 21,259 | |
| Wealth management fees | Wealth management fees | | 17,494 | | | 16,547 | | | 13,624 | |
| Net gains on sales of loans | Net gains on sales of loans | | 4,501 | | | 4,035 | | | 6,590 | |
| Net gains on sales of AFS debt securities | | 12,299 | | | 3,930 | | | 2,535 | |
| | Net gain on sale of business | | 0 | | | 0 | | | 31,470 | |
| Net (losses) gains on AFS debt securities | |
| Other investment income | Other investment income | | 10,641 | | | 18,117 | | | 7,731 | |
| Other income | Other income | | 13,567 | | | 11,035 | | | 16,310 | |
| Total noninterest income | Total noninterest income | | 235,547 | | | 222,245 | | | 217,433 | |
| NONINTEREST EXPENSE | NONINTEREST EXPENSE | | | | | | |
| Compensation and employee benefits | Compensation and employee benefits | | 404,071 | | | 401,700 | | | 379,622 | |
| Compensation and employee benefits | |
| Compensation and employee benefits | |
| Occupancy and equipment expense | Occupancy and equipment expense | | 66,489 | | | 69,730 | | | 68,896 | |
| Deposit insurance premiums and regulatory assessments | Deposit insurance premiums and regulatory assessments | | 15,128 | | | 12,928 | | | 21,211 | |
| Deposit account expense | |
| | Deposit account expense | | 13,530 | | | 14,175 | | | 11,244 | |
| Data processing | | 16,603 | | | 13,533 | | | 13,177 | |
| Computer software expense | | 29,033 | | | 26,471 | | | 22,286 | |
| Consulting expense | | 5,391 | | | 9,846 | | | 11,579 | |
| Legal expense | | 7,766 | | | 8,441 | | | 8,781 | |
| Computer software and data processing expenses | |
| Computer software and data processing expenses | |
| Computer software and data processing expenses | |
| | Other operating expense | |
| | Other operating expense | |
| | Other operating expense | Other operating expense | | 79,489 | | | 92,249 | | | 88,042 | |
| Amortization of tax credit and other investments | Amortization of tax credit and other investments | | 70,082 | | | 98,383 | | | 96,152 | |
| | Repurchase agreements’ extinguishment cost | | 8,740 | | | 0 | | | 0 | |
| Total noninterest expense | |
| Total noninterest expense | |
| Total noninterest expense | Total noninterest expense | | 716,322 | | | 747,456 | | | 720,990 | |
| INCOME BEFORE INCOME TAXES | INCOME BEFORE INCOME TAXES | | 685,765 | | | 843,917 | | | 818,696 | |
| INCOME TAX EXPENSE | INCOME TAX EXPENSE | | 117,968 | | | 169,882 | | | 114,995 | |
| NET INCOME | NET INCOME | | $ | 567,797 | | | $ | 674,035 | | | $ | 703,701 | |
| | EARNINGS PER SHARE (“EPS”) | EARNINGS PER SHARE (“EPS”) | | | | | | |
| BASIC | |
| BASIC | |
| BASIC | BASIC | | $ | 3.99 | | | $ | 4.63 | | | $ | 4.86 | |
| DILUTED | DILUTED | | $ | 3.97 | | | $ | 4.61 | | | $ | 4.81 | |
| WEIGHTED-AVERAGE NUMBER OF SHARES OUTSTANDING | WEIGHTED-AVERAGE NUMBER OF SHARES OUTSTANDING | |
| BASIC | BASIC | | 142,336 | | | 145,497 | | | 144,862 | |
| BASIC | |
| BASIC | |
| DILUTED | DILUTED | | 142,991 | | | 146,179 | | | 146,169 | |
|
See accompanying Notes to Consolidated Financial Statements.
9583
EAST WEST BANCORP, INC. AND SUBSIDIARIES
CONSOLIDATED STATEMENT OF COMPREHENSIVE INCOME
($ in thousands)
| | | Year Ended December 31, |
| 2020 | | 2019 | | 2018 |
| | Year Ended December 31, | |
| | Year Ended December 31, | |
| | Year Ended December 31, | |
| | Year Ended December 31, | |
| | Year Ended December 31, | |
| | Year Ended December 31, | |
| | Year Ended December 31, | |
| | Year Ended December 31, | |
| | Year Ended December 31, | |
| | Year Ended December 31, | |
| | Year Ended December 31, | |
| | Year Ended December 31, | |
| | Year Ended December 31, | |
| | Year Ended December 31, | |
| | Year Ended December 31, | |
| | Year Ended December 31, | |
| | Year Ended December 31, | |
| | Year Ended December 31, | |
| | Year Ended December 31, | |
| | Year Ended December 31, | |
| | Year Ended December 31, | |
| | 2023 | | | | 2023 | | 2022 | | 2021 |
| Net income | Net income | | $ | 567,797 | | | $ | 674,035 | | | $ | 703,701 | |
| Other comprehensive income (loss), net of tax: | Other comprehensive income (loss), net of tax: | |
| Net changes in unrealized gains (losses) on AFS debt securities | Net changes in unrealized gains (losses) on AFS debt securities | | 54,666 | | | 43,402 | | | (8,652) | |
| Net changes in unrealized losses on cash flow hedges | | (1,230) | | | 0 | | | 0 | |
| Net changes in unrealized gains (losses) on AFS debt securities | |
| Net changes in unrealized gains (losses) on AFS debt securities | |
| Reclassification of unrealized losses on debt securities transferred from AFS to HTM | |
| Amortization of unrealized losses on debt securities transferred from ASF to HTM | |
| Net changes in unrealized gains (losses) on cash flow hedges | |
| Foreign currency translation adjustments | Foreign currency translation adjustments | | 9,297 | | | (3,636) | | | (5,732) | |
| Other comprehensive income (loss) | Other comprehensive income (loss) | | 62,733 | | | 39,766 | | | (14,384) | |
| COMPREHENSIVE INCOME | COMPREHENSIVE INCOME | | $ | 630,530 | | | $ | 713,801 | | | $ | 689,317 | |
|
See accompanying Notes to Consolidated Financial Statements.
9684
EAST WEST BANCORP, INC. AND SUBSIDIARIES
CONSOLIDATED STATEMENT OF CHANGES IN STOCKHOLDERS’ EQUITY
($ in thousands, except shares and per share data)
| | | | | | | | | | | | | | | | | | | | | | | | | | | | | | | | | | | | | | | | | | | | |
|
| | | | | | Common Stock and
Additional Paid-in Capital | | Retained
Earnings | | Treasury
Stock | | AOCI,
Net of Tax | | Total
Stockholders’
Equity |
| | | | | | | Shares | | Amount | | | | |
| BALANCE, DECEMBER 31, 2017 | | | | | | | | 144,543,060 | | | $ | 1,755,495 | | | $ | 2,576,302 | | | $ | (452,327) | | | $ | (37,519) | | | $ | 3,841,951 | |
Cumulative-effect of change in accounting principle related to marketable equity securities (1) | | | | | | | | — | | | — | | | (545) | | | — | | | 385 | | | (160) | |
Reclassification of tax effects in AOCI resulting from the new federal corporate income tax rate (2) | | | | | | | | — | | | — | | | 6,656 | | | — | | | (6,656) | | | — | |
| Net income | | | | | | | | — | | | — | | | 703,701 | | | — | | | — | | | 703,701 | |
| Other comprehensive loss | | | | | | | | — | | | — | | | — | | | — | | | (14,384) | | | (14,384) | |
| | | | | | | | | | | | | | | | | | |
| Net activity of common stock pursuant to various stock compensation plans and agreements | | | | | | | | 418,303 | | | 34,482 | | | — | | | (15,634) | | | — | | | 18,848 | |
| Cash dividends on common stock ($0.860 per share) | | | | | | | | — | | | — | | | (125,982) | | | — | | | — | | | (125,982) | |
| BALANCE, DECEMBER 31, 2018 | | | | | | | | 144,961,363 | | | $ | 1,789,977 | | | $ | 3,160,132 | | | $ | (467,961) | | | $ | (58,174) | | | $ | 4,423,974 | |
Cumulative-effect of change in accounting principle related to leases (3) | | | | | | | | — | | | — | | | 10,510 | | | — | | | — | | | 10,510 | |
| | | | | | | | | | | | | | | | | | |
| Net income | | | | | | | | — | | | — | | | 674,035 | | | — | | | — | | | 674,035 | |
| Other comprehensive income | | | | | | | | — | | | — | | | — | | | — | | | 39,766 | | | 39,766 | |
| Warrants exercised | | | | | | | | 180,226 | | | 1,711 | | | — | | | 2,732 | | | — | | | 4,443 | |
| Net activity of common stock pursuant to various stock compensation plans and agreements | | | | | | | | 483,796 | | | 34,824 | | | — | | | (14,635) | | | — | | | 20,189 | |
| Cash dividends on common stock ($1.055 per share) | | | | | | | | — | | | — | | | (155,300) | | | — | | | — | | | (155,300) | |
| BALANCE, DECEMBER 31, 2019 | | | | | | | | 145,625,385 | | | $ | 1,826,512 | | | $ | 3,689,377 | | | $ | (479,864) | | | $ | (18,408) | | | $ | 5,017,617 | |
Cumulative-effect of change in accounting principle related to credit losses (4) | | | | | | | | — | | | — | | | (97,967) | | | — | | | — | | | (97,967) | |
| | | | | | | | | | | | | | | | | | |
| Net income | | | | | | | | — | | | — | | | 567,797 | | | — | | | — | | | 567,797 | |
| Other comprehensive income | | | | | | | | — | | | — | | | — | | | — | | | 62,733 | | | 62,733 | |
| | | | | | | | | | | | | | | | | | |
| | | | | | | | | | | | | | | | | | |
| Net activity of common stock pursuant to various stock compensation plans and agreements | | | | | | | | 411,526 | | | 32,007 | | | — | | | (8,253) | | | — | | | 23,754 | |
| Repurchase of common stock pursuant to the Stock Repurchase Program | | | | | | | | (4,471,682) | | | — | | | — | | | (145,966) | | | — | | | (145,966) | |
| Cash dividends on common stock ($1.100 per share) | | | | | | | | — | | | — | | | (158,793) | | | — | | | — | | | (158,793) | |
| BALANCE, DECEMBER 31, 2020 | | | | | | | | 141,565,229 | | | $ | 1,858,519 | | | $ | 4,000,414 | | | $ | (634,083) | | | $ | 44,325 | | | $ | 5,269,175 | |
|
| | | | | | | | | | | | | | | | | | | | | | | | | | | | | | | | | | | | | | | | | | | | |
|
| | | | | | Common Stock and Additional Paid-in Capital | | Retained Earnings | | Treasury Stock | | AOCI, Net of Tax | | Total Stockholders’ Equity |
| | | | | | | | Shares | | Amount | | | | |
| BALANCE, DECEMBER 31, 2020 | | | | | | | | 141,565,229 | | | $ | 1,858,519 | | | $ | 4,000,414 | | | $ | (634,083) | | | $ | 44,325 | | | $ | 5,269,175 | |
| | | | | | | | | | | | | | | | | | |
| Net income | | | | | | | | — | | | — | | | 872,981 | | | — | | | — | | | 872,981 | |
| Other comprehensive loss | | | | | | | | — | | | — | | | — | | | — | | | (134,706) | | | (134,706) | |
| | | | | | | | | | | | | | | | | | |
| Issuance of common stock pursuant to various stock compensation plans and agreements | | | | | | | | 550,045 | | | 35,206 | | | — | | | — | | | — | | | 35,206 | |
| Repurchase of common stock pursuant to various stock compensation plans and agreements | | | | | | | | (207,320) | | | — | | | — | | | (15,702) | | | — | | | (15,702) | |
| | | | | | | | | | | | | | | | | | |
| Cash dividends on common stock ($1.32 per share) | | | | | | | | — | | | — | | | (189,736) | | | — | | | — | | | (189,736) | |
| BALANCE, DECEMBER 31, 2021 | | | | | | | | 141,907,954 | | | $ | 1,893,725 | | | $ | 4,683,659 | | | $ | (649,785) | | | $ | (90,381) | | | $ | 5,837,218 | |
| | | | | | | | | | | | | | | | | | |
| Net income | | | | | | | | — | | | — | | | 1,128,083 | | | — | | | — | | | 1,128,083 | |
| Other comprehensive loss | | | | | | | | — | | | — | | | — | | | — | | | (675,248) | | | (675,248) | |
| | | | | | | | | | | | | | | | | | |
| Issuance of common stock pursuant to various stock compensation plans and agreements | | | | | | | | 671,871 | | | 42,832 | | | — | | | — | | | — | | | 42,832 | |
| Repurchase of common stock pursuant to various stock compensation plans and agreements | | | | | | | | (246,462) | | | — | | | — | | | (19,087) | | | — | | | (19,087) | |
| Repurchase of common stock pursuant to the stock repurchase program | | | | | | | | (1,385,517) | | | — | | | — | | | (99,990) | | | — | | | (99,990) | |
| Cash dividends on common stock ($1.60 per share) | | | | | | | | — | | | — | | | (229,196) | | | — | | | — | | | (229,196) | |
| BALANCE, DECEMBER 31, 2022 | | | | | | | | 140,947,846 | | | $ | 1,936,557 | | | $ | 5,582,546 | | | $ | (768,862) | | | $ | (765,629) | | | $ | 5,984,612 | |
Cumulative-effect of change in accounting principle (1) | | | | | | | | — | | | — | | | (4,262) | | | — | | | — | | | (4,262) | |
| | | | | | | | | | | | | | | | | | |
| Net income | | | | | | | | — | | | — | | | 1,161,161 | | | — | | | — | | | 1,161,161 | |
| Other comprehensive income | | | | | | | | — | | | — | | | — | | | — | | | 145,033 | | | 145,033 | |
| | | | | | | | | | | | | | | | | | |
| | | | | | | | | | | | | | | | | | |
| Issuance of common stock pursuant to various stock compensation plans and agreements | | | | | | | | 913,185 | | | 44,430 | | | — | | | — | | | — | | | 44,430 | |
| Repurchase of common stock pursuant to various stock compensation plans and agreements | | | | | | | | (327,573) | | | — | | | — | | | (23,751) | | | — | | | (23,751) | |
| Repurchase of common stock pursuant to the stock repurchase program | | | | | | | | (1,506,091) | | | — | | | — | | | (82,174) | | | — | | | (82,174) | |
| Cash dividends on common stock ($1.92 per share) | | | | | | | | — | | | — | | | (274,215) | | | — | | | — | | | (274,215) | |
| BALANCE, DECEMBER 31, 2023 | | | | | | | | 140,027,367 | | | $ | 1,980,987 | | | $ | 6,465,230 | | | $ | (874,787) | | | $ | (620,596) | | | $ | 6,950,834 | |
|
(1)Represents the impactchange in the Company’s allowance for loan losses as a result of the adoption of Accounting Standards Update (“ASU”) 2016-01, Financial Instruments — Overall (Subtopic 825-10): Recognition and Measurement of Financial Assets and Financial Liabilities on January 1, 2018.
(2)Represents amounts reclassified from AOCI to retained earnings due to the early adoption of ASU 2018-02, Income Statement — Reporting Comprehensive Income (Topic 220): Reclassification of Certain Tax Effects from Accumulated Other Comprehensive Income on January 1, 2018.
(3)Represents the impact of the adoption of ASU 2016-02, Leases (Topic 842) and subsequent related ASUson January 1, 2019.
(4)Represents the impact of the adoption of ASU 2016-13,2022-02, Financial Instruments — Credit Losses (Topic(Topic 326): Troubled Debt Restructurings and the Vintage Disclosures on January 1, 2020.2023. Refer to Note 1 — Summary of Significant Accounting Policiesto the Consolidated Financial Statements in this Annual Report on Form 10-K (“this Form 10-K”) for additional information.
See accompanying Notes to Consolidated Financial Statements.
9785
EAST WEST BANCORP, INC. AND SUBSIDIARIES
CONSOLIDATED STATEMENT OF CASH FLOWS
($ in thousands)
| | | Year Ended December 31, |
| 2020 | | 2019 | | 2018 |
| | Year Ended December 31, | |
| | Year Ended December 31, | |
| | Year Ended December 31, | |
| | Year Ended December 31, | |
| | Year Ended December 31, | |
| | Year Ended December 31, | |
| | Year Ended December 31, | |
| | Year Ended December 31, | |
| | Year Ended December 31, | |
| | Year Ended December 31, | |
| | Year Ended December 31, | |
| | Year Ended December 31, | |
| | Year Ended December 31, | |
| | Year Ended December 31, | |
| | Year Ended December 31, | |
| | Year Ended December 31, | |
| | Year Ended December 31, | |
| | Year Ended December 31, | |
| | Year Ended December 31, | |
| | Year Ended December 31, | |
| | Year Ended December 31, | |
| | 2023 | | | | 2023 | | 2022 | | 2021 |
| CASH FLOWS FROM OPERATING ACTIVITIES | CASH FLOWS FROM OPERATING ACTIVITIES | | | | | | | CASH FLOWS FROM OPERATING ACTIVITIES | | |
| Net income | Net income | | $ | 567,797 | | | $ | 674,035 | | | $ | 703,701 | |
| Adjustments to reconcile net income to net cash provided by operating activities: | Adjustments to reconcile net income to net cash provided by operating activities: | | | | | | | Adjustments to reconcile net income to net cash provided by operating activities: | | |
| Provision for credit losses | | 210,653 | | | 98,685 | | | 64,255 | |
| Provision for (reversal of) credit losses | |
| Depreciation and amortization | Depreciation and amortization | | 119,908 | | | 144,178 | | | 139,499 | |
| Accretion of discount and amortization of premiums, net | | (16,456) | | | (22,379) | | | (20,572) | |
| Accretion of discount and (amortization of premiums), net | |
| | Stock compensation costs | Stock compensation costs | | 29,237 | | | 30,761 | | | 30,937 | |
| Deferred income tax benefit | | (41,515) | | | (21,604) | | | (16,470) | |
| Stock compensation costs | |
| Stock compensation costs | |
| Deferred income tax (benefit) expense | |
| Net gains on sales of loans | Net gains on sales of loans | | (4,501) | | | (4,035) | | | (6,590) | |
| Gains on sales of AFS debt securities | | (12,299) | | | (3,930) | | | (2,535) | |
| Net losses (gains) on AFS debt securities | |
| | Net gain on sale of business | | 0 | | | 0 | | | (31,470) | |
| Net gains on sales of other real estate owned ("OREO") and other foreclosed assets | |
| Net gains on sales of other real estate owned ("OREO") and other foreclosed assets | |
| Net gains on sales of other real estate owned ("OREO") and other foreclosed assets | |
| Impairment on OREO and other foreclosed assets | |
| Loans held-for-sale: | Loans held-for-sale: | |
| Originations and purchases | |
| Originations and purchases | |
| Originations and purchases | Originations and purchases | | (81,662) | | | (10,569) | | | (20,176) | |
| Proceeds from sales and paydowns/payoffs of loans originally classified as held-for-sale | Proceeds from sales and paydowns/payoffs of loans originally classified as held-for-sale | | 80,659 | | | 10,436 | | | 20,068 | |
| Proceeds from distributions received from equity method investees | Proceeds from distributions received from equity method investees | | 8,786 | | | 3,470 | | | 3,761 | |
| | Net change in accrued interest receivable and other assets | Net change in accrued interest receivable and other assets | | (339,868) | | | (170,819) | | | (60,791) | |
| | Net change in accrued interest receivable and other assets | |
| | Net change in accrued interest receivable and other assets | |
| Net change in accrued expenses and other liabilities | Net change in accrued expenses and other liabilities | | 170,403 | | | 7,012 | | | 88,070 | |
| Other net operating activities | | 2,183 | | | 588 | | | (8,515) | |
| Other operating activities, net | |
| Total adjustments | Total adjustments | | 125,528 | | | 61,794 | | | 179,471 | |
| Net cash provided by operating activities | Net cash provided by operating activities | | 693,325 | | | 735,829 | | | 883,172 | |
| CASH FLOWS FROM INVESTING ACTIVITIES | CASH FLOWS FROM INVESTING ACTIVITIES | | | | | | | CASH FLOWS FROM INVESTING ACTIVITIES | | |
| Net (increase) decrease in: | Net (increase) decrease in: | | | | | | | Net (increase) decrease in: | | |
| Investments in qualified affordable housing partnerships, tax credit and other investments | Investments in qualified affordable housing partnerships, tax credit and other investments | | (154,887) | | | (146,902) | | | (132,605) | |
| Interest-bearing deposits with banks | Interest-bearing deposits with banks | | (577,607) | | | 193,455 | | | 4,212 | |
| Resale agreements: | Resale agreements: | |
| Proceeds from paydowns and maturities | Proceeds from paydowns and maturities | | 450,000 | | | 650,000 | | | 175,000 | |
| Proceeds from paydowns and maturities | |
| Proceeds from paydowns and maturities | |
| Purchases | Purchases | | (800,000) | | | (325,000) | | | (160,000) | |
| AFS debt securities: | AFS debt securities: | |
| Proceeds from sales | Proceeds from sales | | 525,433 | | | 627,110 | | | 364,270 | |
| Proceeds from sales | |
| Proceeds from sales | |
| Proceeds from repayments, maturities and redemptions | |
| Purchases | |
| HTM debt securities: | |
| Proceeds from repayments, maturities and redemptions | |
| Proceeds from repayments, maturities and redemptions | |
| Proceeds from repayments, maturities and redemptions | Proceeds from repayments, maturities and redemptions | | 2,070,131 | | | 1,155,002 | | | 742,132 | |
| Purchases | Purchases | | (4,758,254) | | | (2,303,317) | | | (888,673) | |
| Loans held-for-investment: | Loans held-for-investment: | |
| Proceeds from sales of loans originally classified as held-for-investment | Proceeds from sales of loans originally classified as held-for-investment | | 331,864 | | | 288,823 | | | 483,948 | |
| Proceeds from sales of loans originally classified as held-for-investment | |
| Proceeds from sales of loans originally classified as held-for-investment | |
| Purchases | Purchases | | (389,863) | | | (524,142) | | | (597,112) | |
| Other changes in loans held-for-investment, net | Other changes in loans held-for-investment, net | | (3,557,369) | | | (2,184,915) | | | (3,313,382) | |
| Premises and equipment: | | | | | | |
| Proceeds from sales | | 5,154 | | | 403 | | | 1,638 | |
| Purchases | | (2,656) | | | (9,859) | | | (13,787) | |
| | Payment received from the sales of businesses, net of cash transferred | | 0 | | | 0 | | | (503,687) | |
| | Proceeds from sales of OREO and other foreclosed assets | |
| | Proceeds from sales of OREO and other foreclosed assets | |
| | Proceeds from sales of OREO and other foreclosed assets | |
| | Purchase of bank-owned life insurance | |
| Purchase of bank-owned life insurance | |
| Purchase of bank-owned life insurance | |
| Distributions received from equity method investees | Distributions received from equity method investees | | 15,901 | | | 9,502 | | | 5,185 | |
| Other net investing activities | | (6,563) | | | (1,336) | | | 449 | |
| Other investing activities, net | |
| Net cash used in investing activities | Net cash used in investing activities | | (6,848,716) | | | (2,571,176) | | | (3,832,412) | |
| |
See accompanying Notes to Consolidated Financial Statements.
9886
EAST WEST BANCORP, INC. AND SUBSIDIARIES
CONSOLIDATED STATEMENT OF CASH FLOWS
($ in thousands)
(Continued)
| | | Year Ended December 31, |
| 2020 | | 2019 | | 2018 |
| | Year Ended December 31, | |
| | Year Ended December 31, | |
| | Year Ended December 31, | |
| | Year Ended December 31, | |
| | Year Ended December 31, | |
| | Year Ended December 31, | |
| | Year Ended December 31, | |
| | Year Ended December 31, | |
| | Year Ended December 31, | |
| | Year Ended December 31, | |
| | Year Ended December 31, | |
| | Year Ended December 31, | |
| | Year Ended December 31, | |
| | Year Ended December 31, | |
| | Year Ended December 31, | |
| | Year Ended December 31, | |
| | Year Ended December 31, | |
| | Year Ended December 31, | |
| | Year Ended December 31, | |
| | Year Ended December 31, | |
| | Year Ended December 31, | |
| | 2023 | | | | 2023 | | 2022 | | 2021 |
| CASH FLOWS FROM FINANCING ACTIVITIES | CASH FLOWS FROM FINANCING ACTIVITIES | | | | | | |
| Net increase in deposits | Net increase in deposits | | 7,482,730 | | | 1,902,741 | | | 3,903,192 | |
| Net (decrease) increase in short-term borrowings | | (9,016) | | | (28,535) | | | 61,392 | |
| Net increase in deposits | |
| Net increase in deposits | |
| Net increase (decrease) in short-term borrowings | |
| FHLB advances: | FHLB advances: | | |
| Proceeds | |
| Proceeds | |
| Proceeds | Proceeds | | 10,300 | | | 1,500,000 | | | 0 | |
| Repayments | Repayments | | (105,300) | | | (1,082,001) | | | 0 | |
| Repurchase agreements: | Repurchase agreements: | | |
| Proceeds | | 48,063 | | | 0 | | | 0 | |
| | Repayment | |
| | Repayment | |
| | Repayment | Repayment | | (198,063) | | | 0 | | | 0 | |
| Extinguishment cost | Extinguishment cost | | (8,740) | | | 0 | | | 0 | |
| Long-term debt and lease liabilities: | Long-term debt and lease liabilities: | | |
| Proceeds from long-term debt | | 1,437,269 | | | 0 | | | 0 | |
| | Repayments of long-term debt and lease liabilities | |
| | Repayments of long-term debt and lease liabilities | |
| | Repayments of long-term debt and lease liabilities | Repayments of long-term debt and lease liabilities | | (1,438,335) | | | (884) | | | (25,000) | |
| Common stock: | Common stock: | | |
| Proceeds from issuance pursuant to various stock compensation plans and agreements | Proceeds from issuance pursuant to various stock compensation plans and agreements | | 2,326 | | | 3,383 | | | 2,846 | |
| Proceeds from issuance pursuant to various stock compensation plans and agreements | |
| Proceeds from issuance pursuant to various stock compensation plans and agreements | |
| Stock tendered for payment of withholding taxes | Stock tendered for payment of withholding taxes | | (8,253) | | | (14,635) | | | (15,634) | |
| Repurchase of common stock pursuant to the Stock Repurchase Program | | (145,966) | | | 0 | | | 0 | |
| Repurchase of common stock pursuant to the stock repurchase program | |
| Cash dividends paid | Cash dividends paid | | (158,222) | | | (155,107) | | | (125,988) | |
| Other net financing activities | | 0 | | | 0 | | | 0 | |
| | Net cash provided by financing activities | |
| Net cash provided by financing activities | |
| Net cash provided by financing activities | Net cash provided by financing activities | | 6,908,793 | | | 2,124,962 | | | 3,800,808 | |
| Effect of exchange rate changes on cash and cash equivalents | Effect of exchange rate changes on cash and cash equivalents | | 3,420 | | | (29,843) | | | (24,783) | |
| NET INCREASE IN CASH AND CASH EQUIVALENTS | | 756,822 | | | 259,772 | | | 826,785 | |
| NET INCREASE (DECREASE) IN CASH AND CASH EQUIVALENTS | |
| CASH AND CASH EQUIVALENTS, BEGINNING OF YEAR | CASH AND CASH EQUIVALENTS, BEGINNING OF YEAR | | 3,261,149 | | | 3,001,377 | | | 2,174,592 | |
| CASH AND CASH EQUIVALENTS, END OF YEAR | CASH AND CASH EQUIVALENTS, END OF YEAR | | $ | 4,017,971 | | | $ | 3,261,149 | | | $ | 3,001,377 | |
| | SUPPLEMENTAL CASH FLOW INFORMATION: | SUPPLEMENTAL CASH FLOW INFORMATION: | |
| SUPPLEMENTAL CASH FLOW INFORMATION: | |
| SUPPLEMENTAL CASH FLOW INFORMATION: | |
| Cash paid during the year for: | |
| Cash paid during the year for: | |
| Cash paid during the year for: | Cash paid during the year for: | | | | | | | | |
| Interest | Interest | | $ | 233,139 | | | $ | 418,840 | | | $ | 253,026 | |
| Income taxes, net | Income taxes, net | | $ | 116,412 | | | $ | 158,296 | | | $ | 85,872 | |
| Noncash investing and financing activities: | Noncash investing and financing activities: | | | | | | |
| Loans transferred from held-for-investment to held-for-sale | Loans transferred from held-for-investment to held-for-sale | | $ | 329,069 | | | $ | 285,637 | | | $ | 481,593 | |
| Loans transferred from held-for-sale to held-for-investment | | $ | 0 | | | $ | 0 | | | $ | 2,306 | |
| Loans transferred from held-for-investment to held-for-sale | |
| Loans transferred from held-for-investment to held-for-sale | |
| | Loans transferred to other real estate owned (“OREO”) | | $ | 19,504 | | | $ | 2,013 | | | $ | 1,206 | |
| Securities transferred from AFS to HTM debt securities | |
| | | Securities transferred from AFS to HTM debt securities | |
| | Securities transferred from AFS to HTM debt securities | |
| Loans transferred to OREO | |
|
See accompanying Notes to Consolidated Financial Statements.
9987
EAST WEST BANCORP, INC. AND SUBSIDIARIES
NOTES TO CONSOLIDATED FINANCIAL STATEMENTS
Note 1 — Summary of Significant Accounting Policies
Organization
East West Bancorp, Inc. (referred to herein on an unconsolidated basis as “East West” and on a consolidated basis as the “Company”) is a registered bank holding company that offers a full range of banking services to individuals and businesses through its subsidiary bank, East West Bank and its subsidiaries (“East West Bank” or the “Bank”). The Bank is the Company’s principal asset. As of December 31, 2020,2023, the Company operates in more thanoperated in over 120 locations in the United States (“U.S.”) and Greater China.Asia. In the U.S., the Bank’s corporate headquarters and main administrative offices area located in California, and its branches and offices are located in California, Texas, New York, Washington, Georgia, Massachusetts, Illinois, and Nevada. In Greater China,Asia, East West’s presence includes full serviceincluded full-service branches in Hong Kong, Shanghai, Shantou and Shenzhen, and representative offices in Beijing, Chongqing, Guangzhou, Xiamen and Xiamen.Singapore, and administrative support offices in Beijing and Shanghai. The Bank has 4 wholly owned subsidiaries, one of which includes a banking subsidiary based in China — East West Bank (China) Limited.
On March 17, 2018, the Bank completed the sale of its 8 Desert Community Bank branches located in the High Desert area of Southern California to Flagstar Bank, a wholly owned subsidiary of Flagstar Bancorp, Inc. The transaction resulted in a net cash payment of $499.9 million by the Company to Flagstar Bank and a pre-tax gain of $31.5 million for the year ended December 31, 2018.
In 2019, the Company acquired East West Markets, LLC, a private broker-dealer and established East West Investment Management LLC, a registered investment adviser. Both East West Markets, LLC and East West Investment Management LLC are wholly owned subsidiaries of East West.
Significant Accounting Policies
Basis of Presentation — The accounting and reporting policies of the Company conform with the U.S. Generally Accepted Accounting Principles (“GAAP”), applicable guidelines prescribed by regulatory authorities and generalcommon practices in the banking industry. The preparation of the Consolidated Financial Statements in conformity with U.S. GAAP requires management to make estimates and assumptions that affect the reported amounts of assets and liabilities as of the date of the Consolidated Financial Statements, income and expenses during the reporting period, and the related disclosures. Actual results could differ materially from those estimates. Certain items on the Consolidated Financial Statements and notes for the prior years have been reclassified to conform to the 20202023 presentation.
Principles of Consolidation — The Consolidated Financial Statements in this Form 10-K include the accounts of East West and its subsidiaries. subsidiaries that are majority owned and in which the Company has a controlling financial interest. In accordance with the applicable accounting guidance for consolidation, the Company first determines if it has a variable interest in the entity. A variable interest entity (“VIE”) is an entity that lacks equity investors or whose equity investors do not have a controlling financial interest in the entity through their equity investments. If it is determined that the Company does not have a variable interest in the entity, no further analysis is required and the entity is not consolidated. The Company consolidates a VIE when the Company has a controlling financial interest in the entity and therefore is deemed to be the primary beneficiary. The primary beneficiary of a VIE is determined if the Company has: i) both the power and ability to direct activities of the VIE that most significantly affect the entity’s economic performance; and ii) the obligation to absorb losses of the entity or the right to receive benefits from the entity that could potentially be significant to the VIE. For an entity that does not meet the definition of a VIE, the entity is determined to be a voting interest entity. The Company consolidates a voting interest entity if it can exert control over the financial and operating policies of an investee, which can occur if the Company has a more than 50% voting interest in the entity. For unconsolidated voting interest entities or VIE, the Company uses the equity, cost or measurement alternative method based on the Company’s voting or economic interest.
Intercompany transactions and accounts have been eliminated in consolidation. East West also has 6 wholly ownedsix wholly-owned subsidiaries that are statutory business trusts (the “Trusts”). In accordance with Financial Accounting Standards Board (“FASB”) Accounting Standards Codification (“ASC”) Topic 810, Consolidation, the Trusts are not included onin the Consolidated Financial Statements.
Cash and Cash Equivalents — Cash and cash equivalents include cash on hand, cash items in transit, cash due from the Federal Reserve Bank of San Francisco (“FRBSF”) and other financial institutions, and federal funds sold with original maturities up to three months.
Interest-bearingInterest-Bearing Deposits with Banks — Interest-bearing deposits with banks include cash placed with other banks with original maturities greater than three months and less than one year.
Assets Purchased under Resale Agreements and Assets Sold under Repurchase Agreements — Resale agreements are recorded as receivables based on the values at which the securities or loans are acquired. Repurchase agreements are accounted for as collateralized financing transactions and recorded as liabilities based on the values at which the securities are sold. The Company monitors the values of the underlying assets collateralizing the resale and repurchase agreements, including accrued interests,interest, and obtains or posts additional collateralscollateral in order to maintain the appropriate collateral requirements for the transactions. In addition,For allowance for credit losses on resale agreements, refer to the Company has elected to offset resale and repurchase transactions with the same counterparty on the Consolidated Balance Sheet when it has a legally enforceable master netting agreement and when the transactions are eligibleAllowance for netting under ASC 210-20-45-11, Collateral-Dependent Financial AssetsBalance Sheet Offsetting: Repurchase and Reverse Repurchase Agreements. section of this note for details.
Securities — The Company’s securities include various debt securities, marketable equity securities and restrictednon-marketable equity securities. Debt securities are recorded on the Consolidated Balance Sheet as of their trade dates. The Company initially classifies its debt securities as trading securities, AFS or held-to-maturityHTM debt securities based on management’s intention on the date of the purchase.
Debt securities are purchased for liquidity and investment purpose,purposes, as part of asset-liabilityasset/liability management and other strategic activities.
Debt securities for which the Company does not havehas the positive intention and ability to hold tountil maturity are classified as HTM and are carried at amortized cost, net of allowance for credit losses. Debt securities not classified as trading securities or HTM securities are classified as AFS. AFS debt securities are reported at fair value, with unrealized gains and losses, net of applicable income taxes, included in AOCI, and net of the allowance for credit losses. We recognizelosses, with unrealized gains and losses recorded in AOCI, net of applicable income taxes. For details of the allowance for credit losses on debt securities, refer to the Allowance for Credit Losses on Available-for-Sale and Held-to-Maturity Debt Securities sections of this note. Interest income, including any amortization of premium or accretion of discount, is included in net income. The Company recognizes realized gains and losses on the sale of AFS debt securities in earnings, using the specific identification method.
Upon transfer of a debt security from the AFS to HTM category, the security’s new amortized cost is reset to fair value, reduced by any previous write-offs but excluding any allowance for credit losses. Unrealized gains or losses at the date of transfer of these securities continue to be reported in AOCI and are amortized into interest income over the remaining life of the securities as effective yield adjustments, in a manner consistent with the amortization or accretion of the original purchase premium or discount on the associated security. For transfers of securities from the AFS to HTM category, any allowance for credit losses that was previously recorded under the AFS model is reversed and an allowance for credit losses is subsequently recorded under the HTM debt security model. The reversal and re-establishment of the allowance for credit losses are recorded in the provision for credit losses.
Marketable equity securities that havewith readily determinable fair values are recorded at fair value with unrealized gains and losses due to changes in fair value, reflectedvalue; and are included in earnings.Other investment income on the Consolidated Statement of Income. Marketable equity securities include mutual fund investments, which are included in Investments in qualified affordable housing partnership, tax credit and other investments, net on the Consolidated Balance Sheet.
Non-marketable equity securities including tax credit investments, and other equity investments that do not have readily determinable fair values are recorded in Investments in qualified affordable housing partnership, tax credit and other investments, net, and Other assets on the Consolidated Balance Sheet and are accounted for under one of the following accounting methods:
•Equity Method — When we havethe Company has the ability to exertexercise significant influence over the investee.
•Cost Method — The cost method is applied to investmentsrestricted equity securities held for membership and regulatory purposes, such as FRBSF and FHLB stock. These investments are held at their cost minus impairment. If impaired, the carrying value is written down to the fair value of the security.
•Measurement Alternative — This method is applied to all remaining non-marketable equity securities. These securities are carried at cost adjusted for impairment, if any, plus or minus observable price changes in orderly transactions of an identical or similar security of the same issuer.
Non-marketable equity securities include tax credit investments that are included in Investments in tax credit and other investments, net, and Other assets on the Consolidated Balance Sheet.
OurThe Company’s impairment review for impairment for equity method, cost method and measurement alternative securities typically includes an analysis of the facts and circumstances of each security, the intent or requirement to sell the security, the expectations of cash flows, capital needs and the viability of its business model. For equity method and cost method investments, we reducethe Company reduces the asset’s carrying value when we considerthe Company considers declines in value to be other-than-temporary impairment (“OTTI”). For securities accounted for under the measurement alternative, we reducethe Company reduces the asset value when the fair value is less than the carrying value, without the consideration of recovery.
Restricted equity securities include FRBSF and FHLB stock. The FRBSF stock is required by law to be held as a condition of membership in the Federal Reserve System. The FHLB stock is required to obtain advances from the FHLB. They are carried at cost as they do not have a readily determinable fair value.
Loans Held-for-Sale — Loans are initially classified as loans held-for-sale when they are individually identified as being available for immediate sale and management has committed to a formal plan to sell them. Loans held-for-sale are carried at lower of cost or fair value. Subject to periodic review under the Company’s evaluation process, including asset/liability and credit risk management, the Company may transfer certain loans from held-for-investment to held-for-sale measured at lower of cost or fair value. Any write-downs in the carrying amount of the loan at the date of transfer are recorded as charge-offs to allowance for loan losses. Loan origination fees on loans held-for-sale, net of certain costs in processing and closing the loans, are deferred until the time of sale and are included in the periodic determination of the lower of cost or fair value adjustments and/or the gain or loss recognized at the time of sale. A valuation allowance is established if the fair value of such loans is lower than their cost, with a corresponding charge to noninterest income. If the loan or a portion of the loan cannot be sold, it is subsequently transferred back to the loans held-for-investment portfolio from the loans held-for-sale portfolio at the lower of cost or fair value on the transfer date.
Loans Held-for-Investment — At the time of commitment to originate or purchase a loan, the loan is determined to be held-for-investment if it is the Company’s intent to hold the loan to maturity or for the “foreseeableforeseeable future.” Loans held-for-investment are stated at their outstanding principal, reduced by an allowance for loan losses and net of deferred loan fees or costs, or unearned fees on originated loans, net of unamortized premiums or unaccreted discounts on purchased loans. Nonrefundable fees and direct costs associated with the origination or purchase of loans are deferred and netted against outstanding loan balances. The deferred net loan fees and costs are recognized in interest income as an adjustment to yield over the loan term using the effective interest method or straight-line method. Discounts/premiums on purchased loans are accreted/amortized to interest income using the effective interest method or straight-line method over the remaining period to the contractual maturity. Interest on loans is calculated using the simple-interest method on daily balances of the principal amounts outstanding. Generally, loans are placed on nonaccrual status when they become 90 days past due or more. Loans are considered past due when contractually required principal or interest payments have not been made on the due dates. Loans are also placed on nonaccrual status when management believes, after considering economic and business conditions and collection efforts, that the borrower’s financial condition is such that full collection of principal or interest becomes uncertain, regardless of the length of past due status. Once a loan is placed on nonaccrual status, interest accrual is discontinued and all unpaid accrued interest is reversed against interest income. Interest payments received on nonaccrual loans are reflected as a reduction of principal and not as interest income. A loan is returned to accrual status when the borrower has demonstrated a satisfactory payment trend subject to management’s assessment of the borrower’s ability to repay the loan.
Loan Modifications — Certain loans are modified in the normal course of business for competitive reasons or in conjunction with the Company’s loss mitigation activities. Upon the adoption of ASU 2022-02 on January 1, 2023, the Company applies the general loan modification guidance provided in ASC 310-20 to all loan modifications, including modifications made to borrowers experiencing financial difficulty. Under the general loan modification guidance, a modification is treated as a new loan only if the following two conditions are met: (1) the terms of the new loan are at least as favorable to the Company as the terms for comparable loans to other customers with similar collection risks; and (2) modifications to the terms of the original loan are more than minor. If either condition is not met, the modification is accounted for as a continuation of the existing loan with any effect of the modification treated as a prospective adjustment to the loan’s effective interest rate. A modification made to borrowers experiencing financial difficulty may vary by program and by borrower-specific characteristics, and may include rate reductions, principal forgiveness, term extensions, and payment delays, and is intended to minimize the Company’s economic loss and to avoid foreclosure or repossession of collateral. The Company applies the same credit loss methodology it uses for similar loans that were not modified.
Troubled Debt Restructurings — A— Prior to the adoption of ASU 2022-02, a loan iswas generally classified as a troubled debt restructuring (“TDR”) when the Company, for economic or legal reasons related to the borrower’s financial difficulties, grantsgranted a concession to the borrower that the Company would not otherwise consider. The concessions may be granted in various forms, including a below-market change in the stated interest rate, a reduction in the loan balance or accrued interest, ana term extension, of the maturity date with a stated interest rate lower than the current market rate or note splits referred to as A/B note restructurings.payment forbearance and other actions. Loans with contractual terms that have beenwere modified as a TDR and arewere current at the time of restructuring may remain on accrual status if there iswas demonstrated performance prior to the restructuring and payment in full under the restructured terms iswas expected. Otherwise, these loans arewere placed on nonaccrual status and arewere reported as nonperforming, until the borrower demonstratesdemonstrated a sustained period of performance, generally six months, and the ability to repay the loan according to the contractual terms. If accruing TDRs ceaseceased to perform in accordance with their modified contractual terms, they arewere placed on nonaccrual status and reported as nonperforming TDRs. TDRs arewere included in the quarterly allowance for credit losses valuation process. Refer to Allowance for Loan Losses below for a complete discussion.
The Company has implemented various loan modification programs to provide its borrowers relief from the economic impacts of the COVID-19 pandemic. As provided under Section 4013 of the CARES Act, as amended by the Consolidated Appropriations Act, 2021 (“CAA”), the Company has elected not to apply TDR classification to any COVID-19 pandemic related loan modifications that were executed after March 1, 2020 and earlier of (A) 60 days after the national emergency termination date concerning the COVID-19 pandemic outbreak declared by the President on March 13, 2020 under the National Emergencies Act, or (B) January 1, 2022 to borrowers who were current as of December 31, 2019. For loans that were modified in response to the COVID-19 pandemic that do not meet the CARES Act criteria (e.g., current payment status as of December 31, 2019), the Company has applied the guidance included in the “Interagency Statement on Loan Modifications and Reporting for Financial Institutions Working with Customer Affected by the Coronavirus (Revised)” (the “Interagency Statement”) issued by the federal banking regulators on April 7, 2020. The Interagency Statement states that short-term loan modifications (i.e. six months or less) are not TDRs if they were made on a good faith basis in response to the COVID-19 pandemic to borrowers who were current as of the implementation date of a loan modification program. The aging on the delinquency of the loans modified under the CARES Act, as amended by the CAA, and the Interagency Statement is frozen at the time of the modification. Interest income continues to be recognized over the accommodation period.
Paycheck Protection Program — From April to August 2020, the Company accepted Paycheck Protection Program (“PPP”) applications and originated loans to qualified small businesses under the PPP established by the CARES Act. The CAA extends the PPP to March 31, 2021. PPP loans are included in the commercial and industrial (“C&I”) portfolio, carrying an interest rate of 1%, and are 100% guaranteed by the Small Business Administration (“SBA”). No allowance for loan losses was recorded for these loans as of December 31, 2020. As of December 31, 2020, the Company had approximately 6,200 SBA 7(a) approved PPP loans with an outstanding loan balance of $1.57 billion. The substantial majority of the Company’s PPP loans have a term of two years. The SBA paid the Company fees for processing PPP loans and such fees are accounted for loan origination fees, where net deferred fees are recognized over the estimated life of the loan as a yield adjustment on the loans. Under the terms of the PPP, if certain conditions are satisfied, such loans are eligible to be forgiven in which case the SBA will make payments to the Company for the forgiven amounts. If a loan is paid off or forgiven by the SBA prior to its projected estimated life, the remaining unamortized deferred fees will be recognized as interest income in that period.
Allowance for Loan Losses —The Company adopted ASU 2016-13, Financial Instruments — Credit Losses (Topic 326): Measurement of Credit Losses on Financial Instruments on January 1, 2020, which introduced a new current expected credit losses (“CECL”) model. The allowance for loan losses is established as management’s estimate of expected credit losses inherent in the Company’s lending activities; it is increased by the provision for credit losses and decreased by net charge-offs. The allowance for loan losses is evaluated quarterly by management based on regular reviews of the collectability of the Company’s loans.loans, and more often if deemed necessary. The Company develops and documents the allowance for loan losses methodology at the portfolio segment level —thelevel. The commercial loan portfolio is comprised of commercial and industrial (“C&I,&I”), commercial real estate (“CRE”), multifamily residential, and construction and land loans; and the consumer loan portfolio is comprised of single-family residential, home equity lines of credit (“HELOCs”), and other consumer loans.
The allowance for loan losses represents the portion of a loan’s amortized cost basis that the Company does not expect to collect due to anticipated credit losses over the loan’s contractual life, adjusted for prepayments. The Company measures the expected loan losses on a collective pool basis when similar risk characteristics exist. Models consisting of quantitative and qualitative components are designed for each pool to develop the expected credit loss estimates. Reasonable and supportable forecast periods vary by loan portfolio. The Company has adopted lifetime loss rate models for the portfolios, which use historical loss rates and forecast economic variables to calculate the expected credit losses for each loan pool.
When loans do not share similar risk characteristics, the Company evaluates the loan for expected credit losses on an individual basis. Individually assessed loans include nonaccrual and TDR loans. The Company evaluates loans for expected credit losses on an individual basis if, based on current information and events, it is probable that the Company will be unable to collect all amounts due according to the original contractual terms of the loan agreement. The following three different asset valuation measurement methods are available: (1) the present value of expected future cash flows, (2) the fair value of collateral less costs to sell, and (3) the loan's observable market price. The allowance for loan losses for collateral-dependent loans is determined based on the fair value of the collateral less costs to sell. For loans that are not collateral-dependent, the Company applies the present value of expected future cash flows valuation or the market value of the loan. When the loan is deemed uncollectible, it is the Company’s policy to promptly charge off the estimated credituncollectible amount against the allowance for loan losses.
The amortized cost of loans held-for-investment excludes accrued interest, which is included in Other assets on the Consolidated Balance Sheet. The Company has made an accounting policy election to not recognize an allowance for creditloan losses for accrued interest receivables as the Company reverses accrued interest if a loan is on nonaccrual status.
The allowance for loan losses is reported separately on the Consolidated Balance Sheet and the Provision for credit losses is reported on the Consolidated Statement of Income.
Allowance for Unfunded Credit Commitments — The allowance for unfunded credit commitments includes reserves provided for unfunded loan commitments, letters of credit, standby letters of credit (“SBLCs”) and recourse obligations for loans sold. The Company estimates the allowance for unfunded credit commitments over the contractual period in which the entity is exposed to credit risk via a present contractual obligation to extend credit. Within the period of credit exposure, the estimate of credit losses will considerCompany considers both the likelihood that funding will occur, and an estimate of the expected credit losses on the commitments that are expected to fund over their estimated lives.
The allowance for unfunded credit commitments is maintained at a level believed by management to be sufficient to absorb estimated expected credit losses related to unfunded credit facilities. The determination of the adequacy of the allowance is based on periodic evaluations of the unfunded credit facilities. For all off-balance sheet instruments and commitments, the unfunded credit exposure is calculated using utilization assumptions based on the Company's historical utilization experience in related portfolio segments. Loss rates are applied to the calculated exposure balances to estimate the allowance for unfunded credit commitments. Other elements such as credit risk factors for loans outstanding, terms and expiration dates of the unfunded credit facilities, and other pertinent information are considered to determine the adequacy of the allowance.
The allowance for unfunded credit commitments is included in the Accrued expenses and other liabilities on the Consolidated Balance Sheet. Changes to the allowance for unfunded credit commitments are included in Provision for credit losses on the Consolidated Income Statements.
Allowance for Credit Losses on Available-for-Sale Debt Securities — For each reporting period, everyeach AFS debt security that is in an unrealized loss position is individually analyzed as part of the Company’s ongoing assessments to determine whether a fair value below the amortized cost basis has resulted from a credit loss or other factors. The initial indicator of impairment is a decline in fair value below the amortized cost of the AFS debt security, excluding accrued interest. The Company first considers whether there is a plan to sell the AFS debt security or it is more-likely-than-not that it will be required to sell the AFS debt security before recovery of the amortized cost. In determining whether an impairment is due to credit related factors, the Company considers the severity of the decline in fair value, nature of the security, the underlying collateral, the financial condition of the issuer, changes in the AFS debt security’s ratings and other qualitative factors. For AFS debt securities that are fully guaranteed or issued by the U.S. government, or certain governmentgovernment-sponsored enterprises of high credit quality, the Company believes that the credit loss exposure on these securities is remote and applies a zero credit loss assumption.
When the Company does not intend to sell the impaired AFS debt security and it is more-likely-than-not that the Company will not be required to sell the impaired debt security prior to recovery of its amortized cost basis, the credit component of the unrealized loss of the impaired AFS debt security is recognized as an allowance for credit losses, with a corresponding Provision for credit losses on the Consolidated Statement of Income and the non-credit component is recognized in Other comprehensive income (loss) on the Consolidated Statement of Comprehensive Income, net of applicable taxes. At each reporting period, the Company increases or decreases the allowance for credit losses as appropriate, while limiting reversals of the allowance for credit losses to the extent of the amounts previously recorded. If the Company intends to sell the impaired debt security or it is more-likely-than-not that the Company will be required to sell the impaired debt security prior to recovering its amortized cost basis, the entire impairment amount is recognized as an adjustment to the debt security’s amortized cost basis, with a corresponding Provision for credit losses on the Consolidated Statement of Income.
The amortized cost of the Company’s AFS debt securities excludes accrued interest, which is included in Other assets on the Consolidated Balance Sheet. The Company has made an accounting policy election not to not recognize an allowance for credit losses for accrued interest receivables on AFS debt securities as the Company reverses any accrued interest if a debt security is impaired. As each AFS debt security has a unique security structure, where the accrual status is clearly determined when certain criteria listed in the terms are met, the Company assesses the default status of each security as defined by the debt security’s specific security structure.
Other-Than-Temporary Impairment AssessmentAllowance for Credit Losses on AFSHeld-to-Maturity Debt Securities Prior to the Adoption of the CECL Guidance, Applicable for the Years Ended December 31, 2019 and 2018 — For each reporting period,major HTM debt security type, the allowance for credit losses is estimated collectively for groups of securities with similar risk characteristics. For securities that do not share similar risk characteristics, the losses are estimated individually. The Company applies a zero credit loss assumption to certain HTM debt securities, classified as either AFS or held-to-maturityincluding debt securities that were in an unrealizedare either guaranteed or issued by the U.S. government or government-sponsored enterprises, are highly rated by nationally recognized statistical rating organizations (“NRSROs”), and have a long history of no credit losses. Any expected credit loss position were analyzed as partis recorded through the allowance for credit losses and deducted from the amortized cost basis of the Company’s ongoing OTTI assessment. security, reflecting the net amount the Company expects to collect.
The initial indicator of OTTI was a decline in fair value below the amortized cost of the Company’s HTM debt security. In determining whether OTTI had occurred, the Company considered the severity and duration of the declinesecurities excludes accrued interest, which is included in fair value, the length of time expected for recovery, the financial condition of the issuer, changes in the debt securities’ ratings and other qualitative factors, as well as whether the Company either planned to sell the debt security or it was more-likely-than-not that it would be required to sell the debt security before recovery of the amortized cost. When the Company did not intend to sell the impaired debt security and it was more-likely-than-not that the Company would not be required to sell the impaired debt security prior to recovery of its amortized cost basis, the credit component of an OTTI of the impaired debt security was recognized as OTTI lossOther assets on the Consolidated Statement of Income and the non-credit component was recognized in other comprehensive income. This appliedBalance Sheet. The Company has made an accounting policy election not to recognize an allowance for both AFS and held-to-maturitycredit losses for accrued interest receivables on HTM debt securities. Ifsecurities, as the Company intended to sell the impairedreverses any accrued interest against interest income if a debt security or it was more-likely-than-not thatis placed on nonaccrual status. The criteria used to place HTM debt securities on nonaccrual are largely similar to those described for loans. Any cash collected on nonaccrual HTM debt securities is applied to reduce the Company would be required to sell the impaired debt security prior to recovery of its amortized cost basis, the full amount of the impairment loss (equal to the difference between the debt security’s amortized cost basis and its fair value atnot as interest income. Generally, the balance sheet date) was recognized as OTTI loss onCompany returns an HTM security to accrual status when all delinquent interest and principal become current under the Consolidated Statementcontractual terms of Income. Following the recognitionsecurity, and the collectability of OTTI, the debt security’s new amortized cost basis was the previous basis minus the OTTI amount recognized in earnings.remaining principal and interest is no longer doubtful.
Allowance for Collateral-Dependent Financial Assets — A financial asset is considered collateral-dependent if repayment is expected to be provided substantially through the operation or sale of the collateral. The allowance for credit losses is measured on an individual basis for collateral-dependent financial assets and determined by comparing the fair value of the collateral minusless the cost to sell, to the amortized cost basis of the related financial asset at the reporting date. Other than loans, collateral-dependent financial assets could also include resale agreements. In arrangements which the borrower must continually adjust the collateral securing the asset to reflect changes in the collateral’s fair value (e.g., resale agreements), the Company estimates the expected credit losses on the basis of the unsecured portion of the amortized cost as of the balance sheet date. If the fair value of the collateral is equal to or greater than the amortized cost of the resale agreement, the expected losses would be zero. If the fair value of the collateral is less than the amortized cost of the asset, the expected losses are limited to the difference between the fair value of the collateral and the amortized cost basis of the resale agreement.
Allowance for Purchased Credit Deteriorated Assets — ASU 2016-13 replaces the concept of purchased credit impaired (“PCI”) accounting under ASC 310-30 Receivables - Loans and Debt Securities Acquired with Deteriorated Credit Quality with the concept of purchased financialPurchased assets with credit deterioration. The Company adopted ASU 2016-13 using the prospective transition approach for Purchased Credit Deteriorated (“PCD”) assets that were previously classified as PCI assets. PCD financial assets are defined as acquired individual financial assets (or groups with similar risk characteristics) that as of the date of acquisition, have experienced a more-than-insignificant deterioration in credit quality since origination.origination are deemed Purchased Credit Deteriorated (“PCD”) assets. For PCD HTM debt securities and PCD loans, the company records the allowance for credit losses by grossing up the initial amortized cost, which includes the purchase price and the allowance for credit losses. The expected credit losses of PCD debt securities are measured at the individual security level. The expected credit losses for PCD loans are measured based on the loan’s unpaid principal balance. Beginning January 1, 2020, for any asset designated as a PCD asset at the time of acquisition, the Company estimates and records an allowance for credit losses, which is added to the purchase price to establish the initial amortized cost basis of the financial asset. Hence,Under this approach, there is no income statement impact from the acquisition. Subsequent changes in the allowance for credit losses on PCD assets will be recognized in Provision for credit losses on the Consolidated Statement of Income. The non-credit discount or premium will be accreted to interest income based on the effective interest rate on the PCD assets determined after the gross-up for the allowance for credit losses.
Allowance for Credit Losses Prior to the Adoption of the CECL Guidance, Applicable for the Years Ended December 31, 2019 and 2018 — Prior to CECL adoption, the allowance of credit losses represented the Company’s estimate of probable credit losses inherent in the lending activities, and consisted of general and specific reserves. Impaired loans were subject to specific reserves. Non-impaired loans were evaluated as part of the general reserve. General reserves were calculated by utilizing both quantitative and qualitative factors. There were different qualitative risks for the loans in each portfolio segment. Predominant risk characteristics of the CRE, multifamily, single-family residential loans and HELOC loans considered the collateral and geographic locations of the properties collateralizing the loans. Predominant risk characteristics of the C&I loans included cash flows, debt service and collateral of the borrowers and guarantors, as well as the economic and market conditions.
Impaired Loans Prior to the Adoption of the CECL Guidance, Applicable for the Years Ended December 31, 2019 and 2018 — Impaired loans were identified and evaluated for impairment on an individual basis. A loan was considered impaired when, based on current information and events, it was probable that the Company would not be able to collect all scheduled payments of principal or interest due in accordance with the original contractual terms of the loan agreement. Factors considered by management in determining and measuring loan impairment included payment status, collateral value, and the probability of collecting scheduled principal and interest payments when due. Impaired loans were measured based on the present value of expected future cash flows discounted at a designated discount rate or, as appropriate, at the loan’s observable market price or the fair value of the collateral, if the loan was collateral dependent, less cost to sell.
Purchased Credit-Impaired LoansPrior to the Adoption of the CECL Guidance, Applicable for the Years Ended December 31, 2019 and 2018— Acquired loans were recorded at fair value as of acquisition date in accordance with ASC 805, Business Combinations. A purchased loan was deemed to be credit impaired when there was evidence of credit deterioration since its origination and it was probable at the acquisition date that the Company would be unable to collect all contractually required payments and was accounted for under ASC 310-30, Receivables — Loans and Debt Securities Acquired with Deteriorated Credit Quality. Under ASC 310-30, loans were recorded at fair value at acquisition date, factoring in credit losses expected to be incurred over the life of the loan. Accordingly, an allowance for loan losses was not carried over or recorded as of the acquisition date.
Variable Interest and Voting Interest Entities —The Company determines whether it has a controlling financial interest in an entity by first evaluating whether the entity is a voting interest entity or a variable interest entity (“VIE”). We first determine whether or not we have variable interests in the entity, which are investments or other interests that absorb portions of an entity’s expected losses or receive portions of the entity’s expected returns. If it is determined that we do not have a variable interest in the entity, no further analysis is required and the entity is not consolidated. A VIE is an entity that lacks equity investors or whose equity investors do not have a controlling financial interest in the entity through their equity investments. The Company consolidates a VIE if it has both the power to direct the activities of the VIE that most significantly impact the VIE’s economic performance and an obligation to absorb losses or the right to receive benefits that could potentially be significant to the VIE. For entities that do not meet the definition of a VIE, the entity is considered a voting interest entity. We consolidate these entities if we can exert control over the financial and operating policies of an investee, which can occur if we have a 50% or more voting interest in the entity.
Investments in Qualified Affordable Housing Partnerships, Net, Tax Credit and Other Investments, Net — The Company records the investments in qualified affordable housing partnerships, net, primarily using the proportional amortization method. Under the proportional amortization method, the Company amortizes the initial cost of the investment in proportion to the tax credits and other tax benefits received, and recognizes the amortization in Income tax expense on the Consolidated Statement of Income.
The Company records investments in tax credit and other investments, net, using either the equity method or costthe measurement alternative method of accounting. The tax credits are recognized on the Consolidated Financial Statements to the extent they are utilized on the Company’s income tax returns in the year the credit arises under the flow-through method of accounting. The investments are reviewedevaluated for impairmentpossible OTTI on an annual basis or on an interim basis, if an event occurs that would trigger potential impairment. OTTI charges and impairment recoveries are recorded within Amortization of tax credit and other investments on the Consolidated Statement of Income. See Note 2 — Fair Value Measurement and Fair Value of Financial Instruments to the Consolidated Financial Statements in this Form 10-K for a discussion on the Company’s impairment evaluation and monitoring process of tax credit investments.
Premises and Equipment, Net — The Company’s premises and equipment are stated at cost less accumulated depreciation and amortization. Depreciation and amortization are computed based on the straight-line method over the estimated useful lives of the various classes of assets. The ranges of estimated useful lives for the principal classes of assets are as follows:
| | | | | | | | |
|
| Premises and Equipment | | Useful Lives |
| Buildings | | 25 years |
| Furniture, fixtures and equipment, and building improvements | | 3 to 7 years |
| Leasehold improvements | | Term of lease or useful life, whichever is shorter |
|
The Company reviews its long-lived assets for impairment annually, or when events or changes in circumstances indicate that the carrying amounts of these assets may not be recoverable. An asset is considered impaired when the fair value, which is the expected undiscounted cash flows over the remaining useful life, is less than the net book value. The excess of the net book value over its fair value is charged as impairment loss to noninterest expense.
Goodwill and Other Intangible Assets — Goodwill represents the excess of the purchase price over the fair value of net assets acquired in an acquisition. Goodwill is tested for impairment on an annual basis as of December 31, or more frequently as events occur or circumstances change that indicate a potential impairment at the reporting unit level. The Company assesses goodwill for impairment at each operating segment level. The Company organizes its operations into 3three reporting segments: (1) Consumer and Business Banking; (2) Commercial Banking; and (3) Other. For information on how the reporting units are identified and the components are aggregated, see Note 1817 — Business Segments to the Consolidated Financial Statements in this Form 10-K. The Company has the option to perform a qualitative assessment of goodwill or elect to bypass the qualitative test and proceed directly to a quantitative test. If the Company performs a qualitative assessment of goodwill to test for impairment and concludes it is more likely than not that a reporting unit’s fair value is greater than its carrying value, quantitative tests are not required. If the qualitative analysis indicates that it is more likely than not that a reporting unit’s fair value is less than its carrying fair value, the Company is required to perform a quantitative assessment to determine if there is goodwill impairment. Factors considered in the qualitative assessments include but are not limited to macroeconomic conditions, industry and market considerations, financial performance of the respective operating segment and other reporting unit specific considerations. The Company uses a combined income and market approach in its quantitative valuation methodologies. A quantitative valuation involves determining the fair value of each reporting unit and comparing the fair value to its corresponding carrying value. Goodwill impairment loss is recorded as a charge to noninterest expensesexpense and an adjustment to the carrying value of goodwill. Subsequent reversals of goodwill impairment are not allowed.
Other intangible assets are comprised of core deposit intangibles and are included in Other assets on the Consolidated Balance Sheet. Core deposit intangibles represent the intangible value of depositor relationships resulting from deposits assumed in various acquisitions. Core deposit intangibles are amortized over the projected useful lives of the deposits, which is between eight to 15 years. The impairment test is performed annually, or more frequently as events occur or changes in circumstances indicate that the intangible asset’s carrying values may not be recoverable. Impairment on core deposit intangibles is recognized by writing down the asset as a charge to noninterest expense to the extent that the carrying value exceeds the estimated fair value.
Derivatives — As part of its asset and asset/liability management strategy, the Company uses derivative financial instruments to mitigate exposure to interest rate and foreign currency risks, and to assist customers with their risk management objectives. Derivatives utilized by the Company include primarily swaps, forwards and option contracts. Derivative instruments are included in Other assets or Accrued expenses and other liabilities on the Consolidated Balance Sheet at fair value. The related cash flows are recognized on the Cash flows from operating activities section on the Consolidated Statement of Cash Flows. The Company uses its accounting hedges based on the exposure being hedged as either fair value hedges, cash flow hedges or hedges of the net investments in certain foreign operations. For fair value hedges of interest rate risk, changes in fair value of derivatives are reported within Interest expense on the Consolidated Statement of Income. Changes in fair value of derivatives designated as hedges of the net investments in foreign operations are recorded as a component of AOCI. For cash flow hedges of floating-rate interest payments or receipts, the change in the fair value of hedges is recognized in AOCI on the Consolidated Balance Sheet and reclassified to earnings in the same period when the hedged cash flows impact earnings. Reclassified gains and losses of cash flow hedges are recorded in the same line item as the hedged interest payment within Interest expense or as interest receipts within Interest and dividend income on the Consolidated Statements of Income.
All derivatives designated as fair value hedges and hedges of the net investments in certain foreign operations are linked to specific hedged items or to groups of specific assets and liabilities on the Consolidated Balance Sheet. Cash flow hedges are linked to the forecasted transactions related to a recognized asset or liability. To qualify as an accounting hedge under the hedge accounting rules (versus an economic hedge where hedge accounting is not sought), a derivative must be highly effective in offsetting the risk designated as being hedged. The Company formally documents its hedging relationships at inception, including the identification of the hedging instruments and the hedged items, as well as its risk management objectives and strategies for undertaking the hedge transaction at the time the derivative contract is executed. Subsequent to inception, on a quarterly basis, the Company assesses whether the derivatives used in hedging transactions are highly effective in offsetting changes in the fair value of the hedged items or the cash flows of attributable hedged risks. Retrospective effectivenessThe quarterly assessment is also assessed, as well as the continued expectationperformed on both a prospective basis (to reconfirm forward-looking expectations that the hedge will remain effective prospectively.be highly effective) and a retrospective basis (to determine whether the hedging relationship was highly effective).
The Company discontinues hedge accounting prospectively when (i) a derivative is no longer highly effective in offsetting changes in fair value; (ii) a derivative expires, or is sold, terminated or exercised, or (iii) the Company determines that designation of a derivative as a hedge is no longer appropriate. If a fair value hedge is discontinued, the derivative will continue to be recorded on the Consolidated Balance Sheet at fair value with changes in fair value recognized on the Consolidated Statement of Income. When the hedged net investment is discontinued, any amounts that have not yet been recognized in earnings remain in AOCI until the net investment is either sold or substantially liquidated where the changes in the fair value of the derivatives are reclassified out of AOCI into Foreign exchange income on the Consolidated Statement of Income. If a cash flow hedge is discontinued but the hedged forecasted cash flow is still expected to happen, the derivative net gain or loss will remain in AOCI and be reclassified in tointo earnings in the periods in which the hedged forecasted cash flow affects earnings. If a cash flow hedge is discontinued and when it becomes probable that the forecasted cash flow is not expected to happen, the derivative net gain or loss will be reclassified into earnings immediately.
The Company also offers various interest rate, commodity and foreign currency, and energy commodityexchange derivative products to customers. These transactions are not linked to specific assets or liabilities on the Consolidated Balance Sheet or to forecasted transactions in a hedging relationship and, therefore, do not qualify for hedge accounting. These contracts are recorded at fair value with changes in fair value recorded in Customer derivative income or Foreign exchange incomeon the Consolidated Statement of Income.
As part of the Company’s loan origination process, from time to time, the Company obtains equity warrants to purchase preferred and/or common stock of public or private companies it provides loans to. Separately, the Company granted performance-based restricted stock units (“RSUs”) as part of its consideration for its investment in Rayliant Global Advisors Limited (“Rayliant”) during the third quarter of 2023. The vesting of these performance-based RSUs is contingent on Rayliant meeting certain financial performance targets during the future performance period. These equity warrantscontracts are accounted for as derivatives and recorded at fair value included in Other assetsor Accrued expenses and other liabilities on the Consolidated Balance Sheet with changes in fair value recorded in Lending fees or Customer derivative incomeon the Consolidated Statement of Income.
The Company is exposed to counterparty credit risk, which is the risk that counterparties to the derivative contracts do not perform as expected. Valuation of derivative assets and liabilities reflect the value of the instrument inclusive of the nonperformance risk. The Company uses master netting arrangements to mitigate counterparty credit risk in derivative transactions. To the extent the derivatives are subject to master netting arrangements, the Company takes into account the impact of master netting arrangements that allow the Company to settle all derivative contracts executed with the same counterparty on a net basis, and to offset the net derivative position with the related cash collateral and securities.securities collateral. The Company electedelects to offset derivative transactions with the same counterparty on the Consolidated Balance Sheet when a derivative transaction has a legally enforceable master netting arrangement and when it is eligible for netting under ASC 210-20-45-1, Balance Sheet Offsetting: Netting Derivative Positions on Balance Sheet. Derivative balances and related cash collateral are presented net on the Consolidated Balance Sheet. In addition, the Company appliedapplies the Settlement to Market treatment for the cash collateralizing our interest rate and commodity contracts with certain centrally cleared counterparties. As a result, derivative balances with these counterparties are considered settled by the collateral.
Fair Value — The Company records or discloses certain assets and liabilities at fair value. Fair value is defined as the price that would be received to sell an asset or the price that would be paid to transfer a liability in an orderly transaction between market participants at the measurement datedate. In determining the fair value of financial instruments, the Company uses various methods including market and income approaches. Based on these approaches, the Company utilizes certain assumptions that market participants would use in many cases, requires management to makepricing an asset or a number of significant judgments.liability. These inputs can be readily observable, market corroborated or generally unobservable. Fair value measurements are based on the exit price notion and are determined by maximizingthat maximizes the use of observable inputs and minimizes the use of unobservable inputs. However, for certain instruments, we must utilizeAll inputs, whether observable or unobservable, inputs in determining fair value due to the lack of observable inputs in the market, which requires greater judgment in the measurement of fair value. Based on the inputs used in the valuation techniques, the Company classifies its assets and liabilities measured and disclosed at fair valueare ranked in accordance with a three-levelprescribed fair value hierarchy (i.e., Level 1, Level 2that assigns the highest priority to quoted prices in active markets and Level 3) established under ASC 820, Fair Value Measurements.the lowest priority to prices derived from data lacking transparency. The Company records certain financial instruments, such as AFS debt securities, and derivativeCompany’s assets and liabilities atare classified in their entirety based on the lowest level of input that is significant to their fair value measurements. The fair value of the Company’s assets and liabilities is classified and disclosed in one of the following three categories:
•Level 1 — Valuation is based on a recurring basis. Certain financialquoted prices for identical instruments such as impaired loans and loans held-for-sale,traded in active markets.
•Level 2 — Valuation is based on quoted prices for similar instruments traded in active markets; quoted prices for identical or similar instruments traded in markets that are not carried atactive; and model-derived valuations whose inputs are observable and can be corroborated by market data.
•Level 3 — Valuation is based on significant unobservable inputs for determining the fair value each period butof assets or liabilities. These significant unobservable inputs reflect assumptions that market participants may require nonrecurring fair value adjustments due to lower-of-cost-or-market accountinguse in pricing the assets or write-downs of individual assets. liabilities.
For additional information on fair value, see Note 2 — Fair Value Measurement and Fair Value of Financial Instruments to the Consolidated Financial Statements in this Form 10-K.
Stock-Based Compensation — The Company issues stock-based awards to eligible employees, officers and directors, and accounts for the related costs in accordance with the provisions of ASC 505, Equity and ASC 718, Compensation — Stock Compensation. Stock-based compensation cost is measured at the grant date based on the fair value of the awards and expensed over the employee’s requisite service period.
The Company grants restricted stock units (“RSUs”),time-based RSUs, which include service conditions for vesting. Additionally, someCompensation cost for these time-based awards is based on the quoted market price of the Company’s common stock at the grant date. Compensation costs for time-based RSUs that will be settled in cash instead of shares are adjusted to fair value based on changes in the Company’s stock price up to the settlement date. In addition, the Company grants performance-based RSUs, which contain additional performance goals and market conditions that are required to be met in order for the awards to vest. RSUs may vest ratably over three years or cliff vest after three or five years of continued employment from the date of the grant. RSUs are authorized to settle predominantly in shares of the Company’s common stock. Compensation costexpense for those awardsthese performance-based RSUs is based on quotedthe grant-date fair value considers both performance and market priceconditions. Subsequently, the Company evaluates the probable outcome of the Company’s common stock atperformance conditions quarterly and makes cumulative adjustments for current and prior periods in compensation expense in the period of change. Market conditions subsequent to the grant date. Certain RSUsdate have no impact on the amount of compensation expense the Company will be settled in cash, which subjects these RSUs to variable accounting wherebyrecognize over the compensation cost is adjusted to fair value based on changes inlife of the Company’s stock price up to the settlement date.award. Compensation cost is amortized on a straight-line basis over the requisite service period for the entire award, which is generally the maximum vesting period of the award. Excess tax benefits and deficiencies on share-based payment awards are recognized within Income tax expense on the Consolidated Statement of Income.
For time-based RSUs, the grant-date fair value is measured at the fair value of the Company’s common stock as if the RSUs are vested and issued on the date of grant. For performance-based RSUs, the grant-date fair value considers both performance and market conditions. As stock-based compensation expense is estimated based on awards ultimately expected to vest, it is reduced by the expense related to awards expected to be forfeited. Forfeitures are estimated at the time of grant and are updated quarterly. If the estimated forfeitures are revised, a cumulative effect of changes in estimated forfeitures for the current and prior periods is recognized in compensation expense in the period of change. For performance-based RSUs, the compensation expense fluctuates based on the estimated outcome of meeting the performance conditions. The Company evaluates the probable outcome of the performance conditions quarterly and makes cumulative adjustments for current and prior periods in compensation expense in the period of change. Market conditions subsequent to the grant date have no impact on the amount of compensation expense the Company will recognize over the life of the award. Refer to Note 13 — Stock Compensation Plans toon the Consolidated Financial Statements in this Form 10-K for additional information.
Revenue from Contracts with Customers —The— The Company recognizes two primary types of revenue on its Consolidated Statement of Income: netNet interest income and noninterest income.Noninterest income. The Company adopted ASU 2014-09, RevenueCompany’s revenue from Contractscontracts with Customers (Topic 606) using the modified retrospective method on January 1, 2018. The adoptioncustomers consists of ASU 2014-09 did not have a material impact on the Consolidated Financial Statements. The majority of our revenue streams are out-of-scope of ASU 2014-09, since our primary revenue streams are accounted for in accordance with the financial instrument standards. Remaining in-scope noninterest income revenue streams include service charges and fees related to deposit accounts, and card income as well asand wealth management fees. These revenue streams as described below comprised 29%40%, 26%39% and 25%35% of total noninterest income for the years ended December 31, 2020, 20192023, 2022 and 2018,2021, respectively.
•Deposit Service Charges and Related Fee Income — The Company offers a range of deposit products to individuals and businesses, which includes savings, money market, checking and time deposit accounts. The deposit account services include ongoing account maintenance, as well as certain optional services such as various in-branch services, automated teller machine/debit card usage, wire transfer services or check orders. In addition, treasury management and business account analysis services are offered to commercial deposit customers. The monthly account fees may vary with the amount of average monthly deposit balances maintained, or the Company may charge a fixed monthly account maintenance fee if certain average balances are not maintained. In addition, each time a deposit customer selects an optional service, the Company may earn transaction fees, generally recognized by the Company at the point when the transaction occurs. For business analysis accounts, commercial deposit customers receive an earnings credit based on their account balance, which can be used to offset the cost of banking and treasury management services. Business analysis accounts that are assessed fees in excess of earnings credits received are typically charged at the end of each month, after all transactions are known and the credits are calculated. Deposit service charge and related fee income are recognized in the all operating segments.
•Card Income — Card income consists of merchant referral fees and interchange income. For merchant referral fees, the Company provides marketing and referral services to acquiring banks for merchant card processing services and earns variable referral fees based on transaction activities. The Company satisfies its performance obligation over time as the Company identifies, solicits, and refers business customers who are provided such services. The Company receives monthly fees net of consideration it pays to the acquiring bank performing the merchant card processing services. The Company recognizes revenue on a monthly basis when the uncertainty associated with the variable referral fees is resolved after the Company receives monthly statements from the acquiring bank. For interchange income, the Company, as a card issuer, has a stand ready performance obligation to authorize, clear, and settle card transactions. The Company earns or pays interchange fees, which are percentage-based on each transaction, and based on rates published by the corresponding payment network for transactions processed using their network. The Company measures its progress toward the satisfaction of its performance obligation over time as services are rendered, and the Company provides continuous access to this service and settles transactions as its customer or the payment network requires. Interchange income is presented net of direct costs paid to the customer and entities in their distribution chain, which are transaction-based expenses such as rewards program expenses and certain network costs. Revenue is recognized when the net profit is determined by the payment networks at the end of each day. Card income is recognized in consumer and business banking, and commercial banking segments.
•Wealth Management Fees —The Company provides investment planning services for customers including wealth management services, asset allocation strategies, portfolio analysis and monitoring, investment strategies and risk management strategies. The fees the Company earns are variable and are generally received monthly. The Company recognizes revenue for the services performed at quarter-end based on actual transaction details received from the broker-dealer with whom the Company engages. Wealth management fees isare recognized in both consumer and business banking, and commercial banking segments.
Income Taxes — The Company files consolidated federal income tax returns, foreign tax returns, and various combined and separate company state tax returns. The calculation of the Company'sCompany’s income tax provision and related tax accruals requires the use of estimates and judgments. Income tax expense comprisesconsists of two components: current and deferred. Current tax expense represents taxes to be paid or refunded for the current period and includes income tax expense related to our uncertain tax positions. Income tax liabilities (receivables) represent the estimated amounts due to (received(due from) the various taxing jurisdictions where the Company has established a tax presence.presence and are reported in Accrued expenses and other liabilities or Other assets on the Consolidated Balance Sheets. Deferred tax expense results from changes in deferred tax assets and liabilities between period, and is determined using the balance sheet method. Under the balance sheet method, the net deferred tax asset or liability is based on the tax effects of the differences between the book and tax basis of assets and liabilities. Deferred tax assets are also recognized for tax attributes such as net operating loss carryforwards and tax credit carryforwards. Management regularly reviews the Company’s tax positions and deferred tax balances. In concluding whether a valuation allowance is required, the Company considers all available evidence, both positive and negative, based on the more-likely-than-not criteria that such assets will be realized. Factors considered in this analysis include the Company’s ability to generate future taxable income, implement tax-planning strategies (as defined in ASC 740, Income Taxes) and utilize taxable income from prior carryback years (if such carryback is permitted under the applicable tax law), as well as future reversals of existing taxable temporary differences. To the extent a deferred tax asset is no longer expected more-likely-than-not to be realized, a valuation allowance is established. Deferred tax assets net of deferred tax liabilities are included in Other assets on the Consolidated Balance Sheet. See Note 11 — Income Taxes to the Consolidated Financial Statements in this Form 10-K for a discussion of management’s assessment of evidence considered by the Company in establishing a valuation allowance.
The Company reports a liability for unrecognized tax benefits resulting from uncertain tax positions taken, or expected to be taken, in an income tax return. Uncertain tax positions that meet the more-likely-than-not recognition threshold are measured to determine the amount of benefit to recognize. An uncertain tax position is measured at the largest amount of benefit that management believes has a greater than 50% likelihood of realization upon settlement. Tax benefits not meeting our realization criteria represent unrecognized tax benefits. The Company establishes a liability for potential taxes, interest and penalties related to uncertain tax positions based on facts and circumstances, including the interpretation of existing law, new judicial or regulatory guidance, and the status of tax audits.
Earnings Per Share — Basic EPS is computed by dividing net income available to common stockholders by the weighted-average number of common shares outstanding during each period. Diluted EPS is computed by dividingtaking net income, availableadjusted to common stockholdersremove any fair value changes related to liability-classified contingent equity contracts, divided by the weighted-average number of common shares outstanding during each period, plus any incremental dilutive common share equivalents calculated for warrantsoutstanding time- and performance-based RSUs outstandingand contingently issuable shares using the treasury stock method.
Foreign Currency Translation — The Company’s foreign subsidiary in China, East West Bank (China) Limited’s functional currency is in Chinese Renminbi (“RMB”). As a result, assets and liabilities of East West Bank (China) Limited are translated, for the consolidation purpose, from its functional currency into the reporting currency U.S. dollar (“USD”) using period-end spot foreign exchange rates. Revenues and expenses of East West Bank (China) Limited are translated, for the purpose of consolidation, from its functional currency into USD at the transaction date foreign exchange rates. The effects of those translation adjustments are reported in the Foreign currency translation adjustments account within Other comprehensive income (loss) on the Consolidated Statement of Comprehensive Income, net of any related hedged effects. For transactions that are denominated in a currency other than the functional currency, including transactions denominated in the local currencies of foreign operations that use the USD as their functional currency, the effects of changes in exchange rates are reported in Foreign exchange income on the Consolidated Statement of Income.
New Accounting Pronouncements Adopted in 20202023
| | | | | | | | | | | | | | |
| Standard | Required Date of Adoption | Description | EffectsEffect on Financial Statements | | | |
| Standards Adopted in 2020 | | | | | |
| | | | | | |
ASU 2016-13,2022-02, Financial Instruments — Credit Losses (Topic 326): Measurement of Credit Losses on Financial InstrumentsTroubled Debt Restructurings and subsequent related ASUsthe Vintage Disclosures | January 1, 2020
Early adoption is permitted on January 1, 2019.Effective for fiscal years beginning after December 15, 2022. | The ASU introduces2022-02 eliminates the
• accounting guidance for TDR, and requires the Company to apply the loan refinancing and restructuring guidance to determine whether a modification made to a loan results in a new CECL model that appliesloan or a continuation of an existing loan; and • requirement to mostuse a discounted cash flow method to measure receivables.
The guidance also requires • enhanced disclosures for certain loan refinancing and restructurings by creditors when the borrower is experiencing financial assets measured at amortized costdifficulty; and certain instruments, including trade • vintage disclosures of current period gross charge-offs (on a current year-to-date basis) by year of loan origination for financing receivables and other receivables, loan receivables, AFS and held-to-maturity debt securities, net investments in leases and off-balance sheet credit exposures. The CECL model utilizes a lifetime “expected credit loss” measurement objective forwithin the recognitionscope of credit losses at the time the financial asset is originated or acquired. The expected credit losses are adjusted in each period for changes in expected lifetime credit losses. ASU 2016-13 also eliminates the guidance for PCI loans, but requires an allowance for loan losses for purchased financial assets with more than an insignificant deterioration of credit since origination. The ASU also modifies the OTTI model for AFS debt securities to require an allowance for credit losses instead of a direct write-down. A reversal of the allowance for credit losses is allowed in future periods based on improvements in credit performance expectations. This ASU expands the disclosure requirements regarding an entity’s assumptions, models and methods for estimating the allowance for loan and lease losses, and requires disclosure of the amortized cost balance for each class of financial asset by credit quality indicator, disaggregated by the year of origination (i.e., by vintage year). The guidance should be applied using a modified retrospective approach through a cumulative-effect adjustment to retained earnings as of the beginning of the reporting period of adoption. The new guidance also allows optional relief for certain instruments measured at amortized cost with an option to irrevocably elect the fair value option under ASC Topic 825,326-20: Financial Instruments — Credit Losses — Measured at Amortized Cost. | The Company adopted ASU 2016-13 using2022-02 on January 1, 2023 on a prospective basis, except for the guidance related to the elimination of TDR recognition and measurement, which was adopted on a modified retrospective approach on January 1, 2020 without electing the fair value option on eligible financial instruments under ASU 2019-05. Theapproach.
This adoption of this ASU increased the allowance for loan losses on TDRs as of December 31, 2022 by $125.2$6 million and allowance for unfunded credit commitments by $10.5 million and an after-tax decrease todecreased opening retained earnings of $98.0 million on January 1, 2020. The increase to allowance for loan losses was primarily related to the C&I and CRE loan portfolios. The Company did not record an allowance for credit losses related to the Company’s AFS debt securities as a result of this adoption. Disclosures for periods after January 1, 2020 are presented in accordance with ASC 326 while prior period amounts continue to be reported in accordance with the incurred-loss methodology before CECL adoption.
The Company has elected the CECL phase-in option provided2023 by regulatory capital rules, which delays the impact of CECL on regulatory capital for two years, followed by a three-year transition period. As a result, the effects of CECL on the Company’s and the Bank’s regulatory capital will be delayed through the year 2021, after which the effects will be phased-in over a three-year period from January 1, 2022 through December 31, 2024.$4 million after-tax.
| | | |
| ASU 2017-04, Intangibles — Goodwill and Other (Topic 350): Simplifying the Test for Goodwill Impairment
| January 1, 2020
Early adoption is permitted for interim or annual goodwill impairment tests with measurement dates after January 1, 2017. | The ASU simplifies the accounting for goodwill impairment. Under this guidance, an entity will no longer perform a hypothetical purchase price allocation to measure goodwill impairment. Instead, an impairment loss will be recognized when the carrying amount of a reporting unit exceeds its fair value and the loss recognized should not exceed the total amount of goodwill allocated to that reporting unit. The guidance also eliminates the requirement to perform a qualitative assessment for any reporting units with a zero or negative carrying amount. This guidance should be applied prospectively. | The Company adopted this guidance on January 1, 2020. The adoption of this guidance did not have a material impact on the Company’s Consolidated Financial Statements. | | |
| ASU 2018-15, Intangibles — Goodwill and Other — Internal-Use Software (Subtopic 350-40) Customer’s Accounting for Implementation Costs Incurred in a Cloud Computing Arrangement That Is a Service Contract
| January 1, 2020 | The ASU amends ASC Topic 350-40 to align the accounting for costs incurred in a cloud computing arrangement with the guidance on developing internal use software. Specifically, if a cloud computing arrangement is deemed to be a service contract, certain implementation costs are eligible for capitalization. The new guidance prescribes the balance sheet and income statement presentation and cash flow classification for the capitalized costs and related amortization expense. The amendments in this ASU should be applied either retrospectively or prospectively to all implementation costs incurred after the date of adoption. | The Company adopted this guidance on a prospective basis on January 1, 2020. The adoption of this guidance did not have a material impact on the Company’s Consolidated Financial Statements. | | |
| | | | | | |
| | | | | | |
| | | | | | |
| | | | | | |
| | | | | | |
| | | | | | |
| | | | | | |
The following standards were adopted on January 1, 2023, but they did not have a material impact on the Company’s Consolidated Financial Statements:
Recent
•ASU 2021-08, Business Combinations (Topic 805): Accounting Pronouncementfor Contract Assets and Contract Liabilities from Contracts with Customers
•ASU 2022-01, Derivatives and Hedging (Topic 815): Fair Value Hedging — Portfolio Layer Method
•ASU 2022-04, Liabilities — Supplier Finance Program (Subtopic 405-50): Disclosures of Supplier Finance Program Obligations
Accounting Pronouncements Adopted in 2024
| | | | | | | | | | | |
| Standard | Required Date of Adoption | Description | Effect on Financial Statements |
| Standard Not Yet Adopted | | |
| | | |
| | | |
ASU 2020-04, 2023-02,Reference Rate Reform (Topic 848) Investments — Equity Method and Joint Ventures (Topic 323): Facilitation ofAccounting for Investments in Tax Credit Structures Using the Effects of Reference Rate Reform on Financial ReportingProportional Amortization Method
| January 1, 2024 | EffectiveASU 2023-02 expands the scope of the proportional amortization method to equity tax credit investment programs if certain conditions are met. Previously, the proportional amortization method could only be used for all entities as of March 12, 2020
through December 31, 2022. | In March 2020, the FASB issued an accounting standard relatedinvestments in low-income housing tax credit structures. Under this guidance, companies are able to contracts or hedging relationships that reference London interbank offered rate or other reference rates that are expected to be discontinued due to reference rate reform. This ASU provides temporary optional expedients and exceptions regarding the accounting requirements related to the modification of certain contracts, hedging relationships and other transactions that are affected by the reference rate reform. The guidance permits the Company to makeelect, on a one-time election to sell and/or transfer qualifying held-to-maturity securities, and nottax credit program-by-tax credit program basis, to apply modification accountingthe proportional amortization method to all equity investments meeting the criteria in ASC 323-740-25-1.
The amendments in this guidance must be applied on a modified retrospective or remeasure lease payments in lease contracts if the changes to the contract are related to the discontinuation of the reference rate. If certain criteria are met, the amendments also allow exceptions to the de-designation criteria of the hedging relationship and the assessment of hedge effectiveness during the transition period. This one time election may be made at any time after March 12, 2020, but no later than December 31, 2022.a retrospective basis. | The Company adopted this guidanceASU 2023-02 on a prospective basis in January 2021. At the time of adoption, the guidance did not have a material impact on the Company’s Consolidated Financial Statements. The Company will continue to track the exposure as of each reporting period and to assess the impact as the reference rate transition occurs through the cessation of LIBOR. |
ASU 2021-01, Reference Rate Reform (Topic 848): Scope
| Effective immediately as of January 7, 2021 through December 31, 20221, 2024, for all entities. | In January 2021, the FASB issued ASU 2021-01, which expanded the scope of Topic 848 to include all affected derivatives and give market participants the ability to apply certain aspectstax credit investments under a modified retrospective basis. The impact of the contract modification and hedge accounting expedients to derivative contracts affectedadoption decreased opening retained earnings on January 1, 2024 by the discounting transition. The amendments of this guidance may be elected retrospectively as of any date from the beginning of the interim period that includes March 12, 2020, or prospectively to new modifications made on or after any date that includes January 7, 2021.$10 million. | The Company adopted this guidance on a prospective basis in January 2021. At the time of adoption, the guidance |
The following standards were adopted on January 1, 2024, but they did not have a material impact on the Company’s Consolidated Financial Statements:
•ASU 2023-01, Leases (Topic 842): Common Control Arrangements
•ASU 2022-03, Fair Value Measurement (Topic 820) Fair Value Measurement of Equity Securities Subject to Contractual Sale Restrictions
Recent Accounting Pronouncements Yet to be Adopted
| | | | | | | | | | | |
| Standard | Required Date of Adoption | Description | Effect on Financial Statements |
| | | |
| | | |
ASU No. 2023-07, Segment Reporting (Topic 280): Improvements to Reportable Segment Disclosures | December 31, 2024.
Early adoption is permitted | ASU 2023-07 expands the disclosure requirements for reportable segments of public entities by adding the following disclosure requirements:
• Requires, on an annual and interim basis, significant segment expenses that are regularly provided to the chief operating decision maker (“CODM”) and included within each reported measure of segment profit or loss. • Requires , on an annual and interim basis, amount and composition of other segment items. This amount reconciles segment revenues, less the significant segment expenses, to the reported measure of segment profit or loss. • Expands the current interim disclosure requirements to require all existing annual disclosures about a reportable segment’s profit or loss and assets also be made on an interim basis. • Clarifies that if a CODM uses more than one measure of segment profit or loss, then the entity may disclose one or more measures, but at least one measure should be that which is most consistent with GAAP measurement principles. • Requires annual disclosure of the title and position of the CODM as well as explanation of how the CODM uses the reported measures in assessing segment performance and allocating resources. | The Company is currently evaluating the impact of this guidance on the Company’s Consolidated Financial Statements. |
ASU No. 2023-09, Income Taxes (Topic 740): Improvements to Income Tax Disclosures | December 31, 2025
Early adoption is permitted. | ASU 2023-09 amends the disclosure requirements for income taxes, including the requirement for further disaggregation of the income tax rate reconciliation and income taxes paid disclosures.
The amendments in this guidance must be applied prospectively, with the option to apply retrospectively. | The Company is currently evaluating the impact of this guidance on the Company’s Consolidated Financial Statements. |
The following standard will be adopted on January 1, 2025 and is not expected to have a material impact on the Company’s Consolidated Financial Statements:
•ASU 2023-05, Business Combinations — Joint Venture Formations (Subtopic 805-60): Recognition and Initial Measurement
Note 2 — Fair Value Measurement and Fair Value of Financial Instruments
Fair Value Determination
Fair value is defined as the price that would be received to sell an asset or the price that would be paid to transfer a liability in an orderly transaction between market participants at the measurement date. In determining the fair value of financial instruments,Under applicable accounting standards, the Company uses various methods including market and income approaches. Based on these approaches, the Company utilizes certain assumptions that market participants would use in pricing an asset ormeasures a liability. These inputs can be readily observable, market corroborated or generally unobservable. The Company utilizes valuation techniques that maximize the useportion of observable inputs and minimize the use of unobservable inputs. The fair value hierarchy noted below is based on the quality and reliability of the information used to determine fair value. The fair value hierarchy gives the highest priority to quoted prices available in active markets and the lowest priority to prices derived from data lacking transparency. The fair value of the Company’sits assets and liabilities is classified and disclosed in one of the following three categories:
•Level 1 — Valuation is based on quoted prices for identical instruments traded in active markets.
•Level 2 — Valuation is based on quoted prices for similar instruments traded in active markets; quoted prices for identical or similar instruments traded in markets that are not active; and model-derived valuations whose inputs are observable and can be corroborated by market data.
•Level 3 — Valuation is based on significant unobservable inputs for determining theat fair value of assets or liabilities.value. These significant unobservable inputs reflect assumptions that market participants may use in pricing the assets or liabilities.
The classification of assets and liabilities within the hierarchy is based on whether inputs to the valuation methodology used are observable or unobservable, and the significance of those inputs in the fair value measurement. The Company’s assets and liabilities are classified in their entiretypredominantly recorded at fair value on a recurring basis. From time to time, certain assets and liabilities are measured at fair value on a nonrecurring basis; that is, they are subject to fair value adjustments only as required through the application of an accounting method such as lower of cost or fair value or write-down of individual assets. The Company categorizes its assets and liabilities into three levels based on the lowest level of input that is significant to theirestablished fair value measurements.hierarchy and conducts a review of fair value hierarchy classifications on a quarterly basis. For more information regarding the fair value hierarchy and how the Company measures fair value, see Note 1— Summary of Significant Accounting Policies — Significant Accounting Policies — Fair Valueto the Consolidated Financial Statements in this Form 10-K.
Assets and Liabilities Measured at Fair Value on a Recurring Basis
The following section describes the valuation methodologies used by the Company to measure financial assets and liabilities on a recurring basis, as well as the general classification of these instruments pursuant towithin the fair value hierarchy.
Available-for-Sale Debt Securities — When available, the Company uses quoted market prices to determine the fair value of AFS debt securities, which are classified as Level 1. Level 1 AFS debt securities are comprised of U.S. Treasury securities. The fair value of other AFS debt securities is generally determined by independent external pricing service providers who have experience in valuing these securities or by taking the average quoted market prices obtained from independent external brokers. The valuations provided by the third-party pricing service providers are based on observable market inputs, which include benchmark yields, reported trades, issuer spreads, benchmark securities, bids, offers, prepayment expectationexpectations and reference data obtained from market research publications. Inputs used by the third-party pricing service providers in valuing collateralized mortgage obligations and other securitization structures also include new issuenewly issued data, monthly payment information, whole loan collateral performance, tranche evaluation and “To Be Announced” prices. In valuing securities issued by state and political subdivisions, inputs used by third-party pricing service providers also include material event notices. The valuations provided by the brokers incorporate information from their trading desks,research and other market data.
On a monthly basis, the Company validates the valuations provided by third-party pricing service providers to ensure that the fair value determination is consistent with the applicable accounting guidance and the financial instruments are properly classified in the fair value hierarchy. To perform this validation, the Company evaluates the fair values of securities by comparing the fair values provided by the third-party pricing service providers to prices from other available independent sources for the same securities. When significant variances in prices are identified, the Company further compares inputs used by different sources to ascertain the reliability of these sources. On a quarterly basis, the Company reviews the documentation received from thevaluation inputs and methodology furnished by third-party pricing service providers regarding the valuation inputs and methodology used for each categorysecurity category. On an annual basis, the Company assesses the reasonableness of securities.broker pricing by reviewing the related pricing methodologies. This review includes corroborating pricing with market data, performing pricing input reviews under current market-related conditions, and investigating security pricing by instrument as needed.
When a quoted price in an active market exists for the identical security, this price is used to determine the fair value and the AFS debt security is classified as Level 1. Level 1 AFS debt securities consist of U.S. Treasury securities. When pricing is unavailable from third-party pricing service providers for certain securities, the Company requests market quotes from various independent external brokers and utilizes the average quoted market prices. TheseIn addition, the Company obtains market quotes from other official published sources. As these valuations are based on observable inputs in the current marketplace, andthey are classified as Level 2. The Company periodically communicates with the independent external brokers to validate their pricing methodology. Information such as pricing sources, pricing assumptions, data inputs and valuation technique are reviewed.
Equity Securities — Equity securities consisted of mutual funds as of both December 31, 20202023 and 2019.2022. The Company invested in these mutual funds for Community Reinvestment Act (“CRA”) purposes. The Company uses net asset value (“NAV”) information to determine the fair value of these equity securities. When NAV is available periodically and the equity securities can be put back to the transfer agents at the publicly available NAV, the fair value of the equity securities is classified as Level 1. When NAV is available periodically, but the equity securities may not be readily marketable at its periodic NAV in the secondary market, the fair value of these equity securities is classified as Level 2.
Interest Rate Contracts — The Company enters into Interest rate contracts consist of interest rate swapswaps and option contracts with its borrowers to lock in attractive intermediate and long-term interest rates, resulting in the customer obtaining a synthetic fixed-rate loan. To economically hedge against the interest rate risks in the products offered to its customers, the Company enters into mirrored offsetting interest rate contracts with third-party financial institutions. The Company also enters into interest rate swap contracts with institutional counterparties to hedge against certain variable interest rate borrowings.options. The fair value of the interest rate swaps is determined using the market standard methodology of netting the discounted future fixed cash payments (or receipts) and the discounted expected variable cash receipts (or payments). The fair value of the interest rate options, which consist of floors and caps, is determined using the market standard methodology of discounting the future expected cash receipts that would occur if variable interest rates fall below (rise above) the strike rate of the floors (caps). In addition, to comply with the provisions of ASC 820, Fair Value Measurement, the Company incorporates credit valuation adjustments to appropriately reflect both its own nonperformance risk and the respective counterparty’s nonperformance risk in the fair value measurements of its derivatives. The credit valuation adjustments associated with the Company’s derivatives utilize model-derived credit spreads, which are Level 3 inputs. AsConsidering the observable nature of December 31, 2020 and 2019,all other significant inputs utilized, the Company has assessed the significance of the impact of the credit valuation adjustments on the overall valuation of these interest rate contracts and has determined that the credit valuation adjustments were not significant to the overall valuation of its derivative portfolios. The Company classifies these derivative instruments as Level 2 due to the observable nature of the significant inputs utilized.2.
Foreign Exchange Contracts — The Company enters intofair value of foreign exchange contracts to accommodate the business needs of its customers. For a majority of the foreign exchange contracts entered with its customers, the Company entered into offsetting foreign exchange contracts with third-party financial institutions to manage its exposure. The Company also utilizes foreign exchange contracts that are not designated as hedging instruments to mitigate the economic effect of fluctuations in certain foreign currency on-balance sheet assets and liabilities, primarily foreign currency denominated deposits that it offers to its customers. The fair value is determined at each reporting period based on changes in the foreign exchange rates. These are over-the-counter contracts where quoted market prices are not readily available. Valuation is measured using conventional valuation methodologies with observable market data. Due to the short-term nature of the majority of these contracts, the counterparties’ credit risks are considered nominal and result in no adjustments to the valuation of the foreign exchange contracts. Due to the observable nature of the inputs used in deriving the fair value of these contracts, the valuation of foreign exchange contracts areis classified as Level 2. As of both December 31, 20202023 and 2019,2022, the Bank held foreign currency non-deliverable forward contracts to hedge its net investment in its China subsidiary, East West Bank (China) Limited, a non-USD functional currency subsidiary in China.subsidiary. These foreign currency non-deliverable forward contracts were designated as net investment hedges. The fair value of foreign currency non-deliverable forward contracts is determined by comparing the contracted foreign exchange rate to the current market foreign exchange rate. Key inputs of the current market exchange rate include the spot rates and forward rates of the contractual currencies. Foreign exchange forward curves are used to determine which forward rate pertains to a specific maturity. Due to the observable nature of the inputs used in deriving the estimated fair value, these instruments are classified as Level 2.
Credit Contracts — TheCredit contracts utilized by the Company may periodically enter intoare comprised of credit risk participation agreements (“RPAs”) to manageentered into by the credit exposure on interest rate contracts associated with the syndicated loans. The Company may enter into protection sold or protection purchased RPAs with institutional counterparties. The fair value of the RPAs is calculated by determining the total expected asset or liability exposure of the derivatives to the borrowers and applying the borrowers’ credit spread to that exposure. Total expected exposure incorporates both the current and potential future exposure of the derivatives, derived from using observable inputs, such as yield curves and volatilities. The majorityDue to the observable nature of theall other significant inputs used toin deriving the estimated fair value, the RPAscredit contracts are observable;accordingly, RPAs fall withinclassified as Level 2.
Equity Contracts — As partEquity contracts consist of the loan origination process, the Company periodically obtains warrants to purchase preferred and/common or commonpreferred stock of technology and life sciences companies to which it provides loans. As of December 31, 2020 and 2019, the warrants included on the Consolidated Financial Statements were from both public and private companies.companies, and any liability-classified contingent issuable shares of the Company. The Company values thesefair value of the warrants is based on the Black-Scholes option pricing model. For warrants from public companies, the model uses the underlying stock price, stated strike price, warrant expiration date, risk-free interest rate based on a duration-matched U.S. Treasury rate, and market-observable company-specific optionequity volatility as inputs to value the warrants. Due to the observable nature of the inputs used in deriving the estimated fair value, warrants from public companies are classified as Level 2. For warrants from private companies, the model uses inputs such as the offering price observed in the most recent round of funding, stated strike price, warrant expiration date, risk-free interest rate based on duration-matched U.S. Treasury rate and optionequity volatility. The Company applies proxy volatilities based on the industry sectors of the private companies. The model values are then adjusted for a general lack of liquidity due to the private nature of the underlying companies. Since both optionequity volatility and liquidity discount assumptions are subject to management’s judgment, measurement uncertainty is inherent in the valuation of private companies’company warrants. Due to the unobservable nature of the optionequity volatility and liquidity discount assumptions used in deriving the estimated fair value, warrants from private companies are classified as Level 3. Given that the Company holds long positions in all warrants, an increase in volatility assumption would generally result in an increase in fair value. A higher liquidity discount would result in a decrease in fair value. On a quarterly basis, the changes in the fair value of warrants from private companies are reviewed for reasonableness, and a measurement of uncertainty analysis on the optionequity volatility and liquidity discount assumptions is performed.
In connection with the Company’s acquisition of a 49.99% equity interest in Rayliant during the third quarter of 2023, the Company granted performance-based RSUs as part of its consideration. The vesting of these equity contracts is contingent on Rayliant meeting certain financial performance targets, and they are accounted for as a derivative liability. The fair value of these liability-classified equity contracts varies based on the operating revenue and operating EBITDA of Rayliant to be achieved during the future performance period. Due to the unobservable nature of the input assumptions, these equity contracts are classified as Level 3. For additional information on the equity contracts, refer to Note 5 — Derivatives and Note 7 — Investments in Qualified Affordable Housing Partnerships, Tax Credit and Other Investments, Net and Variable Interest Entities to the Consolidated Financial Statements in this Form 10-K.
Commodity Contracts — The Company enters into energy commodityCommodity contracts in the formconsist of swaps and options with its commercial loan customers to allow them to hedge against the risk of fluctuation in energyreferencing commodity prices.products. The fair value of the commodity option contracts is determined using the Black-Scholes model and assumptions that include expectations of future commodity price and volatility. The future commodity contract price is derived from observable inputs such as the market price of the commodity. Commodity swaps are structured as an exchange of fixed cash flows for floating cash flows. The fair value of the commodity swaps is determined using the market standard methodology of netting the discounted future fixed cash payments (or receipts) and the discounted expected variable cash receipts (or payments) based on the market prices of the commodity. The fixed cash flows are predetermined based on the known volumes and fixed price as specified in the swap agreement. The floating cash flows are correlated with the change of forward commodity prices, which is derived from market corroborated futures settlement prices. The fair value of the commodity swaps is determined using the market standard methodology of netting the discounted future fixed cash payments (or receipts) and the discounted expected variable cash receipts (or payments) based on the market prices of the commodity. As a result, the Company classifies these derivative instruments as Level 2 due to the observable nature of the significant inputs utilized.
The following tables present financial assets and liabilities that are measured at fair value on a recurring basis as of December 31, 20202023 and 2019:2022:
| | | | | | | | | | | | | | | | | | | | | | | | | | |
|
| ($ in thousands) | | Assets and Liabilities Measured at Fair Value on a Recurring Basis
as of December 31, 2020 |
| Quoted Prices in
Active Markets
for Identical
Assets
(Level 1) | | Significant
Other
Observable
Inputs
(Level 2) | | Significant
Unobservable
Inputs
(Level 3) | | Total
Fair Value |
| AFS debt securities: | | | | | | | | |
| U.S. Treasury securities | | $ | 50,761 | | | $ | 0 | | | $ | 0 | | | $ | 50,761 | |
| U.S. government agency and U.S. government sponsored enterprise debt securities | | — | | | 814,319 | | | 0 | | | 814,319 | |
| U.S. government agency and U.S. government sponsored enterprise mortgage-backed securities: | | | | | | | | |
| Commercial mortgage-backed securities | | 0 | | | 1,153,770 | | | 0 | | | 1,153,770 | |
| Residential mortgage-backed securities | | 0 | | | 1,660,894 | | | 0 | | | 1,660,894 | |
| Municipal securities | | 0 | | | 396,073 | | | 0 | | | 396,073 | |
| Non-agency mortgage-backed securities: | | | | | | | | |
| Commercial mortgage-backed securities | | 0 | | | 239,842 | | | 0 | | | 239,842 | |
| Residential mortgage-backed securities | | 0 | | | 289,775 | | | 0 | | | 289,775 | |
| Corporate debt securities | | 0 | | | 405,968 | | | 0 | | | 405,968 | |
| Foreign government bonds | | 0 | | | 182,531 | | | 0 | | | 182,531 | |
| Asset-backed securities | | 0 | | | 63,231 | | | 0 | | | 63,231 | |
| Collateralized loan obligations (“CLOs”) | | 0 | | | 287,494 | | | 0 | | | 287,494 | |
| Total AFS debt securities | | $ | 50,761 | | | $ | 5,493,897 | | | $ | 0 | | | $ | 5,544,658 | |
| | | | | | | | |
| Investments in tax credit and other investments: | | | | | | | | |
Equity securities (1) | | $ | 22,548 | | | $ | 8,724 | | | $ | 0 | | | $ | 31,272 | |
| Total investments in tax credit and other investments | | $ | 22,548 | | | $ | 8,724 | | | $ | 0 | | | $ | 31,272 | |
| | | | | | | | |
| Derivative assets: | | | | | | | | |
| Interest rate contracts | | $ | 0 | | | $ | 489,132 | | | $ | 0 | | | $ | 489,132 | |
| Foreign exchange contracts | | 0 | | | 30,300 | | | 0 | | | 30,300 | |
| Credit contracts | | 0 | | | 13 | | | 0 | | | 13 | |
| Equity contracts | | 0 | | | 585 | | | 273 | | | 858 | |
| Commodity contracts | | 0 | | | 82,451 | | | 0 | | | 82,451 | |
| Gross derivative assets | | $ | 0 | | | $ | 602,481 | | | $ | 273 | | | $ | 602,754 | |
Netting adjustments (2) | | $ | 0 | | | $ | (101,512) | | | $ | 0 | | | $ | (101,512) | |
| Net derivative assets | | $ | 0 | | | $ | 500,969 | | | $ | 273 | | | $ | 501,242 | |
| | | | | | | | |
| Derivative liabilities: | | | | | | | | |
| Interest rate contracts | | $ | 0 | | | $ | 317,698 | | | $ | 0 | | | $ | 317,698 | |
| Foreign exchange contracts | | 0 | | | 22,759 | | | 0 | | | 22,759 | |
| Credit contracts | | 0 | | | 206 | | | 0 | | | 206 | |
| Commodity contracts | | 0 | | | 84,165 | | | 0 | | | 84,165 | |
| Gross derivative liabilities | | $ | 0 | | | $ | 424,828 | | | $ | 0 | | | $ | 424,828 | |
Netting adjustments (2) | | $ | 0 | | | $ | (184,697) | | | $ | 0 | | | $ | (184,697) | |
| Net derivative liabilities | | $ | 0 | | | $ | 240,131 | | | $ | 0 | | | $ | 240,131 | |
|
(1)Equity securities consist of mutual funds with readily determinable fair values.
(2)Represents balance sheet netting of derivative assets and liabilities and related cash collateral under master netting agreements or similar agreements. See Note 5 — Derivatives to the Consolidated Financial Statements in this Form 10-K for additional information. | | | | | | | | | | | | | | | | | | | | | | | | | | |
|
| | Assets and Liabilities Measured at Fair Value on a Recurring Basis
as of December 31, 2023 |
| ($ in thousands) | | Level 1 | | Level 2 | | Level 3 | | Total Fair Value |
| AFS debt securities: | | | | | | | | |
| U.S. Treasury securities | | $ | 1,060,375 | | | $ | — | | | $ | — | | | $ | 1,060,375 | |
| U.S. government agency and U.S. government sponsored enterprise debt securities | | — | | | 364,446 | | | — | | | 364,446 | |
| U.S. government agency and U.S. government sponsored enterprise mortgage-backed securities: | | | | | | | | |
| Commercial mortgage-backed securities | | — | | | 468,259 | | | — | | | 468,259 | |
| Residential mortgage-backed securities | | — | | | 1,727,594 | | | — | | | 1,727,594 | |
| Municipal securities | | — | | | 261,016 | | | — | | | 261,016 | |
| Non-agency mortgage-backed securities: | | | | | | | | |
| Commercial mortgage-backed securities | | — | | | 367,516 | | | — | | | 367,516 | |
| Residential mortgage-backed securities | | — | | | 553,671 | | | — | | | 553,671 | |
| Corporate debt securities | | — | | | 502,425 | | | — | | | 502,425 | |
| Foreign government bonds | | — | | | 227,874 | | | — | | | 227,874 | |
| Asset-backed securities | | — | | | 42,300 | | | — | | | 42,300 | |
| Collateralized loan obligations (“CLOs”) | | — | | | 612,861 | | | — | | | 612,861 | |
| Total AFS debt securities | | $ | 1,060,375 | | | $ | 5,127,962 | | | $ | — | | | $ | 6,188,337 | |
| | | | | | | | |
| Investments in qualified affordable housing partnerships, tax credit and other investments, net: | | | | | | | | |
| Equity securities | | $ | 20,509 | | | $ | 4,150 | | | $ | — | | | $ | 24,659 | |
| Total investments in qualified affordable housing partnerships, tax credit and other investments, net | | $ | 20,509 | | | $ | 4,150 | | | $ | — | | | $ | 24,659 | |
| | | | | | | | |
| Derivative assets: | | | | | | | | |
| Interest rate contracts | | $ | — | | | $ | 473,907 | | | $ | — | | | $ | 473,907 | |
| Foreign exchange contracts | | — | | | 57,072 | | | — | | | 57,072 | |
| Credit contracts | | — | | | 1 | | | — | | | 1 | |
| Equity contracts | | — | | | — | | | 336 | | | 336 | |
| Commodity contracts | | — | | | 79,604 | | | — | | | 79,604 | |
| Gross derivative assets | | $ | — | | | $ | 610,584 | | | $ | 336 | | | $ | 610,920 | |
Netting adjustments (1) | | $ | — | | | $ | (312,792) | | | $ | — | | | $ | (312,792) | |
| Net derivative assets | | $ | — | | | $ | 297,792 | | | $ | 336 | | | $ | 298,128 | |
| | | | | | | | |
| Derivative liabilities: | | | | | | | | |
| Interest rate contracts | | $ | — | | | $ | 433,936 | | | $ | — | | | $ | 433,936 | |
| Foreign exchange contracts | | — | | | 42,564 | | | — | | | 42,564 | |
Equity contracts (2) | | — | | | — | | | 15,119 | | | 15,119 | |
| Credit contracts | | — | | | 25 | | | — | | | 25 | |
| Commodity contracts | | — | | | 121,670 | | | — | | | 121,670 | |
| Gross derivative liabilities | | $ | — | | | $ | 598,195 | | | $ | 15,119 | | | $ | 613,314 | |
Netting adjustments (1) | | $ | — | | | $ | (76,170) | | | $ | — | | | $ | (76,170) | |
| Net derivative liabilities | | $ | — | | | $ | 522,025 | | | $ | 15,119 | | | $ | 537,144 | |
|
| | | ($ in thousands) | | Assets and Liabilities Measured at Fair Value on a Recurring Basis
as of December 31, 2019 |
| | | Assets and Liabilities Measured at Fair Value on a Recurring Basis
as of December 31, 2022 | |
| | Assets and Liabilities Measured at Fair Value on a Recurring Basis
as of December 31, 2022 | |
| | Assets and Liabilities Measured at Fair Value on a Recurring Basis
as of December 31, 2022 | |
| | Assets and Liabilities Measured at Fair Value on a Recurring Basis
as of December 31, 2022 | |
| | Assets and Liabilities Measured at Fair Value on a Recurring Basis
as of December 31, 2022 | |
| | Assets and Liabilities Measured at Fair Value on a Recurring Basis
as of December 31, 2022 | |
| | Assets and Liabilities Measured at Fair Value on a Recurring Basis
as of December 31, 2022 | |
| | Assets and Liabilities Measured at Fair Value on a Recurring Basis
as of December 31, 2022 | |
| | Assets and Liabilities Measured at Fair Value on a Recurring Basis
as of December 31, 2022 | |
| | Assets and Liabilities Measured at Fair Value on a Recurring Basis
as of December 31, 2022 | |
| | Assets and Liabilities Measured at Fair Value on a Recurring Basis
as of December 31, 2022 | |
| | Assets and Liabilities Measured at Fair Value on a Recurring Basis
as of December 31, 2022 | |
| | Assets and Liabilities Measured at Fair Value on a Recurring Basis
as of December 31, 2022 | |
| | Assets and Liabilities Measured at Fair Value on a Recurring Basis
as of December 31, 2022 | |
| | Assets and Liabilities Measured at Fair Value on a Recurring Basis
as of December 31, 2022 | |
| | Assets and Liabilities Measured at Fair Value on a Recurring Basis
as of December 31, 2022 | |
| | Assets and Liabilities Measured at Fair Value on a Recurring Basis
as of December 31, 2022 | |
| | Assets and Liabilities Measured at Fair Value on a Recurring Basis
as of December 31, 2022 | |
| | Assets and Liabilities Measured at Fair Value on a Recurring Basis
as of December 31, 2022 | |
| | Assets and Liabilities Measured at Fair Value on a Recurring Basis
as of December 31, 2022 | |
| | Assets and Liabilities Measured at Fair Value on a Recurring Basis
as of December 31, 2022 | |
| | Assets and Liabilities Measured at Fair Value on a Recurring Basis
as of December 31, 2022 | |
| | Assets and Liabilities Measured at Fair Value on a Recurring Basis
as of December 31, 2022 | |
| | Assets and Liabilities Measured at Fair Value on a Recurring Basis
as of December 31, 2022 | |
| | Assets and Liabilities Measured at Fair Value on a Recurring Basis
as of December 31, 2022 | |
| | Assets and Liabilities Measured at Fair Value on a Recurring Basis
as of December 31, 2022 | |
| ($ in thousands) | ($ in thousands) | | Quoted Prices in
Active Markets
for Identical
Assets
(Level 1) | | Significant
Other
Observable
Inputs
(Level 2) | | Significant
Unobservable
Inputs
(Level 3) | | Total
Fair Value | ($ in thousands) | | Level 1 | | Level 2 | | Level 3 | | Total Fair Value |
| | U.S. Treasury securities | |
| U.S. Treasury securities | |
| U.S. Treasury securities | U.S. Treasury securities | | $ | 176,422 | | | $ | 0 | | | $ | 0 | | | $ | 176,422 | |
| U.S. government agency and U.S. government sponsored enterprise debt securities | U.S. government agency and U.S. government sponsored enterprise debt securities | | 0 | | | 581,245 | | | 0 | | | 581,245 | |
| U.S. government agency and U.S. government sponsored enterprise mortgage-backed securities: | U.S. government agency and U.S. government sponsored enterprise mortgage-backed securities: | |
| Commercial mortgage-backed securities | Commercial mortgage-backed securities | | 0 | | | 603,471 | | | 0 | | | 603,471 | |
| Commercial mortgage-backed securities | |
| Commercial mortgage-backed securities | |
| Residential mortgage-backed securities | Residential mortgage-backed securities | | 0 | | | 1,003,897 | | | 0 | | | 1,003,897 | |
| Municipal securities | Municipal securities | | 0 | | | 102,302 | | | 0 | | | 102,302 | |
| Non-agency mortgage-backed securities: | Non-agency mortgage-backed securities: | |
| Commercial mortgage-backed securities | |
| Commercial mortgage-backed securities | |
| Commercial mortgage-backed securities | Commercial mortgage-backed securities | | 0 | | | 88,550 | | | 0 | | | 88,550 | |
| Residential mortgage-backed securities | Residential mortgage-backed securities | | 0 | | | 46,548 | | | 0 | | | 46,548 | |
| Corporate debt securities | Corporate debt securities | | 0 | | | 11,149 | | | 0 | | | 11,149 | |
| Foreign government bonds | Foreign government bonds | | 0 | | | 354,172 | | | 0 | | | 354,172 | |
| Asset-backed securities | Asset-backed securities | | 0 | | | 64,752 | | | 0 | | | 64,752 | |
| CLOs | CLOs | | 0 | | | 284,706 | | | 0 | | | 284,706 | |
| Total AFS debt securities | Total AFS debt securities | | $ | 176,422 | | | $ | 3,140,792 | | | $ | 0 | | | $ | 3,317,214 | |
| | Investments in tax credit and other investments: | | | | | | | | |
Equity securities (1) | | $ | 21,746 | | | $ | 9,927 | | | $ | 0 | | | $ | 31,673 | |
| Total investments in tax credit and other investments | | $ | 21,746 | | | $ | 9,927 | | | $ | 0 | | | $ | 31,673 | |
| Investments in qualified affordable housing partnerships, tax credit and other investments, net: | |
| Investments in qualified affordable housing partnerships, tax credit and other investments, net: | |
| Investments in qualified affordable housing partnerships, tax credit and other investments, net: | |
| Equity securities | |
| Equity securities | |
| Equity securities | |
| Total investments in qualified affordable housing partnerships, tax credit and other investments, net | |
| | Derivative assets: | Derivative assets: | | | | | | | | |
| Derivative assets: | |
| Derivative assets: | |
| Interest rate contracts | |
| Interest rate contracts | |
| Interest rate contracts | Interest rate contracts | | $ | 0 | | | $ | 192,883 | | | $ | 0 | | | $ | 192,883 | |
| Foreign exchange contracts | Foreign exchange contracts | | 0 | | | 54,637 | | | 0 | | | 54,637 | |
| Credit contracts | | 0 | | | 2 | | | 0 | | | 2 | |
| | Equity contracts | |
| Equity contracts | |
| Equity contracts | Equity contracts | | 0 | | | 993 | | | 421 | | | 1,414 | |
| Commodity contracts | Commodity contracts | | 0 | | | 81,380 | | | 0 | | | 81,380 | |
| Gross derivative assets | Gross derivative assets | | $ | 0 | | | $ | 329,895 | | | $ | 421 | | | $ | 330,316 | |
Netting adjustments (2) | | $ | 0 | | | $ | (125,319) | | | $ | 0 | | | $ | (125,319) | |
Netting adjustments (1) | |
| Net derivative assets | Net derivative assets | | $ | 0 | | | $ | 204,576 | | | $ | 421 | | | $ | 204,997 | |
| | Derivative liabilities: | Derivative liabilities: | | | | | | | | |
| Derivative liabilities: | |
| Derivative liabilities: | |
| Interest rate contracts | |
| Interest rate contracts | |
| Interest rate contracts | Interest rate contracts | | $ | 0 | | | $ | 127,317 | | | $ | 0 | | | $ | 127,317 | |
| Foreign exchange contracts | Foreign exchange contracts | | 0 | | | 48,610 | | | 0 | | | 48,610 | |
| Credit contracts | Credit contracts | | 0 | | | 84 | | | 0 | | | 84 | |
| Commodity contracts | Commodity contracts | | 0 | | | 80,517 | | | 0 | | | 80,517 | |
| Gross derivative liabilities | Gross derivative liabilities | | $ | 0 | | | $ | 256,528 | | | $ | 0 | | | $ | 256,528 | |
Netting adjustments (2) | | $ | 0 | | | $ | (159,799) | | | $ | 0 | | | $ | (159,799) | |
Netting adjustments (1) | |
| Net derivative liabilities | Net derivative liabilities | | $ | 0 | | | $ | 96,729 | | | $ | 0 | | | $ | 96,729 | |
|
(1)Equity securities consist of mutual funds with readily determinable fair values.
(2)Represents balance sheet netting of derivative assets and liabilities and related cash collateral under master netting agreements or similar agreements. See Note 5 — Derivatives to the Consolidated Financial Statements in this Form 10-K for additional information.
(2)Equity contracts classified as derivative liabilities consist of performance-based RSUs granted as part of EWBC’s consideration in its investment in Rayliant.
For the years ended December 31, 2020, 20192023, 2022 and 2018,2021, Level 3 fair value measurements that were measured on a recurring basis consistconsisted of warrantswarrant equity contracts issued by private companies.companies and liability-classified contingent issuable shares of the Company. The following table provides a reconciliation of the beginning and ending balances of these equity warrantscontracts for the years ended December 31, 2020, 20192023, 2022 and 2018:2021:
| | | ($ in thousands) | | | Year Ended December 31, |
| | | | | | | | | | Year Ended December 31, | |
| | | | | | | | | Year Ended December 31, | |
| ($ in thousands) | ($ in thousands) | | | 2020 | | | 2019 | | | 2018 | |
| | Equity Contracts | | | | | | | | | | |
| Derivative assets: | |
| | Derivative assets: | |
| | Derivative assets: | |
| Equity contracts | |
| Equity contracts | |
| Equity contracts | |
| Beginning balance | |
| Beginning balance | |
| Beginning balance | Beginning balance | | | $ | 421 | | | | $ | 673 | | | | $ | 679 | | |
| Total gains included in earnings (1) | | | 8,225 | | | | 563 | | | | 162 | | |
Total (losses) gains included in earnings (1) | |
| Total (losses) gains included in earnings (1) | |
| Total (losses) gains included in earnings (1) | |
| | Issuances | |
| | Issuances | |
| | Issuances | Issuances | | | 0 | | | | 114 | | | | 65 | | |
| | Settlements | Settlements | | | 0 | | | | (929) | | | | (233) | | |
| | Settlements | |
| | Settlements | |
Transfers out of Level 3 (2) | |
Transfers out of Level 3 (2) | |
Transfers out of Level 3 (2) | Transfers out of Level 3 (2) | | | (8,373) | | | | 0 | | | | 0 | | |
| Ending balance | Ending balance | | | $ | 273 | | | | $ | 421 | | | | $ | 673 | | |
| Ending balance | |
| Ending balance | |
| Derivative liabilities: | |
| Derivative liabilities: | |
| Derivative liabilities: | |
Equity contracts (3) | |
Equity contracts (3) | |
Equity contracts (3) | |
| Beginning balance | |
| Beginning balance | |
| Beginning balance | |
| | Issuances | |
| | Issuances | |
| | Issuances | |
| Ending balance | |
| Ending balance | |
| Ending balance | |
|
(1)Includes both realized and unrealized (losses) gains recorded in Lending feeson the Consolidated Statement of Income. The unrealized (losses) of $8.2 million, $(292)gains were $(79) thousand, $17 thousand, and $225$(44) thousand for the years ended December 31, 2020, 20192023, 2022 and 2018,2021, respectively. The realized/unrealized gains (losses) of equity contracts are included in Lending fees on the Consolidated Statement of Income.
(2)During the year endedending December 31, 2020,2021, the Company transferred $8.4 million$6 thousand of equity contracts measured on a recurring basis out of Level 3 intoto Level 2 after the corresponding issuer of the equity warrant, which was previously a private company, completed its initial public offering and became a public company.
(3)Equity contracts classified as derivative liabilities consist of performance-based RSUs granted as part of EWBC’s consideration in its investment in Rayliant.
The following table presents quantitative information about the significant unobservable inputs used in the valuation of Level 3 fair value measurements as of December 31, 20202023 and 2019, respectively.2022. The significant unobservable inputs presented in the table below are those that the Company considers significant to the fair value of the Level 3 assets. The Company considers unobservable inputs to be significant if, by their exclusion, the fair value of the Level 3 assets would be impacted by a predetermined percentage change.
| | | ($ in thousands) | ($ in thousands) | | Fair Value
Measurements
(Level 3) | | Valuation
Technique | | Unobservable
Inputs | | Range of
Inputs | | Weighted- Average (1) |
| December 31, 2020 | | | | | | | | | | |
| ($ in thousands) | |
| ($ in thousands) | |
| ($ in thousands) | |
| ($ in thousands) | |
| ($ in thousands) | |
| ($ in thousands) | |
| ($ in thousands) | |
| ($ in thousands) | |
| ($ in thousands) | |
| ($ in thousands) | |
| ($ in thousands) | |
| ($ in thousands) | |
| ($ in thousands) | |
| ($ in thousands) | |
| ($ in thousands) | |
| ($ in thousands) | |
| ($ in thousands) | |
| ($ in thousands) | |
| ($ in thousands) | |
| ($ in thousands) | |
| ($ in thousands) | |
| ($ in thousands) | |
| ($ in thousands) | |
| ($ in thousands) | |
| ($ in thousands) | |
| ($ in thousands) | |
| ($ in thousands) | |
| ($ in thousands) | |
| ($ in thousands) | |
| ($ in thousands) | |
| ($ in thousands) | |
| ($ in thousands) | |
| December 31, 2023 | |
| December 31, 2023 | |
| December 31, 2023 | |
| Derivative assets: | |
| Derivative assets: | |
| Derivative assets: | Derivative assets: | |
| Equity contracts | Equity contracts | | $ | 273 | | | Black-Scholes option pricing model | | Equity volatility | | 46% — 61% | | 53% |
| Liquidity discount | | 47% | | 47% |
| December 31, 2019 | | | |
| Equity contracts | |
| Equity contracts | | | $ | 336 | | | Black-Scholes option pricing model | | Equity volatility | | 37% — 48% | | 45% | (1) |
| | | | | | Liquidity discount | |
| Derivative liabilities: | |
| Derivative liabilities: | |
| Derivative liabilities: | |
Equity contracts (2) | |
Equity contracts (2) | |
Equity contracts (2) | |
| December 31, 2022 | |
| December 31, 2022 | |
| December 31, 2022 | |
| Derivative assets: | |
| Derivative assets: | |
| Derivative assets: | Derivative assets: | |
| Equity contracts | Equity contracts | | $ | 421 | | | Black-Scholes option pricing model | | Equity volatility | | 39% — 44% | | 42% |
| Equity contracts | |
| Equity contracts | | | $ | 323 | | | Black-Scholes option pricing model | | Equity volatility | | 42% — 60% | | 54% | (1) |
| | | | | | Liquidity discount | |
| | Liquidity discount | | 47% | | 47% |
|
(1)Weighted-average of inputs is calculated based on the fair value of equity warrantscontracts as of December 31, 20202023 and 2019, respectively.2022.
(2)Equity contracts classified as derivative liabilities consist of performance-based RSUs granted as part of EWBC’s consideration in its investment in Rayliant.
Assets and Liabilities Measured at Fair Value on a Nonrecurring Basis
Assets measured at fair value on a nonrecurring basis include certain individually evaluated loans held-for-investment, investments in qualified affordable housing partnerships, tax credit and other investments, OREO, loans held-for-sale, and other nonperforming assets. Nonrecurring fair value adjustments result from the impairment on certain individually evaluated loans held-for-investment and investments in qualified affordable housing partnerships, tax credit and other investments, from write-downs of OREO and other nonperforming assets, or from the application of lower of cost or fair value on loans held-for-sale.
Individually Evaluated Loans Held-For-InvestmentHeld-for-Investment — Individually evaluated loans held-for-investment are classified as Level 3 assets. The following two methods are used to derive the fair value of individually evaluated loans held-for-investment:
•Discounted cash flow valuation techniques that consist of developing an expected stream of cash flows over the life of the loans, and then calculating the present value of the loans by discounting the expected cash flows at a designated discount rate.
•When the repayment of an individually evaluated loan is collateral-dependent,dependent on the sale of the collateral, the fair value of the loan is determined based on the fair value of the underlying collateral, which may take the form of real estate, inventory, equipment, contracts or guarantees. The fair value of the underlying collateral is generally based on third-party appraisals, or an internal valuation if a third-party appraisal is not required by regulations, which utilizeor is unavailable. An internal valuation utilizes one or more valuation techniques such as the income, market and/or cost approaches.
Investments in Qualified Affordable Housing Partnerships, Tax Credit and Other Investments, Net — As part of its monitoring process, theThe Company conducts ongoing due diligence on its investments in qualified affordable housing partnerships, tax credit and other investments afterprior to the initial investment date and prior tothrough the placed-in-service date. After these investments are either acquired or placed into service, the Company continues its periodic monitoring process to ensure book values are realizable and that there is performed, whichno significant tax credit recapture risk. This monitoring process includes reviewing the investment entity’s quarterly review of the financial statements ofand annual tax returns, the investment entity, the annual review of the financial statements of the guarantor (if any), the review of the annual tax returns of the investment entity, and thea comparison of the actual cash distributions receivedperformance of the investment against the financial projections prepared at the time when the investment was made. The Company assesses its tax credit and other investments for possible OTTI on an annual basis or when events or circumstances suggest that the carrying amount of the investments may not be realizable. These circumstances can include, but are not limited to the following factors:
•The expected future cash flows isthat are less than the carrying amountamount of the investment;
•Changeschanges in the economic, market or technological environment that could adversely affect the investee’s operations;
•the potential for tax credit recapture; and
•Otherother factors that raise doubt about the investee’s ability to continue as a going concern, such as negative cash flows from operations and the continuing prospects of the underlying operations of the investment.
All available evidenceinformation is considered in assessing whether a decline in value is other-than-temporary. Generally, none of the aforementioned factors are individually conclusive and the relative importance placed on individual facts may vary depending on the situation. In accordance with ASC 323-10-35-32, Investments — Equity Method and Joint Ventures,an impairment charge would only be recognized in earnings for a decline in value that is determined to be other-than-temporary.
Other Real Estate Owned — The Company’s OREO represents properties acquired through foreclosure, or through full or partial satisfaction of loans held-for-investment. These OREO properties are recorded at estimated fair value less the costs to sell at the time of foreclosure or at the lower of cost or estimated fair value less the costs to sell subsequent to acquisition. On a monthly basis, the current fair market value of each OREO property is reviewed to ensure that the current carrying value is appropriate. OREO properties are classified as Level 3.
Loans Held-for-Sale— Loans held-for-investment subsequently transferred to held-for-sale are recorded at the lower of cost or fair value upon transfer. Loans held-for-sale may be measured at fair value on a nonrecurring basis when fair value is less than cost. Fair value is generally determined based on available market data for similar loans and therefore, loans held-for-sale are classified as Level 2.
Other Nonperforming Assets — Other nonperforming assets are recorded at fair value upon transferstransfer from loans to foreclosed assets. Subsequently, foreclosed assets are recorded at the lower of carrying value or fair value. Fair value is based on independent market prices, appraised values of the collateral or management’s estimatesestimated recovery of the foreclosed asset. The Company records an impairment when the foreclosed asset’s fair value declines below its carrying value. OtherThe fair value measurement of other nonperforming assets areis classified within one of the three levels in a valuation hierarchy based upon the observability of inputs to the valuation as Level 3.of the measurement date.
The following tables present the carrying amounts of assets that were still held and had fair value changesadjustments measured on a nonrecurring basis as of December 31, 20202023 and 2019:2022:
| | | ($ in thousands) | | Assets Measured at Fair Value on a Nonrecurring Basis
as of December 31, 2020 |
| | | Assets Measured at Fair Value on a Nonrecurring Basis
as of December 31, 2023 | |
| | Assets Measured at Fair Value on a Nonrecurring Basis
as of December 31, 2023 | |
| | Assets Measured at Fair Value on a Nonrecurring Basis
as of December 31, 2023 | |
| | Assets Measured at Fair Value on a Nonrecurring Basis
as of December 31, 2023 | |
| | Assets Measured at Fair Value on a Nonrecurring Basis
as of December 31, 2023 | |
| | Assets Measured at Fair Value on a Nonrecurring Basis
as of December 31, 2023 | |
| | Assets Measured at Fair Value on a Nonrecurring Basis
as of December 31, 2023 | |
| | Assets Measured at Fair Value on a Nonrecurring Basis
as of December 31, 2023 | |
| | Assets Measured at Fair Value on a Nonrecurring Basis
as of December 31, 2023 | |
| | Assets Measured at Fair Value on a Nonrecurring Basis
as of December 31, 2023 | |
| | Assets Measured at Fair Value on a Nonrecurring Basis
as of December 31, 2023 | |
| | Assets Measured at Fair Value on a Nonrecurring Basis
as of December 31, 2023 | |
| | Assets Measured at Fair Value on a Nonrecurring Basis
as of December 31, 2023 | |
| | Assets Measured at Fair Value on a Nonrecurring Basis
as of December 31, 2023 | |
| | Assets Measured at Fair Value on a Nonrecurring Basis
as of December 31, 2023 | |
| | Assets Measured at Fair Value on a Nonrecurring Basis
as of December 31, 2023 | |
| | Assets Measured at Fair Value on a Nonrecurring Basis
as of December 31, 2023 | |
| | Assets Measured at Fair Value on a Nonrecurring Basis
as of December 31, 2023 | |
| | Assets Measured at Fair Value on a Nonrecurring Basis
as of December 31, 2023 | |
| | Assets Measured at Fair Value on a Nonrecurring Basis
as of December 31, 2023 | |
| | Assets Measured at Fair Value on a Nonrecurring Basis
as of December 31, 2023 | |
| | Assets Measured at Fair Value on a Nonrecurring Basis
as of December 31, 2023 | |
| | Assets Measured at Fair Value on a Nonrecurring Basis
as of December 31, 2023 | |
| | Assets Measured at Fair Value on a Nonrecurring Basis
as of December 31, 2023 | |
| | Assets Measured at Fair Value on a Nonrecurring Basis
as of December 31, 2023 | |
| | Assets Measured at Fair Value on a Nonrecurring Basis
as of December 31, 2023 | |
| ($ in thousands) | ($ in thousands) | | Quoted Prices in
Active Markets
for Identical
Assets
(Level 1) | | Significant
Other
Observable
Inputs
(Level 2) | | Significant
Unobservable
Inputs
(Level 3) | | Fair Value Measurements | ($ in thousands) | | Level 1 | | Level 2 | | Level 3 | | Fair Value Measurements |
| | | Commercial: | Commercial: | |
| | Commercial: | |
| | Commercial: | |
| C&I | |
| C&I | |
| C&I | C&I | | $ | 0 | | | $ | 0 | | | $ | 143,331 | | | $ | 143,331 | |
| CRE: | CRE: | |
| CRE | CRE | | 0 | | | 0 | | | 42,894 | | | 42,894 | |
| CRE | |
| CRE | |
| | | Total commercial | |
| | Total commercial | |
| | Total commercial | Total commercial | | 0 | | | 0 | | | 186,225 | | | 186,225 | |
| Consumer: | Consumer: | | | | | | | | |
| | Residential mortgage: | Residential mortgage: | |
| | Residential mortgage: | |
| | Residential mortgage: | |
| HELOCs | HELOCs | | 0 | | | 0 | | | 1,146 | | | 1,146 | |
| Other consumer | | 0 | | | 0 | | | 2,491 | | | 2,491 | |
| HELOCs | |
| HELOCs | |
| | Total consumer | |
| Total consumer | |
| Total consumer | Total consumer | | 0 | | | 0 | | | 3,637 | | | 3,637 | |
| Total loans held-for-investment | Total loans held-for-investment | | $ | 0 | | | $ | 0 | | | $ | 189,862 | | | $ | 189,862 | |
| Investments in tax credit and other investments, net | | $ | 0 | | | $ | 0 | | | $ | 3,140 | | | $ | 3,140 | |
OREO (1) | | $ | 0 | | | $ | 0 | | | $ | 15,824 | | | $ | 15,824 | |
| Investments in qualified affordable housing partnerships, tax credit and other investments, net | |
| | | |
| | | | | | | | | | | | | | | | | | | | | | | | | | |
|
| ($ in thousands) | | Assets Measured at Fair Value on a Nonrecurring Basis
as of December 31, 2019 |
| Quoted Prices in
Active Markets
for Identical
Assets
(Level 1) | | Significant
Other
Observable
Inputs
(Level 2) | | Significant
Unobservable
Inputs
(Level 3) | | Fair Value Measurements |
| Loans held-for-investment: | | | | | | | | |
| | | | | | | | |
| | | | | | | | |
| | | | | | | | |
| | | | | | | | |
| Commercial: | | | | | | | | |
| C&I | | $ | 0 | | | $ | 0 | | | $ | 47,554 | | | $ | 47,554 | |
| CRE: | | | | | | | | |
| CRE | | 0 | | | 0 | | | 753 | | | 753 | |
| | | | | | | | |
| | | | | | | | |
| Total commercial | | 0 | | | 0 | | | 48,307 | | | 48,307 | |
| Consumer: | | | | | | | | |
| Residential mortgage: | | | | | | | | |
| | | | | | | | |
| HELOCs | | 0 | | | 0 | | | 1,372 | | | 1,372 | |
| | | | | | | | |
| Total consumer | | 0 | | | 0 | | | 1,372 | | | 1,372 | |
| Total loans held-for-investment | | $ | 0 | | | $ | 0 | | | $ | 49,679 | | | $ | 49,679 | |
| Investments in tax credit and other investments, net | | $ | 0 | | | $ | 0 | | | $ | 3,076 | | | $ | 3,076 | |
OREO (1) | | $ | 0 | | | $ | 0 | | | $ | 125 | | | $ | 125 | |
| Other nonperforming assets | | $ | 0 | | | $ | 0 | | | $ | 1,167 | | | $ | 1,167 | |
|
(1)Amounts are included in Other assets on the Consolidated Balance Sheet and represent the carrying value of OREO properties that were written down subsequent to their initial classification as OREO. | | | | | | | | | | | | | | | | | | | | | | | | | | |
|
| | Assets Measured at Fair Value on a Nonrecurring Basis
as of December 31, 2022 |
| ($ in thousands) | | Level 1 | | Level 2 | | Level 3 | | Fair Value Measurements |
| Loans held-for-investment: | | | | | | | | |
| | | | | | | | |
| | | | | | | | |
| | | | | | | | |
| | | | | | | | |
| Commercial: | | | | | | | | |
| C&I | | $ | — | | | $ | — | | | $ | 40,011 | | | $ | 40,011 | |
| CRE: | | | | | | | | |
| CRE | | — | | | — | | | 31,380 | | | 31,380 | |
| | | | | | | | |
| | | | | | | | |
| Total commercial | | — | | | — | | | 71,391 | | | 71,391 | |
| Consumer: | | | | | | | | |
| Residential mortgage: | | | | | | | | |
| | | | | | | | |
| HELOCs | | — | | | — | | | 1,223 | | | 1,223 | |
| | | | | | | | |
| Total consumer | | — | | | — | | | 1,223 | | | 1,223 | |
| Total loans held-for-investment | | $ | — | | | $ | — | | | $ | 72,614 | | | $ | 72,614 | |
| | | | | | | | |
| | | | | | | | |
| | | | | | | | |
| | | | | | | | |
The following table presents the increase (decrease) in the fair value of certain assets held at the end of the respective reporting periods, for which a nonrecurring fair value adjustment has beenwas recognized for the years ended December 31, 2020, 20192023, 2022 and 2018:2021:
| | | ($ in thousands) | | Year Ended December 31, |
| | | Year Ended December 31, | |
| | Year Ended December 31, | |
| | Year Ended December 31, | |
| | Year Ended December 31, | |
| | Year Ended December 31, | |
| | Year Ended December 31, | |
| | Year Ended December 31, | |
| | Year Ended December 31, | |
| | Year Ended December 31, | |
| | Year Ended December 31, | |
| | Year Ended December 31, | |
| | Year Ended December 31, | |
| | Year Ended December 31, | |
| | Year Ended December 31, | |
| | Year Ended December 31, | |
| | Year Ended December 31, | |
| | Year Ended December 31, | |
| | Year Ended December 31, | |
| | Year Ended December 31, | |
| | Year Ended December 31, | |
| ($ in thousands) | ($ in thousands) | | 2020 | | 2019 | | 2018 | ($ in thousands) | | 2023 | | 2022 | | 2021 |
| | | Commercial: | Commercial: | |
| | Commercial: | |
| | Commercial: | |
| C&I | |
| C&I | |
| C&I | C&I | | $ | (48,154) | | | $ | (35,365) | | | $ | (9,341) | |
| CRE: | CRE: | |
| CRE | |
| CRE | |
| CRE | CRE | | (11,289) | | | 9 | | | 270 | |
| | Total commercial | Total commercial | | (59,443) | | | (35,356) | | | (9,071) | |
| | Total commercial | |
| | Total commercial | |
| Consumer: | Consumer: | | | | | | |
| Residential mortgage: | Residential mortgage: | |
| Single-family residential | | 0 | | | 0 | | | 15 | |
| Residential mortgage: | |
| Residential mortgage: | |
| | HELOCs | HELOCs | | (175) | | | (2) | | | 0 | |
| | Other consumer | | 2,491 | | | 0 | | | 0 | |
| HELOCs | |
| | HELOCs | |
| | Total consumer | |
| | Total consumer | |
| | Total consumer | Total consumer | | $ | 2,316 | | | $ | (2) | | | $ | 15 | |
| Total loans held-for-investment | Total loans held-for-investment | | $ | (57,127) | | | $ | (35,358) | | | $ | (9,056) | |
| Investments in tax credit and other investments, net | | $ | (3,868) | | | $ | (13,023) | | | $ | 0 | |
| OREO | | $ | (3,680) | | | $ | (8) | | | $ | 0 | |
| Investments in qualified affordable housing partnerships, tax credit and other investments, net | |
| | Other nonperforming assets | |
| Other nonperforming assets | |
| Other nonperforming assets | Other nonperforming assets | | $ | 0 | | | $ | (3,000) | | | $ | 0 | |
|
The following table presents the quantitative information about the significant unobservable inputs used in the valuation of Level 3 fair value measurements that are measured on a nonrecurring basis as of December 31, 20202023 and 2019:2022:
| | | | | | | | | | | | | | | | | | | | | | | | | | | | | | | | |
|
| ($ in thousands) | | Fair Value
Measurements
(Level 3) | | Valuation
Techniques | | Unobservable
Inputs | | Range of
Inputs | | Weighted-
Average (1) |
| December 31, 2020 | | | | | | | | | | |
| Loans held-for-investment | | $ | 104,783 | | | Discounted cash flows | | Discount | | 3% — 15% | | 11% |
| | $ | 22,207 | | | Fair value of collateral | | Discount | | 10% — 26% | | 15% |
| | $ | 15,879 | | | Fair value of collateral | | Contract value | | NM | | NM |
| | $ | 46,993 | | | Fair value of property | | Selling cost | | 7% — 26% | | 10% |
| Investments in tax credit and other investments, net | | $ | 3,140 | | | Individual analysis of each investment | | Expected future tax
benefits and distributions | | NM | | NM |
| OREO | | $ | 15,824 | | | Fair value of property | | Selling cost | | 8% | | 8% |
| | | | | | | | | | |
| December 31, 2019 | | | | | | | | | | |
| Loans held-for-investment | | $ | 27,841 | | | Discounted cash flows | | Discount | | 4% — 15% | | 14% |
| | $ | 1,014 | | | Fair value of collateral | | Discount | | 8% — 20% | | 19% |
| | $ | 20,824 | | | Fair value of collateral | | Contract value | | NM | | NM |
| Investments in tax credit and other investments, net | | $ | 3,076 | | | Individual analysis of each investment | | Expected future tax
benefits and distributions | | NM | | NM |
| OREO | | $ | 125 | | | Fair value of property | | Selling cost | | 8% | | 8% |
| Other nonperforming assets | | $ | 1,167 | | | Fair value of collateral | | Contract value | | NM | | NM |
|
| | | | | | | | | | | | | | | | | | | | | | | | | | | | | | | | | | | |
| |
| ($ in thousands) | | Fair Value Measurements (Level 3) | | Valuation Techniques | | Unobservable Inputs | | Range of Inputs | | Weighted-Average of Inputs | |
| December 31, 2023 | | | | | | | | | | | |
| | | | | | | | | | | |
| Loans held-for-investment | | $ | 16,328 | | | Fair value of collateral | | Discount | | 15% — 75% | | 45% | (1) |
| | $ | 3,009 | | | Fair value of collateral | | Contract value | | NM | | NM | |
| | $ | 26,555 | | | Fair value of property | | Selling cost | | 8% | | 8% | |
| Investments in qualified affordable housing partnerships, tax credit and other investments, net | | $ | 868 | | | Individual analysis of each investment | | Expected future tax
benefits and distributions | | NM | | NM | |
| | | | | | | | | | | |
| | | | | | | | | | | |
| December 31, 2022 | | | | | | | | | | | |
| Loans held-for-investment | | $ | 23,322 | | | Discounted cash flows | | Discount | | 4% — 6% | | 4% | (1) |
| | $ | 17,912 | | | Fair value of collateral | | Discount | | 15% — 75% | | 37% | (1) |
| | | | | | | | | | | |
| | $ | 31,380 | | | Fair value of property | | Selling cost | | 8% | | 8% | |
| | | | | | | | | | | |
| | | | | | | | | | | |
| | | | | | | | | | | |
| |
NM —- Not meaningful.(1)Weighted-average of inputs is based on the relative fair value of the respective assets as of December 31, 20202023 and 2019.2022.
Disclosures about the Fair Value of Financial Instruments
The following tables present the fair value estimates for financial instruments as of December 31, 20202023 and 2019,2022, excluding financial instruments recorded at fair value on a recurring basis as they are included in the tables presented elsewhere in this Note. The carrying amounts in the following tables are recorded on the Consolidated Balance Sheet under the indicated captions, except for accrued interest receivable, restricted equity securities, at cost, and mortgage servicing rights that are included in Other assets, and accrued interest payable thatwhich is included in Accrued expenses and other liabilities. These financial assets and liabilitiesinstruments are measured aton an amortized cost basis on the Company’s Consolidated Balance Sheet.
| | | ($ in thousands) | | December 31, 2020 |
| | | December 31, 2023 | |
| | December 31, 2023 | |
| | December 31, 2023 | |
| | December 31, 2023 | |
| | December 31, 2023 | |
| | December 31, 2023 | |
| | December 31, 2023 | |
| | December 31, 2023 | |
| | December 31, 2023 | |
| | December 31, 2023 | |
| | December 31, 2023 | |
| | December 31, 2023 | |
| | December 31, 2023 | |
| | December 31, 2023 | |
| | December 31, 2023 | |
| | December 31, 2023 | |
| | December 31, 2023 | |
| | December 31, 2023 | |
| | December 31, 2023 | |
| | December 31, 2023 | |
| | December 31, 2023 | |
| | December 31, 2023 | |
| | December 31, 2023 | |
| | December 31, 2023 | |
| | December 31, 2023 | |
| | December 31, 2023 | |
| | December 31, 2023 | |
| | December 31, 2023 | |
| | December 31, 2023 | |
| | December 31, 2023 | |
| | December 31, 2023 | |
| | December 31, 2023 | |
| ($ in thousands) | ($ in thousands) | | Carrying
Amount | | Level 1 | | Level 2 | | Level 3 | | Estimated
Fair Value | ($ in thousands) | | Carrying Amount | | Level 1 | | Level 2 | | Level 3 | | Estimated Fair Value |
| | Cash and cash equivalents | Cash and cash equivalents | | $ | 4,017,971 | | | $ | 4,017,971 | | | $ | 0 | | | $ | 0 | | | $ | 4,017,971 | |
| Cash and cash equivalents | |
| Cash and cash equivalents | |
| Interest-bearing deposits with banks | Interest-bearing deposits with banks | | $ | 809,728 | | | $ | 0 | | | $ | 809,728 | | | $ | 0 | | | $ | 809,728 | |
Resale agreements (1) | | $ | 1,460,000 | | | $ | 0 | | | $ | 1,464,635 | | | $ | 0 | | | $ | 1,464,635 | |
| Resale agreements | |
| HTM debt securities | |
| Restricted equity securities, at cost | Restricted equity securities, at cost | | $ | 83,046 | | | $ | 0 | | | $ | 83,046 | | | $ | 0 | | | $ | 83,046 | |
| Loans held-for-sale | Loans held-for-sale | | $ | 1,788 | | | $ | 0 | | | $ | 1,788 | | | $ | 0 | | | $ | 1,788 | |
| Loans held-for-investment, net | Loans held-for-investment, net | | $ | 37,770,972 | | | $ | 0 | | | $ | 0 | | | $ | 37,803,940 | | | $ | 37,803,940 | |
| Mortgage servicing rights | Mortgage servicing rights | | $ | 5,522 | | | $ | 0 | | | $ | 0 | | | $ | 8,435 | | | $ | 8,435 | |
| Accrued interest receivable | Accrued interest receivable | | $ | 150,140 | | | $ | 0 | | | $ | 150,140 | | | $ | 0 | | | $ | 150,140 | |
| Financial liabilities: | Financial liabilities: | |
| Demand, checking, savings and money market deposits | Demand, checking, savings and money market deposits | | $ | 35,862,403 | | | $ | 0 | | | $ | 35,862,403 | | | $ | 0 | | | $ | 35,862,403 | |
| Demand, checking, savings and money market deposits | |
| Demand, checking, savings and money market deposits | |
| Time deposits | Time deposits | | $ | 9,000,349 | | | $ | 0 | | | $ | 9,016,884 | | | $ | 0 | | | $ | 9,016,884 | |
| | Short-term borrowings | Short-term borrowings | | $ | 21,009 | | | $ | 0 | | | $ | 21,009 | | | $ | 0 | | | $ | 21,009 | |
| | FHLB advances | | $ | 652,612 | | | $ | 0 | | | $ | 659,631 | | | $ | 0 | | | $ | 659,631 | |
Repurchase agreements (1) | | $ | 300,000 | | | $ | 0 | | | $ | 317,850 | | | $ | 0 | | | $ | 317,850 | |
| | Short-term borrowings | |
| | Short-term borrowings | |
| Long-term debt | Long-term debt | | $ | 147,376 | | | $ | 0 | | | $ | 150,131 | | | $ | 0 | | | $ | 150,131 | |
| Accrued interest payable | Accrued interest payable | | $ | 11,956 | | | $ | 0 | | | $ | 11,956 | | | $ | 0 | | | $ | 11,956 | |
|
| | | | | | | | | | | | | | | | | | | | | | | | | | | | | | | | |
|
| ($ in thousands) | | December 31, 2019 |
| Carrying
Amount | | Level 1 | | Level 2 | | Level 3 | | Estimated
Fair Value |
| Financial assets: | | | | | | | | | | |
| Cash and cash equivalents | | $ | 3,261,149 | | | $ | 3,261,149 | | | $ | 0 | | | $ | 0 | | | $ | 3,261,149 | |
| Interest-bearing deposits with banks | | $ | 196,161 | | | $ | 0 | | | $ | 196,161 | | | $ | 0 | | | $ | 196,161 | |
Resale agreements (1) | | $ | 860,000 | | | $ | 0 | | | $ | 856,025 | | | $ | 0 | | | $ | 856,025 | |
| Restricted equity securities, at cost | | $ | 78,580 | | | $ | 0 | | | $ | 78,580 | | | $ | 0 | | | $ | 78,580 | |
| Loans held-for-sale | | $ | 434 | | | $ | 0 | | | $ | 434 | | | $ | 0 | | | $ | 434 | |
| Loans held-for-investment, net | | $ | 34,420,252 | | | $ | 0 | | | $ | 0 | | | $ | 35,021,300 | | | $ | 35,021,300 | |
| Mortgage servicing rights | | $ | 6,068 | | | $ | 0 | | | $ | 0 | | | $ | 8,199 | | | $ | 8,199 | |
| | | | | | | | | | |
| Accrued interest receivable | | $ | 144,599 | | | $ | 0 | | | $ | 144,599 | | | $ | 0 | | | $ | 144,599 | |
| Financial liabilities: | | | | | | | | | | |
| Demand, checking, savings and money market deposits | | $ | 27,109,951 | | | $ | 0 | | | $ | 27,109,951 | | | $ | 0 | | | $ | 27,109,951 | |
| Time deposits | | $ | 10,214,308 | | | $ | 0 | | | $ | 10,208,895 | | | $ | 0 | | | $ | 10,208,895 | |
| Short-term borrowings | | $ | 28,669 | | | $ | 0 | | | $ | 28,669 | | | $ | 0 | | | $ | 28,669 | |
| FHLB advances | | $ | 745,915 | | | $ | 0 | | | $ | 755,371 | | | $ | 0 | | | $ | 755,371 | |
Repurchase agreements (1) | | $ | 200,000 | | | $ | 0 | | | $ | 232,597 | | | $ | 0 | | | $ | 232,597 | |
| Long-term debt | | $ | 147,101 | | | $ | 0 | | | $ | 152,641 | | | $ | 0 | | | $ | 152,641 | |
| Accrued interest payable | | $ | 27,246 | | | $ | 0 | | | $ | 27,246 | | | $ | 0 | | | $ | 27,246 | |
|
(1)Resale and repurchase agreements are reported net pursuant to ASC 210-20-45-11, Balance Sheet Offsetting: Repurchase and Reverse Repurchase Agreements. As of December 31, 2020, NaN of the $300.0 million of gross repurchase agreements were eligible for netting against gross resale agreements. Out of $450.0 million of gross repurchase agreements, $250.0 million were eligible for netting against gross resale agreements as of December 31, 2019. | | | | | | | | | | | | | | | | | | | | | | | | | | | | | | | | |
|
| | December 31, 2022 |
| ($ in thousands) | | Carrying Amount | | Level 1 | | Level 2 | | Level 3 | | Estimated Fair Value |
| Financial assets: | | | | | | | | | | |
| Cash and cash equivalents | | $ | 3,481,784 | | | $ | 3,481,784 | | | $ | — | | | $ | — | | | $ | 3,481,784 | |
| Interest-bearing deposits with banks | | $ | 139,021 | | | $ | — | | | $ | 139,021 | | | $ | — | | | $ | 139,021 | |
| Resale agreements | | $ | 792,192 | | | $ | — | | | $ | 693,656 | | | $ | — | | | $ | 693,656 | |
| HTM debt securities | | $ | 3,001,868 | | | $ | 471,469 | | | $ | 1,983,702 | | | $ | — | | | $ | 2,455,171 | |
| Restricted equity securities, at cost | | $ | 78,624 | | | $ | — | | | $ | 78,624 | | | $ | — | | | $ | 78,624 | |
| Loans held-for-sale | | $ | 25,644 | | | $ | — | | | $ | 25,644 | | | $ | — | | | $ | 25,644 | |
| Loans held-for-investment, net | | $ | 47,606,785 | | | $ | — | | | $ | — | | | $ | 46,670,690 | | | $ | 46,670,690 | |
| Mortgage servicing rights | | $ | 6,235 | | | $ | — | | | $ | — | | | $ | 10,917 | | | $ | 10,917 | |
| | | | | | | | | | |
| Accrued interest receivable | | $ | 263,430 | | | $ | — | | | $ | 263,430 | | | $ | — | | | $ | 263,430 | |
| Financial liabilities: | | | | | | | | | | |
| Demand, checking, savings and money market deposits | | $ | 42,637,316 | | | $ | — | | | $ | 42,637,316 | | | $ | — | | | $ | 42,637,316 | |
| Time deposits | | $ | 13,330,533 | | | $ | — | | | $ | 13,228,777 | | | $ | — | | | $ | 13,228,777 | |
| | | | | | | | | | |
| | | | | | | | | | |
| Repurchase agreements | | $ | 300,000 | | | $ | — | | | $ | 304,097 | | | $ | — | | | $ | 304,097 | |
| Long-term debt | | $ | 147,950 | | | $ | — | | | $ | 143,483 | | | $ | — | | | $ | 143,483 | |
| Accrued interest payable | | $ | 37,198 | | | $ | — | | | $ | 37,198 | | | $ | — | | | $ | 37,198 | |
|
Note 3 — Assets Purchased under Resale Agreements and Sold under Repurchase Agreements
Assets Purchased under Resale Agreements
InThe Company’s resale agreements the Company is exposedexposes it to credit risk for both the counterparties and the underlying collateral. The companyCompany manages credit exposure from certain transactions by entering into master netting agreements and collateral arrangements with the counterparties. The relevant agreements allow for thean efficient closeout of the transaction, liquidation and set-off of collateral against the net amount owed by the counterparty following a default. It is also the Company’s policy to take possession, where possible, of the assets underlying resale agreements. As a result of the Company’s credit risk mitigation practices with respect to resale agreements as described above, the Company did not hold any reserves for credit impairment with respect to these agreements as of both December 31, 20202023 and 2019.2022.
Securities Purchased under Resale Agreements — Total securities purchased under resale agreements were $1.16 billion$785 million and $1.11 billion$760 million as of December 31, 20202023 and 2019,2022, respectively. The weighted-average yields were 1.94%2.87%, 2.66%2.12% and 2.63%1.53% for the years ended December 31, 2020, 20192023, 2022 and 2018,2021, respectively.
Loans purchasedPurchased under Resale Agreements — During the fourth quarter of 2020, the Company participated in $300.0 million inLoans purchased under resale agreements collateralized withwere $32 million as of December 31, 2022. The Company had no loans with multiple counterparties.purchased under resale agreements as of December 31, 2023 due to the maturity of the underlying loans. The weighted-average yield was 2.27%yields were 2.16% and 1.53% for the yearyears ended December 31, 2020.2022 and 2021, respectively.
Assets Sold under Repurchase Agreements — As of December 31, 2020, the collateral for the repurchase agreements were comprised of U.S. government agency and U.S. government-sponsored enterprise mortgage-backed securities, and U.S. Treasury securities. Gross repurchase agreements were $300.0 million and $450.0$300 million as of December 31, 20202022. The Company extinguished $300 million of repurchase agreements during the first quarter of 2023 and 2019, respectively. The weighted-average interest ratesrecorded $4 million of extinguishment charges during 2023. In comparison, no extinguishment charges were 3.25%, 4.74% and 4.46%recorded for the years ended December 31, 2020, 20192022 and 2018, respectively. During2021. The weighted-average interest rates were 3.07% and 2.61% for the second quarter of 2020, the Company recorded $8.7 million of charges related to the extinguishment of $150.0 million of repurchase agreements. In comparison, there were 0 extinguishment charges recorded in 2019 and 2018. As ofyears ended December 31, 2020, all2022 and 2021, respectively These weighted-average interest rates also reflect the impact of short-term repurchase agreements will mature 2023.entered and repaid during the years presented.
Balance Sheet Offsetting
The Company’s resale and repurchase agreements are transacted under legally enforceable master repurchasenetting agreements that, in the event of default by the counterparty, provide the Company the right to liquidate assetssecurities held and to offset receivables and payables with the same counterparty. The Company nets resale and repurchase transactions with the same counterparty on the Consolidated Balance Sheet when it has a legally enforceable master netting agreement and the transactions are eligible for netting under ASC 210-20-45-11, Balance Sheet Offsetting: Repurchase and Reverse Repurchase Agreements. Collateral received includes assetssecurities and loans that are not recognized on the Consolidated Balance Sheet. Collateral pledged consists of assetssecurities that are not netted on the Consolidated Balance Sheet against the related collateralized liability. CollateralSecurities received or pledged as collateral in resale and repurchase agreements with other financial institutions may also be sold or re-pledged by the secured party, and isare usually delivered to and held by the third-party trustees. The collateral amounts received/pledged are limited for presentation purposes to the related recognized asset/liability balance for each counterparty, and accordingly, do not include excess collateral received/pledged.
The following tables present the resale and repurchase agreements included on the Consolidated Balance Sheet as of December 31, 20202023 and 2019:2022:
| | | ($ in thousands) | ($ in thousands) | | December 31, 2020 |
| ($ in thousands) | |
| ($ in thousands) | |
| ($ in thousands) | |
| ($ in thousands) | |
| ($ in thousands) | |
| ($ in thousands) | |
| ($ in thousands) | |
| ($ in thousands) | |
| ($ in thousands) | |
| ($ in thousands) | |
| ($ in thousands) | |
| ($ in thousands) | |
| ($ in thousands) | |
| ($ in thousands) | |
| ($ in thousands) | |
| ($ in thousands) | |
| ($ in thousands) | |
| ($ in thousands) | |
| ($ in thousands) | |
| ($ in thousands) | |
| ($ in thousands) | |
| ($ in thousands) | |
| ($ in thousands) | |
| ($ in thousands) | |
| ($ in thousands) | |
| ($ in thousands) | |
| ($ in thousands) | |
| ($ in thousands) | |
| ($ in thousands) | |
| ($ in thousands) | |
| ($ in thousands) | |
| ($ in thousands) | | | December 31, 2023 |
| | Gross Amounts of Recognized Assets | |
| Assets | |
| Assets | Assets | | Gross Amounts
of Recognized
Assets | | Gross Amounts
Offset on the
Consolidated
Balance Sheet | | Net Amounts of
Assets Presented
on the Consolidated
Balance Sheet | | Gross Amounts Not Offset on the
Consolidated Balance Sheet | | Net
Amount |
| Collateral Received | | | | | | Collateral Received | | Net Amount |
| Resale agreements | Resale agreements | | $ | 1,460,000 | | | $ | 0 | | | $ | 1,460,000 | | | $ | (1,458,700) | | (1) | $ | 1,300 | |
| | | Gross Amounts of Recognized Liabilities | |
| | Gross Amounts of Recognized Liabilities | |
| | Gross Amounts of Recognized Liabilities | |
| Liabilities | |
| Liabilities | Liabilities | | Gross Amounts
of Recognized
Liabilities | | Gross Amounts
Offset on the
Consolidated
Balance Sheet | | Net Amounts of
Liabilities
Presented on the
Consolidated
Balance Sheet | | Gross Amounts Not Offset on the
Consolidated Balance Sheet | | Net
Amount |
| Collateral Pledged | | | | | | Collateral Pledged | | Net Amount |
| Repurchase agreements | Repurchase agreements | | $ | 300,000 | | | $ | 0 | | | $ | 300,000 | | | $ | (300,000) | | (2) | $ | 0 | |
|
| | | ($ in thousands) | ($ in thousands) | | December 31, 2019 |
| ($ in thousands) | |
| ($ in thousands) | |
| ($ in thousands) | |
| ($ in thousands) | |
| ($ in thousands) | |
| ($ in thousands) | |
| ($ in thousands) | |
| ($ in thousands) | |
| ($ in thousands) | |
| ($ in thousands) | |
| ($ in thousands) | |
| ($ in thousands) | |
| ($ in thousands) | |
| ($ in thousands) | |
| ($ in thousands) | |
| ($ in thousands) | |
| ($ in thousands) | |
| ($ in thousands) | |
| ($ in thousands) | |
| ($ in thousands) | |
| ($ in thousands) | |
| ($ in thousands) | |
| ($ in thousands) | |
| ($ in thousands) | |
| ($ in thousands) | |
| ($ in thousands) | |
| ($ in thousands) | |
| ($ in thousands) | |
| ($ in thousands) | |
| ($ in thousands) | |
| ($ in thousands) | |
| ($ in thousands) | | | December 31, 2022 |
| | Gross Amounts of Recognized Assets | |
| Assets | |
| Assets | Assets | | Gross Amounts
of Recognized
Assets | | Gross Amounts
Offset on the
Consolidated
Balance Sheet | | Net Amounts of
Assets Presented
on the Consolidated
Balance Sheet | | Gross Amounts Not Offset on the
Consolidated Balance Sheet | | Net
Amount |
| Collateral Received | | | | | | Collateral Received | | Net Amount |
| Resale agreements | Resale agreements | | $ | 1,110,000 | | | $ | (250,000) | | | $ | 860,000 | | | $ | (856,058) | | (1) | $ | 3,942 | |
| | | Gross Amounts of Recognized Liabilities | |
| | Gross Amounts of Recognized Liabilities | |
| | Gross Amounts of Recognized Liabilities | |
| Liabilities | |
| Liabilities | Liabilities | | Gross Amounts
of Recognized
Liabilities | | Gross Amounts
Offset on the
Consolidated
Balance Sheet | | Net Amounts of
Liabilities
Presented on the
Consolidated
Balance Sheet | | Gross Amounts Not Offset on the
Consolidated Balance Sheet | | Net
Amount |
| Collateral Pledged | | | | | | Collateral Pledged | | Net Amount |
| Repurchase agreements | Repurchase agreements | | $ | 450,000 | | | $ | (250,000) | | | $ | 200,000 | | | $ | (200,000) | | (2) | $ | 0 | |
|
(1)Represents the fair value of assets the Company has received under resale agreements, limited for table presentation purposes to the amount of the recognized asset due from each counterparty. The application of collateral cannot reduce the net position below zero. Therefore, excess collateral, if any, is not reflected above.
(2)Represents the fair value of assets the Company has pledged under repurchase agreements, limited for table presentation purposes to the amount of the recognized liability due to each counterparty. The application of collateral cannot reduce the net position below zero. Therefore, excess collateral, if any, is not reflected above.
In addition to the amounts included in the tables above, the Company also has balance sheet netting related to derivatives. Refer to Note 5 — Derivatives to the Consolidated Financial Statements in this Form 10-K for additional information.
Note 4 — Securities
The following tables present the amortized cost, gross unrealized gains and losses, and fair value by major categories of AFS and HTM debt securities as of December 31, 20202023 and 2019:2022:
| | | ($ in thousands) | | December 31, 2020 |
| | | December 31, 2023 | |
| | December 31, 2023 | |
| | December 31, 2023 | |
| | December 31, 2023 | |
| | December 31, 2023 | |
| | December 31, 2023 | |
| | December 31, 2023 | |
| | December 31, 2023 | |
| | December 31, 2023 | |
| | December 31, 2023 | |
| | December 31, 2023 | |
| | December 31, 2023 | |
| | December 31, 2023 | |
| | December 31, 2023 | |
| | December 31, 2023 | |
| | December 31, 2023 | |
| | December 31, 2023 | |
| | December 31, 2023 | |
| | December 31, 2023 | |
| | December 31, 2023 | |
| | December 31, 2023 | |
| | December 31, 2023 | |
| | December 31, 2023 | |
| | December 31, 2023 | |
| | December 31, 2023 | |
| | December 31, 2023 | |
| ($ in thousands) | ($ in thousands) | | Amortized
Cost | | Gross
Unrealized
Gains | | Gross
Unrealized
Losses | | Fair
Value | ($ in thousands) | | Amortized Cost | | Gross Unrealized Gains | | Gross Unrealized Losses | | Fair Value |
| | U.S. Treasury securities | |
| U.S. Treasury securities | |
| U.S. Treasury securities | U.S. Treasury securities | | $ | 50,310 | | | $ | 451 | | | $ | 0 | | | $ | 50,761 | |
| U.S. government agency and U.S. government-sponsored enterprise debt securities | U.S. government agency and U.S. government-sponsored enterprise debt securities | | 806,814 | | | 8,765 | | | (1,260) | | | 814,319 | |
| U.S. government agency and U.S. government-sponsored enterprise mortgage-backed securities: | U.S. government agency and U.S. government-sponsored enterprise mortgage-backed securities: | |
| Commercial mortgage-backed securities | Commercial mortgage-backed securities | | 1,125,174 | | | 34,306 | | | (5,710) | | | 1,153,770 | |
| Commercial mortgage-backed securities | |
| Commercial mortgage-backed securities | |
| Residential mortgage-backed securities | Residential mortgage-backed securities | | 1,634,553 | | | 27,952 | | | (1,611) | | | 1,660,894 | |
| Municipal securities | | 382,573 | | | 13,588 | | | (88) | | | 396,073 | |
| Municipal securities: | |
| Non-agency mortgage-backed securities: | Non-agency mortgage-backed securities: | |
| Commercial mortgage-backed securities | |
| Commercial mortgage-backed securities | |
| Commercial mortgage-backed securities | Commercial mortgage-backed securities | | 234,965 | | | 6,107 | | | (1,230) | | | 239,842 | |
| Residential mortgage-backed securities | Residential mortgage-backed securities | | 288,520 | | | 1,761 | | | (506) | | | 289,775 | |
| Corporate debt securities | Corporate debt securities | | 406,323 | | | 3,493 | | | (3,848) | | | 405,968 | |
| Foreign government bonds | Foreign government bonds | | 183,828 | | | 163 | | | (1,460) | | | 182,531 | |
| Asset-backed securities | Asset-backed securities | | 63,463 | | | 10 | | | (242) | | | 63,231 | |
| CLOs | CLOs | | 294,000 | | | 0 | | | (6,506) | | | 287,494 | |
| Total AFS debt securities | Total AFS debt securities | | $ | 5,470,523 | | | $ | 96,596 | | | $ | (22,461) | | | $ | 5,544,658 | |
| HTM debt securities | |
| U.S. Treasury securities | |
| U.S. Treasury securities | |
| U.S. Treasury securities | |
| U.S. government agency and U.S. government-sponsored enterprise debt securities | |
| U.S. government agency and U.S. government-sponsored enterprise mortgage-backed securities: | |
| Commercial mortgage-backed securities | |
| Commercial mortgage-backed securities | |
| Commercial mortgage-backed securities | |
| Residential mortgage-backed securities | |
| Municipal securities | |
| Total HTM debt securities | |
| Total debt securities | |
|
| | | ($ in thousands) | | December 31, 2019 |
| | | | December 31, 2022 | |
| | | December 31, 2022 | |
| ($ in thousands) | ($ in thousands) | | Amortized
Cost | | Gross
Unrealized
Gains | | Gross
Unrealized
Losses | | Fair
Value | ($ in thousands) | | Amortized Cost | | | | Gross Unrealized Gains | | Gross Unrealized Losses | | Fair Value |
| | U.S. Treasury securities | |
| U.S. Treasury securities | |
| U.S. Treasury securities | U.S. Treasury securities | | $ | 177,215 | | | $ | 0 | | | $ | (793) | | | $ | 176,422 | |
| U.S. government agency and U.S. government-sponsored enterprise debt securities | U.S. government agency and U.S. government-sponsored enterprise debt securities | | 584,275 | | | 1,377 | | | (4,407) | | | 581,245 | |
| U.S. government agency and U.S. government-sponsored enterprise mortgage-backed securities: | U.S. government agency and U.S. government-sponsored enterprise mortgage-backed securities: | |
| Commercial mortgage-backed securities | Commercial mortgage-backed securities | | 599,814 | | | 8,551 | | | (4,894) | | | 603,471 | |
| Commercial mortgage-backed securities | |
| Commercial mortgage-backed securities | |
| Residential mortgage-backed securities | Residential mortgage-backed securities | | 998,447 | | | 6,927 | | | (1,477) | | | 1,003,897 | |
| Municipal securities | Municipal securities | | 101,621 | | | 790 | | | (109) | | | 102,302 | |
| Non-agency mortgage-backed securities: | Non-agency mortgage-backed securities: | |
| Commercial mortgage-backed securities | |
| Commercial mortgage-backed securities | |
| Commercial mortgage-backed securities | Commercial mortgage-backed securities | | 86,609 | | | 1,947 | | | (6) | | | 88,550 | |
| Residential mortgage-backed securities | Residential mortgage-backed securities | | 46,830 | | | 3 | | | (285) | | | 46,548 | |
| Corporate debt securities | Corporate debt securities | | 11,250 | | | 12 | | | (113) | | | 11,149 | |
| Foreign government bonds | Foreign government bonds | | 354,481 | | | 198 | | | (507) | | | 354,172 | |
| Asset-backed securities | Asset-backed securities | | 66,106 | | | 0 | | | (1,354) | | | 64,752 | |
| CLOs | CLOs | | 294,000 | | | 0 | | | (9,294) | | | 284,706 | |
| Total AFS debt securities | Total AFS debt securities | | $ | 3,320,648 | | | $ | 19,805 | | | $ | (23,239) | | | $ | 3,317,214 | |
| HTM debt securities: | |
| U.S. Treasury securities | |
| U.S. Treasury securities | |
| U.S. Treasury securities | |
| U.S. government agency and U.S. government-sponsored enterprise debt securities | |
| U.S. government agency and U.S. government-sponsored enterprise mortgage-backed securities: | |
| Commercial mortgage-backed securities | |
| Commercial mortgage-backed securities | |
| Commercial mortgage-backed securities | |
| Residential mortgage-backed securities | |
| Municipal securities | |
| Total HTM debt securities | |
| Total debt securities | |
| |
As of December 31, 20202023 and 2019,2022, the amortized cost of AFS debt securities excluded accrued interest receivables of $22.3$44 million and $11.1$42 million, respectively, which are included in Other assets on the Consolidated Balance Sheet. For the Company’s accounting policy related to AFS debt securities’ accrued interest receivable, see Note 1 — Summary of Significant Accounting Policies — Significant Accounting Policies — Allowance for Credit Losses on Available-for-Sale Debt Securities and Allowance for Credit Losses onHeld-to-Maturity Debt Securitiesto the Consolidated Financial Statements in this Form 10-K.
Unrealized Losses of Available-for-Sale Debt Securities
The following tables present the fair value and the associated gross unrealized losses of the Company’s AFS debt securities, aggregated by investment category and the length of time that the securities have been in a continuous unrealized loss position, as of December 31, 20202023 and 2019:2022:
| | | ($ in thousands) | | December 31, 2020 |
| Less Than 12 Months | | 12 Months or More | | Total |
| | | December 31, 2023 | |
| | December 31, 2023 | |
| | December 31, 2023 | |
| | December 31, 2023 | |
| | December 31, 2023 | |
| | December 31, 2023 | |
| | December 31, 2023 | |
| | December 31, 2023 | |
| | December 31, 2023 | |
| | December 31, 2023 | |
| | December 31, 2023 | |
| | December 31, 2023 | |
| | December 31, 2023 | |
| | December 31, 2023 | |
| | December 31, 2023 | |
| | December 31, 2023 | |
| | December 31, 2023 | |
| | December 31, 2023 | |
| | December 31, 2023 | |
| | December 31, 2023 | |
| | December 31, 2023 | |
| | December 31, 2023 | |
| | December 31, 2023 | |
| | December 31, 2023 | |
| | December 31, 2023 | |
| | December 31, 2023 | |
| | December 31, 2023 | |
| | December 31, 2023 | |
| | December 31, 2023 | |
| | December 31, 2023 | |
| | December 31, 2023 | |
| | December 31, 2023 | |
| | December 31, 2023 | |
| | December 31, 2023 | |
| | December 31, 2023 | |
| | December 31, 2023 | |
| | December 31, 2023 | |
| | December 31, 2023 | |
| | Less Than 12 Months | | | | Less Than 12 Months | | 12 Months or More | | Total |
| ($ in thousands) | ($ in thousands) | | Fair
Value | | Gross
Unrealized
Losses | | Fair
Value | | Gross
Unrealized
Losses | | Fair
Value | | Gross
Unrealized
Losses | ($ in thousands) | | Fair Value | | Gross Unrealized Losses | | Fair Value | | Gross Unrealized Losses | | Fair Value | | Gross Unrealized Losses |
| | | U.S. Treasury securities | |
| U.S. Treasury securities | |
| U.S. Treasury securities | |
| U.S. government agency and U.S. government-sponsored enterprise debt securities | U.S. government agency and U.S. government-sponsored enterprise debt securities | | $ | 352,521 | | | $ | (1,260) | | | $ | 0 | | | $ | 0 | | | $ | 352,521 | | | $ | (1,260) | |
| U.S. government agency and U.S. government-sponsored enterprise mortgage-backed securities: | U.S. government agency and U.S. government-sponsored enterprise mortgage-backed securities: | |
| Commercial mortgage-backed securities | |
| Commercial mortgage-backed securities | |
| Commercial mortgage-backed securities | Commercial mortgage-backed securities | | 292,596 | | | (5,656) | | | 3,543 | | | (54) | | | 296,139 | | | (5,710) | |
| Residential mortgage-backed securities | Residential mortgage-backed securities | | 342,561 | | | (1,611) | | | 0 | | | 0 | | | 342,561 | | | (1,611) | |
| Municipal securities | Municipal securities | | 24,529 | | | (88) | | | 0 | | | 0 | | | 24,529 | | | (88) | |
| Non-agency mortgage-backed securities: | Non-agency mortgage-backed securities: | |
| Commercial mortgage-backed securities | |
| Commercial mortgage-backed securities | |
| Commercial mortgage-backed securities | Commercial mortgage-backed securities | | 58,738 | | | (1,230) | | | 7,920 | | | 0 | | | 66,658 | | | (1,230) | |
| Residential mortgage-backed securities | Residential mortgage-backed securities | | 90,156 | | | (506) | | | 0 | | | 0 | | | 90,156 | | | (506) | |
| Corporate debt securities | Corporate debt securities | | 251,674 | | | (3,645) | | | 9,798 | | | (203) | | | 261,472 | | | (3,848) | |
| Foreign government bonds | Foreign government bonds | | 106,828 | | | (1,460) | | | 0 | | | 0 | | | 106,828 | | | (1,460) | |
| Asset-backed securities | Asset-backed securities | | 0 | | | 0 | | | 34,104 | | | (242) | | | 34,104 | | | (242) | |
| CLOs | CLOs | | 0 | | | 0 | | | 287,494 | | | (6,506) | | | 287,494 | | | (6,506) | |
| Total AFS debt securities | Total AFS debt securities | | $ | 1,519,603 | | | $ | (15,456) | | | $ | 342,859 | | | $ | (7,005) | | | $ | 1,862,462 | | | $ | (22,461) | |
|
| | | | | | | | | | | | | | | | | | | | | | | | | | | | | | | | | | | | | | |
|
| | December 31, 2022 |
| | Less Than 12 Months | | 12 Months or More | | Total |
| ($ in thousands) | | Fair Value | | Gross Unrealized Losses | | Fair Value | | Gross Unrealized Losses | | Fair Value | | Gross Unrealized Losses |
| AFS debt securities: | | | | | | | | | | | | |
| U.S. Treasury securities | | $ | 131,843 | | | $ | (8,761) | | | $ | 474,360 | | | $ | (61,342) | | | $ | 606,203 | | | $ | (70,103) | |
| U.S. government agency and U.S. government-sponsored enterprise debt securities | | 97,403 | | | (6,902) | | | 214,136 | | | (49,364) | | | 311,539 | | | (56,266) | |
| U.S. government agency and U.S. government-sponsored enterprise mortgage-backed securities: | | | | | | | | | | | | |
| Commercial mortgage-backed securities | | 252,144 | | | (30,029) | | | 248,125 | | | (47,094) | | | 500,269 | | | (77,123) | |
| Residential mortgage-backed securities | | 307,536 | | | (20,346) | | | 1,448,658 | | | (228,554) | | | 1,756,194 | | | (248,900) | |
| Municipal securities | | 95,655 | | | (10,194) | | | 159,439 | | | (36,594) | | | 255,094 | | | (46,788) | |
| Non-agency mortgage-backed securities: | | | | | | | | | | | | |
| Commercial mortgage-backed securities | | 106,184 | | | (3,309) | | | 282,301 | | | (46,087) | | | 388,485 | | | (49,396) | |
| Residential mortgage-backed securities | | 22,715 | | | (1,546) | | | 626,509 | | | (111,432) | | | 649,224 | | | (112,978) | |
| Corporate debt securities | | 173,595 | | | (17,907) | | | 352,679 | | | (129,321) | | | 526,274 | | | (147,228) | |
| Foreign government bonds | | 107,576 | | | (429) | | | 36,143 | | | (13,857) | | | 143,719 | | | (14,286) | |
| Asset-backed securities | | 12,450 | | | (524) | | | 36,626 | | | (1,552) | | | 49,076 | | | (2,076) | |
| CLOs | | 144,365 | | | (4,735) | | | 453,299 | | | (14,851) | | | 597,664 | | | (19,586) | |
| Total AFS debt securities | | $ | 1,451,466 | | | $ | (104,682) | | | $ | 4,332,275 | | | $ | (740,048) | | | $ | 5,783,741 | | | $ | (844,730) | |
|
| | | | | | | | | | | | |
| | | | | | | | | | | | |
| | | | | | | | | | | | | | | | | | | | | | | | | | | | | | | | | | | | | | |
|
| ($ in thousands) | | December 31, 2019 |
| Less Than 12 Months | | 12 Months or More | | Total |
| Fair
Value | | Gross
Unrealized
Losses | | Fair
Value | | Gross
Unrealized
Losses | | Fair
Value | | Gross
Unrealized
Losses |
| AFS debt securities: | | | | | | | | | | | | |
| U.S. Treasury securities | | $ | 0 | | | $ | 0 | | | $ | 176,422 | | | $ | (793) | | | $ | 176,422 | | | $ | (793) | |
| U.S. government agency and U.S. government-sponsored enterprise debt securities | | 310,349 | | | (4,407) | | | 0 | | | 0 | | | 310,349 | | | (4,407) | |
| U.S. government agency and U.S. government-sponsored enterprise mortgage-backed securities: | | | | | | | | | | | | |
| Commercial mortgage-backed securities | | 204,675 | | | (2,346) | | | 108,314 | | | (2,548) | | | 312,989 | | | (4,894) | |
| Residential mortgage-backed securities | | 325,354 | | | (1,234) | | | 34,337 | | | (243) | | | 359,691 | | | (1,477) | |
| Municipal securities | | 31,130 | | | (109) | | | 0 | | | 0 | | | 31,130 | | | (109) | |
| Non-agency mortgage-backed securities: | | | | | | | | | | | | |
| Commercial mortgage-backed securities | | 7,914 | | | (6) | | | 0 | | | 0 | | | 7,914 | | | (6) | |
| Residential mortgage-backed securities | | 42,894 | | | (285) | | | 0 | | | 0 | | | 42,894 | | | (285) | |
| Corporate debt securities | | 0 | | | 0 | | | 9,888 | | | (113) | | | 9,888 | | | (113) | |
| Foreign government bonds | | 129,074 | | | (407) | | | 9,900 | | | (100) | | | 138,974 | | | (507) | |
| Asset-backed securities | | 52,565 | | | (902) | | | 12,187 | | | (452) | | | 64,752 | | | (1,354) | |
| CLOs | | 284,706 | | | (9,294) | | | 0 | | | 0 | | | 284,706 | | | (9,294) | |
| Total AFS debt securities | | $ | 1,388,661 | | | $ | (18,990) | | | $ | 351,048 | | | $ | (4,249) | | | $ | 1,739,709 | | | $ | (23,239) | |
|
| | | | | | | | | | | | |
| | | | | | | | | | | | |
As of December 31, 2020,2023, the Company had 104547 AFS debt securities in a gross unrealized loss position with 0no credit impairment. The AFS debt securities that made up the gross unrealized loss asimpairment, primarily consisting of December 31, 2020 were comprised primarily of 46255 U.S. government agency and U.S. government-sponsored enterprise mortgage-backed securities, 3 CLOs,66 corporate debt securities, and 17 corporate debt99 non-agency mortgage-backed securities. In comparison, as of December 31, 2019,2022, the Company had 101559 AFS debt securities in a gross unrealized loss position with 0no credit impairment. The AFS debt securities that made up the gross unrealized loss asimpairment, primarily consisting of December 31, 2019 were comprised primarily of 3 CLOs, 57263 U.S. government agency and U.S. government-sponsored enterprise mortgage-backed securities, 100 non-agency mortgage-backed securities, and 14 U.S. government agency and U.S. government-sponsored enterprise68 corporate debt securities.
Allowance for Credit Losses on Available-for-Sale Debt Securities
Each reporting period, theThe Company assessesevaluates each AFS debt security that is in an unrealized loss position to determine whetherwhere the decline in fair value declines below the amortized cost basis resulted from a credit loss or other factors.cost. For a discussion of the factors and criteria the Company uses in analyzing securities for impairment related to credit losses, see Note 1 — Summary of Significant Accounting Policies — Significant Accounting Policies — Allowance for Credit Losses on Available-for-Sale Debt Securities to the Consolidated Financial Statements in this Form 10-K. Prior to January 1, 2020, the Company assessed individual securities that were in an unrealized loss position for OTTI.
The gross unrealized losses presented in the abovepreceding tables were primarily attributable to yield curve movementsinterest rate movement and widenedthe widening of liquidity and/or credit spreads. SecuritiesU.S. Treasury, U.S. government agency, U.S. government-sponsored agency, and U.S. government-sponsored enterprise debt and mortgage-backed securities are issued, guaranteed, or otherwise supported by the U.S. government and have a zero credit loss assumption. The remaining securities that were in an unrealized loss positionsposition as of December 31, 20202023 were mainly comprised of the following:
•U.S. government agency and U.S. government-sponsored enterprise mortgage-backed securities — The market value decline as of December 31, 2020 was primarily due to interest rate movement. Since these securities are guaranteed or sponsored by agencies of the U.S. government, and the credit profiles are strong (rated Aaa, AA+ and AAA by Moody’s Investors Service (“Moody’s”), Standard & Poor's (“S&P”) and Fitch Ratings (“Fitch”), respectively), the Company expects to receive all contractual interest payments on time, and believes the risk of credit losses on these securities is remote.
•CLOs — The market value decline as of December 31, 2020 was largely due to the widening in spreads. The credit profiles of the securities are strong (rated A or higher by S&P) and the contractual payments from these bonds are expected to be received on time. Accordingly, the Company believes that the risk of credit losses on these securities is remote.
•Corporate debt securities — The market value decline as of December 31, 20202023 was primarily due to interest rate movement and the widening in spreads. Since credit profilesspread widening. A portion of the corporate debt securities is comprised of subordinated debt securities issued by U.S. banks. Despite the reduction of the market value of these securities after the banking sector disruption in 2023, these securities are nearly all rated investment grade by NRSROs or issued by well-capitalized financial institutions with strong (rated BBB- or higher by Moody’s, S&P, Kroll Bond Rating Agency and Fitch, respectively), and theprofitability. The contractual payments from these bondscorporate debt securities have been and are expected to be received on time. The Company will continue to monitor the market developments in the banking sector and the credit performance of these securities.
•Non-agency mortgage-backed securities — The market value decline as of December 31, 2023, was primarily due to interest rate movement and spread widening. Since these securities are rated investment grade by NRSROs, or have high priority in the cash flow waterfall within the securitization structure, and the contractual payments have historically been on time, the Company believes that the risk of credit losses on these securities is remote.low.
Overall, the Company believes that the credit support levels of the AFS debt securities are strong and, based on current assessments and macroeconomic forecasts, expects that full contractual cash flows will be received even if near-term credit performance could possibly be under the impact of the COVID-19 pandemic.
As of both December 31, 2020,2023 and 2022, the Company had the intentintended to hold the AFS debt securities with unrealized losses through the anticipated recovery period and it was more-likely-than-not that the Company willwould not have to sell these securities before the recovery of their amortized cost. The issuers of these securities have not, to the Company’s knowledge, established any cause for default on these securities. As a result, the Company expects to recover the entire amortized cost basis of these securities. Accordingly, there was 0no allowance for credit losses as of December 31, 2020provided against these securities as of both December 31, 2023 and 2022. In addition, there was 0no provision for credit losses recognized for the year ended December 31, 2020. For the years ended December 31, 20192023, 2022, and 2018, there was 0 OTTI credit loss recognized.2021.
Allowance for Credit Losses on Held-to-Maturity Debt Securities
The Company separately evaluates its HTM debt securities for any credit losses using an expected loss model, similar to the methodology used for loans. For additional information on the Company’s credit loss methodology, refer to Note 1 — Summary of Significant Accounting Policies— Significant Accounting Policies — Allowance for Credit Losses on Held-to-Maturity Debt Securities to the Consolidated Financial Statements in this Form 10-K.
The Company monitors the credit quality of the HTM debt securities using external credit ratings. As of December 31, 2023, all HTM securities were rated investment grade by NRSROs and issued, guaranteed, or supported by U.S. government entities and agencies. Accordingly, the Company applied a zero credit loss assumption and no allowance for credit losses was recorded as of December 31, 2023 and 2022. Overall, the Company believes that the credit support levels of the debt securities are strong and, based on current assessments and macroeconomic forecasts, expects that full contractual cash flows will be received.
Realized Gains and Losses
The following table presents the gross realized gains and tax expense related tofrom the sales and impairment write-off of AFS debt securities and the related tax (benefit) expense included in earnings for the years ended December 31, 2023, 2022 and 2021:
| | | | | | | | | | | | | | | | | | | | |
|
| | Year Ended December 31, |
| ($ in thousands) | | 2023 | | 2022 | | 2021 |
| | | | | | |
Gross realized gains from sales (1) | | $ | 3,138 | | | $ | 1,306 | | | $ | 1,568 | |
| | | | | | |
Impairment write-off (1) | | $ | (10,000) | | | $ | — | | | $ | — | |
| Related tax (benefit) expense | | $ | (2,029) | | | $ | 386 | | | $ | 464 | |
|
(1)During 2023, the Company recognized $7 million in net losses on AFS securities as a component of noninterest income in the Company’s Consolidated Statement of Income, consisting of a $10 million impairment write-off on a subordinated debt security, partially offset by a $3 million gain on the sale of the same security.
Interest Income
The following table presents the composition of interest income on debt securities for the years ended December 31, 2020, 20192023, 2022 and 2018:2021:
| | | | | | | | | | | | | | | | | | | | |
|
| ($ in thousands) | | Year Ended December 31, |
| 2020 | | 2019 | | 2018 |
| | | | | | |
| Gross realized gains | | $ | 12,299 | | | $ | 3,930 | | | $ | 2,535 | |
| | | | | | |
| Related tax expense | | $ | 3,636 | | | $ | 1,162 | | | $ | 749 | |
|
| | | | | | | | | | | | | | | | | | | | | | | | |
|
| | Year Ended December 31, | | |
| ($ in thousands) | | 2023 | | 2022 | | 2021 | | | | |
| | | | | | | | | | |
| Taxable interest | | $ | 255,475 | | | $ | 179,720 | | | $ | 131,985 | | | | | |
| Nontaxable interest | | 20,715 | | | 19,186 | | | 11,998 | | | | | |
| Total interest income on debt securities | | $ | 276,190 | | | $ | 198,906 | | | $ | 143,983 | | | | | |
|
Contractual Maturities of Available-for-Sale and Held-to-Maturity Debt Securities
The following table presentstables present the contractual maturities, amortized cost, fair value and weighted average yields of AFS and HTM debt securities as of December 31, 2020.2023. Expected maturities will differ from contractual maturities on certain securities as the issuers and borrowers of the underlying collateral may have the right to call or prepay obligations with or without prepayment penalties.
| | | | | | | | | | | | | | |
|
| ($ in thousands) | | Amortized Cost | | Fair Value |
| Due within one year | | $ | 893,162 | | | $ | 892,648 | |
| Due after one year through five years | | 639,543 | | | 646,245 | |
| Due after five years through ten years | | 483,606 | | | 499,880 | |
| Due after ten years | | 3,454,212 | | | 3,505,885 | |
| Total AFS debt securities | | $ | 5,470,523 | | | $ | 5,544,658 | |
|
| | | | | | | | | | | | | | | | | | | | | | | | | | | | | | | | |
|
| ($ in thousands) | | Within One Year | | After One Year through Five Years | | After Five Years through Ten Years | | After Ten Years | | Total |
| AFS debt securities: | | | | | | | | | | |
| U.S. Treasury securities | | | | | | | | | | |
| Amortized cost | | $ | 436,296 | | | $ | 676,291 | | | $ | — | | | $ | — | | | $ | 1,112,587 | |
| Fair value | | 436,397 | | | 623,978 | | | — | | | — | | | 1,060,375 | |
Weighted-average yield (1) | | 5.40 | % | | 1.20 | % | | — | % | | — | % | | 2.85 | % |
| U.S. government agency and U.S. government-sponsored enterprise debt securities | | | | | | | | | | |
| Amortized cost | | 50,000 | | | 96,470 | | | 128,169 | | | 137,447 | | | 412,086 | |
| Fair value | | 49,882 | | | 93,182 | | | 109,134 | | | 112,248 | | | 364,446 | |
Weighted-average yield (1) | | 5.00 | % | | 3.08 | % | | 1.38 | % | | 2.33 | % | | 2.53 | % |
| U.S. government agency and U.S. government-sponsored enterprise mortgage-backed securities | | | | | | | | | | |
| Amortized cost | | — | | | 41,533 | | | 142,008 | | | 2,304,763 | | | 2,488,304 | |
| Fair value | | — | | | 39,930 | | | 130,528 | | | 2,025,395 | | | 2,195,853 | |
Weighted-average yield (1) (2) | | — | % | | 3.13 | % | | 2.70 | % | | 3.68 | % | | 3.62 | % |
| Municipal securities | | | | | | | | | | |
| Amortized cost | | 2,240 | | | 35,100 | | | 9,624 | | | 250,319 | | | 297,283 | |
| Fair value | | 2,214 | | | 32,877 | | | 8,752 | | | 217,173 | | | 261,016 | |
Weighted-average yield (1) (2) | | 3.39 | % | | 2.24 | % | | 3.22 | % | | 2.23 | % | | 2.27 | % |
| Non-agency mortgage-backed securities | | | | | | | | | | |
| Amortized cost | | 96,990 | | | 77,046 | | | — | | | 878,877 | | | 1,052,913 | |
| Fair value | | 95,856 | | | 74,884 | | | — | | | 750,447 | | | 921,187 | |
Weighted-average yield (1) | | 6.74 | % | | 4.44 | % | | — | % | | 2.59 | % | | 3.11 | % |
| Corporate debt securities | | | | | | | | | | |
| Amortized cost | | — | | | — | | | 349,501 | | | 304,000 | | | 653,501 | |
| Fair value | | — | | | — | | | 290,877 | | | 211,548 | | | 502,425 | |
Weighted average yield (1) | | — | % | | — | % | | 3.48 | % | | 1.97 | % | | 2.78 | % |
| Foreign government bonds | | | | | | | | | | |
| Amortized cost | | 33,262 | | | 106,071 | | | 50,000 | | | 50,000 | | | 239,333 | |
| Fair value | | 33,231 | | | 106,026 | | | 49,593 | | | 39,024 | | | 227,874 | |
Weighted-average yield (1) | | 3.02 | % | | 2.28 | % | | 5.73 | % | | 1.50 | % | | 2.94 | % |
| Asset-backed securities | | | | | | | | | | |
| Amortized cost | | — | | | — | | | — | | | 43,234 | | | 43,234 | |
| Fair value | | — | | | — | | | — | | | 42,300 | | | 42,300 | |
Weighted-average yield (1) | | — | % | | — | % | | — | % | | 6.07 | % | | 6.07 | % |
| CLOs | | | | | | | | | | |
| Amortized cost | | — | | | — | | | 319,000 | | | 298,250 | | | 617,250 | |
| Fair value | | — | | | — | | | 315,410 | | | 297,451 | | | 612,861 | |
Weighted average yield (1) | | — | % | | — | % | | 6.80 | % | | 6.82 | % | | 6.81 | % |
| Total AFS debt securities | | | | | | | | | | |
| Amortized cost | | $ | 618,788 | | | $ | 1,032,511 | | | $ | 998,302 | | | $ | 4,266,890 | | | $ | 6,916,491 | |
| Fair value | | $ | 617,580 | | | $ | 970,877 | | | $ | 904,294 | | | $ | 3,695,586 | | | $ | 6,188,337 | |
Weighted-average yield (1) | | 5.44 | % | | 1.84 | % | | 4.27 | % | | 3.42 | % | | 3.49 | % |
|
| | | | | | | | | | | | | | | | | | | | | | | | | | | | | | | | |
|
| ($ in thousands) | | Within One Year | | After One Year through Five Years | | After Five Years through Ten Years | | After Ten Years | | Total |
| HTM debt securities: | | | | | | | | | | |
| U.S. Treasury securities | | | | | | | | | | |
| Amortized cost | | $ | — | | $ | 529,548 | | $ | — | | $ | — | | $ | 529,548 |
| Fair value | | — | | 488,551 | | — | | — | | 488,551 |
Weighted-average yield (1) | | — | % | | 1.05 | % | | — | % | | — | % | | 1.05 | % |
| U.S. government agency and U.S. government-sponsored enterprise debt securities | | | | | | | | | | |
| Amortized cost | | — | | — | | 343,319 | | 658,517 | | 1,001,836 |
| Fair value | | — | | — | | 296,124 | | 518,808 | | 814,932 |
Weighted-average yield (1) | | — | % | | — | % | | 1.90 | % | | 1.89 | % | | 1.90 | % |
| U.S. government agency and U.S. government-sponsored enterprise mortgage-backed securities | | | | | | | | | | |
| Amortized cost | | — | | — | | 99,473 | | 1,136,311 | | 1,235,784 |
| Fair value | | — | | — | | 84,323 | | 920,374 | | 1,004,697 |
Weighted-average yield (1) (2) | | — | % | | — | % | | 1.61 | % | | 1.70 | % | | 1.69 | % |
| Municipal securities | | | | | | | | | | |
| Amortized cost | | — | | — | | — | | 188,872 | | 188,872 |
| Fair value | | — | | — | | — | | 145,791 | | 145,791 |
Weighted-average yield (1) (2) | | — | % | | — | % | | — | % | | 1.99 | % | | 1.99 | % |
| Total HTM debt securities | | | | | | | | | | |
| Amortized cost | | $ | — | | $ | 529,548 | | $ | 442,792 | | $ | 1,983,700 | | $ | 2,956,040 |
| Fair value | | $ | — | | $ | 488,551 | | $ | 380,447 | | $ | 1,584,973 | | $ | 2,453,971 |
Weighted-average yield (1) | | — | % | | 1.05 | % | | 1.83 | % | | 1.79 | % | | 1.66 | % |
|
(1)Weighted-average yields are computed based on amortized cost balances.
(2)Yields on tax-exempt securities are not presented on a tax-equivalent basis.
As of December 31, 20202023 and 2019,2022, AFS and HTM debt securities with fair valuecarrying values of $588.5 million$7.0 billion and $479.4$794 million, respectively, were pledged to secure borrowings, public deposits, repurchase agreements and for other purposes required or permitted by law.
Restricted Equity Securities
The following table presents the restricted equity securities included in Other assets on the Consolidated Balance Sheet as of December 31, 20202023 and 2019:2022:
| | | ($ in thousands) | | December 31, |
| | | December 31, | |
| | December 31, | |
| | December 31, | |
| | December 31, | |
| | December 31, | |
| | December 31, | |
| | December 31, | |
| | December 31, | |
| | December 31, | |
| | December 31, | |
| | December 31, | |
| | December 31, | |
| | December 31, | |
| | December 31, | |
| ($ in thousands) | ($ in thousands) | | 2020 | | 2019 | ($ in thousands) | | 2023 | | 2022 |
| $ | 59,249 | | | $ | 58,330 | |
| FHLB stock | FHLB stock | | 23,797 | | | 20,250 | |
| Total restricted equity securities | Total restricted equity securities | | $ | 83,046 | | | $ | 78,580 | |
|
Note 5 — Derivatives
The Company uses derivativesderivative instruments to manage exposure to market risk, primarily interest rate orand foreign currency risk,risks, as well as to assist customers with their risk management objectives. The Company’s goal is to manage interest rate sensitivity and volatility so that movements into mitigate the effect of interest rates do not significantly affectrate changes on earnings or capital. The Company also uses foreign exchange contracts to manage the foreign exchange rate risk associated with certain foreign currency-denominated assets and liabilities, as well as the Bank’s investment in East West Bank (China) Limited. The Company recognizes all derivatives on the Consolidated Balance Sheet at fair value. While the Company designates certain derivatives as hedging instruments in a qualifying hedge accounting relationship, other derivatives consist ofserve as economic hedges. For additional information on the Company’s derivatives and hedging activities, see Note 1 — Summary of Significant Accounting Policies — Significant Accounting Policies — Derivatives to the Consolidated Financial Statements in this Form 10-K.
The following table presents the total notional amounts and gross fair values of the Company’s derivatives as well as the balance sheet netting adjustments on an aggregate basis as of December 31, 20202023 and 2019.2022. Certain derivative contracts are cleared though central clearing organizations where variation margin is applied daily as settlement to the fair values of the contracts. The derivative assets and liabilitiesfair values are presented on a gross basis prior to the application of bilateral collateral and master netting agreements, but after the application of variation margin payments withas settlement to fair values of contracts cleared through central clearing organizations have been appliedorganizations. Applying variation margin payments as settlement to the fair values of derivative contracts cleared through the London Clearing House (“LCH”) and the Chicago Mercantile Exchange (“CME”) resulted in reductions in both the derivative asset and liability fair values of $43 millionas applicable.of December 31, 2023. In comparison, applying variation margin payments as settlement to LCH- and CME-cleared derivative transactions resulted in reductions in the derivative asset and liability fair values of $167 million and $81 million, respectively, as of December 31, 2022. Total derivative assetsasset and liabilitiesliability fair values are adjusted to take into considerationreflect the effects of legally enforceable master netting agreements and cash collateral received or paid as of December 31, 2020 and 2019.paid. The resulting net derivative asset and liability fair values are included in Other assets and Accrued expenses and other liabilities, respectively, on the Consolidated Balance Sheet.
| | | ($ in thousands) | | December 31, 2020 | | December 31, 2019 |
| Notional
Amount | | Fair Value | | Notional
Amount | | Fair Value |
| | | December 31, 2023 | |
| | December 31, 2023 | |
| | December 31, 2023 | |
| | December 31, 2023 | |
| | December 31, 2023 | |
| | December 31, 2023 | |
| | December 31, 2023 | |
| | December 31, 2023 | |
| | December 31, 2023 | |
| | December 31, 2023 | |
| | December 31, 2023 | |
| | December 31, 2023 | |
| | December 31, 2023 | |
| | December 31, 2023 | |
| | December 31, 2023 | |
| | December 31, 2023 | |
| | December 31, 2023 | |
| | December 31, 2023 | |
| | December 31, 2023 | |
| | December 31, 2023 | |
| | December 31, 2023 | |
| | December 31, 2023 | |
| | December 31, 2023 | |
| | December 31, 2023 | |
| | December 31, 2023 | |
| | December 31, 2023 | |
| | December 31, 2023 | |
| | December 31, 2023 | |
| | December 31, 2023 | |
| | December 31, 2023 | |
| | December 31, 2023 | |
| | December 31, 2023 | |
| | December 31, 2023 | |
| | December 31, 2023 | |
| | December 31, 2023 | |
| | December 31, 2023 | |
| | December 31, 2023 | |
| | December 31, 2023 | | | December 31, 2022 |
| | | | Fair Value | | | | | | Fair Value | | | | Fair Value |
| ($ in thousands) | ($ in thousands) | | Notional
Amount | | Derivative
Assets | | Derivative
Liabilities | | Notional
Amount | | Derivative
Assets | | Derivative
Liabilities | ($ in thousands) | | Notional Amount | | Assets | | Liabilities | | Notional Amount | | Assets | | Liabilities |
| | | Interest rate contracts | | $ | 0 | | | $ | 0 | | | $ | 0 | | | $ | 31,026 | | | $ | 0 | | | $ | 3,198 | |
| | Cash flow hedges: | |
| | Cash flow hedges: | |
| | Cash flow hedges: | Cash flow hedges: | |
| Interest rate contracts | Interest rate contracts | | 275,000 | | | 0 | | | 1,864 | | | 0 | | | 0 | | | 0 | |
| Interest rate contracts | |
| Interest rate contracts | |
| Net investment hedges: | Net investment hedges: | |
| Foreign exchange contracts | |
| Foreign exchange contracts | |
| Foreign exchange contracts | Foreign exchange contracts | | 84,269 | | | 0 | | | 235 | | | 86,167 | | | 0 | | | 1,586 | |
| Total derivatives designated as hedging instruments | Total derivatives designated as hedging instruments | | $ | 359,269 | | | $ | 0 | | | $ | 2,099 | | | $ | 117,193 | | | $ | 0 | | | $ | 4,784 | |
| | Derivatives not designated as hedging instruments: | Derivatives not designated as hedging instruments: | | | | | | | | | | | | |
| Derivatives not designated as hedging instruments: | |
| Derivatives not designated as hedging instruments: | |
| Interest rate contracts | Interest rate contracts | | $ | 18,155,678 | | | $ | 489,132 | | | $ | 315,834 | | | $ | 15,489,692 | | | $ | 192,883 | | | $ | 124,119 | |
| Interest rate contracts | |
| Interest rate contracts | |
Commodity contracts (1) | |
| Foreign exchange contracts | Foreign exchange contracts | | 3,108,488 | | | 30,300 | | | 22,524 | | | 4,839,661 | | | 54,637 | | | 47,024 | |
| Credit contracts | | 76,992 | | | 13 | | | 206 | | | 210,678 | | | 2 | | | 84 | |
Credit contracts (2) | |
| Equity contracts | Equity contracts | | 0 | | (1) | 858 | | | 0 | | | 0 | | (1) | 1,414 | | | 0 | |
| Commodity contracts | | 0 | | (2) | 82,451 | | | 84,165 | | | 0 | | (2) | 81,380 | | | 80,517 | |
| Total derivatives not designated as hedging instruments | Total derivatives not designated as hedging instruments | | $ | 21,341,158 | | | $ | 602,754 | | | $ | 422,729 | | | $ | 20,540,031 | | | $ | 330,316 | | | $ | 251,744 | |
| Gross derivative assets/liabilities | Gross derivative assets/liabilities | | | | $ | 602,754 | | | $ | 424,828 | | | | | $ | 330,316 | | | $ | 256,528 | |
| Less: Master netting agreements | Less: Master netting agreements | | (93,063) | | | (93,063) | | | (121,561) | | | (121,561) | |
| Less: Cash collateral received/paid | Less: Cash collateral received/paid | | (8,449) | | | (91,634) | | | (3,758) | | | (38,238) | |
| Net derivative assets/liabilities | Net derivative assets/liabilities | | $ | 501,242 | | | $ | 240,131 | | | $ | 204,997 | | | $ | 96,729 | |
|
(1)The Company held equity contracts in 2 public companies and 17 private companies as of December 31, 2020. In comparison, the Company held equity contracts in 3 public companies and 18 private companies as of December 31, 2019.
(2)The notional amount of the Company’s commodity contracts entered with its customers totaled 6,32118,631 thousand barrels of crude oil and 109,635328,844 thousand units of natural gas, measured in million British thermal units (“MMBTUs”) as of December 31, 2020.2023. In comparison, the notional amount of the Company’s commodity contracts entered with its customers totaled 7,81112,005 thousand barrels of crude oil and 63,773247,704 thousand MMBTUs of natural gas as of December 31, 2019. 2022.
(2)Notional amount for credit contracts reflects the Company’s pro-rata share of the derivative instruments in RPAs.
(3)The Company simultaneously entered into the offsetting commodityheld equity contracts with mirrored terms with third-party financial institutions.in 11 private companies and one public company as of December 31, 2023, and 13 private companies and one public company as of December 31, 2022.
(4)Equity contracts classified as derivative liabilities consist of 349,138 performance-based RSUs granted as part of EWBC’s consideration in its investment in Rayliant.
Derivatives Designated as Hedging Instruments
Fair Value Hedges — The Company entered into interest rate swaps designated as fair value hedges to hedge changes in the fair value of certain certificates of deposit due to changes in the benchmark interest rate. The interest rate swaps involved the exchange of variable-rate payments over the life of the agreements without exchanging the underlying notional amounts. During 2020, both the hedging interest rate swaps and hedged certificates of deposit were called.
The following table presents the net gains (losses) recognized on the Consolidated Statement of Income related to the derivatives designated as fair value hedges for the years ended December 31, 2020, 2019 and 2018:
| | | | | | | | | | | | | | | | | | | | |
|
| ($ in thousands) | | Year Ended December 31, |
| 2020 | | 2019 | | 2018 |
| Gains (losses) recorded in interest expense: | | | | | | |
| Recognized on interest rate swaps | | $ | 3,146 | | | $ | 2,655 | | | $ | (93) | |
| Recognized on certificates of deposit | | $ | (1,605) | | | $ | (2,536) | | | $ | 278 | |
| | | | | | |
|
As of December 31, 2020, there was no fair value hedge or hedged certificates of deposit outstanding. The carrying amount and associated cumulative basis adjustment related to the application of fair value hedge accounting that is included in the carrying amount of the hedged certificates of deposit as of December 31, 2020 and 2019:
| | | | | | | | | | | | | | | | | | | | | | | | | | |
|
| ($ in thousands) | | Carrying Value (1) | | Cumulative Fair Value Adjustment (2) |
| December 31, | | December 31, |
| 2020 | | 2019 | | 2020 | | 2019 |
| Certificates of deposit | | $ | 0 | | | $ | (29,080) | | | $ | 0 | | | $ | 1,604 | |
|
(1)Represents the full carrying amount of the hedged certificates of deposit.
(2)For liabilities, (increase) decrease to carrying value.
Cash Flow Hedges — The Company entered intouses interest rate swaps that were designated and qualified as cash flow hedges in the second quarter of 2020 to hedge the variability in interest paymentsamount received on certain floating-rate borrowings. Forcommercial loans, or paid on certain floating-rate borrowings due to changes in contractually specified interest rates. As of December 31, 2023, interest rate contracts with total notional amount of $5.3 billion were designated as cash flow hedges the entire change in the fair value ofto convert certain variable-rate loans from floating-rate payments to fixed-rate payments. Gains and losses on the hedging derivative instruments isare recognized in AOCI and reclassified to earnings in the same period when the hedged cash flows impact earnings. Reclassified gainsearnings and losses on interest rate swaps are recorded inwithin the same income statement line item as the interest payments of the hedged long-term borrowings within Interest expense in the Consolidated Statements of Income. As of December 31, 2020, the notional amount of the interest rate swaps that were designated as cash flow hedges was $275.0 million.flows. Considering the interest rates, yield curve and notional amounts as of December 31, 2020,2023, the Company expects to reclassify an estimated $599 thousand$47 million of after-tax net losses on derivative instruments designated as cash flow hedges from AOCI into earnings during the next 12 months.
The following table presents the pre-tax changes in AOCI from cash flow hedges for the years ended December 31, 2020, 20192023, 2022 and 2018.2021. The after-tax impact of cash flow hedges on AOCI is shown in Note 1415 — Accumulated Other Comprehensive Income (Loss) to the Consolidated Financial Statements in the Form-10-K.this Form 10-K.
| | | | | | | | | | | | | | | | | | | | |
|
| ($ in thousands) | | Year Ended December 31, |
| 2020 | | 2019 | | 2018 |
| Losses recognized in AOCI | | $ | (1,604) | | | $ | 0 | | | $ | 0 | |
| Gains reclassified from AOCI to Interest expense | | $ | 113 | | | $ | 0 | | | $ | 0 | |
|
| | | | | | | | | | | | | | | | | | | | | | |
| | |
| | Year Ended December 31, | | |
| ($ in thousands) | | 2023 | | 2022 | | 2021 | | |
| (Losses) gains recognized in AOCI: | | | | | | | | |
| Interest rate contracts | | $ | (5,767) | | | $ | (74,069) | | | $ | 1,210 | | | |
| Gains (losses) reclassified from AOCI into earnings: | | | | | | | | |
| Interest expense (for cash flow hedges on borrowings) | | $ | 696 | | | $ | 3,200 | | | $ | (868) | | | |
| Interest and dividend income (for cash flow hedges on loans) | | (82,153) | | | (7,204) | | | — | | | |
| Noninterest income | | 1,614 | | (1) | — | | | — | | | |
| Total | | $ | (79,843) | | | $ | (4,004) | | | $ | (868) | | | |
| | |
(1)Represents the amounts in AOCI reclassified into earnings as a result that the forecasted cash flows were no longer probable to occur.
Net Investment Hedges — ASC 830-20, Foreign Currency Matters — Foreign Currency Transactions and ASC 815, Derivatives and Hedging, allow hedging of the foreign currency risk of a net investment in a foreign operation. The Company enters into foreign currency forward contracts to hedge a portion of the Bank’s investment in East West Bank (China) Limited, a non-USD functional currency subsidiary in China. The hedging instruments designated as net investment hedges involve hedging the risk of changes in the USD equivalent value of a designated monetary amount of the Bank’s net investment in East West Bank (China) Limited,were used to hedge against the risk of adverse changes in the foreign currency exchange rate of the RMB. The Company may de-designate the net investment hedges when the Company expects the hedge will cease to be highly effective. The notional and fair value amounts of the foreign exchange forward contracts were $84.3 million and $235 thousand liability, respectively, as of December 31, 2020. In comparison, the notional and fair value amounts of the foreign exchange forward contracts were $86.2 million and $1.6 million liability, respectively, as of December 31, 2019.
The following table presents the after-taxpre-tax gains (losses) gains recognized in AOCI on net investment hedges for the years ended December 31, 2020, 20192023, 2022 and 2018:2021:
| | | | Year Ended December 31, | |
| | Year Ended December 31, | |
| | Year Ended December 31, | |
| | Year Ended December 31, | |
| | Year Ended December 31, | |
| | Year Ended December 31, | |
| | Year Ended December 31, | |
| | Year Ended December 31, | |
| | Year Ended December 31, | |
| | Year Ended December 31, | |
| | Year Ended December 31, | |
| | Year Ended December 31, | |
| | Year Ended December 31, | |
| | Year Ended December 31, | |
| | Year Ended December 31, | |
| | Year Ended December 31, | |
| | Year Ended December 31, | |
| | Year Ended December 31, | |
| | Year Ended December 31, | |
| | Year Ended December 31, | |
| | Year Ended December 31, | |
| ($ in thousands) | ($ in thousands) | | Year Ended December 31, | ($ in thousands) | | 2023 | | 2022 | | 2021 |
| 2020 | | 2019 | | 2018 |
| (Losses) gains recognized in AOCI | | $ | (4,801) | | | $ | (471) | | | $ | 6,072 | |
| Gains (losses) recognized in AOCI | |
| |
Derivatives Not Designated as Hedging Instruments
Interest Rate Contracts Customer-Related Positions and Economic Hedge Derivatives — The Company enters into interest rate, contracts, which include interest rate swapscommodity, and options withforeign exchange derivatives at the request of its customers to allow customers to hedge against the risk of rising interest rates on their variable rate loans. To economically hedge against the interest rate risks in the products offered to its customers, the Company enters into mirrored offsetting interest rate contracts with third-party financial institutions, including central clearing organizations.
The following tables present the notional amounts and the gross fair values of interest rate derivative contracts outstanding as of December 31, 2020 and 2019:
| | | | | | | | | | | | | | | | | | | | | | | | | | | | | | | | | | | | | | | | | | | | |
|
| ($ in thousands) | | December 31, 2020 |
| Customer Counterparty | | ($ in thousands) | | Financial Counterparty |
| Notional
Amount | | Fair Value | | | Notional
Amount | | Fair Value |
| | Assets | | Liabilities | | | | Assets | | Liabilities |
| Written options | | $ | 957,393 | | | $ | 0 | | | $ | 115 | | | Purchased options | | $ | 957,393 | | | $ | 101 | | | $ | 15 | |
| Sold collars and corridors | | 518,477 | | | 7,673 | | | 0 | | | Collars and corridors | | 518,477 | | | 0 | | | 7,717 | |
| Swaps | | 7,586,414 | | | 479,634 | | | 1,364 | | | Swaps | | 7,617,524 | | | 1,724 | | | 306,623 | |
| Total | | $ | 9,062,284 | | | $ | 487,307 | | | $ | 1,479 | | | Total | | $ | 9,093,394 | | | $ | 1,825 | | | $ | 314,355 | |
|
| | | | | | | | | | | | | | | | | | | | | | | | | | | | | | | | | | | | | | | | | | | | |
|
| ($ in thousands) | | December 31, 2019 |
| Customer Counterparty | | ($ in thousands) | | Financial Counterparty |
| Notional
Amount | | Fair Value | | | Notional
Amount | | Fair Value |
| | Assets | | Liabilities | | | | Assets | | Liabilities |
| Written options | | $ | 1,003,558 | | | $ | 0 | | | $ | 66 | | | Purchased options | | $ | 1,003,558 | | | $ | 67 | | | $ | 0 | |
| Sold collars and corridors | | 490,852 | | | 1,971 | | | 16 | | | Collars and corridors | | 490,852 | | | 17 | | | 1,996 | |
| Swaps | | 6,247,667 | | | 187,294 | | | 6,237 | | | Swaps | | 6,253,205 | | | 3,534 | | | 115,804 | |
| Total | | $ | 7,742,077 | | | $ | 189,265 | | | $ | 6,319 | | | Total | | $ | 7,747,615 | | | $ | 3,618 | | | $ | 117,800 | |
|
In January 2018, the London Clearing House (“LCH”) amended its rulebook to legally characterize variation margin payments made to and received from LCH as settlements of derivatives, and not as collateral against derivatives. Included in the total notional amount of $9.09 billion of interest rate contracts entered into with financial counterparties as of December 31, 2020, was a notional amount of $2.98 billion of interest rate swaps that cleared through LCH. Applying variation margin payments as settlement to LCH cleared derivative transactions resulted in a reduction in derivative asset fair values of $1.3 million and liability fair values of $187.4 million, as of December 31, 2020. In comparison, included in the total notional amount of $7.75 billion of interest rate contracts entered into with financial counterparties as of December 31, 2019, was a notional amount of $2.53 billion of interest rate swaps that cleared through LCH. Applying variation margin payments as settlement to LCH cleared derivative transactions resulted in a reduction in derivative asset fair values of $2.9 million and liability fair values of $75.1 million, as of December 31, 2019.
Foreign Exchange Contracts — The Company enters into foreign exchange contracts with its customers, consisting of forwards, spot, swap and option contracts to accommodate the business needs of its customers. The Companygenerally enters into offsetting foreign exchangederivative contracts with third-party financial institutions to manage its foreign exchange exposure with its customers, or entered into bilateral collateral and master netting agreements with certain customer counterparties to manager its credit exposure.mitigate the inherent market risk. The Company also utilizes foreign exchange contracts which are not designated as hedging instruments to mitigate the economic effect of currency fluctuations on certain foreign currency-denominated on-balance sheet assets and liabilities, primarily for foreign currency-denominatedcurrency denominated deposits offeredthat it offers to its customers. A majority of the foreign exchange contracts had original maturities of one year or less as of both December 31, 20202023 and 2019.2022.
The following tables presenttable presents the notional amounts and the gross fair values of the interest rate and foreign exchange derivative contracts outstandingderivatives entered into with customers and with third-party financial institutions as economic hedges to customers’ positions as of December 31, 20202023 and 2019:2022:
| | | | December 31, 2023 | |
| | | December 31, 2023 | |
| | | December 31, 2023 | |
| | | | Fair Value | |
| | | | Fair Value | |
| | | | Fair Value | |
| ($ in thousands) | ($ in thousands) | | December 31, 2020 |
| Customer Counterparty | | Financial Counterparty |
| Notional
Amount | | Fair Value | | | Notional
Amount | | Fair Value |
| Assets | | Liabilities | | ($ in thousands) | | Assets | | Liabilities |
| Customer-related positions: | |
| Customer-related positions: | |
| Customer-related positions: | |
| Interest rate contracts: | |
| Interest rate contracts: | |
| Interest rate contracts: | |
| Swaps | |
| Swaps | |
| Swaps | |
| Written options | |
| Written options | |
| Written options | |
| Collars and corridors | |
| Collars and corridors | |
| Collars and corridors | |
| Subtotal | |
| Subtotal | |
| Subtotal | |
| Foreign exchange contracts: | |
| Foreign exchange contracts: | |
| Foreign exchange contracts: | |
| Forwards and spot | |
| Forwards and spot | |
| Forwards and spot | Forwards and spot | | $ | 1,522,888 | | | $ | 17,575 | | | $ | 17,928 | | | Forwards and spot | | $ | 145,197 | | | $ | 1,230 | | | $ | 273 | |
| Swaps | Swaps | | 13,590 | | | 872 | | | 91 | | | Swaps | | 1,191,355 | | | 10,049 | | | 3,658 | |
| Swaps | |
| Swaps | |
| Other | |
| Other | |
| Other | |
| Subtotal | |
| Subtotal | |
| Subtotal | |
| Total | |
| Total | |
| Total | |
| Other economic hedges: | |
| Other economic hedges: | |
| Other economic hedges: | |
| Interest rate contracts: | |
| Interest rate contracts: | |
| Interest rate contracts: | |
| Swaps | |
| Swaps | |
| Swaps | |
| Purchased options | |
| Purchased options | |
| Purchased options | |
| Written options | Written options | | 117,729 | | | 0 | | | 574 | | | Purchased options | | 117,729 | | | 574 | | | 0 | |
| | Written options | |
| Written options | |
| Collars and corridors | |
| Collars and corridors | |
| Collars and corridors | |
| Subtotal | |
| Subtotal | |
| Subtotal | |
| Foreign exchange contracts: | |
| Foreign exchange contracts: | |
| Foreign exchange contracts: | |
| Forwards and spot | |
| Forwards and spot | |
| Forwards and spot | |
| Swaps | |
| Swaps | |
| Swaps | |
| Other | |
| Other | |
| Other | |
| Subtotal | |
| Subtotal | |
| Subtotal | |
| Total | |
| Total | |
| Total | Total | | $ | 1,654,207 | | | $ | 18,447 | | | $ | 18,593 | | | Total | | $ | 1,454,281 | | | $ | 11,853 | | | $ | 3,931 | |
|
| | | | | | | | | | | | | | | | | | | | | | | | | | | | | | | | | | | | | | | | | | | | |
|
| ($ in thousands) | | December 31, 2019 |
| Customer Counterparty | | | | Financial Counterparty |
| Notional
Amount | | Fair Value | | | | Notional
Amount | | Fair Value |
| | Assets | | Liabilities | | ($ in thousands) | | | Assets | | Liabilities |
| Forwards and spot | | $ | 3,581,036 | | | $ | 45,911 | | | $ | 40,591 | | | Forwards and spot | | $ | 207,492 | | | $ | 1,400 | | | $ | 507 | |
| Swaps | | 6,889 | | | 16 | | | 84 | | | Swaps | | 702,391 | | | 6,156 | | | 4,712 | |
| Written options | | 87,036 | | | 127 | | | 0 | | | Purchased options | | 87,036 | | | 0 | | | 127 | |
| Collars | | 2,244 | | | 0 | | | 14 | | | Collars | | 165,537 | | | 1,027 | | | 989 | |
| Total | | $ | 3,677,205 | | | $ | 46,054 | | | $ | 40,689 | | | Total | | $ | 1,162,456 | | | $ | 8,583 | | | $ | 6,335 | |
|
The Company enters into energy commodity contracts with its customers in the oil and gas sector, which allow them to hedge against the risk of fluctuation in energy commodity prices. Offsetting contracts entered with third-party financial institutions are used as economic hedges to manage the Company’s exposure on its customer-related positions. The following table presents the notional amounts in units and the gross fair values of the commodity derivatives issued for customer-related positions and other economic hedges as of December 31, 2023 and 2022:
| | | | | | | | | | | | | | | | | | | | | | | | | | | | | | | | | | | | | | | | | | | | | | | | |
| | | | |
| | December 31, 2023 | | December 31, 2022 | | | | |
| | | | | Fair Value | | | | | Fair Value | | | | |
| ($ in thousands) | | Notional Units | | Assets | | Liabilities | | Notional Units | | Assets | | Liabilities | | | | |
| Customer-related positions: | | | | | | | | | | | | | | | | | | |
| Commodity contracts: | | | | | | | | | | | | | | | | | | |
| Crude oil: | | | | | | | | | | | | | | | | | | |
| Swaps | | 3,277 | | Barrels | | $ | 3,735 | | | $ | 15,445 | | | 2,465 | | Barrels | | $ | 39,955 | | | $ | 6,178 | | | | | |
| Collars | | 5,966 | | Barrels | | 1,820 | | | 5,103 | | | 3,011 | | Barrels | | 16,038 | | | 2,630 | | | | | |
| Written options | | — | | Barrels | | — | | | — | | | — | | Barrels | | 558 | | — | | | | | |
| Subtotal | | 9,243 | | Barrels | | 5,555 | | | 20,548 | | | 5,476 | | Barrels | | 56,551 | | | 8,808 | | | | | |
| Natural gas: | | | | | | | | | | | | | | | | | | |
| Swaps | | 118,325 | | MMBTUs | | 438 | | | 73,793 | | | 92,590 | | MMBTUs | | 112,314 | | | 73,208 | | | | | |
| Collars | | 45,854 | | MMBTUs | | 21 | | | 20,400 | | | 32,072 | | MMBTUs | | 2,217 | | | 18,317 | | | | | |
| Written options | | 1,874 | | MMBTUs | | — | | | 233 | | | — | | MMBTUs | | — | | | — | | | | | |
| Subtotal | | 166,053 | | MMBTUs | | 459 | | | 94,426 | | | 124,662 | | MMBTUs | | 114,531 | | | 91,525 | | | | | |
| Total | | | | | $ | 6,014 | | | $ | 114,974 | | | | | | $ | 171,082 | | | $ | 100,333 | | | | | |
| Other economic hedges: | | | | | | | | | | | | | | | | | | |
| Commodity contracts: | | | | | | | | | | | | | | | | | | |
| Crude oil: | | | | | | | | | | | | | | | | | | |
| Swaps | | 3,422 | | Barrels | | $ | 9,166 | | | $ | 4,924 | | | 2,587 | | Barrels | | $ | 6,935 | | | $ | 36,060 | | | | | |
| Collars | | 5,966 | | Barrels | | 1,685 | | | 1,467 | | | 3,942 | | Barrels | | 1,378 | | | 12,856 | | | | | |
| Purchased options | | — | | Barrels | | — | | | — | | | — | | Barrels | | — | | | 516 | | | | | |
| Subtotal | | 9,388 | | Barrels | | 10,851 | | | 6,391 | | | 6,529 | | Barrels | | 8,313 | | | 49,432 | | | | | |
| Natural gas: | | | | | | | | | | | | | | | | | | |
| Swaps | | 116,463 | | MMBTUs | | 49,941 | | | 305 | | | 91,900 | | MMBTUs | | 69,767 | | | 106,883 | | | | | |
| Collars | | 44,454 | | MMBTUs | | 12,565 | | | — | | | 31,142 | | MMBTUs | | 12,451 | | | 1,960 | | | | | |
| Purchased options | | 1,874 | | MMBTUs | | 233 | | | — | | | — | | MMBTUs | | — | | | — | | | | | |
| Subtotal | | 162,791 | | MMBTUs | | 62,739 | | | 305 | | | 123,042 | | MMBTUs | | 82,218 | | | 108,843 | | | | | |
| Total | | | | | $ | 73,590 | | | $ | 6,696 | | | | | | $ | 90,531 | | | $ | 158,275 | | | | | |
| | | | |
Credit Contracts — The Company may periodically enterenters into RPA contractscredit RPAs with institutional counterparties to manage the credit exposure onof the interest rate contracts associated with syndicatedsyndication loans. Under the RPAs, a portion of the credit exposure is transferred from one party (the purchaser of credit protection) to another party (the seller of credit protection). The seller of credit protection is required to make payments to the purchaser of credit protection if the underlying borrower defaults on the related interest rate contract. The Company may enter into protection sold or protection purchased RPAs. Under the RPAs, the Company will receive or make a payment if a borrower defaults on the related interest rate contract. Credit risk on RPAs is managed by monitoring the credit worthiness of the borrowers and the institutional counterparties, which is based ona part of the Company’s normal credit review and monitoring process. The referencedAll reference entities of the protection sold RPAs were investment grade, as of both December 31, 2020 and 2019. The notional amount of the RPAs reflects the Company’s pro-rata share of the derivative instrument. The following table presents the notional amounts and the gross fair values of RPAs soldweighted-average remaining maturity was 2.8 years and purchased outstanding2.4 years as of December 31, 20202023 and 2019:
| | | | | | | | | | | | | | | | | | | | | | | | | | | | | | | | | | | | | | |
|
| ($ in thousands) | | December 31, 2020 | | December 31, 2019 |
| Notional Amount | | Fair Value | | Notional Amount | | Fair Value |
| | Assets | | Liabilities | | | Assets | | Liabilities |
| RPAs - protection sold | | $ | 66,278 | | | $ | 0 | | | $ | 206 | | | $ | 199,964 | | | $ | 0 | | | $ | 84 | |
| RPAs - protection purchased | | 10,714 | | | 13 | | | 0 | | | 10,714 | | | 2 | | | 0 | |
| Total RPAs | | $ | 76,992 | | | $ | 13 | | | $ | 206 | | | $ | 210,678 | | | $ | 2 | | | $ | 84 | |
|
2022, respectively. Assuming allthe underlying borrowers referenced in the interest rate contracts defaulted as of December 31, 2020 and 2019,2023, the maximum exposure from theof protection sold RPAs with protections sold would be $662 thousand and $125 thousand for 2020 and 2019, respectively. $177 thousand. In comparison, assuming the underlying borrowers referenced in the interest rate contracts defaulted as of December 31, 2022, the Company would not have any current exposure in the protection sold RPAs.
As of December 31, 20202023, the Company had one outstanding protection purchased RPA with a notional amount of $25 million and 2019,minimal fair value. In comparison, the weighted-average remaining maturitiesCompany did not have any outstanding protection purchased RPAs as of the outstanding RPAs were 3.7 years and 2.2 years, respectively.December 31, 2022.
Equity Contracts — From time to time, asAs part of the Company’s loan origination process, the Company obtainsmay obtain warrants to purchase the preferred and/or common stock of the borrowers’ companies, which are mainly in the technology and life sciences companies to which it provides loans to.sectors. Warrants grant the Company the right to buy a certain class of the underlying company’s equity at a certain price before expiration. In connection with the Company’s investment in Rayliant during the third quarter of 2023, the Company granted performance-based RSUs as part of its consideration. The Company held warrantsvesting of these equity contracts is contingent on Rayliant meeting certain financial performance targets during the future performance period. For additional information on these equity contracts, refer to Note 2— Fair Value Measurement and Fair Value of Financial Instruments and Note 7 — Investments in 2 public companiesQualified Affordable Housing Partnerships, Tax Credit and 17 private companies as of December 31, 2020,Other Investments, Net and held warrantsVariable Interest Entities to the Consolidated Financial Statements in 3 public companies and 18 private companies as of December 31, 2019. The total fair value of the warrants held in both public and private companies was $858 thousand and $1.4 million as of December 31, 2020 and 2019, respectively.this Form 10-K.
Commodity Contracts — The Company enters into energy commodity contracts in the form of swaps and options with its commercial loan customers to allow them to hedge against the risk of energy commodity price fluctuation. To economically hedge against the risk of commodity price fluctuation in the products offered to its customers, the Company enters into offsetting commodity contracts with third-party financial institutions to manage the exposure.
The following tables present the notional amounts and fair values of the commodity derivative positions outstanding as of December 31, 2020 and 2019.
| | | | | | | | | | | | | | | | | | | | | | | | | | | | | | | | | | | | | | | | | | | | | | | | | | | | | | | | |
|
| ($ and units in thousands) | | December 31, 2020 |
| Customer Counterparty | | ($ and units in thousands) | | Financial Counterparty |
| Notional
Unit | | Fair Value | | | Notional
Unit | | Fair Value |
| | Assets | | Liabilities | | | | Assets | | Liabilities |
| Crude oil: | | | | | | | | | | Crude oil: | | | | | | | | |
| | | | | | | | | | | | | | | | | | |
| Collars | | 2,022 | | | Barrels | | $ | 2,344 | | | $ | 2,193 | | | Collars | | 2,022 | | | Barrels | | $ | 2,217 | | | $ | 2,402 | |
| Swaps | | 4,299 | | | Barrels | | 9,282 | | | 14,283 | | | Swaps | | 4,299 | | | Barrels | | 8,220 | | | 7,135 | |
| Total | | 6,321 | | | | | $ | 11,626 | | | $ | 16,476 | | | Total | | 6,321 | | | | | $ | 10,437 | | | $ | 9,537 | |
| | | | | | | | | | | | | | | | | | |
| Natural gas: | | | | | | | | | | Natural gas: | | | | | | | | |
| Written options | | 597 | | | MMBTUs | | $ | 0 | | | $ | 59 | | | Purchased options | | 597 | | | MMBTUs | | $ | 59 | | | $ | 0 | |
| Collars | | 12,733 | | | MMBTUs | | 1,063 | | | 205 | | | Collars | | 16,293 | | | MMBTUs | | 205 | | | 813 | |
| Swaps | | 96,305 | | | MMBTUs | | 32,073 | | | 27,238 | | | Swaps | | 103,973 | | | MMBTUs | | 26,988 | | | 29,837 | |
| Total | | 109,635 | | | | | $ | 33,136 | | | $ | 27,502 | | | Total | | 120,863 | | | | | $ | 27,252 | | | $ | 30,650 | |
| | | | | | | | | | | | | | | | | | |
| Total | | | | | | $ | 44,762 | | | $ | 43,978 | | | Total | | | | | | $ | 37,689 | | | $ | 40,187 | |
|
| | | | | | | | | | | | | | | | | | | | | | | | | | | | | | | | | | | | | | | | | | | | | | | | | | | | | | | | |
|
| ($ and units in thousands) | | December 31, 2019 |
| Customer Counterparty | | ($ and units in thousands) | | Financial Counterparty |
| Notional
Unit | | Fair Value | | | Notional
Unit | | Fair Value |
| | Assets | | Liabilities | | | | Assets | | Liabilities |
| Crude oil: | | | | | | | | | | Crude oil: | | | | | | | | |
| Written options | | 36 | | | Barrels | | $ | 0 | | | $ | 30 | | | Purchased options | | 36 | | | Barrels | | $ | 29 | | | $ | 0 | |
| Collars | | 3,174 | | | Barrels | | 2,673 | | | 538 | | | Collars | | 3,630 | | | Barrels | | 677 | | | 2,815 | |
| Swaps | | 4,601 | | | Barrels | | 6,949 | | | 5,531 | | | Swaps | | 4,721 | | | Barrels | | 4,516 | | | 5,215 | |
| Total | | 7,811 | | | | | $ | 9,622 | | | $ | 6,099 | | | Total | | 8,387 | | | | | $ | 5,222 | | | $ | 8,030 | |
| | | | | | | | | | | | | | | | | | |
| Natural gas: | | | | | | | | | | Natural gas: | | | | | | | | |
| Written options | | 540 | | | MMBTUs | | $ | 0 | | | $ | 22 | | | Purchased options | | 530 | | | MMBTUs | | $ | 21 | | | $ | 0 | |
| Collars | | 14,277 | | | MMBTUs | | 186 | | | 522 | | | Collars | | 14,517 | | | MMBTUs | | 471 | | | 150 | |
| Swaps | | 48,956 | | | MMBTUs | | 30,257 | | | 35,497 | | | Swaps | | 48,779 | | | MMBTUs | | 35,601 | | | 30,197 | |
| Total | | 63,773 | | | | | $ | 30,443 | | | $ | 36,041 | | | Total | | 63,826 | | | | | $ | 36,093 | | | $ | 30,347 | |
| | | | | | | | | | | | | | | | | | |
| Total | | | | | | $ | 40,065 | | | $ | 42,140 | | | Total | | | | | | $ | 41,315 | | | $ | 38,377 | |
|
Beginning in January 2017, the Chicago Mercantile Exchange (“CME”) amended its rulebook to legally characterize variation margin payments made to and received from CME as settlements of derivatives and not as collateral against derivatives. As of December 31, 2020, the notional quantities that cleared through CME totaled 1,275 thousand barrels of crude oil and 29,733 thousand MMBTUs of natural gas. Applying the variation margin payments as settlement to CME-cleared derivative transactions resulted in reductions to the gross derivative asset fair value of $7.9 million and to the liability fair value of $3.7 million as of December 31, 2020, to a net fair value of 0. In comparison, the notional quantities that cleared through CME totaled 1,752 thousand barrels of crude oil and 6,075 thousand MMBTUs of natural gas as of December 31, 2019. Applying the variation margin payments as settlement to CME-cleared derivative transactions resulted in a reduction to the gross derivative asset fair value of $2.9 million and to the liability fair value of $1.5 million, respectively, as of December 31, 2019, to a net asset fair value of $986 thousand.
The following table presents the net gains (losses) recognized on the Company’s Consolidated Statement of Income related to derivatives not designated as hedging instruments for the years ended December 31, 2020, 20192023, 2022 and 2018:2021:
| | | ($ in thousands) | | Classification on
Consolidated
Statement of Income | | Year Ended December 31, |
| | | Classification on Consolidated Statement of Income | |
| | Classification on Consolidated Statement of Income | |
| | Classification on Consolidated Statement of Income | |
| | Classification on Consolidated Statement of Income | |
| | Classification on Consolidated Statement of Income | |
| | Classification on Consolidated Statement of Income | |
| | Classification on Consolidated Statement of Income | |
| | Classification on Consolidated Statement of Income | |
| | Classification on Consolidated Statement of Income | |
| | Classification on Consolidated Statement of Income | |
| | Classification on Consolidated Statement of Income | |
| | Classification on Consolidated Statement of Income | |
| | Classification on Consolidated Statement of Income | |
| | Classification on Consolidated Statement of Income | |
| | Classification on Consolidated Statement of Income | |
| | Classification on Consolidated Statement of Income | |
| | Classification on Consolidated Statement of Income | |
| | Classification on Consolidated Statement of Income | |
| | Classification on Consolidated Statement of Income | |
| | Classification on Consolidated Statement of Income | |
| | Classification on Consolidated Statement of Income | |
| | Classification on Consolidated Statement of Income | |
| | Classification on Consolidated Statement of Income | |
| | Classification on Consolidated Statement of Income | |
| | Classification on Consolidated Statement of Income | |
| | Classification on Consolidated Statement of Income | | | Year Ended December 31, |
| ($ in thousands) | ($ in thousands) | | Classification on
Consolidated
Statement of Income | | 2020 | | 2019 | | 2018 | ($ in thousands) | | | 2023 | | 2022 | | 2021 |
| | Interest rate contracts | Interest rate contracts | | Interest rate contracts and other derivative income | | $ | (8,637) | | | $ | (2,126) | | | $ | 280 | |
| Interest rate contracts | |
| Interest rate contracts | |
| Foreign exchange contracts | Foreign exchange contracts | | Foreign exchange income | | 23,215 | | | 22,264 | | | 16,784 | |
| Credit contracts | Credit contracts | | Interest rate contracts and other derivative income | | (5) | | | 59 | | | (156) | |
| Equity contracts | | Lending fees | | 11,025 | | | 678 | | | 512 | |
| Equity contracts - warrants | |
| Commodity contracts | Commodity contracts | | Interest rate contracts and other derivative income | | (35) | | | (67) | | | (11) | |
| Net gains | Net gains | | $ | 25,563 | | | $ | 20,808 | | | $ | 17,409 | |
|
Credit-Risk-Related Contingent Features — Certain of the Company’s over-the-counter derivative contracts of the Company contain early termination provisions that may require the Company to settle any outstanding balances upon the occurrence of a specified credit-risk-related event. These events, which are defined by the existing derivative contracts,Such an event primarily relaterelates to a downgrade in the credit rating of East West Bank to below investment grade. As of December 31, 2020,2023, the aggregate fair value amounts of all derivative instruments with credit risk-related contingent features that were in a net liability position totaled $107.4 million, in$9 thousand, for which $106.8 million ofno collateral was posted to cover these positions. AsIn comparison, as of December 31, 2019,2022, the aggregate fair value amounts of all derivative instruments with credit risk-related contingent features that were in a net liability position totaled $56.4$3 million, infor which $56.4$1 million of collateral was posted to cover these positions. In the event that the credit rating of East West Bank had been downgraded to below investment grade, minimal additional collateral would have been required to be posted as of both December 31, 20202023 and 2019.2022.
Offsetting of Derivatives
The following tables present the gross derivative fair values, the balance sheet netting adjustments, and the resulting net fair values recorded on the consolidated balance sheet,Consolidated Balance Sheet, as well as the cash and noncash collateral associated with master netting arrangements. The gross amounts of derivative assets and liabilities are presented after the application of variation margin payments as settlements withto the fair values of contracts cleared through central counterparties,clearing organizations, where applicable. The collateral amounts in the following tables are limited to the outstanding balances of the related asset or liability, after the application of netting; thereforeliability. Therefore, instances of overcollateralization are not shown:
| | | ($ in thousands) | ($ in thousands) | | As of December 31, 2020 |
| | Gross
Amounts
Recognized (1) | | Gross Amounts Offset
on the
Consolidated Balance Sheet | | Net Amounts
Presented
on the
Consolidated
Balance Sheet | | Gross Amounts Not Offset
on the
Consolidated Balance Sheet | | Net
Amount |
| Master Netting Arrangements | | Cash Collateral Received (3) | | Security Collateral Received (5) | |
| ($ in thousands) | |
| ($ in thousands) | |
| ($ in thousands) | |
| ($ in thousands) | |
| ($ in thousands) | |
| ($ in thousands) | |
| ($ in thousands) | |
| ($ in thousands) | |
| ($ in thousands) | |
| ($ in thousands) | |
| ($ in thousands) | |
| ($ in thousands) | |
| ($ in thousands) | |
| ($ in thousands) | |
| ($ in thousands) | |
| ($ in thousands) | |
| ($ in thousands) | |
| ($ in thousands) | |
| ($ in thousands) | |
| ($ in thousands) | |
| ($ in thousands) | |
| ($ in thousands) | |
| ($ in thousands) | |
| ($ in thousands) | |
| ($ in thousands) | |
| ($ in thousands) | |
| ($ in thousands) | |
| ($ in thousands) | |
| ($ in thousands) | |
| ($ in thousands) | |
| ($ in thousands) | |
| ($ in thousands) | |
| ($ in thousands) | |
| ($ in thousands) | |
| ($ in thousands) | |
| ($ in thousands) | |
| ($ in thousands) | |
| ($ in thousands) | | | As of December 31, 2023 |
| | Gross Amounts Recognized (1) | | | | Gross Amounts Recognized (1) | | Gross Amounts Offset on the Consolidated Balance Sheet | | Net Amounts Presented on the Consolidated Balance Sheet | | Gross Amounts Not Offset on the Consolidated Balance Sheet | | Net Amount |
| | | Master Netting Arrangements | |
| Derivative assets | |
| Derivative assets | |
| Derivative assets | Derivative assets | | $ | 602,754 | | | $ | (93,063) | | | $ | (8,449) | |
| $ | 501,242 | | | $ | (35) | |
| $ | 501,207 | |
| | | Gross
Amounts
Recognized (2) | | Gross Amounts Offset
on the
Consolidated Balance Sheet | | Net Amounts
Presented
on the
Consolidated
Balance Sheet | | Gross Amounts Not Offset
on the
Consolidated Balance Sheet | | Net
Amount |
| Master Netting Arrangements | | Cash Collateral Pledged (4) | | Security Collateral Pledged (5) | |
| | Gross Amounts Recognized (2) | |
| | Gross Amounts Recognized (2) | |
| | Gross Amounts Recognized (2) | | | Gross Amounts Offset on the Consolidated Balance Sheet | | Net Amounts Presented on the Consolidated Balance Sheet | | Gross Amounts Not Offset on the Consolidated Balance Sheet | | Net Amount |
| | | Master Netting Arrangements | |
| Derivative liabilities | |
| Derivative liabilities | |
| Derivative liabilities | Derivative liabilities | | $ | 424,828 | | | $ | (93,063) | | | $ | (91,634) | |
| $ | 240,131 | | | $ | (221,150) | |
| $ | 18,981 | |
|
| | | ($ in thousands) | ($ in thousands) | | As of December 31, 2019 |
| | Gross
Amounts
Recognized (1) | | Gross Amounts Offset
on the
Consolidated Balance Sheet | | Net Amounts
Presented
on the
Consolidated
Balance Sheet | | Gross Amounts Not Offset
on the
Consolidated Balance Sheet | | Net
Amount |
| Master Netting Arrangements | | Cash Collateral Received (3) | | Security Collateral
Received (5) | |
| ($ in thousands) | |
| ($ in thousands) | |
| ($ in thousands) | |
| ($ in thousands) | |
| ($ in thousands) | |
| ($ in thousands) | |
| ($ in thousands) | |
| ($ in thousands) | |
| ($ in thousands) | |
| ($ in thousands) | |
| ($ in thousands) | |
| ($ in thousands) | |
| ($ in thousands) | |
| ($ in thousands) | |
| ($ in thousands) | |
| ($ in thousands) | |
| ($ in thousands) | |
| ($ in thousands) | |
| ($ in thousands) | |
| ($ in thousands) | |
| ($ in thousands) | |
| ($ in thousands) | |
| ($ in thousands) | |
| ($ in thousands) | |
| ($ in thousands) | |
| ($ in thousands) | |
| ($ in thousands) | |
| ($ in thousands) | |
| ($ in thousands) | |
| ($ in thousands) | |
| ($ in thousands) | |
| ($ in thousands) | |
| ($ in thousands) | |
| ($ in thousands) | |
| ($ in thousands) | |
| ($ in thousands) | |
| ($ in thousands) | |
| ($ in thousands) | | | As of December 31, 2022 |
| | Gross Amounts Recognized (1) | | | | Gross Amounts Recognized (1) | | Gross Amounts Offset on the Consolidated Balance Sheet | | Net Amounts Presented on the Consolidated Balance Sheet | | Gross Amounts Not Offset on the Consolidated Balance Sheet | | Net Amount |
| | Derivative assets | |
| Derivative assets | |
| Derivative assets | Derivative assets | | $ | 330,316 | | | $ | (121,561) | | | $ | (3,758) | | | $ | 204,997 | | | $ | 0 | | | $ | 204,997 | |
| | | Gross
Amounts
Recognized (2) | | Gross Amounts Offset
on the
Consolidated Balance Sheet | | Net Amounts
Presented
on the
Consolidated
Balance Sheet | | Gross Amounts Not Offset
on the
Consolidated Balance Sheet | | Net
Amount |
| Master Netting Arrangements | | Cash Collateral Pledged (4) | | Security Collateral Pledged (5) | |
| | Gross Amounts Recognized (2) | |
| | | Gross Amounts Recognized (2) | | | | Gross Amounts Recognized (2) | | Gross Amounts Offset on the Consolidated Balance Sheet | | Net Amounts Presented on the Consolidated Balance Sheet | | Gross Amounts Not Offset on the Consolidated Balance Sheet | | Net Amount |
| | Derivative liabilities | |
| Derivative liabilities | |
| Derivative liabilities | Derivative liabilities | | $ | 256,528 | | | $ | (121,561) | | | $ | (38,238) | | | $ | 96,729 | | | $ | (79,619) | | | $ | 17,110 | |
|
(1)Included $1.1Includes $3 million and $1.6$2 million of gross fair value assets with counterparties that were not subject to enforceable master netting arrangements or similar agreements as of December 31, 20202023 and 2019,2022, respectively.
(2)Included $220 thousandIncludes $16 million and $20 thousand$1 million of gross fair value liabilities with counterparties that were not subject to enforceable master netting arrangements or similar agreements as of December 31, 20202023 and 2019,2022, respectively.
(3)Gross cash collateral received under master netting arrangements or similar agreements were $15.8$244 million and $3.8$385 million respectively, as of December 31, 20202023 and 2019.2022, respectively. Of the gross cash collateral received, $8.4$237 million and $3.8$372 million were used to offset against derivative assets respectively, as of December 31, 20202023 and 2019.2022, respectively.
(4)Gross cash collateral pledged under master netting arrangements or similar agreements were $91.6$1 million and $43.0 million, respectively,$490 thousand as of December 31, 20202023 and 2019.2022, respectively. Of the gross cash collateral pledged, $91.6$1 million and $38.2 million werewas used to offset against derivative liabilities respectively, as of December 31, 2020 and 2019.2023. In comparison, no cash collateral was used to offset against derivative liabilities as of December 31, 2022.
(5)Represents the fair value of security collateral received andor pledged limited to derivative assets andor liabilities that are subject to enforceable master netting arrangements or similar agreements. U.S. GAAP does not permit the netting of noncash collateral on the consolidated balance sheetConsolidated Balance Sheet but requires disclosure of such amounts.
In addition to the amounts included in the tables above, the Company also has balance sheet netting related to the resale and repurchase agreements. Refer to Note 3 — Assets Purchased under Resale Agreements and Sold under Repurchase Agreements to the Consolidated Financial Statements in this Form 10-K for additional information. Refer to Note 2 — Fair Value Measurement and Fair Value of Financial Instruments to the Consolidated Financial Statements in this Form 10-K for fair value measurement disclosures on derivatives.
Note 6 — Loans Receivable and Allowance for Credit Losses
The following table presents the composition of the Company’s loans held-for-investment outstanding as of December 31, 20202023 and 2019:2022:
| | | ($ in thousands) | ($ in thousands) | | December 31, 2020 | | December 31, 2019 |
| | ($ in thousands) | |
| | ($ in thousands) | ($ in thousands) | | Amortized Cost (1) | | | Non-PCI Loans (1) | | PCI Loans | | Total (1) | | December 31, 2023 | | December 31, 2022 |
| C&I (2) | | $ | 13,631,726 | | | | $ | 12,149,121 | | | $ | 1,810 | | | $ | 12,150,931 | |
| C&I | |
| C&I | |
| C&I | |
| CRE: | CRE: | | | |
| CRE | |
| CRE | |
| CRE | CRE | | 11,174,611 | | | | 10,165,247 | | | 113,201 | | | 10,278,448 | |
| Multifamily residential | Multifamily residential | | 3,033,998 | | | | 2,834,212 | | | 22,162 | | | 2,856,374 | |
| Construction and land | Construction and land | | 599,692 | | | | 628,459 | | | 40 | | | 628,499 | |
| Total CRE | Total CRE | | 14,808,301 | | | | 13,627,918 | | | 135,403 | | | 13,763,321 | |
| Total commercial | Total commercial | | 28,440,027 | | | | 25,777,039 | | | 137,213 | | | 25,914,252 | |
| Consumer: | Consumer: | | | | | | | | | |
| Residential mortgage: | Residential mortgage: | | | |
| Residential mortgage: | |
| Residential mortgage: | |
| Single-family residential | |
| Single-family residential | |
| Single-family residential | Single-family residential | | 8,185,953 | | | | 7,028,979 | | | 79,611 | | | 7,108,590 | |
| HELOCs | HELOCs | | 1,601,716 | | | | 1,466,736 | | | 6,047 | | | 1,472,783 | |
| Total residential mortgage | Total residential mortgage | | 9,787,669 | | | | 8,495,715 | | | 85,658 | | | 8,581,373 | |
| Other consumer | Other consumer | | 163,259 | | | | 282,914 | | | 0 | | | 282,914 | |
| Total consumer | Total consumer | | 9,950,928 | | | | 8,778,629 | | | 85,658 | | | 8,864,287 | |
| Total loans held-for-investment | | $ | 38,390,955 | | | | $ | 34,555,668 | | | $ | 222,871 | | | $ | 34,778,539 | |
Total loans held-for-investment (1) | |
| Allowance for loan losses | Allowance for loan losses | | (619,983) | | | | (358,287) | | | 0 | | | (358,287) | |
| Loans held-for-investment, net | | $ | 37,770,972 | | | | $ | 34,197,381 | | | $ | 222,871 | | | $ | 34,420,252 | |
Loans held-for-investment, net (1) | |
|
(1)Includes $71 million and $70 millionof net deferred loan fees unearned fees,and net unamortized premiums and unaccreted discounts of $(58.8) million and $(43.2) millionas of December 31, 20202023 and 2019,2022, respectively.
(2)Includes PPP loans of $1.57 billion as of December 31, 2020.
Loans held-for-investments’ accruedAccrued interest receivable on loans held-for-investment was $107.5$267 million and $121.8$208 million as of December 31, 20202023 and 2019, respectively. Reversal of2022, respectively, and was included in Other assets on the Consolidated Balance Sheet. The interest income related to nonaccrual loansreversed was approximately $2.5 million duringinsignificant for the yearyears ended December 31, 2020. Interest income recognized on nonaccrual loans was approximately $44 thousand for2023, 2022 and 2021. For the year ended December 31, 2020. For theCompany’s accounting policy on accrued interest receivable related to loans held-for-investment, see Note 1 — Summary of Significant Accounting Policies — Loans Held-for-Investment to the Consolidated Financial Statements in this Form 10-K. The Company also has loans held-for-sale. For the Company’s accounting policy on loans held-for-sale, refer to Note 1 — Summary of Significant Accounting Policies — Loans Held-for-Sale to the Consolidated Financial Statements in this Form 10-K.
The Company’s FRBSF and FHLB borrowings are primarily secured by loans held-for-investment. Loans held-for-investment totaling $23.26$37.2 billion and $22.43$28.3 billion, as of December 31, 2020 and 2019, respectively, were pledged to secure borrowings and provide additional borrowing capacity from the FRBSFas of December 31, 2023 and the FHLB.2022.
Credit Quality Indicators
All loans are subject to the Company’s credit review and monitoring.monitoring process. For the commercial loan portfolio, loans are risk rated based on an analysis of the borrower’s current payment performance or delinquency, repayment sources, financial and liquidity factors, including industry and geographic considerations. For the majority of the consumer loan portfolio, payment performance or delinquency is typically the driving indicator for the risk ratings.
For the Company’sThe Company utilizes internal credit risk ratings to assign each individual loan is given a risk rating of 1 through 10. Loans10:
•Pass —loans risk rated 1 through 5 are assigned an internal risk rating category of “Pass,“Pass.” with loansLoans risk rated 1 beingare typically loans fully secured by cash or U.S. government and its agencies.cash. Pass loans have sufficient sources of repayment to repay the loan in full, in accordance with all terms and conditions. Loans
•Special mention— loans assigned a risk rating of 6 have potential weaknesses that warrant closer attention by management; these are assigned an internal risk rating category of “Special Mention.” Loans
•Substandard —loans assigned a risk rating of 7 or 8 have well-defined weaknesses that may jeopardize the full and timely repayment of the loan; these are assigned an internal risk rating category of “Substandard.” Loans
•Doubtful — loans assigned a risk rating of 9 have insufficient sources of repayment and a high probability of loss; these are assigned an internal risk rating category of “Doubtful.” Loans
•Loss —loans assigned a risk rating of 10 are uncollectableuncollectible and of such little value that they are no longer considered bankable assets; these are assigned an internal risk rating category of “Loss.” Exposures
Loan exposures categorized as criticized consist of special mention, substandard, doubtful and loss categories. The Company reviews the internal risk ratings of its loan portfolio on a regular and ongoing basis, and adjusts the ratings based on changes in the borrowers’ financial status and the collectability of the loans.
The following table summarizestables summarize the Company’s loans held-for-investment as of December 31, 2020, presentedand current year-to-date gross write-offs by loan portfolio segments, internal risk ratings and vintage year.year as of December 31, 2023 and 2022. The vintage year is the year of loan origination, renewal or major modification.
| | | | | | | | | | | | | | | | | | | | | | | | | | | | | | | | | | | | | | | | | | | | | | | | | | | | | | | | |
|
| ($ in thousands) | | December 31, 2020 |
| Term Loans | | Revolving Loans
Amortized Cost Basis | | Revolving Loans Converted to Term Loans Amortized Cost Basis | | Total |
| | | |
| | | |
| Amortized Cost Basis by Origination Year | | | |
| 2020 | | 2019 | | 2018 | | 2017 | | 2016 | | Prior | | | |
| Commercial: | | | | | | | | | | | | | | | | | | |
| C&I: | | | | | | | | | | | | | | | | | | |
| Pass | | $ | 3,912,147 | | | $ | 1,477,740 | | | $ | 483,725 | | | $ | 245,594 | | | $ | 69,482 | | | $ | 245,615 | | | $ | 6,431,003 | | | $ | 29,487 | | | $ | 12,894,793 | |
| Criticized (accrual) | | 120,183 | | | 74,601 | | | 56,785 | | | 19,426 | | | 1,487 | | | 5,872 | | | 324,640 | | | 0 | | | 602,994 | |
| Criticized (nonaccrual) | | 2,125 | | | 25,267 | | | 22,240 | | | 18,787 | | | 4,964 | | | 1,592 | | | 58,964 | | | 0 | | | 133,939 | |
| | | | | | | | | | | | | | | | | | |
| | | | | | | | | | | | | | | | | | |
| | | | | | | | | | | | | | | | | | |
| | | | | | | | | | | | | | | | | | |
| Total C&I | | 4,034,455 | | | 1,577,608 | | | 562,750 | | | 283,807 | | | 75,933 | | | 253,079 | | | 6,814,607 | | | 29,487 | | | 13,631,726 | |
| | | | | | | | | | | | | | | | | | |
| CRE: | | | | | | | | | | | | | | | | | | |
| Pass | | 2,296,649 | | | 2,402,136 | | | 2,310,748 | | | 1,328,251 | | | 732,694 | | | 1,529,681 | | | 173,267 | | | 19,064 | | | 10,792,490 | |
| Criticized (accrual) | | 47,459 | | | 63,654 | | | 43,447 | | | 98,259 | | | 2,094 | | | 80,662 | | | 0 | | | 0 | | | 335,575 | |
| Criticized (nonaccrual) | | 0 | | | 0 | | | 42,067 | | | 1,115 | | | 0 | | | 3,364 | | | 0 | | | 0 | | | 46,546 | |
| | | | | | | | | | | | | | | | | | |
| | | | | | | | | | | | | | | | | | |
| | | | | | | | | | | | | | | | | | |
| | | | | | | | | | | | | | | | | | |
| Total CRE | | 2,344,108 | | | 2,465,790 | | | 2,396,262 | | | 1,427,625 | | | 734,788 | | | 1,613,707 | | | 173,267 | | | 19,064 | | | 11,174,611 | |
| Multifamily residential: | | | | | | | | | | | | | | | | | | |
| Pass | | 783,671 | | | 783,589 | | | 479,959 | | | 411,945 | | | 181,213 | | | 348,751 | | | 5,895 | | | 0 | | | 2,995,023 | |
| Criticized (accrual) | | 0 | | | 735 | | | 22,330 | | | 6,101 | | | 264 | | | 5,877 | | | 0 | | | 0 | | | 35,307 | |
| Criticized (nonaccrual) | | 0 | | | 0 | | | 1,475 | | | 0 | | | 0 | | | 2,193 | | | 0 | | | 0 | | | 3,668 | |
| | | | | | | | | | | | | | | | | | |
| | | | | | | | | | | | | | | | | | |
| | | | | | | | | | | | | | | | | | |
| | | | | | | | | | | | | | | | | | |
| Total multifamily residential | | 783,671 | | | 784,324 | | | 503,764 | | | 418,046 | | | 181,477 | | | 356,821 | | | 5,895 | | | 0 | | | 3,033,998 | |
| Construction and land: | | | | | | | | | | | | | | | | | | |
| Pass | | 224,924 | | | 172,707 | | | 156,712 | | | 0 | | | 20,897 | | | 1,028 | | | 0 | | | 0 | | | 576,268 | |
| Criticized (accrual) | | 3,524 | | | 0 | | | 0 | | | 0 | | | 0 | | | 19,900 | | | 0 | | | 0 | | | 23,424 | |
| Criticized (nonaccrual) | | 0 | | | 0 | | | 0 | | | 0 | | | 0 | | | 0 | | | 0 | | | 0 | | | 0 | |
| | | | | | | | | | | | | | | | | | |
| | | | | | | | | | | | | | | | | | |
| | | | | | | | | | | | | | | | | | |
| | | | | | | | | | | | | | | | | | |
| Total construction and land | | 228,448 | | | 172,707 | | | 156,712 | | | 0 | | | 20,897 | | | 20,928 | | | 0 | | | 0 | | | 599,692 | |
| Total CRE | | 3,356,227 | | | 3,422,821 | | | 3,056,738 | | | 1,845,671 | | | 937,162 | | | 1,991,456 | | | 179,162 | | | 19,064 | | | 14,808,301 | |
| Total commercial | | 7,390,682 | | | 5,000,429 | | | 3,619,488 | | | 2,129,478 | | | 1,013,095 | | | 2,244,535 | | | 6,993,769 | | | 48,551 | | | 28,440,027 | |
| Consumer: | | | | | | | | | | | | | | | | | | |
| | | | | | | | | | | | | | | | | | |
| Single-family residential: | | | | | | | | | | | | | | | | | | |
Pass (1) | | 2,385,853 | | | 1,813,200 | | | 1,501,660 | | | 1,021,707 | | | 523,170 | | | 921,714 | | | 0 | | | 0 | | | 8,167,304 | |
| Criticized (accrual) | | 0 | | | 1,429 | | | 0 | | | 0 | | | 119 | | | 1,034 | | | 0 | | | 0 | | | 2,582 | |
Criticized (Nonaccrual) (1) | | 0 | | | 226 | | | 812 | | | 1,789 | | | 1,994 | | | 11,246 | | | 0 | | | 0 | | | 16,067 | |
| | | | | | | | | | | | | | | | | | |
| | | | | | | | | | | | | | | | | | |
| | | | | | | | | | | | | | | | | | |
| | | | | | | | | | | | | | | | | | |
| Total single-family residential mortgage | | 2,385,853 | | | 1,814,855 | | | 1,502,472 | | | 1,023,496 | | | 525,283 | | | 933,994 | | | 0 | | | 0 | | | 8,185,953 | |
| HELOCs: | | | | | | | | | | | | | | | | | | |
| Pass | | 1,131 | | | 880 | | | 2,879 | | | 5,363 | | | 8,433 | | | 13,475 | | | 1,328,919 | | | 225,810 | | | 1,586,890 | |
| Criticized (accrual) | | 0 | | | 0 | | | 200 | | | 0 | | | 996 | | | 0 | | | 1,328 | | | 606 | | | 3,130 | |
| Criticized (nonaccrual) | | 0 | | | 151 | | | 285 | | | 4,617 | | | 164 | | | 1,962 | | | 0 | | | 4,517 | | | 11,696 | |
| | | | | | | | | | | | | | | | | | |
| | | | | | | | | | | | | | | | | | |
| | | | | | | | | | | | | | | | | | |
| | | | | | | | | | | | | | | | | | |
| Total HELOCs | | 1,131 | | | 1,031 | | | 3,364 | | | 9,980 | | | 9,593 | | | 15,437 | | | 1,330,247 | | | 230,933 | | | 1,601,716 | |
| Total residential mortgage | | 2,386,984 | | | 1,815,886 | | | 1,505,836 | | | 1,033,476 | | | 534,876 | | | 949,431 | | | 1,330,247 | | | 230,933 | | | 9,787,669 | |
| Other consumer: | | | | | | | | | | | | | | | | | | |
| Pass | | 9,531 | | | 0 | | | 0 | | | 1,830 | | | 0 | | | 83,255 | | | 66,136 | | | 0 | | | 160,752 | |
| Criticized (accrual) | | 16 | | | 0 | | | 0 | | | 0 | | | 0 | | | 0 | | | 0 | | | 0 | | | 16 | |
| Criticized (nonaccrual) | | 0 | | | 0 | | | 0 | | | 2,491 | | | 0 | | | 0 | | | 0 | | | 0 | | | 2,491 | |
| | | | | | | | | | | | | | | | | | |
| | | | | | | | | | | | | | | | | | |
| | | | | | | | | | | | | | | | | | |
| | | | | | | | | | | | | | | | | | |
| Total other consumer | | 9,547 | | | 0 | | | 0 | | | 4,321 | | | 0 | | | 83,255 | | | 66,136 | | | 0 | | | 163,259 | |
| Total consumer | | 2,396,531 | | | 1,815,886 | | | 1,505,836 | | | 1,037,797 | | | 534,876 | | | 1,032,686 | | | 1,396,383 | | | 230,933 | | | 9,950,928 | |
| Total | | $ | 9,787,213 | | | $ | 6,816,315 | | | $ | 5,125,324 | | | $ | 3,167,275 | | | $ | 1,547,971 | | | $ | 3,277,221 | | | $ | 8,390,152 | | | $ | 279,484 | | | $ | 38,390,955 | |
|
(1)As of December 31, 2020, $747 thousand of nonaccrual loans whose payments are guaranteed by the Federal Housing Administration were classified with a pass rating.
Revolving loans that are converted to term loans presented in the table abovetables below are excluded from the term loans by vintage year columns. During the year ended December 31, 2020, HELOCs totaling $145.0 million were converted to term loans. NaN C&I revolving loans of $23.9 million were converted to a term loan during the year ended December 31, 2020.
| | | | | | | | | | | | | | | | | | | | | | | | | | | | | | | | | | | | | | | | | | | | | | | | | | | | | | | | | | |
| | |
| | December 31, 2023 | | |
| | | | | | | | | | | | | | | | | | | | |
| | | | | | | | | | | | | | | | | | | | |
| | Term Loans by Origination Year | | | | | | | | |
| | | | | | | | | | |
| ($ in thousands) | | 2023 | | 2022 | | 2021 | | 2020 | | 2019 | | Prior | | Revolving Loans | | Revolving Loans Converted to Term Loans (1) | | Total | | |
| Commercial: | | | | | | | | | | | | | | | | | | | | |
| C&I: | | | | | | | | | | | | | | | | | | | | |
| Pass | | $ | 2,314,463 | | | $ | 1,628,560 | | | $ | 1,296,936 | | | $ | 331,982 | | | $ | 245,173 | | | $ | 164,159 | | | $ | 10,053,757 | | | $ | 20,143 | | | $ | 16,055,173 | | | |
| Criticized (accrual) | | 105,119 | | | 67,899 | | | 120,574 | | | 15,064 | | | 40,920 | | | 22,098 | | | 117,196 | | | — | | | 488,870 | | | |
| Criticized (nonaccrual) | | 2,104 | | | 7,916 | | | 131 | | | 4,819 | | | 2,979 | | | 18,137 | | | 950 | | | — | | | 37,036 | | | |
| | | | | | | | | | | | | | | | | | | | |
| | | | | | | | | | | | | | | | | | | | |
| Total C&I | | 2,421,686 | | | 1,704,375 | | | 1,417,641 | | | 351,865 | | | 289,072 | | | 204,394 | | | 10,171,903 | | | 20,143 | | | 16,581,079 | | | |
| | | | | | | | | | | | | | | | | | | | |
YTD gross write-offs (2) | | 350 | | | 10,454 | | | 424 | | | 3,758 | | | 9,748 | | | 2,648 | | | 1,593 | | | — | | | 28,975 | | | |
| | | | | | | | | | | | | | | | | | | | |
| CRE: | | | | | | | | | | | | | | | | | | | | |
| | | | | | | | | | | | | | | | | | | | |
| Pass | | 2,492,915 | | | 4,086,385 | | | 2,216,257 | | | 1,428,724 | | | 1,600,844 | | | 2,494,382 | | | 92,851 | | | 62,771 | | | 14,475,129 | | | |
| Criticized (accrual) | | 36,855 | | | 34,485 | | | 30,336 | | | 48,250 | | | 24,437 | | | 104,340 | | | — | | | — | | | 278,703 | | | |
| Criticized (nonaccrual) | | — | | | — | | | — | | | — | | | 444 | | | 22,805 | | | — | | | — | | | 23,249 | | | |
| | | | | | | | | | | | | | | | | | | | |
| | | | | | | | | | | | | | | | | | | | |
| Subtotal CRE | | 2,529,770 | | | 4,120,870 | | | 2,246,593 | | | 1,476,974 | | | 1,625,725 | | | 2,621,527 | | | 92,851 | | | 62,771 | | | 14,777,081 | | | |
| | | | | | | | | | | | | | | | | | | | |
YTD gross write-offs (2) | | — | | | — | | | — | | | — | | | — | | | 1,329 | | | — | | | — | | | 1,329 | | | |
| | | | | | | | | | | | | | | | | | | | |
| Multifamily residential: | | | | | | | | | | | | | | | | | | | | |
| Pass | | 665,780 | | | 1,481,161 | | | 808,333 | | | 612,408 | | | 498,491 | | | 857,713 | | | 8,690 | | | 1,281 | | | 4,933,857 | | | |
| Criticized (accrual) | | — | | | 3,356 | | | 54,614 | | | — | | | 693 | | | 25,974 | | | — | | | — | | | 84,637 | | | |
| Criticized (nonaccrual) | | — | | | — | | | — | | | — | | | — | | | 4,669 | | | — | | | — | | | 4,669 | | | |
| | | | | | | | | | | | | | | | | | | | |
| | | | | | | | | | | | | | | | | | | | |
| Subtotal multifamily residential | | 665,780 | | | 1,484,517 | | | 862,947 | | | 612,408 | | | 499,184 | | | 888,356 | | | 8,690 | | | 1,281 | | | 5,023,163 | | | |
| | | | | | | | | | | | | | | | | | | | |
YTD gross write-offs | | — | | | — | | | — | | | — | | | — | | | 3 | | | — | | | — | | | 3 | | | |
| | | | | | | | | | | | | | | | | | | | |
| Construction and land: | | | | | | | | | | | | | | | | | | | | |
| Pass | | 209,775 | | | 280,151 | | | 120,724 | | | 39,928 | | | 808 | | | 5,501 | | | 6,981 | | $ | — | | | 663,868 | | | |
| Criticized (accrual) | | — | | | — | | | — | | | — | | | — | | | — | | | — | | | — | | | — | | | |
| Criticized (nonaccrual) | | — | | | — | | | — | | | — | | | — | | | — | | | — | | | — | | | — | | | |
| Subtotal construction and land | | 209,775 | | | 280,151 | | | 120,724 | | | 39,928 | | | 808 | | | 5,501 | | | 6,981 | | | — | | | 663,868 | | | |
| | | | | | | | | | | | | | | | | | | | |
YTD gross write-offs (2) | | — | | | — | | | — | | | — | | | — | | | — | | | — | | | — | | | — | | | |
| | | | | | | | | | | | | | | | | | | | |
| Total CRE | | 3,405,325 | | | 5,885,538 | | | 3,230,264 | | | 2,129,310 | | | 2,125,717 | | | 3,515,384 | | | 108,522 | | | 64,052 | | | 20,464,112 | | | |
| | | | | | | | | | | | | | | | | | | | |
YTD gross write-offs (2) | | — | | | — | | | — | | | — | | | — | | | 1,332 | | | — | | | — | | | 1,332 | | | |
| | | | | | | | | | | | | | | | | | | | |
| Total commercial | | $ | 5,827,011 | | | $ | 7,589,913 | | | $ | 4,647,905 | | | $ | 2,481,175 | | | $ | 2,414,789 | | | $ | 3,719,778 | | | $ | 10,280,425 | | | $ | 84,195 | | | $ | 37,045,191 | | | |
| | | | | | | | | | | | | | | | | | | | |
YTD total commercial gross write-offs (2) | | $ | 350 | | | $ | 10,454 | | | $ | 424 | | | $ | 3,758 | | | $ | 9,748 | | | $ | 3,980 | | | $ | 1,593 | | | $ | — | | | $ | 30,307 | | | |
|
| | | | | | | | | | | | | | | | | | | | |
| | | | | | | | | | | | | | | | | | | | |
The following tables present | | | | | | | | | | | | | | | | | | | | | | | | | | | | | | | | | | | | | | | | | | | | | | | | | | | | | | | | | | |
| | December 31, 2023 | | |
| | | | | | | | | | | | | | | | | | | | |
| | | | | | | | | | | | | | | | | | | | |
| | Term Loans by Origination Year | | | | | | | | |
| ($ in thousands) | | 2023 | | 2022 | | 2021 | | 2020 | | 2019 | | Prior | | Revolving Loans | | Revolving Loans Converted to Term Loans (1) | | Total | | |
| Consumer: | | | | | | | | | | | | | | | | | | | | |
| Residential mortgage: | | | | | | | | | | | | | | | | | | | | |
| Single-family residential: | | | | | | | | | | | | | | | | | | | | |
Pass (3) | | $ | 3,188,830 | | | $ | 3,340,789 | | | $ | 2,279,802 | | | $ | 1,594,525 | | | $ | 980,686 | | | $ | 1,959,974 | | | $ | — | | | $ | — | | | $ | 13,344,606 | | | |
| Criticized (accrual) | | 2,680 | | | 4,471 | | | 566 | | | 1,440 | | | 1,503 | | | 4,167 | | | — | | | — | | | 14,827 | | | |
Criticized (nonaccrual) (3) | | 4,466 | | | 837 | | | 3,902 | | | 2,081 | | | 3,626 | | | 8,715 | | | — | | | — | | | 23,627 | | | |
| Subtotal single-family residential mortgage | | 3,195,976 | | | 3,346,097 | | | 2,284,270 | | | 1,598,046 | | | 985,815 | | | 1,972,856 | | | — | | | — | | | 13,383,060 | | | |
| YTD gross write-offs | | — | | | — | | | — | | | — | | | — | | | — | | | — | | | — | | | — | | | |
| | | | | | | | | | | | | | | | | | | | |
| HELOCs: | | | | | | | | | | | | | | | | | | | | |
| Pass | | 3,641 | | | 3,882 | | | 1,734 | | | 3,153 | | | 729 | | | 9,251 | | | 1,551,074 | | | 126,280 | | | 1,699,744 | | | |
| Criticized (accrual) | | 565 | | | 1,219 | | | 1,872 | | | 101 | | | 185 | | | 1,470 | | | 2,548 | | | 1,089 | | | 9,049 | | | |
| Criticized (nonaccrual) | | 815 | | | 856 | | | 413 | | | 72 | | | 584 | | | 6,863 | | | 279 | | | 3,529 | | | 13,411 | | | |
| Subtotal HELOCs | | 5,021 | | | 5,957 | | | 4,019 | | | 3,326 | | | 1,498 | | | 17,584 | | | 1,553,901 | | | 130,898 | | | 1,722,204 | | | |
YTD gross write-offs (2) | | — | | | — | | | — | | | — | | | — | | | 41 | | | — | | | 6 | | | 47 | | | |
| | | | | | | | | | | | | | | | | | | | |
| Total residential mortgage | | 3,200,997 | | | 3,352,054 | | | 2,288,289 | | | 1,601,372 | | | 987,313 | | | 1,990,440 | | | 1,553,901 | | | 130,898 | | | 15,105,264 | | | |
YTD gross write-offs (2) | | — | | | — | | | — | | | — | | | — | | | 41 | | | — | | | 6 | | | 47 | | | |
| | | | | | | | | | | | | | | | | | | | |
| Other consumer: | | | | | | | | | | | | | | | | | | | | |
| Pass | | 2,286 | | | 18,098 | | | 135 | | | — | | | — | | | 13,244 | | | 26,432 | | $ | — | | | 60,195 | | | |
| Criticized (accrual) | | — | | | — | | | — | | | — | | | — | | | — | | | — | | | — | | | — | | | |
| Criticized (nonaccrual) | | — | | | — | | | — | | | — | | | — | | | — | | | 132 | | | — | | | 132 | | | |
| Total other consumer | | 2,286 | | | 18,098 | | | 135 | | | — | | | — | | | 13,244 | | | 26,564 | | | — | | | 60,327 | | | |
YTD gross write-offs (2) | | — | | | — | | | — | | | — | | | — | | | — | | | — | | | — | | | — | | | |
| | | | | | | | | | | | | | | | | | | | |
| Total consumer | | $ | 3,203,283 | | | $ | 3,370,152 | | | $ | 2,288,424 | | | $ | 1,601,372 | | | $ | 987,313 | | | $ | 2,003,684 | | | $ | 1,580,465 | | | $ | 130,898 | | | $ | 15,165,591 | | | |
YTD total consumer gross write-offs (2) | | $ | — | | | $ | — | | | $ | — | | | $ | — | | | $ | — | | | $ | 41 | | | $ | — | | | $ | 6 | | | $ | 47 | | | |
| | | | | | | | | | | | | | | | | | | | |
| Total loans held-for-investment: | | | | | | | | | | | | | | | | | | | | |
| Pass | | $ | 8,877,690 | | | $ | 10,839,026 | | | $ | 6,723,921 | | | $ | 4,010,720 | | | $ | 3,326,731 | | | $ | 5,504,224 | | | $ | 11,739,785 | | | $ | 210,475 | | | $ | 51,232,572 | | | |
| Criticized (accrual) | | 145,219 | | | 111,430 | | | 207,962 | | | 64,855 | | | 67,738 | | | 158,049 | | | 119,744 | | | 1,089 | | | 876,086 | | | |
| Criticized (nonaccrual) | | 7,385 | | | 9,609 | | | 4,446 | | | 6,972 | | | 7,633 | | | 61,189 | | | 1,361 | | | 3,529 | | | 102,124 | | | |
| | | | | | | | | | | | | | | | | | | | |
| | | | | | | | | | | | | | | | | | | | |
| | | | | | | | | | | | | | | | | | | | |
| Total | | $ | 9,030,294 | | | $ | 10,960,065 | | | $ | 6,936,329 | | | $ | 4,082,547 | | | $ | 3,402,102 | | | $ | 5,723,462 | | | $ | 11,860,890 | | | $ | 215,093 | | | $ | 52,210,782 | | | |
YTD total loans held-for-investment gross write-offs (2) | | $ | 350 | | | $ | 10,454 | | | $ | 424 | | | $ | 3,758 | | | $ | 9,748 | | | $ | 4,021 | | | $ | 1,593 | | | $ | 6 | | | $ | 30,354 | | | |
| | |
| | | | | | | | | | | | | | | | | | | | | | | | | | | | | | | | | | | | | | | | | | | | | | | | | | | | | | | | |
| | | | | | | | | | | | | | | | | | |
| | December 31, 2022 |
| | Term Loans by Origination Year | | | | | | |
| ($ in thousands) | | 2022 | | 2021 | | 2020 | | 2019 | | 2018 | | Prior | | Revolving Loans | | Revolving Loans Converted to Term Loans (1) | | Total |
| Commercial: | | | | | | | | | | | | | | | | | | |
| C&I: | | | | | | | | | | | | | | | | | | |
| Pass | | $ | 2,831,834 | | | $ | 2,053,215 | | | $ | 623,026 | | | $ | 392,013 | | | $ | 143,970 | | | $ | 97,605 | | | $ | 9,177,401 | | | $ | 20,548 | | | $ | 15,339,612 | |
| Criticized (accrual) | | 72,210 | | | 34,296 | | | 48,761 | | | 34,221 | | | 20,646 | | | 12,933 | | | 97,988 | | | — | | | 321,055 | |
| Criticized (nonaccrual) | | 18,722 | | | 4,797 | | | 10,733 | | | 243 | | | 5,618 | | | 10,315 | | | — | | | — | | | 50,428 | |
| | | | | | | | | | | | | | | | | | |
| | | | | | | | | | | | | | | | | | |
| Total C&I | | 2,922,766 | | | 2,092,308 | | | 682,520 | | | 426,477 | | | 170,234 | | | 120,853 | | | 9,275,389 | | | 20,548 | | | 15,711,095 | |
| | | | | | | | | | | | | | | | | | |
| CRE: | | | | | | | | | | | | | | | | | | |
| Pass | | 4,178,780 | | | 2,404,634 | | | 1,505,150 | | | 1,771,679 | | | 1,471,710 | | | 1,909,925 | | | 165,653 | | | 22,009 | | | 13,429,540 | |
| Criticized (accrual) | | 3,518 | | | 60,573 | | | 159,424 | | | 40,095 | | | 91,132 | | | 32,173 | | | 1,455 | | | 16,716 | | | 405,086 | |
| Criticized (nonaccrual) | | — | | | 19,044 | | | — | | | — | | | — | | | 4,200 | | | — | | | — | | | 23,244 | |
| | | | | | | | | | | | | | | | | | |
| | | | | | | | | | | | | | | | | | |
| Subtotal CRE | | 4,182,298 | | | 2,484,251 | | | 1,664,574 | | | 1,811,774 | | | 1,562,842 | | | 1,946,298 | | | 167,108 | | | 38,725 | | | 13,857,870 | |
| Multifamily residential: | | | | | | | | | | | | | | | | | | |
| Pass | | 1,500,289 | | | 892,598 | | | 641,677 | | | 519,614 | | | 350,044 | | | 625,293 | | | 11,325 | | | — | | | 4,540,840 | |
| Criticized (accrual) | | — | | | — | | | — | | | 707 | | | 4,276 | | | 27,076 | | | — | | | — | | | 32,059 | |
| Criticized (nonaccrual) | | — | | | — | | | — | | | — | | | — | | | 169 | | | — | | | — | | | 169 | |
| | | | | | | | | | | | | | | | | | |
| | | | | | | | | | | | | | | | | | |
| Subtotal multifamily residential | | 1,500,289 | | | 892,598 | | | 641,677 | | | 520,321 | | | 354,320 | | | 652,538 | | | 11,325 | | | — | | | 4,573,068 | |
| Construction and land: | | | | | | | | | | | | | | | | | | |
| Pass | | 288,394 | | | 276,839 | | | 31,804 | | | 3,104 | | | 2,805 | | | 231 | | | 9,073 | | | — | | | 612,250 | |
| Criticized (accrual) | | 4,504 | | | — | | | — | | | — | | | 21,666 | | | — | | | — | | | — | | | 26,170 | |
| Criticized (nonaccrual) | | — | | | — | | | — | | | — | | | — | | | — | | | — | | | — | | | — | |
| Subtotal construction and land | | 292,898 | | | 276,839 | | | 31,804 | | | 3,104 | | | 24,471 | | | 231 | | | 9,073 | | | — | | | 638,420 | |
| Total CRE | | 5,975,485 | | | 3,653,688 | | | 2,338,055 | | | 2,335,199 | | | 1,941,633 | | | 2,599,067 | | | 187,506 | | | 38,725 | | | 19,069,358 | |
| Total commercial | | $ | 8,898,251 | | | $ | 5,745,996 | | | $ | 3,020,575 | | | $ | 2,761,676 | | | $ | 2,111,867 | | | $ | 2,719,920 | | | $ | 9,462,895 | | | $ | 59,273 | | | $ | 34,780,453 | |
| Consumer: | | | | | | | | | | | | | | | | | | |
| | | | | | | | | | | | | | | | | | |
| Single-family residential: | | | | | | | | | | | | | | | | | | |
Pass (3) | | $ | 3,548,894 | | | $ | 2,453,717 | | | $ | 1,775,696 | | | $ | 1,101,965 | | | $ | 817,164 | | | $ | 1,500,359 | | | $ | — | | | $ | — | | | $ | 11,197,795 | |
| Criticized (accrual) | | — | | | 1,275 | | | 785 | | | 1,463 | | | 4,352 | | | 3,935 | | | — | | | — | | | 11,810 | |
Criticized (nonaccrual) (3) | | 141 | | | — | | | 204 | | | 3,202 | | | 1,721 | | | 8,154 | | | — | | | — | | | 13,422 | |
| Subtotal single-family residential mortgage | | 3,549,035 | | | 2,454,992 | | | 1,776,685 | | | 1,106,630 | | | 823,237 | | | 1,512,448 | | | — | | | — | | | 11,223,027 | |
| HELOCs: | | | | | | | | | | | | | | | | | | |
| Pass | | 520 | | | 3,583 | | | 7,336 | | | 3,203 | | | 525 | | | 8,960 | | | 1,958,692 | | | 127,401 | | | 2,110,220 | |
| Criticized (accrual) | | — | | | 6 | | | — | | | — | | | — | | | — | | | 4 | | | 1,079 | | | 1,089 | |
| Criticized (nonaccrual) | | — | | | — | | | 483 | | | 231 | | | 1,017 | | | 4,844 | | | 1,001 | | | 3,770 | | | 11,346 | |
| Subtotal HELOCs | | 520 | | | 3,589 | | | 7,819 | | | 3,434 | | | 1,542 | | | 13,804 | | | 1,959,697 | | | 132,250 | | | 2,122,655 | |
| Total residential mortgage | | 3,549,555 | | | 2,458,581 | | | 1,784,504 | | | 1,110,064 | | | 824,779 | | | 1,526,252 | | | 1,959,697 | | | 132,250 | | | 13,345,682 | |
| Other consumer: | | | | | | | | | | | | | | | | | | |
| Pass | | 17,088 | | | 137 | | | 5,356 | | | — | | | — | | | 15,808 | | | 37,804 | | | — | | | 76,193 | |
| Criticized (accrual) | | 3 | | | — | | | — | | | — | | | — | | | — | | | — | | | — | | | 3 | |
| Criticized (nonaccrual) | | — | | | — | | | — | | | — | | | — | | | — | | | 99 | | | — | | | 99 | |
| Total other consumer | | 17,091 | | | 137 | | | 5,356 | | | — | | | — | | | 15,808 | | | 37,903 | | | — | | | 76,295 | |
| Total consumer | | $ | 3,566,646 | | | $ | 2,458,718 | | | $ | 1,789,860 | | | $ | 1,110,064 | | | $ | 824,779 | | | $ | 1,542,060 | | | $ | 1,997,600 | | | $ | 132,250 | | | $ | 13,421,977 | |
| Total by risk rating: | | | | | | | | | | | | | | | | | | |
| Pass | | $ | 12,365,799 | | | $ | 8,084,723 | | | $ | 4,590,045 | | | $ | 3,791,578 | | | $ | 2,786,218 | | | $ | 4,158,181 | | | $ | 11,359,948 | | | $ | 169,958 | | | $ | 47,306,450 | |
| Criticized (accrual) | | 80,235 | | | 96,150 | | | 208,970 | | | 76,486 | | | 142,072 | | | 76,117 | | | 99,447 | | | 17,795 | | | 797,272 | |
| Criticized (nonaccrual) | | 18,863 | | | 23,841 | | | 11,420 | | | 3,676 | | | 8,356 | | | 27,682 | | | 1,100 | | | 3,770 | | | 98,708 | |
| Total | | $ | 12,464,897 | | | $ | 8,204,714 | | | $ | 4,810,435 | | | $ | 3,871,740 | | | $ | 2,936,646 | | | $ | 4,261,980 | | | $ | 11,460,495 | | | $ | 191,523 | | | $ | 48,202,430 | |
|
| | | | | | | | | | | | | | | | | | |
| | | | | | | | | | | | | | | | | | |
| | | | | | | | | | | | | | | | | | |
| | | | | | | | | | | | | | | | | | |
| | | | | | | | | | | | | | | | | | |
| | | | | | | | | | | | | | | | | | |
| | | | | | | | | | | | | | | | | | |
| | | | | | | | | | | | | | | | | | |
| | | | | | | | | | | | | | | | | | |
| | | | | | | | | | | | | | | | | | |
| | | | | | | | | | | | | | | | | | |
| | | | | | | | | | | | | | | | | | |
| | | | | | | | | | | | | | | | | | |
| | | | | | | | | | | | | | | | | | |
| | | | | | | | | | | | | | | | | | |
| | | | | | | | | | | | | | | | | | |
| | | | | | | | | | | | | | | | | | |
| | | | | | | | | | | | | | | | | | |
| | | | | | | | | | | | | | | | | | |
| | | | | | | | | | | | | | | | | | |
| | | | | | | | | | | | | | | | | | |
| | | | | | | | | | | | | | | | | | |
| | | | | | | | | | | | | | | | | | |
(1)$29 million,$26 million and $6 million of total commercial loans, primarily comprised of CRE revolving loans, converted to term loans during the credit risk ratings for non-PCIyears ended December 31, 2023, 2022 and PCI2021, respectively. During the years ended December 31, 2023 and 2021, respectively, $44 million and $54 million of total consumer loans, by portfolio segments ascomprised of HELOCs, converted to term loans. For the year ended December 31, 2022, no consumer loans converted to term loans.
(2)Excludes gross write-offs associated with loans the Company sold or settled.
(3)As of each of December 31, 2019:
| | | | | | | | | | | | | | | | | | | | | | | | | | | | | | | | | | | | |
|
| ($ in thousands) | | December 31, 2019 |
| Pass | | Criticized | | | | | | | | | | | | Total
Non-PCI Loans |
| | Accrual | | Nonaccrual | | | | | | | | | | | |
| | | | | | | | | | | | | | | | | | |
| | | | | | | | | | | | | | | | | | |
| | | | | | | | | | | | | | | | | | |
| | | | | | | | | | | | | | | | | | |
| | | | | | | | | | | | | | | | | | |
| | | | | | | | | | | | | | | | | | |
| | | | | | | | | | | | | | | | | | |
| | | | | | | | | | | | | | | | | | |
| | | | | | | | | | | | | | | | | | |
| | | | | | | | | | | | | | | | | | |
| | | | | | | | | | | | | | | | | | |
| | | | | | | | | | | | | | | | | | |
| Commercial: | | | | | | | | | | | | | | | | | | |
| C&I | | $ | 11,423,094 | | | $ | 651,192 | | | $ | 74,835 | | | | | | | | | | | | | $ | 12,149,121 | |
| CRE: | | | | | | | | | | | | | | | | | | |
| CRE | | 10,003,749 | | | 145,057 | | | 16,441 | | | | | | | | | | | | | 10,165,247 | |
| Multifamily residential | | 2,806,475 | | | 26,918 | | | 819 | | | | | | | | | | | | | 2,834,212 | |
| Construction and land | | 603,447 | | | 25,012 | | | 0 | | | | | | | | | | | | | 628,459 | |
| Total CRE | | 13,413,671 | | | 196,987 | | | 17,260 | | | | | | | | | | | | | 13,627,918 | |
| Total commercial | | 24,836,765 | | | 848,179 | | | 92,095 | | | | | | | | | | | | | 25,777,039 | |
| Consumer: | | | | | | | | | | | | | | | | | | |
| Residential mortgage: | | | | | | | | | | | | | | | | | | |
Single-family residential (1) | | 7,012,522 | | | 2,278 | | | 14,179 | | | | | | | | | | | | | 7,028,979 | |
| HELOCs | | 1,453,207 | | | 2,787 | | | 10,742 | | | | | | | | | | | | | 1,466,736 | |
| Total residential mortgage | | 8,465,729 | | | 5,065 | | | 24,921 | | | | | | | | | | | | | 8,495,715 | |
| Other consumer | | 280,392 | | | 5 | | | 2,517 | | | | | | | | | | | | | 282,914 | |
| Total consumer | | 8,746,121 | | | 5,070 | | | 27,438 | | | | | | | | | | | | | 8,778,629 | |
| Total | | $ | 33,582,886 | | | $ | 853,249 | | | $ | 119,533 | | | | | | | | | | | | | $ | 34,555,668 | |
|
| | | | | | | | | | | | | | | | | | | | | | | | | | | | | | | | | | | | |
|
| ($ in thousands) | | December 31, 2019 |
| Pass | | Criticized | | | | | | | | | | | | Total
PCI Loans |
| | Accrual | | Nonaccrual | | | | | | | | | | | |
| Commercial: | | | | | | | | | | | | | | | | | | |
| C&I | | $ | 1,810 | | | $ | 0 | | | $ | 0 | | | | | | | | | | | | | $ | 1,810 | |
| CRE: | | | | | | | | | | | | | | | | | | |
| CRE | | 102,257 | | | 10,939 | | | 5 | | | | | | | | | | | | | 113,201 | |
| Multifamily residential | | 22,162 | | | 0 | | | 0 | | | | | | | | | | | | | 22,162 | |
| Construction and land | | 40 | | | 0 | | | 0 | | | | | | | | | | | | | 40 | |
| Total CRE | | 124,459 | | | 10,939 | | | 5 | | | | | | | | | | | | | 135,403 | |
| Total commercial | | 126,269 | | | 10,939 | | | 5 | | | | | | | | | | | | | 137,213 | |
| Consumer: | | | | | | | | | | | | | | | | | | |
| Residential mortgage: | | | | | | | | | | | | | | | | | | |
| Single-family residential | | 79,517 | | | 0 | | | 94 | | | | | | | | | | | | | 79,611 | |
| HELOCs | | 5,849 | | | 0 | | | 198 | | | | | | | | | | | | | 6,047 | |
| Total residential mortgage | | 85,366 | | | 0 | | | 292 | | | | | | | | | | | | | 85,658 | |
| | | | | | | | | | | | | | | | | | |
| Total consumer | | 85,366 | | | 0 | | | 292 | | | | | | | | | | | | | 85,658 | |
Total (2) | | $ | 211,635 | | | $ | 10,939 | | | $ | 297 | | | | | | | | | | | | | $ | 222,871 | |
|
(1)As of December 31, 2019, $686 thousand2023 and 2022, $1 million of nonaccrual loans whose payments arewere guaranteed by the Federal Housing Administration were classified with a pass“Pass” rating.
(2)Loans net of ASC 310-30 discount.
Nonaccrual and Past Due Loans
Loans that are 90 or more days past due are generally placed on nonaccrual status, unless the loan is well-collateralized and in the process of collection. Loans that are less than 90 days past due but have identified deficiencies, such as when the full collection of principal or interest becomes uncertain, are also placed on nonaccrual status. The following table presentstables present the aging analysis of total loans held-for-investment as of December 31, 2020:2023 and 2022:
| | | | December 31, 2023 | |
| | | December 31, 2023 | |
| | | December 31, 2023 | |
| ($ in thousands) | |
| ($ in thousands) | ($ in thousands) | | December 31, 2020 | |
| Current
Accruing
Loans | | Accruing
Loans
30-59 Days
Past Due | | Accruing
Loans
60-89 Days
Past Due | | | Total
Accruing
Past Due
Loans | | Nonaccrual
Loans Less
Than 90
Days
Past Due | | Nonaccrual
Loans
90 or More
Days
Past Due | | Total
Nonaccrual
Loans | | Total
Loans | |
| Commercial: | Commercial: | | | | | | | | | | | | | | | | | | |
| Commercial: | |
| Commercial: | |
| C&I | |
| C&I | |
| C&I | C&I | | $ | 13,488,070 | | | $ | 8,993 | | | $ | 724 | | | | $ | 9,717 | | | $ | 100,602 | | | $ | 33,337 | | | $ | 133,939 | | | $ | 13,631,726 | | |
| CRE: | CRE: | | | | |
| CRE: | |
| CRE: | |
| CRE | |
| CRE | |
| CRE | CRE | | 11,127,690 | | | 375 | | | 0 | | | | 375 | | | 448 | | | 46,098 | | | 46,546 | | | 11,174,611 | | |
| Multifamily residential | Multifamily residential | | 3,028,512 | | | 1,818 | | | 0 | | | | 1,818 | | | 2,375 | | | 1,293 | | | 3,668 | | | 3,033,998 | | |
| Multifamily residential | |
| Multifamily residential | |
| Construction and land | |
| Construction and land | |
| Construction and land | Construction and land | | 579,792 | | | 19,900 | | | 0 | | | | 19,900 | | | 0 | | | 0 | | | 0 | | | 599,692 | | |
| Total CRE | Total CRE | | 14,735,994 | | | 22,093 | | | 0 | | | | 22,093 | | | 2,823 | | | 47,391 | | | 50,214 | | | 14,808,301 | | |
| Total CRE | |
| Total CRE | |
| Total commercial | |
| Total commercial | |
| Total commercial | Total commercial | | 28,224,064 | | | 31,086 | | | 724 | | | | 31,810 | | | 103,425 | | | 80,728 | | | 184,153 | | | 28,440,027 | | |
| Consumer: | Consumer: | | | | | | | | | | | | | | | | | | |
| Consumer: | |
| Consumer: | |
| Residential mortgage: | |
| Residential mortgage: | |
| Residential mortgage: | Residential mortgage: | | | | |
| Single-family residential | Single-family residential | | 8,156,645 | | | 9,911 | | | 2,583 | | | | 12,494 | | | 2,385 | | | 14,429 | | | 16,814 | | | 8,185,953 | | |
| Single-family residential | |
| Single-family residential | |
| HELOCs | |
| HELOCs | |
| HELOCs | HELOCs | | 1,583,968 | | | 2,922 | | | 3,130 | | | | 6,052 | | | 577 | | | 11,119 | | | 11,696 | | | 1,601,716 | | |
| Total residential mortgage | Total residential mortgage | | 9,740,613 | | | 12,833 | | | 5,713 | | | | 18,546 | | | 2,962 | | | 25,548 | | | 28,510 | | | 9,787,669 | | |
| Total residential mortgage | |
| Total residential mortgage | |
| Other consumer | |
| Other consumer | |
| Other consumer | Other consumer | | 160,534 | | | 217 | | | 17 | | | | 234 | | | 0 | | | 2,491 | | | 2,491 | | | 163,259 | | |
| Total consumer | Total consumer | | 9,901,147 | | | 13,050 | | | 5,730 | | | | 18,780 | | | 2,962 | | | 28,039 | | | 31,001 | | | 9,950,928 | | |
| Total consumer | |
| Total consumer | |
| Total | |
| Total | |
| Total | Total | | $ | 38,125,211 | | | $ | 44,136 | | | $ | 6,454 | | | | $ | 50,590 | | | $ | 106,387 | | | $ | 108,767 | | | $ | 215,154 | | | $ | 38,390,955 | | |
|
| | | | | | | | | | | | | | | | | | | | | | | | | | | | | | | | | | | | | | | | | | | | |
|
| | December 31, 2022 |
| ($ in thousands) | | Current Accruing Loans | | Accruing Loans 30-59 Days Past Due | | Accruing Loans 60-89 Days Past Due | | | | Total Accruing Past Due Loans | | | | | | Total Nonaccrual Loans | | Total Loans |
| Commercial: | | | | | | | | | | | | | | | | | | |
| C&I | | $ | 15,651,312 | | | $ | 6,482 | | | $ | 2,873 | | | | | $ | 9,355 | | | | | | | $ | 50,428 | | | $ | 15,711,095 | |
| CRE: | | | | | | | | | | | | | | | | | | |
| CRE | | 13,820,441 | | | 14,185 | | | — | | | | | 14,185 | | | | | | | 23,244 | | | 13,857,870 | |
| Multifamily residential | | 4,571,899 | | | 678 | | | 322 | | | | | 1,000 | | | | | | | 169 | | | 4,573,068 | |
| Construction and land | | 638,420 | | | — | | | — | | | | | — | | | | | | | — | | | 638,420 | |
| Total CRE | | 19,030,760 | | | 14,863 | | | 322 | | | | | 15,185 | | | | | | | 23,413 | | | 19,069,358 | |
| Total commercial | | 34,682,072 | | | 21,345 | | | 3,195 | | | | | 24,540 | | | | | | | 73,841 | | | 34,780,453 | |
| Consumer: | | | | | | | | | | | | | | | | | | |
| Residential mortgage: | | | | | | | | | | | | | | | | | | |
| Single-family residential | | 11,183,134 | | | 13,523 | | | 12,130 | | | | | 25,653 | | | | | | | 14,240 | | | 11,223,027 | |
| HELOCs | | 2,102,523 | | | 7,700 | | | 1,086 | | | | | 8,786 | | | | | | | 11,346 | | | 2,122,655 | |
| Total residential mortgage | | 13,285,657 | | | 21,223 | | | 13,216 | | | | | 34,439 | | | | | | | 25,586 | | | 13,345,682 | |
| Other consumer | | 73,004 | | | 109 | | | 3,083 | | | | | 3,192 | | | | | | | 99 | | | 76,295 | |
| Total consumer | | 13,358,661 | | | 21,332 | | | 16,299 | | | | | 37,631 | | | | | | | 25,685 | | | 13,421,977 | |
| Total | | $ | 48,040,733 | | | $ | 42,677 | | | $ | 19,494 | | | | | $ | 62,171 | | | | | | | $ | 99,526 | | | $ | 48,202,430 | |
|
The following table presents the amortized cost of loans on nonaccrual status for which there was no related allowance for loan losses as of both December 31, 2020:2023 and 2022. Nonaccrual loans may not have an allowance for credit losses if the loan balances are well secured by collateral values and there is no loss expectation.
| | | | | | | | |
|
($ in thousands) | | December 31, 2020 |
Commercial: | | |
C&I | | $ | 62,040 | |
CRE: | | |
CRE | | 45,537 | |
Multifamily residential | | 2,519 | |
| | |
Total CRE | | 48,056 | |
Total commercial | | 110,096 | |
Consumer: | | |
Residential mortgage: | | |
Single-family residential | | 6,013 | |
HELOCs | | 8,076 | |
Total residential mortgage | | 14,089 | |
Other consumer | | 2,491 | |
Total consumer | | 16,580 | |
Total nonaccrual loans with no related allowance for loan losses | | $ | 126,676 | |
|
The following table presents the aging analysis of non-PCI loans as of December 31, 2019:
| | | | | | | | | | | | | | | | | | | | | | | | | | | | | | | | | | | | | | | | | | | | | | | | | | | | |
|
| ($ in thousands) | | December 31, 2019 |
| Current
Accruing
Loans | | Accruing
Loans
30-59 Days
Past Due | | Accruing
Loans
60-89 Days
Past Due | | | | Total
Accruing
Past Due
Loans | | Nonaccrual
Loans Less
Than 90
Days
Past Due | | Nonaccrual
Loans
90 or More
Days
Past Due | | Total
Nonaccrual
Loans | | Total
Non-PCI
Loans |
| Commercial: | | | | | | | | | | | | | | | | | | |
| C&I | | $ | 12,026,131 | | | $ | 31,121 | | | $ | 17,034 | | | | | $ | 48,155 | | | $ | 31,084 | | | $ | 43,751 | | | $ | 74,835 | | | $ | 12,149,121 | |
| CRE: | | | | | | | | | | | | | | | | | | |
| CRE | | 10,123,999 | | | 22,830 | | | 1,977 | | | | | 24,807 | | | 540 | | | 15,901 | | | 16,441 | | | 10,165,247 | |
| Multifamily residential | | 2,832,664 | | | 198 | | | 531 | | | | | 729 | | | 534 | | | 285 | | | 819 | | | 2,834,212 | |
| Construction and land | | 628,459 | | | 0 | | | 0 | | | | | 0 | | | 0 | | | 0 | | | — | | | 628,459 | |
| Total CRE | | 13,585,122 | | | 23,028 | | | 2,508 | | | | | 25,536 | | | 1,074 | | | 16,186 | | | 17,260 | | | 13,627,918 | |
| Total commercial | | 25,611,253 | | | 54,149 | | | 19,542 | | | | | 73,691 | | | 32,158 | | | 59,937 | | | 92,095 | | | 25,777,039 | |
| Consumer: | | | | | | | | | | | | | | | | | | |
| Residential mortgage: | | | | | | | | | | | | | | | | | | |
| Single-family residential | | 6,993,597 | | | 15,443 | | | 5,074 | | | | | 20,517 | | | 1,964 | | | 12,901 | | | 14,865 | | | 7,028,979 | |
| HELOCs | | 1,448,930 | | | 4,273 | | | 2,791 | | | | | 7,064 | | | 1,448 | | | 9,294 | | | 10,742 | | | 1,466,736 | |
| Total residential mortgage | | 8,442,527 | | | 19,716 | | | 7,865 | | | | | 27,581 | | | 3,412 | | | 22,195 | | | 25,607 | | | 8,495,715 | |
| Other consumer | | 280,386 | | | 6 | | | 5 | | | | | 11 | | | 0 | | | 2,517 | | | 2,517 | | | 282,914 | |
| Total consumer | | 8,722,913 | | | 19,722 | | | 7,870 | | | | | 27,592 | | | 3,412 | | | 24,712 | | | 28,124 | | | 8,778,629 | |
| Total | | $ | 34,334,166 | | | $ | 73,871 | | | $ | 27,412 | | | | | $ | 101,283 | | | $ | 35,570 | | | $ | 84,649 | | | $ | 120,219 | | | $ | 34,555,668 | |
|
PCI loans were excluded from the above aging analysis table as of December 31, 2019, as the Company elected to account for these loans on a pool level basis under ASC 310-30 at the time of acquisition. As of December 31, 2019, PCI loans on nonaccrual status totaled $297 thousand. | | | | | | | | | | | | | | | | | | | | | | | |
| | | | | | | | | | | |
| ($ in thousands) | | December 31, 2023 | | December 31, 2022 | | | | | | | | | |
| Commercial: | | | | | | | | | | | | | |
| C&I | | $ | 33,089 | | | $ | 11,398 | | | | | | | | | | |
| CRE | | 22,653 | | | 22,944 | | | | | | | | | | |
| Multifamily residential | | 4,235 | | | — | | | | | | | | | | |
| Total commercial | | 59,977 | | | 34,342 | | | | | | | | | | |
| Consumer: | | | | | | | | | | | | | |
| Single-family residential | | 4,852 | | | 2,998 | | | | | | | | | | |
| HELOCs | | 7,256 | | | 7,245 | | | | | | | | | | |
| Total consumer | | 12,108 | | | 10,243 | | | | | | | | | | |
| Total nonaccrual loans with no related allowance for loan losses | | $ | 72,085 | | | $ | 44,585 | | | | | | | | | | |
| | | | | | | | | | | |
Foreclosed Assets
The Company acquires assets from borrowers through loan restructurings, workouts, or foreclosures. Assets acquired may include real properties (e.g., real estate, land, and buildings) and commercial and personal properties. The Company recognizes foreclosed assets upon receiving assets in satisfaction of a loan (e.g., taking legal title or physical possession).
Foreclosed assets, consisting of OREO and other nonperforming assets, are included in Other assets on the Consolidated Balance Sheet. The Company had $19.7$11 million in foreclosed assets as of December 31, 2020,2023, compared with $1.3 million$270 thousand as of December 31, 2019.2022. The Company commences the foreclosure process on consumer mortgage loans whenafter a borrower becomes more than 120 days delinquent in accordance with the Consumer FinanceFinancial Protection Bureau guidelines. The carrying valuesvalue of the consumer real estate loans that were in the process ofan active or suspended foreclosure were $4.1process was $8 million and $7.2$7 million as of December 31, 20202023 and 2019,2022, respectively. The Company has suspended certain mortgage foreclosure activities in connection with our actions to support our customers during the COVID-19 pandemic.
Troubled Debt RestructuringsLoan Modifications to Borrowers Experiencing Financial Difficulty
TDRs are individually evaluated,Effective January 1, 2023, the Company adopted ASU 2022-02, which in part eliminated the accounting for TDR and the type of restructuring is selected based on theenhanced disclosure requirements for loan type and the circumstances of the borrower’smodifications to borrowers experiencing financial difficulty. A TDR is a modification of the terms of a loan when the Company, for economic or legal reasons related to the borrower’s financial difficulties, grants a concession to the borrower that it would not have otherwise considered. Beginning in March 2020, the Company has implemented various commercial and consumer loan modification programs to provide its borrowers relief from the economic impacts of the COVID-19 pandemic. These COVID-related modifications are generally not classified as TDRs due to the relief under the CARES Act, as amended by the CAA, and the Interagency Statement, and therefore are not included in the discussion below. Assistance provided in response to the COVID-19 pandemic could delay the recognition of delinquencies, nonaccrual status, and net charge-offs for those borrowers who would have otherwise moved into past due or nonaccrual status. SeeNote 1 — Summary of Significant Accounting Policies — Troubled Debt RestructuringsLoan Modifications to the Consolidated Financial Statements in this Form 10-K for additional information relatedinformation. As part of the Company’s loss mitigation efforts, the Company may agree to TDR.modify the contractual terms of a loan to assist borrowers experiencing financial difficulty. The Company negotiates loan modifications on a case-by-case basis to achieve mutually agreeable terms that maximize loan collectability and meet the borrower’s financial needs. The Company considers various factors to identify borrowers experiencing financial difficulty. The primary factor for consumer borrowers is delinquency status. For commercial loan borrowers, these factors include credit risk ratings, the probability of loan risk rating downgrades, and overall risk profile changes. The modification may include, but is not limited to, payment delays, interest rate reductions, term extensions, principal forgiveness, or a combination of such modifications. Commercial loan borrowers that require immaterial modifications such as insignificant interest rate changes, short-term extensions (90 days or less) from the original maturity date, or temporary waivers or extensions of financial covenants which would not constitute material credit actions, are generally not considered to be experiencing financial difficulty and are not included in the disclosure. Insignificant payment deferrals (three months or less in the last 12 months) are also not included in the disclosure.
The following tables presenttable presents the amortized cost of loans that were modified during the year ended December 31, 2023 by loan class and modification type:
| | | | | | | | | | | | | | | | | | | | | | | | | | | | | | | | | | | | | | | | | | | | | | |
|
| | Year Ended December 31, 2023 |
| | Modification Type | | |
| ($ in thousands) | | Term Extension | | Payment Delay | | Combination: Term Extension/ Payment Delay | | Combination: Rate Reduction/ Term Extension | | Combination: Rate Reduction/ Payment Delay | | | | Total | | Modification as a % of Loan Class |
| Commercial: | | | | | | | | | | | | | | | | |
| C&I | | $ | 62,704 | | | $ | 6,842 | | | $ | — | | | $ | — | | | $ | — | | | | | $ | 69,546 | | | 0.42 | % |
| CRE: | | | | | | | | | | | | | | | | |
| CRE | | 13,939 | | | — | | | — | | | 32,470 | | | — | | | | | 46,409 | | | 0.23 | % |
| | | | | | | | | | | | | | | | |
| | | | | | | | | | | | | | | | |
| Total CRE | | 13,939 | | | — | | | — | | | 32,470 | | | — | | | | | 46,409 | | | |
| Total commercial | | 76,643 | | | 6,842 | | | — | | | 32,470 | | | — | | | | | 115,955 | | | |
| Consumer: | | | | | | | | | | | | | | | | |
| Residential mortgage: | | | | | | | | | | | | | | | | |
| Single-family residential: | | — | | | 10,202 | | | 3,967 | | | — | | | — | | | | | 14,169 | | | 0.11 | % |
| HELOCs | | — | | | 3,148 | | | 1,170 | | | — | | | 815 | | | | | 5,133 | | | 0.30 | % |
| Total residential mortgage | | — | | | 13,350 | | | 5,137 | | | — | | | 815 | | | | | 19,302 | | | |
| | | | | | | | | | | | | | | | |
| | | | | | | | | | | | | | | | |
| | | | | | | | | | | | | | | | |
| Total consumer | | — | | | 13,350 | | | 5,137 | | | — | | | 815 | | | | | 19,302 | | | |
| Total | | $ | 76,643 | | | $ | 20,192 | | | $ | 5,137 | | | $ | 32,470 | | | $ | 815 | | | | | $ | 135,257 | | | |
|
The following table presents the financial effects of the loan modifications for the year ended December 31, 2023 by loan class and modification type:
| | | | | | | | | | | | | | | | | | | | | | | | | | | | | | | | | | | | |
| | | | | | | | | | |
| | | | | | Financial Effects of Loan Modifications |
| | | | | | Year Ended December 31, 2023 |
| | | | | | | | | | ($ in thousands) | | Principal Forgiveness | | Weighted-Average Interest Rate Reduction | | Weighted-Average Term Extension
(in years) | | Weighted-Average Payment Delay
(in years) |
| | | | | | | | | | Commercial: | | | | | | | | |
| | | | | | | | | | C&I | | $ | 371 | | (1) | — | % | (1) | 1.3 years | | 0.9 years |
| | | | | | | | | | | | | | | | | | |
| | | | | | | | | | CRE | | — | | | 3.00 | % | | 2.1 years | | — | |
| | | | | | | | | | | | | | | | | | |
| | | | | | | | | | | | | | | | | | |
| | | | | | | | | | | | | | | | | | |
| | | | | | | | | | | | | | | | | | |
| | | | | | | | | | Consumer: | | | | | | | | |
| | | | | | | | | | | | | | | | | | |
| | | | | | | | | | Single-family residential | | — | | | — | % | | 9.3 years | | 1.8 years |
| | | | | | | | | | HELOCs | | — | | | 0.11 | % | | 14.2 years | | 4.6 years |
| | | | | | | | | | | | | | | | | | |
| | | | | | | | | | | | | | | | | | |
| | | | | | | | | | | | | | | | | | |
| | | | | | | | | | | | | | | | | | |
| | | | | | | | | | | | | | | | | | |
| | | | | | | | | | Total | | $ | 371 | | | | | | | |
| | | | | | | | | | |
(1)Comprised of C&I loans modified during the year ended December 31, 2023 where the interest rate is waived in addition to principal forgiveness. No recorded investment was outstanding as of December 31, 2023.
A modified loan may become delinquent and may result in a payment default (generally 90 days past due) subsequent to modification. During the year ended December 31, 2023, two residential mortgage loans that were modified as payment delay totaling $1 million subsequently defaulted.
The Company closely monitors the performance of modified loans to borrowers experiencing financial difficulty to understand the effectiveness of its modification efforts. The following table presents the performance of loans that were modified as of December 31, 2023 since the adoption of ASU 2022-02 on January 1, 2023:
| | | | | | | | | | | | | | | | | | | | | | | | | | | | | | | | | | | | | | |
|
| | | | Payment Performance as of December 31, 2023 |
| ($ in thousands) | | | | | | | | | | | | | | Current | | 30-89 Days Past Due | | 90+ Days Past Due | | Total |
| Commercial: | | | | | | | | | | | | | | | | | | | | |
| C&I | | | | | | | | | | | | | | $ | 52,087 | | | $ | 8,153 | | | $ | 9,306 | | | $ | 69,546 | |
| CRE: | | | | | | | | | | | | | | | | | | | | |
| CRE | | | | | | | | | | | | | | 46,409 | | | — | | | — | | | 46,409 | |
| | | | | | | | | | | | | | | | | | | | |
| | | | | | | | | | | | | | | | | | | | |
| Total CRE | | | | | | | | | | | | | | 46,409 | | | — | | | — | | | 46,409 | |
| Total commercial | | | | | | | | | | | | | | 98,496 | | | 8,153 | | | 9,306 | | | 115,955 | |
| Consumer: | | | | | | | | | | | | | | | | | | | | |
| Residential mortgage: | | | | | | | | | | | | | | | | | | | | |
| Single-family residential | | | | | | | | | | | | | | 11,197 | | | 2,425 | | | 547 | | | 14,169 | |
| HELOCs | | | | | | | | | | | | | | 4,207 | | | 177 | | | 749 | | | 5,133 | |
| Total residential mortgage | | | | | | | | | | | | | | 15,404 | | | 2,602 | | | 1,296 | | | 19,302 | |
| | | | | | | | | | | | | | | | | | | | |
| Total consumer | | | | | | | | | | | | | | 15,404 | | | 2,602 | | | 1,296 | | | 19,302 | |
| Total | | | | | | | | | | | | | | $ | 113,900 | | | $ | 10,755 | | | $ | 10,602 | | | $ | 135,257 | |
| | | | | | | | | | | | | | | | | | | | |
As of December 31, 2023, commitments to lend additional funds to borrowers whose loans were modified were $4 million.
Troubled Debt Restructurings Prior to the Adoption of ASU 2022-02
Prior to the adoption of ASU 2022-02, the Company accounted for a modification to the contractual terms of a loan that resulted in granting a concession to a borrower experiencing financial difficulties as a TDR. ASU 2022-02 eliminated TDR accounting prospectively for all restructurings occurring on or after January 1, 2023.
The following table presents the additions to TDRs for the years ended December 31, 2020, 20192022, and 2018:2021:
| | | | | | | | | | | | | | | | | | | | | | | | | | |
|
| ($ in thousands) | | Loans Modified as TDRs During the Year Ended December 31, 2020 |
| Number
of
Loans | | Pre-Modification
Outstanding
Recorded
Investment | | Post-Modification
Outstanding
Recorded
Investment (1) | | Financial
Impact (2) |
| Commercial: | | | | | | | | |
| C&I | | 14 | | | $ | 152,249 | | | $ | 134,467 | | | $ | 19,555 | |
| CRE: | | | | | | | | |
| CRE | | 2 | | | 21,429 | | | 21,221 | | | 18 | |
| Multifamily residential | | 1 | | | 1,220 | | | 1,226 | | | 0 | |
| | | | | | | | |
| Total CRE | | 3 | | | 22,649 | | | 22,447 | | | 18 | |
| Total commercial | | 17 | | | 174,898 | | | 156,914 | | | 19,573 | |
| Consumer: | | | | | | | | |
| | | | | | | | |
| | | | | | | | |
| | | | | | | | |
| | | | | | | | |
| Total consumer | | 0 | | | 0 | | | 0 | | | 0 | |
| Total | | 17 | | | $ | 174,898 | | | $ | 156,914 | | | $ | 19,573 | |
|
| | | | | | | | | | | | | | | | | | | | | | | | | | |
|
| ($ in thousands) | | Loans Modified as TDRs During the Year Ended December 31, 2019 |
| Number
of
Loans | | Pre-Modification
Outstanding
Recorded
Investment | | Post-Modification
Outstanding
Recorded
Investment (1) | | Financial
Impact (2) |
| Commercial: | | | | | | | | |
| C&I | | 8 | | | $ | 95,742 | | | $ | 71,332 | | | $ | 8,004 | |
| CRE: | | | | | | | | |
| | | | | | | | |
| | | | | | | | |
| Construction and land | | 1 | | | 19,696 | | | 19,691 | | | 0 | |
| Total CRE | | 1 | | | 19,696 | | | 19,691 | | | 0 | |
| Total commercial | | 9 | | | 115,438 | | | 91,023 | | | 8,004 | |
| Consumer: | | | | | | | | |
| Residential mortgage: | | | | | | | | |
| Single-family residential | | 2 | | | 1,123 | | | 1,098 | | | 2 | |
| HELOCs | | 2 | | | 539 | | | 528 | | | 0 | |
| Total residential mortgage | | 4 | | | 1,662 | | | 1,626 | | | 2 | |
| Total consumer | | 4 | | | 1,662 | | | 1,626 | | | 2 | |
| Total | | 13 | | | $ | 117,100 | | | $ | 92,649 | | | $ | 8,006 | |
|
| | | ($ in thousands) | | Loans Modified as TDRs During the Year Ended December 31, 2018 |
| | | Loans Modified as TDRs During the Year Ended | |
| | Loans Modified as TDRs During the Year Ended | |
| | Loans Modified as TDRs During the Year Ended | |
| | Loans Modified as TDRs During the Year Ended | |
| | Loans Modified as TDRs During the Year Ended | |
| | Loans Modified as TDRs During the Year Ended | |
| | Loans Modified as TDRs During the Year Ended | |
| | Loans Modified as TDRs During the Year Ended | |
| | Loans Modified as TDRs During the Year Ended | |
| | Loans Modified as TDRs During the Year Ended | |
| | Loans Modified as TDRs During the Year Ended | |
| | Loans Modified as TDRs During the Year Ended | |
| | Loans Modified as TDRs During the Year Ended | |
| | Loans Modified as TDRs During the Year Ended | |
| | Loans Modified as TDRs During the Year Ended | |
| | Loans Modified as TDRs During the Year Ended | |
| | Loans Modified as TDRs During the Year Ended | |
| | Loans Modified as TDRs During the Year Ended | |
| | Loans Modified as TDRs During the Year Ended | |
| | Loans Modified as TDRs During the Year Ended | |
| | Loans Modified as TDRs During the Year Ended | |
| | Loans Modified as TDRs During the Year Ended | |
| | Loans Modified as TDRs During the Year Ended | |
| | Loans Modified as TDRs During the Year Ended | |
| | Loans Modified as TDRs During the Year Ended | |
| | Loans Modified as TDRs During the Year Ended | |
| | Loans Modified as TDRs During the Year Ended | |
| | Loans Modified as TDRs During the Year Ended | |
| | Loans Modified as TDRs During the Year Ended | |
| | Loans Modified as TDRs During the Year Ended | |
| | Loans Modified as TDRs During the Year Ended | |
| | Loans Modified as TDRs During the Year Ended | |
| | Loans Modified as TDRs During the Year Ended | |
| | Loans Modified as TDRs During the Year Ended | |
| | Loans Modified as TDRs During the Year Ended | |
| | Loans Modified as TDRs During the Year Ended | |
| | Loans Modified as TDRs During the Year Ended | |
| | Loans Modified as TDRs During the Year Ended | |
| | Loans Modified as TDRs During the Year Ended | |
| | Loans Modified as TDRs During the Year Ended | |
| | Loans Modified as TDRs During the Year Ended | |
| | Loans Modified as TDRs During the Year Ended | |
| | Loans Modified as TDRs During the Year Ended | |
| | Loans Modified as TDRs During the Year Ended | |
| | Loans Modified as TDRs During the Year Ended | |
| | Loans Modified as TDRs During the Year Ended | |
| | Loans Modified as TDRs During the Year Ended | |
| | Loans Modified as TDRs During the Year Ended | |
| | Loans Modified as TDRs During the Year Ended | |
| | Loans Modified as TDRs During the Year Ended | |
| | December 31, 2022 | | | | December 31, 2022 | | December 31, 2021 |
| ($ in thousands) | ($ in thousands) | | Number
of
Loans | | Pre-Modification
Outstanding
Recorded
Investment | | Post-Modification
Outstanding
Recorded
Investment (1) | | Financial
Impact (2) | ($ in thousands) | | Number of Loans | | Pre-Modification Outstanding Recorded Investment | | Post-Modification Outstanding Recorded Investment (1) | | Financial Impact (2) | | Number of Loans | | Pre-Modification Outstanding Recorded Investment | | Post-Modification Outstanding Recorded Investment (1) | | Financial Impact (2) |
| | C&I | C&I | | 8 | | | $ | 11,366 | | | $ | 9,520 | | | $ | 699 | |
| C&I | |
| C&I | |
| CRE: | CRE: | |
| CRE | | 1 | | | 750 | | | 752 | | | 0 | |
| | Multifamily residential | |
| | Multifamily residential | |
| | Multifamily residential | |
| | Total CRE | |
| Total CRE | |
| Total CRE | Total CRE | | 1 | | | 750 | | | 752 | | | 0 | |
| Total commercial | Total commercial | | 9 | | | 12,116 | | | 10,272 | | | 699 | |
| Consumer: | Consumer: | | | | | | | | |
| Residential mortgage: | Residential mortgage: | |
| Single-family residential | | 2 | | | 405 | | | 391 | | | (28) | |
| Residential mortgage: | |
| Residential mortgage: | |
| | HELOCs | |
| | HELOCs | |
| | HELOCs | HELOCs | | 2 | | | 1,546 | | | 1,418 | | | 0 | |
| Total residential mortgage | Total residential mortgage | | 4 | | | 1,951 | | | 1,809 | | | (28) | |
| Total consumer | Total consumer | | 4 | | | 1,951 | | | 1,809 | | | (28) | |
| Total | Total | | 13 | | | $ | 14,067 | | | $ | 12,081 | | | $ | 671 | |
|
(1)Includes subsequent payments after modification and reflects the balance as of December 31, 2020, 20192022 and 2018.2021.
(2)Includes charge-offs and specific reserves recorded since the modification date. Loans modified more than once are reported in the period they were first modified.
The following tables presenttable presents the TDR post-modificationspost-modification outstanding balances by the primary modification type for the years ended December 31, 2020, 20192022 and 2018 by modification type:2021:
| | | | | | | | | | | | | | | | | | | | | | | | | | | | | | | | | | | | | | | | |
|
| ($ in thousands) | | Modification Type During the Year Ended December 31, 2020 |
| Principal (1) | | Principal and Interest (2) | | Interest
Rate
Reduction | | | | Interest
Deferments | | Other (3) | | Total |
| Commercial: | | | | | | | | | | | | | | |
| C&I | | $ | 59,134 | | | $ | 10,863 | | | $ | 31,913 | | | | | $ | 32,557 | | | $ | 0 | | | $ | 134,467 | |
| CRE: | | | | | | | | | | | | | | |
| CRE | | 21,221 | | | 0 | | | 0 | | | | | 0 | | | 0 | | | 21,221 | |
| Multifamily residential | | 1,226 | | | 0 | | | 0 | | | | | 0 | | | 0 | | | 1,226 | |
| | | | | | | | | | | | | | |
| Total CRE | | 22,447 | | | 0 | | | 0 | | | | | 0 | | | 0 | | | 22,447 | |
| Total commercial | | 81,581 | | | 10,863 | | | 31,913 | | | | | 32,557 | | | 0 | | | 156,914 | |
| Consumer: | | | | | | | | | | | | | | |
| | | | | | | | | | | | | | |
| | | | | | | | | | | | | | |
| | | | | | | | | | | | | | |
| | | | | | | | | | | | | | |
| | | | | | | | | | | | | | |
| Total consumer | | 0 | | | 0 | | | 0 | | | | | 0 | | | 0 | | | 0 | |
| Total | | $ | 81,581 | | | $ | 10,863 | | | $ | 31,913 | | | | | $ | 32,557 | | | $ | 0 | | | $ | 156,914 | |
|
| | | | | | | | | | | | | | | | | | | | | | | | | | | | | | | | | | | | | | | | |
|
| ($ in thousands) | | Modification Type During the Year Ended December 31, 2019 |
| Principal (1) | | Principal and Interest (2) | | Interest
Rate
Reduction | | | | Interest
Deferments | | Other (3) | | Total |
| Commercial: | | | | | | | | | | | | | | |
| C&I | | $ | 31,611 | | | $ | 0 | | | $ | 0 | | | | | $ | 0 | | | $ | 39,721 | | | $ | 71,332 | |
| CRE: | | | | | | | | | | | | | | |
| | | | | | | | | | | | | | |
| | | | | | | | | | | | | | |
| Construction and land | | 0 | | | 0 | | | 19,691 | | | | | 0 | | | 0 | | | 19,691 | |
| Total CRE | | 0 | | | 0 | | | 19,691 | | | | | 0 | | | 0 | | | 19,691 | |
| Total commercial | | 31,611 | | | 0 | | | 19,691 | | | | | 0 | | | 39,721 | | | 91,023 | |
| Consumer: | | | | | | | | | | | | | | |
| Residential mortgage: | | | | | | | | | | | | | | |
| Single-family residential | | 0 | | | 1,098 | | | 0 | | | | | 0 | | | 0 | | | 1,098 | |
| HELOCs | | 0 | | | 397 | | | 0 | | | | | 0 | | | 131 | | | 528 | |
| Total residential mortgage | | 0 | | | 1,495 | | | 0 | | | | | 0 | | | 131 | | | 1,626 | |
| | | | | | | | | | | | | | |
| Total consumer | | 0 | | | 1,495 | | | 0 | | | | | 0 | | | 131 | | | 1,626 | |
| Total | | $ | 31,611 | | | $ | 1,495 | | | $ | 19,691 | | | | | $ | 0 | | | $ | 39,852�� | | | $ | 92,649 | |
|
| | | ($ in thousands) | | Modification Type During the Year Ended December 31, 2018 |
| | | | Modification Type During the Year Ended | |
| | | Modification Type During the Year Ended | |
| | December 31, 2022 | | | | December 31, 2022 | | December 31, 2021 |
| ($ in thousands) | ($ in thousands) | | Principal (1) | | Principal
and
Interest (2) | | Interest
Rate
Reduction | | | Interest
Deferments | | Other (3) | | Total | ($ in thousands) | | Principal (1) | | | | Interest Rate Reduction | | | | | | Other (2) | | Total | | Principal (1) | | Interest Rate Reduction | | Other | | Total |
| | C&I | C&I | | $ | 5,472 | | | $ | 0 | | | $ | 0 | | | | $ | 0 | | | $ | 4,048 | | | $ | 9,520 | |
| C&I | |
| C&I | |
| CRE: | CRE: | | | |
| CRE | | 0 | | | 0 | | | 752 | | | | 0 | | | 0 | | | 752 | |
| | Multifamily residential | |
| | Multifamily residential | |
| | Multifamily residential | |
| | Total CRE | |
| Total CRE | |
| Total CRE | Total CRE | | 0 | | | 0 | | | 752 | | | | 0 | | | 0 | | | 752 | |
| Total commercial | Total commercial | | 5,472 | | | 0 | | | 752 | | | | 0 | | | 4,048 | | | 10,272 | |
| Consumer: | Consumer: | | | | | | | | | | | | | |
| Residential mortgage: | Residential mortgage: | | | |
| Single-family residential | | 66 | | | 0 | | | 0 | | | | 0 | | | 325 | | | 391 | |
| Residential mortgage: | |
| Residential mortgage: | |
| | HELOCs | |
| | HELOCs | |
| | HELOCs | HELOCs | | 1,353 | | | 0 | | | 0 | | | | 0 | | | 65 | | | 1,418 | |
| Total residential mortgage | Total residential mortgage | | 1,419 | | | 0 | | | 0 | | | | 0 | | | 390 | | | 1,809 | |
| | Total consumer | Total consumer | | 1,419 | | | 0 | | | 0 | | | | 0 | | | 390 | | | 1,809 | |
| Total consumer | |
| Total consumer | |
| Total | Total | | $ | 6,891 | | | $ | 0 | | | $ | 752 | | | | $ | 0 | | | $ | 4,438 | | | $ | 12,081 | |
|
(1)Includes forbearance payments, term extensions and principal deferments that modify the terms of the loan from principal and interest payments to interest payments only.
(2)Includes principal and interest deferments or reductions.
(3)Includes primarily funding to secure additional collateral and providesprovide liquidity to collateral-dependent and term extension to C&I loans.
After a loan is modified as a TDR, the Company continues to monitor its performance under its most recent restructured terms. A TDR may become delinquent and result in payment default (generally 90 days past due) subsequent to restructuring. The following table presents information on loans for which a subsequent paymentthat entered into default occurred during the years ended December 31, 2020, 20192022 and 2018, respectively, which had been2021 that were modified as TDR withinTDRs during the previous 12 months of its default, and were still in default as of the respective periods end:preceding payment default:
| | | | | | | | | | | | | | | | | | | | | | | | | | | | | | | | | | | | | | |
|
| ($ in thousands) | | Loans Modified as TDRs that Subsequently Defaulted
During the Year Ended December 31, |
| 2020 | | 2019 | | 2018 |
| Number of
Loans | | Recorded
Investment | | Number of
Loans | | Recorded
Investment | | Number of
Loans | | Recorded
Investment |
| Commercial: | | | | | | | | | | | | |
| C&I | | 1 | | | $ | 15,852 | | | 3 | | | $ | 13,112 | | | 4 | | | $ | 1,890 | |
| CRE: | | | | | | | | | | | | |
| CRE | | 0 | | | 0 | | | 0 | | | 0 | | | 1 | | | 186 | |
| | | | | | | | | | | | |
| | | | | | | | | | | | |
| Total CRE | | 0 | | | 0 | | | 0 | | | 0 | | | 1 | | | 186 | |
| Total commercial | | 1 | | | 15,852 | | | 3 | | | 13,112 | | | 5 | | | 2,076 | |
| Consumer: | | | | | | | | | | | | |
| Residential mortgage: | | | | | | | | | | | | |
| | | | | | | | | | | | |
| HELOCs | | 0 | | | 0 | | | 0 | | | 0 | | | 1 | | | 150 | |
| Total residential mortgage | | 0 | | | 0 | | | 0 | | | 0 | | | 1 | | | 150 | |
| | | | | | | | | | | | |
| Total consumer | | 0 | | | 0 | | | 0 | | | 0 | | | 1 | | | 150 | |
| Total | | 1 | | | $ | 15,852 | | | 3 | | | $ | 13,112 | | | 6 | | | $ | 2,226 | |
|
| | | | | | | | | | | | | | | | | | | | | | | | | | | | | | |
|
| | | | | | Loans Modified as TDRs that Subsequently Defaulted
During the Year Ended December 31, |
| | | | 2022 | | 2021 |
| ($ in thousands) | | | | | | Number of Loans | | Recorded Investment | | Number of Loans | | Recorded Investment |
| Commercial: | | | | | | | | | | | | |
| C&I | | | | | | 2 | | | $ | 10,296 | | | 1 | | | $ | 11,431 | |
| | | | | | | | | | | | |
| | | | | | | | | | | | |
| | | | | | | | | | | | |
| | | | | | | | | | | | |
| | | | | | | | | | | | |
| Total commercial | | | | | | 2 | | | 10,296 | | | 1 | | | 11,431 | |
| | | | | | | | | | | | |
| | | | | | | | | | | | |
| | | | | | | | | | | | |
| | | | | | | | | | | | |
| | | | | | | | | | | | |
| | | | | | | | | | | | |
| | | | | | | | | | | | |
| Total | | | | | | 2 | | | $ | 10,296 | | | 1 | | | $ | 11,431 | |
|
As of December 31, 2020 and 2019,2022, the remaining commitments to lend additional funds to borrowers whose terms have beenof their outstanding owed balances were modified as TDRs were $3.0 million and $2.2 million, respectively.was $16 million.
Impaired Loans
In connection with the adoption of ASU 2016-13 on January 1, 2020, the Company no longer provides information on impaired loans. Information on non-PCI impaired loans as of December 31, 2019 is presented as follows:
| | | | | | | | | | | | | | | | | | | | | | | | | | | | | | | | |
|
| ($ in thousands) | | December 31, 2019 |
| Unpaid
Principal
Balance | | Recorded
Investment
With No
Allowance | | Recorded
Investment
With
Allowance | | Total
Recorded
Investment | | Related
Allowance |
| Commercial: | | | | | | | | | | |
| C&I | | $ | 174,656 | | | $ | 73,956 | | | $ | 40,086 | | | $ | 114,042 | | | $ | 2,881 | |
| CRE: | | | | | | | | | | |
| CRE | | 27,601 | | | 20,098 | | | 1,520 | | | 21,618 | | | 97 | |
| Multifamily residential | | 4,965 | | | 1,371 | | | 3,093 | | | 4,464 | | | 55 | |
| Construction and land | | 19,696 | | | 19,691 | | | 0 | | | 19,691 | | | 0 | |
| Total CRE | | 52,262 | | | 41,160 | | | 4,613 | | | 45,773 | | | 152 | |
| Total commercial | | 226,918 | | | 115,116 | | | 44,699 | | | 159,815 | | | 3,033 | |
| Consumer: | | | | | | | | | | |
| Residential mortgage: | | | | | | | | | | |
| Single-family residential | | 23,626 | | | 8,507 | | | 13,704 | | | 22,211 | | | 35 | |
| HELOCs | | 13,711 | | | 6,125 | | | 7,449 | | | 13,574 | | | 8 | |
| Total residential mortgage | | 37,337 | | | 14,632 | | | 21,153 | | | 35,785 | | | 43 | |
| Other consumer | | 2,517 | | | 0 | | | 2,517 | | | 2,517 | | | 2,517 | |
| Total consumer | | 39,854 | | | 14,632 | | | 23,670 | | | 38,302 | | | 2,560 | |
| Total non-PCI impaired loans | | $ | 266,772 | | | $ | 129,748 | | | $ | 68,369 | | | $ | 198,117 | | | $ | 5,593 | |
|
The following table presents the average recorded investment and interest income recognized on non-PCI impaired loans for the years ended December 31, 2019 and 2018:
| | | | | | | | | | | | | | | | | | | | | | | | | | | | | | |
|
| ($ in thousands) | | | | | Year Ended December 31, |
| | | 2019 | | 2018 |
| | | | | Average
Recorded
Investment | | Recognized
Interest
Income (1) | | Average
Recorded
Investment | | Recognized Interest Income (1) |
| Commercial: | | | | | | | | | | | | |
| C&I | | | | | | $ | 248,619 | | | $ | 2,932 | | | $ | 143,430 | | | $ | 1,046 | |
| CRE: | | | | | | | | | | | | |
| CRE | | | | | | 33,046 | | | 464 | | | 35,049 | | | 491 | |
| Multifamily residential | | | | | | 6,116 | | | 228 | | | 11,742 | | | 249 | |
| Construction and land | | | | | | 19,691 | | | 68 | | | 3,973 | | | 0 | |
| Total CRE | | | | | | 58,853 | | | 760 | | | 50,764 | | | 740 | |
| Total commercial | | | | | | 307,472 | | | 3,692 | | | 194,194 | | | 1,786 | |
| Consumer: | | | | | | | | | | | | |
| Residential mortgage: | | | | | | | | | | | | |
| Single-family residential | | | | | | 37,315 | | | 496 | | | 22,350 | | | 474 | |
| HELOCs | | | | | | 22,851 | | | 130 | | | 14,134 | | | 70 | |
| Total residential mortgage | | | | | | 60,166 | | | 626 | | | 36,484 | | | 544 | |
| Other consumer | | | | | | 2,552 | | | 0 | | | 2,502 | | | 0 | |
| Total consumer | | | | | | 62,718 | | | 626 | | | 38,986 | | | 544 | |
| Total non-PCI impaired loans | | | | | | $ | 370,190 | | | $ | 4,318 | | | $ | 233,180 | | | $ | 2,330 | |
|
(1)Includes interest income recognized on accruing non-PCI TDRs. Interest payments received on nonaccrual non-PCI loans are reflected as a reduction to principal, not as interest income.
Allowance for Credit Losses
On January 1, 2020, theThe Company adopted ASU 2016-13 that establisheshas a single allowancecurrent expected credit losses (“CECL”) framework for all financial assets measured at amortized cost and certain off-balance sheet credit exposures. It requiresThe Company’s allowance for credit losses, which includes both the allowance for loan losses and the allowance for unfunded credit commitments, is calculated with the objective of maintaining a reserve sufficient to absorb losses inherent in our credit portfolios. The measurement of the allowance for credit losses to beis based on management’s best estimate of lifetime expected credit losses, inherent inperiodic evaluation of the Company’sloan portfolio, lending-related commitments and other relevant financial assets. Balance sheet information and results of operations for reporting periods beginning with January 1, 2020 are presented under ASC 326, while prior period comparisons continue to be presented under legacy GAAP.factors.
The allowance for credit losses is deducted from the amortized cost basis of a financial asset or a group of financial assets so that the balance sheet reflects the net amount the Company expects to collect. Amortized cost is the principal balance outstanding, net of purchase premiums and discounts, and deferred fees and costs.costs, and escrow advances. Subsequent changes in expected credit losses are recognized in net income as a provision for, credit loss expense or a reversal of, credit loss expense.
The process of the allowance for credit losses estimation involves procedures to consider the unique risk characteristics of the portfolio segments. The majority of the Company’s credit exposures that share risk characteristics with other similar exposures and as a result are collectively evaluated. The collectively evaluated loans coverinclude performing risk-rated loans and unfunded credit commitments. If an exposure does not share risk characteristics with other exposures, the Company generally estimates expected credit losses on an individual basis. The individually assessed loans cover loans modified or reasonably expected to be modified in a TDR, collateral-dependent loans, as well as, risk-rated loans that have been placed on nonaccrual status.
Allowance for Collectively Evaluated Loans
The allowance for collectively evaluated loans consists of a quantitative component that assesses manythe different risk factors which are considered in our models and a qualitative component that considers risk factors external to the models. Each of these components are described below.
Quantitative Component —The allowance forCompany applies quantitative methods to estimate loan losses is estimated using quantitative methods that considerby considering a variety of factors such as historical loss experience, the current credit quality of the portfolio, as well asand an economic outlook over the life of the loan. The Company incorporates forward-looking information using macroeconomic scenarios applied over the forecasted life of the loans. The forward-looking information is limited to the reasonable and supportable period. These macroeconomic scenarioswhich include variables that are considered key drivers of increases and decreases in credit losses. The Company utilizes a probability-weighted, multiple scenariomultiple-scenario forecast approach. These scenarios may consist of a base forecast representing management's view of the most likely outcome, combined with downside andor upside scenarios reflecting possible worsening or improving economic conditions. AThe quantitative models incorporate a probability-weighted averagecalculation of these macroeconomic scenarios over a reasonable and supportable forecast period is incorporated into the quantitative models.period. If the loans’ life of the loans extends beyond the reasonable and supportable forecast period, thenthe Company will consider historical experience or long-run macroeconomic trends is considered over the remaining life of the loans in estimation ofto estimate the allowance for loan losses.
There were no changes to the reasonable and supportable forecast period, except to the C&I segment, and no changes to the reversion to the historical loss experience method in 2023 and 2022. The reasonable and supportable forecast period for the C&I segment changed from 11 quarters to eight quarters due to model redevelopment during the third quarter of 2023.
The following table provides key credit risk characteristics and macroeconomic variables that the Company uses to estimate the expected credit losses by portfolio segment:
| | | | | | | | | | | | | | |
| | | | |
| Portfolio Segment | | Risk Characteristics | | Macroeconomic Variables |
| C&I | | Age percentage, size at origination, delinquency status, sector and risk rating | | Unemployment rate, Gross Domestic Product (“GDP”), and U.S. Treasury rates (1) |
| CRE, Multifamily residential, and Construction and land | | Delinquency status, maturity date, collateral value, property type, and geographic location | | Unemployment rate, GDP, and U.S. Treasury rates |
| Single-family residential and HELOCs | | FICO score, delinquency status, maturity date, collateral value, and geographic location | | Unemployment rate, GDP, and Home Price Indices |
| Other consumer | | Loss rate approach | | Immaterial (2) |
| | | | |
(1).Macroeconomic variables were updated due to model redevelopment.
(2)Macroeconomic variables are included in the qualitative estimate.
Quantitative Component — Allowance for Loan Losses for the Commercial Loan Portfolio
The Company’s C&I lifetime loss rate model estimates the loss rate expected over the life of a loan. This loss rate is applied to the amortized cost basis, excluding accrued interest receivable, to determine expected credit losses. The lifetime loss rate model’s reasonable and supportable period spans eight quarters, thereafter immediately reverting to the historical average loss rate, expressed through the loan-level lifetime loss rate.
To generate estimates of expected loss at the loan level for CRE, multifamily residential, and construction and land loans, projected PDs and LGDs are applied to the estimated exposure at default, considering the term and payment structure of the loan. The forecast of future economic conditions returns to long-run historical economic trends within the reasonable and supportable period.
To estimate the life of a loan under both models, the contractual term of the loan is adjusted for estimated prepayments based on historical prepayment experience.
Quantitative Component — Allowance for Loan Losses for the Consumer Loan Portfolio
For single-family residential and HELOC loans, projected PDs and LGDs are applied to the estimated exposure at default, considering the term and payment structure of the loan, to generate estimates of expected loss at the loan level. The forecast of future economic conditions returns to long-run historical economic trends after the reasonable and supportable period. To estimate the life of a loan for the single-family residential and HELOC loan portfolios, the contractual term of the loan is adjusted for estimated prepayments based on historical prepayment experience. For other consumer loans, the Company uses a loss rate approach.
Qualitative Component — The Company also considers the following qualitative factors in the determination of the collectively evaluated allowance if these factors have not already been captured by the quantitative model. Such qualitative factors may include, but are not limited to:
•–Loanloan growth trends;
•–Thethe volume and severity of past due financial assets, and the volume and severity of criticized or adversely classified or rated financial assets;
•–Thethe Company’s lending policies and procedures, including changes in lending strategies, underwriting standards, collection, write-off and recovery practices,practices;
•–Knowledgeknowledge of thea borrower’s operations;
•–Thethe quality of the Company’s credit review system;
•–Thethe experience, ability and depth of the Company’s management lending staff and other relevant staff;associates;
•–Thethe effect of other external factors such as the regulatory and legal and technological environments; andenvironments, or changes in technology;
•–Actualactual and expected changes in international, national, regional, and local economic and business conditions in which the Company operates, includingoperates; and
–risk factors in certain industry sectors not captured by the actual and expected conditions of various market segments.quantitative models.
The magnitude of the impact of these factors on the Company’s qualitative assessment of the allowance for credit losses changes from period to period according to changes made by management in its assessment of these factors. The extent to which these factors change may be dependent on whether they are already reflected in quantitative loss estimates during the current period and the extent to which changes in these factors diverge from period to period. For the year ended December 31, 2020, there were no changes to the reasonable and supportable forecast period, and reversion to historical loss experience method.
The following table provides key credit risk characteristics and macroeconomic variables that the Company uses to estimate the expected credit losses by portfolio segment:
| | | | | | | | | | | | | | |
| | | | |
Portfolio Segment | | Risk Characteristics | | Macroeconomic Variables |
C&I | | Internal risk rating; size and credit spread at origination, and time to maturity | | Unemployment rate, and two and ten year treasury spread |
CRE, Multifamily residential, and Construction and land | | Delinquency status; maturity date; collateral value; property type, and geographic location | | Unemployment rate; GDP, and U.S. Treasury rates |
Single-family residential and HELOCs | | FICO; delinquency status; maturity date; collateral value, and geographic location | | Unemployment rate; GDP, and home price index |
Other consumer | | Historical loss experience | | Immaterial (1)
|
| | | | |
(1)Macroeconomic variables are included in the qualitative estimate.
Allowance for Loan Losses for the Commercial Loan Portfolio— The Company’s C&I loan lifetime loss rate model estimates credit losses by estimating a loss rate expected over the life of a loan. This loss rate is applied to the amortized cost basis, excluding accrued interest receivable, to determine expected credit losses. The lifetime loss rate model’s reasonable and supportable period spans eight quarters, thereafter immediately reverting to the historical average loss rate, expressed through the loan-level lifetime loss rate.
For CRE loans, projected probability of defaults (“PDs”) and loss given defaults (“LGDs”) are applied to the estimated exposure at default, considering the term and payment structure of the loan, to generate estimates of expected loss at the loan level. Within the reasonable and supportable period, the forecast of future economic conditions returns to long-run historical economic trends.
In order to estimate the life of a loan under both models, the contractual term of the loan is adjusted for estimated prepayments, which are based on historical prepayment experience.
Allowance for Loan Losses for the Consumer Loan Portfolio — For single-family residential and HELOC loans, projected PDs and LGDs are applied to the estimated exposure at default, considering the term and payment structure of the loan, to generate estimates of expected loss at the loan level. Within the reasonable and supportable period, the forecast of future economic conditions returns to long-run historical economic trends.
For other consumer loans, the Company uses a loss rate approach. In order to estimate the life of a loan, the contractual term of the loan is adjusted for estimated prepayments, which are based on historical prepayment experience.
Qualitative Allowance for Collectively Evaluated Loans — While the Company’s allowance methodologies strive to reflect all relevant credit risk factors, there continues to be uncertainty associated with, but not limited to, potential imprecision in the estimation process due to the inherent time lag of obtaining information and normal variations between expected and actual outcomes. The Company may hold additional qualitative reserves that are designed to provide coverage for losses attributable to such risk. The allowance for loan losses as of December 31, 2020 also included qualitative adjustments for certain industry sectors, such as oil & gas, included as part of the C&I loan portfolio.
Allowance for Individually Evaluated Loans
When a loan no longer shares similar risk characteristics with other loans, such as in the case forof certain nonaccrual or TDR loans, the Company estimates the allowance for loan losses on an individual loan basis. The allowance for loan losses for individually evaluated loans is measured as the difference between the recorded value of the loans and their fair value. For loans evaluated individually, the Company uses one of three different asset valuation measurement methods: (1) the fair value of collateral less costs to sell; (2) the present value of expected future cash flows; andor (3) the loan's observable market price. If an individually evaluated loan is determined to be collateral dependent, the Company applies the fair value of the collateral less costs to sell method. If an individually evaluated loan is determined not to be collateral dependent, the Company uses the present value of future cash flows or the observable market value of the loan.
•Collateral-Dependent Loans — WhenThe allowance of a collateral-dependent loan is collateral dependent, the allowance is measured on an individual loan basis and is limited to the difference between the recorded value and fair value of the collateral less cost of disposal or sale. As of December 31, 2020,2023, collateral-dependent commercial and consumer loans totaled $97.2$30 million and $17.3$12 million, respectively. In comparison, collateral-dependent commercial and consumer loans totaled $47 million and $13 million, respectively, as of December 31, 2022. The collateral-dependent loans decreased from December 31, 2022, predominantly driven by the adoption of ASU 2022-02 which eliminated TDR guidance. The Company's commercial collateral-dependent loans were secured by real estates or other collateral. The Company's consumer collateral-dependent loans were all residential mortgage loans, secured by their underlying real estates.estate. As of both December 31, 2020,2023 and 2022, the collateral value of the properties securing each of these collateral dependentthe collateral-dependent loans, net of selling costs, exceeded the recorded value of the individual loans.
The following tables summarize the activity in the allowance for loan losses by portfolio segments for the years ended December 31, 2020, 20192023, 2022 and 2018:2021:
| | | ($ in thousands) | | Year Ended December 31, 2020 |
| | | | | | Year Ended December 31, 2023 | |
| | Commercial | |
| | | | CRE | |
| | | | CRE | |
| | | | CRE | |
| ($ in thousands) | ($ in thousands) | | Commercial | | Consumer | | Total | |
| C&I | | CRE | | Residential Mortgage | | Other
Consumer | | |
| CRE | | Multifamily
Residential | | Construction
and Land | | Single-
Family
Residential | | HELOCs | | | Total | |
| | Allowance for loan losses, December 31, 2022 | |
| | Allowance for loan losses, December 31, 2022 | |
| | Allowance for loan losses, December 31, 2022 | |
| Impact of ASU 2022-02 adoption | |
| Impact of ASU 2022-02 adoption | |
| Impact of ASU 2022-02 adoption | |
| Allowance for loan losses, beginning of period | Allowance for loan losses, beginning of period | | $ | 238,376 | | | $ | 40,509 | | | $ | 22,826 | | | $ | 19,404 | | | $ | 28,527 | | | $ | 5,265 | | | $ | 3,380 | | | $ | 358,287 | | |
| Impact of ASU 2016-13 adoption | | 74,237 | | | 72,169 | | | (8,112) | | | (9,889) | | | (3,670) | | | (1,798) | | | 2,221 | | | 125,158 | | |
| Allowance for loan losses, beginning of period | |
| Allowance for loan losses, beginning of period | |
| Provision for (reversal of) credit losses on loans | |
| Provision for (reversal of) credit losses on loans | |
| Provision for (reversal of) credit losses on loans | Provision for (reversal of) credit losses on loans | (a) | 145,212 | | | 55,864 | | | 10,879 | | | 644 | | | (9,922) | | | (605) | | | (3,381) | | | 198,691 | | |
| Gross charge-offs | Gross charge-offs | | (66,225) | | | (15,206) | | | 0 | | | 0 | | | 0 | | | (221) | | | (185) | | | (81,837) | | |
| Gross charge-offs | |
| Gross charge-offs | |
| Gross recoveries | |
| Gross recoveries | |
| Gross recoveries | Gross recoveries | | 5,428 | | | 10,455 | | | 1,980 | | | 80 | | | 585 | | | 49 | | | 95 | | | 18,672 | | |
| Total net (charge-offs) recoveries | Total net (charge-offs) recoveries | | (60,797) | | | (4,751) | | | 1,980 | | | 80 | | | 585 | | | (172) | | | (90) | | | (63,165) | | |
| Total net (charge-offs) recoveries | |
| Total net (charge-offs) recoveries | |
| Foreign currency translation adjustment | Foreign currency translation adjustment | | 1,012 | | | 0 | | | 0 | | | 0 | | | 0 | | | 0 | | | 0 | | | 1,012 | | |
| Foreign currency translation adjustment | |
| Foreign currency translation adjustment | |
| Allowance for loan losses, end of period | |
| Allowance for loan losses, end of period | |
| Allowance for loan losses, end of period | Allowance for loan losses, end of period | | $ | 398,040 | | | $ | 163,791 | | | $ | 27,573 | | | $ | 10,239 | | | $ | 15,520 | | | $ | 2,690 | | | $ | 2,130 | | | $ | 619,983 | | |
| |
| | | | | | | | | | | | | | | | | | | | | | | | | | | | | | | | | | | | | | | | | | | | | | | | | | | | | | |
|
| | Year Ended December 31, 2022 |
| | Commercial | | Consumer | | | | | | |
| | | | CRE | | Residential Mortgage | | | | | | | | |
| ($ in thousands) | | C&I | | CRE | | Multifamily Residential | | Construction and Land | | Single-Family Residential | | HELOCs | | Other Consumer | | Total | | | | |
| | | | | | | | | | | | | | | | | | | | |
| Allowance for loan losses, beginning of period | | $ | 338,252 | | | $ | 150,940 | | | $ | 14,400 | | | $ | 15,468 | | | $ | 17,160 | | | $ | 3,435 | | | $ | 1,924 | | | $ | 541,579 | | | | | |
| | | | | | | | | | | | | | | | | | | | |
| Provision for (reversal of) credit losses on loans | (a) | 37,604 | | | 8,212 | | | 15,651 | | | (6,433) | | | 18,867 | | | 1,124 | | | (258) | | | 74,767 | | | | | |
| Gross charge-offs | | (18,738) | | | (10,871) | | | (7,237) | | | — | | | (775) | | | (193) | | | (106) | | | (37,920) | | | | | |
| Gross recoveries | | 16,824 | | | 1,583 | | | 559 | | | 74 | | | 312 | | | 109 | | | — | | | 19,461 | | | | | |
| Total net (charge-offs) recoveries | | (1,914) | | | (9,288) | | | (6,678) | | | 74 | | | (463) | | | (84) | | | (106) | | | (18,459) | | | | | |
| Foreign currency translation adjustment | | (2,242) | | | — | | | — | | | — | | | — | | | — | | | — | | | (2,242) | | | | | |
| Allowance for loan losses, end of period | | $ | 371,700 | | | $ | 149,864 | | | $ | 23,373 | | | $ | 9,109 | | | $ | 35,564 | | | $ | 4,475 | | | $ | 1,560 | | | $ | 595,645 | | | | | |
| | | | |
| | | | | | | | | | | | | | | | | | | | | | | | | | | | | | | | | | | | | | | | | | | | | | | | | | | | | | |
|
| ($ in thousands) | | Year Ended December 31, 2019 |
| Commercial | | Consumer | | Total | | | | |
| C&I | | CRE | | Residential Mortgage | | Other
Consumer | | | | | |
| | CRE | | Multifamily
Residential | | Construction
and Land | | Single-
Family
Residential | | HELOCs | | | | | | |
| | | | | | | | | | | | | | | | | | | | |
| Allowance for loan losses, beginning of period | | $ | 189,117 | | | $ | 40,666 | | | $ | 19,885 | | | $ | 20,290 | | | $ | 31,340 | | | $ | 5,774 | | | $ | 4,250 | | | $ | 311,322 | | | | | |
| Provision for (reversal of) credit losses on loans | (a) | 109,068 | | | (4,345) | | | 1,085 | | | (1,422) | | | (2,938) | | | (516) | | | (839) | | | 100,093 | | | | | |
| Gross charge-offs | | (73,985) | | | (1,021) | | | 0 | | | 0 | | | (11) | | | 0 | | | (50) | | | (75,067) | | | | | |
| Gross recoveries | | 14,501 | | | 5,209 | | | 1,856 | | | 536 | | | 136 | | | 7 | | | 19 | | | 22,264 | | | | | |
| Total net (charge-offs) recoveries | | (59,484) | | | 4,188 | | | 1,856 | | | 536 | | | 125 | | | 7 | | | (31) | | | (52,803) | | | | | |
| Foreign currency translation adjustment | | (325) | | | 0 | | | 0 | | | 0 | | | 0 | | | 0 | | | 0 | | | (325) | | | | | |
| Allowance for loan losses, end of period | | $ | 238,376 | | | $ | 40,509 | | | $ | 22,826 | | | $ | 19,404 | | | $ | 28,527 | | | $ | 5,265 | | | $ | 3,380 | | | $ | 358,287 | | | | | |
| | | | |
| | | | | | | | | | | | | | | | | | | | | | | | | | | | | | | | | | | | | | | | | | | | | | | | | | | | | | |
|
| ($ in thousands) | | Year Ended December 31, 2018 |
| Commercial | | Consumer | | Total | | | | |
| C&I | | CRE | | Residential Mortgage | | Other
Consumer | | | | | |
| | CRE | | Multifamily
Residential | | Construction
and Land | | Single-
Family
Residential | | HELOCs | | | | | | |
| | | | | | | | | | | | | | | | | | | | |
| Allowance for loan losses, beginning of period | | $ | 163,058 | | | $ | 40,809 | | | $ | 19,537 | | | $ | 26,881 | | | $ | 26,362 | | | $ | 7,354 | | | $ | 3,127 | | | $ | 287,128 | | | | | |
| Provision for (reversal of) credit losses on loans | (a) | 75,629 | | | (5,337) | | | (1,409) | | | (7,331) | | | 3,765 | | | (1,618) | | | 1,308 | | | 65,007 | | | | | |
| Gross charge-offs | | (59,244) | | | 0 | | | 0 | | | 0 | | | (1) | | | 0 | | | (188) | | | (59,433) | | | | | |
| Gross recoveries | | 10,417 | | | 5,194 | | | 1,757 | | | 740 | | | 1,214 | | | 38 | | | 3 | | | 19,363 | | | | | |
| Total net (charge-offs) recoveries | | (48,827) | | | 5,194 | | | 1,757 | | | 740 | | | 1,213 | | | 38 | | | (185) | | | (40,070) | | | | | |
| Foreign currency translation adjustment | | (743) | | | 0 | | | 0 | | | 0 | | | 0 | | | 0 | | | 0 | | | (743) | | | | | |
| Allowance for loan losses, end of period | | $ | 189,117 | | | $ | 40,666 | | | $ | 19,885 | | | $ | 20,290 | | | $ | 31,340 | | | $ | 5,774 | | | $ | 4,250 | | | $ | 311,322 | | | | | |
| | | | |
The following table summarizes the activities in the allowance for unfunded credit commitments for the years ended December 31, 2020, 2019 and 2018:
| | | | | | | | | | | | | | | | | | | | |
|
| ($ in thousands) | | Year Ended December 31, |
| 2020 | | 2019 | | 2018 |
| Unfunded credit facilities | | | | | | |
| Allowance for unfunded credit commitments, beginning of period | | $ | 11,158 | | | $ | 12,566 | | | $ | 13,318 | |
| Impact of ASU 2016-13 adoption | | 10,457 | | | 0 | | | 0 | |
| Provision for (reversal of ) credit losses on unfunded credit commitments | (b) | 11,962 | | | (1,408) | | | (752) | |
| Allowance for unfunded credit commitments, end of period | | 33,577 | | | 11,158 | | | 12,566 | |
| | | | | | |
| Provision for credit losses | (a) + (b) | $ | 210,653 | | | $ | 98,685 | | | $ | 64,255 | |
|
The allowance for loan losses as of December 31, 2020 was $620.0 million, an increase of $261.7 million compared with $358.3 million as of December 31, 2019. The adoption of ASU 2016-13 increased the allowance for loan losses by $125.2 million on January 1, 2020. In addition, the overall increases in allowance for loan losses and the provision for credit losses of $210.7 million for the year ended December 31, 2020 were primarily driven by the deteriorating macroeconomic conditions and outlook as a result of the COVID-19 pandemic. During the year ended December 31, 2020, the macroeconomic environment declined in the first half of the year, and then improved slightly for the second half of 2020. The Company uses a multi-scenario approach in calculating the allowance for loan losses and applies management judgment to add qualitative factors for the impact of COVID-19 pandemic on industry and CRE sectors that are affected by the pandemic. | | | | | | | | | | | | | | | | | | | | | | | | | | | | | | | | | | | | | | | | | | | | | | | | | | | | | | |
|
| | Year Ended December 31, 2021 |
| | Commercial | | Consumer | | | | | | |
| | | | CRE | | Residential Mortgage | | | | | | | | |
| ($ in thousands) | | C&I | | CRE | | Multifamily Residential | | Construction and Land | | Single-Family Residential | | HELOCs | | Other Consumer | | Total | | | | |
| | | | | | | | | | | | | | | | | | | | |
| Allowance for loan losses, beginning of period | | $ | 398,040 | | | $ | 163,791 | | | $ | 27,573 | | | $ | 10,239 | | | $ | 15,520 | | | $ | 2,690 | | | $ | 2,130 | | | $ | 619,983 | | | | | |
| | | | | | | | | | | | | | | | | | | | |
| (Reversal of) provision for credit losses on loans | (a) | (39,732) | | | 14,282 | | | (15,076) | | | 7,576 | | | 1,965 | | | 745 | | | 1,286 | | | (28,954) | | | | | |
| Gross charge-offs | | (32,490) | | | (28,430) | | | (130) | | | (2,954) | | | (1,046) | | | (45) | | | (1,497) | | | (66,592) | | | | | |
| Gross recoveries | | 11,906 | | | 1,297 | | | 2,033 | | | 607 | | | 721 | | | 45 | | | 5 | | | 16,614 | | | | | |
| Total net (charge-offs) recoveries | | (20,584) | | | (27,133) | | | 1,903 | | | (2,347) | | | (325) | | | — | | | (1,492) | | | (49,978) | | | | | |
| Foreign currency translation adjustment | | 528 | | | — | | | — | | | — | | | — | | | — | | | — | | | 528 | | | | | |
| Allowance for loan losses, end of period | | $ | 338,252 | | | $ | 150,940 | | | $ | 14,400 | | | $ | 15,468 | | | $ | 17,160 | | | $ | 3,435 | | | $ | 1,924 | | | $ | 541,579 | | | | | |
| | | | |
In addition to the allowance for loan losses, the Company maintains an allowance for unfunded credit commitments. The Company has three general areas for which it provides the allowance for unfunded credit commitments: (1) recourse obligations for loans sold, (2) letters of credit, and (3) unfunded lending commitments. The allowance for unfunded credit commitments is maintained at a level that management believes to be sufficient to absorb estimated expected credit losses related to unfunded credit facilities. See Note 12 — Commitments Contingencies and Related Party TransactionsContingencies to the Consolidated Financial Statements in this Form 10-K for additional information related to unfunded credit reserves.
commitments. The following table presentssummarizes the Company’sactivities in the allowance for loan losses and recorded investments by portfolio segments and impairment methodology as of December 31, 2019. This table is no longer presented after December 31, 2019, given the adoption of ASU 2016-13 on January 1, 2020, which has a single impairment methodology.
| | | | | | | | | | | | | | | | | | | | | | | | | | | | | | | | | | | | | | | | | | | | | | | | | | | | | | | | | | |
|
| ($ in thousands) | | | | | | | | | | December 31, 2019 |
| | | | | | | | | Commercial | | Consumer | | Total |
| | | | | | | | | | | CRE | | Residential Mortgage | | | |
| | | | | | | | | C&I | | CRE | | Multifamily
Residential | | Construction
and Land | | Single-Family
Residential | | HELOCs | | Other
Consumer | |
| Allowance for loan losses | | | | | | | | | | | | | | | | | | | | | | | | |
| Individually evaluated for impairment | | | | | | | | | | $ | 2,881 | | | $ | 97 | | | $ | 55 | | | $ | 0 | | | $ | 35 | | | $ | 8 | | | $ | 2,517 | | | $ | 5,593 | |
| Collectively evaluated for impairment | | | | | | | | | | 235,495 | | | 40,412 | | | 22,771 | | | 19,404 | | | 28,492 | | | 5,257 | | | 863 | | | 352,694 | |
| | | | | | | | | | | | | | | | | | | | | | | | |
| Total | | | | | | | | | | $ | 238,376 | | | $ | 40,509 | | | $ | 22,826 | | | $ | 19,404 | | | $ | 28,527 | | | $ | 5,265 | | | $ | 3,380 | | | $ | 358,287 | |
| | | | | | | | | | | | | | | | | | | | | | | | |
| Recorded investment in loans | | | | | | | | | | | | | | | | | | | | | | | | |
| Individually evaluated for impairment | | | | | | | | | | $ | 114,042 | | | $ | 21,618 | | | $ | 4,464 | | | $ | 19,691 | | | $ | 22,211 | | | $ | 13,574 | | | $ | 2,517 | | | $ | 198,117 | |
| Collectively evaluated for impairment | | | | | | | | | | 12,035,079 | | | 10,143,629 | | | 2,829,748 | | | 608,768 | | | 7,006,768 | | | 1,453,162 | | | 280,397 | | | 34,357,551 | |
Acquired with deteriorated credit quality (1) | | | | | | | | | | 1,810 | | | 113,201 | | | 22,162 | | | 40 | | | 79,611 | | | 6,047 | | | 0 | | | 222,871 | |
Total (1) | | | | | | | | | | $ | 12,150,931 | | | $ | 10,278,448 | | | $ | 2,856,374 | | | $ | 628,499 | | | $ | 7,108,590 | | | $ | 1,472,783 | | | $ | 282,914 | | | $ | 34,778,539 | |
|
(1)Loans net of ASC 310-30 discount.
Purchased Credit-Impaired Loans
On January 1, 2020, the amortized cost basis of PCD loans was adjusted to reflect the $1.2 million of allowance for loan losses. For the year ended December 31, 2020, the Company did not acquire any PCD loans. For information on PCD loans, see Note 1 — Summary of Significant Accounting Policies to the Consolidated Financial Statements in this Form 10-K.
The following table presents the changes in the accretable yield on PCI loansunfunded credit commitments for the years ended December 31, 20192023, 2022 and 2018:2021:
| | | | | | | | | | | | | | | | |
|
| ($ in thousands) | | | Year Ended December 31, |
| | | 2019 | | 2018 |
| Accretable yield for PCI loans, beginning of period | | | | $ | 74,870 | | | $ | 101,977 | |
| | | | | | |
| Accretion | | | | (24,220) | | | (34,662) | |
| Changes in expected cash flows | | | | (140) | | | 7,555 | |
| Accretable yield for PCI loans, end of period | | | | $ | 50,510 | | | $ | 74,870 | |
|
| | | | | | | | | | | | | | | | | | | | |
|
| | Year Ended December 31, |
| ($ in thousands) | | 2023 | | 2022 | | 2021 |
| Unfunded credit facilities | | | | | | |
| Allowance for unfunded credit commitments, beginning of period | | $ | 26,264 | | | $ | 27,514 | | | $ | 33,577 | |
| | | | | | |
| Provision for (reversal of) credit losses on unfunded credit commitments | (b) | 11,429 | | | (1,267) | | | (6,046) | |
| Foreign currency translation adjustments | | 6 | | | 17 | | | (17) | |
| Allowance for unfunded credit commitments, end of period | | 37,699 | | | 26,264 | | | 27,514 | |
| | | | | | |
| Provision for (reversal of) credit losses | (a) + (b) | $ | 125,000 | | | $ | 73,500 | | | $ | (35,000) | |
|
Loans Held-for-SaleThe allowance for credit losses was $706 million as of December 31, 2023, compared with $622 million as of December 31, 2022. The increase in the allowance for credit losses was primarily driven by net loan growth and economic forecasts that reflect continued caution regarding inflation, the high interest rate environment and the CRE market outlook.
The Company considers multiple economic scenarios to develop the estimate of the allowance for loan losses. The scenarios may consist of a baseline forecast representing management's view of the most likely outcome, and downside or upside scenarios that reflect possible worsening or improving economic conditions. As of both December 31, 20202023 and 2019, loans held-for-sale2022, the Company assigned the same weightings to its baseline, upside, and downside scenarios. The current baseline economic forecast continues to reflect key risks such as high inflation, high interest rates, concerns over global conflicts and oil prices. Compared with the December 2022 forecast, the 2023 baseline forecast projected lower annual GDP growth for 2023 and beyond, and a similarly higher unemployment rate for 2023 and beyond. The downside scenario assumed the economy falls into recession in the first quarter of $1.8 million2024 as a result of an extended federal government shutdown, global and $434 thousand, respectively, consisteddomestic political tensions, high inflation, and increased unemployment. The upside scenario assumed a more optimistic economic outlook for 2024, including stronger growth, stable financial market, and full employment starting in the first quarter of single-family residential loans. Refer to Note 1— Summary of Significant Accounting Policies — Significant Accounting Policies — Loans Held-for-Sale to theConsolidated Financial Statements in this Form 10-K for additional details related to the Company’s loans held-for-sale.2024.
Loan Transfers, Sales and Purchases
The Company’s primary business focus is on directly originated loans. The Company also purchases loans and sells loansparticipates in loan financing with other banks. In the secondary market in the ordinarynormal course of business.doing business, the Company also provides other financial institutions with the ability to participate in commercial loans that it originates, by selling loans to such institutions. Purchased loans may be transferred from held-for-investment to held-for-sale, and write-downs to allowance for loan losses are recorded, when appropriate. The following tables provide information abouton the carrying value of loans transferred, sold and purchased for the held-for-investment portfolio, loans sold and loan transfers during the years ended December 31, 2020, 20192023, 2022 and 2018:2021:
| | | ($ in thousands) | | Year Ended December 31, 2020 |
| | | | | | Year Ended December 31, 2023 | |
| | Commercial | |
| | | | CRE | |
| | | | CRE | |
| | | | CRE | |
| ($ in thousands) | ($ in thousands) | | Commercial | | Consumer | | Total |
| | CRE | | Residential Mortgage | | |
| C&I | | CRE | | Multifamily
Residential | | Construction
and Land | | Single-Family
Residential | | HELOCs | | Other
Consumer | | | C&I | | CRE | | Multifamily Residential | | Construction and Land | | Single-Family Residential | | | | | | Total |
| $ | 300,677 | | | $ | 26,994 | | | $ | 1,398 | | | $ | 0 | | | $ | 0 | | | $ | 0 | | | $ | 0 | | | $ | 329,069 | |
| Sales (2)(3)(4) | | $ | 303,520 | | | $ | 26,994 | | | $ | 1,398 | | | $ | 0 | | | $ | 80,309 | | | $ | 0 | | | $ | 0 | | | $ | 412,221 | |
Purchases (5) | | $ | 154,154 | | | $ | 0 | | | $ | 2,358 | | | $ | 0 | | | $ | 233,068 | | | $ | 0 | | | $ | 0 | | | $ | 389,580 | |
| Sales (2)(3) | |
| Sales (2)(3) | |
| Sales (2)(3) | |
Purchases (4) | |
|
| | | | | | | | | | | | | | | | | | | | | | | | | | | | | | | | | | | | | | | | | | | | | | | | | | |
|
| ($ in thousands) | | Year Ended December 31, 2019 |
| Commercial | | Consumer | | Total |
| | | CRE | | Residential Mortgage | | | |
| C&I | | CRE | | Multifamily
Residential | | Construction
and Land | | Single-Family
Residential | | HELOCs | | Other
Consumer | |
Loans transferred from held-for-investment to held-for-sale (1) | | $ | 245,002 | | | $ | 39,062 | | | $ | 0 | | | $ | 1,573 | | | $ | 0 | | | $ | 0 | | | $ | 0 | | | $ | 285,637 | |
| | | | | | | | | | | | | | | | |
Sales (2)(3)(4) | | $ | 245,791 | | | $ | 39,062 | | | $ | 0 | | | $ | 1,573 | | | $ | 10,410 | | | $ | 0 | | | $ | 0 | | | $ | 296,836 | |
Purchases (5) | | $ | 397,615 | | | $ | 0 | | | $ | 8,988 | | | $ | 0 | | | $ | 117,227 | | | $ | 0 | | | $ | 0 | | | $ | 523,830 | |
|
| | | ($ in thousands) | | Year Ended December 31, 2018 |
| | | | | | Year Ended December 31, 2022 | |
| | Commercial | |
| | | | CRE | |
| | | | CRE | |
| | | | CRE | |
| ($ in thousands) | ($ in thousands) | | Commercial | | Consumer | | Total |
| | CRE | | Residential Mortgage | | |
| C&I | | CRE | | Multifamily
Residential | | Construction
and Land | | Single-Family
Residential | | HELOCs | | Other
Consumer | | | C&I | | CRE | | Multifamily Residential | | Construction and Land | | Single-Family Residential | | | | | | Total |
| $ | 404,321 | | | $ | 62,291 | | | $ | 0 | | | $ | 0 | | | $ | 14,981 | | | $ | 0 | | | $ | 0 | | | $ | 481,593 | |
| Loans transferred from held-for-sale to held-for-investment | Loans transferred from held-for-sale to held-for-investment | | $ | 2,306 | | | $ | 0 | | | $ | 0 | | | $ | 0 | | | $ | 0 | | | $ | 0 | | | $ | 0 | | | $ | 2,306 | |
Sales (2)(3)(4) | | $ | 413,844 | | | $ | 62,291 | | | $ | 0 | | | $ | 0 | | | $ | 34,966 | | | $ | 0 | | | $ | 0 | | | $ | 511,101 | |
Purchases (5) | | $ | 525,767 | | | $ | 0 | | | $ | 7,389 | | | $ | 0 | | | $ | 63,781 | | | $ | 0 | | | $ | 0 | | | $ | 596,937 | |
Sales (2)(3) | |
Purchases (4) | |
|
| | | | | | | | | | | | | | | | | | | | | | | | | | | | | | | | | | | | | | | | | | |
|
| | Year Ended December 31, 2021 |
| | Commercial | | Consumer | | |
| | | | CRE | | Residential Mortgage | | | | | | |
| ($ in thousands) | | C&I | | CRE | | Multifamily Residential | | Construction and Land | | Single-Family Residential | | | | | | Total |
Loans transferred from held-for-investment to held-for-sale (1) | | $ | 496,655 | | | $ | 78,834 | | | $ | — | | | $ | 18,883 | | | $ | 5,238 | | | | | | | $ | 599,610 | |
| | | | | | | | | | | | | | | | |
Sales (2)(3) | | $ | 502,694 | | | $ | 78,834 | | | $ | — | | | $ | 21,557 | | | $ | 18,458 | | | | | | | $ | 621,543 | |
Purchases (4) | | $ | 476,690 | | | $ | — | | | $ | 370 | | | $ | — | | | $ | 564,651 | | | | | | | $ | 1,041,711 | |
|
(1)The Company recordedIncludes write-downs of $2.8$5 million, $789 thousand$3 million and $14.6$12 million to the allowance for loan losses related to loans transferred from held-for-investment to held-for-sale for the years ended December 31, 2020, 20192023, 2022 and 2018,2021, respectively.
(2)Includes originated loans sold of $400.4$513 million, $230.3$388 million and $309.7$413 million for the years ended December 31, 2020, 20192023, 2022 and 2018,2021, respectively. Originated loans sold consistconsisted primarily of C&I and CRE loans for all periods.
(3)Includes $256 million of purchased loans of $11.8 million, $66.5 million and $201.4 million sold in the secondary market for the yearsyear ended December 31, 2020, 2019 and 2018, respectively.
(4)Net gains on sales of loans were $4.5 million, $4.0 million and $6.62023, compared with $208 million for each of the years ended December 31, 2020, 20192022 and 2018, respectively.2021.
(5)(4)C&I loan purchases were comprised primarily of syndicated C&I term loans.
Note 7 — Investments in Qualified Affordable Housing Partnerships, Tax Credit and Other Investments, Net and Variable Interest Entities
The Community Reinvestment Act (“CRA”)CRA encourages banks to meet the credit needs of their communities, particularly including low- and moderate-income individuals and neighborhoods. The Company invests in certain affordable housing projects in the form of ownership interests in limited partnerships or limited liability companies that qualify for CRA consideration and tax credits. These entities are formed to develop and operate apartment complexes designed as high-quality affordable housing for lower income tenants throughout the U.S. To fully utilize the available tax credits, each of these entities must meet the regulatory affordable housing requirements for a 15-year minimum 15-year compliance period. In addition to affordable housing projects, the Company also invests in New Market Tax Creditsmall business investment companies and new market tax credit projects that qualify for CRA credits,consideration, as well as eligible projects that qualify for renewable energy and historic tax credits. Investments in renewable energy tax credits help promote the development of renewable energy sources, and the investments in historic tax credits promote the rehabilitation of historic buildings and economic revitalization of the surrounding areas.
For the Company’s accounting policies on tax credit investments, see
— Summary of Significant Accounting Policies — Significant Accounting Policies — Securitiesand Investments in Qualified Affordable Housing Partnerships, Tax Credit and Other Investments, Netin this Form 10-K. For discussion on the Company’s impairment evaluation and monitoring process of tax credit investments, refer to Note 2 — Fair Value Measurement and Fair Value of Financial Instruments — Investments in Qualified Affordable Housing Partnerships, Tax Credit and Other Investments, Net to the Consolidated Financial Statements in this Form 10-K.
The Company records its investments in qualified affordable housing partnerships, net, using the proportional amortization method. Under the proportional amortization method, the Company amortizes the initial cost of the investment in proportion to the tax credits and other tax benefits received, and recognizes the amortization in Income tax expense on the Consolidated Statement of Income.
The following table presents the Company’s investments inand unfunded commitments of the Company’s qualified affordable housing partnerships, net,tax credit, and related unfunded commitmentsother investments, net as of December 31, 20202023 and 2019:2022:
| | | | December 31, | |
| | December 31, | |
| | December 31, | |
| | December 31, | |
| | December 31, | |
| | December 31, | |
| | December 31, | |
| | December 31, | |
| | December 31, | |
| | December 31, | |
| | December 31, | |
| | December 31, | |
| | December 31, | |
| | December 31, | |
| | December 31, | |
| | December 31, | |
| | December 31, | |
| | December 31, | |
| | December 31, | |
| | December 31, | |
| | December 31, | |
| | December 31, | |
| | December 31, | |
| | December 31, | |
| | December 31, | |
| | December 31, | |
| | December 31, | |
| | 2023 | | | | 2023 | | 2022 |
| ($ in thousands) | ($ in thousands) | | December 31, | ($ in thousands) | | Assets | | Liabilities - Unfunded Commitments (1) | | Assets | | Liabilities - Unfunded Commitments (1) |
| 2020 | | 2019 |
| | Investments in qualified affordable housing partnerships, net | Investments in qualified affordable housing partnerships, net | | $ | 213,555 | | | $ | 207,037 | |
| Accrued expenses and other liabilities — Unfunded commitments | | $ | 77,444 | | | $ | 80,294 | |
| Investments in qualified affordable housing partnerships, net | |
| Investments in qualified affordable housing partnerships, net | |
| Investments in tax credit and other investments, net | |
| Total | |
|
(1)Included in Accrued expenses and other liabilities on the Consolidated Balance Sheet.
Investments in tax credit and other investments, net presented in the table above include equity securities that are mutual funds with readily determinable fair values of $25 million and $24 million, as of December 31, 2023 and 2022, respectively. The Company invests in these mutual funds for CRA purposes.
The following table presents additional information related to the Company’s investments in qualified affordable housing partnerships, net,tax credit and other investments for the years ended December 31, 2020, 20192023, 2022 and 2018:2021:
| | | | Year Ended December 31, | |
| | | Year Ended December 31, | |
| | | Year Ended December 31, | |
| ($ in thousands) | ($ in thousands) | | Year Ended December 31, |
| 2020 | | 2019 | | 2018 |
| ($ in thousands) | |
| Investments in qualified housing partnerships, net | |
| Investments in qualified housing partnerships, net | |
| Investments in qualified housing partnerships, net | |
| Tax credits and other tax benefits recognized | |
| Tax credits and other tax benefits recognized | |
| Tax credits and other tax benefits recognized | Tax credits and other tax benefits recognized | | $ | 45,971 | | | $ | 46,034 | | | $ | 39,262 | |
| Amortization expense included in income tax expense | Amortization expense included in income tax expense | | $ | 37,132 | | | $ | 36,561 | | | $ | 28,046 | |
| Amortization expense included in income tax expense | |
| Amortization expense included in income tax expense | |
| Investments in tax credit and other investments, net | |
| Investments in tax credit and other investments, net | |
| Investments in tax credit and other investments, net | |
Amortization of tax credit and other investments (1) | |
Amortization of tax credit and other investments (1) | |
Amortization of tax credit and other investments (1) | |
| Unrealized gains (losses) on equity securities with readily determinable values | |
| Unrealized gains (losses) on equity securities with readily determinable values | |
| Unrealized gains (losses) on equity securities with readily determinable values | |
| |
Investments in Tax CreditIncludes net impairment recoveries of $1 million, $469 thousand and Other Investments, Net
Depending on the ownership percentage and the influence the Company has on the investments in tax credit and other investments, net, the Company applies the equity or cost method of accounting, or the measurement alternative as elected under ASU 2016-01 for equity investments without readily determinable fair value.
The following table presents the Company’s investments in tax credit and other investments, net, and related unfunded commitments as of December 31, 2020 and 2019:
| | | | | | | | | | | | | | |
|
| ($ in thousands) | | December 31, |
| 2020 | | 2019 |
| Investments in tax credit and other investments, net | | $ | 266,525 | | | $ | 254,140 | |
| Accrued expenses and other liabilities — Unfunded commitments | | $ | 105,282 | | | $ | 113,515 | |
|
Amortization of tax credit and other investments was $70.1 million, $98.4 million, and $96.2$1 million for the years ended December 31, 2020, 20192023, 2022 and 2018,2021, respectively.
The Company held equity securities with readily determinable fair values of $31.3 million and $31.7 million, as of December 31, 2020 and 2019, respectively. These equity securities were CRA investments measured at fair value with changes in fair value recorded in net income. The Company recorded unrealized gains on these equity securities of $732 thousand for the year ended December 31, 2020, and unrealized gains of $789 thousand for the year ended December 31, 2019. Equity securities with readily determinable fair value were included in Investments in tax credit and other investments, net on the Consolidated Balance Sheet.
The Company held equity securities without readily determinable fair values totaling $23.7 million and $19.1 million as of December 31, 2020 and 2019, respectively, which were measured using the measurement alternative at cost less impairment and adjusted for observable price changes. The increase during 2020activity was primarily due to a $5.0 million purchase of 1 new security in the fourth quarter of 2020. For the year ended December 31, 2020, the Company recorded $360 thousand in OTTI charges related to these securities. NaN adjustments were made to these securities for the year ended December 31, 2019. Equity securities without readily determinable fair values were included in Investments inhistoric and/or energy tax credit and other investments, net and Other Assets on the Consolidated Balance Sheet.credits.
As of December 31, 2020,2023, the Company’s unfunded commitments related to investments in qualified affordable housing partnerships, tax credit and other investments, net are estimated to be funded as follows:
| | | ($ in thousands) | ($ in thousands) | | Amount |
| 2021 | | $ | 125,142 | |
| 2022 | | 37,175 | |
| 2023 | | 14,499 | |
| ($ in thousands) | |
| ($ in thousands) | |
| ($ in thousands) | |
| ($ in thousands) | |
| ($ in thousands) | |
| ($ in thousands) | |
| ($ in thousands) | |
| ($ in thousands) | | | Amount |
| 2024 | 2024 | | 2,034 | |
| 2025 | 2025 | | 462 | |
| 2026 | |
| 2027 | |
| 2028 | |
| Thereafter | Thereafter | | 3,414 | |
| Total | Total | | $ | 182,726 | |
|
Tax credit investments are evaluated for possible OTTI on an annual basis or when events or changes in circumstances suggest that the carrying amount of the tax credit investments may not be realizable. OTTI charges are recorded within Amortization of tax credit and other investments, net on the Consolidated Statement of Income. Refer to Note 2 — Fair Value Measurement and Fair Value of Financial Instruments to the Consolidated Financial Statements in this Form 10-K for a discussion on the Company’s impairment evaluation and monitoring process of tax credit investments. There were $4.8 million OTTI charges, offset by OTTI recoveries of $1.5 million recorded on the Company’s investments in tax credits and other investments, net, during the year ended December 31, 2020. Comparatively, there were $14.6 million in OTTI charges, offset by OTTI recoveries of $1.6 million recorded during the year ended December 31, 2019. The higher OTTI charges recorded during the year ended December 31, 2019 were primarily due to $5.4 million in net OTTI charges related to the Company’s investment in DC Solar and affiliates (“DC Solar”) discussed below.
The Company invested in 4 solar energy tax credit funds in the years 2014, 2015, 2017 and 2018 as a limited member. These tax credit funds engaged in the acquisition and leasing of mobile solar generators through DC Solar entities. These investments were recorded in Investments in tax credit and other investments, net on the Consolidated Balance Sheet and were accounted for under the equity method of accounting. DC Solar had its assets frozen in December 2018 and filed for bankruptcy protection in February 2019. In February 2019, an affidavit from a Federal Bureau of Investigation (“FBI”) special agent stated that DC Solar was operating a fraudulent “Ponzi-like scheme” and that the majority of the mobile solar generators sold to investors and managed by DC Solar, as well as the majority of the related lease revenues claimed to had been received by DC Solar might not have existed.
During 2019, the Company recorded $7.0 million OTTI charge on its remaining tax credit investment related to DC Solar, and subsequently recovered $1.6 million. During 2020, the Company further recorded $10.7 million in recoveries, of which $1.1 million was recorded as an impairment recovery. There were 0 balances in Accrued expenses and other liabilities — Unfunded commitments related to DC Solar as of both December 31, 2020 and 2019. Refer to Note 11 — Income Taxes to the Consolidated Financial Statements in this Form 10-K for a further discussion related to the impacts on the Company’s income tax expense related to the DC solar tax credit investments.
Variable Interest Entities
The Company investsmajority of both the investments in unconsolidated limitedaffordable housing partnerships and similartax credit and other investments discussed above are variable interest entities that construct, own and operate affordable housing, historic rehabilitation, wind and solar projects, of whichwhere the majority of such investments are VIEs. AsCompany is a limited partner in these partnerships, these investments are designed to generate a return primarily through the realization of federal tax credits and tax benefits. Anan unrelated third party is typically the general partner or managing member who has control over the significant activities of suchthese investments. While the Company’s interest in some of the investments may exceed 50% of the outstanding equity interests, the Company does not consolidate these structuresinvestments due to the general partnerpartner’s or managing member’s ability to manage the entity, which is indicative of the general partner’s or managing member’s power over them.the entity. The Company’s maximum exposure to loss in connection with these partnerships consistconsists of the unamortized investment balance and any tax credits claimed that may become subject to recapture.
Special purpose entities formed in connection with securitization transactions are generally considered VIEs. A CLO is a VIE that purchases a pool of assets consisting primarily of non-investment grade corporate loans, and issues multiple tranches of notes to investors to fund the asset purchases and pay upfront expenses associated with forming the CLO
Other Investments
.
The Company served asacquired a 49.99% equity interest in Rayliant during the collateralthird quarter of 2023. Rayliant is an asset manager specializing in asset allocation and investment in developed and emerging markets. This investment will expand the Bank’s wealth management business and provide its customers with additional access to institutional-quality investment management products and services. The investment in Rayliant is accounted for under the equity method of a CLO that closedaccounting and is included in 2019 and subsequently reassigned its portfolio manager responsibilities in 2020.Other assets on the Consolidated Balance Sheet. The Company had retainedpaid $95 million in cash and granted performance-based RSUs that are contingently issuable at vesting. The performance-based RSUs will vest on September 1, 2028 into a variable number of the top 3Company’s shares of common stock, ranging from 20% to 200% of the 349,138 shares initially underlying such performance-based RSUs, based on Rayliant’s achievement of certain financial performance targets during the future performance period. For additional information related to these equity contracts accounted for as derivative liability, refer to Note 2 — Fair Value Measurement and Fair Value of Financial Instruments and Note 5— Derivatives to the Consolidated Financial Statements in this Form 10-K. The carrying value of the Company's investment grade-rated tranches issued by the CLO, which the carrying amounts were $287.5in Rayliant was $109 millionand $284.7 million as of December 31, 20202023, of which $101 million was comprised of equity method goodwill.
The Company also held equity securities without readily determinable fair values totaling $146 million and 2019,$37 million as of December 31, 2023 and 2022, respectively. These equity securities without readily determinable fair values are included in Other Assets on the Consolidated Balance Sheet.
Note 8 — Goodwill and Other Intangible Assets
Goodwill
Total goodwill was $466 million as of both December 31, 2023 and 2022. The Company’s annual goodwill impairment testing wastest is performed annually, as of December 31, of each year, or more frequently as events occur or circumstances change that would more-likely-than-not reduce the fair value of a reporting unitsunit below its carrying value. The Company completed its annual goodwill impairment test as of December 31, 2023 by using a quantitative assessment, and concluded goodwill was not impaired. Additional information pertaining to ourthe Company’s accounting policy for goodwill is summarized in Note 1— Summary of Significant Accounting Policies -— Significant Accounting Policies — Goodwill and Other Intangible Assets. Due to the uncertain market conditions resulting from the COVID-19 pandemic, the Company had performed an interim goodwill impairment test as of March 31, 2020 and concluded that there was 0 impairment. We completed our annual goodwill impairment testing as of December 31, 2020. Based on the results of the annual goodwill impairment test, the Company determined there was 0 goodwill impairment.
The following table presents changesConsolidated Financial Statements in the carrying amount of goodwill by reporting units during the year ended December 31, 2019:
| | | | | | | | | | | | | | | | | | | | |
|
| ($ in thousands) | | Consumer
and
Business Banking | | Commercial
Banking | | Total |
| | | | | | |
| Beginning balance, January 1, 2019 | | $ | 353,321 | | | $ | 112,226 | | | $ | 465,547 | |
| | | | | | |
| Acquisition of East West Markets, LLC | | 0 | | | 150 | | | 150 | |
| Ending balance, December 31, 2019 | | $ | 353,321 | | | $ | 112,376 | | | $ | 465,697 | |
|
There were 0 changes in the carrying amount of goodwill during the year ended December 31, 2020.
Core Deposit Intangibles
The following table presents the gross carrying amount of core deposit intangible and accumulated amortization as of December 31, 2020 and 2019:
| | | | | | | | | | | | | | |
|
| ($ in thousands) | | December 31, |
| 2020 | | 2019 |
Gross balance (1) | | $ | 86,099 | | | $ | 86,099 | |
Accumulated amortization (1) | | (79,722) | | | (76,088) | |
Net carrying balance (1) | | $ | 6,377 | | | $ | 10,011 | |
|
(1) Excludes fully amortized core deposit intangible assets.
There were 0 impairment write-downs on core deposit intangibles for the years ended December 31, 2020, 2019 and 2018.
Amortization Expense
The Company amortizes the core deposit intangibles based on the projected useful lives of the related deposits. The amortization expense related to the core deposit intangible assets was $3.6 million, $4.5 million and $5.5 million for the years ended December 31, 2020, 2019 and 2018, respectively. The following table presents the estimated future amortization expense of core deposit intangibles as of December 31, 2020:
| | | | | | | | |
|
| ($ in thousands) | | Amount |
| 2021 | | $ | 2,749 | |
| 2022 | | 1,865 | |
| 2023 | | 1,199 | |
| 2024 | | 553 | |
| 2025 | | 11 | |
| Thereafter | | 0 | |
| Total | | $ | 6,377 | |
|
Note 9 — Deposits
The following table presents the composition of the Company’s deposits as of December 31, 20202023 and 2019:2022:
| | | ($ in thousands) | | December 31, |
| | | December 31, | |
| | December 31, | |
| | December 31, | |
| | December 31, | |
| | December 31, | |
| | December 31, | |
| | December 31, | |
| | December 31, | |
| | December 31, | |
| | December 31, | |
| | December 31, | |
| | December 31, | |
| | December 31, | |
| | December 31, | |
| ($ in thousands) | ($ in thousands) | | 2020 | | 2019 | ($ in thousands) | | 2023 | | 2022 |
| | Noninterest-bearing demand | Noninterest-bearing demand | | $ | 16,298,301 | | | $ | 11,080,036 | |
| Noninterest-bearing demand | |
| Noninterest-bearing demand | |
| Interest-bearing checking | Interest-bearing checking | | 6,142,193 | | | 5,200,755 | |
| Money market | Money market | | 10,740,667 | | | 8,711,964 | |
| Savings | | 2,681,242 | | | 2,117,196 | |
| Time deposits: | | | |
| Less than $100,000 | | 999,664 | | | 1,993,950 | |
| $100,000 or greater | | 8,000,685 | | | 8,220,358 | |
| Savings: | |
| Domestic office | |
| Domestic office | |
| Domestic office | |
| Foreign office | |
Time deposits (1): | |
| Domestic office | |
| Domestic office | |
| Domestic office | |
| Foreign office | |
| | Total deposits | Total deposits | | $ | 44,862,752 | | | $ | 37,324,259 | |
| | | Total deposits | |
| | Total deposits | |
|
The aggregate amount of domestic time deposits that meetmet or exceedexceeded the current Federal Deposit Insurance Corporation (“FDIC”)deposit insurance limit of $250,000 was $5.78$13.6 billion and $5.44$10.6 billion as of December 31, 20202023 and 2019,2022, respectively. As of December 31, 2020 and 2019, the aggregate amount of foreign office time deposits, including both Hong Kong and China that meet or exceed the current FDIC insurance limit of $250,000 was $823.2 million and $1.19 billion, respectively.
As of December 31, 2020, $696.1 million of interest-bearing demand deposits and $840.7 million of time deposits were held by the Company’s branch in Hong Kong and subsidiary bank in China. In comparison, $493.4 million of interest-bearing demand deposits and $1.21 billion of time deposits were held by the Company’s branch in Hong Kong and subsidiary bank in China as of December 31, 2019.
The following table presents the scheduled maturities of time deposits for the five years succeeding December 31, 2020 and thereafter:2023:
| | | ($ in thousands) | ($ in thousands) | | Amount |
| 2021 | | $ | 8,608,547 | |
| 2022 | | 332,809 | |
| 2023 | | 41,178 | |
| ($ in thousands) | |
| ($ in thousands) | |
| ($ in thousands) | |
| ($ in thousands) | |
| ($ in thousands) | |
| ($ in thousands) | |
| ($ in thousands) | |
| ($ in thousands) | | | Amount |
| 2024 | 2024 | | 11,085 | |
| 2025 | 2025 | | 6,715 | |
| Thereafter | | 15 | |
| 2026 | |
| 2027 | |
| 2028 | |
| | Total | |
| Total | |
| Total | Total | | $ | 9,000,349 | |
|
Note 10 — Federal Home Loan Bank AdvancesShort-Term Borrowings and Long-Term Debt
The following table presents the balancedetails of the Company’s junior subordinated debt and FHLB advancesshort-term borrowings as of December 31, 20202023 and 2019, and the related contractual rates and maturity dates as of December 31, 2020:2022,
| | | | | | | | | | | | | | | | | | | | | | | | | | | | |
|
| ($ in thousands) | | | |
Interest Rate | | Maturity Dates | | December 31, |
| | | | | 2020 | | 2019 |
| | | | | Amount | | Amount |
| Parent Company | | | | | | | | | | |
Junior subordinated debt (1 ) — floating | | | | 1.57% — 2.12% | | 2034 — 2037 | | $ | 147,376 | | | $ | 147,101 | |
| Bank | | | | | | | | | | |
FHLB advances (2): | | | | | | | | | | |
| Fixed | | | | 0.00% — 2.34% | | 2021 | | 405,000 | | | 400,000 | |
Floating (3) | | | | 0.60% — 0.63% | | 2022 | | 247,612 | | | 345,915 | |
| Total FHLB advances | | | | | | | | $ | 652,612 | | | $ | 745,915 | |
|
| | | | | | | | | | | | | | | | | | | | | | | | | | | | |
|
| | | | | | | | December 31, |
| | | | | | | | 2023 | | 2022 |
| ($ in thousands) | | | | Interest Rate | | Maturity Dates | | Amount | | Amount |
| Parent company | | | | | | | | | | |
Junior subordinated debt (1 ) — floating (2) | | | | 7.00% — 7.55% | | 2034 — 2037 | | $ | 148,249 | | | $ | 147,950 | |
| Bank | | | | | | | | | | |
| Short-term borrowings | | | | 4.37% | | 3/19/2024 | | $ | 4,500,000 | | | $ | — | |
| | | | | | | | | | |
| | | | | | | | | | |
| | | | | | | | | | |
|
(1)The weighted-average contractual interest rates for junior subordinated debt were 2.26%6.87% and 3.98%3.49% as of December 31, 20202023 and 2019,2022, respectively.
(2)During the third quarter of 2023, all junior subordinated debt that referenced London Interbank Offered Rate transitioned to a Secured Overnight Financing Rate (“SOFR”)-based replacement rate plus the applicable stated margin.
Short-Term Borrowings — Bank Term Funding Program
As of December 31, 2023 , the Company’s short-term borrowings consisted of funds from the Bank Term Funding Program (“BTFP”), which was designed by the Federal Reserve to provide additional liquidity to U.S. depository institutions. The weighted-average contractual interest ratesadvances are limited to the par value of eligible collateral pledged by the borrower, for FHLBa term of up to one year. U.S. federally insured depository institutions can request advances under the BTFP until at least March 11, 2024.
The Company pledged eligible U.S. government agency and U.S. government-sponsored enterprise debt and mortgage-backed securities, and U.S. Treasury securities as collateral for the borrowings under the BTFP. As of December 31, 2023, the carrying amount of the Company’s pledged securities to the BTFP totaled $4.3 billion with a remaining borrowing capacity of $121 million. In comparison, there were 1.77% and 2.19%no short-term borrowings as of December 31, 2020 and 2019, respectively.
(3)Floating interest rates reset monthly or quarterly based on LIBOR.
FHLB Advances
The Bank’s available borrowing capacity from FHLB advances totaled $6.33 billion and $6.83 billion as of December 31, 2020 and 2019, respectively. The Bank’s available borrowing capacity from the FHLB is derived from its portfolio of loans that are pledged to the FHLB reduced by its outstanding FHLB advances. As of December 31, 2020 and 2019, all advances were secured by real estate loans.2022.
Long-Term Debt — Junior Subordinated Debt
As of December 31, 2020,2023, East West has 6had six statutory business trusts for the purpose of issuing junior subordinated debt to third party investors. The junior subordinated debt was issued in connection with the East West’s various pooled trust preferred securities offerings. The Trusts issued both fixed and variable rate capital securities, representing undivided preferred beneficial interests in the assets of the Trusts, to third party investors. East West is the owner of all the beneficial interests represented by the common securities of the Trusts. The junior subordinated debt is recorded as a component of long-term debt and includes the value of the common stock issued by 6six of East West’s wholly ownedwholly-owned subsidiaries in conjunction with these transactions. The common stock is recorded in Other assets on the Consolidated Balance Sheet for the amount issued in connection with these junior subordinated debt issuances. The proceeds from these issuances represent liabilities of East West to the Trusts and are reported on the Consolidated Balance Sheet as a component of Long-term debt.on the Consolidated Balance Sheet. Interest payments on these securities are madedisbursed quarterly and are deductible for tax purposes.
The following table presents the outstanding junior subordinated debt issued by each trust as of December 31, 20202023 and 2019:2022:
| | | Issuer | | Stated
Maturity (1) | | Stated
Interest Rate | | Current Rate | | December 31, 2020 | | December 31, 2019 |
| | | | | | | | | December 31, 2023 | |
| | | | | | | | December 31, 2023 | |
| | | | | | | | December 31, 2023 | |
| | | | | | | | December 31, 2023 | |
| | | | | | | | December 31, 2023 | |
| | | | | | | | December 31, 2023 | |
| | | | | | | | December 31, 2023 | |
| | | | | | | | December 31, 2023 | |
| | | | | | | | December 31, 2023 | |
| | | | | | | | December 31, 2023 | |
| | | | | | | | December 31, 2023 | |
| | | | | | | | December 31, 2023 | |
| | | | | | | | December 31, 2023 | |
| | | | | | | | December 31, 2023 | |
| | | | | | | | December 31, 2023 | |
| | | | | | | | December 31, 2023 | |
| | | | | | | | December 31, 2023 | |
| | | | | | | | December 31, 2023 | |
| | | | | | | | December 31, 2023 | |
| | | | | | | | December 31, 2023 | |
| | | | | | | | December 31, 2023 | |
| | | | | | | | December 31, 2023 | |
| | | | | | | | December 31, 2023 | |
| | | | | | | | December 31, 2023 | |
| | | | | | | | December 31, 2023 | |
| | | | | | | | December 31, 2023 | |
| | | | | | | | December 31, 2023 | |
| | | | | | | | December 31, 2023 | |
| | | | | | | | December 31, 2023 | |
| | | | | | | | December 31, 2023 | |
| | | | | | | | December 31, 2023 | |
| | | | | | | | December 31, 2023 | |
| | | | | | | | December 31, 2023 | |
| | | | | | | | December 31, 2023 | |
| | | | | | | | December 31, 2023 | |
| | | | | | | | December 31, 2023 | |
| | | | | | | | December 31, 2023 | |
| | | | | | | | December 31, 2023 | |
| | | | | | | | December 31, 2023 | |
| | | | | | | | December 31, 2023 | |
| | | | | | | | December 31, 2023 | |
| | | | | | | | December 31, 2023 | |
| | | | | | | | December 31, 2023 | |
| | | | | | | | December 31, 2023 | | | December 31, 2022 |
| Issuer | Issuer | | Stated
Maturity (1) | | Stated
Interest Rate | | Current Rate | | Aggregate
Principal
Amount of
Trust
Securities | | Aggregate
Principal
Amount of
the Junior
Subordinated
Debts | | Aggregate
Principal
Amount of
Trust
Securities | | Aggregate
Principal
Amount of
the Junior
Subordinated
Debts | Issuer | | Stated Maturity (1) | | Stated Interest Rate | | Current Rate | | Aggregate Principal Amount of Trust Securities | | Aggregate Principal Amount of the Junior Subordinated Debt | | Aggregate Principal Amount of Trust Securities | | Aggregate Principal Amount of the Junior Subordinated Debt |
| | East West Capital Trust V | |
| East West Capital Trust V | |
| East West Capital Trust V | East West Capital Trust V | | November 2034 | | 3-month LIBOR + 1.80% | | 2.01% | | $ | 464 | | | $ | 15,000 | | | $ | 464 | | | $ | 15,000 | |
| East West Capital Trust VI | East West Capital Trust VI | | September 2035 | | 3-month LIBOR + 1.50% | | 1.72% | | 619 | | | 20,000 | | | 619 | | | 20,000 | |
| East West Capital Trust VII | East West Capital Trust VII | | June 2036 | | 3-month LIBOR + 1.35% | | 1.57% | | 928 | | | 30,000 | | | 928 | | | 30,000 | |
| East West Capital Trust VIII | East West Capital Trust VIII | | June 2037 | | 3-month LIBOR + 1.40% | | 1.63% | | 619 | | | 18,000 | | | 619 | | | 18,000 | |
| East West Capital Trust IX | East West Capital Trust IX | | September 2037 | | 3-month LIBOR + 1.90% | | 2.12% | | 928 | | | 30,000 | | | 928 | | | 30,000 | |
| MCBI Statutory Trust I | MCBI Statutory Trust I | | December 2035 | | 3-month LIBOR + 1.55% | | 1.77% | | 1,083 | | | 35,000 | | | 1,083 | | | 35,000 | |
| Total | Total | | $ | 4,641 | | | $ | 148,000 | | | $ | 4,641 | | | $ | 148,000 | |
|
(1)All the aboveThe debt instruments above mature in more than five years after December 31, 20202023 and are subject to call options where early redemption requires appropriate notice.
Note 11 — Income Taxes
The following table presents the components of income tax expense/benefitexpense (benefit) for the years ended December 31, 2020, 20192023, 2022 and 2018:2021:
| | | ($ in thousands) | | Year Ended December 31, |
| | | Year Ended December 31, | |
| | Year Ended December 31, | |
| ($ in thousands) | ($ in thousands) | | 2020 | | 2019 | | 2018 | ($ in thousands) | | 2023 | | 2022 | | 2021 |
| | Federal | |
| Federal | |
| Federal | Federal | | $ | 84,560 | | | $ | 107,393 | | | $ | 63,035 | |
| State | State | | 74,252 | | | 86,578 | | | 64,917 | |
| Foreign | Foreign | | 671 | | | (2,485) | | | 3,513 | |
| Total current income tax expense | Total current income tax expense | | 159,483 | | | 191,486 | | | 131,465 | |
| Deferred income tax (benefit) expense: | Deferred income tax (benefit) expense: | | | | | | |
| Federal | Federal | | (28,093) | | | (8,801) | | | (11,870) | |
| Federal | |
| Federal | |
| State | State | | (11,671) | | | (16,390) | | | (4,600) | |
| Foreign | Foreign | | (1,751) | | | 3,587 | | | 0 | |
| Total deferred income tax benefit | | (41,515) | | | (21,604) | | | (16,470) | |
| Total deferred income tax (benefit) expense | |
| Income tax expense | Income tax expense | | $ | 117,968 | | | $ | 169,882 | | | $ | 114,995 | |
|
The following table presents the reconciliation of the federal statutory rate to the Company’s effective tax rate for the years ended December 31, 2020, 20192023, 2022 and 2018:2021:
| | | | Year Ended December 31, |
| 2020 | | 2019 | | 2018 |
| | Year Ended December 31, | |
| | Year Ended December 31, | |
| | Year Ended December 31, | |
| | 2023 | | | | 2023 | | 2022 | | 2021 |
| Statutory U.S. federal tax rate | Statutory U.S. federal tax rate | | 21.0 | % | | 21.0 | % | | 21.0 | % | Statutory U.S. federal tax rate | | 21.0 | % | | 21.0 | % | | 21.0 | % |
| U.S. state income taxes, net of U.S. federal income tax effect | U.S. state income taxes, net of U.S. federal income tax effect | | 7.2 | | | 7.1 | | | 5.8 | |
| | Tax credits and benefits, net of related expenses | Tax credits and benefits, net of related expenses | | (12.4) | | | (6.8) | | | (12.7) | |
| Tax credits and benefits, net of related expenses | |
| Tax credits and benefits, net of related expenses | |
| Other, net | Other, net | | 1.4 | | | (1.2) | | | (0.1) | |
| Effective tax rate | Effective tax rate | | 17.2 | % | | 20.1 | % | | 14.0 | % | Effective tax rate | | 20.5 | % | | 20.1 | % | | 17.4 | % |
|
Income tax expense was $118.0 million, andThe following table summarizes the effective tax rate was 17.2% for the year ended December 31, 2020, compared with income tax expense of $169.9 million, and an effective tax rate of 20.1% for the year ended December 31, 2019. Income tax expense was $115.0 million and the effective tax rate was 14.0% for the year ended December 31, 2018. For the year ended December 31, 2020, income tax expense included $5.1 million in uncertain tax position related to the Company’s investment in DC Solar. The higher effective tax rate for the year ended December 31, 2019 was primarily due to $30.1 million of additional income tax expense recorded to reverse certain previously claimed tax credits related to the Company’s investment in DC Solar.
The tax effects of temporary differences that give rise to a significant portion of deferred tax assets and liabilities as of December 31, 20202023 and 2019 are presented below:2022:
| | | ($ in thousands) | | | December 31, |
| | | | | | | | | | December 31, | |
| | | | | | | | | December 31, | |
| ($ in thousands) | ($ in thousands) | | | 2020 | | | 2019 | ($ in thousands) | | | | | | | | 2023 | | | | | | | | 2022 |
| | Deferred tax assets: | Deferred tax assets: | | | | | | |
| Allowance for loan losses | | | $ | 192,534 | | | | $ | 109,903 | |
| Deferred tax assets: | |
| Deferred tax assets: | |
| Allowance for credit losses and nonperforming assets valuation allowance | |
| Allowance for credit losses and nonperforming assets valuation allowance | |
| Allowance for credit losses and nonperforming assets valuation allowance | |
| Investments in qualified affordable housing partnerships, tax credit and other investments, net | Investments in qualified affordable housing partnerships, tax credit and other investments, net | | | 11,174 | | | | 11,190 | |
| Deferred compensation | | | 23,604 | | | | 23,816 | |
| Stock compensation and other accrued compensation | |
| Interest income on nonaccrual loans | Interest income on nonaccrual loans | | | 5,909 | | | | 9,527 | |
| State taxes | State taxes | | | 273 | | | | 5,848 | |
| Net unrealized losses on debt securities and derivatives | |
| | Premises and equipment | |
| Premises and equipment | |
| Premises and equipment | |
| Lease liabilities | |
| FDIC special assessment charge | |
| Other | |
| Total deferred tax assets | |
| | Premises and equipment | | | 2,096 | | | | 1,578 | |
| Deferred tax liabilities: | |
| | Lease liability | | | 30,554 | | | | 35,948 | |
| Other | | | 1,441 | | | | 965 | |
| Total gross deferred tax assets | | | 267,585 | | | | 198,775 | |
| Valuation allowance | | | 0 | | | | (21) | |
| Total deferred tax assets, net of valuation allowance | | | $ | 267,585 | | | | $ | 198,754 | |
| Deferred tax liabilities: | |
| | Deferred tax liabilities: | Deferred tax liabilities: | | | | | | |
| Equipment lease financing | Equipment lease financing | | | $ | 29,990 | | | | $ | 30,669 | |
| Equipment lease financing | |
| Equipment lease financing | |
| Investments in qualified affordable housing partnerships, tax credit and other investments, net | Investments in qualified affordable housing partnerships, tax credit and other investments, net | | | 14,912 | | | | 12,301 | |
| Core deposit intangibles | | | 1,934 | | | | 3,032 | |
| | FHLB stock dividends | |
| FHLB stock dividends | |
| FHLB stock dividends | FHLB stock dividends | | | 1,855 | | | | 1,854 | |
| Mortgage servicing assets | Mortgage servicing assets | | | 1,675 | | | | 1,839 | |
| Acquired debt | | | 1,597 | | | | 1,679 | |
| Acquired debts | |
| Prepaid expenses | Prepaid expenses | | | 1,194 | | | | 1,100 | |
| | Premises and equipment | | | 99 | | | | 1,890 | |
| Unrealized gains/losses on securities | | | 21,593 | | | | 890 | |
| | Operating lease right-of-use assets | |
| | Operating lease right-of-use assets | |
| | Operating lease right-of-use assets | Operating lease right-of-use assets | | | 28,468 | | | | 34,313 | |
| Other | Other | | | 453 | | | | 2,700 | |
| Total gross deferred tax liabilities | | | $ | 103,770 | | | | $ | 92,267 | |
| Total deferred tax liabilities | |
| Net deferred tax assets | Net deferred tax assets | | | $ | 163,815 | | | | $ | 106,487 | |
|
The tax benefitsAs of deductible temporary differencesboth December 31, 2023 and tax carryforwards are recorded as an asset to2022, the extentCompany concluded that management assesses the utilization of such temporary differences and carryforwards to be more-likely-than-not. Ano valuation allowance is used, as needed,was necessary to reduce the deferred tax assets to the amount that is more-likely-than-not to be realized. Evidence the Company considers includes the Company’s ability to generatesince estimated future taxable income implement tax-planning strategies (as defined in ASC 740,will be sufficient to utilize these assets. For further information on the Company’s valuation policy on deferred taxes, see Note 1— Summary of Significant Accounting Policies — Significant Accounting Policies — Income Taxes), and utilize taxable income from prior carryback years (if such carryback is permitted under the applicable tax law), as well as future reversals of existing taxable temporary differences. The Company expects to have sufficient taxable income in future years to fully realize its deferred tax assets. The Company also performed an overall assessment by weighing all positive evidence against all negative evidence and concluded that it is more-likely-than-not that all of the benefits of the deferred tax assets will be realized, with the exception of the deferred tax assets related to certain state net operating losses (“NOL”) carryforwards. As of December 31, 2020, management released $21 thousand of valuation allowance provided as of December 31, 2019, which related to the state NOL carryforwards. NaN additional valuation allowance was recorded as of December 31, 2020.Consolidated Financial Statements in this Form 10-K.
The following table presents a reconciliation of the beginning and ending amountsbalances of unrecognized tax benefits for the years ended December 31, 2020, 20192023, 2022 and 2018:2021:
| | | ($ in thousands) | | Year Ended December 31, |
| | | Year Ended December 31, | |
| | Year Ended December 31, | |
| | Year Ended December 31, | |
| | Year Ended December 31, | |
| | Year Ended December 31, | |
| | Year Ended December 31, | |
| | Year Ended December 31, | |
| | Year Ended December 31, | |
| | Year Ended December 31, | |
| | Year Ended December 31, | |
| | Year Ended December 31, | |
| | Year Ended December 31, | |
| | Year Ended December 31, | |
| | Year Ended December 31, | |
| | Year Ended December 31, | |
| | Year Ended December 31, | |
| | Year Ended December 31, | |
| | Year Ended December 31, | |
| | Year Ended December 31, | |
| | Year Ended December 31, | |
| ($ in thousands) | ($ in thousands) | | 2020 | | 2019 | | 2018 | ($ in thousands) | | 2023 | | 2022 | | 2021 |
| $ | 0 | | | $ | 4,378 | | | $ | 10,419 | |
| Additions for tax positions related to prior years | Additions for tax positions related to prior years | | 5,045 | | | 30,103 | | | 0 | |
| Deductions for tax positions related to prior years | | 0 | | | (34,481) | | | (3,969) | |
| | Additions for tax positions related to current year | |
| Additions for tax positions related to current year | |
| Additions for tax positions related to current year | |
| Settlements with taxing authorities | Settlements with taxing authorities | | 0 | | | 0 | | | (2,072) | |
| Ending balance | Ending balance | | $ | 5,045 | | | $ | 0 | | | $ | 4,378 | |
|
(1)In 2022, the Company settled an issue regarding previously claimed tax credits related to DC Solar and affiliates.
The Company believes that adequate provisions have been recorded for all income tax uncertainties consistent with the standards of ASC 740-10. The increase in unrecognized tax benefits for the year ended December 31, 2020 was mainly attributable to the additional income expenses recorded related to DC Solar investments, as well as a minor state adjustment. The Company recognizes interest and penalties, as applicable, related to the underpayment of income taxes as a component of Income tax expense on the Consolidated Statement of Income. The Company recorded a chargeamount of $564 thousand of interest for the year ended December 31, 2020. In comparison, a reversal of $6.3 million and $2.0 million ofnet interest and penalties related to unrecognized tax benefits was recordedimmaterial for the years ended December 31, 2019 and 2018, respectively. Total accrued interest included in Accrued expenses and other liabilities on the Consolidated Balance Sheet was $564 thousand as of December 31, 2020. There was 0 liability for accrued interest and penalties as of December 31, 2019.all periods presented.
The Company files federal income tax year, thereturns, as well as returns in various state and foreign jurisdictions. We are routinely examined by tax authorities in these various jurisdictions. The Company has executed a Memorandum of Understanding (“MOU”) with the Internal Revenue Service (“IRS”)is subject to voluntarily participate in the IRS Compliance Assurance Process (“CAP”). Under the CAP, the IRS auditsfederal income tax examination for the tax position of the Company to identifyyears 2020 and resolve any tax issues that may arise throughout the tax year. The objective of the CAP is to resolve issues in a timely and contemporaneous manner and eliminate the need for a lengthy post-filing examination. The Company has executed a MOU with the IRS for the 2019 tax year. For federal tax purposes, the IRS had completed the 2017 and earlier tax years’ corporate income tax return examination. For the 2020 tax year, the Company was accepted by IRS as a CAP Bridge Year.forward. The Company is also currently being audited bysubject to tax examination in various state and local jurisdictions for the state of Missouritax years 2017 and California and the City of New York.forward. The Company does not believe that the outcome of unresolved issues or claims in any of the tax jurisdictionjurisdictions is likely to be material toon the Company’s financial position, cash flows or results of operations.Consolidated Financial Statements. The Company believes that adequate provisions have been recorded for all income tax uncertainties consistent with ASC 740, Income Taxes as of December 31, 2020.
Impact of Investment in DC Solar Tax Credit Funds
Investors in DC Solar funds, including the Company, received tax credits for making renewable energy investments. The Company’s investments in the DC Solar tax credit funds qualified for federal energy tax credit under Section 48 of the Internal Revenue Code of 1986, as amended. The Company also received a “should” level legal opinion from an external law firm supporting the legal structure of the investments for tax credit purposes. Between fiscal year 2014 and 2018, the Company had invested in 4 DC Solar energy tax credit funds and claimed tax credits of approximately $53.9 million, partially reduced by a deferred tax liability of $5.7 million related to the 50% tax basis reduction, for a net impact of $48.2 million to the Consolidated Financial Statements.
ASC 740-10-25-6 states in part, that an entity shall initially recognize the financial statement effects of a tax position when it is more-likely-than-not, based on the technical merits, that the position will be sustained upon examination. The term “more-likely-than-not” means a likelihood of more than 50 percent; the terms “examined” and “upon examination” include resolution of the related appeals or litigation processes, if any. The level of evidence that is necessary and appropriate to support the technical merits of a tax position is subject to judgment and depends on available information as of the balance sheet date. A subsequent measurement of a tax position is based on management’s best judgment given the facts, circumstances and information available at the latest quarterly reporting date. A change in judgment that results in a subsequent derecognition or change in measurement of a tax position is recognized as a discrete item in the period in which the change occurs.
In February 2019, an affidavit from a FBI special agent stated that DC Solar was operating a fraudulent “Ponzi-like scheme” and that the majority of the mobile solar generators sold to investors and managed by DC Solar, as well as the majority of the related lease revenues claimed to have been received by DC Solar might not have existed. The Company, in coordination with other fund investors, engaged an unaffiliated third-party inventory firm to investigate the actual number of mobile solar generators in existence. Based on the inventory report, NaN of the mobile service generators that had been purchased by the Company’s 2017 and 2018 tax credit funds were found. On the other hand, a vast majority of the mobile solar generators purchased by the Company’s 2014 and 2015 tax credit funds were found. Based on the inventory information, as well as management’s best judgments regarding the future settlement of the related tax positions with the IRS, the Company concluded that a portion of the previously claimed tax credits would be recaptured. During the year ended December 31, 2019, the Company reversed $33.6 million out of the $53.9 million previously claimed tax credits, and $3.5 million out of the $5.7 million deferred tax liability, resulting in $30.1 million of additional income tax expense. In December 2020, the Company recorded an additional $5.1 million income tax expense regarding DC Solar investments.
The Company continues to conduct an ongoing investigation related to this matter. For further discussion related to the Company’s investment in DC Solar and the Company’s impairment evaluation and monitoring process in tax credit investments, refer to Note 7 — Investments in Qualified Affordable Housing Partnerships, Tax Credit and Other Investments, Net and Variable Interest Entities and Note 2 — Fair Value Measurement and Fair Value of Financial Instruments to the Consolidated Financial Statements in this Form 10-K.2023.
Note 12 — Commitments Contingencies and Related Party TransactionsContingencies
Commitments to Extend Credit — In the ordinarynormal course of business, the Company provides customers loan commitments and letters of credit to customers on predetermined terms. These outstanding commitments to extend credit are not reflected in the accompanying Consolidated Financial Statements. While the Company does not anticipate losses as a result offrom these transactions, commitments to extend credit are included in determining the appropriate level of the allowance for unfunded credit commitments, and outstanding commercial and SBLCs.commitments.
The following table presents the Company’s credit-related commitments as of December 31, 20202023 and 2019:2022:
| | | ($ in thousands) | | December 31, |
| 2020 | | 2019 |
| | | December 31, | |
| | December 31, | |
| | December 31, | |
| | December 31, | |
| | December 31, | |
| | December 31, | |
| | December 31, | |
| | December 31, | |
| | December 31, | |
| | December 31, | |
| | December 31, | |
| | December 31, | |
| | December 31, | |
| | December 31, | |
| | December 31, | |
| | December 31, | |
| | December 31, | |
| | December 31, | |
| | December 31, | |
| | December 31, | |
| | December 31, | |
| | December 31, | |
| | December 31, | |
| | December 31, | |
| | December 31, | |
| | December 31, | |
| | December 31, | |
| | December 31, | |
| | December 31, | |
| | December 31, | |
| | December 31, | |
| | December 31, | |
| | December 31, | |
| | December 31, | |
| | December 31, | |
| | December 31, | |
| | December 31, | |
| | December 31, | |
| | 2023 | | | | 2023 | | 2022 |
| ($ in thousands) | ($ in thousands) | | Expire in One Year or Less | | Expire After One Year Through Three Years | | Expire After Three Years Through
Five Years | | Expire After Five Years | | Total | | Total | ($ in thousands) | | Expire in One Year or Less | | Expire After One Year Through Three Years | | Expire After Three Years Through Five Years | | Expire After Five Years | | Total | | Total |
| $ | 3,126,551 | | | $ | 1,836,523 | | | $ | 589,114 | | | $ | 138,729 | | | $ | 5,690,917 | | | $ | 5,330,211 | |
| 1,159,357 | | | 420,222 | | | 137,394 | | | 523,840 | | | 2,240,813 | | | 1,860,414 | |
| Total | Total | | $ | 4,285,908 | | | $ | 2,256,745 | | | $ | 726,508 | | | $ | 662,569 | | | $ | 7,931,730 | | | $ | 7,190,625 | |
| | |
Loan commitments are agreements to lend to customers provided there are no violations of any conditions established in the agreement. Commitments generally have fixed expiration dates or other termination clauses and may require maintenance of compensatory balances.commitment fees. Since many of the commitments are expected to expire without being drawn upon, the total commitment amounts do not necessarily represent future funding requirements.
Commercial letters of credit are issued to facilitate domestic and foreign trade transactions, while SBLCs are generally contingent upon the failure of the customers to perform according to the terms of the underlying contract with the third party. As a result, the total contractual amounts do not necessarily represent future funding requirements. The Company’s historical experience is that SBLCs typically expire without being funded. Additionally, in many cases, the Company holds collateral in various forms against these SBLCs. As part of its risk management activities, the Company monitors the creditworthiness of customers in conjunction with its SBLC exposure. Customers are obligated to reimburse the Company for any payment made on the customers’ behalf. If the customers fail to pay, the Company would, as applicable, liquidate the collateral and/or offset existing accounts. As of December 31, 2020,2023, total letters of credit of $2.24$2.6 billion consisted of SBLCs of $2.12$2.6 billion and commercial letters of credit of $124.9$24 million. In comparison, as of December 31, 2022, total letters of credit of $1.86$2.3 billion consisted of SBLCs of $1.81$2.3 billion and commercial letters of credit of $48.5 million as$22 million. As of both December 31, 2019.2023 and 2022, substantially all SBLCs were graded “Pass” using the Bank’s internal credit risk rating system.
The Company applies the same credit underwriting criteria to extend loans, commitments and conditional obligations to customers. Each customer’s creditworthiness is evaluated on a case-by-case basis. Collateral and financial guarantees may be obtained based on management’s assessment of a customer’s credit.credit risk. Collateral may include cash, accounts receivable, inventory, personal property, plant and equipment, and income-producing commercialreal estate property.
Estimated exposure to loss from these commitments is included in the allowance for unfunded credit commitments, and amounted to $33.5$38 million and $11.1$26 million as of December 31, 20202023 and 2019.2022, respectively.
Guarantees — TheFrom time to time, the Company sells or securitizes single-family and multifamily residential loans with recourse in the ordinary course of business. The recourse component of the loans sold or securitized with recourse is considered a guarantee. As the guarantor, the Company is obligated to repurchase up to the recourse component of the loans if the loans default. The following table presents the typescarrying amounts of guaranteesloans sold or securitized with recourse and the Company had outstandingmaximum potential future payments as of December 31, 20202023 and 2019:2022:
| | | ($ in thousands) | | Maximum Potential Future Payments | | Carrying Value |
| December 31, | | December 31, |
| 2020 | | 2019 | | 2020 | | 2019 |
| | | Maximum Potential Future Payments | |
| | Maximum Potential Future Payments | |
| | Maximum Potential Future Payments | |
| | Maximum Potential Future Payments | |
| | Maximum Potential Future Payments | |
| | Maximum Potential Future Payments | |
| | Maximum Potential Future Payments | |
| | Maximum Potential Future Payments | |
| | Maximum Potential Future Payments | |
| | Maximum Potential Future Payments | |
| | Maximum Potential Future Payments | |
| | Maximum Potential Future Payments | |
| | Maximum Potential Future Payments | |
| | Maximum Potential Future Payments | |
| | Maximum Potential Future Payments | |
| | Maximum Potential Future Payments | |
| | Maximum Potential Future Payments | |
| | Maximum Potential Future Payments | |
| | Maximum Potential Future Payments | |
| | Maximum Potential Future Payments | |
| | Maximum Potential Future Payments | |
| | Maximum Potential Future Payments | |
| | Maximum Potential Future Payments | |
| | Maximum Potential Future Payments | |
| | Maximum Potential Future Payments | |
| | Maximum Potential Future Payments | |
| | Maximum Potential Future Payments | |
| | Maximum Potential Future Payments | |
| | Maximum Potential Future Payments | |
| | Maximum Potential Future Payments | |
| | Maximum Potential Future Payments | |
| | Maximum Potential Future Payments | |
| | Maximum Potential Future Payments | |
| | Maximum Potential Future Payments | |
| | Maximum Potential Future Payments | |
| | Maximum Potential Future Payments | |
| | Maximum Potential Future Payments | |
| | Maximum Potential Future Payments | |
| | Maximum Potential Future Payments | |
| | Maximum Potential Future Payments | |
| | Maximum Potential Future Payments | |
| | Maximum Potential Future Payments | |
| | Maximum Potential Future Payments | |
| | Maximum Potential Future Payments | |
| | Maximum Potential Future Payments | |
| | Maximum Potential Future Payments | |
| | Maximum Potential Future Payments | |
| | Maximum Potential Future Payments | |
| | Maximum Potential Future Payments | |
| | Maximum Potential Future Payments | | | Carrying Value |
| | December 31, | | | | December 31, | | December 31, |
| | 2023 | | | | 2023 | | 2022 | | 2023 | | 2022 |
| ($ in thousands) | ($ in thousands) | | Expire in One Year or Less | | Expire After One Year Through Three Years | | Expire After Three Years Through
Five Years | | Expire After Five Years | | Total | | Total | | Total | | Total | ($ in thousands) | | Expire in One Year or Less | | Expire After One Year Through Three Years | | Expire After Three Years Through Five Years | | Expire After Five Years | | Total | | Total |
| $ | 0 | | | $ | 344 | | | $ | 484 | | | $ | 9,698 | | | $ | 10,526 | | | $ | 12,578 | | | $ | 10,526 | | | $ | 12,578 | |
| 370 | | | 481 | | | 0 | | | 14,894 | | | 15,745 | | | 15,892 | | | 26,619 | | | 40,708 | |
| | Total | Total | | $ | 370 | | | $ | 825 | | | $ | 484 | | | $ | 24,592 | | | $ | 26,271 | | | $ | 28,470 | | | $ | 37,145 | | | $ | 53,286 | |
| | |
The Company’s recourse reserve related to these guarantees is included in the allowance for unfunded credit commitments and totaled $88$40 thousand and $76$37 thousand as of December 31, 20202023 and 2019,2022, respectively. The allowance for unfunded credit commitments is included in Accrued expenses and other liabilities on the Consolidated Balance Sheet. The Company continues to experience minimal losses from the single-family and multifamily residential loan portfolios sold or securitized with recourse.
Litigation — The Company is a party to various legal actions arising in the ordinary course of its business. In accordance with ASC 450, Contingencies, the Company accrues reserves for outstanding lawsuits, claims and proceedings when a loss contingency is probable and can be reasonably estimated. The Company estimates the amount of loss contingencies using current available information from legal proceedings, advice from legal counsel and available insurance coverage. Due to the inherent subjectivity of the assessments and unpredictability of the outcomes of the legal proceedings, any amounts accrued or included in this aggregate amount may not represent the ultimate loss to the Company from the legal proceedings in question. Thus, the Company’s exposure and ultimate losses may be higher, and possibly significantly more than the amounts accrued.
Other Commitments — TheWhile it is impossible to ascertain the ultimate resolution or range of financial liability, based on information known to
the Company has commitments to invest in qualified affordable housing partnerships, tax credit and other investments as discussed in Note 7 — Investments in Qualified Affordable Housing Partnerships, Tax Credit and Other Investments, Net and Variable Interest Entities to the Consolidated Financial Statements in this Form 10-K. As of December 31, 2020 and 2019, these commitments totaled $182.7 million and $193.8 million, respectively. These commitments2023, the Company does not believe there are includedany pending legal proceedings to which the Company is a party that, individually or in Accrued expenses and other liabilitiesthe aggregate, would reasonably be expected to have a material adverse effect on the Consolidated Balance Sheet.
Related Party Transactions —Company’s financial condition. In light of the ordinary courseinherent uncertainty in legal proceedings, however, there can be no assurance that the ultimate resolution will not exceed established reserves and it is possible that the outcome of business,a particular matter, or a combination of matters, may be material to the Company may extend credit to related parties, including executive officers, directorsCompany’s financial condition for a particular period, depending upon the size of the loss and principal shareholders. These related party loans were not materialthe Company’s income for the years ended December 31, 2020 and 2019.that particular period.
Note 13 — Stock Compensation Plans
Pursuant to the Company’s 20162021 Stock Incentive Plan, as amended, the Company may issue stocks,stock, stock options, restricted stock, RSUs including performance-based RSUs, stock purchase warrants, stock appreciation rights, phantom stock and dividend equivalents to eligible employees, non-employee directors, consultants, and other service providers of the CompanyEast West and its subsidiaries. The Company has granted RSUs as its primary incentive awards. There were 0no outstanding stock awards other than RSUs as of December 31, 2020, 20192023, 2022 and 2018.2021. An aggregate of 14.017 million shares of common stock were authorized under the 20162021 Stock Incentive Plan, and the total number of shares available for grant was approximately 2.84 million as of December 31, 2020.2023.
The following table presents a summary of the total share-based compensation expense and the related net tax (deficiencies) benefits associated with the Company’s various employee share-based compensation plans for the years ended December 31, 2020, 20192023, 2022 and 2018:2021:
| | | ($ in thousands) | | Year Ended December 31, |
| | | Year Ended December 31, | |
| | Year Ended December 31, | |
| | Year Ended December 31, | |
| | Year Ended December 31, | |
| | Year Ended December 31, | |
| | Year Ended December 31, | |
| | Year Ended December 31, | |
| | Year Ended December 31, | |
| | Year Ended December 31, | |
| | Year Ended December 31, | |
| | Year Ended December 31, | |
| | Year Ended December 31, | |
| | Year Ended December 31, | |
| | Year Ended December 31, | |
| | Year Ended December 31, | |
| | Year Ended December 31, | |
| | Year Ended December 31, | |
| | Year Ended December 31, | |
| | Year Ended December 31, | |
| | Year Ended December 31, | |
| ($ in thousands) | ($ in thousands) | | 2020 | | 2019 | | 2018 | ($ in thousands) | | 2023 | | 2022 | | 2021 |
| $ | 29,237 | | | $ | 30,761 | | | $ | 30,937 | |
| Related net tax (deficiencies) benefits for stock compensation plans | | $ | (1,839) | | | $ | 4,792 | | | $ | 5,089 | |
| Related net tax benefits for stock compensation plans | |
|
Restricted Stock Units — RSUs are granted under the Company’s long-term incentive plan at no cost to the recipient. RSUs vest ratably after three years orgenerally cliff vest after three or five years of continued employment from the date of the grant, and are authorized to settle predominantly in shares of the Company’s common stock. Certain RSUs are settled in cash. Dividends are accrued during the vesting period and are paid at the time of vesting. While a portion of RSUs are time-vestingtime-based vesting awards, others vest subject to the attainment of additional specified performance goals, and these RSUs are referred to as “performance-based RSUs.”
Performance-based RSUs are granted atannually upon approval by the target amount of awards. BasedCompany’s Compensation and Management Development Committee based on the Company’s attainmentperformance in the year prior to the grant date of specified performance goals and consideration of market conditions, the award. The number of sharesawards that vest can range between a minimum of 0%from zero percent to a maximum of 200% of the target. The amount of performance-based RSUs that are eligible to vest is determined at the end of each performance period and is then added together as the totalgranted number of performance shares to vest. Performance-based RSUs cliff vest three years from the date of each grant.
Compensation costs for the time-based awards that will be settled in shares of the Company’s common stock are based on the quoted market priceCompany’s achievement of specified performance criteria over a performance period of three years. For information on accounting on stock-based compensation plans, see Note 1— Summary of Significant Accounting Policies — Significant Accounting Policies — Stock-Based Compensation to the Company’s common stock at the grant date. Compensation costs for certain time-based awards that will be settledConsolidated Financial Statements in cash are adjusted to fair value based on changes in the share price of the Company’s common stock up to the settlement date. Compensation costs associated with performance-based RSUs are based on grant date fair value which considers both market and performance conditions, and is subject to subsequent adjustments based on the changes in the Company’s projected outcome of the performance criteria. Compensation costs of both time-based and performance-based awards are estimated based on awards ultimately expected to vest and recognized on a straight-line basis from the grant date until the vesting date of each grant.this Form 10-K.
The following table presents a summary of the activities for the Company’s time-based and performance-based RSUs that will bewere settled in shares for the year ended December 31, 2020.2023. The number of outstanding performance-based RSUs providedstated below assumes that performance will be met atreflects the target level.number of awards granted on the grant date:
| | | | Time-Based RSUs | | Performance-Based RSUs |
| Shares | | Weighted-
Average
Grant Date
Fair Value | | Shares | | Weighted-
Average
Grant Date
Fair Value |
| Outstanding, January 1, 2020 | | 1,139,868 | | | $ | 57.78 | | | 386,483 | | | $ | 60.13 | |
| | Time-Based RSUs | |
| | Time-Based RSUs | |
| | Time-Based RSUs | |
| | Time-Based RSUs | |
| | Time-Based RSUs | |
| | Time-Based RSUs | |
| | Time-Based RSUs | |
| | Time-Based RSUs | |
| | Time-Based RSUs | |
| | Time-Based RSUs | |
| | Time-Based RSUs | |
| | Time-Based RSUs | |
| | Time-Based RSUs | |
| | Time-Based RSUs | |
| | Time-Based RSUs | |
| | Time-Based RSUs | |
| | Time-Based RSUs | |
| | Time-Based RSUs | |
| | Time-Based RSUs | |
| | Time-Based RSUs | |
| | Time-Based RSUs | |
| | Time-Based RSUs | |
| | Time-Based RSUs | |
| | Time-Based RSUs | |
| | Time-Based RSUs | |
| | Time-Based RSUs | |
| | Time-Based RSUs | | | Performance-Based RSUs |
| | Shares | | | | Shares | | Weighted-Average Grant Date Fair Value | | Shares | | Weighted-Average Grant Date Fair Value |
| Outstanding, January 1, 2023 | |
| Granted | Granted | | 680,172 | | | 40.61 | | | 165,084 | | | 39.79 | |
| Vested | Vested | | (290,147) | | | 55.23 | | | (131,597) | | | 56.59 | |
| Forfeited | Forfeited | | (184,258) | | | 53.61 | | | (21,913) | | | 45.64 | |
| Outstanding, December 31, 2020 | | 1,345,635 | | | $ | 50.22 | | | 398,057 | | | $ | 53.66 | |
| Outstanding, December 31, 2023 | |
|
The following table presents a summary of the activities for the Company’s time-based RSUs that will be settled in cash for the year ended December 31, 2020:
| | | | | | | | | | |
|
| | | | Shares |
Outstanding, January 1, 2020 | | | | 11,638 | |
Granted | | | | 11,215 | |
Vested | | | | 0 | |
Forfeited | | | | (1,051) | |
Outstanding, December 31, 2020 | | | | 21,802 | |
|
The weighted-average grant date fair value of the time-based awardsRSUs granted during the years ended December 31, 2020, 20192023, 2022, and 20182021 was $40.61, $52.46$73.13, $78.15, and $66.86,$71.88, respectively. The weighted-average grant date fair value of the performance-based awardsRSUs granted during the years ended December 31, 2020, 20192023, 2022 and 20182021 was $39.79, $54.64$79.93, $77.91 and $70.13,$77.67, respectively. The total fair value of time-based awardsRSUs that vested during the years ended December 31, 2020, 20192023, 2022 and 20182021 was $11.5$39 million, $20.7$30 million and $23.1$23 million, respectively. The total fair value of performance-based awardsRSUs that vested during the years ended December 31, 2020, 20192023, 2022, and 20182021 was $8.9$21 million, $14.5$18 million and $16.2$15 million, respectively.
As of December 31, 2020,2023, there was $22.8were $28 million of unrecognized compensation costs related to unvested time-based RSUs expected to be recognized over a weighted-average period of 1.721.76 years, and $13.0$15 million of unrecognized compensation costs related to unvested performance-based RSUs expected to be recognized over a weighted-average period of 1.721.77 years.
Employee Stock Purchase Plan — The 1998 Employee Stock Purchase Plan (the “Purchase Plan”) provides eligible employees of the Company the right to purchase shares of its common stock at a discount. Employees couldcan purchase shares at 90% of the fair market price subject to an annual purchase limitation of $22,500 per employee. As of December 31, 2020,2023, the Purchase Plan qualifies as a non-compensatory plan under Section 423 of the Internal Revenue Code and, accordingly, 0no compensation expense has been recognized. 2,000,000 shares of the Company’s common stock have been made AFSwere authorized for sale under the Purchase Plan. During the years ended December 31, 20202023 and 2019, 89,4252022, 65,971 shares totaling $2.3$3 million and 81,22148,990 shares totaling $3.4$3 million, respectively, have beenwere sold to employees under the Purchase Plan. As of December 31, 2020,2023, there were 304,500151,814 shares available under the Purchase Plan.
Note 14 — Employee Benefit Plans
The Company sponsors a defined contribution plan, the East West Bank Employees 401(k) Savings Plan (the “401(k) Plan”), designed to provide retirement benefits financed by participants’ tax deferred contributions for the benefits of its employees. A Roth 401(k) investment option is also available to the participants, with contributions to be made on an after-tax basis. Under the 401(k) Plan, after three months of service, eligible employees may elect to defer up to 80% of their compensation before taxes, up to the dollar limit imposed by the IRS for tax purposes. Participants can also designate a part or all of their contributions as Roth 401(k) contributions. Effective as of April 1, 2020, the Company matches 75% of the first 6% of the Plan participant’s deferred compensation. The Company’s contributions to the Plan are determined annually by the Board of Directors in accordance with the Plan requirements and are invested based on employee investment elections. Plan participants become vested in matching contributions received from the Company at the rate of 20% per year for each full year of service, such that the Plan participants become 100% vested after five years of credited service. For the Plan years ended December 31, 2020, 2019 and 2018, the Company expensed $12.6 million, $14.0 million and $9.9 million, respectively.
During 2002, the Company adopted a Supplemental Executive Retirement Plan (“SERP”) pursuant to which the Company will pay supplemental pension benefits to certain executive officers designated by the Board of Directors upon retirement based upon the officers’ years of service and compensation. The SERP meets the definition of a pension plan per ASC 715-30, Compensation — Retirement Benefits — Defined Benefit Plans — Pension. The SERP is an unfunded, non-qualified plan under which the participants have no rights beyond those of a general creditor of the Company, and there are no specific assets set aside by the Company in connection with the plan. As of December 31, 2020, there were 0 additional benefits to be accrued for under the SERP. As of each of December 31, 2020 and 2019, there was 1 former executive officer remaining under the SERP. Benefits expensed and accrued for the years ended December 31, 2020, 2019 and 2018 were $333 thousand, $333 thousand and $332 thousand, respectively. The benefit obligation was $4.2 million as of both December 31, 2020 and 2019. The following table presents a summary of expected SERP payments to be paid for the next five years and thereafter as of December 31, 2020:
| | | | | | | | |
| | |
| Years Ending December 31, | | Amount
($ in thousands) |
| 2021 | | $ | 349 | |
| 2022 | | 359 | |
| 2023 | | 370 | |
| 2024 | | 381 | |
| 2025 | | 393 | |
| Thereafter | | 6,710 | |
| Total | | $ | 8,562 | |
| | |
Note 1514 — Stockholders’ Equity and Earnings Per Share
The following table presents the basic and diluted EPS calculations for the years ended December 31, 2020, 20192023, 2022 and 2018.2021. For more information on the calculation of EPS, see Note 1 — Summary of Significant Accounting Policies — Significant Accounting Policies — Earnings Per Share to the Consolidated Financial Statements in this Form 10-K.
| | | | | | | | | | | | | | | | | | | | |
|
| ($ and shares in thousands, except per share data) | | Year Ended December 31, |
| 2020 | | 2019 | | 2018 |
| Basic: | | | | | | |
| Net income | | $ | 567,797 | | | $ | 674,035 | | | $ | 703,701 | |
| | | | | | |
| Basic weighted-average number of shares outstanding | | 142,336 | | | 145,497 | | | 144,862 | |
| Basic EPS | | $ | 3.99 | | | $ | 4.63 | | | $ | 4.86 | |
| Diluted: | | | | | | |
| Net income | | $ | 567,797 | | | $ | 674,035 | | | $ | 703,701 | |
| | | | | | |
Basic weighted-average number of shares outstanding (1) | | 142,336 | | | 145,497 | | | 144,862 | |
Diluted potential common shares (1)(2) | | 655 | | | 682 | | | 1,307 | |
Diluted weighted-average number of shares outstanding (1)(2) | | 142,991 | | | 146,179 | | | 146,169 | |
| Diluted EPS | | $ | 3.97 | | | $ | 4.61 | | | $ | 4.81 | |
|
(1)The Company acquired MetroCorp Bancshares, Inc. (“MetroCorp”) on January 17, 2014. Prior to the acquisition, MetroCorp had outstanding warrants to purchase 771,429 shares of its common stock. Upon the acquisition, the rights of the warrant holders were converted into the rights to acquire 230,282 shares of East West’s common stock until January 16, 2019. All warrants were exercised on January 7, 2019.
(2)Includes dilutive shares from RSUs for the years ended December 31, 2020 and 2019, and from RSUs and warrants for the year ended December 31, 2018. | | | | | | | | | | | | | | | | | | | | |
|
| | Year Ended December 31, |
| ($ and shares in thousands, except per share data) | | 2023 | | 2022 | | 2021 |
| Basic: | | | | | | |
| Net income | | $ | 1,161,161 | | | $ | 1,128,083 | | | $ | 872,981 | |
| | | | | | |
| Weighted-average number of shares outstanding | | 141,164 | | | 141,326 | | | 141,826 | |
| Basic EPS | | $ | 8.23 | | | $ | 7.98 | | | $ | 6.16 | |
| Diluted: | | | | | | |
| Net income | | $ | 1,161,161 | | | $ | 1,128,083 | | | $ | 872,981 | |
| | | | | | |
| Weighted-average number of shares outstanding | | 141,164 | | | 141,326 | | | 141,826 | |
| Add: Diluted impact of unvested RSUs | | 738 | | | 1,166 | | | 1,314 | |
| Diluted weighted-average number of shares outstanding | | 141,902 | | | 142,492 | | | 143,140 | |
| Diluted EPS | | $ | 8.18 | | | $ | 7.92 | | | $ | 6.10 | |
|
For the years ended December 31, 2020, 20192023, 2022 and 2018, 1342021, approximately 283 thousand, 153 thousand and 106 thousand weighted-average shares of anti-dilutive RSUs, respectively, were excluded from the diluted EPS computation.
Stock Repurchase Program — On March 3,In 2020, the Company’s Board of Directors authorized a stock repurchase program to buy back up to $500.0500 million of the Company’s common stock. For the year ended December 31, 2020,In 2023, the Company repurchased 4,471,6821,506,091 shares at an average price of $32.64$54.56 per share andat a total cost of $146.0$82 million. In 2022, the Company repurchased 1,385,517 shares at an average price of $72.17 per share at a total cost of $100 million. The Company did not repurchase any shares during the years endedin 2021. As of December 31, 2019 and 2018.2023, the Company had approximately $172 million available for repurchases under its stock repurchase program.
Note 1615 — Accumulated Other Comprehensive Income (Loss)
The following table presents the changes in the components of AOCI balances for the years ended December 31, 2020, 20192023, 2022 and 2018:2021:
| | | ($ in thousands) | ($ in thousands) | | AFS
Debt
Securities | | Cash
Flow
Hedges | | Foreign
Currency
Translation
Adjustments (1) | | Total |
| Balance, December 31, 2017 | | $ | (30,898) | | | $ | 0 | | | $ | (6,621) | | | $ | (37,519) | |
Cumulative-effect of change in accounting principle related to marketable equity securities (2) | | 385 | | | 0 | | | 0 | | | 385 | |
Reclassification of tax effects in AOCI resulting from the new federal corporate income tax rate (3) | | (6,656) | | | 0 | | | 0 | | | (6,656) | |
| Balance, January 1, 2018, adjusted | | (37,169) | | | 0 | | | (6,621) | | | (43,790) | |
| ($ in thousands) | |
| ($ in thousands) | |
| ($ in thousands) | |
| ($ in thousands) | |
| ($ in thousands) | |
| ($ in thousands) | |
| ($ in thousands) | |
| ($ in thousands) | |
| ($ in thousands) | |
| ($ in thousands) | |
| ($ in thousands) | |
| ($ in thousands) | |
| ($ in thousands) | |
| ($ in thousands) | |
| ($ in thousands) | |
| ($ in thousands) | |
| ($ in thousands) | |
| ($ in thousands) | |
| ($ in thousands) | |
| ($ in thousands) | |
| ($ in thousands) | |
| ($ in thousands) | |
| ($ in thousands) | |
| ($ in thousands) | |
| ($ in thousands) | |
| ($ in thousands) | | | Debt Securities (1) | | Cash Flow Hedges | | Foreign Currency Translation Adjustments (2) | | Total |
| Balance, December 31, 2020 | |
| | Net unrealized (losses) gains arising during the period | |
| | Net unrealized (losses) gains arising during the period | |
| | Net unrealized (losses) gains arising during the period | |
| Amounts reclassified from AOCI | |
| Changes, net of tax | |
| Balance, December 31, 2021 | |
| Net unrealized losses arising during the period | Net unrealized losses arising during the period | | (6,866) | | | 0 | | | (5,732) | | | (12,598) | |
| Amounts reclassified from AOCI | Amounts reclassified from AOCI | | (1,786) | | | 0 | | | 0 | | | (1,786) | |
| Changes, net of tax | Changes, net of tax | | (8,652) | | | 0 | | | (5,732) | | | (14,384) | |
| Balance, December 31, 2018 | | $ | (45,821) | | | $ | 0 | | | $ | (12,353) | | | $ | (58,174) | |
| | Balance, December 31, 2022 | |
| Net unrealized gains (losses) arising during the period | Net unrealized gains (losses) arising during the period | | 46,170 | | | 0 | | | (3,636) | | | 42,534 | |
| Amounts reclassified from AOCI | Amounts reclassified from AOCI | | (2,768) | | | 0 | | | 0 | | | (2,768) | |
| Changes, net of tax | Changes, net of tax | | 43,402 | | | 0 | | | (3,636) | | | 39,766 | |
| Balance, December 31, 2019 | | $ | (2,419) | | | $ | 0 | | | $ | (15,989) | | | $ | (18,408) | |
| Net unrealized gains (losses) arising during the period | | 63,329 | | | (1,149) | | | 9,297 | | | 71,477 | |
| Amounts reclassified from AOCI | | (8,663) | | | (81) | | | 0 | | | (8,744) | |
| Changes, net of tax | | 54,666 | | | (1,230) | | | 9,297 | | | 62,733 | |
| Balance, December 31, 2020 | | $ | 52,247 | | | $ | (1,230) | | | $ | (6,692) | | | $ | 44,325 | |
| Balance, December 31, 2023 | |
|
(1)Includes after-tax unamortized losses related to AFS debt securities that were transferred to HTM in 2022.
(2)Represents foreign currency translation adjustments related to the Company’s net investment in non-U.S. operations, including related hedges. The functional currency and reporting currency of the Company’s foreign subsidiary was RMB and USD, respectively.
(2)Represents the impact of the adoption of ASU 2016-01, Financial Instruments — Overall (Subtopic 825-10): Recognition and Measurement of Financial Assets and Financial Liabilities on January 1, 2018.
(3)Represents the amounts reclassified from AOCI to retained earnings due to the early adoption of ASU 2018-02, Income Statement — Reporting Comprehensive Income (Topic 220): Reclassification of Certain Tax Effects from Accumulated Other Comprehensive Income on January 1, 2018. ASU 2018-02 permits companies to reclassify the stranded tax effects resulting from the Tax Cuts and Jobs Act of 2017 from AOCI to retained earnings on a retrospective basis. The adoption of the guidance resulted in a cumulative-effect adjustment as of January 1, 2018 that increased retained earnings by $6.7 million and reduced AOCI by the same amount.
The following table presents the components of other comprehensive income (loss), reclassifications to net income and the related tax effects for the years ended December 31, 2020, 20192023, 2022 and 2018:2021:
| | | | Year Ended December 31, | |
| | Year Ended December 31, | |
| | Year Ended December 31, | |
| | Year Ended December 31, | |
| | Year Ended December 31, | |
| | Year Ended December 31, | |
| | Year Ended December 31, | |
| | Year Ended December 31, | |
| | Year Ended December 31, | |
| | Year Ended December 31, | |
| | Year Ended December 31, | |
| | Year Ended December 31, | |
| | Year Ended December 31, | |
| | Year Ended December 31, | |
| | Year Ended December 31, | |
| | Year Ended December 31, | |
| | Year Ended December 31, | |
| | Year Ended December 31, | |
| | Year Ended December 31, | |
| | Year Ended December 31, | |
| | Year Ended December 31, | |
| | Year Ended December 31, | |
| | Year Ended December 31, | |
| | Year Ended December 31, | |
| | Year Ended December 31, | |
| | Year Ended December 31, | |
| | Year Ended December 31, | |
| | Year Ended December 31, | |
| | Year Ended December 31, | |
| | Year Ended December 31, | |
| | Year Ended December 31, | |
| | Year Ended December 31, | |
| | Year Ended December 31, | |
| | Year Ended December 31, | |
| | Year Ended December 31, | |
| | Year Ended December 31, | |
| | Year Ended December 31, | |
| | Year Ended December 31, | |
| | Year Ended December 31, | |
| | Year Ended December 31, | |
| | Year Ended December 31, | |
| | Year Ended December 31, | |
| | Year Ended December 31, | |
| | Year Ended December 31, | |
| | Year Ended December 31, | |
| | Year Ended December 31, | |
| | Year Ended December 31, | |
| | Year Ended December 31, | |
| | Year Ended December 31, | |
| | Year Ended December 31, | |
| | Year Ended December 31, | |
| | Year Ended December 31, | |
| | Year Ended December 31, | |
| | Year Ended December 31, | |
| | Year Ended December 31, | |
| | Year Ended December 31, | |
| | Year Ended December 31, | |
| | 2023 | | | | 2023 | | 2022 | | 2021 |
| ($ in thousands) | ($ in thousands) | | Year Ended December 31, | ($ in thousands) | | Before-Tax | | Tax Effect | | Net-of-Tax | | Before-Tax | | Tax Effect | | Net-of-Tax | | Before-Tax | | Tax Effect | | Net-of-Tax |
| 2020 | | 2019 | | 2018 |
| Before -
Tax | | Tax
Effect | | Net-of-
Tax | | Before -
Tax | | Tax
Effect | | Net-of-
Tax | | Before -
Tax | | Tax
Effect | | Net-of-
Tax |
| AFS debt securities: | | | | | | | | | | | | | | | | | | |
| Net unrealized gains (losses) arising during the period | | $ | 89,868 | | | $ | (26,539) | | | $ | 63,329 | | | $ | 65,549 | | | $ | (19,379) | | | $ | 46,170 | | | $ | (9,748) | | | $ | 2,882 | | | $ | (6,866) | |
Net realized (gains) reclassified into net income (1) | | (12,299) | | | 3,636 | | | (8,663) | | | (3,930) | | | 1,162 | | | (2,768) | | | (2,535) | | | 749 | | | (1,786) | |
| Debt securities: | |
| Net unrealized gains (losses) on AFS debt securities arising during the period | |
| Net unrealized gains (losses) on AFS debt securities arising during the period | |
| Net unrealized gains (losses) on AFS debt securities arising during the period | |
| Unrealized losses on debt securities transferred from AFS to HTM | |
| Reclassification adjustments: | |
Net realized losses (gains) on AFS debt securities reclassified into net income (1) | |
Net realized losses (gains) on AFS debt securities reclassified into net income (1) | |
Net realized losses (gains) on AFS debt securities reclassified into net income (1) | |
Amortization of unrealized losses on transferred securities (3) | |
| Net change | Net change | | 77,569 | | | (22,903) | | | 54,666 | | | 61,619 | | | (18,217) | | | 43,402 | | | (12,283) | | | 3,631 | | | (8,652) | |
| Cash flow hedges | | | | | | | | | | | | | | | | | | |
| Net unrealized gains (losses) arising during the period | | (1,604) | | | 455 | | | (1,149) | | | 0 | | | 0 | | | 0 | | | 0 | | | 0 | | | 0 | |
Net realized (gains) reclassified into net income (2) | | (113) | | | 32 | | | (81) | | | 0 | | | 0 | | | 0 | | | 0 | | | 0 | | | 0 | |
| Cash flow hedges: | |
| Net unrealized (losses) gains arising during the period | |
| Net unrealized (losses) gains arising during the period | |
| Net unrealized (losses) gains arising during the period | |
Net realized losses reclassified into net income (4) | |
| Net change | Net change | | (1,717) | | | 487 | | | (1,230) | | | 0 | | | 0 | | | 0 | | | 0 | | | 0 | | | 0 | |
| Foreign currency translation adjustments, net of hedges: | Foreign currency translation adjustments, net of hedges: | | | | | | | | | | | | | | | | | | |
Net unrealized gains (losses) arising during the period (3) | | 7,398 | | | 1,899 | | | 9,297 | | | 290 | | | (3,926) | | | (3,636) | | | (5,732) | | | 0 | | | (5,732) | |
| Net unrealized gains (losses) arising during the period | |
| Net unrealized gains (losses) arising during the period | |
| Net unrealized gains (losses) arising during the period | |
| Net change | Net change | | 7,398 | | | 1,899 | | | 9,297 | | | 290 | | | (3,926) | | | (3,636) | | | (5,732) | | | 0 | | | (5,732) | |
| Other comprehensive income (loss) | Other comprehensive income (loss) | | $ | 83,250 | | | $ | (20,517) | | | $ | 62,733 | | | $ | 61,909 | | | $ | (22,143) | | | $ | 39,766 | | | $ | (18,015) | | | $ | 3,631 | | | $ | (14,384) | |
|
(1)For the years ended December 31, 2020, 2019 and 2018, pre-taxPre-tax amounts were reported in GainsNet (losses) gains on sales of AFS debt securities on the Consolidated Statement of Income.
(2)ForRepresents the year ended December 31, 2020, pre-taxnet loss related to an AFS debt security that was written-off in the first quarter of 2023 and subsequently sold during the fourth quarter of 2023.
(3)Represents unrealized losses amortized over the remaining lives of securities that were transferred from the AFS to HTM portfolio in 2022.
(4)Pre-tax amounts related to cash flow hedges on variable rate loans and long-term borrowings, where applicable, were reported in Interest and dividend income andin Interest expense,respectively, on the Consolidated Statement of Income. In 2023, pre-tax amount also includes the terminated cash flow hedge where the forecasted cash flows were no longer probable to occur and was reported in Noninterest income on the Consolidated Statement of Income.
(3)The tax effects on foreign currency translation adjustments, net of hedges represent the cumulative net deferred tax liabilities on net investment hedges since its inception.
Note 1716 — Regulatory Requirements and Matters
Capital Adequacy — The Company and the Bank are subject to regulatory capital adequacy requirements administered by the respective federal banking agencies. The Bank is a member bank of the Federal Reserve System and is primarily regulated by the Federal Reserve and the California Department of Financial Protection and Innovation. The Company and the Bank are required to comply with the Basel III Capital Rules adopted by the federal banking agencies. BothAs standardized approaches institutions, the Basel III Capital Rules require that banking organizations, such as the Company and the Bank, are standardized approaches institutions under Basel III Capital Rules. The Basel III Capital Rule requires that banking organizationsto maintain a minimum Common Equity Tier 1 (“CET1”) capital ratio of at least 4.5%, a Tier 1 capital ratio of at least 6.0%, a total capital ratio of at least 8.0%, and a Tier 1 leverage ratio of a least 4.0% to be considered adequately capitalized. Failure to meet the minimum capital requirements can result in certain mandatory actions and possibly additional discretionary actions by the regulators that, if undertaken, could have a direct material effect on the Company’s Consolidated Financial Statements. The Basel III Capital Rules also requires the Company and the Bank are also subject to maintainmaintaining a capital conservation buffer of 2.5% above the minimum risk-based capital ratios in order to absorb losses during periods of economic stress, effective January 1, 2019.under the Basel III Capital Rules. Banking institutions with a ratio of CET1 to risk-weighted assets above the minimum but belowwhich does not exceed the capital conservation buffer will face constraints on dividends, equityshare repurchases and executive compensation based on the amount of the shortfall.
The FDICFederal Deposit Insurance Corporation Improvement Act of 1991 requires that the federal regulatory agencies adopt regulations defining capital categories for banks: well capitalized, adequately capitalized, undercapitalized, significantly undercapitalized and critically undercapitalized. Consistent withUnder the Basel III Capital Rules, the capital categories were augmented by including the CET1 capital measure, and revised risk-based capital measuresagencies’ Prompt Corrective Action regulations, failure of a bank to reflect the rule changes to the minimum risk-based capital ratios.
Effective January 1, 2020, the Company adopted the ASU 2016-13 Financial Instruments — Credit Losses (Topic 326) Measurement of Credit Losses on Financial instrument that introduced the CECL methodology. In March 2020, the federal banking agencies issued the Interim Final Rule that provided banking organizations that adopted the CECL with the phase-in option to delay the estimated impact of CECL on regulatory capital. The Bank and the Company have elected the CECL phase-in option in 2020 and delayed the impact of CECL on regulatory capital through 2021, after which the effects are being phased in over a three-year period from January 1, 2022 through December 31, 2024.
As of both December 31, 20202023 and 2019,2022, the Company and the Bank were both categorized as well capitalized based on applicable U.S. regulatory capital ratio requirements in accordance with Basel III standardized approaches, as set forth in the table below. The Company believes that no changes in conditions or events have occurred since December 31, 2020,2023, which would result in changes that would cause the Company or the Bank to fall below the well capitalized level. The following table presents the regulatory capital information of the Company and the Bank as of December 31, 20202023 and 2019:2022:
| | | ($ in thousands) | | Basel III |
| | | | | | Basel III | |
| | | December 31, 2023 | |
| | December 31, 2023 | |
| | December 31, 2023 | |
| ($ in thousands) | ($ in thousands) | | December 31, 2020 | | December 31, 2019 | | Minimum
Capital
Ratios | | Fully Phased-in Minimum Capital Ratios (3) | | Well-
Capitalized
Requirement |
| Actual | | | Actual | |
| Amount | | Ratio | | | Amount | | Ratio | | Ratio | | Ratio | | Ratio | | Amount | | Ratio | | | | | | Amount | | Ratio | | Minimum Capital Ratios | | Fully Phased-in Minimum Capital Ratios (2) | | Well-Capitalized Requirement |
| | Total capital (to risk-weighted assets) | Total capital (to risk-weighted assets) | | | | | | | | | | | | | | | |
| Total capital (to risk-weighted assets) | |
| Total capital (to risk-weighted assets) | |
| Company | |
| Company | |
| Company | Company | | $ | 5,510,640 | | | 14.3 | % | | | $ | 5,064,037 | | | 14.4 | % | | 8.0 | % | | 10.5 | % | | 10.0 | % | | $ | 7,919,407 | | | 14.8 | | 14.8 | % | | | | | | $ | 7,003,299 | | | 14.0 | | 14.0 | % | | 8.0 | % | | 10.5 | % | | 10.0 | % |
| East West Bank | East West Bank | | $ | 5,143,246 | | | 13.4 | % | | | $ | 4,886,237 | | | 13.9 | % | | 8.0 | % | | 10.5 | % | | 10.0 | % | East West Bank | | $ | 7,363,575 | | | 13.8 | | 13.8 | % | | | | | | $ | 6,760,612 | | | 13.5 | | 13.5 | % | | 8.0 | % | | 10.5 | % | | 10.0 | % |
| Tier 1 capital (to risk-weighted assets) | Tier 1 capital (to risk-weighted assets) | | | |
| Company | Company | | $ | 4,882,555 | | | 12.7 | % | | | $ | 4,546,592 | | | 12.9 | % | | 6.0 | % | | 8.5 | % | | 8.0 | % |
| Company | |
| Company | | | $ | 7,140,778 | | | 13.3 | % | | | | | | $ | 6,347,108 | | | 12.7 | % | | 6.0 | % | | 8.5 | % | | 6.0 | % |
| East West Bank | East West Bank | | $ | 4,662,426 | | | 12.1 | % | | | $ | 4,516,792 | | | 12.9 | % | | 6.0 | % | | 8.5 | % | | 8.0 | % | East West Bank | | $ | 6,732,946 | | | 12.6 | | 12.6 | % | | | | | | $ | 6,252,421 | | | 12.5 | | 12.5 | % | | 6.0 | % | | 8.5 | % | | 8.0 | % |
CET1 capital (to risk-weighted assets) | CET1 capital (to risk-weighted assets) | | | |
| Company | | $ | 4,882,555 | | | 12.7 | % | | | $ | 4,546,592 | | | 12.9 | % | | 4.5 | % | | 7.0 | % | | 6.5 | % |
Company (1) | |
Company (1) | |
Company (1) | | | $ | 7,140,778 | | | 13.3 | % | | | | | | $ | 6,347,108 | | | 12.7 | % | | 4.5 | % | | 7.0 | % | | N/A |
| East West Bank | East West Bank | | $ | 4,662,426 | | | 12.1 | % | | | $ | 4,516,792 | | | 12.9 | % | | 4.5 | % | | 7.0 | % | | 6.5 | % | East West Bank | | $ | 6,732,946 | | | 12.6 | | 12.6 | % | | | | | | $ | 6,252,421 | | | 12.5 | | 12.5 | % | | 4.5 | % | | 7.0 | % | | 6.5 | % |
| Tier 1 leverage capital (to adjusted average assets) | Tier 1 leverage capital (to adjusted average assets) | | | |
Company (1) | |
Company (1) | |
Company (1) | Company (1) | | $ | 4,882,555 | | | 9.4 | % | | | $ | 4,546,592 | | | 10.3 | % | | 4.0 | % | | 4.0 | % | | N/A | | $ | 7,140,778 | | | 10.2 | | 10.2 | % | | | | | | $ | 6,347,108 | | | 9.8 | | 9.8 | % | | 4.0 | % | | 4.0 | % | | N/A |
| East West Bank | East West Bank | | $ | 4,662,426 | | | 9.0 | % | | | $ | 4,516,792 | | | 10.3 | % | | 4.0 | % | | 4.0 | % | | 5.0 | % | East West Bank | | $ | 6,732,946 | | | 9.6 | | 9.6 | % | | | | | | $ | 6,252,421 | | | 9.7 | | 9.7 | % | | 4.0 | % | | 4.0 | % | | 5.0 | % |
| Risk-weighted assets | Risk-weighted assets | | | |
| Company | Company | | $ | 38,406,071 | | | N/A | | | $ | 35,136,427 | | | N/A | | N/A | | N/A | | N/A |
| Company | |
| Company | | | $ | 53,663,392 | | | N/A | | | | | | $ | 50,036,719 | | | N/A |
| East West Bank | East West Bank | | $ | 38,481,275 | | | N/A | | | $ | 35,127,920 | | | N/A | | N/A | | N/A | | N/A | East West Bank | | $ | 53,539,980 | | | N/A | | N/A | | | | | | $ | 50,024,772 | | | N/A | | N/A |
Adjusted quarterly average total assets (2) | | | |
| Adjusted quarterly average total assets | |
| Company | |
| Company | |
| Company | Company | | $ | 52,540,964 | | | N/A | | | $ | 44,449,802 | | | N/A | | N/A | | N/A | | N/A | | $ | 70,406,008 | | | N/A | | N/A | | | | | | $ | 65,221,597 | | | N/A | | N/A |
| East West Bank | East West Bank | | $ | 52,594,313 | | | N/A | | | $ | 44,419,308 | | | N/A | | N/A | | N/A | | N/A | East West Bank | | $ | 70,270,449 | | | N/A | | N/A | | | | | | $ | 65,198,267 | | | N/A | | N/A |
|
N/A — Not applicable.
(1)The well-capitalized requirements for CET1 capital and Tier 1 leverage capital well-capitalized requirement appliesapply only to the Bank since there is no CET1 capital ratio or Tier 1 leverage capital ratio component in the definition of a well-capitalized bank holding company.
(2)Reflects adjusted quarterly average total assets for the years ended December 31, 2020 and 2019.
(3)As of January 1, 2019, theIncludes a 2.5% capital conservation buffer requirement above the minimum risk-based capital ratios was required in order to avoid limitations on distributions, including dividend payments and certain discretionary bonus payments to executive officers.
N/A — Not applicable.
Reserve Requirement — The Bank is required to maintain a percentage of its deposits as reserves at the Federal Reserve. In an effort to provide monetary stimulus to counteract the economic disruption caused by the COVID-19 pandemic, the Federal Reserve reduced reserve requirement ratio to zero percent. The daily average reserve requirements were 0 as of December 31, 2020 and $829.0 million as of December 31, 2019.ratios.
Note 1817 — Business Segments
The Company organizes its operations into 3three reportable operating segments: (1) Consumer and Business Banking; (2) Commercial Banking; and (3) Other. These segments are defined by the type of customers served, and the related products and services provided. The segments reflect how financial information is currently evaluated by management. Operating segment results are based on the Company’s internal management reporting process, which reflects assignments and allocations of certain balance sheet and income statement items. The information presented is not indicative of how the segments would perform if they operated as independent entities due to the interrelationships among the segments.entities.
The Consumer and Business Banking segment primarily provides financial products and services to consumer and commercial customers through the Company’s domestic branch network.network and digital banking platforms. This segment offers consumer and commercial deposits, mortgage and home equity loans, and other products and services. It also originates commercial loans for smallsmall- and medium-sized enterprises through the Company’s branch network. Other products and services provided by this segment include wealth management, treasury management, interest rate risk hedging and foreign exchange services.
The Commercial Banking segment primarily generates commercial loansloan and deposits.deposit products. Commercial loan products include CRE lending, construction financing, commercial business loans andlending, working capital lines of credit, trade finance, loans and letters of credit, CRE loans, construction and land loans, affordable housing loans and letters of credit,lending, asset-based lending, asset-backed finance, project finance and equipment financing. Commercial deposit products and other financial services include treasury management, foreign exchange services and interest rate and commodity risk hedging.
The remaining centralized functions, including the corporate treasury activities of the Company and eliminations of inter-segment amounts, have been aggregated and included in the Other segment, which provides broad administrative support to the 2two core segments, namely the Consumer and Business Banking and the Commercial Banking segments.
The Company utilizes an internal reporting process to measure the performance of the 3three operating segments within the Company. The internal reporting process derives operating segment results by utilizing allocation methodologies for revenues and expenses. Net interest income of each segment represents the difference between actual interest earned on assets and interest incurred on liabilities of the segment, adjusted for funding charges or credits through the Company’s internal funds transfer pricing (“FTP”) process. Noninterest income and noninterest expense directly attributable to a business segment are assigned to that segment. Indirect costs, including technology-related costs and corporate overhead, are allocated based on a segment’s estimated usage using factors including but not limited to, full-time equivalent employees, net interest income, and loan and deposit volume. Charge-offs are bookedrecorded to the segment directly associated with the respective loans charged off, and the provision for credit losses is bookedrecorded to the segments based on the related loans for which allowances are evaluated. The Company’s internal reporting process utilizes a full-allocation methodology. Under this methodology, corporate and indirect expenses incurred by the Other segment are allocated to the Consumer and Business Banking and the Commercial Banking segments, except certain corporate treasury-related expenses and insignificant unallocated expenses.
The corporate treasury function within the Other segment is responsible for the Company’s liquidity and interest rate management, ofand the Company. The Company’s internal FTP process is also managed by the corporate treasury function within the Other segment.process. The FTP process is formulated with the goal of encouraging loan and deposit growth that is consistent with the Company’s overall profitability objectives, as well as providing a reasonable and consistent basis for the measurement of its business segments’ net interest margins and profitability. The FTP process charges a cost to fund loans (“FTP charges for loans”) and allocates credits for funds provided from deposits (“FTP credits for deposits”) using internal FTP rates. FTP charges for loans are determined based on a matched cost of funds, which is tied to the pricing and term characteristics of the loans. FTP credits for deposits are based on matched funding credit rates, which are tied to the implied or stated maturity of the deposits. FTP credits for deposits reflect the long-term value generated by the deposits. The net spread between the total internal FTP charges and credits is recorded as part of net interest income in the Other segment. The FTP process transfers the corporate interest rate risk exposure to the treasury function within the Other segment, where such exposures are centrally managed.
The Company’s internal FTP assumptions and methodologies are reviewed at least annually to ensure that the process is reflective of current market conditions. Effective January 1, 2020, in connection with the adoption of ASU 2016-13, Financial Instruments — Credit Losses (Topic 326), the provision for credit losses is booked by segment based on segment loans against which an allowance is recorded instead of being allocated to segments based on loan volume.
The following tables present the operating results and other key financial measures for the individual operating segments as of and for the years ended December 31, 2020, 20192023, 2022 and 2018:2021:
| | | ($ in thousands) | ($ in thousands) | | Consumer and
Business
Banking | | Commercial
Banking | | Other | | Total |
| Year Ended December 31, 2020 | | | | | | | | |
| ($ in thousands) | |
| ($ in thousands) | |
| ($ in thousands) | |
| ($ in thousands) | |
| ($ in thousands) | |
| ($ in thousands) | |
| ($ in thousands) | |
| ($ in thousands) | |
| ($ in thousands) | |
| ($ in thousands) | |
| ($ in thousands) | |
| ($ in thousands) | |
| ($ in thousands) | |
| ($ in thousands) | |
| ($ in thousands) | |
| ($ in thousands) | |
| ($ in thousands) | |
| ($ in thousands) | |
| ($ in thousands) | |
| ($ in thousands) | |
| ($ in thousands) | |
| ($ in thousands) | |
| ($ in thousands) | |
| ($ in thousands) | |
| ($ in thousands) | |
| ($ in thousands) | | | Consumer and Business Banking | | Commercial Banking | | Other | | Total |
| Year Ended December 31, 2023 | |
| | Net interest income before provision for credit losses | |
| | Net interest income before provision for credit losses | |
| | Net interest income before provision for credit losses | Net interest income before provision for credit losses | | $ | 530,829 | | | $ | 706,286 | | | $ | 140,078 | | | $ | 1,377,193 | |
| Provision for credit losses | Provision for credit losses | | 3,885 | | | 206,768 | | | 0 | | | 210,653 | |
| Noninterest income | Noninterest income | | 67,115 | | | 139,365 | | | 29,067 | | | 235,547 | |
| Noninterest expense | Noninterest expense | | 331,750 | | | 266,923 | | | 117,649 | | | 716,322 | |
| | Segment income before income taxes | | 262,309 | | | 371,960 | | | 51,496 | | | 685,765 | |
| Segment income (loss) before income taxes | |
| Segment income (loss) before income taxes | |
| Segment income (loss) before income taxes | |
| Segment net income | Segment net income | | $ | 187,931 | | | $ | 266,342 | | | $ | 113,524 | | | $ | 567,797 | |
| As of December 31, 2020 | | | | | | | | |
| As of December 31, 2023 | |
| | Segment assets | Segment assets | | $ | 13,351,060 | | | $ | 26,958,766 | | | $ | 11,847,087 | | | $ | 52,156,913 | |
| | Segment assets | |
| | Segment assets | |
|
| | | ($ in thousands) | ($ in thousands) | | Consumer and
Business
Banking | | Commercial
Banking | | Other | | Total |
| Year Ended December 31, 2019 | | | | | | | | |
| ($ in thousands) | |
| ($ in thousands) | |
| ($ in thousands) | |
| ($ in thousands) | |
| ($ in thousands) | |
| ($ in thousands) | |
| ($ in thousands) | |
| ($ in thousands) | |
| ($ in thousands) | |
| ($ in thousands) | |
| ($ in thousands) | |
| ($ in thousands) | |
| ($ in thousands) | |
| ($ in thousands) | |
| ($ in thousands) | |
| ($ in thousands) | |
| ($ in thousands) | |
| ($ in thousands) | |
| ($ in thousands) | |
| ($ in thousands) | |
| ($ in thousands) | |
| ($ in thousands) | |
| ($ in thousands) | |
| ($ in thousands) | |
| ($ in thousands) | |
| ($ in thousands) | | | Consumer and Business Banking | | Commercial Banking | | Other | | Total |
| Year Ended December 31, 2022 | |
| | Net interest income before provision for credit losses | | $ | 696,551 | | | $ | 651,413 | | | $ | 119,849 | | | $ | 1,467,813 | |
| Net interest income (loss) before provision for credit losses | |
| | Net interest income (loss) before provision for credit losses | |
| | Net interest income (loss) before provision for credit losses | |
| Provision for credit losses | Provision for credit losses | | 14,178 | | | 84,507 | | | 0 | | | 98,685 | |
| Noninterest income | Noninterest income | | 57,920 | | | 134,622 | | | 29,703 | | | 222,245 | |
| Noninterest expense | Noninterest expense | | 343,001 | | | 263,064 | | | 141,391 | | | 747,456 | |
| | Segment income before income taxes | | 397,292 | | | 438,464 | | | 8,161 | | | 843,917 | |
| Segment income (loss) before income taxes | |
| Segment income (loss) before income taxes | |
| Segment income (loss) before income taxes | |
| Segment net income | Segment net income | | $ | 284,161 | | | $ | 313,833 | | | $ | 76,041 | | | $ | 674,035 | |
| As of December 31, 2019 | | | | | | | | |
| As of December 31, 2022 | |
| | Segment assets | Segment assets | | $ | 11,520,586 | | | $ | 25,501,534 | | | $ | 7,173,976 | | | $ | 44,196,096 | |
| | Segment assets | |
| | Segment assets | |
|
| | | ($ in thousands) | ($ in thousands) | | Consumer and
Business
Banking | | Commercial
Banking | | Other | | Total |
| Year Ended December 31, 2018 | | | | | | | | |
| ($ in thousands) | |
| ($ in thousands) | |
| ($ in thousands) | |
| ($ in thousands) | |
| ($ in thousands) | |
| ($ in thousands) | |
| ($ in thousands) | |
| ($ in thousands) | |
| ($ in thousands) | |
| ($ in thousands) | |
| ($ in thousands) | |
| ($ in thousands) | |
| ($ in thousands) | |
| ($ in thousands) | |
| ($ in thousands) | |
| ($ in thousands) | |
| ($ in thousands) | |
| ($ in thousands) | |
| ($ in thousands) | |
| ($ in thousands) | |
| ($ in thousands) | |
| ($ in thousands) | |
| ($ in thousands) | |
| ($ in thousands) | |
| ($ in thousands) | |
| ($ in thousands) | | | Consumer and Business Banking | | Commercial Banking | | Other | | Total |
| Year Ended December 31, 2021 | |
| | Net interest income before provision for credit losses | | $ | 727,215 | | | $ | 605,650 | | | $ | 53,643 | | | $ | 1,386,508 | |
| Provision for credit losses | | 9,364 | | | 54,891 | | | 0 | | | 64,255 | |
| Net interest income before reversal of provision for credit losses | |
| | Net interest income before reversal of provision for credit losses | |
| | Net interest income before reversal of provision for credit losses | |
| Reversal of provision for credit losses | |
| Noninterest income | Noninterest income | | 85,607 | | | 110,287 | | | 21,539 | | | 217,433 | |
| Noninterest expense | Noninterest expense | | 341,396 | | | 237,520 | | | 142,074 | | | 720,990 | |
| | Segment income (loss) before income taxes | Segment income (loss) before income taxes | | 462,062 | | | 423,526 | | | (66,892) | | | 818,696 | |
| Segment income (loss) before income taxes | |
| Segment income (loss) before income taxes | |
| Segment net income | Segment net income | | $ | 330,683 | | | $ | 303,553 | | | $ | 69,465 | | | $ | 703,701 | |
| As of December 31, 2018 | | | | | | | | |
| As of December 31, 2021 | |
| | Segment assets | Segment assets | | $ | 10,587,621 | | | $ | 23,761,469 | | | $ | 6,693,266 | | | $ | 41,042,356 | |
| | Segment assets | |
| | Segment assets | |
|
Note 1918 — Parent Company Condensed Financial Statements
The principal sources of East West’s income (on a Parent Company-only basis) are dividends from the Bank. In addition to dividend restrictions set forth in statutes and regulations, the banking agencies have the authority to prohibit or to limit the Bank from paying dividends, if, in the banking regulator’s opinion, payment of a dividend would constitute an unsafe or unsound practice in light of the financial condition of the Bank. The Bank declared $511.0 million, $190.0 million and $160.0 million of dividends to East West during the years ended December 31, 2020, 2019 and 2018, respectively.
The following tables present the Parent Company-only condensed financial statements:
CONDENSED BALANCE SHEET
| | | | | | | | | | | | | | |
|
| ($ in thousands, except shares) | | December 31, |
| 2020 | | 2019 |
| ASSETS | | | | |
| Cash and cash equivalents due from subsidiary bank | | $ | 439,065 | | | $ | 166,131 | |
| | | | |
| Investments in subsidiaries: | | | | |
| Bank | | 5,048,896 | | | 4,987,666 | |
| Nonbank | | 6,738 | | | 5,630 | |
| Investments in tax credit investments, net | | 6,586 | | | 11,637 | |
| Other assets | | 3,072 | | | 4,091 | |
| TOTAL | | $ | 5,504,357 | | | $ | 5,175,155 | |
| LIABILITIES | | | | |
| Long-term debt | | $ | 147,376 | | | $ | 147,101 | |
| Accrued income tax payable | | 81,741 | | | 4,534 | |
| Other liabilities | | 6,065 | | | 5,903 | |
| Total liabilities | | 235,182 | | | 157,538 | |
| STOCKHOLDERS’ EQUITY | | | | |
| Common stock, $0.001 par value, 200,000,000 shares authorized; 167,240,600 and 166,621,959 shares issued in 2020 and 2019, respectively | | 167 | | | 167 | |
| Additional paid-in capital | | 1,858,352 | | | 1,826,345 | |
| Retained earnings | | 4,000,414 | | | 3,689,377 | |
| Treasury stock, at cost 25,675,371 shares in 2020 and 20,996,574 shares in 2019 | | (634,083) | | | (479,864) | |
| AOCI, net of tax | | 44,325 | | | (18,408) | |
| Total stockholders’ equity | | 5,269,175 | | | 5,017,617 | |
| TOTAL | | $ | 5,504,357 | | | $ | 5,175,155 | |
|
CONDENSED STATEMENT OF INCOME
| | | | | | | | | | | | | | | | | | | | |
|
| ($ in thousands) | | Year Ended December 31, |
| 2020 | | 2019 | | 2018 |
| Dividends from subsidiaries: | | | | | | |
| Bank | | $ | 511,000 | | | $ | 190,000 | | | $ | 160,000 | |
| Nonbank | | 109 | | | 189 | | | 175 | |
| | | | | | |
| Other income | | 3 | | | 425 | | | 2 | |
| Total income | | 511,112 | | | 190,614 | | | 160,177 | |
| Interest expense on long-term debt | | 3,877 | | | 6,482 | | | 6,488 | |
| Compensation and employee benefits | | 6,210 | | | 5,479 | | | 5,559 | |
| Amortization of tax credit and other investments | | 1,248 | | | 8,437 | | | 413 | |
| Other expense | | 1,184 | | | 1,487 | | | 1,490 | |
| Total expense | | 12,519 | | | 21,885 | | | 13,950 | |
| Income before income tax benefit and equity in undistributed income of subsidiaries | | 498,593 | | | 168,729 | | | 146,227 | |
| Income tax benefit | | 4,158 | | | 6,737 | | | 3,404 | |
| Undistributed earnings of subsidiaries, primarily bank | | 65,046 | | | 498,569 | | | 554,070 | |
| Net income | | $ | 567,797 | | | $ | 674,035 | | | $ | 703,701 | |
|
| | | | | | | | | | | | | | |
|
| | December 31, |
| ($ in thousands) | | 2023 | | 2022 |
| ASSETS | | | | |
| Cash and cash equivalents due from subsidiary bank | | $ | 445,770 | | | $ | 228,531 | |
| Investments in subsidiaries: | | | | |
| Bank | | 6,542,852 | | | 5,889,775 | |
| Nonbank | | 13,502 | | | 13,846 | |
| Investments in tax credit investments, net | | — | | | 1,925 | |
| Other assets | | 120,742 | | | 8,516 | |
| TOTAL | | $ | 7,122,866 | | | $ | 6,142,593 | |
| LIABILITIES AND STOCKHOLDERS’ EQUITY | | | | |
| Long-term debt | | $ | 148,249 | | | $ | 147,950 | |
| Other liabilities | | 23,783 | | | 10,031 | |
| | | | |
| | | | |
| | | | |
| | | | |
| | | | |
| | | | |
| | | | |
| Stockholders’ equity | | 6,950,834 | | | 5,984,612 | |
| TOTAL | | $ | 7,122,866 | | | $ | 6,142,593 | |
|
CONDENSED STATEMENT OF INCOME
| | | | | | | | | | | | | | | | | | | | |
|
| | Year Ended December 31, |
| ($ in thousands) | | 2023 | | 2022 | | 2021 |
| Dividends from subsidiaries: | | | | | | |
| Bank | | $ | 704,000 | | | $ | 240,000 | | | $ | 200,000 | |
| Nonbank | | 322 | | | 157 | | | 82 | |
| Other investment losses | | (2,738) | | | — | | | — | |
| Other income | | — | | | — | | | 11 | |
| Total income | | 701,584 | | | 240,157 | | | 200,093 | |
| Interest expense on long-term debt | | 10,889 | | | 5,450 | | | 2,974 | |
| Compensation and employee benefits | | 7,204 | | | 6,708 | | | 6,370 | |
| (Impairment recoveries) amortization of tax credit and other investments | | (2,901) | | | (786) | | | 425 | |
| Other expense | | 1,815 | | | 2,040 | | | 1,306 | |
| Total expense | | 17,007 | | | 13,412 | | | 11,075 | |
| Income before income tax benefit and equity in undistributed income of subsidiaries | | 684,577 | | | 226,745 | | | 189,018 | |
| Income tax benefit | | 5,844 | | | 4,269 | | | 3,005 | |
| Undistributed earnings of subsidiaries, primarily bank | | 470,740 | | | 897,069 | | | 680,958 | |
| Net income | | $ | 1,161,161 | | | $ | 1,128,083 | | | $ | 872,981 | |
|
CONDENSED STATEMENT OF CASH FLOWS
| | | ($ in thousands) | | Year Ended December 31, |
| | | Year Ended December 31, | |
| | Year Ended December 31, | |
| | Year Ended December 31, | |
| | Year Ended December 31, | |
| | Year Ended December 31, | |
| | Year Ended December 31, | |
| | Year Ended December 31, | |
| | Year Ended December 31, | |
| | Year Ended December 31, | |
| | Year Ended December 31, | |
| | Year Ended December 31, | |
| | Year Ended December 31, | |
| | Year Ended December 31, | |
| | Year Ended December 31, | |
| | Year Ended December 31, | |
| | Year Ended December 31, | |
| | Year Ended December 31, | |
| | Year Ended December 31, | |
| | Year Ended December 31, | |
| | Year Ended December 31, | |
| ($ in thousands) | ($ in thousands) | | 2020 | | 2019 | | 2018 | ($ in thousands) | | 2023 | | 2022 | | 2021 |
| | Net income | Net income | | $ | 567,797 | | | $ | 674,035 | | | $ | 703,701 | |
| Net income | |
| Net income | |
| Adjustments to reconcile net income to net cash provided by operating activities: | Adjustments to reconcile net income to net cash provided by operating activities: | |
| Undistributed earnings of subsidiaries, principally bank | Undistributed earnings of subsidiaries, principally bank | | (65,046) | | | (498,569) | | | (554,070) | |
| Amortization expenses | | 1,523 | | | 8,703 | | | 671 | |
| Undistributed earnings of subsidiaries, principally bank | |
| Undistributed earnings of subsidiaries, principally bank | |
| | Deferred income tax expense (benefit) | Deferred income tax expense (benefit) | | 491 | | | (10,132) | | | 3,517 | |
| | Deferred income tax expense (benefit) | |
| Deferred income tax expense (benefit) | |
| Net change in other assets | Net change in other assets | | 40 | | | 10,246 | | | (595) | |
| Net change in other liabilities | Net change in other liabilities | | 77,052 | | | (18) | | | (45) | |
| | Other operating activities, net | |
| Net cash provided by operating activities | Net cash provided by operating activities | | 581,857 | | | 184,265 | | | 153,179 | |
| CASH FLOWS FROM INVESTING ACTIVITIES | CASH FLOWS FROM INVESTING ACTIVITIES | | | | | | |
| Net increase in investments in tax credit investments | Net increase in investments in tax credit investments | | (172) | | | (292) | | | (1,049) | |
| Net increase in investments in tax credit investments | |
| Net increase in investments in tax credit investments | |
| Distributions received from equity method investees | Distributions received from equity method investees | | 4,096 | | | 2,577 | | | 1,491 | |
| Net increase in investments in and advances to nonbank subsidiaries | | (2,732) | | | (3,314) | | | 0 | |
| Other investing activities | | 0 | | | (157) | | | 0 | |
| | Net cash provided by (used in) investing activities | | 1,192 | | | (1,186) | | | 442 | |
| Other investing activities, net | |
| Other investing activities, net | |
| Other investing activities, net | |
| Net cash used in investing activities | |
| CASH FLOWS FROM FINANCING ACTIVITIES | CASH FLOWS FROM FINANCING ACTIVITIES | | | | | | |
| | Repayment of long-term debt | | 0 | | | 0 | | | (25,000) | |
| Common stock: | |
| Common stock: | |
| Common stock: | Common stock: | |
| Proceeds from issuance pursuant to various stock compensation plans and agreements | Proceeds from issuance pursuant to various stock compensation plans and agreements | | 2,326 | | | 3,383 | | | 2,846 | |
| Proceeds from issuance pursuant to various stock compensation plans and agreements | |
| Proceeds from issuance pursuant to various stock compensation plans and agreements | |
| Stock tendered for payment of withholding taxes | Stock tendered for payment of withholding taxes | | (8,253) | | | (14,635) | | | (15,634) | |
| Repurchased of common stock pursuant to the Stock Repurchase Program | | (145,966) | | | 0 | | | 0 | |
| Repurchase of common stock pursuant to the stock repurchase program | |
| Cash dividends paid | Cash dividends paid | | (158,222) | | | (155,107) | | | (125,988) | |
| | Net cash used in financing activities | Net cash used in financing activities | | (310,115) | | | (166,359) | | | (163,776) | |
| Net increase (decrease) in cash and cash equivalents | Net increase (decrease) in cash and cash equivalents | | 272,934 | | | 16,720 | | | (10,155) | |
| Cash and cash equivalents, beginning of year | Cash and cash equivalents, beginning of year | | 166,131 | | | 149,411 | | | 159,566 | |
| Cash and cash equivalents, end of year | Cash and cash equivalents, end of year | | $ | 439,065 | | | $ | 166,131 | | | $ | 149,411 | |
|
Note 2019 — Subsequent Events
Declaration of Dividend — On January 28, 2021,23, 2024, the Company’s Board of Directors declared first quarter 20212024 cash dividends for the Company’s common stock. The common stock cash dividend of $0.33$0.55 per share was paid on February 23, 202115, 2024 to stockholders of record as of February 9, 2021.2, 2024.
Supplementary DataRedemption of Junior Subordinated Debt and Trust Preferred Securities Issued by East West Capital Trusts — In January 2024, the Company provided notice that it would redeem $113 million of the principal face value of junior subordinated debt and $4 million of the principal face value of trust preferred securities issued by the East West Capital Trusts. Of these amounts, $16 million was redeemed in February 2024 and the remaining $101 million is scheduled to be redeemed in March 2024.
Quarterly Financial Information (Unaudited)
| | | | | | | | | | | | | | | | | | | | | | | | | | |
|
| ($ and shares in thousands, except per share data) | | 2020 Quarters |
| Fourth | | Third | | Second | | First |
| Interest and dividend income | | $ | 381,348 | | | $ | 365,728 | | | $ | 398,776 | | | $ | 449,190 | |
| Interest expense | | 34,767 | | | 41,598 | | | 55,001 | | | 86,483 | |
| Net interest income before provision for credit losses | | 346,581 | | | 324,130 | | | 343,775 | | | 362,707 | |
| Provision for credit losses | | 24,340 | | | 10,000 | | | 102,443 | | | 73,870 | |
| Net interest income after provision for credit losses | | 322,241 | | | 314,130 | | | 241,332 | | | 288,837 | |
| Noninterest income | | 69,832 | | | 54,503 | | | 55,707 | | | 55,505 | |
| Noninterest expense | | 178,651 | | | 172,573 | | | 184,766 | | | 180,332 | |
| Income before income taxes | | 213,422 | | | 196,060 | | | 112,273 | | | 164,010 | |
| Income tax expense | | 49,338 | | | 36,523 | | | 12,921 | | | 19,186 | |
| Net income | | $ | 164,084 | | | $ | 159,537 | | | $ | 99,352 | | | $ | 144,824 | |
| | | | | | | | |
| EPS | | | | | | | | |
| - Basic | | $ | 1.16 | | | $ | 1.13 | | | $ | 0.70 | | | $ | 1.00 | |
| - Diluted | | $ | 1.15 | | | $ | 1.12 | | | $ | 0.70 | | | $ | 1.00 | |
| Weighted-average number of shares outstanding | | | | | | | | |
| - Basic | | 141,564 | | 141,498 | | 141,486 | | 144,814 |
| - Diluted | | 142,529 | | 142,043 | | 141,827 | | 145,285 |
| | | | | | | | |
|
| | | | | | | | | | | | | | | | | | | | | | | | | | |
|
| ($ and shares in thousands, except per share data) | | 2019 Quarters |
| Fourth | | Third | | Second | | First |
| Interest and dividend income | | $ | 467,233 | | | $ | 476,912 | | | $ | 474,844 | | | $ | 463,311 | |
| Interest expense | | 99,014 | | | 107,105 | | | 107,518 | | | 100,850 | |
| Net interest income before provision for credit losses | | 368,219 | | | 369,807 | | | 367,326 | | | 362,461 | |
| Provision for credit losses | | 18,577 | | | 38,284 | | | 19,245 | | | 22,579 | |
| Net interest income after provision for credit losses | | 349,642 | | | 331,523 | | | 348,081 | | | 339,882 | |
| Noninterest income | | 65,797 | | | 55,349 | | | 56,519 | | | 44,580 | |
| Noninterest expense | | 196,157 | | | 180,505 | | | 181,423 | | | 189,371 | |
| Income before income taxes | | 219,282 | | | 206,367 | | | 223,177 | | | 195,091 | |
| Income tax expense | | 31,067 | | | 34,951 | | | 72,797 | | | 31,067 | |
| Net income | | $ | 188,215 | | | $ | 171,416 | | | $ | 150,380 | | | $ | 164,024 | |
| | | | | | | | |
| EPS | | | | | | | | |
| - Basic | | $ | 1.29 | | | $ | 1.18 | | | $ | 1.03 | | | $ | 1.13 | |
| - Diluted | | $ | 1.29 | | | $ | 1.17 | | | $ | 1.03 | | | $ | 1.12 | |
| Weighted-average number of shares outstanding | | | | | | | | |
| - Basic | | 145,624 | | 145,559 | | 145,546 | | 145,256 |
| - Diluted | | 146,318 | | 146,120 | | 146,052 | | 145,921 |
| | | | | | | | |
|
ITEM 9. CHANGES IN AND DISAGREEMENTS WITH ACCOUNTANTS ON ACCOUNTING AND FINANCIAL DISCLOSURE
None.
ITEM 9A. CONTROLS AND PROCEDURES
Disclosure Controls and Procedures
As of December 31, 2020,2023, pursuant to Rule 13a-15(b) of the Securities Exchange Act of 1934, as amended (the “Exchange Act”), the Company conducted an evaluation, under the supervision and with the participation of the Company’s management, including the Chief Executive Officer and Chief Financial Officer, of the effectiveness of the Company’s disclosure controls and procedures (as defined in Rule 13a-15(e) of the Exchange Act). Based upon that evaluation, the Company’s Chief Executive Officer and Chief Financial Officer concluded that the Company’s disclosure controls and procedures were effective as of December 31, 2020.2023.
The Company’s disclosure controls and procedures are designed to ensure that information required to be disclosed by the Company in the reports that the Company files or submits under the Exchange Act is recorded, processed, summarized, and reported within the time periods specified in the rules and forms of the U.S. Securities and Exchange Commission (“SEC”). The Company’s disclosure controls and procedures include, without limitation, controls and procedures designed to ensure that information required to be disclosed by the Company in the reports that the Company files under the Exchange Act is accumulated and communicated to the Company’s management, including the Chief Executive Officer and Chief Financial Officer, as appropriate, to allow timely decisions regarding required disclosure.
Management’s Annual Report on Internal Control over Financial Reporting
The Company’s management is responsible for establishing and maintaining adequate internal control over financial reporting (as defined in Rule 13a-15(f) of the Exchange Act). The Company’s internal control over financial reporting is designed to provide reasonable assurance regarding the reliability of financial reporting and the preparation of the Company’s financial statements for external purposes in accordance with U.S. GAAP.
Because of its inherent limitations, internal control over financial reporting may not prevent or detect misstatements. In addition, projections of any evaluation of effectiveness to future periods are subject to the risk that controls may become inadequate because of changes in conditions or that the degree of compliance with policies or procedures may deteriorate.
Management evaluated the effectiveness of the Company’s internal control over financial reporting as of December 31, 20202023 using the criteria set forth in Internal Control — Integrated Framework 2013 issued by the Committee of Sponsoring Organization of the Treadway Commission. Based on this evaluation, management concluded that the Company’s internal control over financial reporting was effective as of December 31, 2020.2023.
Changes in Internal Control over Financial Reporting
There were no changes in the Company’s internal control over financial reporting during the quarter ended December 31, 2020,2023, that have materially affected or are reasonably likely to materially affect the Company’s internal control over financial reporting.
Report of Independent Registered Public Accounting Firm
KPMG LLP, the independent registered public accounting firm that audited the Company’s Consolidated Financial Statements, issued an audit report on the effectiveness of internal control over financial reporting as of December 31, 2020.2023. The audit report is presented on the following page.
REPORT OF INDEPENDENT REGISTERED PUBLIC ACCOUNTING FIRM
To the Stockholders and Board of Directors
East West Bancorp, Inc.:
Opinion on Internal Control Over Financial Reporting
We have audited East West Bancorp, Inc. and subsidiaries’ (the Company) internal control over financial reporting as of December 31, 2020,2023, based on criteria established in Internal Control — Integrated Framework (2013) issued by the Committee
of Sponsoring Organizations of the Treadway Commission. In our opinion, the Company maintained, in all material respects, effective internal control over financial reporting as of December 31, 2020,2023, based on criteria established in Internal Control — Integrated Framework (2013) issued by the Committee of Sponsoring Organizations of the Treadway Commission.
We also have audited, in accordance with the standards of the Public Company Accounting Oversight Board (United States) (PCAOB), the consolidated balance sheetsheets of the Company as of December 31, 20202023 and 2019,2022, the related consolidated statements of income, comprehensive income, changes in stockholders’ equity, and cash flows for each of the years in the three-year period ended December 31, 2020,2023, and the related notes (collectively, the consolidated financial statements), and our report dated February 26, 202128, 2024 expressed an unqualified opinion on those consolidated financial statements.
Basis for Opinion
The Company’s management is responsible for maintaining effective internal control over financial reporting and for its assessment of the effectiveness of internal control over financial reporting, included in the accompanying Management’s Annual Report on Internal Control over Financial Reporting. Our responsibility is to express an opinion on the Company’s internal control over financial reporting based on our audit. We are a public accounting firm registered with the PCAOB and are required to be independent with respect to the Company in accordance with the U.S. federal securities laws and the applicable rules and regulations of the Securities and Exchange Commission and the PCAOB.
We conducted our audit in accordance with the standards of the PCAOB. Those standards require that we plan and perform the audit to obtain reasonable assurance about whether effective internal control over financial reporting was maintained in all material respects. Our audit of internal control over financial reporting included obtaining an understanding of internal control over financial reporting, assessing the risk that a material weakness exists, and testing and evaluating the design and operating effectiveness of internal control based on the assessed risk. Our audit also included performing such other procedures as we considered necessary in the circumstances. We believe that our audit provides a reasonable basis for our opinion.
Definition and Limitations of Internal Control Over Financial Reporting
A company’s internal control over financial reporting is a process designed to provide reasonable assurance regarding the reliability of financial reporting and the preparation of financial statements for external purposes in accordance with generally accepted accounting principles. A company’s internal control over financial reporting includes those policies and procedures that (1) pertain to the maintenance of records that, in reasonable detail, accurately and fairly reflect the transactions and dispositions of the assets of the company; (2) provide reasonable assurance that transactions are recorded as necessary to permit preparation of financial statements in accordance with generally accepted accounting principles, and that receipts and expenditures of the company are being made only in accordance with authorizations of management and directors of the company; and (3) provide reasonable assurance regarding prevention or timely detection of unauthorized acquisition, use, or disposition of the company’s assets that could have a material effect on the financial statements.
Because of its inherent limitations, internal control over financial reporting may not prevent or detect misstatements. Also, projections of any evaluation of effectiveness to future periods are subject to the risk that controls may become inadequate because of changes in conditions, or that the degree of compliance with the policies or procedures may deteriorate.
/s/KPMG LLP
Los Angeles, California
February 26, 202128, 2024
ITEM 9B. OTHER INFORMATION
None.During the three months ended December 31, 2023, none of the Company’s directors or Section 16 reporting officers adopted or terminated any Rule 10b5-1 trading arrangement or non-Rule 10b5-1 trading arrangement (as such terms are defined in Item 408 of the SEC’s Regulation S-K).
ITEM 9C. DISCLOSURE REGARDING FOREIGN JURISDICTIONS THAT PREVENT INSPECTIONS
Not applicable.
PART III
ITEM 10. DIRECTORS, EXECUTIVE OFFICERS AND CORPORATE GOVERNANCE
Information about our Executive Officers
The following table presents the Company’s executive officers’ names ages, positions and offices, and business experience during the last five years as of February 26, 2021. There is no family relationship between any of the Company’s executive officers, or directors. Each officerand biographical information for each, is appointed by the Board of Directors of the Company or the Bank and serves at their pleasure.
| | | | | | | | | | | | | | | | |
| | | | | | |
Name | | Age (1)
| | Positions and Offices, and Business Experience | | |
Dominic Ng | | 62 | | Chairman and Chief Executive Officer of the Company and the Bank since 1992. | | |
| | | | | | |
Douglas P. Krause | | 64 | | Vice Chairman and Chief Corporate Officer of the Company and the Bank since 2020, prior to which he had been Executive Vice President and General Counsel and Secretary since 1996. | | |
Irene H. Oh | | 43 | | Executive Vice President and Chief Financial Officer of the Company and the Bank since 2010. | | |
Andy Yen | | 63 | | Executive Vice President and Head of International and Commercial Banking since 2013. | | |
| | | | | | |
Gary Teo | | 48 | | Senior Vice President and Head of Human Resources of the Company and the Bank since 2015. | | |
| | |
(1)set forth in As of February 26, 2021.
Code of Conduct
The Company has adopted a code of conduct that applies to its principal executive officer, principal financial and accounting officer, controller, and persons performing similar functions. The code of conduct is posted on the Company’s website at Item 1. Business — Information about our Executive Officerswww.eastwestbank.com/govdocs in this Form 10-K.. Any amendments to, or waivers from, the Company’s Code of Conduct will be disclosed on the Company’s website at http://investor.eastwestbank.com.
Additional Information
The other information required by this item will be set forth in the following sections of the Company’s definitive proxy statement for its 20212024 Annual Meeting of ShareholdersStockholders (the “2021“2024 Proxy Statement”), which will be filed with the SEC pursuant to Regulation 14A within 120 days of the Company’s fiscal year ended December 31, 20202023, and this information is incorporated herein by reference:
•Summary Information about Director Nominees
•Board of Directors and Nominees
•Director Nominee Qualifications and Experience
•Director Independence, Financial Experts and Risk Management Experience
•Board Leadership Structure
•Board Meetings
•Board Committees
The Company has adopted a Code of Conduct that applies to its principal executive officer, principal financial and Committeesaccounting officer, controller, and persons performing similar functions. The Code of Conduct is posted on the Company’s website at www.eastwestbank.com/govdocs. Any amendments to, or waivers from, the Company’s Code of Conduct will be disclosed on the Company’s website at http://investor.eastwestbank.com.
ITEM 11. EXECUTIVE COMPENSATION
Information regarding the Company’s executive compensation will be set forth in the following sections of the 20212024 Proxy Statement and this information is incorporated herein by reference:
•Director Compensation
•Compensation Discussion and Analysis
ITEM 12. SECURITY OWNERSHIP OF CERTAIN BENEFICIAL OWNERS AND MANAGEMENT AND RELATED STOCKHOLDER MATTERS
Information concerning security ownership of certain beneficial owners and management not otherwise included herein will be set forth in the 20212024 Proxy Statement under the heading “Stock Ownership of Principal Stockholders, Directors and Management” and this information is incorporated herein by reference.
Securities Authorized for Issuance under Equity Compensation Plans
The following table sets forth the total number of shares available for issuance under the Company’s employee equity compensation plans as of December 31, 2020:2023:
| | | Plan Category | Plan Category | | Number of Securities to be Issued upon Exercise of Outstanding Options | | Weighted-Average Exercise Price of Outstanding Options | | Number of Securities Remaining Available for Future Issuance under Equity Compensation Plans | |
| Plan Category | |
| Plan Category | |
| Plan Category | |
| Plan Category | |
| Plan Category | |
| Plan Category | |
| Plan Category | |
| Plan Category | |
| Plan Category | |
| Plan Category | |
| Plan Category | |
| Plan Category | |
| Plan Category | |
| Plan Category | |
| Plan Category | |
| Plan Category | |
| Plan Category | |
| Plan Category | |
| Plan Category | |
| Plan Category | |
| Equity compensation plans approved by security holders | |
| Equity compensation plans approved by security holders | |
| Equity compensation plans approved by security holders | Equity compensation plans approved by security holders | | — | | | $ | — | | | 2,767,391 | | (1) | | — | | | $ | | $ | — | | | 4,293,085 | | 4,293,085 | | (1) | (1) |
| Equity compensation plans not approved by security holders | Equity compensation plans not approved by security holders | | — | | | — | | | — | | |
| Total | Total | | — | | | $ | — | | | 2,767,391 | | |
| Total | |
| Total | |
|
(1)Represents future shares available under the shareholder-approved 2016stockholder-approved 2021 Stock Incentive Plan effective May 24, 2016.March 4, 2021.
ITEM 13. CERTAIN RELATIONSHIPS AND RELATED TRANSACTIONS AND DIRECTOR INDEPENDENCE
Information regarding certain relationships and related transactions will be set forth in the following sections of the 20212024 Proxy Statement and this information is incorporated herein by reference:
•Director Independence, Financial Experts and Risk Management Experience
•Certain Relationships and Related Transactions
ITEM 14. PRINCIPAL ACCOUNTANT FEES AND SERVICES
Our independent registered public accounting firm is KPMG LLP, Los Angeles, CA, PCAOB ID: 185.
Information regarding principal accountant fees and services will be set forth in the 20212024 Proxy Statement under the heading “Ratification of Auditors” and this information is incorporated herein by reference.
PART IV
ITEM 15. EXHIBITS AND FINANCIAL STATEMENT SCHEDULES
(1)Financial Statements
The following financial statements of East West Bancorp, Inc. and its subsidiaries, and the auditor’s report thereon are filed as part of this report under Item 8. Financial Statements and Supplementary Data:
(2)Financial Statement Schedules
All financial statement schedules for East West Bancorp, Inc. and its subsidiaries have been included in this Form 10-K in the Consolidated Financial Statements or the related footnotes,notes thereto, or they are either inapplicable or not required.
(3)Exhibits
A list of exhibits to this Form 10-K is set forth below.
| | | | | | | | |
| Exhibit No. | | Exhibit Description |
| 3.1 | | |
| | |
| 3.1.1 | | |
| | |
| 3.1.2 | | |
| | |
| 3.1.3 | | |
| | |
3.23.1.4 | | |
| | |
3.3 | | |
| | |
| 3.1.5 | | |
| 3.1.6 | | |
| 3.2 | | |
| | |
| 4.1 | | |
| | |
| 4.2 | | |
| 4.3 | | |
| | |
| 10.1.1 | | |
| | |
| | | | | | | | |
10.1.310.1.4 | | |
| | |
10.1.410.1.5 | | |
| | |
| | |
10.1.510.1.6 | | |
| 10.1.7 | | |
| 10.1.8 | | |
| 10.2.1 | | |
| | |
| 10.2.2 | | |
| 10.2.3 | | |
| | |
10.2.310.2.4 | | |
| | |
10.2.410.2.5 | | |
| | |
| | |
10.2.510.2.6 | | |
10.310.2.7 | | |
| 10.2.8 | | |
| | |
| | |
| | |
| | |
| | |
| | |
| | |
10.4.110.3.1 | | |
10.4.210.3.2 | | |
| | |
| | |
10.4.310.3.3 | | |
10.5.1 | | |
| | |
| | |
10.5.2 | | |
| | |
10.5.3 | | |
10.6.110.3.4 | | |
| 10.3.5 | | |
| 10.3.6 | | |
| 10.4.1 | | |
| | |
10.6.210.4.2 | | |
| 10.5.1 | | |
10.6.3 | | |
| | |
10.7.1 | | |
| | |
10.7.2 | | |
| | |
| | | | | | | | |
10.7.410.5.2 | | |
| | |
| 10.7.5 | |
| 10.5.3 | | |
| | |
10.7.610.5.4 | | |
| | |
| | |
| | |
10.7.710.6 | | |
| | |
10.8 | | |
| | |
| 10.9 | |
| | |
| | |
| | |
| 21.1 | | |
| | |
| 23.1 | | |
| | |
| 24 | | |
| 31.1 | | |
| | |
| 31.2 | | |
| | |
| 32.1 | | |
| | |
| 32.2 | | |
| | |
| | |
| | |
| 97 | | |
| 101.INS | | The instance document does not appear in the interactive data file because its XBRL tags are embedded within the inline XBRL document. |
| | |
| 101.SCH | | XBRL Taxonomy Extension Schema Document. Filed herewith. |
| | |
| 101.CAL | | XBRL Taxonomy Extension Calculation Linkbase Document. Filed herewith. |
| | |
| 101.DEF | | XBRL Taxonomy Extension Definition Linkbase Document. Filed herewith. |
| | |
| 101.LAB | | XBRL Taxonomy Extension Label Linkbase Document. Filed herewith. |
| | |
| 101.PRE | | XBRL Taxonomy Extension Presentation Linkbase Document. Filed herewith. |
| 104 | | Cover Page Interactive Data (formatted as Inline XBRL and contained in Exhibit 101 filed herewith). Filed herewith. |
| | |
| * Denotes management contract or compensatory plan or arrangement. |
ITEM 16. FORM 10-K SUMMARY
Not applicable.
GLOSSARY OF ACRONYMS
| | | | | | | | | | | |
| AFS | Available-for-sale | GLBA | Gramm-Leach-Bliley Act of 1999 |
| ALCO | Asset/Liability Committee | HELOC | Home equity line of credit |
ALCO | Asset/Liability Committee | IBA | ICE Benchmark Administration |
| AML | Anti-money laundering | IRSHKMA | Internal Revenue ServiceHong Kong Monetary Authority |
| AOCI | Accumulated other comprehensive income (loss) | ISDAHKSFC | International SwapsHong Kong Securities and Derivatives Association, Inc. |
ARRC | Alternative Reference Rates Committee | KRX | Keefe, Bruyette and Woods Nasdaq Regional Banking IndexFutures Commission |
| ASC | Accounting Standards Codification | LCHHTM | London Clearing HouseHeld-to-maturity |
| ASU | Accounting Standards Update | LGDIDI | Loss given defaultInsured depository institution |
| BHC Act | Bank Holding Company Act of 1956, as amended | LCH | London Clearing House |
| BKX | KBW Nasdaq Bank Index | LGD | Loss given default |
| BSA | Bank Secrecy Act | LIBOR | London Interbank Offered Rate |
BSABTFP | Bank Secrecy ActTerm Funding Program | LTV | Loan-to-value |
| C&I | Commercial and industrial | MAS | Monetary Authority of Singapore |
| CCDAA | Climate Corporate Data Accountability Act | MD&A | Management’s Discussion and Analysis of Financial Condition and Results of Operations |
CAACCPA | Consolidated AppropriationsCalifornia Consumer Privacy Act 2021 | MMBTU | Million British thermal unit |
CAP | Compliance Assurance Process | MMLF | Money Market Mutual Fund Liquidity Facility |
CARES Act | Coronavirus Aid, Relief, and Economic Security Act | Moody's | Moody’s Investors Service |
CCPA | California Consumer Privacy Act | MOU | Memorandum of Understanding |
| CECL | Current expected credit losses | MSLPNAFR | Main Street Lending ProgramNational Administration of Financial Regulation |
| CET1 | Common Equity Tier 1 | NAV | Net asset value |
| CFPB | Consumer Financial Protection Bureau | NOLNRSRO | Net operating lossesNationally recognized statistical rating organizations |
| CLO | Collateralized loan obligation | OFAC | Office of Foreign Assets Control |
| CME | Chicago Mercantile Exchange | OREO | Other real estate owned |
COVID-19CODM | Coronavirus Disease 2019Chief operating decision maker | OTTI | Other-than-temporary impairment |
| CRA | Community Reinvestment Act | PCAPATRIOT Act | Prompt Corrective ActionUniting and Strengthening America by Providing Appropriate Tools Required to Intercept and Obstruct Terrorism (USA PATRIOT) Act of 2001 |
| CRE | Commercial real estate | PCDPBOC | Purchased credit deterioratedPeople’s Bank of China |
| CRFRA | Climate-Related Financial Risk Act | DCBPCA | Desert Community Bank | PCI | Purchased credit impairedPrompt Corrective Action |
| DFPI | California Department of Financial Protection and Innovation | PDPCD | Probability of defaultPurchased credit deteriorated |
| DIF | Deposit Insurance Fund | PPPPD | Paycheck Protection ProgramProbability of default |
E&PEFFR | Exploration and productionEffective Fed Funds Rate | PPPLFPIPL | PaycheckPersonal Information Protection Program Liquidity FacilityLaw |
| EGRRCPA | Economic Growth, Regulatory Relief, and Consumer Protection Act | RMB | Chinese Renminbi |
| EPS | Earnings per share | ROAROC | Return on average assetsRisk Oversight Committee |
| ERM | Enterprise risk management | ROE | Return on average common equity |
| EVE | Economic value of equity | RPA | Credit risk participation agreement |
| FASB | Financial Accounting Standards Board | RSU | Restricted stock unit |
FBI | Federal Bureau of Investigation | S&P | Standard & Poor's |
FCA | Financial Conduct Authority | SBA | Small Business Administration |
| FDIA | Federal Deposit Insurance Act | SBLCS&P | Standby letter of creditStandard & Poor's |
| FDIC | Federal Deposit Insurance Corporation | SECSBLC | U.S. Securities and Exchange CommissionStandby letter of credit |
| FFIEC | Federal Financial Institutions Examination Council | SERPSEC | Supplemental Executive Retirement PlanU.S. Securities and Exchange Commission |
| FHLB | Federal Home Loan Bank | SOFR | Secured Overnight Financing Rate |
FOMCFINRA | Federal Open Market CommitteeFinancial Industry Regulatory Authority, Inc. | TDRTCE | Troubled debt restructuringTangible common equity |
| FRBSF | Federal Reserve Bank of San Francisco | U.K.TDR | United KingdomTroubled debt restructuring |
| FTP | Funds transfer pricing | U.S. | United States |
| GAAP | United States Generally Accepted Accounting Principles | USD | U.S. Dollar |
GLBAGDP | Gramm-Leach-Bliley Act of 1999Gross Domestic Product | VIE | Variable interest entity |
| GHG | Greenhouse gas | | |
| | | |
| | | |
| | | |
SIGNATURES
Pursuant to the requirements of Section 13 or 15(d) of the Securities Exchange Act of 1934, the registrant has duly caused this report to be signed on its behalf by the undersigned, thereunto duly authorized.
| | | | | | | | | | | | | | |
| Dated: | February 26, 2021 |
| | |
| | EAST WEST BANCORP, INC.
(Registrant) |
| | |
| | By | /s/ DOMINIC NG | |
| | | Dominic Ng |
| | | Chairman and Chief Executive Officer |
Pursuant to the requirements of the Securities Exchange Act of 1934, this report has been signed below by the following persons on behalf of the registrant and in the capacities and on the dates indicated.
| | | | | | | | | | | | | | |
|
| Signature | | Title | | Date |
| | | | |
| /s/ DOMINIC NG | | Chairman, Chief Executive Officer and Director
(Principal Executive Officer) | | February 26, 202128, 2024 |
| Dominic Ng | | | |
| | | | | |
/s/ IRENE H. OHCHRISTOPHER J. DEL MORAL-NILES | | Executive Vice President and
Chief Financial Officer
(Principal Financial and Accounting Officer) | | February 26, 202128, 2024 |
Irene H. OhChristopher J. Del Moral-Niles | | | |
| | | | | |
/s/ MOLLY CAMPBELLMANUEL P. ALVAREZ* | | Director | | February 26, 202128, 2024 |
| Manuel P. Alvarez | | | | |
| | | | |
| MOLLY CAMPBELL* | | Director | | February 28, 2024 |
| Molly Campbell | | | | |
| | | | |
/s/ IRIS S. CHANARCHANA DESKUS* | | Director | | February 26, 2021 |
Iris S. Chan | | | | |
| | | | |
/s/ ARCHANA DESKUS | | Director | | February 26, 202128, 2024 |
| Archana Deskus | | | | |
| | | | |
| SERGE DUMONT* | | Director | | | February 28, 2024 |
/s/ Serge Dumont | | | | |
| | | | |
RUDOLPH I. ESTRADAESTRADA* | | Lead Director | | February 26, 202128, 2024 |
| Rudolph I. Estrada | | | | |
| | | | |
| MARK HUTCHINS | | Director | | February 28, 2024 |
/s/ Mark Hutchins | | | | |
| | | | |
PAUL H. IRVINGIRVING* | | Director | | February 26, 202128, 2024 |
| Paul H. Irving | | | | |
| | | | |
| | | | |
| | | | |
| | | | |
/s/ JACK C. LIUSABRINA KAY* | | Director | | February 26, 202128, 2024 |
| Sabrina Kay | | | | |
| | | | |
| JACK C. LIU* | | Director | | February 28, 2024 |
| Jack C. Liu | | | | |
| | | | |
| | | | |
/s/ LESTER M. SUSSMANSUSSMAN* | | Director | | February 26, 202128, 2024 |
| Lester M. Sussman | | | | |
| | | | |
| | | | |
| | | | |
|
* Dominic Ng, by signing his name hereto, does hereby sign this document on behalf of each of the above named directors of the registrant pursuant to powers of attorney duly executed by such persons.
| | | | | | | | | | | | | | |
| Dated: February 28, 2024 | |
| | By | /s/ DOMINIC NG | |
| | | Dominic Ng |
| | | Attorney-In-Fact | |
| | | Chairman and Chief Executive Officer |