Background
The disclosures set forth in this item are qualified by Item 1A. Risk Factors and the section captioned “Forward-Looking Statements,” “Additional Information about the Merger and Where to Find It” and “Participants in the Solicitation”Statements” in Item 7. Management’s Discussion and Analysis of Financial Condition and Results of Operations of this report and other cautionary statements set forth elsewhere in this report.
Texas Capital Bancshares, Inc. (“we,” “us,” “TCBI” or the “Company”), a Delaware corporation organized in 1996, is the parent of Texas Capital Bank, National Association (the “Bank”). The Company is a registered bank holding company and has elected to be a financial holding company.
The Bank is headquartered in Dallas, with primary banking offices in Austin, Dallas, Fort Worth, Houston and San Antonio, the five largest metropolitan areas of Texas. Substantially all of our business activities are conducted through the Bank. We have focused on organic growth, maintenance of credit quality and recruiting and retaining experienced bankers with strong personal and professional relationships in their communities.
We serve the needs of commercial businesses and successful professionals and entrepreneurs located in Texas as well as operate several lines of business servingthat serve a regional or national clientele of commercial borrowers. We are primarily a secured lender, with the majority of our loans held for investment, excluding mortgage finance loans and other national lines of business, being made to businesses headquartered or with operations in Texas. Our national lines of business provide specialized lending products to businesses throughout the United States. We have benefitted from the success of our business model since inception, producing strong loan and deposit growth and favorable loss experience amidst a challenging environment for banking nationally.
On December 9, 2019, the Company and Independent Bank Group, Inc. ("IBTX") entered into an Agreement and Plan of Merger (the "Merger Agreement"), pursuant to which, we referon the terms and subject to as the merger agreement, with Independent Bank Group, Inc. ("IBTX") under whichconditions therein, the companies will combine in an all-stock merger of equals, with IBTX as the surviving entity, which we refer to as the merger. Immediately following the merger, the Bank will mergeCompany would be merged with and into IBTX’s wholly owned subsidiary, Independent Bank,IBTX. On May 22, 2020, the Company and IBTX entered into an agreement pursuant to which the parties mutually agreed to terminate the Merger Agreement. Neither party paid a termination fee in connection with Independent Bank as the surviving bank. The nametermination of the surviving entity will be Independent Bank Group, Inc. and the name of the surviving bank will be Texas Capital Bank. The surviving bank will be operated under the name Independent Financial in Colorado and under the name Texas Capital Bank in Texas. The surviving entity will trade under the Independent Bank Group ticker symbol "IBTX" on the Nasdaq Global Select Market.Merger Agreement.
Growth History
We have grown substantially in both size and profitability since our formation. In 2020, we continued to experience growth in most of our key areas of business, however we did experience a decline in certain loan portfolios as we strategically reduced certain portfolios. The table below sets forth data regarding the growth ofour key areas of our business for the past five years:years.
| December 31, | |||||||||||||||||||
| (in thousands) | 2019 | 2018 | 2017 | 2016 | 2015 | ||||||||||||||
| Loans held for sale | $ | 2,577,134 | $ | 1,969,474 | $ | 1,011,004 | $ | 968,929 | $ | 86,075 | |||||||||
| Loans held for investment, mortgage finance | 8,169,849 | 5,877,524 | 5,308,160 | 4,497,338 | 4,966,276 | ||||||||||||||
| Loans held for investment, net | 16,476,413 | 16,690,550 | 15,366,252 | 13,001,011 | 11,745,674 | ||||||||||||||
| Assets | 32,548,069 | 28,257,767 | 25,075,645 | 21,697,134 | 18,903,821 | ||||||||||||||
| Demand deposits | 9,438,459 | 7,317,161 | 7,812,660 | 7,994,201 | 6,386,911 | ||||||||||||||
| Total deposits | 26,478,593 | 20,606,113 | 19,123,180 | 17,016,831 | 15,084,619 | ||||||||||||||
| Stockholders’ equity | 2,832,258 | 2,500,394 | 2,202,721 | 2,009,557 | 1,623,533 | ||||||||||||||
| December 31, | |||||||||||||||||||||||||||||
| (in thousands) | 2020 | 2019 | 2018 | 2017 | 2016 | ||||||||||||||||||||||||
| Loans held for sale | $ | 283,165 | $ | 2,577,134 | $ | 1,969,474 | $ | 1,011,004 | 968,929 | ||||||||||||||||||||
| Loans held for investment, mortgage finance | 9,079,409 | 8,169,849 | 5,877,524 | 5,308,160 | 4,497,338 | ||||||||||||||||||||||||
| Loans held for investment, net | 15,351,451 | 16,476,413 | 16,690,550 | 15,366,252 | 13,001,011 | ||||||||||||||||||||||||
| Assets | 37,726,096 | 32,548,069 | 28,257,767 | 25,075,645 | 21,697,134 | ||||||||||||||||||||||||
| Demand deposits | 12,740,947 | 9,438,459 | 7,317,161 | 7,812,660 | 7,994,201 | ||||||||||||||||||||||||
| Total deposits | 30,996,589 | 26,478,593 | 20,606,113 | 19,123,180 | 17,016,831 | ||||||||||||||||||||||||
| Stockholders’ equity | 2,871,224 | 2,801,321 | 2,480,308 | 2,190,072 | 1,997,890 | ||||||||||||||||||||||||
The following table provides information about the growth of our loans held for investment ("LHI") portfolio by type of loan for the past five years:
| December 31, | |||||||||||||||||||||||||||||
| (in thousands) | 2020 | 2019 | 2018 | 2017 | 2016 | ||||||||||||||||||||||||
| Commercial | $ | 8,861,580 | $ | 9,133,444 | $ | 9,117,546 | $ | 8,373,398 | $ | 6,622,078 | |||||||||||||||||||
| Energy | 766,217 | 1,425,309 | 1,631,371 | 1,130,000 | 889,583 | ||||||||||||||||||||||||
| Mortgage finance | 9,079,409 | 8,169,849 | 5,877,524 | 5,308,160 | 4,497,338 | ||||||||||||||||||||||||
| Real estate | 5,794,624 | 6,008,040 | 6,050,083 | 5,960,785 | 5,560,909 | ||||||||||||||||||||||||
3
| December 31, | |||||||||||||||||||
| (in thousands) | 2019 | 2018 | 2017 | 2016 | 2015 | ||||||||||||||
| Commercial | $ | 10,230,828 | $ | 10,373,288 | $ | 9,189,811 | $ | 7,291,545 | $ | 6,672,631 | |||||||||
| Total real estate | 6,008,040 | 6,050,083 | 5,960,785 | 5,560,909 | 4,990,914 | ||||||||||||||
| Construction | 2,563,339 | 2,120,966 | 2,166,208 | 2,098,706 | 1,851,717 | ||||||||||||||
| Real estate term | 3,444,701 | 3,929,117 | 3,794,577 | 3,462,203 | 3,139,197 | ||||||||||||||
| Mortgage finance | 8,169,849 | 5,877,524 | 5,308,160 | 4,497,338 | 4,966,276 | ||||||||||||||
| Equipment leases | 256,462 | 312,191 | 264,903 | 185,529 | 113,996 | ||||||||||||||
| Consumer | 71,463 | 63,438 | 48,684 | 34,587 | 25,323 | ||||||||||||||
The Texas Market
Our business is concentrated in Texas. The Texas market for banking services is highly competitive. We compete with national, regional and local bank holding companies and commercial banks. Texas’ largest banking organizations are headquartered outside of Texas and are controlled by out-of-state organizations. We also compete with other providers of financial services, such as non-bank lenders, commercial finance and leasing companies, consumer finance companies, financial technology, or fintech, companies, securities firms, insurance companies, full service brokerage firms and discount brokerage firms, credit unions and savings and loan associations. We believe that many middle market companies and successful professionals and entrepreneurs are interested in banking with a company headquartered in, and with decision-making authority based in, Texas and with established Texas bankers who have the expertise to act as trusted advisors to customers with regard to their banking needs.
Our banking centers in our target markets are served by experienced bankers with lending expertise in the specific industries found in their market areas and established community ties. We believe our Bank can offer customers more responsive and personalized service than our competitors. By providing effective service to these customers, we believe we will be able to establish long-term relationships and provide multiple products to our customers, thereby enhancing our profitability.
National Lines of Business
While the Texas market continues to be central to the growth and success of our company, we have developed several lines of business including mortgage finance, mortgage correspondent aggregation ("MCA"), homebuilder finance, insurance premium finance, lender finance, asset-based lending and escrow services, that offer specialized loan and deposit products to businesses regionally and throughout the nation.nation, including mortgage finance, mortgage correspondent aggregation, homebuilder finance, insurance premium finance, lender finance, asset-based lending and escrow services. We believe this helpsthese business lines help us mitigate our geographic concentration risk in Texas. We continue to seek opportunities to develop additional lines of business that leverage our capabilities and are consistent with our business strategy. Most recently, we launched Bask Bank, an all-digital branch of our Bank that offers depositors American Airlines AAdvantage® miles instead of interest.
Business Strategy
Drawing on the business and community ties of our management and their banking experience, our strategy has been to grow an independent bank that has focused primarily on middle market business customers and successful professionals and entrepreneurs in each of the five major metropolitan markets of Texas as well as our national lines of business. To achieve this, we have employedemploy the following strategies:
•offering a premier and differentiated banking experience to middle market businesses and successful professionals and entrepreneurs who value a broad relationship with our Bank;
•growing our loan and deposit base in our existing markets by hiring additional experienced bankers in our different lines of business;
•developing lines of business that leverage our strengths and complement our existing lines of business;
•continuing our emphasis on credit policy to maintain credit quality consistent with long-term objectives;
•leveraging our existing infrastructure with improvements in technology and processes to gain efficiencies to support a larger volume of business;
•maintaining effective internal approval processes for capital and operating expenditures;
•continuing our extensive use of outsourcing to provide cost-effective and more efficient operational support and service levels consistent with large-bank operations; and
•extending our reach within our target markets and lines of business through service innovation and service excellence.
4
Products and Services
We offer a variety of loan, deposit account and other financial products and services to our customers.
Business Customers. We offer a full range of products and services oriented to the needs of our business customers, including:
•commercial loans for general corporate purposes, including financing for working capital, internal growth, acquisitions and financing for business insurance premiums;
•real estate term and construction loans;
•mortgage warehouse lending;
•mortgage correspondent aggregation;
•equipment finance and leasing;
•treasury management services, including online banking and debit and credit card services;
•escrow services; and
•letters of credit.
Individual Customers. We also provide complete banking services for our individual customers, including:
•personal wealth management and trust services;
•certificates of deposit ("CDs") and IRAs;individual retirement accounts ("IRAs");
•interest-bearing and non-interest-bearing checking accounts;
•traditional money market and savings accounts;
•loans, both secured and unsecured;
•online and mobile banking; and
•Bask Bank, an all-digital branch offering depositors American Airlines AAdvantage® miles instead of interest.
Lending Activities
We target our lending to middle market businesses and successful professionals and entrepreneurs that meet our credit standards. The credit standards are set by our standing Credit Policy Committee with the assistance of our Bank’s Chief Credit Officer, who is charged with ensuring that credit standards are met by loans in our portfolio. Our Credit Policy Committee is comprised of senior Bank officers including our Bank’s Texas President/Vice Chairman, our Bank's Chief Risk Officer, and our Bank’s Chief Credit Officer and other Bank officers as deemed appropriate, and is subject to oversight by the Risk Committee of the Company's board of directors. We believe we maintain an appropriately diversified loan portfolio. Credit policies and underwriting guidelines are tailored to address the unique risks associated with each industry represented in the portfolio.
Our credit standards for commercial borrowers referenceare based on numerous criteria with respect to the borrower, including historical and projected financial information, strength of management, acceptable collateral and associated advance rates, and market conditions and trends in the borrower’s industry. In addition, prospective loans are also analyzed based on current industry concentrations in our loan portfolio to prevent an unacceptable concentration of loans in any particular industry. We believe our credit standards are consistent with achieving our business objectives in the markets we serve and are an important part of our risk mitigation.mitigation strategy. We believe that our Bank is differentiated from its competitors by its focus on and targeted marketing to our core customers and by its ability to fittailor its products to the individual needs of our customers.
We generally extend variable rate loans in which the interest rate fluctuates with a specified reference rate such as the United States prime rate or the London Interbank Offered Rate (LIBOR)("LIBOR") and frequently provide for a minimum floor rate. Our use of variable rate loans is designed to protect us from risks associated with interest rate fluctuations since the rates of interest earned will automatically reflect such fluctuations. In 2017, the U.K. Financial Conduct Authority announced that it would no longer compel banks to submit rates for the calculation of LIBOR after 2021. The administrator of LIBOR has proposed to extend publication of the most commonly used U.S. Dollar LIBOR settings to June 30, 2023, and to cease publishing other LIBOR settings on December 31, 2021. The U.S. federal banking agencies have issued guidance strongly encouraging banking organizations to cease using U.S. dollar LIBOR as a reference rate in new contracts as soon as practicable and in any event by December 31, 2021. It is not possible to know whether LIBOR will continue to be viewed as an acceptable market benchmark, what rate or rates may become accepted alternatives to LIBOR or what the effect of any such changes in views or alternatives may have on the financial markets for LIBOR-linked financial instruments. The full impact of alternatives to LIBOR on the valuations, pricing and operation of our financial instruments is not yet known.known; however, the primary instruments that may be impacted include loans, securities, borrowings and derivatives indexed to LIBOR that mature after December 31, 2021. We have established a working group, consisting of key stakeholders from throughout ourthe Bank, to monitor developments relating to LIBOR uncertainty and changes and to guide our Bank's response. This team is currently working to ensure that our technology systems are prepared for the transition, our loan documents that reference LIBOR-based rates have been
5
appropriately amended to reference other methods of interest rate determination and internal and external stakeholders are apprised of the transition.
Deposit Products
We offer a variety of deposit products and services to our customers with terms, including interest rates, which are competitive with other banks. Our business deposit products include commercial checking accounts, lockbox accounts, cash concentration accounts and other treasury management services, including online banking. Our treasury management online system offers information services, wire transfer initiation, ACH initiation, account transfer and service integration. Our consumer deposit products include checking accounts, savings accounts, money market accounts and certificates of deposit. We also allow our consumer deposit customers to access their accounts, transfer funds, pay bills and perform other account functions through online and mobile banking.
Wealth Management and Trust
Our wealth management and trust services include wealth strategy, financial planning, investment management, personal trust and estate services, custodial services, retirement accounts and related services. Our investment management professionals work with our clients to define objectives, goals and strategies for their investment portfolios. We assist the customer with the selection of an investment manager and work with the client to tailor the investment program accordingly. We also offer retirement products such as individual retirement accounts and administrative services for retirement vehicles such as pension and profit sharing plans. Our wealth management and trust services are primarily focused on serving the needs of our banking clients and depend on close cooperation and support between our banking relationship managers and our investment management professionals.
Overview. In March 2020, the outbreak of the novel Coronavirus Disease 2019 (“COVID-19”) was recognized as a pandemic by the World Health Organization. The spread of COVID-19 has created a global public health crisis that has resulted in unprecedented uncertainty, volatility and disruption in financial markets and in governmental, commercial and consumer activity in the United States and globally, including the markets that we serve. Governmental responses to the pandemic have included orders to close businesses not deemed essential and directing individuals to restrict their movements, observe social distancing and shelter in place. These actions, together with responses to the pandemic by businesses and individuals, have resulted in rapid decreases in commercial and consumer activity, temporary, and some permanent, closures of many businesses that have led to a loss of revenues and a rapid increase in unemployment, material decreases in oil and gas prices and in business valuations, disrupted global supply chains, market downturns and volatility, changes in consumer behavior related to pandemic fears, related emergency response legislation and an expectation that Federal Reserve policy will maintain a low interest rate environment for the foreseeable future. Although financial markets have rebounded from significant declines that occurred earlier in the pandemic and global economic conditions showed signs of improvement beginning during the second quarter of 2020, many of the effects that arose or became more pronounced after the onset of the COVID-19 pandemic have persisted through the end of the year. These changes have had and are likely to continue to have a significant adverse effect on the markets in which we conduct our business and the demand for our products and services. See “Risk Factors—Other Risks Affecting our Business—The COVID-19 pandemic is adversely affecting us and our customers, employees and third-party service providers, and the adverse impacts on our business, financial position, operations and prospects have been and are expected to continue to be significant.”
Legislative Developments. On March 27, 2020, the Coronavirus Aid, Relief, and Economic Security (“CARES”) Act was signed into law. It contained substantial tax and spending provisions intended to address the impact of the COVID-19 pandemic. The CARES Act included the Paycheck Protection Program (“PPP”), a nearly $350 billion program designed to aid small- and medium-sized businesses through federally guaranteed loans distributed through banks. These loans were intended to guarantee eight weeks of payroll and other costs to help those businesses remain viable and allow their workers to pay their bills. The initial $350 billion program was supplemented in late April 2020 with $310 billion in additional funding. On June 5, 2020, the Paycheck Protection Program Flexibility Act (the “new Act”) was signed into law, and made significant changes to the PPP to provide additional relief for small businesses. The new Act increased flexibility for small businesses that have been unable to rehire employees due to lack of employee availability, or have been unable to operate as normal due to COVID-19 related restrictions, extended the period that businesses have to use PPP funds to qualify for loan forgiveness to 24 weeks, up from 8 weeks under the original rules, and relaxed the requirements that loan recipients must adhere to in order to qualify for loan forgiveness. In addition, the new Act extended the payment deferral period for PPP loans until the date when the amount of loan forgiveness is determined and remitted to the lender. For PPP recipients who do not apply for forgiveness, the loan deferral period is 10 months after the applicable forgiveness period ends. On July 4, 2020, Congress enacted a new law to extend the deadline for applying for a PPP loan to August 8, 2020. The program was re-opened on January 11, 2021 with updated guidance outlining program changes to enhance its effectiveness and accessibility. This round of the PPP will serve
6
new borrowers, as well as allow certain existing PPP borrowers to apply for a second draw PPP Loan and make a request to modify their first draw PPP loan.
We have partnered with a web-based commercial and SBA lending software provider to manage the origination, processing, closing and monitoring of SBA loans and have set up the Texas Capital Bank SBA PPP Loan Portal to provide borrowers the ability to apply and qualify for PPP loans. As of December 31, 2019,2020, we had 1,738funded $717.5 million in PPP loans. Those loans have an outstanding balance of $617.5 million as of December 31, 2020.
We also implemented a short-term loan modification program in late March 2020 to provide temporary payment relief to borrowers who meet the program’s qualifications. This program allows for a deferral of payments for 90 days, which we may extend for an additional 90 days, for a maximum of 180 days on a cumulative basis. The deferred payments along with interest accrued during the deferral period are due and payable on the maturity date of the existing loan. Through December 31, 2020, we granted temporary modifications on 483 loans with a total outstanding loan balance of $1.3 billion, resulting in the deferral of $7.7 million in interest payments. As of December 31, 2020, 48 loans with a total outstanding balance of $90.2 million remain on deferral, of which $50.7 million have been granted a second deferral.
See Management's Discussion and Analysis of Financial Condition and Results of Operations for additional information on the impact of the COVID-19 pandemic to our financial statements and results of operations, as well as our business operations.
Human Capital
Our goal is to attract, develop, retain and plan for succession of key talent and executives to achieve strategic objectives. We are continually investing in our workforce to further emphasize diversity and inclusion and to foster our employees' growth and career development. As part of our commitment to address diversity, equity and inclusion ("DEI") we have launched a DEI Council, chaired by our CEO.
At December 31, 2020, we had 1,619 employees, nearly all of whom are full-time employees. and of which approximately 50% were female and 40% were minorities. Due to our significant Texas-based operations and branch-lite network, the majority of our employees are based in Texas.
We offer a comprehensive benefits program to our employees and design our compensation programs to attract, retain and motivate employees, as well as to align with Company performance.
None of our employees is represented by a collective bargaining agreement and we consider our relations with our employees to be good.
Regulation and Supervision
General. We and our Bank are subject to extensive federal and state laws and regulations that impose specific requirements on us and provide regulatory oversight of virtually all aspects of our operations. These laws and regulations generally are intended for the protection of the Bank's depositors, the deposit insurance fundDeposit Insurance Fund ("DIF") of the FDICFederal Deposit Insurance Corporation (the "FDIC") and the stability of the U.S. banking system as a whole, rather than for the protection of our stockholders and creditors.
The following discussion summarizes certain laws, regulations and policies to which we and our Bank are subject. It does not address all applicable laws, regulations and policies that affect us currently or might affect us in the future. This discussion is qualified in its entirety by reference to the full texts of the laws, regulations and policies described.
The Company’s activities are governed by the Bank Holding Company Act of 1956, as amended (“BHCA”(the “BHCA”). We are subject to regulation, supervision and examination by the Board of Governors of the Federal Reserve System (the "Federal Reserve") pursuant to the BHCA. We file quarterly reports and other information with the Federal Reserve. WeAs a public company, we also file reports with the SECU.S. Securities and Exchange Commission (the "SEC") and are subject to its regulationregulatory authority, as well as the disclosure and regulatory requirements of the Securities Act of 1933, as amended, and the Securities Exchange Act of 1934, as amended, with respect to our securities, financial reporting and certain governance matters. OurBecause our securities are listed on the Nasdaq Global Select Market ("Nasdaq"), and we are subject to NasdaqNasdaq's rules for listed companies.companies, including rules relating to corporate governance.
Our Bank is organized as a national banking association under the National Bank Act, and is subject to regulation, supervision and examination by the Office of the Comptroller of the Currency (the “OCC”), the FDIC and the Consumer Financial Protection Bureau (“CFPB”(the “CFPB”) as well as being subject to regulation by certain other federal and state agencies. The OCC has primary supervisory responsibility for our Bank and performs a continuous program of examinations concerning safety and
soundness, the quality of management and oversight by our board of directors, information technology and compliance with applicable laws and regulations. Our Bank also files quarterly reports of condition and income with the FDIC, which provides insurance for certain of our Bank’s deposits.
7
Bank Holding Company Regulation. The BHCA limits our business to banking, managing or controlling banks and other activities that the Federal Reserve has determined to be closely related to banking. The Gramm-Leach-Bliley Act of 1999, as amended (the "GLB Act"), allows bank holding companies meeting certain management, capital and Community Reinvestment Act standards to elect to be treated as financial holding company that may offer customers a more comprehensive array of financial products and services. We have elected to register with the Federal Reserve as a financial holding company. This authorizes us to engage in any activity that is either (i) financial in nature or incidental to such financial activity, as determined by the Federal Reserve, or (ii) complementary to a financial activity, so long as the activity does not pose a substantial risk to the safety and soundness of our Bank or the financial system generally, as determined by the Federal Reserve. Examples of non-banking activities that are financial in nature include securities underwriting and dealing, insurance underwriting, providing investment and financial advice, leasing personal property and making merchant banking investments.
We are not at this time exercising the powers authorized for a financial holding company at the parent company level.
We, through our Bank, engage in traditional banking activities that are deemed financial in nature. In order for us to undertake new activities permitted by the BHCA, we and our Bank must be considered "well capitalized" (as defined below) and well managed, our Bank must have received a rating of at least "satisfactory" in its most recent examination under the Community Reinvestment Act and we must notify the Federal Reserve within thirty days of engaging in the new activity. We do not currently expect to engage in any non-banking activities at the holding company level.
Under Federal Reserve policy, now codified by the Dodd-Frank Wall Street Reform and Consumer Protection Act (the "Dodd-Frank Act"), we are expected to act as a source of financial and managerial strength to our Bank and commit resources to its support. Such support may be required even at times when, absent this Federal Reserve policy, a holding company may not be in a financial position, or otherwise inclined, to provide it.such resources. We could in certain circumstances be required to guarantee the capital plan of our Bank if it became undercapitalized.
It is the policy of the Federal Reserve that financial holding companies may pay cash dividends on common stock only out of income available over the past year and only if prospective earnings retention is consistent with the organization’s expected future needs and financial condition. The policy provides that financial holding companies may not pay cash dividends in an amount that would undermine the holding company’s ability to serve as a source of strength to its banking subsidiary.
With certain limited exceptions, the BHCA and the Change in Bank Control Act of 1978, as amended (the "CIBC Act"), together with regulations promulgated thereunder, prohibit a person or company or a group of persons deemed to be “acting in concert” from, directly or indirectly, acquiring more than 10% (5% if the acquirer is a bank holding company) of any class of our voting stock or obtaining the ability to control in any manner the election of a majority of our directors or otherwise direct the management or policies of our company without prior notice or application to and the approval of the Federal Reserve.
If, in the opinion of the applicable federal bank regulatory authorities, a depository institution or holding company is engaged in or is about to engage in an unsafe or unsound practice (which could include the payment of dividends or repurchase or redemptions of securities), such authority may require, generally after notice and hearing, that such institution or holding company cease and desist such practice. The federal banking agencies have indicated that paying dividends that deplete a depository institution’s or holding company’s capital base to an inadequate level would be such an unsafe or unsound banking practice. Moreover, the Federal Reserve and the FDIC have issued policy statements providing that financial holding companies and insured depository institutions generally should only pay dividends out of current operating earnings.earnings and only if the prospective rate of earnings retention appears consistent with the entity's current and expected future capital needs, asset quality and overall financial condition. Federal Reserve regulations require that the Company provide prior notice to or obtain the prior approval of the Federal Reserve for declaring or paying dividends that exceed its earnings for the relevant period and redemptions or repurchases of its equity securities, and prohibit such actions if they would deplete the Company's capital or impair its ability to serve as a source of strength for our Bank.
Regulation of Our Bank by the OCC. National banks the size of our Bank are subject to continuous regulation, supervision and examination by the OCC. The OCC regulates or monitors all areas of a national bank’s operations, including security devices and procedures, adequacy of capitalization and loss reserves, accounting treatment and impact on capital determinations, loans, investments, borrowings, deposits, liquidity, mergers, issuances of securities, payment of dividends, interest rate risk management, establishment of branches, corporate reorganizations, maintenance of books and records, and adequacy of staff training to carry on safe and sound lending and deposit gathering practices. The OCC requires national banks to maintain specified capital ratios and imposes limitations on their aggregate investment in real estate, bank premises and furniture and fixtures. National banks are required by the OCC to file quarterly reports of their financial condition and results of operations and to obtain an annual audit of their financial statements in compliance with minimum standards and procedures prescribed by the OCC.
Regulation of Our Bank by the CFPB. The CFPB has regulation, supervision and examination authority over our Bank with respect to substantially all federal statutes and regulations protecting the interests of consumers of financial services, including but not limited to the Equal Credit Opportunity Act, the Fair Credit Reporting Act, the Truth in Lending Act, the Home
8
Mortgage Disclosure Act, the Real Estate Settlement Procedures Act, the Fair Debt Collection Practices Act, the Truth in
Savings Act, the Right to Financial Privacy Act and the Electronic Funds Transfer Act and their respective related regulations. Penalties for violating these laws and regulations could subject our Bank to lawsuits and administrative penalties, including civil monetary penalties, payments to affected consumers and orders to halt or materially change our consumer banking activities. The CFPB has broad authority to pursue enforcement actions, including investigations, civil actions and cease and desist proceedings, and can refer civil and criminal findings to the Department of Justice for prosecution. The Bank is also subject to other federal and state consumer protection laws and regulations that, among other things, prohibit unfair, deceptive and abusive, corrupt or fraudulent business practices, untrue or misleading advertising and unfair competition.
Capital Adequacy Requirements. Federal banking regulators have adopted a system using certain risk-based capital guidelines to evaluate the capital adequacy of banks and bank holding companies that is based upon the 1988 capital accord of the Bank for International Settlements’ Basel Committee on Banking Supervision (the “Basel Committee”), a committee of central banks and bank regulators from the major industrialized countries that coordinates international standards for bank regulation. Under the guidelines, specific categories of assets and off-balance-sheet activities such as letters of credit are assigned risk weights, based generally on the perceived credit or other risks associated with the asset. Off-balance-sheet activities are assigned a credit conversion factor based on the perceived likelihood that they will become on-balance-sheet assets. These risk weights are multiplied by corresponding asset balances to determine a “risk weighted” asset base, which is then measured against various forms of capital to produce capital ratios.
An organization’s capital is classified in one of two tiers, Core Capital, or Tier 1, and Supplementary Capital, or Tier 2. Tier 1 capital includes common stock, retained earnings, qualifying non-cumulative perpetual preferred stock, minority interests in the equity of consolidated subsidiaries, a limited amount of qualifying trust preferred securities and qualifying cumulative perpetual preferred stock at the holding company level, less goodwill and most intangible assets. Tier 2 capital includes perpetual preferred stock and trust preferred securities not meeting the Tier 1 definition, mandatory convertible debt securities, subordinated debt, and allowances for loan and lease losses. Each category is subject to a number of regulatory definitional and qualifying requirements.
The Basel Committee in 2010 released a set of international recommendations for strengthening the regulation, supervision and risk management of banking organizations, known as Basel III. In July 2013, the Federal Reserve published final rules for the adoption of the Basel III regulatory capital framework (the “Basel III Capital Rules”). The Basel III Capital Rules became effective for us on January 1, 2015, with certain transition provisions phasing in over a period that ended on January 1, 2019.
The Basel III Capital Rules, among other things, (i) specify a capital measure called “Common Equity Tier 1” (“CET1”), (ii) specify that Tier 1 capital consists of CET1 and “Additional Tier 1 capital” instruments meeting specified requirements, (iii) require that most deductions/adjustments to regulatory capital measures be made to CET1 and not to the other components of capital and (iv) define the scope of the deductions/adjustments to the capital measures. Our Series A 6.5% Non-Cumulative Perpetual Preferred Stock constitutes Additional Tier 1 capital and our subordinated notes constitute Tier 2 capital.
The Basel III Capital Rules set the risk-based capital requirement and the total risk-based capital requirement to a minimum of 6.0% and 8.0%, respectively, each plus a 2.5% capital conservation buffer composed entirely of 2.5%CET1, producing targeted ratios of 8.5% and 10.5%, respectively, which were fully phased-in as of January 1, 2019 and for subsequent years. The leverage ratio requirement under the Basel III Capital Rules, calculated as the ratio of Tier 1 capital to average assets, is 4.0%. In order to be well capitalized under the rules now in effect, our Bank must maintain CET1, Tier 1 and total capital ratios that are equal to or greater than 7.0%, 8.5% and 10.5%, respectively, and a leverage ratio equal to or greater than 5.0%. See “Selected Consolidated Financial Data - Capital and Liquidity Ratios.”
Additionally, the Basel III Capital Rules specify a capital conservation buffer with respect to each of the CET1, Tier 1 and total capital to risk-weighted assets ratios, which provides for capital levels that exceed the minimum risk-based capital adequacy requirements. The 2.5% capital conservation buffer was implemented over a three year phase-in period that began on January 1, 2016 and concluded on January 1, 2019. A financial institution with a conservation buffer of less than the required amount is subject to limitations on capital distributions, including dividend payments and stock repurchases, and certain discretionary bonus payments to executive officers.
We have met the capital adequacy requirements under the Basel III Capital Rules on a fully phased-in basis since we commenced filing of the applicable reports with the FDIC and OCC. AtAs of December 31, 20192020 our Bank's CET1 ratio was 8.96%9.48% and its total risk-based capital ratio was 10.92%11.67% and, as a result, it is currently classified as "well capitalized" for purposes of the OCC's prompt corrective action regulations.
Because we had less than $15 billion in total consolidated assets as of December 31, 2009, we are allowed to continue to classify our trust preferred securities, all of which were issued prior to May 19, 2010, as Tier 1 capital. WeAs a non-advanced approaches banking organization, we have elected to exclude the effects of certain accumulated other comprehensive income ("AOCI") items included in stockholders’ equity fromfor the determination of regulatory capital and capital ratios under the Basel III Capital Rules.
9
In November 2017, the federal banking regulators issued a final rule to extend certain transition periods related to the regulatory capital treatment under the capital rules for certain items (including certain deferred tax assets, mortgage servicing rights, investments in non-consolidated financial entities and minority interest limitations) until January 1, 2020 when final rules to simplify the regulatory treatment of those items took effect. The relief provided under the final rule applies to banking organizations that are not subject to the advanced approaches framework, such as the Company and the Bank.
In December 2017, the Basel Committee published the last version of the Basel III regulatory reforms, which are commonly referred to as “Basel IV.” The Basel IV standards, which will be generally effective on January 1, 2022, revise, among other things the Basel Committee’s standardized approach for credit risk and provide a new standardized approach for operational risk capital. Under the current U.S. capital rules, operational risk capital requirements and a capital floor apply only to banking organizations that are subject to the advanced approaches framework. The impact of the Basel IV standards on us and our Bank will depend on the manner in which it is implemented by the federal banking regulators.
In February 2019, the federal bank regulatory agencies issued a final rule (the “2019 CECL Rule”) that revised certain capital regulations to account for changes to credit loss accounting under accounting principles generally accepted in the United States ("GAAP"). The 2019 CECL Rule included a transition option that allows banking organizations to phase in, over a three-year period, the day-one adverse effects of adopting the new accounting standard related to the measurement of current expected credit losses (“CECL”) on their regulatory capital ratios (three-year transition option). In March 2020, the federal bank regulatory agencies issued an interim final rule that maintains the three-year transition option of the 2019 CECL Rule and also provides banking organizations that were required under GAAP to implement CECL before the end of 2020 the option to delay for two years an estimate of the effect of CECL on regulatory capital, relative to the incurred loss methodology’s effect on regulatory capital, followed by a three-year transition period (five-year transition option). We adopted CECL on January 1, 2020 and have elected to utilize the five-year transition option.
Regulators may change capital and liquidity requirements, including previous interpretations of practices related to risk weights, which could require an increase to the allocation of capital to assets held by our Bank. Regulators could also require us to make retroactive adjustments to financial statements to reflect such changes. A regulatory capital ratio or category may not
constitute an accurate representation of the Bank’s overall financial condition or prospects. Our regulatory capital status is addressed in more detail under the heading “Liquidity and Capital Resources” within Management’s Discussion and Analysis of Financial Condition and Results of Operations and in Note 1413 - Regulatory Restrictions in the accompanying notes to the consolidated financial statements included elsewhere in this report.
The Federal Deposit Insurance Corporation Improvement Act of 1991 (“FDICIA”(the “FDICIA”) established a system of prompt corrective action regulations and policies to resolve the problems of undercapitalized insured depository institutions. Under this system, insured depository institutions are ranked in one of five capital categories as described below. Regulators are required to take mandatory supervisory actions and are authorized to take other discretionary actions of increasing severity with respect to insured depository institutions in the three undercapitalized categories. The five capital categories for insured depository institutions under the prompt corrective action regulations consist of:
•Well capitalized - equals or exceeds a 10% total risk-based capital ratio, 8% Tier 1 risk-based capital ratio, and 5% leverage ratio and is not subject to any written agreement, order or directive requiring it to maintain a specific level for any capital measure;
•Adequately capitalized - equals or exceeds an 8% total risk-based capital ratio, 6% Tier 1 risk-based capital ratio, and 4% leverage ratio;
•Undercapitalized - total risk-based capital ratio of less than 8%, or a Tier 1 risk-based ratio of less than 6%, or a leverage ratio of less than 4%;
•Significantly undercapitalized - total risk-based capital ratio of less than 6%, or a Tier 1 risk-based capital ratio of less than 4%, or a leverage ratio of less than 3%; and
•Critically undercapitalized - a ratio of tangible equity to total assets equal to or less than 2%.
The prompt corrective action regulations provide that an institution may be downgraded to the next lower category if its regulator determines, after notice and opportunity for hearing or response, that the institution is in an unsafe or unsound condition or has received and not corrected a less-than-satisfactory rating for any of the categories of asset quality, management, earnings or liquidity in its most recent examination.
Federal bank regulatory agencies are required to implement arrangements for prompt corrective action for institutions failing to meet minimum requirements to be at least adequately capitalized. FDICIA imposes an increasingly stringent array of restrictions, requirements and prohibitions as an organization’s capital levels deteriorate. A bank rated "adequately capitalized" or below may not accept, renew or roll over brokered deposits.deposits unless it receives a waiver from the FCIC. A "significantly undercapitalized" institution is subject to mandated capital raising activities, restrictions on interest rates paid and transactions with affiliates, removal of management and other restrictions. The OCC has only very limited discretion in dealing with a "critically
10
"critically undercapitalized" institution and generally must appoint a receiver or conservator (the FDIC) if the capital deficiency is not corrected promptly.
Under the Federal Deposit Insurance Act, (“FDIA”as amended (the “FDIA”), “critically undercapitalized” banks may not, beginning 60 days after becoming critically undercapitalized, make any payment of principal or interest on their subordinated debt (subject to certain limited exceptions). In addition, under Section 18(i) of the FDIA, banks are required to obtain the advance consent of the FDIC to retire any part of their subordinated notes. Under the FDIA, a bank may not pay interest on its subordinated notes if such interest is required to be paid only out of net profits, or distribute any of its capital assets, while it remains in default on any assessment due to the FDIC.
In December 2020, the FDIC issued a final rule that is designed to bring the brokered deposits regulations in line with modern deposit taking methods and generally reduces the amount of deposits that would be classified as brokered, which most directly affects banks rated as “adequately capitalized” or “undercapitalized”. The final rule will become effective on April 1, 2021, with an extended compliance date of January 1, 2022.
Federal bank regulators may set capital requirements for a particular banking organization that are higher than the minimum ratios when circumstances warrant. Federal Reserve and OCC guidelines provide that banking organizations experiencing significant growth or making acquisitions will be expected to maintain strong capital positions substantially above the minimum supervisory levels, without significant reliance on intangible assets. Concentration of credit risks, interest rate risk (imbalances in rates, maturities or sensitivities) and risks arising from non-traditional activities, as well as an institution’s ability to manage these risks, are important factors taken into account by regulatory agencies in assessing an organization’s overall capital adequacy.
The OCC and the Federal Reserve also use a leverage ratio as an additional tool to evaluate the capital adequacy of banking organizations. The leverage ratio is a company’s Tier 1 capital divided by its average total consolidated assets. A minimum leverage ratio of 3.0% is required for banks and bank holding companies that either have the highest supervisory rating or have implemented the appropriate federal regulatory authority’s risk-adjusted measure for market risk. All other banks and bank holding companies are required to maintain a minimum leverage ratio of 4.0%, unless a different minimum is specified by an appropriate regulatory authority. In order to be considered well capitalized the leverage ratio must be at least 5.0%.
The risk-based and leverage capital ratios established by federal banking regulators are minimum supervisory ratios generally applicable to banking organizations that meet specified criteria, assuming that they otherwise have received the highest regulatory ratings in their most recent examinations. Banking organizations not meeting these criteria are expected to operate with capital positions in excess of the minimum ratios. Regulators can, from time to time, change their policies or interpretations of banking practices to require changes in risk weights assigned to our Bank's assets or changes in the factors considered in order to evaluate capital adequacy, which may require our Bank to obtain additional capital to support existing asset levels or future growth or reduce asset balances in order to meet minimum acceptable capital ratios.
Liquidity Requirements. U.S. bank regulators in September 2014 issued a final rule implementing the Basel III liquidity framework for certain U.S. banks - generally those having more than $50 billion of assets or whose primary federal banking regulator determines compliance with the liquidity framework is appropriate based on the organization's size, level of complexity, risk profile, scope of operations, U.S. or non-U.S. affiliations or risk to the financial system. One of the liquidity tests included in the new rule, referred to as the liquidity coverage ratio (“LCR”), is designed to ensure that a banking entity maintains an adequate level of unencumbered high-quality liquid assets equal to the entity’s expected net cash outflow for a 30-day time horizon (or, if greater, 25% of its expected total cash outflow) under an acute liquidity stress scenario.
The other test, referred to as the net stable funding ratio (“NSFR”), is designed to promote more medium- and long-term funding of the assets and activities of banking entities over a one-year time horizon. These requirements encourage the covered banking entities to increase their holdings of U.S. Treasury securities and other sovereign debt as a component of assets, and also to increase the use of long-term debt as a funding source.
While the LCR and NSFR tests are not currently applicable to our Bank, and the proposed rules would increase substantially the $50 billion asset threshold, other relevant measures of liquidity are monitored by management and are reported to our board of directors. Regulators may change capital and liquidity requirements, including previous interpretations of practices related to risk weights, which could require an increase in liquid assets or in the necessary capital to support the assets held by our Bank. Regulators could also require us to make retroactive adjustments to financial statements and reported capital ratios to reflect such changes.
Stress Testing. Pursuant to the Dodd-Frank Act and regulations published by the Federal Reserve and OCC, we were required to conduct an annual “stress test” of capital and consolidated earnings and losses under a base case and two severely adverse stress scenarios provided by bank regulatory agencies during the years 2016 to 2018. In response to this requirement we
11
developed dedicated staffing, economic models, policies and procedures to implement stress testing on an annual basis, the results of which were furnished to regulators and published on our website, as well as conducting stress tests for internal use based upon economic scenarios we developed. The Economic Growth, Regulatory Relief and Consumer Protection Act (the “Regulatory Relief Act”) enacted in 2018,, which amended portions of the Dodd-Frank Act, was enacted in 2018 and subsequently adopted, enabling regulations terminatedterminating our stress testing requirements. We continueHowever, we have continued to perform certain stress tests internally and have incorporated the economic models and information developed through our stress testing program into our risk management and business, capital and liquidity planning activities, which are subject to continuing regulatory oversight.
Privacy and Data Security. The financial privacy provisions of the Gramm-Leach-BlileyGLB Act generally prohibit financial institutions, including our Bank, from disclosing non-public personal financial information about customers to non-affiliated third parties unless customers have the opportunity to “opt out” of the disclosure and have not elected to do so. Our Bank is required to comply with state laws regarding consumer privacy if they are more protective than the Gramm-Leach-BlileyGLB Act.
In October 2016, the federal banking regulators jointly issued an advance notice of proposed rulemaking on enhanced cyber risk management standards that are intended to increase the operational resilience of large and interconnected entities under their supervision. If established, the enhanced cyber risk management standards would be designed to help reduce the potential impact of a cyber-attack or other cyber-related failure on the financial system. The advance notice of proposed rulemaking addresses five categories of cyber standards: (1) cyber risk governance; (2) cyber risk management; (3) internal dependency management; (4) external dependency management; and (5) incident response, cyber resilience and situational awareness. In May 2019,the Federal Reserve announced that it would revisit the Advance Notice of Proposed Rulemaking in the future. In December 2020, the federal banking agencies issued a Notice of Proposed Rulemaking that would require banking organizations to notify their primary federal regulator within 36 hours of becoming aware of a "computer-security incident" or a "notification incident." The Notice of Proposed Rulemaking also would require specific and immediate notifications by bank service providers that become aware of similar incidents.
In February 2018, the SEC published interpretive guidance to assist public companies in preparing disclosures about cybersecurity risks and incidents. These SEC guidelines, and any other regulatory guidance, are in addition to notification and disclosure requirements under state and federal banking law and regulations.
Privacy and data security areas are expected to receive increased attention at the federal level. An increasing number of state laws and regulations have been enacted in recent years to implement privacy and cybersecurity standards and regulations, including data breach notification and data privacy requirements. OtherRecently, several states have adopted regulations requiring certain financial institutions to implement cybersecurity programs that meet specified requirements. In addition, other nations in which our customers do business, such as the European Union, have adopted similar requirements. This trend of state-level and international activity is expected to continue to expand, requiring continual monitoring of developments in the states and nations in which our customers are located and ongoing investments in our information systems and compliance capabilities.
Community Reinvestment Act. The Community Reinvestment Act of 1977 (“CRA”(the “CRA”) requires depository institutions to assist in meeting the credit needs of their market areas consistent with safe and sound banking practice. Under the CRA, each depository institution is required to help meet the credit needs of its market areas by, among other things, providing credit, making investments and providing community development services to low- and moderate-income individuals and communities. Depository institutions are periodically examined for compliance with the CRA and are assigned one of four ratings. Our Bank is subject to examination by the OCC. In order for a financial holding company to commence new activity permitted by the BHCA, each insured depository institution subsidiary of the financial holding company must have received a rating of at least “satisfactory” in its most recent examination under the CRA. Our Bank's strategic focus on serving commercial customers in regional and national markets from a limited number of branches makes it more challenging for us to satisfy CRA requirements as compared to banks of comparable size that focus on providing retail banking services in markets where they maintain a network of full-service branches.
In December 2019, the OCC and the FDIC issued a notice of proposed rulemaking intended to (i) clarify which activities qualify for CRA credit; (ii) update where activities count for CRA credit; (iii) create a more transparent and objective method for measuring CRA performance; and (iv) provide for more transparent, consistent, and timely CRA-related data collection, recordkeeping, and reporting. In May 2020, the OCC issued its final CRA rule, effective October 1, 2020. The FDIC has not finalized the revisions to its CRA rule.
The USA Patriot Act, the International Money Laundering Abatement and Financial Anti-Terrorism Act and the Bank Secrecy Act. A major focus of U.S. government policy regarding financial institutions in recent years has been combating money laundering, terrorist financing and other illegal payments. The USA Patriot Act of 2001 and the International Money Laundering Abatement and Financial Anti-Terrorism Act of 2001 substantially broadened the scope of United States anti-money laundering laws and penalties, specifically related to the Bank Secrecy Act of 1970, and expanded the extra-territorial jurisdiction of the U.S. government in this area. Regulations issued under these laws impose obligations on financial institutions to maintain appropriate policies, procedures and controls to detect, prevent and report money laundering and terrorist financing and other suspicious activity and to verify the identity of their customers and apply additional scrutiny to customers considered
12
to present greater than normal risk. Failure of a financial institution to maintain and implement adequate programs to combat money laundering and terrorist financing, or to comply with relevant laws or regulations, could have serious legal, reputational and financial consequences for the institution. Because of the significance of regulatory emphasis on these requirements, we have expended, and expect to continue to expend, significant staffing, technology and financial resources to maintain programs designed to ensure compliance with applicable laws and regulations and an effective audit function for testing our compliance with the Bank Secrecy Act on an ongoing basis.
The Anti-Money Laundering Act of 2020 (“AMLA”), which amends the Bank Secrecy Act of 1970 (“BSA”), was enacted in January 2021. The AMLA is intended to be a comprehensive reform and modernization to U.S. bank secrecy and anti-money laundering laws. Among other things, it codifies a risk-based approach to anti-money laundering compliance for financial institutions; requires the development of standards for evaluating technology and internal processes for BSA compliance; expands enforcement- and investigation-related authority, including increasing available sanctions for certain BSA violations and instituting BSA whistleblower incentives and protections.
Office of Foreign Assets Control. The U.S. Treasury Department’s Office of Foreign Assets Control (“OFAC”) is responsible for administering and enforcing economic and trade sanctions against specified foreign parties, including countries and regimes, foreign individuals and other foreign organizations and entities. OFAC publishes lists of prohibited parties that are regularly consulted by our Bank in the conduct of its business in order to assure compliance. We are responsible for, among other things, blocking accounts of, and transactions with, prohibited parties identified by OFAC, avoiding unlicensed trade and financial transactions with such parties and reporting blocked transactions after their occurrence. Failure to comply with OFAC requirements could have serious legal, financial and reputational consequences for our Bank.
Safe and Sound Banking Practices; Enforcement. Banks and bank holding companies are prohibited from engaging in unsafe and unsound banking practices. Bank regulators have broad authority to prohibit and penalize activities of bank holding companies and their subsidiaries which represent unsafe and unsound banking practices or which constitute violations of laws, regulations or written directives of or agreements with regulators. Regulators have considerable discretion in identifying what they deem to be unsafe and unsound practices and in pursuing enforcement actions in response to them.
The FDIA requires federal bank regulatory agencies to prescribe, by regulation or guideline, operational and managerial standards for all insured depository institutions that relate to, among other things: (i) internal controls, information systems and audit systems; (ii) loan documentation; (iii) credit underwriting; (iv) interest rate exposure; (v) asset growth and quality; and (vi) compensation and benefits. Federal banking agencies have adopted regulations and Interagency Guidelines Prescribing Standards for Safety and Soundness to implement these requirements, which regulators use to identify and address problems at insured depository institutions before capital becomes impaired. If a regulator determines that a bank fails to meet any standards prescribed by the guidelines, the bank may be required to submit an acceptable plan to achieve compliance, and agree to specific deadlines for the submission to and review by the regulator of reports confirming progress in implementing the safety and soundness compliance plan. Failure to implement such a plan may result in an enforcement action against the bank.
Enforcement actions against us, our Bank and our officers and directors may include the issuance of a written directive, the issuance of a cease-and-desist order that can be judicially enforced, the imposition of civil money penalties, the issuance of directives to increase capital, the issuance of formal and informal agreements, the issuance of removal and prohibition orders against officers or other institution-affiliated parties, the imposition of restrictions and sanctions under prompt corrective action regulations, the termination of deposit insurance (in the case of our Bank) and the appointment of a conservator or receiver for our Bank. Civil money penalties can be as high as $1.0 million for each day a violation continues.
Transactions with Affiliates and Insiders. Our Bank is subject to Section 23A of the Federal Reserve Act, as amended (the "FRA") which places limits on, among other covered transactions, the amount of loans or extensions of credit to affiliates that may be made by our Bank. Extensions of credit to affiliates must be adequately collateralized by specified amounts and types of collateral. Section 23A also limits the amount of loans or advances made by our Bank to third party borrowers whichthat are collateralized by our or our subsidiaries' respective securities or obligations or those of our subsidiaries.obligations. Our Bank is also is subject to Section 23B of the Federal Reserve Act,FRA, which, among
other things, prohibits an institution from engaging in transactions with affiliates unless the transactions are on terms substantially the same, or at least as favorable to such institution or its subsidiaries, as those prevailing at the time for comparable transactions with non-affiliates.
We are subject to restrictions on extensions of credit to insiders (namely executive officers, directors, principal stockholdersand 10% stockholders) and their related interests. These restrictions are contained in the Federal Reserve ActFRA and Federal Reserve Regulation O and apply to all insured institutions as well as their subsidiaries and holding companies. These restrictions include limits on loans to one borrowerany individual insider and such insider's related interests and certain conditions that must be met before such loans can be made. There is also an aggregate limitation on all loans to insiders and their related interests, which cannot exceed the institution’s total unimpaired capital and surplus, unless the FDIC determines that a lesser amount is appropriate. Insiders are subject to enforcement actions for knowingly accepting loans in violation of applicable restrictions. Additional restrictions on transactions with affiliates and insiders are discussed in the Dodd-Frank Act section below.
13
Restrictions on Payment of Dividends by Our Bank. The sole source of funding of our parent company financial obligations has consisted of proceeds of capital markets transactions and cash payments from our Bank for debt service and dividend payments with respect to our Bank's preferred stock issued to us by the Company.Bank. We may in the future seek to rely upon receipt of dividends paid by our Bank to meet our financial obligations. Our Bank is subject to statutory dividend restrictions. Under such restrictions, national banks may not, without the prior approval of the OCC, declare dividends in excess of the sum of the current year’s net profits plus the retained net profits from the prior two years, less any required transfers to surplus. The Basel III Capital Rules further limit the amount of dividends that may be paid by our Bank. In addition, under the FDICIA, our Bank may not pay any dividend if it is undercapitalized or if payment would cause it to become undercapitalized.
Limits on Compensation. The Federal Reserve, OCC and FDIC in 2010 issued comprehensive final guidance on incentive compensation policies for executive management of banks and bank holding companies. This guidance was intended to ensure that the incentive compensation policies of banking organizations do not undermine their safety and soundness by encouraging excessive risk-taking. The objective of the guidance is to assure that incentive compensation arrangements (i) provide incentives that do not encourage excessive risk-taking, (ii) are compatible with effective internal controls and risk management and (iii) are supported by strong corporate governance, including oversight by the board of directors. In 2016, as required by the Dodd-Frank Act, the Federal Reserve, the FDIC and the FDICSEC proposed rules that would, depending upon the assets of the institution, directly regulate incentive compensation arrangements and would require enhanced oversight and recordkeeping. As of December 31, 2019,2020, these rules have not been implemented.
Deposit Insurance. Our Bank’s deposits are insured through the DIF, which is administered by the FDIC, up to limits established by applicable law, currently $250,000 per depositor. The FDIC determines quarterly deposit insurance assessments consisting of a percentage of an assessment base equal to our Bank’s average consolidated total assets less average tangible equity capital and the assignment of one of four risk categories based on supervisory evaluations, regulatory capital levels and certain other factors. The FDIC has the discretion to adjust an institution’s risk rating. rating and may terminate its insurance of deposits upon a finding that the institution engaged or is engaging in unsafe and unsound practices, is in an unsafe or unsound condition to continue operations, or violated any applicable law, regulation, rule, order or condition imposed by the FDIC or written agreement entered into with the FDIC. The FDIC may also prohibit any FDIC-insured institution from engaging in any activity it determines to pose a serious risk to the DIF.
For 2019,2020, minimum and maximum assessment rates (inclusive of possible adjustments) for institutions the size of our Bank ranged from 1.5 to 40 basis points. As a “large” institution for purposes of determining FDIC insurance assessments, our Bank was until December 31, 2018, subject to additional surcharges to rebuild the DIF to a reserve ratio (DIF balance divided by total insured deposits) equal to 1.35%.
The Dodd-Frank Act. The Dodd-Frank Act became law in 2010 and has had a broad impact on the financial services industry, imposing significant regulatory and compliance changes. A significant volume of financial services regulations required by the Dodd-Frank Act have not yet been finalized by banking regulators, Congress continues to consider legislation that would make significant changes to the law and courts are addressing significant litigation arising under the Act, making it difficult to predict the ultimate effect of the Dodd-Frank Act on our business. The following discussion provides a brief summary of certain provisions of the Dodd-Frank Act that may have an effect on us.
The Dodd-Frank Act significantly reduces the ability of national banks to rely upon federal preemption of state consumer financial laws and permits states to adopt consumer protection laws and standards that are more stringent than those adopted at the federal level and, in certain circumstances, permits state attorneys general to enforce compliance with both the state and federal laws and regulations. Although the OCC, as the primary regulator of national banks, has the ability to make preemption determinations where certain conditions are met, the broad rollback of federal preemption has the potential to create a patchwork of federal and state compliance obligations and enforcement. This may result in significant state regulatory requirements applicable to us and certain of our lending activities, with potentially significant changes in our operations and increases in our compliance costs.
The Dodd-Frank Act generally enhances the restrictions on transactions with affiliates under Sections 23A and 23B of the Federal Reserve Act, including an expansion of the definition of “covered transactions” and an increase in the amount of time for which collateral requirements regarding covered credit transactions must be satisfied. Insider transaction limitations are expanded through the strengthening of restrictions on loans to insiders and the expansion of the types of transactions subject to the various limits, including derivatives transactions, repurchase agreements, reverse repurchase agreements and securities lending or borrowing transactions. Restrictions are also placed on certain asset sales to and from an insider to an institution,
including requirements that such sales be on market terms and, in certain circumstances, approved by the institution’s board of directors.
The Dodd-Frank Act increases the risk of “secondary actor liability” for lenders that provide financing or other services to customers offering financial products or services to consumers, as our Bank does in our mortgage finance, mortgage correspondent aggregation and lender finance lines of business. The Dodd-Frank Act can impose liability on a service provider for knowingly or recklessly providing substantial assistance to a customer found to have engaged in unfair, deceptive or abusive
14
practices that injure a consumer. This exposure contributes to increased compliance and other costs in connection with the administration of credit extended to entities engaged in providing financial products and services to consumers.
The Dodd-Frank Act may impact the profitability of our business activities, require changes to certain of our business practices, impose upon us more stringent compliance, capital, liquidity and leverage requirements or otherwise adversely affect our business. These developments may also require us to invest significant management attention and resources to evaluate and make changes to our business as necessary to comply with new and changing statutory and regulatory requirements.
The Volcker Rule. The Dodd-Frank Act amended the BHCA to require the federal financial regulatory agencies to adopt rules that prohibit banks and their affiliates from engaging in proprietary trading in designated types of financial instruments and from investing in and sponsoring certain hedge funds and private equity funds. The Volcker Rule has not had a material effect on our operations since we do not engage in the businesses prohibited by the Volcker Rule. Unanticipated effects of the Volcker Rule’s provisions or future interpretations may have an adverse effect on our business or services provided to our Bank by other financial institutions.
Future Legislation and Regulation.Laws, regulations and policies are continually under review by Congress and state legislatures and federal and state regulatory agencies. In addition to the specific legislation and regulations described above, future legislation and regulations or changes to existing statutes, regulations or regulatory policies applicable to us and our subsidiaries may affect our business, financial condition and results of operations in adverse and unpredictable ways and increase our reporting requirements and compliance costs.The substance or impact of pending or future legislation or regulation, or the application thereof, cannot be predicted.
Available Information
Under the Securities Exchange Act of 1934, we are required to file annual, quarterly and current reports, proxy statements and other information with the SEC. The SEC maintains a website at www.sec.gov that contains reports, proxy and information statements and other information that we file electronically with the SEC.
We make available, free of charge through our website, our reports on Forms 10-K, 10-Q and 8-K, and amendments to those reports, as soon as reasonably practicable after such reports are filed with or furnished to the SEC. Additionally, we have adopted and posted on our website a code of ethicsbusiness conduct that applies to our principal executive officer, principal financial officer and principal accounting officer. The address for our website is www.texascapitalbank.com. Any amendments to, or waivers from, our code of ethicsbusiness conduct applicable to our executive officers will be posted on our website within four days of such amendment or waiver. We will provide a printed copy of any of the aforementioned documents to any requesting stockholder.
Our business is subject to risk. The following discussion, along with management’s discussion and analysis and our financial statements and footnotes, sets forth the most significant risks and uncertainties that we believe could adversely affect our business, financial condition or results of operations. Additional risks and uncertainties that management is not aware of or that management currently deems immaterial may also have a material adverse effect on our business, financial condition or results of operations. There is no assurance that this discussion covers all potential risks that we face. The occurrence of the described risks could cause our results to differ materially from those described in our forward-looking statements included elsewhere in this report or in our other filings with the SEC and could have a material adverse impact on our business, financial condition or results of operations.
The consummationfollowing is a summary of the merger is contingent upon the satisfaction of a number of conditions, including shareholder and regulatory approvals, that may be outside of TCBI’s or IBTX’s control and that TCBI and IBTX may be unable to satisfy or obtain or which may delay the consummation of the merger or result in the imposition of conditions that could reduce the anticipated benefits from the merger or cause the parties to abandon the merger.
Credit Risks
•Before the transactions contemplatedWe must effectively manage our credit risks.
•A significant portion of our assets consists of commercial loans, which involve a high degree of credit risk.
•We are subject to risks arising from conditions in the merger agreementreal estate market, as a significant portion of our loans are secured by commercial and residential real estate.
•Our future profitability depends, to a significant extent, upon our middle market business customers.
•Our business is concentrated in Texas; our energy industry exposure could adversely affect our performance.
•Our mortgage correspondent aggregation business subjects us to additional risks.
•We must effectively manage our counterparty risk.
•We must maintain an appropriate allowance for credit losses.
15
•Changes in accounting standards could materially affect how we report our financial results.
Liquidity Risks
•We must effectively manage our liquidity risk.
•Our growth plans are dependent on the availability of capital and funding.
•We are dependent on funds obtained from borrowing or capital transactions or from our Bank to fund our obligations.
Market Risks
•We must effectively manage our interest rate risks.
•We may be adversely affected by changes in the method of determining LIBOR, or the replacement of LIBOR with IBTX can be completed, approvalsan alternative reference rate, for our variable rate loans, derivative contracts and other financial assets and liabilities.
Strategic Risks
•We must be obtained from regulatory authorities, including the Federal Reserve, the FDICeffective in developing and the Texas Departmentexecuting new lines of Banking,business and fromnew products and services while managing associated risks.
•We compete with many banks and other financial service providers.
•We must effectively execute our stockholders,business strategy in order to continue our asset and all conditions to the closingearnings growth.
Operational Risks
•We, our vendors and customers must effectively manage our information systems risk which may experience disruption, failure or breach in security.
•Our operations rely extensively on a broad range of the transaction included in the merger agreementexternal vendors.
•We must have been satisfied or waived. The required regulatory approvals may impose additional conditions, limitations, obligations or costs on the surviving entity, place restrictions on the conduct of the business of the surviving entity or require changes to the terms of the transactions contemplated by the merger agreement. There can be no assurance that our or IBTX’s regulators will not impose any such additional conditions, limitations, obligations or restrictions, or that they will not have the effect of delaying or preventing the completion of the merger, imposing
•Our risk management strategies and the mergerprocesses may not be completed. effective; our controls and procedures may fail or be circumvented.
•The merger agreementOur business is susceptible to fraud.
Legal, Regulatory and Compliance Risks
•We are subject to a number of conditions whichextensive government regulation and supervision.
•We must be fulfilled in ordermaintain adequate regulatory capital to complete the merger, including the approval of the merger agreement by TCBI’s stockholderssupport our business objectives.
•We are subject to claims and by IBTX’s shareholders; the receipt of authorization for listing on the Nasdaq of the shares of IBTX common stock and IBTX Series B preferred stock to be issuedlitigation in the merger; the receipt of all required regulatory approvals; the effectiveness of the registration statement on Form S-4 for the IBTX common stock and IBTX preferred stock to be issued in the merger; the absence of any order, injunction, decree or other legal restraint preventing the completion of the merger or making the completion of the merger illegal; subject to certain exceptions, the accuracy of the representations and warranties under the merger agreement; our and IBTX’s performance in all material respectsordinary course of our and their respective obligations under the merger agreement; and each of our and IBTX’s receipt of a tax opinion to the effectbusiness, including claims that the merger will qualify as a reorganization within the meaning of Section 368(a) of the Internal Revenue Code of 1986, as amended.The conditions to the closing of the merger included in the merger agreement may not be fulfilled in a timely manner or at all, and, accordingly, the merger may be delayed or may not be completed.
Other Risks Affecting Our Business
•Our business faces unpredictable economic and business conditions.
•The COVID-19 pandemic is adversely affecting us and our customers, employees and third-party service providers, and the merger is subject to material uncertainties. The merger agreement provides that upon the closing of the mergeradverse impacts on our stockholders will receive 1.0311 shares of IBTX common stock for each share of our common stock that they own at that time. The exchange rate for the conversion of our common stock into IBTX common stock was set in early December 2019 based upon information available to the boards of directors andbusiness, financial advisors of each company at that time. The market price of our common stock and of IBTX common stock is subject to substantial fluctuations in response to variety of factors that are inherently unpredictable and outside of our control, including changes in our and IBTX’s business,position, operations and prospects and regulatory considerations, the historical and anticipated future financial results of our respective banking operations and general market and economic developments affecting Texas, United States and international businesses and financial markets. The substantial differences between our business and the business of IBTX will subject our stockholders to new and different risks than those with which they are familiar. A period of
•As a participating lender in the pursuit of other opportunities beneficial to us as an independent company; and
Small Business Administration’s PPP, we may be subject to negative reactions fromadditional risks regarding our Bank’s processing of PPP loans and are dependent on the financial marketsfederal government’s continuation and fromsupport of the program.
•The impact of the Tax Cuts and Jobs Act (the “Tax Act”) on us and our customers contributes to uncertainty and employeesrisk related to our customers’ future demand for credit and our future results.
•We are subject to environmental liability risk associated with lending activities.
•Severe weather, earthquakes, other natural disasters, pandemics, acts of war or terrorism and other external events could significantly impact our business.
Risks Relating to Our Securities
•Our stock price can be volatile.
•The trading volume in our common stock is less than that could materially affectof other larger financial services companies.
•Our preferred stock is thinly traded.
•An investment in our business, financial resultssecurities is not an insured deposit.
•The holders of our indebtedness and preferred stock price; the market pricehave rights that are senior to those of our common stock could decline tostockholders.
•We do not currently pay dividends on our common stock.
•Federal legislation and regulations impose restrictions on the extent that current market pricesownership of our common stock reflectstock.
•Anti-takeover provisions of our certificate of incorporation, bylaws and Delaware law may make it more difficult for you to receive a market assumption that the merger will be completed.change in control premium.
16
•The trading volume in our credit risk. The riskcommon stock is less than that of non-payment of loans is inherent in commercial banking. Increased credit risk may result from many factors, including:other larger financial services companies.
•An investment in local, U.S.our securities is not an insured deposit.
•The holders of our indebtedness and global economic and industry conditions;
•Federal legislation and regulations impose restrictions on the ownership of our common stock.
•Anti-takeover provisions of our certificate of incorporation, bylaws and Delaware law may make it more difficult for you to receive a change in control premium.
•Our Bank is subject to fluctuation based upon, among other things, the costregulatory and availability of funds, changes in interest rates and economic conditions in general. Our Bank’s ability to pay dividends to us is subject to regulatorycontractual limitations that can, under certain adverse circumstances, prohibiton the payment of dividends to us. Our right to participate in any distribution from the liquidation or sale of our Bank’s assets is subject to the prior claims of our Bank’s creditors.its subordinated notes.
16
Risks Relating to Our Securities
•Our stock price can be volatile.
•The trading volume in our common stock is less than that of other larger financial services companies.
•Our preferred stock is thinly traded.
•An investment in our securities is not an insured deposit.
•The holders of our indebtedness and preferred stock have rights that are senior to those of our common stockholders.
•We do not currently pay dividends on our common stock.
•Federal legislation and regulations impose restrictions on the ownership of our common stock.
•Anti-takeover provisions of our certificate of incorporation, bylaws and Delaware law may make it more difficult for you to receive a change in control premium.
•Our Bank is subject to regulatory and contractual limitations on the payment of its subordinated notes.
16
Risk Factors Associated With Our Business
Credit Risks
We must effectively manage our credit risks. The risk of non-payment of loans is inherent in commercial banking, which may result from many factors, including:
•Adverse changes in local, U.S. and global economic and industry conditions;
•Business and market disruptions as a result of the COVID-19 pandemic and governmental restrictions imposed in response to the pandemic;
•Declines in the value of collateral, including asset values that are directly or indirectly related to external factors such as commodity prices, real estate values or interest rates;
•Concentrations of credit associated with specific loan categories, industries or collateral types; and
•Exposures to individual borrowers and to groups of entities that may be affiliated on some basis that individually and/or collectively represent a larger percentage of our total loans or capital than might be considered common at other banks of similar size.
We rely heavily on information provided by third parties when originating and monitoring loans. If this information is intentionally or negligently misrepresented and we do not detect such misrepresentations, the credit risk associated with the transaction may be increased. Although we attempt to manage our credit risk by carefully monitoring the concentration of our loans within specific loan categories and industries and through prudent loan approval and monitoring practices in all categories of our lending, we cannot assure you that our approval and monitoring procedures will reduce these lending risks. Our significant number of large credit relationships (above $20 million) could exacerbate credit problems precipitated by a regional or national economic downturn. Competitive pressures could erode underwriting standards, leading to a decline in general credit quality and increases in credit defaults and non-performing asset levels. If our credit portfolio management routines, policies and procedures are not able to adequately adapt to changes in economic, competitive or other conditions that affect customers and the quality of the loan portfolio, we may incur increased losses that could adversely affect our financial results and lead to increased regulatory scrutiny, restrictions on our lending activity or financial penalties.
A significant portion of our assets consists of commercial loans, which involve a high degree of credit risk. We generally invest a greater proportion of our assets in commercial loans to business customers than other banking institutions of our size, and our business plan calls for continued efforts to increase our assets invested in these loans. At December 31, 2020, approximately 36% of our LHI portfolio was comprised of commercial loans. Commercial loans may involve a higher degree of credit risk than other types of loans due, in part, to their larger average size, the effects of changing economic conditions on the businesses of our commercial loan customers, the dependence of borrowers on operating cash flow to service debt and our reliance upon collateral which may not be readily marketable. Due to the greater proportion of these commercial loans in our portfolio and because the balances of these loans are, on average, larger than other categories of loans, losses incurred on a relatively small number of commercial loans could have a materially adverse impact on our results of operations and financial condition.
We are subject to risks arising from conditions in the real estate market, as a significant portion of our loans are secured by commercial and residential real estate. At December 31, 2020, approximately 61% of our loans held for investment portfolio was comprised of loans with real estate as the primary component of collateral. Our real estate lending activities, and our exposure to fluctuations in real estate collateral values, are significant and may increase as our assets increase. The market value of real estate can fluctuate significantly in a relatively short period of time as a result of market conditions in the geographic area in which the real estate is located, in response to factors such as economic downturns, changes in the economic health of industries heavily concentrated in a particular area and in response to changes in market interest rates, which influence capitalization rates used to value revenue-generating commercial real estate. If the value of real estate serving as collateral for our loans declines materially, a significant part of our loan portfolio could become under-collateralized and losses incurred upon borrower defaults would increase. Conditions in certain segments of the real estate industry, including homebuilding, lot development and mortgage lending, may have an effect on values of real estate pledged as collateral for our loans. The inability of purchasers of real estate, including residential real estate, to obtain financing may weaken the financial condition of our borrowers who are dependent on the sale or refinancing of property to repay their loans. Changes in the economic health of certain industries can have a significant impact on other sectors or industries which are directly or indirectly associated with those industries, and may impact the value of real estate in areas where such industries are concentrated.
Our future profitability depends, to a significant extent, upon our middle market business customers. Our future profitability depends, to a significant extent, upon revenue we receive from middle market business customers, and their ability to continue to meet their loan obligations. Adverse economic conditions or other factors affecting this market segment, and our failure to timely identify and react to unexpected economic downturns, may have a greater adverse effect on us than on other financial
17
institutions that have a more diversified customer base. Additionally, our inability to grow our middle market business customer base in a highly competitive market could affect our future growth and profitability.
Our business is concentrated in Texas; our energy industry exposure could adversely affect our performance. Although more than 50% of our loan exposure is outside of Texas and more than 50% of our deposits are sourced outside of Texas, our Texas concentration remains significant compared to other peer banks. A majority of our loans held for investment, excluding mortgage finance loans and other national lines of business, are to businesses with headquarters or operations in Texas. As a result, our financial condition and results of operations may be strongly affected by any prolonged period of economic recession or other adverse business, economic or regulatory conditions affecting Texas businesses and financial institutions. While the Texas economy is more diversified than in the 1980’s, the energy sector continues to play an important role. At December 31, 2020 our outstanding energy loans represented 3% of total loans held for investment. Furthermore, energy production and related industries represent a significant part of the economies in some of the primary markets in which we operate. Our energy loans consist primarily of producing reserve-based loans to exploration and production companies with a smaller portion of our loan balances attributable to royalty owners, midstream operators, saltwater disposal and other service companies whose businesses primarily relate to production, not exploration and development, of oil and gas. These businesses have been significantly affected by volatility in oil and natural gas prices, reserve depletion curves, material declines in the level of drilling and production activity in Texas and in other areas of the United States and material fluctuations in investor interest in oil and gas exploration and production investments. We experienced an increase in non-performing assets and higher charge-offs primarily related to energy loans during 2017, and they still remain elevated compared to the overall loan portfolio. There is no assurance that we will not be materially adversely impacted by the direct and indirect effects of current and future conditions in the energy industry in Texas and nationally.
Our mortgage correspondent aggregation business subjects us to additional risks. In 2015, we launched our mortgage correspondent aggregation (“MCA”) business, a correspondent lending program that complements our mortgage warehouse lending business, in 2015. Volatility in the mortgage industry has caused uncertainty related to the pricing of the mortgage loans that we seek to purchase, as well as uncertainty in the pricing of those loans when they are sold or securitized. Similar uncertainty exists with respect to volatility in the value of mortgage servicing rights ("MSRs") on our balance sheet. This volatility may cause the actual returns on mortgage sales or securitization transactions to be less than anticipated, which could adversely affect our overall loans held for sale volumes and the profitability of this line of business. Fluctuations in the value of MSRs that we hold on our balance sheet could require that we recognize impairments in the value of such assets and/or actual losses on the disposition of such assets. Additionally, non-bank competitors may have a pricing advantage as they are not subject to the same capital maintenance requirements relative to mortgage loans and MSRs as our Bank.
Our MCA business subjects us to additional interest rate risk and price risk, which may have an adverse effect on our business. The persistent low interest rate environment has in certain cases resulted in an increase in the value of MSRs, causing other market participants and competitors who are planning to hold MSRs for a longer term to be more aggressive in their pricing of the underlying loan purchases than a participant like our Bank that does not plan to hold MSRs on a long-term basis. While we believe market and competitive conditions may improve in the future, a prolonged low interest rate environment could adversely affect the economics of our MCA business over a longer period of time. Conversely, an environment of rising interest rates could have a significant effect on loan volumes in our MCA business if refinancing and home purchase activities are reduced.
We have entered into loan purchase commitments and forward sales commitments in connection with the MCA business, as well as interest rate swap futures and forward sale commitments of mortgage-backed securities in connection with holding MSRs. While we believe that our hedging strategies will be successful in mitigating our exposure to interest rate risk associated with the purchase of mortgage loans held for sale and holding of MSRs, no hedging strategy can completely protect us. Poorly designed strategies, improperly executed transactions, or inaccurate assumptions regarding future interest rates or market conditions could have a material adverse effect on our financial condition and results of operations.
We are from time to time required to hold or repurchase mortgage loans or reimburse investors as a result of breaches in contractual representations and warranties under the agreements pursuant to which we purchase and sell mortgage loans. While our agreements with the originators and sellers of mortgage loans provide us with legal recourse against them that may allow us to recover some or all of our losses, these companies are frequently not financially capable of paying large amounts of damages and as a result we can offer no assurance that we will not bear all of the risk of loss.
We may incur other costs and losses as a result of actual or alleged violations of regulations related to the origination and purchase of residential mortgage loans. The origination of residential mortgage loans is governed by a variety of federal and state laws and regulations, which are frequently changing. We sell residential mortgage loans that we have purchased or that we have originated to various parties, including Ginnie Mae and GSEs such as Fannie Mae or Freddie Mac and other financial institutions that purchase mortgage loans for investment or private label securitization. We may also pool FHA-insured and VA-guaranteed mortgage loans which back securities issued by Ginnie Mae. Our accrued mortgage repurchase liability represents management’s best estimate of the probable loss that we may expect to incur for the representations and warranties in
18
the contractual provisions of our sales of mortgage loans, but there is no assurance that our losses will not materially exceed such amounts.
We must effectively manage our counterparty risk. Financial services institutions are interrelated as a result of trading, clearing, counterparty and other relationships. Our Bank has exposure to many different industries and counterparties, and routinely executes transactions with counterparties in the financial services industry, including commercial banks, brokers and dealers, investment banks, and other financial market participants. Many of these transactions expose our Bank to credit risk in the event of a default by a counterparty or client. In addition, our Bank’s credit risk may be increased when the collateral securing its loans cannot be realized upon or is liquidated at prices not sufficient to recover the full amount of its credit or derivative exposure. Any such losses could have a material adverse effect on our business, financial condition and results of operations.
We must maintain an appropriate allowance for credit losses. Our experience in the banking industry indicates that some portion of our loans will become delinquent, and some may only be partially repaid or may never be repaid at all. We maintain an allowance for credit losses on loans, which is a reserve established through a provision for credit losses charged to expense each quarter, that is consistent with management’s assessment of the collectability of the loan portfolio in light of the amount of loans committed and outstanding and current and future economic conditions and market trends. When specific loan losses are identified, the amount of the expected loss is removed, or charged-off, from the allowance. Our methodology for establishing the appropriateness of the allowance for credit losses on loans depends on our subjective application of risk grades as indicators of each borrower’s ability to repay specific loans, together with our assessment of how actual or projected changes in competitor underwriting practices, competition for borrowers and depositors and other conditions in our markets are likely to impact improvement or deterioration in the collectability of our loans as compared to our historical experience.
Our business model makes our Bank more vulnerable to changes in underlying business credit quality than other banks with which we compete. We have a substantially larger percentage of commercial, real estate and other categories of business loans relative to total assets than most other banks in our market and our individual loans are generally larger as a percentage of our total earning assets than other banks. We have substantially increased our liquidity in recent years, and these funds have primarily been invested in low-yielding deposits with federal agencies and other financial institutions. And, we have had a substantially smaller portion of our assets consists of securities and other earning asset categories that can be less vulnerable to changes in local, regional or industry-specific economic trends, causing our potential for credit losses to be more severe than other banks. However, during 2020, we began deploying some of our excess liquidity into securities to improve income, but the most significant portion of earning assets still remains in loans. Our business model has focused on growth in various loan categories that can be more sensitive to changes in economic trends. We believe our ability to maintain an above-peer rate of growth in commercial loans is dependent on maintaining above-peer credit quality metrics. The failure to maintain above-peer credit quality metrics would have a material adverse impact on our growth and profitability. Historically, we have sought to take action prior to economic downturns by slowing growth rates and decreasing the risk level of our assets by, among other things, allowing runoff of loans that we believe may not perform well during a weakening or declining economic environment.
If our assessment of inherent risk and losses in our loan portfolio is inaccurate, or economic and market conditions or our borrowers' financial performance experience material unanticipated changes, including as a result of the COVID-19 pandemic, the allowance may become inadequate, requiring larger provisions for loan losses that can materially decrease our earnings. Certain of our loans individually represent a significant percentage of our total allowance for credit losses. Adverse collection experience in a relatively small number of these loans could require an increase in the provision for credit losses. Federal regulators periodically review our allowance for credit losses and, based on their judgments, which may be different than ours, may require us to change classifications or grades of loans, increase the allowance for credit losses or recognize further loan charge-offs. Any increase in the allowance for credit losses or in the amount of loan charge-offs required by our methodology or regulatory agencies could have a negative effect on our results of operations and financial condition.
Changes in accounting standards could materially affect how we report our financial results. The Financial Accounting Standards Board and the SEC may change the financial accounting and reporting standards, or the interpretation of those standards, that govern the preparation of our external financial statements from time to time. The impact of these changes or the application thereof on our financial condition and operations can be difficult to predict.
For example, we adopted ASU 2016-13 Financial Instruments - Credit Losses (Topic 326) on January 1, 2020 which replaced the incurred loss methodology for determining our provision for credit losses and allowance for credit losses with the CECL model. Implementation of CECL requires that we determine periodic estimates of lifetime expected future credit losses on loans in the provision for credit losses in the period when the loans are booked. Our adoption of CECL resulted in an increase to the allowance for credit losses by $9.1 million. The impact of CECL in future periods will be significantly influenced by the composition, characteristics and quality of our loan portfolio, as well as the prevailing economic conditions and forecasts utilized. Should these factors materially change, we may be required to increase or decrease our allowance for credit losses, decreasing or increasing our reported income, and introducing additional volatility into our reported earnings.
Liquidity Risks
19
We must effectively manage our liquidity risk. Our Bank requires liquidity in the form of available funds to meet its deposit, debt and other obligations as they come due, borrower requests to draw on committed credit facilities as well as unexpected demands for cash payments. While we are not subject to Basel III liquidity regulations, the adequacy of our liquidity is a matter of regulatory interest given the significant portion of our balance sheet represented by loans as opposed to securities and other more marketable investments. Our Bank’s principal source of funding consists of customer deposits, supplemented by our short-term and long-term borrowings, including federal funds purchased and FHLB borrowings. We also rely on the availability of the mortgage secondary market provided by Ginnie Mae and the GSEs to support the liquidity of our residential mortgage assets. A substantial majority of our Bank’s liabilities consist of demand, savings, checking and money market deposits, which are payable on demand or upon relatively short notice. By comparison, a substantial portion of our assets are loans, most of which, excluding our mortgage finance loans and mortgage loans held for sale, cannot be collected or sold in so short a time frame, creating the potential for an imbalance in the availability of liquid assets to satisfy depositors and loan funding requirements.
We have historically held smaller balances of marketable securities than many of our competitors, limiting our ability to increase our liquidity by completing market sales of these assets. During 2020, we deployed some of our excess liquidity into marketable securities. An inability to raise funds through deposits, borrowings, the sale of securities and loans and other sources, or an inability to access the capital markets, could have a substantial negative effect on our Bank’s liquidity. We actively manage our available sources of funds to meet our expected needs under normal and financially stressed conditions, but there is no assurance that our Bank will be able to make new loans, meet ongoing funding commitments to borrowers and replace maturing deposits and advances as necessary under all possible circumstances. Our Bank’s ability to obtain funding could be impaired by factors beyond its control, such as disruptions in financial markets, negative expectations regarding the financial services industry generally or in our markets or negative perceptions of our Bank, including our credit ratings.
Our Bank sources a significant volume of its demand deposits from financial services companies, mortgage finance customers and other commercial sources, resulting in a larger percentage of large deposits and a smaller number of sources of deposits than would be typical of other banks in our markets, creating concentrations of deposits that carry a greater risk of unexpected material withdrawals. In recent periods over half of our total deposits have been attributable to customers whose balances exceed the $250,000 FDIC insurance limit. Many of these customers actively monitor our financial condition and results of operations and could withdraw their deposits quickly upon the occurrence of a material adverse development affecting our Bank or their businesses. Significant deterioration in our credit quality or a downgrade in our credit ratings could affect funding sources such as financial institutions and broker dealers. In response to this risk we have increased our liquidity and developed more sophisticated techniques for monitoring and planning for changes in liquidity and capital over the past several years, but there is no assurance that we will maintain or have access to sufficient funding and capital to fully mitigate our liquidity risk.
One potential source of liquidity for our Bank consists of “brokered deposits” arranged by brokers acting as intermediaries, typically larger money-center financial institutions. We receive deposits provided by certain of our customers in connection with our delivery of other financial services to them or their customers which are subject to regulatory classification as “brokered deposits” even though we consider these to be relationship deposits and they are not subject to the typical risks or market pricing associated with conventional brokered deposits.
If we do not maintain our regulatory capital above the level required to be well capitalized we would be required to obtain FDIC consent for us to continue to accept deposits classified as brokered deposits, and there can be no assurance that the FDIC would consent under any circumstances. We could also be required to suspend or eliminate deposit gathering from any source classified as “brokered” deposits. The FDIC can change the definition of brokered deposits or extend the classification to deposits not currently classified as brokered deposits. These non-traditional deposits are subject to greater operational and reputational risk of unexpected withdrawal than traditional demand and time deposits, particularly those provided by consumers. A significant decrease in our balances of relationship brokered deposits could have a material adverse effect upon our financial condition and results of operations. See Management’s Discussion and Analysis of Financial Condition and Results of Operations below for further discussion of our liquidity.
Our growth plans are dependent on the availability of capital and funding. Our historical ability to raise capital through the sale of capital stock and debt securities may be affected by economic and market conditions or regulatory changes that are beyond our control. Adverse changes in our operating performance or financial condition could make raising additional capital difficult or more expensive or limit our access to customary sources of funding, including inter-bank borrowings, repurchase agreements and borrowings from the Federal Reserve Bank ("FRB") or the Federal Home Loan Bank ("FHLB"). Unexpected changes in requirements for capital resulting from regulatory actions could require us to raise capital at a time, and at a price, that might be unfavorable, or could require that we forego continuing growth or reduce our current loan portfolio. We cannot offer assurance that capital and funding will be available to us in the future, in needed amounts, upon acceptable terms or at all. Our efforts to raise capital could require the issuance of securities at times and with maturities, conditions and rates that are disadvantageous, and which could have a dilutive impact on our current stockholders. Factors that could adversely affect our ability to raise additional capital or necessary funding include conditions in the capital markets, our financial performance, our credit ratings, regulatory actions and general economic conditions. Increases in our cost of capital, including dilution and
20
increased interest or dividend requirements, could have a direct adverse impact on our operating performance and our ability to achieve our growth objectives. Trust preferred securities are no longer viable as a source of new long-term debt capital as a result of regulatory changes. The treatment of our existing trust preferred securities as capital may be subject to further regulatory change prior to their maturity, which could require the Company to seek additional capital.
Our mortgage finance business has experienced, and will likely continue to experience, highly variable usage of our funding capacity resulting from seasonal demands for credit, surges in consumer demand driven by changes in interest rates and month-end “spikes” of residential mortgage closings. These spikes could also result in our Bank having capital ratios that are below internally targeted levels or even levels that could cause our Bank to not be well capitalized and could affect liquidity levels. At the same time managing this risk by declining to respond fully to the needs of our customers could severely impact our business. We have responded to these variable funding demands by, among other things, increasing the extent of participations sold in our mortgage loan interests, as needed, and by maintaining a substantial borrowing relationship with the FHLB. Our mortgage finance customers have in recent periods provided significant low-cost deposit balances associated with the borrower escrow accounts created at the time certain mortgage loans are funded, which have benefitted our liquidity and net interest margin. In response to competitive pressures, we sometimes find it necessary to pay interest on some of these accounts, as regulations allow or require and this trend may continue, which can affect our ability to reduce our costs of funds. Individual escrow account balances also experience significant variability monthly as principal and interest payments, as well as ad valorem taxes and insurance premiums, are paid periodically. While the short average holding period of our mortgage interests of approximately 20 days will allow us, if necessitated by a funding shortfall, to rapidly decrease the size of the portfolio and its associated capital and funding requirements, any such action might significantly damage our business and important mortgage finance relationships.
We are dependent on funds obtained from borrowing or capital transactions or from our Bank to fund our obligations. We are a financial holding company engaged in the business of managing, controlling and operating our Bank. We conduct no material business or other activity at the parent company level other than activities incidental to holding equity and debt investments in our Bank. As a result, we rely on the proceeds of capital transactions, borrowings under our revolving line of credit, payments of interest and principal on loans made to our Bank and dividends on preferred stock issued by our Bank to pay our operating expenses, to satisfy our obligations to debtholders and to pay dividends on our preferred stock. The profitability of our Bank is subject to fluctuation based upon, among other things, the cost and availability of funds, changes in interest rates and economic conditions in general. Our Bank’s ability to pay dividends to us is subject to regulatory limitations that can, under certain adverse circumstances, prohibit the payment of dividends to us. Our right to participate in any distribution from the liquidation or sale of our Bank’s assets is subject to the prior claims of our Bank’s creditors.
If we are unable to access funds from capital transactions, borrowing under our revolving line of credit or dividends or interest on loan payments from our Bank, we may be unable to satisfy our obligations to creditors or debtholders or pay dividends on our preferred stock. Changes in our Bank’s operating results or capital requirements could require us to convert subordinated notes or preferred stock of our bank held by us into common equity, reducing our cash flow available to meet our obligations.
Market Risks
We must effectively manage our interest rate risk. Our profitability is dependent to a large extent on our net interest income, which is the difference between the interest income paid to us on our loans and investments and the interest we pay to third parties such as our depositors, lenders and debtholders. Changes in interest rates can impact our profits and the fair values of certain of our assets and liabilities. Models that we use to forecast and plan for the impact of rising and falling interest rates may be incorrect or fail to consider the impact of competition and other conditions affecting our loans and deposits.
Periods of unusually low or volatile interest rates have a material effect on our earnings. During the first quarter of 2020, in response to the COVID-19 pandemic, the Federal Reserve reduced the target Federal Funds rate to between zero and 0.25%, and there is an expectation that Federal Reserve policy will maintain a low interest rate environment for the foreseeable future.
Increases in interest rates and economic conditions affecting consumer demand for housing can have a material impact on the volume of mortgage originations and refinancings, adversely affecting the profitability of our mortgage finance business. Interest rate risk can also result from mismatches between the dollar amounts of repricing or maturing assets and liabilities and from mismatches in the timing and rates at which our assets and liabilities reprice. We actively monitor and manage the balances of our maturing and repricing assets and liabilities to reduce the adverse impact of changes in interest rates, but there can be no assurance that we will be able to avoid material adverse effects on our net interest margin in all market conditions.
Rising interest rates in prior periods have increased our interest expense, with a commensurate adverse effect on our net interest income, and may be expected to do so in future periods. In a rising rate environment, competition for cost-effective deposits increase, making it more costly for us to fund loan growth. Rapid and unexpected volatility in interest rates creates additional uncertainty and potential for adverse financial effects. There can be no assurance that we will not be materially adversely affected by future changes in interest rates.
21
We may be adversely affected by changes in the method of determining LIBOR, or the replacement of LIBOR with an alternative reference rate, for our variable rate loans, derivative contracts and other financial assets and liabilities. Our business relies upon a large volume of loans, derivative contracts and other financial instruments which are directly or indirectly dependent on LIBOR to establish their interest rate and/or value. The administrator of LIBOR has proposed to extend publication of the most commonly used U.S. Dollar LIBOR settings to June 30, 2023 and to cease publishing other LIBOR settings on December 31, 2021. The U.S. federal banking agencies have issued guidance strongly encouraging banking organizations to cease using U.S. dollar LIBOR as a reference rate in new contracts as soon as practicable and in any event by December 31, 2021. It is not possible to know whether LIBOR will continue to be viewed as an acceptable market benchmark, what rate or rates may become accepted alternatives to LIBOR, or what the effect of any such changes in views or alternatives may have on the financial markets for LIBOR-linked financial instruments.
While we have established a working group consisting of key stakeholders from throughout the company to monitor developments relating to LIBOR uncertainty and changes and to guide the Bank’s response, the impact of these developments on our business and financial results is not yet known. The transition from LIBOR may cause us to incur increased costs and face additional risks. Uncertainty as to the nature of alternative reference rates and as to potential changes in or other reforms to LIBOR may adversely affect LIBOR rates and the value of LIBOR-based loans originated prior to 2021. If LIBOR rates are no longer available, any successor or replacement interest rates may perform differently, which may affect our net interest income, change our market risk profile and require changes to our risk, pricing and hedging strategies. Any failure to adequately manage this transition could adversely impact our reputation.
Strategic Risks
We must be effective in developing and executing new lines of business and new products and services while managing associated risks. Our business strategy requires that we develop and grow new lines of business and offer new products and services within existing lines of business in order to compete successfully in offering a premier and differentiated client banking experience to ensure future client acquisition and retention of existing clients and realize our strategic priorities for both loans and deposits. Substantial costs, risks and uncertainties are associated with these efforts, particularly in instances where the markets are not fully developed. Developing and marketing new activities requires that we invest significant time and resources before new sources of revenues, funding and profits can be realized. Timetables for the development and launch of new activities may not be achieved and price and profitability targets may not prove feasible or their realization may be delayed. External factors, such as compliance with regulations, receipt of necessary licenses or permits, competitive alternatives and shifting market preferences, may also adversely impact the successful execution of new activities. New activities necessarily entail additional risks and may present additional risks to the effectiveness of our system of internal controls and risk management strategies. All service offerings, including current offerings and new activities, may become more risky due to changes in economic, competitive and market conditions beyond our control. Our regulators could determine that our risk management practices are not adequate or our capital levels are not sufficiently in excess of well-capitalized levels and take action to restrain our growth. Failure to successfully manage these risks, generally and to the satisfaction of our regulators, in the development and implementation of new lines of business or new products or services could have a material adverse effect on our business, results of operations and financial condition.
We compete with many banks and other financial service providers. Competition among providers of financial services in our markets, in Texas, regionally and nationally, is intense. We compete with other financial and bank holding companies, state and national commercial banks, savings and loan associations, consumer finance companies, credit unions, securities brokerages, insurance companies, mortgage banking companies, money market mutual funds, asset-based non-bank lenders, government sponsored or subsidized lenders and other financial services providers. Many of these competitors have substantially greater financial resources, lending limits and technological resources and larger branch networks than we do, and are able to offer a broader range of products and services than we can, including systems and services that could more effectively protect customers from cyber threats. Many competitors offer lower interest rates and more liberal loan terms that appeal to borrowers but adversely affect net interest margin and assurance of repayment. We are increasingly faced with competition in many of our products and services by non-bank providers who may have competitive advantages of size, access to potential customers and fewer regulatory requirements. Failure to compete effectively for deposit, loan and other banking customers in any of our lines of business could cause us to lose market share, slow or reverse our growth rate or suffer adverse effects on our financial condition and results of operations.
We must effectively execute our business strategy in order to continue our asset and earnings growth. Our core strategy is to develop our business principally through organic growth by offering a premier and differentiated banking experience to companies in high-value business segments. Our prospects for continued growth must be considered in light of the risks, expenses and difficulties frequently encountered by growing companies. In order to execute our business strategy successfully, we must, among other things:
•continue to identify and expand into suitable markets and lines of business, in Texas, regionally and nationally;
•develop new products and services and execute our full range of products and services more efficiently and effectively;
22
•attract and retain qualified bankers in each of our targeted market segments to build our customer base;
•respond to market opportunities promptly and nimbly while balancing the demands of risk management and compliance with regulatory requirements;
•expand our loan portfolio in an intensely competitive environment while maintaining credit quality;
•attract sufficient deposits and capital to fund our anticipated loan growth and satisfy regulatory requirements;
•control expenses; and
•acquire and maintain sufficient qualified staffing and information technology and operational resources to support growth and compliance with regulatory requirements.
Failure to effectively execute our business strategy could have a material adverse effect on our business, future prospects, financial condition or results of operations.
Operational Risks
We, our vendors and customers must effectively manage our information systems risk which may experience disruption, failure or breach in security.. We, our vendors and customers all rely heavily on communications and information systems to conduct our respective businesses, store sensitive data and work effectively together. The financial services industry is undergoing rapid technological changes with frequent introductions of new technology-driven products and services. Our ability to compete successfully depends in part upon our ability to use technology to provide products and services that will satisfy customer demands. Many ofour larger competitors invest substantially greater resources in technological capabilities than we do. We may not be able to effectively protect, develop and manage mission critical systems and IT infrastructure to support strategic business initiatives, which could impair our ability to achieve financial, operational, compliance and strategic objectives and negatively affect our business, results of operations or financial condition.
Our communications and information systems and those of our vendors and customers remain vulnerable to unexpected disruptions, failures and cyber-attacks. Any disruption, failure or breach in security of these systems could result in significant disruption to our operations. Information security breaches and cyber-security-related incidents include, but are not limited to, attempts to access information, including customer and company information, malicious code, computer viruses and denial of service attacks that could result in unauthorized access, misuse, loss or destruction of data (including confidential customer information), account takeovers, unavailability of service or other events. These types of threats may derive from human error, fraud or malice on the part of external or internal parties or may result from accidental technological failure. The risk, frequency and intensity of such attacks is escalating, including as a result of remote working arrangements implemented in response to the COVID-19 pandemic, the use of the internet and telecommunications technologies to conduct financial transactions, and the increased sophistication of these threats. Material failures or interruptions of these systems could impair our ability to serve our customers and to operate our business and could damage our reputation, result in a loss of business, subject us to additional regulatory scrutiny or enforcement or expose us to civil litigation and possible financial liability. While we have developed extensive recovery plans, we cannot assure that those plans will be effective to prevent adverse effects upon us and our customers resulting from system failures.
Cloud technologies are also critical to the operation of our systems, and our reliance on cloud technologies is growing. Service disruptions in cloud technologies may lead to delays in accessing, or the loss of, data that is important to our businesses and may hinder our clients’ access to our products and services.
We collect and store sensitive data, including personally identifiable information of our customers and employees and in the ordinary course of business must allow certain of our vendors access to that data. Breaches of our systems or our vendors' or customers’ systems, thefts of data and other breaches and criminal activity may result in significant costs to respond, liability for customer losses if we or our vendors are at fault, damage to our customer relationships, regulatory scrutiny and enforcement and loss of future business opportunities due to reputational damage. Even the most well protected information, networks, systems and facilities remain potentially vulnerable because attempted security breaches, particularly cyber-attacks and intrusions, or disruptions will occur in the future, and because the techniques used in such attempts are constantly evolving and generally are not recognized until launched against a target, and in some cases are designed not to be detected and, in fact, may not be detected. Accordingly, we may be unable to anticipate these techniques or to implement adequate security barriers or other preventative measures, and thus it is virtually impossible for us to entirely mitigate this risk.
Breaches can be perpetrated by unknown third parties, but could also be facilitated by employees either inadvertently or by consciously attempting to create disruption or certain acts of fraud. Our customers and employees have been, and will continue to be, targeted by parties using fraudulent e-mails and other communications in attempts to misappropriate passwords, bank account information or other personal information or to introduce viruses or other malware through "Trojan horse" programs to our information systems, the information systems of our merchants or third-party service providers and/or our customers' computers. Although we, with the help of third-party service providers, will continue to implement information security technology solutions and establish operational procedures to protect sensitive data, there can be no assurance that these
23
measures will be effective. We advise and provide training to our customers and evaluate and impose security requirements on our vendors regarding protection of their respective information systems, but there is no assurance that these actions will have the intended positive effects or will be effective to prevent losses. In some cases we may elect to contribute to the cost of responding to cybercrime against our customers, even when we are not at fault, in order to maintain valuable customer relationships. Successful cyber-attacks on our Bank, vendors or customers may affect the reputation of our Bank, and failure to meet customer expectations could have a material impact on our ability to attract and retain deposits as a primary source of funding.
A security breach or other significant disruption of our information systems or those related to our customers, merchants and our third party vendors, including as a result of cyber-attacks, could (i) disrupt the proper functioning of our networks and systems and therefore our operations and/or those of certain of our customers; (ii) result in the unauthorized access to, and destruction, loss, theft, misappropriation or release of confidential, sensitive or otherwise valuable information of ours or our customers; (iii) result in a violation of applicable privacy, data breach and other laws, subjecting us to additional regulatory scrutiny and exposing us to civil litigation, governmental fines and possible financial liability; (iv) require significant management attention and resources to remedy the damages that result; or (v) harm our reputation or cause a decrease in the number of customers that choose to do business with us. The occurrence of any of the foregoing could have a material adverse effect on our business, financial condition and results of operations.
Our operations rely extensively on a broad range of external vendors. We rely on a large number of vendors to provide products and services necessary to maintain our day-to-day operations, particularly in the areas of operations, treasury management systems, information technology and security. This reliance exposes us to the risk that these vendors will not perform as required by our agreements as well as risks resulting from disruptions in communications with our vendors, cyber-attacks and security breaches at our vendors, failure of a vendor to provide services for other reasons and poor performance of services. An external vendor’s failure to perform in any of these areas could be disruptive to our operations, which could have a material adverse impact on our business, financial condition and results of operations, as well as cause reputational damage. External vendors who must have access to our information systems in order to provide their services have been identified as significant sources of information technology security risk. While we have implemented an active program of oversight to address this risk, there can be no assurance that we will not experience material security breaches associated with our vendors.
We must continue to attract, retain and develop key personnel. Our success depends to a significant extent upon our ability to attract, develop and retain experienced bankers in each of our lines of business and markets as well as managers in operational areas, compliance and other support areas to build and maintain the infrastructure and controls required to support continuing loan and deposit growth. Competition for the best people in our industry can be intense, and there is no assurance that we will continue to have the same level of success in this effort that has supported our historical results. Factors that affect our ability to attract, develop and retain key employees include our compensation and benefits programs, our profitability, our ability to establish appropriate succession plans for key talent, our reputation for rewarding and promoting qualified employees and market competition for employees with certain skills, including information systems development and security. The cost of employee compensation is a significant portion of our operating expenses and can materially impact our results of operations. The unanticipated loss of the services of key personnel could have an adverse effect on our business. Although we have entered into employment agreements with certain key employees, we cannot assure you that we will be successful in retaining them.
Our accounting estimates and risk management processes rely on management judgment, which may prove inadequate or be adversely impacted by inaccurate assumptions or models. The processes we use to estimate expected credit losses for purposes of establishing the allowance for credit losses and to measure the fair value of financial instruments, certain of our liquidity and capital planning tools, as well as the processes we use to estimate the effects of changing interest rates and other market measures on our financial condition and results of operations, all depend upon management’s judgment. Management’s judgment and the data relied upon by management may be based on assumptions that prove to be inaccurate, particularly in times of market stress or other unforeseen circumstances. Additionally, CECL requires the application of greater management judgment that is supported by new models and more data elements, including macroeconomic forecasts, than the previous allowance standard. Our adoption of the CECL model is expected to increase the complexity, and associated risk, of the analysis and processes relying on management judgment, which could negatively impact our financial condition and results of operations.
Our risk management strategies and processes may not be effective; our controls and procedures may fail or be circumvented. We continue to invest in the development of risk management techniques, strategies, assessment methods and related controls and monitoring approaches on an ongoing basis. However, these risk management strategies and processes may not be fully effective in mitigating our risk exposure in all economic market environments or against all types of risk. Any failures in our risk management strategies and processes to accurately identify, quantify and monitor our risk exposure could limit our ability to effectively manage our risks. Management regularly reviews and updates our internal controls over financial reporting, disclosure controls and procedures, and corporate governance policies and procedures. Any system of controls, however well designed and operated, is based in part on certain assumptions and management judgment and can provide only reasonable, not absolute, assurances that the objectives of the system are met. Any failure or circumvention of our controls and procedures or
24
failure to comply with regulations related to controls and procedures could have a material adverse effect on our business, results of operations and financial condition.
Our business is susceptible to fraud. Our business exposes us to fraud risk from our loan and deposit customers, the parties they do business with, as well as from our employees, contractors and vendors. We rely on financial and other data from new and existing customers which could turn out to be fraudulent when accepting such customers, executing their financial transactions and making and purchasing loans and other financial assets. In times of increased economic stress we are at increased risk of fraud losses. We believe we have underwriting and operational controls in place to prevent or detect such fraud, but we cannot provide assurance that these controls will be effective in detecting fraud or that we will not experience fraud losses or incur costs or other damage related to such fraud, at levels that adversely affect our financial results or reputation. Our lending customers may also experience fraud in their businesses which could adversely affect their ability to repay their loans or make use of our services. Our exposure and the exposure of our customers to fraud may increase our financial risk and reputation risk as it may result in unexpected loan losses that exceed those that have been provided for in our allowance for credit losses.
Legal, Regulatory and Compliance Risks
We are subject to extensive government regulation and supervision. We, as a bank holding company and financial holding company, and our Bank as a national bank, are subject to extensive federal and state regulation and supervision, and the potential for regulatory enforcement actions, that impact our business on a daily basis. See the discussion above at Business - Regulation and Supervision. These regulations affect our lending practices, permissible products and services and their terms and conditions, customer relationships, capital structure, investment practices, accounting, financial reporting, operations and our ability to grow, among other things. These regulations also impose obligations to maintain appropriate policies, procedures and controls to detect, prevent and report money laundering and terrorist financing and to verify the identities of our customers.
The level of regulatory scrutiny that we are subject to may fluctuate over time, based on numerous factors, including as a result of the upcoming change in the U.S. presidential administration. In addition, Congress, state legislatures, and federal and state regulatory agencies continually review banking laws, regulations and policies for possible changes. Changes to statutes, regulations or regulatory policies, including changes in interpretation or implementation of statutes, regulations or policies, could affect us in substantial and unpredictable ways. Material changes in regulation and requirements imposed on financial institutions, such as the Dodd-Frank Act, Basel III Capital Rules, European Union's General Data Protection Regulations and California Consumer Privacy Act CCPA result in additional costs, impose more stringent capital, liquidity and leverage requirements, limit the types of financial services and products we may offer and increase the ability of non-bank financial services providers to offer competing financial services and products, among other things. Such changes could result in new regulatory obligations which could prove difficult, expensive or competitively impractical to comply with if not equally imposed upon non-bank financial services providers with whom we compete.
We are subject to a continuous program of examinations by our regulators concerning, among other things, lending practices, reserve methodology, compliance with changing regulations and interpretations, BSA/AML compliance, our management of interest rate, liquidity, capital and operational risk, enterprise risk management, regulatory and financial accounting practices and policies and related matters, which can divert management’s time and attention from focusing on our business. We devote a significant amount of management time and expense to enhancing the infrastructure to support our compliance obligations, which can pose significant regulatory enforcement, financial and reputational risks if not appropriately addressed.
The Regulatory Relief Act passed on May 22, 2018, has provided a limited degree of regulatory relief for institutions of our size. Uncertainty regarding how our regulators will evaluate capital and liquidity planning going forward remains a risk. We continue to increase our capital and liquidity and expand our regulatory compliance staffing and systems in order to address continuing regulatory requirements. There is no assurance that our financial performance in future years will not be similarly burdened.
We expend substantial effort and incur costs to maintain and improve our systems, controls, accounting, operations, information security, compliance, audit effectiveness, analytical capabilities, staffing and training in order to satisfy regulatory requirements. We cannot offer assurance that these efforts will be accepted by our regulators as satisfying the legal and regulatory requirements applicable to us. Failure to comply with relevant laws, regulations or policies could result in sanctions by regulatory agencies, civil money penalties and/or reputation damage, which could have a material adverse effect on our business, financial condition and results of operations. While we have policies and procedures designed to prevent any such violations, there can be no assurance that such violations will not occur.
We must maintain adequate regulatory capital to support our business objectives. Under regulatory capital adequacy guidelines and other regulatory requirements, we must satisfy capital requirements based upon quantitative measures of assets, liabilities and certain off-balance sheet items. Our satisfaction of these requirements is subject to qualitative judgments by regulators that may differ materially from management’s and that are subject to being determined retroactively for prior periods. Additionally, regulators can make subjective assessments about the adequacy of capital levels, even if our Bank's
25
reported capital exceeds the “well-capitalized” requirements. Our ability to maintain our status as a financial holding company and to continue to operate our Bank as we have in recent periods is dependent upon a number of factors, including our Bank qualifying as “well capitalized” and “well managed” under applicable prompt corrective action regulations and upon our company qualifying on an ongoing basis as “well capitalized” and “well managed” under applicable Federal Reserve regulations.
Failure to meet regulatory capital standards could have a material adverse effect on our business, including damaging the confidence of customers in us, adversely impacting our reputation and competitive position and retention of key personnel. Any of these developments could limit our access to:
•brokered deposits;
•the Federal Reserve discount window;
•advances from the FHLB;
•capital markets transactions; and
•development of new financial services.
Failure to meet regulatory capital standards may also result in higher FDIC assessments. If we fall below guidelines for being deemed “adequately capitalized” the OCC or Federal Reserve could impose restrictions on our activities and a broad range of regulatory requirements in order to effect “prompt corrective action.” The capital requirements applicable to us are in a process of continuous evaluation and revision in connection with actions of the Basel Committee, our regulators and the requirements of the Dodd-Frank Act. We cannot predict the final form, or the effects, of these regulations on our business, but among the possible effects are requirements that we slow our rate of growth or obtain additional capital which could reduce our earnings or dilute our existing stockholders.
We are subject to claims and litigation in the ordinary course of our business, including claims that may not be covered by our insurers. Customers and other parties we engage with assert claims and take legal action against us on a regular basis and we regularly take legal action to collect unpaid borrower obligations, realize on collateral and assert our rights in commercial and other contexts. These actions frequently result in counter-claims against us. Litigation arises in a variety of contexts, including lending activities, employment practices, commercial agreements, fiduciary responsibility related to our wealth management services, intellectual property rights and other general business matters.
Claims and legal actions may result in significant legal costs to defend us or assert our rights and may result in reputational damage that adversely affects existing and future customer relationships. If claims and legal actions are not resolved in a manner favorable to us we may suffer significant financial liability or adverse effects upon our reputation, which could have a material adverse effect on our business, financial condition and results of operations. See Legal Proceedings below for additional disclosures regarding legal proceedings.
We purchase insurance coverage to mitigate a wide range of operating risks, including general liability, errors and omissions, professional liability, business interruption, cyber-crime, fraud and property loss, for events that may be materially detrimental to our Bank or customers. There is no assurance that our insurance will be adequate to protect us against material losses in excess of our coverage limits or that insurers will perform their obligations under our policies without attempting to limit or exclude coverage. We could be required to pursue legal actions against insurers to obtain payment of amounts we are owed, and there is no assurance that such actions, if pursued, would be successful.
Other Risks Affecting Our Business
Our business faces unpredictable economic and business conditions. Our business is directly impacted by general economic and business conditions in Texas, the United States and internationally. The credit quality of our loan portfolio necessarily reflects, among other things, the general economic conditions in the areas in which we and our customers conduct our respective businesses. Our continued financial success can be affected by other factors that are beyond our control, including:
•national, regional and local economic conditions;
•the value of the U.S. Dollar in relation to the currencies of other advanced and emerging market countries;
•the performance of both domestic and international equity and debt markets and valuation of securities traded on recognized domestic and international exchanges;
•general economic consequences of international conditions, such as weakness in European and South American sovereign debt and currencies and the U.K.'s referendum to exit from the European Union, and the impact of those conditions on the US and global economies;
•legislative and regulatory changes impacting our industry;
26
•the financial health of our customers and economic conditions affecting them and the value of our collateral, including effects from the COVID-19 pandemic and the continued price volatility of oil and gas and other commodities;
•the incidence of fraud, illegal payments, security breaches and other illegal acts among or impacting our Bank and our customers;
•structural changes in the markets for origination, sale and servicing of residential mortgages;
•changes in governmental economic and regulatory policies, including the extent and timing of intervention in credit markets by the Federal Reserve or withdrawal from that intervention, generally as well as changes attributable to presidential and congressional elections;
•changes in the availability of liquidity at a systemic level; and
•material inflation or deflation.
Substantial deterioration in any of the foregoing conditions can have a material adverse effect on our prospects and our results of operations and financial condition. There is no assurance that we will be able to return to our historical rate of growth or our profitability. Our Bank's customer base is primarily commercial in nature, and our Bank does not have a significant retail branch network or retail consumer deposit base. In periods of economic downturn, business and commercial deposits may be more volatile than traditional retail consumer deposits. As a result, our financial condition and results of operations could be adversely affected to a greater degree by these uncertainties than competitors having a larger retail customer base.
The COVID-19 pandemic is adversely affecting us and our customers, employees and third-party service providers, and the adverse impacts on our business, financial position, operations and prospects have been and are expected to continue to be significant.As a result of the unprecedented uncertainty, volatility and disruption in financial markets and in governmental, commercial and consumer activity caused by the COVID-19 pandemic, business and consumer customers of the Bank are experiencing varying degrees of financial distress, which is expected to increase over coming months and will likely adversely affect their ability to timely pay interest and principal on their loans and the value of the collateral securing their obligations. This in turn has influenced the recognition of credit losses in our loan portfolios and has increased our allowance for credit losses, particularly as businesses remain closed and as more customers are expected to draw on their lines of credit or seek additional loans to help finance their businesses. Disruptions to our customers’ businesses could also result in declines in, among other things, wealth management revenue. These developments as a consequence of the pandemic are materially impacting our business and the businesses of our customers and are expected to have a material adverse effect on our financial results, as evidenced by our results for the prior quarters in 2020.
In order to protect the health of our customers and employees, and to comply with applicable government directives, we have modified our business practices, including restricting employee travel, directing employees to work from home insofar as is possible, cancelling in-person meetings and implementing our business continuity plans and protocols to the extent necessary. We may take further such actions that we determine are in the best interest of our employees, customers and communities or as may be required by government order. These actions in response to the COVID-19 pandemic, and similar actions by our vendors and business partners, have not materially impaired our ability to support our employees, conduct our business and serve our customers, but there is no assurance that these actions will be sufficient to successfully mitigate the risks presented by COVID-19 or that our ability to operate will not be materially affected going forward. For instance, our business operations may be disrupted if key personnel or significant portions of our employees are unable to work effectively, including because of illness, quarantines, government actions, or other restrictions in connection with the COVID-19 pandemic. Similarly, if any of our vendors or business partners become unable to continue to provide their products and services, which we rely upon to maintain our day-to-day operations, our ability to serve our customers could be impacted.
COVID-19 does not yet appear to be contained and could affect significantly more households and businesses. Given the ongoing and dynamic nature of the circumstances, it is not possible to accurately predict the extent, severity or duration of these conditions or when normal economic and operating conditions will resume. For this reason, the extent to which the COVID-19 pandemic affects our business, operations and financial condition, as well as our regulatory capital and liquidity ratios and credit ratings, is highly uncertain and unpredictable and depends on, among other things, new information that may emerge concerning the scope, duration and severity of the COVID-19 pandemic, actions taken by governmental authorities and other parties in response to the pandemic, the scale of distribution and public acceptance of any vaccines for COVID-19 and the effectiveness of such vaccines in stemming or stopping the spread of COVID-19. The adverse impact on the markets in which we operate and on our business, operations and financial condition is expected to remain elevated until the pandemic subsides.
As a participating lender in the Small Business Administration’s PPP, we may be subject to additional risks regarding our Bank’s processing of PPP loans and are dependent on the federal government’s continuation and support of the program. Due to the short timeframe between the passing of the CARES Act and the beginning of the PPP, there is some ambiguity in the laws, rules and guidance regarding the operation of the PPP. Several other large banks have been subject to litigation regarding the process and procedures that such banks used in processing applications for the PPP. We may be exposed to the risk of
27
litigation, from both customers and non-customers who approached our Bank requesting PPP loans, regarding the process and procedures used by our Bank in processing applications for the PPP. Any such litigation filed against the Company or the Bank may be costly, regardless of the outcome, and result in significant financial liability or adversely affect our reputation. Any financial liability, litigation costs or reputational damage caused by PPP-related litigation could have a material adverse impact on our business, financial condition and results of operations.
In addition, while the PPP loans are fully guaranteed by the Small Business Administration (the “SBA”) and we believe that the majority of these loans will be forgiven, there can be no assurance that the borrowers will use or have used the funds appropriately or will have satisfied the staffing or payment requirements to qualify for forgiveness in whole or in part. Any portion of the loan that is not forgiven must be repaid by the borrower. In the event of a loss resulting from a default on a PPP loan and a determination by the SBA that there was a deficiency in the manner in which the PPP loan was originated, funded or serviced by our Bank, which may or may not be related to an ambiguity in the laws, rules or guidance regarding operation of the PPP, the SBA may deny its liability under the guaranty, reduce the amount of the guaranty, or, if we have already been paid under the guaranty, seek recovery from us of any loss related to the deficiency.
The impact of the Tax Act on us and our customers contributes to uncertainty and risk related to our customers' future demand for credit and our future results. The extent to which increased economic activity expected to result from the Tax Act has spurred additional economic activity or affected the extent of borrowing by our customers is unclear, although the continuation of the current economic expansion provides some evidence of a positive effect. At the same time, some of our customers may have elected to use their additional cash flow from lower taxes to fund their business, decreasing borrowing needs. The elimination of the federal income tax deductibility of business interest expense for a significant number of our customers effectively increases the cost of borrowing and makes equity or hybrid funding relatively more attractive. This could have a long-term negative impact on business customer borrowing. We realized a significant increase in our after-tax net income available to stockholders attributable to the Tax Act beginning in 2018, but there is no guarantee that future years' results will have the same benefit. The continued compression of net interest margin at our bank and for competitor banks indicates that some or all of the expected benefit from the Tax Act has been lost as the banks and financial services companies we compete with have elected to lower interest rates and fees and we have responded in order to remain competitive. Additionally, the tax benefits could be repealed as a result of future political or regulatory actions, including as a result of changes proposed by the new U.S. presidential administration. There is no assurance that the current or anticipated benefits of the Tax Act will be realized in future periods.
We are subject to environmental liability risk associated with lending activities. A significant portion of our loan portfolio is secured by real property. During the ordinary course of business, we may foreclose on and take title to properties securing certain loans. There is a risk that hazardous or toxic substances could be found on these properties, and that we may be liable for remediation costs, as well as for personal injury and property damage. Environmental laws may require us to incur substantial expenses and may materially reduce the affected property's value by limiting our ability to use or sell it. Although we have policies and procedures requiring environmental review before initiating any foreclosure action on real property, these reviews may not be sufficient to detect all potential environmental hazards. The remediation costs and any other financial liabilities associated with an environmental hazard could have a material adverse effect on our financial condition and results of operations. Future laws or regulations or more stringent interpretations or enforcement policies with respect to existing laws and regulations may increase our exposure to environmental liability.
Severe weather, earthquakes, other natural disasters, pandemics, acts of war or terrorism and other external events could significantly impact our business. Severe weather, earthquakes, other natural disasters, pandemics (such as the COVID-19 pandemic), acts of war or terrorism and other adverse external events could have a significant impact on our ability to conduct business. Such events could affect the stability of our deposit base, impair the ability of borrowers to repay outstanding loans, impair the value of collateral securing loans, cause significant property damage, result in loss of revenue and/or cause us to incur additional expenses. Recent hurricanes caused extensive flooding and destruction along the coastal areas of Texas and in other areas in the US, including communities where we conduct business. Although management has established disaster recovery policies and procedures, the occurrence of any such events could have a material adverse effect on our business, financial condition and results of operations.
Risks Relating to Our Securities
Our stock price can be volatile. Stock price volatility may make it more difficult for you to resell your common stock when you want and at prices you find attractive. Our stock price can fluctuate significantly in response to a variety of factors including, among other things:
•actual or anticipated variations in quarterly and annual results of our operations or those of IBTX;operations;
•changes in recommendations by securities analysts;
•changes in composition and perceptions of the investors who own our stock and other securities;
28
•changes in ratings from national rating agencies on publicly or privately-owned debt securities and deposits in our Bank;
•operating and stock price performance of other companies that investors deem comparable to us;
•news reports relating to trends, concerns and other issues in the financial services industry, including regulatory actions against other financial institutions;
•actual or expected economic conditions that are perceived to affect our company such as changes in commodity prices, real estate values or interest rates;
•perceptions in the marketplace regarding us and/or our competitors;
•new technology used, or services offered, by competitors;
•significant acquisitions or business combinations, strategic partnerships, joint ventures or capital commitments by or involving us or our competitors, including the proposed merger with IBTX;competitors;
•changes in government regulations and interpretation of those regulations, changes in our practices requested or required by regulators and changes in regulatory enforcement focus;
•impacts and disruptions resulting from the COVID-19 pandemic; and
•geopolitical conditions such as acts or threats of terrorism or military conflicts.
General market fluctuations, industry factors and general economic and political conditions and events, such as economic slowdowns or recessions, interest rate changes or credit loss trends, could also cause our stock price to decrease regardless of operating results.
The trading volume in our common stock is less than that of other larger financial services companies. Although our common stock is traded on the Nasdaq, Global Select Market, the trading volume in our common stock is less than that of other larger financial services companies. Given the lower trading volume of our common stock, significant sales of our common stock, or the expectation of these sales, could cause our stock price to fall. In addition, a substantial majority of common stock outstanding is held by institutional investors, and trading activity involving large positions may increase volatility of the stock price. Concentration of ownership by institutional investors and inability to execute trades covering large numbers of shares can increase volatility of stock price. Changes in general economic outlook or perspectives on our business or prospects by our institutional investors, whether factual or speculative, can have a major impact on our stock price.
Our preferred stock is thinly traded. There is only a limited trading volume in our preferred stock due to the small size of the issue and its largely institutional holder base. Significant sales of our preferred stock, or the expectation of these sales, could cause the price of the preferred stock to fall substantially.
An investment in our securities is not an insured deposit. Our common stock, preferred stock and indebtedness are not bank deposits and, therefore, are not insured against loss by the FDIC, any other deposit insurance fund or by any other public or private entity. Investment in our common stock is inherently risky for the reasons described in this “Risk Factors” section and elsewhere in this report and is subject to the same market forces that affect the price of securities of any company. As a result, if you acquire our common stock, preferred stock or indebtedness, you may lose some or all of your investment.
The holders of our indebtedness and preferred stock have rights that are senior to those of our common stockholders. As of December 31, 2019,2020, we had $111.0 million outstanding in subordinated notes issued by our holding company and $113.4 million outstanding in junior subordinated notes that are held by statutory trusts which issued trust preferred securities to investors. At December 31, 20192020, our Bank had $175.0 million in subordinated notes outstanding. Payments of the principal and interest on our trust preferred securities are conditionally guaranteed by us to the extent not paid by each trust, provided the trust has funds available for such obligations.
Our subordinated notes and junior subordinated notes are senior to our shares of preferred stock and common stock in right of payment of dividends and other distributions. We must be current on interest and principal payments on our indebtedness before any dividends can be paid on our preferred stock or our common stock. In the event of our bankruptcy, dissolution or liquidation, the holders of our indebtedness must be satisfied before any distributions can be made to our preferred or common stockholders. If certain conditions are met, we have the right to defer interest payments on the junior subordinated debentures (and the related trust preferred securities) at any time or from time to time for a period not to exceed 20 consecutive quarters in a deferral period, during which time no dividends may be paid to holders of our preferred stock or common stock. Because our Bank’s subordinated notes are obligations of the Bank, they would in liquidation of our Bank or sale of its assets receive payment before any amounts would be payable to holders of our common stock, preferred stock or subordinated notes.
At December 31, 2019,2020, we had issued and outstanding 6 million shares of our 6.50% Non-Cumulative Perpetual Preferred Stock, Series A, having an aggregate liquidation preference of $150.0 million. Our preferred stock is senior to our shares of common stock in right of payment of dividends and other distributions. We must be current on dividends payable to holders of
29
preferred stock before any dividends can be paid on our common stock. In the event of our bankruptcy, dissolution or liquidation, the holders of our preferred stock must be satisfied before any distributions can be made to our common stockholders.
We do not currently pay dividends on our common stock; the payment of dividends by the combined company following the merger is subject to future events and determinations by the board of directors and applicable regulatory limitationsstock. We have not paid dividends on our common stock and we do not expect to do so for the foreseeable future. Our ability to pay dividends is limited by regulatory restrictions and the need to maintain sufficient consolidated capital. The ability of our Bank to pay dividends to us is limited by its obligation to maintain sufficient capital and by other regulatory restrictions as discussed above under the heading Supervision and Regulation - Restrictions on Payment of Dividends by Our Bank.
Anti-takeover provisions of our certificate of incorporation, bylaws and Delaware law may make it more difficult for you to receive a change in control premium. Certain provisions of our certificate of incorporation and bylaws could make a merger, tender offer or proxy contest more difficult, even if such events were perceived by many of our stockholders as beneficial to their interests. These provisions include advance notice for nominations of directors and stockholders' proposals, and authority to issue “blank check” preferred stock with such designations, rights and preferences as may be determined from time to time by our board of directors. In addition, as a Delaware corporation, we are subject to Section 203 of the Delaware General Corporation Law which, in general, prevents an interested stockholder, defined generally as a person owning 15% or more of a
corporation's outstanding voting stock, from engaging in a business combination with our company for three years following the date that person became an interested stockholder unless certain specified conditions are satisfied.
Our Bank’s subordinated indebtedness is unsecured and subordinate and junior in right of payment to the Bank’s obligations to its depositors, its obligations under banker’s acceptances and letters of credit, its obligations to any Federal Reserve Bank, certain obligations to the FDIC, and its obligations to its other creditors, whether now outstanding or hereafter incurred, except any obligations which expressly rank on a parity with or junior to the subordinated notes.
30
None.
ITEM 2. PROPERTIES
Our corporate headquarters is located in downtown Dallas, Texas. These facilities, which we lease, house our executive and primary administrative offices, as well as the principal banking headquarters of Texas Capital Bank. We also lease other facilities in our primary market regions of Dallas, Fort Worth, Houston, Austin and San Antonio, as well as in California, Illinois, Louisiana, Missouri and New York, some of which operate as full-service banking centers. We also lease an operations center in Richardson, Texas that houses our loan and deposit operations and our customer call center.
ITEM 3. LEGAL PROCEEDINGS
The Company is subject to various claims and legal actions that may arise in the course of conducting its business. Management does not expect the disposition of any of these matters to have a material adverse impact on the Company’s financial statements or results of operations.
ITEM 4. MINE SAFETY DISCLOSURES
Not applicable.
31
ITEM 5. MARKET FOR REGISTRANT’S COMMON EQUITY, RELATED STOCKHOLDER MATTERS AND ISSUER PURCHASES OF EQUITY SECURITIES
Our common stock is traded on The Nasdaq Global Select Market under the symbol “TCBI”. On February 11, 2020,8, 2021, there were approximately 192175 holders of record of our common stock.
Stock Performance Graph
The following table and graph sets forth the cumulative total stockholder return for the Company’s common stock for the five-year period ending on December 31, 2019,2020, compared to an overall stock market index (Russell 2000 Index) and the Company’s peer group index (Nasdaq Bank Index). The Russell 2000 Index and Nasdaq Bank Index are based on total returns assuming reinvestment of dividends. The graph assumes an investment of $100 on December 31, 2014.2015. The performance graph represents past performance and should not be considered to be an indication of future performance.
| 12/31/2015 | 12/31/2016 | 12/31/2017 | 12/31/2018 | 12/31/2019 | 12/31/2020 | ||||||||||||||||||||||||||||||
| Texas Capital Bancshares, Inc. | $ | 100.00 | $ | 158.64 | $ | 179.89 | $ | 103.38 | $ | 114.87 | $ | 120.40 | |||||||||||||||||||||||
| Russell 2000 Index (RTY) | 100.00 | 119.30 | 134.87 | 118.81 | 146.70 | 173.09 | |||||||||||||||||||||||||||||
| Nasdaq Bank Index (CBNK) | 100.00 | 134.52 | 139.44 | 115.35 | 139.62 | 125.29 | |||||||||||||||||||||||||||||
| 12/31/2014 | 12/31/2015 | 12/31/2016 | 12/31/2017 | 12/31/2018 | 12/31/2019 | ||||||||||||||||||
| Texas Capital Bancshares, Inc. | $ | 100.00 | $ | 90.96 | $ | 144.30 | $ | 163.63 | $ | 94.04 | $ | 104.49 | |||||||||||
| Russell 2000 Index (RTY) | 100.00 | 94.46 | 112.69 | 127.40 | 112.22 | 138.57 | |||||||||||||||||
| Nasdaq Bank Index (CBNK) | 100.00 | 106.72 | 143.56 | 148.81 | 123.11 | 149.00 | |||||||||||||||||
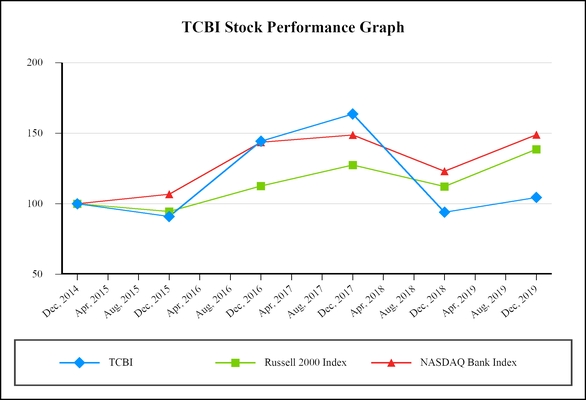
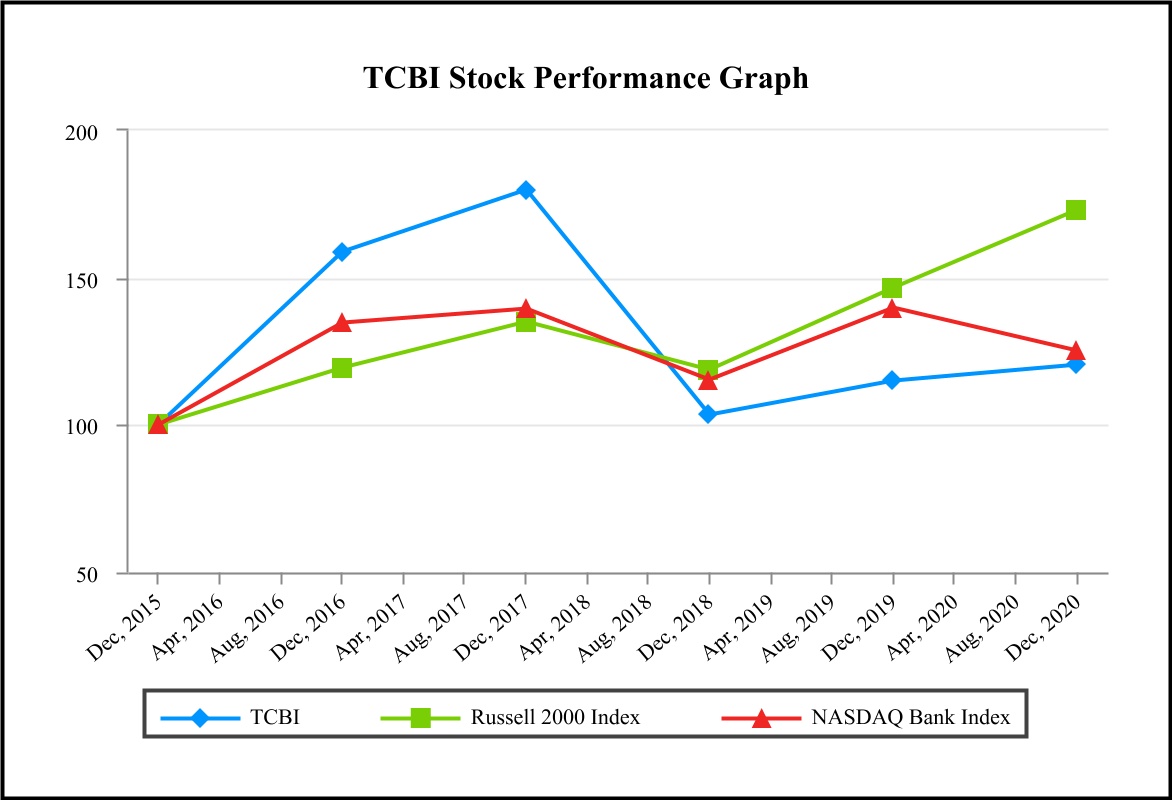
Source: Bloomberg
32
You should read the selected financial data presented below in conjunction with “Management’s Discussion and Analysis of Financial Condition and Results of Operations” and our consolidated financial statements and the related notes appearing elsewhere in this Form 10-K.
| At or For the Year Ended December 31, | |||||||||||||||||||||||||||||
| (in thousands) | 2020 | 2019 | 2018 | 2017 | 2016 | ||||||||||||||||||||||||
| Consolidated Operating Data | |||||||||||||||||||||||||||||
| Interest income | $ | 1,056,912 | $ | 1,365,312 | $ | 1,164,193 | $ | 879,299 | $ | 703,408 | |||||||||||||||||||
| Interest expense | 188,086 | 385,592 | 249,333 | 117,971 | 63,594 | ||||||||||||||||||||||||
| Net interest income | 868,826 | 979,720 | 914,860 | 761,328 | 639,814 | ||||||||||||||||||||||||
| Provision for credit losses | 258,000 | 75,000 | 87,000 | 44,000 | 77,000 | ||||||||||||||||||||||||
| Net interest income after provision for credit losses | 610,826 | 904,720 | 827,860 | 717,328 | 562,814 | ||||||||||||||||||||||||
| Non-interest income | 185,516 | 92,440 | 78,024 | 74,256 | 60,780 | ||||||||||||||||||||||||
| Non-interest expense | 704,396 | 600,850 | 532,533 | 466,858 | 384,097 | ||||||||||||||||||||||||
| Income before income taxes | 91,946 | 396,310 | 373,351 | 324,726 | 239,497 | ||||||||||||||||||||||||
| Income tax expense | 25,657 | 84,295 | 79,964 | 128,645 | 86,078 | ||||||||||||||||||||||||
| Net income | 66,289 | 312,015 | 293,387 | 196,081 | 153,419 | ||||||||||||||||||||||||
| Preferred stock dividends | 9,750 | 9,750 | 9,750 | 9,750 | 9,750 | ||||||||||||||||||||||||
| Net income available to common stockholders | $ | 56,539 | $ | 302,265 | $ | 283,637 | $ | 186,331 | $ | 143,669 | |||||||||||||||||||
| Consolidated Balance Sheet Data | |||||||||||||||||||||||||||||
| Total assets | $ | 37,726,096 | $ | 32,548,069 | $ | 28,257,767 | $ | 25,075,645 | $ | 21,697,134 | |||||||||||||||||||
| Loans held for sale | 283,165 | 2,577,134 | 1,969,474 | 1,011,004 | 968,929 | ||||||||||||||||||||||||
| Loans held for investment (LHI) | 15,351,451 | 16,476,413 | 16,690,550 | 15,366,252 | 13,001,011 | ||||||||||||||||||||||||
| Loans held for investment, mortgage finance | 9,079,409 | 8,169,849 | 5,877,524 | 5,308,160 | 4,497,338 | ||||||||||||||||||||||||
| Liquidity assets(1) | 9,032,807 | 4,263,766 | 2,865,874 | 2,727,581 | 2,725,645 | ||||||||||||||||||||||||
| Investment securities | 3,196,970 | 239,871 | 120,216 | 23,511 | 24,874 | ||||||||||||||||||||||||
| Demand deposits | 12,740,947 | 9,438,459 | 7,317,161 | 7,812,660 | 7,994,201 | ||||||||||||||||||||||||
| Total deposits | 30,996,589 | 26,478,593 | 20,606,113 | 19,123,180 | 17,016,831 | ||||||||||||||||||||||||
| Federal funds purchased and repurchase agreements | 111,751 | 141,766 | 641,174 | 365,040 | 109,575 | ||||||||||||||||||||||||
| Other borrowings | 3,000,000 | 2,400,000 | 3,900,000 | 2,800,000 | 2,000,000 | ||||||||||||||||||||||||
| Subordinated notes | 282,490 | 282,129 | 281,767 | 281,406 | 281,044 | ||||||||||||||||||||||||
| Trust preferred subordinated debentures | 113,406 | 113,406 | 113,406 | 113,406 | 113,406 | ||||||||||||||||||||||||
| Stockholders’ equity | 2,871,224 | 2,801,321 | 2,480,308 | 2,190,072 | 1,997,890 | ||||||||||||||||||||||||
| At or For the Year Ended December 31, | |||||||||||||||||||
| (in thousands, except per share, average share and percentage data) | 2019 | 2018 | 2017 | 2016 | 2015 | ||||||||||||||
| Consolidated Operating Data | |||||||||||||||||||
| Interest income | $ | 1,365,312 | $ | 1,164,193 | $ | 879,299 | $ | 703,408 | $ | 602,958 | |||||||||
| Interest expense | 385,592 | 249,333 | 117,971 | 63,594 | 46,428 | ||||||||||||||
| Net interest income | 979,720 | 914,860 | 761,328 | 639,814 | 556,530 | ||||||||||||||
| Provision for credit losses | 75,000 | 87,000 | 44,000 | 77,000 | 53,250 | ||||||||||||||
| Net interest income after provision for credit losses | 904,720 | 827,860 | 717,328 | 562,814 | 503,280 | ||||||||||||||
| Non-interest income | 92,440 | 78,024 | 74,256 | 60,780 | 47,738 | ||||||||||||||
| Non-interest expense | 589,999 | 525,096 | 465,876 | 382,397 | 326,523 | ||||||||||||||
| Income before income taxes | 407,161 | 380,788 | 325,708 | 241,197 | 224,495 | ||||||||||||||
| Income tax expense | 84,295 | 79,964 | 128,645 | 86,078 | 79,641 | ||||||||||||||
| Net income | 322,866 | 300,824 | 197,063 | 155,119 | 144,854 | ||||||||||||||
| Preferred stock dividends | 9,750 | 9,750 | 9,750 | 9,750 | 9,750 | ||||||||||||||
| Net income available to common stockholders | $ | 313,116 | $ | 291,074 | $ | 187,313 | $ | 145,369 | $ | 135,104 | |||||||||
| Consolidated Balance Sheet Data | |||||||||||||||||||
| Total assets | $ | 32,548,069 | $ | 28,257,767 | $ | 25,075,645 | $ | 21,697,134 | $ | 18,903,821 | |||||||||
| Loans held for sale | 2,577,134 | 1,969,474 | 1,011,004 | 968,929 | 86,075 | ||||||||||||||
| Loans held for investment (LHI) | 16,476,413 | 16,690,550 | 15,366,252 | 13,001,011 | 11,745,674 | ||||||||||||||
| Loans held for investment, mortgage finance | 8,169,849 | 5,877,524 | 5,308,160 | 4,497,338 | 4,966,276 | ||||||||||||||
| Liquidity assets(1) | 4,263,766 | 2,865,874 | 2,727,581 | 2,725,645 | 1,681,374 | ||||||||||||||
| Investment securities | 239,871 | 120,216 | 23,511 | 24,874 | 29,992 | ||||||||||||||
| Demand deposits | 9,438,459 | 7,317,161 | 7,812,660 | 7,994,201 | 6,386,911 | ||||||||||||||
| Total deposits | 26,478,593 | 20,606,113 | 19,123,180 | 17,016,831 | 15,084,619 | ||||||||||||||
| Federal funds purchased and repurchase agreements | 141,766 | 641,174 | 365,040 | 109,575 | 143,051 | ||||||||||||||
| Other borrowings | 2,400,000 | 3,900,000 | 2,800,000 | 2,000,000 | 1,500,000 | ||||||||||||||
| Subordinated notes | 282,129 | 281,767 | 281,406 | 281,044 | 280,682 | ||||||||||||||
| Trust preferred subordinated debentures | 113,406 | 113,406 | 113,406 | 113,406 | 113,406 | ||||||||||||||
| Stockholders’ equity | 2,832,258 | 2,500,394 | 2,202,721 | 2,009,557 | 1,623,533 | ||||||||||||||
33
| At or For the Year Ended December 31, | |||||||||||||||||||||||||||||
| 2020 | 2019 | 2018 | 2017 | 2016 | |||||||||||||||||||||||||
| Other Financial Data | |||||||||||||||||||||||||||||
| Income per share | |||||||||||||||||||||||||||||
| Basic | $ | 1.12 | $ | 6.01 | $ | 5.68 | $ | 3.76 | $ | 3.10 | |||||||||||||||||||
| Diluted | 1.12 | 5.99 | 5.64 | 3.71 | 3.07 | ||||||||||||||||||||||||
| Book value per common share | 53.92 | 52.67 | 46.42 | 41.09 | 37.33 | ||||||||||||||||||||||||
| Tangible book value per common share(1) | 53.57 | 52.31 | 46.05 | 40.71 | 36.93 | ||||||||||||||||||||||||
| Weighted average shares | |||||||||||||||||||||||||||||
| Basic | 50,430,326 | 50,286,300 | 49,936,702 | 49,587,169 | 46,239,210 | ||||||||||||||||||||||||
| Diluted | 50,582,979 | 50,419,204 | 50,272,872 | 50,259,834 | 46,765,902 | ||||||||||||||||||||||||
| Selected Financial Ratios | |||||||||||||||||||||||||||||
| Performance Ratios | |||||||||||||||||||||||||||||
| Net interest margin | 2.39 | % | 3.28 | % | 3.78 | % | 3.49 | % | 3.14 | % | |||||||||||||||||||
| Return on average assets | 0.18 | % | 1.01 | % | 1.16 | % | 0.86 | % | 0.73 | % | |||||||||||||||||||
| Return on average common equity | 2.10 | % | 11.95 | % | 12.80 | % | 9.46 | % | 9.16 | % | |||||||||||||||||||
| Efficiency ratio(2) | 66.81 | % | 56.04 | % | 53.63 | % | 55.87 | % | 54.82 | % | |||||||||||||||||||
| Non-interest expense to average earning assets | 1.93 | % | 2.00 | % | 2.19 | % | 2.12 | % | 1.88 | % | |||||||||||||||||||
| Asset Quality Ratios | |||||||||||||||||||||||||||||
| Allowance for credit losses on loans to LHI | 1.04 | % | 0.79 | % | 0.85 | % | 0.89 | % | 0.96 | % | |||||||||||||||||||
| Net charge-offs (recoveries) to average LHI | 0.80 | % | 0.31 | % | 0.37 | % | 0.16 | % | 0.29 | % | |||||||||||||||||||
| Allowance for credit losses on loans to non-accrual loans | 2.1x | .9x | 2.4x | 1.8x | 1.0x | ||||||||||||||||||||||||
| Non-accrual loans to LHI | 0.50 | % | 0.91 | % | 0.36 | % | 0.49 | % | 0.96 | % | |||||||||||||||||||
| Total NPAs to LHI plus OREO | 0.50 | % | 0.91 | % | 0.36 | % | 0.55 | % | 1.07 | % | |||||||||||||||||||
| Capital and Liquidity Ratios | |||||||||||||||||||||||||||||
| CET1 | 9.35 | % | 8.88 | % | 8.58 | % | 8.45 | % | 8.97 | % | |||||||||||||||||||
| Total capital ratio | 12.09 | % | 11.37 | % | 11.31 | % | 11.50 | % | 12.48 | % | |||||||||||||||||||
| Tier 1 capital ratio | 10.25 | % | 9.75 | % | 9.53 | % | 9.52 | % | 10.23 | % | |||||||||||||||||||
| Tier 1 leverage ratio | 7.52 | % | 8.42 | % | 9.87 | % | 9.15 | % | 9.34 | % | |||||||||||||||||||
| Total common equity to total assets | 7.21 | % | 8.15 | % | 8.25 | % | 8.14 | % | 8.52 | % | |||||||||||||||||||
| Tangible common equity to total tangible assets(3) | 7.13 | % | 8.07 | % | 8.18 | % | 8.06 | % | 8.43 | % | |||||||||||||||||||
| Average LHI, net to average total deposits | 80.07 | % | 95.73 | % | 102.74 | % | 97.56 | % | 95.82 | % | |||||||||||||||||||
(1)Stockholders' equity excluding preferred stock, less goodwill and intangibles, divided by shares outstanding at period end.
(2)Non-interest expense divided by the sum of net interest income and non-interest income.
(3)Stockholders' equity excluding preferred stock, less accumulated other comprehensive income and goodwill and intangibles, divided by total assets, less accumulated other comprehensive income and goodwill and intangibles.
34
| At or For the Year Ended December 31, | |||||||||||||||||||
| (in thousands, except per share, average share and percentage data) | 2019 | 2018 | 2017 | 2016 | 2015 | ||||||||||||||
| Other Financial Data | |||||||||||||||||||
| Income per share | |||||||||||||||||||
| Basic | $ | 6.23 | $ | 5.83 | $ | 3.78 | $ | 3.14 | $ | 2.95 | |||||||||
| Diluted | 6.21 | 5.79 | 3.73 | 3.11 | 2.91 | ||||||||||||||
| Book value per common share | 53.29 | 46.82 | 41.35 | 37.56 | 32.12 | ||||||||||||||
| Tangible book value per common share(2) | 52.93 | 46.45 | 40.97 | 37.17 | 31.69 | ||||||||||||||
| Weighted average shares | |||||||||||||||||||
| Basic | 50,286,300 | 49,936,702 | 49,587,169 | 46,239,210 | 45,808,440 | ||||||||||||||
| Diluted | 50,419,204 | 50,272,872 | 50,259,834 | 46,765,902 | 46,437,872 | ||||||||||||||
| Selected Financial Ratios | |||||||||||||||||||
| Performance Ratios | |||||||||||||||||||
| Net interest margin | 3.28 | % | 3.78 | % | 3.49 | % | 3.14 | % | 3.14 | % | |||||||||
| Return on average assets | 1.04 | % | 1.19 | % | 0.87 | % | 0.74 | % | 0.79 | % | |||||||||
| Return on average common equity | 12.38 | % | 13.14 | % | 9.51 | % | 9.27 | % | 9.65 | % | |||||||||
| Efficiency ratio(3) | 55.03 | % | 52.89 | % | 55.75 | % | 54.58 | % | 54.04 | % | |||||||||
| Non-interest expense to average earning assets | 1.96 | % | 2.15 | % | 2.12 | % | 1.88 | % | 1.84 | % | |||||||||
| Asset Quality Ratios | |||||||||||||||||||
| Allowance for loan losses to LHI | 0.79 | % | 0.85 | % | 0.89 | % | 0.96 | % | 0.84 | % | |||||||||
| Net charge-offs (recoveries) to average LHI | 0.31 | % | 0.37 | % | 0.16 | % | 0.29 | % | 0.07 | % | |||||||||
| Allowance for loan losses to non-accrual loans | .9x | 2.4x | 1.8x | 1.0x | .8x | ||||||||||||||
| Non-accrual loans to LHI | 0.91 | % | 0.36 | % | 0.49 | % | 0.96 | % | 1.08 | % | |||||||||
| Total NPAs to LHI plus OREO | 0.91 | % | 0.36 | % | 0.55 | % | 1.07 | % | 1.08 | % | |||||||||
| Capital and Liquidity Ratios | |||||||||||||||||||
| CET1 | 8.88 | % | 8.58 | % | 8.45 | % | 8.97 | % | 7.47 | % | |||||||||
| Total capital ratio | 11.37 | % | 11.31 | % | 11.50 | % | 12.48 | % | 11.05 | % | |||||||||
| Tier 1 capital ratio | 9.75 | % | 9.53 | % | 9.52 | % | 10.23 | % | 8.81 | % | |||||||||
| Tier 1 leverage ratio | 8.42 | % | 9.87 | % | 9.15 | % | 9.34 | % | 8.92 | % | |||||||||
| Total common equity to total assets | 8.24 | % | 8.32 | % | 8.19 | % | 8.57 | % | 7.79 | % | |||||||||
| Tangible common equity to total tangible assets(4) | 8.16 | % | 8.26 | % | 8.11 | % | 8.49 | % | 7.69 | % | |||||||||
| Average LHI, net to average total deposits | 95.73 | % | 102.74 | % | 97.56 | % | 95.82 | % | 101.71 | % | |||||||||
The following discussion and analysis of the Company’s financial condition and results of operations for the years ended December 31, 20192020 and 20182019 should be read in conjunction with the Company’s Selected Consolidated Financial Data and the audited consolidated financial statements and the accompanying notes included elsewhere in this Annual Report on Form 10-K. Certain risks, uncertainties and other factors, including those set forth under “Risk Factors” in Part I, Item 1A, and elsewhere in this Annual Report on Form 10-K, may cause actual results to differ materially from the results discussed in the forward-looking statements appearing in this discussion and analysis. Refer to "Management's Discussion and Analysis of Financial Condition and Results of Operations" in our 20182019 Annual Report on Form 10K filed with the SEC on February 14, 2019,12, 2020, for discussion of our results of operations for the years ended December 31, 20182019 and 2017.2018.
Forward-Looking Statements
Certain statements and financial analysis contained in this report that are not historical facts are forward-looking statements made pursuant tomay constitute "forward-looking statements" within the safe harbor provisionsmeaning of federal securities laws.the Private Securities Litigation Reform Act of 1995. Forward-looking statements may also be contained in our future filings with SEC, in press releases and in oral and written statements made by us or with our approval that are not statements of historical fact.fact and constitute "forward-looking statements" within the meaning of the Private Securities Litigation Reform Act of 1995. These forward-looking statements are based on our beliefs, assumptions and expectations of our future performance taking into account all information available to us at the time such statements are made. Words such as “believes,” “expects,” “estimates,” “anticipates,” “plans,” “goals,” “objectives,” “expects,” “intends,” “seeks,” “likely,” “targeted,” “continue,” “remain,” “will,” “should,” “may” and other similar expressions are intended to identify forward-looking statements but are not the exclusive means of identifying such statements.
Forward-looking statements may include, among other things, statements about the credit quality of our loan portfolio, statements related to the proposed merger, including the expected timing of the consummation of the merger, the potential effects of the proposed merger on our business and operations upon or prior to the consummation thereof, the effects on us if the merger is not consummated and information regarding the combined business and operations of TCBI and IBTX following the merger, if consummated, general economic conditions in the United States and in our markets, including the continued impact on our customers from volatility in oil and gas prices, the financial impact ofmaterial risks and uncertainties for the Tax Act onU.S. and world economies, and for our results of operations,business, resulting from the COVID-19 pandemic, expectations regarding rates of default and loan losses, volatility in the mortgage industry, our business strategies and our expectations about future financial performance, future growth and earnings, the appropriateness of our allowance for loancredit losses and provision for loancredit losses, the impact of changing regulatory requirements and legislative changes on our business, increased competition, interest rate risk, new lines of business, new product or service offerings and new technologies.
Forward-looking statements are subject to various risks and uncertainties, which change over time, are based on management’s expectations and assumptions at the time the statements are made and are not guarantees of future results. Important factors that could cause actual results to differ materially from the forward-looking statements include, but are not limited to, the following:
•Deterioration of the credit quality of our loan portfolio or declines in the value of collateral related to external factors such as commodity prices, real estate values or interest rates, increased default rates and loan losses or adverse changes in the industry concentrations of our loan portfolio.
•The possibility thatCOVID-19 pandemic is adversely affecting us and our customers, employees and third-party service providers; the previously announced merger does not close when expected or at all because required regulatory, stockholder or other approvals and other conditions to closing are not received or satisfied on a timely basis or at all.
Operational issues stemming from, and/or capital spending necessitated by, the potential need to adapt to industry changes in information technology systems, on which IBTX and TCBIwe are highly dependent.
•Changes in interest rates, which may affect TCBI's or IBTX'sour net income and other future cash flows, or the market value of TCBI's or IBTX'sour assets, including the market value of investment securities.
•Changes in theour ability of TCBI or IBTX to access the capital markets, including changes in their respectiveour credit ratings.
•Changes in the value of commercial and residential real estate securing our loans or in the demand for credit to support the purchase and ownership of such assets.
•Changing economic conditions or other developments adversely affecting our commercial, entrepreneurial and professional customers.
•Adverse economic conditions and other factors affecting our middle market customers and their ability to continue to meet their loan obligations.
•The failure to correctly assess and model the assumptions supporting our allowance for loancredit losses, causing it to become inadequate in the event of deteriorations in loan quality and increases in charge-offs, or increases or decreases to our allowance for loancredit losses as a result of the implementation of CECL.
35
•Changes in the U.S. economy in general or the Texas economy specifically resulting in deterioration of credit quality, increases in non-performing assets or charge-offs or reduced demand for credit or other financial services we offer, including the effects from declines in the level of drilling and production related to volatility in oil and gas prices.prices and the effects of the COVID-19 pandemic.
•Adverse changes in economic or market conditions, in Texas, the United States or internationally, that could affect the credit quality of our loan portfolio or our operating performance.
•Unanticipated effects from the Tax Cuts and Jobs Act of 2017 may limit its benefits or adversely impact our business, which could include decreased demand for borrowing by our middle market customers or increased price competition that offsets the benefits of decreased federal income tax expense.
•Unexpected market conditions or regulatory changes that could cause access to capital market transactions and other sources of funding to become more difficult to obtain on terms and conditions that are acceptable to us.
•The inadequacy of our available funds to meet our deposit, debt and other obligations as they become due, or our failure to maintain our capital ratios as a result of adverse changes in our operating performance or financial condition, or changes in applicable regulations or regulator interpretation of regulations impacting our business or the characterization or risk weight of our assets.
•The failure to effectively balance our funding sources with cash demands by depositors and borrowers.
•The failure to manage information systems risk or to prevent cyber-attackscyber-incidents against us, our customers or our third party vendors, or to manage risks from failures, disruptions or security breaches affecting us, our customers or our third party vendors.vendors, which risks have been materially enhanced by our increased reliance on technology to support associates working outside our offices.
•The costs and effects of cyber-incidents or other failures, disruptions or security breaches of our systems or those our third-party providers.
•The failure to effectively manage our interest rate risk resulting from unexpectedly large or sudden changes in interest rates, maturity imbalances in our assets and liabilities, potential adverse effects to our borrowers including their
inability to repay loans with increased interest rates and the impact to our net interest income from the increasing cost of interest-bearing deposits.
•The failure of our enterprise risk management framework, our compliance program, or our corporate governance and supervisory oversight functions to timely identify and address emerging risks adequately, which may result in unexpected losses.
•Uncertainty regarding the future of the London Interbank Offered Rate ("LIBOR"),LIBOR, and the potentialexpected transition away from LIBOR toward new interest rate benchmarks.
•Legislative and regulatory changes imposing further restrictions and costs on our business, a failure to remainmaintain well capitalized or well managed status or regulatory enforcement actions against us, and uncertainty related to future implementation and enforcement of regulatory requirements resulting from the current political environment.
•Changes in the monetary and fiscal policies of the U.S. Government, including policies of the U.S. Department of Treasury and the Federal Reserve.
•The effect of changes in laws, regulations, policies and guidelines (including, among others, laws, regulations, policies and guidelines concerning taxes, banking, securities and monetary and fiscal policies) with which we and our subsidiaries must comply under the new Biden Administration and the effects of any such changes on our business and results of operations;
•The failure to successfully execute our business strategy, which may include expanding into new markets, developing and launching new lines of business or new products and services within the expected timeframes and budgets or to successfully manage the risks related to the development and implementation of these new businesses, products or services.
•The failure to identify, attract and retain key personnel or the loss of key individuals or groups of employees.
•Increased or more effective competition from banks and other financial service providers in our markets.
•Structural changes in the markets for origination, sale and servicing of residential mortgages.
•Uncertainty in the pricing of mortgage loans that we purchase, and later sell or securitize, as well as competition for the MSRs related to these loans and related interest rate risk or price risk resulting from retaining MSRs, and the potential effects of higher interest rates on our MCA loan volumes.
•Changes in accounting principles, policies, practices or guidelines.
36
•Volatility in the market price of our common stock.
•Material failures of our accounting estimates and risk management processes based on management judgment, or the supporting analytical and forecasting models.
•Failure of our risk management strategies and procedures, including failure or circumvention of our controls.
•Credit risk resulting from our exposure to counterparties.
•An increase in the incidence or severity of fraud, illegal payments, security breaches and other illegal acts impacting our Bank and our customers.
•The failure to maintain adequate regulatory capital to support our business.
•Unavailability of funds obtained from borrowing or capital transactions or from our Bank to fund our obligations.
•Incurrence of material costs and liabilities associated with legal and regulatory proceedings, investigations, inquiries and related matters with respect to the financial services industry, including those directly involving us or our Bank.Bank and arising from our participation in government stimulus programs responding to the economic impact of the COVID-19 pandemic.
•Environmental liability associated with properties related to our lending activities.
•Severe weather, natural disasters, acts of war or terrorism and other external events.
Actual outcomes and results may differ materially from what is expressed in our forward-looking statements and from our historical financial results due to the factors discussed elsewhere in this report or disclosed in our other SEC filings. Forward-looking statements included herein speak only as of the date hereof and should not be relied upon as representing our expectations or beliefs as of any date subsequent to the date of this report. Except as required by law, we undertake no obligation to revise any forward-looking statements contained in this report, whether as a result of new information, future events or otherwise. The factors discussed herein are not intended to be a complete summary of all risks and uncertainties that may affect our businesses. Though we strive to monitor and mitigate risk, we cannot anticipate all potential economic, operational and financial developments that may adversely impact our operations and our financial results. Forward-looking statements should not be viewed as predictions and should not be the primary basis upon which investors evaluate an investment in our securities.
Overview of Our Business Operations
We commenced our banking operations in December 1998. An important aspect of our growth strategy has been our ability to effectively service and manage a large number of loans and deposit accounts in multiple markets in Texas, as well as several lines of business serving a regional or national clientele of commercial borrowers. Accordingly, we have created an operations infrastructure sufficient to support our lending and banking operations that we continue to build out as needed to serve a larger customer base and specialized industries.
On December 9, 2019, we and IBTX announced that both companies' boards of directors unanimously approvedentered into the merger agreementMerger Agreement to combine the companies in an all-stock merger of equals. Upon closing ofOn May 22, 2020, we and IBTX mutually agreed to terminate the merger,Merger Agreement. The termination was approved by each share of TCBI common stock will be exchanged for 1.0311 shares of IBTX common stock. The corporate headquarters of the surviving entity and the surviving bank will be located in McKinney, Texas. The name of the surviving entity will be Independent Bank Group, Inc., and the name of the surviving bank will be Texas Capital Bank. The surviving bank will be operated under the name Independent Financial in Colorado and under the name Texas Capital Bank in Texas. Thecompany's board of directors after careful consideration of the surviving entitysignificant impact of the COVID-19 pandemic on global markets and on the companies' ability to fully realize the benefits expected to be achieved through the merger. Neither party paid a termination fee in connection with the termination of the Merger Agreement.
In response to the pressures of the current economic environment and a refinement of our strategy, we took actions during the second and third quarters of 2020 which are expected to decrease our non-interest expenses, including a workforce reduction and write-offs of certain software assets. While these expenses, as well as merger-related expenses incurred in the first half of 2020, had a significant impact on our year-to-date operating results, we believe that we are better positioned to improve our core profitability going forward as the non-interest expense items are not expected to recur in future periods. During the fourth quarter of 2020, we did experience improvements in non-interest expense as a result of these actions, specifically in salaries and employee benefits due to the workforce reduction and in communications and technology expense related to lower software amortization expense as compared to the third quarter of 2020. We continue to focus on balance sheet strength and while we intend to operate with above-average liquidity in response to the uncertain economic environment, we believe opportunities exist to improve core earnings by reducing or replacing higher cost funding sources and improving the earning asset mix.
Our organic growth model and the surviving bank will be compriseddepth of 13 directors,talent on our team have built a resilient business with lasting client relationships and a record of which seven will be former membersvalue creation through dynamic markets and business cycles.
37
Impact of COVID-19 Pandemic
Impact on Our Financial Statements and Results of Operations
Financial institutions are dependent upon the ability of their loan customers to meet their loan obligations and the availability of their workforce and vendors. As a result of the Boardshelter-at-home mandate that was in force early in the second quarter of Directors2020, commercial activity throughout the state of TCBITexas, as well as nationally, decreased significantly. As of December 31, 2020, most regions in Texas have allowed businesses to re-open at limited capacities and six will be former memberswith caution as to social-distancing and other restrictions. Commercial activity has improved, but has not returned to the levels existing prior to the outbreak of the boardpandemic. This continued depression in commercial activity may result in our customers' inability to meet their loan obligations to us. In addition, the economic pressures and uncertainties related to the COVID-19 pandemic have resulted in changes in consumer spending behaviors, which may negatively impact the demand for loans and other services we offer. Our business and consumer customers are experiencing varying degrees of directors of IBTX. The mergerfinancial distress, which is expected to closecontinue into the first quarter of 2021, especially if COVID-19 infections increase and new economic restrictions are mandated. Our borrowing base includes customers in mid-2020,industries such as energy, hotel/lodging, restaurants, entertainment, retail and commercial real estate, all of which have been and are likely to continue to be significantly impacted by the COVID-19 pandemic. We recognize that these industries may take longer to recover as consumers may be hesitant to return to full social interaction or may change their spending habits on a more permanent basis as a result of the pandemic. We continue to monitor these customers closely.
Future economic conditions are subject to satisfactionsignificant uncertainty. We have taken deliberate actions to ensure that we have the balance sheet strength to serve our clients and communities, including increases in liquidity and managing our assets and liabilities in order to maintain a strong capital position. Current economic pressures and their effects on our customers, coupled with the implementation of customary closing conditions,the CECL expected loss methodology for determining our allowance for credit losses, have contributed to a substantially increased provision for credit losses in 2020. We continue to monitor closely the impact of the COVID-19 pandemic on our customers, as well as the effects of the CARES Act and the new Act. Uncertainties associated with the pandemic include the duration of the outbreak, the impact to our customers, employees and vendors and the impact to the economy as a whole. COVID-19 has had, and is expected to continue to have, a significant adverse impact on our business, financial position and operating results. The extent to which the COVID-19 pandemic will impact our operations and financial results in 2021 cannot be reasonably or reliably estimated at this time.
Impact on our Business Operations
In order to protect the health of our customers and employees, and to comply with applicable government directives, we have modified our business practices, including receiptrestricting employee travel, directing employees to work from home insofar as is possible and implementing our business continuity plans and protocols to the extent necessary. Since early March 2020, a majority of customary regulatory approvalsour workforce has been working virtually with limited impact on the execution of our business and approval byclient experience. We expect to be able to continue with this strategy for the stockholdersforeseeable future, but will begin transitioning employees back into the office in a phased approach when it is safe to do so. When the time comes to transition employees back into the office locations, our Business Continuity team has a plan in place to phase employees back into the office locations over an extended period of each company. Refertime. Our branch locations are currently open and operating during normal business hours, although customers are admitted into the branches only between the hours of 10:00 a.m. and 2:00 p.m. We are taking additional precautions within our branch locations, including enhanced cleaning procedures, to Mergerensure the safety of our customers and our employees.
Energy Portfolio
Outstanding energy loans totaled $766.2 million, or 3% of total loans held for investment, at December 31, 2020, compared to $1.4 billion, or 6% of total loans, at December 31, 2019. The decline in outstanding energy loans is due to our strategic de-risking of the energy portfolio as well as a heightened level of charge-offs in 2020 as we reached final resolution on a number of loans previously disclosed as problem loans. At December 31, 2020, energy non-accruals decreased to $51.7 million, compared to $125.0 million at December 31, 2019, further evidencing final resolution of previously disclosed problem loans.
Our energy loan portfolio is primarily comprised of loans to exploration and production (“E&P”) companies that are generally collateralized with Independent Bank Group, Inc.proven reserves based on appropriate valuation standards that take into account the risk of oil and gas price volatility. At December 31, 2020, loans to E&P companies represented approximately 70% of total energy loans outstanding. The majority of this portfolio consists of first lien, senior secured, reserve-based loans, which we believe is the lowest-risk form of energy lending. At December 31, 2020 approximately 40% of our exposure was located in Item 1 for additional disclosures.lower cost production areas such as the Permian Basin and Eagle Ford.
Year ended December 31, 20192020 compared to year ended December 31, 20182019
We reported net income of $322.9$66.3 million and net income available to common stockholders of $313.1$56.5 million, or $6.21$1.12 per diluted common share, for the year ended December 31, 2019,2020, compared to net income of $300.8$312.0 million and net income
38
available to common stockholders of $291.1$302.3 million, or $5.79$5.99 per diluted common share, for 2018.2019. Return on average common equity ("ROE") was 12.38%2.10% and return on average assets ("ROA") was 1.04%0.18% for the year ended December 31, 2019,2020, compared to 13.14%11.95% and 1.19%1.01%, respectively, for 2018.2019. The decreasesdecline in net income, ROE and ROA werefor the year ended December 31, 2020 resulted primarily from a $183.0 million increase in the provision for credit losses, as well as a $103.5 million increase in non-interest expense, driven primarily by larger balances in total mortgage finance loans and liquidity assets.the significant year-to-date 2020 expenses described below.
39
Consolidated Daily Average Balances, Average Yields and Rates
| Year ended December 31, | |||||||||||||||||||||||||||||
| 2020 | 2019 | 2018 | |||||||||||||||||||||||||||
| (in thousands except percentages) | Average Balance | Revenue / Expense | Yield / Rate | Average Balance | Revenue / Expense | Yield / Rate | Average Balance | Revenue / Expense | Yield / Rate | ||||||||||||||||||||
| Assets | |||||||||||||||||||||||||||||
| Investment Securities—taxable | $ | 689,590 | $ | 10,112 | 1.47 | % | $ | 37,574 | $ | 1,611 | 4.29 | % | $ | 24,142 | $ | 849 | 3.52 | % | |||||||||||
| Investment Securities—non-taxable(2) | 195,741 | 9,320 | 4.76 | % | 176,328 | 8,915 | 5.06 | % | 46,553 | 2,512 | 5.40 | % | |||||||||||||||||
| Federal funds sold and securities purchased under resale agreements | 114,141 | 693 | 0.61 | % | 73,946 | 1,529 | 2.07 | % | 201,236 | 3,792 | 1.88 | % | |||||||||||||||||
| Interest-bearing Deposits in other banks | 9,653,129 | 27,569 | 0.29 | % | 3,483,254 | 71,093 | 2.04 | % | 1,769,074 | 32,597 | 1.84 | % | |||||||||||||||||
| Loans held for sale | 1,114,311 | 36,369 | 3.26 | % | 2,688,677 | 112,526 | 4.19 | % | 1,561,530 | 71,240 | 4.56 | % | |||||||||||||||||
| Loans held for investment, mortgage finance | 8,589,762 | 285,212 | 3.32 | % | 6,999,585 | 241,665 | 3.45 | % | 4,875,860 | 181,438 | 3.72 | % | |||||||||||||||||
| Loans held for investment(1)(2) | 16,377,733 | 691,731 | 4.22 | % | 16,803,930 | 934,228 | 5.56 | % | 16,075,007 | 877,688 | 5.46 | % | |||||||||||||||||
| Less reserve for loan losses | 248,563 | — | — | 200,283 | — | — | 183,863 | — | — | ||||||||||||||||||||
| Loans held for investment, net | 24,718,932 | 976,943 | 3.95 | % | 23,603,232 | 1,175,893 | 4.98 | % | 20,767,004 | 1,059,126 | 5.10 | % | |||||||||||||||||
| Total earning assets | 36,485,844 | 1,061,006 | 2.91 | % | 30,063,011 | 1,371,567 | 4.56 | % | 24,369,539 | 1,170,116 | 4.80 | % | |||||||||||||||||
| Cash and other assets | 1,030,357 | 952,994 | 828,150 | ||||||||||||||||||||||||||
| Total assets | $ | 37,516,201 | $ | 31,016,005 | $ | 25,197,689 | |||||||||||||||||||||||
| Liabilities and stockholders’ equity | |||||||||||||||||||||||||||||
| Transaction deposits | $ | 4,090,591 | $ | 32,836 | 0.80 | % | $ | 3,535,282 | $ | 68,908 | 1.95 | % | $ | 3,044,300 | $ | 47,738 | 1.57 | % | |||||||||||
| Savings deposits | 12,346,904 | 74,950 | 0.61 | % | 9,780,532 | 168,856 | 1.73 | % | 7,986,135 | 114,255 | 1.43 | % | |||||||||||||||||
| Time deposits | 2,867,579 | 38,331 | 1.34 | % | 2,351,698 | 55,773 | 2.37 | % | 1,292,864 | 23,123 | 1.79 | % | |||||||||||||||||
| Total interest-bearing deposits | 19,305,074 | 146,117 | 0.76 | % | 15,667,512 | 293,537 | 1.87 | % | 12,323,299 | 185,116 | 1.50 | % | |||||||||||||||||
| Other borrowings | 3,115,416 | 22,006 | 0.71 | % | 3,038,095 | 70,265 | 2.31 | % | 2,102,404 | 42,738 | 2.03 | % | |||||||||||||||||
| Subordinated notes | 282,299 | 16,764 | 5.94 | % | 281,936 | 16,764 | 5.95 | % | 281,574 | 16,764 | 5.95 | % | |||||||||||||||||
| Trust preferred subordinated debentures | 113,406 | 3,199 | 2.82 | % | 113,406 | 5,026 | 4.43 | % | 113,406 | 4,715 | 4.16 | % | |||||||||||||||||
| Total interest-bearing liabilities | 22,816,195 | 188,086 | 0.82 | % | 19,100,949 | 385,592 | 2.02 | % | 14,820,683 | 249,333 | 1.68 | % | |||||||||||||||||
| Demand deposits | 11,567,549 | 8,989,104 | 7,890,304 | ||||||||||||||||||||||||||
| Other liabilities | 295,710 | 246,931 | 121,203 | ||||||||||||||||||||||||||
| Stockholders’ equity | 2,836,747 | 2,679,021 | 2,365,499 | ||||||||||||||||||||||||||
| Total liabilities and stockholders’ equity | $ | 37,516,201 | $ | 31,016,005 | $ | 25,197,689 | |||||||||||||||||||||||
| Net interest income(2) | $ | 872,920 | $ | 985,975 | $ | 920,783 | |||||||||||||||||||||||
| Net interest margin | 2.39 | % | 3.28 | % | 3.78 | % | |||||||||||||||||||||||
| Net interest spread | 2.09 | % | 2.54 | % | 3.12 | % | |||||||||||||||||||||||
| Loan spread(3) | 3.43 | % | 3.59 | % | 4.04 | % | |||||||||||||||||||||||
| Year ended December 31, | ||||||||||||||||||||||||
| 2019 | 2018 | 2017 | ||||||||||||||||||||||
| (in thousands except percentages) | Average Balance | Revenue / Expense | Yield / Rate | Average Balance | Revenue / Expense | Yield / Rate | Average Balance | Revenue / Expense | Yield / Rate | |||||||||||||||
| Assets | ||||||||||||||||||||||||
| Investment Securities—taxable | $ | 37,574 | $ | 1,611 | 4.29 | % | $ | 24,142 | $ | 849 | 3.52 | % | $ | 51,751 | $ | 1,064 | 2.06 | % | ||||||
| Investment Securities—non-taxable(2) | 176,328 | 8,915 | 5.06 | % | 46,553 | 2,512 | 5.40 | % | 55 | 3 | 4.85 | % | ||||||||||||
| Federal funds sold and securities purchased under resale agreements | 73,946 | 1,529 | 2.07 | % | 201,236 | 3,792 | 1.88 | % | 237,371 | 2,542 | 1.07 | % | ||||||||||||
| Interest-bearing Deposits in other banks | 3,483,254 | 71,093 | 2.04 | % | 1,769,074 | 32,597 | 1.84 | % | 2,715,669 | 29,399 | 1.08 | % | ||||||||||||
| Loans held for sale | 2,688,677 | 112,526 | 4.19 | % | 1,561,530 | 71,240 | 4.56 | % | 1,016,144 | 39,159 | 3.85 | % | ||||||||||||
| Loans held for investment, mortgage finance | 6,999,585 | 241,665 | 3.45 | % | 4,875,860 | 181,438 | 3.72 | % | 4,136,653 | 143,275 | 3.46 | % | ||||||||||||
| Loans held for investment(1)(2) | 16,803,930 | 934,228 | 5.56 | % | 16,075,007 | 877,688 | 5.46 | % | 14,040,965 | 670,265 | 4.77 | % | ||||||||||||
| Less reserve for loan losses | 200,283 | — | — | 183,863 | — | — | 174,105 | — | — | |||||||||||||||
| Loans held for investment, net | 23,603,232 | 1,175,893 | 4.98 | % | 20,767,004 | 1,059,126 | 5.10 | % | 18,003,513 | 813,540 | 4.52 | % | ||||||||||||
| Total earning assets | 30,063,011 | 1,371,567 | 4.56 | % | 24,369,539 | 1,170,116 | 4.80 | % | 22,024,503 | 885,707 | 4.02 | % | ||||||||||||
| Cash and other assets | 952,994 | 828,150 | 680,345 | |||||||||||||||||||||
| Total assets | $ | 31,016,005 | $ | 25,197,689 | $ | 22,704,848 | ||||||||||||||||||
| Liabilities and stockholders’ equity | ||||||||||||||||||||||||
| Transaction deposits | $ | 3,535,282 | $ | 68,908 | 1.95 | % | $ | 3,044,300 | $ | 47,738 | 1.57 | % | $ | 2,159,375 | $ | 15,290 | 0.71 | % | ||||||
| Savings deposits | 9,780,532 | 168,856 | 1.73 | % | 7,986,135 | 114,255 | 1.43 | % | 7,495,318 | 61,230 | 0.82 | % | ||||||||||||
| Time deposits | 2,351,698 | 55,773 | 2.37 | % | 1,292,864 | 23,123 | 1.79 | % | 478,513 | 3,366 | 0.70 | % | ||||||||||||
| Total interest-bearing deposits | 15,667,512 | 293,537 | 1.87 | % | 12,323,299 | 185,116 | 1.50 | % | 10,133,206 | 79,886 | 0.79 | % | ||||||||||||
| Other borrowings | 3,038,095 | 70,265 | 2.31 | % | 2,102,404 | 42,738 | 2.03 | % | 1,618,238 | 17,729 | 1.10 | % | ||||||||||||
| Subordinated notes | 281,936 | 16,764 | 5.95 | % | 281,574 | 16,764 | 5.95 | % | 281,213 | 16,764 | 5.96 | % | ||||||||||||
| Trust preferred subordinated debentures | 113,406 | 5,026 | 4.43 | % | 113,406 | 4,715 | 4.16 | % | 113,406 | 3,592 | 3.17 | % | ||||||||||||
| Total interest-bearing liabilities | 19,100,949 | 385,592 | 2.02 | % | 14,820,683 | 249,333 | 1.68 | % | 12,146,063 | 117,971 | 0.97 | % | ||||||||||||
| Demand deposits | 8,989,104 | 7,890,304 | 8,320,650 | |||||||||||||||||||||
| Other liabilities | 246,931 | 121,203 | 118,944 | |||||||||||||||||||||
| Stockholders’ equity | 2,679,021 | 2,365,499 | 2,119,191 | |||||||||||||||||||||
| Total liabilities and stockholders’ equity | $ | 31,016,005 | $ | 25,197,689 | $ | 22,704,848 | ||||||||||||||||||
| Net interest income(2) | $ | 985,975 | $ | 920,783 | $ | 767,736 | ||||||||||||||||||
| Net interest margin | 3.28 | % | 3.78 | % | 3.49 | % | ||||||||||||||||||
| Net interest spread | 2.54 | % | 3.12 | % | 3.05 | % | ||||||||||||||||||
| Loan spread(3) | 3.59 | % | 4.04 | % | 4.00 | % | ||||||||||||||||||
(3)Yield on loans, net of reserves, less funding cost including all deposits and borrowed funds.
40
Volume/Rate Analysis
The following table presents the changes in taxable-equivalent net interest income and identifies the changes due to differences in the average volume of earning assets and interest-bearing liabilities and the changes due to differences in the average interest rate on those assets and liabilities.
| Years Ended December 31, | |||||||||||||||||||||||||||||||||||
| 2020/2019 | 2019/2018 | ||||||||||||||||||||||||||||||||||
| Net Change | Change Due To(1) | Net Change | Change Due To(1) | ||||||||||||||||||||||||||||||||
| (in thousands) | Volume | Yield/Rate(2) | Volume | Yield/Rate(2) | |||||||||||||||||||||||||||||||
| Interest income: | |||||||||||||||||||||||||||||||||||
| Investment securities | $ | 8,906 | $ | 34,391 | $ | (25,485) | $ | 7,165 | $ | 5,787 | $ | 1,378 | |||||||||||||||||||||||
| Loans held for sale | (76,157) | (61,542) | (14,615) | 41,286 | 51,381 | (10,095) | |||||||||||||||||||||||||||||
| Loans held for investment, mortgage finance loans | 43,547 | 56,230 | (12,683) | 60,227 | 78,979 | (18,752) | |||||||||||||||||||||||||||||
| Loans held for investment | (242,497) | (22,700) | (219,797) | 56,540 | 38,729 | 17,811 | |||||||||||||||||||||||||||||
| Federal funds sold and securities purchased under resale agreements | (836) | 1,092 | (1,928) | (2,263) | (2,329) | 66 | |||||||||||||||||||||||||||||
| Interest-bearing deposits in other banks | (43,524) | 133,964 | (177,488) | 38,496 | 36,304 | 2,192 | |||||||||||||||||||||||||||||
| Total | (310,561) | 141,435 | (451,996) | 201,451 | 208,851 | (7,400) | |||||||||||||||||||||||||||||
| Interest expense: | |||||||||||||||||||||||||||||||||||
| Transaction deposits | (36,072) | 10,856 | (46,928) | 21,170 | 7,644 | 13,526 | |||||||||||||||||||||||||||||
| Savings deposits | (93,906) | 45,495 | (139,401) | 54,601 | 27,534 | 27,067 | |||||||||||||||||||||||||||||
| Time deposits | (17,442) | 12,330 | (29,772) | 32,650 | 15,517 | 17,133 | |||||||||||||||||||||||||||||
| Other borrowings | (48,259) | 1,741 | (50,000) | 27,527 | 18,344 | 9,183 | |||||||||||||||||||||||||||||
| Long-term debt | (1,827) | 20 | (1,847) | 311 | 20 | 291 | |||||||||||||||||||||||||||||
| Total | (197,506) | 70,442 | (267,948) | 136,259 | 69,059 | 67,200 | |||||||||||||||||||||||||||||
| Net interest income | $ | (113,055) | $ | 70,993 | $ | (184,048) | $ | 65,192 | $ | 139,792 | $ | (74,600) | |||||||||||||||||||||||
| Years Ended December 31, | |||||||||||||||||||||||
| 2019/2018 | 2018/2017 | ||||||||||||||||||||||
Net Change | Change Due To(1) | Net Change | Change Due To(1) | ||||||||||||||||||||
| (in thousands) | Volume | Yield/Rate(2) | Volume | Yield/Rate(2) | |||||||||||||||||||
| Interest income: | |||||||||||||||||||||||
| Investment securities | $ | 7,165 | $ | 5,787 | $ | 1,378 | $ | 2,294 | $ | 722 | $ | 1,572 | |||||||||||
| Loans held for sale | 41,286 | 51,381 | (10,095 | ) | 32,081 | 21,385 | 10,696 | ||||||||||||||||
| Loans held for investment, mortgage finance loans | 60,227 | 78,979 | (18,752 | ) | 38,163 | 25,541 | 12,622 | ||||||||||||||||
| Loans held for investment | 56,540 | 38,729 | 17,811 | 207,423 | 96,521 | 110,902 | |||||||||||||||||
| Federal funds sold and securities purchased under resale agreements | (2,263 | ) | (2,329 | ) | 66 | 1,250 | (435 | ) | 1,685 | ||||||||||||||
| Interest-bearing deposits in other banks | 38,496 | 36,304 | 2,192 | 3,198 | (10,437 | ) | 13,635 | ||||||||||||||||
| Total | 201,451 | 208,851 | (7,400 | ) | 284,409 | 133,297 | 151,112 | ||||||||||||||||
| Interest expense: | |||||||||||||||||||||||
| Transaction deposits | 21,170 | 7,644 | 13,526 | 32,448 | 6,197 | 26,251 | |||||||||||||||||
| Savings deposits | 54,601 | 27,534 | 27,067 | 53,025 | 3,382 | 49,643 | |||||||||||||||||
| Time deposits | 32,650 | 15,517 | 17,133 | 19,757 | 6,181 | 13,576 | |||||||||||||||||
| Other borrowings | 27,527 | 18,344 | 9,183 | 25,009 | 5,173 | 19,836 | |||||||||||||||||
| Long-term debt | 311 | 20 | 291 | 1,123 | 20 | 1,103 | |||||||||||||||||
| Total | 136,259 | 69,059 | 67,200 | 131,362 | 20,953 | 110,409 | |||||||||||||||||
| Net interest income | $ | 65,192 | $ | 139,792 | $ | (74,600 | ) | $ | 153,047 | $ | 112,344 | $ | 40,703 | ||||||||||
(2)Taxable equivalent rates used where applicable assuming a 21% tax rate.
Net Interest Income
Net interest income was $979.7$868.8 million for the year ended December 31, 20192020 compared to $914.9$979.7 million for 2018.2019. The increasedecrease was primarily due to andecreases in yields on earning assets and a shift in earning asset composition, partially offset by a decrease in funding costs.
Average earning assets for the year ended December 31, 2020 increased by $6.4 billion compared to the same period in 2019, and included a $671.4 million increase in average earning assetstotal investment securities, reflecting the deployment of $5.7 billion, offset by the effect of decreases in interest rates on loan yields, an increase in average interest-bearing liabilities of $4.3 billion and the effect of increasing funding costs. The increase in average earning assets includedexcess liquidity into higher-yielding investment securities, a $1.1 billion increase in average loans held for sale, a $2.8 billion increase in average nettotal loans held for investment, primarily fromattributable to increases in average mortgage finance loans driven byrelated to lower long-term interest rates, a $143.2 million increase in average investment securities, and a $1.6$6.2 billion increase in average liquidity assets.assets, partially offset by a $1.6 billion decrease in average loans held for sale. The increase in average liquidity assets was the result of actions taken by management during 2020 to ensure that we have the balance sheet strength to serve our clients during the COVID-19 pandemic. While we intend to operate with above-average liquidity in response to the uncertain economic environment, we believe opportunities exist to improve core earnings by reducing or replacing higher-cost funding sources and improving the earning asset mix. The decrease in average loans held for sale compared to the year ended December 31, 2019 resulted from holding purchased loans for shorter durations than in prior periods in order to limit exposure to forbearance risk caused by current economic uncertainties. The decline in net interest income on loans held for sale resulting from shorter hold times was offset by an increase in non-interest income. Average interest-bearing liabilities includedincreased $3.7 billion for the year ended December 31, 2020 compared to the same period in 2019, primarily due to a $3.3$3.6 billion increase in average interest-bearing deposits and a $935.7 million increase in other borrowings.deposits. Average demand deposits for the year ended December 31, 20192020 increased to $11.6 billion from $9.0 billion from $7.9 billion for 2018. 2019.
Net interest margin for the year ended December 31, 20192020 was 3.28%2.39% compared to 3.78%3.28% for 2018.2019. The decrease was primarily due to the effect of decreases indeclining interest rates during 2019 on loanearning asset yields and highera shift in earning asset composition, primarily increases in lower-yielding liquidity assets and mortgage finance loans coupled with a decline in loans held for investment, excluding mortgage finance, partially offset by lower funding costs compared to 2018.2019.
41
The yield on total loans held for investment decreased to 4.98%3.95% for the year ended December 31, 20192020 compared to 5.10%4.98% for 20182019 and the yield on earning assets decreased to 4.56%2.91% for the year ended December 31, 20192020 compared to 4.80%4.56% for 2018.2019. The average cost of total deposits and borrowed funds increaseddecreased to 1.31%0.47% for 2020 from 1.19% for 2019 from 1.02% for 2018. The spread onand total earning assets, net of the cost of deposits and borrowed funds, was 3.25% for 2019 compared to 3.78% for 2018. The decrease was primarily a result of an increase in the cost of interest-bearing liabilities coupled with declining loan yields. Total funding costs, including all deposits, long-term debt and stockholders' equity increaseddecreased to 0.51% for 2020 compared to 1.25% for 2019 compared to 0.99% for 2018.2019.
Non-interest Income
| Year ended December 31, | |||||||||||||||||
| (in thousands) | 2020 | 2019 | 2018 | ||||||||||||||
| Service charges on deposit accounts | $ | 11,620 | $ | 11,320 | $ | 12,787 | |||||||||||
| Wealth management and trust fee income | 9,998 | 8,810 | 8,148 | ||||||||||||||
| Brokered loan fees | 46,423 | 29,738 | 22,532 | ||||||||||||||
| Servicing income | 27,029 | 13,439 | 18,307 | ||||||||||||||
| Swap fees | 5,182 | 4,387 | 5,625 | ||||||||||||||
| Net gain/(loss) on sale of loans held for sale | 58,026 | (20,259) | (15,934) | ||||||||||||||
| Other(1) | 27,238 | 45,005 | 26,559 | ||||||||||||||
| Total non-interest income | $ | 185,516 | $ | 92,440 | $ | 78,024 | |||||||||||
| Year ended December 31, | |||||||||||
| (in thousands) | 2019 | 2018 | 2017 | ||||||||
| Service charges on deposit accounts | $ | 11,320 | $ | 12,787 | $ | 12,432 | |||||
| Wealth management and trust fee income | 8,810 | 8,148 | 6,153 | ||||||||
| Brokered loan fees | 29,738 | 22,532 | 23,331 | ||||||||
| Servicing income | 13,439 | 18,307 | 15,657 | ||||||||
| Swap fees | 4,387 | 5,625 | 3,990 | ||||||||
| Net gain/(loss) on sale of loans held for sale | (20,259 | ) | (15,934 | ) | (2,387 | ) | |||||
| Other(1) | 45,005 | 26,559 | 15,080 | ||||||||
| Total non-interest income | $ | 92,440 | $ | 78,024 | $ | 74,256 | |||||
Non-interest income increased by $14.4$93.1 million during the year ended December 31, 20192020 to $185.5 million, compared to $92.4 million compared to $78.0 million for 2018. Other non-interest income increased $18.4 million, which included the settlement of $15.0 million in legal claims during 2019. Brokered loan fees increased $7.2 millionThis increase was primarily due to ana $78.3 million increase in total mortgage finance volumes during 2019 compared to 2018. Offsetting these increases was a $4.9 million decrease in servicing income due to an overall decrease in average MSR balances held during 2019 as compared to 2018, a $4.3 million decrease in net gain/(loss) on sale of loans held for sale, a $1.5$16.7 million increase in brokered loan fees and a $13.4 million increase in servicing income, partially offset by a $17.8 million decrease in service chargesother non-interest income. The increase in net gain/(loss) on sale of loans held for sale was due to favorable economics and lower hedge costs in 2020 as a $1.2 millionresult of holding purchased loans for shorter durations than in prior periods, which was offset by the decline in net interest income on loans held for sale noted above. The increase in brokered loans fees was due to an increase in total mortgage finance volumes in 2020, and the increase in servicing income was due to an increase in the outstanding balance of our servicing portfolio. The decrease in swap fees. Swap fees are based upon customer swap transactions, are receivedother non-interest income resulted primarily from the institutionsettlement of $15.0 million in legal claims in 2019 that is our counterparty on the transaction and fluctuate from time to time based on the number and volume of transactions closed during the year.did not recur in 2020.
Non-interest Expense
| Year ended December 31, | ||||||||||||||||||||
| (in thousands) | 2020 | 2019(1) | 2018(1) | |||||||||||||||||
| Salaries and employee benefits | $ | 340,529 | $ | 328,483 | $ | 300,899 | ||||||||||||||
| Net occupancy expense | 34,955 | 32,989 | 30,342 | |||||||||||||||||
| Marketing | 23,581 | 53,355 | 39,335 | |||||||||||||||||
| Legal and professional | 52,132 | 52,460 | 42,990 | |||||||||||||||||
| Communications and technology | 103,054 | 44,826 | 30,056 | |||||||||||||||||
| FDIC insurance assessment | 25,955 | 20,093 | 24,307 | |||||||||||||||||
| Servicing-related expenses | 64,625 | 22,573 | 14,934 | |||||||||||||||||
| Merger-related expenses | 17,756 | 1,370 | — | |||||||||||||||||
| Other(2) | 41,809 | 44,701 | 49,670 | |||||||||||||||||
| Total non-interest expense | $ | 704,396 | $ | 600,850 | $ | 532,533 | ||||||||||||||
| Year ended December 31, | ||||||||||||
| (in thousands) | 2019 | 2018 | 2017 | |||||||||
| Salaries and employee benefits | $ | 315,080 | $ | 291,768 | $ | 264,231 | ||||||
| Net occupancy expense | 32,989 | 30,342 | 25,811 | |||||||||
| Marketing | 53,355 | 39,335 | 26,787 | |||||||||
| Legal and professional | 53,830 | 42,990 | 29,731 | |||||||||
| Communications and technology | 44,826 | 30,056 | 31,004 | |||||||||
| FDIC insurance assessment | 20,093 | 24,307 | 23,510 | |||||||||
| Servicing-related expenses | 22,573 | 14,934 | 15,506 | |||||||||
| Allowance and other carrying costs for OREO | 7 | 474 | 6,437 | |||||||||
| Other(1) | 47,246 | 50,890 | 42,859 | |||||||||
| Total non-interest expense | $ | 589,999 | $ | 525,096 | $ | 465,876 | ||||||
(2)Other expense includes such items as courier expenses, regulatory assessments other than FDIC insurance, insurance expenses and other general operating expenses.
Non-interest expense for the year ended December 31, 20192020 increased $64.9$103.5 million compared to 2018.2019. The increase iswas primarily due to increases in salaries and employee benefits, net occupancy expense and communication and technology expenses, all of which were due to general business growthservicing-related expenses and continued build-out, as well as increases in marketing, legal and professional and servicing-relatedmerger-related expenses, partially offset by decreasesa decrease in FDIC insurance assessment and other non-interest expense.marketing expenses. The increase in marketingsalaries and employee benefits was primarily due to $18.0 million in severance expense related to our workforce reduction in 2020. The increase in communications and technology expense was primarily due to an increase in variable expenses tied to deposit balances. The increase in legal and professional expense includes $1.3$36.0 million in expenseswrite-offs of certain software assets in 2020 and $5.9 million in technology expense related to the roll-out of our pending merger with IBTX, as well as increases relatedPPP capabilities in 2020. The full impact on salaries and employee benefits expense from the reduction in workforce and on software amortization included in communications and technology expense from the software write-offs recorded during 2020 is expected to investmentbe realized in Bask Bank and new commercial loan verticals.non-interest expense in the first half of 2021, though we did experience improvements during the fourth quarter of 2020. The increase in servicing-related expenses iswas primarily due to higher MSR amortization and impairment expense, resulting primarily from higher mortgage prepayment rates, as well as an increase in impairment expense.
42
Analysis of Financial Condition
Loans Held for Investment
The following table summarizes our loans held for investment on a gross basis by portfolio segment:
| December 31, | |||||||||||||||||||||||||||||
| (in thousands) | 2020 | 2019 | 2018 | 2017 | 2016 | ||||||||||||||||||||||||
| Commercial | $ | 8,861,580 | $ | 9,133,444 | $ | 9,117,546 | $ | 8,373,398 | $ | 6,622,078 | |||||||||||||||||||
| Energy | 766,217 | 1,425,309 | 1,631,371 | 1,130,000 | 889,583 | ||||||||||||||||||||||||
| Mortgage finance | 9,079,409 | 8,169,849 | 5,877,524 | 5,308,160 | 4,497,338 | ||||||||||||||||||||||||
| Real estate | 5,794,624 | 6,008,040 | 6,050,083 | 5,960,785 | 5,560,909 | ||||||||||||||||||||||||
| Total loans held for investment | $ | 24,501,830 | $ | 24,736,642 | $ | 22,676,524 | $ | 20,772,343 | $ | 17,569,908 | |||||||||||||||||||
| December 31, | |||||||||||||||||||
| (in thousands) | 2019 | 2018 | 2017 | 2016 | 2015 | ||||||||||||||
| Commercial | $ | 10,230,828 | $ | 10,373,288 | $ | 9,189,811 | $ | 7,291,545 | $ | 6,672,631 | |||||||||
| Mortgage finance | 8,169,849 | 5,877,524 | 5,308,160 | 4,497,338 | 4,966,276 | ||||||||||||||
| Construction | 2,563,339 | 2,120,966 | 2,166,208 | 2,098,706 | 1,851,717 | ||||||||||||||
| Real estate | 3,444,701 | 3,929,117 | 3,794,577 | 3,462,203 | 3,139,197 | ||||||||||||||
| Consumer | 71,463 | 63,438 | 48,684 | 34,587 | 25,323 | ||||||||||||||
| Equipment leases | 256,462 | 312,191 | 264,903 | 185,529 | 113,996 | ||||||||||||||
| Total loans held for investment | $ | 24,736,642 | $ | 22,676,524 | $ | 20,772,343 | $ | 17,569,908 | $ | 16,769,140 | |||||||||
We originate a substantial majority of all loans held for investment. We also participate in syndicated loan relationships, both as a participant and as an agent. As of December 31, 2019,2020, we had $2.3$1.9 billion in syndicated loans, $621.1$435.5 million of which we administer as agent. All syndicated loans, whether we act as agent or participant, are underwritten to the same standards as all other loans we originate. As of December 31, 2019, $26.0 million2020, none of our syndicated loans were on non-accrual.
Portfolio Geographic and Industry Concentrations
Although more than 50% of our total loan exposure is outside of Texas and more than 50% of our deposits are sourced outside of Texas, our Texas concentration remains significant. As of December 31, 2019,2020, a majority of our loans held for investment, excluding mortgage finance loans and other national lines of business, were to businesses with headquarters or operations in Texas. This geographic concentration subjects the loan portfolio to the general economic conditions within this state. We also make loans to customers that are secured by assets located outside of Texas. The risks created by this concentration have been considered by management in the determination of the appropriateness of the allowance for loancredit losses.
43
The table below summarizes the industry concentrations of our loans held for investment on a gross basis at December 31, 2019.2020.
| (in thousands except percentage data) | Amount | Percent of Total Loans Held for Investment | (in thousands except percentage data) | Amount | Percent of Total Loans Held for Investment | ||||||||||||
| Industry type: | Industry type: | ||||||||||||||||
| Mortgage finance loans | $ | 8,169,849 | 33.0 | % | Mortgage finance loans | $ | 9,079,409 | 37.0 | % | ||||||||
| Real estate and construction | 5,430,580 | 22.0 | % | Real estate and construction | 5,247,480 | 21.4 | % | ||||||||||
| Financials excluding banks | 5,053,285 | 20.4 | % | Financials excluding banks | 5,067,487 | 20.7 | % | ||||||||||
| Oil & gas and pipelines | 1,665,422 | 6.7 | % | Oil & gas and pipelines | 1,020,033 | 4.2 | % | ||||||||||
| Government and education | 527,217 | 2.1 | % | ||||||||||||||
| Healthcare and pharmaceuticals | 510,077 | 2.1 | % | Healthcare and pharmaceuticals | 460,517 | 1.9 | % | ||||||||||
| Machinery, equipment and parts manufacturing | 409,306 | 1.7 | % | ||||||||||||||
| Commercial services | 368,394 | 1.5 | % | Commercial services | 459,409 | 1.9 | % | ||||||||||
| Retail | 360,463 | 1.5 | % | Retail | 388,682 | 1.6 | % | ||||||||||
| Technology, telecom and media | 309,237 | 1.3 | % | Technology, telecom and media | 309,532 | 1.3 | % | ||||||||||
| Machinery, equipment and parts manufacturing | Machinery, equipment and parts manufacturing | 301,167 | 1.2 | % | |||||||||||||
| Materials and commodities | 260,896 | 1.1 | % | Materials and commodities | 231,609 | 0.9 | % | ||||||||||
| Entertainment and recreation | 200,181 | 0.8 | % | ||||||||||||||
| Food and beverage manufacturing and wholesale | 193,964 | 0.8 | % | Food and beverage manufacturing and wholesale | 225,003 | 0.9 | % | ||||||||||
| Consumer services | 178,726 | 0.7 | % | Consumer services | 222,009 | 0.9 | % | ||||||||||
| Entertainment and recreation | Entertainment and recreation | 203,605 | 0.8 | % | |||||||||||||
| Transportation services | 98,813 | 0.4 | % | Transportation services | 172,344 | 0.7 | % | ||||||||||
| Auto-related | 80,794 | 0.3 | % | ||||||||||||||
| Government and education | Government and education | 145,390 | 0.6 | % | |||||||||||||
| Diversified or miscellaneous | 919,438 | 3.6 | % | Diversified or miscellaneous | 968,154 | 4.0 | % | ||||||||||
| Total loans held for investment | $ | 24,736,642 | 100.0 | % | Total loans held for investment | $ | 24,501,830 | 100.0 | % | ||||||||
Our largest concentration of loans held for investment, excluding mortgage finance, in any single industry is in real estate and construction. Loans extended to borrowers within the real estate and construction industries generally include market risk real estate loans.loans, consisting of commercial real estate loans and loans made to residential builders and developers. Loan amounts are determined in part from an analysis of pro forma cash flows. Loans are also underwritten to comply with product-type specific advance rates against both cost and market value. We extend market riskcommercial real estate loans, including both construction/development financing and limited term financing, to builders, professional real estate developers and owners/managers of commercial real estate projects and properties who have a demonstrated record of past success with similar properties. Collateral properties include office buildings, warehouse/distribution buildings, shopping centers, hotels/motels, senior living, apartment buildings and residential and commercial tract development located primarily within our five major metropolitan markets in Texas. Thesedevelopment. The primary source of repayment on these loans are generally repaid throughis expected to come from the borrower's sale, permanent financing or lease of the properties or through refinancing by other institutional sources offering long-term fixed rate financing. Loan amountsreal property collateral. Loans to residential builders are determinedtypically in part from an analysisthe form of pro forma cash flows. Loansuncommitted guidance lines and are also underwrittenfor the purpose of developing lots into single-family homes, while loans to comply with product-type specific advance rates against both costdevelopers are typically in the form of borrowing base lines extended for the purpose of acquiring and market value. Borrowers represented within the real estate and construction category are largely owners and managers of both residential and non-residential commercial real estate properties, including homebuilders.developing raw land into lots that can be further sold to home builders.
Loans extended to borrowers in the financials excluding banks category are comprised largely of loans to companies who loan money to businesses and consumers for various purposes including, but not limited to, insurance, consumer goods and real estate. This category also includes loans to companies involved in investment management and securities and commodities trading.
44
We believe the loans we originate are appropriately collateralized under our credit standards. Approximately 97%98% of our loans held for investment are secured by collateral. Over 61%60.3% of the market risk real estate collateral is located in Texas. The table below sets forth information regarding the distribution of our loans held for investment on a gross basis among various types of collateral at December 31, 2019:2020:
| (in thousands except percentage data) | Amount | Percent of Total Loans Held for Investment | (in thousands except percentage data) | Amount | Percent of Total Loans Held for Investment | ||||||||||||
| Collateral type: | Collateral type: | ||||||||||||||||
| Mortgage finance loans | $ | 8,169,849 | 33.0 | % | Mortgage finance loans | $ | 9,079,409 | 37.1 | % | ||||||||
| Business assets | 7,257,383 | 29.3 | % | Business assets | 6,848,036 | 28.0 | % | ||||||||||
| Real property | 6,008,040 | 24.3 | % | Real property | 5,794,624 | 23.6 | % | ||||||||||
| Energy | 1,235,384 | 5.0 | % | Energy | 766,217 | 3.1 | % | ||||||||||
| U. S. Government guaranty | U. S. Government guaranty | 620,919 | 2.5 | % | |||||||||||||
| Other assets | Other assets | 368,633 | 1.5 | % | |||||||||||||
| Highly liquid assets | Highly liquid assets | 226,783 | 0.9 | % | |||||||||||||
| Municipal tax- and revenue-secured | 635,061 | 2.6 | % | Municipal tax- and revenue-secured | 186,061 | 0.8 | % | ||||||||||
| Rolling stock | Rolling stock | 23,872 | 0.1 | % | |||||||||||||
| Unsecured | 782,993 | 3.2 | % | Unsecured | 587,276 | 2.4 | % | ||||||||||
| Highly liquid assets | 210,082 | 0.8 | % | ||||||||||||||
| Other assets | 383,591 | 1.6 | % | ||||||||||||||
| Rolling stock | 45,982 | 0.2 | % | ||||||||||||||
| U. S. Government guaranty | 8,277 | — | % | ||||||||||||||
| Total loans held for investment | $ | 24,736,642 | 100.0 | % | Total loans held for investment | $ | 24,501,830 | 100.0 | % | ||||||||
As noted in the table above, approximately 24.3%21.4% of our loans held for investment as of December 31, 20192020 are secured by real property. The table below summarizes our total real estate loan portfolio, which includes real estate loans and construction loans, as segregated by the type of property securing the credit. Property type concentrations are stated as a percentage of year-end total real estate loans as of December 31, 2019:2020:
| (in thousands except percentage data) | Amount | Percent of Total Real Estate Loans | |||||||||
| Property type: | |||||||||||
| Market risk | |||||||||||
| Apartment/condominium buildings | 1,195,645 | 20.8 | % | ||||||||
| Commercial buildings | 597,163 | 10.3 | % | ||||||||
| 1-4 Family dwellings (other than condominium) | 585,267 | 10.1 | % | ||||||||
| Senior housing buildings | 387,601 | 6.7 | % | ||||||||
| Self-storage building | 348,442 | 6.0 | % | ||||||||
| Hotel/motel buildings | 327,327 | 5.6 | % | ||||||||
| Industrial buildings | 314,569 | 5.4 | % | ||||||||
| Residential lots | 286,981 | 5.0 | % | ||||||||
| Shopping center/mall buildings | 257,404 | 4.4 | % | ||||||||
| Commercial lots | 75,480 | 1.3 | % | ||||||||
| Other | 168,440 | 2.9 | % | ||||||||
| Other than market risk | |||||||||||
| Commercial buildings | 350,462 | 6.0 | % | ||||||||
| Industrial buildings | 358,825 | 6.2 | % | ||||||||
| 1-4 Family dwellings (other than condominium) | 335,562 | 5.8 | % | ||||||||
| Other | 205,456 | 3.5 | % | ||||||||
| Total real estate loans | 5,794,624 | 100 | % | ||||||||
45
| (in thousands except percentage data) | Amount | Percent of Total Real Estate Loans | ||||
| Property type: | ||||||
| Market risk | ||||||
| Apartment buildings | $ | 1,011,552 | 16.8 | % | ||
| 1-4 Family dwellings (other than condominium) | 731,220 | 12.2 | % | |||
| Commercial buildings | 704,318 | 11.7 | % | |||
| Hotel/motel buildings | 377,412 | 6.3 | % | |||
| Hospital/medical buildings | 367,156 | 6.1 | % | |||
| Residential lots | 348,282 | 5.8 | % | |||
| Shopping center/mall buildings | 327,431 | 5.4 | % | |||
| Industrial buildings | 294,315 | 4.9 | % | |||
| Commercial lots | 94,214 | 1.6 | % | |||
| Unimproved land | 54,657 | 0.9 | % | |||
| Other | 476,194 | 7.9 | % | |||
| Other than market risk | ||||||
| 1-4 Family dwellings (other than condominium) | 384,094 | 6.4 | % | |||
| Commercial buildings | 311,948 | 5.2 | % | |||
| Industrial buildings | 300,184 | 5.0 | % | |||
| Other | 225,063 | 3.8 | % | |||
| Total real estate loans | $ | 6,008,040 | 100.0 | % | ||
The table below summarizes our market risk real estate portfolio at December 31, 20192020 as segregated by the geographic region in which the property is located:
| (in thousands except percentage data) | Amount | Percent of Total | (in thousands except percentage data) | Amount | Percent of Total | ||||||||||||
| Geographic region: | Geographic region: | ||||||||||||||||
| Dallas/Fort Worth | $ | 1,095,967 | 22.9 | % | Dallas/Fort Worth | $ | 1,040,163 | 22.9 | % | ||||||||
| Houston | 908,119 | 19.0 | % | Houston | 725,827 | 16.0 | % | ||||||||||
| San Antonio | 411,146 | 8.6 | % | San Antonio | 428,795 | 9.4 | % | ||||||||||
| Austin | 403,945 | 8.4 | % | Austin | 453,389 | 10.0 | % | ||||||||||
| Other Texas cities | 108,281 | 2.3 | % | Other Texas cities | 89,935 | 2.0 | % | ||||||||||
| Other states | 1,859,293 | 38.8 | % | Other states | 1,806,210 | 39.7 | % | ||||||||||
| Total market risk real estate loans | $ | 4,786,751 | 100 | % | Total market risk real estate loans | $ | 4,544,319 | 100.0 | % | ||||||||
The determination of collateral value is critically important when financing real estate. As a result, obtaining current and objectively prepared appraisals is a major part of our underwriting and monitoring processes. We engage a variety of professional firms to supply appraisals, market studies and feasibility reports, environmental assessments and project site inspections to complement our internal resources to underwrite and monitor these credit exposures. Generally, our policy requires a new appraisal every three years. However, in periods of economic uncertainty where real estate values can fluctuatemarket conditions may change rapidly, more current appraisals are obtained when warranted by conditions such as a borrower’s deteriorating financial condition, their possible inability to perform on the loan or other indicators of increasing risk of reliance on collateral value as the sole source of repayment of the loan. Annual appraisals are generally obtained for loans graded substandard or worse where real estate is a material portion of the collateral value and/or the income from the real estate or sale of the real estate is the primary source of debt service.
Appraisals are, in substantially all cases, reviewed by a third party to determine the reasonableness of the appraised value. The third party reviewer will challenge whether or not the data used is appropriate and relevant, form an opinion as to the appropriateness of the appraisal methods and techniques used, and determine if overall the analysis and conclusions of the appraiser can be relied upon. Additionally, the third party reviewer provides a detailed report of that analysis. Further review may be conducted by our credit officers, as well as by the Bank’s managed asset committee as conditions warrant. These additional steps of review are undertaken to confirm that the underlying appraisal and the third party analysis can be relied upon. If we have differences, we address those with the reviewer and determine an appropriate resolution. Both the appraisal process and the appraisal review process can be less reliable in establishing accurate collateral values during and following periods of economic weakness due to the lack of comparable sales and the limited availability of financing to support an active market of potential purchasers.
Large Credit Relationships
We originate and maintain large credit relationships with numerous customers in the ordinary course of business. The legal lending limit of our Bank is approximately $489.3$506.4 million. We employ much lower house limits which vary by assigned risk grade, product and collateral type. Such house limits, which generally range from $20 million to $50$60 million, may be exceeded with appropriate authorization for exceptionally strong borrowers and otherwise where business opportunity and perceived credit risk warrant a somewhat larger investment. We consider large credit relationships to be those with commitments equal to or in excess of $20.0 million. The following table provides additional information on our large held for investment credit relationships, excluding mortgage finance, outstanding at year-end:
| December 31, 2019 | December 31, 2018 | ||||||||||||||||||||
| Period End Balances | Period End Balances | ||||||||||||||||||||
| (in thousands, except relationship data) | Number of Relationships | Committed | Outstanding | Number of Relationships | Committed | Outstanding | |||||||||||||||
| $30.0 million and greater | 177 | $ | 8,254,124 | $ | 4,251,321 | 152 | $ | 6,995,259 | $ | 3,678,155 | |||||||||||
| $20.0 million to $29.9 million | 196 | 4,708,982 | 3,103,200 | 224 | 5,272,529 | 3,362,732 | |||||||||||||||
| December 31, 2020 | December 31, 2019 | ||||||||||||||||||||||||||||||||||
| Period End Balances | Period End Balances | ||||||||||||||||||||||||||||||||||
| (in thousands, except relationship data) | Number of Relationships | Committed | Outstanding | Number of Relationships | Committed | Outstanding | |||||||||||||||||||||||||||||
| $30.0 million and greater | 190 | $ | 8,650,588 | $ | 4,252,488 | 177 | $ | 8,254,124 | $ | 4,251,321 | |||||||||||||||||||||||||
| $20.0 million to $29.9 million | 167 | 4,095,449 | 2,414,768 | 196 | 4,708,982 | 3,103,200 | |||||||||||||||||||||||||||||
46
Growth in period-end outstanding balances related to large credit relationships primarily resulted from an increase in the number of commitments. The following table summarizes the average committed and outstanding loan balances per relationship related to our large held for investment credit relationships, excluding mortgage finance, at year-end:
| 2019 Average Balance per Relationship | 2018 Average Balance per Relationship | 2020 Average Balance per Relationship | 2019 Average Balance per Relationship | |||||||||||||||||||||||||||||||||||
| (in thousands) | Committed | Outstanding | Committed | Outstanding | (in thousands) | Committed | Outstanding | Committed | Outstanding | |||||||||||||||||||||||||||||
| $30.0 million and greater | $ | 46,633 | $ | 24,019 | $ | 46,021 | $ | 24,198 | $30.0 million and greater | $ | 45,529 | $ | 22,382 | $ | 46,633 | $ | 24,019 | |||||||||||||||||||||
| $20.0 million to $29.9 million | 24,025 | 15,833 | 23,538 | 15,012 | $20.0 million to $29.9 million | 24,524 | 14,460 | 24,025 | 15,833 | |||||||||||||||||||||||||||||
Loan Maturities and Interest Rate Sensitivity
| December 31, 2020 | |||||||||||||||||||||||
| (in thousands) | Total | Within 1 Year | 1-5 Years | After 5 Years | |||||||||||||||||||
| Loan maturity: | |||||||||||||||||||||||
| Commercial | $ | 8,861,580 | $ | 3,175,247 | $ | 5,071,781 | $ | 614,552 | |||||||||||||||
| Energy | 766,217 | 241,164 | 525,053 | — | |||||||||||||||||||
| Mortgage finance | 9,079,409 | 9,079,409 | — | — | |||||||||||||||||||
| Real estate | 5,794,624 | 1,667,692 | 3,205,451 | 921,481 | |||||||||||||||||||
| Total loans held for investment | $ | 24,501,830 | $ | 14,163,512 | $ | 8,802,285 | $ | 1,536,033 | |||||||||||||||
| Interest rate sensitivity for selected loans with: | |||||||||||||||||||||||
| Predetermined interest rates | $ | 3,127,325 | $ | 1,476,707 | $ | 1,136,376 | $ | 514,242 | |||||||||||||||
| Floating or adjustable interest rates | 21,374,505 | 12,686,805 | 7,665,909 | 1,021,791 | |||||||||||||||||||
| Total loans held for investment | $ | 24,501,830 | $ | 14,163,512 | $ | 8,802,285 | $ | 1,536,033 | |||||||||||||||
| December 31, 2019 | |||||||||||||||
| (in thousands) | Total | Within 1 Year | 1-5 Years | After 5 Years | |||||||||||
| Loan maturity: | |||||||||||||||
| Commercial | $ | 10,230,828 | $ | 3,563,035 | $ | 5,807,416 | $ | 860,377 | |||||||
| Mortgage finance | 8,169,849 | 8,169,849 | — | — | |||||||||||
| Construction | 2,563,339 | 731,908 | 1,766,100 | 65,331 | |||||||||||
| Real estate | 3,444,701 | 664,770 | 1,851,049 | 928,882 | |||||||||||
| Consumer | 71,463 | 56,182 | 7,740 | 7,541 | |||||||||||
| Equipment leases | 256,462 | 29,512 | 107,965 | 118,985 | |||||||||||
| Total loans held for investment | $ | 24,736,642 | $ | 13,215,256 | $ | 9,540,270 | $ | 1,981,116 | |||||||
| Interest rate sensitivity for selected loans with: | |||||||||||||||
| Predetermined interest rates | $ | 3,074,975 | $ | 1,556,329 | $ | 530,507 | $ | 988,139 | |||||||
| Floating or adjustable interest rates | 21,661,667 | 11,658,927 | 9,009,763 | 992,977 | |||||||||||
| Total loans held for investment | $ | 24,736,642 | $ | 13,215,256 | $ | 9,540,270 | $ | 1,981,116 | |||||||
Interest Reserve Loans
As of December 31, 20192020 and December 31, 2018,2019, we had $743.8$549.1 million and $718.5$743.8 million, respectively, in loans held for investment that included interest reserve arrangements, representing approximately 29%23% and 34%12%, respectively, of ouroutstanding construction loans, which are a component of real estate loans. Interest reserve provisions are common in construction loans. The use of interest reserves is carefully controlled by our underwriting standards, which consider the feasibility of the project, the creditworthiness of the borrower and guarantors and the loan-to-value coverage of the collateral. The interest reserve allows the borrower to draw loan funds to pay interest charges on the outstanding balance of the loan when financial conditions precedent are met. When drawn, the interest is capitalized and added to the loan balance, subject to conditions specified during the initial underwriting and at the time the credit is approved. We have ongoing controls for monitoring compliance with loan covenants, advancing funds and determining default conditions.
When we finance land on which improvements will be constructed, construction funds are generally not advanced until the borrower has received lease or purchase commitments which will meet cash flow coverage requirements and/or our analysis of market conditions and project feasibility indicates to our satisfaction that such lease or purchase commitments are forthcoming or other sources of repayment have been identified to repay the loan. It is our general policy to require a substantial equity investment by the borrower to complement the Bank's credit commitment. Any such required borrower investment is first contributed and invested in the project before any draws are allowed under the Bank's credit commitment. We require current financial statements of the borrowing entity and guarantors, as well as conduct periodic inspections of the project and analysis of whether the project is on schedule or delayed. Updated appraisals are ordered when necessary to validate the collateral values to support advances, including reserve interest. Advances of interest reserves are discontinued if collateral values do not support the advances or if the borrower does not comply with other terms and conditions in the loan agreements. In addition, most of our construction lending is performed in Texas and our lenders are very familiar with trends in local real estate. If at any time we believe that our collateral position is jeopardized, we retain the right to stop the use of interest reserves. As of December 31, 20192020 and December 31, 2018,2019, none of our loans with interest reserves were on non-accrual.
47
Non-performing Assets
Non-performing assets include non-accrual loans and leases and repossessed assets. The table below summarizes our non-performing assets by type and by type of property securing the credit:
| As of December 31, | |||||||||||||||||
| (in thousands) | 2020 | 2019 | 2018 | ||||||||||||||
| Non-accrual loans(1) | |||||||||||||||||
| Commercial | |||||||||||||||||
| Assets of the borrowers | $ | 18,776 | $ | 57,901 | $ | 16,538 | |||||||||||
| Accounts receivable and inventory | 3,547 | 26,426 | 21,300 | ||||||||||||||
| Other | 9,773 | 4,308 | 2,548 | ||||||||||||||
| Total commercial | 32,096 | 88,635 | 40,386 | ||||||||||||||
| Energy | |||||||||||||||||
| Oil and gas properties | 51,724 | 125,049 | 37,532 | ||||||||||||||
| Total Energy | 51,724 | 125,049 | 37,532 | ||||||||||||||
| Real estate | |||||||||||||||||
| Assets of the borrowers | 14,496 | — | — | ||||||||||||||
| Commercial property | 13,569 | 1,751 | 988 | ||||||||||||||
| Hotel/motel | 4,619 | 8,500 | — | ||||||||||||||
| Single family residences | 218 | 1,449 | 1,469 | ||||||||||||||
| Other | 5,267 | — | — | ||||||||||||||
| Total real estate | 38,169 | 11,700 | 2,457 | ||||||||||||||
| Total non-accrual loans | 121,989 | 225,384 | 80,375 | ||||||||||||||
| OREO(2) | — | — | 79 | ||||||||||||||
| Total non-performing assets | $ | 121,989 | $ | 225,384 | $ | 80,454 | |||||||||||
| Restructured loans - accruing | $ | — | $ | — | $ | — | |||||||||||
| Loans held for investment past due 90 days and accruing(3) | $ | 12,541 | $ | 17,584 | $ | 9,353 | |||||||||||
| Loans held for sale non-accrual(4) | $ | 6,966 | $ | — | $ | — | |||||||||||
| Loans held for sale past due 90 days and accruing(5) | $ | 16,667 | $ | 8,207 | $ | 16,829 | |||||||||||
| As of December 31, | |||||||||||
| (in thousands) | 2019 | 2018 | 2017 | ||||||||
| Non-accrual loans(1) | |||||||||||
| Commercial | |||||||||||
| Oil and gas properties | $ | 125,049 | $ | 37,532 | $ | 64,192 | |||||
| Assets of the borrowers | 54,538 | 16,538 | 7,571 | ||||||||
| Accounts receivable and inventory | 29,789 | 21,300 | 24,399 | ||||||||
| Other | 4,084 | 2,493 | 3,569 | ||||||||
| Total commercial | 213,460 | 77,863 | 99,731 | ||||||||
| Real estate | |||||||||||
| Commercial property | 1,751 | 988 | 1,096 | ||||||||
| Single family residences | 1,449 | 1,469 | 118 | ||||||||
| Hotel/motel | 8,500 | — | — | ||||||||
| Other | — | — | 499 | ||||||||
| Total real estate | 11,700 | 2,457 | 1,713 | ||||||||
| Consumer | 34 | 55 | — | ||||||||
| Equipment leases | 190 | — | — | ||||||||
| Total non-accrual loans | 225,384 | 80,375 | 101,444 | ||||||||
| OREO(2) | — | 79 | 11,742 | ||||||||
| Total non-performing assets | $ | 225,384 | $ | 80,454 | $ | 113,186 | |||||
| Restructured loans - accruing | $ | — | $ | — | $ | — | |||||
| Loans held for investment past due 90 days and accruing(3) | $ | 17,584 | $ | 9,353 | $ | 8,429 | |||||
| Loans held for sale past due 90 days and accruing(4) | $ | 8,207 | $ | 16,829 | $ | 19,737 | |||||
(2)At December 31, 2018, there was no valuation allowance recorded against the OREO balance.
(3)At December 31, 2020, 2019 and 2018, loans past due 90 days and still accruing includes premium finance loans of $6.4 million, $8.5 million and $9.2 million, respectively.
(4)Includes one non-accrual loan previously reported in loans HFI that was transferred to loans HFS as of December 31, 2020 and subsequently sold at carrying value.
(5)Includes loans guaranteed by U.S. government agencies that were repurchased out of Ginnie Mae securities. Loans are recorded as loans held for sale and carried at fair value on the balance sheet. Interest on these past due loans accrues at the debenture rate guaranteed by the U.S. government. Also includes loans that, pursuant to Ginnie Mae servicing guidelines, we have the unilateral right, but not the obligation, to repurchase if defined delinquent loan criteria are met and therefore must record as loans held for sale on our balance sheet regardless of whether the repurchase option has been exercised.
Total non-performing assets at December 31, 2019 increased $144.92020 decreased $103.4 million from December 31, 2018.2019. The increasedecrease during 20192020 primarily related to increases in ourcharge-offs of energy and leveraged loan portfolios. Energylending loans during 2020. Non-accrual energy loans totaled $51.7 million (42% of total non-performing assets totaled $125.0 millionassets) at December 31, 20192020 compared to $37.5$125.0 million (55% of total non-performing assets) at December 31, 2018, and2019. Non-accrual leveraged lending loans totaled $18.9 million (15% of total non-performing assets totaledassets) at December 31, 2020 compared to $73.2 million and $28.8 million for the same periods, respectively.(32% of total non-performing assets) at December 31, 2019.
Potential problem loans consist of loans that are performing in accordance with contractual terms, but for which we have concerns about the borrower’s ability to comply with repayment terms because of the borrower’s potential financial difficulties. We monitor these loans closely and review their performance on a regular basis. At December 31, 2019,2020, we had $46.6$193.2 million in loans of this type, compared to $81.7$46.6 million at December 31, 2018.2019. Potential problem loan levels have remained elevated throughout 2020 as compared to 2019, primarily as a result of continued economic uncertainty related to the COVID-19 pandemic.
48
Summary of Loan Loss Experience
The provision for credit losses, which includes a provision for off-balance sheet credit losses, on unfunded commitments, is a charge to earnings to maintain the allowance for loancredit losses at a level consistent with management’s assessment of inherentexpected losses in the loan portfolio at the balance sheet date. We adopted ASU 2016-13 on January 1, 2020, which replaced the incurred loss methodology for determining our provision for credit losses and allowance for credit losses with the CECL model. Upon adoption, the allowance for credit losses was increased by $9.1 million, with no impact on the consolidated statement of income. We recorded a provision for credit losses of $258.0 million for the year ended December 31, 2020, $75.0 million for the year ended December 31, 2019, and $87.0 million for the year ended December 31, 2018, and $44.02018. Criticized loans totaled $918.4 million for the year endedat December 31, 2017. The decrease in provision recorded during 20192020, compared to 2018 was primarily related$1.1 billion at September 30, 2020 and $584.1 million at December 31, 2019. Criticized loan levels have declined in the fourth quarter of 2020 as compared to decreasesthe third quarter of 2020, however remain elevated due to the downgrade of loans to borrowers that have been impacted by the COVID-19 pandemic or that are in charge-offs and loans held for investment, excluding mortgage finance, balances.categories that are expected to be more significantly impacted by COVID-19.
The table below presents a summary of our loan loss experience for the past five years:
| Year Ended December 31, | Year Ended December 31, | |||||||||||||||||||||||||||||||||||||||||||||||||||||||||||||||
| (in thousands except percentage and multiple data) | 2019 | 2018 | 2017 | 2016 | 2015 | (in thousands except percentage and multiple data) | 2020 | 2019 | 2018 | 2017 | 2016 | |||||||||||||||||||||||||||||||||||||||||||||||||||||
| Allowance for loan losses: | ||||||||||||||||||||||||||||||||||||||||||||||||||||||||||||||||
| Allowance for credit losses: | Allowance for credit losses: | |||||||||||||||||||||||||||||||||||||||||||||||||||||||||||||||
| Beginning balance | $ | 191,522 | $ | 184,655 | $ | 168,126 | $ | 141,111 | $ | 100,954 | Beginning balance | $ | 195,047 | $ | 191,522 | $ | 184,655 | $ | 168,126 | $ | 141,111 | |||||||||||||||||||||||||||||||||||||||||||
| Impact of CECL adoption | Impact of CECL adoption | 8,585 | — | — | — | — | ||||||||||||||||||||||||||||||||||||||||||||||||||||||||||
| Loans charged-off: | Loans charged-off: | |||||||||||||||||||||||||||||||||||||||||||||||||||||||||||||||
| Commercial | 76,958 | 79,692 | 34,145 | 56,558 | 16,254 | Commercial | 73,360 | 44,352 | 60,158 | 13,673 | 18,843 | |||||||||||||||||||||||||||||||||||||||||||||||||||||
| Construction | — | — | 59 | — | — | |||||||||||||||||||||||||||||||||||||||||||||||||||||||||||
| Energy | Energy | 133,522 | 32,625 | 20,620 | 20,652 | 37,762 | ||||||||||||||||||||||||||||||||||||||||||||||||||||||||||
| Real estate | 662 | — | 290 | 528 | 389 | Real estate | 180 | 662 | — | 349 | 528 | |||||||||||||||||||||||||||||||||||||||||||||||||||||
| Consumer | — | 767 | 180 | 47 | 62 | |||||||||||||||||||||||||||||||||||||||||||||||||||||||||||
| Equipment leases | 19 | 319 | — | — | 25 | |||||||||||||||||||||||||||||||||||||||||||||||||||||||||||
| Total charge-offs | 77,639 | 80,778 | 34,674 | 57,133 | 16,730 | Total charge-offs | 207,062 | 77,639 | 80,778 | 34,674 | 57,133 | |||||||||||||||||||||||||||||||||||||||||||||||||||||
| Recoveries: | Recoveries: | |||||||||||||||||||||||||||||||||||||||||||||||||||||||||||||||
| Commercial | 3,290 | 2,468 | 4,593 | 9,364 | 4,944 | Commercial | 1,277 | 3,054 | 2,450 | 4,022 | 7,702 | |||||||||||||||||||||||||||||||||||||||||||||||||||||
| Construction | — | — | 104 | 34 | 400 | |||||||||||||||||||||||||||||||||||||||||||||||||||||||||||
| Energy | Energy | 6,999 | 316 | 489 | 651 | 1,760 | ||||||||||||||||||||||||||||||||||||||||||||||||||||||||||
| Real estate | — | 69 | 75 | 63 | 33 | Real estate | — | — | 69 | 179 | 97 | |||||||||||||||||||||||||||||||||||||||||||||||||||||
| Consumer | 69 | 438 | 70 | 21 | 173 | |||||||||||||||||||||||||||||||||||||||||||||||||||||||||||
| Equipment leases | 11 | 33 | 10 | 77 | 38 | |||||||||||||||||||||||||||||||||||||||||||||||||||||||||||
| Total recoveries | 3,370 | 3,008 | 4,852 | 9,559 | 5,588 | Total recoveries | 8,276 | 3,370 | 3,008 | 4,852 | 9,559 | |||||||||||||||||||||||||||||||||||||||||||||||||||||
| Net charge-offs | 74,269 | 77,770 | 29,822 | 47,574 | 11,142 | Net charge-offs | 198,786 | 74,269 | 77,770 | 29,822 | 47,574 | |||||||||||||||||||||||||||||||||||||||||||||||||||||
| Provision for loan losses | 77,794 | 84,637 | 46,351 | 74,589 | 51,299 | |||||||||||||||||||||||||||||||||||||||||||||||||||||||||||
| Provision for credit losses on loans | Provision for credit losses on loans | 249,769 | 77,794 | 84,637 | 46,351 | 74,589 | ||||||||||||||||||||||||||||||||||||||||||||||||||||||||||
| Ending balance | $ | 195,047 | $ | 191,522 | $ | 184,655 | $ | 168,126 | $ | 141,111 | Ending balance | $ | 254,615 | $ | 195,047 | $ | 191,522 | $ | 184,655 | $ | 168,126 | |||||||||||||||||||||||||||||||||||||||||||
| Allowance for off-balance sheet credit losses: | Allowance for off-balance sheet credit losses: | |||||||||||||||||||||||||||||||||||||||||||||||||||||||||||||||
| Beginning balance | $ | 11,434 | $ | 9,071 | $ | 11,422 | $ | 9,011 | $ | 7,060 | Beginning balance | $ | 8,640 | $ | 11,434 | $ | 9,071 | $ | 11,422 | $ | 9,011 | |||||||||||||||||||||||||||||||||||||||||||
| Impact of CECL adoption | Impact of CECL adoption | 563 | — | — | — | — | ||||||||||||||||||||||||||||||||||||||||||||||||||||||||||
| Provision for off-balance sheet credit losses | (2,794 | ) | 2,363 | (2,351 | ) | 2,411 | 1,951 | Provision for off-balance sheet credit losses | 8,231 | (2,794) | 2,363 | (2,351) | 2,411 | |||||||||||||||||||||||||||||||||||||||||||||||||||
| Ending balance | $ | 8,640 | $ | 11,434 | $ | 9,071 | $ | 11,422 | $ | 9,011 | Ending balance | $ | 17,434 | $ | 8,640 | $ | 11,434 | $ | 9,071 | $ | 11,422 | |||||||||||||||||||||||||||||||||||||||||||
| Total allowance for credit losses | $ | 203,687 | $ | 202,956 | $ | 193,726 | $ | 179,548 | $ | 150,122 | Total allowance for credit losses | $ | 272,049 | $ | 203,687 | $ | 202,956 | $ | 193,726 | $ | 179,548 | |||||||||||||||||||||||||||||||||||||||||||
| Total provision for credit losses | $ | 75,000 | $ | 87,000 | $ | 44,000 | $ | 77,000 | $ | 53,250 | Total provision for credit losses | $ | 258,000 | $ | 75,000 | $ | 87,000 | $ | 44,000 | $ | 77,000 | |||||||||||||||||||||||||||||||||||||||||||
| Allowance for loan losses to LHI | 0.79 | % | 0.85 | % | 0.89 | % | 0.96 | % | 0.84 | % | ||||||||||||||||||||||||||||||||||||||||||||||||||||||
| Allowance for credit losses on loans to LHI | Allowance for credit losses on loans to LHI | 1.04 | % | 0.79 | % | 0.85 | % | 0.89 | % | 0.96 | % | |||||||||||||||||||||||||||||||||||||||||||||||||||||
| Net charge-offs to average LHI | 0.31 | % | 0.37 | % | 0.16 | % | 0.29 | % | 0.07 | % | Net charge-offs to average LHI | 0.80 | % | 0.31 | % | 0.37 | % | 0.16 | % | 0.29 | % | |||||||||||||||||||||||||||||||||||||||||||
| Total provision for credit losses to average LHI | 0.32 | % | 0.42 | % | 0.24 | % | 0.46 | % | 0.35 | % | Total provision for credit losses to average LHI | 1.03 | % | 0.32 | % | 0.42 | % | 0.24 | % | 0.46 | % | |||||||||||||||||||||||||||||||||||||||||||
| Recoveries to total charge-offs | 4.34 | % | 3.72 | % | 13.99 | % | 16.73 | % | 33.40 | % | Recoveries to total charge-offs | 4.00 | % | 4.34 | % | 3.72 | % | 13.99 | % | 16.73 | % | |||||||||||||||||||||||||||||||||||||||||||
| Allowance for off-balance sheet credit losses to off-balance sheet credit commitments | 0.10 | % | 0.14 | % | 0.13 | % | 0.19 | % | 0.16 | % | Allowance for off-balance sheet credit losses to off-balance sheet credit commitments | 0.20 | % | 0.10 | % | 0.14 | % | 0.13 | % | 0.19 | % | |||||||||||||||||||||||||||||||||||||||||||
| Combined allowance for credit losses to LHI | 0.83 | % | 0.90 | % | 0.94 | % | 1.03 | % | 0.90 | % | ||||||||||||||||||||||||||||||||||||||||||||||||||||||
| Total allowance for credit losses to LHI | Total allowance for credit losses to LHI | 1.11 | % | 0.83 | % | 0.90 | % | 0.94 | % | 1.03 | % | |||||||||||||||||||||||||||||||||||||||||||||||||||||
| Allowance as a multiple of non-performing loans | 0.9 | x | 2.4 | x | 1.8 | x | 1.0 | x | 0.8 | x | Allowance as a multiple of non-performing loans | 2.1 | x | 0.9 | x | 2.4 | x | 1.8 | x | 1.0 | x | |||||||||||||||||||||||||||||||||||||||||||
The allowance for credit losses, including the allowance for off-balance sheet credit losses on unfunded commitments reported on the consolidated balance sheets in other liabilities, totaled $272.0 million at December 31, 2020, $203.7 million at December 31, 2019 and $203.0 million at December 31, 2018 and $193.7 million at December 31, 2017.2018. The combinedtotal allowance as a percentage of loans held for investment decreasedincreased to 1.11% at December 31, 2020 from 0.83% and 0.90% at December 31, 2019 from 0.90% and 0.94% at December 31, 2018, and 2017, respectively. The downward trend in the combinedtotal allowance as a percentage of loans held for investment, that beganexcluding mortgage finance, increased to 1.77% at December 31, 2020 from 1.24% at December 31, 2019 and 1.22% at December 31, 2018. The increase in 2017 continued during 2018 andthe total allowance as a percentage of loans held for investment at December 31, 2020, compared to December 31, 2019, is due primarily to growthan increase in mortgage finance loans heldthe allowance for investment.
49
The following table presents a summary of our allowance for loancredit losses on loans by portfolio segment for the past five years:
| December 31, | ||||||||||||||||||||||||||||||||||||||||||||||||||||||||||||||
| 2020 | 2019 | 2018 | 2017 | 2016 | ||||||||||||||||||||||||||||||||||||||||||||||||||||||||||
(in thousands except percentage data) | Reserve | % of Loans | Reserve | % of Loans | Reserve | % of Loans | Reserve | % of Loans | Reserve | % of Loans | ||||||||||||||||||||||||||||||||||||||||||||||||||||
| Loan category: | ||||||||||||||||||||||||||||||||||||||||||||||||||||||||||||||
| Commercial | $ | 73,061 | 36 | % | $ | 102,254 | 37 | % | $ | 96,814 | 40 | % | $ | 74,226 | 40 | % | $ | 77,584 | 37 | % | ||||||||||||||||||||||||||||||||||||||||||
| Energy | 84,064 | 3 | % | 60,253 | 6 | % | 34,882 | 7 | % | 48,479 | 5 | % | 52,549 | 5 | % | |||||||||||||||||||||||||||||||||||||||||||||||
| Mortgage finance loans | 4,699 | 37 | % | 2,265 | 33 | % | — | 26 | % | — | 26 | % | — | 26 | % | |||||||||||||||||||||||||||||||||||||||||||||||
| Real estate | 92,791 | 24 | % | 30,275 | 24 | % | 52,595 | 27 | % | 53,560 | 29 | % | 32,293 | 32 | % | |||||||||||||||||||||||||||||||||||||||||||||||
| Additional qualitative reserve | — | — | — | — | 7,231 | — | 8,390 | — | 5,700 | — | ||||||||||||||||||||||||||||||||||||||||||||||||||||
| Total allowance for credit losses on loans | $ | 254,615 | 100 | % | $ | 195,047 | 100 | % | $ | 191,522 | 100 | % | $ | 184,655 | 100 | % | $ | 168,126 | 100 | % | ||||||||||||||||||||||||||||||||||||||||||
| December 31, | |||||||||||||||||||||||||||||||||||
| 2019 | 2018 | 2017 | 2016 | 2015 | |||||||||||||||||||||||||||||||
(in thousands except percentage data) | Reserve | % of Loans | Reserve | % of Loans | Reserve | % of Loans | Reserve | % of Loans | Reserve | % of Loans | |||||||||||||||||||||||||
| Loan category: | |||||||||||||||||||||||||||||||||||
| Commercial | $ | 162,119 | 42 | % | $ | 129,442 | 46 | % | $ | 118,806 | 45 | % | $ | 128,768 | 41 | % | $ | 112,446 | 40 | % | |||||||||||||||
| Mortgage finance loans | 2,265 | 33 | % | — | 26 | % | — | 26 | % | — | 26 | % | — | 29 | % | ||||||||||||||||||||
| Construction | 14,773 | 10 | % | 19,242 | 9 | % | 19,273 | 10 | % | 13,144 | 12 | % | 6,836 | 11 | % | ||||||||||||||||||||
| Real estate | 15,502 | 14 | % | 33,353 | 18 | % | 34,287 | 18 | % | 19,149 | 20 | % | 13,381 | 19 | % | ||||||||||||||||||||
| Consumer | 53 | — | 425 | — | 357 | — | 241 | — | 338 | — | |||||||||||||||||||||||||
| Equipment leases | 335 | 1 | % | 1,829 | 1 | % | 3,542 | 1 | % | 1,124 | 1 | % | 3,931 | 1 | % | ||||||||||||||||||||
| Additional qualitative reserve | — | — | 7,231 | — | 8,390 | — | 5,700 | — | 4,179 | — | |||||||||||||||||||||||||
| Total allowance for loan losses | $ | 195,047 | 100 | % | $ | 191,522 | 100 | % | $ | 184,655 | 100 | % | $ | 168,126 | 100 | % | $ | 141,111 | 100 | % | |||||||||||||||
See Note 1 - Operations and Summary of Significant Accounting Policies and Note 4 - Loans Held for Investment and Allowance for LoanCredit Losses on Loans in the accompanying notes to the consolidated financial statements included elsewhere in this report for details of the allowance for loancredit losses.
Loans Held for Sale
Through our MCA program we commit to purchase residential mortgage loans from independent correspondent lenders and deliver those loans into the secondary market via whole loan sales to independent third parties or in securitization transactions to Ginnie Mae and GSEs such as Fannie Mae and Freddie Mac. For additional information on our loans held for sale portfolio, see Note 1 - Operations and Summary of Significant Accounting Policies and Note 65 - Certain Transfers of Financial Assets in the accompanying notes to the consolidated financial statements included elsewhere in this report.
Deposits
We compete for deposits by offering a broad range of products and services to our customers. While this includes offering competitive interest rates and fees, the primary means of competing for deposits is convenience and service to our customers. However, our strategy to provide service and convenience to customers does not include a large branch network. Our Bank offers banking centers, courier services and online and mobile banking. BankDirect and Bask Bank, our online banking divisions, serve customers on a 24 hours-a-day, 7 days-a-week basis solely through online banking.
Average total deposits for the year ended December 31, 20192020 increased $4.4$6.2 billion compared to 2018.2019. Average demand deposits for the year ended December 31, 20192020 increased $1.1$2.6 billion compared to 2018,2019, and average interest-bearing deposits increased $3.3$3.6 billion. The average cost of total deposits increaseddecreased to 0.47% in 2020 from 1.19% in 2019 from 0.92% in 2018 due to increased
The following table discloses our average deposits:
| Year Ended December 31, | Year Ended December 31, | |||||||||||||||||||||||||||
| (in thousands) | 2019 | 2018 | 2017 | (in thousands) | 2020 | 2019 | 2018 | |||||||||||||||||||||
| Non-interest-bearing | $ | 8,989,104 | $ | 7,890,304 | $ | 8,320,650 | Non-interest-bearing | $ | 11,567,549 | $ | 8,989,104 | $ | 7,890,304 | |||||||||||||||
| Interest-bearing transaction | 3,535,282 | 3,044,300 | 2,159,375 | Interest-bearing transaction | 4,090,591 | 3,535,282 | 3,044,300 | |||||||||||||||||||||
| Savings | 9,780,532 | 7,986,135 | 7,495,318 | Savings | 12,346,904 | 9,780,532 | 7,986,135 | |||||||||||||||||||||
| Time deposits | 2,351,698 | 1,292,864 | 478,513 | Time deposits | 2,867,579 | 2,351,698 | 1,292,864 | |||||||||||||||||||||
| Total average deposits | $ | 24,656,616 | $ | 20,213,603 | $ | 18,453,856 | Total average deposits | $ | 30,872,623 | $ | 24,656,616 | $ | 20,213,603 | |||||||||||||||
Uninsured deposits at December 31, 20192020 were 53%52% of total deposits, compared to 57% of total deposits53% at December 31, 20182019 and 59% of total deposits57% at December 31, 2017.2018. The insured deposit data for 2020, 2019 2018 and 20172018 reflect the deposit insurance impact of "combined ownership segregation" of escrow and other accounts at an aggregate level but do not reflect an evaluation of all of the account styling distinctions that would determine the availability of deposit insurance to individual accounts based on FDIC regulations.
50
Maturity of Domestic CDs and Other Time Deposits in Amounts of $100,000 or More
| December 31, | |||||||||||||||||
| (in thousands) | 2020 | 2019 | 2018 | ||||||||||||||
| Months to maturity: | |||||||||||||||||
| 3 or less | $ | 159,428 | $ | 215,991 | $ | 193,982 | |||||||||||
| Over 3 through 6 | 133,921 | 75,632 | 89,529 | ||||||||||||||
| Over 6 through 12 | 203,626 | 165,973 | 100,177 | ||||||||||||||
| Over 12 | 67,703 | 50,619 | 15,834 | ||||||||||||||
| Total | $ | 564,678 | $ | 508,215 | $ | 399,522 | |||||||||||
| December 31, | |||||||||||
| (in thousands) | 2019 | 2018 | 2017 | ||||||||
| Months to maturity: | |||||||||||
| 3 or less | $ | 215,991 | $ | 193,982 | $ | 161,523 | |||||
| Over 3 through 6 | 75,632 | 89,529 | 146,027 | ||||||||
| Over 6 through 12 | 165,973 | 100,177 | 128,817 | ||||||||
| Over 12 | 50,619 | 15,834 | 28,965 | ||||||||
| Total | $ | 508,215 | $ | 399,522 | $ | 465,332 | |||||
Liquidity and Capital Resources
In general terms, liquidity is a measurement of our ability to meet our cash needs. Our objectives in managing our liquidity are to maintain our ability to meet loan commitments, repurchase investment securities and repay deposits and other liabilities in accordance with their terms, without an adverse impact on our current or future earnings. Our liquidity strategy is guided by policies, formulated and monitored by our senior management and our Asset and Liability Management Committee (“ALCO”), which take into account the demonstrated marketability of our assets, the sources and stability of our funding and the level of unfunded commitments. We regularly evaluate all of our various funding sources with an emphasis on accessibility, stability, reliability and cost-effectiveness. For the years ended December 31, 20192020 and 2018,2019, our principal source of funding has been our customer deposits, supplemented by our short-term and long-term borrowings, primarily from federal funds purchased and FHLB borrowings, which are generally used to fund mortgage finance assets. We also rely on the availability of the mortgage secondary market provided by Ginnie Mae and the GSEs to support the liquidity of our mortgage finance assets.
In accordance with our liquidity strategy, deposit growth and increases in borrowing capacity related to our mortgage finance loans have resulted in increasedaccumulating liquidity assets in recent periods, which wereperiods. Throughout 2020 we have significantly increased our liquidity assets to ensure that we have the balance sheet strength to serve our clients during the COVID-19 pandemic. Liquidity assets totaled $9.0 billion at December 31, 2020 compared to $4.3 billion at December 31, 2019 and $2.9 billion at December 31, 2018.2019. The following table summarizes the growth in and composition of liquidity assets:
| December 31, | December 31, | |||||||||||||||||||||||||||||||
| (in thousands except percentage data) | 2019 | 2018 | 2017 | (in thousands except percentage data) | 2020 | 2019 | 2018 | |||||||||||||||||||||||||
| Federal funds sold and securities purchased under resale agreements | $ | 30,000 | $ | 50,190 | $ | 30,000 | Federal funds sold and securities purchased under resale agreements | $ | — | $ | 30,000 | $ | 50,190 | |||||||||||||||||||
| Interest-bearing deposits | 4,233,766 | 2,815,684 | 2,697,581 | Interest-bearing deposits | 9,032,807 | 4,233,766 | 2,815,684 | |||||||||||||||||||||||||
| Total liquidity assets | $ | 4,263,766 | $ | 2,865,874 | $ | 2,727,581 | Total liquidity assets | $ | 9,032,807 | $ | 4,263,766 | $ | 2,865,874 | |||||||||||||||||||
| Total liquidity assets as a percent of: | Total liquidity assets as a percent of: | |||||||||||||||||||||||||||||||
| Total loans held for investment | 17.3 | % | 12.7 | % | 13.2 | % | Total loans held for investment | 37.0 | % | 17.3 | % | 12.7 | % | |||||||||||||||||||
| Total earning assets | 13.5 | % | 10.5 | % | 11.2 | % | Total earning assets | 24.6 | % | 13.5 | % | 10.5 | % | |||||||||||||||||||
| Total deposits | 16.1 | % | 13.9 | % | 14.3 | % | Total deposits | 29.1 | % | 16.1 | % | 13.9 | % | |||||||||||||||||||
Our liquidity needs to support growth in loans held for investment have been fulfilled primarily through growth in our core customer deposits. Our goal is to obtain as much of our funding for loans held for investment and other earning assets as possible from deposits of these core customers. These deposits are generated principally through development of long-term customer relationships, with a significant focus on treasury management products. In addition to deposits from our core customers, we also have access to deposits through brokered customer relationships. For regulatory purposes, these relationship brokered deposits are categorized as brokered deposits; however, since these deposits arise from a customer relationship, which involves extensive treasury services, we consider these deposits to be core deposits for our reporting purposes.
51
We also have access to incremental deposits through brokered retail certificates of deposit, or CDs. These traditional brokered deposits are generally of short maturities less than 12 months, and are used to fund temporary differences in the growth in loan balances, including growth in loans held for sale or other specific categories of loans as compared to customer deposits. The following table summarizes our period-end and average core customer deposits, relationship brokered deposits and traditional brokered deposits:
| December 31, | December 31, | |||||||||||||||||
| (in thousands) | 2019 | 2018 | (in thousands) | 2020 | 2019 | |||||||||||||
| Deposits from core customers | $ | 22,549,568 | $ | 17,015,541 | Deposits from core customers | $ | 27,581,532 | $ | 22,549,568 | |||||||||
| Deposits from core customers as a percent of total deposits | 85.2 | % | 82.6 | % | Deposits from core customers as a percent of total deposits | 89.0 | % | 85.2 | % | |||||||||
| Relationship brokered deposits | $ | 1,617,247 | $ | 2,027,850 | Relationship brokered deposits | $ | 1,771,883 | $ | 1,617,247 | |||||||||
| Relationship brokered deposits as a percent of average total deposits | 6.1 | % | 9.8 | % | Relationship brokered deposits as a percent of average total deposits | 5.7 | % | 6.1 | % | |||||||||
| Traditional brokered deposits | $ | 2,311,778 | $ | 1,562,722 | Traditional brokered deposits | $ | 1,643,174 | $ | 2,311,778 | |||||||||
| Traditional brokered deposits as a percent of total deposits | 8.7 | % | 7.6 | % | Traditional brokered deposits as a percent of total deposits | 5.3 | % | 8.7 | % | |||||||||
| Average deposits from core customers | $ | 20,747,292 | $ | 17,504,922 | Average deposits from core customers | $ | 26,537,612 | $ | 20,747,292 | |||||||||
| Average deposits from core customers as a percent of average total deposits | 84.1 | % | 86.6 | % | Average deposits from core customers as a percent of average total deposits | 86.0 | % | 84.1 | % | |||||||||
| Average relationship brokered deposits | $ | 2,096,287 | $ | 1,890,824 | Average relationship brokered deposits | $ | 2,099,652 | $ | 2,096,287 | |||||||||
| Average relationship brokered deposits as a percent of average total deposits | 8.5 | % | 9.4 | % | Average relationship brokered deposits as a percent of average total deposits | 6.8 | % | 8.5 | % | |||||||||
| Average traditional brokered deposits | $ | 1,813,037 | $ | 817,857 | Average traditional brokered deposits | $ | 2,235,359 | $ | 1,813,037 | |||||||||
| Average traditional brokered deposits as a percent of average total deposits | 7.4 | % | 4.0 | % | Average traditional brokered deposits as a percent of average total deposits | 7.2 | % | 7.4 | % | |||||||||
We have access to sources of traditional brokered deposits that we estimate to be $5.3$7.5 billion. Based on our internal guidelines, we have chosen to limit our use of these sources to a lesser amount. We have increased our use of traditional brokered deposits in 20182020 and 2019 in response to favorable rates available in that market relative to other available funding sources.
We have short-term borrowing sources available to supplement deposits and meet our funding needs. Such borrowings are generally used to fund our mortgage finance loans, due to their liquidity, short duration and interest spreads available. These borrowing sources include federal funds purchased from our downstream correspondent bank relationships (which consist of banks that are smaller than our Bank) and from our upstream correspondent bank relationships (which consist of banks that are larger than our Bank), customer repurchase agreements and advances from the FHLB and the Federal Reserve. The following table summarizes our short-term and other borrowings:
| December 31, | December 31, | |||||||||||||||||||||||
| (in thousands) | 2019 | 2018 | 2017 | (in thousands) | 2020 | 2019 | 2018 | |||||||||||||||||
| Federal funds purchased | $ | 132,270 | $ | 629,169 | $ | 359,338 | Federal funds purchased | $ | 107,600 | $ | 132,270 | $ | 629,169 | |||||||||||
| Repurchase agreements | 9,496 | 12,005 | 5,702 | Repurchase agreements | 4,151 | 9,496 | 12,005 | |||||||||||||||||
| FHLB borrowings | 2,400,000 | 3,900,000 | 2,800,000 | FHLB borrowings | 3,000,000 | 2,400,000 | 3,900,000 | |||||||||||||||||
| Line of credit | — | — | — | Line of credit | — | — | — | |||||||||||||||||
| Total short-term and other borrowings | $ | 2,541,766 | $ | 4,541,174 | $ | 3,165,040 | Total short-term and other borrowings | $ | 3,111,751 | $ | 2,541,766 | $ | 4,541,174 | |||||||||||
For additional information on our short-term and other borrowings, see Note 1110 - Short-Term and Other Borrowings in the accompanying notes to the consolidated financial statements included elsewhere in this report.
From November 2002 to September 2006 various Texas Capital Statutory Trusts were created and subsequently issued floating rate trust preferred securities in various private offerings totaling $113.4 million. Because our Bank had less than $15.0 billion in total consolidated assets as of December 31, 2009, we are allowed to continue to classify our trust preferred securities, all of which were issued prior to May 19, 2010, as Tier 1 capital.
Our equity capital averaged $2.7$2.8 billion for the year ended December 31, 2019 as2020 compared to $2.7 billion in 2019 and $2.4 billion in 2018 and $2.1 billion in 2017.2018. We have not paid any cash dividends on our common stock since we commenced operations. While weWe have no plans to paynot paid any cash dividends on our common stock since we commenced operations and have no plans to do so in the foreseeable future, it is anticipated that following the merger of the Company and IBTX the combined company will pay dividends to stockholders at the rate of $1.00 per share annually. See the discussion at Risk Factors – Risks Relating to Our Securities.future.
For additional information on our capital, see Note 1413 - Regulatory Restrictions in the accompanying notes to the consolidated financial statements included elsewhere in this report.
52
Commitments and Contractual Obligations
The following table presents, as of December 31, 2019,2020, significant fixed and determinable contractual obligations to third parties by payment date. Amounts in the table do not include accrued or accruing interest. See Note 7 - Leases in the accompanying notes to the consolidated financial statements included elsewhere in this report for details of contractual lease obligations. Further discussion of the nature of each obligation is included in the referenced note to the consolidated financial statements included elsewhere in this report.
| (in thousands) | Note Reference | Within One Year | After One But Within Three Years | After Three But Within Five Years | After Five Years | Total | |||||||||||||||||||||||||||||
| Deposits without a stated maturity | 9 | $ | 28,757,070 | $ | — | $ | — | $ | — | $ | 28,757,070 | ||||||||||||||||||||||||
| Time deposits | 9 | 1,317,558 | 917,032 | 4,924 | 5 | 2,239,519 | |||||||||||||||||||||||||||||
| Lease liabilities | 6 | 17,222 | 32,966 | 17,278 | 22,849 | 90,315 | |||||||||||||||||||||||||||||
| Federal funds purchased and customer repurchase agreements | 10 | 111,751 | — | — | — | 111,751 | |||||||||||||||||||||||||||||
| FHLB borrowings | 10 | 3,000,000 | — | — | — | 3,000,000 | |||||||||||||||||||||||||||||
| Subordinated notes | 11 | — | — | — | 282,490 | 282,490 | |||||||||||||||||||||||||||||
| Trust preferred subordinated debentures | 11 | — | — | — | 113,406 | 113,406 | |||||||||||||||||||||||||||||
| Total contractual obligations | $ | 33,203,601 | $ | 949,998 | $ | 22,202 | $ | 418,750 | $ | 34,594,551 | |||||||||||||||||||||||||
| (in thousands) | Note Reference | Within One Year | After One But Within Three Years | After Three But Within Five Years | After Five Years | Total | ||||||||||||||||
| Deposits without a stated maturity | 10 | $ | 23,607,562 | $ | — | $ | — | $ | — | $ | 23,607,562 | |||||||||||
| Time deposits | 10 | 2,810,219 | 55,923 | 2,034 | 2,855 | 2,871,031 | ||||||||||||||||
| Federal funds purchased and customer repurchase agreements | 11 | 141,766 | — | — | — | 141,766 | ||||||||||||||||
| FHLB borrowings | 11 | 2,400,000 | — | — | — | 2,400,000 | ||||||||||||||||
| Subordinated notes | 12 | — | — | — | 282,129 | 282,129 | ||||||||||||||||
| Trust preferred subordinated debentures | 12 | — | — | — | 113,406 | 113,406 | ||||||||||||||||
| Total contractual obligations | $ | 28,959,547 | $ | 55,923 | $ | 2,034 | $ | 398,390 | $ | 29,415,894 | ||||||||||||
Off-Balance Sheet Arrangements
We had the following off-balance sheet contractual obligations as of December 31, 2019:2020:
| (in thousands) | Within One Year | After One But Within Three Years | After Three But Within Five Years | After Five Years | Total | (in thousands) | Within One Year | After One But Within Three Years | After Three But Within Five Years | After Five Years | Total | |||||||||||||||||||||||||||||||||||||
| Commitments to extend credit | $ | 2,672,791 | $ | 3,112,661 | $ | 2,066,169 | $ | 215,034 | $ | 8,066,655 | Commitments to extend credit | $ | 3,021,442 | $ | 3,650,051 | $ | 1,638,198 | $ | 220,762 | $ | 8,530,453 | |||||||||||||||||||||||||||
| Standby and commercial letters of credit | 186,377 | 58,301 | 16,727 | — | 261,405 | Standby and commercial letters of credit | 178,571 | 78,912 | 11,411 | — | 268,894 | |||||||||||||||||||||||||||||||||||||
| Total financial instruments with off-balance sheet risk | $ | 2,859,168 | $ | 3,170,962 | $ | 2,082,896 | $ | 215,034 | $ | 8,328,060 | Total financial instruments with off-balance sheet risk | $ | 3,200,013 | $ | 3,728,963 | $ | 1,649,609 | $ | 220,762 | $ | 8,799,347 | |||||||||||||||||||||||||||
Due to the nature of our unfunded loan commitments, including unfunded lines of credit, the amounts presented in the table above do not necessarily represent amounts that we anticipate funding in the periods presented above. Commitments to extend credit do not include our mortgage finance arrangements with mortgage loan originators through our mortgage warehouse lending division, which are established as uncommitted "guidance" purchase and sale facilities under which the mortgage originator has no obligation to offer and we have no obligation to purchase interests in the mortgage loans subject to the arrangements. See Note 1 - Operations and Summary of Significant Accounting Policies in the accompanying notes to the consolidated financial statements included elsewhere in this report.
Critical Accounting Policies
SEC guidance requires disclosure of “critical accounting policies.” The SEC defines “critical accounting policies” as those that are most important to the presentation of a company’s financial condition and results, and require management’s most difficult, subjective or complex judgments, often as a result of the need to make estimates about the effect of matters that are inherently uncertain.
We follow financial accounting and reporting policies that are in accordance with accounting principles generally accepted in the United States. The more significant of these policies are summarized in Note 1 - Operations and Summary of Significant Accounting Policies in the notes to the consolidated financial statements included elsewhere in this report. Not all significant accounting policies require management to make difficult, subjective or complex judgments. However, the policy noted below could be deemed to meet the SEC’s definition of a critical accounting policy.
Allowance for LoanCredit Losses
Management considers the policies related to the allowance for loancredit losses as the most critical to the financial statement presentation. The total allowance for loancredit losses includes activity related to allowances calculated in accordance with Accounting Standards Codification (“ASC”) 310,326, Receivables, and ASC 450, ContingenciesCredit Losses. The allowance for loancredit losses is established through a provision for credit losses charged to current earnings. The amount maintained in the allowance reflects management’s continuing evaluation of the loancredit losses inherentexpected to be recognized over the life of the loans in the loan portfolio at the balance sheet date.our portfolio. The allowance for loancredit losses on loans is comprised of general reserves and specific reserves assigneda valuation account that is deducted from the loans' amortized cost basis to certain impaired loans. Factors contributingpresent the net amount expected to be collected on the determination of specific reserves include the creditworthiness of the borrower, and more specifically, changes in the expected future receipt of principal and interest payments and/or in the value of pledged collateral. A reserve is recorded when the carrying amount of the loan exceeds the discounted estimated cash flows using the loan’s initial effective interest rate or the fair value of the collateral for certain collateral dependent loans. For purposes of determining the general reserve,allowance for credit losses, the loan portfolio is segregated by product types in order to recognize differing risk profiles among categories, and then further segregated by credit grades. Loans that do not share risk characteristics are evaluated on an individual basis and are not included in the collective evaluation. Management estimates the allowance balance using relevant available information from internal and external
53
sources relating to past events, current conditions and reasonable and supportable forecasts. Adjustments to historical loss information are made to incorporate our reasonable and supportable forecast of future losses at the portfolio segment level, as well as any necessary qualitative adjustments using a Portfolio Level Qualitative Factor ("PLQF") and/or a Portfolio Segment Level Qualitative Factor ("SLQF"). The PLQF and SLQF are utilized to address factors that are not present in historical loss rates and are otherwise unaccounted for in the quantitative process. A reserve is recorded upon origination or purchase of a loan. See “Summary of LoanCredit Loss Experience” above and Note 4 – Loans Held for Investment and Allowance for LoanCredit Losses on Loans in the accompanying notes to the consolidated financial statements included elsewhere in this report for further discussion of the risk factors considered by management in establishing the allowance for loancredit losses.
| December 31, | |||||||||||||||||||
| (in thousands, except per share data) | 2019 | 2018 | 2017 | 2016 | 2015 | ||||||||||||||
| Total common equity | $ | 2,682,258 | $ | 2,350,394 | $ | 2,052,721 | $ | 1,859,557 | $ | 1,473,533 | |||||||||
| Adjustments: | |||||||||||||||||||
| Goodwill and intangibles | (18,099 | ) | (18,570 | ) | (19,040 | ) | (19,512 | ) | (19,960 | ) | |||||||||
| Tangible common equity | $ | 2,664,159 | $ | 2,331,824 | $ | 2,033,681 | $ | 1,840,045 | $ | 1,453,573 | |||||||||
| Common shares outstanding | 50,337,741 | 50,200,710 | 49,643,344 | 49,503,662 | 45,873,807 | ||||||||||||||
| Book value per common share | $ | 53.29 | $ | 46.82 | $ | 41.35 | $ | 37.56 | $ | 32.12 | |||||||||
| Tangible book value per common share(1) | $ | 52.93 | $ | 46.45 | $ | 40.97 | $ | 37.17 | $ | 31.69 | |||||||||
| December 31, | |||||||||||||||||||
| (in thousands, except percentage data) | 2019 | 2018 | 2017 | 2016 | 2015 | ||||||||||||||
| Total common equity | $ | 2,682,258 | $ | 2,350,394 | $ | 2,052,721 | $ | 1,859,557 | $ | 1,473,533 | |||||||||
| Adjustments: | |||||||||||||||||||
| AOCI | (8,950 | ) | (518 | ) | (428 | ) | (415 | ) | (718 | ) | |||||||||
| Goodwill and intangibles | (18,099 | ) | (18,570 | ) | (19,040 | ) | (19,512 | ) | (19,960 | ) | |||||||||
| Tangible common equity | $ | 2,655,209 | $ | 2,331,306 | $ | 2,033,253 | $ | 1,839,630 | $ | 1,452,855 | |||||||||
| Total Assets | $ | 32,548,069 | $ | 28,257,767 | $ | 25,075,645 | $ | 21,697,134 | $ | 18,903,821 | |||||||||
| Adjustments: | |||||||||||||||||||
| AOCI | (8,950 | ) | (518 | ) | (428 | ) | (415 | ) | (718 | ) | |||||||||
| Goodwill and intangibles | (18,099 | ) | (18,570 | ) | (19,040 | ) | (19,512 | ) | (19,960 | ) | |||||||||
| Tangible common equity | $ | 32,521,020 | $ | 28,238,679 | $ | 25,056,177 | $ | 21,677,207 | $ | 18,883,143 | |||||||||
| Total common equity to total assets | 8.24 | % | 8.32 | % | 8.19 | % | 8.57 | % | 7.79 | % | |||||||||
| Tangible common equity to total tangible assets(1) | 8.16 | % | 8.26 | % | 8.11 | % | 8.49 | % | 7.69 | % | |||||||||
Market risk is a broad term for the risk of economic loss due to adverse changes in the fair value of a financial instrument. These changes may be the result of various factors, including interest rates, foreign exchange rates, commodity prices, or equity prices. Additionally, the financial instruments subject to market risk can be classified either as held for trading purposes or held for other than trading.
We are subject to market risk primarily through the effect of changes in interest rates on our portfolio of assets held for purposes other than trading. Additionally, we have some market risk relative to commodity prices through our energy lending activities. Declines and volatility in commodity prices negatively impacted our energy clients' ability to perform on their loan obligations in recent years, and further uncertainty and volatility could have a negative impact on our customers and our loan portfolio in future periods. Foreign exchange rates, commodity prices (other than energy) and equity prices are not expected to pose significant market risk to us.
The responsibility for managing market risk rests with the ALCO, which operates under policy guidelines established by our board of directors. The acceptable negative variation in net interest revenue due to a 100 basis point increase or decrease in interest rates is generally limited by these guidelines to plus or minus 10-12%. These guidelines establish maximum levels for
short-term borrowings, short-term assets and public and brokered deposits and minimum levels for liquidity, among other things. Oversight of our compliance with these guidelines is the ongoing responsibility of the ALCO, with exceptions reported to the Risk Management Committee, and to our board of directors if deemed necessary, on a quarterly basis. Additionally, the Credit Policy Committee ("CPC") specifically manages risk relative to commodity price market risks. The CPC establishes maximum portfolio concentration levels for energy loans as well as maximum advance rates for energy collateral.
Interest Rate Risk Management
Our interest rate sensitivity is illustrated in the following table. The table reflects rate-sensitive positions as of December 31, 2019,2020, and is not necessarily indicative of positions on other dates. The balances of interest rate sensitive assets and liabilities are presented in the periods in which they next reprice to market rates or mature and are aggregated to show the interest rate sensitivity gap. The mismatch between repricings or maturities within a time period is commonly referred to as the “gap” for that period. A positive gap (asset sensitive), where interest rate-sensitive assets exceed interest rate sensitive liabilities, generally will result in the net interest margin increasing in a rising rate environment and decreasing in a falling rate environment. A negative gap (liability sensitive) will generally have the opposite results on the net interest margin. To reflect anticipated prepayments, certain asset and liability categories are shown in the table using estimated cash flows rather than contractual cash flows. The Company employs interest rate floors in certain variable rate loans to enhance the yield on those loans at times when market interest rates are extraordinarily low. The degree of asset sensitivity, spreads on loans and net interest margin may be reduced until rates increase by an amount sufficient to eliminate the effects of floors. The adverse effect of floors as market rates increase may also be offset by the positive gap, the extent to which rates on deposits and other funding sources lag increasing market rates for loans and changes in composition of funding.
54
Interest Rate Sensitivity Gap Analysis
December 31, 20192020
| (in thousands) | 0-3 mo Balance | 4-12 mo Balance | 1-3 yr Balance | 3+ yr Balance | Total Balance | ||||||||||||||||||||||||
| Assets: | |||||||||||||||||||||||||||||
| Interest-bearing deposits in other banks, federal funds sold and securities purchased under resale agreements | $ | 9,032,807 | $ | — | $ | — | $ | — | $ | 9,032,807 | |||||||||||||||||||
| Investment securities(1) | 46,444 | 1,724 | 605 | 3,148,197 | 3,196,970 | ||||||||||||||||||||||||
| Total variable loans | 21,278,748 | 62,769 | 28,117 | 267,871 | 21,637,505 | ||||||||||||||||||||||||
| Total fixed loans | 237,836 | 1,239,653 | 877,452 | 792,549 | 3,147,490 | ||||||||||||||||||||||||
| Total loans(2) | 21,516,584 | 1,302,422 | 905,569 | 1,060,420 | 24,784,995 | ||||||||||||||||||||||||
| Total interest sensitive assets | $ | 30,595,835 | $ | 1,304,146 | $ | 906,174 | $ | 4,208,617 | $ | 37,014,772 | |||||||||||||||||||
| Liabilities: | |||||||||||||||||||||||||||||
| Interest-bearing customer deposits | $ | 16,016,123 | $ | — | $ | — | $ | — | $ | 16,016,123 | |||||||||||||||||||
| CDs & IRAs | 166,858 | 352,776 | 71,782 | 4,929 | 596,345 | ||||||||||||||||||||||||
| Traditional brokered deposits | 286,736 | 511,188 | 845,250 | — | 1,643,174 | ||||||||||||||||||||||||
| Total interest-bearing deposits | 16,469,717 | 863,964 | 917,032 | 4,929 | 18,255,642 | ||||||||||||||||||||||||
| Repurchase agreements, federal funds purchased, FHLB borrowings | 3,111,751 | — | — | — | 3,111,751 | ||||||||||||||||||||||||
| Subordinated notes | — | — | — | 282,490 | 282,490 | ||||||||||||||||||||||||
| Trust preferred subordinated debentures | — | — | — | 113,406 | 113,406 | ||||||||||||||||||||||||
| Total borrowings | 3,111,751 | — | — | 395,896 | 3,507,647 | ||||||||||||||||||||||||
| Total interest sensitive liabilities | $ | 19,581,468 | $ | 863,964 | $ | 917,032 | $ | 400,825 | $ | 21,763,289 | |||||||||||||||||||
| GAP | $ | 11,014,367 | $ | 440,182 | $ | (10,858) | $ | 3,807,792 | $ | — | |||||||||||||||||||
| Cumulative GAP | $ | 11,014,367 | $ | 11,454,549 | $ | 11,443,691 | $ | 15,251,483 | $ | 15,251,483 | |||||||||||||||||||
| Demand deposits | 12,740,947 | ||||||||||||||||||||||||||||
| Stockholders’ equity | 2,871,224 | ||||||||||||||||||||||||||||
| Total | $ | 15,612,171 | |||||||||||||||||||||||||||
(1)Investment securities based on fair market value.
(2)Total loans includes loans held for investments, stated at gross, and loans held for sale.
| (in thousands) | 0-3 mo Balance | 4-12 mo Balance | 1-3 yr Balance | 3+ yr Balance | Total Balance | ||||||||||||||
| Assets: | |||||||||||||||||||
| Interest-bearing deposits in other banks, federal funds sold and securities purchased under resale agreements | $ | 4,263,766 | $ | — | $ | — | $ | — | $ | 4,263,766 | |||||||||
| Investment securities(1) | 27,021 | 2,680 | 352 | 209,818 | 239,871 | ||||||||||||||
| Total variable loans | 23,716,946 | 173,143 | 32,628 | 316,084 | 24,238,801 | ||||||||||||||
| Total fixed loans | 259,483 | 1,296,845 | 300,767 | 1,217,880 | 3,074,975 | ||||||||||||||
| Total loans(2) | 23,976,429 | 1,469,988 | 333,395 | 1,533,964 | 27,313,776 | ||||||||||||||
| Total interest sensitive assets | $ | 28,267,216 | $ | 1,472,668 | $ | 333,747 | $ | 1,743,782 | $ | 31,817,413 | |||||||||
| Liabilities: | |||||||||||||||||||
| Interest-bearing customer deposits | $ | 14,169,103 | $ | — | $ | — | $ | — | $ | 14,169,103 | |||||||||
| CDs & IRAs | 229,827 | 268,614 | 55,923 | 4,889 | 559,253 | ||||||||||||||
| Traditional brokered deposits | 400,000 | 1,911,778 | — | — | 2,311,778 | ||||||||||||||
| Total interest-bearing deposits | 14,798,930 | 2,180,392 | 55,923 | 4,889 | 17,040,134 | ||||||||||||||
| Repurchase agreements, federal funds purchased, FHLB borrowings | 2,541,766 | — | — | — | 2,541,766 | ||||||||||||||
| Subordinated notes | — | — | — | 282,129 | 282,129 | ||||||||||||||
| Trust preferred subordinated debentures | — | — | — | 113,406 | 113,406 | ||||||||||||||
| Total borrowings | 2,541,766 | — | — | 395,535 | 2,937,301 | ||||||||||||||
| Total interest sensitive liabilities | $ | 17,340,696 | $ | 2,180,392 | $ | 55,923 | $ | 400,424 | $ | 19,977,435 | |||||||||
| GAP | $ | 10,926,520 | $ | (707,724 | ) | $ | 277,824 | $ | 1,343,358 | $ | — | ||||||||
| Cumulative GAP | $ | 10,926,520 | $ | 10,218,796 | $ | 10,496,620 | $ | 11,839,978 | $ | 11,839,978 | |||||||||
| Demand deposits | 9,438,459 | ||||||||||||||||||
| Stockholders’ equity | 2,832,258 | ||||||||||||||||||
| Total | $ | 12,270,717 | |||||||||||||||||
55
While a gap interest table is useful in analyzing interest rate sensitivity, an interest rate sensitivity simulation provides a better illustration of the sensitivity of earnings to changes in interest rates. Earnings are also affected by the effects of changing interest rates on the value of funding derived from demand deposits and stockholders’ equity. We perform a sensitivity analysis to identify interest rate risk exposure on net interest income. We quantify and measure interest rate risk exposure using a model to dynamically simulate the effect of changes in net interest income relative to changes in interest rates over the next twelve months based on three interest rate scenarios. These are a static rate scenario and two “shock test” scenarios.
These scenarios are based on interest rates as of the last day of a reporting period published by independent sources and incorporate relevant spreads of instruments that are actively traded in the open market. The Federal Reserve’s federal funds target affects short-term borrowing; the prime lending rate and LIBOR are the basis for most of our variable-rate loan pricing. The 10-year treasury rate is also monitored because of its effect on prepayment speeds for mortgage-backed securities and MSRs. These are our primary interest rate exposures. We are currently not using derivatives to manage our interest rate exposure, except for MSRs, although we may do so in the future if that appears advisable.
For modeling purposes, the “shock test” scenarios as of December 31, 2019 assume immediate, sustained 100 and 200 basis point increases in interest rates and a 100 basis point decrease in interest rates. As short-term rates have declined during 2020, we do not believe that analysis of an assumed decrease in interest rates would provide meaningful results. As such, the scenarios as of December 31, 2020 assume immediate, sustained 100 and 200 basis point increases only. We will continue to evaluate these scenarios as interest rates change, until short-term rates rise above 3.0%, at which point we will resume evaluations of shock scenarios in which interest rates decrease.
Our interest rate risk exposure model incorporates assumptions regarding the level of interest rate on indeterminable maturity deposits (demand deposits, interest-bearing transaction accounts and savings accounts) for a given level of market rate change. In the current environment of decreasing short-term rates, deposit pricing can vary by product and customer. These assumptions have been developed through a combination of historical analysis and projection of future expected pricing behavior. Changes in prepayment behavior of mortgage-backed securities, residential and commercial mortgage loans in each rate environment are captured using industry estimates of prepayment speeds for various coupon segments of the portfolio. The impact of these changes is factored into the simulation model. This modeling indicated interest rate sensitivity as follows:
Anticipated Impact Over the Next Twelve Months as Compared to Most Likely Scenario | Anticipated Impact Over the Next Twelve Months as Compared to Most Likely Scenario | |||||||||||||||||||||||||||||||||||||||||||||||||||||||||
| December 31, 2019 | December 31, 2018 | December 31, 2020 | December 31, 2019 | |||||||||||||||||||||||||||||||||||||||||||||||||||||||
| (in thousands) | 100 bps Increase | 200 bps Increase | 100 bps Decrease | 100 bps Increase | 200 bps Increase | 100 bps Decrease | (in thousands) | 100 bps Increase | 200 bps Increase | 100 bps Increase | 200 bps Increase | 100 bps Decrease | ||||||||||||||||||||||||||||||||||||||||||||||
| Change in net interest income | $ | 93,290 | $ | 187,968 | $ | (81,988 | ) | $ | 101,888 | $ | 204,279 | $ | (105,505 | ) | Change in net interest income | $ | 35,286 | $ | 87,613 | $ | 93,290 | $ | 187,968 | $ | (81,988) | |||||||||||||||||||||||||||||||||
The simulations used to manage market risk are based on numerous assumptions regarding the effect of changes in interest rates on the timing and extent of repricing characteristics, future cash flows and customer behavior. These assumptions are inherently uncertain and, as a result, the model cannot precisely estimate net interest income or precisely predict the impact of higher or lower interest rates on net interest income. Actual results will differ from simulated results due to timing, magnitude and frequency of interest rate changes as well as changes in market conditions, customer behavior and management strategies, among other factors.
Our business relies upon a large volume of loans, derivative contracts and other financial instruments with attributes that are either directly or indirectly dependent on LIBOR to establish their interest rate and/or value. In 2017, the U.K. Financial Conduct Authority announced that it would no longer compel banks to submit rates for the calculation of LIBOR after 2021. The administrator of LIBOR has proposed to extend publication of the most commonly used U.S. Dollar LIBOR settings to June 30, 2023 and to cease publishing other LIBOR settings on December 31, 2021. The U.S. federal banking agencies issued guidance strongly encouraging banking organizations to cease using U.S. dollar LIBOR as a reference rate in new contracts as soon as practicable and in any event by December 31, 2021. It is not possible to know whether LIBOR will continue to be viewed as an acceptable market benchmark, what rate or rates may become accepted alternatives to LIBOR or what the effect of any such changes in views or alternatives may have on the financial markets for LIBOR-linked financial instruments. The full impact of alternatives to LIBOR on the valuations, pricing and operation of our financial instruments is not yet known; however, the primary instruments that may be impacted include loans, securities, borrowings and derivatives indexed to LIBOR that mature after December 31, 2021. We have established a working group, consisting of key stakeholders from throughout the company, to monitor developments relating to LIBOR uncertainty and changes and to guide the Bank's response. This team is currently working to gain an understandingensure that our technology systems are prepared for the transition, our loan documents that reference LIBOR-based rates have been appropriately amended to reference other methods of interest rate determinations and internal and external stakeholders are apprised of the specific products, information technology systems, borrowing arrangements and legal agreements that will be impacted by the change.transition.
56
Index to Consolidated Financial Statements
Page Reference | |||||
57
Report of Ernst & Young LLP, Independent Registered Public Accounting Firm
To the ShareholdersStockholders and the Board of Directors of Texas Capital Bancshares, Inc.
Opinion on the Financial Statements
We have audited the accompanying consolidated balance sheets of Texas Capital Bancshares, Inc. (the Company) as of December 31, 20192020 and 2018,2019, the related consolidated statements of income and other comprehensive income, shareholders'stockholders' equity and cash flows for each of the three years in the period ended December 31, 2019,2020, and the related notes (collectively referred to as “the consolidatedthe “consolidated financial statements”). In our opinion, the consolidated financial statements present fairly, in all material respects, the financial position of the Company at December 31, 20192020 and 2018,2019, and the results of its operations and its cash flows for each of the three years in the period ended December 31, 2019,2020, in conformity with U.S. generally accepted accounting principles.
We also have audited, in accordance with the standards of the Public Company Accounting Oversight Board (United States) (PCAOB), the Company's internal control over financial reporting as of December 31, 2019,2020, based on criteria established in Internal Control-Integrated Framework issued by the Committee of Sponsoring Organizations of the Treadway Commission (2013 framework), and our report dated February 12, 20209, 2021 expressed an unqualified opinion thereon.
Adoption of new accounting standard
As discussed in Note 1 to the consolidated financial statements, the Company changed its method for accounting for credit losses in 2020. As explained below, auditing the Company’s allowance for credit losses, including adoption of the new accounting guidance related to the estimate of allowance for credit losses, was a critical audit matter.
Basis for Opinion
These financial statements are the responsibility of the Company's management. Our responsibility is to express an opinion on the Company’s financial statements based on our audits. We are a public accounting firm registered with the PCAOB and are required to be independent with respect to the Company in accordance with the U.S. federal securities laws and the applicable rules and regulations of the Securities and Exchange Commission and the PCAOB.
We conducted our audits in accordance with the standards of the PCAOB. Those standards require that we plan and perform the audit to obtain reasonable assurance about whether the financial statements are free of material misstatement, whether due to error or fraud. Our audits included performing procedures to assess the risks of material misstatement of the financial statements, whether due to error or fraud, and performing procedures that respond to those risks. Such procedures included examining, on a test basis, evidence regarding the amounts and disclosures in the financial statements. Our audits also included evaluating the accounting principles used and significant estimates made by management, as well as evaluating the overall presentation of the financial statements. We believe that our audits provide a reasonable basis for our opinion.
Critical Audit Matter
The critical audit matter communicated below is a matter arising from the current period audit of the financial statements that was communicated or required to be communicated to the audit committee and that: (1) relates to accounts or disclosures that are material to the financial statements and (2) involved our especially challenging, subjective or complex judgments. The communication of the critical audit matter does not alter in any way our opinion on the consolidated financial statements, taken as a whole, and we are not, by communicating the critical audit matter below, providing a separate opinion on the critical audit matter or on the accountsaccount or disclosuredisclosures to which it relates.
58
| Allowance for | |||||
| Description of the Matter | The Company’s loans held for investment Auditing management’s estimate of the | ||||
| How We Addressed the Matter in Our Audit | Our considerations and procedures performed included evaluation of the process utilized by management to challenge the model results and determine the best estimate of the ACL as of the balance sheet date. We obtained an understanding of the Company’s process for establishing the ACL, including determination of the qualitative factors and reserve assumptions for loans evaluated on an individual basis. We evaluated the design and tested the operating effectiveness of the We performed specific substantive tests of the | ||||

We have served as the Company's auditor since 1999.
Dallas, TX
February 12, 20209, 2021
59
TEXAS CAPITAL BANCSHARES, INC.
CONSOLIDATED BALANCE SHEETS
| December 31, | December 31, | |||||||||||||||||
| (in thousands except per share data) | 2019 | 2018 | (in thousands except per share data) | 2020 | 2019 | |||||||||||||
| Assets | Assets | |||||||||||||||||
| Cash and due from banks | $ | 161,817 | $ | 214,191 | Cash and due from banks | $ | 173,573 | $ | 161,817 | |||||||||
| Interest-bearing deposits in other banks | 4,233,766 | 2,815,684 | Interest-bearing deposits in other banks | 9,032,807 | 4,233,766 | |||||||||||||
| Federal funds sold and securities purchased under resale agreements | 30,000 | 50,190 | Federal funds sold and securities purchased under resale agreements | 0 | 30,000 | |||||||||||||
| Investment securities | 239,871 | 120,216 | Investment securities | 3,196,970 | 239,871 | |||||||||||||
| Loans held for sale ($2,571.3 million and $1,969.2 million at December 2019 and 2018, respectively, at fair value) | 2,577,134 | 1,969,474 | ||||||||||||||||
| Loans held for sale ($239.1 million and $2,571.3 million at December 2020 and 2019, respectively, at fair value) | Loans held for sale ($239.1 million and $2,571.3 million at December 2020 and 2019, respectively, at fair value) | 283,165 | 2,577,134 | |||||||||||||||
| Loans held for investment, mortgage finance | 8,169,849 | 5,877,524 | Loans held for investment, mortgage finance | 9,079,409 | 8,169,849 | |||||||||||||
| Loans held for investment (net of unearned income) | 16,476,413 | 16,690,550 | Loans held for investment (net of unearned income) | 15,351,451 | 16,476,413 | |||||||||||||
| Less: Allowance for loan losses | 195,047 | 191,522 | ||||||||||||||||
| Less: Allowance for credit losses on loans | Less: Allowance for credit losses on loans | 254,615 | 195,047 | |||||||||||||||
| Loans held for investment, net | 24,451,215 | 22,376,552 | Loans held for investment, net | 24,176,245 | 24,451,215 | |||||||||||||
| Mortgage servicing rights, net | 64,904 | 42,474 | Mortgage servicing rights, net | 105,424 | 64,904 | |||||||||||||
| Premises and equipment, net | 31,212 | 23,802 | Premises and equipment, net | 24,546 | 31,212 | |||||||||||||
| Accrued interest receivable and other assets | 740,051 | 626,614 | Accrued interest receivable and other assets | 715,699 | 740,051 | |||||||||||||
| Goodwill and intangible assets, net | 18,099 | 18,570 | Goodwill and intangible assets, net | 17,667 | 18,099 | |||||||||||||
| Total assets | $ | 32,548,069 | $ | 28,257,767 | Total assets | $ | 37,726,096 | $ | 32,548,069 | |||||||||
| Liabilities and Stockholders’ Equity | Liabilities and Stockholders’ Equity | |||||||||||||||||
| Liabilities: | Liabilities: | |||||||||||||||||
| Deposits: | Deposits: | |||||||||||||||||
| Non-interest-bearing | $ | 9,438,459 | $ | 7,317,161 | Non-interest-bearing | $ | 12,740,947 | $ | 9,438,459 | |||||||||
| Interest-bearing | 17,040,134 | 13,288,952 | Interest-bearing | 18,255,642 | 17,040,134 | |||||||||||||
| Total deposits | 26,478,593 | 20,606,113 | Total deposits | 30,996,589 | 26,478,593 | |||||||||||||
| Accrued interest payable | 12,760 | 20,675 | Accrued interest payable | 11,150 | 12,760 | |||||||||||||
| Other liabilities | 287,157 | 194,238 | Other liabilities | 339,486 | 318,094 | |||||||||||||
| Federal funds purchased and repurchase agreements | 141,766 | 641,174 | Federal funds purchased and repurchase agreements | 111,751 | 141,766 | |||||||||||||
| Other borrowings | 2,400,000 | 3,900,000 | Other borrowings | 3,000,000 | 2,400,000 | |||||||||||||
| Subordinated notes, net | 282,129 | 281,767 | Subordinated notes, net | 282,490 | 282,129 | |||||||||||||
| Trust preferred subordinated debentures | 113,406 | 113,406 | Trust preferred subordinated debentures | 113,406 | 113,406 | |||||||||||||
| Total liabilities | 29,715,811 | 25,757,373 | Total liabilities | 34,854,872 | 29,746,748 | |||||||||||||
| Stockholders’ equity: | Stockholders’ equity: | |||||||||||||||||
| Preferred stock, $.01 par value, $1,000 liquidation value: | ||||||||||||||||||
| Preferred stock, $0.01 par value, $1,000 liquidation value: | Preferred stock, $0.01 par value, $1,000 liquidation value: | |||||||||||||||||
| Authorized shares—10,000,000 | Authorized shares—10,000,000 | |||||||||||||||||
| Issued shares—6,000,000 shares issued at December 31, 2019 and 2018 | 150,000 | 150,000 | ||||||||||||||||
| Common stock, $.01 par value: | ||||||||||||||||||
| Issued shares—6,000,000 shares issued at December 31, 2020 and 2019 | Issued shares—6,000,000 shares issued at December 31, 2020 and 2019 | 150,000 | 150,000 | |||||||||||||||
| Common stock, $0.01 par value: | Common stock, $0.01 par value: | |||||||||||||||||
| Authorized shares—100,000,000 | Authorized shares—100,000,000 | |||||||||||||||||
| Issued shares—50,338,158 and 50,201,127 at December 31, 2019 and 2018, respectively | 503 | 502 | ||||||||||||||||
| Issued shares—50,470,867 and 50,338,158 at December 31, 2020 and 2019, respectively | Issued shares—50,470,867 and 50,338,158 at December 31, 2020 and 2019, respectively | 504 | 503 | |||||||||||||||
| Additional paid-in capital | 978,205 | 967,890 | Additional paid-in capital | 991,898 | 978,205 | |||||||||||||
| Retained earnings | 1,694,608 | 1,381,492 | Retained earnings | 1,713,056 | 1,663,671 | |||||||||||||
| Treasury stock (shares at cost: 417 at December 31, 2019 and 2018) | (8 | ) | (8 | ) | ||||||||||||||
| Treasury stock (shares at cost: 417 at December 31, 2020 and 2019) | Treasury stock (shares at cost: 417 at December 31, 2020 and 2019) | (8) | (8) | |||||||||||||||
| Accumulated other comprehensive income, net of taxes | 8,950 | 518 | Accumulated other comprehensive income, net of taxes | 15,774 | 8,950 | |||||||||||||
| Total stockholders’ equity | 2,832,258 | 2,500,394 | Total stockholders’ equity | 2,871,224 | 2,801,321 | |||||||||||||
| Total liabilities and stockholders’ equity | $ | 32,548,069 | $ | 28,257,767 | Total liabilities and stockholders’ equity | $ | 37,726,096 | $ | 32,548,069 | |||||||||
See accompanying notes to consolidated financial statements.
60
TEXAS CAPITAL BANCSHARES, INC.
CONSOLIDATED STATEMENTS OF INCOME AND OTHER
COMPREHENSIVE INCOME
See accompanying notes to consolidated financial statements.
| Year ended December 31, | Year ended December 31, | |||||||||||||||||||||||||||
| (in thousands except per share data) | 2019 | 2018 | 2017 | (in thousands except per share data) | 2020 | 2019 | 2018 | |||||||||||||||||||||
| Interest income | Interest income | |||||||||||||||||||||||||||
| Interest and fees on loans | $ | 1,284,036 | $ | 1,124,970 | $ | 846,292 | Interest and fees on loans | $ | 1,011,175 | $ | 1,284,036 | $ | 1,124,970 | |||||||||||||||
| Investment securities | 8,654 | 2,834 | 1,066 | Investment securities | 17,475 | 8,654 | 2,834 | |||||||||||||||||||||
| Federal funds sold and securities purchased under resale agreements | 1,529 | 3,792 | 2,542 | Federal funds sold and securities purchased under resale agreements | 693 | 1,529 | 3,792 | |||||||||||||||||||||
| Interest-bearing deposits in other banks | 71,093 | 32,597 | 29,399 | Interest-bearing deposits in other banks | 27,569 | 71,093 | 32,597 | |||||||||||||||||||||
| Total interest income | 1,365,312 | 1,164,193 | 879,299 | Total interest income | 1,056,912 | 1,365,312 | 1,164,193 | |||||||||||||||||||||
| Interest expense | Interest expense | |||||||||||||||||||||||||||
| Deposits | 293,537 | 185,116 | 79,886 | Deposits | 146,117 | 293,537 | 185,116 | |||||||||||||||||||||
| Federal funds purchased | 11,872 | 6,531 | 2,592 | Federal funds purchased | 1,083 | 11,872 | 6,531 | |||||||||||||||||||||
| Other borrowings | 58,393 | 36,207 | 15,137 | Other borrowings | 20,923 | 58,393 | 36,207 | |||||||||||||||||||||
| Subordinated notes | 16,764 | 16,764 | 16,764 | Subordinated notes | 16,764 | 16,764 | 16,764 | |||||||||||||||||||||
| Trust preferred subordinated debentures | 5,026 | 4,715 | 3,592 | Trust preferred subordinated debentures | 3,199 | 5,026 | 4,715 | |||||||||||||||||||||
| Total interest expense | 385,592 | 249,333 | 117,971 | Total interest expense | 188,086 | 385,592 | 249,333 | |||||||||||||||||||||
| Net interest income | 979,720 | 914,860 | 761,328 | Net interest income | 868,826 | 979,720 | 914,860 | |||||||||||||||||||||
| Provision for credit losses | 75,000 | 87,000 | 44,000 | Provision for credit losses | 258,000 | 75,000 | 87,000 | |||||||||||||||||||||
| Net interest income after provision for credit losses | 904,720 | 827,860 | 717,328 | Net interest income after provision for credit losses | 610,826 | 904,720 | 827,860 | |||||||||||||||||||||
| Non-interest income | Non-interest income | |||||||||||||||||||||||||||
| Service charges on deposit accounts | 11,320 | 12,787 | 12,432 | Service charges on deposit accounts | 11,620 | 11,320 | 12,787 | |||||||||||||||||||||
| Wealth management and trust fee income | 8,810 | 8,148 | 6,153 | Wealth management and trust fee income | 9,998 | 8,810 | 8,148 | |||||||||||||||||||||
| Brokered loan fees | 29,738 | 22,532 | 23,331 | Brokered loan fees | 46,423 | 29,738 | 22,532 | |||||||||||||||||||||
| Servicing income | 13,439 | 18,307 | 15,657 | Servicing income | 27,029 | 13,439 | 18,307 | |||||||||||||||||||||
| Swap fees | 4,387 | 5,625 | 3,990 | Swap fees | 5,182 | 4,387 | 5,625 | |||||||||||||||||||||
| Net gain/(loss) on sale of loans held for sale | (20,259 | ) | (15,934 | ) | (2,387 | ) | Net gain/(loss) on sale of loans held for sale | 58,026 | (20,259) | (15,934) | ||||||||||||||||||
| Other | 45,005 | 26,559 | 15,080 | Other | 27,238 | 45,005 | 26,559 | |||||||||||||||||||||
| Total non-interest income | 92,440 | 78,024 | 74,256 | Total non-interest income | 185,516 | 92,440 | 78,024 | |||||||||||||||||||||
| Non-interest expense | Non-interest expense | |||||||||||||||||||||||||||
| Salaries and employee benefits | 315,080 | 291,768 | 264,231 | Salaries and employee benefits | 340,529 | 328,483 | 300,899 | |||||||||||||||||||||
| Net occupancy expense | 32,989 | 30,342 | 25,811 | Net occupancy expense | 34,955 | 32,989 | 30,342 | |||||||||||||||||||||
| Marketing | 53,355 | 39,335 | 26,787 | Marketing | 23,581 | 53,355 | 39,335 | |||||||||||||||||||||
| Legal and professional | 53,830 | 42,990 | 29,731 | Legal and professional | 52,132 | 52,460 | 42,990 | |||||||||||||||||||||
| Communications and technology | 44,826 | 30,056 | 31,004 | Communications and technology | 103,054 | 44,826 | 30,056 | |||||||||||||||||||||
| FDIC insurance assessment | 20,093 | 24,307 | 23,510 | FDIC insurance assessment | 25,955 | 20,093 | 24,307 | |||||||||||||||||||||
| Servicing related expenses | 22,573 | 14,934 | 15,506 | |||||||||||||||||||||||||
| Allowance and other carrying costs for other real estate owned | 7 | 474 | 6,437 | |||||||||||||||||||||||||
| Servicing-related expenses | Servicing-related expenses | 64,625 | 22,573 | 14,934 | ||||||||||||||||||||||||
| Merger-related expenses | Merger-related expenses | 17,756 | 1,370 | 0 | ||||||||||||||||||||||||
| Other | 47,246 | 50,890 | 42,859 | Other | 41,809 | 44,701 | 49,670 | |||||||||||||||||||||
| Total non-interest expense | 589,999 | 525,096 | 465,876 | Total non-interest expense | 704,396 | 600,850 | 532,533 | |||||||||||||||||||||
| Income before income taxes | 407,161 | 380,788 | 325,708 | Income before income taxes | 91,946 | 396,310 | 373,351 | |||||||||||||||||||||
| Income tax expense | 84,295 | 79,964 | 128,645 | Income tax expense | 25,657 | 84,295 | 79,964 | |||||||||||||||||||||
| Net income | 322,866 | 300,824 | 197,063 | Net income | 66,289 | 312,015 | 293,387 | |||||||||||||||||||||
| Preferred stock dividends | 9,750 | 9,750 | 9,750 | Preferred stock dividends | 9,750 | 9,750 | 9,750 | |||||||||||||||||||||
| Net income available to common stockholders | $ | 313,116 | $ | 291,074 | $ | 187,313 | Net income available to common stockholders | $ | 56,539 | $ | 302,265 | $ | 283,637 | |||||||||||||||
| Other comprehensive income (loss) | ||||||||||||||||||||||||||||
| Other comprehensive income | Other comprehensive income | |||||||||||||||||||||||||||
| Change in unrealized gain (loss) on available-for-sale debt securities arising during period, before tax | $ | 10,674 | $ | 7 | $ | 19 | Change in unrealized gain (loss) on available-for-sale debt securities arising during period, before tax | $ | 8,639 | $ | 10,674 | $ | 7 | |||||||||||||||
| Income tax expense (benefit) related to unrealized loss on available-for-sale debt securities | 2,242 | 1 | 6 | |||||||||||||||||||||||||
| Other comprehensive income (loss), net of tax | 8,432 | 6 | 13 | |||||||||||||||||||||||||
| Income tax expense/(benefit) | Income tax expense/(benefit) | 1,815 | 2,242 | 1 | ||||||||||||||||||||||||
| Other comprehensive income, net of tax | Other comprehensive income, net of tax | 6,824 | 8,432 | 6 | ||||||||||||||||||||||||
| Comprehensive income | $ | 331,298 | $ | 300,830 | $ | 197,076 | Comprehensive income | $ | 73,113 | $ | 320,447 | $ | 293,393 | |||||||||||||||
| Basic earnings per common share | $ | 6.23 | $ | 5.83 | $ | 3.78 | Basic earnings per common share | $ | 1.12 | $ | 6.01 | $ | 5.68 | |||||||||||||||
| Diluted earnings per common share | $ | 6.21 | $ | 5.79 | $ | 3.73 | Diluted earnings per common share | $ | 1.12 | $ | 5.99 | $ | 5.64 | |||||||||||||||
61
TEXAS CAPITAL BANCSHARES, INC.
CONSOLIDATED STATEMENTS OF STOCKHOLDERS’ EQUITY
| Preferred Stock | Common Stock | Additional | Treasury Stock | Accumulated Other | |||||||||||||||||||||||||||||||||||||||||||||||||||||||
| Paid-in | Retained | Comprehensive | |||||||||||||||||||||||||||||||||||||||||||||||||||||||||
| (in thousands except share data) | Shares | Amount | Shares | Amount | Capital | Earnings | Shares | Amount | Income | Total | |||||||||||||||||||||||||||||||||||||||||||||||||
| Balance at December 31, 2017 | 6,000,000 | $ | 150,000 | 49,643,761 | $ | 496 | $ | 961,305 | $ | 1,077,851 | (417) | $ | (8) | $ | 428 | $ | 2,190,072 | ||||||||||||||||||||||||||||||||||||||||||
| Impact of adoption of new accounting standards(1) | — | — | — | — | — | (82) | — | — | 84 | 2 | |||||||||||||||||||||||||||||||||||||||||||||||||
| Comprehensive income: | |||||||||||||||||||||||||||||||||||||||||||||||||||||||||||
| Net income | — | — | — | — | — | 293,387 | — | — | — | 293,387 | |||||||||||||||||||||||||||||||||||||||||||||||||
| Change in unrealized gain (loss) on available-for-sale debt securities, net of taxes | — | — | — | — | — | — | — | — | 6 | 6 | |||||||||||||||||||||||||||||||||||||||||||||||||
| Total comprehensive income | 293,393 | ||||||||||||||||||||||||||||||||||||||||||||||||||||||||||
| Stock-based compensation expense recognized in earnings | — | — | — | — | 8,973 | — | — | — | — | 8,973 | |||||||||||||||||||||||||||||||||||||||||||||||||
| Preferred stock dividend | — | — | — | — | — | (9,750) | — | — | — | (9,750) | |||||||||||||||||||||||||||||||||||||||||||||||||
| Issuance of stock related to stock-based awards | — | — | 120,242 | 1 | (2,383) | — | — | — | — | (2,382) | |||||||||||||||||||||||||||||||||||||||||||||||||
| Issuance of common stock related to warrants | — | — | 437,124 | 5 | (5) | — | — | — | — | 0 | |||||||||||||||||||||||||||||||||||||||||||||||||
| Balance at December 31, 2018 | 6,000,000 | $ | 150,000 | 50,201,127 | $ | 502 | $ | 967,890 | $ | 1,361,406 | (417) | $ | (8) | $ | 518 | $ | 2,480,308 | ||||||||||||||||||||||||||||||||||||||||||
| Comprehensive income: | |||||||||||||||||||||||||||||||||||||||||||||||||||||||||||
| Net income | — | — | — | — | — | 312,015 | — | — | — | 312,015 | |||||||||||||||||||||||||||||||||||||||||||||||||
| Change in unrealized gain (loss) on available-for-sale debt securities, net of taxes | — | — | — | — | — | — | — | — | 8,432 | 8,432 | |||||||||||||||||||||||||||||||||||||||||||||||||
| Total comprehensive income | 320,447 | ||||||||||||||||||||||||||||||||||||||||||||||||||||||||||
| Stock-based compensation expense recognized in earnings | — | — | — | — | 11,775 | — | — | — | — | 11,775 | |||||||||||||||||||||||||||||||||||||||||||||||||
| Preferred stock dividend | — | — | — | — | — | (9,750) | — | — | — | (9,750) | |||||||||||||||||||||||||||||||||||||||||||||||||
| Issuance of stock related to stock-based awards | — | — | 128,263 | 1 | (1,460) | — | — | — | — | (1,459) | |||||||||||||||||||||||||||||||||||||||||||||||||
| Issuance of common stock related to warrants | — | — | 8,768 | 0 | 0 | — | — | — | — | 0 | |||||||||||||||||||||||||||||||||||||||||||||||||
| Balance at December 31, 2019 | 6,000,000 | $ | 150,000 | 50,338,158 | $ | 503 | $ | 978,205 | $ | 1,663,671 | (417) | $ | (8) | $ | 8,950 | $ | 2,801,321 | ||||||||||||||||||||||||||||||||||||||||||
| Impact of adoption of new accounting standards(2) | — | — | — | — | — | (7,154) | — | — | 0 | (7,154) | |||||||||||||||||||||||||||||||||||||||||||||||||
| Comprehensive income: | |||||||||||||||||||||||||||||||||||||||||||||||||||||||||||
| Net income | — | — | — | — | — | 66,289 | — | — | — | 66,289 | |||||||||||||||||||||||||||||||||||||||||||||||||
| Change in unrealized gain (loss) on available-for-sale debt securities, net of taxes | — | — | — | — | — | — | — | — | 6,824 | 6,824 | |||||||||||||||||||||||||||||||||||||||||||||||||
| Total comprehensive income | 73,113 | ||||||||||||||||||||||||||||||||||||||||||||||||||||||||||
| Stock-based compensation expense recognized in earnings | — | — | — | — | 15,681 | — | — | — | — | 15,681 | |||||||||||||||||||||||||||||||||||||||||||||||||
| Preferred stock dividend | — | — | — | — | — | (9,750) | — | — | — | (9,750) | |||||||||||||||||||||||||||||||||||||||||||||||||
| Issuance of stock related to stock-based awards | — | — | 132,709 | 1 | (1,988) | — | — | — | — | (1,987) | |||||||||||||||||||||||||||||||||||||||||||||||||
| Balance at December 31, 2020 | 6,000,000 | $ | 150,000 | 50,470,867 | $ | 504 | $ | 991,898 | $ | 1,713,056 | (417) | $ | (8) | $ | 15,774 | $ | 2,871,224 | ||||||||||||||||||||||||||||||||||||||||||
| Preferred Stock | Common Stock | Additional | Treasury Stock | Accumulated Other | ||||||||||||||||||||||||||||||||
| Paid-in | Retained | Comprehensive | ||||||||||||||||||||||||||||||||||
| (in thousands except share data) | Shares | Amount | Shares | Amount | Capital | Earnings | Shares | Amount | Income | Total | ||||||||||||||||||||||||||
| Balance at December 31, 2016 | 6,000,000 | $ | 150,000 | 49,504,079 | $ | 495 | $ | 955,468 | $ | 903,187 | (417 | ) | $ | (8 | ) | $ | 415 | $ | 2,009,557 | |||||||||||||||||
| Comprehensive income: | ||||||||||||||||||||||||||||||||||||
| Net income | — | — | — | — | — | 197,063 | — | — | — | 197,063 | ||||||||||||||||||||||||||
| Change in unrealized gain (loss) on available-for-sale debt securities, net of taxes of $6 | — | — | — | — | — | — | — | — | 13 | 13 | ||||||||||||||||||||||||||
| Total comprehensive income | 197,076 | |||||||||||||||||||||||||||||||||||
| Stock-based compensation expense recognized in earnings | — | — | — | — | 8,079 | — | — | — | — | 8,079 | ||||||||||||||||||||||||||
| Preferred stock dividend | — | — | — | — | — | (9,750 | ) | — | — | — | (9,750 | ) | ||||||||||||||||||||||||
| Issuance of stock related to stock-based awards | — | — | 106,087 | 1 | (2,242 | ) | — | — | — | — | (2,241 | ) | ||||||||||||||||||||||||
| Issuance of common stock related to warrants | — | — | 33,595 | — | — | — | — | — | — | — | ||||||||||||||||||||||||||
| Balance at December 31, 2017 | 6,000,000 | 150,000 | 49,643,761 | 496 | 961,305 | 1,090,500 | (417 | ) | (8 | ) | 428 | 2,202,721 | ||||||||||||||||||||||||
| Impact of adoption of new accounting standards(1) | — | — | — | — | — | (82 | ) | — | — | 84 | 2 | |||||||||||||||||||||||||
| Comprehensive income: | ||||||||||||||||||||||||||||||||||||
| Net income | — | — | — | — | — | 300,824 | — | — | — | 300,824 | ||||||||||||||||||||||||||
| Change in unrealized gain (loss) on available-for-sale debt securities, net of taxes of $1 | — | — | — | — | — | — | — | — | 6 | 6 | ||||||||||||||||||||||||||
| Total comprehensive income | 300,830 | |||||||||||||||||||||||||||||||||||
| Stock-based compensation expense recognized in earnings | — | — | — | — | 8,973 | — | — | — | — | 8,973 | ||||||||||||||||||||||||||
| Preferred stock dividend | — | — | — | — | — | (9,750 | ) | — | — | — | (9,750 | ) | ||||||||||||||||||||||||
| Issuance of stock related to stock-based awards | — | — | 120,242 | 1 | (2,383 | ) | — | — | — | — | (2,382 | ) | ||||||||||||||||||||||||
| Issuance of common stock related to warrants | — | — | 437,124 | 5 | (5 | ) | — | — | — | — | — | |||||||||||||||||||||||||
| Balance at December 31, 2018 | 6,000,000 | 150,000 | 50,201,127 | 502 | 967,890 | 1,381,492 | (417 | ) | (8 | ) | 518 | 2,500,394 | ||||||||||||||||||||||||
| Comprehensive income: | ||||||||||||||||||||||||||||||||||||
| Net income | — | — | — | — | — | 322,866 | — | — | — | 322,866 | ||||||||||||||||||||||||||
| Change in unrealized gain (loss) on available-for-sale debt securities, net of taxes of $2,242 | — | — | — | — | — | — | — | — | 8,432 | 8,432 | ||||||||||||||||||||||||||
| Total comprehensive income | 331,298 | |||||||||||||||||||||||||||||||||||
| Stock-based compensation expense recognized in earnings | — | — | — | — | 11,775 | — | — | — | — | 11,775 | ||||||||||||||||||||||||||
| Preferred stock dividend | — | — | — | — | — | (9,750 | ) | — | — | — | (9,750 | ) | ||||||||||||||||||||||||
| Issuance of stock related to stock-based awards | — | — | 128,263 | 1 | (1,460 | ) | — | — | — | — | (1,459 | ) | ||||||||||||||||||||||||
| Issuance of common stock related to warrants | — | — | 8,768 | — | — | — | — | — | — | — | ||||||||||||||||||||||||||
| Balance at December 31, 2019 | 6,000,000 | $ | 150,000 | 50,338,158 | $ | 503 | $ | 978,205 | $ | 1,694,608 | (417 | ) | $ | (8 | ) | $ | 8,950 | $ | 2,832,258 | |||||||||||||||||
(2) Represents the impact of adopting ASU 2016-13. See Note 1 to the consolidated financial statements for more information.
See accompanying notes to consolidated financial statements.
62
TEXAS CAPITAL BANCSHARES, INC.
CONSOLIDATED STATEMENTS OF CASH FLOWS
| Year ended December 31, | Year ended December 31, | |||||||||||||||||||||||||||
| (in thousands) | 2019 | 2018 | 2017 | (in thousands) | 2020 | 2019 | 2018 | |||||||||||||||||||||
| Operating activities | Operating activities | |||||||||||||||||||||||||||
| Net income | $ | 322,866 | $ | 300,824 | $ | 197,063 | Net income | $ | 66,289 | $ | 312,015 | $ | 293,387 | |||||||||||||||
| Adjustments to reconcile net income to net cash provided by operating activities: | ||||||||||||||||||||||||||||
| Adjustments to reconcile net income to net cash provided by/(used in) operating activities: | Adjustments to reconcile net income to net cash provided by/(used in) operating activities: | |||||||||||||||||||||||||||
| Provision for credit losses | 75,000 | 87,000 | 44,000 | Provision for credit losses | 258,000 | 75,000 | 87,000 | |||||||||||||||||||||
| Deferred tax expense (benefit) | 10,796 | (6,400 | ) | 31,276 | Deferred tax expense (benefit) | (7,964) | 10,796 | (6,400) | ||||||||||||||||||||
| Depreciation and amortization | 37,267 | 32,022 | 27,871 | Depreciation and amortization | 74,925 | 37,267 | 32,022 | |||||||||||||||||||||
| Net (gain)/loss on sale of loans held for sale | 20,259 | 15,934 | 2,387 | Net (gain)/loss on sale of loans held for sale | (58,026) | 20,259 | 15,934 | |||||||||||||||||||||
| Increase (decrease) in valuation allowance on mortgage servicing rights | 5,803 | (2,823 | ) | 2,823 | Increase (decrease) in valuation allowance on mortgage servicing rights | 20,164 | 5,803 | (2,823) | ||||||||||||||||||||
| Stock-based compensation expense | 17,604 | 16,938 | 22,019 | Stock-based compensation expense | 17,441 | 17,604 | 16,938 | |||||||||||||||||||||
| Purchases and originations of loans held for sale | (10,183,057 | ) | (6,753,709 | ) | (5,556,964 | ) | Purchases and originations of loans held for sale | (11,366,986) | (10,183,057) | (6,753,709) | ||||||||||||||||||
| Proceeds from sales and repayments of loans held for sale | 9,508,927 | 5,759,067 | 5,457,117 | Proceeds from sales and repayments of loans held for sale | 13,619,623 | 9,508,927 | 5,759,067 | |||||||||||||||||||||
| Changes in operating assets and liabilities: | Changes in operating assets and liabilities: | |||||||||||||||||||||||||||
| Accrued interest receivable and other assets | (143,617 | ) | (123,542 | ) | (105,720 | ) | Accrued interest receivable and other assets | 10,654 | (143,617) | (123,542) | ||||||||||||||||||
| Accrued interest payable and other liabilities | 87,884 | (5,026 | ) | 10,289 | Accrued interest payable and other liabilities | 5,749 | 98,735 | 2,411 | ||||||||||||||||||||
| Net cash (used in)/provided by operating activities | (240,268 | ) | (679,715 | ) | 132,161 | |||||||||||||||||||||||
| Net cash provided by/(used in) operating activities | Net cash provided by/(used in) operating activities | 2,639,869 | (240,268) | (679,715) | ||||||||||||||||||||||||
| Investing activities | Investing activities | |||||||||||||||||||||||||||
| Purchases of investment securities | (113,233 | ) | (101,558 | ) | (97,776 | ) | Purchases of investment securities | (3,001,746) | (113,233) | (101,558) | ||||||||||||||||||
| Maturities and calls of available-for-sale securities | — | — | 94,775 | Maturities and calls of available-for-sale securities | 0 | 0 | 0 | |||||||||||||||||||||
| Principal payments received on investment securities | 6,185 | 3,426 | 4,383 | Principal payments received on investment securities | 52,609 | 6,185 | 3,426 | |||||||||||||||||||||
| Originations of mortgage finance loans | (138,759,289 | ) | (99,151,237 | ) | (86,931,566 | ) | Originations of mortgage finance loans | (216,234,122) | (138,759,289) | (99,151,237) | ||||||||||||||||||
| Proceeds from pay-offs of mortgage finance loans | 136,466,964 | 98,581,873 | 86,120,744 | Proceeds from pay-offs of mortgage finance loans | 215,324,562 | 136,466,964 | 98,581,873 | |||||||||||||||||||||
| Net (increase)/decrease in loans held for investment, excluding mortgage finance loans | 139,868 | (1,402,068 | ) | (2,395,063 | ) | Net (increase)/decrease in loans held for investment, excluding mortgage finance loans | 926,176 | 139,868 | (1,402,068) | |||||||||||||||||||
| Purchase of premises and equipment, net | (16,651 | ) | (7,651 | ) | (12,265 | ) | Purchase of premises and equipment, net | (2,796) | (16,651) | (7,651) | ||||||||||||||||||
| Proceeds from sale of MSRs | — | 70,824 | — | Proceeds from sale of MSRs | 0 | 0 | 70,824 | |||||||||||||||||||||
| Proceeds from sale of other real estate owned, net | 79 | 13,645 | 1,023 | Proceeds from sale of other real estate owned, net | 0 | 79 | 13,645 | |||||||||||||||||||||
| Net cash used in investing activities | (2,276,077 | ) | (1,992,746 | ) | (3,215,745 | ) | Net cash used in investing activities | (2,935,317) | (2,276,077) | (1,992,746) | ||||||||||||||||||
| Financing activities | Financing activities | |||||||||||||||||||||||||||
| Net increase in deposits | 5,872,480 | 1,482,933 | 2,106,349 | Net increase in deposits | 4,517,996 | 5,872,480 | 1,482,933 | |||||||||||||||||||||
| Costs from issuance of stock related to stock-based awards and warrants | (1,459 | ) | (2,382 | ) | (2,241 | ) | Costs from issuance of stock related to stock-based awards and warrants | (1,986) | (1,459) | (2,382) | ||||||||||||||||||
| Preferred dividends paid | (9,750 | ) | (9,750 | ) | (9,750 | ) | Preferred dividends paid | (9,750) | (9,750) | (9,750) | ||||||||||||||||||
| Net increase/(decrease) in other borrowings | (1,500,000 | ) | 1,100,000 | 800,000 | Net increase/(decrease) in other borrowings | 600,000 | (1,500,000) | 1,100,000 | ||||||||||||||||||||
| Net increase/(decrease) in federal funds purchased and repurchase agreements | (499,408 | ) | 276,134 | 255,465 | Net increase/(decrease) in federal funds purchased and repurchase agreements | (30,015) | (499,408) | 276,134 | ||||||||||||||||||||
| Net cash provided by financing activities | 3,861,863 | 2,846,935 | 3,149,823 | Net cash provided by financing activities | 5,076,245 | 3,861,863 | 2,846,935 | |||||||||||||||||||||
| Net increase in cash and cash equivalents | 1,345,518 | 174,474 | 66,239 | Net increase in cash and cash equivalents | 4,780,797 | 1,345,518 | 174,474 | |||||||||||||||||||||
| Cash and cash equivalents at beginning of period | 3,080,065 | 2,905,591 | 2,839,352 | Cash and cash equivalents at beginning of period | 4,425,583 | 3,080,065 | 2,905,591 | |||||||||||||||||||||
| Cash and cash equivalents at end of period | $ | 4,425,583 | $ | 3,080,065 | $ | 2,905,591 | Cash and cash equivalents at end of period | $ | 9,206,380 | $ | 4,425,583 | $ | 3,080,065 | |||||||||||||||
| Supplemental disclosures of cash flow information: | Supplemental disclosures of cash flow information: | |||||||||||||||||||||||||||
| Cash paid during the period for interest | $ | 393,507 | $ | 236,338 | $ | 115,789 | Cash paid during the period for interest | $ | 189,696 | $ | 393,507 | $ | 236,338 | |||||||||||||||
| Cash paid during the period for income taxes | 89,967 | 75,405 | 103,871 | Cash paid during the period for income taxes | 26,152 | 89,967 | 75,405 | |||||||||||||||||||||
See accompanying notes to consolidated financial statements.
63
(1) Operations and Summary of Significant Accounting Policies
Organization and Nature of Business
Texas Capital Bancshares, Inc. (the "Company” or "TCBI"), a Delaware corporation, was incorporated in November 1996 and commenced banking operations in December 1998. The consolidated financial statements of the Company include the accounts of Texas Capital Bancshares, Inc. and its wholly owned subsidiary, Texas Capital Bank, National Association (the "Bank”). We serve the needs of commercial businesses and successful professionals and entrepreneurs located in Texas as well as operate several lines of business serving a regional or national clientele of commercial borrowers. We are primarily a secured lender, with the majority of our loans held for investment, excluding mortgage finance loans and other national lines of business, being made to businesses headquartered or with operations in Texas. Our national lines of business provide specialized leading products to businesses throughout the United States.
On December 9, 2019, the Company and IBTX entered into a merger agreementthe Merger Agreement, pursuant to which, on the terms and subject to the conditions therein, the Company would be merged with IBTX,and into IBTX. On May 22, 2020, the holding company for Independent Bank, under which TCBICompany and IBTX will combineentered into an agreement pursuant to which the parties mutually agreed to terminate the Merger Agreement. Neither party paid a termination fee in an all-stock merger of equals. Underconnection with the termstermination of the merger agreement, each share of TCBI common stock outstanding immediately prior to the effective time, other than certain shares held by TCBI or IBTX, will be converted into the right to receive the merger consideration of 1.0311 shares of IBTX common stock. At the effective time, each outstanding share of TCBI preferred stock will be automatically converted into the right to receive one share of IBTX preferred stock having substantially the same terms as such share of TCBI preferred stock. The name of the surviving entity will be Independent Bank Group, Inc. and the name of the surviving bank will be Texas Capital Bank. The surviving bank will be operated under the name Independent Financial in Colorado and under the name Texas Capital Bank in Texas.
Basis of Presentation
Our accounting and reporting policies conform to accounting principles generally accepted in the United States ("GAAP") and to generally accepted practices within the banking industry. Certain prior period balances have been reclassified to conform to the current period presentation.
Revision of Prior Period Financial Statements
During the second quarter of 2020, the Company identified an error in our historical financial statements related to the accounting for certain share-based liabilities of a consolidated entity that contained put features, whereby the liabilities were not remeasured to their puttable value at each period end. The aggregate amount of the errors at each period end represented 1% or less of our stockholders' equity in all prior periods. In accordance with the guidance set forth in SEC Staff Bulletin 99, Materiality, and SEC Staff Accounting Bulletin 108, Considering the Effects of Prior Year Misstatements when Quantifying Misstatements in Current Year Financials, the Company concluded that the error was not material, individually or in the aggregate with other previously identified immaterial errors, to any prior periods, the current period or the trend in earnings from a quantitative and qualitative perspective. However, correcting the cumulative effect of the errors in the current period would have resulted in a material misstatement in the current period and, as such, we have revised our previously reported financial information contained in our Annual Report on Form 10-K for the year ended December 31, 2019 to correct the immaterial error, as well as other previously identified immaterial errors.
A summary of revisions to certain previously reported financial information is presented below:
Revised Consolidated Balance Sheets
| December 31, 2019 | December 31, 2018 | December 31, 2017 | ||||||||||||||||||||||||||||||||||||||||||||||||||||||
(in thousands) | As Reported | Adjustment | As Revised | As Reported | Adjustment | As Revised | As Reported | Adjustment | As Revised | |||||||||||||||||||||||||||||||||||||||||||||||
| Other liabilities | $ | 287,157 | $ | 30,937 | $ | 318,094 | $ | 194,238 | $ | 20,086 | $ | 214,324 | $ | 182,212 | $ | 12,649 | $ | 194,861 | ||||||||||||||||||||||||||||||||||||||
| Total liabilities | 29,715,811 | 30,937 | 29,746,748 | 25,757,373 | 20,086 | $ | 25,777,459 | 22,872,924 | 12,649 | 22,885,573 | ||||||||||||||||||||||||||||||||||||||||||||||
| Retained Earnings | 1,694,608 | (30,937) | 1,663,671 | 1,381,492 | (20,086) | $ | 1,361,406 | 1,090,500 | (12,649) | 1,077,851 | ||||||||||||||||||||||||||||||||||||||||||||||
| Total Equity | 2,832,258 | (30,937) | 2,801,321 | 2,500,394 | (20,086) | $ | 2,480,308 | 2,202,721 | (12,649) | 2,190,072 | ||||||||||||||||||||||||||||||||||||||||||||||
64
Revised Consolidated Statement of Income and Other Comprehensive Income
| Year Ended December 31, 2019 | Year Ended December 31, 2018 | Year Ended December 31, 2017 | ||||||||||||||||||||||||||||||||||||
| (in thousands) | As Reported | Adjustment | As Revised | As Reported | Adjustment | As Revised | As Reported | Adjustment | As Revised | |||||||||||||||||||||||||||||
| Salaries and employee benefits expense | $ | 315,080 | $ | 13,403 | $ | 328,483 | $ | 291,768 | $ | 9,131 | $ | 300,899 | $ | 264,231 | $ | 2,230 | $ | 266,461 | ||||||||||||||||||||
| Other non-interest expense | 47,253 | (2,552) | 44,701 | 51,364 | (1,694) | 49,670 | 49,296 | (1,248) | 48,048 | |||||||||||||||||||||||||||||
| Total non-interest expense | 589,999 | 10,851 | 600,850 | 525,096 | 7,437 | 532,533 | 465,876 | 982 | 466,858 | |||||||||||||||||||||||||||||
| Income before tax | 407,161 | (10,851) | 396,310 | 380,788 | (7,437) | 373,351 | 325,708 | (982) | 324,726 | |||||||||||||||||||||||||||||
| Net income | 322,866 | (10,851) | 312,015 | 300,824 | (7,437) | 293,387 | 197,063 | (982) | 196,081 | |||||||||||||||||||||||||||||
| Net income available to common stockholders | 313,116 | (10,851) | 302,265 | 291,074 | (7,437) | 283,637 | 187,313 | (982) | 186,331 | |||||||||||||||||||||||||||||
| Comprehensive income | 331,298 | (10,851) | 320,447 | 300,830 | (7,437) | 293,393 | 197,076 | (982) | 196,094 | |||||||||||||||||||||||||||||
Revised Consolidated Statement of Stockholders' Equity
| Year Ended December 31, 2019 | Year Ended December 31, 2018 | Year Ended December 31, 2017 | ||||||||||||||||||||||||||||||||||||
| (in thousands) | As Reported | Adjustment | As Revised | As Reported | Adjustment | As Revised | As Reported | Adjustment | As Revised | |||||||||||||||||||||||||||||
| Beginning balance retained earnings | $ | 1,381,492 | $ | (20,086) | $ | 1,361,406 | $ | 1,090,500 | $ | (12,649) | $ | 1,077,851 | $ | 903,187 | $ | (11,667) | $ | 891,520 | ||||||||||||||||||||
| Beginning balance total equity | 2,500,394 | (20,086) | 2,480,308 | 2,202,721 | (12,649) | 2,190,072 | 2,009,557 | (11,667) | 1,997,890 | |||||||||||||||||||||||||||||
| Ending balance retained earnings | 1,694,608 | (30,937) | 1,663,671 | 1,381,492 | (20,086) | 1,361,406 | 1,090,500 | (12,649) | 1,077,851 | |||||||||||||||||||||||||||||
| Ending balance total equity | 2,832,258 | (30,937) | 2,801,321 | 2,500,394 | (20,086) | 2,480,308 | 2,202,721 | (12,649) | 2,190,072 | |||||||||||||||||||||||||||||
The share-based liabilities relate to agreements with certain employees of a subsidiary of the Company that was acquired in 2005. The terms of the agreements include a put feature that, when exercised, requires mandatory settlement by the Company of the share-based liability at a formulaic price. The put feature causes the liability to be remeasured to current puttable value at each period end. The impact of adjusting the liability to puttable value at each period end is recorded in salaries and employee benefits expense. During the second quarter of 2020, put features were exercised on a portion of the outstanding liability. As of December 31, 2020, the carrying value of these share-based liabilities totaled $7.8 million and is recorded in other liabilities on the consolidated balance sheets.
Accounting Changes
On January 1, 2020, we adopted ASU 2016-13 "Financial Instruments - Credit Losses (Topic 326): Measurement of Credit Losses on Financial Instruments" ("ASU 2016-13"), which replaces the incurred loss methodology for determining our provision for credit losses and allowance for credit losses with an expected loss methodology that is referred to as the Current Expected Credit Loss ("CECL") model. The measurement of expected credit losses under the CECL methodology is applicable to financial assets measured at amortized cost, including loan receivables and held-to-maturity debt securities. It also applies to off-balance sheet credit exposures not accounted for as insurance (loan commitments, standby letters of credit, financial guarantees, and other similar instruments) and net investments in leases recognized by a lessor in accordance with ASU 2016-02 "Leases (Topic 842)". In addition, ASU 2016-13 made changes to the accounting for available-for-sale debt securities. One such change is to require credit-related impairments to be recognized in the allowance for credit losses rather than as a write-down of the securities' amortized cost basis when management does not intend to sell or believes that it is not more likely than not that they will be required to sell the securities prior to recovery of the securities amortized cost basis.
We adopted ASU 2016-13 using the modified retrospective method for all financial assets measured at amortized cost, off-balance sheet credit exposures and net investments in leases. Results for reporting periods beginning after January 1, 2020 are presented under ASU 2016-13 while prior period amounts continue to be reported in accordance with previously applicable GAAP. Our accounting policies changed significantly upon the adoption of CECL on January 1, 2020. Prior to January 1, 2020, the allowance for loan losses was based on incurred credit losses in accordance with accounting policies disclosed in Note 1 - Operations and Summary of Significant Accounting Policies in the accompanying notes to the consolidated financial statements included in our Annual Report on Form 10-K for the year-ended December 31, 2019.
We adopted ASU 2016-13 using the prospective transition approach for debt securities for which other-than-temporary impairment had been recognized prior to January 1, 2020. As a result, the amortized cost basis remains the same before and after the effective date of ASU 2016-13.
65
The following table illustrates the impact of adopting ASU 2016-13 and details how outstanding loan balances have been reclassified as a result of changes made to our primary portfolio segments under CECL:
| January 1, 2020 | ||||||||||||||||||||
| (in thousands) | As Reported Under ASU 2016-13 | Pre-ASU 2016-13 | Impact of ASU 2016-13 Adoption | |||||||||||||||||
| Assets: | ||||||||||||||||||||
| Loans held for investment (outstanding balance) | ||||||||||||||||||||
| Commercial | $ | 9,133,444 | $ | 10,230,828 | $ | (1,097,384) | ||||||||||||||
| Energy | 1,425,309 | 0 | 1,425,309 | |||||||||||||||||
| Mortgage finance | 8,169,849 | 8,169,849 | 0 | |||||||||||||||||
| Construction | 0 | 2,563,339 | (2,563,339) | |||||||||||||||||
| Real estate | 6,008,040 | 3,444,701 | 2,563,339 | |||||||||||||||||
| Consumer | 0 | 71,463 | (71,463) | |||||||||||||||||
| Equipment leases | 0 | 256,462 | (256,462) | |||||||||||||||||
| Allowance for credit losses on loans | (203,632) | (195,047) | (8,585) | |||||||||||||||||
| Total loans held for investment, net | 24,442,630 | 24,451,215 | (8,585) | |||||||||||||||||
| Net deferred tax asset | 23,058 | 21,064 | 1,994 | |||||||||||||||||
| Liabilities: | ||||||||||||||||||||
| Allowance for credit losses on off-balance sheet exposures | 9,203 | 8,640 | 563 | |||||||||||||||||
| Equity: | ||||||||||||||||||||
| Retained earnings | 1,656,517 | 1,663,671 | (7,154) | |||||||||||||||||
In connection with our adoption of ASU 2016-13, changes were made to our primary portfolio segments to align with the methodology applied in determining the allowance under CECL. These changes included segregating energy loans into a stand-alone portfolio segment and reclassifying consumer and equipment leases into the commercial loan portfolio segment. Additionally, construction and real estate loans were combined into a single portfolio segment, referred to as real estate. The real estate loan portfolio segment includes loans further categorized as commercial real estate, residential homebuilder finance, secured by 1-4 family and an "other" category. See Allowance for Credit Losses below for further discussion of these portfolio segments.
Use of Estimates
The preparation of financial statements in conformity with GAAP requires management to make estimates and assumptions that affect the reported amounts of assets and liabilities and disclosure of contingent assets and liabilities at the date of the financial statements. Actual results could differ from those estimates. The allowance for loancredit losses, the fair value of financial instruments and the status of contingencies are particularly susceptible to significant change.
Basic and Diluted Earnings Per Common Share
Basic earnings per common share is based on net income available to common stockholders divided by the weighted-average number of common shares outstanding during the period excluding non-vested stock. Diluted earnings per common share include the dilutive effect of non-vested stock-based awards granted using the treasury stock method. A reconciliation of the weighted-average shares used in calculating basic earnings per common share and the weighted average common shares used in calculating diluted earnings per common share for the reported periods is provided in Note 2 — Earnings Per Share.
Accumulated Other Comprehensive Income
Unrealized gains or losses on our available-for-sale debt securities (after applicable income tax expense or benefit) are included in accumulated other comprehensive income (loss), net ("AOCI"). AOCI is reported in the accompanying consolidated statements of stockholders’ equity and consolidated statements of income and other comprehensive income.
GAAP does not permit the adjustment of tax amounts in AOCI for changes in tax rates; as a result the effects become "stranded" in AOCI. Stranded tax effects caused by the 2018 revaluation of deferred taxes resulting from the corporate tax rates established by the Tax Cuts and Jobs Act (the "Tax Act") are reclassified from AOCI to retained earnings in accordance with our early adoption of ASU 2018-02 "Income Statement - Reporting Comprehensive Income (Topic 220): Reclassification of Certain Tax Effects from Accumulated Other Comprehensive Income."
Cash and Cash Equivalents
Cash equivalents include amounts due from banks, interest-bearing deposits in other banks, federal funds sold and securities purchased under resale agreements.
66
Investment Securities
Investment securities include available-for-sale debt securities and equity securities at fair value.
Debt Securities
Debt securities are classified as trading, available-for-sale or held-to-maturity. Management classifies securities at the time of purchase and re-assesses such designation at each balance sheet date; however, transfers between categories from this re-assessment are rare. All debt securities are available-for-sale as of December 31, 2020 and 2019.
Trading Account
Debt securities acquired for resale in anticipation of short-term market movements are classified as trading, with realized and unrealized gains and losses recognized in income. To date, we have not had any activity in our trading account.
Held-to-Maturity
Debt securities are classified as held-to-maturity when we have the positive intent and ability to hold the securities to maturity. Held-to-maturity securities are stated at amortized cost. Debt securities not classified as held-to-maturity or trading are classified as available-for-sale.
Available-for-Sale
Available-for-sale debt securities are stated at fair value, with the unrealizedvalue. Unrealized gains and lossesare reported as a separate component of AOCI, net of tax. For available-for-sale debt securities in an unrealized loss position, we first assess whether we intend to sell, or it is more-likely-than-not that we will be required to sell, the securities before recovery of the amortized cost basis. If either of these criteria is met, the securities' amortized cost basis is written down to fair value as a current period expense. If either of the above criteria is not met, we evaluate whether the decline in fair value is the result of credit losses or other factors. In making this assessment, we may consider various factors including the extent to which fair value is less than amortized cost, performance of any underlying collateral and adverse conditions specifically related to the security, among other factors. If this assessment indicates that a credit loss exists, the present value of cash flows expected to be collected are compared to the amortized cost basis of the security and any excess of the amortized cost basis over the present value of expected cash flows is recorded as an allowance for credit loss, limited to the amount by which the fair value is less than the amortized cost basis. Any impairment not recorded through an allowance for credit loss is recognized in AOCI, net of tax, as a non credit-related impairment.
The amortized cost of debt securities is adjusted for amortization of premiums and accretion of discounts to maturity, or in the case of mortgage-backed securities, over the estimated life of the security. Such amortization and accretion are included in interest income from securities. Realized gains and losses and declines in value judged to be other-than-temporary are included in gain (loss) on sale of securities. The cost of securities sold is based on the specific identification method.
Included in debt securities available-for-sale are Credit Risk Transfer ("CRT") securities.CRT securities represent unsecured obligations issued by government sponsored entities ("GSEs") such as Freddie Mac and are designed to transfer mortgage credit risk from the GSE to private investors. CRT securities are structured to be subject to the performance of December 31, 2019a reference pool of mortgage loans in which we share in 50% of the first losses with the GSE. If the reference pool incurs losses, the amount we will recover on the notes is reduced by our share of the amount of such losses, which could potentially be up to 100% of the amount outstanding. Unrealized losses recognized in AOCI for the CRT securities are primarily related to the difference between the current market rate for similar securities and 2018.the stated interest rate and are not considered to be related to credit loss events. The CRT securities are generally interest-only for an initial period of time and may be restricted from being transferred until a future date.
Equity Securities
Beginning January 1, 2018, upon adoption of ASU 2016-01 "Recognition and Measurement of Financial Assets and Financial Liabilities," equity securities with readily determinable fair values are stated at fair value with realized and unrealized gains and losses reported in income. For periods prior to January 1, 2018, equity securities were classified as available-for-sale and stated at fair value with unrealized gains and losses reported as a separate component of AOCI, net of tax. Equity securities without readily determinable fair values are recorded at cost less any impairment, if any.
67
Loans
Loans Held for Sale
Through our mortgage correspondent aggregation ("MCA") program, we commit to purchase residential mortgage loans from independent correspondent lenders and deliver those loans into the secondary market via whole loan sales to independent third parties or in securitization transactions to third parties such as Ginnie Mae or to government sponsored entities such as Fannie Mae or Freddie Mac ("GSEs"). In some cases, we retain the mortgage servicing rights. Once purchased, these loans are classified as held for sale and are carried at fair value pursuant to our election of the fair value option in accordance with Accounting Standards Codification ("ASC") 825, Financial Instruments. At the commitment date, we enter into a corresponding forward sale commitment with a third party, typically Ginnie Mae or a GSE, to deliver the loans within a specified timeframe. The estimated gain/loss for the entire transaction (from initial purchase commitment to final delivery of loans) is recorded as an asset or liability. The fair value of loans held for sale is derived from observable current market prices, when available, and includes the fair value of the mortgage servicing rights. Adjustments to reflect unrealized gains and losses resulting from changes in fair value and realized gains and losses upon ultimate sale of the loans are classified as gain/(loss) on sale of loans held for sale in the consolidated statements of income and other comprehensive income.
Residential mortgage loans held for sale are subject to both credit and interest rate risk. Credit risk is managed through underwriting policies and procedures, including collateral requirements, which are generally accepted by the secondary loan markets. Exposure to interest rate fluctuations is partially managed through forward sales contracts, which set the price for loans that will be delivered in the next 60 to 90 days.
Pursuant to Ginnie Mae servicing guidelines, we have the unilateral right, but not the obligation, to repurchase certain delinquent loans securitized in Ginnie Mae pools, if they meet defined delinquent loan criteria. Once the delinquency criteria
have been met, and regardless of whether the repurchase option has been exercised, we account for these loans as if they had been repurchased and recognize the loans and a corresponding liability as held for sale and other liabilities, respectively, in the consolidated balance sheets. If the loans are actually repurchased, the liability is extinguished and the loans continue to be reported as held for sale. As a Ginnie Mae approved lender, we may recover losses incurred on repurchased loans through a claims process with the government agency.
From time to time we hold for sale the guaranteed portion of Small Business Administration 7(a) loans, which are carried at lower of cost or market.
Loans Held for Investment
Loans held for investment (including financing leases) are stated at the amount of unpaid principal reduced by deferred income (net of costs). Interest on loans is recognized using the simple-interestsimple interest method on the daily balances of the principal amounts outstanding. Loan origination fees, net of direct loan origination costs, and commitment fees are deferred and amortized as an adjustment to yield over the life of the loan, or over the commitment period, as applicable.
Restructured loans are loans on which, due to the borrower’s financial difficulties, we have granted a concession that we would not otherwise consider for borrowers of similar credit quality. This may include a transfer of real estate or other assets from the borrower, a modification of loan terms, or a combination of the two. Modifications of terms that could potentially qualify as a restructuring include reduction of contractual interest rate, extension of the maturity date at a contractual interest rate lower than the current rate for new debt with similar risk, a reduction of the face amount of debt or forgiveness of either principal or accrued interest. A loan continues to qualify as restructured until a consistent payment history or change in the borrower’s financial condition has been evidenced, generally for no less than twelve months. Assuming thatIf the restructuring agreement specifies an interest rate at the time of the restructuring that is greater than or equal to the rate that we are willing to accept for a new extension of credit with comparable risk, then the loan is no longer has to be considered a restructuring if it is in compliance with the modified terms in calendar years after the year of the restructure.
Loans held for investment includes legal ownership interests in mortgage loans that we purchase through our mortgage warehouse lending division. The ownership interests are purchased from unaffiliated mortgage originators who are seeking additional funding through sale of the undivided ownership interests to facilitate their ability to originate loans. The mortgage originator has no obligation to offer and we have no obligation to purchase these interests. The originator closes mortgage loans
68
consistent with underwriting standards established by approved investors, and, at the time of the sale to the investor, our ownership interest and that of the originator are delivered by us to the investor selected by the originator and approved by us. We typically purchase up to a 99% ownership interest in each mortgage with the originator owning the remaining percentage. These mortgage ownership interests are generally held by us for a period of less than 30 days and more typically 10-20 days. Because of conditions in agreements with originators designed to reduce transaction risks, under ASC 860, Transfers and Servicing of Financial Assets (“ASC 860”), the ownership interests do not qualify as participating interests. Under ASC 860, the ownership interests are deemed to be loans to the originators and payments we receive from investors are deemed to be payments made by or on behalf of the originator to repay the loan deemed made to the originator. Because we have an actual, legal ownership interest in the underlying residential mortgage loan, these interests are reported as extensions of credit to the originators that are secured by the mortgage loans as collateral.
Due to market conditions or events of default by the investor or the originator, we could be required to purchase the remaining interests in the mortgage loans and hold them beyond the expected 10-20 days. Mortgage loans acquired under these conditions would require mark-to-market adjustments to income and could require further allocations of the allowance for loancredit losses or be subject to charge offcharge-off in the event the loans become impaired.
Allowance for LoanCredit Losses
The allowance for credit losses is an estimate of the expected credit losses in the loans held for investment and available-for-sale debt securities portfolio. The following is our discussion of the allowance for credit losses on loans held for investment. See "Investment Securities - Available-for-Sale" above for discussion of the allowance for credit losses on available-for-sale debt securities.
ASU 2016-13 replaces the incurred loss impairment model, which recognizes losses when it becomes probable that a credit loss will be incurred, with a requirement to recognize lifetime expected credit losses immediately when a financial asset is originated or purchased. The allowance for credit losses is a valuation account that is deducted from the amortized cost basis of loans to present the net amount expected to be collected on the loans. Loans, or portions thereof, are charged off against the allowance when they are deemed uncollectible. Expected recoveries do not exceed the aggregate of amounts previously charged-off and expected to be charged-off.
Management estimates the allowance balance using relevant available information, from internal and external sources, relating to past events, current conditions and reasonable and supportable forecasts. Historical credit loss experience provides the basis for the estimation of expected credit losses. Adjustments to historical loss information are made for differences in current loan-specific risk characteristics such as differences in underwriting standards, portfolio mix, credit quality, or term, as well as for changes in macroeconomic conditions, such as changes in unemployment rates, crude oil prices, property values or other relevant factors.
The allowance for loancredit losses is comprised of general reserves and specific reserves for impaired loans, allmeasured on a collective (pool) basis based on our estimate of losses inherent in the portfolio at the balance sheet date.a lifetime loss-rate model when similar risk characteristics exist. Reserves on loans that do not share risk characteristics are evaluated on an individual basis. In order to determine the allowance for loancredit losses, all loans are assigned a credit grade. Loan commitmentsLoans graded substandard or worse and greater than $500,000 are specifically reviewed for loss potential. Loanspotential and when deemed to be impaired, as well as restructured loans and loans formerly reported as restructured,appropriate are assigned a specific reserve based on the losses expected to be realized from those loans.an individual evaluation. For purposes of determining the generalpool-basis reserve, the remainder of the portfolio, representing all loans not assigned an individual reserve, is segregated first by portfolio segment, then by product typestype, to recognize differing risk profiles amongwithin portfolio segments, and then further segregatedfinally by credit grades.grade. Each credit grade within each product type is assigned a risk factor, historical loss rate. These historical loss rates are then modified to incorporate our reasonable and supportable forecast of future losses at the portfolio segment level, as well as any necessary qualitative adjustments using a Portfolio Level Qualitative Factor ("PLQF") and/or reserve allocation percentage.a Portfolio Segment Level Qualitative Factor ("SLQF"). These risk factorsmodified historical loss rates are multiplied by the outstanding principal balance of each loan and risk-weighted by product type to calculate a required reserve. A similar process is employed to calculate a reserve assigned to off-balance sheet commitments, specifically unfunded loan commitments and letters of credit, and any needed reserve is recorded in other liabilities. The PLQF and SLQF are utilized to address factors that are not present in historical loss rates and are otherwise unaccounted for in the quantitative process. The PLQF is used to apply a qualitative adjustment across the entire portfolio of loans, while the SLQF is designed to apply a qualitative adjustment across a single portfolio segment. Even though portions of the allowance may be allocated to specific loans, the entire allowance is available for any credit that, in management’s judgment, should be charged off.
We generally use a two-year forecast period, based on a single consensus forecast scenario, using variables we believe are most relevant to each portfolio segment. For periods beyond which we are able to develop reasonable and supportable forecasts, we immediately revert to the average historical loss rate. The forecast period and scenario used is reviewed on a quarterly basis and may be adjusted based on management's view of the current economic conditions and level of predictability the forecast can provide.
Portfolio segments are used to pool loans with similar risk characteristics and align with our methodology for measuring expected credit losses. A summary of our primary portfolio segments is as follows:
69
Commercial. Our commercial loan portfolio is comprised of lines of credit for working capital, term loans and leases to finance equipment and other business assets across a variety of industries. These loans are used for general corporate purposes including financing working capital, internal growth, acquisitions and business insurance premiums and are generally secured by accounts receivable, inventory, equipment and other assets of our clients’ businesses. Our commercial loan portfolio also includes consumer loans because our small portfolio of consumer loans is largely comprised of accommodation loans to individuals associated with our commercial clients.
Energy. Our energy loan portfolio is primarily comprised of loans to exploration and production (“E&P”) companies that are generally collateralized with proven reserves based on appropriate valuation standards that take into account the risk of oil and gas price volatility. The majority of this portfolio is first lien, senior secured, reserve-based lending, which we believe is the lowest-risk form of energy lending. Energy loans are impacted by commodity price volatility, as well as changes in consumer and business demand.
Mortgage finance. Mortgage finance loans relate to our mortgage warehouse lending operations in which we purchase mortgage loan ownership interests from unaffiliated mortgage originators that are generally held by us for a period of less than 30 days and more typically 10-20 days before they are sold to an approved investor. Volumes fluctuate based on the level of market demand for the product and the number of days between purchase and sale of the loans, which can be affected by changes in overall market interest rates and housing demand and tend to peak at the end of each month. Mortgage finance loans are consistently underwritten based on standards established by the approved investors. Market conditions or events of default by an investor or originator could require that we repurchase the remaining interests in the mortgage loans and hold them beyond the expected 10-20 days.
Real estate. Our real estate portfolio is comprised of the following types of loans:
Commercial real estate ("CRE"). Our CRE portfolio is comprised of both construction/development financing and limited term financing provided to professional real estate developers and owners/managers of commercial real estate projects and properties who have a demonstrated record of past success with similar properties. Collateral properties include office buildings, warehouse/distribution buildings, shopping centers, hotels/motels, senior living, apartment buildings and residential and commercial tract development. The primary source of repayment on these loans is expected to come from the sale, permanent financing or lease of the real property collateral. CRE loans are impacted by fluctuations in collateral values, as well as the ability of the borrower to obtain permanent financing.
Residential homebuilder finance ("RBF"). The RBF portfolio is comprised of loans made to residential builders and developers. Loans to residential builders are typically in the form of uncommitted guidance lines and are for the purpose of developing lots into single-family homes, while loans to developers are typically in the form of borrowing base lines extended for the purpose of acquiring and developing raw land into lots that can be further sold to home builders. RBF loans, if not structured and monitored correctly, can be impacted by volatility in consumer demand, as well as fluctuation in housing prices.
Secured by 1-4 family. This category of loans includes both first and second lien loans made for the purpose of purchasing or constructing 1-4 family residential dwellings, as well as home equity revolving lines of credit and loans to purchase lots for future construction of 1-4 family residential dwellings.
Other. The "other" category is primarily comprised of real estate loans originated through a Small Business Administration (SBA) program where repayment is partially guaranteed by the SBA, as well as other loans secured by real estate where the primary source of repayment is not expected to come from the sale or lease of the real property collateral.
We have several pass credit grades that are assigned to loans based on varying levels of risk, ranging from credits that are secured by cash or marketable securities, to watch credits which have all the characteristics of an acceptable credit risk but warrant more than the normal level of monitoring. Within our criticized/classified credit grades are special mention, substandard and doubtful. Special mention loans are those that are currently protected by the sound worth and paying capacity of the borrower, but that are potentially weak and constitute an additional credit risk. These loans have the potential to deteriorate to a substandard grade due to the existence of financial or administrative deficiencies. Substandard loans have a well-defined weakness or weaknesses that jeopardizes the liquidation of the debt. They are characterized by the distinct possibility that we will sustain some loss if the deficiencies are not corrected. Some substandard loans are inappropriatelyinadequately protected by the sound worth and paying capacity of the borrower and of the collateral pledged and may be considered impaired. Substandard loans can be accruing or can be on non-accrual depending on the circumstances of the individual loans. Loans classified as doubtful have all the weaknesses inherent in substandard loans with the added characteristics that the weaknesses make collection or liquidation in full highly questionable and improbable. The possibility of loss is extremely high. All doubtful loans are on non-accrual.
The allowance allocation percentages assigned to each credit grade have been developed based primarily on an analysis of our historical loss rates. The level of the allowance reflects management’s continuing evaluation of conditions likely to impact the amount of losses expected to be incurred in the Bank’s loan portfolio. Such conditions include, without limitation, credit quality indicators such as amounts and percentages of loans classified as past due, criticized and non-performing, conditions internal to the Bank such as the skill and experience of lending and credit personnel and effectiveness of credit review processes, the rate of portfolio growth, the extent of hold limits and loan concentrations, such as loans to specific borrowers, loans to groups of affiliated borrowers, loans to borrowers in defined industry groups and loans to borrowers, and collateral, in defined geographic locations. Conditions external to the Bank that may impact incurred losses that are also considered by management in the evaluation of the allowance include the general health of the national economy and regional economies where the Bank operates, international economic conditions, domestic and international political events that may impact the Bank’s loan portfolio, regulatory developments deemed relevant to risk assessment and classification of credits and circumstances that may have negative consequences for industries or specific borrowers where the Bank has exposure.
70
allowance and in specific reserves assigned on an individual basis as the collectability of classified loans is evaluated with new information. As our portfolio has matured, historical loss ratios have been closely monitored. Our reserve appropriateness relies primarily on our loss history. The review of the appropriateness of the allowance is performed by executive management and presented to the audit and risk committees of our board of directors for their review. The committees report to the board as part of the board's review on a quarterly basis of the Company'sour consolidated financial statements.
When management determines that foreclosure is probable, and for certain collateral-dependent loans where foreclosure is not considered probable, expected credit losses are based on the estimated fair value of the collateral adjusted for selling costs, when appropriate. A loan is considered collateral-dependent when the borrower is experiencing financial difficulty and repayment is expected to be provided substantially through the operation or sale of the collateral.
Expected credit losses are estimated over the contractual term of the loans, adjusted for expected prepayments when appropriate. The contractual term excludes expected extensions, renewals and modifications unless either of the following applies: management has a reasonable expectation that a loan will be restructured, or the extension or renewal options are included in the borrower contract and are not unconditionally cancellable by us.
We do not measure an allowance for credit losses on accrued interest receivable balances because these balances are written off in a timely manner as a reduction to interest income when loans are placed on non-accrual status as discussed above.
Other Real Estate Owned
Other real estate owned (“OREO”), which is included in other assets on the consolidated balance sheet, consists of real estate that has been foreclosed. When foreclosure occurs, the acquired asset is recorded at fair value less selling costs, generally based on appraised value, which may result in partial charge-off of the loan through a charge to the allowance for loancredit losses, if necessary. Subsequent write-downs required for declines in value are recorded through a valuation allowance, or taken directly to the asset, and are recorded in allowance and other carrying costs for OREO in the consolidated statements of income and other comprehensive income. Gains or losses on sale of OREO are recorded in other non-interest income in the consolidated statements of income and other comprehensive income.
Mortgage Servicing Rights, Net
Mortgage servicing rights ("MSRs") are created by selling mortgage loans with servicing rights retained. We identify classes of servicing rights based upon the nature of the underlying assumptions used to value the asset along with the risks associated with the underlying asset. Based upon these criteria we have one class of MSRs, residential.
MSRs are recognized based on the estimated fair value of the mortgage loans and the related servicing rights at the date of sale using values derived from a valuation model. MSRs are reported on the consolidated balance sheets at amortized cost, less a valuation allowance if the fair value of identified strata within the MSR portfolio are determined to have a fair value that is less than amortized cost. MSRs are amortized proportionally over the estimated life of the projected net servicing revenue and are periodically evaluated for impairment. Loan servicing fee income represents income earned for servicing mortgage loans owned by investors and includes mortgage servicing fees and other ancillary servicing income. Servicing fees are recorded as income when earned and are reported in non-interest income on the consolidated statements of income and other comprehensive income. MSR valuation allowance expense and servicing related expenses are recorded in servicing relatedservicing-related expenses in the consolidated statements of income and other comprehensive income.
The estimated fair value of the MSR assets is obtained from an independent third party and reviewed by management on a quarterly basis. MSRs typically do not trade in an active, open market with readily observable prices; as such, the fair value of MSRs is determined using a discounted cash flow model to calculate the present value of the estimated future net servicing income. The assumptions utilized in the discounted cash flow model are based on market data for comparable assets, where available. Each quarter, management and the independent third party review the key assumptions used in the discounted cash flow model and make adjustments as necessary to estimate the fair value of the MSRs.
Goodwill and Other Intangible Assets, Net
Intangible assets are acquired assets that lack physical substance but can be distinguished from goodwill because of contractual or other legal rights or because the asset is capable of being sold or exchanged either on its own or in combination with a related contract, asset or liability. Our intangible assets relate primarily to loan customer relationships purchased as part of business acquisitions. Intangible assets with definite useful lives are amortized over their estimated life. Goodwill and intangible assets are tested for impairment at least annually or whenever changes in circumstances indicate the carrying amount of the assets may not be recoverable from future undiscounted cash flows. If impaired, the assets are recorded at fair value.
Premises and Equipment, Net
Premises and equipment are stated at cost less accumulated depreciation. Depreciation is computed using the straight-line method over the estimated useful lives of the assets. Furniture and equipment is generally depreciated over three to five years,
71
while leasehold improvements are generally depreciated over the term of their respective lease. Gains or losses on disposals of premises and equipment are included in other non-interest income in the consolidated statements of income and other comprehensive income.
Software
Costs incurred in connection with development or purchase of internal use software and cloud computing arrangements, including in-substance software licenses, are capitalized. Amortization is computed on a straight-line basis over the estimated useful life of the asset, which generally ranges from one to five years. Capitalized software is included in other assets in the consolidated balance sheets.
Financial Instruments with Off-Balance Sheet Risk
The Company has undertaken certain guarantee obligations in the ordinary course of business which include liabilities with off-balance sheet risk. We consider the following arrangements to be guarantees: commitments to extend credit, standby letters of credit and indemnification agreements included within third party contractual arrangements.
The Bank is a party to financial instruments with off-balance sheet risk in the normal course of business to meet the financing needs of its customers. These financial instruments include commitments to extend credit and standby letters of credit that involve varying degrees of credit risk in excess of the amount recognized in the consolidated balance sheets. The Bank’s exposure to credit loss in the event of non-performance by the other party to the financial instrument for commitments to extend credit and standby letters of credit is represented by the contractual amount of these instruments. The Bank uses the same credit policies in making commitments and conditional obligations as it does for on-balance sheet instruments. The amount of collateral obtained, if deemed necessary, is based on management’s credit evaluation of the borrower.
Commitments to extend credit are agreements to lend to a customer as long as there is no violation of any condition established in the contract. Commitments generally have fixed expiration dates or other termination clauses and may require payment of a fee. Since many of the commitments may expire without being drawn upon, the total commitment amounts do not necessarily represent future cash requirements. The Bank evaluates each customer’s creditworthiness on a case-by-case basis.
Standby letters of credit are conditional commitments issued by the Bank to guarantee the performance of a customer to a third party. Those guarantees are primarily issued to support public and private borrowing arrangements. The credit risk involved in issuing letters of credit is essentially the same as that involved in extending loan facilities to customers.
In conjunction with the sale and securitization of loans held for sale and their related servicing rights, we may be exposed to liability resulting from recourse, repurchase and repurchasemake-whole agreements. If it is determined subsequent to our sale of a loan or its related servicing rights that a breach of the representations or warranties made in the applicable sale agreement has occurred, which may include guarantees that prepayments will not occur within a specified and customary time frame, we may have an obligation to either (a) repurchase the loan for the unpaid principal balance, accrued interest and related advances, (b) indemnify the purchaser against any loss it suffers or (c) make the purchaser whole for the economic benefits of the loan and its related servicing rights.
Our repurchase, indemnification and make-whole obligations vary based upon the terms of the applicable agreements, the nature of the asserted breach and the status of the mortgage loan at the time a claim is made. We establish reserves for estimated losses of this nature inherent in the origination of mortgage loans by estimating the losses inherent in the population of all loans sold based on trends in claims and actual loss severities experienced. The reserve will include accruals for probable contingent losses in addition to those identified in the pipeline of claims received. The estimation process is designed to include amounts based on actual losses experienced from actual activity.
Leases
ASU 2016-02 "Leases (Topic 842)" ("ASU 2016-02") requires that lessees and lessors recognize lease assets and lease liabilities on the balance sheet and disclose key information about leasing arrangements. ASU 2016-02 became effective for us on January 1, 2019. ASU 2016-02 provides for a modified retrospective transition approach requiring lessees to recognize and measure leases on the balance sheet at the beginning of either the earliest period presented or as of the beginning of the period of adoption with the option to elect certain practical expedients. We elected to apply ASU 2016-02 as of the beginning of the period of adoption (January 1, 2019) and have not restated comparative periods. Of the optional practical expedients available under ASU 2016-02, we adopted all expedients except for the hindsight practical expedient. As a result of implementing ASU 2016-02, we recognized an operating lease right-of-use ("ROU") asset of $64 million and an operating lease liability of $74 million on January 1, 2019, with no impact on our consolidated statements of income or consolidated statements of cash flows compared to the prior lease accounting model.
Operating lease ROU assets represent our right to use an underlying asset during the lease term and operating lease liabilities represent our obligation to make lease payments arising from the lease. Operating lease agreements may contain extension options which typically range from 5 to 10 years at the then fair market rental rates. As these extension options are not
72
generally considered reasonably certain of exercise, they are not included in the lease term. ROU assets and operating lease liabilities are recognized at lease commencement based on the present value of the remaining lease payments using a discount rate that represents our incremental borrowing rate at the lease commencement date, which is based on our collateralized borrowing capabilities over a similar term as the related lease payments. ROU assets are further adjusted for lease incentives.
Our operating leases relate primarily to office space and bank branches. Operating leases in which we are the lessee are recorded as operating lease ROU assets and operating lease liabilities, included in other assets and other liabilities, respectively, on our consolidated balance sheets. Operating lease expense, which is comprised of amortization of the ROU asset and the implicit interest accreted on the operating lease liability, is recognized on a straight-line basis over the lease term, and is recorded in net occupancy expense in the consolidated statements of income and other comprehensive income. See Note 76 – Leases for additional information.
Revenue Recognition
ASC 606, Revenue from Contracts with Customers ("ASC 606"), establishes principles for reporting information about the nature, amount, timing and uncertainty of revenue and cash flows arising from the entity's contracts to provide goods or services to customers. The core principle requires an entity to recognize revenue to depict the transfer of goods or services to customers in an amount that reflects the consideration that it expects to be entitled to receive in exchange for those goods or services recognized as performance obligations are satisfied.
The majority of our revenue-generating transactions are not subject to ASC 606, including revenue generated from financial instruments, such as our loans, letters of credit, derivatives and investment securities, as well as revenue related to our mortgage servicing activities, as these activities are subject to other GAAP discussed elsewhere within our disclosures. Descriptions of our revenue-generating activities that are within the scope of ASC 606, which are presented in our income statements as components of non-interest income are as follows:
•Service charges on deposit accounts - these represent general service fees for monthly account maintenance and activity- or transaction-based fees and consist of transaction-based revenue, time-based revenue (service period), item-based revenue or some other individual attribute-based revenue. Revenue is recognized when our performance obligation is completed, which is generally monthly for account maintenance services or when a transaction has been completed (such as a wire transfer). Payments for such performance obligations are generally received at the time the performance obligations are satisfied.
•Wealth management and trust fee income - this represents monthly fees due from wealth management customers as consideration for managing the customers' assets. Wealth management and trust services include custody of assets, investment management, escrow services, fees for trust services and similar fiduciary activities. Revenue is recognized when our performance obligation is completed each month, which is generally the time that payment is received. Also included are fees received from a third party broker-dealer as part of a revenue-sharing agreement for fees earned from customers that we refer to the third party. These fees are paid to us by the third party on a quarterly basis and recognized ratably throughout the quarter as our performance obligation is satisfied.
•Brokered loan fees - these represent fees for the administration and funding of purchased mortgage loan interests as well as facility renewal and application fees received from mortgage originator customers in our mortgage warehouse lending business. Also included are fees received from independent correspondent mortgage lenders as consideration for our purchase of individual residential mortgage loans through our MCA business. Revenue related to the mortgage warehouse lending business is recognized when the related loan interest is disposed (i.e., through sale or payoff) or upon receipt of the facility renewal or application. Revenue related to our MCA business is recognized at the time a loan is purchased.
•Other non-interest income primarily includes items such as letter of credit fees, bank owned life insurance income, dividends on FHLB and FRB stock and other general operating income, none of which are subject to the requirements of ASC 606.
Stock-based Compensation
We account for all stock-based compensation transactions in accordance with ASC 718, Compensation — Stock Compensation (“ASC 718”), which requires that stock compensation transactions be recognized as compensation expense in the consolidated statements of income and other comprehensive income based on their fair values on the measurement date, which is the date of the grant.
Income Taxes
The Company and its subsidiary file a consolidated federal income tax return. We utilize the liability method in accounting for income taxes. Under this method, deferred tax assets and liabilities are determined based upon the difference between the values of the assets and liabilities as reflected in the financial statements and their related tax basis using enacted tax rates in
73
effect for the year in which the differences are expected to be recovered or settled. As changes in tax law or rates are enacted, deferred tax assets and liabilities are adjusted through the provision for income taxes. A valuation allowance is provided against deferred tax assets unless it is more likely than not that such deferred tax assets will be realized.
Unrecognized tax benefits for the uncertain portion of recorded tax benefits and related interest may result from the application of complex tax laws, rules, regulations and interpretations. Unrecognized tax benefits, as well as estimated penalties and interest, are assessed quarterly and may be adjusted through current income tax expense in future periods based on changing facts and circumstances, completion of examinations by taxing authorities or expiration of a statute of limitations.
Fair Values of Financial Instruments
ASC 820, Fair Value Measurements and Disclosures (“ASC 820”), defines fair value, establishes a framework for measuring fair value under GAAP and enhances disclosures about fair value measurements. In general,The standard describes three levels of inputs that may be used to measure fair value as provided below.
Level 1 Quoted prices in active markets for identical assets or liabilities.
Level 2 Observable inputs other than Level 1 prices, such as quoted prices for similar assets or liabilities; quoted prices in markets that are not active; or other inputs that are observable or can be corroborated by observable market data for substantially the full term of the assets or liabilities.
Level 3 Unobservable inputs that are supported by little or no market activity and that are significant to the fair value of the assets or liabilities. Level 3 assets and liabilities include financial instruments whose value is determined using pricing models, discounted cash flow methodologies, or similar techniques, as well as instruments for which the determination of fair values requires significant management judgment or estimation.
Also required are disclosures of fair value information about financial instruments, are based upon quoted market prices,whether or not recognized on the balance sheet, for which it is practical to estimate that value. In cases where available. If such quoted market prices are not available, fair value isvalues are based on estimates using present value or other valuation techniques. Those techniques are significantly affected by the assumptions used, including the discount rate and estimates of future cash flows. The disclosure of fair value information about financial instruments does not and is not intended to represent the fair value of the Company.
The following are descriptions of the methods and significant assumptions used by the Company in estimating its fair value disclosures for financial instruments:
Cash and Cash Equivalents, Variable Rate Loans, and Variable Rate Debt
The fair value of these financial instruments approximates carrying value.
Investment Securities
Within the investment securities portfolio, we hold equity securities related to our non-qualified deferred compensation plan that are valued using quoted market prices for identical equity securities in an active market, and are classified as Level 1 assets in the fair value hierarchy. We also hold Community Reinvestment Act equity securities that are valued using quoted market prices for identical equity securities in an inactive market that we classify as Level 2 assets in the fair value hierarchy.The fair value of our U.S. government agency and residential mortgage-backed securities are based on prices obtained from independent pricing services that are based on quoted market prices for the same or similar securities, and are characterized as Level 2 assets in the fair value hierarchy. We obtain documentation from our primary pricing service regarding their processes and controls applicable to pricing investment securities, and on a quarterly basis independently verify the prices that we receive from the service provider using two additional independent pricing sources. We also hold tax-exempt asset-backed securities and CRT securities that are valued using a discounted cash flow model, which utilizes Level 3 inputs, and are classified as Level 3 assets in the fair value hierarchy.
The fair value for loans held for sale is derived from quoted market prices for similar loans, in which case they are characterized as Level 2 assets in the fair value hierarchy, or is derived from third party pricing models, in which case they are characterized as Level 3 assets in the fair value hierarchy.
Derivative Assets and Liabilities
The estimated fair value of interest rate swaps and caps is obtained from independent pricing services based on quoted market prices for similar derivative contracts and these financial instruments are characterized as Level 2 assets and liabilities in the fair value hierarchy. On a quarterly basis, we independently verify the fair value using an additional independent pricing source. Foreign currency forward contracts are valued based upon quoted market prices obtained from independent pricing services for similar derivative contracts. As such, these financial instruments are characterized as Level 2 assets and liabilities in the fair
74
Derivative Financial Instruments
All contracts that satisfy the definition of a derivative are recorded at fair value in other assets and other liabilities in the consolidated balance sheets. We record the derivatives on a net basis when a right of offset exists with a single counterparty that is subject to a legally enforceable master netting agreement.
We enter into interest rate derivative contracts that are not designated as hedging instruments. These derivative positions relate to transactions in which we enter into an interest rate swap, cap and/or floor with a customer while at the same time entering into an offsetting interest rate swap, cap and/or floor with another financial institution. In connection with each swap transaction, we agree to pay interest to the customer on a notional amount at a variable interest rate and receive interest from the customer on a similar notional amount at a fixed interest rate. At the same time, we agree to pay another financial institution the same fixed interest rate on the same notional amount and receive the same variable interest rate on the same notional amount. The transaction allows our customer to effectively convert a variable rate loan to a fixed rate. Because we act as an intermediary for our customer, changes in the fair value of the underlying derivative contracts substantially offset each other and do not have a material impact on our results of operations.
We also enter into foreign currency forward contracts that are not designeddesignateed as hedging instruments. These derivative instruments relate to transactions in which we enter into a contract with a customer to buy or sell a foreign currency at a future date for a specified price while at the same time entering into an offsetting contract with a financial institution to buy or sell the same currency at the same future date for a specified price. These transactions allow our customers to manage their exposure to foreign currency exchange rate fluctuations. Because we act as an intermediary for our customer, changes in the fair value of the underlying derivative instruments substantially offset each other and do not have a material impact on our results of operations.
To mitigate exposure to potential impairment losses from adverse changes in the fair value of our residential MSR portfolio, we enter into interest rate derivative contracts, primarily interest rate swap futures and forward sale commitments of mortgage-backed securities. These derivative instruments are considered highly liquid and can be settled daily, which allows us to dynamically manage our exposure. The derivative instruments are used to economically hedge the fair value of the residential MSR portfolio impacted by changes in anticipated prepayments resulting from mortgage interest rate movements and are classified as other assets and other liabilities on the consolidated balance sheets. Any unrealized or realized gains/(losses) related to derivatives economically hedging the residential MSR portfolio are recognized in servicing-related expenses along with changes to the MSR valuation allowance.
Segment Reporting
We have determined that all of our lending divisions and subsidiaries meet the aggregation criteria of ASC 280, Segment Reporting, since all offer similar products and services, operate with similar processes, have similar customers and are collectively reviewed by the chief operating decision maker.
75
(2) Earnings Per Share
The following table presents the computation of basic and diluted earnings per share:
| Year ended December 31, | |||||||||||||||||
| (in thousands except per share data) | 2020 | 2019 | 2018 | ||||||||||||||
| Numerator: | |||||||||||||||||
| Net income | $ | 66,289 | $ | 312,015 | $ | 293,387 | |||||||||||
| Preferred stock dividends | 9,750 | 9,750 | 9,750 | ||||||||||||||
| Net income available to common stockholders | $ | 56,539 | $ | 302,265 | $ | 283,637 | |||||||||||
| Denominator: | |||||||||||||||||
| Denominator for basic earnings per share—weighted average shares | 50,430,326 | 50,286,300 | 49,936,702 | ||||||||||||||
| Effect of employee stock-based awards(1) | 152,653 | 132,904 | 218,275 | ||||||||||||||
| Effect of warrants to purchase common stock | 0 | 0 | 117,895 | ||||||||||||||
| Denominator for dilutive earnings per share—adjusted weighted average shares and assumed conversions | 50,582,979 | 50,419,204 | 50,272,872 | ||||||||||||||
| Basic earnings per common share | $ | 1.12 | $ | 6.01 | $ | 5.68 | |||||||||||
| Diluted earnings per common share | $ | 1.12 | $ | 5.99 | $ | 5.64 | |||||||||||
| Year ended December 31, | |||||||||||
| (in thousands except per share data) | 2019 | 2018 | 2017 | ||||||||
| Numerator: | |||||||||||
| Net income | $ | 322,866 | $ | 300,824 | $ | 197,063 | |||||
| Preferred stock dividends | 9,750 | 9,750 | 9,750 | ||||||||
| Net income available to common stockholders | $ | 313,116 | $ | 291,074 | $ | 187,313 | |||||
| Denominator: | |||||||||||
| Denominator for basic earnings per share—weighted average shares | 50,286,300 | 49,936,702 | 49,587,169 | ||||||||
| Effect of employee stock-based awards(1) | 132,904 | 218,275 | 239,008 | ||||||||
| Effect of warrants to purchase common stock | — | 117,895 | 433,657 | ||||||||
| Denominator for dilutive earnings per share—adjusted weighted average shares and assumed conversions | 50,419,204 | 50,272,872 | 50,259,834 | ||||||||
| Basic earnings per common share | $ | 6.23 | $ | 5.83 | $ | 3.78 | |||||
| Diluted earnings per common share | $ | 6.21 | $ | 5.79 | $ | 3.73 | |||||
(3) Investment Securities
Beginning January 1, 2018, upon adoption of ASU 2016-01 "Recognition and Measurement of Financial Assets and Financial Liabilities," equity securities with readily determinable fair values are stated at fair value with realized and unrealized gains and losses reported in income. For periods prior to January 1, 2018, equity securities were classified as available-for-sale and stated at fair value with unrealized gains and losses reported as a separate component of AOCI, net of tax. Equity securities without readily determinable fair values are recorded at cost less any impairment, if any.
67
Loans
Loans Held for Sale
Through our mortgage correspondent aggregation ("MCA") program, we commit to purchase residential mortgage loans from independent correspondent lenders and deliver those loans into the secondary market via whole loan sales to independent third parties or in securitization transactions to third parties such as Ginnie Mae or to government sponsored entities such as Fannie Mae or Freddie Mac ("GSEs"). In some cases, we retain the mortgage servicing rights. Once purchased, these loans are classified as held for sale and are carried at fair value pursuant to our election of the fair value option in accordance with Accounting Standards Codification ("ASC") 825, Financial Instruments. At the commitment date, we enter into a corresponding forward sale commitment with a third party, typically Ginnie Mae or a GSE, to deliver the loans within a specified timeframe. The estimated gain/loss for the entire transaction (from initial purchase commitment to final delivery of loans) is recorded as an asset or liability. The fair value of loans held for sale is derived from observable current market prices, when available, and includes the fair value of the mortgage servicing rights. Adjustments to reflect unrealized gains and losses resulting from changes in fair value and realized gains and losses upon ultimate sale of the loans are classified as gain/(loss) on sale of loans held for sale in the consolidated statements of income and other comprehensive income.
Residential mortgage loans held for sale are subject to both credit and interest rate risk. Credit risk is managed through underwriting policies and procedures, including collateral requirements, which are generally accepted by the secondary loan markets. Exposure to interest rate fluctuations is partially managed through forward sales contracts, which set the price for loans that will be delivered in the next 60 to 90 days.
Pursuant to Ginnie Mae servicing guidelines, we have the unilateral right, but not the obligation, to repurchase certain delinquent loans securitized in Ginnie Mae pools, if they meet defined delinquent loan criteria. Once the delinquency criteria have been met, and regardless of whether the repurchase option has been exercised, we account for these loans as if they had been repurchased and recognize the loans and a corresponding liability as held for sale and other liabilities, respectively, in the consolidated balance sheets. If the loans are actually repurchased, the liability is extinguished and the loans continue to be reported as held for sale. As a Ginnie Mae approved lender, we may recover losses incurred on repurchased loans through a claims process with the government agency.
From time to time we hold for sale the guaranteed portion of Small Business Administration 7(a) loans, which are carried at lower of cost or market.
Loans Held for Investment
Loans held for investment (including financing leases) are stated at the amount of unpaid principal reduced by deferred income (net of costs). Interest on loans is recognized using the simple interest method on the daily balances of the principal amounts outstanding. Loan origination fees, net of direct loan origination costs, and commitment fees are deferred and amortized as an adjustment to yield over the life of the loan, or over the commitment period, as applicable.
Restructured loans are loans on which, due to the borrower’s financial difficulties, we have granted a concession that we would not otherwise consider for borrowers of similar credit quality. This may include a transfer of real estate or other assets from the borrower, a modification of loan terms, or a combination of the two. Modifications of terms that could potentially qualify as a restructuring include reduction of contractual interest rate, extension of the maturity date at a contractual interest rate lower than the current rate for new debt with similar risk, a reduction of the face amount of debt or forgiveness of either principal or accrued interest. A loan continues to qualify as restructured until a consistent payment history or change in the borrower’s financial condition has been evidenced, generally for no less than twelve months. If the restructuring agreement specifies an interest rate at the time of the restructuring that is greater than or equal to the rate that we are willing to accept for a new extension of credit with comparable risk, then the loan is no longer considered a restructuring if it is in compliance with the modified terms in calendar years after the year of the restructure.
A loan is considered past due when a contractually due payment has not been received by the contractual due date. We place a loan on non-accrual when there is a clear indication that the borrower’s cash flow may not be sufficient to meet payments as they become due, which is generally when a loan is 90 days past due. When a loan is placed on non-accrual status, all previously accrued and unpaid interest is reversed as a reduction of current period interest income. Interest income is subsequently recognized on a cash basis as long as the remaining book balance of the asset is deemed to be collectible. If collectability is questionable, then cash payments are applied to principal. A loan is placed back on accrual status when both principal and interest are current and it is probable that we will be able to collect all amounts due (both principal and interest) according to the terms of the loan agreement.
Loans held for investment includes legal ownership interests in mortgage loans that we purchase through our mortgage warehouse lending division. The ownership interests are purchased from unaffiliated mortgage originators who are seeking additional funding through sale of the undivided ownership interests to facilitate their ability to originate loans. The mortgage originator has no obligation to offer and we have no obligation to purchase these interests. The originator closes mortgage loans
68
consistent with underwriting standards established by approved investors, and, at the time of the sale to the investor, our ownership interest and that of the originator are delivered by us to the investor selected by the originator and approved by us. We typically purchase up to a 99% ownership interest in each mortgage with the originator owning the remaining percentage. These mortgage ownership interests are generally held by us for a period of less than 30 days and more typically 10-20 days. Because of conditions in agreements with originators designed to reduce transaction risks, under ASC 860, Transfers and Servicing of Financial Assets (“ASC 860”), the ownership interests do not qualify as participating interests. Under ASC 860, the ownership interests are deemed to be loans to the originators and payments we receive from investors are deemed to be payments made by or on behalf of the originator to repay the loan deemed made to the originator. Because we have an actual, legal ownership interest in the underlying residential mortgage loan, these interests are reported as extensions of credit to the originators that are secured by the mortgage loans as collateral.
Due to market conditions or events of default by the investor or the originator, we could be required to purchase the remaining interests in the mortgage loans and hold them beyond the expected 10-20 days. Mortgage loans acquired under these conditions would require mark-to-market adjustments to income and could require further allocations of the allowance for credit losses or be subject to charge-off in the event the loans become impaired.
Allowance for Credit Losses
The allowance for credit losses is an estimate of the expected credit losses in the loans held for investment and available-for-sale debt securities portfolio. The following is a summaryour discussion of the allowance for credit losses on loans held for investment. See "Investment Securities - Available-for-Sale" above for discussion of the allowance for credit losses on available-for-sale debt securities:securities.
| (in thousands) | Amortized Cost | Gross Unrealized Gains | Gross Unrealized Losses | Estimated Fair Value | |||||||||||
| December 31, 2019 | |||||||||||||||
| Available-for-sale debt securities: | |||||||||||||||
| Residential mortgage-backed securities | $ | 4,991 | $ | 275 | $ | — | $ | 5,266 | |||||||
| Tax-exempt asset-backed securities | 183,225 | 13,802 | — | 197,027 | |||||||||||
| Credit risk transfer securities | 14,713 | — | (2,749 | ) | 11,964 | ||||||||||
| $ | 202,929 | $ | 14,077 | $ | (2,749 | ) | $ | 214,257 | |||||||
| December 31, 2018 | |||||||||||||||
| Available-for-sale debt securities: | |||||||||||||||
| Residential mortgage-backed securities | $ | 6,874 | $ | 368 | $ | — | $ | 7,242 | |||||||
| Tax-exempt asset-backed securities | 95,518 | 286 | — | 95,804 | |||||||||||
| $ | 102,392 | $ | 654 | $ | — | $ | 103,046 | ||||||||
| (in thousands, except percentage data) | Less Than One Year | After One Through Five Years | After Five Through Ten Years | After Ten Years | Total | ||||||||||||||
| December 31, 2019 | |||||||||||||||||||
| Available-for-sale: | |||||||||||||||||||
| Residential mortgage-backed securities:(1) | |||||||||||||||||||
| Amortized cost | $ | — | $ | 1,005 | $ | — | $ | 3,986 | $ | 4,991 | |||||||||
| Estimated fair value | — | 1,088 | — | 4,178 | 5,266 | ||||||||||||||
| Weighted average yield(3) | — | % | 5.54 | % | — | % | 4.31 | % | 4.55 | % | |||||||||
| Tax-exempt asset-backed securities:(1) | |||||||||||||||||||
| Amortized Cost | — | — | — | 183,225 | 183,225 | ||||||||||||||
| Estimated fair value | — | — | — | 197,027 | 197,027 | ||||||||||||||
| Weighted average yield(2)(3) | — | % | — | % | — | % | 4.20 | % | 4.20 | % | |||||||||
| CRT securities:(1) | |||||||||||||||||||
| Amortized Cost | — | — | — | 14,713 | 14,713 | ||||||||||||||
| Estimated fair value | — | — | — | 11,964 | 11,964 | ||||||||||||||
| Weighted average yield(3) | — | % | — | % | — | % | 1.71 | % | 1.71 | % | |||||||||
| Total available-for-sale debt securities: | |||||||||||||||||||
| Amortized cost | $ | 202,929 | |||||||||||||||||
| Estimated fair value | $ | 214,257 | |||||||||||||||||
| December 31, 2018 | |||||||||||||||||||
| Available-for-sale: | |||||||||||||||||||
| Residential mortgage-backed securities:(1) | |||||||||||||||||||
| Amortized cost | $ | 3 | $ | 1,573 | $ | — | $ | 5,298 | $ | 6,874 | |||||||||
| Estimated fair value | 4 | 1,668 | — | 5,570 | 7,242 | ||||||||||||||
| Weighted average yield(3) | 6.50 | % | 5.54 | % | — | % | 4.53 | % | 4.76 | % | |||||||||
| Tax-exempt asset-backed securities:(1) | |||||||||||||||||||
| Amortized Cost | — | — | — | 95,518 | 95,518 | ||||||||||||||
| Estimated fair value | — | — | — | 95,804 | 95,804 | ||||||||||||||
| Weighted average yield(2)(3) | — | % | — | % | — | % | 4.25 | % | 4.25 | % | |||||||||
| Total available-for-sale debt securities: | |||||||||||||||||||
| Amortized cost | $ | 102,392 | |||||||||||||||||
| Estimated fair value | $ | 103,046 | |||||||||||||||||
| December 31, 2019 | Less Than 12 Months | 12 Months or Longer | Total | ||||||||||||||||||||
| (in thousands) | Fair Value | Unrealized Loss | Fair Value | Unrealized Loss | Fair Value | Unrealized Loss | |||||||||||||||||
| CRT securities | $ | 11,964 | $ | (2,749 | ) | $ | — | $ | — | $ | 11,964 | $ | (2,749 | ) | |||||||||
Management estimates the allowance balance using relevant available information, from internal and external sources, relating to past events, current conditions and reasonable and supportable forecasts. Historical credit loss experience provides the basis for the estimation of expected credit losses. Adjustments to historical loss information are made for differences in current loan-specific risk characteristics such as differences in underwriting standards, portfolio mix, credit quality, or term, as well as for changes in macroeconomic conditions, such as changes in unemployment rates, crude oil prices, property values or other relevant factors.
The allowance for credit losses is comprised of reserves measured on a collective (pool) basis based on a lifetime loss-rate model when similar risk characteristics exist. Reserves on loans that do not share risk characteristics are evaluated on an individual basis. In order to determine the allowance for credit losses, all loans are assigned a credit grade. Loans graded substandard or worse and greater than $500,000 are specifically reviewed for loss potential and when deemed appropriate are assigned a reserve based on an individual evaluation. For purposes of determining the pool-basis reserve, the remainder of the portfolio, representing all loans not assigned an individual reserve, is segregated first by portfolio segment, then by product type, to recognize differing risk profiles within portfolio segments, and finally by credit grade. Each credit grade within each product type is assigned a historical loss rate. These historical loss rates are then modified to incorporate our reasonable and supportable forecast of future losses at the portfolio segment level, as well as any necessary qualitative adjustments using a Portfolio Level Qualitative Factor ("PLQF") and/or a Portfolio Segment Level Qualitative Factor ("SLQF"). These modified historical loss rates are multiplied by the outstanding principal balance of each loan to calculate a required reserve. A similar process is employed to calculate a reserve assigned to off-balance sheet commitments, specifically unfunded loan commitments and letters of credit, and any needed reserve is recorded in other liabilities. The PLQF and SLQF are utilized to address factors that are not present in historical loss rates and are otherwise unaccounted for in the quantitative process. The PLQF is used to apply a qualitative adjustment across the entire portfolio of loans, while the SLQF is designed to apply a qualitative adjustment across a single portfolio segment. Even though portions of the allowance may be allocated to specific loans, the entire allowance is available for any credit that, in management’s judgment, should be charged off.
We generally use a two-year forecast period, based on a single consensus forecast scenario, using variables we believe are most relevant to each portfolio segment. For periods beyond which we are able to develop reasonable and supportable forecasts, we immediately revert to the average historical loss rate. The forecast period and scenario used is reviewed on a quarterly basis and may be adjusted based on management's view of the current economic conditions and level of predictability the forecast can provide.
Portfolio segments are used to pool loans with similar risk characteristics and align with our methodology for measuring expected credit losses. A summary of our primary portfolio segments is as follows:
69
Commercial. Our commercial loan portfolio is comprised of lines of credit for working capital, term loans and leases to finance equipment and other business assets across a variety of industries. These loans are used for general corporate purposes including financing working capital, internal growth, acquisitions and business insurance premiums and are generally secured by accounts receivable, inventory, equipment and other assets of our clients’ businesses. Our commercial loan portfolio also includes consumer loans because our small portfolio of consumer loans is largely comprised of accommodation loans to individuals associated with our commercial clients.
Energy. Our energy loan portfolio is primarily comprised of loans to exploration and production (“E&P”) companies that are generally collateralized with proven reserves based on appropriate valuation standards that take into account the risk of oil and gas price volatility. The majority of this portfolio is first lien, senior secured, reserve-based lending, which we believe is the lowest-risk form of energy lending. Energy loans are impacted by commodity price volatility, as well as changes in consumer and business demand.
Mortgage finance. Mortgage finance loans relate to our mortgage warehouse lending operations in which we purchase mortgage loan ownership interests from unaffiliated mortgage originators that are generally held by us for a period of less than 30 days and more typically 10-20 days before they are sold to an approved investor. Volumes fluctuate based on the level of market demand for the product and the number of days between purchase and sale of the loans, which can be affected by changes in overall market interest rates and housing demand and tend to peak at the end of each month. Mortgage finance loans are consistently underwritten based on standards established by the approved investors. Market conditions or events of default by an investor or originator could require that we repurchase the remaining interests in the mortgage loans and hold them beyond the expected 10-20 days.
Real estate. Our real estate portfolio is comprised of the following types of loans:
Commercial real estate ("CRE"). Our CRE portfolio is comprised of both construction/development financing and limited term financing provided to professional real estate developers and owners/managers of commercial real estate projects and properties who have a demonstrated record of past success with similar properties. Collateral properties include office buildings, warehouse/distribution buildings, shopping centers, hotels/motels, senior living, apartment buildings and residential and commercial tract development. The primary source of repayment on these loans is expected to come from the sale, permanent financing or lease of the real property collateral. CRE loans are impacted by fluctuations in collateral values, as well as the ability of the borrower to obtain permanent financing.
Residential homebuilder finance ("RBF"). The RBF portfolio is comprised of loans made to residential builders and developers. Loans to residential builders are typically in the form of uncommitted guidance lines and are for the purpose of developing lots into single-family homes, while loans to developers are typically in the form of borrowing base lines extended for the purpose of acquiring and developing raw land into lots that can be further sold to home builders. RBF loans, if not structured and monitored correctly, can be impacted by volatility in consumer demand, as well as fluctuation in housing prices.
Secured by 1-4 family. This category of loans includes both first and second lien loans made for the purpose of purchasing or constructing 1-4 family residential dwellings, as well as home equity revolving lines of credit and loans to purchase lots for future construction of 1-4 family residential dwellings.
Other. The "other" category is primarily comprised of real estate loans originated through a Small Business Administration (SBA) program where repayment is partially guaranteed by the SBA, as well as other loans secured by real estate where the primary source of repayment is not expected to come from the sale or lease of the real property collateral.
We have several pass credit grades that are assigned to loans based on varying levels of risk, ranging from credits that are secured by cash or marketable securities, to watch credits which have all the characteristics of an acceptable credit risk but warrant more than the normal level of monitoring. Within our criticized/classified credit grades are special mention, substandard and doubtful. Special mention loans are those that are currently protected by the sound worth and paying capacity of the borrower, but that are potentially weak and constitute an additional credit risk. These loans have the potential to deteriorate to a substandard grade due to the existence of financial or administrative deficiencies. Substandard loans have a well-defined weakness or weaknesses that jeopardizes the liquidation of the debt. They are characterized by the distinct possibility that we will sustain some loss if the deficiencies are not corrected. Some substandard loans are inadequately protected by the sound worth and paying capacity of the borrower and of the collateral pledged and may be considered impaired. Substandard loans can be accruing or can be on non-accrual depending on the circumstances of the individual loans. Loans classified as doubtful have all the weaknesses inherent in substandard loans with the added characteristics that the weaknesses make collection in full highly questionable and improbable. The possibility of loss is extremely high. All doubtful loans are on non-accrual.
The methodology used in the estimation of the allowance, which is performed at least quarterly, is designed to be dynamic and responsive to changes in portfolio credit quality and forecasted economic conditions. Changes are reflected in the pool-basis
70
allowance and in reserves assigned on an individual basis as the collectability of classified loans is evaluated with new information. As our portfolio has matured, historical loss ratios have been closely monitored. The review of the appropriateness of the allowance is performed by executive management and presented to the audit and risk committees of our board of directors for their review. The committees report to the board as part of the board's review on a quarterly basis of our consolidated financial statements.
When management determines that foreclosure is probable, and for certain collateral-dependent loans where foreclosure is not considered probable, expected credit losses are based on the estimated fair value of the collateral adjusted for selling costs, when appropriate. A loan is considered collateral-dependent when the borrower is experiencing financial difficulty and repayment is expected to be provided substantially through the operation or sale of the collateral.
Expected credit losses are estimated over the contractual term of the loans, adjusted for expected prepayments when appropriate. The contractual term excludes expected extensions, renewals and modifications unless either of the following applies: management has a reasonable expectation that a loan will be restructured, or the extension or renewal options are included in the borrower contract and are not unconditionally cancellable by us.
We do not measure an allowance for credit losses on accrued interest receivable balances because these balances are written off in a timely manner as a reduction to interest income when loans are placed on non-accrual status as discussed above.
Other Real Estate Owned
Other real estate owned (“OREO”), which is included in other assets on the consolidated balance sheet, consists of real estate that has been foreclosed. When foreclosure occurs, the acquired asset is recorded at fair value less selling costs, generally based on appraised value, which may result in partial charge-off of the loan through a charge to the allowance for credit losses, if necessary. Subsequent write-downs required for declines in value are recorded through a valuation allowance, or taken directly to the asset, and are recorded in allowance and other carrying costs for OREO in the consolidated statements of income and other comprehensive income. Gains or losses on sale of OREO are recorded in other non-interest income in the consolidated statements of income and other comprehensive income.
Mortgage Servicing Rights, Net
Mortgage servicing rights ("MSRs") are created by selling mortgage loans with servicing rights retained. We identify classes of servicing rights based upon the nature of the underlying assumptions used to value the asset along with the risks associated with the underlying asset. Based upon these criteria we have one class of MSRs, residential.
MSRs are recognized based on the estimated fair value of the mortgage loans and the related servicing rights at the date of sale using values derived from a valuation model. MSRs are reported on the consolidated balance sheets at amortized cost, less a valuation allowance if the fair value of identified strata within the MSR portfolio are determined to have a fair value that is less than amortized cost. MSRs are amortized proportionally over the estimated life of the projected net servicing revenue and are periodically evaluated for impairment. Loan servicing fee income represents income earned for servicing mortgage loans owned by investors and includes mortgage servicing fees and other ancillary servicing income. Servicing fees are recorded as income when earned and are reported in non-interest income on the consolidated statements of income and other comprehensive income. MSR valuation allowance expense and servicing related expenses are recorded in servicing-related expenses in the consolidated statements of income and other comprehensive income.
The estimated fair value of the MSR assets is obtained from an independent third party and reviewed by management on a quarterly basis. MSRs typically do not trade in an active, open market with readily observable prices; as such, the fair value of MSRs is determined using a discounted cash flow model to calculate the present value of the estimated future net servicing income. The assumptions utilized in the discounted cash flow model are based on market data for comparable assets, where available. Each quarter, management and the independent third party review the key assumptions used in the discounted cash flow model and make adjustments as necessary to estimate the fair value of the MSRs.
Goodwill and Other Intangible Assets, Net
Intangible assets are acquired assets that lack physical substance but can be distinguished from goodwill because of contractual or other legal rights or because the asset is capable of being sold or exchanged either on its own or in combination with a related contract, asset or liability. Our intangible assets relate primarily to loan customer relationships purchased as part of business acquisitions. Intangible assets with definite useful lives are amortized over their estimated life. Goodwill and intangible assets are tested for impairment at least annually or whenever changes in circumstances indicate the carrying amount of the assets may not be recoverable from future undiscounted cash flows. If impaired, the assets are recorded at fair value.
Premises and Equipment, Net
Premises and equipment are stated at cost less accumulated depreciation. Depreciation is computed using the straight-line method over the estimated useful lives of the assets. Furniture and equipment is generally depreciated over three to five years,
71
while leasehold improvements are generally depreciated over the term of their respective lease. Gains or losses on disposals of premises and equipment are included in other non-interest income in the consolidated statements of income and other comprehensive income.
Software
Costs incurred in connection with development or purchase of internal use software and cloud computing arrangements, including in-substance software licenses, are capitalized. Amortization is computed on a straight-line basis over the estimated useful life of the asset, which generally ranges from one to five years. Capitalized software is included in other assets in the consolidated balance sheets.
Financial Instruments with Off-Balance Sheet Risk
The Company has undertaken certain guarantee obligations in the ordinary course of business which include liabilities with off-balance sheet risk. We consider the following arrangements to be guarantees: commitments to extend credit, standby letters of credit and indemnification agreements included within third party contractual arrangements.
The Bank is a party to financial instruments with off-balance sheet risk in the normal course of business to meet the financing needs of its customers. These financial instruments include commitments to extend credit and standby letters of credit that involve varying degrees of credit risk in excess of the amount recognized in the consolidated balance sheets. The Bank’s exposure to credit loss in the event of non-performance by the other party to the financial instrument for commitments to extend credit and standby letters of credit is represented by the contractual amount of these instruments. The Bank uses the same credit policies in making commitments and conditional obligations as it does for on-balance sheet instruments. The amount of collateral obtained, if deemed necessary, is based on management’s credit evaluation of the borrower.
Commitments to extend credit are agreements to lend to a customer as long as there is no violation of any condition established in the contract. Commitments generally have fixed expiration dates or other termination clauses and may require payment of a fee. Since many of the commitments may expire without being drawn upon, the total commitment amounts do not necessarily represent future cash requirements. The Bank evaluates each customer’s creditworthiness on a case-by-case basis.
Standby letters of credit are conditional commitments issued by the Bank to guarantee the performance of a customer to a third party. Those guarantees are primarily issued to support public and private borrowing arrangements. The credit risk involved in issuing letters of credit is essentially the same as that involved in extending loan facilities to customers.
In conjunction with the sale and securitization of loans held for sale and their related servicing rights, we may be exposed to liability resulting from recourse, repurchase and make-whole agreements. If it is determined subsequent to our sale of a loan or its related servicing rights that a breach of the representations or warranties made in the applicable sale agreement has occurred, which may include guarantees that prepayments will not occur within a specified and customary time frame, we may have an obligation to either (a) repurchase the loan for the unpaid principal balance, accrued interest and related advances, (b) indemnify the purchaser against any loss it suffers or (c) make the purchaser whole for the economic benefits of the loan and its related servicing rights.
Our repurchase, indemnification and make-whole obligations vary based upon the terms of the applicable agreements, the nature of the asserted breach and the status of the mortgage loan at the time a claim is made. We establish reserves for estimated losses of this nature inherent in the origination of mortgage loans by estimating the losses inherent in the population of all loans sold based on trends in claims and actual loss severities experienced. The reserve will include accruals for probable contingent losses in addition to those identified in the pipeline of claims received. The estimation process is designed to include amounts based on actual losses experienced from actual activity.
Leases
ASU 2016-02 "Leases (Topic 842)" ("ASU 2016-02") requires that lessees and lessors recognize lease assets and lease liabilities on the balance sheet and disclose key information about leasing arrangements. ASU 2016-02 became effective for us on January 1, 2019. ASU 2016-02 provides for a modified retrospective transition approach requiring lessees to recognize and measure leases on the balance sheet at the beginning of either the earliest period presented or as of the beginning of the period of adoption with the option to elect certain practical expedients. We elected to apply ASU 2016-02 as of the beginning of the period of adoption (January 1, 2019) and have not restated comparative periods. Of the optional practical expedients available under ASU 2016-02, we adopted all expedients except for the hindsight practical expedient. As a result of implementing ASU 2016-02, we recognized an operating lease right-of-use ("ROU") asset of $64 million and an operating lease liability of $74 million on January 1, 2019, with no impact on our consolidated statements of income or consolidated statements of cash flows compared to the prior lease accounting model.
Operating lease ROU assets represent our right to use an underlying asset during the lease term and operating lease liabilities represent our obligation to make lease payments arising from the lease. Operating lease agreements may contain extension options which typically range from 5 to 10 years at the then fair market rental rates. As these extension options are not
72
generally considered reasonably certain of exercise, they are not included in the lease term. ROU assets and operating lease liabilities are recognized at lease commencement based on the present value of the remaining lease payments using a discount rate that represents our incremental borrowing rate at the lease commencement date, which is based on our collateralized borrowing capabilities over a similar term as the related lease payments. ROU assets are further adjusted for lease incentives.
Our operating leases relate primarily to office space and bank branches. Operating leases in which we are the lessee are recorded as operating lease ROU assets and operating lease liabilities, included in other assets and other liabilities, respectively, on our consolidated balance sheets. Operating lease expense, which is comprised of amortization of the ROU asset and the implicit interest accreted on the operating lease liability, is recognized on a straight-line basis over the lease term, and is recorded in net occupancy expense in the consolidated statements of income and other comprehensive income. See Note 6 – Leases for additional information.
Revenue Recognition
ASC 606, Revenue from Contracts with Customers ("ASC 606"), establishes principles for reporting information about the nature, amount, timing and uncertainty of revenue and cash flows arising from the entity's contracts to provide goods or services to customers. The core principle requires an entity to recognize revenue to depict the transfer of goods or services to customers in an amount that reflects the consideration that it expects to be entitled to receive in exchange for those goods or services recognized as performance obligations are satisfied.
The majority of our revenue-generating transactions are not subject to ASC 606, including revenue generated from financial instruments, such as our loans, letters of credit, derivatives and investment securities, as well as revenue related to our mortgage servicing activities, as these activities are subject to other GAAP discussed elsewhere within our disclosures. Descriptions of our revenue-generating activities that are within the scope of ASC 606, which are presented in our income statements as components of non-interest income are as follows:
•Service charges on deposit accounts - these represent general service fees for monthly account maintenance and activity- or transaction-based fees and consist of transaction-based revenue, time-based revenue (service period), item-based revenue or some other individual attribute-based revenue. Revenue is recognized when our performance obligation is completed, which is generally monthly for account maintenance services or when a transaction has been completed (such as a wire transfer). Payments for such performance obligations are generally received at the time the performance obligations are satisfied.
•Wealth management and trust fee income - this represents monthly fees due from wealth management customers as consideration for managing the customers' assets. Wealth management and trust services include custody of assets, investment management, escrow services, fees for trust services and similar fiduciary activities. Revenue is recognized when our performance obligation is completed each month, which is generally the time that payment is received. Also included are fees received from a third party broker-dealer as part of a revenue-sharing agreement for fees earned from customers that we refer to the third party. These fees are paid to us by the third party on a quarterly basis and recognized ratably throughout the quarter as our performance obligation is satisfied.
•Brokered loan fees - these represent fees for the administration and funding of purchased mortgage loan interests as well as facility renewal and application fees received from mortgage originator customers in our mortgage warehouse lending business. Also included are fees received from independent correspondent mortgage lenders as consideration for our purchase of individual residential mortgage loans through our MCA business. Revenue related to the mortgage warehouse lending business is recognized when the related loan interest is disposed (i.e., through sale or payoff) or upon receipt of the facility renewal or application. Revenue related to our MCA business is recognized at the time a loan is purchased.
•Other non-interest income primarily includes items such as letter of credit fees, bank owned life insurance income, dividends on FHLB and FRB stock and other general operating income, none of which are subject to the requirements of ASC 606.
Stock-based Compensation
We account for all stock-based compensation transactions in accordance with ASC 718, Compensation — Stock Compensation (“ASC 718”), which requires that stock compensation transactions be recognized as compensation expense in the consolidated statements of income and other comprehensive income based on their fair values on the measurement date, which is the date of the grant.
Income Taxes
The Company and its subsidiary file a consolidated federal income tax return. We utilize the liability method in accounting for income taxes. Under this method, deferred tax assets and liabilities are determined based upon the difference between the values of the assets and liabilities as reflected in the financial statements and their related tax basis using enacted tax rates in
73
effect for the year in which the differences are expected to be collectedrecovered or settled. As changes in tax law or rates are enacted, deferred tax assets and wasliabilities are adjusted through the provision for income taxes. A valuation allowance is provided against deferred tax assets unless it is more likely than not that such deferred tax assets will be realized.
Unrecognized tax benefits for the uncertain portion of recorded tax benefits and related interest may result from the application of complex tax laws, rules, regulations and interpretations. Unrecognized tax benefits, as well as estimated penalties and interest, are assessed quarterly and may be adjusted through current income tax expense in future periods based on changing facts and circumstances, completion of examinations by taxing authorities or expiration of a statute of limitations.
Fair Values of Financial Instruments
ASC 820, Fair Value Measurements and Disclosures (“ASC 820”), defines fair value, establishes a framework for measuring fair value under GAAP and enhances disclosures about fair value measurements. The standard describes three levels of inputs that may be used to measure fair value as provided below.
Level 1 Quoted prices in active markets for identical assets or liabilities.
Level 2 Observable inputs other than Level 1 prices, such as quoted prices for similar assets or liabilities; quoted prices in markets that are not active; or other inputs that are observable or can be corroborated by observable market data for substantially the full term of the assets or liabilities.
Level 3 Unobservable inputs that are supported by little or no market activity and that are significant to the fair value of the assets or liabilities. Level 3 assets and liabilities include financial instruments whose value is determined using pricing models, discounted cash flow methodologies, or similar techniques, as well as instruments for which the determination of fair values requires significant management judgment or estimation.
Also required are disclosures of fair value information about financial instruments, whether or not recognized on the balance sheet, for which it is practical to estimate that value. In cases where quoted market prices are not available, fair values are based on estimates using present value or other valuation techniques. Those techniques are significantly affected by the assumptions used, including the discount rate and estimates of future cash flows. The disclosure of fair value information about financial instruments does not and is not intended to represent the fair value of the Company.
The following are descriptions of the methods and significant assumptions used by the Company in estimating its fair value disclosures for financial instruments:
Cash and Cash Equivalents, Variable Rate Loans, and Variable Rate Debt
The fair value of these financial instruments approximates carrying value.
Investment Securities
Within the investment securities portfolio, we hold equity securities related to our non-qualified deferred compensation plan that are valued using quoted market prices for identical equity securities in an active market, and are classified as Level 1 assets in the fair value hierarchy. We also hold Community Reinvestment Act equity securities that are valued using quoted market prices for identical equity securities in an inactive market that we classify as Level 2 assets in the fair value hierarchy.The fair value of our U.S. government agency and residential mortgage-backed securities are based on prices obtained from independent pricing services that are based on quoted market prices for the same or similar securities, and are characterized as Level 2 assets in the fair value hierarchy. We obtain documentation from our primary pricing service regarding their processes and controls applicable to pricing investment securities, and on a quarterly basis independently verify the prices that we receive from the service provider using two additional independent pricing sources. We also hold tax-exempt asset-backed securities and CRT securities that are valued using a discounted cash flow model, which utilizes Level 3 inputs, and are classified as Level 3 assets in the fair value hierarchy.
Loans Held for Sale
The fair value for loans held for sale is derived from quoted market prices for similar loans, in which case they are characterized as Level 2 assets in the fair value hierarchy, or is derived from third party pricing models, in which case they are characterized as Level 3 assets in the fair value hierarchy.
Derivative Assets and Liabilities
The estimated fair value of interest rate swaps and caps is obtained from independent pricing services based on quoted market prices for similar derivative contracts and these financial instruments are characterized as Level 2 assets and liabilities in the fair value hierarchy. On a quarterly basis, we independently verify the fair value using an additional independent pricing source. Foreign currency forward contracts are valued based upon quoted market prices obtained from independent pricing services for similar derivative contracts. As such, these financial instruments are characterized as Level 2 assets and liabilities in the fair
74
value hierarchy. The derivative instruments related to the loans held for sale portfolio include loan purchase commitments and forward sale commitments. Loan purchase commitments are valued based upon the fair value of the underlying mortgage loans to be purchased, which is based on observable market data for similar loans. Forward sale commitments are valued based upon quoted market prices from brokers. As such, these loan purchase commitments and forward sales commitments are characterized as Level 2 assets or liabilities in the fair value hierarchy. The derivative instruments related to our residential MSRs include interest rate swap futures and forward sale commitments. The interest rate swap futures are valued based on quoted market prices obtained from brokers for similar derivative contracts, while the forward sale commitments are valued based on the fair value of the underlying mortgage loans to be purchased, which is based on observable market data for similar loans. As such, these derivative instruments are characterized as Level 2 assets and liabilities in the fair value hierarchy.
Derivative Financial Instruments
All contracts that satisfy the definition of a derivative are recorded at fair value in other assets and other liabilities in the consolidated balance sheets. We record the derivatives on a net basis when a right of offset exists with a single counterparty that is subject to a legally enforceable master netting agreement.
We enter into interest rate derivative contracts that are not designated as hedging instruments. These derivative positions relate to transactions in which we enter into an interest rate swap, cap and/or floor with a customer while at the same time entering into an offsetting interest rate swap, cap and/or floor with another financial institution. In connection with each swap transaction, we agree to pay interest to the customer on a notional amount at a variable interest rate and receive interest from the customer on a similar notional amount at a fixed interest rate. At the same time, we agree to pay another financial institution the same fixed interest rate on the same notional amount and receive the same variable interest rate on the same notional amount. The transaction allows our customer to effectively convert a variable rate loan to a fixed rate. Because we act as an intermediary for our customer, changes in the fair value of the underlying derivative contracts substantially offset each other and do not have a material impact on our results of operations.
We also enter into foreign currency forward contracts that are not designateed as hedging instruments. These derivative instruments relate to transactions in which we enter into a contract with a customer to buy or sell a foreign currency at a future date for a specified price while at the same time entering into an offsetting contract with a financial institution to buy or sell the same currency at the same future date for a specified price. These transactions allow our customers to manage their exposure to foreign currency exchange rate fluctuations. Because we act as an intermediary for our customer, changes in the fair value of the underlying derivative instruments substantially offset each other and do not have a material impact on our results of operations.
As part of our MCA program, we enter into loan purchase commitment contracts with mortgage originators to purchase residential mortgage loans at a future date, as well as forward sales commitment contracts to sell residential mortgage loans or to deliver mortgage-backed securities at a future date. The objective of these transactions is to mitigate our exposure to interest rate risk associated with the purchase of mortgage loans held for sale. Any changes in fair value are recorded in gain/(loss) on sale of loans held for sale in the consolidated statements of income and other non-interest expense. Basedcomprehensive income.
To mitigate exposure to potential impairment losses from adverse changes in the fair value of our residential MSR portfolio, we enter into interest rate derivative contracts, primarily interest rate swap futures and forward sale commitments of mortgage-backed securities. These derivative instruments are considered highly liquid and can be settled daily, which allows us to dynamically manage our exposure. The derivative instruments are used to economically hedge the fair value of the residential MSR portfolio impacted by changes in anticipated prepayments resulting from mortgage interest rate movements and are classified as other assets and other liabilities on the results of our periodic review at December 31, 2019, no additional other-than-temporary credit-related impairment was recorded onconsolidated balance sheets. Any unrealized or realized gains/(losses) related to derivatives economically hedging the CRT securities, as the remaining loss position is not believed to be other-than-temporary. Our periodic review at December 31, 2019 included an evaluation of the near-term prospects of the investmentsresidential MSR portfolio are recognized in relationservicing-related expenses along with changes to the severity and duration of the unrealized losses. Based on that evaluation weMSR valuation allowance.
Segment Reporting
We have determined that weall of our lending divisions and subsidiaries meet the aggregation criteria of ASC 280, Segment Reporting, since all offer similar products and services, operate with similar processes, have similar customers and are collectively reviewed by the abilitychief operating decision maker.
75
(2) Earnings Per Share
The following table presents the computation of basic and intentdiluted earnings per share:
| Year ended December 31, | |||||||||||||||||
| (in thousands except per share data) | 2020 | 2019 | 2018 | ||||||||||||||
| Numerator: | |||||||||||||||||
| Net income | $ | 66,289 | $ | 312,015 | $ | 293,387 | |||||||||||
| Preferred stock dividends | 9,750 | 9,750 | 9,750 | ||||||||||||||
| Net income available to common stockholders | $ | 56,539 | $ | 302,265 | $ | 283,637 | |||||||||||
| Denominator: | |||||||||||||||||
| Denominator for basic earnings per share—weighted average shares | 50,430,326 | 50,286,300 | 49,936,702 | ||||||||||||||
| Effect of employee stock-based awards(1) | 152,653 | 132,904 | 218,275 | ||||||||||||||
| Effect of warrants to purchase common stock | 0 | 0 | 117,895 | ||||||||||||||
| Denominator for dilutive earnings per share—adjusted weighted average shares and assumed conversions | 50,582,979 | 50,419,204 | 50,272,872 | ||||||||||||||
| Basic earnings per common share | $ | 1.12 | $ | 6.01 | $ | 5.68 | |||||||||||
| Diluted earnings per common share | $ | 1.12 | $ | 5.99 | $ | 5.64 | |||||||||||
(1)SARs and RSUs outstanding of 453,024, 86,308 and 27,100 in 2020, 2019 and 2018, respectively, have not been included in diluted earnings per share because to holddo so would have been antidilutive for the investments until recovery of fair value.periods presented.
(3) Investment Securities
Equity Securities
Beginning January 1, 2018, upon adoption of ASU 2016-01 "Recognition and Measurement of Financial Assets and Financial Liabilities," equity securities with readily determinable fair values are stated at fair value with realized and unrealized gains and losses reported in income. For periods prior to January 1, 2018, equity securities were classified as available-for-sale and stated at fair value with unrealized gains and losses reported as a separate component of AOCI, net of tax. Equity securities consistwithout readily determinable fair values are recorded at cost less any impairment, if any.
67
Loans
Loans Held for Sale
Through our mortgage correspondent aggregation ("MCA") program, we commit to purchase residential mortgage loans from independent correspondent lenders and investments relateddeliver those loans into the secondary market via whole loan sales to independent third parties or in securitization transactions to third parties such as Ginnie Mae or to government sponsored entities such as Fannie Mae or Freddie Mac ("GSEs"). In some cases, we retain the mortgage servicing rights. Once purchased, these loans are classified as held for sale and are carried at fair value pursuant to our non-qualified deferred compensation plan.election of the fair value option in accordance with Accounting Standards Codification ("ASC") 825, Financial Instruments. At December 31, 2019the commitment date, we enter into a corresponding forward sale commitment with a third party, typically Ginnie Mae or a GSE, to deliver the loans within a specified timeframe. The estimated gain/loss for the entire transaction (from initial purchase commitment to final delivery of loans) is recorded as an asset or liability. The fair value of loans held for sale is derived from observable current market prices, when available, and December 31, 2018, we had $25.6 millionincludes the fair value of the mortgage servicing rights. Adjustments to reflect unrealized gains and $17.2 million, respectively,losses resulting from changes in equity securities recorded at fair value. The following is a summary of unrealizedvalue and realized gains/(losses) recognizedgains and losses upon ultimate sale of the loans are classified as gain/(loss) on equity securities and included in other non-interest incomesale of loans held for sale in the consolidated statements of income:
| Year Ended December 31, | ||||||||
| (in thousands) | 2019 | 2018 | ||||||
| Net gains/(losses) recognized during the period | $ | 2,383 | $ | (975 | ) | |||
| Less: Realized net gains/(losses) recognized during the period on equity securities sold | 119 | 460 | ||||||
| Unrealized net gains/(losses) recognized during the period on equity securities still held | $ | 2,264 | $ | (1,435 | ) | |||
| December 31, | |||||||
| (in thousands) | 2019 | 2018 | |||||
| Commercial | $ | 10,230,828 | $ | 10,373,288 | |||
| Mortgage finance(1) | 8,169,849 | 5,877,524 | |||||
| Construction | 2,563,339 | 2,120,966 | |||||
| Real estate | 3,444,701 | 3,929,117 | |||||
| Consumer | 71,463 | 63,438 | |||||
| Equipment leases | 256,462 | 312,191 | |||||
| Gross loans held for investment | 24,736,642 | 22,676,524 | |||||
| Deferred income (net of direct origination costs) | (90,380 | ) | (108,450 | ) | |||
| Allowance for loan losses | (195,047 | ) | (191,522 | ) | |||
| Total loans held for investment, net | $ | 24,451,215 | $ | 22,376,552 | |||
| (in thousands) | Commercial | Mortgage Finance | Construction | Real Estate | Consumer | Equipment Leases | Total | ||||||||||||||||||||
| December 31, 2019 | |||||||||||||||||||||||||||
| Grade: | |||||||||||||||||||||||||||
| Pass | $ | 9,751,645 | $ | 8,169,849 | $ | 2,540,059 | $ | 3,364,554 | $ | 71,289 | $ | 255,171 | $ | 24,152,567 | |||||||||||||
| Special mention | 198,269 | — | 6,590 | 52,919 | 140 | 1,062 | 258,980 | ||||||||||||||||||||
| Substandard-accruing | 67,454 | — | 16,690 | 15,528 | — | 39 | 99,711 | ||||||||||||||||||||
| Non-accrual | 213,460 | — | — | 11,700 | 34 | 190 | 225,384 | ||||||||||||||||||||
| Total loans held for investment | $ | 10,230,828 | $ | 8,169,849 | $ | 2,563,339 | $ | 3,444,701 | $ | 71,463 | $ | 256,462 | $ | 24,736,642 | |||||||||||||
| December 31, 2018 | |||||||||||||||||||||||||||
| Grade: | |||||||||||||||||||||||||||
| Pass | $ | 10,034,597 | $ | 5,877,524 | $ | 2,099,955 | $ | 3,850,811 | $ | 61,815 | $ | 309,775 | $ | 22,234,477 | |||||||||||||
| Special mention | 120,531 | — | 21,011 | 47,644 | — | 2,223 | 191,409 | ||||||||||||||||||||
| Substandard-accruing | 140,297 | — | — | 28,205 | 1,568 | 193 | 170,263 | ||||||||||||||||||||
| Non-accrual | 77,863 | — | — | 2,457 | 55 | — | 80,375 | ||||||||||||||||||||
| Total loans held for investment | $ | 10,373,288 | $ | 5,877,524 | $ | 2,120,966 | $ | 3,929,117 | $ | 63,438 | $ | 312,191 | $ | 22,676,524 | |||||||||||||
| (in thousands) | Commercial | Mortgage Finance | Construction | Real Estate | Consumer | Equipment Leases | Additional Qualitative Reserve | Total | ||||||||||||||||
| Year ended December 31, 2019 | ||||||||||||||||||||||||
| Allowance for loan losses: | ||||||||||||||||||||||||
| Beginning balance | $ | 129,442 | $ | — | $ | 19,242 | $ | 33,353 | $ | 425 | $ | 1,829 | $ | 7,231 | $ | 191,522 | ||||||||
| Provision for loan losses | 106,345 | 2,265 | (4,469 | ) | (17,189 | ) | (441 | ) | (1,486 | ) | (7,231 | ) | 77,794 | |||||||||||
| Charge-offs | 76,958 | — | — | 662 | — | 19 | — | 77,639 | ||||||||||||||||
| Recoveries | 3,290 | — | — | — | 69 | 11 | — | 3,370 | ||||||||||||||||
| Net charge-offs (recoveries) | 73,668 | — | — | 662 | (69 | ) | 8 | — | 74,269 | |||||||||||||||
| Ending balance | $ | 162,119 | $ | 2,265 | $ | 14,773 | $ | 15,502 | $ | 53 | $ | 335 | $ | — | $ | 195,047 | ||||||||
| Period end allowance for loan losses allocated to: | ||||||||||||||||||||||||
| Loans individually evaluated for impairment | $ | 59,832 | $ | — | $ | — | $ | 549 | $ | 7 | $ | 36 | $ | — | $ | 60,424 | ||||||||
| Loans collectively evaluated for impairment | 102,287 | 2,265 | 14,773 | 14,953 | 46 | 299 | — | 134,623 | ||||||||||||||||
| Total | $ | 162,119 | $ | 2,265 | $ | 14,773 | $ | 15,502 | $ | 53 | $ | 335 | $ | — | $ | 195,047 | ||||||||
| Period end loans allocated to: | ||||||||||||||||||||||||
| Loans individually evaluated for impairment | $ | 213,460 | $ | — | $ | — | $ | 11,700 | $ | 34 | $ | 190 | $ | — | $ | 225,384 | ||||||||
| Loans collectively evaluated for impairment | 10,017,368 | 8,169,849 | 2,563,339 | 3,433,001 | 71,429 | 256,272 | — | 24,511,258 | ||||||||||||||||
| Total | $ | 10,230,828 | $ | 8,169,849 | $ | 2,563,339 | $ | 3,444,701 | $ | 71,463 | $ | 256,462 | $ | — | $ | 24,736,642 | ||||||||
| Year ended December 31, 2018 | ||||||||||||||||||||||||
| Allowance for loan losses: | ||||||||||||||||||||||||
| Beginning balance | $ | 118,806 | $ | — | $ | 19,273 | $ | 34,287 | $ | 357 | $ | 3,542 | $ | 8,390 | $ | 184,655 | ||||||||
| Provision for loan losses | 87,860 | — | (31 | ) | (1,003 | ) | 397 | (1,427 | ) | (1,159 | ) | 84,637 | ||||||||||||
| Charge-offs | 79,692 | — | — | — | 767 | 319 | — | 80,778 | ||||||||||||||||
| Recoveries | 2,468 | — | — | 69 | 438 | 33 | — | 3,008 | ||||||||||||||||
| Net charge-offs (recoveries) | 77,224 | — | — | (69 | ) | 329 | 286 | — | 77,770 | |||||||||||||||
| Ending balance | $ | 129,442 | $ | — | $ | 19,242 | $ | 33,353 | $ | 425 | $ | 1,829 | $ | 7,231 | $ | 191,522 | ||||||||
| Period end allowance for loan losses allocated to: | ||||||||||||||||||||||||
| Loans individually evaluated for impairment | $ | 8,252 | $ | — | $ | — | $ | 48 | $ | 10 | $ | — | $ | — | $ | 8,310 | ||||||||
| Loans collectively evaluated for impairment | 121,190 | — | 19,242 | 33,305 | 415 | 1,829 | 7,231 | 183,212 | ||||||||||||||||
| Total | $ | 129,442 | $ | — | $ | 19,242 | $ | 33,353 | $ | 425 | $ | 1,829 | $ | 7,231 | $ | 191,522 | ||||||||
| Period end loans allocated to: | ||||||||||||||||||||||||
| Loans individually evaluated for impairment | $ | 78,428 | $ | — | $ | — | $ | 8,857 | $ | 55 | $ | — | $ | — | $ | 87,340 | ||||||||
| Loans collectively evaluated for impairment | 10,294,860 | 5,877,524 | 2,120,966 | 3,920,260 | 63,383 | 312,191 | — | 22,589,184 | ||||||||||||||||
| Total | $ | 10,373,288 | $ | 5,877,524 | $ | 2,120,966 | $ | 3,929,117 | $ | 63,438 | $ | 312,191 | $ | — | $ | 22,676,524 | ||||||||
| (in thousands) | Recorded Investment | Unpaid Principal Balance | Related Allowance | Average Recorded Investment | Interest Income Recognized | ||||||||||||||
| December 31, 2019 | |||||||||||||||||||
| With no related allowance recorded: | |||||||||||||||||||
| Commercial | |||||||||||||||||||
| Business loans | $ | 35,932 | $ | 51,172 | $ | — | $ | 20,074 | $ | — | |||||||||
| Energy loans | 57,722 | 58,519 | — | 15,692 | — | ||||||||||||||
| Real estate | |||||||||||||||||||
| Market risk | 8,500 | 8,806 | — | 4,980 | — | ||||||||||||||
| Commercial | 881 | 881 | — | 5,100 | — | ||||||||||||||
| Secured by 1-4 family | 1,218 | 1,218 | — | 1,226 | — | ||||||||||||||
| Consumer | — | — | — | — | — | ||||||||||||||
| Equipment leases | — | — | — | — | — | ||||||||||||||
| Total impaired loans with no allowance recorded | $ | 104,253 | $ | 120,596 | $ | — | $ | 47,072 | $ | — | |||||||||
| With an allowance recorded: | |||||||||||||||||||
| Commercial | |||||||||||||||||||
| Business loans | $ | 52,479 | $ | 55,422 | $ | 29,467 | $ | 27,288 | $ | — | |||||||||
| Energy loans | 67,327 | 87,067 | 30,365 | 51,232 | — | ||||||||||||||
| Real estate | |||||||||||||||||||
| Market risk | 870 | 870 | 499 | 2,257 | — | ||||||||||||||
| Commercial | — | — | — | — | — | ||||||||||||||
| Secured by 1-4 family | 231 | 231 | 50 | 621 | — | ||||||||||||||
| Consumer | 34 | 34 | 7 | 63 | — | ||||||||||||||
| Equipment leases | 190 | 190 | 36 | 16 | — | ||||||||||||||
| Total impaired loans with an allowance recorded | $ | 121,131 | $ | 143,814 | $ | 60,424 | $ | 81,477 | $ | — | |||||||||
| Combined: | |||||||||||||||||||
| Commercial | |||||||||||||||||||
| Business loans | $ | 88,411 | $ | 106,594 | $ | 29,467 | $ | 47,362 | $ | — | |||||||||
| Energy loans | 125,049 | 145,586 | 30,365 | 66,924 | — | ||||||||||||||
| Real estate | |||||||||||||||||||
| Market risk | 9,370 | 9,676 | 499 | 7,237 | — | ||||||||||||||
| Commercial | 881 | 881 | — | 5,100 | — | ||||||||||||||
| Secured by 1-4 family | 1,449 | 1,449 | 50 | 1,847 | — | ||||||||||||||
| Consumer | 34 | 34 | 7 | 63 | — | ||||||||||||||
| Equipment leases | 190 | 190 | 36 | 16 | — | ||||||||||||||
| Total impaired loans | $ | 225,384 | $ | 264,410 | $ | 60,424 | $ | 128,549 | $ | — | |||||||||
| (in thousands) | Recorded Investment | Unpaid Principal Balance | Related Allowance | Average Recorded Investment | Interest Income Recognized | ||||||||||||||
| December 31, 2018 | |||||||||||||||||||
| With no related allowance recorded: | |||||||||||||||||||
| Commercial | |||||||||||||||||||
| Business loans | $ | 23,367 | $ | 55,008 | $ | — | $ | 16,426 | $ | 133 | |||||||||
| Energy loans | 12,188 | 13,363 | — | 17,135 | — | ||||||||||||||
| Real estate | |||||||||||||||||||
| Market risk | — | — | — | — | — | ||||||||||||||
| Commercial | 7,388 | 7,388 | — | 3,215 | — | ||||||||||||||
| Secured by 1-4 family | 1,233 | 1,233 | — | 734 | — | ||||||||||||||
| Consumer | — | — | — | — | — | ||||||||||||||
| Equipment leases | — | — | — | — | — | ||||||||||||||
| Total impaired loans with no allowance recorded | $ | 44,176 | $ | 76,992 | $ | — | $ | 37,510 | $ | 133 | |||||||||
| With an allowance recorded: | |||||||||||||||||||
| Commercial | |||||||||||||||||||
| Business loans | $ | 17,529 | $ | 17,564 | $ | 4,679 | $ | 41,307 | $ | — | |||||||||
| Energy loans | 25,344 | 28,105 | 3,573 | 25,672 | — | ||||||||||||||
| Real estate | |||||||||||||||||||
| Market risk | — | — | — | 49 | — | ||||||||||||||
| Commercial | — | — | — | 83 | — | ||||||||||||||
| Secured by 1-4 family | 236 | 236 | 48 | 188 | — | ||||||||||||||
| Consumer | 55 | 55 | 10 | 54 | — | ||||||||||||||
| Equipment leases | — | — | — | 275 | — | ||||||||||||||
| Total impaired loans with an allowance recorded | $ | 43,164 | $ | 45,960 | $ | 8,310 | $ | 67,628 | $ | — | |||||||||
| Combined: | |||||||||||||||||||
| Commercial | |||||||||||||||||||
| Business loans | $ | 40,896 | $ | 72,572 | $ | 4,679 | $ | 57,733 | $ | 133 | |||||||||
| Energy loans | 37,532 | 41,468 | 3,573 | 42,807 | — | ||||||||||||||
| Real estate | |||||||||||||||||||
| Market risk | — | — | — | 49 | — | ||||||||||||||
| Commercial | 7,388 | 7,388 | — | 3,298 | — | ||||||||||||||
| Secured by 1-4 family | 1,469 | 1,469 | 48 | 922 | — | ||||||||||||||
| Consumer | 55 | 55 | 10 | 54 | — | ||||||||||||||
| Equipment leases | — | — | — | 275 | — | ||||||||||||||
| Total impaired loans | $ | 87,340 | $ | 122,952 | $ | 8,310 | $ | 105,138 | $ | 133 | |||||||||
| (in thousands) | 30-59 Days Past Due | 60-89 Days Past Due | 90 Days or More Past Due(1) | Total Past Due | Non-accrual | Current | Total | ||||||||||||||||||||
| December 31, 2019 | |||||||||||||||||||||||||||
| Commercial | |||||||||||||||||||||||||||
| Business loans | $ | 8,746 | $ | 9,299 | $ | 17,285 | $ | 35,330 | $ | 88,411 | $ | 8,681,989 | $ | 8,805,730 | |||||||||||||
| Energy | — | — | — | — | 125,049 | 1,300,049 | 1,425,098 | ||||||||||||||||||||
| Mortgage finance loans | — | — | — | — | — | 8,169,849 | 8,169,849 | ||||||||||||||||||||
| Construction | |||||||||||||||||||||||||||
| Market risk | — | — | — | — | — | 2,457,986 | 2,457,986 | ||||||||||||||||||||
| Commercial | — | — | — | — | — | 93,764 | 93,764 | ||||||||||||||||||||
| Secured by 1-4 family | — | — | — | — | — | 11,589 | 11,589 | ||||||||||||||||||||
| Real estate | |||||||||||||||||||||||||||
| Market risk | 10,786 | — | — | 10,786 | 9,370 | 2,238,384 | 2,258,540 | ||||||||||||||||||||
| Commercial | — | 495 | 193 | 688 | 881 | 810,149 | 811,718 | ||||||||||||||||||||
| Secured by 1-4 family | 104 | 179 | 106 | 389 | 1,449 | 372,605 | 374,443 | ||||||||||||||||||||
| Consumer | — | 212 | — | 212 | 34 | 71,217 | 71,463 | ||||||||||||||||||||
| Equipment leases | 304 | — | — | 304 | 190 | 255,968 | 256,462 | ||||||||||||||||||||
| Total loans held for investment | $ | 19,940 | $ | 10,185 | $ | 17,584 | $ | 47,709 | $ | 225,384 | $ | 24,463,549 | $ | 24,736,642 | |||||||||||||
| Extended Maturity | Adjusted Payment Schedule | Total | |||||||||||||||||
| (in thousands, except number of contracts) | Number of Contracts | Balance at Period End | Number of Contracts | Balance at Period End | Number of Contracts | Balance at Period End | |||||||||||||
| Year Ended December 31, 2019 | |||||||||||||||||||
| Commercial | |||||||||||||||||||
| Business loans | 1 | $ | 1,753 | 3 | $ | 21,193 | 4 | $ | 22,946 | ||||||||||
| Energy loans | 1 | 3,935 | — | — | 1 | 3,935 | |||||||||||||
| Total | 2 | $ | 5,688 | 3 | $ | 21,193 | $ | 5 | $ | 26,881 | |||||||||
| Year Ended December 31, 2018 | |||||||||||||||||||
| Commercial | |||||||||||||||||||
| Business loans | — | $ | — | 2 | $ | 2,411 | $ | 2 | $ | 2,411 | |||||||||
| Energy loans | — | — | 5 | 10,047 | 5 | 10,047 | |||||||||||||
| Total | — | $ | — | 7 | $ | 12,458 | $ | 7 | $ | 12,458 | |||||||||
| Year ended December 31, | |||||||||||
| (in thousands) | 2019 | 2018 | 2017 | ||||||||
| Beginning balance | $ | 79 | $ | 11,742 | $ | 18,961 | |||||
| Additions | — | — | — | ||||||||
| Sales | (79 | ) | (11,663 | ) | (1,108 | ) | |||||
| Valuation allowance for OREO | — | — | — | ||||||||
| Direct write-downs | — | — | (6,111 | ) | |||||||
| Ending balance | $ | — | $ | 79 | $ | 11,742 | |||||
| Year Ended December 31, | ||||||||
| (in thousands) | 2019 | 2018 | ||||||
| Outstanding balance(1): | ||||||||
| Beginning balance | $ | 1,949,785 | $ | 1,012,580 | ||||
| Loans purchased and originated | 10,183,057 | 6,753,709 | ||||||
| Payments and loans sold | (9,564,480 | ) | (5,816,504 | ) | ||||
| Ending balance | 2,568,362 | 1,949,785 | ||||||
| Fair value adjustment: | ||||||||
| Beginning balance | 19,689 | (1,576 | ) | |||||
| Increase/(decrease) to fair value | (10,917 | ) | 21,265 | |||||
| Ending balance | 8,772 | 19,689 | ||||||
| Loans held for sale at fair value | $ | 2,577,134 | $ | 1,969,474 | ||||
Pursuant to Ginnie Mae servicing guidelines, we have the unilateral right, but not the obligation, to repurchase certain delinquent loans securitized in Ginnie Mae pools, if they meet defined delinquent loan criteria. Once the delinquency criteria arehave been met, and therefore must record as held for sale on our balance sheet regardless of whether the repurchase option has been exercised. At December 31, 2018, $16.0 million ofexercised, we account for these loans as if they had been repurchased and recognize the $16.8 million in loans and a corresponding liability as held for sale wereand other liabilities, respectively, in the consolidated balance sheets. If the loans guaranteed by U.S. government agencies that were purchased out ofare actually repurchased, the liability is extinguished and the loans continue to be reported as held for sale. As a Ginnie Mae securities and recorded asapproved lender, we may recover losses incurred on repurchased loans held for sale, at fair value, onthrough a claims process with the balance sheet.
From time to time we retainhold for sale the rightguaranteed portion of Small Business Administration 7(a) loans, which are carried at lower of cost or market.
Loans Held for Investment
Loans held for investment (including financing leases) are stated at the amount of unpaid principal reduced by deferred income (net of costs). Interest on loans is recognized using the simple interest method on the daily balances of the principal amounts outstanding. Loan origination fees, net of direct loan origination costs, and commitment fees are deferred and amortized as an adjustment to serviceyield over the life of the loan, or over the commitment period, as applicable.
Restructured loans are loans on which, due to the borrower’s financial difficulties, we have granted a concession that we would not otherwise consider for borrowers of similar credit quality. This may include a transfer of real estate or other assets from the borrower, a modification of loan terms, or a combination of the two. Modifications of terms that could potentially qualify as a restructuring include reduction of contractual interest rate, extension of the maturity date at a contractual interest rate lower than the current rate for new debt with similar risk, a reduction of the face amount of debt or forgiveness of either principal or accrued interest. A loan continues to qualify as restructured until a consistent payment history or change in the borrower’s financial condition has been evidenced, generally for no less than twelve months. If the restructuring agreement specifies an interest rate at the time of the restructuring that is greater than or equal to the rate that we are willing to accept for a new extension of credit with comparable risk, then the loan is no longer considered a restructuring if it is in compliance with the modified terms in calendar years after the year of the restructure.
A loan is considered past due when a contractually due payment has not been received by the contractual due date. We place a loan on non-accrual when there is a clear indication that the borrower’s cash flow may not be sufficient to meet payments as they become due, which is generally when a loan is 90 days past due. When a loan is placed on non-accrual status, all previously accrued and unpaid interest is reversed as a reduction of current period interest income. Interest income is subsequently recognized on a cash basis as long as the remaining book balance of the asset is deemed to be collectible. If collectability is questionable, then cash payments are applied to principal. A loan is placed back on accrual status when both principal and interest are current and it is probable that we will be able to collect all amounts due (both principal and interest) according to the terms of the loan agreement.
Loans held for investment includes legal ownership interests in mortgage loans that we purchase through our mortgage warehouse lending division. The ownership interests are purchased from unaffiliated mortgage originators who are seeking additional funding through sale of the undivided ownership interests to facilitate their ability to originate loans. The mortgage originator has no obligation to offer and we have no obligation to purchase these interests. The originator closes mortgage loans
68
consistent with underwriting standards established by approved investors, and, at the time of the sale to the investor, our ownership interest and that of the originator are delivered by us to the investor selected by the originator and approved by us. We typically purchase up to a 99% ownership interest in each mortgage with the originator owning the remaining percentage. These mortgage ownership interests are generally held by us for a period of less than 30 days and more typically 10-20 days. Because of conditions in agreements with originators designed to reduce transaction risks, under ASC 860, Transfers and Servicing of Financial Assets (“ASC 860”), the ownership interests do not qualify as participating interests. Under ASC 860, the ownership interests are deemed to be loans to the originators and payments we receive from investors are deemed to be payments made by or on behalf of the originator to repay the loan deemed made to the originator. Because we have an actual, legal ownership interest in the underlying residential mortgage loan, these interests are reported as extensions of credit to the originators that are secured by the mortgage loans as collateral.
Due to market conditions or events of default by the investor or the originator, we could be required to purchase the remaining interests in the mortgage loans and hold them beyond the expected 10-20 days. Mortgage loans acquired under these conditions would require mark-to-market adjustments to income and could require further allocations of the allowance for credit losses or be subject to charge-off in the event the loans sold throughbecome impaired.
Allowance for Credit Losses
The allowance for credit losses is an estimate of the expected credit losses in the loans held for investment and available-for-sale debt securities portfolio. The following is our MCA program, creating MSRsdiscussion of the allowance for credit losses on loans held for investment. See "Investment Securities - Available-for-Sale" above for discussion of the allowance for credit losses on available-for-sale debt securities.
ASU 2016-13 replaces the incurred loss impairment model, which recognizes losses when it becomes probable that a credit loss will be incurred, with a requirement to recognize lifetime expected credit losses immediately when a financial asset is originated or purchased. The allowance for credit losses is a valuation account that is deducted from the amortized cost basis of loans to present the net amount expected to be collected on the loans. Loans, or portions thereof, are charged off against the allowance when they are deemed uncollectible. Expected recoveries do not exceed the aggregate of amounts previously charged-off and expected to be charged-off.
Management estimates the allowance balance using relevant available information, from internal and external sources, relating to past events, current conditions and reasonable and supportable forecasts. Historical credit loss experience provides the basis for the estimation of expected credit losses. Adjustments to historical loss information are made for differences in current loan-specific risk characteristics such as differences in underwriting standards, portfolio mix, credit quality, or term, as well as for changes in macroeconomic conditions, such as changes in unemployment rates, crude oil prices, property values or other relevant factors.
The allowance for credit losses is comprised of reserves measured on a collective (pool) basis based on a lifetime loss-rate model when similar risk characteristics exist. Reserves on loans that do not share risk characteristics are evaluated on an individual basis. In order to determine the allowance for credit losses, all loans are assigned a credit grade. Loans graded substandard or worse and greater than $500,000 are specifically reviewed for loss potential and when deemed appropriate are assigned a reserve based on an individual evaluation. For purposes of determining the pool-basis reserve, the remainder of the portfolio, representing all loans not assigned an individual reserve, is segregated first by portfolio segment, then by product type, to recognize differing risk profiles within portfolio segments, and finally by credit grade. Each credit grade within each product type is assigned a historical loss rate. These historical loss rates are then modified to incorporate our reasonable and supportable forecast of future losses at the portfolio segment level, as well as any necessary qualitative adjustments using a Portfolio Level Qualitative Factor ("PLQF") and/or a Portfolio Segment Level Qualitative Factor ("SLQF"). These modified historical loss rates are multiplied by the outstanding principal balance of each loan to calculate a required reserve. A similar process is employed to calculate a reserve assigned to off-balance sheet commitments, specifically unfunded loan commitments and letters of credit, and any needed reserve is recorded as assetsin other liabilities. The PLQF and SLQF are utilized to address factors that are not present in historical loss rates and are otherwise unaccounted for in the quantitative process. The PLQF is used to apply a qualitative adjustment across the entire portfolio of loans, while the SLQF is designed to apply a qualitative adjustment across a single portfolio segment. Even though portions of the allowance may be allocated to specific loans, the entire allowance is available for any credit that, in management’s judgment, should be charged off.
We generally use a two-year forecast period, based on a single consensus forecast scenario, using variables we believe are most relevant to each portfolio segment. For periods beyond which we are able to develop reasonable and supportable forecasts, we immediately revert to the average historical loss rate. The forecast period and scenario used is reviewed on a quarterly basis and may be adjusted based on management's view of the current economic conditions and level of predictability the forecast can provide.
Portfolio segments are used to pool loans with similar risk characteristics and align with our balance sheet.methodology for measuring expected credit losses. A summary of MSR activityour primary portfolio segments is as follows:
| Year Ended December 31, | |||||||
| (in thousands) | 2019 | 2018 | |||||
| MSRs: | |||||||
| Balance, beginning of year | $ | 42,474 | $ | 88,150 | |||
| Capitalized servicing rights | 39,774 | 39,149 | |||||
| Amortization | (11,541 | ) | (9,278 | ) | |||
| Sales | — | (75,547 | ) | ||||
| Balance, end of period | $ | 70,707 | $ | 42,474 | |||
| Valuation allowance: | |||||||
| Balance, beginning of year | $ | — | $ | 2,823 | |||
| Increase (decrease) in valuation allowance | 5,803 | (2,823 | ) | ||||
| Balance, end of period | $ | 5,803 | $ | — | |||
| MSRs, net | $ | 64,904 | $ | 42,474 | |||
| MSRs, fair value | $ | 64,904 | $ | 44,502 | |||
69
Commercial. Our commercial loan portfolio is comprised of lines of credit for working capital, term loans and 2018,leases to finance equipment and other business assets across a variety of industries. These loans are used for general corporate purposes including financing working capital, internal growth, acquisitions and business insurance premiums and are generally secured by accounts receivable, inventory, equipment and other assets of our servicingclients’ businesses. Our commercial loan portfolio also includes consumer loans because our small portfolio of residential mortgageconsumer loans had an outstanding principal balanceis largely comprised of $6.7 billionaccommodation loans to individuals associated with our commercial clients.
Energy. Our energy loan portfolio is primarily comprised of loans to exploration and $3.9 billion, respectively.
Mortgage finance. Mortgage finance loans relate to our mortgage warehouse lending operations in which we purchase mortgage loan ownership interests from unaffiliated mortgage originators that are generally held by us for a period of less than 30 days and more typically 10-20 days before they are sold to an approved investor. Volumes fluctuate based on the level of market demand for the product and the number of days between purchase and sale of the loans, which can be affected by changes in overall market interest rates and housing demand and tend to peak at the end of each month. Mortgage finance loans are consistently underwritten based on standards established by the approved investors. Market conditions or events of default by an investor or originator could require that we repurchase the remaining interests in the mortgage loans and hold them beyond the expected 10-20 days.
Real estate. Our real estate portfolio is comprised of the following types of loans:
Commercial real estate ("CRE"). Our CRE portfolio is comprised of both construction/development financing and limited term financing provided to professional real estate developers and owners/managers of commercial real estate projects and properties who have a demonstrated record of past success with similar properties. Collateral properties include office buildings, warehouse/distribution buildings, shopping centers, hotels/motels, senior living, apartment buildings and residential and commercial tract development. The primary source of repayment on these loans is expected to come from the sale, permanent financing or lease of the real property collateral. CRE loans are impacted by fluctuations in collateral values, as well as the ability of the borrower to obtain permanent financing.
Residential homebuilder finance ("RBF"). The RBF portfolio is comprised of loans made to residential builders and developers. Loans to residential builders are typically in the form of uncommitted guidance lines and are for the purpose of developing lots into single-family homes, while loans to developers are typically in the form of borrowing base lines extended for the purpose of acquiring and developing raw land into lots that can be further sold to home builders. RBF loans, if not structured and monitored correctly, can be impacted by volatility in consumer demand, as well as fluctuation in housing prices.
Secured by 1-4 family. This category of loans includes both first and second lien loans made for the purpose of purchasing or constructing 1-4 family residential dwellings, as well as home equity revolving lines of credit and loans to purchase lots for future construction of 1-4 family residential dwellings.
Other. The "other" category is primarily comprised of real estate loans originated through a Small Business Administration (SBA) program where repayment is partially guaranteed by the SBA, as well as other loans secured by real estate where the primary source of repayment is not expected to come from the sale or lease of the real property collateral.
We have several pass credit grades that are assigned to loans based on varying levels of risk, ranging from credits that are secured by cash or marketable securities, to watch credits which have all the characteristics of an acceptable credit risk but warrant more than the normal level of monitoring. Within our criticized/classified credit grades are special mention, substandard and doubtful. Special mention loans are those that are currently protected by the sound worth and paying capacity of the borrower, but that are potentially weak and constitute an additional credit risk. These loans have the potential to deteriorate to a substandard grade due to the investors. These escrow fundsexistence of financial or administrative deficiencies. Substandard loans have a well-defined weakness or weaknesses that jeopardizes the liquidation of the debt. They are segregatedcharacterized by the distinct possibility that we will sustain some loss if the deficiencies are not corrected. Some substandard loans are inadequately protected by the sound worth and heldpaying capacity of the borrower and of the collateral pledged and may be considered impaired. Substandard loans can be accruing or can be on non-accrual depending on the circumstances of the individual loans. Loans classified as doubtful have all the weaknesses inherent in separate non-interest-bearing bank accountssubstandard loans with the added characteristics that the weaknesses make collection in full highly questionable and improbable. The possibility of loss is extremely high. All doubtful loans are on non-accrual.
The methodology used in the estimation of the allowance, which is performed at least quarterly, is designed to be dynamic and responsive to changes in portfolio credit quality and forecasted economic conditions. Changes are reflected in the pool-basis
70
allowance and in reserves assigned on an individual basis as the collectability of classified loans is evaluated with new information. As our portfolio has matured, historical loss ratios have been closely monitored. The review of the appropriateness of the allowance is performed by executive management and presented to the audit and risk committees of our board of directors for their review. The committees report to the board as part of the board's review on a quarterly basis of our consolidated financial statements.
When management determines that foreclosure is probable, and for certain collateral-dependent loans where foreclosure is not considered probable, expected credit losses are based on the estimated fair value of the collateral adjusted for selling costs, when appropriate. A loan is considered collateral-dependent when the borrower is experiencing financial difficulty and repayment is expected to be provided substantially through the operation or sale of the collateral.
Expected credit losses are estimated over the contractual term of the loans, adjusted for expected prepayments when appropriate. The contractual term excludes expected extensions, renewals and modifications unless either of the following applies: management has a reasonable expectation that a loan will be restructured, or the extension or renewal options are included in the borrower contract and are not unconditionally cancellable by us.
We do not measure an allowance for credit losses on accrued interest receivable balances because these balances are written off in a timely manner as a reduction to interest income when loans are placed on non-accrual status as discussed above.
Other Real Estate Owned
Other real estate owned (“OREO”), which is included in other assets on the consolidated balance sheet, consists of real estate that has been foreclosed. When foreclosure occurs, the acquired asset is recorded at fair value less selling costs, generally based on appraised value, which may result in partial charge-off of the loan through a charge to the allowance for credit losses, if necessary. Subsequent write-downs required for declines in value are recorded through a valuation allowance, or taken directly to the asset, and are recorded in allowance and other carrying costs for OREO in the consolidated statements of income and other comprehensive income. Gains or losses on sale of OREO are recorded in other non-interest income in the consolidated statements of income and other comprehensive income.
Mortgage Servicing Rights, Net
Mortgage servicing rights ("MSRs") are created by selling mortgage loans with servicing rights retained. We identify classes of servicing rights based upon the nature of the underlying assumptions used to value the asset along with the risks associated with the underlying asset. Based upon these criteria we have one class of MSRs, residential.
MSRs are recognized based on the estimated fair value of the mortgage loans and the related servicing rights at the Bank. These deposits, included in total non-interest-bearing depositsdate of sale using values derived from a valuation model. MSRs are reported on the consolidated balance sheets were $63.7 million at December 31, 2019amortized cost, less a valuation allowance if the fair value of identified strata within the MSR portfolio are determined to have a fair value that is less than amortized cost. MSRs are amortized proportionally over the estimated life of the projected net servicing revenue and $37.9 million at December 31, 2018.are periodically evaluated for impairment. Loan servicing fee income represents income earned for servicing mortgage loans owned by investors and includes mortgage servicing fees and other ancillary servicing income. Servicing fees are recorded as income when earned and are reported in non-interest income on the consolidated statements of income and other comprehensive income. MSR valuation allowance expense and servicing related expenses are recorded in servicing-related expenses in the consolidated statements of income and other comprehensive income.
The estimated fair value of the MSR assets is obtained from an independent third party and reviewed by management on a quarterly basis. MSRs typically do not trade in an active, open market with readily observable prices; as such, the fair value of MSRs is determined using a discounted cash flow model to calculate the present value of the estimated future net servicing income. The assumptions utilized in the discounted cash flow model are based on market data for comparable assets, where available. Each quarter, management and the independent third party review the key assumptions used in the discounted cash flow model and make adjustments as necessary to estimate the fair value of the MSRs.
Goodwill and Other Intangible Assets, Net
Intangible assets are acquired assets that lack physical substance but can be distinguished from goodwill because of contractual or other legal rights or because the asset is capable of being sold or exchanged either on its own or in combination with a related contract, asset or liability. Our intangible assets relate primarily to loan customer relationships purchased as part of business acquisitions. Intangible assets with definite useful lives are amortized over their estimated life. Goodwill and intangible assets are tested for impairment at least annually or whenever changes in circumstances indicate the carrying amount of the assets may not be recoverable from future undiscounted cash flows. If impaired, the assets are recorded at fair value.
Premises and Equipment, Net
Premises and equipment are stated at cost less accumulated depreciation. Depreciation is computed using the straight-line method over the estimated useful lives of the assets. Furniture and equipment is generally depreciated over three to five years,
71
while leasehold improvements are generally depreciated over the term of their respective lease. Gains or losses on disposals of premises and equipment are included in other non-interest income in the consolidated statements of income and other comprehensive income.
Software
Costs incurred in connection with development or purchase of internal use software and cloud computing arrangements, including in-substance software licenses, are capitalized. Amortization is computed on a straight-line basis over the estimated useful life of the asset, which generally ranges from one to five years. Capitalized software is included in other assets in the consolidated balance sheets.
Financial Instruments with Off-Balance Sheet Risk
The Company has undertaken certain guarantee obligations in the ordinary course of business which include liabilities with off-balance sheet risk. We consider the following arrangements to be guarantees: commitments to extend credit, standby letters of credit and indemnification agreements included within third party contractual arrangements.
The Bank is a party to financial instruments with off-balance sheet risk in the normal course of business to meet the financing needs of its customers. These financial instruments include commitments to extend credit and standby letters of credit that involve varying degrees of credit risk in excess of the amount recognized in the consolidated balance sheets. The Bank’s exposure to credit loss in the event of non-performance by the other party to the financial instrument for commitments to extend credit and standby letters of credit is represented by the contractual amount of these instruments. The Bank uses the same credit policies in making commitments and conditional obligations as it does for on-balance sheet instruments. The amount of collateral obtained, if deemed necessary, is based on management’s credit evaluation of the borrower.
Commitments to extend credit are agreements to lend to a customer as long as there is no violation of any condition established in the contract. Commitments generally have fixed expiration dates or other termination clauses and may require payment of a fee. Since many of the commitments may expire without being drawn upon, the total commitment amounts do not necessarily represent future cash requirements. The Bank evaluates each customer’s creditworthiness on a case-by-case basis.
Standby letters of credit are conditional commitments issued by the Bank to guarantee the performance of a customer to a third party. Those guarantees are primarily issued to support public and private borrowing arrangements. The credit risk involved in issuing letters of credit is essentially the same as that involved in extending loan facilities to customers.
In conjunction with the sale and securitization of loans held for sale and their related servicing rights, we may be exposed to liability resulting from recourse, repurchase and make-whole agreements. If it is determined subsequent to our sale of a loan or its related servicing rights that a breach of the representations or warranties made in the applicable sale agreement has occurred, which may include guarantees that prepayments will not occur within a specified and customary time frame, we may have an obligation to either (a) repurchase the loan for the unpaid principal balance, accrued interest and related advances, (b) indemnify the purchaser against any loss it suffers or (c) make the purchaser whole for the economic benefits of the loan and its related servicing rights.
Our repurchase, indemnification and make-whole obligations vary based upon the terms of the applicable agreements, the nature of the asserted breach and the status of the mortgage loan at the time a claim is made. We establish reserves for estimated losses of this nature inherent in the origination of mortgage loans by estimating the losses inherent in the population of all loans sold based on trends in claims and actual loss severities experienced. The reserve will include accruals for probable contingent losses in addition to those identified in the pipeline of claims received. The estimation process is designed to include amounts based on actual losses experienced from actual activity.
Leases
ASU 2016-02 "Leases (Topic 842)" ("ASU 2016-02") requires that lessees and lessors recognize lease assets and lease liabilities on the balance sheet and disclose key information about leasing arrangements. ASU 2016-02 became effective for us on January 1, 2019. ASU 2016-02 provides for a modified retrospective transition approach requiring lessees to recognize and measure leases on the balance sheet at the beginning of either the earliest period presented or as of the beginning of the period of adoption with the option to elect certain practical expedients. We elected to apply ASU 2016-02 as of the beginning of the period of adoption (January 1, 2019) and have not restated comparative periods. Of the optional practical expedients available under ASU 2016-02, we adopted all expedients except for the hindsight practical expedient. As a result of implementing ASU 2016-02, we recognized an operating lease right-of-use ("ROU") asset of $64 million and an operating lease liability of $74 million on January 1, 2019, with no impact on our consolidated statements of income or consolidated statements of cash flows compared to the prior lease accounting model.
Operating lease ROU assets represent our right to use an underlying asset during the lease term and operating lease liabilities represent our obligation to make lease payments arising from the lease. Operating lease agreements may contain extension options which typically range from 5 to 10 years at the then fair market rental rates. As these extension options are not
72
generally considered reasonably certain of exercise, they are not included in the lease term. ROU assets and operating lease liabilities are recognized at lease commencement based on the present value of the remaining lease payments using a discount rate that represents our incremental borrowing rate at the lease commencement date, which is based on our collateralized borrowing capabilities over a similar term as the related lease payments. ROU assets are further adjusted for lease incentives.
Our operating leases relate primarily to office space and bank branches. Operating leases in which we are the lessee are recorded as operating lease ROU assets and operating lease liabilities, included in other assets and other liabilities, respectively, on our consolidated balance sheets. Operating lease expense, which is comprised of amortization of the ROU asset and the implicit interest accreted on the operating lease liability, is recognized on a straight-line basis over the lease term, and is recorded in net occupancy expense in the consolidated statements of income and other comprehensive income. See Note 6 – Leases for additional information.
Revenue Recognition
ASC 606, Revenue from Contracts with Customers ("ASC 606"), establishes principles for reporting information about the nature, amount, timing and uncertainty of revenue and cash flows arising from the entity's contracts to provide goods or services to customers. The core principle requires an entity to recognize revenue to depict the transfer of goods or services to customers in an amount that reflects the consideration that it expects to be entitled to receive in exchange for those goods or services recognized as performance obligations are satisfied.
The majority of our revenue-generating transactions are not subject to ASC 606, including revenue generated from financial instruments, such as our loans, letters of credit, derivatives and investment securities, as well as revenue related to our mortgage servicing activities, as these activities are subject to other GAAP discussed elsewhere within our disclosures. Descriptions of our revenue-generating activities that are within the scope of ASC 606, which are presented in our income statements as components of non-interest income are as follows:
•Service charges on deposit accounts - these represent general service fees for monthly account maintenance and activity- or transaction-based fees and consist of transaction-based revenue, time-based revenue (service period), item-based revenue or some other individual attribute-based revenue. Revenue is recognized when our performance obligation is completed, which is generally monthly for account maintenance services or when a transaction has been completed (such as a wire transfer). Payments for such performance obligations are generally received at the time the performance obligations are satisfied.
•Wealth management and trust fee income - this represents monthly fees due from wealth management customers as consideration for managing the customers' assets. Wealth management and trust services include custody of assets, investment management, escrow services, fees for trust services and similar fiduciary activities. Revenue is recognized when our performance obligation is completed each month, which is generally the time that payment is received. Also included are fees received from a third party broker-dealer as part of a revenue-sharing agreement for fees earned from customers that we refer to the third party. These fees are paid to us by the third party on a quarterly basis and recognized ratably throughout the quarter as our performance obligation is satisfied.
•Brokered loan fees - these represent fees for the administration and funding of purchased mortgage loan interests as well as facility renewal and application fees received from mortgage originator customers in our mortgage warehouse lending business. Also included are fees received from independent correspondent mortgage lenders as consideration for our purchase of individual residential mortgage loans through our MCA business. Revenue related to the mortgage warehouse lending business is recognized when the related loan interest is disposed (i.e., through sale or payoff) or upon receipt of the facility renewal or application. Revenue related to our MCA business is recognized at the time a loan is purchased.
•Other non-interest income primarily includes items such as letter of credit fees, bank owned life insurance income, dividends on FHLB and FRB stock and other general operating income, none of which are subject to the requirements of ASC 606.
Stock-based Compensation
We account for all stock-based compensation transactions in accordance with ASC 718, Compensation — Stock Compensation (“ASC 718”), which requires that stock compensation transactions be recognized as compensation expense in the consolidated statements of income and other comprehensive income based on their fair values on the measurement date, which is the date of the grant.
Income Taxes
The Company and its subsidiary file a consolidated federal income tax return. We utilize the liability method in accounting for income taxes. Under this method, deferred tax assets and liabilities are determined based upon the difference between the values of the assets and liabilities as reflected in the financial statements and their related tax basis using enacted tax rates in
73
effect for the year in which the differences are expected to be recovered or settled. As changes in tax law or rates are enacted, deferred tax assets and liabilities are adjusted through the provision for income taxes. A valuation allowance is provided against deferred tax assets unless it is more likely than not that such deferred tax assets will be realized.
Unrecognized tax benefits for the uncertain portion of recorded tax benefits and related interest may result from the application of complex tax laws, rules, regulations and interpretations. Unrecognized tax benefits, as well as estimated penalties and interest, are assessed quarterly and may be adjusted through current income tax expense in future periods based on changing facts and circumstances, completion of examinations by taxing authorities or expiration of a statute of limitations.
Fair Values of Financial Instruments
ASC 820, Fair Value Measurements and Disclosures (“ASC 820”), defines fair value, establishes a framework for measuring fair value under GAAP and enhances disclosures about fair value measurements. The standard describes three levels of inputs that may be used to measure fair value as provided below.
Level 1 Quoted prices in active markets for identical assets or liabilities.
Level 2 Observable inputs other than Level 1 prices, such as quoted prices for similar assets or liabilities; quoted prices in markets that are not active; or other inputs that are observable or can be corroborated by observable market data for substantially the full term of the assets or liabilities.
Level 3 Unobservable inputs that are supported by little or no market activity and that are significant to the fair value of the assets or liabilities. Level 3 assets and liabilities include financial instruments whose value is determined using pricing models, discounted cash flow methodologies, or similar techniques, as well as instruments for which the determination of fair values requires significant management judgment or estimation.
Also required are disclosures of fair value information about financial instruments, whether or not recognized on the balance sheet, for which it is practical to estimate that value. In cases where quoted market prices are not available, fair values are based on estimates using present value or other valuation techniques. Those techniques are significantly affected by the assumptions used, including the discount rate and estimates of future cash flows. The disclosure of fair value information about financial instruments does not and is not intended to represent the fair value of the Company.
The following are descriptions of the methods and significant assumptions used by the Company in estimating its fair value disclosures for financial instruments:
Cash and Cash Equivalents, Variable Rate Loans, and Variable Rate Debt
The fair value of these financial instruments approximates carrying value.
Investment Securities
Within the investment securities portfolio, we hold equity securities related to our non-qualified deferred compensation plan that are valued using quoted market prices for identical equity securities in an active market, and are classified as Level 1 assets in the fair value hierarchy. We also hold Community Reinvestment Act equity securities that are valued using quoted market prices for identical equity securities in an inactive market that we classify as Level 2 assets in the fair value hierarchy.The fair value of our U.S. government agency and residential mortgage-backed securities are based on prices obtained from independent pricing services that are based on quoted market prices for the same or similar securities, and are characterized as Level 2 assets in the fair value hierarchy. We obtain documentation from our primary pricing service regarding their processes and controls applicable to pricing investment securities, and on a quarterly basis independently verify the prices that we receive from the service provider using two additional independent pricing sources. We also hold tax-exempt asset-backed securities and CRT securities that are valued using a discounted cash flow model, which utilizes Level 3 inputs, and are classified as Level 3 assets in the fair value hierarchy.
Loans Held for Sale
The fair value for loans held for sale is derived from quoted market prices for similar loans, in which case they are characterized as Level 2 assets in the fair value hierarchy, or is derived from third party pricing models, in which case they are characterized as Level 3 assets in the fair value hierarchy.
Derivative Assets and Liabilities
The estimated fair value of interest rate swaps and caps is obtained from independent pricing services based on quoted market prices for similar derivative contracts and these financial instruments are characterized as Level 2 assets and liabilities in the fair value hierarchy. On a quarterly basis, we independently verify the fair value using an additional independent pricing source. Foreign currency forward contracts are valued based upon quoted market prices obtained from independent pricing services for similar derivative contracts. As such, these financial instruments are characterized as Level 2 assets and liabilities in the fair
74
value hierarchy. The derivative instruments related to the loans held for sale portfolio include loan purchase commitments and forward sale commitments. Loan purchase commitments are valued based upon the fair value of the underlying mortgage loans to be purchased, which is based on observable market data for similar loans. Forward sale commitments are valued based upon quoted market prices from brokers. As such, these loan purchase commitments and forward sales commitments are characterized as Level 2 assets or liabilities in the fair value hierarchy. The derivative instruments related to our residential MSRs include interest rate swap futures and forward sale commitments. The interest rate swap futures are valued based on quoted market prices obtained from brokers for similar derivative contracts, while the forward sale commitments are valued based on the fair value of the underlying mortgage loans to be purchased, which is based on observable market data for similar loans. As such, these derivative instruments are characterized as Level 2 assets and liabilities in the fair value hierarchy.
Derivative Financial Instruments
All contracts that satisfy the definition of a derivative are recorded at fair value in other assets and other liabilities in the consolidated balance sheets. We record the derivatives on a net basis when a right of offset exists with a single counterparty that is subject to a legally enforceable master netting agreement.
We enter into interest rate derivative contracts that are not designated as hedging instruments. These derivative positions relate to transactions in which we enter into an interest rate swap, cap and/or floor with a customer while at the same time entering into an offsetting interest rate swap, cap and/or floor with another financial institution. In connection with each swap transaction, we agree to pay interest to the customer on a notional amount at a variable interest rate and receive interest from the customer on a similar notional amount at a fixed interest rate. At the same time, we agree to pay another financial institution the same fixed interest rate on the same notional amount and receive the same variable interest rate on the same notional amount. The transaction allows our customer to effectively convert a variable rate loan to a fixed rate. Because we act as an intermediary for our customer, changes in the fair value of the underlying derivative contracts substantially offset each other and do not have a material impact on our results of operations.
We also enter into foreign currency forward contracts that are not designateed as hedging instruments. These derivative instruments relate to transactions in which we enter into a contract with a customer to buy or sell a foreign currency at a future date for a specified price while at the same time entering into an offsetting contract with a financial institution to buy or sell the same currency at the same future date for a specified price. These transactions allow our customers to manage their exposure to foreign currency exchange rate fluctuations. Because we act as an intermediary for our customer, changes in the fair value of the underlying derivative instruments substantially offset each other and do not have a material impact on our results of operations.
As part of our MCA program, we enter into loan purchase commitment contracts with mortgage originators to purchase residential mortgage loans at a future date, as well as forward sales commitment contracts to sell residential mortgage loans or to deliver mortgage-backed securities at a future date. The objective of these transactions is to mitigate our exposure to interest rate risk associated with the purchase of mortgage loans held for sale. Any changes in fair value are recorded in gain/(loss) on sale of loans held for sale in the consolidated statements of income and other comprehensive income.
To mitigate exposure to potential impairment losses from adverse changes in the fair value of our residential MSR portfolio, we enter into interest rate derivative contracts, primarily interest rate swap futures and forward sale commitments of mortgage-backed securities. These derivative instruments are considered highly liquid and can be settled daily, which allows us to dynamically manage our exposure. The derivative instruments are used to economically hedge the fair value of the residential MSR portfolio impacted by changes in anticipated prepayments resulting from mortgage interest rate movements and are classified as other assets and other liabilities on the consolidated balance sheets. Any unrealized or realized gains/(losses) related to derivatives economically hedging the residential MSR portfolio are recognized in servicing-related expenses along with changes to the MSR valuation allowance.
Segment Reporting
We have determined that all of our lending divisions and subsidiaries meet the aggregation criteria of ASC 280, Segment Reporting, since all offer similar products and services, operate with similar processes, have similar customers and are collectively reviewed by the chief operating decision maker.
75
(2) Earnings Per Share
The following table presents the computation of basic and diluted earnings per share:
| Year ended December 31, | |||||||||||||||||
| (in thousands except per share data) | 2020 | 2019 | 2018 | ||||||||||||||
| Numerator: | |||||||||||||||||
| Net income | $ | 66,289 | $ | 312,015 | $ | 293,387 | |||||||||||
| Preferred stock dividends | 9,750 | 9,750 | 9,750 | ||||||||||||||
| Net income available to common stockholders | $ | 56,539 | $ | 302,265 | $ | 283,637 | |||||||||||
| Denominator: | |||||||||||||||||
| Denominator for basic earnings per share—weighted average shares | 50,430,326 | 50,286,300 | 49,936,702 | ||||||||||||||
| Effect of employee stock-based awards(1) | 152,653 | 132,904 | 218,275 | ||||||||||||||
| Effect of warrants to purchase common stock | 0 | 0 | 117,895 | ||||||||||||||
| Denominator for dilutive earnings per share—adjusted weighted average shares and assumed conversions | 50,582,979 | 50,419,204 | 50,272,872 | ||||||||||||||
| Basic earnings per common share | $ | 1.12 | $ | 6.01 | $ | 5.68 | |||||||||||
| Diluted earnings per common share | $ | 1.12 | $ | 5.99 | $ | 5.64 | |||||||||||
(1)SARs and RSUs outstanding of 453,024, 86,308 and 27,100 in 2020, 2019 and 2018, respectively, have not been included in diluted earnings per share because to do so would have been antidilutive for the periods presented.
(3) Investment Securities
Available-for-Sale Debt Securities
The following is a summary of available-for-sale debt securities:
| (in thousands) | Amortized Cost(1) | Gross Unrealized Gains | Gross Unrealized Losses | Estimated Fair Value | |||||||||||||||||||
| December 31, 2020 | |||||||||||||||||||||||
| U.S. government agency securities | $ | 125,000 | $ | 1 | $ | (1,412) | $ | 123,589 | |||||||||||||||
| Residential mortgage-backed securities | 2,818,518 | 11,566 | (1,128) | 2,828,956 | |||||||||||||||||||
| Tax-exempt asset-backed securities | 184,940 | 14,236 | 0 | 199,176 | |||||||||||||||||||
| Credit risk transfer securities | 14,713 | 0 | (3,296) | 11,417 | |||||||||||||||||||
| Total | $ | 3,143,171 | $ | 25,803 | $ | (5,836) | $ | 3,163,138 | |||||||||||||||
| December 31, 2019 | |||||||||||||||||||||||
| Residential mortgage-backed securities | $ | 4,991 | $ | 275 | $ | 0 | $ | 5,266 | |||||||||||||||
| Tax-exempt asset-backed securities | 183,225 | 13,802 | 0 | 197,027 | |||||||||||||||||||
| Credit risk asset-backed securities | 14,713 | 0 | (2,749) | 11,964 | |||||||||||||||||||
| Total | $ | 202,929 | $ | 14,077 | $ | (2,749) | $ | 214,257 | |||||||||||||||
(1) Excludes accrued interest receivable of $6.0 million and $1.6 million at December 31, 2020 and 2019, respectively, that is recorded in accrued interest receivable and other assets.
76
The amortized cost and estimated fair value, excluding accrued interest receivable, and weighted average yield of available-for-sale debt securities are presented below by contractual maturity:
| (in thousands, except percentage data) | Less Than One Year | After One Through Five Years | After Five Through Ten Years | After Ten Years | Total | ||||||||||||||||||||||||
| December 31, 2020 | |||||||||||||||||||||||||||||
| U.S. government agency securities:(1) | |||||||||||||||||||||||||||||
| Amortized cost | $ | 0 | $ | 0 | $ | 125,000 | $ | 0 | $ | 125,000 | |||||||||||||||||||
| Estimated fair value | 0 | 0 | 123,589 | 0 | 123,589 | ||||||||||||||||||||||||
| Weighted average yield(3) | 0 | % | 0 | % | 1.13 | % | 0 | % | 1.13 | % | |||||||||||||||||||
| Residential mortgage-backed securities:(1) | |||||||||||||||||||||||||||||
| Amortized cost | $ | 0 | $ | 545 | $ | 17,500 | $ | 2,800,473 | $ | 2,818,518 | |||||||||||||||||||
| Estimated fair value | 0 | 605 | 17,490 | 2,810,861 | 2,828,956 | ||||||||||||||||||||||||
| Weighted average yield(3) | 0 | % | 4.58 | % | 1.08 | % | 1.25 | % | 1.25 | % | |||||||||||||||||||
| Tax-exempt asset-backed securities:(1) | |||||||||||||||||||||||||||||
| Amortized Cost | 0 | 0 | 0 | 184,940 | 184,940 | ||||||||||||||||||||||||
| Estimated fair value | 0 | 0 | 0 | 199,176 | 199,176 | ||||||||||||||||||||||||
| Weighted average yield(2)(3) | 0 | % | 0 | % | 0 | % | 4.92 | % | 4.92 | % | |||||||||||||||||||
| CRT securities:(1) | |||||||||||||||||||||||||||||
| Amortized Cost | 0 | 0 | 0 | 14,713 | 14,713 | ||||||||||||||||||||||||
| Estimated fair value | 0 | 0 | 0 | 11,417 | 11,417 | ||||||||||||||||||||||||
| Weighted average yield(3) | 0 | % | 0 | % | 0 | % | 0.15 | % | 0.15 | % | |||||||||||||||||||
| Total available-for-sale debt securities: | |||||||||||||||||||||||||||||
| Amortized cost | $ | 3,143,171 | |||||||||||||||||||||||||||
| Estimated fair value | $ | 3,163,138 | |||||||||||||||||||||||||||
| December 31, 2019 | |||||||||||||||||||||||||||||
| Residential mortgage-backed securities:(1) | |||||||||||||||||||||||||||||
| Amortized cost | $ | 0 | $ | 1,005 | $ | 0 | $ | 3,986 | $ | 4,991 | |||||||||||||||||||
| Estimated fair value | 0 | 1,088 | 0 | 4,178 | 5,266 | ||||||||||||||||||||||||
| Weighted average yield(3) | 0 | % | 5.54 | % | 0 | % | 4.31 | % | 4.55 | % | |||||||||||||||||||
| Tax-exempt asset-backed securities:(1) | |||||||||||||||||||||||||||||
| Amortized Cost | 0 | 0 | 0 | 183,225 | 183,225 | ||||||||||||||||||||||||
| Estimated fair value | 0 | 0 | 0 | 197,027 | 197,027 | ||||||||||||||||||||||||
| Weighted average yield(2)(3) | 0 | % | 0 | % | 0 | % | 5.32 | % | 5.32 | % | |||||||||||||||||||
| CRT securities:(1) | |||||||||||||||||||||||||||||
| Amortized Cost | 0 | 0 | 0 | 14,713 | 14,713 | ||||||||||||||||||||||||
| Estimated fair value | 0 | 0 | 0 | 11,964 | 11,964 | ||||||||||||||||||||||||
| Weighted average yield(3) | 0 | % | 0 | % | 0 | % | 1.71 | % | 1.71 | % | |||||||||||||||||||
| Total available-for-sale debt securities: | |||||||||||||||||||||||||||||
| Amortized cost | $ | 202,929 | |||||||||||||||||||||||||||
| Estimated fair value | $ | 214,257 | |||||||||||||||||||||||||||
(1)Actual maturities may differ from contractual maturities because borrowers may have the right to call or prepay obligations with or without prepayment penalties.
(2)Yields have been adjusted to a tax equivalent basis assuming a 21% federal tax rate.
(3)Yields are calculated based on amortized cost.
77
The following table discloses our available-for-sale debt securities that have been in a continuous unrealized loss position for less than 12 months and those that have been in a continuous unrealized loss position for 12 or more months:
| Less Than 12 Months | 12 Months or Longer | Total | |||||||||||||||||||||||||||||||||
| (in thousands) | Fair Value | Unrealized Loss | Fair Value | Unrealized Loss | Fair Value | Unrealized Loss | |||||||||||||||||||||||||||||
| December 31, 2020 | |||||||||||||||||||||||||||||||||||
| U.S. government agency securities | $ | 98,588 | $ | (1,412) | $ | 0 | $ | 0 | $ | 98,588 | $ | (1,412) | |||||||||||||||||||||||
| Residential mortgage-backed securities | 354,387 | (1,128) | 0 | 0 | 354,387 | (1,128) | |||||||||||||||||||||||||||||
| CRT securities | 0 | 0 | 11,417 | (3,296) | 11,417 | (3,296) | |||||||||||||||||||||||||||||
| Total | $ | 452,975 | $ | (2,540) | $ | 11,417 | $ | (3,296) | $ | 464,392 | $ | (5,836) | |||||||||||||||||||||||
| December 31, 2019 | |||||||||||||||||||||||||||||||||||
| CRT securities | $ | 11,964 | $ | (2,749) | $ | 0 | $ | 0 | $ | 11,964 | $ | (2,749) | |||||||||||||||||||||||
| Total | $ | 11,964 | $ | (2,749) | $ | 0 | $ | 0 | $ | 11,964 | $ | (2,749) | |||||||||||||||||||||||
Based upon our December 31, 2020 review of securities with unrealized losses we have determined that all losses resulted from factors not deemed credit-related. We have evaluated the near-term prospects of each securities portfolio in relation to the severity of the unrealized losses and adverse conditions related to the securities among other factors. Based on that evaluation management has determined that we have the ability and intent to hold the securities until recovery of fair value and have recorded the unrealized losses in AOCI.
Available-for-sale debt securities with carrying values of approximately $31.7 million and $1.9 million were pledged to secure certain customer repurchase agreements and deposits, respectively, at December 31, 2020. The comparative amounts at December 31, 2019 were $3.5 million and $1.2 million, respectively.
Equity Securities
Equity securities consist of Community Reinvestment Act funds and investments related to our non-qualified deferred compensation plan. At December 31, 2020 and December 31, 2019, we had $33.8 million and $25.6 million, respectively, in equity securities recorded at fair value. The following is a summary of unrealized and realized gains/(losses) recognized on equity securities and included in other non-interest income in the consolidated statements of income:
| Year Ended December 31, | ||||||||||||||||||||
| (in thousands) | 2020 | 2019 | ||||||||||||||||||
| Net gains/(losses) recognized during the period | $ | 2,998 | $ | 2,383 | ||||||||||||||||
| Less: Realized net gains/(losses) recognized during the period on equity securities sold | 1,418 | 119 | ||||||||||||||||||
| Unrealized net gains/(losses) recognized during the period on equity securities still held | $ | 1,580 | $ | 2,264 | ||||||||||||||||
(4) Loans Held for Investment and Allowance for Credit Losses on Loans
Loans held for investment are summarized by portfolio segment as follows:
| December 31, | |||||||||||
| (in thousands) | 2020 | 2019 | |||||||||
| Commercial | $ | 8,861,580 | $ | 9,133,444 | |||||||
| Energy | 766,217 | 1,425,309 | |||||||||
| Mortgage finance(1) | 9,079,409 | 8,169,849 | |||||||||
| Real estate | 5,794,624 | 6,008,040 | |||||||||
| Gross loans held for investment(2) | 24,501,830 | 24,736,642 | |||||||||
| Deferred income (net of direct origination costs) | (70,970) | (90,380) | |||||||||
| Allowance for credit losses on loans | (254,615) | (195,047) | |||||||||
| Total loans held for investment, net(2) | $ | 24,176,245 | $ | 24,451,215 | |||||||
(1) Balances at December 31, 2020 and December 31, 2019 are stated net of $1.2 billion and $682.7 million of participations sold, respectively.
(2) Excludes accrued interest receivable of $56.5 million and $63.4 million at December 31, 2020 and December 31, 2019, respectively, that is recorded in accrued interest receivable and other assets.
78
The following table summarizes our gross loans held for investment by year of origination and internally assigned credit grades:
| (in thousands) | 2020 | 2019 | 2018 | 2017 | 2016 | 2015 and prior | Revolving lines of credit | Revolving lines of credit converted to term loans | Total | |||||||||||||||||||||||||||||||||||||||||||||||
| December 31, 2020 | ||||||||||||||||||||||||||||||||||||||||||||||||||||||||
| Commercial | ||||||||||||||||||||||||||||||||||||||||||||||||||||||||
| (1-7) Pass | $ | 1,259,949 | $ | 2,816,425 | $ | 543,438 | $ | 374,455 | $ | 192,060 | $ | 213,212 | $ | 3,020,353 | $ | 40,253 | $ | 8,460,145 | ||||||||||||||||||||||||||||||||||||||
| (8) Special mention | 2,664 | 115,015 | 38,751 | 26,423 | 1,983 | 290 | 19,971 | 22,797 | 227,894 | |||||||||||||||||||||||||||||||||||||||||||||||
| (9) Substandard - accruing | 15,773 | 15,854 | 18,068 | 32,241 | 15,297 | 19,639 | 22,932 | 1,641 | 141,445 | |||||||||||||||||||||||||||||||||||||||||||||||
| (9+) Non-accrual | 1,820 | 8,360 | 377 | 1,292 | 802 | 15,157 | 3,836 | 452 | 32,096 | |||||||||||||||||||||||||||||||||||||||||||||||
| Total commercial | $ | 1,280,206 | $ | 2,955,654 | $ | 600,634 | $ | 434,411 | $ | 210,142 | $ | 248,298 | $ | 3,067,092 | $ | 65,143 | $ | 8,861,580 | ||||||||||||||||||||||||||||||||||||||
| Energy | ||||||||||||||||||||||||||||||||||||||||||||||||||||||||
| (1-7) Pass | $ | 0 | $ | 12,020 | $ | 7,598 | $ | 26,931 | $ | 0 | $ | 23,750 | $ | 553,970 | $ | 0 | $ | 624,269 | ||||||||||||||||||||||||||||||||||||||
| (8) Special mention | 0 | 0 | 0 | 0 | 0 | 13,358 | 76,866 | 0 | 90,224 | |||||||||||||||||||||||||||||||||||||||||||||||
| (9) Substandard - accruing | 0 | 0 | 0 | 0 | 0 | 0 | 0 | 0 | 0 | |||||||||||||||||||||||||||||||||||||||||||||||
| (9+) Non-accrual | 0 | 0 | 0 | 5,705 | 1,972 | 8,009 | 36,038 | 0 | 51,724 | |||||||||||||||||||||||||||||||||||||||||||||||
| Total energy | $ | 0 | $ | 12,020 | $ | 7,598 | $ | 32,636 | $ | 1,972 | $ | 45,117 | $ | 666,874 | $ | 0 | $ | 766,217 | ||||||||||||||||||||||||||||||||||||||
| Mortgage finance | ||||||||||||||||||||||||||||||||||||||||||||||||||||||||
| (1-7) Pass | $ | 755,309 | $ | 1,063,641 | $ | 821,122 | $ | 483,436 | $ | 106,013 | $ | 5,849,888 | $ | 0 | $ | 0 | $ | 9,079,409 | ||||||||||||||||||||||||||||||||||||||
| (8) Special mention | 0 | 0 | 0 | 0 | 0 | 0 | 0 | 0 | 0 | |||||||||||||||||||||||||||||||||||||||||||||||
| (9) Substandard - accruing | 0 | 0 | 0 | 0 | 0 | 0 | 0 | 0 | 0 | |||||||||||||||||||||||||||||||||||||||||||||||
| (9+) Non-accrual | 0 | 0 | 0 | 0 | 0 | 0 | 0 | 0 | 0 | |||||||||||||||||||||||||||||||||||||||||||||||
| Total mortgage finance | $ | 755,309 | $ | 1,063,641 | $ | 821,122 | $ | 483,436 | $ | 106,013 | $ | 5,849,888 | $ | 0 | $ | 0 | $ | 9,079,409 | ||||||||||||||||||||||||||||||||||||||
| Real estate | ||||||||||||||||||||||||||||||||||||||||||||||||||||||||
| CRE | ||||||||||||||||||||||||||||||||||||||||||||||||||||||||
| (1-7) Pass | $ | 352,688 | $ | 892,831 | $ | 923,762 | $ | 444,587 | $ | 208,426 | $ | 451,283 | $ | 62,336 | $ | 61,133 | $ | 3,397,046 | ||||||||||||||||||||||||||||||||||||||
| (8) Special mention | 3,475 | 11,170 | 6,485 | 88,633 | 11,153 | 17,623 | 0 | 1,247 | 139,786 | |||||||||||||||||||||||||||||||||||||||||||||||
| (9) Substandard - accruing | 0 | 327 | 47,708 | 11,601 | 32,645 | 30,766 | 0 | 15,940 | 138,987 | |||||||||||||||||||||||||||||||||||||||||||||||
| (9+) Non-accrual | 0 | 0 | 0 | 0 | 5,749 | 4,852 | 0 | 0 | 10,601 | |||||||||||||||||||||||||||||||||||||||||||||||
| RBF | ||||||||||||||||||||||||||||||||||||||||||||||||||||||||
| (1-7) Pass | 162,397 | 60,077 | 65,271 | 3,727 | 5,888 | 8,483 | 551,703 | 0 | 857,546 | |||||||||||||||||||||||||||||||||||||||||||||||
| (8) Special mention | 0 | 353 | 0 | 0 | 0 | 0 | 0 | 0 | 353 | |||||||||||||||||||||||||||||||||||||||||||||||
| (9) Substandard - accruing | 0 | 0 | 0 | 0 | 0 | 0 | 0 | 0 | 0 | |||||||||||||||||||||||||||||||||||||||||||||||
| (9+) Non-accrual | 0 | 0 | 0 | 0 | 0 | 0 | 0 | 0 | 0 | |||||||||||||||||||||||||||||||||||||||||||||||
| Other | ||||||||||||||||||||||||||||||||||||||||||||||||||||||||
| (1-7) Pass | 190,995 | 150,787 | 119,696 | 120,817 | 82,465 | 113,105 | 16,630 | 39,129 | 833,624 | |||||||||||||||||||||||||||||||||||||||||||||||
| (8) Special mention | 0 | 6,700 | 2,240 | 0 | 1,843 | 7,195 | 0 | 1,018 | 18,996 | |||||||||||||||||||||||||||||||||||||||||||||||
| (9) Substandard - accruing | 0 | 0 | 2,567 | 14,452 | 3,301 | 14,453 | 0 | 0 | 34,773 | |||||||||||||||||||||||||||||||||||||||||||||||
| (9+) Non-accrual | 0 | 0 | 0 | 927 | 5,524 | 6,403 | 0 | 14,496 | 27,350 | |||||||||||||||||||||||||||||||||||||||||||||||
| Secured by 1-4 family | ||||||||||||||||||||||||||||||||||||||||||||||||||||||||
| (1-7) Pass | 58,515 | 63,031 | 46,623 | 54,096 | 72,527 | 31,880 | 4,697 | 0 | 331,369 | |||||||||||||||||||||||||||||||||||||||||||||||
| (8) Special mention | 646 | 0 | 0 | 635 | 0 | 1,768 | 0 | 0 | 3,049 | |||||||||||||||||||||||||||||||||||||||||||||||
| (9) Substandard - accruing | 0 | 0 | 0 | 817 | 0 | 109 | 0 | 0 | 926 | |||||||||||||||||||||||||||||||||||||||||||||||
| (9+) Non-accrual | 0 | 0 | 0 | 0 | 0 | 218 | 0 | 0 | 218 | |||||||||||||||||||||||||||||||||||||||||||||||
| Total real estate | $ | 768,716 | $ | 1,185,276 | $ | 1,214,352 | $ | 740,292 | $ | 429,521 | $ | 688,138 | $ | 635,366 | $ | 132,963 | $ | 5,794,624 | ||||||||||||||||||||||||||||||||||||||
| Total loans held for investment | $ | 2,804,231 | $ | 5,216,591 | $ | 2,643,706 | $ | 1,690,775 | $ | 747,648 | $ | 6,831,441 | $ | 4,369,332 | $ | 198,106 | $ | 24,501,830 | ||||||||||||||||||||||||||||||||||||||
79
The following table details activity in the allowance for credit losses on loans. Allocation of a portion of the allowance to one category of loans does not preclude its availability to absorb losses in other categories.
| (in thousands) | Commercial | Energy | Mortgage Finance | Real Estate | Additional Qualitative Reserve | Total | ||||||||||||||
| Year ended December 31, 2020 | ||||||||||||||||||||
| Beginning balance | $ | 102,254 | $ | 60,253 | $ | 2,265 | $ | 30,275 | $ | 0 | $ | 195,047 | ||||||||
| Impact of CECL adoptions | (15,740) | 24,154 | 2,031 | (1,860) | 0 | 8,585 | ||||||||||||||
| Provision for credit losses on loans | 58,630 | 126,180 | 403 | 64,556 | 0 | 249,769 | ||||||||||||||
| Charge-offs | 73,360 | 133,522 | 0 | 180 | 0 | 207,062 | ||||||||||||||
| Recoveries | 1,277 | 6,999 | 0 | 0 | 0 | 8,276 | ||||||||||||||
| Net charge-offs (recoveries) | 72,083 | 126,523 | 0 | 180 | 0 | 198,786 | ||||||||||||||
| Ending balance | $ | 73,061 | $ | 84,064 | $ | 4,699 | $ | 92,791 | $ | 0 | $ | 254,615 | ||||||||
| Year ended December 31, 2019 | ||||||||||||||||||||
| Beginning balance | $ | 96,814 | $ | 34,882 | $ | 0 | $ | 52,595 | $ | 7,231 | $ | 191,522 | ||||||||
| Provision for credit losses on loans | 46,738 | 57,680 | 2,265 | (21,658) | (7,231) | 77,794 | ||||||||||||||
| Charge-offs | 44,352 | 32,625 | 0 | 662 | 0 | 77,639 | ||||||||||||||
| Recoveries | 3,054 | 316 | 0 | 0 | 0 | 3,370 | ||||||||||||||
| Net charge-offs (recoveries) | 41,298 | 32,309 | 0 | 662 | 0 | 74,269 | ||||||||||||||
| Ending balance | $ | 102,254 | $ | 60,253 | $ | 2,265 | $ | 30,275 | $ | 0 | $ | 195,047 | ||||||||
In the first quarter of 2020, we adopted ASU 2016-13, which replaced the incurred loss methodology for determining our provision for credit losses and allowance for credit losses with an expected loss methodology that is referred to as the CECL model. Upon adoption, the allowance for credit losses was increased by $9.1 million, which included a $563,000 increase to the allowance for off-balance sheet credit losses, with no impact to the consolidated statement of income. We recorded a $258.0 million provision for credit losses for the year ended December 31, 2020, compared to $75.0 million for the same period of 2019. We recorded $198.8 million in net charge-offs during the year ended December 31, 2020, compared to $74.3 million during the same period of 2019. Criticized loans total $918.4 million at December 31, 2020 and $584.1 million at December 31, 2019. Criticized loan levels have increased during 2020 as compared to 2019 due to the downgrade of loans to borrowers that have been impacted by the COVID-19 pandemic or that are in categories that are expected to be more significantly impacted by COVID-19.
80
A loan is considered collateral-dependent when the borrower is experiencing financial difficulty and repayment is expected to be provided substantially through the operation or sale of the collateral. The following table summarizes collateral-dependent gross loans held for investment by collateral type as follows:
| Collateral Type | ||||||||||||||||||||||||||||||||||||||
| (in thousands) | Business Assets | Real Property | Oil/Gas Mineral Reserves | Rolling Stock | Total | |||||||||||||||||||||||||||||||||
| December 31, 2020 | ||||||||||||||||||||||||||||||||||||||
| Commercial | $ | 3,361 | $ | 0 | $ | 0 | $ | 774 | $ | 4,135 | ||||||||||||||||||||||||||||
| Energy | 0 | 0 | 5,156 | 0 | 5,156 | |||||||||||||||||||||||||||||||||
| Real estate | ||||||||||||||||||||||||||||||||||||||
| CRE | 0 | 4,619 | 0 | 0 | 4,619 | |||||||||||||||||||||||||||||||||
| Other | 0 | 11,372 | 0 | 0 | 11,372 | |||||||||||||||||||||||||||||||||
| Total collateral-dependent loans held for investment | $ | 3,361 | $ | 15,991 | $ | 5,156 | $ | 774 | $ | 25,282 | ||||||||||||||||||||||||||||
The table below provides an age analysis of our loans held for investment:
| (in thousands) | 30-59 Days Past Due | 60-89 Days Past Due | 90 Days or More Past Due(1) | Total Past Due | Non-accrual(2) | Current | Total | Non-accrual With No Allowance | |||||||||||||||||||||||||||||||||||||||
| December 31, 2020 | |||||||||||||||||||||||||||||||||||||||||||||||
| Commercial | $ | 6,171 | $ | 2,602 | $ | 9,325 | $ | 18,098 | $ | 32,096 | $ | 8,811,386 | $ | 8,861,580 | $ | 6,917 | |||||||||||||||||||||||||||||||
| Energy | 0 | 0 | 0 | 0 | 51,724 | 714,493 | 766,217 | 17,759 | |||||||||||||||||||||||||||||||||||||||
| Mortgage finance loans | 0 | 0 | 0 | 0 | 0 | 9,079,409 | 9,079,409 | 0 | |||||||||||||||||||||||||||||||||||||||
| Real estate | |||||||||||||||||||||||||||||||||||||||||||||||
| CRE | 2,926 | 297 | 0 | 3,223 | 10,601 | 3,672,596 | 3,686,420 | 5,749 | |||||||||||||||||||||||||||||||||||||||
| RBF | 0 | 0 | 0 | 0 | 0 | 857,899 | 857,899 | 0 | |||||||||||||||||||||||||||||||||||||||
| Other | 3,471 | 493 | 0 | 3,964 | 27,350 | 883,429 | 914,743 | 13,263 | |||||||||||||||||||||||||||||||||||||||
| Secured by 1-4 family | 1,340 | 1,467 | 3,216 | 6,023 | 218 | 329,321 | 335,562 | 0 | |||||||||||||||||||||||||||||||||||||||
| Total loans held for investment | $ | 13,908 | $ | 4,859 | $ | 12,541 | $ | 31,308 | $ | 121,989 | $ | 24,348,533 | $ | 24,501,830 | $ | 43,688 | |||||||||||||||||||||||||||||||
(1)Loans past due 90 days and still accruing includes premium finance loans of $6.4 million. These loans are generally secured by obligations of insurance carriers to refund premiums on canceled insurance policies. The receipt of the refund of premiums from the insurance carriers can take 180 days or longer from the cancellation date.
(2)As of December 31, 2020 and December 31, 2019, none of our non-accrual loans were earning interest income on a cash basis. Additionally, no interest income was recognized on non-accrual loans for the year ended December 31, 2020. Accrued interest of $1.3 million was reversed during the year ended December 31, 2020.
On January 1, 2020, the date we adopted CECL, non-accrual loans totaled $225.4 million, and included $88.6 million in commercial loans, $125.0 million in energy loans, $9.4 million in CRE loans, $881,000 in real estate-other loans and $1.4 million in secured by 1-4 family loans.
As of December 31, 2020 and December 31, 2019, we did not have any loans considered restructured that were not on non-accrual. Of the non-accrual loans at December 31, 2020 and 2019, $45.4 million and $35.1 million, respectively, met the criteria for restructured. These loans had no unfunded commitments at their respective balance sheet dates.
81
The following table details the recorded investment at December 31, 2020 and 2019 of loans that have been restructured during the years ended December 31, 2020 and 2019 by type of modification:
| Extended Maturity | Adjusted Payment Schedule | Total | |||||||||||||||||||||||||||
| (in thousands, except number of contracts) | Number of Contracts | Balance at Period End | Number of Contracts | Balance at Period End | Number of Contracts | Balance at Period End | |||||||||||||||||||||||
| Year Ended December 31, 2020 | |||||||||||||||||||||||||||||
| Commercial | 2 | $ | 7,390 | 2 | $ | 14,496 | 4 | $ | 21,886 | ||||||||||||||||||||
| Energy loans | 1 | 5,705 | 3 | 12,935 | 4 | 18,640 | |||||||||||||||||||||||
| Total | 3 | $ | 13,095 | 5 | $ | 27,431 | $ | 8 | $ | 40,526 | |||||||||||||||||||
| Year Ended December 31, 2019 | |||||||||||||||||||||||||||||
| Commercial | 1 | $ | 1,753 | 3 | $ | 21,193 | $ | 4 | $ | 22,946 | |||||||||||||||||||
| Energy loans | 1 | 3,935 | 0 | 0 | 1 | 3,935 | |||||||||||||||||||||||
| Total | 2 | $ | 5,688 | 3 | $ | 21,193 | $ | 5 | $ | 26,881 | |||||||||||||||||||
Restructured loans generally include terms to temporarily place the loan on interest only, extend the payment terms or reduce the interest rate. We did not forgive any principal on the above restructured loans. At December 31, 2020 and 2019, all of the above restructured loans were on non-accrual. The restructuring of the loans did not have a significant impact on our allowance for credit losses at December 31, 2020 or 2019. As of December 31, 2020 and 2019, we did not have any loans that were restructured within the last 12 months that subsequently defaulted.
In response to the COVID-19 pandemic, we implemented a short-term modification program in late March 2020 to provide temporary payment relief to borrowers who meet the program's qualifications. This program allows for a deferral of payments for 90 days, which we may extend for an additional 90 days, for a maximum of 180 days on a cumulative basis. The deferred payments along with interest accrued during the deferral period are due and payable on the maturity date of the existing loan. Through December 31, 2020, we granted temporary modifications on 483 loans with a total outstanding balance of $1.3 billion, resulting in the deferral of $7.7 million in interest payments. As of December 31, 2020, 48 loans with a total outstanding balance of $90.2 million remain on deferral, of which $50.7 million have been granted a second deferral. Under the applicable guidance, none of these loans were considered restructured as of December 31, 2020.
(5) Certain Transfers of Financial Assets
The table below presents a reconciliation of the changes in loans held for sale:
| Year Ended December 31, | ||||||||||||||
| (in thousands) | 2020 | 2019 | ||||||||||||
| Outstanding balance(1): | ||||||||||||||
| Beginning balance | $ | 2,568,362 | $ | 1,949,785 | ||||||||||
| Loans purchased and originated | 11,366,986 | 10,183,057 | ||||||||||||
| Payments and loans sold | (13,654,211) | (9,564,480) | ||||||||||||
| Ending balance | 281,137 | 2,568,362 | ||||||||||||
| Fair value adjustment: | ||||||||||||||
| Beginning balance | 8,772 | 19,689 | ||||||||||||
| Increase/(decrease) to fair value | (6,744) | (10,917) | ||||||||||||
| Ending balance | 2,028 | 8,772 | ||||||||||||
| Loans held for sale at fair value | $ | 283,165 | $ | 2,577,134 | ||||||||||
(1) Includes $44.1 million and $5.8 million of loans held for sale that are carried at lower of cost or market as of December 31, 2020 and 2019, respectively, as well as $299,000 as of December 31, 2018.
At December 31, 2020, we had $7.0 million in in non-accrual loans held for sale, comprised of one loan previously reported in loans held for investment that was transferred to loans held for sale as of December 31, 2020 and subsequently sold at carrying value. At December 31, 2019 there were 0 non-accrual loans held for sale. At December 31, 2020 and December 31, 2019, we had $16.7 million and $8.2 million, respectively, in loans held for sale that were 90 days or more past due. The $16.7 million in loans held for sale that were 90 days or more past due at December 31, 2020 included $3.3 million of loans guaranteed by U.S. government agencies that were purchased out of Ginnie Mae securities and recorded as loans held for sale, at fair value, on the balance sheet. Interest on these past due loans accrues at the debenture rate guaranteed by the U.S. government. Also included in the $16.7 million were $13.4 million in loans that, pursuant to Ginnie Mae servicing guidelines, we have the unilateral right, but not the obligation, to repurchase if defined delinquent loan criteria are met, and therefore must record as held for sale on our balance sheet regardless of whether the repurchase option has been exercised. At December 31, 2019, $6.0 million of the $8.2
82
million in loans held for sale that were 90 days or more past due were loans guaranteed by U.S. government agencies that were purchased out of Ginnie Mae securities and recorded as loans held for sale, at fair value, on the balance sheet and $1.9 million were loans that we have the unilateral right, but not the obligation, to repurchase if defined delinquent criteria are met.
From time to time we retain the right to service the loans sold through our MCA program, creating MSRs which are recorded as assets on our balance sheet. A summary of MSR activity is as follows:
| Year Ended December 31, | |||||||||||
| (in thousands) | 2020 | 2019 | |||||||||
| MSRs: | |||||||||||
| Balance, beginning of year | $ | 70,707 | $ | 42,474 | |||||||
| Capitalized servicing rights | 99,678 | 39,774 | |||||||||
| Amortization | (38,994) | (11,541) | |||||||||
| Sales | 0 | 0 | |||||||||
| Balance, end of period | $ | 131,391 | $ | 70,707 | |||||||
| Valuation allowance: | |||||||||||
| Balance, beginning of year | $ | 5,803 | $ | 0 | |||||||
| Increase (decrease) in valuation allowance | 20,164 | 5,803 | |||||||||
| Balance, end of period | $ | 25,967 | $ | 5,803 | |||||||
| MSRs, net | $ | 105,424 | $ | 64,904 | |||||||
| MSRs, fair value | $ | 105,424 | $ | 64,904 | |||||||
At December 31, 2020 and 2019, our servicing portfolio of residential mortgage loans had an outstanding principal balance of $13.8 billion and $6.7 billion, respectively.
In connection with the servicing of these loans, we hold segregated non-interested-bearing deposit accounts in the name of investors representing escrow funds for taxes and insurance, as well as collections in transit to the investors. These deposits, included in total non-interest-bearing deposits on the consolidated balance sheets, were $152.6 million at December 31, 2020 and $63.7 million at December 31, 2019.
At December 31, 2020, the estimated fair value of MSRs was adjusted as a result ofnegatively impacted by the decline in mortgageincreased prepayment speeds from continued low interest rates, during the year, which resulted in an impairment charge of $5.8 million. There was no impairment at$20.2 million being recorded for the year ended December 31, 2018.2020, compared to a $5.8 million impairment charge for the year ended December 31, 2019. To mitigate exposure to potential impairment charges from adverse changes in the fair value of our residential MSR portfolio, we enter into certain derivative contracts as are disclosed in Note 17 - Derivative Financial Instruments. The following summarizes the assumptions used by management to determine the fair value of MSRs:
| December 31, | |||||
| 2019 | 2018 | ||||
| Average discount rates | 9.06 | % | 9.55 | % | |
| Expected prepayment speeds | 13.11 | % | 9.77 | % | |
| Weighted-average life, in years | 5.8 | 7.0 | |||
| December 31, | |||||||||||
| 2020 | 2019 | ||||||||||
| Average discount rates | 9.09 | % | 9.06 | % | |||||||
| Expected prepayment speeds | 16.37 | % | 13.11 | % | |||||||
| Weighted-average life, in years | 4.9 | 5.8 | |||||||||
A sensitivity analysis of changes in the fair value of our MSR portfolio resulting from certain key assumptions is presented in the following table:
| December 31, | |||||||
| (in thousands) | 2019 | 2018 | |||||
| 50 bp adverse change in prepayment speed | $ | (10,768 | ) | $ | (6,028 | ) | |
| 100 bp adverse change in prepayment speed | (17,965 | ) | (11,629 | ) | |||
| December 31, | |||||||||||
| (in thousands) | 2020 | 2019 | |||||||||
| 50 bp adverse change in prepayment speed | $ | (12,203) | $ | (10,768) | |||||||
| 100 bp adverse change in prepayment speed | (16,062) | (17,965) | |||||||||
These sensitivities are hypothetical and actual results may differ materially due to a number of factors. The effect on fair value of a 10% variation in assumptions generally cannot be determined with confidence because the relationship of the change in assumptions to the change in fair value may not be linear. Additionally, the impact of a variation in a particular assumption on the fair value is calculated while holding other assumptions constant. In reality, changes in one factor may be correlated with changes in other factors, which could impact the sensitivity analysis as presented.
In conjunction with the sale and securitization of loans held for sale, we may be exposed to liability resulting from repurchase, indemnification and make-whole agreements. Our estimated exposure related to those agreements totaled $3.6 million$621,000 and $1.6$3.6 million at December 31, 20192020 and December 31, 2018,2019, respectively, and is recorded in other liabilities in the consolidated
83
balance sheets. We incurred $9.0$8.4 million in losses due to make-whole obligationsobligation payments were made during the year ended December 31, 20192020 compared to $258,000$9.0 million in 2018. The increase in make-whole obligation losses is primarily related to an increase in early payoffs resulting from the declining interest rate environment.2019.
Our leases relate primarily to office space and bank branches with remaining lease terms of generally 1 to 13 years. Certain lease arrangements contain extension options which typically range from 5 to 10 years at the then fair market rental rates. As these extension options are not generally considered reasonably certain of exercise, they are not included in the lease term. As ofAt December 31, 2019,2020, operating lease ROU assets and liabilities were $67.0 million and $82.5 million, respectively, compared to $80.0 million and $95.9 million, respectively.respectively, at December 31, 2019. We do not currently have any significant finance leases in which we are the lessee.
The table below summarizes our net lease cost:
| Year Ended December 31, | ||||||||||||||
| (in thousands) | 2020 | 2019 | ||||||||||||
| Operating lease cost | $ | 15,544 | $ | 14,844 | ||||||||||
| Short-term lease cost | 19 | 19 | ||||||||||||
| Variable lease cost | 4,476 | 3,918 | ||||||||||||
| Sublease income | (107) | (126) | ||||||||||||
| Net lease cost | $ | 19,932 | $ | 18,655 | ||||||||||
| Cash paid for amounts included in the measurement of lease liabilities: | ||||||||||||||
| Operating cash flows from operating leases | $ | 16,568 | $ | 14,711 | ||||||||||
| Non-cash changes in ROU assets | $ | 765 | $ | 98,369 | ||||||||||
| Non-cash changes in lease liabilities(1) | $ | 784 | $ | 108,189 | ||||||||||
| (in thousands) | Year Ended December 31, 2019 | |||
| Operating lease cost | $ | 14,844 | ||
| Short-term lease cost | 19 | |||
| Variable lease cost | 3,918 | |||
| Sublease income | (126 | ) | ||
| Net lease cost | $ | 18,656 | ||
| Cash paid for amounts included in the measurement of lease liabilities: | ||||
| Operating cash flows from operating leases | $ | 14,711 | ||
| Non-cash changes in ROU assets | $ | 98,369 | ||
| Non-cash changes in lease liabilities(1) | $ | 108,189 | ||
The table below summarizes other information related to our operating leases:
| December 31, | ||||||||||||||||||||
| 2020 | 2019 | |||||||||||||||||||
| Weighted-average remaining lease term - operating leases, in years | 6.5 | 7.2 | ||||||||||||||||||
| Weighted-average discount rate - operating leases | 2.74 | % | 2.75 | % | ||||||||||||||||
The table below summarizes the maturity of remaining lease liabilities:
| (in thousands) | December 31, 2020 | |||||||
| 2021 | $ | 17,222 | ||||||
| 2022 | 16,455 | |||||||
| 2023 | 16,511 | |||||||
| 2024 | 11,754 | |||||||
| 2025 | 5,524 | |||||||
| 2026 and thereafter | 22,849 | |||||||
| Total lease payments | 90,315 | |||||||
| Less: Interest | (7,786) | |||||||
| Present value of lease liabilities | $ | 82,529 | ||||||
| (in thousands) | December 31, 2019 | |||
| 2020 | $ | 16,586 | ||
| 2021 | 17,136 | |||
| 2022 | 16,338 | |||
| 2023 | 16,377 | |||
| 2024 | 11,619 | |||
| 2025 and thereafter | 28,018 | |||
| Total lease payments | 106,074 | |||
| Less: Interest | (10,187 | ) | ||
| Present value of lease liabilities | $ | 95,887 | ||
84
Goodwill and other intangible assets are summarized as follows:
| (in thousands) | Gross Goodwill and Intangible Assets | Accumulated Amortization | Net Goodwill and Intangible Assets | ||||||||
| December 31, 2019 | |||||||||||
| Goodwill | $ | 15,468 | $ | (374 | ) | $ | 15,094 | ||||
| Intangible assets—customer relationships and trademarks | 9,006 | (6,001 | ) | 3,005 | |||||||
| Total goodwill and intangible assets | $ | 24,474 | $ | (6,375 | ) | $ | 18,099 | ||||
| December 31, 2018 | |||||||||||
| Goodwill | $ | 15,468 | $ | (374 | ) | $ | 15,094 | ||||
| Intangible assets—customer relationships and trademarks | 9,006 | (5,530 | ) | 3,476 | |||||||
| Total goodwill and intangible assets | $ | 24,474 | $ | (5,904 | ) | $ | 18,570 | ||||
| (in thousands) | Gross Goodwill and Intangible Assets | Accumulated Amortization | Net Goodwill and Intangible Assets | ||||||||||||||
| December 31, 2020 | |||||||||||||||||
| Goodwill | $ | 15,468 | $ | (374) | $ | 15,094 | |||||||||||
| Intangible assets—customer relationships and trademarks | 9,006 | (6,433) | 2,573 | ||||||||||||||
| Total goodwill and intangible assets | $ | 24,474 | $ | (6,807) | $ | 17,667 | |||||||||||
| December 31, 2019 | |||||||||||||||||
| Goodwill | $ | 15,468 | $ | (374) | $ | 15,094 | |||||||||||
| Intangible assets—customer relationships and trademarks | 9,006 | (6,001) | 3,005 | ||||||||||||||
| Total goodwill and intangible assets | $ | 24,474 | $ | (6,375) | $ | 18,099 | |||||||||||
Amortization expense related to intangible assets totaled $432,000 in 2020, $471,000 in 2019 and $470,000 in 2018 and $472,000 in 2017.2018. The estimated aggregate future amortization expense for intangible assets remaining as of December 31, 20192020 is as follows:
| (in thousands) | |||
| 2020 | $ | 432 | |
| 2021 | 405 | ||
| 2022 | 405 | ||
| 2023 | 382 | ||
| 2024 | 268 | ||
| Thereafter | 1,113 | ||
| Total | $ | 3,005 | |
| (in thousands) | |||||
| 2021 | $ | 405 | |||
| 2022 | 405 | ||||
| 2023 | 382 | ||||
| 2024 | 268 | ||||
| 2025 | 268 | ||||
| Thereafter | 845 | ||||
| Total | $ | 2,573 | |||
Premises and equipment are summarized as follows:
| December 31, | |||||||
| (in thousands) | 2019 | 2018 | |||||
| Premises | $ | 30,181 | $ | 27,999 | |||
| Furniture and equipment | 42,176 | 35,130 | |||||
| Total cost | 72,357 | 63,129 | |||||
| Accumulated depreciation | (41,145 | ) | (39,327 | ) | |||
| Total premises and equipment, net | $ | 31,212 | $ | 23,802 | |||
| December 31, | |||||||||||
| (in thousands) | 2020 | 2019 | |||||||||
| Premises | $ | 32,231 | $ | 30,181 | |||||||
| Furniture and equipment | 41,627 | 42,176 | |||||||||
| Total cost | 73,858 | 72,357 | |||||||||
| Accumulated depreciation | (49,312) | (41,145) | |||||||||
| Total premises and equipment, net | $ | 24,546 | $ | 31,212 | |||||||
Depreciation expense for the above premises and equipment was approximately $9.5 million, $9.2 million and $9.0 million in 2020, 2019 and $6.9 million in 2019, 2018, and 2017, respectively.
Deposits are summarized as follows:
| December 31, | |||||||||||
| (in thousands) | 2020 | 2019 | |||||||||
| Non-interest-bearing demand deposits | $ | 12,740,947 | $ | 9,438,459 | |||||||
| Interest-bearing deposits: | |||||||||||
| Transaction | 4,396,243 | 3,651,128 | |||||||||
| Savings | 11,619,880 | 10,517,975 | |||||||||
| Time | 2,239,519 | 2,871,031 | |||||||||
| Total interest-bearing deposits | 18,255,642 | 17,040,134 | |||||||||
| Total deposits | $ | 30,996,589 | $ | 26,478,593 | |||||||
| December 31, | |||||||
| (in thousands) | 2019 | 2018 | |||||
| Non-interest-bearing demand deposits | $ | 9,438,459 | $ | 7,317,161 | |||
| Interest-bearing deposits | |||||||
| Transaction | 3,651,128 | 3,051,535 | |||||
| Savings | 10,517,975 | 8,222,893 | |||||
| Time | 2,871,031 | 2,014,524 | |||||
| Total interest-bearing deposits | 17,040,134 | 13,288,952 | |||||
| Total deposits | $ | 26,478,593 | $ | 20,606,113 | |||
85
The scheduled maturities of interest-bearing time deposits were as follows at December 31, 2019:2020:
| (in thousands) | |||
| 2020 | $ | 2,810,219 | |
| 2021 | 49,275 | ||
| 2022 | 6,648 | ||
| 2023 | 271 | ||
| 2024 | 1,763 | ||
| 2025 and after | 2,855 | ||
| Total | $ | 2,871,031 | |
| (in thousands) | |||||
| 2021 | $ | 1,317,558 | |||
| 2022 | 795,656 | ||||
| 2023 | 121,376 | ||||
| 2024 | 1,921 | ||||
| 2025 | 3,003 | ||||
| 2026 and after | 5 | ||||
| Total | $ | 2,239,519 | |||
At December 31, 20192020 and 2018,2019, interest-bearing time deposits of $250,000 or more were approximately $347.7$386.9 million and $270.2$347.7 million, respectively.
The following table summarizes our short-term and other borrowings:
| (dollar amounts in thousands) | Federal Funds Purchased | Customer Repurchase Agreements | FHLB Borrowings | |||||||||
| December 31, 2019 | ||||||||||||
| Amount outstanding at year-end | $ | 132,270 | $ | 9,496 | $ | 2,400,000 | ||||||
| Interest rate at year-end | 1.66 | % | 0.61 | % | 1.68 | % | ||||||
| Average balance outstanding during the year | $ | 502,604 | $ | 11,655 | $ | 2,523,836 | ||||||
| Weighted-average interest rate during the year | 2.36 | % | 0.51 | % | 2.31 | % | ||||||
| Maximum month-end outstanding during the year | $ | 905,473 | $ | 14,208 | $ | 5,000,000 | ||||||
| December 31, 2018 | ||||||||||||
| Amount outstanding at year-end | $ | 629,169 | $ | 12,005 | $ | 3,900,000 | ||||||
| Interest rate at year-end | 2.54 | % | 0.09 | % | 2.56 | % | ||||||
| Average balance outstanding during the year | $ | 323,140 | $ | 9,812 | $ | 1,769,452 | ||||||
| Weighted-average interest rate during the year | 2.02 | % | 0.09 | % | 2.05 | % | ||||||
| Maximum month-end outstanding during the year | $ | 629,169 | $ | 13,835 | $ | 4,000,000 | ||||||
| December 31, 2017 | ||||||||||||
| Amount outstanding at year-end | $ | 359,338 | $ | 5,702 | $ | 2,800,000 | ||||||
| Interest rate at year-end | 1.45 | % | 0.03 | % | 1.35 | % | ||||||
| Average balance outstanding during the year | $ | 215,895 | $ | 6,590 | $ | 1,395,753 | ||||||
| Weighted-average interest rate during the year | 1.20 | % | 0.04 | % | 1.08 | % | ||||||
| Maximum month-end outstanding during the year | $ | 544,203 | $ | 8,727 | $ | 2,800,000 | ||||||
| (dollar amounts in thousands) | Federal Funds Purchased | Customer Repurchase Agreements | FHLB Borrowings | |||||||||||||||||
| December 31, 2020 | ||||||||||||||||||||
| Amount outstanding at year-end | $ | 107,600 | $ | 4,151 | $ | 3,000,000 | ||||||||||||||
| Interest rate at year-end | 0.15 | % | 0.35 | % | 0.46 | % | ||||||||||||||
| Average balance outstanding during the year | $ | 207,121 | $ | 5,563 | $ | 2,902,732 | ||||||||||||||
| Weighted-average interest rate during the year | 0.52 | % | 0.47 | % | 0.72 | % | ||||||||||||||
| Maximum month-end outstanding during the year | $ | 300,430 | $ | 8,314 | $ | 4,900,000 | ||||||||||||||
| December 31, 2019 | ||||||||||||||||||||
| Amount outstanding at year-end | $ | 132,270 | $ | 9,496 | $ | 2,400,000 | ||||||||||||||
| Interest rate at year-end | 1.66 | % | 0.61 | % | 1.68 | % | ||||||||||||||
| Average balance outstanding during the year | $ | 502,604 | $ | 11,655 | $ | 2,523,836 | ||||||||||||||
| Weighted-average interest rate during the year | 2.36 | % | 0.51 | % | 2.31 | % | ||||||||||||||
| Maximum month-end outstanding during the year | $ | 905,473 | $ | 14,208 | $ | 5,000,000 | ||||||||||||||
| December 31, 2018 | ||||||||||||||||||||
| Amount outstanding at year-end | $ | 629,169 | $ | 12,005 | $ | 3,900,000 | ||||||||||||||
| Interest rate at year-end | 2.54 | % | 0.09 | % | 2.56 | % | ||||||||||||||
| Average balance outstanding during the year | $ | 323,140 | $ | 9,812 | $ | 1,769,452 | ||||||||||||||
| Weighted-average interest rate during the year | 2.02 | % | 0.09 | % | 2.05 | % | ||||||||||||||
| Maximum month-end outstanding during the year | $ | 629,169 | $ | 13,835 | $ | 4,000,000 | ||||||||||||||
The following table summarizes our other borrowing capacities net of balances outstanding. As of December 31, 2019,2020, all are scheduled to mature within one year.
| December 31, | |||||||||||||||||
| (in thousands) | 2020 | 2019 | 2018 | ||||||||||||||
| FHLB borrowing capacity relating to loans | $ | 7,653,317 | $ | 8,964,019 | $ | 4,568,842 | |||||||||||
| FHLB borrowing capacity relating to securities | 2,946,539 | 589 | 721 | ||||||||||||||
| Total FHLB borrowing capacity(1) | $ | 10,599,856 | $ | 8,964,608 | $ | 4,569,563 | |||||||||||
| Unused federal funds lines available from commercial banks | $ | 1,030,000 | $ | 1,432,000 | $ | 620,000 | |||||||||||
| Unused Federal Reserve borrowings capacity | $ | 2,179,000 | $ | 3,637,238 | $ | 4,933,965 | |||||||||||
| Unused revolving line of credit(2) | $ | 130,000 | $ | 130,000 | $ | 130,000 | |||||||||||
| December 31, | |||||||||||
| (in thousands) | 2019 | 2018 | 2017 | ||||||||
| FHLB borrowing capacity relating to loans | $ | 8,964,019 | $ | 4,568,842 | $ | 3,890,995 | |||||
| FHLB borrowing capacity relating to securities | 589 | 721 | 2,071 | ||||||||
| Total FHLB borrowing capacity(1) | $ | 8,964,608 | $ | 4,569,563 | $ | 3,893,066 | |||||
| Unused federal funds lines available from commercial banks | $ | 1,432,000 | $ | 620,000 | $ | 885,000 | |||||
| Unused Federal Reserve borrowings capacity | $ | 3,637,238 | $ | 4,933,965 | $ | 4,114,594 | |||||
| Unused revolving line of credit(2) | $ | 130,000 | $ | 130,000 | $ | 130,000 | |||||
(2)Unsecured revolving, non-amortizing line of credit with maturity date of December 14, 2021. Proceeds may be used for general corporate purposes, including funding regulatory capital infusions into the Bank. The loan agreement contains customary financial covenants and restrictions. NaN borrowings were made against this line of credit during 2020, 2019, or 2018.
86
From November 2002 to September 2006 various Texas Capital Statutory Trusts were created and subsequently issued floating rate trust preferred securities in various private offerings totaling $113.4 million. As of December 31, 2019,2020, the details of the trust preferred subordinated debentures are summarized below:
| (dollar amounts in thousands) | Texas Capital Bancshares Statutory Trust I | Texas Capital Statutory Trust II | Texas Capital Statutory Trust III | Texas Capital Statutory Trust IV | Texas Capital Statutory Trust V | ||||
| Date issued | November 19, 2002 | April 10, 2003 | October 6, 2005 | April 28, 2006 | September 29, 2006 | ||||
| Trust preferred securities issued | $10,310 | $10,310 | $25,774 | $25,774 | $41,238 | ||||
| Floating or fixed rate securities | Floating | Floating | Floating | Floating | Floating | ||||
| Interest rate on subordinated debentures | 3 month LIBOR + 3.35% | 3 month LIBOR + 3.25% | 3 month LIBOR + 1.51% | 3 month LIBOR + 1.60% | 3 month LIBOR + 1.71% | ||||
| Maturity date | November 2032 | April 2033 | December 2035 | June 2036 | December 2036 | ||||
| (dollar amounts in thousands) | Texas Capital Bancshares Statutory Trust I | Texas Capital Statutory Trust II | Texas Capital Statutory Trust III | Texas Capital Statutory Trust IV | Texas Capital Statutory Trust V | ||||||||||||||||||||||||
| Date issued | November 19, 2002 | April 10, 2003 | October 6, 2005 | April 28, 2006 | September 29, 2006 | ||||||||||||||||||||||||
| Trust preferred securities issued | $10,310 | $10,310 | $25,774 | $25,774 | $41,238 | ||||||||||||||||||||||||
| Floating or fixed rate securities | Floating | Floating | Floating | Floating | Floating | ||||||||||||||||||||||||
| Interest rate on subordinated debentures | 3 month LIBOR + 3.35% | 3 month LIBOR + 3.25% | 3 month LIBOR + 1.51% | 3 month LIBOR + 1.60% | 3 month LIBOR + 1.71% | ||||||||||||||||||||||||
| Maturity date | November 2032 | April 2033 | December 2035 | June 2036 | December 2036 | ||||||||||||||||||||||||
On September 21, 2012, the Company issued $111.0 million of subordinated notes. The notes mature in September 2042 and bear interest at a rate of 6.50% per annum, payable quarterly. The indenture governing the notes contains customary covenants and restrictions.
On January 31, 2014, the Bank issued $175.0 million of subordinated notes in an offering to institutional investors exempt from registration under Section 3(a)(2) of the Securities Act of 1933 and 12 C.F.R. Part 16. The notes mature in January 2026 and bear interest at a rate of 5.25% per annum, payable semi-annually. The notes are unsecured and are subordinate to the Bank’s obligations to its depositors, its obligations under banker’s acceptances and letters of credit, certain obligations to Federal Reserve Banks and the FDIC and the Bank’s obligations to its other creditors, except any obligations which expressly rank on a parity with or junior to the notes. The notes qualify as Tier 2 capital for regulatory capital purposes, subject to applicable limitations.
The table below presents our financial instruments with off-balance sheet risk, as well as the activity in the allowance for off-balance sheet credit losses related to those financial instruments. This allowance is recorded in other liabilities on the consolidated balance sheet.
| Year Ended December 31, | |||||||
| (in thousands) | 2019 | 2018 | |||||
| Beginning balance of allowance for off-balance sheet credit losses | $ | 11,434 | $ | 9,071 | |||
| Provision for off-balance sheet credit losses | (2,794 | ) | 2,363 | ||||
| Ending balance of allowance for off-balance sheet credit losses | $ | 8,640 | $ | 11,434 | |||
| Commitments to extend credit - period end balance | $ | 8,066,655 | $ | 8,030,198 | |||
| Standby letters of credit - period end balance | $ | 261,405 | $ | 236,537 | |||
| Year Ended December 31, | |||||||||||
| (in thousands) | 2020 | 2019 | |||||||||
| Beginning balance of allowance for off-balance sheet credit losses | $ | 8,640 | $ | 11,434 | |||||||
| Impact of CECL adoption | 563 | — | |||||||||
| Provision for off-balance sheet credit losses | 8,231 | (2,794) | |||||||||
| Ending balance of allowance for off-balance sheet credit losses | $ | 17,434 | $ | 8,640 | |||||||
| Commitments to extend credit - period end balance | $ | 8,530,453 | $ | 8,066,655 | |||||||
| Standby letters of credit - period end balance | $ | 268,894 | $ | 261,405 | |||||||
The Company and the Bank are subject to various regulatory capital requirements administered by the federal banking agencies. Failure to meet minimum capital requirements can initiate certain mandatory (and possibly additional discretionary) actions by regulators that, if undertaken, could have a direct material adverse effect on the Company’s and the Bank’s financial statements. Under capital adequacy guidelines and the regulatory framework for prompt corrective action, the Company and the Bank must meet specific capital guidelines that involve quantitative measures of the Company’s and the Bank’s assets, liabilities, and certain off-balance sheet items as calculated under regulatory accounting practices. The Company’s and the Bank’s capital amounts and classification are also subject to qualitative judgments by the regulators about components, risk weightings and other factors.
The Basel III regulatory capital framework (the "Basel III Capital Rules") adopted by U.S. federal regulatory authorities, among other things, (i) establishes the capital measure called "Common Equity Tier 1" ("CET1"), (ii) specifies that Tier 1 capital consist of CET1 and "Additional Tier 1 Capital" instruments meeting stated requirements, (iii) requires that most deductions/adjustments to regulatory capital measures be made to CET1 and not to other components of capital and (iv) defines the scope of the deductions/adjustments to the capital measures. The Basel III Capital Rules became effective for us on January 1, 2015 with certain transition provisions that became fully phased in on January 1, 2019.
Additionally, the Basel III Capital Rules require that we maintain a 2.5% capital conservation buffer with respect to each of CET1, Tier 1 and total capital to risk-weighted assets, which provides for capital levels that exceed the minimum risk-based capital adequacy requirements. The capital conservation buffer was subject to a three year phase-in period that began on January 1, 2016 and became fully phased-in on January 1, 2019 at 2.5%. The required capital conservation buffer during 2018 was 1.875%. A financial institution with a conservation buffer of less than the required amount is subject to
87
limitations on capital distributions, including dividend payments and stock repurchases, and certain discretionary bonus payments to executive officers.
In February 2019, the federal bank regulatory agencies issued a final rule (the "2019 CECL Rule") that revised certain capital regulations to account for changes to credit loss accounting under GAAP. The 2019 CECL Rule included a transition option that allows banking organizations to phase in, over a three-year period, the day-one adverse effects of adopting the new accounting standard related to the measurement of current expected credit losses on their regulatory capital ratios (three-year transition option). In March 2020, the federal bank regulatory agencies issued an interim final rule that maintains the three-year transition option of the 2019 CECL Rule and also provides banking organizations that were required under GAAP to implement CECL before the end of 2020 the option to delay for two years an estimate of the effect of CECL on regulatory capital, relative to the incurred loss methodology's effect on regulatory capital, followed by a three-year transition period (five-year transition option). We adopted CECL on January 1, 2020 and have elected to utilize the five-year transition option.
Quantitative measures established by regulation to ensure capital adequacy require the Company and the Bank to maintain minimum amounts and ratios of CET1, Tier 1 and total capital to risk-weighted assets, and of Tier 1 capital to average assets, each as defined in the regulations. Management believes, as of December 31, 2019,2020, that the Company and the Bank meet all capital adequacy requirements to which they are subject.
Financial institutions are categorized as well capitalized or adequately capitalized, based on minimum total risk-based, Tier 1 risk-based, CET1 and Tier 1 leverage ratios. As shown in the table below, the Company’s capital ratios exceeded the regulatory definition of "well capitalized"adequately capitalized as of December 31, 20192020 and 2018.2019. Based upon the information in its most recently filed call report, the Bank met the capital ratios necessary to be well capitalized. The regulatory authorities can apply changes in classification of assets and such changes may retroactively subject the Company to changes in capital ratios. Any such change could reduce one or more capital ratios below well-capitalized status. In addition, a change may result in imposition of additional assessments by the FDIC or could result in regulatory actions that could have a material effect on our condition and results of operations.
Because the Bank had less than $15.0 billion in total consolidated assets as of December 31, 2009, we are allowed to continue to classify our trust preferred securities, all of which were issued prior to May 19, 2010, as Tier 1 capital.
88
The table below summarizes our actual and required capital ratios under the Basel III Capital Rules:
| Actual | Minimum capital Required - Basel III Fully Phased-In | Required to be Considered Well Capitalized | |||||||||||||||||||||||||||
| (dollars in thousands) | Capital Amount | Ratio | Capital Amount | Ratio | Capital Amount | Ratio | |||||||||||||||||||||||
| December 31, 2020 | |||||||||||||||||||||||||||||
| CET1 | |||||||||||||||||||||||||||||
| Company | $ | 2,708,150 | 9.35 | % | $ | 2,026,400 | 7.00 | % | N/A | N/A | |||||||||||||||||||
| Bank | 2,744,211 | 9.48 | % | 2,025,417 | 7.00 | % | 1,880,745 | 6.50 | % | ||||||||||||||||||||
| Total capital (to risk-weighted assets) | |||||||||||||||||||||||||||||
| Company | 3,498,737 | 12.09 | % | 3,039,600 | 10.50 | % | N/A | N/A | |||||||||||||||||||||
| Bank | 3,375,983 | 11.67 | % | 3,038,126 | 10.50 | % | 2,893,453 | 10.00 | % | ||||||||||||||||||||
| Tier 1 capital (to risk-weighted assets) | |||||||||||||||||||||||||||||
| Company | 2,968,150 | 10.25 | % | 2,460,628 | 8.50 | % | N/A | N/A | |||||||||||||||||||||
| Bank | 2,904,211 | 10.04 | % | 2,459,435 | 8.50 | % | 2,314,763 | 8.00 | % | ||||||||||||||||||||
| Tier 1 capital (to average assets)(1) | |||||||||||||||||||||||||||||
| Company | 2,968,150 | 7.52 | % | 1,578,651 | 4.00 | % | N/A | N/A | |||||||||||||||||||||
| Bank | 2,904,211 | 7.36 | % | 1,578,207 | 4.00 | % | 1,972,758 | 5.00 | % | ||||||||||||||||||||
| December 31, 2019 | |||||||||||||||||||||||||||||
| CET1 | |||||||||||||||||||||||||||||
| Company | $ | 2,653,999 | 8.88 | % | $ | 2,091,591 | 7.00 | % | N/A | N/A | |||||||||||||||||||
| Bank | 2,676,513 | 8.96 | % | 2,090,870 | 7.00 | % | 1,941,522 | 6.50 | % | ||||||||||||||||||||
| Total capital (to risk-weighted assets) | |||||||||||||||||||||||||||||
| Company | 3,398,345 | 11.37 | % | 3,137,926 | 10.50 | % | N/A | N/A | |||||||||||||||||||||
| Bank | 3,262,144 | 10.92 | % | 3,136,305 | 10.50 | % | 2,986,957 | 10.00 | % | ||||||||||||||||||||
| Tier 1 capital (to risk-weighted assets) | |||||||||||||||||||||||||||||
| Company | 2,912,529 | 9.75 | % | 2,540,226 | 8.50 | % | N/A | N/A | |||||||||||||||||||||
| Bank | 2,835,043 | 9.49 | % | 2,538,913 | 8.50 | % | 2,389,565 | 8.00 | % | ||||||||||||||||||||
| Tier 1 capital (to average assets)(1) | |||||||||||||||||||||||||||||
| Company | 2,912,529 | 8.42 | % | 1,383,640 | 4.00 | % | N/A | N/A | |||||||||||||||||||||
| Bank | 2,835,043 | 8.20 | % | 1,383,190 | 4.00 | % | 1,728,988 | 5.00 | % | ||||||||||||||||||||
| Actual | Minimum Capital Required - Basel III Phase-In Schedule | Minimum capital Required - Basel III Fully Phased-In | Required to be Considered Well Capitalized | ||||||||||||||||||||
| (dollars in thousands) | Capital Amount | Ratio | Capital Amount | Ratio | Capital Amount | Ratio | Capital Amount | Ratio | |||||||||||||||
| December 31, 2019 | |||||||||||||||||||||||
| CET1 | |||||||||||||||||||||||
| Company | $ | 2,653,999 | 8.88 | % | $ | 1,344,825 | 4.50 | % | $ | 2,091,591 | 7.00 | % | N/A | N/A | |||||||||
| Bank | 2,676,513 | 8.96 | % | 1,344,131 | 4.50 | % | 2,090,870 | 7.00 | % | 1,941,522 | 6.50 | % | |||||||||||
| Total capital (to risk-weighted assets) | |||||||||||||||||||||||
| Company | 3,398,345 | 11.37 | % | 2,390,801 | 8.00 | % | 3,137,926 | 10.50 | % | N/A | N/A | ||||||||||||
| Bank | 3,262,144 | 10.92 | % | 2,389,565 | 8.00 | % | 3,136,305 | 10.50 | % | 2,986,957 | 10.00 | % | |||||||||||
| Tier 1 capital (to risk-weighted assets) | |||||||||||||||||||||||
| Company | 2,912,529 | 9.75 | % | 1,793,101 | 6.00 | % | 2,540,226 | 8.50 | % | N/A | N/A | ||||||||||||
| Bank | 2,835,043 | 9.49 | % | 1,792,174 | 6.00 | % | 2,538,913 | 8.50 | % | 2,389,565 | 8.00 | % | |||||||||||
| Tier 1 capital (to average assets)(1) | |||||||||||||||||||||||
| Company | 2,912,529 | 8.42 | % | 1,383,640 | 4.00 | % | 1,383,640 | 4.00 | % | N/A | N/A | ||||||||||||
| Bank | 2,835,043 | 8.20 | % | 1,383,190 | 4.00 | % | 1,383,190 | 4.00 | % | 1,728,988 | 5.00 | % | |||||||||||
| December 31, 2018 | |||||||||||||||||||||||
| CET1 | |||||||||||||||||||||||
| Company | $ | 2,330,599 | 8.58 | % | $ | 1,732,501 | 6.38 | % | $ | 1,902,354 | 7.00 | % | N/A | N/A | |||||||||
| Bank | 2,340,988 | 8.62 | % | 1,731,955 | 6.38 | % | 1,901,755 | 7.00 | % | 1,765,915 | 6.50 | % | |||||||||||
| Total capital (to risk-weighted assets) | |||||||||||||||||||||||
| Company | 3,074,097 | 11.31 | % | 2,683,679 | 9.88 | % | 2,853,532 | 10.50 | % | N/A | N/A | ||||||||||||
| Bank | 2,925,872 | 10.77 | % | 2,682,833 | 9.88 | % | 2,852,632 | 10.50 | % | 2,716,793 | 10.00 | % | |||||||||||
| Tier 1 capital (to risk-weighted assets) | |||||||||||||||||||||||
| Company | 2,589,374 | 9.53 | % | 2,140,149 | 7.88 | % | 2,310,002 | 8.50 | % | N/A | N/A | ||||||||||||
| Bank | 2,499,763 | 9.20 | % | 2,139,474 | 7.88 | % | 2,309,274 | 8.50 | % | 2,173,434 | 8.00 | % | |||||||||||
| Tier 1 capital (to average assets)(1) | |||||||||||||||||||||||
| Company | 2,589,374 | 9.87 | % | 1,049,694 | 4.00 | % | 1,049,694 | 4.00 | % | N/A | N/A | ||||||||||||
| Bank | 2,499,763 | 9.53 | % | 1,049,296 | 4.00 | % | 1,049,296 | 4.00 | % | 1,311,620 | 5.00 | % | |||||||||||
Our mortgage finance loan volumes can increase significantly at month-end, causing a meaningful difference between ending balance and average balance for any period. At December 31, 2019,2020, our mortgage finance loans were $8.2$9.1 billion compared to the average for the quarter ended December 31, 20192020 of $7.9$9.6 billion. As CET1, Tier 1 and total capital ratios are calculated using quarter-end risk-weighted assets and our mortgage finance loans are 100% risk-weighted (excluding MCA mortgage loans held for sale, which receive lower risk weights), the period-end fluctuation in these balances can significantly impact our reported ratios. Due to the actual risk profile and liquidity of this asset class, we manage capital allocated to mortgage finance loans based on changing trends in average balances and do not believe that the period-end balance is representative of risk characteristics that would justify higher allocations. However, we monitor our capital allocation to confirm that all capital levels remain above well-capitalized levels.
Dividends that may be paid by banks are routinely restricted by various regulatory authorities. The amount that can be paid in any calendar year without prior approval of our Bank’s regulatory agencies cannot exceed the lesser of the net profits (as defined) for that year plus the net profits for the preceding two calendar years, or retained earnings. The Basel III Capital Rules further limit the amount of dividends that may be paid by our Bank. No dividends were declared or paid on our common stock during 2020, 2019 2018 or 2017.2018.
On March 15, 2020, to encourage banks to lend all available funds during the COVID-19 pandemic, the Federal Reserve announced it had reduced the reserve requirement ratio to zero effective March 26, 2020 and continuing through December 31, 2020. The required reserve balances at the Federal Reserve at December 31, 2019 and 2018 werewas approximately $283.4 million and $157.7 million, respectively.
89
We have a qualified retirement plan with a salary deferral feature designed to qualify under Section 401 of the Internal Revenue Code (“the 401(k) Plan”). The 401(k) Plan permits our employees to defer a portion of their compensation. Matching contributions may be made in amounts and at times determined by the Company. We contributed approximately $10.3 million, $9.5 million, $9.6 million, and $8.4$9.6 million for the years ended December 31, 2020, 2019 2018 and 2017,2018, respectively. Employees are eligible to participate in the 401(k) Plan when they meet certain requirements concerning minimum age and period of credited service. All contributions to the 401(k) Plan are invested in accordance with participant elections among certain investment options.
We also offer a non-qualified deferred compensation plan for our executives and key members of management in order to assist us in attracting and retaining these individuals. Participants in the plan may elect to defer up to 75% of their annual salary and/or short-term incentive payout into deferral accounts that mirror the gains or losses of investments selected by the participants. The plan allows us to make discretionary contributions on behalf of a participant as well as matching contributions. We made matching contributions of $1.0 million in botheach of 2020, 2019 and 2018 and made discretionary contributions of $260,000 in 2017.2018. All participant contributions to the plan and any related earnings are immediately vested and may be withdrawn upon the participant's separation from service, death or disability or upon a date specified by the participant. Salary deferrals are recorded as salaries and employee benefits expense in the consolidated statements of income with an offsetting payable to participants in other liabilities on the consolidated balance sheets.
We have an Employee Stock Purchase Plan (“ESPP”). Employees are eligible for the ESPP when they meet certain requirements concerning period of credited service and minimum hours worked. Eligible employees may contribute a between 1% and 10% of eligible compensation up to the Section 423 of the Internal Revenue Code limit of $25,000. Employee contributions to the ESPP were temporarily suspended throughout 2020. On January 1, 2021, the suspension was removed and employee contributions commenced. In 2006, stockholders approved the ESPP, which allocated 400,000 shares for purchase. As of December 31, 2020, 2019 and 2018, 155,933, 155,933 and 2017, 155,933, 143,348 and 132,285 shares had been purchased on behalf of employees under the ESPP.
We have stock-based compensation plans under which equity-based compensation grants are made by the board of directors, or its designated committee. Grants are subject to vesting requirements. Under the plans, we may grant, among other things, non-qualified stock options, incentive stock options, restricted stock, restricted stock units (“RSUs”), stock appreciation rights (“SARs”), cash-settled performance units or any combination thereof to employees and non-employee directors. A total of 2,550,000 shares are authorized for grant under the plans. Total shares remaining available for grant under the plans at December 31, 20192020 were 1,772,070.1,203,294.
A summary of our SAR activity and related information is as follows. Grants of SARs include time-based vesting conditions that generally vest ratably over a period of five years.
| December 31, 2020 | December 31, 2019 | December 31, 2018 | |||||||||||||||||||||||||||||||||
| SARs | Weighted Average Exercise Price | SARs | Weighted Average Exercise Price | SARs | Weighted Average Exercise Price | ||||||||||||||||||||||||||||||
| SARs outstanding at beginning of year | 21,200 | $ | 33.95 | 41,350 | $ | 29.13 | 74,363 | $ | 30.12 | ||||||||||||||||||||||||||
| SARs exercised | (8,800) | 20.52 | (20,150) | 24.07 | (33,013) | 31.35 | |||||||||||||||||||||||||||||
| SARs outstanding at year-end | 12,400 | $ | 43.48 | 21,200 | $ | 33.95 | 41,350 | $ | 29.13 | ||||||||||||||||||||||||||
| SARs vested and exercisable at year-end | 12,400 | $ | 43.48 | 21,200 | $ | 33.95 | 39,750 | $ | 27.81 | ||||||||||||||||||||||||||
| Weighted average remaining contractual life of SARs vested (in years) | 2.26 | 2.14 | 2.33 | ||||||||||||||||||||||||||||||||
| Weighted average remaining contractual life of SARs outstanding (in years) | 2.26 | 2.14 | 2.44 | ||||||||||||||||||||||||||||||||
| Compensation expense | $ | 0 | $ | 6,000 | $ | 121,000 | |||||||||||||||||||||||||||||
| Unrecognized compensation expense | $ | 0 | $ | 0 | $ | 6,000 | |||||||||||||||||||||||||||||
| Weighted average period over which unrecognized compensation expense is expected to be recognized (in years) | 0.00 | 0.00 | 0.17 | ||||||||||||||||||||||||||||||||
| Fair value of shares vested during the year | $ | 0 | $ | 37,000 | $ | 211,000 | |||||||||||||||||||||||||||||
| Intrinsic value of SARs exercised | $ | 294,000 | $ | 724,000 | $ | 1,919,000 | |||||||||||||||||||||||||||||
| December 31, 2019 | December 31, 2018 | December 31, 2017 | |||||||||||||||||||||
| SARs | Weighted Average Exercise Price | SARs | Weighted Average Exercise Price | SARs | Weighted Average Exercise Price | ||||||||||||||||||
| SARs outstanding at beginning of year | 41,350 | $ | 29.13 | 74,363 | $ | 30.12 | 125,863 | $ | 31.68 | ||||||||||||||
| SARs exercised | (20,150 | ) | 24.07 | (33,013 | ) | 31.35 | (51,500 | ) | 33.94 | ||||||||||||||
| SARs outstanding at year-end | 21,200 | $ | 33.95 | 41,350 | $ | 29.13 | 74,363 | $ | 30.12 | ||||||||||||||
| SARs vested and exercisable at year-end | 21,200 | $ | 33.95 | 39,750 | $ | 27.81 | 60,463 | $ | 26.02 | ||||||||||||||
| Weighted average remaining contractual life of SARs vested (in years) | 2.14 | 2.33 | 2.82 | ||||||||||||||||||||
| Weighted average remaining contractual life of SARs outstanding (in years) | 2.14 | 2.44 | 3.35 | ||||||||||||||||||||
| Compensation expense | $ | 6,000 | $ | 121,000 | $ | 265,000 | |||||||||||||||||
| Unrecognized compensation expense | $ | — | $ | 6,000 | $ | 127,000 | |||||||||||||||||
| Weighted average period over which unrecognized compensation expense is expected to be recognized (in years) | 0.00 | 0.17 | 0.75 | ||||||||||||||||||||
| Fair value of shares vested during the year | $ | 37,000 | $ | 211,000 | $ | 294,000 | |||||||||||||||||
| Intrinsic value of SARs exercised | $ | 724,000 | $ | 1,919,000 | $ | 3,802,000 | |||||||||||||||||
90
A summary of our RSU activity and related information is as follows. Grants of RSUs include time-based vesting conditions that generally vest ratably over a period of three to five years. Additionally, from time to time, grants of RSUs with both time-based and performance-based vesting conditions are made that generally vest at the end of a three or four year period.
| December 31, 2019 | December 31, 2018 | December 31, 2017 | |||||||||||||||||||||
| RSUs | Weighted Average Grant Date Fair Value | RSUs | Weighted Average Grant Date Fair Value | RSUs | Weighted Average Grant Date Fair Value | ||||||||||||||||||
| RSUs outstanding at beginning of year | 349,533 | $ | 69.11 | 423,732 | $ | 60.01 | 425,055 | $ | 51.28 | ||||||||||||||
| RSUs granted | 386,913 | 59.28 | 95,891 | 88.07 | 121,243 | 80.40 | |||||||||||||||||
| RSUs vested | (140,666 | ) | 59.97 | (121,507 | ) | 54.97 | (102,057 | ) | 48.93 | ||||||||||||||
| RSUs forfeited | (37,468 | ) | 62.73 | (48,583 | ) | 63.60 | (20,509 | ) | 54.75 | ||||||||||||||
| RSUs outstanding at year-end | 558,312 | $ | 64.95 | 349,533 | $ | 69.11 | 423,732 | $ | 60.01 | ||||||||||||||
| Compensation expense | $ | 11,733,000 | $ | 8,803,000 | $ | 7,790,000 | |||||||||||||||||
| Unrecognized compensation expense | $ | 25,305,000 | $ | 16,538,000 | $ | 18,730,000 | |||||||||||||||||
| Weighted average period over which unrecognized compensation expense is expected to be recognized (in years) | 3.09 | 2.90 | 3.15 | ||||||||||||||||||||
| December 31, 2020 | December 31, 2019 | December 31, 2018 | |||||||||||||||||||||||||||||||||
| RSUs | Weighted Average Grant Date Fair Value | RSUs | Weighted Average Grant Date Fair Value | RSUs | Weighted Average Grant Date Fair Value | ||||||||||||||||||||||||||||||
| RSUs outstanding at beginning of year | 558,312 | $ | 64.95 | 349,533 | $ | 69.11 | 423,732 | $ | 60.01 | ||||||||||||||||||||||||||
| RSUs granted | 631,092 | 39.37 | 386,913 | 59.28 | 95,891 | 88.07 | |||||||||||||||||||||||||||||
| RSUs vested | (171,494) | 65.17 | (140,666) | 59.97 | (121,507) | 54.97 | |||||||||||||||||||||||||||||
| RSUs forfeited | (62,316) | 56.92 | (37,468) | 62.73 | (48,583) | 63.60 | |||||||||||||||||||||||||||||
| RSUs outstanding at year-end | 955,594 | $ | 48.76 | 558,312 | $ | 64.95 | 349,533 | $ | 69.11 | ||||||||||||||||||||||||||
| Compensation expense | $ | 15,655,000 | $ | 11,733,000 | $ | 8,803,000 | |||||||||||||||||||||||||||||
| Unrecognized compensation expense | $ | 29,146,000 | $ | 25,305,000 | $ | 16,538,000 | |||||||||||||||||||||||||||||
| Weighted average period over which unrecognized compensation expense is expected to be recognized (in years) | 2.83 | 3.09 | 2.90 | ||||||||||||||||||||||||||||||||
New non-employee directors receive grants of restricted common stock as to which restrictions lapse ratably over a period of three years. Compensation expense for these grants was $26,000, $36,000 $62,000 and $61,000$62,000 for the years ended December 31, 2020, 2019 2018 and 2017,2018, respectively.
Total compensation cost for all share-based arrangements was $15.7 million, $11.8 million $9.0 million and $8.1$9.0 million for the years ended December 31, 2020, 2019 2018 and 2017,2018, respectively.
Cash-settled units totaling 163,85659,285 were outstanding at December 31, 2019,2020, all of which are time-based and vest ratably over a period of four years. We granted 138,773 and 121,260 cash-settled units in 2018 and 2017, respectively. No2018. NaN grants were made in 2020 or 2019. Since these units have a cash payout feature, they are accounted for under the liability method with related expense based on the stock price at period end. Compensation cost for the cash-settled units was $1.8 million, $5.8 million $8.0 million and $13.9$8.0 million for the years ended December 31, 2020, 2019 2018 and 2017,2018, respectively.
Income tax expense/(benefit) consists of the following:
| Year ended December 31, | |||||||||||||||||
| (in thousands) | 2020 | 2019 | 2018 | ||||||||||||||
| Current: | |||||||||||||||||
| Federal | $ | 32,701 | $ | 69,427 | $ | 82,556 | |||||||||||
| State | 920 | 4,072 | 3,808 | ||||||||||||||
| Total | 33,621 | 73,499 | 86,364 | ||||||||||||||
| Deferred: | |||||||||||||||||
| Federal | (7,964) | 10,796 | (6,400) | ||||||||||||||
| State | 0 | 0 | 0 | ||||||||||||||
| Total | (7,964) | 10,796 | (6,400) | ||||||||||||||
| Total expense: | |||||||||||||||||
| Federal | 24,737 | 80,223 | 76,156 | ||||||||||||||
| State | 920 | 4,072 | 3,808 | ||||||||||||||
| Total | $ | 25,657 | $ | 84,295 | $ | 79,964 | |||||||||||
| Year ended December 31, | |||||||||||
| (in thousands) | 2019 | 2018 | 2017 | ||||||||
| Current: | |||||||||||
| Federal | $ | 69,427 | $ | 82,556 | $ | 94,112 | |||||
| State | 4,072 | 3,808 | 3,257 | ||||||||
| Total | 73,499 | 86,364 | 97,369 | ||||||||
| Deferred: | |||||||||||
| Federal | 10,796 | (6,400 | ) | 31,276 | |||||||
| State | — | — | — | ||||||||
| Total | 10,796 | (6,400 | ) | 31,276 | |||||||
| Total expense: | |||||||||||
| Federal | 80,223 | 76,156 | 125,388 | ||||||||
| State | 4,072 | 3,808 | 3,257 | ||||||||
| Total | $ | 84,295 | $ | 79,964 | $ | 128,645 | |||||
91
The reconciliation of our effective income tax rate toat the U.S. federal statutory tax rate to our income tax expense and effective tax rate is as follows:
| Year ended December 31, | ||||||||
| 2019 | 2018 | 2017 | ||||||
| U.S. statutory rate | 21 | % | 21 | % | 35 | % | ||
| State taxes | 1 | % | 1 | % | 1 | % | ||
| Non-deductible expenses | 1 | % | 1 | % | 1 | % | ||
| Deferred tax asset remeasurement write-off | — | % | — | % | 5 | % | ||
| Non-taxable income | (1 | )% | (1 | )% | (1 | )% | ||
| Other | (1 | )% | (1 | )% | (1 | )% | ||
| Effective tax rate | 21 | % | 21 | % | 40 | % | ||
| Year ended December 31, | |||||||||||||||||||||||||||||||||||
| 2020 | 2019 | 2018 | |||||||||||||||||||||||||||||||||
| Amount | Rate | Amount | Rate | Amount | Rate | ||||||||||||||||||||||||||||||
| U.S. statutory rate | $ | 19,309 | 21 | % | $ | 85,504 | 21 | % | $ | 79,965 | 21 | % | |||||||||||||||||||||||
| State taxes | 726 | 1 | % | 3,217 | 1 | % | 3,008 | 1 | % | ||||||||||||||||||||||||||
| Tax-exempt income | (3,356) | (4) | % | (5,127) | (1) | % | (4,855) | (1) | % | ||||||||||||||||||||||||||
| Tax credits | (1,216) | (1) | % | (2,052) | (1) | % | (2,421) | (1) | % | ||||||||||||||||||||||||||
| Disallowed FDIC | 3,920 | 4 | % | 2,468 | 1 | % | 2,418 | 1 | % | ||||||||||||||||||||||||||
| Disallowed compensation | 3,098 | 3 | % | 628 | 0 | % | 400 | 0 | % | ||||||||||||||||||||||||||
| Other | 3,176 | 4 | % | (343) | 0 | % | 1,449 | 0 | % | ||||||||||||||||||||||||||
| Effective tax rate | $ | 25,657 | 28 | % | $ | 84,295 | 21 | % | $ | 79,964 | 21 | % | |||||||||||||||||||||||
Our 2020 effective tax rate was significantly impacted by the lower level of income before income taxes experienced in 2020. The tax effect of unrealized gains and losses on available-for-sale debt securities is recorded to other comprehensive income and is not a component of income tax expense/(benefit).
At December 31, 2020, 2019 and 2018, we had unrecognized tax benefits of $1.1 million, $1.3 million and $1.6 million, respectively.
We are no longer subject to U.S. federal income tax examinations for years before 20162017 or state and local income tax examinations for years before 2015.
The table below summarizes significant components of our deferred tax assets and liabilities utilizing the federal corporate income tax rate of 21%. Management believes it is more likely than not that all of the deferred tax assets will be realized. In connection with our adoption of CECL, a $2.0 million increase to the deferred tax asset associated with our allowance for credit losses was recorded on January 1, 2020. Our net deferred tax assets are included in other assets in the consolidated balance sheets.
| December 31, | |||||||
| (in thousands) | 2019 | 2018 | |||||
| Deferred tax assets: | |||||||
| Allowance for credit losses | $ | 44,383 | $ | 44,224 | |||
| Operating lease liabilities | 20,894 | — | |||||
| Loan origination fees | 10,638 | 11,328 | |||||
| Stock compensation | 3,605 | 3,363 | |||||
| Non-accrual interest | 2,351 | 1,724 | |||||
| Non-qualified deferred compensation | 4,027 | 2,211 | |||||
| Other | 2,544 | 2,517 | |||||
| Total deferred tax assets | 88,442 | 65,367 | |||||
| Deferred tax liabilities: | |||||||
| Loan origination costs | (2,686 | ) | (2,049 | ) | |||
| Leases | (7,912 | ) | (9,000 | ) | |||
| Operating lease ROU assets | (19,644 | ) | — | ||||
| MSRs | (13,818 | ) | (9,184 | ) | |||
| Depreciation | (17,602 | ) | (8,233 | ) | |||
| Unrealized gain on securities | (2,379 | ) | (138 | ) | |||
| Other | (3,337 | ) | (2,662 | ) | |||
| Total deferred tax liabilities | (67,378 | ) | (31,266 | ) | |||
| Net deferred tax asset | $ | 21,064 | $ | 34,101 | |||
| December 31, | |||||||||||
| (in thousands) | 2020 | 2019 | |||||||||
| Deferred tax assets: | |||||||||||
| Allowance for credit losses | $ | 59,279 | $ | 44,383 | |||||||
| Operating lease liabilities | 17,983 | 20,894 | |||||||||
| Loan origination fees | 11,181 | 10,638 | |||||||||
| Stock compensation | 3,913 | 3,605 | |||||||||
| Non-accrual interest | 1,245 | 2,351 | |||||||||
| Non-qualified deferred compensation | 5,795 | 4,027 | |||||||||
| Other | 3,136 | 2,544 | |||||||||
| Total deferred tax assets | 102,532 | 88,442 | |||||||||
| Deferred tax liabilities: | |||||||||||
| Loan origination costs | (2,997) | (2,686) | |||||||||
| Leases | (8,603) | (7,912) | |||||||||
| Operating lease ROU assets | (16,617) | (19,644) | |||||||||
| MSRs | (22,566) | (13,818) | |||||||||
| Depreciation | (14,968) | (17,602) | |||||||||
| Unrealized gain on securities | (4,193) | (2,379) | |||||||||
| Other | (3,381) | (3,337) | |||||||||
| Total deferred tax liabilities | (73,325) | (67,378) | |||||||||
| Net deferred tax asset | $ | 29,207 | $ | 21,064 | |||||||
We determine the fair market values of our assets and liabilities measured at fair value on a recurring and nonrecurring basis using the fair value hierarchy as prescribed in ASC 820. The standard describes three levelsSee Note 1 - Operations and Summary of inputs that may be used to measureSignificant Accounting Policies for information regarding the fair value as provided below.hierarchy and a description of the methods and significant assumptions used by the Company is estimating its fair value disclosures for financial statements.
92
Assets and liabilities measured at fair value are as follows:
| Fair Value Measurements Using | |||||||||||||||||
| (in thousands) | Level 1 | Level 2 | Level 3 | ||||||||||||||
| December 31, 2020 | |||||||||||||||||
| Available-for-sale debt securities:(1) | |||||||||||||||||
| U.S. government agency securities | $ | 0 | $ | 123,589 | $ | 0 | |||||||||||
| Residential mortgage-backed securities | 0 | 2,828,956 | 0 | ||||||||||||||
| Tax-exempt asset-backed securities | 0 | 0 | 199,176 | ||||||||||||||
| CRT Securities | 0 | 0 | 11,417 | ||||||||||||||
| Equity securities(1)(2) | 26,593 | 7,239 | 0 | ||||||||||||||
| Loans held for sale(3) | 0 | 232,147 | 6,933 | ||||||||||||||
| Loans held for investment(4) | 0 | 0 | 21,209 | ||||||||||||||
| Derivative assets(5) | 0 | 102,720 | 0 | ||||||||||||||
| Derivative liabilities(5) | 0 | 99,255 | 0 | ||||||||||||||
| Non-qualified deferred compensation plan liabilities(6) | 26,593 | 0 | 0 | ||||||||||||||
| December 31, 2019 | |||||||||||||||||
| Available-for-sale debt securities:(1) | |||||||||||||||||
| Residential mortgage-backed securities | $ | 0 | $ | 5,266 | $ | 0 | |||||||||||
| Tax-exempt asset-backed securities | 0 | 0 | 197,027 | ||||||||||||||
| CRT Securities | 0 | 0 | 11,964 | ||||||||||||||
| Equity securities(1)(2) | 18,484 | 7,130 | 0 | ||||||||||||||
| Loans held for sale(3) | 0 | 2,564,281 | 7,043 | ||||||||||||||
| Loans held for investment(4) | 0 | 0 | 109,585 | ||||||||||||||
| Derivative assets(5) | 0 | 48,684 | 0 | ||||||||||||||
| Derivative liabilities(5) | 0 | 51,310 | 0 | ||||||||||||||
| Non-qualified deferred compensation plan liabilities(6) | 18,484 | 0 | 0 | ||||||||||||||
| Fair Value Measurements Using | |||||||||||
| (in thousands) | Level 1 | Level 2 | Level 3 | ||||||||
| December 31, 2019 | |||||||||||
| Available-for-sale debt securities:(1) | |||||||||||
| Residential mortgage-backed securities | $ | — | $ | 5,266 | $ | — | |||||
| Tax-exempt asset-backed securities | — | — | 197,027 | ||||||||
| CRT Securities | — | — | 11,964 | ||||||||
| Equity securities(1)(2) | 18,484 | 7,130 | — | ||||||||
| Loans held for sale(3) | — | 2,564,281 | 7,043 | ||||||||
| Loans held for investment(4)(6) | — | — | 109,585 | ||||||||
| Derivative assets(7) | — | 48,684 | — | ||||||||
| Derivative liabilities(7) | — | 51,310 | — | ||||||||
| Non-qualified deferred compensation plan liabilities(8) | 18,484 | — | — | ||||||||
| December 31, 2018 | |||||||||||
| Available-for-sale debt securities:(1) | |||||||||||
| Residential mortgage-backed securities | $ | — | $ | 7,242 | $ | — | |||||
| Tax-exempt asset-backed securities | — | — | 95,804 | ||||||||
| Equity securities(1)(2) | 10,262 | 6,908 | — | ||||||||
| Loans held for sale(3) | — | 1,952,760 | 16,415 | ||||||||
| Loans held for investment(4)(6) | — | — | 29,885 | ||||||||
| OREO(5)(6) | — | — | 79 | ||||||||
| Derivative assets(7) | — | 21,806 | — | ||||||||
| Derivative liabilities(7) | — | 41,375 | — | ||||||||
| Non-qualified deferred compensation plan liabilities(8) | 10,148 | — | — | ||||||||
(3)Loans held for sale purchased through our MCA program are measured at fair value on a recurring basis, generally monthly.
(4)Includes certain collateral-dependent loans held for investment for which a specific allocation of the allowance for credit losses is based upon the fair value of the loan’s underlying collateral. These loans held for investment are measured on a nonrecurring basis, generally annually or more often as warranted by market and economic conditions.
(5)Derivative assets and liabilities are measured at fair value on a recurring basis, generally quarterly.
(6)Non-qualified deferred compensation plan liabilities represent the fair value of the obligation to the employee, which generally corresponds to the fair value of the invested assets, and are measured at fair value on a recurring basis, generally monthly.
93
Level 3 Valuations
The following table presents a reconciliation of the level 3 fair value category measured at fair value on a recurring basis:
| Net Realized/Unrealized Gains (Losses) | |||||||||||||||||||||||||||||||||||
| (in thousands) | Balance at Beginning of Period | Purchases / Additions | Sales / Reductions | Realized | Unrealized | Balance at End of Period | |||||||||||||||||||||||||||||
| Year ended December 31, 2020 | |||||||||||||||||||||||||||||||||||
| Available-for-sale debt securities:(1) | |||||||||||||||||||||||||||||||||||
| Tax-exempt asset-backed securities | $ | 197,027 | $ | 8,470 | $ | (6,755) | $ | 0 | $ | 434 | $ | 199,176 | |||||||||||||||||||||||
| CRT Securities | $ | 11,964 | $ | 0 | $ | 0 | $ | 0 | $ | (547) | $ | 11,417 | |||||||||||||||||||||||
| Loans held for sale(2) | $ | 7,043 | $ | 1,472 | $ | (2,077) | $ | 248 | $ | 247 | $ | 6,933 | |||||||||||||||||||||||
| Year ended December 31, 2019 | |||||||||||||||||||||||||||||||||||
| Available-for-sale debt securities:(1) | |||||||||||||||||||||||||||||||||||
| Tax-exempt asset-backed securities | $ | 95,804 | $ | 92,010 | $ | (4,302) | $ | 0 | $ | 13,515 | $ | 197,027 | |||||||||||||||||||||||
| CRT Securities | $ | 0 | $ | 15,044 | $ | 0 | $ | (331) | $ | (2,749) | $ | 11,964 | |||||||||||||||||||||||
| Loans held for sale(2) | $ | 16,415 | $ | 321 | $ | (10,690) | $ | 190 | $ | 807 | $ | 7,043 | |||||||||||||||||||||||
| Net Realized/Unrealized Gains (Losses) | |||||||||||||||||||||||
| (in thousands) | Balance at Beginning of Period | Purchases / Additions | Sales / Reductions | Realized | Unrealized | Balance at End of Period | |||||||||||||||||
| Year ended December 31, 2019 | |||||||||||||||||||||||
| Available-for-sale debt securities:(1) | |||||||||||||||||||||||
| Tax-exempt asset-backed securities | $ | 95,804 | $ | 92,010 | $ | (4,302 | ) | $ | — | $ | 13,515 | $ | 197,027 | ||||||||||
| CRT Securities | $ | — | $ | 15,044 | $ | — | $ | (331 | ) | $ | (2,749 | ) | $ | 11,964 | |||||||||
| Loans held for sale(2) | $ | 16,415 | $ | 321 | $ | (10,690 | ) | $ | 190 | $ | 807 | $ | 7,043 | ||||||||||
| Year ended December 31, 2018 | |||||||||||||||||||||||
| Tax-exempt asset-backed securities(1) | $ | — | $ | 95,521 | $ | (3 | ) | $ | — | $ | 286 | $ | 95,804 | ||||||||||
| Loans held for sale(2) | $ | — | $ | 38,430 | $ | (20,591 | ) | $ | (173 | ) | $ | (1,251 | ) | $ | 16,415 | ||||||||
(2)Realized and unrealized gains/(losses) on loans held for sale are recorded in gain/(loss) on sale of loans held for sale.
Tax-exempt asset-backed securities
The fair value of tax-exempt asset-backed securities is based on a discounted cash flow model, which utilizes Level 3, or unobservable, inputs, the most significant of which were a discount rate and weighted-average life. At December 31, 2019,2020, the discount rates utilized ranged from 2.44% to 2.53% and the weighted-average life ranged from 5.51 years to 5.54 years. On a combined amortized cost weighted-average basis a discount rate of 2.99%2.49% and a weighted-average life of 7.05.53 years were utilized to determine the fair value of these securities compared to 4.21% and 9.2 years, respectively, at December 31, 2018.2020. At December 31, 2019, the combined weighted-average discount rate and weighted-average life utilized were 2.99% and 7.00 years, respectively.
CRT securities
The fair value of CRT securities is based on a discounted cash flow model, which utilizes Level 3, or unobservable, inputs, the most significant of which were a discount rate and weighted-average life. At December 31, 2019,2020, the discount rates utilized ranged from 2.75% to 7.59% and the weighted-average life ranged from 5.97 years to 10.54 years. On a combined amortized cost weighted-average basis a discount rate of 4.54%4.36% and a weighted-average life of 9.37.49 years were utilized to determine the fair value of these securities.securities at December 31, 2020. At December 31, 2019, the combined weighted-average discount rate and weighted-average life utilized were 4.54% and 9.33 years, respectively.
Loans held for sale
The fair value of loans held for sale using Level 3 inputs include loans that cannot be sold through normal sale channels and thus require significant management judgment or estimation when determining the fair value. The fair value of such loans is generally based upon quoted prices of comparable loans with a liquidity discount applied. At December 31, 2019,2020, the fair value of these loans was calculated using a weighted-average discounted price of 94.1%97.2%, compared to 92.9%94.1% at December 31, 2018.2019.
Loans held for investment
Certain impairedcollateral-dependent loans held for investment are reported at fair value through awhen, based upon an individual evaluation, the specific valuation allowance allocation of the allowance for loancredit losses that is deducted from the loan's amortized cost is based upon the fair value of the loan's underlying collateral. The $21.2 million fair value of loans held for investment at December 31, 2020 reported above includes loans held for investment with a carrying value of $25.3 million that were reduced by specific allowance allocations totaling $4.1 million based on collateral valuations utilizing Level 3 inputs. The $109.6 million fair value of loans held for investment at December 31, 2019 reported above includes impaired loans held for investment with a carrying value of $145.4 million that were reduced by specific valuation allowance allocations totaling $35.8 million based on collateral valuations utilizing Level 3 inputs. The $29.9 million fair value of loans held for investment at December 31, 2018 reported above includes impaired loans with a carrying value of $32.2 million that were reduced by specific valuation allowance allocations totaling $2.3 million based on collateral valuations utilizing Level 3 inputs.
94
Fair Value of Financial Instruments
A summary of the carrying amounts and estimated fair values of financial instruments is as follows:
| December 31, 2019 | December 31, 2018 | ||||||||||||||
| (in thousands) | Carrying Amount | Estimated Fair Value | Carrying Amount | Estimated Fair Value | |||||||||||
| Financial assets: | |||||||||||||||
| Level 1 inputs: | |||||||||||||||
| Cash and cash equivalents | $ | 4,425,583 | $ | 4,425,583 | $ | 3,080,065 | $ | 3,080,065 | |||||||
| Investment securities | 18,484 | 18,484 | 10,262 | 10,262 | |||||||||||
| Level 2 inputs: | |||||||||||||||
| Investment securities | 12,396 | 12,396 | 14,150 | 14,150 | |||||||||||
| Loans held for sale | 2,570,091 | 2,570,091 | 1,953,059 | 1,953,059 | |||||||||||
| Derivative assets | 48,684 | 48,684 | 21,806 | 21,806 | |||||||||||
| Level 3 inputs: | |||||||||||||||
| Investment securities | 208,991 | 208,991 | 95,804 | 95,804 | |||||||||||
| Loans held for sale | 7,043 | 7,043 | 16,415 | 16,415 | |||||||||||
| Loans held for investment, net | 24,451,215 | 24,478,586 | 22,376,552 | 22,347,876 | |||||||||||
| Financial liabilities: | |||||||||||||||
| Level 2 inputs: | |||||||||||||||
| Federal funds purchased | 132,270 | 132,270 | 629,169 | 629,169 | |||||||||||
| Customer repurchase agreements | 9,496 | 9,496 | 12,005 | 12,005 | |||||||||||
| Other borrowings | 2,400,000 | 2,400,000 | 3,900,000 | 3,900,000 | |||||||||||
| Subordinated notes | 282,129 | 292,302 | 281,767 | 283,349 | |||||||||||
| Trust preferred subordinated debentures | 113,406 | 113,406 | 113,406 | 113,406 | |||||||||||
| Derivative liabilities | 51,310 | 51,310 | 41,375 | 41,375 | |||||||||||
| Level 3 inputs: | |||||||||||||||
| Deposits | 26,478,593 | 29,357,121 | 20,606,113 | 20,608,494 | |||||||||||
| December 31, 2020 | December 31, 2019 | ||||||||||||||||||||||
| (in thousands) | Carrying Amount | Estimated Fair Value | Carrying Amount | Estimated Fair Value | |||||||||||||||||||
| Financial assets: | |||||||||||||||||||||||
| Level 1 inputs: | |||||||||||||||||||||||
| Cash and cash equivalents | $ | 9,206,380 | $ | 9,206,380 | $ | 4,425,583 | $ | 4,425,583 | |||||||||||||||
| Investment securities | 26,593 | 26,593 | 18,484 | 18,484 | |||||||||||||||||||
| Level 2 inputs: | |||||||||||||||||||||||
| Investment securities | 2,959,784 | 2,959,784 | 12,396 | 12,396 | |||||||||||||||||||
| Loans held for sale | 232,147 | 232,147 | 2,570,091 | 2,570,091 | |||||||||||||||||||
| Derivative assets | 102,720 | 102,720 | 48,684 | 48,684 | |||||||||||||||||||
| Level 3 inputs: | |||||||||||||||||||||||
| Investment securities | 210,593 | 210,593 | 208,991 | 208,991 | |||||||||||||||||||
| Loans held for sale | 6,933 | 6,933 | 7,043 | 7,043 | |||||||||||||||||||
| Loans held for investment, net | 24,176,245 | 24,233,185 | 24,451,215 | 24,478,586 | |||||||||||||||||||
| Financial liabilities: | |||||||||||||||||||||||
| Level 2 inputs: | |||||||||||||||||||||||
| Federal funds purchased | 107,600 | 107,600 | 132,270 | 132,270 | |||||||||||||||||||
| Customer repurchase agreements | 4,151 | 4,151 | 9,496 | 9,496 | |||||||||||||||||||
| Other borrowings | 3,000,000 | 3,000,000 | 2,400,000 | 2,400,000 | |||||||||||||||||||
| Subordinated notes | 282,490 | 291,704 | 282,129 | 292,302 | |||||||||||||||||||
| Trust preferred subordinated debentures | 113,406 | 113,406 | 113,406 | 113,406 | |||||||||||||||||||
| Derivative liabilities | 99,255 | 99,255 | 51,310 | 51,310 | |||||||||||||||||||
| Level 3 inputs: | |||||||||||||||||||||||
| Deposits | 30,996,589 | 30,997,980 | 26,478,593 | 26,486,090 | |||||||||||||||||||
The notional amounts and estimated fair values of derivative positions outstanding are presented in the following table:
| December 31, 2020 | December 31, 2019 | ||||||||||||||||||||||||||||
| Estimated Fair Value | Estimated Fair Value | ||||||||||||||||||||||||||||
| (in thousands) | Notional Amount | Asset Derivative | Liability Derivative | Notional Amount | Asset Derivative | Liability Derivative | |||||||||||||||||||||||
| Non-hedging derivatives: | |||||||||||||||||||||||||||||
| Financial institution counterparties: | |||||||||||||||||||||||||||||
| Commercial loan/lease interest rate swaps | $ | 1,922,956 | $ | 71 | $ | 96,246 | $ | 1,548,234 | $ | 182 | $ | 46,518 | |||||||||||||||||
| Commercial loan/lease interest rate caps | 565,634 | 34 | 0 | 639,163 | 32 | 0 | |||||||||||||||||||||||
| Foreign currency forward contracts | 6,667 | 214 | 78 | 2,219 | 169 | 0 | |||||||||||||||||||||||
| Customer counterparties: | |||||||||||||||||||||||||||||
| Commercial loan/lease interest rate swaps | 1,922,956 | 96,246 | 71 | 1,548,234 | 46,518 | 182 | |||||||||||||||||||||||
| Commercial loan/lease interest rate caps | 565,634 | 0 | 34 | 639,163 | 0 | 32 | |||||||||||||||||||||||
| Foreign currency forward contracts | 6,667 | 78 | 214 | 2,219 | 0 | 169 | |||||||||||||||||||||||
| Economic hedging derivatives to hedge: | |||||||||||||||||||||||||||||
| Residential MSRs: | |||||||||||||||||||||||||||||
| Interest rate swap futures | 320,000 | 474 | 0 | 0 | 0 | 0 | |||||||||||||||||||||||
| Forward sale commitments | 155,000 | 551 | 0 | 0 | 0 | 0 | |||||||||||||||||||||||
| Loans held for sale: | |||||||||||||||||||||||||||||
| Loan purchase commitments | 332,145 | 5,123 | 8 | 214,012 | 1,965 | 4 | |||||||||||||||||||||||
| Forward sale commitments | 485,326 | 0 | 2,675 | 2,654,653 | 0 | 4,587 | |||||||||||||||||||||||
| Gross derivatives | 102,791 | 99,326 | 48,866 | 51,492 | |||||||||||||||||||||||||
| Offsetting derivative assets/liabilities | (71) | (71) | (182) | (182) | |||||||||||||||||||||||||
| Net derivatives included in the consolidated balance sheets | $ | 102,720 | $ | 99,255 | $ | 48,684 | $ | 51,310 | |||||||||||||||||||||
| December 31, 2019 | December 31, 2018 | ||||||||||||||||||||
| Estimated Fair Value | Estimated Fair Value | ||||||||||||||||||||
| (in thousands) | Notional Amount | Asset Derivative | Liability Derivative | Notional Amount | Asset Derivative | Liability Derivative | |||||||||||||||
| Non-hedging derivatives: | |||||||||||||||||||||
| Financial institution counterparties: | |||||||||||||||||||||
| Commercial loan/lease interest rate swaps | $ | 1,548,234 | $ | 182 | $ | 46,518 | $ | 1,579,328 | $ | 7,978 | $ | 16,719 | |||||||||
| Commercial loan/lease interest rate caps | 639,163 | 32 | — | 606,950 | 1,109 | 4 | |||||||||||||||
| Foreign currency forward contracts | 2,219 | 169 | — | 39,737 | 2,263 | 59 | |||||||||||||||
| Customer counterparties: | |||||||||||||||||||||
| Commercial loan/lease interest rate swaps | 1,548,234 | 46,518 | 182 | 1,579,328 | 16,719 | 7,978 | |||||||||||||||
| Commercial loan/lease interest rate caps | 639,163 | — | 32 | 606,950 | 4 | 1,109 | |||||||||||||||
| Foreign currency forward contracts | 2,219 | — | 169 | 39,737 | 59 | 2,263 | |||||||||||||||
| Economic hedging interest rate derivatives: | |||||||||||||||||||||
| Loan purchase commitments | 214,012 | 1,965 | 4 | 167,984 | 1,442 | 6 | |||||||||||||||
| Forward sale commitments | 2,654,653 | — | 4,587 | 1,928,527 | — | 21,005 | |||||||||||||||
| Gross derivatives | 48,866 | 51,492 | 29,574 | 49,143 | |||||||||||||||||
| Offsetting derivative assets/liabilities | (182 | ) | (182 | ) | (7,768 | ) | (7,768 | ) | |||||||||||||
| Net derivatives included in the consolidated balance sheets | $ | 48,684 | $ | 51,310 | $ | 21,806 | $ | 41,375 | |||||||||||||
95
The weighted-average received and paid interest rates for interest rate swaps outstanding were as follows:
December 31, 2019 Weighted-Average Interest Rate | December 31, 2018 Weighted-Average Interest Rate | ||||||||||
| Received | Paid | Received | Paid | ||||||||
| Non-hedging interest rate swaps | 3.94 | % | 3.26 | % | 4.24 | % | 4.20 | % | |||
| December 31, 2020 Weighted-Average Interest Rate | December 31, 2019 Weighted-Average Interest Rate | ||||||||||||||||||||||
| Received | Paid | Received | Paid | ||||||||||||||||||||
| Non-hedging interest rate swaps | 3.14 | % | 1.38 | % | 3.94 | % | 3.26 | % | |||||||||||||||
The weighted-average strike rate for outstanding interest rate caps was 3.41% at December 31, 2020 and 3.29% at December 31, 2019 and 3.20% at December 31, 2018.2019.
Our credit exposure on derivative instruments is limited to the net favorable value and interest payments by each counterparty. In some cases collateral may be required from the counterparties involved if the net value of the derivative instruments exceeds a nominal amount. Our credit exposure associated with these instruments, net of any collateral pledged, was approximately
We also enter into credit risk participation agreements with financial institution counterparties for interest rate swaps related to loans in which we are either a participant or a lead bank. The risk participation agreements entered into by us as a participant bank provide credit protection to the financial institution counterparty should the borrower fail to perform on its interest rate derivative contract with that financial institution. We are party to 129 risk participation agreements where we are a participant bank with a notional amount of $146.7$119.5 million at December 31, 2019,2020, compared to 1312 risk participation agreements having a notional amount of $149.1$146.7 million at December 31, 2018.2019. The maximum estimated exposure to these agreements, assuming 100% default by all obligors, was approximately $6.0 million at December 31, 2020 and $3.6 million at December 31, 2019 and $1.5 million at December 31, 2018.2019. The fair value of these exposures was insignificant to the consolidated financial statements at both December 31, 20192020 and December 31, 2018.2019. Risk participation agreements entered into by us as the lead bank provide credit protection to us should the borrower fail to perform on its interest rate derivative contract with us. We are party to 1216 risk participation agreements where we are the lead bank having a notional amount of $145.9$165.9 million at December 31, 2019,2020, compared to 912 agreements having a notional amount of $114.8$145.9 million at December 31, 2018.2019.
During 20192020 and 2018,2019, we have had transactions with our directors, executive officers and their affiliates and our employees. These transactions were made in the ordinary course of business and include extensions of credit and deposit transactions. The Bank had approximately $13.0$11.6 million in deposits from related parties, including directors, stockholders and their affiliates at December 31, 20192020 and $13.5$13.0 million at December 31, 2018.2019.
(19) Parent Company Only
Summarized financial information for Texas Capital Bancshares, Inc. – Parent Company Only are as follows:
Balance Sheet
| December 31, | |||||||
| (in thousands) | 2019 | 2018 | |||||
| Assets | |||||||
| Cash and cash equivalents | $ | 71,462 | $ | 89,561 | |||
| Loans held for investment (net of unearned income) | 10,500 | 7,500 | |||||
| Investment in subsidiaries | 2,878,330 | 2,534,341 | |||||
| Other assets | 88,639 | 87,451 | |||||
| Total assets | $ | 3,048,931 | $ | 2,718,853 | |||
| Liabilities and Stockholders’ Equity | |||||||
| Other liabilities | $ | 1,768 | $ | 1,471 | |||
| Subordinated notes | 108,715 | 108,614 | |||||
| Trust preferred subordinated debentures | 113,406 | 113,406 | |||||
| Total liabilities | 223,889 | 223,491 | |||||
| Preferred stock | 150,000 | 150,000 | |||||
| Common stock | 503 | 502 | |||||
| Additional paid-in capital | 988,357 | 978,042 | |||||
| Retained earnings | 1,677,240 | 1,366,308 | |||||
| Treasury stock | (8 | ) | (8 | ) | |||
| Accumulated other comprehensive income | 8,950 | 518 | |||||
| Total stockholders’ equity | 2,825,042 | 2,495,362 | |||||
| Total liabilities and stockholders’ equity | $ | 3,048,931 | $ | 2,718,853 | |||
| December 31, | |||||||||||
| (in thousands) | 2020 | 2019 | |||||||||
| Assets | |||||||||||
| Cash and cash equivalents | $ | 57,472 | $ | 71,462 | |||||||
| Loans held for investment (net of unearned income) | 7,500 | 10,500 | |||||||||
| Investment in subsidiaries | 2,930,843 | 2,847,393 | |||||||||
| Other assets | 89,551 | 88,639 | |||||||||
| Total assets | $ | 3,085,366 | $ | 3,017,994 | |||||||
| Liabilities and Stockholders’ Equity | |||||||||||
| Other liabilities | $ | 1,320 | $ | 1,768 | |||||||
| Subordinated notes | 108,816 | 108,715 | |||||||||
| Trust preferred subordinated debentures | 113,406 | 113,406 | |||||||||
| Total liabilities | 223,542 | 223,889 | |||||||||
| Preferred stock | 150,000 | 150,000 | |||||||||
| Common stock | 504 | 503 | |||||||||
| Additional paid-in capital | 1,002,050 | 988,357 | |||||||||
| Retained earnings | 1,693,504 | 1,646,303 | |||||||||
| Treasury stock | (8) | (8) | |||||||||
| Accumulated other comprehensive income | 15,774 | 8,950 | |||||||||
| Total stockholders’ equity | 2,861,824 | 2,794,105 | |||||||||
| Total liabilities and stockholders’ equity | $ | 3,085,366 | $ | 3,017,994 | |||||||
Statement of EarningsIncome
| Year ended December 31, | |||||||||||||||||
| (in thousands) | 2020 | 2019 | 2018 | ||||||||||||||
| Interest on loans | $ | 3,402 | $ | 3,401 | $ | 3,398 | |||||||||||
| Dividend income | 10,400 | 10,400 | 10,400 | ||||||||||||||
| Other income | 96 | 151 | 142 | ||||||||||||||
| Total income | 13,898 | 13,952 | 13,940 | ||||||||||||||
| Other non-interest income | 3 | 17 | 7 | ||||||||||||||
| Interest expense | 10,515 | 12,342 | 12,031 | ||||||||||||||
| Salaries and employee benefits | 725 | 607 | 588 | ||||||||||||||
| Legal and professional | 3,238 | 3,093 | 2,020 | ||||||||||||||
| Other non-interest expense | 4,553 | 1,889 | 2,013 | ||||||||||||||
| Total expense | 19,031 | 17,931 | 16,652 | ||||||||||||||
| Income (loss) before income taxes and equity in undistributed income of subsidiary | (5,130) | (3,962) | (2,705) | ||||||||||||||
| Income tax expense (benefit) | (1,135) | (861) | (587) | ||||||||||||||
| Income (loss) before equity in undistributed income of subsidiary | (3,995) | (3,101) | (2,118) | ||||||||||||||
| Equity in undistributed income of subsidiary | 68,100 | 312,932 | 293,321 | ||||||||||||||
| Net income | 64,105 | 309,831 | 291,203 | ||||||||||||||
| Preferred stock dividends | 9,750 | 9,750 | 9,750 | ||||||||||||||
| Net income available to common stockholders | $ | 54,355 | $ | 300,081 | $ | 281,453 | |||||||||||
| Year ended December 31, | |||||||||||
| (in thousands) | 2019 | 2018 | 2017 | ||||||||
| Interest on loans | $ | 3,401 | $ | 3,398 | $ | 3,271 | |||||
| Dividend income | 10,400 | 10,400 | 10,400 | ||||||||
| Other income | 151 | 142 | 108 | ||||||||
| Total income | 13,952 | 13,940 | 13,779 | ||||||||
| Other non-interest income | 17 | 7 | 13 | ||||||||
| Interest expense | 12,342 | 12,031 | 10,908 | ||||||||
| Salaries and employee benefits | 607 | 588 | 489 | ||||||||
| Legal and professional | 3,093 | 2,020 | 1,700 | ||||||||
| Other non-interest expense | 1,889 | 2,013 | 1,761 | ||||||||
| Total expense | 17,931 | 16,652 | 14,858 | ||||||||
| Income (loss) before income taxes and equity in undistributed income of subsidiary | (3,962 | ) | (2,705 | ) | (1,066 | ) | |||||
| Income tax expense (benefit) | (861 | ) | (587 | ) | (371 | ) | |||||
| Income (loss) before equity in undistributed income of subsidiary | (3,101 | ) | (2,118 | ) | (695 | ) | |||||
| Equity in undistributed income of subsidiary | 323,783 | 300,758 | 194,118 | ||||||||
| Net income | 320,682 | 298,640 | 193,423 | ||||||||
| Preferred stock dividends | 9,750 | 9,750 | 9,750 | ||||||||
| Net income available to common stockholders | $ | 310,932 | $ | 288,890 | $ | 183,673 | |||||
97
Statements of Cash Flows
| Year ended December 31, | |||||||||||||||||
| (in thousands) | 2020 | 2019 | 2018 | ||||||||||||||
| Operating Activities | |||||||||||||||||
| Net income | $ | 64,105 | $ | 309,831 | $ | 291,203 | |||||||||||
| Adjustments to reconcile net income to net cash used in operating activities: | |||||||||||||||||
| Equity in undistributed income of subsidiary | (68,100) | (312,932) | (293,321) | ||||||||||||||
| Amortization | 101 | 101 | 101 | ||||||||||||||
| Increase in other assets | (912) | (1,187) | (1,152) | ||||||||||||||
| Increase (decrease) in other liabilities | (448) | 297 | 227 | ||||||||||||||
| Net cash used in operating activities | (5,254) | (3,890) | (2,942) | ||||||||||||||
| Investing Activities | |||||||||||||||||
| Net (increase)/decrease in loans held for investment | 3,000 | (3,000) | 0 | ||||||||||||||
| Investments in and advances to subsidiaries | 0 | 0 | (40,000) | ||||||||||||||
| Net cash provided by/(used in) investing activities | 3,000 | (3,000) | (40,000) | ||||||||||||||
| Financing Activities | |||||||||||||||||
| Proceeds from sale of stock related to stock-based awards | (1,986) | (1,459) | (2,382) | ||||||||||||||
| Preferred dividends paid | (9,750) | (9,750) | (9,750) | ||||||||||||||
| Net cash used in financing activities | (11,736) | (11,209) | (12,132) | ||||||||||||||
| Net decrease in cash and cash equivalents | (13,990) | (18,099) | (55,074) | ||||||||||||||
| Cash and cash equivalents at beginning of year | 71,462 | 89,561 | 144,635 | ||||||||||||||
| Cash and cash equivalents at end of year | $ | 57,472 | $ | 71,462 | $ | 89,561 | |||||||||||
| Year ended December 31, | |||||||||||
| (in thousands) | 2019 | 2018 | 2017 | ||||||||
| Operating Activities | |||||||||||
| Net income | $ | 320,682 | $ | 298,640 | $ | 193,423 | |||||
| Adjustments to reconcile net income to net cash used in operating activities: | |||||||||||
| Equity in undistributed income of subsidiary | (323,783 | ) | (300,758 | ) | (194,118 | ) | |||||
| Amortization | 101 | 101 | 101 | ||||||||
| Increase in other assets | (1,187 | ) | (1,152 | ) | (739 | ) | |||||
| Increase (decrease) in other liabilities | 297 | 227 | (40 | ) | |||||||
| Net cash used in operating activities | (3,890 | ) | (2,942 | ) | (1,373 | ) | |||||
| Investing Activities | |||||||||||
| Net increase in loans held for investment | (3,000 | ) | — | (7,500 | ) | ||||||
| Investments in and advances to subsidiaries | — | (40,000 | ) | (55,000 | ) | ||||||
| Net cash used in investing activities | (3,000 | ) | (40,000 | ) | (62,500 | ) | |||||
| Financing Activities | |||||||||||
| Proceeds from sale of stock related to stock-based awards | (1,459 | ) | (2,382 | ) | (2,241 | ) | |||||
| Preferred dividends paid | (9,750 | ) | (9,750 | ) | (9,750 | ) | |||||
| Net cash used in financing activities | (11,209 | ) | (12,132 | ) | (11,991 | ) | |||||
| Net increase (decrease) in cash and cash equivalents | (18,099 | ) | (55,074 | ) | (75,864 | ) | |||||
| Cash and cash equivalents at beginning of year | 89,561 | 144,635 | 220,499 | ||||||||
| Cash and cash equivalents at end of year | $ | 71,462 | $ | 89,561 | $ | 144,635 | |||||
98
The tables below summarize our quarterly financial information:
| 2020 Selected Quarterly Financial Data | |||||||||||||||||||||||
| (in thousands, except per share data) | Fourth | Third | Second | First | |||||||||||||||||||
| Interest income | $ | 255,163 | $ | 243,731 | $ | 252,010 | $ | 306,008 | |||||||||||||||
| Interest expense | 32,153 | 36,162 | 42,082 | 77,689 | |||||||||||||||||||
| Net interest income | 223,010 | 207,569 | 209,928 | 228,319 | |||||||||||||||||||
| Provision for credit losses | 32,000 | 30,000 | 100,000 | 96,000 | |||||||||||||||||||
| Net interest income after provision for credit losses | 191,010 | 177,569 | 109,928 | 132,319 | |||||||||||||||||||
| Non-interest income | 42,886 | 60,348 | 70,502 | 11,780 | |||||||||||||||||||
| Non-interest expense | 150,886 | 165,741 | 222,352 | 165,417 | |||||||||||||||||||
| Income/(loss) before income taxes | 83,010 | 72,176 | (41,922) | (21,318) | |||||||||||||||||||
| Income tax expense/(benefit) | 22,834 | 15,060 | (7,606) | (4,631) | |||||||||||||||||||
| Net income/(loss) | 60,176 | 57,116 | (34,316) | (16,687) | |||||||||||||||||||
| Preferred stock dividends | 2,437 | 2,438 | 2,437 | 2,438 | |||||||||||||||||||
| Net income/(loss) available to common stockholders | $ | 57,739 | $ | 54,678 | $ | (36,753) | $ | (19,125) | |||||||||||||||
| Basic earnings/(loss) per share: | $ | 1.14 | $ | 1.08 | $ | (0.73) | $ | (0.38) | |||||||||||||||
| Diluted earnings/(loss) per share: | $ | 1.14 | $ | 1.08 | $ | (0.73) | $ | (0.38) | |||||||||||||||
| 2019 Selected Quarterly Financial Data | |||||||||||||||||||||||
| (in thousands, except per share data) | Fourth | Third | Second | First | |||||||||||||||||||
| Interest income | $ | 337,757 | $ | 355,101 | $ | 346,893 | $ | 325,561 | |||||||||||||||
| Interest expense | 89,372 | 102,933 | 103,340 | 89,947 | |||||||||||||||||||
| Net interest income | 248,385 | 252,168 | 243,553 | 235,614 | |||||||||||||||||||
| Provision for credit losses | 17,000 | 11,000 | 27,000 | 20,000 | |||||||||||||||||||
| Net interest income after provision for credit losses | 231,385 | 241,168 | 216,553 | 215,614 | |||||||||||||||||||
| Non-interest income | 17,761 | 20,301 | 24,364 | 30,014 | |||||||||||||||||||
| Non-interest expense | 168,187 | 149,429 | 141,718 | 141,516 | |||||||||||||||||||
| Income before income taxes | 80,959 | 112,040 | 99,199 | 104,112 | |||||||||||||||||||
| Income tax expense | 16,539 | 23,958 | 21,387 | 22,411 | |||||||||||||||||||
| Net income | 64,420 | 88,082 | 77,812 | 81,701 | |||||||||||||||||||
| Preferred stock dividends | 2,437 | 2,438 | 2,437 | 2,438 | |||||||||||||||||||
| Net income available to common stockholders | $ | 61,983 | $ | 85,644 | $ | 75,375 | $ | 79,263 | |||||||||||||||
| Basic earnings per share: | $ | 1.23 | $ | 1.70 | $ | 1.50 | $ | 1.58 | |||||||||||||||
| Diluted earnings per share: | $ | 1.23 | $ | 1.70 | $ | 1.50 | $ | 1.58 | |||||||||||||||
(21) New Accounting Standards
| 2019 Selected Quarterly Financial Data | |||||||||||||||
| (in thousands, except per share data) | Fourth | Third | Second | First | |||||||||||
| Interest income | $ | 337,757 | $ | 355,101 | $ | 346,893 | $ | 325,561 | |||||||
| Interest expense | 89,372 | 102,933 | 103,340 | 89,947 | |||||||||||
| Net interest income | 248,385 | 252,168 | 243,553 | 235,614 | |||||||||||
| Provision for credit losses | 17,000 | 11,000 | 27,000 | 20,000 | |||||||||||
| Net interest income after provision for credit losses | 231,385 | 241,168 | 216,553 | 215,614 | |||||||||||
| Non-interest income | 17,761 | 20,301 | 24,364 | 30,014 | |||||||||||
| Non-interest expense | 158,690 | 149,370 | 141,561 | 140,378 | |||||||||||
| Income before income taxes | 90,456 | 112,099 | 99,356 | 105,250 | |||||||||||
| Income tax expense | 16,539 | 23,958 | 21,387 | 22,411 | |||||||||||
| Net income | 73,917 | 88,141 | 77,969 | 82,839 | |||||||||||
| Preferred stock dividends | 2,437 | 2,438 | 2,437 | 2,438 | |||||||||||
| Net income available to common stockholders | $ | 71,480 | $ | 85,703 | $ | 75,532 | $ | 80,401 | |||||||
| Basic earnings per share: | $ | 1.42 | $ | 1.70 | $ | 1.50 | $ | 1.60 | |||||||
| Diluted earnings per share: | $ | 1.42 | $ | 1.70 | $ | 1.50 | $ | 1.60 | |||||||
ASU 2020-01 "Investments - Equity Securities (Topic 321), Investments - Equity Method and Joint Ventures (Topic 323), and Derivatives and Hedging (Topic 815)" ("ASU 2020-01") clarifies the interaction of the accounting for equity securities under Topic 321 and investments accounted for under the equity method of accounting in Topic 323 and the accounting for certain forward contracts and purchased options accounted for under Topic 815. ASU 2020-01 will be effective for us on January 1, 2021 and is not expected to have any material impact on our consolidated financial statements.
ASU 2020-02 "Financial Instruments - Credit Losses (Topic 326) and Leases (Topic 842)" ("ASU 2020-02") incorporates SEC SAB 119 (updated from SAB 102) into the Accounting Standards Codification (the "Codification") by aligning SEC recommended policies and procedures with ASC 326. ASU 2020-02 was effective on January 1, 2020 and has not had a significant impact on our documentation requirements.
| 2018 Selected Quarterly Financial Data | |||||||||||||||
| (in thousands, except per share data) | Fourth | Third | Second | First | |||||||||||
| Interest income | $ | 321,718 | $ | 301,754 | $ | 286,852 | $ | 253,869 | |||||||
| Interest expense | 81,045 | 69,579 | 55,140 | 43,569 | |||||||||||
| Net interest income | 240,673 | 232,175 | 231,712 | 210,300 | |||||||||||
| Provision for credit losses | 35,000 | 13,000 | 27,000 | 12,000 | |||||||||||
| Net interest income after provision for credit losses | 205,673 | 219,175 | 204,712 | 198,300 | |||||||||||
| Non-interest income | 15,280 | 25,518 | 17,279 | 19,947 | |||||||||||
| Non-interest expense | 129,862 | 136,143 | 132,131 | 126,960 | |||||||||||
| Income before income taxes | 91,091 | 108,550 | 89,860 | 91,287 | |||||||||||
| Income tax expense | 19,200 | 22,998 | 18,424 | 19,342 | |||||||||||
| Net income | 71,891 | 85,552 | 71,436 | 71,945 | |||||||||||
| Preferred stock dividends | 2,437 | 2,438 | 2,437 | 2,438 | |||||||||||
| Net income available to common stockholders | $ | 69,454 | $ | 83,114 | $ | 68,999 | $ | 69,507 | |||||||
| Basic earnings per share: | $ | 1.38 | $ | 1.66 | $ | 1.39 | $ | 1.40 | |||||||
| Diluted earnings per share: | $ | 1.38 | $ | 1.65 | $ | 1.38 | $ | 1.38 | |||||||
99
ASU 2020-03 "Codification Improvements to Financial Instruments" ("ASU 2020-03") revised a wide variety of topics in the Codification with the intent to make the Codification easier to understand and apply by eliminating inconsistencies and providing clarifications. ASU 2020-03 was effective immediately upon its release in March 2020 and did not have a material impact on our consolidated financial statements.
ASU 2020-04, "Reference Rate Reform (Topic 848)" ("ASU 2020-04") provides optional expedients and exceptions for applying GAAP to loan and lease agreements, derivative contracts, and other transactions affected by the anticipated transition away from LIBOR toward new interest rate benchmarks. For transactions that are modified because of reference rate reform and that meet certain scope guidance (i) modifications of loan agreements should be accounted for by prospectively adjusting the effective interest rate and the modification will be considered "minor" so that any existing unamortized origination fees/costs would carry forward and continue to be amortized and (ii) modifications of lease agreements should be accounted for as a continuation of the existing agreement with no reassessments of the lease classification and the discount rate or remeasurements of lease payments that otherwise would be required for modifications not accounted for as separate contracts. ASU 2020-04 also provides numerous optional expedients for derivative accounting. ASU 2020-04 is effective March 12, 2020 through December 31, 2022. An entity may elect to apply ASU 2020-04 for contract modifications as of January 1, 2020, or prospectively from a date within an interim period that includes or is subsequent to March 12, 2020, up to the date that the financial statements are available to be issued. Once elected for a Topic or an Industry Subtopic within the Codification, the amendments in this ASU must be applied prospectively for all eligible contract modifications for that Topic or Industry Subtopic. We anticipate this ASU will simplify any modifications we execute between the selected start date (yet to be determined) and December 31, 2022 that are directly related to LIBOR transition by allowing prospective recognition of the continuation of the contract, rather than extinguishment of the old contract resulting in writing off unamortized fees/costs. We are evaluating the impacts of this ASU and have not yet determined whether this ASU will have material effects on our business operations and consolidated financial statements.
ITEM 9. CHANGES IN AND DISAGREEMENTS WITH ACCOUNTANTS ON ACCOUNTING AND FINANCIAL DISCLOSURES
None.
ITEM 9A. CONTROLS AND PROCEDURES
Evaluation of Disclosure Controls and Procedures
Our management, with the supervision and participation of our Chief Executive Officer and Chief Financial Officer, has evaluated the effectiveness of the design and operation of our disclosure controls and procedures (as defined in Rules 13a-15(e) and 15d-15(e) under the Securities Exchange Act of 1934, as amended (the "Exchange Act")) as of the end of the period covered by this report. Based upon that evaluation, we have concluded that, as of the end of such period, our disclosure controls and procedures were effective in recording, processing, summarizing and reporting, on a timely basis, information required to be disclosed by us in the reports that we file or submit under the Exchange Act and were effective in ensuring that information
required to be disclosed by us in the reports that we file or submit under the Exchange Act is accumulated and communicated to the Company's management, including our Chief Executive Officer and Chief Financial Officer, as appropriate to allow timely decisions regarding required disclosure.
Changes in Internal Control over Financial Reporting
There were no changes in our internal control over financial reporting (as defined in Rules 13a-15(e) and 15d-15(f) under the Exchange Act) during the period covered by this report that have materially affected, or are reasonably likely to materially affect, our internal control over financial reporting, except the following:
Management’s Report on Internal Control over Financial Reporting
The management of the Company is responsible for establishing and maintaining adequate internal control over financial reporting. Our internal control over financial reporting is a process designed under the supervision of our Chief Executive Officer and Chief Financial Officer to provide reasonable assurance regarding the reliability of financial reporting and the preparation of our financial statements for external purposes in accordance with generally accepted accounting principles.
As of December 31, 2019,2020, management assessed the effectiveness of the Company’s internal control over financial reporting based on the criteria for effective internal control over financial reporting established in “Internal Control—Integrated Framework (2013),” issued by the Committee of Sponsoring Organizations (COSO) of the Treadway Commission. Based on the assessment, management determined that the Company maintained effective internal control over financial reporting as of December 31, 2019.2020.
100
Ernst & Young LLP, the independent registered public accounting firm that audited the consolidated financial statements of the Company included in this Annual Report on Form 10-K, has issued an attestationaudit report on the effectiveness of the Company’s internal control over financial reporting as of December 31, 2019.2020. The report, which expresses an unqualified opinion on the effectiveness of the Company’s internal control over financial reporting as of December 31, 2019,2020, is included in this Item under the heading “Report of Independent Registered Public Accounting Firm.”
101
Report of Ernst & Young LLP, Independent Registered Public Accounting Firm
To the ShareholdersStockholders and the Board of Directors of Texas Capital Bancshares, Inc.
Opinion on Internal Control over Financial Reporting
We have audited Texas Capital Bancshares, Inc.’s internal control over financial reporting as of December 31, 2019,2020, based on criteria established in Internal Control-Integrated Framework issued by the Committee of Sponsoring Organizations of the Treadway Commission (2013 framework) (the COSO criteria). In our opinion, Texas Capital Bancshares, Inc. (the Company) maintained, in all material respects, effective internal control over financial reporting as of December 31, 2019,2020, based on the COSO criteria.
We also have audited, in accordance with the standards of the Public Company Accounting Oversight Board (United States) (PCAOB), the consolidated balance sheets of the Company as of December 31, 20192020 and 2018,2019, the related consolidated statements of income and other comprehensive income, shareholders’stockholders’ equity and cash flows for each of the three years in the period ended December 31, 2019,2020, and the related notes and our report dated February 12, 20209, 2021 expressed an unqualified opinion thereon.
Basis for Opinion
The Company’s management is responsible for maintaining effective internal control over financial reporting and for its assessment of the effectiveness of internal control over financial reporting included in the accompanying Management’s Report on Internal Control over Financial Reporting. Our responsibility is to express an opinion on the Company’s internal control over financial reporting based on our audit. We are a public accounting firm registered with the PCAOB and are required to be independent with respect to the Company in accordance with the U.S. federal securities laws and the applicable rules and regulations of the Securities and Exchange Commission and the PCAOB.
We conducted our audit in accordance with the standards of the PCAOB. Those standards require that we plan and perform the audit to obtain reasonable assurance about whether effective internal control over financial reporting was maintained in all material respects.
Our audit included obtaining an understanding of internal control over financial reporting, assessing the risk that a material weakness exists, testing and evaluating the design and operating effectiveness of internal control based on the assessed risk, and performing such other procedures as we considered necessary in the circumstances. We believe that our audit provides a reasonable basis for our opinion.
Definition and Limitations of Internal Control over Financial Reporting
A company’s internal control over financial reporting is a process designed to provide reasonable assurance regarding the reliability of financial reporting and the preparation of financial statements for external purposes in accordance with generally accepted accounting principles. A company’s internal control over financial reporting includes those policies and procedures that (1) pertain to the maintenance of records that, in reasonable detail, accurately and fairly reflect the transactions and dispositions of the assets of the company; (2) provide reasonable assurance that transactions are recorded as necessary to permit preparation of financial statements in accordance with generally accepted accounting principles, and that receipts and expenditures of the company are being made only in accordance with authorizations of management and directors of the company; and (3) provide reasonable assurance regarding prevention or timely detection of unauthorized acquisition, use, or disposition of the company’s assets that could have a material effect on the financial statements.
Because of its inherent limitations, internal control over financial reporting may not prevent or detect misstatements. Also, projections of any evaluation of effectiveness to future periods are subject to the risk that controls may become inadequate because of changes in conditions, or that the degree of compliance with the policies or procedures may deteriorate.
Dallas, TX
February 12, 2020
102
None.
Information required by this item relatingis set forth in our definitive proxy materials regarding our annual meeting of stockholders to Texas Capital Bancshares, Inc.’s directors, executive officers, code of ethics, audit committee and audit committee financial experts of the Company and Section 16(a) beneficial ownership reporting compliancebe held April 20, 2021, which proxy materials will be included in an amendment to this Annual Report on Form 10-K/A filed within 120 days afterwith the end of our 2019 fiscal year.SEC no later than March 11, 2021.
Information required by this item relatingis set forth in our definitive proxy materials regarding our annual meeting of stockholders to compensation of our directors and executive officersbe held April 20, 2021, which proxy materials will be included in an amendment to this Annual Report on Form 10-K/A filed within 120 days afterwith the end of our 2019 fiscal year.SEC no later than March 11, 2021.
Information required by this item relatingis set forth in our definitive proxy materials regarding our annual meeting of stockholders to security ownership of certain beneficial owners and management and securities authorized for issuance under equity compensation plansbe held April 20, 2021, which proxy materials will be included in an amendment to this Annual Report on Form 10-K/A filed within 120 days afterwith the end of our 2019 fiscal year.SEC no later than March 11, 2021.
Information required by this item relatingis set forth in our definitive proxy materials regarding our annual meeting of stockholders to security ownership of certain relationships and related transactions and director independencebe held April 20, 2021, which proxy materials will be included in an amendment to this Annual Report on Form 10-K/A filed within 120 days afterwith the end of our 2019 fiscal year.SEC no later than March 11, 2021.
Information required by this item relatingis set forth in our definitive proxy materials regarding our annual meeting of stockholders to principal accountant fees and servicesbe held April 20, 2021, which proxy materials will be included in an amendment to this Annual Report on Form 10-K/A filed within 120 days afterwith the end of our 2019 fiscal year.SEC no later than March 11, 2021.
ITEM 15. EXHIBITS, FINANCIAL STATEMENT SCHEDULES
(a) Documents filed as part of this report
(1) All financial statements
Independent Registered Public Accounting Firm’s Report of Ernst & Young LLP
(2) All financial statements required by Item 8
Independent Registered Public Accounting Firm’s Report of Ernst & Young LLP
(3) Exhibits
103
| 2.1 | |||||
| 3.1 | |||||
| 3.2 | |||||
| 3.3 | |||||
| 3.4 | |||||
| 3.5 | |||||
| 3.6 | |||||
| 3.7 | |||||
| 3.8 | |||||
| 4.1 | |||||
| 4.2 | |||||
| 4.3 | |||||
| 4.4 | |||||
| 4.5 | |||||
| 4.6 | |||||
| 4.7 | |||||
| 4.8 | |||||
| 4.9 | |||||
| 4.11 | |||||
104
| 4.12 | |||||
| 4.13 | |||||
| 4.14 | |||||
| 4.15 | |||||
| 4.16 | |||||
| 4.17 | |||||
| 4.18 | |||||
| 4.19 | |||||
| 4.20 | |||||
| 4.21 | |||||
| 4.22 | |||||
| 4.23 | |||||
| 10.1 | |||||
| 10.2 | |||||
| 10.3 | |||||
| 10.4 | |||||
105
| 10.11 | |||||
| 10.21 | |||||
| 21 | |||||
| 23.1 | |||||
| 31.1 | |||||
| 31.2 | |||||
| 32.1 | |||||
| 32.2 | |||||
| 101.INS | XBRL Instance Document* | ||||
| 101.SCH | XBRL Taxonomy Extension Schema Document* | ||||
| 101.CAL | XBRL Taxonomy Extension Calculation Linkbase Document* | ||||
| 101.DEF | XBRL Taxonomy Extension Definition Linkbase Document* | ||||
| 101.LAB | XBRL Taxonomy Extension Label Linkbase Document* | ||||
| 101.PRE | XBRL Taxonomy Extension Presentation Linkbase Document* | ||||
* Filed herewith ** Furnished herewith + Management contract or compensatory plan arrangement |
106
SIGNATURES
Pursuant to the requirements of Section 13 or 15(d) of the Securities Exchange Act of 1934, the Registrant has duly caused this report to be signed on its behalf by the undersigned thereunto duly authorized.
| Date: | February | TEXAS CAPITAL BANCSHARES, INC. | |||||||||||||||
| By: | /S/ ROB C. | ||||||||||||||||
Rob C. Holmes President and Chief Executive Officer | |||||||||||||||||
Pursuant to the requirements of the Securities Exchange Act of 1934, this report has been signed below by the following persons on behalf of the registrant and in the capacities and on the dates indicated.
| Date: | February 9, 2021 | /S/ LARRY L. HELM | |||||||||
| Larry L. Helm Chairman of the Board and Director | |||||||||||
| Date: | February 9, 2021 | /S/ JULIE L. ANDERSON | |||||||||
| Julie L. Anderson Chief Financial Officer (principal financial officer) | |||||||||||
| Date: | February 9, 2021 | /S/ ELLEN DETRICH | |||||||||
| Ellen Detrich Controller and Chief Accounting Officer (principal accounting officer) | |||||||||||
| Date: | February 9, 2021 | /S/ JONATHAN E. BALIFF | |||||||||
| Jonathan E. Baliff Director | |||||||||||
| Date: | February 9, 2021 | /S/ JAMES H. BROWNING | |||||||||
| James H. Browning Director | |||||||||||
| Date: | February 9, 2021 | /S/ DAVID S. HUNTLEY | |||||||||
| David S. Huntley Director | |||||||||||
| Date: | February 9, 2021 | /S/ CHARLES S. HYLE | |||||||||
| Charles S. Hyle Director | |||||||||||
| Date: | February 9, 2021 | /S/ ELYSIA H. RAGUSA | |||||||||
| Elysia H. Ragusa Director | |||||||||||
| Date: | February 9, 2021 | /S/ STEVEN P. ROSENBERG | |||||||||
| Steven P. Rosenberg Director | |||||||||||
| Date: | February 9, 2021 | /S/ ROBERT W. STALLINGS | |||||||||
| Robert W. Stallings Director | |||||||||||
| Date: | February 9, 2021 | /S/ DALE W. TREMBLAY | |||||||||
| Dale W. Tremblay Director | |||||||||||
Director | |||||||||||
Director | |||||||||||
Director | |||||||||||
Director | |||||||||||
Director | |||||||||||
Director | |||||||||||
107