UNITED STATES
SECURITIES AND EXCHANGE COMMISSION
Washington, D.C. 20549
Form 10-K
|
| | |
| (Mark One) |
| x | | ANNUAL REPORT PURSUANT TO SECTION 13 OR 15(d) OF THE SECURITIES EXCHANGE ACT OF 1934 |
| | | For the fiscal year ended October 31, 20132016 |
| or |
| o | | TRANSITION REPORT PURSUANT TO SECTION 13 OR 15(d) OF THE SECURITIES EXCHANGE ACT OF 1934 |
| | | For the transition period from to |
Commission File Number: 001-15405
Agilent Technologies, Inc.
(Exact name of registrant as specified in its charter) |
| | |
| Delaware | | 77-0518772 |
State or other jurisdiction of Incorporation or organization | | I.R.S. Employer Identification No. |
Address of principal executive offices: 5301 Stevens Creek Blvd., Santa Clara, California 95051
Registrant's telephone number, including area code: (408) 345-8886
Securities registered pursuant to Section 12(b) of the Act: |
| | |
| Title of each class | | Name of each exchange on which registered |
Common Stock par value $0.01 per share | | New York Stock Exchange Inc. |
Securities registered pursuant to Section 12(g) of the Act:
None
Indicate by check mark if the registrant is a well-known seasoned issuer, as defined in Rule 405 of the Securities Act. Yes x No ¨
Indicate by check mark if the registrant is not required to file reports pursuant to Section 13 or Section 15(d) of the Act. Yes ¨ No x
Indicate by check mark whether the registrant (1) has filed all reports required to be filed by Section 13 or 15(d) of the Securities Exchange Act of 1934 during the preceding 12 months (or for such shorter period that the registrant was required to file such reports), and (2) has been subject to such filing requirements for the past 90 days. Yes x No ¨
Indicate by check mark whether the registrant has submitted electronically and posted on its corporate website, if any, every Interactive Data File required to be submitted and posted pursuant to Rule 405 of Regulation S-T (§232.405 of this chapter) during the preceding 12 months (or for such shorter period that the registrant was required to submit and post such files). Yes x No ¨
Indicate by check mark if disclosure of delinquent filers pursuant to Item 405 of Regulation S-K (§229.405 of this chapter) is not contained herein, and will not be contained, to the best of registrant's knowledge, in definitive proxy or information statements incorporated by reference in Part III of this Form 10-K or any amendment to this Form 10-K.
Indicate by check mark whether the registrant is a large accelerated filer, an accelerated filer, a non-accelerated filer, or a smaller reporting company. See the definitions of "large accelerated filer," "accelerated filer" and "smaller reporting company" in Rule 12b-2 of the Exchange Act. |
| | | | | | |
Large accelerated filer x | | Accelerated filer ¨ | | Non-accelerated filer ¨ | | Smaller reporting company ¨ |
| | | | | (Do not check if a smaller reporting company) | | |
Indicate by check mark whether the registrant is a shell company (as defined in Rule 12b-2 of the Exchange Act). Yes ¨ No x
The aggregate market value of the registrant's common equity held by non-affiliates as of April 30, 2013,2016, was approximately $12.08$9.4 billion. Shares of stock held by officers, directors and 5 percent or more stockholders have been excluded in that such persons may be deemed to be affiliates. This determination of affiliate status is not necessarily a conclusive determination for other purposes.
As of December 1, 2013,2016, there were 331,808,500321,747,881 outstanding shares of common stock, par value $0.01 per share.
DOCUMENTS INCORPORATED BY REFERENCE |
| | |
| Document Description | | 10-K Part |
Portions of the Proxy Statement for the Annual Meeting of Stockholders (the "Proxy Statement") to be held on March 19, 2014,15, 2017, and to be filed pursuant to Regulation 14A within 120 days after registrant's fiscal year ended October 31, 20132016 are incorporated by reference into Part III of this Report | | III |
TABLE OF CONTENTS
Forward-Looking Statements
This report contains forward-looking statements including, without limitation, statements regarding trends, seasonality cyclicality and growth in, and drivers of, the markets we sell into, our strategic direction, our future effective tax rate and tax valuation allowance, earnings from our foreign subsidiaries, remediation activities,lease and site services income from Keysight, the impact of foreign currency movements on our performance, our hedging programs, indemnification, new product and service introductions, the ability of our products to meet market needs, adoption of our products, changes to our manufacturing processes, the use of contract manufacturers, out sourcing and third-party package delivery services, source and supply of materials used in our products, the impact of local government regulations on our ability to pay vendors or conduct operations, our liquidity position and cash availability, our ability to generate cash from operations, growth in our businesses, our investments, including in research and development, the potential impact of adopting new accounting pronouncements, our financial results, our operating margin, our sales, our purchase commitments, our capital expenditures, our contributions to our pension plans, the selection of discount rates and recognition of any gains or losses for ourother defined benefit plans, our strategic initiatives, our cost-control activities savings and headcount reduction recognized from our restructuring programs and other cost saving initiatives, uncertainties relating to Food and Drug Administration ("FDA") and other regulatory approvals, the integration of our acquisitions and other transactions, the separationimpairment of the electronic measurement business,goodwill and other intangible assets, write down of investment values or loans and convertible notes, our stock repurchase program, our declared dividends, our transition to lower-cost regions, and the existence of economic instability, that involve risks and uncertainties. Our actual results could differ materially from the results contemplated by these forward-looking statements due to various factors, including those discussed in Part I Item 1A and elsewhere in this Form 10-K.
PART I
Item 1. Business
Overview
Agilent Technologies Inc. (“we”("we", “Agilent”"Agilent" or the “company”"company"), incorporated in Delaware in May 1999, is the world's premier measurement company providing core bio-analytical and electronic measurement solutions to thea global leader in life sciences, diagnostics and genomics,applied chemical analysis, communicationsmarkets, providing application focused solutions that includes instruments, software, services and electronics industries.consumables for the entire laboratory workflow.
On September 19, 2013, Agilent announced plans to separate into two publicly traded companies, one comprisingNovember 1, 2014, we completed the distribution of 100% of the life sciences, diagnostics and chemical analysis businesses that will retainoutstanding common shares of Keysight Technologies, Inc. ("Keysight") to Agilent stockholders who received one share of Keysight common stock for every two shares of Agilent held as of the Agilent nameclose of business on the record date, October 22, 2014. The historical results of operations and the other that will be comprisedfinancial position of Keysight are included in the electronic measurement business ("EM"). The separation is expected to occur through a tax-free pro rata spin offconsolidated financial statements of the EM company to Agilent shareholders and is expected to be completed early in November 2014. We expect to incur pre-separation expenses of $100 million in fiscal 2014.are reported as discontinued operations within this Form 10-K.
In addition to the announcement to separate into two companies,For fiscal year ended October 31, 2016, we formed a new operating segment in the fourth fiscal quarter of 2013. The new life sciences and diagnostics segment was formed by the combination of the life sciences business plus the diagnostics and genomics business. Following this reorganization, Agilent hashave three business segments comprised of the life sciences and diagnosticsapplied markets business, the chemical analysisdiagnostics and genomics business and the electronic measurementAgilent CrossLab business. The historical segment financial information for the life sciences and diagnostics segment has been recast to conform to this new reporting structure in our financial statements.
Our life sciences and applied markets business provides application-focused solutions that include instruments and software that enable customers to identify, quantify and analyze the physical and biological properties of substances and products, as well as enable customers in the clinical and life sciences research areas to interrogate samples at the molecular level. Our diagnostics and genomics business focuses onis comprised of three areas of activity providing solutions that include reagents, instruments, software and consumables, which enable customers in the pharmaceutical, academicclinical and government, bio-agriculture, food safety, clinical markets, biotechnologylife sciences research areas to interrogate samples at the cellular and contract research organization industries. Our chemical analysismolecular level. The Agilent CrossLab business focuses onspans the petrochemical, environmental, forensicsentire lab with its extensive consumables and food safety industries. Our electronic measurement business addresses the communications, electronics and other industries.services portfolio, which is designed to improve customer outcomes. In addition, to our three businesses, we conduct centralized manufacturing and order fulfillment and supply chain operations for our businesses through Agilent Order Fulfillment ("AOF") as well as research through Agilent Technologies Laboratoriesthe order fulfillment and supply chain organization (“Agilent Labs”OFS”). OFS provides resources for manufacturing, engineering and strategic sourcing to our respective businesses. Each of our three businesses, AOF and Agilent Labs,together with OFS, is supported by our global infrastructure organization, which provides shared services in the areas of finance, information technology, legal, workplace services and human resources.
On June 21, 2012, we acquired Dako through the purchase of 100% of the share capital of Dako, a limited liability company incorporated under the laws of Denmark, under the share purchase agreement, dated May 16, 2012. Dako provides antibodies, reagents, scientific instruments and software primarily to customers in pathology laboratories. As a result of the acquisition, Dako has become a wholly-owned subsidiary of Agilent. The consideration paid was approximately $2,143 million, of which $1,400 million was paid directly to the seller and $743 million was paid to satisfy the outstanding debt of Dako. Agilent funded the acquisition using existing cash.
We sell our products primarily through direct sales, but we also utilize distributors, resellers, manufacturer's representatives telesales and electronic commerce. Of our total net revenue of $6.8$4.2 billion for the fiscal year ended October 31, 2013,2016, we generated 30 percent in the U.S. and 70 percent outside the U.S. As of October 31, 2013,2016, we employed approximately 20,60012,500 people
worldwide. Our primary research and development and manufacturing sites are in California, Colorado, Delaware, Massachusetts and DelawareTexas in the U.S. and in Australia, China, Denmark, Germany, India, Italy, Japan, Malaysia, Poland, Singapore and the United Kingdom.
The net revenue, income from operations and assets by business segment, as of and for the fiscal year ended October 31, 20132016 and for each of the past three years are shown in Note 21,19, "Segment Information", to our consolidated financial statements,
which we incorporate by reference herein.
Life Sciences and DiagnosticsApplied Markets Business
Our life sciences and diagnosticsapplied markets business provides application-focused solutions that include reagents, instruments software, consumables, and servicessoftware that enable customers to identify, quantify and analyze the physical and biological properties of substances and products, as well as enable customers in the clinical and life sciences research areas to interrogate samples at the molecular level. Key product categories include: liquid chromatography ("LC") systems columns and components; liquid chromatography mass spectrometry ("LCMS") systems; gas chromatography ("GC") systems and components; gas chromatography mass spectrometry ("GCMS") systems; inductively coupled plasma mass spectrometry ("ICP-MS") instruments; atomic absorption ("AA") instruments; microwave plasma-atomic emission spectrometry (“MP-AES”) instruments; inductively coupled plasma optical emission spectrometry ("ICP-OES") instruments; cell analysis plate based assays; laboratory software and informatics systems; laboratory automation and robotic systems;automation; dissolution testing; nucleic acid solutions; Nuclear Magnetic Resonance ("NMR"), Magnetic Resonance Imaging ("MRI"),vacuum pumps and X-Ray Diffraction (“XRD”) systems; services and support for the aforementioned products; immunohistochemistry (“IHC”); In Situ Hybridization (“ISH”); Hematoxylin and Eosin (“H&E”) staining; special staining, DNA mutation detection; genotyping; gene copy number determination; identification of gene rearrangements; DNA methylation profiling; gene expression profiling; next generation sequencing (“NGS”) target enrichment; and automated gel electrophoresis-based sample analysis systems. We also collaborate with a number of major pharmaceutical companies to develop new potential pharmacodiagnostics, also called companion diagnostics, with the potential of identifying patients most likely to benefit from a specific targeted therapy.measurement technologies.
We employed approximately 6,1004,300 people as of October 31, 20132016 in our life sciences and diagnosticsapplied markets business. This business generated revenue of $2.3$2.1 billion in fiscal 2013,2016, $2.0 billion in fiscal 20122015 and $1.8$2.1 billion in fiscal 2011.2014
Life Sciences and DiagnosticsApplied Markets
Our life sciences and diagnosticsapplied markets business focuses primarily on the following threefive markets:
The Pharma, Biotech,Pharmaceutical, Biotechnology, CRO & CMO Market. This market consists of “for-profit” companies who participate across the pharmaceutical value chain in the areas of therapeutic research, discovery & development, clinical trials, manufacturing and quality assurance and quality control. One sub-segment of this market is core and emerging pharmaceutical companies (“pharma”). A second sub-segment includes biotechnology companies (“biotech”), contract research organizations (“CROs”) and contract manufacturing organizations (“CMOs”). Biotech companies and, to a somewhat lesser extent, CROs and CMOs typically participate in specific points in the pharmaceutical industry value chain. Additionally, due to the relatively low drug efficacy within oncology, pharma companies are partnering with diagnostic companies to bring validated tests to the market with their new drugs.
The Academic and GovernmentLife Science Research Market. This market consists primarily of “not-for-profit” organizations and includes academic institutions, large government institutes and privately funded organizations. The academic and governmentlife science research market plays an influential role in technology adoption and therapeutic developments for pharmaceutical and molecular diagnostics companies. After decades of investment in basic biomedical research by government funding bodies, the focus has widened to include translational research - multidisciplinary scientific efforts directed at accelerating therapy development.
The Clinical MarketChemical & Energy Market.. A significant part The natural gas and petroleum refining markets use our products to measure and control the quality of their finished products and to verify the environmental safety of their operations. Petroleum refiners use our clinical diagnostic customersmeasurement solutions to analyze crude oil composition, perform raw material analysis, verify and improve refining processes and ensure the overall quality of gasoline, fuels, lubricants and other products. Our solutions are also used in pathology labs throughout the world.development, manufacturing and quality control of fine chemicals.
The Environmental & Forensics Market. Our high-quality, automated pathology tissue staining platformsinstruments, software and workflow solutions are used most heavily by the large labs located in hospitals, medical centers, and reference labs. The market is skewed towards the mature economies, with approximately 75% of the market in North America, Western Europe and Japan. The mix is changing, however, as emerging markets increase spending on human health.
The clinicalenvironmental market for genomics consistsapplications such as laboratory and field analysis of high complexity clinical labs performing patientchemical pollutants in air, water, soil and solid waste. Environmental industry customers include all levels of government, the industrial and manufacturing sectors, engineering and consulting companies, commercial testing laboratories and colleges and universities. Drug testing and forensics laboratories use our instruments, software and workflow solutions for applications such as analyzing evidence associated with crime, screening athletes for performance enhancing drugs, analyzing samples for recreational drugs, or detecting and identifying biological and chemical warfare agents. This instrumentation is used in either static or mobile laboratories. Customers include local, state, federal, and international law enforcement agencies and health laboratories.
The Food Market. Our instruments, software, and workflow solutions are used throughout the food production chain, including “for-profit” reference laboratories, hospital labs,incoming inspection, new product development, quality control and molecular diagnostic companies. While these labs primarily purchaseassurance, and packaging. For example, our mass spectrometer portfolio is used to analyze contaminants and residual pesticides in vitro diagnostics (“IVD”) labeled testing kits, they often developfood. There is also a significant food safety market involved in analyzing food for pathogen contamination, accurate verification of species type and validate their own molecular based tests. Analyte Specific Reagents (“ASRs”) are often used by these labs.evidence of genetically modified content.
Life Sciences and Diagnostics MeasurementApplied Markets Products and Applications
Our products fall into elevennine main areas of work: liquid chromatography, gas chromatography, mass spectrometry, spectroscopy, software and informatics, lab automation and robotics, automated electrophoresis NMR and MRI systems, life sciences consumablesmicrofluidics, vacuum technology and services, pathology products, specific proteins and flow reagents, target enrichment, cytogenetic research solutions and microarrays. cell analysis.
Our key product
segments include: and applications include the following technologies:
Liquid Chromatography Products
A liquid chromatograph ("LC") or a high performance liquid chromatograph (“HPLC”) is used to separate molecules of a liquid mixture to determine the quantity and identity of the molecules present. The Agilent LC portfolio is modular in construction and can be configured as analytical and preparative systems. These systems can be stepwise upgraded to highly sophisticated, automated workflow solutions such as method development, multi‑method/walk-up, high-capacity/high-throughput or multi‑dimensional LC and can be extended to application‑based analyzers e.g. for bio-molecular separations, chiral analysis or size exclusion chromatography. As a leader in liquid chromatography, we continue to expand our application space with new HPLC columns, new services and diagnostics offerings and ongoing instrument and software product enhancements.
Gas Chromatography
Agilent is the world's leading provider of gas chromatographs, both laboratory and portable models. GC's are used to separate any gas, liquid or solid that can be vaporized and then detect the molecules present to determine their identity and quantity. Agilent provides custom or standard analyzers configured for specific chemical analysis applications, such as detailed speciation of a complex hydrocarbon stream, calculation of gas calorific values in the field, or analysis of a new bio-fuel formulation. We also offer related software, accessories and consumable products for these and other similar instruments.
Mass Spectrometry Products
A mass spectrometer (“MS”) identifies and quantifies chemicals based on a chemical's molecular mass and characteristic patterns of fragment ion masses that result when a molecule is broken apart. Liquid chromatography is commonly used to separate compounds and introduce them to the MS system. The combined use of LC and MS is frequently used both to identify and quantify chemical compounds. Mass spectrometry is an important tool in analyzing small molecules and can also be used to characterize and quantify proteins and other biological entities. Agilent's LCMS portfolio includes instruments built around four main analyzer types - single quadrupole, triple quadrupole, time-of-flight (“TOF”) and quadrupole time-of-flight (“QTOF”). We significantly expanded our mass spectrometry portfolio in recent years with a focus on improving performance, sensitivity, and ease of use.
Spectroscopy
Spectroscopy is a technique for analyzing the individual chemical components of substances based on the absorption or emission of electromagnetic radiation of specific wavelengths of light. Our spectroscopy instruments include AA spectrometers, microwave plasma-atomic emission spectrometers (“MP-AES”), ICP-OES, ICP-MS, fluorescence spectrophotometers, ultraviolet- visible ("UV-Vis") spectrophotometers, Fourier Transform infrared ("FT-IR") spectrophotometers, near-infrared ("NIR") spectrophotometers, Raman spectrometers and sample automation products. We also offer related software, accessories and consumable products for these and other similar instruments.
Software and Informatics Products
We provide software for instrument control, data acquisition, data analysis, laboratory content and business process management, and informatics. Our software facilitates the regulatory‑compliant use of instruments in pharmaceutical quality assurance/quality control environments. With OpenLab Laboratory Software Suite, Agilent has a scalable, open software platform that enables customers to capture, analyze, and share scientific data throughout the lab and across the enterprise.
Lab Automation and Robotics
We offer a comprehensive suite of workflow solutions to our life science customers with the addition of automated liquid handling and robotics that range from standalone instrumentation to bench-top automation solutions to large, multi‑armed robotic systems.solutions. These solutions strengthen our offering of automated sample‑sample preparation solutions across a broad range of applications. In fiscal 2012 we acquired AssayMAP technology, which in combination with Agilent's Bravo liquid handling platform enables highly parallel automated microchromatography for protein purification and characterization. In 2011, Agilent acquired a technology that provides high throughput sample introduction devices (Rapid Fire) for LCMS to expand capability to run ultra-short analysis in an automated manner.
Automated Electrophoresis and Microfluidics
Automated electrophoresis is a separation technique for bio molecules such as proteins, peptides and nucleic acids (RNA and DNA) and is used to determine the identity of a molecule by either size or charge. It is widely used as a QC tool to check sample integrity prior to subsequent analysis. Prominent examples are nucleic acid preparation products in front of polymerase chain reaction, NGS and microarrays.
NMR, MRI and XRD systemsVacuum Technology
NMR, spectrometers, MRI systems and XRD systems
Our vacuum technologies products are used to create, control, measure and test vacuum environments in life science, industrial and scientific applications where ultra-clean, high-vacuum environments are needed. Vacuum technologies' customers are typically OEMs that manufacture equipment for these applications. Products include a varietywide range of industrieshigh and ultra-high vacuum pumps (diffusion, turbomolecular and ion getter), intermediate vacuum pumps (rotary vane, sorption and dry scroll), vacuum instrumentation (vacuum control instruments, sensor gauges and meters) and vacuum components (valves, flanges and other mechanical hardware). These products also include helium mass spectrometry and helium-sensing leak detection instruments used to identify and measure leaks in hermetic or vacuum environments. In addition to product sales, we also offer a wide range of services including academican exchange and not-for-profit research, life sciences (pharmarebuild program, assistance with the design and biotech),integration of vacuum systems, applications support and industrial companies. All of these technologies are utilized fortraining in basic and appliedadvanced vacuum technologies.
Cell Analysis
Our cell analysis tools are used to study cell signaling pathways and function through metabolic profile analysis for cells. The multi-well plate assays and readers are used to understand the impact of stimuli on cells as part of the drug development process. Cell analysis customers are typically academia and pharma companies who need to assess the metabolic state of the cell and use mass spectromety to study the related metabolites as part of research and NMR is also used in processdrug development and manufacturing QA/QC. In the fourth quarter of 2013, we announced the termination of our involvement in MRI systems.processes.
Life Sciences Consumables and ServicesApplied Markets Customers
We had approximately 23,000 customers for our life sciences and applied markets business in fiscal 2016. No single customer represented a material amount of the net revenue of the life sciences and applied markets business. A significant number of our life sciences and applied markets customers are also offercustomers of our Agilent CrossLab business.
The life sciences and applied markets business is susceptible to seasonality in its orders and revenues primarily based on U.S. and foreign government budgets and large pharmaceutical company budgets. Historically, the result is that our first and fourth fiscal quarters tend to deliver the strongest profits for this group. However, general economic trends, new product introductions and competition might overshadow this trend in any given year.
Life Sciences and Applied Markets Sales, Marketing and Support
The life science and applied markets channels focus on the therapeutics and human disease research customer base (pharma, biotech, CRO, CMO and generics), clinical customer base (high complexity clinical testing labs) and on emerging life sciences opportunities in life science research institutes. We deploy a broad rangemulti-channel approach, marketing products to our customers through direct sales, electronic commerce, resellers, manufacturers' representatives and distributors. We primarily use direct sales to market our solutions to our pharmaceutical, biopharmaceutical and clinical accounts. Sales agents supplement direct sales by providing broader geographic coverage and coverage of smaller accounts. Our active reseller program augments our ability to provide more complete solutions to our customers. We sell our consumable products which supportthrough distributors, electronic commerce and direct sales.
Our products typically come with standard warranties, and extended warranties are available for additional cost.
Life Sciences and Applied Markets Manufacturing
Our manufacturing supports our LCdiverse product range and MS technology platforms. These consumablecustomer‑centric focus. We assemble highly configurable products include sample preparation products; self-manufactured LC columns, instrument replacement parts,to individual customer orders and consumable suppliesmake standard products to meet our customers' analysis needs. Allstock. We employ advanced manufacturing techniques and supply chain management systems to reduce costs and manufacturing cycle times. Our manufacturing process then converts these designs into custom products for shipment to customers. We selectively use third parties to provide some supply chain processes for manufacturing, warehousing and logistics. We have manufacturing facilities in California, Delaware and Massachusetts in the U.S. Outside of our products are designed to Agilent's specifications to improvethe U.S., we have manufacturing facilities in Germany, Malaysia and maximize the performance of our instruments.Singapore. We have FDA registered sites in California, Germany and Singapore. We utilize just-in-time manufacturing.
Life Sciences and Applied Markets Competition
The markets for analytical instruments in which we compete are characterized by evolving industry standards and intense competition. Our principal competitors in the life sciences and applied markets arena include: Danaher Corporation, PerkinElmer Inc., Shimadzu Corporation, Thermo Fisher Scientific Inc. and Waters Corporation. Agilent competes on the basis of product performance, reliability, support quality, applications expertise, global channel coverage and price.
Diagnostics and Genomics Business
Our diagnostics and genomics business includes genomics, nucleic acid contract manufacturing and the pathology, companion diagnostics and reagent partnership businesses.
Our diagnostics and genomics business is comprised of five areas of activity providing solutions that include reagents, instruments, software and consumables, which enable customers in the clinical and life sciences research areas to interrogate samples at the cellular and molecular level. First, our genomics business includes arrays for DNA mutation detection, genotyping, gene copy number determination, identification of gene rearrangements, DNA methylation profiling, gene expression profiling, as well as next generation sequencing ("NGS") target enrichment and genetic data management and interpretation support software. Second, our nucleic acid solutions business provides equipment and expertise focused on production of synthesized oligonucleotides under pharmaceutical good manufacturing practices ("GMP") conditions for use as active pharmaceutical ingredients ("API") in an emerging class of drugs that utilize nucleic acid molecules for disease therapy. Next, our pathology solutions business is focused on product offerings to cancer diagnostics and anatomic pathology workflows. The broad portfolio of offerings includes immunohistochemistry (“IHC”), in situ hybridization (“ISH”), hematoxylin and eosin (“H&E”) staining and special staining. We also collaborate with a number of major pharmaceutical companies to develop new potential pharmacodiagnostics, also known as companion diagnostics, which may be used to identify patients most likely to benefit from a specific targeted therapy. Finally, the reagent partnership business is a provider of reagents used for turbidimetry and flow cytometry.
We offer a wide rangeemployed approximately 1,900 people as of startup, operational, educationalOctober 31, 2016 in our diagnostics and compliance support services for our measurementgenomics business. This business generated revenue of $0.7 billion in fiscal 2016, $0.7 billion in fiscal 2015, and data handling systems. Our support services include maintenance, troubleshooting, repair$0.7 billion in fiscal 2014.
Diagnostics and training for allGenomics Market
Within diagnostics and genomics business, we focus primarily on the following market:
The Diagnostics and Clinical Market. A significant part of our chemicalclinical diagnostic customers are in pathology labs throughout the world. Our high-quality, automated pathology tissue staining platforms and bioinstrumentation analysis hardwaresolutions are used most heavily by the large labs located in hospitals, medical centers, and software products. Special service bundles have also been designed to meetreference labs. The market is skewed towards mature economies, with most of the market in North America, Western Europe and Japan. The mix is changing, however, as emerging markets increase spending on human health.
The clinical market for genomics consists of high complexity clinical labs performing patient testing, including “for-profit” reference laboratories, hospital labs, and molecular diagnostic companies. While these labs primarily purchase in vitro diagnostics (“IVD”) labeled testing kits, they often develop and validate their own molecular based tests. Analyte Specific Reagents (“ASRs”) are often used by these labs.
Diagnostics and Genomics Products
Our products fall into six main areas of work: pathology products, specific application needs of various industries.proteins and flow reagents, target enrichment, cytogenetic research solutions and microarrays, PCR and qPCR instrumentation and molecular biology reagents and nucleic acid solutions.
Pathology Products
This area consists of routine clinical solutions for tissue based cancer diagnostics with solutions that comprise antibodies, reagents, instruments and software targeting both primary and advanced cancer diagnostics. Our CoverStainer and Artisan based product families target primary cancer diagnostics through Hematoxylin and Eosin staining as well as Special Stains for additional insights and detection of potentially carcinogenic tissue. In the fourth quarter of 2013, we launched our new combined IHC/ISH platform, Dako Omnis. The Dako Omnis and Autostainer based IHC solution and Instant Quality Fluorescence In Situ Hybridization
("IQFISH") technologies provide advanced tumor typing through investigation of protein and gene expression. These products also include companion diagnostic tests that are used to help identify patients most likely to benefit from a specific targeted therapy.
Specific Proteins and Flow Reagents
Our reagent OEM business is a provider of clinical diagnostic products within the areas of specific proteins for turbidimetry and reagents for flow cytometry. These are sold OEM as customized reagent solutions supplied to top IVD companies or through retail partners.
Companion Diagnostics
In our Companion Diagnostics business, we partner with a number of major pharmaceutical companies to develop new potential pharmacodiagnostics, which may be used to identify patients most likely to benefit from a specific targeted therapy.
Target Enrichment
Agilent continues to be a strong player in the next generation sequencing market. We provide a target enrichment portfolio composed of two main platforms, SureSelect and HaloPlex, both enabling customers to select specific target regions of the genome for sequencing. Customers can customize our products for their regions of interest using the SureDesign software, or they can choose from a wide range of catalog products, including gene panels for specific applications and Exome designs, which allow analysis of the entire coding sequences of the genome. After preparing samples with SureSelect and HaloPlex, products can be sequenced in the main next generation sequencing platforms available in the market. The technologies provide an easy sample prep workflow that can be automated with the Agilent Bravo platform for scalability. HaloPlex provides less-than-24-hours fast workflow, which makes it suitable for labs that require fast turnaround time from sample to results. These products are used for mutation detection and genotyping. Results can be easily analyzed using Agilent software solutions GeneSpring or SureCall.
Cytogenetic Research Solutions and Microarrays
Agilent is a leading provider of microarrays for Comparative Genomic Hybridization (“CGH”), mostly used by customers in cytogenetic laboratories. The arrays allow customers to detect genome-wide copy number alterations, with high levels of resolution (from entire chromosomal copy number changes to specific microdeletions or duplications). The arrays are offered in many formats allowing the customers to choose from different levels of resolution and number of samples per arrays. Arrays can also be customized using the SureDesign software. In addition to the microarrays, Agilent's solution includes reagents for sample processing, hardware for reading the microarrays, and software to help users view the data in a meaningful way. In addition to the CGH portfolio, the cytogenetics solution comprises a line of oligonucleotide probes for Fluorescent In Situ Hybridization ('FISH'("FISH") called SureFISH. Over 400 probes are available in our catalog, covering most relevant regions in the genome. Cytogenetic labs can use SureFISH probes to detect specific translocations or copy number changes in samples. Additionally, Agilent provides a wide range of microarrays to the research market for different types of applications: gene expression, microRNA, methylation, splice variants, and chromatin immunoprecipitation applications. Arrays are offered as catalog designs or customizable designs, with no minimum order size and short delivery time, which differentiates us from other vendors and enables researchers the maximum flexibility in their studies. Our end-to-end solution includes reagents for sample preparation and microarray processing; hardware for sample QC and high-throughput microarray scanning; microarrays on industry-standard 1” × 3” glass slides for key applications; custom microarray design services; and GeneSpring and CytoGenomics software products for data analysis.
PCR &and qPCR Instrumentation and Molecular Biology Reagents
Polymerase Chain Reaction (“PCR”) is a standard laboratory method used to amplify the amount of genetic material of a given sample to enable further interrogation. Quantitative PCR (“qPCR”) or real time PCR is also a standard method used in genomic research facilities to measure the amount of a specific nucleic acid sequence within a sample. There are several applications for qPCR, among the most common are identifying the expression level of a specific gene, or calculating the amount of a specific pathogen present in a sample. Agilent offers a complete portfolio of PCR & qPCR instruments, as well as specialty enzymes for
amplifying difficult sample types. In addition to PCR and qPCR enzymes, Agilent offers a wide range of molecular biology reagents including tools for cloning and mutagenesis applications.
Life SciencesNucleic Acid Solutions
Our Nucleic Acid Solutions division ("NASD") is a contract manufacturing and development services business with equipment and expertise focused on mid to large scale production of synthesized oligonucleotide APIs (Active Pharmaceutical Ingredients) under pharmaceutical GMP conditions for an emerging class of drugs that utilize oligonucleotide molecules for disease
therapy. State of the art for these drugs has advanced from single strand DNA molecules to complex, highly modified molecules including antisense, aptamers, double-stranded RNA, and RNA mixtures. These advancements in the technology have greatly improved the efficacy of delivery and stability of the oligos in-vivo. NASD offers industry leading experience to efficiently advance our customer’s oligo drug candidates from clinical trials to commercial launch with a common goal of patient health and safety.
Diagnostics and Genomics Customers
We had over 46,000approximately 14,000 customers for our life sciencesdiagnostics and diagnosticsgenomics business in 2013.fiscal 2016. No single customer represented a material amount of the net revenue of the life sciencesdiagnostics and diagnostics business. A significant number of our life sciences and diagnostics customers are also customers of our chemical analysisgenomics business.
The life sciences
Diagnostics and diagnostics business is susceptible to seasonality in its orders and revenues primarily based on U.S. and foreign government budgets and large pharmaceutical company budgets. In general, the result is that our third and fourth fiscal quarters tend to deliver the strongest profits for this group. The diagnostics business is generally a fairly stable business impacted primarily by local holidays. However, general economic trends, new product introductions and competition might overshadow this trend in any given year.
Life Sciences and DiagnosticsGenomics Sales, Marketing and Support
The life sciencediagnostics and diagnosticsgenomics channels focus on the therapeutics and human disease research customer base (pharma, biotech, CRO, CMO and generics), clinical customer base (pathology labs and high complexity clinical testing labs) and on emerging life sciences opportunities in academic and government life science research institutes. We deploy a multi-channel approach, marketing products to our customers through direct sales, electronic commerce, resellers, manufacturers' representatives and distributors. We primarily use direct sales to market our solutions to our pharmaceutical, biopharmaceutical and clinical accounts. Sales agents supplement direct sales by providing broader geographic coverage and coverage of smaller accounts. Our active reseller program augments our ability to provide more complete solutions to our customers. We sell our consumable products through distributors, telesales, electronic commerce and direct sales. We utilize telesales for more mature product lines, as well as for reorders of reagent products.
We deliver our support services to customers in a variety of ways, including on-site assistance with repair or exchange of returned products, telephone supportDiagnostics and self-diagnostic services provided over the Internet. We also offer special industry-focused service bundles that are designed to meet the specific needs of hydrocarbon processing, environmental, pharmaceutical and biopharmaceutical customers to keep instruments fully operational and compliant with the respective industry requirements. Our products typically come with standard warranties, and extended warranties are available for additional cost. Our complete pathology solutions are often sold with both application and technical service support.Genomics Manufacturing
Life Sciences and Diagnostics Manufacturing
Our manufacturing supports our diverse product range and customer‑centriccustomer-centric focus. We assemble highly configurable products to individual customer orders and make standard products to stock. We employ advanced manufacturing techniques and supply chain management systems to reduce costs and manufacturing cycle times. Our manufacturing process then converts these designs into custom products for shipment to customers. We selectively use third parties to provide some supply chain processes for manufacturing, warehousing and logistics. We have manufacturing facilities in California, Colorado and North CarolinaTexas in the U.S. Outside of the U.S., we have manufacturing facilities in Germany,Denmark, Malaysia Poland, Singapore and the U.K.Germany. Our FDA registered sites include California, Colorado, Texas Denmark and California.Denmark. We utilize just-in-time manufacturing.manufacturing and so typically do not maintain a high level of inventory.
Life Sciences
Diagnostics and DiagnosticsGenomics Competition
The markets for analytical instruments, diagnostics and genomics analytical products in which we compete are characterized by evolving industry standards and intense competition. Our principal competitors in the life sciencesdiagnostics and diagnosticsgenomics arena include: Bruker Corp.Roche Ventana Medical Systems, Inc., a member of the Roche Group, Leica Biosystems, Inc., a division of Danaher Corporation, Thermo Fisher ScientificAbbott Laboratories, Ilumina, Inc., Waters Corp, and Affymetrix, Inc., Illumina, Inc., Life Technologies Corp, Abbott Laboratories, Sakura and Roche. Agilent competes on the basis of product performance, reliability, support quality, applications expertise, whole solution offering, global channel coverage and price.
Life SciencesDiagnostics and DiagnosticsGenomics Government Regulation
Some of the products the life sciencesdiagnostics and diagnostics groupgenomics business sells are subject to regulatory approval by the FDA and other regulatory bodies throughout the world. These regulations govern a wide variety of product related activities, from quality management, design and development to labeling, manufacturing, promotion, sales and distribution. We continually invest in our manufacturing infrastructure to gain and maintain certifications necessary for the level of clearance. During 2014 and 2015, we have made investments to address the issues identified in the FDA warning letter, now lifted, received by our Glostrup, Denmark facility.
Agilent CrossLab Business
The Agilent CrossLab business spans the entire lab with its extensive consumables and services portfolio, which is designed to improve customer outcomes. The majority of the portfolio is vendor neutral, meaning Agilent can serve and supply customers regardless of their instrument purchase choices. Solutions range from chemistries and supplies to services and software helping to connect the entire lab. Key product categories in consumables include GC and LC columns, sample preparation products, custom chemistries, and a large selection of laboratory instrument supplies. Services include startup, operational, training and compliance support, as well as asset management and consultative services that help increase customer productivity. Custom service and consumable bundles are tailored to meet the specific application needs of various industries and to keep instruments fully operational and compliant with the respective industry requirements.
Chemical Analysis Business
Our chemical analysisAgilent CrossLab business provides application-focused solutions that include instruments, software, consumables, and services that enable customers to identify, quantify and analyze the physical and biological properties of substances and products. Key product categories in chemical analysis include: gas chromatography ("GC") systems, columns and components; gas chromatography mass spectrometry ("GC-MS") systems; inductively coupled plasma mass spectrometry ("ICP-MS") instruments; atomic absorption ("AA") instruments; microwave plasma-atomic emission spectrometry (“MP-AES”) instruments; inductively coupled plasma optical emission spectrometry ("ICP-OES") instruments; software and data systems; vacuum pumps and measurement technologies; services and support for our products.
We employed approximately 3,800 people as of October 31, 2013 in our chemical analysis business. This2016. Our Agilent CrossLab business generated revenue of $1.6$1.4 billion in revenue in fiscal 2013, $1.62016, $1.3 billion in revenue in fiscal 2012,2015 and $1.5$1.3 billion in revenue in fiscal 2011.2014.
Chemical AnalysisAgilent CrossLab Markets
Within chemical analysis, weThe Pharmaceutical, Biotechnology, CRO & CMO Market. Our services and consumable products support customers in this market that consists of “for-profit” companies who participate across the pharmaceutical value chain in the areas of therapeutic research, discovery and development, clinical trials, manufacturing and quality assurance and quality control. One sub-segment of this market is core and emerging pharmaceutical companies (“pharma”). A second sub-segment includes biotechnology companies (“biotech”), contract research organizations (“CROs”) and contract manufacturing organizations (“CMOs”). Biotech companies and, to a somewhat lesser extent, CROs and CMOs typically participate in specific points in the pharmaceutical industry value chain. Additionally, due to the relatively low drug efficacy within oncology, pharma companies are partnering with diagnostic companies to bring validated tests to the market with their new drugs.
The Life Science Research Market. Our services and consumable products support customers in this market that consists primarily of “not-for-profit” organizations and includes academic institutions, large government institutes and privately funded organizations. The life science research market plays an influential role in technology adoption and therapeutic developments for pharmaceutical and molecular diagnostics companies. After decades of investment in basic biomedical research by government funding bodies, the focus primarily on the following markets:
has widened to include translational research - multidisciplinary scientific efforts directed at accelerating therapy development.
The Chemical & Energy Market. The natural gas and petroleum refining markets use our services and consumable products to measuresupport their quality control and control the quality of their finished products and to verify the environmental safety of their operations. Petroleum refiners use our measurement solutions to analyze crude oil composition, perform raw material analysis, verify and improve refining processes and ensure the overall quality of gasoline, fuels, lubricants and other products. Our solutions are also used in the development, manufacturing and quality control of fine chemicals.reviews.
The Environmental & Forensics Market. Our instruments, softwareservices and workflow solutions are used byconsumable products support the environmental market for applications such asindustry customers that perform laboratory and field analysis of chemical pollutants in air, water, soil and solid waste. Environmental industry customers include all levels of government, the industrial and manufacturing sectors, engineering and consulting companies, commercial testing laboratories and colleges and universities. DrugOur services and consumable products also support drug testing and forensics laboratories use our instruments, software and workflow solutions for applications such asthat are involved with analyzing evidence associated with crime, screening athletes for performance enhancing drugs, analyzing samples for recreational drugs, or detecting and identifying biological and chemical warfare agents. This instrumentation is used in either static or mobile laboratories. Customers include local, state, federal, and international law enforcement agencies and healthcommercial testing laboratories.
The Food Market. Our instruments, software,services and workflow solutions are used throughoutconsumable products support the food production chain, including incoming inspection, new product development, quality control and assurance, and packaging. For example, our mass spectrometer portfolio, including triple quad liquid chromatography mass spectrometers, is used to analyze contaminants and residual pesticides in food. There is also a significant food safety market involved in analyzing food for pathogen contamination, accurate verification of species type and evidence of genetically modified content.
Chemical Analysis Products
A key factor in all of our chemical analysis markets is the need for new products that increase customer productivityThe Diagnostics and provide high quality data that enable decision-making by our customers.Clinical Market. Our key product segments include:
Gas Chromatography Products
Agilent is the world's leading provider of gas chromatographs, both laboratory and portable models. A gas chromatograph ("GC") is used to separate any gas, liquid or solid that can be vaporized and then detect the molecules present to determine their identity and quantity. Agilent provides custom or standard analyzers configured for specific chemical analysis applications, such as detailed speciation of a complex hydrocarbon stream, calculation of gas calorific values in the field, or analysis of a new bio-fuel formulation. We also offer related software, accessoriesservices and consumable products for thesesupport clinical diagnostic customers in pathology labs throughout the world. The market is skewed towards the mature economies, with most of the market in North America, Western Europe and other similar instruments.Japan. The mix is changing, however, as emerging markets increase spending on human health.
Agilent CrossLab Applications
Mass Spectrometry Products
Mass spectrometry ("MS") is a technique for analyzing the individual chemical components of substances by ionizing themChemistries and determining their mass-to-charge ratios. Our MS products incorporate various technologies for measuring mass, including single-quadrupole, triple-quadrupole, quadrupole time-of-flight and ion trap mass spectrometers. We combine our mass spectrometers with other instruments to create high-performance instruments such as gas chromatograph mass spectrometers ("GC/MS"), and inductively coupled plasma mass spectrometers ("ICP-MS"). We also offer related software, accessories and consumable products for these and other similar instruments.
Spectroscopy Products
Spectroscopy is a technique for analyzing the individual chemical components of substances based on the absorption or emission of electromagnetic radiation of specific wavelengths of light. Our spectroscopy instruments include atomic absorption ("AA") spectrometers, microwave plasma-atomic emission spectrometers (“MP-AES”), inductively coupled plasma-optical emissions spectrometers ("ICP-OES"), inductively coupled plasma-mass spectrometers ("ICP-MS"), fluorescence spectrophotometers, ultraviolet- visible ("UV-Vis") spectrophotometers, Fourier Transform infrared ("FT-IR") spectrophotometers, near-infrared ("NIR") spectrophotometers, Raman spectrometers and sample automation products. We also offer related software, accessories and consumable products for these and other similar instruments.
Vacuum Technology Products
Our vacuum technologies products are used to create, control, measure and test vacuum environments in life science, industrial and scientific applications where ultra-clean, high-vacuum environments are needed. Vacuum technologies' customers are typically OEMs that manufacture equipment for these applications. Products include a wide range of high and ultra-high vacuum pumps (diffusion, turbomolecular and ion getter), intermediate vacuum pumps (rotary vane, sorption and dry scroll), vacuum instrumentation (vacuum control instruments, sensor gauges and meters) and vacuum components (valves, flanges and other mechanical hardware). These products also include helium mass spectrometry and helium-sensing leak detection instruments used to identify and measure leaks in hermetic or vacuum environments. In addition to product sales, we also offer a wide range of services including an exchange and rebuild program, assistance with the design and integration of vacuum systems, applications support and training in basic and advanced vacuum technologies.
Consumables and ServicesSupplies
We offer a broad range of consumable products, which support our technology platforms, including sample preparation consumables such as solid phase extraction ("SPE") and filtration products, self-manufactured GC and LC columns, chemical standards, and instrument replacement parts. Consumable products also include scientific instrument parts and supplies such as filters and fittings for GC systems; xenon lamps and cuvettes for UV-Vis-NIR, fluorescence, FT-IR and Raman spectroscopy instruments; and graphite furnace tubes, hollow cathode lamps and specialized sample introduction glassware for our AA, ICP-OES and ICP-MS products.
Services and Support
We offer a wide range of startup, operational, educational and compliance support services for our measurement and data handling systems. Our support services include maintenance, troubleshooting, repair and training for all of our chemical and bioinstrumentation analysisbioanalytical instrumentation hardware and software products. Special service bundles have also been designed to meet the specific application needs of various industries. As customers continue to outsource laboratory operations and consolidate suppliers, our
Chemical Analysisenterprise services consist of a broad portfolio of integrated laboratory management services including instrument services, lab supply management, asset management, procurement, informatics and scientific services.
Remarketed Instruments
We refurbish and resell certified pre-owned instruments to value oriented customers who demand Agilent quality and performance at a budget conscious price.
Agilent CrossLab Customers
We had approximately 37,00043,000 Agilent CrossLab customers for our chemical analysis business in 2013. Nofiscal 2016 and no single customer represented a material amount of the net revenue of the chemical analysisAgilent CrossLab business. A significant number of our chemical analysisAgilent CrossLab customers are also customers of our life sciences and diagnosticsapplied markets business.
The chemical analysisservice and consumables business is mostly recurring in nature, and is not as susceptible to market seasonality and industry cycles in its orders and revenues primarily based on U.S. government and large company budgets.comparison to our instrument businesses. The result is thatvendor neutral portion of the portfolio allows the business to perform relatively independent from our fourth fiscal quarter tends to deliver the strongest profits for thisinstrument business. However, general economic trends, new product introductions and competition might overshadow this trend in any given year.
Chemical AnalysisAgilent CrossLab Sales, Marketing and Support
Our salesWe deploy a multi-channel approach, marketing products and support delivery channels are aligned by key markets. We market productsservices to our customers through direct sales, electronic commerce, resellers, manufacturers' representatives and distributors. Additionally, we are optimizing our worldwide distribution capabilities to address high-growth opportunities such as the environmental and food safety markets in the Asia-Pacific region.
We primarily use direct sales to market our solutions to our large- and medium-sized chemical customers and environmentallarge accounts. Sales agents supplement direct sales by providing broader geographic coverage and coverage of smaller accounts. Our active reseller program augments our ability to provide more complete solutions to our customers. We sellutilize telesales to enhance the transactional sales model of our consumable products through distributors, telesales, electronic commerceproducts. All channels are supported by technical product and direct sales.application specialists to meet our customer’s specific requirements.
We deliver our support services to customers in a variety of ways, including on-site assistance with repair or exchange of returned products, telephone support and self-diagnostic services provided over the Internet. We also offer special industry-focused service bundles that are designed to meet the specific needs including those forof hydrocarbon processing, environmental, pharmaceutical and environmentalbiopharmaceutical customers to keep instruments fully operational and compliant with the respective industry requirements. Our products typically come with standard warranties, and extended warranties are available for additional cost.
Chemical AnalysisAgilent CrossLab Manufacturing
Our primary manufacturing supports our diverse product range and customer-centric focus. We assemble highly configurable products to individual customer orders and make standard products to stock. We employ advanced manufacturing techniques and supply chain management systems to reduce costs and manufacturing cycle times. We selectively use third parties to provide some supply chain processessites for manufacturing, warehousing and logistics. We have manufacturing facilitiesthe consumables business are in California Delaware, and ConnecticutDelaware in the U.S. Outside, and outside of the U.S., we have manufacturing facilities in Australia, Canada, China, Italy, Malaysia,the Netherlands Japan, and the United Kingdom. We utilize just-in-time manufacturing and so typically do not maintain a high level of inventory.Our direct service delivery organization is regionally based operating in 30 countries.
Chemical AnalysisAgilent CrossLab Competition
The markets for analytical instruments in which we compete are characterized by evolving industry standards and intense competition. Our principal competitors in the chemical analysisservices and consumable products arena include: Brukerinclude many of our competitors from the instrument business, such as: Danaher Corporation, PerkinElmer Inc., Shimadzu Corporation, and Thermo Fisher Scientific Inc. and Waters Corporation, as well as numerous niche consumables and service providers. Agilent competes on the basis of product performance, reliability, support quality, applications expertise, global channel coverage and price.
Electronic Measurement Business
Our electronic measurement business provides electronic measurement instruments and systems, software design tools and related services that are used in the design, development, manufacture, installation, deployment and operation of electronics equipment, and microscopy products. Related services include start-up assistance, instrument productivity and application services and instrument calibration and repair. We also offer customization, consulting and optimization services throughout the customer's product lifecycle.
Our electronic measurement business employed approximately 8,300 people as of October 31, 2013. Our electronic measurement business generated $2.9 billion in revenue in fiscal 2013 and $3.3 billion in revenue in fiscal 2012 and 2011.
Electronic Measurement Markets
Our electronic measurement products serve the following markets:
The Communications Test Market
We market our electronic measurement products and services to network equipment manufacturers ("NEMs"), wireless device manufacturers, and communications service providers, including the component manufacturers within the supply chain for these customers.
NEMs manufacture and sell products to facilitate the transmission of voice, data and video traffic. The NEMs' customers are communications service providers that deploy and operate the networks and services as well as distribute end-user subscriber devices, including wireless personal communication devices and set-top boxes. To meet their customers' demands, NEMs require test and measurement instruments, systems and solutions for the development, production and installation of each network technology.
Wireless device manufacturers require test and measurement products for the design, development, manufacture and repair of mobile devices. These mobile devices are used for voice, data and video delivery to individuals who connect wirelessly to the service provider's network. The device manufacturers' primary customers are large and small service providers. Wireless device manufacturers require test and measurement products that enable technology development in conformance with the latest communications standards.
Communications service providers require reliable network equipment that enables new service offerings and allows their networks to operate at ever-increasing capacities. To achieve this, communications service providers require a range of sophisticated
test instruments and systems to monitor and evaluate network performance and to identify any sources of communications failure throughout the wireless and fiber optic networks.
Component manufacturers design, develop and manufacture electronic components and modules used in network equipment and wireless devices. The component manufacturers require test and measurement products to verify that the performance of their components and modules meet the specifications of their NEM and device customers.
The communications test market accounted for approximately 34 percent of revenue from our electronic measurement business in 2013.
The General Purpose Test Market
We market our general purpose test products and services to the electronics industry and other industries with significant electronic content such as the aerospace and defense, computer and semiconductor industries. These electronics and electronics-dependent industries design, develop and manufacture a wide range of products, including those produced in high volumes, such as computers, computer peripherals, electronic components, consumer electronics, enterprise servers, storage networks and automotive electronics. The components, printed circuit assemblies and functional devices for these products may be designed, developed and manufactured by electronic components companies, by original equipment manufacturers or by contract manufacturers.
For the development and timely commercialization of new technologies, manufacturers require state-of-the-art test instruments, systems and design software in order to design products for efficient and cost-effective manufacturing and to validate product performance in a variety of configurations and environments.
Customers use our general purpose test solutions in developing and manufacturing a wide variety of electronic components and systems. These customers' test requirements include testing the electrical parameters of digital, radio frequency, and microwave frequency components and assemblies; testing multiple parameters of the printed circuit boards used in almost every electronic device; testing of the final product; and testing of systems containing multiple electronic instruments. For semiconductor and board test applications, customers use our solutions in the design, development, manufacture, installation, deployment, and operation of semiconductor and printed circuit assembly fabrication.
We address the biology, life sciences and material science markets by providing solutions such as the atomic force microscope, nano indenters and scanning electron microscope. For nanotechnology applications, customers use our products to study biological samples at the cellular and molecular level including imaging of DNA and proteins, and to study and research polymers, electrochemistry, and thin films.
The general purpose test market accounted for approximately 66 percent of revenue from our electronic measurement business in 2013.
Electronic Measurement Products
We divide our electronic measurement products into communications test products and general purpose test products.
Communications Test Products
We sell products and services applicable to a wide range of communications networks and systems including wireless communications and microwave networks, voice, broadband, data, and fiber optic networks. Test products include electronic design automation ("EDA") software, vector and signal analyzers, signal generators, vector network analyzers, one box testers, oscilloscopes, logic and protocol analyzers, and bit-error ratio testers.
Our wireless communications and microwave network products include radio frequency and microwave test instruments and EDA software tools. These products are required for the design and production of wireless network products, communications links, cellular handsets and base stations. We provide handheld instruments for the installation and maintenance of wireless networks. Our high-frequency EDA software tools and instruments are used by radio frequency integrated circuit design engineers to model, simulate and analyze communications product designs at the circuit and system levels. Our customers are also applying this technology more frequently to model signal integrity problems in digital design applications as digital speeds continue to increase.
Our suite of fiber optic test products measure and analyze a wide variety of critical optical and electrical parameters in fiber
optic networks and their components. Components which can be tested with Agilent solutions include source lasers, optical amplifiers, filters and other passive components. Test products include optical modulation analyzers, optical component analyzers, optical power meters, and optical laser source products.
General Purpose Test Products
We sell the following types of products into the general purpose test market: general purpose instruments, modular instruments and test software, digital test products, semiconductor and board test solutions, electronics manufacturing test equipment, atomic force microscopes and network surveillance solutions.
General purpose instruments are used principally by engineers in research and development laboratories, manufacturing, and calibration and service, for measuring voltage, current, frequency, signal pulse width, modulation and other complex electronics measurements. Our general purpose products include spectrum analyzers, network analyzers, signal generators, logic analyzers, digitizing oscilloscopes, voltmeters, multimeters, frequency counters, bench and system power supplies, function generators and waveform synthesizers.
Modular instruments and test software are used by engineers and scientists in the design and manufacture of electronic devices and for data collection in many diverse experiments and systems. The building blocks of these systems can be configured for a wide variety of test applications and offer the flexibility to be changed by recombining modular hardware and software components as needed. Examples include test systems for wireless semiconductors; aviation communication, navigation and radar systems; and high energy physics research.
Our digital test products are used by research and development engineers across a broad range of industries to validate the function and performance of their digital product and system designs. These designs include a wide range of products from simple digital control circuits to complex high speed systems such as computer servers and the latest generation gaming consoles. The test products offered include high-performance oscilloscopes, logic and serial protocol analyzers, logic-signal sources and data generators.
Our semiconductor and board test solutions enable customers to develop and test state of the art semiconductors, test and inspect printed circuit boards, perform functional testing, and measure position and distance information to the sub-nanometer level. We supply parametric test instruments and systems used primarily to examine semiconductor wafers during the manufacturing process. Our in-circuit test system helps identify quality defects, such as faulty or incorrect parts, that affect electrical performance. Our laser interferometer measurement systems are based on precision optical technology and provide precise position or distance information for dimensional measurements.
Our atomic force microscopes ("AFM") are high-resolution imaging devices that can resolve features as small as an atomic lattice. An AFM allows researchers to observe and manipulate molecular and atomic level features. Our expanding portfolio of AFM products provides customers with reliable, easy-to-use tools for a wide range of nanotechnology applications, including semiconductor, data storage, polymers, materials science and life science studies.
Our surveillance systems and subsystems are used by defense and government engineers and technicians to detect, locate and analyze signals of interest. These signals may be transmitted via radio frequency or wire lines. The products offered include receivers for detecting radio frequency signals, probes for detecting wire line signals and software that enables the identification and analysis of these signals.
Electronic Measurement Customers
Agilent's electronic measurement customers include original equipment and contract manufacturers of electronic products, wireless device manufacturers and network equipment manufacturers who design, develop, manufacture and install network equipment, service providers who implement, maintain and manage communication networks and services, and companies who design, develop, and manufacture semiconductors and semiconductor lithography systems. Our customers use our products to conduct research and development, manufacture, install and maintain radio frequency, microwave frequency, digital, semiconductor, and optical products and systems and conduct nanotechnology research. Many of our customers purchase solutions across several of our major product lines for their different business units.
We had approximately 14,000 customers for electronic measurement products in fiscal 2013 and no single customer represented a material amount of the net revenue of the electronic measurement business.
In general, the orders and revenues from many of the electronic measurement markets and product categories are seasonal,
traditionally marked by lower business levels in the first quarter of the fiscal year and higher volumes in the fourth quarter of the fiscal year. This seasonality is particularly evident in products that we sell into the aerospace and defense industry, as well as those linked to consumer spending, which includes some of our communications test equipment. The seasonal impact of our business is tempered by broader economic trends and the diversity of our electronic measurement products and customers, which span multiple industries.
Electronic Measurement Sales, Marketing and Support
We have a focused sales strategy, using a direct sales force, resellers, manufacturer's representatives and distributors to meet our customers' needs. Our direct sales force is focused on identifying customer needs and recommending solutions involving the effective use and deployment of our equipment, services, systems and capabilities. Some members of our direct sales force focus on global accounts, providing uniform services on a worldwide basis. Others focus on our more complex products such as our high-performance instruments, where customers require strategic consultation. Our sales force also engages with the contract manufacturer market by collaborating with original equipment manufacturers to specify our test equipment for contract manufacturer test applications, as well as marketing to contract manufacturers directly.
Our direct sales force consists of field engineers and systems engineers who have in-depth knowledge of the customers' business and technology needs. Our systems engineers provide a combination of consulting, systems integration and application and software engineering services and are instrumental in all stages of the sale, implementation and support of our complex systems and solutions.
To complement our direct sales force we have agreements with many channel partners around the world. These partners, including resellers, manufacturer's representatives, and distributors, serve Agilent's customers across a number of product lines and provide the same level of service and support expected from our direct channel. Lower dollar transactions can also be served by our tele-sales and electronic commerce channels.
Our products typically come with three year standard warranties, and extended warranties are available at additional cost.
Electronic Measurement Manufacturing
We concentrate our electronic measurement manufacturing efforts primarily on final assembly and test of our products. To maximize our productivity and our ability to respond to market conditions, we use contract manufacturers for the production of printed circuit boards, sheet metal fabrication, metal die-casting, plastic molding and standard electronic components. We also manufacture proprietary devices and assemblies in our own fabrication facilities for competitive advantage. We have manufacturing facilities in California and Colorado in the U.S. Outside of the U.S. we have manufacturing facilities in China, Germany, Japan and Malaysia.
We generally only manufacture products when we have received firm orders for delivery and do not generally hold large stocks of finished inventory.
Electronic Measurement Competition
The market for electronic measurement equipment is highly competitive. Our electronic measurement business competes with a number of significant competitors in all our major product categories and across our targeted industries. In the communications test market our primary competitors are Aeroflex Incorporated, Anritsu Corporation, Ansoft Corporation (a subsidiary of Ansys Corporation), National Instruments Corporation, Rohde & Schwarz GmbH & Co. KG, Spirent plc, Tektronix, Inc. (a subsidiary of Danaher Corporation) and Teradyne, Inc. In the general purpose test market, we compete against companies such as Aeroflex Incorporated, Bruker Corporation, Fluke Corporation (a subsidiary of Danaher Corporation), Teledyne Technologies Incorporated, National Instruments Corporation, Rohde & Schwarz GmbH & Co. KG, Tektronix, Inc. (a subsidiary of Danaher Corporation), Teradyne, Inc., Test Research Inc., and Zygo Corporation.
Our electronic measurement business offers a wide range of products, and these products compete primarily on the basis of product quality and functionality, as well as performance and reliability.
Agilent Technologies Research Laboratories
Agilent Technologies Research Laboratories ("Research Labs") is our research organization based in Santa Clara, California, with offices in Europe and Asia. The Research Labs create competitive advantage through high-impact technology, driving market leadership and growth in Agilent's core businesses and expanding Agilent's measurement footprint into adjacent markets. At the
cross-roads of the organization, the Research Labs are able to identify and enable synergies across Agilent's businesses to create competitive differentiation and compelling customer value.
The technical staff have advanced degrees that cover a wide range of scientific and engineering fields, including biology, chemistry, computer science, distributed measurement, electrical engineering, image processing, materials science, mathematics, nano/microfabrication, microfluidics, software, informatics, optics, physics physiology and signal processing. As of the end of October 2013, Research Labs employed approximately 210 personnel worldwide.physiology.
Global Infrastructure Organization
We provide support to our businesses through our global infrastructure organization. This support includes services in the areas of finance, legal, workplace services, human resources and information technology. Generally, these organizations are centrally operated from Santa Clara, California, with services provided worldwide. As of the end of October 2013,2016, our global infrastructure organization employed approximately 2,2002,500 people worldwide.
Agilent Order Fulfillment OrganizationOrganizations
Beginning in fiscal year 2012, we created the Agilent Order FulfillmentOur order fulfillment and supply chain organization to centralize(“OFS”) centralizes all order fulfillment and supply organizations and operations. AOF leverageschain operations in our strength inbusinesses. OFS provides resources for manufacturing, engineering and strategic sourcing and logistics for life sciences and diagnostics, chemical analysis and electronic measurementto our respective businesses. In general, AOFOFS employees are dedicated to specific businesses and business headcount numbers include AOF employees. In the fourth quarter of 2013 we announced that the AOF organization had been divided into two separate operations; one dedicatedassociated costs are directly allocated to the life sciences, diagnostics and chemical analysis businesses and one dedicated to the electronic measurement business.those businesses.
The following discussions of Research and Development, Backlog, Intellectual Property, Materials, Environmental, International Operations and Acquisition and Disposal of Material Assets include information common to each of our businesses.
Research and Development
Research and development ("R&D") expenditures were $704$329 million in 2013, $6682016, $330 million in 20122015 and $649$358 million in 2011,2014, the vast majority of which was company-sponsored. We anticipate that we will continue to have significant R&D expenditures in order to maintain our competitive position with a continuing flow of innovative, high-quality products and services. We remain committed to invest approximately 10 percent of revenues in research and development and have focused our development efforts on key strategic opportunities in order to align our business with available markets and position ourselves to capture market share.
Backlog
Backlog represents the amount of revenue expected from orders that have already been booked, including orders for goods and services that have not been delivered to customers, orders invoiced but not yet recognized as revenue, and orders for goods that were shipped but not invoiced, awaiting acceptance by customers.
On October 31, 2013, our unfilled backlog for the electronic measurement business was approximately $760 million, as compared to approximately $800 million at October 31, 2012. On October 31, 2013, our unfilled backlog for the chemical analysis business was approximately $380 million, as compared to approximately $360 million at October 31, 2012. Within our life sciences and diagnostics business, our unfilled backlog was approximately $520 million on October 31, 2013 as compared to approximately $530 million at October 31, 2012. We expect that a majority of the unfilled backlog for all three businesses will be delivered to customers within six months. On average, our unfilled backlog represents approximately three months' worth of revenues. We believe that backlog on any particular date, while indicative of short-term revenue performance, is not necessarily a reliablemeaningful indicator of medium or long-termfuture business prospects for our business segments since a significant portion of our revenue performance.for a given quarter is derived from the current quarter's orders. Therefore, we believe that backlog information is not material to an understanding of our business.
Intellectual Property
We generate patent and other intellectual property rights covering significant inventions and other innovations in order to create a competitive advantage. While we believe that our licenses, patents and other intellectual property rights have value, in general no single license, patent or other intellectual property right is in itself material. In addition, our intellectual property rights may be challenged, invalidated or circumvented or may otherwise not provide significant competitive advantage.
Materials
Our manufacturing operations employ a wide variety of semiconductors, electromechanical components and assemblies and raw materials such as plastic resins and sheet metal. Our electronic measurement, chemical analysis, life sciences and applied markets, diagnostics and genomics and Agilent CrossLab businesses all purchase materials from thousands of suppliers on a global basis. Some of the parts that require custom design work are not readily available from alternate suppliers due to their unique design or the length of time necessary for design work. Our long-term relationships with suppliers allow us to proactively manage technology road maps and product discontinuance plans and monitor their financial health. Even so, some suppliers may still extend their lead times, limit supplies, increase prices or cease to produce necessary parts for our products. If these are unique components, we may not be able to find a substitute quickly or at all. To address the potential disruption in our supply chain, we use a number of techniques, including qualifying multiple sources of supply and redesign of products for alternative components. In addition, while we generally attempt to keep our inventory at minimal levels, we do purchase incremental inventory as circumstances warrant to protect the supply chain.
Environmental
Our R&D, manufacturing and distribution operations involve the use of hazardous substances and are regulated under international, federal, state and local laws governing health and safety and the environment. We apply strict standards for protection of the environment and occupational health and safety to sites inside and outside the U.S., even if not subject to regulation imposed by foreign governments. We believe that our properties and operations at our facilities comply in all material respects with applicable environmental laws and occupational health and safety laws. However, the risk of environmental liabilities cannot be completely eliminated and there can be no assurance that the application of environmental and health and safety laws to Agilent will not require us to incur significant expenditures. We are also regulated under a number of international, federal, state, and local laws regarding recycling, product packaging and product content requirements. The environmental, product content/disposal and recycling laws are gradually becoming more stringent and may cause us to incur significant expenditures in the future.
Some of our operations are located on properties that are known to have subsurface contamination undergoing remediation by our former parent company, Hewlett-Packard Company ("HP"). As part of the initial separation agreement from HP in 1999, HP agreed to retain the liability for the contamination, perform the required remediation and indemnify us with respect to claims arising out of the contamination. The determination of the existence and cost of remediation of additional contamination caused by us, if any, could involve costly and time-consuming negotiations and litigation. While we expect that HP will meet its remediation and indemnification obligations in this regard, there can be no guarantee that it will do so. Under our agreement with HP, HP will have access to these properties to perform the remediation. HP has agreed to minimize interference with on-site operations at those properties during the course of the remediation, but there can be no guarantee that our operations will not be interrupted or that we will not be required to incur unreimbursed costs associated with the remediation. The remediation could also harm on-site operations and the future use and negatively affect the value and future use of the properties. Several of the sites under the initial separation agreement from HP have been sold.
In addition, someconnection with the sale of these properties are undergoing remediation by HP under an orderseveral of an agencyour businesses, we have agreed to indemnity the buyers of such business, their respective affiliates and other related parties against certain damages that they might incur in the future. The continuing indemnifications primarily cover damages relating to liabilities of the state in whichbusiness that Agilent retained and did not transfer to the property is located. Although HP has agreed to indemnify us with respect to such subsurface contamination, it is possible that one or more of the governmental agencies will require us to be named on any of these orders. The naming of Agilent will not affect HP's obligation to indemnify us with regard to these matters.
We are liable and are indemnifying HP for any contamination found at all facilities transferred to us by HP excluding the properties undergoing remediation. In addition,buyers as we are obligated to indemnify HP for liability associated with past non-compliance with environmental laws regulating ongoing operations, if any, at all properties transferred to us by HP, as well as at sold or discontinued businesses that are related to our businesses. While we are not aware of any material liabilities associated with such indemnified matters, there is no guarantee that such contamination or regulatory non-compliance does not exist, and will not expose us to material liability in the future.
We are being indemnified by HP with respect to all environmental liabilities for which HP accrued a reserve, and we are not aware of any material environmental liabilities assumed by us which are not subject to the indemnity.
As part of our acquisition of Varian in 2010, we assumed the liabilities of Varian,other specified items, including Varian's costs and potential liabilities for environmental matters. One such cost isIn our obligation, along withopinion, the obligationfair value of Varian Semiconductor Equipment Associates, Inc. ("VSEA") (under the termsthese indemnification obligations was not material as of a Distribution Agreement between Varian, VSEA and Varian Medical Systems, Inc. ("VMS")) to each indemnify VMS for one-third of certain costs (after adjusting for any insurance proceeds and tax benefits recognized or realized by VMS for such costs) relating to (a) environmental investigation, monitoring and/or remediation activities at certain facilities previously operated by Varian Associates, Inc. ("VAI") and third-party claims made in connection with environmental conditions at those facilities, and (b) U.S. Environmental Protection Agency or third-party claims alleging that VAI
or VMS is a potentially responsible party under the Comprehensive Environmental Response Compensation and Liability Act of 1980, as amended ("CERCLA") in connection with certain sites to which VAI allegedly shipped manufacturing waste for recycling, treatment or disposal (the "CERCLA sites"). With respect to the facilities formerly operated by VAI, VMS is overseeing the environmental investigation, monitoring and/or remediation activities, in most cases under the direction of, or in consultation with, federal, state and/or local agencies, and handling third-party claims. VMS is also handling claims relating to the CERCLA sites. Although any ultimate liability arising from environmental- related matters could result in significant expenditures that, if aggregated and assumed to occur within a single fiscal year, could be material to our financial statements, the likelihood of such occurrence is considered remote. Based on information currently available and our best assessment of the ultimate amount and timing of environmental-related events, management believes that the costs of environmental-related matters are unlikely to have a material adverse effect on our financial condition or results of operations.October 31, 2016.
We maintain a comprehensive Environmental Site Liability insurance policy which may cover certain clean-up costs or legal claims related to environmental contamination. This policy covers specified active, inactive and divested locations.
International Operations
Our net revenue originating outside the U.S., as a percentage of our total net revenue, was approximately 70 percent in fiscal 2013, 68 percent in fiscal 2012, and2016, 70 percent in fiscal 2011,2015 and 75 percent in fiscal 2014, the majority of which was from customers other than foreign governments. Annual revenues derived from China were approximately 1720 percent in fiscal 2013 and2016, 16 percent in fiscal 20122015 and 2011. Approximately 9 percent of our revenue in fiscal 2013, 1013 percent in fiscal 2012 and 11 percent in fiscal 2011 was derived from Japan.2014. Revenues from external customers are generally attributed to countries based uponon where we ship the location ofproducts or provide the Agilent sales representative.services.
Long-lived assets located outside of the U.S., as a percentage of our total long-lived assets, was approximately 5844 percent in fiscal year 2013, 602016 and 49 percent in fiscal year 2012 and 56 percent in fiscal year 2011. Approximately 9, 12 and 13 percent of our long-lived assets were located in Japan in fiscal years 2013, 2012 and 2011, respectively.2015.
Most of our sales in international markets are made by foreign sales subsidiaries. In countries with low sales volumes, sales are made through various representatives and distributors. However, we also sell into international markets directly from the U.S.
Our international business is subject to risks customarily encountered in foreign operations, including interruption to transportation flows for delivery of parts to us and finished goods to our customers, changes in a specific country's or region's political or economic conditions, trade protection measures, import or export licensing requirements, consequences from changes in tax laws and regulatory requirements, difficulty in staffing and managing widespread operations, differing labor regulations, differing protection of intellectual property and geopolitical turmoil, including terrorism and war. We are also exposed to foreign currency exchange rate risk inherent in our sales commitments, anticipated sales and expenses, and assets and liabilities denominated in currencies other than the local functional currency, and may also become subject to interest rate risk inherent in any debt we incur, or investment portfolios we hold. There may be an increased risk of political unrest in regions where we have significant manufacturing operations such as Southeast Asia. However, we believe that our international diversification provides stability to our worldwide operations and reduces the impact on us of adverse economic changes in any single country. Financial information about our international operations is contained in Note 21,19, "Segment Information", to our consolidated financial statements.
Acquisition and Disposal of Material Assets
On June 21, 2012,September 19, 2013, Agilent announced plans to separate into two publicly traded companies, one comprising of the life sciences, diagnostics and chemical analysis businesses that retained the Agilent name, and the other one that comprised of the electronic measurement business that was renamed Keysight Technologies, Inc. (“Keysight”). Keysight was incorporated in Delaware as a wholly-owned subsidiary of Agilent on December 6, 2013. On November 1, 2014, we acquired Dako throughcompleted the purchasedistribution of 100% of the outstanding common shares of Keysight to Agilent stockholders who received one share capital of Dako, a limited liability company incorporated under the lawsKeysight common stock for every two shares of Denmark, under the share purchase agreement, dated May 16, 2012. Dako provides antibodies, reagents, scientific instruments and software primarily to customers in pathology laboratories. As a resultAgilent held as of the acquisition, Dako has become a wholly-owned subsidiaryclose of Agilent. The consideration paid was approximately $2.143 billion, of which $1.4 billion was paid directly tobusiness on the seller and $743 million was paid to satisfy the outstanding debt of Dako. Agilent funded the acquisition using our existing cash.record date, October 22, 2014.
Executive Officers of the Registrant
The names of our current executive officers and their ages, titles and biographies appear below:
Henrik Ancher-Jensen, 5148,, has served as Senior Vice President, Agilent and President, Order Fulfillment since September 2013. From September 2012 to September 2013, Mr. Ancher-Jensen served as our Vice President, Global Product Supply, Diagnostics and Genomics Group. From September 2010 to September 2012 he served as Corporate Vice President, Global Operations of Dako A/S, a Danish diagnostics company, and as Dako’s Vice President, Supply Chain and Chief Information Officer
from 2006 to September 2010. Prior to joining Dako, he spent more than 15 years in senior management roles and management consulting with Chr. Hansen, Deloitte Consulting and NVE.
Solange Glaize,Mark Doak, 61, has served as our Senior Vice President, Agilent and President, Agilent CrossLab Group (formerly a group within the Life Sciences & Applied Markets Group) since September 2014. From August 2008 to September 2014, Mr. Doak
served as our Vice President and General Manager of the Services and Support Division. Prior to that, he held several senior management positions across functions in marketing, quality and services.
Rodney Gonsalves, 49,51, has served as our Vice President, Corporate Controllership and Chief Accounting Officer since March, 2012.May 2015. From June 2011September 2009 to March 2012, Ms. GlaizeMay 2015, Mr. Gonsalves served as Vice President and operational CFO for various business groups within the Company, most recently for the Life Sciences and Applied Markets Group. From January 2007 to August 2009 he served as our Vice Presidentvice president of Finance and Business Development, Group CFO, Life Sciences Group and from September 2009Investor Relations. Prior to June 2011 as Vice President of Finance, Group CFO, Life Sciences Group. From May 2005 to November 2009, she served as Senior Director of Finance, Life Sciences Solution Unit. Ms. Glaize has previouslyassuming this position, Mr. Gonsalves served in various capacities for Agilent, including as Director of Finance, Worldwide Order Fulfillment, Director of Sales Financecontroller, corporate governance and Administration, Semiconductor Products Groupcustomer financing in Agilent’s Global Infrastructure Organization, and as Managing Director, European Financial Services.controller for the Photonics Systems Business Unit. Prior to joining Agilent, Ms. GlaizeMr. Gonsalves held a variety of positions in finance with Hewlett-Packard Company.Hewlett- Packard Co. Mr. Gonsalves holds a master’s degree in business administration from Santa Clara University in California.
Jean M. Halloran,Dominique P. Grau 61,57, has served as our Senior Vice President, Human Resources since from August 1999.2014. From 1997May 2012 to 1999, Ms. HalloranAugust 2014 Mr. Grau served as Director of Corporate Education and Development for Hewlett‑Packard.Vice President, Worldwide Human Resources. Prior to assuming this position,that, he served as Vice President, Compensation, Benefits and HR Services from 1993May 2006 to 1997, Ms. Halloran acted as human resources managerMay 2012. Mr. Grau had previously served in various capacities for Hewlett‑Packard's Measurement Systems Organization. Ms. Halloran joined Hewlett‑Packard in 1980 in the Medical Products Group, where she held a variety of positions in human resources, manufacturingAgilent and strategic planning.Hewlett-Packard Company.
Didier Hirsch, 62,65, has served as our Senior Vice President and Chief Financial Officer since July 2010 and served as interim Chief Financial Officer from April 2010 to July 2010. Prior to that he served as Vice President, Corporate Controllership and Tax from November 2006 to July 20, 2010 and as Chief Accounting Officer from November 2007 to July 20, 2010. From April 2003 to October 2006, Mr. Hirsch served as Vice President and Controller. Prior to assuming this position, Mr. Hirsch served as Vice President and Treasurer from September 1999 to April 2003. Mr. Hirsch had joined Hewlett‑Packard Company in 1989 as Director of Finance and Administration of Hewlett‑Packard France. In 1993, he became Director of Finance and Administration of Hewlett‑ Packard Asia Pacific, and in 1996 Director of Finance and Administration of Hewlett‑Packard Europe, Middle East, and Africa. Mr. Hirsch serves on the Board of Directors of Logitech International and International RectifierKnowles Corporation.
Marie Oh Huber,Patrick K. Kaltenbach, 53 52,, has served as Senior Vice President, General CounselAgilent and SecretaryPresident, Life Sciences and Applied Markets Group since September 2009 and serves as an officer or director for a variety of Agilent subsidiaries. SheNovember 2014. From January 2014 to November 2014 he served as our Vice President Deputyand General CounselManager of the Life Sciences Products and Assistant Secretary from June 2007Solutions organization. Prior to September 2009 andthat he served as our Vice President Assistantand General Counsel and Assistant Secretary from July 2002 to June 2007. She is also a directorManager of the American Leadership Forum - Silicon Valley.Liquid Phase Division from December 2012 to January 2014. From July 2010 to December 2012 he served as Vice President and General Manager of the Liquid Phase Separations Business. Prior to that he served as General Manager of the Liquid Chromatography Business from February 2008 to July 2010. Mr. Kaltenbach has held various positions in R&D management and senior management beginning at Hewlett-Packard Co.
Michael R. McMullen, 52,55, has served as Chief Executive Officer since March 2015 and as President since September 2014. From September 2014 to March 2015 he also served as Chief Operating Officer. From September 2009 to September 2014 he served as Senior Vice President, Agilent and President, Chemical Analysis Group since September 2009.Group. From January 2002 to September 2009, he served as our Vice President and General Manager of the Chemical Analysis Solutions Unit of the Life Sciences and Chemical Analysis Group. Prior to assuming this position, from March 1999 to December 2001, Mr. McMullen served as Country Manager for Agilent's China, Japan and Korea Life Sciences and Chemical Analysis Group. Prior to this position, Mr. McMullen served as our Controller for the Hewlett‑Packard Company and Yokogawa Electric Joint Venture from July 1996 to March 1999.
Ronald S. NersesianMichael Tang, , 54,42, has served as Executive Vice President, Agilent and President and Chief Executive Officer Designate, Electronic Measurement since September 2013. Mr. Nersesian served as President from November 2012 to September 2013 and as Chief Operating Officer from November 2011 to September 2013. From November 2011 to November 2012 Mr. Nersesian served as Executive Vice President and Chief Operating Officer. He served as our Senior Vice President, AgilentGeneral Counsel and Secretary since January 2016. From May 2015 to January 2016 he served as Vice President, Electronic Measurement GroupAssistant General Counsel and Secretary and from November 2013 to April 2015 he served as Vice President, Assistant General Counsel and Assistant Secretary. From March 2012 to October 2013 he served as Business Development Manager in Agilent’s Corporate Development group. From November 2009 to November 2011,February 2012 he served as our Vice President and General Manager of the Wireless Business Unit of the Electronics Measurement Group from February 2005Senior Counsel. From August 2006 to FebruaryOctober 2009 and as our Vice President and General Manager of the Design Validation Division from May 2002 to February 2005.he served in various capacities in Agilent’s legal department. Prior to joining Agilent, Mr. Nersesian servedTang represented public and private technology companies in management positions with LeCroy Corporation from 1996 to 2002. From 1984 through 1996, Mr. Nersesian served in various roles with Hewlett-Packard Company. Mr. Nersesian serves on the Boarda broad range of Directors of Trimble Navigation Limited.corporate and securities matters at Wilson Sonsini Goodrich & Rosati, a Palo Alto, California, law firm and Fenwick & West LLP, a Mountain View, California, law firm.
Guy SénéJacob Thaysen, 58,41, has served as Senior Vice President, Agilent and President, Electronic MeasurementDiagnostics and Genomics Group since November 2011.2014. From May 2009October 2013 to November 2011, Mr. Séné served as our Vice President and General Manager, Microwave and Communications Division of the Electronic Measurement Group, and from October 2006 to April 2009, he served as our Vice President and General Manager, Signal Analysis Division. Prior to that, Mr. Séné held a broad variety of positions in sales, marketing and support in Europe and Asia for Agilent and Hewlett‑Packard Company.
Fred A. Strohmeier, 59, has served as Senior Vice President, Agilent and President, Life Sciences and Diagnostics since December 2013. From December 2012 to December 20132014 he served as Vice President and General Manager of the Life Science ProductsDiagnostics and SolutionsGenomics business. HePrior to that he served as Vice President and General Manager of the Liquid Phase Analysis DivisionGenomics Solutions unit from December 2008January 2013 to December 2012. From 2006October 2013. Before joining Agilent, he was Corporate Vice President of R&D at Dako A/S, a Danish diagnostics company from April 2011 to 2008, he served as General Manager of the Liquid Phase Division. PriorJanuary 2013. His previous positions at Dako include Vice President, System Development, R&D from March 2010 to April 2011, Vice President, Strategic Marketing from April 2009 to March 2010 and Vice President, Global
that,Sales Operations from August 2008 to March 2009. Prior to Dako, Mr. Strohmeier held various positions in generalThaysen worked as a management researchconsultant and developmentChief Technical Officer and manufacturing for Agilent and Hewlett-Packard Company.founder of a high-tech start-up company.
William P. Sullivan, 64, has served as Agilent’s Chief Executive Officer since March 2005 and served as President since September 2013. He previously served as President from March 2005 to November 2012. Before being named as Agilent’s Chief Executive Officer, Mr. Sullivan served as Executive Vice President and Chief Operating Officer from March 2002 to March 2005. In that capacity, he shared the responsibilities of the president’s office with Agilent’s former President and Chief Executive Officer, Edward W. Barnholt. Mr. Sullivan also had overall responsibility for Agilent’s Electronic Products and Solutions Group, the company’s largest business group. Prior to assuming that position, Mr. Sullivan served as our Senior Vice President, Semiconductor Products Group, from August 1999 to March 2002. Before that, Mr. Sullivan held various management positions at Hewlett-Packard Company. Mr. Sullivan serves on the Board of the Children's Discovery Museum in San Jose, California, as well as on the Board of Directors of URS Corporation and Avnet, Inc.
Investor Information
We are subject to the informational requirements of the Securities Exchange Act of 1934 (“Exchange Act”). Therefore, we file periodic reports, proxy statements and other information with the Securities and Exchange Commission (“SEC”). Such reports, proxy statements and other information may be read and copied by visiting the Public Reference Room of the SEC at 100 F Street N.E., Washington, D.C. 20549. You may obtain information on the operation of the Public Reference Room by calling the SEC at 1-800-SEC-0330. In addition, the SEC maintains an Internet site (http://www.sec.gov) that contains reports, proxy and information statements and other information regarding issuers that file electronically.
You can access financial and other information at our Investor Relations website. The address is www.investor.agilent.com. We make available, free of charge, copies of our annual report on Form 10-K, quarterly reports on Form 10-Q, current reports on Form 8-K and amendments to those reports filed or furnished pursuant to Section 13(a) or 15(d) of the Exchange Act as soon as reasonably practicable after filing such material electronically or otherwise furnishing it to the SEC.
Our Amended and Restated Corporate Governance Standards, the charters of our Audit and Finance Committee, our Compensation Committee, our Executive Committee and our Nominating/Corporate Governance Committee, as well as our Standards of Business Conduct (including code of ethics provisions that apply to our principal executive officer, principal financial officer, principal accounting officer and senior financial officers) are available on our website at www.investor.agilent.com under “Corporate Governance”. These items are also available in print to any stockholder in the United States and Canada who requests them by calling (877) 942-4200. This information is also available by writing to the company at the address on the cover of this Annual Report on Form 10-K.
ITEM 1A. RISK FACTORS
Risks, Uncertainties and Other Factors That May Affect Future Results
Depressed and uncertain general economic conditions may adversely affect our operating results and financial condition.
Our business is sensitive to negative changes in general economic conditions, both inside and outside the U.S. The continued economic downturn may adversely impact our business resulting in:
reduced demand for our products, delays in the shipment of orders, or increases in order cancellations;
increased risk of excess and obsolete inventories;
increased price pressure for our products and services; and
greater risk of impairment to the value, and a detriment to the liquidity, of our investment portfolio.
Our operating results and financial condition could be harmed if the markets into which we sell our products decline or do not grow as anticipated.
Visibility into our markets is limited. Our quarterly sales and operating results are highly dependent on the volume and timing of orders received during the fiscal quarter, which are difficult to forecast and may be cancelled by our customers. A large amount of our orders are back-end loaded toward the end of our second and fourth fiscal quarters and their timing may be influenced by the sales incentive programs we have in place. In addition, our revenuesrevenue and earnings forecasts for future fiscal quarters are often based on the expected seasonality or cyclicality of our markets. However, the markets we serve do not always experience the seasonality or cyclicality that we expect. Any decline in our customers' markets or in general economic conditions including declines related to the current market disruptions described above, would likely result in a reduction in demand for our products and services. The broader semiconductor market is one of the drivers for our electronic measurement business, and therefore, a decrease in the semiconductor market could harm our electronic measurement business. Also, if our customers' markets decline, we may not be able to collect on outstanding amounts due to us. Such declines could harm our consolidated financial position, results of operations, cash flows and stock price, and could limit our profitability. Also, in such an environment, pricing pressures could intensify. Since a significant portion of our operating expenses is relatively fixed in nature due to sales, research and development and manufacturing costs, if we were unable to respond quickly enough these pricing pressures could further reduce our operating margins.
If we do not introduce successful new products and services in a timely manner to address increased competition through frequent new product and service introductions, rapid technological changes and changing industry standards, our products and services will become obsolete, and our operating results will suffer.
We generally sell our products in industries that are characterized by rapid technological changes,increased competition through frequent new product and service introductions, rapid technological changes and changing industry standards. In addition, many of the markets in which we operate are seasonal and cyclical.seasonal. Without the timely introduction of new products, services and enhancements, our products and services will become technologically obsolete over time, in which case our revenue and operating results would suffer. The success of our new products and services will depend on several factors, including our ability to:
properly identify customer needs and predict future needs;
innovate and develop new technologies, services and applications;
successfully commercialize new technologies in a timely manner;
manufacture and deliver our products in sufficient volumes and on time;
differentiate our offerings from our competitors' offerings;
price our products competitively;
anticipate our competitors' development of new products, services or technological innovations; and
control product quality in our manufacturing process.
We are pursuing a plan to spin-offGeneral economic conditions may adversely affect our electronic measurement business into a new, independent publicly traded company. The proposed separation may not be completed on the currently contemplated timeline or at alloperating results and may not achieve the intended benefits.financial condition.
In September 2013,Our business is sensitive to negative changes in general economic conditions, both inside and outside the United States. Slower global economic growth and uncertainty in the markets in which we announcedoperate may adversely impact our business resulting in:
reduced demand for our products, delays in the shipment of orders, or increases in order cancellations;
increased risk of excess and obsolete inventories;
increased price pressure for our products and services; and
greater risk of impairment to the value, and a plandetriment to separate into two independent public companies through a spin-offthe liquidity, of our electronic measurement business. Unanticipated developments, including possible delays in obtaining various tax rulings, regulatory approvals or clearances and trade qualifications, uncertainty of the financial markets and challenges in establishing infrastructure or processes, could delay or prevent the proposed separation or cause the proposed separation to occur on terms or conditions that are less favorable and/or different than expected. Even if the transaction is completed, we may not realize some or all of the anticipated benefits from the spin-off. Expenses incurred to accomplish the proposed separation may be significantly higher than what we currently anticipate. Executing the proposed separation also requires significant time and attention from management, which could distract them from other tasks in operating our business. Following the proposed separation, the combined value of the common stock of the two publicly-traded companies may not be equal to or greater than what the value of our common stock would have been had the proposed separation not occurred. investment portfolio.
Failure to adjust our purchases due to changing market conditions or failure to accurately estimate our customers' demand could adversely affect our income.
Our income could be harmed if we are unable to adjust our purchases to reflect market fluctuations, including those caused by the seasonal or cyclical nature of the markets in which we operate. The sale of our products and services are dependent, to a large degree, on customers whose industries are subject to seasonal or cyclical trends in the demand for their products. For example, the consumer electronics market is particularly volatile, making demand difficult to anticipate. During a market upturn, we may not be able to purchase sufficient supplies or components to meet increasing product demand, which could materially affect our results. In the past we have seen a shortage of parts for some of our products. In addition, some of the parts that require custom design are not readily available from alternate suppliers due to their unique design or the length of time necessary for design work.
Should a supplier cease manufacturing such a component, we would be forced to reengineer our product. In addition to discontinuing parts, suppliers may also extend lead times, limit supplies or increase prices due to capacity constraints or other factors. In order to secure components for the production of products, we may continue to enter into non-cancelable purchase commitments with vendors, or at times make advance payments to suppliers, which could impact our ability to adjust our inventory to declining market demands. Prior commitments of this type have resulted in an excess of parts when demand for our communications and electronics products has decreased. If demand for our products is less than we expect, we may experience additional excess and obsolete inventories and be forced to incur additional charges.expenses.
Demand for some of our products and services depends on the capital spending policies of our customers, research and development budgets and on government funding policies.
Our customers include pharmaceutical companies, laboratories, universities, healthcare providers, government agencies and public and private research institutions. Many factors, including public policy spending priorities, available resources, mergers and consolidations, spending priorities, institutional and governmental budgetary policies and product and economic cycles, have a significant effect on the capital spending policies of these entities. Fluctuations in the research and development budgets at these organizations could have a significant effect on the demand for our products and services. Research and development budgets fluctuate due to changes in available resources, consolidation, spending priorities, general economic conditions and institutional and governmental budgetary policies. The timing and amount of revenue from customers that rely on government funding or research may vary significantly due to factors that can be difficult to forecast, including changes in spending authorizations and budgetary priorities for our products and services. If demand for our products and services is adversely affected, our revenue and operating results would suffer.
Economic, political, foreign currency and other risks associated with international sales and operations could adversely affect our results of operations.
Because we sell our products worldwide, our business is subject to risks associated with doing business internationally. We anticipate that revenue from international operations will continue to represent a majority of our total revenue. International revenue and costs are subject to the risk that fluctuations in foreign currency exchange rates could adversely affect our financial results when translated into U.S. dollars for financial reporting purposes. The unfavorable effects of changes in foreign currency exchange rates has decreased revenues by approximately 2 percentage points in the year ended October 31, 2016. In addition, many of our employees, contract manufacturers, suppliers, job functions and manufacturing facilities are located outside the U.S.United States. Accordingly, our future results could be harmed by a variety of factors, including:
interruption to transportation flows for delivery of parts to us and finished goods to our customers;
changes in foreign currency exchange rates;
changes in a specific country's or region's political, economic or other conditions;
trade protection measures and import or export licensing requirements;
negative consequences from changes in tax laws including changes to U.S. tax legislation that could materially increase our effective tax rate;
difficulty in staffing and managing widespread operations;
differing labor regulations;
differing protection of intellectual property;
unexpected changes in regulatory requirements; and
geopolitical turmoil, including terrorism and war.
We centralized most of our accounting and tax processes to two locations: India and Malaysia. These processes include general accounting, cost accounting, accounts payable, and accounts receivables and tax functions. If conditions change in those countries, it may adversely affect operations, including impairing our ability to pay our suppliers and collect our receivables. Our results of operations, as well as our liquidity, may be adversely affected and possible delays may occur in reporting financial results.
Additionally, we must comply with complex foreign and U.S. laws and regulations, such as the U.S. Foreign Corrupt Practices Act, the U.K. Bribery Act, and other local laws prohibiting corrupt payments to governmental officials, anti-competition regulations and anti-competitionsanctions imposed by the U.S. Office of Foreign Assets Control and other similar laws and regulations. Violations of these laws and regulations could result in fines and penalties, criminal sanctions, restrictions on our business conduct and on our ability to offer our products in one or more countries, and could also materially affect our brand, our ability to attract and retain employees, our international operations, our business and our operating results. Although we have implemented policies and procedures designed to ensure compliance with these laws and regulations, there can be no assurance that our employees, contractors, or agents will not violate our policies. See Item 3. "Legal Proceedings". If government action results from our China investigation, we could face possible fines and penalties, criminal or civil sanctions, or other consequences, and our business could suffer.
In addition, although the majority of our products are priced and paid for in U.S. dollars, a significant amount of certain types of expenses, such as payroll, utilities, tax, and marketing expenses, are paid in local currencies. Our hedging programs reduce, but do not always entirely eliminate, within any given twelve monthtwelve-month period, the impact of currency exchange rate movements, and therefore fluctuations in exchange rates, including those caused by currency controls, could impact our business, operating results and financial condition by resulting in lower revenue or increased expenses. However, for expenses beyond that twelve monthtwelve-month period, our hedging strategy does not mitigate our exposure. In addition, our currency hedging programs involve third party financial institutions as counterparties. The weakening or failure of financial institution counterparties may adversely affect our hedging programs and our financial condition through, among other things, a reduction in available counterparties, increasingly unfavorable terms, and the failure of the counterparties to perform under hedging contracts.
Significant key customers or large orders may expose us to additionalOur strategic initiatives could have long-term adverse effects on our business and legal risks thatwe may not realize the operational or financial benefits from such actions.
We have implemented multiple strategic initiatives across our businesses to adjust our cost structure, and we may engage in similar activities in the future. These strategic initiatives and our regular ongoing cost reduction activities may distract management, could slow improvements in our products and services and limit our ability to increase production quickly if demand for our products increases. In addition, delays in implementing our strategic initiatives, unexpected costs or failure to meet targeted improvements may diminish the operational and financial benefits we realize from such actions. Any of the above circumstances could have a materialan adverse impacteffect on our operating resultsbusiness and financial condition.
Certain significant key customers have substantial purchasing power and leverage in negotiating contractual arrangements with us. These customers may demand contract terms that differ considerably from our standard terms and conditions. Large orders may also include severe contractual liabilities for us if we fail to provide the quantity and quality of product at the required delivery times. While we attempt to contractually limit our potential liability under such contracts, we expect to be forced to agree to some or all of these types of provisions to secure these orders and to continue to grow our business. Such actions expose us to significant additional risks which could result in a material adverse impact on our operating results and financial condition.statements.
Our business will suffer if we are not able to retain and hire key personnel.
Our future success depends partly on the continued service of our key research, engineering, sales, marketing, manufacturing, executive and administrative personnel. If we fail to retain and hire a sufficient number of these personnel, we will not be able to maintain or expand our business. The markets in which we operate are very dynamic, and our businesses continue to respond with reorganizations, workforce reductions and site closures. We believe our pay levels are very competitive within the regions that we operate. However, there is alsoan intense competition for certain highly technical specialties in geographic areas where we continue to recruit, and it may become more difficult to hire and retain our key employees, especially in light of our ongoing restructuring efforts.employees.
Our acquisitions, strategic investments and alliances, joint ventures, exiting of businesses and divestitures may result in financial results that are different than expected.
In the normal course of business, we frequently engage in discussions with third parties relating to possible acquisitions, strategic investments and alliances, joint ventures and divestitures, and generally expect to complete several transactions per year. For example in the pastIn addition, we completed various acquisitions, including Dako A/S, Halo Genomics AB and the test systems division of AT4 wireless.may decide to exit a particular business within our product portfolio. As a result of such transactions, our financial results may differ from our own or the investment community's expectations in a given fiscal quarter, or over the long term. Such transactions often have post-closing arrangements including but not limited to post-closing adjustments, transition services, escrows or indemnifications, the financial results of which can be difficult to predict. In addition, acquisitions and strategic alliances may require us to integrate a different company culture, management team and business infrastructure. We may have difficulty developing, manufacturing and marketing the products of a newly acquired company in a way that enhances the performance of our combined businesses or product lineslines. Transactions such as acquisitions have resulted, and may in the future result, in unexpected significant costs and expenses. In the future, we may be required to realizerecord charges to earnings during the period if we determine there is an impairment of goodwill or intangible assets, up to the full amount of the value from expected synergies.of the assets, or, in the case of strategic investments and alliances, consolidate results, including losses, of third parties or write down investment values or loans and convertible notes related to the strategic investment. In addition, acquisitions and strategic investments and alliances may require us to integrate and collaborate with a different company culture, management team and business infrastructure. Depending on the size and complexity of an acquisition, our successful integration of the entity depends on a variety of factors, including:
including introducing new products and meeting revenue targets as expected, the retention of key employees;
the management of facilitiesemployees and employees in different geographic areas;
the retention of key customers;
the compatibility of our sales programs and facilities with those of the acquired company; and
the compatibility of our existing infrastructure with that of an acquired company.customers.
In addition, effective internal controls are necessary for us to provide reliable and accurate financial reports and to effectively prevent fraud. The integration of acquired businesses is likely to result in our systems and internal controls becoming increasingly complex and more difficult to manage. We devote significant resources and time to comply with the internal control over financial reporting requirements of the Sarbanes-Oxley Act of 2002. However, we cannot be certain that these measures will ensure that we design, implement and maintain adequate control over our financial processes and reporting in the future, especially in the context of acquisitions of other businesses. Any difficulties in the assimilation of acquired businesses into our control system could harm our operating results or cause us to fail to meet our financial reporting obligations. Inferior internal controls could also cause investors to lose confidence in our reported financial information, which could have a negative effect on the trading price of our stock and our access to capital.
A successful divestiture depends on various factors, including our ability to:
to effectively transfer liabilities, contracts, facilities and employees to the purchaser;
purchaser, identify and separate the intellectual property to be divested from the intellectual property that we wish to keep;keep and
reduce fixed costs previously associated with the divested assets or business.
In addition, if customers of the divested business do not receive the same level of service from the new owners, this may adversely affect our other businesses to the extent that these customers also purchase other Agilent products. In exiting a business, we may still retain liabilities associated with the support and warranty of those businesses. All of these efforts
require varying levels of management resources, which may divert our attention from other business operations. Further, if market conditions or other factors lead us to change our strategic direction, we may not realize the expected value from such transactions. If we do not realize the expected benefits or synergies of such transactions, our consolidated financial position, results of operations, cash flows and stock price could be negatively impacted.
If we dofail to maintain an effective system of internal controls, we may not achievebe able to accurately report our financial results, which could lead to a loss of investor confidence in our financial statements and have an adverse effect on our stock price.
Effective internal controls are necessary for us to provide reliable and accurate financial statements and to effectively prevent fraud. We devote significant resources and time to comply with the contemplated benefitsinternal control over financial reporting requirements of the Sarbanes Oxley Act of 2002 and continue to enhance our controls. In our Annual Report on Form 10-K for our fiscal year ended October 31, 2015, management concluded that, because of a material weakness in our internal control over financial reporting related to the accounting for income taxes, our disclosure controls and procedures were not effective as of October 31, 2015. We remediated the material weakness for income tax as of October 31, 2016. However, we cannot be certain that we will be able to
prevent future significant deficiencies or material weaknesses. Inadequate internal controls could cause investors to lose confidence in our reported financial information, which could have a negative effect on investor confidence in our financial statements, the trading price of our acquisitionstock and integration ofour access to capital.
Integrating Dako A/S may be more difficult, costly or time consuming than expected and our business and financial condition may be materially impaired.
We may not achieve the desired benefits from our acquisition and integration of Dako. In addition, the operation of Dako within Agilent couldmay be a difficult, costly and time-consuming process that involves a number of risks, including, but not limited to:
our response to significant competitive pressure;
difficulties in meeting new product timelines;
the ability to grow in emerging markets;
increased exposure to certain governmental regulations and compliance requirements;
increased costs to address certain governmental regulations and compliance issues, such as the U.S. Food and Drug Administration (“FDA”) warning letter received in August 2013 which has now been lifted by the FDA;
increased costs and use of resources; and
difficulties in the assimilation of different corporate cultures, practices and sales and distribution methodologies, as well as in the assimilation and retention of geographically dispersed, decentralized operations and personnel;personnel.
increased exposure to certain governmental regulations and compliance requirements;
the potential loss of key personnel who choose not to remain with Dako or Agilent;
the potential loss of key customers or suppliers who choose not to do business with the combined business; and
the use of cash resources and increased capital expenditures on additional investment or research and development activities in excess of our current expectations, which could offset any synergies resulting from the Dako acquisition and limit other potential uses of our cash, including stock repurchases and retirement of outstanding debt.
Even if we are able to successfully operate Dako within Agilent, we may not be able to realize the revenue and other synergies and growth that we anticipateanticipated from the acquisition in the time frame that we currently expect,expected, and the costs of achieving these benefits may be higher than what we currently expect, because of a number of risks, including, but not limited to:
the possibility that the acquisition may not further our business strategy as we expected;
the possibility that we may not be able to expand the reach and customer base for Dako current and future products as expected;
the possibility that we may not be able to expand the reach and customer base for Agilent products as expected;
the possibility that the carrying amounts of goodwill and other purchased intangible assets may not be recoverable;
and
the fact that the acquisition will substantially expand our diagnostics business, and we may not experience anticipated growth in that market.
expected. As a result, of these risks, the Dako acquisition and integration may not contribute to our earnings as expected, we may not achieve expected revenue synergies or our return on invested capitaloperating margin targets when expected, or at all, and we may not achieve the other anticipated strategic and financial benefits of this transaction.
The impact of consolidation and acquisitions of competitors is difficult to predict and may harm our business.
The electronic measurement and life sciences industries are intensely competitive and have been subject to increasing consolidation. For instance, Danaher Corporation completed its acquisition of IRIS International in November 2012; Thermo Fisher Scientific announced its acquisition of Life Technologies in April 2013 and completed its acquisitions of Doe & Ingalls in May 2012 and One Lambda in September 2012; and PerkinElmer completed its acquisition of Haoyuan Biotech in November 2012. Consolidation in our industries could result in existing competitors increasing their market share through business combinations and result in stronger competitors, which could have a material adverse effect on our business, financial condition and results of operations. We may not be able to compete successfully in increasingly consolidated industries and cannot predict with certainty how industry consolidation will affect our competitors or us.
Our customers and we are subject to various governmental regulations, compliance with or changes in such regulations may cause us to incur significant expenses, and if we fail to maintain satisfactory compliance with certain regulations, we may be forced to recall products and cease their manufacture and distribution, and we could be subject to civil or criminal penalties.
Our customers and we are subject to various significant international, federal, state and local regulations, including but not limited to regulations in the areas of health and safety, packaging, product content, employment, labor and immigration, import/export regulations.controls, trade restrictions and anti-competition. These regulations are complex, change frequently and have tended to become more stringent over time. We may be required to incur significant expenses to comply with these regulations or to remedy any violations of these regulations. Any failure by us to comply with applicable government regulations could also result in the cessation of our operations or portions of our operations, product recalls or impositions of fines and restrictions on our ability to carry on or expand our operations. In addition, because many of our products are regulated or sold into regulated industries, we must comply with additional regulations in marketing our products. We develop, configure and
market our products to meet customer needs created by these regulations. Any significant change in these regulations could reduce demand for our products, force us to modify our products to comply with new regulations or increase our costs of producing these products. If demand for our products is adversely affected or our costs increase, our business would suffer.
Our products and operations are also often subject to the rules of industrial standards bodies, like the International Standards Organization, as well as regulation by other agencies such as the U.S. Federal Communications Commission.FDA. We also must comply with work safety rules. If we fail to adequately address any of these regulations, our businesses could be harmed.
We are subject to extensive regulation by the FDA and certain similar foreign regulatory agencies, and failure to comply with such regulations could harm our reputation, business, financial condition and results of operations.
A number of our products are subject to regulation by the FDA and certain similar foreign regulatory agencies. In addition, a number of our products may in the future be subject to regulation by the FDA and certain similar foreign regulatory agencies. These regulations govern a wide variety of product-related activities, from quality management, design and development to labeling, manufacturing, promotion, sales and distribution. If we or any of our suppliers or distributors fail to comply with FDA and other applicable regulatory requirements or are perceived to potentially have failed to comply, we may face, among other things, warning letters, adverse publicity affecting both us and our customers; investigations or notices of non-compliance, fines, injunctions, and civil penalties; import or export restrictions; partial suspensions or total shutdown of production facilities or the imposition of operating restrictions; increased difficulty in obtaining required FDA clearances or approvals or foreign equivalents; seizures or recalls of our products or those of our customers; or the inability to sell our products. Any such FDA or other regulatory
agency actions could disrupt our business and operations, lead to significant remedial costs and have a material adverse impact on our financial position and results of operations.
Some of our chemical analysis and life sciences and diagnostics products are exposedsubject to particularparticularly complex regulations such as regulations of toxic substances and medical devices, and failure to comply with such regulations could harm our business.
Some of our chemical analysis products and related consumables marketed by our chemical analysis and life sciences and diagnostics businesses are used in conjunction with chemicals whose manufacture, processing, distribution and notification requirements are regulated by the U.S. Environmental Protection Agency (“EPA”) under the Toxic Substances Control Act, and by regulatory bodies in other countries withunder similar laws. The Toxic Substances Control Act regulations govern, among other similar things, the testing, manufacture, processing and distribution of chemicals, the testing of regulated chemicals for their effects on human health and safety and import and export of chemicals. The Toxic Substances Control Act prohibits persons from manufacturing any chemical in the U.S.United States that has not been reviewed by EPA for its effect on health and safety, and placed on an EPA inventory of chemical substances. We must conformensure conformance of the manufacturing, processing, distribution of and notification about these chemicals to these laws and adapt to regulatory requirements in all applicable countries as these requirements change. If we fail to comply with the notification, record-keeping and other requirements in the manufacture or distribution of our products, then we could be madesubject to pay civil penalties, face criminal prosecution and, in some cases, be prohibitedprohibition from distributing or marketing our products until the products or component substances are brought into compliance.
A number of our products from our chemical analysis and life sciences and diagnostics businesses are subject to regulation by the United States Food and Drug Administration ("FDA") and certain similar foreign regulatory agencies. In addition, a number of our products may be in the future subject to regulation by the FDA and certain similar foreign regulatory agencies. These regulations govern a wide variety of product related activities, from quality management, design and development to labeling, manufacturing, promotion, sales and distribution. If we or any of our suppliers or distributors fail to comply with FDA and other applicable regulatory requirements or are perceived to potentially have failed to comply, we may face, among other things, adverse publicity affecting both us and our customers; investigations or notices of non-compliance, fines, injunctions, and civil penalties; import or export restrictions; partial suspensions or total shutdown of production facilities or the imposition of operating restrictions; increased difficulty in obtaining required FDA clearances or approvals; seizures or recalls of our products or those of our customers; or the inability to sell our products.
Our business may suffer if we fail to comply with government contracting laws and regulations.
We derive a portion of our revenuesrevenue from direct and indirect sales to U.S., state, local, and foreign governments and their respective agencies. Such contracts are subject to various procurement laws and regulations, and contract provisions relating to their formation, administration and performance. Failure to comply with these laws, regulations or provisions in our government contracts could result in the imposition of various civil and criminal penalties, termination of contracts, forfeiture of profits, suspension of payments, or suspension from future government contracting. On March 4, 2013, we made a report to the Inspector General of the Department of Defense regarding pricing irregularities relating to certain sales of electronic measurement products to U.S. government agencies. See Item 3. "Legal Proceedings". If our government contracts are terminated, if we are suspended from government work, or if our ability to compete for new contracts is adversely affected, our business could suffer.
Dependence on contract manufacturingOur retirement and outsourcing other portions of our supply chain maypost retirement pension plans are subject to financial market risks that could adversely affect our ability to bring products to marketfuture results of operations and damage our reputation. Dependence on outsourced information technology and other administrative functions may impair our ability to operate effectively.cash flows.
As partWe have significant retirement and post retirement pension plan assets and obligations. The performance of the financial markets and interest rates impact our efforts to streamline operationsplan expenses and to cut costs, we outsource aspectsfunding obligations. Significant decreases in market interest rates, decreases in the fair value of plan assets and investment losses on plan assets will increase our manufacturing processesfunding obligations, and other functions and continue to evaluate additional outsourcing. If our contract manufacturers or other outsourcers fail to perform their obligations in a timely manner or at satisfactory quality levels, our ability to bring products to market and our reputation could suffer. For example, during a market upturn, our contract manufacturers may be unable to meet our demand requirements, which may preclude us from fulfilling our customers' orders on a timely basis. The ability of these manufacturers to perform is largely outside of our control. Additionally, changing or replacing our contract manufacturers or other outsourcers could cause disruptions or delays. In addition, we outsource significant portions of our information technology ("IT") and other administrative
functions. Since IT is critical to our operations, any failure to perform on the part of our IT providers could impair our ability to operate effectively. In addition to the risks outlined above, problems with manufacturing or IT outsourcing could result in lower revenues, unexecuted efficiencies, andadversely impact our results of operations and cash flows.
The impact of consolidation and acquisitions of competitors is difficult to predict and may harm our stock price. Much of our outsourcing takes place in developing countriesbusiness.
The life sciences industry is intensely competitive and as a result, may behas been subject to geopolitical uncertainty.increasing consolidation. Consolidation in our industries could result in existing competitors increasing their market share through business combinations and result in stronger competitors, which could have a material adverse effect on our business, financial condition and results of operations. We may not be able to compete successfully in increasingly consolidated industries and cannot predict with certainty how industry consolidation will affect our competitors or us.
If we are unable to successfully manage the consolidation and streamlining of our manufacturing operations, we may not achieve desired efficiencies and our ability to deliver products to our customers could be disrupted.
Although we utilize manufacturing facilities throughout the world, we have been consolidating, and may continue to consolidate, our manufacturing operations to certain of our plants to achieve efficiencies and gross margin improvements. Additionally, we typically consolidate the production of products from our acquisitions into our supply chain and manufacturing processes, which are technically complex and require expertise to operate. If we are unable to establish processes to efficiently and effectively produce high quality products in the consolidated locations, we may not achieve the anticipated synergies and production may be disrupted, which could adversely affect our business and operating results.
Our operating results may suffer if our manufacturing capacity does not match the demand for our products.
Because we cannot immediately adapt our production capacity and related cost structures to rapidly changing market conditions, when demand does not meet our expectations, our manufacturing capacity will likelymay exceed our production requirements. If, during a general market upturn or an upturn in one of our segments, we cannot increase our manufacturing capacity to meet
product demand, we willmay not be able to fulfill orders in a timely manner which could lead to order cancellations, contract breaches or indemnification obligations. This inability could materially and adversely limit our ability to improve our results. By contrast, if during an economic downturn we had excess manufacturing capacity, then our fixed costs associated with excess manufacturing capacity would adversely affect our income, margins, and operating results.
Demand for someDependence on contract manufacturing and outsourcing other portions of our supply chain, including logistics and third-party package delivery services, may adversely affect our ability to bring products to market and damage our reputation. Dependence on outsourced information technology and other administrative functions may impair our ability to operate effectively.
As part of our efforts to streamline operations and to cut costs, we outsource aspects of our manufacturing processes and other functions and continue to evaluate additional outsourcing. If our contract manufacturers or other outsourcers fail to perform their obligations in a timely manner or at satisfactory quality levels, our ability to bring products to market and our reputation could suffer. For example, during a market upturn, our contract manufacturers may be unable to meet our demand requirements, which may preclude us from fulfilling our customers' orders on a timely basis. The ability of these manufacturers to perform is largely outside of our control. If one or more of the third-party package delivery providers experiences a significant disruption in services or institutes a significant price increase, we may have to seek alternative providers, our costs could increase and the delivery of our products and services depends on capital spending policiescould be prevented or delayed. Additionally, changing or replacing our contract manufacturers, logistics providers or other outsourcers could cause disruptions or delays. In addition, we outsource significant portions of our customersinformation technology ("IT") and on government funding policies.
Our customers include pharmaceutical companies, laboratories, universities, healthcare providers, government agencies and public and private research institutions. Fluctuations in the research and development budgets at these organizations could have a significant effectother administrative functions. Since IT is critical to our operations, any failure to perform on the demand forpart of our products and services. Many factors, including public policy spending priorities, available resources, mergers and consolidation, spending priorities, institutional and governmental budgetary policies and product and economic cycles, have a significant effect onIT providers could impair our ability to operate effectively. In addition to the capital spending policies of these entities. These policiesrisks outlined above, problems with manufacturing or IT outsourcing could result in turn can have a significant effect on the demand for our products and services. If demand for our products and services is adversely affected, ourlower revenue and operatingunexecuted efficiencies, and impact our results would suffer.of operations and our stock price. Much of our outsourcing takes place in developing countries and, as a result, may be subject to geopolitical uncertainty.
Environmental contamination from past operations could subject us to unreimbursed costs and could harm on-site operations and the future use and value of the properties involved, and environmental contamination caused by ongoing operations could subject us to substantial liabilities in the future.
SomeCertain properties transferred to Keysight Technologies, Inc. (“Keysight”) as part of our propertiesthe separation are undergoing remediation by theHP Inc. and Hewlett-Packard Company ("HP"Enterprise (formerly Hewlett-Packard Company) (together "HP") for subsurface contaminations that were known at the time of our separation from HP. HP has agreed to retain the liability for this subsurface contamination, perform the required remediation and indemnify usKeysight with respect to claims arising out of that contamination. HP will have access to ourthose Keysight properties to perform remediation. While HP has agreed to minimize interference with on-site operations at those properties, remediation activities and subsurface contamination may require usKeysight to incur unreimbursed costs and could harm on-site operations and the future use and value of the properties. We cannot be sure that Keysight will not seek additional reimbursement from us for that interference or unreimbursed costs. We cannot be sure that HP will continue to fulfill its indemnification or remediation obligations.obligations, in which case Keysight may seek indemnification from us. In addition, the determination of the existence and cost of any additional contamination caused by us prior to the separation could involve costly and time-consuming negotiations and litigation.
WeOther than those properties currently undergoing remediation by HP, we have agreed to indemnify HP, forwith respect to any liability associated with contamination from past operations, and Keysight, with respect to any liability associated with contamination prior to the separation, at, all otherrespectively, properties transferred from HP to us other than thoseand properties currently undergoing remediationtransferred by HP.us to Keysight. While we are not aware of any material liabilities associated with any potential subsurface contamination at any of those properties, subsurface contamination may exist, and we may be exposed to material liability as a result of the existence of that contamination.
Our current and historical manufacturing processes involve, or have involved, the use of substances regulated under various international, federal, state and local laws governing the environment. As a result, we may become subject to liabilities for environmental contamination, and these liabilities may be substantial. While we have divested substantially all of our semiconductor related businesses to Avago Technologies Ltd. and VerigyAdvantest Corporation and regardless of indemnification arrangements with those parties, we may still become subject to liabilities for historical environmental contamination related to those businesses. Although our policy is to apply strict
standards for environmental protection at our sites inside and outside the U.S.,United States, even if the sites outside the U.S.United States are not subject to regulations imposed by foreign governments, we may not be aware of all conditions that could subject us to liability.
As part of our acquisition of Varian, Inc. (“Varian”) we assumed the liabilities of Varian, including Varian's costs and potential liabilities for environmental matters. One such cost is our obligation, along with the obligation of Varian Semiconductor Equipment Associates, Inc. ("VSEA") (under the terms of a Distribution Agreement between Varian, VSEA andto each indemnify Varian Medical Systems, Inc. ("VMS")(“VMS”) to each indemnify VMS for one-third of certain costs (after adjusting for any insurance proceeds and tax benefits recognized or realized by VMS for such costs) relating to (a) environmental
investigation, monitoring and/or remediation activities at certain facilities previously operated by Varian Associates, Inc. ("VAI") and third-party claims made in connection with environmental conditions at those facilities, and (b) U.S. Environmental Protection AgencyEPA or third-party claims alleging that VAI or VMS is a potentially responsible party under the Comprehensive Environmental Response Compensation and Liability Act of 1980, as amended, ("CERCLA") in connection with certain sites to which VAI allegedly shipped manufacturing waste for recycling, treatment or disposal (the "CERCLA sites"). With respect to the facilities formerly operated by VAI, VMS is overseeing the environmental investigation, monitoring and/or remediation activities, in most cases under the direction of, or in consultation with, federal, state and/or local agencies, and handling third-party claims. VMS is also handling claims relating to the CERCLA sites.disposal. Although any ultimate liability arising from environmental- relatedenvironmental-related matters could result in significant expenditures that, if aggregated and assumed to occur within a single fiscal year, could be material to our financial statements, the likelihood of such occurrence is considered remote.unlikely. Based on information currently available and our best assessment of the ultimate amount and timing of environmental-related events, management believes that the costs of environmental-related matters are unlikely to have a material adverse effect on our financial condition or results of operations.
New regulationsRegulations related to “conflict minerals” may cause us to incur additional expenses and could limit the supply and increase the cost of certain metals used in manufacturing our products.
On August 22, 2012,We are subject to the SEC adopted a new rule requiringrules of the Securities and Exchange Commission (“SEC”) which require disclosures by public companies of specified minerals, known as conflict minerals, that are necessary to the functionality or production of products manufactured or contracted to be manufactured. The new rule, which went into effect for calendar year 2013 and requires aan annual disclosure report to be filed with the SEC by May 31, 2014, will require31st of each year, requires companies to perform due diligence, disclose and report whether or not such minerals originate from the Democratic Republic of Congo or an adjoining country. There are costs associated with complying with these disclosure requirements, including for diligence in regards to the sources of any conflict minerals used in our products, in addition to the cost of remediation and other changes to products, processes, or sources of supply as a consequence of such verification activities. In addition, our ongoing implementation of these rules could adversely affect the sourcing, supply, and pricing of materials used in our products. The new rule could affect sourcing at competitive prices and availability in sufficient quantities of certain minerals used in the manufacture of our products, including tin, tantalum, gold and tungsten. The number of suppliers who provide conflict-free minerals may be limited. In addition, there may be material costs associated with complying with the disclosure requirements, such as costs related to the due diligence process of determining the source of certain minerals used in our products, as well as costs of possible changes to products, processes, or sources of supply as a consequence of such verification activities. As our supply chain is complex and we use contract manufacturers for some of our products, we may not be able to sufficiently verify the origins of the relevant minerals used in our products through the due diligence procedures that we implement, which may harm our reputation. We may also encounter challenges to satisfy those customers who require that all of the components of our products be certified as conflict-free, which could place us at a competitive disadvantage if we are unable to do so.
Our retirement and post retirement pension plans are subject to financial market risks that could adversely affect our future results of operations and cash flows.
We have significant retirement and post retirement pension plans assets and obligations. The performance of the financial markets and interest rates impact our plan expenses and funding obligations. Significant decreases in market interest rates, decreases in the fair value of plan assets and investment losses on plan assets will increase our funding obligations, and adversely impact our results of operations and cash flows.
Third parties may claim that we are infringing their intellectual property and we could suffer significant litigation or licensing expenses or be prevented from selling products or services.
From time to time, third parties may claim that one or more of our products or services infringe their intellectual property rights. We analyze and take action in response to such claims on a case by case basis. Any dispute or litigation regarding patents or other intellectual property could be costly and time-consuming due to the complexity of our technology and the uncertainty of intellectual property litigation and could divert our management and key personnel from our business operations. A claim of intellectual property infringement could force us to enter into a costly or restrictive license agreement, which might not be available under acceptable terms or at all, could require us to redesign our products, which would be costly and time-consuming, and/or could subject us to significant damages or to an injunction against the development and sale of certain of our products or services. Our intellectual property portfolio may not be useful in asserting a counterclaim, or negotiating a license, in response to a claim
of intellectual property infringement. In certain of our businesses we rely on third party intellectual property licenses and we cannot ensure that these licenses will continue to be available to us in the future on favorable terms or at all.
Third parties may infringe our intellectual property and we may suffer competitive injury or expend significant resources enforcing our rights.
Our success depends in large part on our proprietary technology, including technology we obtained through acquisitions. We rely on various intellectual property rights, including patents, copyrights, trademarks and trade secrets, as well as confidentiality provisions and licensing arrangements, to establish our proprietary rights. If we do not enforce our intellectual property rights successfully our competitive position may suffer which could harm our operating results.
Our pending patent applications, and our pending copyright and trademark registration applications, may not be allowed or competitors may challenge the validity or scope of our patents, copyrights or trademarks. In addition, our patents, copyrights, trademarks and other intellectual property rights may not provide us a significant competitive advantage.
We may need to spend significant resources monitoring our intellectual property rights and we may or may not be able to detect infringement by third parties. Our competitive position may be harmed if we cannot detect infringement and enforce our
intellectual property rights quickly or at all. In some circumstances, we may choose to not pursue enforcement because an infringer has a dominant intellectual property position or for other business reasons. In addition, competitors might avoid infringement by designing around our intellectual property rights or by developing non-infringing competing technologies. Intellectual property rights and our ability to enforce them may be unavailable or limited in some countries which could make it easier for competitors to capture market share and could result in lost revenues. Furthermore, some of our intellectual property is licensed to others which allow them to compete with us using that intellectual property.
We are subject to ongoingChanges in tax laws, unfavorable resolution of tax examinations, of ouror exposure to additional income tax returns by the Internal Revenue Service and other tax authorities. An adverse outcome of any such audit or examination by the IRS or other tax authorityliabilities could have a material adverse effect on our results of operations, financial condition and liquidity.
We are subject to income taxes in both the U.S. and various foreign jurisdictions. Governments in the jurisdictions in which we operate implement changes to tax laws and regulations from time to time. Any changes in corporate income tax laws relating to transfer pricing or repatriation of capital, any changes in the interpretation of existing tax laws and regulations, or any implementation of tax laws relating to proposals to curb base erosion and profit shifting or proposals for fundamental U.S. and foreign corporate tax reform, could lead to increases in overall tax liability, which could materially impact our effective tax rate and have a significant adverse impact on our results of operations. We are also subject to ongoing tax examinations of our tax returns by the U.S. Internal Revenue Service and other tax authorities in various jurisdictions. We regularly assess the likelihood of adverse outcomes resulting from ongoing tax examinations to determine the adequacy of our provision for income taxes. These assessments can require considerable estimatesa high degree of judgment and judgments.estimation. Intercompany transactions associated with the sale of inventory, services, intellectual property and cost share arrangements are complex and affect our tax liabilities. The calculation of our tax liabilities involves dealing with uncertainties in the application of complex tax laws and regulations in multiple jurisdictions. There can be no assurance that the outcomes from ongoing tax examinations will not have an adverse effect on our operating results and financial condition. A difference in the ultimate resolution of tax uncertainties from what is currently estimated could have an adverse effect on our operating results and financial condition.
If tax incentives change or cease to be in effect, our income taxes could increase significantly.
Agilent benefits from tax incentives extended to its foreign subsidiaries to encourage investment or employment. Several jurisdictions have granted Agilent tax incentives which require renewal at various times in the future. The incentives are conditioned on achieving various thresholds of investments and employment, or specific types of income. Agilent's taxes could increase if the incentives are not renewed upon expiration. If Agilent cannot or does not wish to satisfy all or parts of the tax incentive conditions, we may lose the related tax incentive and could be required to refund tax incentives previously realized. As a result, our effective tax rate could be higher than it would have been had we maintained the benefits of the tax incentives.
We have substantial cash requirements in the United States while most of our cash is generated outside of the United States. The failure to maintain a level of cash sufficient to address our cash requirements in the United States could adversely affect our financial condition and results of operations.
Although the cash generated in the United States from our operations coversshould cover our normal operating requirements and debt service requirements, a substantial amount of additional cash is required for special purposes such as the maturity of our debt obligations, our stock repurchase program, our declared dividends and acquisitions of third parties. Our business operating results, financial condition, and strategic initiatives could be adversely impacted if we were unable to address our U.S. cash requirements through the efficient and timely repatriations of overseas cash or other sources of cash obtained at an acceptable cost.
We have outstanding debt and may incur other debt in the future, which could adversely affect our financial condition, liquidity and results of operations.
We currently have outstanding an aggregate principal amount of $2.6$1.9 billion in senior unsecured notes and a $46 million secured mortgage.notes. We also are a party to a five-year senior unsecured revolving credit facility which expires in October 2016 andSeptember 2019. On June 9, 2015, we increased the commitments under which we may borrow up to $400the existing credit facility by $300 million so that the aggregate commitments under the facility now total $700 million and retained a Danish Krone denominatedprovision that allows us to further increase commitments to the credit facility equivalentby $300 million in the aggregate, subject to $9 million.certain conditions. As of October 31, 2016, we had no borrowings outstanding under the facility. We may borrow additional amounts in the future and use the proceeds from any future borrowing for general corporate purposes, other future acquisitions, expansion of our business or repurchases of our outstanding shares of common stock.
Our incurrence of this debt, and increases in our aggregate levels of debt, may adversely affect our operating results and financial condition by, among other things:
increasing our vulnerability to downturns in our business, to competitive pressures and to adverse economic and industry conditions;
requiring the dedication of an increased portion of our expected cash flows from operations to service our indebtedness, thereby reducing the amount of expected cash flowflows available for other purposes, including capital expenditures, acquisitions, stock repurchases and stock repurchases;dividends; and
limiting our flexibility in planning for, or reacting to, changes in our business and our industry.
Our current revolving credit facility imposes restrictions on us, including restrictions on our ability to create liens on our assets and the ability of our subsidiaries to incur indebtedness, and requires us to maintain compliance with specified financial ratios. Our ability to comply with these ratios may be affected by events beyond our control. In addition, the indenture governing our senior notes contains covenants that may adversely affect our ability to incur certain liens or engage in certain types of sale and leaseback transactions. If we breach any of the covenants and do not obtain a waiver from the lenders, then, subject to applicable cure periods, our outstanding indebtedness could be declared immediately due and payable.
If we suffer a loss to our factories, facilities or distribution system due to catastrophe, our operations could be seriously harmed.
Our factories, facilities and distribution system are subject to catastrophic loss due to fire, flood, terrorism or other natural or man-made disasters. In particular, several of our facilities could be subject to a catastrophic loss caused by earthquake due to their locations. Our production facilities, headquarters and Agilent Technologies Laboratories in California, and our production facilities in Japan, are all located in areas with above-average seismic activity. If any of these facilities were to experience a catastrophic loss, it could disrupt our operations, delay production, shipments and revenue and result in large expenses to repair or replace the facility. If such a disruption were to occur, we could breach agreements, our reputation could be harmed, and our business and operating results could be adversely affected. In addition, since we have consolidated our manufacturing facilities, we are more likely to experience an interruption to our operations in the event of a catastrophe in any one location. Although we carry insurance for property damage and business interruption, we do not carry insurance or financial reserves for interruptions or potential losses arising from earthquakes or terrorism. Also, our third party insurance coverage will vary from time to time in both type and amount depending on availability, cost and our decisions with respect to risk retention. Economic conditions and uncertainties in global markets may adversely affect the cost and other terms upon which we are able to obtain third party insurance. If our third party insurance coverage is adversely affected, or to the extent we have elected to self-insure, we may be at a greater risk that our operations will be harmed by a catastrophic loss.
If we experience a significant disruption in, or breach in security of, our information technology systems, or if we fail to implement new systems and software successfully, our business could be adversely affected.
We rely on several centralized information technology systems throughout our company to provide products and services, keep financial records, process orders, manage inventory, process shipments to customers and operate other critical functions. Our information technology systems may be susceptible to damage, disruptions or shutdowns due to power outages, hardware failures, computer viruses, attacks by computer hackers, telecommunication failures, user errors, catastrophes or other unforeseen events. Our information technology systems also may experience interruptions, delays or cessations of service or produce errors in connection with system integration, software upgrades or system migration work that takes place from time to time. If we were to experience a prolonged system disruption in the information technology systems that involve our interactions with customers or suppliers, it could result in the loss of sales and customers and significant incremental costs, which could adversely affect our business. In addition, security breaches of our information technology systems could result in the misappropriation or unauthorized disclosure of confidential information belonging to us or to our employees, partners, customers or suppliers, which could result in our suffering significant financial or reputational damage.
Adverse conditions in the global banking industry and credit markets may adversely impact the value of our cash investments or impair our liquidity.
As of October 31, 2013,2016, we had cash and cash equivalents of approximately $2.68 billion$2,289 million invested or held in a mix of money market funds, time deposit accounts and bank demand deposit accounts. Disruptions in the financial markets may, in some cases, result in an inability to access assets such as money market funds that traditionally have been viewed as highly liquid. Any failure of our counterparty financial institutions or funds in which we have invested may adversely impact our cash and cash equivalent positions and, in turn, our results and financial condition.
We could incur significant liability if the distribution of Keysight common stock to our shareholders is determined to be a taxable transaction.
We have received an opinion from outside tax counsel to the effect that the separation and distribution of Keysight qualifies as a transaction that is described in Sections 355(a) and 368(a)(1)(D) of the Internal Revenue Code. The opinion relies on certain facts, assumptions, representations and undertakings from Keysight and us regarding the past and future conduct of the companies’ respective businesses and other matters. If any of these facts, assumptions, representations or undertakings are incorrect or not satisfied, our shareholders and we may not be able to rely on the opinion of tax counsel and could be subject to significant tax liabilities. Notwithstanding the opinion of tax counsel, we have received, the IRS could determine on audit that the separation is taxable if it determines that any of these facts, assumptions, representations or undertakings are not correct or have been violated or if it disagrees with the conclusions in the opinion. If the separation is determined to be taxable for U.S. federal income tax purposes, our shareholders that are subject to U.S. federal income tax and we could incur significant U.S. federal income tax liabilities.
We may be exposed to claims and liabilities as a result of the separation with Keysight.
We entered into a separation and distribution agreement and various other agreements with Keysight to govern the separation and the relationship of the two companies going forward. These agreements provide for specific indemnity and liability obligations and could lead to disputes between us. The indemnity rights we have against Keysight under the agreements may not be sufficient to protect us. In addition, our indemnity obligations to Keysight may be significant and these risks could negatively affect our financial condition.
We cannot assure you that we will continue to pay dividends on our common stock.
Since the first quarter of fiscal year 2012, we have paid a quarterly dividend on our common stock. The timing, declaration, amount and payment of any future dividends fall within the discretion of our Board of Directors and will depend on many factors, including our available cash, estimated cash needs, earnings, financial condition, operating results, capital requirements, as well as limitations in our contractual agreements, applicable law, regulatory constraints, industry practice and other business considerations that our Board of Directors considers relevant. A change in our dividend program could have an adverse effect on the market price of our common stock.
Item 1B. Unresolved Staff Comments
None.
Item 2. Properties
As of October 31, 20132016 we owned or leased a total of approximately 10.65.6 million square feet of space worldwide. Of that, we owned approximately 8.14.1 million square feet and leased the remaining 2.51.5 million square feet. Our sales and support facilities occupied a total of approximately 1.30.7 million square feet. Our manufacturing plants, R&D facilities and warehouse and administrative facilities occupied approximately 9.34.9 million square feet. All of our businesses share sales offices throughout the world.
Information about each of our businesses appears below:
Life Sciences & DiagnosticsApplied Markets Group.Our life sciences and diagnostics business has manufacturing and R&D facilities in Singapore, Malaysia, Denmark, Germany, Poland, U.K. and the U.S.
Chemical Analysis Group. Our chemical analysis measurementapplied markets business has manufacturing and R&D facilities in Australia, China, Germany, Italy, Malaysia, Italy, Japan, Netherlands, U.K.Singapore, United Kingdom and the U.S.United States.
Electronic MeasurementDiagnostics and Genomics Group. Our electronic measurementdiagnostics and genomics business has manufacturing and R&D facilities in China,Denmark, Germany, Japan, Malaysia Singapore, India and the U.S.
Agilent CrossLab Group. Our Agilent CrossLab business has manufacturing and R&D facilities in Australia, China, Germany, Japan, Netherlands, United Kingdom and the United States.
Item 3. Legal Proceedings
We are involved in lawsuits, claims, investigations and proceedings, including, but not limited to, patent,intellectual property, commercial and environmentalemployment matters, which arise in the ordinary course of business. There are no matters pending that we currently
believe are probable or reasonably possible of having a material impact to our business, consolidated financial condition, results of operations or cash flows.
On March 4, 2013, we made a report to the Inspector General of the Department of Defense (“DOD IG”) regarding pricing irregularities relating to certain sales of electronic measurement products to U.S. government agencies. We have conducted a thorough investigation with the help of external counsel, and we have approached the DOD IG with a proposed methodology for resolving possible overcharges to U.S. government purchasers resulting from these sales. Based on our investigation and our interactions with the DOD IG, we do not believe that this matter is reasonably possible of having a material impact on Agilent's financial condition, results of operations or cash flows. As of October 31, 2013, we have accrued for this matter based on our current understanding.
As part of routine internal audit activities, the Company determined that certain employees of Agilent's subsidiaries in China did not comply with the Company's Standards of Business Conduct and other policies. Based on those findings, the Company has initiated an internal investigation, with the assistance of outside counsel, relating to certain sales of our products through third party intermediaries in China. The internal investigation includes a review of compliance by our employees in China with the requirements of the U.S. Foreign Corrupt Practices Act and other applicable laws and regulations. On September 5, 2013, the Company voluntarily contacted the United States Securities and Exchange Commission and United States Department of Justice to advise both agencies of this internal investigation. We will cooperate with any government investigation of this matter. At this point, we cannot predict or estimate the duration, scope, cost, or result of this matter, or whether the government will commence any legal action, which could result in possible fines and penalties, criminal or civil sanctions, or other consequences. Accordingly, no provision with respect to these matters has been made in the Company's consolidated financial statements. Adverse findings or other negative outcomes from any governmental proceedings could have a material impact on the Company's consolidated financial statements in future periods.
Item 4. Mine Safety Disclosures
Not applicable.
PART II
Item 5. Market for the Registrant's Common Equity, Related Stockholder Matters and Issuer Purchases of Equity Securities
Our common stock is listed on the New York Stock Exchange with the ticker symbol “A”. The following table sets forth the high and low sale prices and the dividend declarations per quarter for the 20122015 and 20132016 fiscal years as reported in the consolidated transaction reporting system for the New York Stock Exchange:
|
| | | | | | | | | |
| Fiscal 2012 | | High | Low | Dividends |
| First Quarter (ended January 31, 2012) | $ | 44.85 |
| $ | 32.51 |
| $0.10 |
| Second Quarter (ended April 30, 2012) | $ | 46.28 |
| $ | 39.15 |
| N/A |
| Third Quarter (ended July 31, 2012) | $ | 43.27 |
| $ | 35.32 |
| $0.10 |
| Fourth Quarter (ended October 31, 2012) | $ | 40.97 |
| $ | 35.38 |
| $0.10 |
| | | | |
| Fiscal 2013 | | High | Low | Dividends |
| First Quarter (ended January 31, 2013) | $ | 45.55 |
| $ | 35.45 |
| $0.22 |
| Second Quarter (ended April 30, 2013) | $ | 45.66 |
| $ | 40.19 |
| N/A |
| Third Quarter (ended July 31, 2013) | $ | 47.47 |
| $ | 41.24 |
| $0.12 |
| Fourth Quarter (ended October 31, 2013) | $ | 53.47 |
| $ | 45.32 |
| $0.12 |
| | | | |
|
| | | | | | | | | | | | |
| Fiscal 2015 | High | | Low | | Dividends |
| First Quarter (ended January 31, 2015) | | $ | 42.99 |
| | $ | 37.68 |
| | $ | 0.10 |
|
| Second Quarter (ended April 30, 2015) | | $ | 43.59 |
| | $ | 37.71 |
| | $ | 0.10 |
|
| Third Quarter (ended July 31, 2015) | | $ | 42.93 |
| | $ | 38.48 |
| | $ | 0.10 |
|
| Fourth Quarter (ended October 31, 2015) | | $ | 41.35 |
| | $ | 33.12 |
| | $ | 0.10 |
|
| | | | | | | |
| Fiscal 2016 | | High | | Low | | Dividends |
| First Quarter (ended January 31, 2016) | | $ | 42.48 |
| | $ | 36.01 |
| | $ | 0.115 |
|
| Second Quarter (ended April 30, 2016) | | $ | 42.00 |
| | $ | 34.15 |
| | $ | 0.115 |
|
| Third Quarter (ended July 31, 2016) | | $ | 48.18 |
| | $ | 40.39 |
| | $ | 0.115 |
|
| Fourth Quarter (ended October 31, 2016) | | $ | 48.63 |
| | $ | 43.11 |
| | $ | 0.115 |
|
As of December 1, 2013,2016, there were 30,05424,949 common stockholders of record.
During fiscal 2013,2016, we issued four quarterly dividends one of $0.10 per share and three of $0.12$0.115 per share. All decisions regarding the declaration and payment of dividends are at the discretion of our Board of Directors and will be evaluated regularly in light of our financial condition, earnings, growth prospects, funding requirements, applicable law, and any other factors that our Board deems relevant. The information required by this item with respect to equity compensation plans is included under the caption Equity Compensation Plans in our proxy statement for the annual meeting of stockholders to be held March 19, 2014,15, 2017, to be filed with the Securities and Exchange Commission pursuant to Regulation 14A, and is incorporated herein by reference.
STOCK PRICE PERFORMANCE GRAPH
The graph below shows the cumulative total stockholder return on our common stock with the cumulative total return of the S&P 500 Index; our Current Peer Group Index (a) and our Old Peer Group Index (b) assuming an initial investment of $100 on October 31, 2011 and the reinvestment of all dividends. We have selected Danaher Corporation to replace the entire S&P Industrials Sector as we believe Danaher more closely matches our company characteristics than the majority of the companies included in the S&P Industrials Sector, which was previously included in the Old Peer Group Index. Agilent’s stock price performance shown in the following graph is not indicative of future stock price performance. The data for this performance graph was compiled for us by Standard and Poor’s.
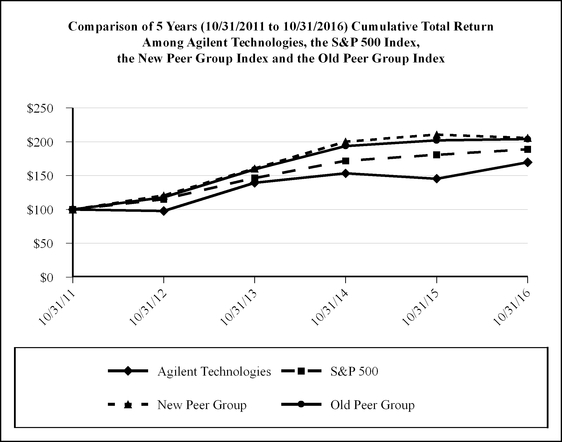
|
| | | | | | |
| | | | INDEXED RETURNS | |
| | Base | | Years Ending | | |
| | Period | | | | | |
| Company Name / Index | 10/31/11 | 10/31/12 | 10/31/13 | 10/31/14 | 10/31/15 | 10/31/16 |
| Agilent Technologies | 100 | 97.81 | 139.39 | 153.23 | 145.42 | 169.58 |
| S&P 500 | 100 | 115.21 | 146.52 | 171.82 | 180.75 | 188.90 |
| New Peer Group | 100 | 120.61 | 160.47 | 200.11 | 210.61 | 205.57 |
| Old Peer Group | 100 | 118.15 | 159.32 | 193.66 | 201.90 | 203.76 |
(a) Our New Peer Group Index includes all companies in the S&P 500 Healthcare Sector, Materials Sector and Danaher. In July, Danaher was moved from the S&P Industrial Sector to the S&P Healthcare Sector.
(b) Our Old Peer Group Index includes all companies in the S&P 500 Healthcare Sector, Materials Sector and Industrials Sector.
(c) On November 1, 2014, we completed the spin-off of our electronic measurement business into an independent publicly traded company called Keysight Technologies, Inc. The cumulative returns of our common stock have been adjusted to reflect the spin-off.
ISSUER PURCHASES OF EQUITY SECURITIES
The table below summarizes information about the company’sCompany’s purchases, based on trade date; of its equity securities registered pursuant to Section 12 of the Exchange Act during the quarterly period ended October 31, 2013.2016. The total number of shares of common stock purchased by the companyCompany during the fiscal year ended October 31, 20132016 is 20,544,05410,829,981 shares.
|
| | | | | | | | | | | | | | |
| Period | | Total Number of Shares of Common Stock Purchased(1) | | Weighted Average Price Paid per Share of Common Stock(2) | | Total Number of Shares of Common Stock Purchased as Part of Publicly Announced Plans or Programs(1) | | Maximum Approximate Dollar Value of Shares of Common Stock that May Yet Be Purchased Under the Plans or Programs (in millions)(1) |
| | | | | | | | | |
Aug. 1, 2016 through
Aug. 31, 2016 | | — |
| | — |
| | — |
| | $ | 850 |
|
Sep. 1, 2016 through
Sep. 30, 2016 | | 447,978 |
| | 45.25 |
| | 447,978 |
| | $ | 830 |
|
Oct. 1, 2016 through
Oct. 31, 2016 | | 710,874 |
| | $ | 44.83 |
| | 710,874 |
| | $ | 798 |
|
| Total | | 1,158,852 |
| | $ | 45.00 |
| | 1,158,852 |
| | |
|
|
| | | | | | | | | | |
Period(1) | On May 28, 2015, we announced that our board of directors had approved a new share repurchase program (the "2015 repurchase program"). The 2015 repurchase program authorizes the purchase of up to $1.14 billion of our common stock through and including November 1, 2018. The 2015 repurchase program does not require the company to acquire a specific number of shares and may be suspended or discontinued at any time. All such shares and related costs, except for 150,000 shares purchased in October 2016 that had not settled as of October 31, 2016, are held as treasury stock and accounted for using the cost method. |
| Total Number of
Shares of Common
Stock Purchased(1)
| | Weighted Average
Price Paid per Share of
Common Stock(2)
| | Total
Number of
Shares of Common
Stock Purchased as
Part of Publicly
Announced Plans or
Programs(1)
| | Maximum
Approximate Dollar
Value of Shares of
Common Stock that
May Yet Be
Purchased Under the
Plans or Programs
(in millions)
|
| (2) | | (a) | | (b) | | (c) | | (d) |
Aug. 1, 2013 through
Aug. 31, 2013 | | — |
| | N/A | | — |
| | 100 |
Sep. 1, 2013 through
Sep. 30, 2013 | | — |
| | N/A | | — |
| | 100 |
Oct. 1, 2013 through
Oct. 31, 2013 | | — |
| | N/A | | — |
| | 100 |
Total | | — |
| | N/A | | — |
| | The weighted average price paid per share of common stock does not include the cost of commissions. |
(1) On January 17, 2013, we announced that our board of directors approved a share repurchase program authorizing the use of up to $500 million to repurchase shares of the Company's common stock in open market transactions, inclusive of any amounts repurchased since November 1, 2012 (the “2013 Repurchase Program”). On May 14, 2013, we announced that our board of directors authorized a $500 million increase to the 2013 Repurchase Program, bringing the cumulative authorization to $1
billion. Unless terminated earlier by the board of directors, the 2013 Repurchase Program is designed to cover purchases from November 1, 2012 through December 31, 2013, and any unused portion may be used in calendar year 2014. The 2013 Repurchase Program does not require the Company to acquire a specific number of shares and may be suspended or discontinued at any time. As of October 31, 2013, $100 million remained under the 2013 Repurchase Program. We repurchased the remaining $100 million worth of shares under the 2013 repurchase program in November 2013.
On November 22, 2013 we announced that our board of directors has authorized a new share repurchase program effective upon the conclusion of the company's existing $1 billion repurchase program. The new program is designed to reduce or eliminate dilution resulting from issuance of stock under the company's employee equity incentive programs to maintain a weighted average share count of approximately 335 million diluted shares.
(2) The weighted average price paid per share of common stock does not include the cost of commissions.
Item 6. Selected Financial Data
SELECTED FINANCIAL DATA
(Unaudited)
|
| | | | | | | | | | | | | | | | | | | |
| | Years Ended October 31, |
| | 2013 | | 2012 | | 2011 | | 2010 | | 2009 |
| | (in millions, except per share data) |
| Consolidated Statement of Operations Data: | | | (2) | | | | (1) | | |
| Net revenue | $ | 6,782 |
| | $ | 6,858 |
| | $ | 6,615 |
| | $ | 5,444 |
| | $ | 4,481 |
|
| Income before taxes | $ | 859 |
| | $ | 1,043 |
| | $ | 1,032 |
| | $ | 692 |
| | $ | 7 |
|
| Net income (loss) | $ | 724 |
| | $ | 1,153 |
| | $ | 1,012 |
| | $ | 684 |
| | $ | (31 | ) |
| Net income (loss) per share — Basic: | $ | 2.12 |
| | $ | 3.31 |
| | $ | 2.92 |
| | $ | 1.97 |
| | $ | (0.09 | ) |
| Net income (loss) per share — Diluted: | $ | 2.10 |
| | $ | 3.27 |
| | $ | 2.85 |
| | $ | 1.94 |
| | $ | (0.09 | ) |
| Weighted average shares used in computing basic net income (loss) per share | 341 |
| | 348 |
| | 347 |
| | 347 |
| | 346 |
|
| Weighted average shares used in computing diluted net income (loss) per share | 345 |
| | 353 |
| | 355 |
| | 353 |
| | 346 |
|
| Cash dividends declared per common share | $ | 0.46 |
| | $ | 0.30 |
| | — |
| | — |
| | — |
|
|
| | | | | | | | | | | | | | | | | | | |
| | Years Ended October 31, |
| | 2016 | | 2015 | | 2014 | | 2013 | | 2012 |
| | (in millions, except per share data) |
| Consolidated Statement of Operations Data: | | | | | | | | | (1) |
| Net revenue | $ | 4,202 |
| | $ | 4,038 |
| | $ | 4,048 |
| | $ | 3,894 |
| | $ | 3,543 |
|
| Income from continuing operations before taxes | $ | 544 |
| | $ | 480 |
| | $ | 229 |
| | $ | 293 |
| | $ | 237 |
|
| Income from continuing operations | $ | 462 |
| | $ | 438 |
| | $ | 232 |
| | $ | 225 |
| | $ | 353 |
|
| Income (loss) from discontinued operations, net of taxes | $ | — |
| | $ | (37 | ) | | $ | 317 |
| | $ | 509 |
| | $ | 775 |
|
| Net income | $ | 462 |
| | $ | 401 |
| | $ | 549 |
| | $ | 734 |
| | $ | 1,128 |
|
| Net income per share — basic: | | | | | | | | | |
| Income from continuing operations | $ | 1.42 |
| | $ | 1.32 |
| | $ | 0.70 |
| | $ | 0.66 |
| | $ | 1.01 |
|
| Income (loss) from discontinued operations, net of taxes | — |
| | (0.12 | ) | | 0.95 |
| | 1.49 |
| | 2.23 |
|
| Net income per share - basic | $ | 1.42 |
| | $ | 1.20 |
| | $ | 1.65 |
| | $ | 2.15 |
| | $ | 3.24 |
|
| Net income per share — diluted: | | | | | | | | | |
| Income from continuing operations | $ | 1.40 |
| | $ | 1.31 |
| | $ | 0.69 |
| | $ | 0.65 |
| | $ | 1.00 |
|
| Income (loss) from discontinued operations, net of taxes | — |
| | (0.11 | ) | | 0.93 |
| | 1.48 |
| | 2.20 |
|
| Net income per share - diluted | $ | 1.40 |
| | $ | 1.20 |
| | $ | 1.62 |
| | $ | 2.13 |
| | $ | 3.20 |
|
| Weighted average shares used in computing basic net income per share | 326 |
| | 333 |
| | 333 |
| | 341 |
| | 348 |
|
| Weighted average shares used in computing diluted net income per share | 329 |
| | 335 |
| | 338 |
| | 345 |
| | 353 |
|
| Cash dividends declared per common share | $ | 0.460 |
| | $ | 0.400 |
| | 0.528 |
| | $ | 0.460 |
| | $ | 0.300 |
|
| | | | October 31, | October 31, |
| | 2013 | | 2012 | | 2011 | | 2010 | | 2009 | 2016 | | 2015 | | 2014 | | 2013 | | 2012 |
| | (in millions) | (in millions) |
| Consolidated Balance Sheet Data: | | | (2) | | | | (1) | | | | | | | (2) | | (2) | | (1)(2) |
| Cash and cash equivalents and short-term investments | $ | 2,675 |
| | $ | 2,351 |
| | $ | 3,527 |
| | $ | 2,649 |
| | $ | 2,493 |
| $ | 2,289 |
| | $ | 2,003 |
| | $ | 2,218 |
| | $ | 2,675 |
| | $ | 2,351 |
|
| Working capital | $ | 3,381 |
| | $ | 2,736 |
| | $ | 3,732 |
| | $ | 3,086 |
| | $ | 2,838 |
| $ | 2,690 |
| | $ | 2,710 |
| | $ | 3,817 |
| | $ | 3,392 |
| | $ | 2,775 |
|
| Long-term restricted cash and cash equivalents | $ | — |
| | $ | — |
| | $ | — |
| | $ | — |
| | $ | 1,566 |
| |
| Total assets | $ | 10,686 |
| | $ | 10,536 |
| | $ | 9,057 |
| | $ | 9,696 |
| | $ | 7,612 |
| $ | 7,802 |
| | $ | 7,479 |
| | $ | 10,815 |
| | $ | 10,608 |
| | $ | 10,439 |
|
| Long-term debt | $ | 2,699 |
| | $ | 2,112 |
| | $ | 1,932 |
| | $ | 2,190 |
| | $ | 2,904 |
| $ | 1,912 |
| | $ | 1,655 |
| | $ | 1,663 |
| | $ | 2,699 |
| | $ | 2,112 |
|
| Stockholders' equity | $ | 5,286 |
| | $ | 5,182 |
| | $ | 4,308 |
| | $ | 3,228 |
| | $ | 2,506 |
| $ | 4,243 |
| | $ | 4,167 |
| | $ | 5,301 |
| | $ | 5,297 |
| | $ | 5,183 |
|
| | | | | | | | | | | | | | | | | | | |
| (1) Consolidated financial data includes Varian, acquired on May 14, 2010. | |
| (2) Consolidated financial data includes Dako, acquired on June 21, 2012 and a non-recurring tax benefit relating to the reversal of U.S. valuation allowance of $280 million. | |
| | | |
| (1) Consolidated financial data includes Dako, acquired on June 21, 2012 and a non-recurring tax benefit relating to the reversal of U.S. valuation allowance of $280 million. | | (1) Consolidated financial data includes Dako, acquired on June 21, 2012 and a non-recurring tax benefit relating to the reversal of U.S. valuation allowance of $280 million. |
| (2) The above consolidated balance sheet includes Keysight which is presented as a discontinued operation until October 31, 2014. | | (2) The above consolidated balance sheet includes Keysight which is presented as a discontinued operation until October 31, 2014. |
Item 7. Management's Discussion and Analysis of Financial Condition and Results of Operations
The following discussion should be read in conjunction with the consolidated financial statements and notes thereto included elsewhere in this Annual Report on Form 10-K. This report contains forward-looking statements including, without limitation, statements regarding trends, seasonality cyclicality and growth in, and drivers of, the markets we sell into, our strategic direction, our future effective tax rate and tax valuation allowance, earnings from our foreign subsidiaries, remediation activities,lease and site service income from Keysight, the impact of foreign currency movements on our performance, our hedging programs, indemnification, new product and service introductions, the ability of our products to meet market needs, adoption of our products, changes to our manufacturing processes, the use of contract manufacturers and out sourcing and third-party package delivery services, source and supply of materials used in our products, the impact of local government regulations on our ability to pay vendors or conduct operations, our liquidity position, our ability to generate cash from operations, growth in our businesses, our investments, including in research and development, the potential impact of adopting new accounting pronouncements, our financial results, our operating margin, our sales, our purchase commitments, our capital expenditures, our contributions to our pension plans the selection of discount rates and recognition of any gains or losses for ourother defined benefit plans, our strategic initiatives, our cost-control activities savings and headcount reduction recognized from our restructuring programs and other cost saving initiatives, uncertainties relating to Food and Drug Administration ("FDA") and other regulatory approvals, the integration of our acquisitions and other transactions, the separationimpairment of the electronic measurement business,goodwill and other intangible assets, write-down of investment values or loans and convertible notes, our stock repurchase program, our declared dividends, our transition to lower-cost regions, and the existence of economic instability, that involve risks and uncertainties. Our actual results could differ materially from the results contemplated by these forward-looking statements due to various factors, including those discussed in Part I Item 1A and elsewhere in this Form 10-K.
Overview and Executive Summary
Agilent Technologies Inc. (“we”("we", “Agilent”"Agilent" or the “company”"company"), incorporated in Delaware in May 1999, is the world's premier measurement company providing core bio-analytical and electronic measurement solutions to thea global leader in life sciences, diagnostics and genomics,applied chemical analysis, communicationsmarkets, providing application focused solutions that includes instruments, software, services and electronics industries. Our fiscal year end is October 31. Unless otherwise stated, all years and dates refer to our fiscal year.
On September 19, 2013, Agilent announced plans to separate into two publicly traded companies, one comprising ofconsumables for the life sciences, diagnostics and chemical analysis businesses that will retain the Agilent name and the other that will be comprised of the electronic measurement business ("EM"). The separation is expected to occur through a tax-free pro rata spin off of the EM company to Agilent shareholders and is expected to be completed early in November 2014. We expect to incur pre-separation expenses of $100 million in fiscal 2014.entire laboratory workflow.
In addition to the announcement to separate into two companies,November 2015, we formed a new operating segment in the fourth fiscal quarter of 2013. The new life sciences and diagnostics segment was formed by the combination of the life sciences business plus the diagnostics and genomics business. Following this reorganization, Agilent has three business segments comprised of the life sciences and diagnostics business, the chemical analysis business and the electronic measurement business. The historical segment financial information for the life sciences and diagnostics segment has been recast to conform to this new reporting structure in our financial statements.
On June 21, 2012, we completed our acquisition of Dako A/S through the acquisition of 100% of the share capital of Dako A/S,Seahorse Bioscience ("Seahorse"), a limited liability company incorporated under the laws of Denmark (“Dako”), under the share purchase agreement, dated May 16, 2012. Dako provides antibodies, reagents, scientificleader in providing instruments and software primarilyassay kits for measuring cell metabolism and bioenergetics for $242 million in cash. Seahorse's technology enables researchers to customers in pathology laboratories. Asbetter understand cell health, function and signaling, and how the cell may be impacted by the introduction of a result of the acquisition, Dako became a wholly-owned subsidiary of Agilent.specific drug, by providing real-time kinetics to unlock essential cellular bioenergetics data. The consideration paid was approximately $2,143 million, of which $1,400 million was paid directly to the seller and $743 million was paid to satisfy the outstanding debt of Dako. Agilent funded the acquisition using existing cash. The acquisition has been accounted for in accordance with the authoritative accounting guidance and thefinancial results of Dako areSeahorse have been included inwithin Agilent's consolidated financial statements from November 1, 2015.
On March 2, 2016, Agilent made a preferred stock investment in Lasergen for $80 million. Agilent’s initial ownership stake was 48 percent and we have also joined the dateboard of acquisition. The acquisitionLasergen and signed a collaboration agreement. We have the option to acquire all of Dako and its portfoliothe remaining shares of Lasergen until March 2, 2018, for additional consideration of $105 million. Lasergen is another stepa Variable Interest Entity (“VIE”), however, we do not consolidate the entity in our financial statements because we do not have the power to increase our growth in several rapidly expanding areasdirect the activities of diagnostics, including anatomic pathology and molecular diagnostics, as well as strengthen our existing offerings with a focus on product development to help in the fight against cancer. For additional details related toVIE that most significantly impact the VIE's economic performance nor are we the primary beneficiary. Because of the nature of the preferred stock of Lasergen that we own, we account for this investment under the cost method.
On August 1, 2016 we completed the acquisition of Dako, see Note 3, "Acquisitions"substantially all of the assets of iLab Solutions LLC ("iLab"), a cloud-based solutions provider for core laboratory management. iLab's offerings enables customers to easily and accurately book time in shared facilities, to bill and invoice for projects, to manage studies, to generate reports and business intelligence, and to schedule instrument reservations across multiple projects. The purchase price was $26 million in cash. The financial results of iLab have been included within Agilent's consolidated financial statements from August 1, 2016.
Agilent's total ordersnet revenue of $4,202 million in 2013 were $6,827 million, a decrease of 12016 increased 4 percent when compared to 2012.2015. Foreign currency movements for 2016 had an unfavorable impact of approximately 2 percentage points compared to 2015. Agilent's net revenue of $4,038 million was flat in 2015 when compared to 2014.
The life sciences and applied markets business brings together Agilent's analytical laboratory instrumentation and informatics. Revenue increased 1 percent in 2016 when compared to 2015. Foreign currency movements had an unfavorable impact of approximately 2 percentage points forin 2016 when compared to 2015. For the year ended October 31, 20132016 and excluding the impact of foreign currency movements, acquisitions and the NMR business our performance within the life sciences market continued to show strong revenue growth from the pharmaceutical and biotechnology markets. Within the applied markets, and excluding the impact of foreign currency movements and the NMR business, there was strong growth in both the environmental and food markets, but revenue from sales to other applied markets was weak with a decline in revenue from sales to the chemical and energy markets. Revenue decreased 2 percent in 2015 when compared to 2012. The increase in orders associated with the Dako acquisition accounted for approximately 3 percentage points of total order growth for2014. For the year ended October 31, 2013 when compared to 2012. Within our life sciences2015 and diagnostics business orders increased 16 percent in 2013 compared to 2012 with 13 percentage points of order increase attributable to the Dako acquisition. Chemical analysis orders increased 2 percent in 2013 when compared to 2012 and electronic measurement businesses orders decreased 13 percent when compared to 2012. Agilent's total orders in 2012 increased 2 percent when compared to 2011. The
increaseexcluding the impact of currency movements and the NMR business, our performance within the life sciences business showed consistent revenue growth from sales to the pharmaceutical and biotechnology market partially offset by a decrease in orders associated with the Dako acquisition accounted for 2 percentage pointsrevenue generated from sales to the life sciences research market. Within applied markets and excluding the impact of order growth forcurrency movements and the NMR business, there was weakness in the chemical and energy markets in the year ended October 31, 20122015 when compared to 2011.the prior year.
Agilent's net revenue of $6,782 million decreased 1The diagnostics and genomics business includes genomics, nucleic acid contract manufacturing and the pathology, companion diagnostics and reagent partnership businesses. Revenue increased 7 percent in 2016 when compared to 2012.2015. Foreign currency movements for 2013 had an unfavorable impact of approximately 1 percentage pointpoints in 2016 when compared to 2012. Revenue associated with2015. Excluding the Dako acquisition accounted for approximately 4 percentage pointsimpact of foreign currency movements and acquisitions, growth in revenue from sales to the revenue growth fordiagnostics and clinical markets continued to be strong, led by our companion diagnostics and genomics businesses in the year ended October 31, 20132016 when compared to 2012. Within our life sciences and diagnostics business revenue increased 16 percentthe prior year. Revenue was flat in 20132015 when compared to 2012 with 13 percentage points of2014. Excluding foreign currency movements, our growth in revenue increase attributablefrom sales to the Dako acquisition. Excluding the effects of the Dako acquisition, there was growth in demand for life sciences and diagnostics products and services led by pharmaceutical and biotechnology and clinical markets. Theremarkets was a decreasestrong in demand from the academic and government market for the year ended October 31, 2013,2015 when compared to the prior year.
The Agilent CrossLab business combines our analytical laboratory services and consumables business. Revenue increased 7 percent in 2016 when compared to 2015. Foreign currency movements had an unfavorable impact of approximately 2 percentage points in 2016 when compared to 2015. Excluding the impact of foreign currency movements and acquisitions, there was growth in sales to all key markets. The pharmaceutical and biotechnology markets led all the markets in revenue and revenue growth along with very strong revenue growth from the food markets. In addition, we saw moderate growth from the environmental market and modest revenue growth from the chemical and energy markets. Revenue increased 2 percent in 2015 when compared to 2014. Excluding the impact of foreign currency movements there was growth in sales to all key end markets, in particular, the pharmaceutical and biotechnology market in the year ended October 31, 2015 when compared to the prior year. Within ourthe applied markets revenue in chemical analysis business revenue grew 2 percent in 2013 compared with the prior year. There were modest increases in revenue from the food safety and petrochemical markets, but environmental and forensicsenergy end markets were downslower but still reported growth when compared to the prior year. Within electronic measurement, total revenue decreased when compared to the prior year by 13 percent. General purpose markets decreased with aerospace and defense flat and computer and semi-conductor markets down when compared to 2012. Also within electronic measurement, the communications test business decreasedadjusted for the year ended October 31, 2013 when compared to the prior year with wireless R&D down moderately but wireless manufacturing showing a significant shortfall compared to the prior year mostly driven by the loss of business from a large customer with whom we could not agree on contractual terms. Agilent's total net revenue in 2012 increased 4 percent when compared to 2011. The revenue increase associated with the Dako acquisition accounted for approximately 2 percentage points of revenue increase for the year ended October 31, 2012 when compared to 2011. Foreign currency movements for 2012 had an unfavorable impact of approximately 1 percentage point compared to 2011.movements.
Net income from continuing operations was $724$462 million in 20132016 compared to net income from continuing operations of $1,153$438 million and $1,012$232 million in 20122015 and 2011, respectively. In 2013, 2012 and 2011 we generated operating cash flows of $1,152 million, $1,228 million and $1,260 million,2014, respectively. As of October 31, 20132016 and 20122015 we had cash and cash equivalents balances of $2,675$2,289 million and $2,351$2,003 million, respectively.
On November 22, 2013 we announced that our board of directors had authorized a share repurchase program. The existing program is designed to reduce or eliminate dilution resulting from issuance of stock under the company's employee equity incentive programs to target maintaining a weighted average share count of approximately 335 million diluted shares. For the years ended October 31, 2016, 2015 and 2014 we repurchased 2.4 million shares for $98 million, 6 million shares for $267 million and 4 million shares for $200 million, respectively. All such shares and related costs are held as treasury stock and accounted for using the cost method.
On May 28, 2015 we announced that our board of directors had approved a new share repurchase program (the "2015 repurchase program"). The 2015 share repurchase program authorizes the purchase of up to $1.14 billion of our common stock through and including November 1, 2018. The 2015 repurchase program does not require the company to acquire a specific number of shares and may be suspended or discontinued at any time. During the year ended October 31, 2016, upon the completion of our previous repurchase program, we repurchased approximately 8.3 million shares for $336 million under this authorization. All such shares and related costs are held as treasury stock and accounted for using the cost method.
For the years ended October 31, 2016, 2015 and 2014 cash dividends of $150 million, $133 million and $176 million were paid on the company's outstanding common stock, respectively. On November 16, 2016, we declared a quarterly dividend of $0.132 per share of common stock, or approximately $43 million which will be paid on January 25, 2017 to shareholders of record as of the close of business on January 3, 2017. The timing and amounts of any future dividends are subject to determination and approval by our board of directors.
Looking forward, we expect to continue to focus on the growth of the operating margin in our businesses by simplifying our operations, differentiating product solutions and improving our customer's experience. We anticipate returning a significant proportion of our cash flow to shareholders through our dividend and share repurchase programs. End market growth outlook in today's uncertain political and economic environment is unpredictable and challenging. However, we expect continued strength in the near termpharmaceutical markets and solid growth in the food and environmental markets but we areremain uncertain about the growth in a slow-growth environment within electronic measurement which remains challenging. There are indicationsthe chemical and energy markets. The unfavorable effects of changes in foreign currency exchange rates has decreased revenue by approximately 2 percentage points for the year ended October 31, 2016. Costs and expenses, incurred in local currency, were subject to the favorable effects due to changes in foreign currency exchange rates reducing our overall net exposure. The impact of foreign currency exchange rates movements can be positive or negative in any period and is calculated by applying the prior period foreign currency exchange rates to the current year period.We anticipate that our electronic measurement business will return to a growth position next year. We expect positive trends to continuechanges in our other businesses.foreign currency exchange rates
will continue to have an unfavorable impact on our performance for the near future.
Critical Accounting Policies and Estimates
The preparation of financial statements in accordance with accounting principles generally accepted in the U.S. requires management to make estimates and assumptions that affect the amounts reported in our consolidated financial statements and accompanying notes. Management bases its estimates on historical experience and various other assumptions believed to be reasonable. Although these estimates are based on management's best knowledge of current events and actions that may impact the company in the future, actual results may be different from the estimates. An accounting policy is deemed to be critical if it requires an accounting estimate to be made based on assumptions about matters that are highly uncertain at the time the estimate is made, and if different estimates that reasonably could have been used or changes in the accounting estimate that are reasonably likely to occur could materially change the financial statements. Our critical accounting policies are those that affect our financial statements materially and involve difficult, subjective or complex judgments by management. Those policies are revenue recognition, inventory valuation, share-based compensation, retirement and post-retirement plan assumptions, valuation of goodwill and purchased intangible assets restructuring and accounting for income taxes.
Revenue recognition. We enter into agreements to sell products (hardware or software), services, and other arrangements (multiple element arrangements) that include combinations of products and services. Revenue from product sales, net of trade discounts and allowances, is recognized provided that persuasive evidence of an arrangement exists, delivery has occurred, the price is fixed or determinable, and collectability is reasonably assured. Delivery is considered to have occurred when title and risk of loss have transferred to the customer. Revenue is reduced for estimated product returns, when appropriate. For sales that include customer-specified acceptance criteria, revenue is recognized after the acceptance criteria have been met. For products that include installation, if the installation meets the criteria to be considered a separate element, product revenue is recognized upon delivery, and recognition of installation revenue occurs when the installation is complete. Otherwise, neither the product nor the installation revenue is recognized until the installation is complete. Revenue from services is deferred and recognized over the contractual period or as services are rendered and accepted by the customer. We allocate revenue to each element in our multiple-element arrangements based upon their relative selling prices. We determine the selling price for each deliverable based on a selling price hierarchy. The selling price for a deliverable is based on our vendor specific objective evidence (VSOE) if available, third-party evidence (TPE) if VSOE is not available, or estimated selling price (ESP) if neither VSOE nor TPE is available. Revenue from the sale of software products that are not required to deliver the tangible product's essential functionality are accounted for under
software revenue recognition rules. Revenue allocated to each element is then recognized when the basic revenue recognition criteria for that element have been met. The amount of product revenue recognized is affected by our judgments as to whether an arrangement includes multiple elements.
We use VSOE of selling price in the selling price allocation in all instances where it exists. VSOE of selling price for products and services is determined when a substantial majority of the selling prices fall within a reasonable range when sold separately. TPE of selling price can be established by evaluating largely interchangeable competitor products or services in standalone sales to similarly situated customers. As our products contain a significant element of proprietary technology and the solution offered differs substantially from that of competitors, it is difficult to obtain the reliable standalone competitive pricing necessary to establish TPE. ESP represents the best estimate of the price at which we would transact a sale if the product or service were sold on a standalone basis. We determine ESP for a product or service by using historical selling prices which reflect multiple factors including, but not limited to customer type, geography, market conditions, competitive landscape, gross margin objectives and pricing practices. The determination of ESP is made through consultation with and approval by management. We may modify or develop new pricing practices and strategies in the future. As these pricing strategies evolve changes may occur in ESP. The aforementioned factors may result in a different allocation of revenue to the deliverables in multiple element arrangements, which may change the pattern and timing of revenue recognition for these elements but will not change the total revenue recognized for the arrangement.
Inventory valuation. We assess the valuation of our inventory on a periodic basis and make adjustments to the value for estimated excess and obsolete inventory based upon estimates about future demand and actual usage. Such estimates are difficult to make under most economic conditions. The excess balance determined by this analysis becomes the basis for our excess inventory charge. Our excess inventory review process includes analysis of sales forecasts, managing product rollovers and working with manufacturing to maximize recovery of excess inventory. If actual market conditions are less favorable than those projected by management, additional write-downs may be required. If actual market conditions are more favorable than anticipated, inventory previously written down may be sold to customers, resulting in lower cost of sales and higher income from operations than expected in that period. In the fourth quarter of 2014, Agilent announced it is exiting the NMR business, and as a result, recorded an excess inventory charge of $30 million. For the year ended October 31, 2015 and 2016 additional excess inventory charges were recorded in respect of the exiting of the NMR business of $4 million and $2 million, respectively.
Share-based compensation. We account for share-based awards in accordance with the authoritative guidance. Under the authoritative guidance, share-based compensation expense is primarily based on estimated grant date fair value and is recognized on a straight line basis. The fair value of share-based awards for employee stock option awards was estimated using the Black-Scholes option pricing model. No stock options were granted in 2016. Shares granted under the Long-Term Performance Program based on Total Shareholders Return ("LTPP"LTPP-TSR") were valued using the Monte Carlo simulation model. The estimated fair value of restricted stock unit awards and LTPP based on Operating Margin (“LTPP-OM”) is determined based on the market price of Agilent's common stock on the date of grant adjusted for expected dividend yield. On January 17, 2012,The compensation cost for LTPP (OM) reflects the company's Boardcost of Directors approvedawards that are probable to vest at the initiationend of quarterly cash dividends to the company's shareholders. The fair value of all the awards granted prior to the declaration of quarterly cash dividend was measured based on an expected dividend yield of 0%.performance period. The Employee Stock Purchase Plan ("ESPP") allows eligible employees to purchase shares of our common stock at 85 percent of the fair market value at the purchase date. All awards granted in 2016 to our senior management employees have a one year post-vest holding restriction and the value of these awards are adjusted for this.
Both the Black-Scholes and Monte Carlo simulation fair value models require the use of highly subjective and complex assumptions, including the option's expected life and the price volatility of the underlying stock. TheNo options were granted in 2016. Due to the separation of Keysight on November 1, 2014, expected volatility for grants of options in 2015 was based on a 5.5 year average historical stock price volatility assumption was determined usingof a group of our peer companies. We believe our historical volatility prior to the separation of Keysight is no longer relevant. In developing our estimated life of our employee stock options of 5.8 years for 2014, we considered the historical volatilityoption exercise behavior of Agilent's stock option overour executive employees who were granted the most recent historical period equivalentmajority of the options in the annual grants, which we believed was representative of future behavior. See Note 4, "Share-based Compensation," to the expected life. A 10 percent increase in our estimated volatility from 39 percent to 49 percentconsolidated financial statements for our most recent employee stock option grant would generally increase the value of an award and the associated compensation cost by approximately 23 percent if no other factors were changed.
more information. For the grants awarded under the 2009 stock plan after November 1, 2010, we increased the period available to retirement eligible employees to exercise their options from three years at retirement date to the full contractual term of ten years. In developing our estimated life of our employee stock options of 5.8 years for 2011 to 2013, we considered the historical option exercise behavior of our executive employees who were granted the majority of the options in the annual grants, which we believe is representative of future behavior. See Note 4, "Share-based Compensation," to the consolidated financial statements for more information.
The assumptions used in calculating the fair value of share-based awards represent our best estimates, but these estimates involve inherent uncertainties and the application of management judgment. Although we believe the assumptions and estimates we have made are reasonable and appropriate, changes in assumptions could materially impact our reported financial results.
In the third quarter of fiscal year 2016, the company elected to early adopt new guidance that changes the accounting for certain aspects of share-based payments to employees. For additional details related to the new guidance see Note 2, "New Accounting Pronouncements."
Retirement and post-retirement benefit plan assumptions. Retirement and post-retirement benefit plan costs are a significant cost of doing business. They represent obligations that will ultimately be settled sometime in the future and therefore are subject to estimation. Pension accounting is intended to reflect the recognition of future benefit costs over the employees' average expected future service to Agilent based on the terms of the plans and investment and funding decisions. To estimate the
impact of these future payments and our decisions concerning funding of these obligations, we are required to make assumptions using actuarial concepts within the framework of accounting principles generally accepted in the U.S. Two critical assumptions are the discount rate and the expected long-term return on plan assets. Other important assumptions include, expected future salary increases, expected future increases to benefit payments, expected retirement dates, employee turnover, retiree mortality rates, and portfolio composition. We evaluate these assumptions at least annually.
The discount rate is used to determine the present value of future benefit payments at the measurement date - October 31 for both U.S. and non-U.S. plans. For 20132015 and 2012,2016, the U.S. discount rates were based on the results of matching expected plan benefit payments with cash flows from a hypothetically constructed bond portfolio and increased in 2013portfolio. In 2016, discount rates for the U.S. Plans decreased 75 basis points from the previous year. For 20132016 and 2012,2015, the discount rate for non-U.S. plans was generally based on published rates for high quality corporate bonds and remained largely unchanged.in 2016, decreased 60 basis points to 110 basis points from the previous year. If we changed our discount rate by 1 percent, the impact would be $8less than $1 million on U.S. pension expense and $23$16 million on non-U.S. pension expense. Lower discount rates increase present values of the pension benefit obligation and subsequent year pension expense; higher discount rates decrease present values of the pension benefit obligation and subsequent year pension expense.
The company uses alternate methods of amortization as allowed by the authoritative guidance which amortizes the actuarial gains and losses on a consistent basis for the years presented. For U.S. Plans, gains and losses are amortized over the average future working lifetime.lifetime of participants using the corridor method. For most Non-U.S. Plans and U.S. Post-Retirement Benefit Plans, gains and losses are amortized using a separate layer for each year's gains and losses. The expected long-term return on plan assets is estimated using current and expected asset allocations as well as historical and expected returns. Plan assets are valued at fair value. If we changed our estimated return on assets by 1 percent, the impact would be $8$4 million on U.S. pension expense and $17$7 million on non-U.S. pension expense. For 2013,2016, actual return on assets was abovebelow expectations which, along with contributions during the year, reducedincreased next year’s pension cost as well as improvedresulting in a degradation of the funded status at year end. The net
periodic pension and post-retirement benefit costs recorded in continuing operations excluding curtailments and settlements were $58$3 million in 2013, $522016, $26 million in 2012,2015 and $58$15 million in 2011.2014. The year ended October 31, 2016, included a $16 million gain on curtailment and settlement.
Goodwill and purchased intangible assets.Purchased Intangible Assets. Agilent reviews goodwill for impairment annually during our fourth fiscal quarter and whenever events or changes in circumstances indicate the carrying value may not be recoverable. As defined inUnder the authoritative guidance a reporting unit is an operating segment, or one level below an operating segment. We aggregated components of an operating segment thatwe have similar economic characteristics into our reporting units. At the time of an acquisition, we assign goodwill to the reporting unit that is expected to benefit from the synergies of the combination. In the fourth quarter of 2013, we combined the life sciences and diagnostics and genomics segments to form the life sciences and diagnostics segment. As a result, Agilent now has three segments, life sciences and diagnostics, chemical analysis, and electronic measurement segments.
In September 2011, the FASB approved changes to the goodwill impairment guidance which are intended to reduce the cost and complexity of the annual impairment test. The changes provide entities an option to perform a qualitative assessment to determine whether further impairment testing is necessary. The revisedaccounting standard gives an entity the option to first assess qualitative factors to determine whether performing the current two-step test is necessary. If an entity believes, as a result of its qualitative assessment, that it is more-likely-than-not (i.e. >greater than 50% chance) that the fair value of a reporting unit is less than its carrying amount, the quantitative impairment test will be required. Otherwise, no further testing will be required.
The revised guidance includes examples of events and circumstances that might indicate that a reporting unit's fair value is less than its carrying amount. These include macro-economic conditions such as deterioration in the entity's operating environment or industry or market considerations; entity-specific events such as increasing costs, declining financial performance, or loss of key personnel; or other events such as an expectation that a reporting unit will be sold or a sustained decrease in the stock price on either an absolute basis or relative to peers.
The qualitative indicators replace those previously used to determine whether an interim goodwill impairment test is required. Agilent opted to early adopt this guidance for the year ended October 31, 2011.
If it is determined, as a result of the qualitative assessment, that it is more-likely-than-not that the fair value of a reporting unit is less than its carrying amount, the provisions of authoritative guidance require that we perform a two-step impairment test on goodwill. In the first step, we compare the fair value of each reporting unit to its carrying value. The second step (if necessary) measures the amount of impairment by applying fair-value-based tests to the individual assets and liabilities within each reporting unit. As defined in the authoritative guidance, a reporting unit is an operating segment, or one level below an operating segment. We aggregate components of an operating segment that have similar economic characteristics into our reporting units.
In fiscal year 2013,2016, we assessed goodwill impairment for our fourthree reporting units which consisted of twothree segments: chemical analysis and electronic measurement; and two reporting units under the life sciences and applied markets, diagnostics segment. The first of these two reporting units related to our life sciences business and the second related to our diagnostics business.genomics and Agilent CrossLab. We performed a qualitative test for goodwill impairment of the following three reporting units, as of September 30, 2013: the chemical analysis
segment, the electronic measurement segment, and the reporting unit relating to life sciences.2016. Based on the results of our qualitative testing, we believe that it is more-likely-than-not that the fair value of these reporting units are greater than their respective carrying values. We performed a quantitative test for goodwill impairment of the reporting unit related to our diagnostics business as of September 30, 2013. Based on the results of our quantitative testing, the fair value was significantly in excess of the carrying value. There was no impairment of goodwill during the years ended October 31, 2013, 2012 and 2011. Each quarter we review the events and circumstances to determine if goodwill impairment is indicated. There was no impairment of goodwill during the years ended October 31, 2016, 2015 and 2014.
Purchased intangible assets consist primarily of acquired developed technologies, proprietary know-how, trademarks, and customer relationships and are amortized using the best estimate of the asset's useful life that reflect the pattern in which the economic benefits are consumed or used up or a straight-line method over estimated useful lives ranging from 6 months to 15 years. In-process research and development (IPR&D)("IPR&D") is initially capitalized at fair value as an intangible asset with an indefinite life and assessed for impairment thereafter. When the IPR&D project is complete, it is reclassified as an amortizable purchased intangible asset and is amortized over its estimated useful life. If an IPR&D project is abandoned, Agilent will record a charge for the value of the related intangible asset to Agilent's consolidated statement of operations in the period it is abandoned.
In July 2012, the FASB simplified the guidance for testing for impairment of indefinite-lived intangible assets other than goodwill. The changes are intended to reduce compliance costs. Agilent's indefinite-lived intangible assets are IPR&D intangible assets. The revisedaccounting guidance allows a qualitative approach for testing indefinite-lived intangible assets for impairment, similar to the issued impairment testing guidance for goodwill. Itgoodwill and allows the option to first assess qualitative factors (events and circumstances) that could affecthave affected the significant inputs used in determining the fair value of the indefinite-lived intangible asset. The qualitative factors assist in determiningasset to determine whether it is more likelymore-likely-than-not (i.e. greater than not (meaning a likelihood of more than 50 percent)50% chance) that the indefinite-lived intangible asset is impaired. An organization may choose to bypass the qualitative assessment for any indefinite-lived intangible asset in any period and proceed directly to calculating its fair value. The amendments are effectiveWe performed a qualitative test for annualimpairment of indefinite-lived intangible assets as of September 30, 2016. Based on the results of our qualitative testing, we believe that it is more-likely-than-not that the fair value of these indefinite-lived intangible assets is greater than their respective carrying values. Each quarter we review the events and interimcircumstances to determine if impairment tests performed for fiscalof indefinite-lived intangible asset is indicated. In the years beginning after September 15, 2012. Early adoption was permitted. Agilent adopted this guidance forended October 31, 2016, 2015 and 2014, we recorded an impairment of $4 million, $3 million and $4 million, respectively, due to the cancellation of certain IPR&D projects. In addition, in the year ended October 31, 2012. Based on the quantitative test,2014, we also recorded an impairment of $1 million in 2013 and an impairment of $1 million in 2012, both relating to IPR&D projects that were abandoned. In all other instances we used the qualitative test and concluded that it was more likely than not that all other indefinite-lived intangible assets were not impaired. No impairments were recorded in 2011.
We continually monitor events and changes in circumstances that could indicate carrying amounts of long-lived assets, including purchased intangible assets, may not be recoverable. When such events or changes in circumstances occur, we assess the recoverability of long-lived assets by determining whether the carrying value of such assets will be recovered through undiscounted expected future cash flows. If the total of the undiscounted future cash flows is less than the carrying amount of those assets, we recognize an impairment loss based on the excess of the carrying amount over the fair value of the assets. In 2013, we recorded $1$12 million of impairmentsimpairment of other intangibles related to cancellation of an in-process research and development project. We also recorded $3 million of impairments related to other long-lived assets in 2013. In 2012, we recorded $1 million of impairments of other intangibles relateddue to the cancellation of an in-process research and development project. We also recorded $1 of impairments related to other long-lived assets in 2012. We performed impairment analyses of purchased intangible assets in 2011 and recorded $3 million of impairment charges primarily related to a business where we ceased operations. We also recorded $8 million of impairments related to other long-lived assets in 2011.
Restructuring. The main componentexit of our restructuring plan is related to workforce reductions. Workforce reduction charges are accrued when payment of benefits becomes probable that the employees are entitled to the severance and the amounts can be estimated. If the amounts and timing of cash flows from restructuring activities are significantly different from what we have estimated, the actual amount of restructuring and other related charges could be materially different, either higher or lower, than those we have recorded.NMR business.
Accounting for income taxes.We must make certain estimates and judgments in determining income tax expense for financial statement purposes. These estimates and judgments occur in the calculation of tax credits, benefits and deductions, and in the calculation of certain tax assets and liabilities which arise from differences in the timing of recognition of revenue and expense for tax and financial statement purposes, as well as interest and penalties related to uncertain tax positions. Significant changes to these estimates may result in an increase or decrease to our tax provision in a subsequent period.
Significant management judgment is also required in determining whether deferred tax assets will be realized in full or in part. When it is more-likely-than-not that all or some portion of specific deferred tax assets such as net operating losses or foreign tax credit carryforwards will not be realized, a valuation allowance must be established for the amount of the deferred tax assets
that cannot be realized. We consider all available positive and negative evidence on a jurisdiction-by-jurisdiction basis when assessing whether it is more likely than not that deferred tax assets are recoverable. We consider evidence such as our past operating results, the existence of losses in recent years and our forecast of future taxable income. In the fourth quarter of fiscal 2012 we released the valuation allowance for the majority of our U.S. deferred tax assets. At October 31, 2013,2016, we continue to recognize
a valuation allowance for certain U.S. and U.S state and foreign deferred tax assets. We intend to maintain a valuation allowance in these jurisdictions until sufficient positive evidence exists to support its reversal.
We have not provided for all U.S. federal income and foreign withholding taxes on the undistributed earnings of some of our foreign subsidiaries because we intend to reinvest such earnings indefinitely. Should we decide to remit this income to the U.S. in a future period, our provision for income taxes will increase materially in that period.
The calculation of our tax liabilities involves dealing with uncertainties in the application of complex tax law and regulations in a multitude of jurisdictions. Although the guidance on the accounting for uncertainty in income taxes prescribes the use of a recognition and measurement model, the determination of whether an uncertain tax position has met those thresholds will continue to require significant judgment by management. In accordance with the guidance on the accounting for uncertainty in income taxes, for all U.S. and other tax jurisdictions, we recognize potential liabilities for anticipated tax audit issues based on our estimate of whether, and the extent to which, additional taxes and interest will be due. The ultimate resolution of tax uncertainties may differ from what is currently estimated, which could result in a material impact on income tax expense. If our estimate of income tax liabilities proves to be less than the ultimate assessment, a further charge to expense would be required. If events occur and the payment of these amounts ultimately proves to be unnecessary, the reversal of the liabilities would result in tax benefits being recognized in the period when we determine the liabilities are no longer necessary. We include interest and penalties related to unrecognized tax benefits within the provision for income taxes on the consolidated statements of operations.
As a part of our accounting for business combinations, intangible assets are recognized at fair values and goodwill is measured as the excess of consideration transferred over the net estimated fair values of assets acquired. Impairment charges associated with goodwill are generally not tax deductible and will result in an increased effective income tax rate in the period that any impairment is recorded. Amortization expenses associated with acquired intangible assets are generally not tax deductible and therefore deferred tax liabilities have been recorded for non-deductible amortization expenses as a part of the accounting for business combinations.
Adoption of New Pronouncements
See Note 2, "New Accounting Pronouncements," to the consolidated financial statements for a description of new accounting pronouncements.
Restructuring
In the second quarter of 2013, we accrued for a targeted restructuring program that is expected to reduce Agilent's total headcount by approximately 450 regular employees, representing approximately 2 percent of our global workforce. The timing and scope of workforce reductions will vary based on local legal requirements. When completed, the restructuring program is expected to result in an approximately $50 million reduction in annual cost of sales and operating expenses. In addition we have been streamlining our manufacturing operations. As part of this action, we anticipate the reduction of approximately 250 positions to reduce our annual cost of sales.
For the year ended October 31, 2013 we accrued $53 million associated with the headcount reductions. Within the U.S, we have substantially completed these restructuring activities. Internationally, we expect to complete the majority of these restructuring activities by the end of the second half of fiscal 2014. As of October 31, 2013, approximately 250 employees were terminated and $29 million was paid under the targeted restructuring program and 100 employees were terminated under the streamlining of manufacturing.
Foreign Currency
Our revenues, costs and expenses, and monetary assets and liabilities are exposed to changes in foreign currency exchange rates as a result of our global operating and financing activities. The unfavorable effects of changes in foreign currency exchange rates has decreased revenue by approximately 2 percentage points for the year ended October 31, 2016 and 6 percentage points for the year ended October 31, 2015. Costs and expenses, incurred in local currency, were subject to the favorable effects due to changes in foreign currency exchange rates for the years ended October 31, 2016 and 2015, reducing our overall net exposure. The impact of foreign currency exchange rates movements can be positive or negative in any period and is calculated by applying the prior period foreign currency exchange rates to the current year period. We hedge revenues, expenses and balance sheet exposures that are not denominated in the functional currencies of our subsidiaries on a short term and anticipated basis. We do experience some fluctuations within individual lines of the consolidated statement of operations and balance sheet because our hedging program is not designed to offset the currency movements in each category of revenues, expenses, monetary assets and liabilities. Our hedging program is designed to hedge currency movements on a relatively short-term basis (up to a rolling twelve monthtwelve-month period). Therefore, we are exposed to currency fluctuations over the longer term. To the extent that we are required to pay for all, or portions, of an acquisition price in foreign currencies, Agilent may enter into foreign exchange contracts to reduce the risk that currency movements will impact the U.S. dollar cost of the transaction.
Results from Operations
Orders and Net Revenue
| | | | Years Ended October 31, | | 2013 over 2012
% Change | | 2012 over 2011
% Change | Years Ended October 31, | | 2016 over 2015
% Change | | 2015 over 2014% Change |
| | 2013 | | 2012 | | 2011 | | 2016 | | 2015 | | 2014 | |
| | (in millions) | | | | | (in millions) | | | | |
| Orders | $ | 6,827 |
| | $ | 6,877 |
| | $ | 6,769 |
| | (1)% | | 2% | |
| Net revenue: | | | | | | | | | | | | | | | | | | |
| Products | $ | 5,534 |
| | $ | 5,659 |
| | $ | 5,482 |
| | (2)% | | 3% | $ | 3,227 |
| | $ | 3,146 |
| | $ | 3,185 |
| | 3% | | (1)% |
| Services and other | $ | 1,248 |
| | $ | 1,199 |
| | $ | 1,133 |
| | 4% | | 6% | $ | 975 |
| | $ | 892 |
| | $ | 863 |
| | 9% | | 4% |
| Total net revenue | $ | 6,782 |
| | $ | 6,858 |
| | $ | 6,615 |
| | (1)% | | 4% | $ | 4,202 |
| | $ | 4,038 |
| | $ | 4,048 |
| | 4% | | — |
| | | | Years Ended October 31, | | 2013 over 2012
Ppts Change | | 2012 over 2011
Ppts Change | Years Ended October 31, | | 2016 over 2015
Ppts Change | | 2015 over 2014
Ppts Change |
| | 2013 | | 2012 | | 2011 | | 2016 | | 2015 | | 2014 | |
| % of total net revenue: | | | | | | | | | | | | | | | | | | |
| Products | 82 | % | | 83 | % | | 83 | % | | (1) ppt | | — | 77 | % | | 78 | % | | 79 | % | | (1) ppt | | (1) ppt |
| Services and other | 18 | % | | 17 | % | | 17 | % | | 1 ppt | | — | 23 | % | | 22 | % | | 21 | % | | 1 ppt | | 1 ppt |
| Total | 100 | % | | 100 | % | | 100 | % | | | | | 100 | % | | 100 | % | | 100 | % | | | | |
In general, recorded orders represent firm purchase commitments from our customers with established terms and conditions for products and services that will be delivered within six months. Agilent's total ordersnet revenue of $4,202 million in 2013 were $6,827 million, a decrease of 1October 31, 2016 increased 4 percent when compared to 2012.2015. Foreign currency movements for 2016 had an unfavorable impact of approximately 2 percentage points compared to 2015. Agilent's net revenue of $4,038 million was flat in 2015 when compared to 2014.
Services and other revenue includes revenue generated from servicing our installed base of products, warranty extensions and consulting including companion diagnostics. Services and other revenue increased 9 percent in 2016 as compared to 2015. The service and other revenue growth is impacted by a portion of the revenue being driven by the current and previously installed product base. Service and other revenue increased due to increased service contract repairs, compliance services and preventative maintenance, and strong companion diagnostics revenue. Services and other revenue increased 4 percent in 2015 as compared to 2014.
Net Revenue By Segment
|
| | | | | | | | | | | | | | | |
| | Years Ended October 31, | | 2016 over 2015
% Change | | 2015 over 2014% Change |
| | 2016 | | 2015 | | 2014 | |
| | (in millions) | | | | |
| Net revenue by segment: | | | | | | | | | |
| Life sciences and applied markets | $ | 2,073 |
| | $ | 2,046 |
| | $ | 2,078 |
| | 1% | | (2)% |
| Diagnostics and genomics | $ | 709 |
| | $ | 662 |
| | $ | 663 |
| | 7% | | — |
| Agilent CrossLab | $ | 1,420 |
| | $ | 1,330 |
| | $ | 1,307 |
| | 7% | | 2% |
| Total net revenue | $ | 4,202 |
| | $ | 4,038 |
| | $ | 4,048 |
| | 4% | | — |
The life sciences and applied markets business brings together Agilent's analytical laboratory instrumentation and informatics. Revenue increased 1 percent in 2016 when compared to 2015. Foreign currency movements had an unfavorable impact of approximately 2 percentage points forin 2016 when compared to 2015. For the year ended October 31, 20132016 and excluding the impact of foreign currency movements, acquisitions and the NMR business our performance within the life sciences market continued to show strong revenue growth from the pharmaceutical and biotechnology markets. Within the applied markets, and excluding the impact of foreign currency movements and the NMR business, there was strong growth in both the environmental and food markets, but revenue from sales to other applied markets was weak with a decline in revenue from sales to the chemical and energy markets. Revenue decreased 2 percent in 2015 when compared to 2012. The increase in orders associated with the Dako acquisition accounted for approximately 3 percentage points of total order growth for2014. For the year ended October 31, 2013 when compared to 2012. Within2015 and excluding the impact of currency movements and the NMR business, our performance within the life sciences and diagnostics business orders increased 16 percent in 2013 compared to 2012 with 13 percentage points of order increase attributableshowed consistent revenue growth from sales to the Dako acquisition. Chemical analysis orders increased 2 percentpharmaceutical and biotechnology market partially offset by a decrease in 2013 when comparedthe revenue generated from sales to 2012the life sciences research market. Within applied markets and electronic measurement businesses orders decreased 13 percent when compared to 2012. Agilent's total ordersexcluding the impact of currency movements and the NMR business, there was weakness in 2012 increased 2 percent when compared to 2011. The increasethe chemical and energy markets in orders associated with the Dako acquisition accounted for 2 percentage points of order growth for the year ended October 31, 20122015 when compared to 2011. Within our life sciencesthe prior year.
The diagnostics and genomics business includes genomics, nucleic acid contract manufacturing and the pathology, companion diagnostics business ordersand reagent partnership businesses. Revenue increased due to the Dako acquisition and were flat7 percent in chemical analysis and electronic measurement2016 when compared to 2011.
Agilent's net revenue of $6,782 million decreased 1 percent when compared to 2012.2015. Foreign currency movements for 2013 had an unfavorable impact of approximately 1 percentage pointpoints in 2016 when compared to 2012. Revenue associated with2015. Excluding the Dako acquisition accounted for approximately 4 percentage pointsimpact of foreign currency movements and acquisitions, growth in revenue from sales to the revenue growth fordiagnostics and clinical research markets continued to be strong, led by our companion diagnostics and genomics businesses in the year ended October 31, 20132016 when compared to 2012. Within our life sciences and diagnostics business revenue increased 16 percentthe prior year. Revenue was flat in 20132015 when compared to 2012 with 13 percentage points of2014. Excluding foreign currency movements, our growth in revenue increase attributablefrom sales to the Dako acquisition. Excluding the effects of the Dako acquisition, there was growth in demand for life sciences and diagnostics products and services led by pharmaceutical and biotechnology and clinical markets. Theremarkets was a decreasestrong in demand from the academic and government market for the year ended October 31, 2013,2015 when compared to the prior year.
The Agilent CrossLab business combines our analytical laboratory services and consumables business. Revenue increased 7 percent in 2016 when compared to 2015. Foreign currency movements had an unfavorable impact of approximately 2 percentage points in 2016 when compared to 2015. Excluding the impact of foreign currency movements and acquisitions, there was growth in sales to all key markets. The phamaceutical and biotechnology markets led all the markets in revenue and revenue growth along with very strong revenue growth from the food markets. In addition, we saw moderate growth from the environmental market and modest revenue growth from the chemical and energy markets. Revenue increased 2 percent in 2015 when compared to 2014. Excluding the impact of foreign currency movements there was growth in sales to all key end markets, in particular, the pharmaceutical and biotechnology market in the year ended October 31, 2015 when compared to the prior year. Within ourthe applied markets revenue in chemical analysis business revenue grew 2 percent in 2013 compared with the prior year. There were modest increases in revenue from the food safety and petrochemical markets, but environmental and forensicsenergy end markets were downslower but still reported growth when compared to the prior year. Within electronic measurement, total revenue decreased when compared to the prior year by 13 percent. General purposes markets decreased with aerospace and defense flat and computer and semi-conductor markets down when compared to 2012. Also within electronic measurement, the communications test business decreasedadjusted for the year ended October 31, 2013 when compared to the prior year with wireless R&D down moderately but wireless manufacturing showing a significant shortfall compared to the prior year mostly driven by the loss of business from a large customer with whom we could not agree on contractual terms. Agilent's total net revenue in 2012 increased 4 percent when compared to 2011. The revenue increase associated with the Dako acquisition accounted for approximately 2 percentage points of revenue increase for the year ended October 31, 2012 when compared to 2011. Foreign currency movements for 2012 had an unfavorable impact of approximately 1 percentage point compared to 2011. Note 21, "Segment Information" shows a reconciliation between segment revenue and net revenue.
Services and other revenue include revenue generated from servicing our installed base of products, warranty extensions and consulting. Services and other revenue increased 4 percent in 2013 as compared to 2012. The service and other revenue growth is higher than product revenue growth due to a portion of the revenue being driven more by the previously installed base than current period product sales. Services and other revenue increased 6 percent in 2012 as compared to 2011.
Backlogmovements.
Backlog represents the amount of revenue expected from orders that have already been booked, including orders for goods and services that have not been delivered to customers, orders invoiced but not yet recognized as revenue, and orders for goods that were shipped but not invoiced, awaiting acceptance by customers.
On October 31, 2013, our unfilled backlog for the electronic measurement business was approximately $760 million, as compared to approximately $800 million at October 31, 2012. On October 31, 2013, our unfilled backlog for the chemical analysis business was approximately $380 million, as compared to approximately $360 million at October 31, 2012. Within our life sciences and diagnostics business, our unfilled backlog was approximately $520 million on October 31, 2013 as compared to approximately $530 million at October 31, 2012. We expect that a majority of the unfilled backlog for all three businesses will be delivered to customers within six months. On average, our unfilled backlog represents approximately three months' worth of revenues. We believe backlog on any particular date, while indicative of short-term revenue performance, is not necessarily a reliable indicator of medium or long-term revenue performance.
Costs and Expenses
| | | | Years Ended October 31, | | 2013 over 2012
Change | | 2012 over 2011
Change | Years Ended October 31, | | 2016 over 2015
Change | | 2015 over 2014
Change |
| | 2013 | | 2012 | | 2011 | | 2016 | | 2015 | | 2014 | |
| Gross margin on products | 53.5 | % | | 53.9 | % | | 54.9 | % | | — | | (1) ppt | 54.6 | % | | 52.5 | % | | 50.8 | % | | 2 ppts | | 2 ppts |
| Gross margin on services and other | 46.2 | % | | 46.1 | % | | 45.9 | % | | — | | — | 44.5 | % | | 43.8 | % | | 41.6 | % | | 1 ppt | | 2 ppts |
| Total gross margin | 52.1 | % | | 52.6 | % | | 53.3 | % | | — | | (1) ppt | 52.3 | % | | 50.5 | % | | 48.8 | % | | 2 ppts | | 2 ppts |
| Operating margin | 14.0 | % | | 16.3 | % | | 16.2 | % | | (2) ppts | | — | 14.6 | % | | 12.9 | % | | 10.4 | % | | 2 ppts | | 3 ppts |
| | | (in millions) | | | | | | | | | | | | | | | | | | |
| Research and development | $ | 704 |
| | $ | 668 |
| | $ | 649 |
| | 5% | | 3% | $ | 329 |
| | $ | 330 |
| | $ | 358 |
| | — | | (8)% |
| Selling, general and administrative | $ | 1,880 |
| | $ | 1,817 |
| | $ | 1,809 |
| | 3% | | —% | $ | 1,253 |
| | $ | 1,189 |
| | $ | 1,199 |
| | 5% | | (1)% |
In 2013, totalTotal gross margin was flat in comparison to 2012. Increased costs, in particular, intangible amortization fromfor the acquisition of Dako, restructuring expenses and inventory charges were offset by a decrease in variable and incentive pay. In 2012, total gross margin decreased 1 percentage point in comparison to 2011. The unfavorable impact of product mix,year ended October 31, 2016 increased intangible amortization related to the Dako acquisition were offset by lower variable and incentive pay. Operating margins in 2013 decreased 2 percentage points when compared to 2012last year. Increases in total gross margins for the year ended October 31, 2016 were as a result of the exit of the NMR business, several margin improvement initiatives, lower logistics costs, lower costs to address the now lifted FDA warning letter offset by increased operating expenses associated withwages and variable pay. Total gross margins for the Dako acquisition, includingyear ended October 31, 2015 increased 2 percentage points when compared the prior year. Increases in total gross margins for the year ended October 31, 2015 were the result of lower intangible asset amortization, restructuring costs, higher wagesfavorable product mix and increased inventory chargesimproved manufacturing efficiencies partially offset by lower variable and incentive pay. Operating margins in 2012 were flat when compared to 2011. This was the resultimpact of maintaining cost control through a decrease in variable and incentive pay while absorbing increases in expenditure from Dakounfavorable currency movements and wage increases.
Total operating margin increased 2 percentage points for the year ended October 31, 2016, when compared to last year. Operating margins increased due to improvements in gross margin and the impact of an employee pension curtailment gain offset by the increased acquisition and integrations costs, the impairment charge for investment-related loans and increased wages and variable pay. Total operating margins increased 3 percentage points for the year ended October 31, 2015, when compared to last year. Operating margins improved due to increased gross margins and reduced expenses on lower revenue compared to last year.
Gross inventory charges, included in continuing operations, were $48$20 million in 2013 and2016, $30 million in 20122015 and 2011.$46 million in 2014. Sales of previously written down inventory, included in continuing operations, were $7$9 million in 2013 and $52016, $13 million in 20122015 and 2011.$8 million in 2014.
Our research and development efforts focus on potential new products and product improvements covering a wide variety of technologies, none of which is individually significant to our operations. We conduct five types of research and development: basic research, foundation technologies, communications, life sciences and measurement. Our research seeks to improve on various technical competencies in electronics, software, systems and solutions, life sciences and photonics.diagnostics. In each of these research fields, we conduct research that is focused on specific product development for release in the short-term as well as other research that is intended to be the foundation for future products over a longer time-horizon. SomeMost of our product development research is designed to improve on the more than 20,000 products already in production, focus on major new product releases, and develop new product segments for the future. Due to
the breadth of research and development projects across all of our businesses, there are a number of drivers of this expense. We remain committed to invest significantly in research and development and have focused our development efforts on key strategic opportunities to align our business with available markets and position ourselves to capture market share.
Research and development expenses was relatively flat for the year ended October 31, 2016 when compared with last year. Research and development expenditures increased 5 percent in 2013 compared to 2012. Increased expenditure was due to our continued investment in new productby a $4 million in-process research and development and technologies, increased costs due to Dako, restructuring costs and wage increases, partially(IPR&D) impairment charge mostly offset by lower variable and incentive pay.the impact of an employee pension curtailment gain. Research and development expenditures increased 3expenses decreased 8 percent in 2012for the year ended October 31, 2015 when compared to 2011. Increasedwith last year. R&D expenditure wasdecreased due to increased costs due to Dakothe impact of foreign currency movements, savings from the exit from the NMR business and transformation initiatives, offset by lower variable and incentive pay. We remain committed to invest approximately 10 percent of revenues in research and development and have focused our development efforts on key strategic opportunities in order to align our business with available markets and position ourselves to capture market share.wage increases.
Selling, general and administrative expenses increased 35 percent in 20132016 compared to 2012. Increases were due to the acquisition of Dako, including amortization of intangible assets, wage increases and investments in sales channel coverage in emerging geographies and restructuring costs offset by decreases in variable and incentive pay.2015. Selling, general and administrative expenses were flatincreased due to acquisition and integration costs related to recently acquired businesses, higher wages and variable pay and an impairment charge related to equity method investment loans offset by the impact of an employee pension curtailment gain. Selling, general and administrative expenses decreased 1 percent in 2012 when2015 compared to 2011. Increases2014. There were increases in expenditure mostly due to the acquisitionimpact of Dako, wage increases, higher commissions and investments in sales channel coveragecosts associated with business improvement and transformation initiatives more than offset by decreasesfavorable foreign currency movements and the decline in variable and incentive pay and lower commissions.NMR expenses due to the exiting of that business together with a decrease in pre separation expenses related to the separation of Keysight.
Interest expense for the years ended October 31, 2013, 20122016, 2015 and 20112014 was $107$72 million, $101$66 million and $86$110 million, respectively, and relates to the interest charged on our senior notes and the amortization of the deferred loss recorded upon termination of the forward starting interest rate swap contracts offset by the amortization of deferred gains recorded upon termination of interest rate swap contracts. The decrease in interest expense in 2015 compared with 2014 is due to debt redemptions as part of the debt repositioning as a result of the separation of the Keysight business.
At October 31, 2013,2016, our headcount was approximately 20,60012,500 compared to 20,50011,800 in 20122015.
Other income (expense), net
For the year ended October 31, 2016 other income (expense), net includes an $18 million expense related to the impairment of an investment and 18,700$12 million of income in 2011. A significant proportionrespect of the increaseprovision of certain site service costs to, and lease income from, Keysight. The costs associated with these services are reported within income from operations. Agilent expects to receive lease income and site service income from Keysight over the next 3-4 years of approximately $12 million per year. For the year ended October 31, 2015, other income (expense), net included $25 million of income in headcount in 2012 compared with 2011 was duerespect of the provision of certain IT and site service costs to, and lease income from, Keysight. For the Dako acquisition.year ended October 31, 2014 other income (expense) net, included a net loss on the early redemption of senior notes of $89 million.
Income Taxes
|
| | | | | | | | | | | |
| | Years Ended October 31, |
| | 2013 | | 2012 | | 2011 |
| | (in millions) |
| Provision (benefit) for income taxes | $ | 135 |
| | $ | (110 | ) | | $ | 20 |
|
|
| | | | | | | | | | | |
| | Years Ended October 31, |
| | 2016 | | 2015 | | 2014 |
| | (in millions) |
| Provision (benefit) for income taxes | $ | 82 |
| | $ | 42 |
| | $ | (3 | ) |
For 2013,2016, the company’s effective tax rate from continuing operations was 1615.1 percent. The 16 percent effectiveincome tax rate is lower thanexpense from continuing operations was $82 million. The income tax provision from continuing operations for the year ended October 31, 2016 included net discrete tax expense of $17 million. The net discrete tax expense for the year ended October 31, 2016, included $5 million of tax benefit for the extension of the U.S. statutory rate primarily dueresearch and development tax credit attributable to the mixcompany's prior fiscal year, $6 million of earnings in non-U.S. jurisdictions taxed at lower statutory rates; in particular Singapore where we enjoy tax holidays. The effective tax rate also included a $12 million out-of-period adjustment to increase tax expense recognized in the second quarter of 2013, associated with the write off of deferred tax assets related to foreign tax credits incorrectly claimed in prior years.
For 2012, the effective tax rate was a benefit of 11 percent. The 11 percent effective tax rate benefit reflected tax on earnings in jurisdictions that had low effective tax rates and included a $280 million tax benefit duecurtailment gain recognized with respect to the reversalU.S. retirement plan and Supplemental Benefits Plan, $18 million of tax expense related to the establishment of a valuation allowance for most U.S. federalon an equity method impairment that would generate a capital loss when realized, and state deferreda net $2 million of other discrete tax assets. Valuation allowances requirebenefit. Included in the net $2 million discrete tax benefit are $9 million of out-of-period correcting tax expense entries recorded in the second and fourth quarters of the fiscal year of 2016 associated with German return-to-provision corrections. These are offset by an assessment of both positive and negative evidence when determining whether it is more likely than not that deferred$11 million out-of-period tax assets are recoverable. Such assessment is required on a jurisdiction by jurisdiction basis. In the fourth quarter of 2012, management concluded that the valuation allowance for most of Agilent's U.S. federal and state deferred tax assets is no longer needed primarily duebenefit associated with an adjustment to the emergence from cumulative losses in recent years, the return to sustainable U.S. operating profits and the expectation of sustainable profitability in future periods. As of October 31, 2012, the cumulative positive evidence outweighed the negative evidence regarding the likelihood that most of the deferred tax assetliability for Agilent's U.S. consolidated income tax group willunremitted foreign earnings. The out-of-period corrections were determined to be realized. Accordingly, we recognized a non-recurring tax benefit of $280 million relatingimmaterial to the valuation allowance reversal. Thepreviously issued and current period financial statements.
For 2015, the company's effective tax rate also included a non-recurring tax expense of $88 million relating to an increase in the overall residual U.S. tax expected to be imposed upon the repatriation of unremitted foreign earnings previously considered permanently reinvested. During the fourth quarter of 2012, we assessed the forecasted cash needs and overall financial position of our foreign subsidiaries and determined that a portion of previously permanently reinvested earnings would no longer be reinvested overseas. The effective tax ratefrom continuing operations was also reduced by a $68 million tax benefit primarily associated with the recognition of previously unrecognized tax benefits and the reversal of the related interest accruals due to the reassessment of certain uncertain tax positions relating to foreign jurisdictions.
For 2011, the effective tax rate was 28.7 percent. The 2 percent effective tax rate reflects tax on earnings in jurisdictions that had low effective tax rates and includes a $97 million net tax benefit primarily associated with a refund in Canada and the recognition of previously unrecognized tax benefits and the reversal of the related interest accruals due to the reassessment of certain uncertain tax positions. The income tax provision alsoexpense from continuing operations was $42 million. The income tax benefit for the year ended October 31, 2015 included a $26 million out of period adjustment to reduce the carrying value of certain U.K. deferred tax assets for which the majority was recorded in the quarter ended April 30, 2011. The overstatement of these deferred tax assets resulted in an overstatement of the U.K. valuation allowance release in the fourth quarter of 2010. For the fullnet discrete benefit
year, this out of period adjustment was substantially offset by other out$55 million primarily due to the settlement of period adjustments. The net impactan Internal Revenue Service ("IRS") audit in the U.S. and the recognition of all outtax expense related to the repatriation of period adjustments ondividends.
For 2014, the company’s effective tax rate from continuing operations was immaterial. Without considering interest and penalties,(1.3) percent. The income tax benefit from continuing operations was $3 million. The income tax benefit for the effective rate reflected taxesyear ended October 31, 2014 included a net discrete benefit of $33 million primarily due to the settlement of an Internal Revenue Service (“IRS”) audit in all jurisdictions except the U.S. and certain foreign jurisdictions in which incomethe recognition of tax expense or benefit continuedrelated to be offset by adjustments to valuation allowances.the repatriation of dividends.
Agilent enjoys tax holidays in several different jurisdictions, most significantly in Singapore. The tax holidays provide lower rates of taxation on certain classes of income and require various thresholds of investments and employment or specific types of income in those jurisdictions. The tax holidays are due for renewal between 20152018 and 2023. As a result of the incentives, the impact of the tax holidays decreased income taxes by $127$86 million, $122$65 million, and $127$27 million in 2013, 2012,2016, 2015, and 2011,2014, respectively. The benefit of the tax holidays on net income per share (diluted) was approximately $0.37, $0.35,$0.26, $0.19, and $0.36$0.08 in 2013, 20122016, 2015 and 2011,2014, respectively.
In accordance with the guidance on the accounting for uncertainty in income taxes, for all U.S. and other tax jurisdictions, we recognize potential liabilities for anticipated tax audit issues based on our estimate of whether, and the extent to which, additional taxes and interest will be due. If our estimate of income tax liabilities proves to be less than the ultimate assessment, a further charge to expense would be required. If events occur and the payment of these amounts ultimately proves to be unnecessary, the reversal of the liabilities would result in tax benefits being recognized in the period when we determine the liabilities are no longer necessary. We include interest and penalties related to unrecognized tax benefits within the provision for income taxes on the consolidated statements of operations.
On November 1, 2014, Agilent transferred deferred tax assets of $237 million, deferred tax liabilities of $37 million, current income tax payable of $40 million, and other long-term liabilities related to uncertain tax positions totaling $8 million to Keysight as part of its separation from Agilent. A current prepaid income tax asset of $19 million and long-term prepaid income tax asset of $3 million related to sales of intercompany assets was also transferred to Keysight upon separation from Agilent. In addition, for the year ended October 31, 2015, a $6 million return to provision adjustment for Keysight associated with bonus depreciation was recognized through retained earnings.
In the U.S., tax years remain open back to the year 20062012 for federal income tax purposes and the year 2000 for significant states. Agilent's U.S. federal incomeOn September 22, 2015, we reached an agreement with the Internal Revenue Service ("IRS") for the tax returnsyears 2008 through 2011. During the first quarter of 2016, we made a payment of approximately $9 million of tax plus interest as part of closing the exam. In 2015, we reclassified a portion of other long-term liabilities to other accrued liabilities related to uncertain tax positions of continuing operations that we expected to pay within the next twelve months. This amount was partially offset by a prepaid tax account of approximately $3 million that the IRS allowed as an offset to the $12 million in incremental taxes. The settlement resulted in the recognition, within the continuing operations, of previously unrecognized tax benefits of $119 million, offset by a tax liability on foreign distributions of approximately $99 million principally related to the repatriation of foreign earnings.
On January 29, 2014, we reached an agreement with the IRS for the tax years 2006 through 2007 are currently under audit2007. The settlement resulted in the recognition, within the continuing operations, of previously unrecognized tax benefits of $111 million, offset by the IRS. During the three months ended July 31, 2012, the company received a Revenue Agents Report (“RAR”) for these years and filed a protest to dispute certain adjustments, the most significanttax liability on foreign distributions of which pertainsapproximately $75 million principally related to the amountrepatriation of a gain from the disposition of a business that was allocated to the U.S. for income tax purposes. There can be no assurance that the outcome of this dispute will not have a material effect on our operating results or financial condition. foreign earnings.
In other major jurisdictions where the company conducts business, the tax years generally remain open back to the year 2003. With these jurisdictions and the U.S., it is reasonably possible that there could be significant changes to our unrecognized tax benefits in the next twelve months due to either the expiration of a statute of limitation or a tax audit settlement.settlement which will be partially offset by an anticipated tax liability related to unremitted foreign earnings, where applicable. Given the number of years and numerous matters that remain subject to examination in various tax jurisdictions, management is unable to estimate the range of possible changes to the balance of our unrecognized tax benefits.
On July 27, 2015, the U.S. Tax Court issued an opinion in Altera Corp. v. Commissioner related to the treatment of stock-based compensation expense in an intercompany cost-sharing arrangement. A final decision was entered by the U.S. Tax Court on December 1, 2015. At this time, the U.S. Department of the Treasury has not withdrawn the requirement from its regulations to include stock-based compensation. The IRS notified the U.S. Court of Appeals for the Ninth Circuit on February 19, 2016 of its intent to appeal the Tax Court's decision in the case. We concluded that no adjustment to our consolidated financial statements is appropriate at this time due to the uncertainties with respect to the ultimate resolution of this case.
Segment Overview
We formed a new operating segment in the fourth fiscal quarter of 2013. The new life sciences and diagnostics segment was formed by the combination of the life sciences business plus the diagnostics and genomics business. Following this reorganization,Through October 31, 2016, we have three business segments comprised of the life sciences and applied markets business, diagnostics business, the chemical analysisand genomics business and the electronic measurementAgilent CrossLab business. The historical segment financial information for the life sciences and diagnostics segment has been recast to conform to this new reporting structure in our financial statements.
Life Sciences and DiagnosticsApplied Markets
Our life sciences and diagnosticsapplied markets business provides application-focused solutions that include reagents, instruments software, consumables, and servicessoftware that enable customers to identify, quantify and analyze the physical and biological properties of substances and products, as well as enable customers in the clinical and life sciences research areas to interrogate samples at the molecular level. Key product categories include: liquid chromatography ("LC") systems columns and components; liquid chromatography mass spectrometry ("LCMS") systems; gas chromatography ("GC") systems and components; gas chromatography mass spectrometry ("GCMS") systems; inductively coupled plasma mass spectrometry ("ICP-MS") instruments; atomic absorption ("AA") instruments; microwave plasma-atomic emission spectrometry (“MP-AES”) instruments; inductively coupled plasma optical emission spectrometry ("ICP-OES") instruments; cell analysis plate based assays; laboratory software and informatics systems; laboratory automation and robotic systems; dissolution testing; nucleic acid solutions; Nuclear Magnetic Resonance, Magnetic Resonance Imaging,vacuum pumps and X-Ray Diffraction systems; services and support for the aforementioned products; immunohistochemistry; In Situ Hybridization; Hematoxylin and Eosin staining; special staining, DNA mutation detection; genotyping; gene copy number determination; identification of gene rearrangements; DNA methylation profiling; gene expression profiling; next generation sequencing target enrichment; and automated gel electrophoresis-based sample analysis systems. We also collaborate with a number of major pharmaceutical companies to develop new potential pharmacodiagnostics, also called companion diagnostics, with the potential of identifying patients most likely to benefit from a specific targeted therapy. measurement technologies.
Orders and Net Revenue
|
| | | | | | | | | | | | | | | |
| | Years Ended October 31, | | 2013 over 2012
Change | | 2012 over 2011
Change |
| | 2013 | | 2012 | | 2011 | |
| | (in millions) | | | | |
| Orders | $ | 2,319 |
| | $ | 1,993 |
| | $ | 1,875 |
| | 16% | | 6% |
| Net revenue from products | $ | 1,868 |
| | $ | 1,578 |
| | $ | 1,424 |
| | 18% | | 11% |
| Net revenue from services and other | 432 |
| | 406 |
| | 368 |
| | 6% | | 10% |
| Total net revenue | $ | 2,300 |
| | $ | 1,984 |
| | $ | 1,792 |
| | 16% | | 11% |
|
| | | | | | | | | | | | | | | |
| | Years Ended October 31, | | 2016 over 2015
Change | | 2015 over 2014
Change |
| | 2016 | | 2015 | | 2014 | |
| | (in millions) | | | | |
| Net revenue | $ | 2,073 |
| | $ | 2,046 |
| | $ | 2,078 |
| | 1% | | (2)% |
Life sciencesscience and diagnostics ordersapplied markets business revenue in 2013 grew 162016 increased 1 percent compared to 2012. Foreign currency movements had an unfavorable impact of 2 percentage point on order growth when compared to the prior year. Incremental orders associated with the Dako acquisition in 2013 accounted for 13 percentage points of the order growth. Excluding the impact of the Dako acquisition, order results were led by demand in the LC, genomics, services and consumables portfolios. Geographically, orders grew 16 percent in the Americas, grew 27 percent in Europe, declined 2 percent in Japan, and grew 9 percent in other Asia Pacific during 2013 when compared to 2012. Life sciences and diagnostics orders in 2012 increased 6 percent compared to 2011. Foreign currency movements had an unfavorable impact of 1 percentage point on order growth when compared to the prior year. Excluding the impact of the Dako acquisition, order growth was driven by strength in informatics, microfluidics, nucleic acid, and services. Budget constraints and cautious spending weighed on the results in 2012.
Life sciences and diagnostics net revenue in 2013 increased 16 percent compared to 2012. Revenue associated with the Dako acquisition accounted for 17 percent of our life sciences and diagnostics business and 13 percentage points of the revenue growth in 2013.2015. Foreign currency movements for 2013 had an unfavorable impact of 1 percentage point compared to 2012. Excluding the impact of the Dako acquisition, revenue growth was led by strength in LC, consumables and services portfolios. Geographically, revenue grew 13 percent in the Americas, grew 26 percent in Europe, declined 2 percent in Japan, and grew 12 percent in other Asia Pacific during 2013 when compared to 2012. Though European countries continue to focus on addressing the financial downturn and continued austerity measures, Europe had the strongest performance with particular demand in the diagnostics and pharma markets. Life sciences and diagnostics revenue in 2012 increased 11 percent compared to 2011. Foreign currency movements for 20122016 had an unfavorable impact of 2 percentage points on revenue growth when compared to 2011. Excluding the impactsame period last year. Geographically, revenue declined 6 percent in the Americas with a 1 percentage point unfavorable currency impact. Revenue declined 8 percent in Europe with a 4 percentage point unfavorable currency impact. Revenue grew 7 percent in Japan with an 8 percentage point favorable currency impact. Revenue grew 14 percent in Asia Pacific excluding Japan with a 1 percentage point unfavorable currency impact. Strong growth in China led the geographic portfolio during 2016, and helped offset softness in the Americas and Europe. Liquid chromatography products revenue continued solid growth on strength in the pharmaceutical market. Revenue from mass spectrometry had instances of strength, particularly in China, which were offset by continued declines in revenue in the chemical and energy markets as well as diagnostic and clinical market declines in the Americas. Life science and applied markets business revenue in 2015 decreased 2 percent compared to 2014. During 2015 we exited the research products business, which reduced overall life sciences and applied markets growth by 2 percentage points. Product revenue results were otherwise solid across the rest of the Dako acquisition, revenue strength was ledproduct portfolio. Strength in the Americas and Europe pharmaceutical business were offset by LCMS, informatics, automationsoftness in applied markets and services.life science research.
End market performance reflected slowmixed growth across most markets in 2013.2016. Pharmaceutical and biotech market was soft overall as budgetsgrowth continued to be tightened. Customers are investing to upgraderobust in 2016 driven by continuing technology such as advanced LCMS applications, to stay ahead ofrefresh programs. The growth led the curve in biologic drugs yet still maintain an edge in chemical drugs, particularly in generic drugsway for life sciences and emerging markets. The academiadiagnostics markets, which were offset somewhat by lower diagnostic and government market continued to see the dampening effects of the U.S. sequestration and weak macroeconomic environment in Europe, though we saw some signs of stabilization in Europeclinical sales, notably in the latter partUS related to a slowdown in pain management related sales. Food and environmental markets, driven by strong sales in China, were areas of the 2013. The diagnostics market experienced solidgood growth in pathology, reagent partnershipsan otherwise weak applied market sector. Chemical and companion diagnostics and the clinical market remained robust during the year reflecting record volumes in the latter part of 2013energy markets continued their declines throughout 2016 as oil prices remain low. Markets were also mixed for our genomics products. Applied markets were flat as2015 with pharmaceutical growth in food and petrochemical saw good demand from China and other emerging markets, but was largely offset by declinesdelayed capital spending in environmentallife science research markets, and forensics markets as tight government budgets continued to constrain demand in the U.S.chemical and Europe.energy weakness from low oil prices.
Looking forward, we are optimistic about our growth opportunities in the life sciences and diagnosticsapplied markets as our broad portfolio of products and solutions are well suited to address customer needs. We expect strong sales funnels given a number of significant new product introductions in the next few quarters as we continue to invest in expanding and improving our applications and solutions portfolio. We expect low spending levelsremain concerned about short term prospects in chemical and energy markets, but are confident in our product portfolio to continueaddress customer needs when the market does recover.
Gross Margin and Operating Margin
The following table shows the life sciences and applied markets business' margins, expenses and income from operations for 2016 versus 2015, and 2015 versus 2014.
|
| | | | | | | | | | | | |
| | Years Ended October 31, | | 2016 over 2015
Change | | 2015 over 2014
Change |
| | 2016 | | 2015 | | 2014 | |
| Total gross margin | 58.6 | % | | 56.2 | % | | 55.8 | % | | 2 ppts | | — |
| Operating margin | 20.7 | % | | 18.6 | % | | 17.7 | % | | 2 ppts | | 1 ppt |
|
| | | | | | | | | | | | | | | |
| (in millions) | | | | | | | | | |
| Research and development | $ | 195 |
| | $ | 192 |
| | $ | 215 |
| | 2% | | (10)% |
| Selling, general and administrative | $ | 590 |
| | $ | 576 |
| | $ | 576 |
| | 2% | | — |
| Income from operations | $ | 429 |
| | $ | 380 |
| | $ | 369 |
| | 13% | | 3% |
Gross margin increased 2 percentage points in academic2016 compared to 2015. The exit of our research products division contributed 1 percentage point to gross margin improvement with the rest a combination of reduced warranty costs and government markets givenimproved efficiencies in logistics offset by wage increases and variable pay. Gross margins were flat in 2015 compared to 2014. Increases for wages and materials were largely offset by improvement in operational efficiencies.
Research and development expenses increased 2 percent in 2016 when compared to 2015. Acquisitions roughly offset savings from the U.S. budget sequestrationresearch products division exit, with growth coming from wage increases, variable pay and continued austeritytargeted investments. Research and development expenses decreased 10 percent in most developed countries, but we expect businesses such as consumables2015 when compared to 2014. Excluding NMR, 2015 research and servicesdevelopment expenses were down 4 percent from 2014 impacted by our transformation initiatives.
Selling, general and administrative expenses increased 2 percent in 2016 compared to 2015. Acquisitions roughly offset savings from the research products division exit, with growth coming from wage increases and variable pay. Selling, general and administrative expenses were flat in 2015 compared to 2014. Excluding NMR, selling, general and administrative expenses grew 3 percent primarily due to dis-synergies in infrastructure costs from the separation of Keysight.
Operating margin increased 2 percentage points in 2016 compared to 2015. The exit of our research products division contributed 2 percentage point to operating margin improvement, with gross margin improvements from lower warranty and logistics costs making up the difference. Operating margins increased by 1 percentage point in 2015 compared to 2014. Expenses declined more than revenue to help with the improvement.
Income from Operations
Income from operations in 2016 increased by $49 million or 13 percent compared to 2015 on a revenue increase of $27 million. The exit of our research products division contributed roughly 40 percent of the improvement with revenue growth and improved gross margins making up the difference. Income from operations in 2015 increased by $11 million or 3 percent compared to 2014 on a revenue decrease of $32 million.
Diagnostics and Genomics
Our diagnostics and genomics business includes genomics, nucleic acid contract manufacturing and the pathology, companion diagnostics and reagent partnership businesses.
Our diagnostics and genomics business is comprised of five areas of activity providing solutions that include reagents, instruments, software and consumables, which enable customers in the clinical and life sciences research areas to interrogate samples at the cellular and molecular level. First, our genomics business includes arrays for DNA mutation detection, genotyping, gene copy number determination, identification of gene rearrangements, DNA methylation profiling, gene expression profiling, as well as next generation sequencing ("NGS") target enrichment and genetic data management and interpretation support software. Second, our nucleic acid solutions business provides equipment and expertise focused on production of synthesized oligonucleotides under pharmaceutical good manufacturing practices ("GMP") conditions for use as active pharmaceutical ingredients ("API") in an emerging class of drugs that utilize nucleic acid molecules for disease therapy. Next, our pathology solutions business is focused on product offerings to cancer diagnostics and anatomic pathology workflows. The broad portfolio of offerings includes immunohistochemistry (“IHC”), in situ hybridization (“ISH”), hematoxylin and eosin (“H&E”) staining and
special staining. We also collaborate with a number of major pharmaceutical companies to develop new potential pharmacodiagnostics, also known as companion diagnostics, which may be used to identify patients most likely to benefit from a specific targeted therapy. Finally, the reagent partnership business is a provider of reagents used for turbidimetry and flow cytometry.
Net Revenue
|
| | | | | | | | | | | | | | | |
| | Years Ended October 31, | | 2016 over 2015
Change | | 2015 over 2014
Change |
| | 2016 | | 2015 | | 2014 | |
| | (in millions) | | | | |
| Net revenue | $ | 709 |
| | $ | 662 |
| | $ | 663 |
| | 7% | | — |
Diagnostics and genomics business revenue in 2016 increased 7 percent compared to 2015. Foreign currency movements for 2016 had an unfavorable currency impact of 1 percentage point on revenue growth when compared to the same period last year. Geographically, revenue grew 11 percent in the Americas with no currency impact. Revenue grew 1 percent in Europe with a 4 percentage point unfavorable currency impact. Revenue grew 6 percent in Japan with an 8 percentage point favorable currency impact. Revenue grew 17 percent in Asia Pacific excluding Japan with a 2 percentage point unfavorable currency impact. The performance in Americas and Europe were assisted by positive growth in sales in genomics (particularly target enrichment and arrays), strength in pathology business, continued needdemand in the nucleic acid solutions and good momentum in the companion diagnostic business. Growth in Asia Pacific excluding Japan reflected strong growth in China. Diagnostics and genomics business revenue in 2015 was flat compared to refresh2014, significantly impacted by currency.
The 7 percent revenue growth was due to positive growth from all businesses. This was led by continued growth momentum in the next generation sequencing (target enrichment portfolio) solution offering in the research and clinical research markets and an increase in the CGH products portfolio and good revenue performance in companion diagnostics business working with our pharmaceutical partners. Nucleic acid business saw continued market demand in the nucleic acid solutions business related to therapeutic oligo programs. The pathology business saw steady growth due to continued growth in our Omnis instrument placements and steady growth in the reagent revenues including traction in our PD-L1 assays. The end markets in diagnostics and clinical research remain strong and growing driven by an aging instrumentationpopulation and lifestyle. The positive local currency revenue growth in 2015 was also driven by demand in the nucleic acid solutions, good revenue performance in pathology and companion diagnostics businesses as well as next generation sequencing solution offering within the genomics business.
Looking forward, we are optimistic about our growth opportunities in the diagnostics markets and continue to partially offset this effect.invest in expanding and improving our applications and solutions portfolio. We remain positive about our growth in our clinical and clinical researchthese markets, as adoption of our SureSelect and HaloPlex sequencing target enrichment solutions continue. The fourth quarter of 2013 markedcontinue, and Omnis instruments and reagents, PD-L1 assays and SureFISH gain traction with our customers in clinical oncology applications. Market demand in the commercial launch of thenucleic acid solutions business related to therapeutic oligo programs continues to be strong. Our nucleic acid business is expanding into a new Dako Omnis autostainer. First installations of this platform have taken place,site to accommodate future production needs. We will continue to invest in research and we are seeing good acceptance of ordersdevelopment, and seek to expand our position in both the U.S.developing countries and Europe.emerging markets.
Gross Margin and Operating Margin
The following table shows the life sciencesdiagnostics and diagnostics business'genomics business's margins, expenses and income from operations for 20132016 versus 2012,2015, and 20122015 versus 2011.2014.
| | | | Years Ended October 31, | | 2013 over 2012
Change | | 2012 over 2011
Change | Years Ended October 31, | | 2016 over 2015
Change | | 2015 over 2014
Change |
| | 2013 | | 2012 | | 2011 | | 2016 | | 2015 | | 2014 | |
| Total gross margin | 54.3 | % | | 53.3 | % | | 52.0 | % | | 1 ppt | | 1 ppt | 54.6 | % | | 54.4 | % | | 56.4 | % | | — | | (2) ppts |
| Operating margin | 16.4 | % | | 14.8 | % | | 13.2 | % | | 2 ppts | | 2 ppts | 16.0 | % | | 13.3 | % | | 14.0 | % | | 3 ppts | | (1) ppt |
| | | (in millions) | | | | | | | | | | | | | | | | | | |
| Research and development | $ | 228 |
| | $ | 195 |
| | $ | 174 |
| | 17% | | 12% | $ | 83 |
| | $ | 78 |
| | $ | 86 |
| | 6% | | (10)% |
| Selling, general and administrative | $ | 645 |
| | $ | 567 |
| | $ | 522 |
| | 14% | | 9% | $ | 190 |
| | $ | 195 |
| | $ | 195 |
| | (2)% | | — |
| Income from operations | $ | 377 |
| | $ | 295 |
| | $ | 237 |
| | 28% | | 24% | $ | 114 |
| | $ | 88 |
| | $ | 93 |
| | 29% | | (5)% |
Gross marginsmargin was flat in 2013 increased 1 percentage point2016 when compared to 2012. The increase in2015. Favorable gross margins was mainly due to the impact of the Dako acquisition, along with favorable volume,higher volumes and lower infrastructure expenses, lower variable pay, partiallyinventory charges were fully offset by unfavorable product mixcurrency movements and unfavorable standard cost.wage increases. Gross margins increased 1decreased by 2 percentage pointpoints in 20122015 compared to 2011 mainly due to the2014. Gross margins reflected unfavorable currency movement impact, of the Dako acquisition, favorable volumechange in business mix, higher inventory charges, and lower material costs, which were offset by higher infrastructure costs and unfavorable product mix.wage increases.
Research and development expenses increased 176 percent in 20132016 when compared to 2012. The2015 however, remained flat as a percentage of revenue. This reflected increase was due toin wages and benefits and increased spending around the impactdevelopment of the Dako acquisition.clinical applications and solutions were partially offset by favorable currency movements. Research and development expenses increased 12decreased 10 percent in 20122015 when compared to 2011, mostly2014; however, remained flat as a percentage of revenue. The decline was mainly due to the impact of the Dako acquisitionfavorable currency movements and investments in new product development.business improvement initiatives partially offset by wage increases.
Selling, general and administrative expenses increased 14decreased 2 percent in 20132016 when compared to 2012.2015, reflecting favorable currency movements, reduced expenses due to business improvement initiatives partially offset by wages and variable pay increases. Selling, general and administrative expenses increased 9 percentwere flat in 20122015 compared to 2011.2014, favorable currency movements, and business improvement initiatives and were offset by higher allocated infrastructure expenses following the Keysight separation and wage increases.
Operating margin increased 3 percentage points in 2016 when compared to 2015. The increase was due to the impact of the Dako acquisition in both periods.
higher volumes, lower inventory charges, better selling expenses partially offset by wage and benefits increases. Operating margins increaseddecreased by 21 percentage pointspoint in 20132015 compared to 2012.2014. The increases were mainly due to the impact of the Dako acquisition and favorable gross profit from higher revenue. Operating margins increased 2 percentage points in 2012 compared to 2011.The increasereduction was due to the impact of the Dako acquisition, favorablelower gross profit frommargins due to higher revenue outpacing operating expense growth.inventory charges and wage increases.
Income from Operations
Income from operations in 2013 increased by $82 million or 28 percent on a revenue increase of $316 million, a 26 percent year-over-year operating margin incremental. Income from operations in 2012 increased $58 million or 24 percent on a revenue increase of $192 million. Operating margin incremental is measured by the increase in income from operations compared to the prior period divided by the increase in revenue compared to the prior period.
Chemical Analysis
Our chemical analysis business provides application-focused solutions that include instruments, software, consumables, and services that enable customers to identify, quantify and analyze the physical and biological properties of substances and products. Key product categories in chemical analysis include: gas chromatography (GC) systems, columns and components; gas chromatography mass spectrometry (GC-MS) systems; inductively coupled plasma mass spectrometry (ICP-MS) instruments; atomic absorption (AA) instruments; inductively coupled plasma optical emission spectrometry (ICP-OES) instruments; molecular spectroscopy instruments; software and data systems; vacuum pumps and measurement technologies; services and support for our products.
Orders and Net Revenue
|
| | | | | | | | | | | | | | | |
| | Years Ended October 31, | | 2013 over 2012
Change | | 2012 over 2011
Change |
| | 2013 | | 2012 | | 2011 | |
| | (in millions) | | | | |
| Orders | $ | 1,642 |
| | $ | 1,604 |
| | $ | 1,589 |
| | 2% | | 1% |
| Net revenue from products | $ | 1,232 |
| | $ | 1,219 |
| | $ | 1,194 |
| | 1% | | 3% |
| Net revenue from services and other | 362 |
| | 340 |
| | 324 |
| | 6% | | 5% |
| Total net revenue | $ | 1,594 |
| | $ | 1,559 |
| | $ | 1,518 |
| | 2% | | 3% |
Chemical analysis orders in 2013 increased 2 percent compared to 2012. Foreign currency movements for 2013 had an unfavorable impact of 2 percentage point compared to 2012. Order results were led by solid performance in services, consumables, and ICP-MS instruments. Strength in these areas was offset by declines in GC-MS systems and flat orders in vacuum pump products. Geographically, orders were flat in the Americas, increased 5 percent in Europe, declined 14 percent in Japan (includes unfavorable currency impact of 16 percentage points), and grew 6 percent in other Asia Pacific during 2013 when compared to 2012. In the Americas the overall government spending remains weak. Total Asia Pacific orders reflected continued weakness in unfavorable currency impacts in Japan orders offset by continued growth in both China and South Asia Pacific and Korea. Chemical analysis orders in 2012 increased 1 percent compared to 2011 due to strength in services and consumables, along with GC-MS and ICP-MS instruments.
Chemical analysis net revenue in 2013 increased 2 percent compared to 2012. Foreign currency movements for 2013 had an unfavorable impact of 2 percentage point compared to 2012. Revenue growth was led by services and consumables. GC and GC-MS weaknesses were offset by strength in ICP-MS and AA and ICP-OES instruments. Geographically, revenue grew 3 percent in the Americas, grew 1 percent in Europe, declined 17 percent in Japan (including a 15 percentage point unfavorable currency impact), and grew 8 percent in other Asia Pacific. Brazil, China, and India in particular had strong revenue growth in 2013, each having double digit growth. Chemical analysis revenue grew 3 percent in 2012 compared to 2011, led by services and consumables, along with strength in ICP-MS
Chemical analysis saw mixed growth in the core end markets. The demand to export safe and high quality food in emerging markets remains strong, and their government funding continues to drive strength for purchases of GC and GC-MS instruments. Chemical and energy end markets saw modest increases in 2013 compared to 2012, driven primarily by stronger demand in China and a bright outlook for petrochemicals in North America. In forensics, the spread of designer drugs continues to drive the need for GC-MS systems, particularly in Europe. Environmental demand in mature markets is tempered by continued government budget constraints. In emerging economies, testing to ensure the quality and safety of drinking water is a factor in economic growth and has led to the demand for GC-MS and ICP-MS instruments. Other applied markets showed mid-single digit growth, with growth in pharmaceutical and bio tech markets being offset by a decline in academic and government markets.
Strength in 2013 and our fourth quarter results reflect a positive outlook for the chemical analysis core end markets. We will continue to invest in research and development, and seek to expand our position in developing countries and emerging markets. New instrument launches over the next twelve months, as well as continued market acceptance of our new products released in 2013, will help with our product differentiation and competitive position.
Gross Margin and Operating Margin
The following table shows the chemical analysis business's margins, expenses and income from operations for 2013 versus 2012, and 2012 versus 2011.
|
| | | | | | | | | | | | |
| | Years Ended October 31, | | 2013 over 2012
Change | | 2012 over 2011
Change |
| | 2013 | | 2012 | | 2011 | |
| Total gross margin | 51.7 | % | | 51.4 | % | | 51.1 | % | | — | | — |
| Operating margin | 22.3 | % | | 21.7 | % | | 20.6 | % | | 1 ppt | | 1 ppt |
|
| | | | | | | | | | | | | | | |
| (in millions) | | | | | | | | | |
| Research and development | $ | 94 |
| | $ | 93 |
| | $ | 92 |
| | 2% | | — |
| Selling, general and administrative | $ | 374 |
| | $ | 371 |
| | $ | 371 |
| | 1% | | — |
| Income from operations | $ | 355 |
| | $ | 338 |
| | $ | 313 |
| | 5% | | 8% |
Gross margins in 2013 remained flat compared to 2012. Higher product discounts and unfavorable foreign currency movements were offset by favorable manufacturing overhead costs and favorable revenue volume. Gross margin also remained flat in 2012 compared to 2011, driven by higher product discounts offsetting favorable revenue volume and lower material costs.
Research and development expenses increased 2 percent in 2013 compared to 2012, driven mainly by our continued investment in instrument products. Research and development expenses remained flat in 2012 compared to 2011.
Selling, general, and administrative expenses increased 1 percent in 2013 compared to 2012 mainly due to higher infrastructure expenses and commissions partially offset by reduced discretionary expenses including marketing programs and travel. Selling, general, and administrative expenses remained flat in 2012 compared to 2011, primarily driven by investments in sales channel coverage with a focus on emerging markets being offset by lower commissions and discretionary spending
Operating margins increased by 1 percentage point in 2013 compared to 2012. The increase was mainly due to favorable gross profit from higher revenue while holding expenses fairly flat. Operating margins increased 1 percentage point from 2012 compared to 2011, mainly due to favorable gross profit from higher revenue while holding expenses flat.
Income from Operations
Income from operations in 2013 increased by $17 million or 5 percent on a revenue increase of $35 million, a 49 percent year-over-year operating margin incremental. Income from operations in 2012 increased by $25 million or 8 percent compared to 2011 on a revenue increase of $41 million, or 60 percent year-over-year operating margin incremental.
Electronic Measurement
Our electronic measurement business provides electronic measurement instruments and systems, software design tools and related services that are used in the design, development, manufacture, installation, deployment and operation of electronics equipment, and microscopy products. Related services include start-up assistance, instrument productivity and application services and instrument calibration and repair. We also offer customization, consulting and optimization services throughout the customer's product lifecycle.
Orders and Net Revenue
|
| | | | | | | | | | | | | | | |
| | Years Ended October 31, | | 2013 over 2012
Change | | 2012 over 2011
Change |
| | 2013 | | 2012 | | 2011 | |
| | (in millions) | | | | |
| Orders | $ | 2,866 |
| | $ | 3,280 |
| | $ | 3,305 |
| | (13)% | | (1)% |
| Net revenue from products | $ | 2,434 |
| | $ | 2,862 |
| | $ | 2,875 |
| | (15)% | | — |
| Net revenue from services and other | 454 |
| | 453 |
| | 441 |
| | — | | 3% |
| Total net revenue | $ | 2,888 |
| | $ | 3,315 |
| | $ | 3,316 |
| | (13)% | | — |
Electronic measurement orders declined 13 percent in 2013 compared to 2012. Foreign currency movements had an unfavorable impact of 2 percentage points on the year-over-year compare. Orders were lower for all market segments, including aerospace and defense; industrial, computer, and semiconductor test; and communications test, which decreased year-over-year primarily due to lower wireless manufacturing demand relating to the loss of business from a large customer with whom we could not agree on contractual terms. On a geographic basis, orders declined 20 percent in the Americas, 12 percent in Japan, 7 percent in Asia Pacific excluding Japan, and 4 percent in Europe. The decline in orders in the Americas was driven by weak communications test and soft aerospace and defense demand. Japan orders were lower due to the unfavorable impact of currency movements, improving by 1 percent year-over-year in local currency. Electronic measurement orders declined 1 percent in 2012 compared to 2011; weak industrial and slightly lower aerospace and defense orders were mostly offset by growth in computer and semiconductor and communications test business.
Electronic measurement revenue declined 13 percent in 2013 compared to 2012 primarily on lower wireless manufacturing and industrial, computer and semiconductor test demand. The unfavorable impact of foreign currency movements contributed to 2 percentage points of the year-over-year decline. Revenue from the Americas decreased 19 percent on significantly lower wireless manufacturing demand and soft general purpose test business. Japan revenue was 14 percent lower year-over-year but declined only 3 percent in local currency. Asia Pacific excluding Japan decreased 7 percent, and Europe declined 6 percent when compared to last year. Revenue from products was 15 percent lower compared to 2012 while service related revenue was flat. Electronic measurement revenue was flat in 2012 compared to 2011 on flat demand in both general purpose and communications test. Within communications test, strong wireless manufacturing test revenue was offset by lower wireless R&D and broadband communications test business.
General purpose test revenue, representing approximately 66 percent of electronic measurement business, declined year-over-year on weak industrial, computer, and semiconductor test demand. Our aerospace and defense business was flat year-over-year on lower demand in the Americas offset by stronger spending in Europe. Semiconductor test revenue declined on moderating investments in new process technology and weak manufacturing demand. The shift from personal computers to lower priced, more highly integrated tablets has resulted in a reduction in test equipment demand. Uncertain global economic conditions contributed to lower industrial test business. In 2012, general purpose test represented approximately 63 percent of electronic measurement revenue with slight growth in computers and semiconductor business, flat industrial test demand, and a slight decline in aerospace and defense compared to 2011.
Communications test revenue, representing approximately 34 percent of total electronic measurement, declined year-over-year primarily due to significantly lower wireless manufacturing demand driven by the loss of business from a large customer with whom we could not agree on contractual terms. Wireless R&D spending remained soft reflecting a cautious spending environment though long-term industry fundamentals remain intact, with continued interest in high data rate applications such as long-term evolution (LTE). In 2012, communications test represented approximately 37 percent of total electronic measurement revenue; strong wireless manufacturing test demand was offset by lower wireless R&D and broadband communications business.
The outlook across market segments remains mixed. There continues to be downward pressure on aerospace and defense demand with near-term uncertainty relating to the budget for the United States. We expect to see improvement in semiconductor test considering the order strength in the last quarter of fiscal year 2013. Communications test is expected to improve in the near term on investment in wireless R&D for next generation formats and more stable wireless manufacturing demand. Longer term growth drivers such as mobility and transformational initiatives, including modular and hand-held instrumentation, support our ongoing investments.
Gross Margin and Operating Margin
The following table shows the electronic measurement business's margins, expenses and income from operations for 2013 versus 2012 and 2012 versus 2011.
|
| | | | | | | | | | | | |
| | Years Ended October 31, | | 2013 over 2012
Change | | 2012 over 2011
Change |
| | 2013 | | 2012 | | 2011 | |
| Total gross margin | 56.9 | % | | 56.9 | % | | 58.4 | % | | — | | (2) ppts |
| Operating margin | 18.9 | % | | 22.7 | % | | 22.9 | % | | (4) ppts | | — |
|
| | | | | | | | | | | | | | | |
| (in millions) | | | | | | | | | |
| Research and development | $ | 365 |
| | $ | 375 |
| | $ | 379 |
| | (3)% | | (1)% |
| Selling, general and administrative | $ | 733 |
| | $ | 761 |
| | $ | 798 |
| | (4)% | | (5)% |
| Income from operations | $ | 544 |
| | $ | 751 |
| | $ | 760 |
| | (28)% | | (1)% |
Gross margins were flat in 2013 compared to 2012 on lower revenue. On a volume-adjusted basis, gross margins were higher year-over-year primarily due to the lower proportion of wireless manufacturing business. A decline in variable and incentive pay and reduced infrastructure spending were offset by higher inventory charges and wage increases. In 2012, gross margins declined 2 percentage points compared to 2011 on flat revenue primarily driven by the unfavorable impact of a higher proportion of lower gross margin wireless manufacturing business.
Research and development expenses declined 3 percent in 2013 compared to 2012. Reductions in development spending, variable and incentive pay, and infrastructure related expenses, and the favorable impact of currency movements were partially offset by investments in acquisitions and wage increases. Research and development expenses declined 1 percent in 2012 compared to 2011 on lower variable and incentive pay and infrastructure costs partially offset by incremental spending on acquisitions and wage increases.
Selling, general and administrative expenses decreased 4 percent in 2013 compared to 2012. Reductions in discretionary spending, lower variable and incentive pay, and the favorable impact of currency movements were partially offset by wage increases. Selling, general and administrative expenses decreased 5 percent in 2012 compared to 2011 on lower variable and incentive pay, infrastructure costs and commissions partially offset by wage increases.
Operating margins declined by 4 percentage points in 2013 compared to 2012 on lower revenue partially offset by reduced operating expenses. Operating margins were approximately the same in 2012 compared to 2011 on flat revenue with the net impact of lower gross margins mostly offset by reductions in operating expenses.
Income from Operations
Income from operations in 2013 declined2016 increased by $207$26 million or 2829 percent when compared to 2015 on a revenue increase of $47 million. The increase was due to higher volumes and reduced selling and general administration expenses. Income from operations in 2015 decreased by $5 million or 5 percent compared to 20122014 on a revenue decrease of $427 million,$1 million. The reduction was due to lower gross margins.
Agilent CrossLab
The Agilent CrossLab business spans the entire lab with its extensive consumables and services portfolio, which is designed to improve customer outcomes. The majority of the portfolio is vendor neutral, meaning Agilent can serve and supply customers regardless of their instrument purchase choices. Solutions range from chemistries and supplies to services and software helping to connect the entire lab. Key product categories in consumables include GC and LC columns, sample preparation products, custom chemistries, and a 48large selection of laboratory instrument supplies. Services include startup, operational, training and compliance support, as well as asset management and consultative services that help increase customer productivity. Custom service and consumable bundles are tailored to meet the specific application needs of various industries and to keep instruments fully operational and compliant with the respective industry requirements.
Net Revenue
|
| | | | | | | | | | | | | | | |
| | Years Ended October 31, | | 2016 over 2015
Change | | 2015 over 2014
Change |
| | 2016 | | 2015 | | 2014 | |
| | (in millions) | | | | |
| Total net revenue | $ | 1,420 |
| | $ | 1,330 |
| | $ | 1,307 |
| | 7% | | 2% |
Agilent CrossLab business revenue in 2016 increased 7 percent year-over-year operating margin decrement, reflecting the netwhen compared to 2015. Foreign currency movements for 2016 had an unfavorable impact of lower2 percentage points when compared to 2015. Revenue growth in 2016 was led by increases in enterprise service contracts, LC small molecule columns, remarketed instruments, and bio-columns. Geographically, revenue grew 6 percent in the Americas with a 2 percentage point unfavorable currency impact. Revenue grew 3 percent in Europe with a 4 percentage point unfavorable currency impact. Revenue declined 4 percent in Japan with a 7 percentage point favorable currency impact due to macroeconomic conditions. Revenue grew 16 percent in Asia Pacific excluding Japan with a 4 percentage point unfavorable currency impact due to continued strength in China. Agilent CrossLab business revenue in 2015 increased 2 percent compared to 2014. Revenue growth in 2015 was led by strength in the overall aftermarket service agreement business, the remarketed instrument business, and our chemistries portfolio of LC columns and sample preparation products.
Agilent CrossLab business saw positive revenue growth in all the key end markets after accounting for the unfavorable currency movements in 2016. Revenue growth was led by the pharmaceutical and biotechnology market, as well as the food market. Revenue growth was slowest in the forensics market and the life science research market, but neither represented a large share of revenue in the Agilent CrossLab business. Agilent CrossLab business saw positive revenue growth in all the key end markets after accounting for the unfavorable currency impact in 2015 compared to 2014. Growth was led by the pharmaceutical and biotechnology markets. Revenue in chemical and emergy end markets were slower but still reported growth, adjusted for currency movements.
Looking forward, we expect continued strength in the pharmaceutical and biotechnology markets to drive growth in the near term. From a geographical stand point, we remain optimistic on the market growth and market penetration opportunities in China. Other factors for near term revenue growth will rely on upcoming product launches from our consumables pipeline, as well as on our investment in our laboratory enterprise offerings.
Gross Margin and Operating Margin
The following table shows the Agilent CrossLab business's margins, expenses and income from operations for 2016 versus 2015 and 2015 versus 2014.
|
| | | | | | | | | | | | |
| | Years Ended October 31, | | 2016 over 2015
Change | | 2015 over 2014
Change |
| | 2016 | | 2015 | | 2014 | |
| Total gross margin | 49.4 | % | | 49.6 | % | | 48.5 | % | | — | | 1 ppt |
| Operating margin | 22.3 | % | | 22.5 | % | | 23.0 | % | | — | | (1) ppt |
|
| | | | | | | | | | | | | | | |
| (in millions) | | | | | | | | | |
| Research and development | $ | 46 |
| | $ | 46 |
| | $ | 45 |
| | — | | 3% |
| Selling, general and administrative | $ | 339 |
| | $ | 315 |
| | $ | 287 |
| | 7% | | 10% |
| Income from operations | $ | 316 |
| | $ | 299 |
| | $ | 301 |
| | 6% | | (1)% |
Gross margin was flat in 2016 when compared to 2015, due to the higher sales volume and several margin improvement initiatives helping to offset the higher wages, unfavorable currency movements and a less favorable currency hedging results. Gross margin increased by 1 percentage point in 2015 compared to 2014, primarily due to the favorable currency hedging gains recognized in 2015, which were partially offset by expense reductions. higher logistic costs.
Research and development expenses was flat in 2016 when compared to 2015, due to wage increases being offset by moderate favorable currency movements. Research and development expenses increased 3 percent in 2015 when compared to 2014, due to higher project expenses and wage increases.
Selling, general and administrative expenses increased 7 percent in 2016 when compared to 2015, primarily due to higher orders driving higher field selling costs, wage increases and larger investments into marketing and the sales channel. Selling,
general and administrative expenses increased 10 percent in 2015 compared to 2014, due to the increase in allocated infrastructure costs following our separation of Keysight and wage increases.
Operating margin was flat in 2016 when compared to 2015, due to the higher sales volume helping to offset the higher wages, unfavorable currency movements less favorable currency hedging results, and increased selling, general and administrative expenses. Operating margin decreased by 1 percentage point in 2015 when compared to 2014, due to the increase in allocated infrastructure costs following our separation of Keysight, which were partially offset by the favorable currency hedging gains recognized in 2015.
Income from Operations
Income from operations in 20122016 increased by $17 million or 6 percent when compared to 2015 on a revenue increase of $90 million, representing an incremental operating margin of 19 percent. This increase was driven primarily by volume offset by currency and higher selling, general and administrative expenses. Income from operations in 2015 decreased by $9$2 million or 1 percent compared to 20112014 on flata revenue withincrease of $23 million, representing an operating margin decrement. This decrease was primarily due to the impact of lower gross margins mostlyfavorable volume increase being offset by reductionsthe increase in expenses.allocated infrastructure costs following our separation of Keysight.
Financial Condition
Liquidity and Capital Resources
Our financial position as of October 31, 20132016 consisted of cash and cash equivalents of $2,675$2,289 million as compared to $2,351$2,003 million as of October 31, 2012.2015.
As of October 31, 2013,2016, approximately $2,552$2,181 million of our cash and cash equivalents is held outside of the U.S. in our foreign subsidiaries. Most of the amounts held outside of the U.S. could be repatriated to the U.S. but, under current law, would be subject to U.S. federal and state income taxes, less applicable foreign tax credits. Agilent has accrued for U.S. federal and state tax liabilities on the earnings of its foreign subsidiaries except when the earnings are considered indefinitely reinvested outside of the U.S. Repatriation could result in additional material U.S. federal and state income tax payments in future years. We utilize a variety of funding strategies in an effort to ensure that our worldwide cash is available in the locations in which it is needed.
On June 21, 2012, we completed the acquisition of Dako A/S through the acquisition of 100% of the share capital of Dako A/S, a limited liability company incorporated under the laws of Denmark (“Dako”), under the share purchase agreement, dated May 16, 2012. As a result of the acquisition, Dako has become a wholly-owned subsidiary of Agilent. The consideration paid was approximately $2,143 million, $1,400 million was paid directly to the seller and $743 million was paid to satisfy the outstanding debt of Dako. Agilent funded the acquisition using existing cash. The acquisition has been accounted for in accordance with the authoritative accounting guidance and the results of Dako are included in Agilent's consolidated financial statements from the date of acquisition.
We believe our cash and cash equivalents, cash generated from operations, and ability to access capital markets and credit lines will satisfy, for at least the foreseeable future,next twelve months, our liquidity requirements, both globally and domestically, including the following: working capital needs, capital expenditures, business acquisitions, stock repurchases, cash dividends, contractual obligations, commitments, principal and interest payments on debt, and other liquidity requirements associated with our operations.
Net Cash Provided by Operating Activities
Net cash provided by operating activities was $1,152$793 million in 20132016 as compared to $1,228$512 million provided in 20122015 and $1,260$731 million provided in 2011. We received $65 million in interest rate swap proceeds and $61 million in respect of a tax sharing settlement with Hewlett Packard Company during2014. For the year ended October 31, 2011.2014 net cash provided by operating activities included the cash provided by Keysight operating activities. We paid approximately $67 million of net taxes in 2016, as compared to $129 million in net taxes in 2015 and net taxes of $110$131 million in 2013, as compared to net $86 million2014. Income taxes, including those paid for the Keysight business, were paid by Agilent for the year ended October 31, 2014. The decrease in taxes paid for the year ended October 31, 2016 was primarily due to no taxes paid related to the separation and to a lesser extent due to some refund of taxes. Cash paid for income taxes for the year ended October 31, 2015 included tax payments related to the separation. Operating cash flows in 20122014 were impacted by pre-separation costs and net $22separation related taxes, the redemption of senior notes including payments related to accrued interest and the timing of the purchase of shares under the employee stock purchase plan. For the years ended October 31, 2016, 2015 and 2014 other assets and liabilities provided cash of $10 million and used cash of $249 million and $26 million, respectively. The increase in 2011.the usage of cash for the year ended October 31, 2015 in other assets and liabilities was largely the result of contributions to defined benefit plans, changes in interest and restructuring accruals, income tax liabilities and transaction tax assets and liabilities.
In 2013,2016, the change in accounts receivable providedused cash of $14$33 million, provided$24 million in 2015, and $119 million in 2014. For the year ended October 31, 2014 the change in accounts receivable included $25 million of cash used by Keysight. Days' sales outstanding as of October 31, were 51 days in 2016, 53 days in 2015 and 49 days in 2014. The change in accounts payable used cash of $19$15 million in 20122016, used cash of $26 million in 2015 and provided cash of $11$50 million in 2011. Days' sales outstanding were 47 days2014. For the year ended October 31, 2014 the change in 2013, 47 days in 2012 and 45 days in 2011. Accountsaccounts payable usedincluded $32 million of cash of $27 million in 2013, used cash of $31 million in 2012 and used cash of $35 million in 2011.provided by Keysight. Cash used in inventory was $100$7 million in 2013, $522016, in $24 million in 20122015 and $208$99 million in 2011.2014. For the years ended October 31, 2014 the change in inventory included $31 million of cash used by Keysight. Inventory days on-hand increaseddecreased to 11892 days in 20132016 compared to 10897 days in 20122015 and 100
106 days in 2011. The increase in days on-hand was due to the reduced shipment volume within our electronic measurement business.2014.
We contributed $30 million, $30zero, $15 million and $33$30 million to our U.S. defined benefit plans in 2013, 20122016, 2015 and 2011,2014, respectively. For the year ended October 31, 2014 we contributed $15 million to our U.S. defined benefit plans on behalf of Keysight. We contributed $89$24 million, $54$25 million and $59$72 million to our non-U.S. defined benefit plans in 2013, 20122016, 2015 and 2011,2014, respectively. For the year ended October 31, 2014 we contributed $41 million to our non-U.S. defined benefit plans on behalf of Keysight. We contributed less than $1 million in both 2016 and 2015 and $1 million in 2014 to our U.S. post-retirement benefit plans in 2013 and did not contribute to our U.S. post-retirement benefit plans in 2012 or 2011.plans. Our non-U.S. defined benefit plans are generally funded ratably throughout the year. Total contributions in 20132016 were $120$24 million or 43 percent more than 2012. Total contributions in 2012 were $84 million or 940 percent less than 2011.2015. Our annual contributions are highly dependent on the relative performance of our assets versus our projected liabilities, among other factors. We expect to contribute approximately $101$26 million to our U.S. and $20 million non-U.S. defined benefit plans and $2 millionnothing to our U.S. post-retirement benefit plans during 2014.2017.
Net Cash Provided by/Used in Investing Activities
Net cash used in investing activities in 20132016 was $248$238 million and in 2015 was $400 million as compared to net cash used of $2,366$230 million in 2012 primarily due to2014. For the acquisition of Dako. In 2011, netyear ended October 31, 2014 cash provided byused in investing activities was $1,294 million.included $82 million of cash used by Keysight.
Investments in property, plant and equipment were $195$139 million in 2013, $1942016, $98 million in 20122015 and $188$205 million in 2011.2014. For the year ended October 31, 2014 investments in plant and equipment included $70 million related to Keysight. Proceeds from sale of property, plant and equipment were $2zero in 2016, $12 million in 2013, zero in 20122015 and $18$14 million in 2011.2014. In 2013,2016 we invested $21$261 million in acquisitions of businesses and intangible assets, net of cash acquired compared to $2,257$74 million in 20122015 and $98$13 million in 2011. Proceeds from2014. In 2016 we made a payment of $80 million for the salepurchase of a cost method investment securities in 2013 were $12 million, $5Lasergen compared to zero outlay in 2015 and 2014. We made a loan to our equity method investment of $3 million in 20122016 and $16 millionzero in 2011. The amounts ofboth 2015 and changes2014. Change in restricted cash were not material for the fiscal year ended 2012. In 2011 restricted cash decreased $1,545 million mostly due to the reclassification of restricted cash to cash and cash equivalents following the settlement of the World Trade repurchase obligation.was $245 million inflow in 2016, $240 million outflow in 2015 (both changes related to our Seahorse Biosciences acquisition) and $4 million in 2014, respectively.
Net Cash Provided by/Used in Financing Activities
Net cash used in financing activities in 20132016 was $554$268 million compared to $37$1,089 million in 20122015 and $1,693$117 million in 2011,2014, respectively. The increase in cash used in 2015 when compared to 2014 was largely due to the net cash transferred to Keysight.
Treasury stock repurchases
On November 19, 2009 our board of directors approved a share-repurchase program to reduce or eliminate dilution of basic outstanding shares in connection with issuances of stock under the company's equity incentive plans (the "2009 repurchase
program"). The 2009 repurchase program did not require the company to acquire a specific number of shares and could be suspended or discontinued at any time. There was no fixed termination date for the 2009 repurchase program.
On January 16, 2013, our board of directors terminated the 2009 repurchase program and approved a new share-repurchase program (the "2013 repurchase program"). The 2013 repurchase program authorized the use of up to $500 million to repurchase shares of the company's common stock in open market transactions, inclusive of any amounts repurchased since November 1, 2012. On May 14,22, 2013 we announced that our board of directors had authorized an increase of $500 million to the 2013a share repurchase program bringing the cumulative authorization to $1 billion. Unless terminated earlier by the board of directors, the 2013 repurchaseprogram. The existing program is designed to cover purchases untilreduce or eliminate dilution resulting from issuance of stock under the endcompany's employee equity incentive programs to target maintaining a weighted average share count of approximately 335 million diluted shares. For the calendar yearyears ended October 31, 2016, 2015 and any unused portion may be used in2014 we repurchased 2.4 million shares for $98 million, 6 million shares for $267 million and 4 million shares for $200 million, respectively. All such shares and related costs are held as treasury stock and accounted for using the calendar year 2014.cost method.
On May 28, 2015 we announced that our board of directors had approved a new share repurchase program (the "2015 repurchase program"). The 20132015 share repurchase program authorizes the purchase of up to $1.14 billion of our common stock through and including November 1, 2018. The 2015 repurchase program does not require the company to acquire a specific number of shares and may be suspended or discontinued at any time. As of October 31, 2013, the remaining amount to be repurchased under the 2013 program is $100 million. We repurchased the remaining $100 million worth of shares under the 2013 repurchase program in November 2013.
ForDuring the year ended October 31, 2013,2016, upon the completion of our previous repurchase program, we repurchased 20approximately 8.3 million shares for $900 million.$336 million under this authorization. All such shares and related costs are held as treasury stock and accounted for using the cost method. For the year endedAs of October 31, 20122016, we repurchased approximately 5had remaining authorization to repurchase up to $804 million shares for $172 million. For the year ended October 31, 2011 we repurchased 12 million shares for $497 million.
On November 22, 2013 we announced thatof our board of directors has authorized a new share repurchase program effective upon the conclusion of the company's existing $1 billion repurchase program. The new program is designed to reduce or eliminate dilution resulting from issuance ofcommon stock under the company's employee equity incentive programs to maintain a weighted average share count of approximately 335 million diluted shares.this program.
Dividends
DuringFor the yearyears ended October 31, 2013,2016, 2015 and 2014 cash dividends of $0.46 per share, or $156$150 million, $133 million and $176 million were declared and paid on the company's outstanding common stock. During the year ended October 31, 2012, cash dividendsstock, respectively. On November 16, 2016, we declared a quarterly dividend of $0.30$0.132 per share of common stock, or $104approximately $43 million were declared andwhich will be paid on January 25, 2017 to shareholders of record as of the company's outstanding common stock.close of business on January 3, 2017. The timing and amounts of any future dividends are subject to determination and approval by our board of directors.
On November 22, 2013 we announced that our board
Credit Facility
On October 20, 2011, weSeptember 15, 2014, Agilent entered into a five-year credit agreement with a financial institution which provides for a $400 million five-year unsecured credit facility that will expire on October 20, 2016. The company may use amounts borrowedSeptember 15, 2019. On June 9, 2015, the commitments under the existing credit facility were increased by $300 million so that the aggregate commitments under the facility for general corporate purposes.now total $700 million. For the year ended October 31, 2016, we borrowed $255 million and repaid $255 million by October 31, 2016. As of October 31, 20132016, the company hashad no borrowings outstanding under the facility. We were in compliance with the covenants for the credit facilitiesfacility during the yearyears ended October 31, 2013.
As a result of the Dako acquisition, we have a credit facility in Danish Krone equivalent of $9 million with a Danish financial institution.2016 and 2015. As of October 31, 2013December 20, 2016, the company had no borrowings of $65 million outstanding under the facility.this credit facility and may borrow more during fiscal year 2017.
Short-term debt
On July 13, 2010, the company issued an aggregate principal amount of $250 million in senior notes ("2013 senior notes"). The 2013 senior notes matured on July 15, 2013 and were paid in full.
On September 9, 2009, the company issued an aggregate principal amount of $250 million in senior notes ("2012 senior notes"). The 2012 senior notes matured on September 14, 2012 and were paid in full.
Long-term debt
In September 2009, the company issued an aggregate principal amount of $500 million in senior notes ("2015 senior notes"). The 2015 senior notes were issued at 99.69% of their principal amount. The notes will mature on September 14, 2015, and bear interest at a fixed rate of 5.50% per annum. The interest is payable semi-annually on March 14th and September 14th of each year, payments commenced on March 14, 2010.
On June 6, 2011, we terminated our interest rate swap contracts related to our 2015 senior notes that represented the notional amount of $500 million. The asset value, including interest receivable, upon termination for these contracts was approximately $31 million and the amount to be amortized at October 31, 2013 was $12 million. The gain is being deferred and amortized to interest expense over the remaining life of the 2015 senior notes.
In October 2007, the company issued an aggregate principal amount of $600 million in senior notes ("2017 senior notes"). The 2017 senior notes were issued at 99.60% of their principal amount. The notes will mature on November 1, 2017, and bear interest at a fixed rate of 6.50% per annum. The interest is payable semi-annually on May 1st and November 1st of each year and payments commenced on May 1, 2008.
On November 25, 2008, we terminated two interest rate swap contracts associated with our 2017 senior notes that represented the notional amount of $400 million. The asset value, including interest receivable, upon termination was approximately $43 million and the amount to be amortized at October 31, 20132016 was $22$1 million. The gain is being deferred and amortized to interest expense over the remaining life of the 2017 senior notes.
In July 2010, the company issued an aggregate principal amount of $500 million in senior notes ("2020 senior notes"). The 2020 senior notes were issued at 99.54% of their principal amount. The notes will mature on July 15, 2020, and bear interest at a fixed rate of 5.00% per annum. The interest is payable semi-annually on January 15th and July 15th of each year, payments commenced on January 15, 2011.
On August 9, 2011, we terminated our interest rate swap contracts related to our 2020 senior notes that represented the notional amount of $500 million. The asset value, including interest receivable, upon termination for these contracts was approximately $34 million and the amount to be amortized at October 31, 20122016 was $26$15 million. The gain is being deferred and amortized to interest expense over the remaining life of the 2020 senior notes.
In September 2012, the company issued an aggregate principal amount of $400 million in senior notes ("2022 senior notes"). The 2022 senior notes were issued at 99.80% of their principal amount. The notes will mature on October 1, 2022, and bear interest at a fixed rate of 3.20% per annum. The interest is payable semi-annually on April 1st and October 1st of each year, payments commenced on April 1, 2013. We used part of the proceeds from the issuance of the 2022 senior notes to pay the 2012 senior notes.
In June 2013, the company issued aggregate principal amount of $600 million in senior notes ("2023 senior notes"). The 2023 senior notes were issued at 99.544% of their principal amount. The notes will mature on July 15, 2023 and bear interest at a fixed rate of 3.875% per annum. InterestThe interest is payable semi annuallysemi-annually on January 15th and July 15th of each year and payments will commence January 15, 2014.
All notesOn September 15, 2016, the company issued are unsecured and rank equallyaggregate principal amount of $300 million in right of payment with all of Agilent's other senior unsecured indebtedness. The company incurred issuance costs of $5 million each in connection with the 2017 and 2023 senior notes ("2026 senior notes"). The 2026 senior notes were issued at 99.624%% of their principal amount. The notes will mature on September 22, 2026 and incurred $3 millionbear interest at a fixed rate of 3.050% per annum. The interest is payable semi-annually on March 22nd and September 22nd of each in connection with the 2015, 2020year and 2022 senior notes. These costs were capitalized in other assets on the consolidated balance sheet and the costs are being amortized to interest expense over the term of the senior notes.payments will commence March 22, 2017.
AsIn 2016, we paid approximately $37 million, of October 31, 2013, and as a result of the Dako acquisition, we have aour mortgage debt, secured on buildings in Denmark, in Danish Krone equivalent of $46 million aggregate principal outstanding withto a Danish financial institution. The loan has a variable interest rate basedgain recognized upon early payment was not material. No balance exists on 3 months Copenhagen Interbank Rate ("Cibor") and will mature on September 30, 2027. Interest payments are made in March, June, September and Decemberthis debt as of each year.October 31. 2016.
Off Balance Sheet Arrangements and Other
We have contractual commitments for non-cancelable operating leases. See Note 1715, "Commitments and Contingencies", to our consolidated financial statements for further information on our non-cancelable operating leases.
Our liquidity is affected by many factors, some of which are based on normal ongoing operations of our business and some of which arise from fluctuations related to global economics and markets. Our cash balances are generated and held in many locations throughout the world. Local government regulations may restrict our ability to move cash balances to meet cash needs under certain circumstances. We do not currently expect such regulations and restrictions to impact our ability to pay vendors and conduct operations throughout our global organization.
Contractual Commitments
Our cash flows from operations are dependent on a number of factors, including fluctuations in our operating results, accounts receivable collections, inventory management, and the timing of tax and other payments. As a result, the impact of contractual obligations on our liquidity and capital resources in future periods should be analyzed in conjunction with such factors.
The following table summarizes our total contractual obligations at October 31, 20132016 for Agilent operations and excludes amounts recorded in our consolidated balance sheet (in millions):
| | | | Less than one year | | One to three years | | Three to five years | | More than five years | Less than one year | | One to three years | | Three to five years | | More than five years |
| Operating leases | $ | 56 |
| | $ | 78 |
| | $ | 33 |
| | $ | 6 |
| $ | 38 |
| | $ | 60 |
| | $ | 22 |
| | $ | 26 |
|
| Commitments to contract manufacturers and suppliers | 727 |
| | 21 |
| | — |
| | — |
| 359 |
| | 3 |
| | — |
| | — |
|
| Other purchase commitments | 70 |
| | — |
| | — |
| | — |
| 62 |
| | — |
| | — |
| | — |
|
| Retirement plans | 103 |
| | — |
| | — |
| | — |
| 45 |
| | — |
| | — |
| | — |
|
| Total | $ | 956 |
| | $ | 99 |
| | $ | 33 |
| | $ | 6 |
| $ | 504 |
| | $ | 63 |
| | $ | 22 |
| | $ | 26 |
|
Operating leases. Commitments under operating leases relate primarily to leasehold property, see Note 17,15, "Commitments and Contingencies".
Commitments to contract manufacturers and suppliers. We purchase components from a variety of suppliers and use several contract manufacturers to provide manufacturing services for our products. During the normal course of business, we issue purchase orders with estimates of our requirements several months ahead of the delivery dates. The above amounts represent the commitments under the open purchase orders with our suppliers that have not yet been received. However, our agreements with these suppliers usually provide us the option to cancel, reschedule, and adjust our requirements based on our business needs prior to firm orders being placed. Typically purchase orders outstanding with delivery dates within 30 days are non-cancelable. Therefore, only approximately 55 percent of our reported purchase commitments arising from these agreements are firm, non-cancelable, and unconditional commitments. We expect to fulfill most of our purchase commitments for inventory within one year.
In addition to the above mentioned commitments to contract manufacturers and suppliers, in the past we recordrecorded a liability for firm, non-cancelable and unconditional purchase commitments for quantities in excess of our future demand forecasts consistent with our policy relating to excess inventory. As of October 31, 2013,2016, the liability for our firm, non-cancelable and unconditional purchase commitments was $5less than $1 million compared to $5 million, as of October 31, 20122015 and 2011.$10 million as of October 31, 2014. These amounts are included in other accrued liabilities in our consolidated balance sheet.
Other purchase commitments. We have categorized "other purchase commitments" related to contracts with professional services suppliers. Typically, we can cancel these contracts within 90 days without penalties. For those contracts that are not cancelable within 90 days without penalties, we are disclosing the amountstermination fees and costs or commitments for continued spending that we are obligated to pay to a supplier under each contract in thatcontact's termination period before such contract can be cancelled. Our contractual obligations with these suppliers under "other purchase commitments" were approximately $70$62 million within the next year.
Retirement Plans. Commitments under the retirement plans relate to expected contributions to be made to our U.S. and non-U.S. defined benefit plans and to our post-retirement medical plans for the next year only. Contributions after next year are impractical to estimate.
We had no material off-balance sheet arrangements as of October 31, 20132016 or October 31, 2012.2015.
On Balance Sheet Arrangements
The following table summarizes our total contractual obligations recorded in our consolidated balance sheet pertainingat October 31, 2016 related to our long-term debt as of October 31, 2013and interest expense (in millions):
|
| | | | | | | | | | | | | | | |
| | Less than one year | | One to three years | | Three to five years | | More than five years |
| Senior notes | $ | — |
| | $ | 1,100 |
| | $ | — |
| | $ | 1,500 |
|
| Other debt | — |
| | — |
| | — |
| | 46 |
|
| Total | $ | — |
| | $ | 1,100 |
| | $ | — |
| | $ | 1,546 |
|
We have contractual obligations for interest payments on the above debts. Interest rates and payment dates are detailed in
"Long-term debt". |
| | | | | | | | | | | | | | | |
| | Less than one year | | One to three years | | Three to five years | | More than five years |
| Senior notes | $ | — |
| | $ | 100 |
| | $ | 500 |
| | $ | 1,300 |
|
| Interest expense | 77 |
| | 144 |
| | 116 |
| | 106 |
|
| Total | $ | 77 |
| | $ | 244 |
| | $ | 616 |
| | $ | 1,406 |
|
Other long-term liabilities include $341$190 million and $320$227 million of liabilities for uncertain tax positions as of October 31, 20132016 and October 31, 2012,2015, respectively. We are unable to accurately predict when these amounts will be realized or released. However, it is reasonably possible that there could be significant changes to our unrecognized tax benefits in the next twelve months due to either the expiration of a statute of limitations or a tax audit settlement.
Item 7A. Quantitative and Qualitative Disclosures About Market Risk
We are exposed to foreign currency exchange rate risks inherent in our sales commitments, anticipated sales, and assets and liabilities denominated in currencies other than the functional currency of our subsidiaries. We hedge future cash flows denominated in currencies other than the functional currency using sales forecasts up to twelve months in advance. Our exposure to exchange rate risks is managed on an enterprise-wide basis. This strategy utilizes derivative financial instruments, including option and forward contracts, to hedge certain foreign currency exposures with the intent of offsetting gains and losses that occur on the underlying exposures with gains and losses on the derivative contracts hedging them. We do not currently and do not intend to utilize derivative financial instruments for speculative trading purposes.purposes.To the extent that we are required to pay for all, or portions, of an acquisition price in foreign currencies, we may enter into foreign exchange contracts to reduce the risk that currency movements will impact the cost of the transaction.
Our operations generate non-functional currency cash flows such as revenues, third party vendor payments and inter-company payments. In anticipation of these foreign currency cash flows and in view of volatility of the currency market, we enter into such foreign exchange contracts as are described above to manage our currency risk. Approximately 6354 percent of our revenue in 2016, 57 percent of our revenue in 2015 and 61 percent of our revenues in 2013, 63 percent of our revenues in 2012 and 64 percent of our revenues in 20112014 were generated in U.S. dollars.dollars.The unfavorable effects of changes in foreign currency exchange rates, principally as a result of the strength of the U.S. dollar, has decreased revenue by approximately 2 percentage points in the year ended October 31, 2016. The impact of foreign currency movements is calculated by applying the prior period foreign currency exchange rates to the current year period.
We performed a sensitivity analysis assuming a hypothetical 10 percent adverse movement in foreign exchange rates to the hedging contracts and the underlying exposures described above. As of October 31, 20132016 and 2012,2015, the analysis indicated that these hypothetical market movements would not have a material effect on our consolidated financial position, results of operations, statement of comprehensive income or cash flows.
We are also exposed to interest rate risk due to the mismatch between the interest expense we pay on our loans at fixed rates and the variable rates of interest we receive from cash, cash equivalents and other short-term investments. We have issued long-term debt in U.S. dollars or foreign currencies at fixed interest rates based on the market conditions at the time of financing. We believe that the fair value of our fixed rate debt changes when the underlying market rates of interest change, and we may use interest rate swaps to modify such market risk.
We performed a sensitivity analysis assuming a hypothetical 10 percent adverse movement in interest rates relating to the underlying fair value of our fixed rate debt. As of October 31, 20132016 and 2012,2015, the sensitivity analyses indicated that a hypothetical 10 percent adverse movement in interest rates would result in an immaterial impact to the fair value of our fixed interest rate debt.
Item 8. Financial Statements and Supplementary Data
|
| | |
| Index to Consolidated Financial Statements | | Page |
| | | |
| Consolidated Financial Statements: | | |
| | |
| | |
| | |
| | |
| | |
| | |
| | |
| | |
REPORT OF INDEPENDENT REGISTERED PUBLIC ACCOUNTING FIRM
Tothe Stockholders and Board of Directors of Agilent Technologies, Inc.:
In our opinion, the accompanying consolidated financialbalance sheets and the related consolidated statements listed in the index appearing under Item 8of operations, comprehensive income, equity and cash flows present fairly, in all material respects, the financial position of Agilent Technologies, Inc. and its subsidiaries at October 31, 20132016 and October 31, 2012,2015, and the results of their operations and their cash flows for each of the three years in the period ended October 31, 20132016 in conformity with accounting principles generally accepted in the United States of America. In addition, in our opinion, the financial statement schedule listed in the index appearing under item 15(a)(2)presents fairly, in all material respects, the information set forth therein when read in conjunction with the related consolidated financial statements. Also in our opinion, the Company maintained, in all material respects, effective internal control over financial reporting as of October 31, 2013,2016, based on criteria established in Internal Control - Integrated Framework (1992)(2013) issued by the Committee of Sponsoring Organizations of the Treadway Commission (COSO). The Company's management is responsible for these financial statements and financial statement schedule, for maintaining effective internal control over financial reporting and for its assessment of the effectiveness of internal control over financial reporting, included in Management's Report on Internal Control over Financial Reporting appearing under Item 9A.Reporting. Our responsibility is to express opinions on these financial statements, on the financial statement schedule, and on the Company's internal control over financial reporting based on our integrated audits. We conducted our audits in accordance with the standards of the Public Company Accounting Oversight Board (United States). Those standards require that we plan and perform the audits to obtain reasonable assurance about whether the financial statements are free of material misstatement and whether effective internal control over financial reporting was maintained in all material respects. Our audits of the financial statements included examining, on a test basis, evidence supporting the amounts and disclosures in the financial statements, assessing the accounting principles used and significant estimates made by management, and evaluating the overall financial statement presentation. Our audit of internal control over financial reporting included obtaining an understanding of internal control over financial reporting, assessing the risk that a material weakness exists, and testing and evaluating the design and operating effectiveness of internal control based on the assessed risk. Our audits also included performing such other procedures as we considered necessary in the circumstances. We believe that our audits provide a reasonable basis for our opinions.
As discussed in Note 2 to the consolidated financial statements, the Company changed the manner in which it accounts for deferred income taxes and share-based payments in 2016.
A company’s internal control over financial reporting is a process designed to provide reasonable assurance regarding the reliability of financial reporting and the preparation of financial statements for external purposes in accordance with generally accepted accounting principles. A company’s internal control over financial reporting includes those policies and procedures that (i) pertain to the maintenance of records that, in reasonable detail, accurately and fairly reflect the transactions and dispositions of the assets of the company; (ii) provide reasonable assurance that transactions are recorded as necessary to permit preparation of financial statements in accordance with generally accepted accounting principles, and that receipts and expenditures of the company are being made only in accordance with authorizations of management and directors of the company; and (iii) provide reasonable assurance regarding prevention or timely detection of unauthorized acquisition, use, or disposition of the company’s assets that could have a material effect on the financial statements.
Because of its inherent limitations, internal control over financial reporting may not prevent or detect misstatements. Also, projections of any evaluation of effectiveness to future periods are subject to the risk that controls may become inadequate because of changes in conditions, or that the degree of compliance with the policies or procedures may deteriorate.
|
| |
| /s/ PRICEWATERHOUSECOOPERS LLP | |
| | |
San Jose, California | |
December 19, 201320, 2016 | |
54
AGILENT TECHNOLOGIES, INC.
CONSOLIDATED STATEMENT OF OPERATIONS
| | | | Years Ended October 31, | Years Ended October 31, |
| | 2013 | | 2012 | | 2011 | 2016 | | 2015 | | 2014 |
| | (in millions, except per share data) | (in millions, except per share data) |
| Net revenue: | | | | | | | | | | |
| Products | $ | 5,534 |
| | $ | 5,659 |
| | $ | 5,482 |
| $ | 3,227 |
| | $ | 3,146 |
| | $ | 3,185 |
|
| Services and other | 1,248 |
| | 1,199 |
| | 1,133 |
| 975 |
| | 892 |
| | 863 |
|
| Total net revenue | 6,782 |
| | 6,858 |
| | 6,615 |
| 4,202 |
| | 4,038 |
| | 4,048 |
|
| Costs and expenses: | | | | | | | | | | |
| Cost of products | 2,576 |
| | 2,608 |
| | 2,473 |
| 1,464 |
| | 1,496 |
| | 1,568 |
|
| Cost of services and other | 671 |
| | 646 |
| | 613 |
| 541 |
| | 501 |
| | 504 |
|
| Total costs | 3,247 |
| | 3,254 |
| | 3,086 |
| 2,005 |
| | 1,997 |
| | 2,072 |
|
| Research and development | 704 |
| | 668 |
| | 649 |
| 329 |
| | 330 |
| | 358 |
|
| Selling, general and administrative | 1,880 |
| | 1,817 |
| | 1,809 |
| 1,253 |
| | 1,189 |
| | 1,199 |
|
| Total costs and expenses | 5,831 |
| | 5,739 |
| | 5,544 |
| 3,587 |
| | 3,516 |
| | 3,629 |
|
| Income from operations | 951 |
| | 1,119 |
| | 1,071 |
| 615 |
| | 522 |
| | 419 |
|
| Interest income | 7 |
| | 9 |
| | 14 |
| 11 |
| | 7 |
| | 9 |
|
| Interest expense | (107 | ) | | (101 | ) | | (86 | ) | (72 | ) | | (66 | ) | | (110 | ) |
| Other income (expense), net | 8 |
| | 16 |
| | 33 |
| (10 | ) | | 17 |
| | (89 | ) |
| Income before taxes | 859 |
| | 1,043 |
| | 1,032 |
| |
| Income from continuing operations before taxes | | 544 |
| | 480 |
| | 229 |
|
| Provision (benefit) for income taxes | 135 |
| | (110 | ) | | 20 |
| 82 |
| | 42 |
| | (3 | ) |
| Income from continuing operations | | 462 |
| | 438 |
| | 232 |
|
| Income (loss) from discontinued operations, net of tax expense (benefit) of $0, $(2) and $100 | | $ | — |
| | $ | (37 | ) | | $ | 317 |
|
| Net income | $ | 724 |
| | $ | 1,153 |
| | $ | 1,012 |
| $ | 462 |
| | $ | 401 |
| | $ | 549 |
|
| Net income per share: | | | | | | |
| Basic | $ | 2.12 |
| | $ | 3.31 |
| | $ | 2.92 |
| |
| Diluted | $ | 2.10 |
| | $ | 3.27 |
| | $ | 2.85 |
| |
| | | | | | | |
| Net income per share - basic: | | | | | | |
| Income from continuing operations | | $ | 1.42 |
| | $ | 1.32 |
| | $ | 0.70 |
|
| Income (loss) from discontinued operations | | — |
| | (0.12 | ) | | 0.95 |
|
| Net income per share - basic | | $ | 1.42 |
| | $ | 1.20 |
| | $ | 1.65 |
|
| | | | | | | |
| Net income per share - diluted: | | | | | | |
| Income from continuing operations | | $ | 1.40 |
| | $ | 1.31 |
| | $ | 0.69 |
|
| Income (loss) from discontinued operations | | — |
| | (0.11 | ) | | 0.93 |
|
| Net income per share - diluted | | $ | 1.40 |
| | $ | 1.20 |
| | $ | 1.62 |
|
| | | | | | | |
| Weighted average shares used in computing net income per share: | | | | | | | | | | |
| Basic | 341 |
| | 348 |
| | 347 |
| 326 |
| | 333 |
| | 333 |
|
| Diluted | 345 |
| | 353 |
| | 355 |
| 329 |
| | 335 |
| | 338 |
|
| | | | | | | | | | | |
| Cash dividends declared per common share | $ | 0.46 |
| | $ | 0.30 |
| | $ | — |
| $ | 0.460 |
| | $ | 0.400 |
| | $ | 0.528 |
|
The accompanying notes are an integral part of these consolidated financial statements.
AGILENT TECHNOLOGIES, INC.
CONSOLIDATED STATEMENT OF COMPREHENSIVE INCOME
(in millions)
|
| | | | | | | | | | | | |
| | Years Ended October 31, |
| | 2013 | | 2012 | | 2011 | |
| | | | | | | |
| Net income | $ | 724 |
| | $ | 1,153 |
| | $ | 1,012 |
| |
| Other comprehensive income (loss): |
| |
| |
| |
| Change in unrealized gain on investments, net of tax expense (benefit) of $2, $(8) and $0 | 7 |
| | 6 |
| | (4 | ) | |
| Gain on derivative instruments, net of tax expense of $2, $3 and $0 | 8 |
| | 7 |
| | — |
| |
| Amounts reclassified into earnings related to derivative instruments, net of tax benefit of $(3), $(2) and $(2) | (10 | ) | | (6 | ) | | 3 |
| |
| Foreign currency translation | 1 |
| | (28 | ) | | 94 |
| |
| Net defined benefit pension cost and post retirement plan costs: |
| |
| |
| |
| Change in actuarial net loss, net of tax expense (benefit) of $114, $(61), and $(3) | 228 |
| | (175 | ) | | (38 | ) | |
| Change in net prior service benefit, net of tax benefit of $(16), $(17), and $0 | (32 | ) | | (31 | ) | | 149 |
| |
| Other comprehensive income (loss) | 202 |
| | (227 | ) | | 204 |
| |
| Total comprehensive income | $ | 926 |
| | $ | 926 |
| | $ | 1,216 |
| |
|
| | | | | | | | | | | | |
| | Years Ended October 31, |
| | 2016 | | 2015 | | 2014 | |
| | | | | | | |
| Net income | $ | 462 |
| | $ | 401 |
| | $ | 549 |
| |
| Other comprehensive income (loss): |
| |
| |
| |
| Unrealized gain on investments, net of tax expense of $0, $0 and $1 | — |
| | — |
| | 11 |
| |
| Amounts reclassified into earnings related to investments, net of tax of $0, $0 and $0 | — |
| | — |
| | (1 | ) | |
| Gain (loss) on derivative instruments, net of tax expense (benefit) of $(4), $3 and $5 | (6 | ) | | 8 |
| | 8 |
| |
| Amounts reclassified into earnings related to derivative instruments, net of tax expense (benefit) of $0, $(6) and $0 | 3 |
| | (12 | ) | | 1 |
| |
| Foreign currency translation, net of tax expense (benefit) of $3, $(24) and $(8) | (8 | ) | | (336 | ) | | (269 | ) | |
| Net defined benefit pension cost and post retirement plan costs: |
| |
| |
| |
| Change in actuarial net loss, net of tax benefit of $(42), $(17), and $(65) | (86 | ) | | (38 | ) | | (143 | ) | |
| Change in net prior service benefit, net of tax benefit of $(8), $(6), and $(16) | (15 | ) | | (11 | ) | | (32 | ) | |
| Other comprehensive loss | (112 | ) | | (389 | ) | | (425 | ) | |
| Total comprehensive income | $ | 350 |
| | $ | 12 |
| | $ | 124 |
| |
The accompanying notes are an integral part of these condensed consolidated financial statements.
AGILENT TECHNOLOGIES, INC.
CONSOLIDATED BALANCE SHEET | | | | October 31, | October 31, |
| | 2013 | | 2012 | 2016 | | 2015 |
| | (in millions, except par value and share data) | (in millions, except par value and share data) |
| ASSETS | | | | | | |
| Current assets: | | | | | | |
| Cash and cash equivalents | $ | 2,675 |
| | $ | 2,351 |
| $ | 2,289 |
| | $ | 2,003 |
|
| Short-term restricted cash and cash equivalents | | — |
| | 242 |
|
| Accounts receivable, net | 899 |
| | 923 |
| 631 |
| | 606 |
|
| Inventory | 1,066 |
| | 1,014 |
| 533 |
| | 541 |
|
| Other current assets | 343 |
| | 341 |
| 182 |
| | 294 |
|
| Total current assets | 4,983 |
| | 4,629 |
| 3,635 |
| | 3,686 |
|
| Property, plant and equipment, net | 1,134 |
| | 1,164 |
| 639 |
| | 604 |
|
| Goodwill | 3,047 |
| | 3,025 |
| 2,517 |
| | 2,366 |
|
| Other intangible assets, net | 916 |
| | 1,086 |
| 408 |
| | 445 |
|
| Long-term investments | 139 |
| | 109 |
| 135 |
| | 86 |
|
| Other assets | 467 |
| | 523 |
| 468 |
| | 292 |
|
| Total assets | $ | 10,686 |
| | $ | 10,536 |
| $ | 7,802 |
| | $ | 7,479 |
|
| LIABILITIES AND EQUITY | | | | | | |
| Current liabilities: | | | | | | |
| Accounts payable | $ | 432 |
| | $ | 461 |
| $ | 257 |
| | $ | 279 |
|
| Employee compensation and benefits | 401 |
| | 387 |
| 235 |
| | 221 |
|
| Deferred revenue | 439 |
| | 420 |
| 269 |
| | 258 |
|
| Short-term debt | — |
| | 250 |
| |
| Other accrued liabilities | 330 |
| | 375 |
| 184 |
| | 218 |
|
| Total current liabilities | 1,602 |
| | 1,893 |
| 945 |
| | 976 |
|
| Long-term debt | 2,699 |
| | 2,112 |
| 1,912 |
| | 1,655 |
|
| Retirement and post-retirement benefits | 294 |
| | 554 |
| 360 |
| | 264 |
|
| Other long-term liabilities | 802 |
| | 792 |
| 339 |
| | 414 |
|
| Total liabilities | 5,397 |
| | 5,351 |
| 3,556 |
| | 3,309 |
|
| Commitments and contingencies (Note 17) |
|
| |
|
| |
| Commitments and contingencies (Note 15) | |
|
| |
|
|
| Total equity: | | | | | | |
| Stockholders' equity: | | | | | | |
| Preferred stock; $0.01 par value; 125 million shares authorized; none issued and outstanding | — |
| | — |
| — |
| | — |
|
| Common stock; $0.01 par value; 2 billion shares authorized; 602 million shares at October 31, 2013 and 595 million shares at October 31, 2012 issued | 6 |
| | 6 |
| |
| Treasury stock at cost; 269 million shares at October 31, 2013 and 249 million shares at October 31, 2012 | (9,607 | ) | | (8,707 | ) | |
| Common stock; $0.01 par value; 2 billion shares authorized; 614 million shares at October 31, 2016 and 611 million shares at October 31, 2015 issued | | 6 |
| | 6 |
|
| Treasury stock at cost; 290 million shares at October 31, 2016 and 279 million shares at October 31, 2015 | | (10,508 | ) | | (10,074 | ) |
| Additional paid-in-capital | 8,723 |
| | 8,489 |
| 9,159 |
| | 9,045 |
|
| Retained earnings | 6,073 |
| | 5,505 |
| 6,089 |
| | 5,581 |
|
| Accumulated other comprehensive income (loss) | 91 |
| | (111 | ) | |
| Accumulated other comprehensive loss | | (503 | ) | | (391 | ) |
| Total stockholders' equity | 5,286 |
| | 5,182 |
| 4,243 |
| | 4,167 |
|
| Non-controlling interest | 3 |
| | 3 |
| 3 |
| | 3 |
|
| Total equity | 5,289 |
| | 5,185 |
| 4,246 |
| | 4,170 |
|
| Total liabilities and equity | $ | 10,686 |
| | $ | 10,536 |
| $ | 7,802 |
| | $ | 7,479 |
|
The accompanying notes are an integral part of these consolidated financial statements.
AGILENT TECHNOLOGIES, INC.
CONSOLIDATED STATEMENT OF CASH FLOWS
| | | | Years Ended October 31, | Years Ended October 31, |
| | 2013 | | 2012 | | 2011 | 2016 | | 2015 (As Adjusted) | | 2014 (As Adjusted) |
| | (in millions) | (in millions) |
| Cash flows from operating activities: | | | | | | | | | | |
| Net income | $ | 724 |
| | $ | 1,153 |
| | $ | 1,012 |
| $ | 462 |
| | $ | 401 |
| | $ | 549 |
|
| Adjustments to reconcile net income to net cash provided by operating activities: | | | | | | | | | | |
| Depreciation and amortization | 372 |
| | 301 |
| | 253 |
| 246 |
| | 253 |
| | 384 |
|
| Accelerated amortization of interest rate swap gain (due to early redemption of debt) | | — |
| | — |
| | (22 | ) |
| Share-based compensation | 85 |
| | 74 |
| | 72 |
| 58 |
| | 54 |
| | 96 |
|
| Excess tax benefit from share-based plans | (2 | ) | | — |
| | — |
| |
| Deferred taxes | 31 |
| | (158 | ) | | 38 |
| 3 |
| | 70 |
| | (192 | ) |
| Excess and obsolete inventory and inventory related charges | 48 |
| | 30 |
| | 30 |
| 20 |
| | 30 |
| | 79 |
|
| Non-cash restructuring and asset impairment charges | 3 |
| | 1 |
| | 10 |
| 4 |
| | 3 |
| | 23 |
|
| Impairment of equity method investment and loans | | 25 |
| | — |
| | — |
|
| Net gain on sale of investments | (1 | ) | | (4 | ) | | (6 | ) | (1 | ) | | — |
| | (1 | ) |
| Net (gain) loss on sale of assets and divestitures | 3 |
| | 2 |
| | 2 |
| (1 | ) | | 3 |
| | (10 | ) |
| Other | 3 |
| | 5 |
| | 8 |
| 17 |
| | 13 |
| | 10 |
|
| Changes in assets and liabilities: | | | | | | | | | | |
| Accounts receivable, net | 14 |
| | 19 |
| | 11 |
| (33 | ) | | (24 | ) | | (119 | ) |
| Inventory | (100 | ) | | (52 | ) | | (208 | ) | (7 | ) | | (24 | ) | | (99 | ) |
| Accounts payable | (27 | ) | | (31 | ) | | (35 | ) | (15 | ) | | (26 | ) | | 50 |
|
| Employee compensation and benefits | 16 |
| | (54 | ) | | 24 |
| 15 |
| | 8 |
| | 9 |
|
| Interest rate swap proceeds | — |
| | — |
| | 65 |
| |
| Interest rate swap payments | | (10 | ) | | — |
| | — |
|
| Other assets and liabilities | (17 | ) | | (58 | ) | | (16 | ) | 10 |
| | (249 | ) | | (26 | ) |
| Net cash provided by operating activities | 1,152 |
| | 1,228 |
| | 1,260 |
| 793 |
| | 512 |
| | 731 |
|
| Cash flows from investing activities: | | | | | | | | | | |
| Investments in property, plant and equipment | (195 | ) | | (194 | ) | | (188 | ) | (139 | ) | | (98 | ) | | (205 | ) |
| Proceeds from the sale of property, plant and equipment | 2 |
| | — |
| | 18 |
| — |
| | 12 |
| | 14 |
|
| Proceeds from lease receivable | — |
| | 80 |
| | — |
| |
| Proceeds from the sale of investment securities | 12 |
| | 5 |
| | 16 |
| 1 |
| | — |
| | 1 |
|
| Proceeds from divestitures | — |
| | — |
| | 1 |
| — |
| | 3 |
| | 2 |
|
| Payment to acquire cost method investment | | (80 | ) | | — |
| | — |
|
| Payment to acquire equity method investment | (21 | ) | | — |
| | — |
| — |
| | (1 | ) | | (25 | ) |
| Purchase of other investments | (25 | ) | | — |
| | — |
| |
| Payment in exchange for convertible note | | (1 | ) | | (2 | ) | | — |
|
| Loan to equity method investment | | (3 | ) | | — |
| | — |
|
| Change in restricted cash, cash equivalents and investments, net | — |
| | — |
| | 1,545 |
| 245 |
| | (240 | ) | | (4 | ) |
| Acquisitions of businesses and intangible assets, net of cash acquired | (21 | ) | | (2,257 | ) | | (98 | ) | (261 | ) | | (74 | ) | | (13 | ) |
| Net cash provided by (used in) investing activities | (248 | ) | | (2,366 | ) | | 1,294 |
| |
| Net cash used in investing activities | | (238 | ) | | (400 | ) | | (230 | ) |
| Cash flows from financing activities: | | | | | | | | | | |
| Issuance of common stock under employee stock plans | 161 |
| | 100 |
| | 304 |
| 62 |
| | 58 |
| | 188 |
|
| Payment of taxes related to net share settlement of equity awards | | (6 | ) | | (13 | ) | | (19 | ) |
| Treasury stock repurchases | (900 | ) | | (172 | ) | | (497 | ) | (434 | ) | | (267 | ) | | (200 | ) |
| Payment of dividends | (156 | ) | | (104 | ) | | — |
| (150 | ) | | (133 | ) | | (176 | ) |
| Issuance of senior notes | 597 |
| | 399 |
| | — |
| 299 |
| | — |
| | 1,099 |
|
| Debt issuance costs | (5 | ) | | (3 | ) | | — |
| (2 | ) | | — |
| | (9 | ) |
| Repayment of senior notes | (250 | ) | | (250 | ) | | — |
| — |
| | — |
| | (1,000 | ) |
| Purchase of non-controlling interest | (3 | ) | | (6 | ) | | — |
| |
| Proceeds from debts and credit facility | | 255 |
| | — |
| | 87 |
|
| Repayment of debts and credit facility | — |
| | (1 | ) | | (1,500 | ) | (292 | ) | | — |
| | (87 | ) |
| Excess tax benefit from share-based plans | 2 |
| | — |
| | — |
| |
| Net transfer of cash and cash equivalents to Keysight | | — |
| | (734 | ) | | — |
|
| Net cash used in financing activities | (554 | ) | | (37 | ) | | (1,693 | ) | (268 | ) | | (1,089 | ) | | (117 | ) |
| Effect of exchange rate movements | (26 | ) | | (1 | ) | | 17 |
| (1 | ) | | (48 | ) | | (31 | ) |
| Net increase (decrease) in cash and cash equivalents | 324 |
| | (1,176 | ) | | 878 |
| 286 |
| | (1,025 | ) | | 353 |
|
| Change in cash and cash equivalents within current assets of discontinued operations | | — |
| | 810 |
| | — |
|
| Cash and cash equivalents at beginning of year | 2,351 |
| | 3,527 |
| | 2,649 |
| 2,003 |
| | 2,218 |
| | 2,675 |
|
| Cash and cash equivalents at end of year | $ | 2,675 |
| | $ | 2,351 |
| | $ | 3,527 |
| $ | 2,289 |
| | $ | 2,003 |
| | $ | 3,028 |
|
| | | | | | | |
| Supplemental cash flow information: | | | | | | |
| Income tax payments, net | | $ | 67 |
| | $ | 129 |
| | $ | 131 |
|
| Interest payments | | $ | 73 |
| | $ | 71 |
| | $ | 142 |
|
The accompanying notes are an integral part of these consolidated financial statements.
AGILENT TECHNOLOGIES, INC.
CONSOLIDATED STATEMENT OF EQUITY
|
| | | | | | | | | | | | | | | | | | | | | | | | | | | | | | | | | | | | | |
| | Common Stock | | Treasury Stock | | | | Accumulated Other Comprehensive Income/(Loss) | | | | | | |
| | Number of Shares | | Par Value | | Additional Paid-in Capital | | Number of Shares | | Treasury Stock at Cost | | Retained Earnings | | Total Stockholders' Equity | | Non- Controlling Interests | | Total Equity |
| | (in millions, except number of shares in thousands) |
| Balance as of October 31, 2010 | 578,827 |
| | $ | 6 |
| | $ | 7,904 |
| | (232,683 | ) | | $ | (8,038 | ) | | $ | 3,444 |
| | $ | (88 | ) | | $ | 3,228 |
| | $ | 8 |
| | $ | 3,236 |
|
| Components of comprehensive income, net of tax: | | | | | | | | | | | | | | | | | | | |
| Net income | — |
| | — |
| | — |
| | — |
| | — |
| | 1,012 |
| | — |
| | 1,012 |
| | — |
| | 1,012 |
|
| Other comprehensive income | — |
| | — |
| | — |
| | — |
| | — |
| | — |
| | 204 |
| | 204 |
| | — |
| | 204 |
|
| Total comprehensive income | |
| | |
| | |
| | |
| | |
| | |
| | |
| | 1,216 |
| | |
| 1,216 |
|
| Share-based awards issued | 11,841 |
| | — |
| | 289 |
| | — |
| | — |
| | — |
| | — |
| | 289 |
| | — |
| | 289 |
|
| Repurchase of common stock | — |
| | — |
| | — |
| | (11,603 | ) | | (497 | ) | | — |
| | — |
| | (497 | ) | | — |
| | (497 | ) |
| Share-based compensation | — |
| | — |
| | 72 |
| | — |
| | — |
| | — |
| | — |
| | 72 |
| | — |
| | 72 |
|
| Balance as of October 31, 2011 | 590,668 |
| | $ | 6 |
| | $ | 8,265 |
| | (244,286 | ) | | $ | (8,535 | ) | | $ | 4,456 |
| | $ | 116 |
| | $ | 4,308 |
| | $ | 8 |
| | $ | 4,316 |
|
| Components of comprehensive income, net of tax: | | | | | | | | | | | | | | | | | | | |
| Net income | — |
| | — |
| | — |
| | — |
| | — |
| | 1,153 |
| | — |
| | 1,153 |
| | — |
| | 1,153 |
|
| Other comprehensive loss | — |
| | — |
| | — |
| | — |
| | — |
| | — |
| | (227 | ) | | (227 | ) | | — |
| | (227 | ) |
| Total comprehensive income | |
| | |
| | |
| | |
| | |
| | |
| | |
| | 926 |
| | | | 926 |
|
| Cash dividends declared ($0.30 per common share) | — |
| | — |
| | — |
| | — |
| | — |
| | (104 | ) | | — |
| | (104 | ) | | — |
| | (104 | ) |
| Change in non-controlling interest | — |
| | — |
| | — |
| | — |
| | — |
| | — |
| | — |
| | — |
| | (5 | ) | | (5 | ) |
| Share-based awards issued | 4,591 |
| | — |
| | 84 |
| | — |
| | — |
| | — |
| | — |
| | 84 |
| | — |
| | 84 |
|
| Cumulative excess tax benefits realized from share-based awards issued | — |
| | — |
| | 66 |
| | — |
| | — |
| | — |
| | — |
| | 66 |
| | — |
| | 66 |
|
| Repurchase of common stock | — |
| | — |
| | — |
| | (4,500 | ) | | (172 | ) | | — |
| | — |
| | (172 | ) | | — |
| | (172 | ) |
| Share-based compensation | — |
| | — |
| | 74 |
| | — |
| | — |
| | — |
| | — |
| | 74 |
| | — |
| | 74 |
|
| Balance as of October 31, 2012 | 595,259 |
| | $ | 6 |
| | $ | 8,489 |
| | (248,786 | ) | | $ | (8,707 | ) | | $ | 5,505 |
| | $ | (111 | ) | | $ | 5,182 |
| | $ | 3 |
| | $ | 5,185 |
|
| Components of comprehensive income, net of tax: | | | | | | | | | | | | | | | | | | | |
| Net income | — |
| | — |
| | — |
| | — |
| | — |
| | 724 |
| | — |
| | 724 |
| | — |
| | 724 |
|
| Other comprehensive income | — |
| | — |
| | — |
| | — |
| | — |
| | — |
| | 202 |
| | 202 |
| | — |
| | 202 |
|
| Total comprehensive income | |
| | |
| | |
| | |
| | |
| | |
| | |
| | 926 |
| | | | 926 |
|
| Cash dividends declared ($0.46 per common share) | — |
| | — |
| | — |
| | — |
| | — |
| | (156 | ) | | — |
| | (156 | ) | | — |
| | (156 | ) |
| Change in non-controlling interest | — |
| | — |
| | — |
| | — |
| | — |
| | — |
| | — |
| | — |
| | — |
| | — |
|
| Share-based awards issued | 6,370 |
| | — |
| | 147 |
| | — |
| | — |
| | — |
| | — |
| | 147 |
| | — |
| | 147 |
|
| Tax benefit from share based awards issued | — |
| | — |
| | 2 |
| | — |
| | — |
| | — |
| | — |
| | 2 |
| | — |
| | 2 |
|
| Repurchase of common stock | — |
| | — |
| | — |
| | (20,544 | ) | | (900 | ) | | — |
| | — |
| | (900 | ) | | — |
| | (900 | ) |
| Share-based compensation | — |
| | — |
| | 85 |
| | — |
| | — |
| | — |
| | — |
| | 85 |
| | — |
| | 85 |
|
| Balance as of October 31, 2013 | 601,629 |
| | $ | 6 |
| | $ | 8,723 |
| | (269,330 | ) | | $ | (9,607 | ) | | $ | 6,073 |
| | $ | 91 |
| | $ | 5,286 |
| | $ | 3 |
| | $ | 5,289 |
|
The accompanying notes are an integral part of these consolidated financial statements.
AGILENT TECHNOLOGIES, INC.
CONSOLIDATED STATEMENT OF EQUITY |
| | | | | | | | | | | | | | | | | | | | | | | | | | | | | | | | | | | | | |
| | Common Stock | | Treasury Stock | | | | Accumulated Other Comprehensive Income/(Loss) | | | | | | |
| | Number of Shares | | Par Value | | Additional Paid-in Capital | | Number of Shares | | Treasury Stock at Cost | | Retained Earnings | | Total Stockholders' Equity | | Non- Controlling Interests | | Total Equity |
| | (in millions, except number of shares in thousands) |
| Balance as of October 31, 2013 | 601,629 |
| | $ | 6 |
| | $ | 8,711 |
| | (269,330 | ) | | $ | (9,607 | ) | | $ | 6,096 |
| | $ | 91 |
| | $ | 5,297 |
| | $ | 3 |
| | $ | 5,300 |
|
| Components of comprehensive income, net of tax: | | | | | | | | | | | | | | | | | | | |
| Net income | — |
| | — |
| | — |
| | — |
| | — |
| | 549 |
| | — |
| | 549 |
| | — |
| | 549 |
|
| Other comprehensive loss | — |
| | — |
| | — |
| | — |
| | — |
| | — |
| | (425 | ) | | (425 | ) | | — |
| | (425 | ) |
| Total comprehensive income | |
| | |
| | |
| | |
| | |
| | |
| | |
| | 124 |
| | |
| 124 |
|
| Cash dividends declared ($0.528 per common share) | — |
| | — |
| | — |
| | — |
| | — |
| | (176 | ) | | — |
| | (176 | ) | | — |
| | (176 | ) |
| Share-based awards issued | 6,261 |
| | — |
| | 170 |
| | — |
| | — |
| | — |
| | — |
| | 170 |
| | — |
| | 170 |
|
| Repurchase of common stock | — |
| | — |
| | — |
| | (3,594 | ) | | (200 | ) | | — |
| | — |
| | (200 | ) | | — |
| | (200 | ) |
| Adjustment to cumulative excess tax benefits realized from share based awards issued | — |
| | — |
| | (11 | ) | | — |
| | — |
| | | | — |
| | (11 | ) | | | | (11 | ) |
| Tax benefits from share-based awards issued | — |
| | — |
| | 1 |
| | — |
| | — |
| | — |
| | — |
| | 1 |
| | — |
| | 1 |
|
| Share-based compensation | — |
| | — |
| | 96 |
| | — |
| | — |
| | — |
| | — |
| | 96 |
| | — |
| | 96 |
|
| Balance as of October 31, 2014 | 607,890 |
| | $ | 6 |
| | $ | 8,967 |
| | (272,924 | ) | | $ | (9,807 | ) | | $ | 6,469 |
| | $ | (334 | ) | | $ | 5,301 |
| | $ | 3 |
| | $ | 5,304 |
|
| Components of comprehensive income, net of tax: | | | | | | | | | | | | | | | | | | | |
| Net income | — |
| | — |
| | — |
| | — |
| | — |
| | 401 |
| | — |
| | 401 |
| | — |
| | 401 |
|
| Other comprehensive loss | — |
| | — |
| | — |
| | — |
| | — |
| | — |
| | (389 | ) | | (389 | ) | | — |
| | (389 | ) |
| Total comprehensive income | |
| | |
| | |
| | |
| | |
| | |
| | |
| | 12 |
| | | | 12 |
|
| Cash dividends declared ($0.40 per common share) | — |
| | — |
| | — |
| | — |
| | — |
| | (133 | ) | | — |
| | (133 | ) | | — |
| | (133 | ) |
| Distribution of Keysight | — |
| | — |
| | (28 | ) | | — |
| | — |
| | (1,156 | ) | | 332 |
| | (852 | ) | | — |
| | (852 | ) |
| Share-based awards issued | 2,964 |
| | — |
| | 44 |
| | — |
| | — |
| | — |
| | — |
| | 44 |
| | — |
| | 44 |
|
| Tax benefits from share-based awards issued | — |
| | — |
| | 8 |
| | — |
| | — |
| | — |
| | — |
| | 8 |
| | — |
| | 8 |
|
| Repurchase of common stock | — |
| | — |
| | — |
| | (6,471 | ) | | (267 | ) | | — |
| | — |
| | (267 | ) | | — |
| | (267 | ) |
| Share-based compensation | — |
| | — |
| | 54 |
| | — |
| | — |
| | — |
| | — |
| | 54 |
| | — |
| | 54 |
|
| Balance as of October 31, 2015 | 610,854 |
| | $ | 6 |
| | $ | 9,045 |
| | (279,395 | ) | | $ | (10,074 | ) | | $ | 5,581 |
| | $ | (391 | ) | | $ | 4,167 |
| | $ | 3 |
| | $ | 4,170 |
|
| Adjustment due to adoption of ASU 2016-09 | — |
| | — |
| | — |
| | — |
| | — |
| | 196 |
| | — |
| | 196 |
| | — |
| | 196 |
|
| Components of comprehensive income, net of tax: | | | | | | | | | | | | | | | | | | | |
| Net income | — |
| | — |
| | — |
| | — |
| | — |
| | 462 |
| | — |
| | 462 |
| | — |
| | 462 |
|
| Other comprehensive loss | — |
| | — |
| | — |
| | — |
| | — |
| | — |
| | (112 | ) | | (112 | ) | | — |
| | (112 | ) |
| Total comprehensive income | |
| | |
| | |
| | |
| | |
| | |
| | |
| | 350 |
| | | | 350 |
|
| Cash dividends declared ($0.46 per common share) | — |
| | — |
| | — |
| | — |
| | — |
| | (150 | ) | | — |
| | (150 | ) | | — |
| | (150 | ) |
| Share-based awards issued | 2,682 |
| | — |
| | 56 |
| | — |
| | — |
| | — |
| | — |
| | 56 |
| | — |
| | 56 |
|
| Repurchase of common stock | — |
| | — |
| | — |
| | (10,680 | ) | | (434 | ) | | — |
| | — |
| | (434 | ) | | — |
| | (434 | ) |
| Share-based compensation | — |
| | — |
| | 58 |
| | — |
| | — |
| | — |
| | — |
| | 58 |
| | — |
| | 58 |
|
| Balance as of October 31, 2016 | 613,536 |
| | $ | 6 |
| | $ | 9,159 |
| | (290,075 | ) | | $ | (10,508 | ) | | $ | 6,089 |
| | $ | (503 | ) | | $ | 4,243 |
| | $ | 3 |
| | $ | 4,246 |
|
The accompanying notes are an integral part of these consolidated financial statements.
AGILENT TECHNOLOGIES, INC.
NOTES TO CONSOLIDATED FINANCIAL STATEMENTS
1. OVERVIEW AND SUMMARY OF SIGNIFICANT ACCOUNTING POLICIES
Overview. Agilent Technologies Inc. ("we", "Agilent" or the "company"), incorporated in Delaware in May 1999, is a measurement company, providing core bio-analytical and electronic measurement solutions to theglobal leader in life sciences, diagnostics and genomics,applied chemical analysis, communicationsmarkets, providing application focused solutions that includes instruments, software, services and electronics industries.consumables for the entire laboratory workflow.
AgilentKeysight Separation. On September 19, 2013, Agilent announced plans to separate into two publicly traded companies, one comprising of the life sciences, diagnostics and chemical analysis businesses that will retain the Agilent name,and the other that will be comprised of the electronic measurement business ("EM"). The separation is expected to occur through a tax-free pro rata spin off of the EM company to Agilent shareholders and is expected to be completed early in November 2014.
New Segment. We formed a new operating segment in the fourth fiscal quarter of 2013. The new life sciences and diagnostics segment was formed by the combination of the life sciences business plus the diagnostics and genomics business. Following this reorganization, Agilent has three business segments comprised of the life sciences and diagnostics business, the chemical analysis business and the electronic measurement business. The historical segment financial information for the life sciences and diagnostics segment has been recast to conform to this new reporting structure in our financial statements.
Acquisition of Dako A/S. On June 21, 2012,1, 2014, we completed our acquisition of Dako A/S through the acquisitiondistribution of 100% of the outstanding common shares of Keysight Technologies, Inc. ("Keysight") to Agilent stockholders who received one share capital of Dako A/S, a limited liability company incorporated under the lawsKeysight common stock for every two shares of Denmark (“Dako”), under the share purchase agreement, dated May 16, 2012. Dako provides antibodies, reagents, scientific instruments and software primarily to customers in pathology laboratories. As a resultAgilent held as of the acquisition, Dako became a wholly-owned subsidiaryclose of Agilent.business on the record date, October 22, 2014. The consideration paid was approximately $2,143 million,historical results of which $1,400 million was paid directly to the seller and $743 million was paid to satisfy the outstanding debt of Dako. Agilent funded the acquisition using existing cash. The acquisition has been accounted for in accordance with the authoritative accounting guidanceoperations and the resultsfinancial position of DakoKeysight are included in Agilent'sthe consolidated financial statements of Agilent and are reported as discontinued operations within this Form 10-K.
Exit of Nuclear Magnetic Resonance Business. During the fourth quarter of fiscal year 2014, we made the decision to cease the manufacture and sale of our nuclear magnetic resonance (“NMR”) product line within our life sciences and applied markets segment. In connection with the exit from this business, we recorded approximately $6 million and $68 million in restructuring and other related costs in 2015 and 2014, respectively. The exit of the date of acquisition. The acquisition of Dako and its portfolioNMR business was another step to increase our growthcompleted in several rapidly expanding areas of diagnostics, including atomic pathology and molecular diagnostics, as well as strengthen our existing offerings with a focus on product development to help in the fight against cancer. For additional details related to the acquisition of Dako, see Note 3, "Acquisitions".fiscal year 2016.
Basis of presentation. The accompanying financial data has been prepared by us pursuant to the rules and regulations of the U.S. Securities and Exchange Commission ("SEC") and is in conformity with U.S. generally accepted accounting principles ("GAAP"). Our fiscal year end is October 31. Unless otherwise stated, all years and dates refer to our fiscal year.
In the first quarter of 2013, we adopted the updated authoritative guidance that increases the prominence of items reported in other comprehensive income. For additional details related to the updated authoritative guidance, see Note 2, "New Accounting Pronouncements".
Revisions. The statement of cash flows for the year ended October 31, 2012 has been revised to correct the presentation of the purchase of non-controlling interest from investing to financing activities and is not considered material. There was no impact on previously reported net income or the change in net cash for the year ended October 31, 2012. In Note 10, "Goodwill and Other Intangible Assets", the presentation of goodwill has been revised as of October 31, 2012 and 2011 to correct the allocation of goodwill between segments and is not considered material. There was no impact to the previously reported total balance of goodwill as of October 31, 2012 and 2011.
Reclassifications. Segment disclosure amounts have been reclassified to conform to the current year presentation with no impact on previously reported net income.
Management is responsible for the fair presentation of the accompanying consolidated financial statements, prepared in accordance with U.S. GAAP, and has full responsibility for their integrity and accuracy. In the opinion of management, the accompanying consolidated financial statements contain all adjustments necessary to present fairly our consolidated balance sheet, statement of operations, statement of comprehensive income, statement of cash flows and statement of equity for all periods presented.
Principles of consolidation. The consolidated financial statements include the accounts of the company and our wholly- and majority-owned subsidiaries. All significant intercompany accounts and transactions have been eliminated.
Use of estimates. The preparation of financial statements in accordance with accounting principles generally accepted in the U.S. GAAP requires management to make estimates and assumptions that affect the amounts reported in our consolidated financial statements and accompanying notes. Management bases its estimates on historical experience and various other assumptions believed to be reasonable. Although these estimates are based on management's best knowledge of current events and actions that may impact the company in the future, actual results may be different from the estimates. Our critical accounting policies are those that affect our financial statements materially and involve difficult, subjective or complex judgments by management. Those policies are revenue recognition, valuation of goodwill and purchased intangible assets, inventory valuation, share-based compensation, retirement and post-retirement plan assumptions restructuring and accounting for income taxes.
Revenue recognition. We enter into agreements to sell products (hardware and/or software), services and other arrangements (multiple element arrangements) that include combinations of products and services.
We recognize revenue, net of trade discounts and allowances, provided that (1) persuasive evidence of an arrangement exists, (2) delivery has occurred, (3) the price is fixed or determinable and (4) collectability is reasonably assured. Delivery is considered to have occurred when title and risk of loss have transferred to the customer for products, or when the service has been provided. We consider the price to be fixed or determinable when the price is not subject to refund or adjustments. We consider arrangements with extended payment terms not to be fixed or determinable, and accordingly we defer revenue until amounts become due. At the time of the transaction, we evaluate the creditworthiness of our customers to determine the appropriate timing of revenue recognition. Provisions for discounts, warranties, returns, extended payment terms, and other adjustments are provided for in the period the related sales are recorded.
Product revenue. Our product revenue is generated predominantly from the sales of various types of test equipment.analytical instrumentation. Product revenue, including sales to resellers and distributors, is reduced for estimated returns when appropriate. For sales or arrangements that include customer-specified acceptance criteria, including those where acceptance is required upon achievement of performance milestones, revenue is recognized after the acceptance criteria have been met. For products that include installation, if the installation meets the criteria to be considered a separate element, product revenue is recognized upon delivery, and recognition of installation revenue is delayed until the installation is complete. Otherwise, neither the product nor the installation revenue is recognized until the installation is complete.
Where software is licensed separately, revenue is recognized when the software is delivered and has been transferred to the customer or, in the case of electronic delivery of software, when the customer is given access to the licensed software programs.
We also evaluate whether collection of the receivable is probable, the fee is fixed or determinable and whether any other undelivered elements of the arrangement exist on which a portion of the total fee would be allocated based on vendor-specific objective evidence.
Service revenue. Revenue from services includes extended warranty, customer and software support including, Software as a Service (SaaS) due to recent acquisitions, consulting including companion diagnostics and training and education. Service revenue is deferred and recognized over the contractual period or as services are rendered and accepted by the customer. For example, customer support contracts are recognized ratably over the contractual period, while training revenue is recognized as the training is provided to the customer. In addition, the four revenue recognition criteria described above must be met before service revenue is recognized.
Revenue Recognitionrecognition for Arrangementsarrangements with Multiple Deliverables.multiple deliverables. Our multiple-element arrangements are generally comprised of a combination of measurement instruments, installation or other start-up services, and/or software and/or support or services. Hardware and software elements are typically delivered at the same time and revenue is recognized upon delivery once title and risk of loss pass to the customer. Delivery of installation, start-up services and other services varies based on the complexity of the equipment, staffing levels in a geographic location and customer preferences, and can range from a few days to a few months. Service revenue is deferred and recognized over the contractual period or as services are rendered and accepted by the customer. Revenue from the sale of software products that are not required to deliver the tangible product's essential functionality are accounted for under software revenue recognition rules which require vendor specific objective evidence ("VSOE")(VSOE) of fair value to allocate revenue in a multiple element arrangement. Our arrangements generally do not include any provisions for cancellation, termination, or refunds that would significantly impact recognized revenue.
We have evaluated the deliverables in our multiple-element arrangements and concluded that they are separate units of accounting if the delivered item or items have value to the customer on a standalone basis and for an arrangement that includes a general right of return relative to the delivered item(s), delivery or performance of the undelivered item(s) is considered probable and substantially in our control. We allocate revenue to each element in our multiple-element arrangements based upon their relative selling prices. We determine the selling price for each deliverable based on a selling price hierarchy. The selling price for a
deliverable is based on VSOE if available, third-party evidence ("TPE")(TPE) if VSOE is not available, or estimated selling price ("ESP")(ESP) if neither VSOE nor TPE is available. Revenue allocated to each element is then recognized when the basic revenue recognition criteria for that element have been met.
We use VSOE of selling price in the selling price allocation in all instances where it exists. VSOE of selling price for products and services is determined when a substantial majority of the selling prices fall within a reasonable range when sold separately. TPE of selling price can be established by evaluating largely interchangeable competitor products or services in standalone sales to similarly situated customers. As our products contain a significant element of proprietary technology and the solution offered differs substantially from that of competitors, it is difficult to obtain the reliable standalone competitive pricing necessary to establish TPE. ESP represents the best estimate of the price at which we would transact a sale if the product or service were sold on a standalone basis. We determine ESP for a product or service by using historical selling prices which reflect multiple factors including, but not limited to customer type, geography, market conditions, competitive landscape, gross margin objectives and pricing practices. The determination of ESP is made through consultation with and approval by management. We may modify or develop new pricing practices and strategies in the future. As these pricing strategies evolve in changes may occur in ESP. The aforementioned factors may result in a different allocation of revenue to the deliverables in multiple element arrangements, which may change the pattern and timing of revenue recognition for these elements but will not change the total revenue recognized for the arrangement.
For sales arrangements that include equipment lease along with other products or services, revenue is allocated to the different elements based on the Revenue Recognition for Multiple Element Arrangements. Each of these contracts is evaluated as a lease arrangement, either as an operating lease or a capital (sales-type) lease using lease classification guidance.
Deferred revenue. Deferred revenue represents the amount that is allocated to undelivered elements in multiple element arrangements. We limit the revenue recognized to the amount that is not contingent on the future delivery of products or services or meeting other specified performance conditions.
Accounts receivable, net. Trade accounts receivable are recorded at the invoiced amount and do not bear interest. Such accounts receivable has been reduced by an allowance for doubtful accounts, which is our best estimate of the amount of probable credit losses in our existing accounts receivable. We determine the allowance based on customer specific experience and the aging of such receivables, among other factors. The allowance for doubtful accounts as of October 31, 20132016 and 20122015 was not material.
We do not have any off-balance-sheet credit exposure related to our customers. Accounts receivable are also recorded net of product returns.
Share-based compensation.Shipping and handling costs. ForOur shipping and handling costs charged to customers are included in net revenue, and the years ended 2013, 2012 and 2011, we accounted for share-based awards made to our employees and directors including employee stock option awards, restricted stock units, employee stock purchases made under our Employee Stock Purchase Plan ("ESPP") and performance share awards under Agilent Technologies, Inc. Long-Term Performance Program ("LTPP") using the estimated grant date fair value methodassociated expense is recorded in cost of accounting. Under the fair value method, we recorded compensation expenseproducts for all share-based awards of $88 million in 2013, $76 million in 2012 and $73 million in 2011.periods presented.
Inventory. Inventory is valued at standard cost, which approximates actual cost computed on a first-in, first-out basis, not in excess of market value. We assess the valuation of our inventory on a periodic basis and make adjustments to the value for estimated excess and obsolete inventory based on estimates about future demand. The excess balance determined by this analysis becomes the basis for our excess inventory charge. Our excess inventory review process includes analysis of sales forecasts, managing product rollovers and working with manufacturing to maximize recovery of excess inventory.
Warranty. Our standard warranty terms typically extend for one year from the date of delivery. During the second fiscal quarter of 2013 typical standard warranty arrangements within our electronic measurement business were extended from one year to three years from the date of delivery. Prior to the change in standard warranty terms, we sold extended warranties of more than one year and less than three years which were deferred. Those existing warranties greater than one year and less than three years and previously classified as extended warranties will be amortized over the original period of the warranty. We will continue to sell extended warranties for terms beyond three years within the electronic measurement business. The impact will not be material to the segment or consolidated revenue of Agilent and the anticipated increase to the warranty accrual as a result of the new arrangements will not be material to the consolidated balance sheet of Agilent. No changes were made to the standard and extended warranty terms within our other businesses.We accrue for standard warranty costs based on historical trends in warranty charges as a percentage of net product revenue. The accrual is reviewed regularly and periodically adjusted to reflect changes in warranty cost estimates. Estimated warranty charges are recorded within cost of products at the time products are sold. See Note 16, "Guarantees".
Taxes on income. Income tax expense or benefit is based on income or loss before taxes. Deferred tax assets and liabilities are recognized principally for the expected tax consequences of temporary differences between the tax bases of assets and liabilities and their reported amounts.
Shipping and handling costs. Our shipping and handling costs charged to customers are included in net revenue, and the associated expense is recorded in cost of products for all periods presented.
Goodwill and Purchased Intangible Assets.purchased intangible assets. In September 2011,Under the FASB approved changes toauthoritative guidance we have the goodwill impairment guidance which are intended to reduce the cost and complexity of the annual impairment test. The changes provide entities an option to perform a qualitative assessment to determine whether further impairment testing is necessary. The revisedaccounting standard gives an entity the option to first assess qualitative factors to determine whether performing the current two-step test is necessary. If an entity believes, as a result of its qualitative assessment, that it is more-likely-than-not (i.e. >greater than 50% chance) that the fair value of a reporting unit is less than its carrying amount, the quantitative impairment test will be required. Otherwise, no further testing will be required.
The revised guidance includes examples of events and circumstances that might indicate that a reporting unit's fair value is less than its carrying amount. These include macro-economic conditions such as deterioration in the entity's operating environment or industry or market considerations; entity-specific events such as increasing costs, declining financial performance, or loss of key personnel; or other events such as an expectation that a reporting unit will be sold or a sustained decrease in the stock price on either an absolute basis or relative to peers. Agilent opted to early adopt this guidance for the year ended October 31, 2011.
If it is determined, as a result of the qualitative assessment, that it is more-likely-than-not that the fair value of a reporting unit is less than its carrying amount, the provisions of authoritative guidance require that we perform a two-step impairment test on goodwill. In the first step, we compare the fair value of each reporting unit to its carrying value. The second step (if necessary) measures the amount of impairment by applying fair-value-based tests to the individual assets and liabilities within each reporting unit. As defined in the authoritative guidance, a reporting unit is an operating segment, or one level below an operating segment. We aggregatedaggregate components of an operating segmentssegment that have similar economic characteristics into our reporting units. In October 2013, we combined the life sciences and diagnostics and genomics segments to form the life sciences and diagnostics segment. As a result, Agilent now has three segments, life sciences and diagnostics, chemical analysis, and electronic measurement segments.
In fiscal year 2013,2016, we assessed goodwill impairment for our fourthree reporting units which consisted of twothree segments: chemical analysis and electronic measurement; and two reporting units under the life sciences and applied markets, diagnostics segment. The first of these two reporting units related to our life sciences business and the second related to our diagnostics business.genomics and Agilent CrossLab. We performed a qualitative test for goodwill impairment of the following three reporting units, as of September 30, 2013: the chemical analysis segment, the electronic measurement segment, and the reporting unit relating to life sciences.2016. Based on the results of our qualitative testing, we believe that it is more-likely-than-notmore-likely-than-not- that the fair value of these reporting units are greater than their respective carrying values. We performed a quantitative test for goodwill impairment of the reporting unit related to our diagnostics business as of September 30, 2013. Based on the results of our quantitative testing, the fair value was significantly in excess of the carrying value. There was no impairment of goodwill during the years ended October 31, 2013, 2012 and 2011. Each quarter we review the events and circumstances to determine if goodwill impairment is indicated. There was no impairment of goodwill during the years ended October 31, 2016, 2015 and 2014.
Purchased intangible assets consist primarily of acquired developed technologies, proprietary know-how, trademarks, and customer relationships and are amortized using the best estimate of the asset's useful life that reflect the pattern in which the economic benefits are consumed or used up or a straight-line method over estimated useful lives ranging from 6 months to 15 years. In-process research and development ("IPR&D") is initially capitalized at fair value as an intangible asset with an indefinite life and assessed for impairment thereafter. When the IPR&D project is complete, it is reclassified as an amortizable purchased intangible asset and is amortized over its estimated useful life. If an IPR&D project is abandoned, Agilent will record a charge for the value of the related intangible asset to Agilent's consolidated statement of operations in the period it is abandoned.
In July 2012, the FASB simplified the guidance for testing for impairment of indefinite-lived intangible assets other than goodwill. The changes are intended to reduce compliance costs. Agilent's indefinite-lived intangible assets are IPR&D intangible assets. The revisedaccounting guidance allows a qualitative approach for testing indefinite-lived intangible assets for impairment, similar to the issued impairment testing guidance for goodwill. Itgoodwill and allows the option to first assess qualitative factors (events and circumstances) that could affecthave affected the significant inputs used in determining the fair value of the indefinite-lived intangible asset. The qualitative factors assist in determiningasset to determine whether it is more likelymore-likely-than-not (i.e. greater than not (meaning a likelihood of more than 50 percent)50% chance) that the indefinite-lived intangible asset is impaired. An organization may choose to bypass the qualitative assessment for any indefinite-lived intangible asset in any period and proceed directly to calculating its fair value. The amendments are effectiveWe performed a qualitative test for annualimpairment of indefinite-lived intangible assets as of September 30, 2016. Based on the results of our qualitative testing, we believe that it is more-likely-than-not that the fair value of these indefinite-lived intangible assets is greater than their respective carrying values. Each quarter we review the events and interimcircumstances to determine if impairment tests performed for fiscalof indefinite-lived intangible asset is indicated. Based on triggering events in the years beginning after September 15, 2012. Early adoption was permitted. Agilent adopted this guidance for the year ended October 31, 2012. Based on the quantitative test,2016, 2015 and 2014, we recorded an impairment of $1$4 million, in 2013$3 million and an impairment$4 million, respectively due to the cancellation of $1 million in 2012, both relating tocertain IPR&D projects that were abandoned.projects. In all other instances we used the qualitative test and concluded that it was more likely than not that all other indefinite-lived intangible assets were not impaired. No impairments were recorded in 2011.addition,
in the year ended October 31, 2014, we also recorded $12 million of impairment of other intangibles due to the exit of our NMR business.
Share-based compensation. For the years ended 2016, 2015 and 2014, we accounted for share-based awards made to our employees and directors including employee stock option awards, restricted stock units, employee stock purchases made under our Employee Stock Purchase Plan ("ESPP") and performance share awards under Agilent Technologies, Inc. Long-Term Performance Program ("LTPP") using the estimated grant date fair value method of accounting. Under the fair value method, we recorded compensation expense, in continuing operations, for all share-based awards of $60 million in 2016, $55 million in 2015 and $59 million in 2014. For the stock option grants in 2015 and long term performance plan grants in 2016 and 2015 we used a volatility measure derived from a selection of our peer companies. In prior periods, we used Agilent stock historical volatility. We currently consider this method to not be reflective of our future volatility due to the separation of Keysight. See Note 4, "Share-based compensation" for additional information.
Retirement and post-retirement plans. Substantially all of our employees are covered under various defined benefit and/or defined contribution retirement plans. Additionally, we sponsor post-retirement health care benefits for our eligible U.S. employees. Assumptions used to determine the benefit obligations and the expense for these plans are derived annually. See Note 13, “Retirement plans and post-retirement pension plans” for additional information.
Taxes on income. Income tax expense or benefit is based on income or loss before taxes. Deferred tax assets and liabilities are recognized principally for the expected tax consequences of temporary differences between the tax bases of assets and liabilities and their reported amounts. See Note 5, "Income Taxes" for more information.
Warranty. Our standard warranty terms typically extend for one year from the date of delivery. We accrue for standard warranty costs based on historical trends in warranty charges as a percentage of net product revenue. The accrual is reviewed regularly and periodically adjusted to reflect changes in warranty cost estimates. Estimated warranty charges are recorded within cost of products at the time products are sold. See Note 14, "Guarantees".
Advertising. Advertising costs are generally expensed as incurred and amounted to $4430 million in 20132016, $5025 million in 20122015 and $5531 million in 20112014.
Research and development. Costs related to research, design and development of our products are charged to research and development expense as they are incurred.
Sales Taxes.taxes. Sales taxes collected from customers and remitted to governmental authorities are not included in our revenue.
Net income per share. Basic net income per share is computed by dividing net income - the numerator - by the weighted average number of common shares outstanding - the denominator - during the period excluding the dilutive effect of stock options and other employee stock plans. Diluted net income per share gives effect to all potentially dilutivepotential common stock equivalentsshares outstanding during the period.period unless the effect is anti-dilutive. The dilutive effect of share-based awards is reflected in diluted net income per share by application of the treasury stock method, which includes consideration of unamortized share-based compensation expense the tax benefits and shortfalls charged to additional paid-in capital and the dilutive effect of in-the-money options and non-vested restricted stock units. Under the treasury stock method, the amount the employee must pay for exercising stock options and unamortized share-based compensation expense and tax benefits or shortfalls are assumed proceeds to be used to repurchase hypothetical shares. See Note 6, "Net Income Per Share".
Cash, cash equivalents and short term investments. We classify investments as cash equivalents if their original or remaining maturity is three months or less at the date of purchase. Cash equivalents are stated at cost, which approximates fair value.
As of October 31, 20132016, approximately $2,5522,181 million of our cash and cash equivalents is held outside of the U.S. in our foreign subsidiaries. Under current tax laws, most of the cash could be repatriated to the U.S. but most of it would be subject to U.S. federal and state income taxes, less applicable foreign tax credits. Our cash and cash equivalents mainly consist of short term deposits held at major global financial institutions, institutional money market funds, and similar short duration instruments with original maturities of 90 days or less. We continuously monitor the creditworthiness of the financial institutions and institutional money market funds in which we invest our funds.
We classify investments as short-term investments if their original maturities are greater than three months and their remaining maturities are one year or less. Currently, we have no short-term investments.
Variable interest entities. We make a determination upon entering into an arrangement whether an entity in which we have made an investment is considered a Variable Interest Entity (“VIE”). The company evaluates its investments in privately held companies on an ongoing basis. We have determined that as of October 31, 2016 there were no VIE’s required to be consolidated in the company’s consolidated financial statements because we do not have a controlling financial interest in any of the VIE’s that we have invested in nor are we the primary beneficiary. We account for these investments under either the equity or cost method, depending on the circumstances. We periodically reassess whether we are the primary beneficiary of a VIE. The reassessment process considers whether we have acquired the power to direct the most significant activities of the VIE through changes in governing documents or other circumstances. We also reconsider whether entities previously determined not to be VIEs have become VIEs, based on changes in facts and circumstances including changes in contractual arrangements and capital structure. During 2016, we wrote down an equity method investment to its fair value of zero, resulting in an impairment charge of $18 million. In addition, we recorded an impairment of $7 million of uncollectible loans related to this equity method investment. As of October 31, 2016, the carrying value of our investments in VIE’s was $80 million with a maximum exposure of $80 million. The investments are included on the long term investments line of the consolidated balance sheet.
During the year ended October 31, 2016, Agilent made a preferred stock investment in Lasergen for $80 million. Agilent’s initial ownership stake was 48 percent and we have also joined the board of Lasergen and signed a collaboration agreement. We have the option to acquire all of the remaining shares of Lasergen until March 2, 2018, for additional consideration of $105 million. Lasergen is a VIE, however, we do not consolidate the entity in our financial statements because we do not have the power to direct the activities of the VIE that most significantly impact the VIE's economic performance. Because of the nature of the preferred stock of Lasergen that we own, we account for this investment under the cost method. As of October 31, 2016, both the carrying value and maximum exposure of the Lasergen investment was $80 million. The maximum exposure is equal to the carrying value because we do not have future funding commitments.
Fair Valuevalue of Financial Instruments.financial instruments. The carrying values of certain of our financial instruments including cash and cash equivalents, accounts receivable, accounts payable, accrued compensation and other accrued liabilities approximate fair value because of their short maturities. The fair value of long-term equity investments is determined using quoted market prices for those securities when available. For those long-term equity investments accounted for under the cost or equity method, their carrying value approximates their estimated fair value. Equity method investments are reported at the amount of the company’s initial investment and adjusted each period for the company’s share of the investee’s income or loss and dividend paid. The fair value of our long-term debt, calculated from quoted prices which are primarily Level 1 inputs under the accounting guidance fair value hierarchy, exceeds the carrying value by approximately $112$96 million and $210$30 million as of October 31, 20132016 and 2012,2015, respectively. The fair value of foreign currency contracts used for hedging purposes is estimated internally by using inputs tied to active markets. These inputs, for example, interest rate yield curves, foreign exchange rates, and forward and spot prices for currencies are observable in the market or can be corroborated by observable market data for substantially the full term of the assets or liabilities. See also Note 12,11, "Fair Value Measurements" for additional information on the fair value of financial instruments.
Concentration of credit risk. Financial instruments that potentially subject Agilent to significant concentration of credit risk include money market fund investments, time deposits and demand deposit balances. These investments are categorized as cash and cash equivalents and long-term investments.equivalents. In addition, Agilent has credit risk from derivative financial instruments used in hedging activities and accounts receivable. We invest in a variety of financial instruments and limit the amount of credit exposure with any one financial institution. We have a comprehensive credit policy in place and credit exposure is monitored on an ongoing basis.
Credit risk with respect to our accounts receivable is diversified due to the large number of entities comprising our customer base and their dispersion across many different industries and geographies. Credit evaluations are performed on customers requiring credit over a certain amount and we sell the majority of our products through our direct sales force. Credit risk is mitigated through collateral such as letter of credit, bank guarantees or payment terms like cash in advance. Credit evaluation is performed by an independent team to ensure proper segregation of duties. No single customer accounted for more than 10 percent of combined accounts receivable as of October 31, 20132016, or 20122015.
Derivative instruments. Agilent is exposed to global foreign currency exchange rate and interest rate risks in the normal course of business. We enter into foreign exchange hedging contracts, primarily forward contracts and purchased options and, in the past, interest rate swaps to manage financial exposures resulting from changes in foreign currency exchange rates and interest rates. In the vast majority of cases, these contracts are designated at inception as hedges of the related foreign currency or interest exposures. Foreign currency exposures include committed and anticipated revenue and expense transactions and assets and liabilities that are denominated in currencies other than the functional currency of the subsidiary. Interest rate exposures are associated with the company's fixed-rate debt. For option contracts, we exclude time value from the measurement of effectiveness. To qualify for hedge accounting, contracts must reduce the foreign currency exchange rate and interest rate risk otherwise inherent in the amount and duration of the hedged exposures and comply with established risk management policies; foreign exchange hedging contracts generally mature within twelve months and interest rate swaps, if any, mature at the same time as the maturity
of the debt. In order to manage foreign currency exposures in a few limited jurisdictions we may enter into foreign exchange contracts that do not qualify for hedge accounting. In such circumstances, the local foreign currency exposure is offset by contracts owned by the parent company. We do not use derivative financial instruments for speculative trading purposes.
All derivatives are recognized on the balance sheet at their fair values. For derivative instruments that are designated and qualify as a fair value hedge, changes in value of the derivative are recognized in the consolidated statement of operations in the current period, along with the offsetting gain or loss on the hedged item attributable to the hedged risk. For derivative instruments that are designated and qualify as a cash flow hedges, changes in the value of the effective portion of the derivative instrument is recognized in accumulated comprehensive income (loss), a component of stockholders' equity. Amounts associated with cash flow hedges are reclassified and recognized in income when either the forecasted transaction occurs or it becomes probable the forecasted transaction will not occur. Derivatives not designated as hedging instruments are recorded on the balance sheet at their fair value and changes in the fair values are recorded in the income statement in the current period. Derivative instruments are subject to master netting arrangements and qualify for net presentationare disclosed gross in the balance sheet. Changes in the fair value of the ineffective portion of derivative instruments are recognized in earnings in the current period. Ineffectiveness in 20132016, 20122015 and 20112014 was not material. Cash flows from derivative instruments are classified in the statement of cash flows in the same category as the cash flows from the hedged or economically hedged item, primarily in operating activities.
Property, plant and equipment. Property, plant and equipment are stated at cost less accumulated depreciation. Additions, improvements and major renewals are capitalized; maintenance, repairs and minor renewals are expensed as incurred. When assets are retired or disposed of, the assets and related accumulated depreciation and amortization are removed from our general ledger, and the resulting gain or loss is reflected in the consolidated statement of operations. Buildings and improvements are depreciated over the lesser of their useful lives or the remaining term of the lease and machinery and equipment over three to ten years. We use the straight-line method to depreciate assets.
Leases. We lease buildings, machinery and equipment under operating leases for original terms ranging generally from one year to twenty years. Certain leases contain renewal options for periods up to six years. In addition, we lease equipment to customers in connection with our diagnostics business using both capital and operating leases. As of October 31, 20132016 and 2015 our life sciencesdiagnostics and diagnosticsgenomics segment has approximately $4$15 million and $11 million, respectively, of lease receivables forrelated to capital leases and $35approximately $23 million and $31 million, respectively, of net assets for operating leases. We depreciate the assets related to the operating leases over their estimated useful lives.
Capitalized software. We capitalize certain internal and external costs incurred to acquire or create internal use software. Capitalized software is included in property, plant and equipment and is depreciated over three to five years once development is complete.
Impairment of long-lived assets. We continually monitor events and changes in circumstances that could indicate carrying amounts of long-lived assets, including intangible assets, may not be recoverable. When such events or changes in circumstances occur, we assess the recoverability of long-lived assets by determining whether the carrying value of such assets will be recovered through undiscounted expected future cash flows. If the total of the undiscounted future cash flows is less than the carrying amount of those assets, we recognize an impairment loss based on the excess of the carrying amount over the fair value of the assets.
Restructuring. The main component of our restructuring plan is related to workforce reductions. Workforce reduction charges are accrued when payment of benefits becomes probable that the employees are entitled to the severance and the amounts can be estimated. If the amounts and timing of cash flows from restructuring activities are significantly different from what we have estimated, the actual amount of restructuring and other related charges could be materially different, either higher or lower, than those we have recorded.
Employee compensation and benefits. Amounts owed to employees, such as accrued salary, bonuses and vacation benefits are accounted for within employee compensation and benefits. The total amount of accrued vacation benefit was $158$92 million and $156$86 million as of October 31, 2013,2016, and 2012,2015, respectively.
Foreign currency translation. We translate and remeasure balance sheet and income statement items into U.S. dollars. For those subsidiaries that operate in a local currency functional environment, all assets and liabilities are translated into U.S. dollars using current exchange rates at the balance sheet date; revenue and expenses are translated using monthly exchange rates which approximate to average exchange rates in effect during each period. Resulting translation adjustments are reported as a separate component of accumulated other comprehensive income (loss) in stockholders' equity.
For those subsidiaries that operate in a U.S. dollar functional environment, foreign currency assets and liabilities are remeasured into U.S. dollars at current exchange rates except for nonmonetarynon-monetary assets and capital accounts which are remeasured at historical exchange rates. Revenue and expenses are generally remeasured at monthly exchange rates which approximate average exchange rates in effect during each period. Gains or losses from foreign currency remeasurement are included in consolidated net income. Net gains or losses resulting from foreign currency transactions, including hedging gains and losses, are reported in other income (expense), net and was $65 million loss for fiscal year 20132016, $199 million loss for 20122015 and $14 million loss for 20112014, respectively. The loss recorded for fiscal year 2012 includes $14 million
2. NEW ACCOUNTING PRONOUNCEMENTS
Recently Adopted Accounting Pronouncements
In June 2011,November 2015, the Financial Accounting Standards Board (“FASB”) issued ASU 2015-17 Balance Sheet Classification of Deferred Taxes, to simplify accounting for deferred taxes. Beginning on November 1, 2017 and including the interim periods following that date, we will be required to present all deferred tax balances as non-current. Existing GAAP guidance requires us to record deferred tax balances as either current or non-current in accordance with the classification of the underlying attributes. Early adoption of this guidance is permitted and may be applied either prospectively or retrospectively to all periods presented. We adopted this guidance at the end of the period ended April 30, 2016 prospectively and therefore, the October 31, 2016 consolidated balance sheet reflects the new disclosure requirements but prior periods have not been adjusted.
In March 2016, the FASB issued ASU 2016-09 Improvements to Employee Share-Based Payment Accounting, that changes the accounting for certain aspects of share-based payments to employees. The new guidance requires excess tax benefits and tax deficiencies to be recorded in the income statement when the awards vest or are settled. In addition, cash flows related to excess tax benefits will no longer be separately classified as a financing activity apart from other income tax cash flows. The standard also allows us to repurchase more of an employee’s shares for tax withholding purposes without triggering liability accounting, clarifies that all cash payments made on an employee’s behalf for withheld shares should be presented as a financing activity on our cash flows statement, and provides an accounting policy election to account for forfeitures as they occur. The amendments also remove the presentationrequirement to delay the recognition of comprehensive income.an excess tax benefit until it reduces current taxes payable. Under the new guidance the benefit will be recorded when it arises with a cumulative effect adjustment to opening retained earnings for previously unrecognized benefits. The guidance aims to improve the comparability, consistency, and transparency of financial reporting and to increase the prominence of items reported in other comprehensive income. Thenew guidance is effective for fiscal years, and interim periods within those years,us beginning after December 15, 2011. InNovember 1, 2017. We elected to early adopt the firstnew guidance in the third quarter of 2013, we adoptedfiscal year 2016, on a retrospective basis.
The impact of adoption was the updated authoritative guidance that increasesrecognition of tax shortfalls of $2 million in our provision for income taxes for fiscal year 2016. Additional amendments to the prominenceaccounting for income taxes was the recognition of items reportedthe windfall tax benefits as a cumulative effect adjustment to opening retained earnings of $196 million together with an increase in deferred tax assets included in other comprehensive income. The updated authoritative guidance eliminates the option to present componentsassets of other comprehensive income as part$98 million, an increase in additional paid in capital of the statement of changes in equity and requires that changes$4 million, a reduction in other comprehensive incomeaccrued liabilities of $1 million and a decrease of $99 million in other long term liabilities. There was no impact from minimum statutory withholding tax requirements to retained earnings as of November 1, 2015. We have elected to continue to estimate forfeitures expected to occur to determine the amount of compensation cost to be presented either as a single continuous statement of comprehensive income orrecognized in two but consecutive statements.each period. The adoption of the updated authoritativenew guidance did impact the presentation of comprehensive income, as we have elected to present two separate but consecutive statements, but did not have ana significant impact on the calculation of diluted weighted average shares.
We elected to apply the presentation requirements for cash flows related to excess tax benefits and employee taxes paid for withheld shares retrospectively to all periods presented. The presentation requirements for cash flows impacted our financial position or resultspreviously reported consolidated statement of operations.cash flows for fiscal years 2015 and 2014 as follows:
|
| | | | | | | | | | | | | | | |
| | Year Ended
October 31, 2015 | | Year Ended
October 31, 2014 |
| | As
Reported | | As
Adjusted | | As
Reported | | As
Adjusted |
| | (in millions) |
| Consolidated Statement of Cash Flows: | | | | | | | |
| Net cash provided by operating activities | $ | 491 |
| | $ | 512 |
| | $ | 711 |
| | $ | 731 |
|
| Net cash used in financing activities | $ | (1,068 | ) | | $ | (1,089 | ) | | $ | (97 | ) | | $ | (117 | ) |
New Accounting Pronouncements Not Yet Adopted
In December 2011,April 2014, the FASB issued guidance relatedamendments to the enhancedguidance on discontinued operations. The guidance changes the criteria for reporting discontinued operations while enhancing disclosures in this area. Under the new guidance, only disposals representing a strategic shift in operations should be presented as discontinued operations. Those strategic shifts should have a major effect on the organization’s operations and financial results. Examples include a disposal of a major geographic area, a major line of business, or a major equity method investment. Additionally, the new guidance requires expanded disclosures about discontinued operations that will enableprovide financial statement users with more information about the usersassets, liabilities, income, expenses of financial statementsdiscontinued operations and of the pre-tax income attributable to evaluate the effect or potential effecta disposal of netting arrangementsa significant part of an entity's financial position.organization that does not qualify for
discontinued operations reporting. The amendments require improved information about financial instruments and derivative instruments that are either offset or subject to enforceable master netting arrangements or similar agreement. Thenew guidance is effective for annual reporting periods beginning on orAgilent prospectively for all disposals (or classifications as held for sale) of components of an entity that occur after JanuaryNovember 1, 2013,2016.
The disposal of Keysight meets the definition of a discontinued operation under both the existing and interim periods within those annual periods. We do not expect a material impact to ouramended accounting guidance. The historical results of operations and the financial position of Keysight are included in the consolidated financial statements due to the adoption of Agilent and are reported as discontinued operations within this guidance.Form 10-K.
In February 2013,May 2014, the FASB issued the guidance for reporting of amounts reclassified out of accumulated other comprehensive income. The revised guidance requires reporting the effect of significant reclassifications out of accumulated other comprehensive income on the respective line items in net income if the amount being reclassified is required to be reclassified in its entirety to net income. For other amounts that are not required to be reclassified in their entirety to net income in the same reporting period, an entity is required to cross-reference other disclosures that provide additional detail about these amounts. The amendments do not change the current requirements for reporting net income or other comprehensive income in financial statements. The guidance is effective prospectively for annual reporting periods beginning after December 15, 2012 and interim periods within those years. Early adoption is permitted. We do not expect a material impact to our consolidated financial statements due to the adoption of this guidance.
In March 2013, the FASB issued an amendment to the accounting guidance on foreign currency matters in order to clarify the guidance for the release of cumulative translation adjustment. The guidance requires that a parent deconsolidate a subsidiary or derecognize a group of assets that is a nonprofit activity or a business (other than a sale of in substance real estate or conveyance of oil and gas mineral rights) if the parent ceases to have a controlling financial interest in that group of assets. The guidance is effective for interim and annual periods beginning on or after December 15, 2013. We do not expect a material impact to our consolidated financial statements due to the adoption of this guidance.
In July 2013, the FASB issued an amendment to the accounting guidance related to revenue recognition, Topic 606, Revenue from contracts with customers. The objective of the financial statementamendments was to significantly enhance comparability and clarify principles of revenue recognition practices across entities, industries, jurisdictions and capital markets. In July 2015, the FASB amended the effective date. In March 2016, the FASB clarified the implementation guidance on principal versus agent considerations. In April 2016, the FASB clarified certain aspects of identifying performance obligations and licensing implementation guidance. In May 2016, the FASB provided additional guidance related to disclosure of remaining performance obligations, as well as other amendments to guidance on collectibility, non-cash consideration and the presentation of an unrecognized tax benefit whensales and other similar taxes collected from customers. The amendments are effective for us beginning fiscal 2019. Early adoption is permitted for us beginning November 1, 2017. The company expects to adopt this guidance on November 1, 2018. We are currently in the assessment phase to determine the adoption method and are evaluating the impact of these amendments on our consolidated financial statements and disclosures.
In April 2015, the FASB issued amendments to simplify the presentation of debt issuance costs. The amendments require that debt issuance costs related to a net operating loss carryforward,recognized debt liability to presented in the balance sheet as a similar tax loss or a tax credit carryforward exists.direct deduction from the carrying amount of that debt liability, consistent with debt discounts. The recognition and measurement guidance requires an unrecognized tax benefitfor debt issuance costs remain unchanged. The amendments are effective for us beginning November 1, 2016, and for interim periods within that year. We do not expect the impact of adopting the amendments to be presentedmaterial on our consolidated financial statements and disclosures.
In September 2015, the FASB issued guidance intended to simplify accounting for adjustments to provisional amounts recorded in connection with business combinations. Beginning in November 1, 2017 and in the interim periods from November 1, 2018, adjustments will be recorded in the period that they are determined rather than applied retrospectively via revision to the period of acquisition and each period thereafter. We do not expect this guidance to have a material impact on our consolidated financial statements and disclosures.
In January 2016, the FASB issued amendments to address certain aspects of recognition, measurement, presentation, and disclosure of financial instruments. The standard requires entities to measure equity investments that do not result in consolidation and are not accounted for under the equity method at fair value and recognize any changes in fair value in net income. The provisions under this amendment are effective for us beginning November 1, 2018, and for interim periods within that year. Early adoption is not permitted. We are evaluating the impact of adopting this guidance on our consolidated financial statements and disclosures.
In February 2016, the FASB issued guidance which amends the existing accounting standards for leases. Consistent with existing guidance, the recognition, measurement, and presentation of expenses and cash flows arising from a lease by a lessee primarily will depend on its classification. Under the new guidance, a lessee will be required to recognize right-of-use assets and lease liabilities on the balance sheet. The new guidance is effective for us beginning November 1, 2020, and for interim periods within that year. Early adoption is permitted and we will be required to adopt using a modified retrospective approach. We are evaluating the timing of adoption and the impact of this guidance on our consolidated financial statements and disclosures.
In March 2016, the FASB issued amendments to simplify the transition to the equity method of accounting. The amendments require that the equity method investor add the cost of acquiring the additional interest in the investee to the current basis of the investor’s previously held interest and adopt the equity method of accounting as of the date the investment becomes qualified for equity method accounting. The amendments are effective for us beginning November 1, 2017, and for interim periods within that year. We currently do not expect material impact of this amendment on our consolidated financial statements and disclosures.
In August 2016, the FASB issued amendments to address eight specific cash flow issues with the objective of reducing the existing diversity in practice. The amendments are effective for us beginning November 1, 2018, and for interim periods within that year. Early adoption is permitted. If we decide to early adopt the amendments, we will be required to adopt all of the amendments in the same period. We are evaluating the timing of our adoption and the impact of the amendments on our consolidated statement of cash flows and disclosures.
In October 2016, the FASB issued amendments to improve the accounting for the income tax consequences of intra-entity transfers of assets other than inventory. The amendments are effective for us beginning November 1, 2018, and for interim periods within that year. Early adoption is permitted and should be applied on a decrease inmodified retrospective basis through a deferred tax asset where a net operating loss, acumulative-effect
similar tax loss, or a tax credit carryforward existsadjustment directly to retained earnings as of the beginning of the period of adoption. We are evaluating the timing of our adoption and certain criteriathe impact of the amendments on our consolidated financial statements and disclosures.
In November 2016, the FASB issued amendments to require amounts generally described as restricted cash and restricted cash equivalents be included with cash and cash equivalents when reconciling the beginning-of-period and end-of-period total amounts shown on the statement of cash flows. The amendments are met. This guidanceeffective for us beginning November 1, 2018, and for interim periods within that year. Early adoption is effective prospectively for annualpermitted. We are evaluating the timing of our adoption and interim reporting periods beginning after December 15, 2013the impact of the amendments on our consolidated statement of cash flows and is consistent with our current practice.disclosures.
Other amendments to GAAP in the U.S. that have been issued by the FASB or other standards-setting bodies that do not require adoption until a future date are not expected to have a material impact on our consolidated financial statements upon adoption.
3. ACQUISITIONSDISCONTINUED OPERATIONS
Acquisition of Dako
On June 21, 2012, we completed the acquisition of Dako through the acquisition of 100% of share capital of Dako,September 19, 2013, Agilent announced its intention to separate its electronic measurement business, Keysight, which was previously a limited liability companyseparate reportable segment, into a stand-alone publicly traded company. Keysight was incorporated under the laws of Denmark, under the share purchase agreement, dated May 16, 2012. As a result of the acquisition, Dako has becomein Delaware as a wholly-owned subsidiary of Agilent. Accordingly,Agilent on December 6, 2013. On November 1, 2014, we completed the distribution of 100% of the outstanding common stock of Keysight to Agilent stockholders, who received one share of Keysight common stock for every two shares of Agilent common stock held as of the close of business on the record date, October 22, 2014. The separation agreement ensured that Keysight had approximately $700 million of total cash and cash equivalents immediately following distribution. For the year ended October 31, 2015, we transferred a total amount of cash and cash equivalents of $734 million to Keysight.
The historical results of Dako are includedoperations and statement of financial position of Keysight have been presented as discontinued operations in Agilent'sthe consolidated financial statements from the dateand prior periods have been restated. Discontinued operations include results of the acquisition. For the period from June 22, 2012Keysight's business except for certain allocated corporate overhead costs and certain costs associated with transition services provided by Agilent to October 31, 2012, Dako's net revenue was $126 millionKeysight. Discontinued operations also includes other costs incurred by Agilent to separate Keysight. These costs include transaction charges, advisory and net loss was $37 million. The acquisition of Dakoconsulting fees and its portfolio is another step to increase our growth in several rapidly expanding areas of diagnostics, including anatomic pathology and molecular diagnostics, as well as strengthen our existing offerings with a focus on product development to help in the fight against cancer.information system expenses.
The consideration paid was approximately $2,143 million,following table summarizes results from discontinued operations of which $1,400 million was paid directly to the seller and $743 million was paid to satisfy outstanding debt. Agilent funded the acquisition using existing cash. In connection with the acquisition of Dako, Agilent entered into several foreign currency forward contracts to mitigate the currency exchange risk associated with the payment of the purchase price in Danish Krone and the repayment of debt in multiple currencies. The aggregate notional amount of the currencies hedged was $1.7 billion. These foreign exchange contracts did not qualify for hedge accounting treatment and were not designated as hedging instruments. The resulting loss on settlement, on the date of acquisition, was $14 million and was recorded in other income (expense)Keysight included in the consolidated statement of operations:
|
| | | | | | | | |
| | Years Ended October 31, | |
| | 2015 | | 2014 | |
| | (in millions) |
| Net revenue | $ | — |
| | $ | 2,933 |
| |
| Costs and expenses | 39 |
| | 2,521 |
| |
| Operating income (loss) | (39 | ) | | 412 |
| |
| Other income (expense), net | — |
| | 5 |
| |
| Income (loss) from discontinued operations before tax | (39 | ) | | 417 |
| |
| Provision (benefit) for income taxes | (2 | ) | | 100 |
| |
| Net income (loss) from discontinued operations | $ | (37 | ) | | $ | 317 |
| |
Net income (loss) from discontinued operations includes transaction, information systems and other costs to effect the separation of $39 million and $178 million for the years ended October 31, 2015 and 2014, respectively. In the year ended October 31, 2012.2015 only those costs incurred to effect the separation have been included. No income or expense has been recorded for the Keysight business after separation from Agilent on November 1, 2014.
In addition, $332 million of accumulated other comprehensive loss, net of income taxes, primarily related to pension and other post-retirement benefits plans and currency translation was also transferred to Keysight together with $28 million of additional paid in capital related to share based compensation windfall tax benefits. The Dako acquisition was accounted for in accordance with the authoritative accounting guidance. The acquiredremoval of Keysight net assets and assumed liabilities were recorded by Agilent at their estimated fair values. Agilent determined the estimated fair values with the assistance of appraisals or valuations performed by third party specialists, discounted cash flow analyses, and estimates made by management. We expect to realize revenue synergies, leverage and expand the existing sales channels and product development resources, and utilize the assembled workforce. The company also anticipates opportunities for growth through expanded geographic and customer segment diversity and the ability to leverage additional products and capabilities. These factors, among others, contributed to a purchase price in excess of the estimated fair value of Dako's net identifiable assets acquired (see summary of net assets below), and,equity related adjustments is presented as a result, we have recorded goodwillreduction in connection with this transaction.
All goodwill was allocated to the life sciencesAgilent's retained earnings and diagnostics segment. We do not expect the goodwill recognized to be deductible for income tax purposes. Any impairment charges made in the future associated with goodwill will not be tax deductible.
A portion of the overall purchase price was allocated to acquired intangible assets. Amortization expense associated with acquired intangible assets is not deductible for tax purposes. Therefore, approximately $185 million was established asrepresents a deferred tax liability for the future amortization of these intangibles and is included in "other long-term liabilities" in the table below.non cash financing activity excluding cash
The following table summarizes the allocation of the purchase price to the estimated fair values of the assets acquired and liabilities assumed on the closing date of June 21, 2012 (in millions):
|
| | | | | | |
| Cash and cash equivalents | | | $ | 11 |
| |
| Accounts receivable | | | 96 |
| |
| Inventories | | | 90 |
| |
| Other current assets | | | 5 |
| |
| Property, plant and equipment | | | 146 |
| |
| Long term investments | | | 11 |
| |
| Intangible assets | | | 738 |
| |
| Other assets | | | 13 |
| |
| Goodwill | | | 1,382 |
| |
| Total assets acquired | | 2,492 | |
|
| Accounts payable | | | (24 | ) | |
| Employee compensation and benefits | | | (24 | ) | |
| Other accrued liabilities | | | (47 | ) | |
| Long-term debt | | | (43 | ) | |
| Other long-term liabilities | | | (211 | ) | |
| Net assets acquired | | | $ | 2,143 |
| |
The fair valuetransferred. See Note 5 “Income Taxes” for tax implications and adjustments due to the distribution and Note 4 “Share Based Compensation” for changes to share based compensation awards as a result of cash and cash equivalents, accounts receivable, other current assets, accounts payable and other accrued liabilities were generally determined using historical carrying values given the short-term naturedistribution of these assets and liabilities.
The fair values for acquired inventory, property, plant and equipment, and intangible assets were determined with the input from third party valuation specialists.
The fair values of certain other assets, investments, long-term debt, and certain other long-term liabilities were determined internally using historical carrying values and estimates made by management.
Valuations of intangible assets acquired
The components of intangible assets acquired in connection with the Dako acquisition were as follows (in millions):
Keysight.
|
| | | | | | | |
| Fair Value | | Estimated
Useful Life
|
Developed product technology | | $ | 287 |
| | | 8 - 9 yrs |
Customer relationships | | 140 |
| | | 4 years |
Tradenames and trademarks | | 128 |
| | | 12 years |
Total intangible assets subject to amortization | | 555 |
|
| | |
In-process research and development | | 183 |
| | | |
Total intangible assets | | $ | 738 |
| | | |
As noted above,Under the intangible assets, including in-process researchterms of the Transition Services Agreement, we agreed to provide administrative, site services, information technology systems and development, were valued with input from valuation specialists.various other corporate and support services to Keysight over the period of 12-18 months after the separation on a cost or cost-plus basis. The In-Process Research and Developmentmost significant component of the service income is the provision of IT services that was valued usingcompleted by the multi-period excess earnings method under the income approach by discounting forecasted cash flows directly related to the products expecting to result from the projects, netend of returns on contributory assets. The primary in-process project acquired relates to a major new product platform which was released and amortization began in the second quarter of fiscal 2013. See also Note 10, "Goodwill and other Intangible assets" for additional information. Total costs to complete2015. In total we recorded income for all Dako In- Process Research and Development were estimated atservices provided to Keysight of approximately $49$12 million in fiscal year 2015. In addition, Agilent expects to receive lease income together with site service income from Keysight over time asthe next 3-4 years of the close date.
Acquisition and integration costs directly related to the Dako acquisition totaled $15approximately $12 million and $15 million for the years ended October 31, 2013 and 2012, respectively and were recorded in selling, general and administrative expenses. Such costs are expensed in accordance with the authoritative accounting guidance.
The following represents pro forma operating results as if Dako had been included in the company's condensed consolidated statements of operations as of the beginning of fiscal 2011(in millions, except per share amounts):
|
| | | | | | | |
| | 2012 | | 2011 |
| Net revenue | $ | 7,100 |
| | $ | 6,976 |
|
| Net income | $ | 1,145 |
| | $ | 909 |
|
| Net income per share — basic | $ | 3.29 |
| | $ | 2.62 |
|
| Net income per share — diluted | $ | 3.24 |
| | $ | 2.56 |
|
The pro forma financial information assumes that the companies were combined as of November 1, 2010 and include business combination accounting effects from the acquisition including amortization charges from acquired intangible assets, the impact on cost of sales due to the respective estimated fair value adjustments to inventory, changes to interest income for cash used in the acquisition, interest expense and currency losses associated with debt paid in connection with the acquisition and acquisition related transaction costs and tax related effects. The pro forma information as presented above is for informational purposes only and is not indicative of the results of operations that would have been achieved if the acquisition had taken place at the beginning of fiscal 2011.
The unaudited pro forma financial information foryear. In the year ended October 31, 2012 combines2016 and 2015 other income (expense), net includes $12 million and $25 million of income in respect of the historical resultsprovision of Agilent for the year ended October 31, 2012 (which includes Dako after the acquisition date)services to, and for Dako for the six months ended March 31, 2012 and the two months ended May 31, 2012.
The unaudited pro forma financial information for the year ended October 31, 2011 combines the historical results of Agilent for the year ended October 31, 2011 and for Dako the year ended December 31, 2011 (due to differences in reporting periods).lease income from Keysight.
The unaudited pro financial information for the years ended October 31, 2012 and 2011 includes the fourth quarter of Dako's calendar reporting period, October 1, 2011 to December 31, 2011, in both years.
4. SHARE-BASED COMPENSATION
Agilent accounts for share-based awards in accordance with the provisions of the revised accounting guidance which requires the measurement and recognition of compensation expense for all share-based payment awards made to our employees and directors including employee stock option awards, restricted stock units, employee stock purchases made under our ESPP and performance share awards granted to selected members of our senior management under the LTPP based on estimated fair values.
Description of Share-Based Plans
Employee stock purchase plan. Effective November 1, 2000, we adopted the ESPP. The ESPP allows eligible employees to contribute up to ten percent of their base compensation to purchase shares of our common stock at 85 percent of the closing market price at purchase date. Shares authorized for issuance in connection with the ESPP are subject to an automatic annual increase of the lesser of one percent of the outstanding shares of common stock of Agilent on November 1, or an amount determined by the Compensation Committee of our Board of Directors. Under the terms of the ESPP, in no event shall the number of shares issued under the ESPP exceed 75 million shares.
Under our ESPP, employees purchased 1,454,724696,178 shares for $4823 million in 20132016, 1,405,774346,472 shares for $4712 million in 20122015 and 1,205,4311,604,406 shares for $4373 million in 20112014. As of October 31, 20132016, the number of shares of common stock authorized and available for issuance under our ESPP was 37,709,692. This excludes the number of shares of common stock to be issued to participants in consideration of the aggregate participant contributions totaling $23 million as of October 31, 201345,168,192.
Incentive compensation plans. On November 19, 2008 and March 11, 2009, the Compensation Committee of Board of Directors and the stockholders, respectively, approved the Agilent Technologies, Inc. 2009 Stock Plan (the "2009 Stock Plan") to replace the Company's 1999 Stock Plan and 1999 Stock Non-Employee Director Stock Plan and subsequently reserved 25 million shares of Company common stock that may be issued under the 2009 Plan, plus any shares forfeited or cancelled under the 1999 Stock Plan. The 2009 Stock Plan provides for the grant of awards in the form of stock options, stock appreciation rights ("SARs"), restricted stock, restricted stock units ("RSUs"), performance shares and performance units with performance-based conditions on vesting or exercisability, and cash awards. The 2009 Plan has a term of ten years. As of October 31, 20132016, 12,522,18510,316,082 shares were available for future awards under the 2009 Stock Plan.
Stock options granted under the 2009 Stock Plans may be either "incentive stock options", as defined in Section 422 of the Internal Revenue Code, or non-statutory. Options generally vest at a rate of 25 percent per year over a period of four years from the date of grant and generally have a maximum contractual term of ten years. The exercise price for stock options is generally not less than 100 percent of the fair market value of our common stock on the date the stock award is granted. No options were granted during the year ended October 31, 2016.
Effective November 1, 2003, the Compensation Committee of the Board of Directors approved the LTPP, which is a performance stock award program administered under the 2009 Stock Plan, for the company's executive officers and other key employees. Participants in this program are entitled to receive unrestricted shares of the company's stock after the end of a three-year period, if specified performance targets are met. Certain LTPP awards are generally designed to meet the criteria of a performance award with the performance metrics and peer group comparison based on the Total Stockholders’ Return (“TSR”) set at the beginning of the performance period. Effective November 1, 2015, the Compensation Committee of the Board of Directors approved another type of performance stock award, for the company's executive officers and other key employees. Participants in this program are also entitled to receive unrestricted shares of the company's stock after the end of a three-year period, if specified performance targets based on Operating Margin (“OM”) over the three-year period are met. All LTPP awards granted after November 1, 2015, are subject to a one-year post-vest holding period.
Based on the performance metrics the final LTPP award may vary from zero to 200 percent of the target award. The maximum contractual term for awards under the LTPP program is three years. and the maximum award value cannot exceed 300 percent of the grant date target value. We consider the dilutive impact of this programthese programs in our diluted net income per share calculation only to the extent that the performance conditions are expected to be met.
In March 2007, we began toWe also issue restricted stock units under our share-based plans. The estimated fair value of the restricted stock unit awards granted under the Stock Plans is determined based on the market price of Agilent's common stock on the date of grant adjusted for expected dividend yield. Restricted stock units generally vest, with some exceptions, at a rate of 25 percent per year over a period of four years from the date of grant.
In connection with the separation of Keysight Technologies on November 1, 2014 and in accordance with the Employee Matters Agreement we made certain adjustments to the exercise price and number of our share-based compensation awards with the intention of preserving the intrinsic value of the awards prior to the separation. Exercisable and non-exercisable stock options converted to those of the entity where the employee is working post-separation. Restricted stock units awards and long-term performance plan grants were adjusted to provide holders restricted stock units and long-term performance plan grants in the company that employs such employee following the separation. These adjustments to our stock-based compensation awards did not have a material impact on compensation expense.
Impact of Share-based Compensation Awards
We have recognized compensation expense based on the estimated grant date fair value method under the authoritative guidance. For all share-based awards we have recognized compensation expense using a straight-line amortization method. As the guidance requires that share-based compensation expense be based on awards that are ultimately expected to vest, estimated share-based compensation has been reduced for estimated forfeitures.
The impact on our results for share-based compensation was as follows:
| | | | Years Ended October 31, | Years Ended October 31, |
| | 2013 | | 2012 | | 2011 | 2016 | | 2015 | | 2014 |
| | (in millions) | (in millions) |
| Cost of products and services | $ | 20 |
| | $ | 16 |
| | $ | 16 |
| $ | 14 |
| | $ | 11 |
| | $ | 13 |
|
| Research and development | 12 |
| | 10 |
| | 10 |
| 6 |
| | 5 |
| | 7 |
|
| Selling, general and administrative | 56 |
| | 50 |
| | 47 |
| 40 |
| | 39 |
| | 39 |
|
| Share-based compensation expense in continuing operations | | 60 |
| | 55 |
| | 59 |
|
| Share-based compensation expense in discontinued operations | | — |
| | — |
| | 39 |
|
| Total share-based compensation expense | $ | 88 |
| | $ | 76 |
| | $ | 73 |
| $ | 60 |
| | $ | 55 |
| | $ | 98 |
|
At October 31, 20132016 and 20122015 there was no share-based compensation capitalized within inventory. The windfall income tax benefit realized from the exercised stock options and similar awards recognized was $2 million in 2013 and zero in 2012 and 2011, respectively. The weighted average grant date fair value of options, granted in 2013, 20122015 and 20112014 was $12.18, $13.6910.58 and $12.4818.73 per share, respectively. No stock options were granted in 2016.
Included in the 20132016, 2015 and 2014 expense is incremental expense for acceleration of share-based compensation related to the announced workforce reduction plan of $3 million. In 2012zero, $2 million and 2011 the expense for the acceleration of share-based compensation related to the announced workforce reduction plan was immaterial.$1 million, respectively. Upon termination of the employees impacted by workforce reduction, the non-vested Agilent awards held by these employees immediately vests. Employees have a period of up to three months in which to exercise the Agilent options before such options are cancelled.
Valuation Assumptions
For all periods presented, the fair value of share based awards for employee stock option awards was estimated using the Black-Scholes option pricing model. For all periods presented, shares granted under the LTPP (TSR) were valued using a Monte Carlo simulation. The estimated fair value of restricted stock unit awards was determined based on the market price of Agilent's common stock on the date of grant adjusted for expected dividend yield. On January 17, 2012, the company's Board of Directors approved the initiation of quarterly cash dividends to the company's shareholders. The fair value of all the awards granted prior to the declaration of quarterly cash dividend was measured based on an expected dividend yield of 0%. The ESPP allows eligible employees to purchase shares of our common stock at 85 percent of the fair market value at the purchase date.
The estimated fair value of restricted stock unit awards and LTPP (OM) was determined based on the market price of Agilent's common stock on the date of grant adjusted for expected dividend yield and as appropriate, a discount related to the one-year post vesting. The compensation cost for LTPP (OM) reflects the cost of awards that are probable to vest at the end of the performance period.
The following assumptions were used to estimate the fair value of employee stock options and LTPP grants.
| | | | Years Ended October 31, | | Years Ended October 31, |
| | 2013 | | 2012 | | 2011 | | 2016 | | 2015 | | 2014 |
| Stock Option Plans: | | | | | | | | | | | |
| Weighted average risk-free interest rate | 0.86% | | 0.88% | | 1.49% | | — | | 1.75% | | 1.69% |
| Dividend yield | 1% | | 0% | | 0% | | — | | 1% | | 1% |
| Weighted average volatility | 39% | | 38% | | 35% | | — | | 28% | | 39% |
| Expected life | 5.8 years | | 5.8 years | | 5.8 years | | — | | 5.5 years | | 5.8 years |
| LTPP: | | | | | | | | | | | |
| Volatility of Agilent shares | 37% | | 41% | | 40% | | 24% | | 25% | | 36% |
| Volatility of selected peer-company shares | 6%-64% | | 17%-75% | | 20%-76% | | 14%-50% | | 12%-57% | | 13%-57% |
| Price-wise correlation with selected peers | 49% | | 62% | | 55% | | 35% | | 37% | | 47% |
Both the Black-Scholes and Monte Carlo simulation fair value models require the use of highly subjective and complex assumptions, including the option'soption’s expected life and the price volatility of the underlying stock. Due to the separation of Keysight on November 1, 2014, expected volatility for grants of options in 2015 was based on a 5.5 year average historical stock price volatility of a group of our peer companies. For all the years presented,volatility of our 2016 and 2015 LTPP (TSR) grants, we used the 3-year average historical stock price volatility of a group of our peer companies. We believe our historical volatility prior to the separation of Keysight is no longer relevant to use. For the grants of options and LTPP (TSR) prior to November 1, 2014, the expected stock price volatility assumption was determined using the historical volatility of Agilent'sAgilent’s stock options over the most recent historical period equivalent to the expected life.life of the stock options and LTPP (TSR).
ForAll LTPP awards granted in 2016 to our senior management employees have a one-year post-vest holding restriction. The estimated discount associated with post-vest holding restrictions is calculated using the grants awarded underFinnerty model. The model calculates the 2009potential lost value if the employee were able to sell the shares during the lack of marketability period, instead of being required to hold the shares. The model used the 3-year average historical stock plan after November 1, 2010, we increased the period available to retirement eligible employees to exercise their options from three years at retirement date to the full contractual termprice volatility of ten years. In developing our estimated lifea group of our employee stock options of 5.8 years for 2011peer companies and an expected dividend yield to 2013, we consideredcompute the historical option exercise behavior of our executive employees who were granted the majority of the options in the annualdiscount. The grants made which we believe is representativeduring 2016 have a discount of future behavior.5.5 percent while computing the fair value.
Share-based Payment Award Activity
Employee Stock Options
The following table summarizes employee stock option award activity made toof our employees and directors for 2013:2016.
| | | | Options Outstanding | | Weighted Average Exercise Price | Options Outstanding | | Weighted Average Exercise Price |
| | (in thousands) | | | (in thousands) | | |
| Outstanding at October 31, 2012 | 12,077 |
| | $ | 30 |
| |
| Outstanding at October 31, 2015 | | 5,712 |
| | $ | 31 |
|
| Granted | 1,596 |
| | $ | 36 |
| — |
| | $ | — |
|
| Exercised | (4,037 | ) | | $ | 28 |
| (1,547 | ) | | $ | 25 |
|
| Cancelled/Forfeited/Expired | (27 | ) | | $ | 17 |
| (59 | ) | | $ | 33 |
|
| Outstanding at October 31, 2013 | 9,609 |
| | $ | 32 |
| |
| Outstanding at October 31, 2016 | | 4,106 |
| | $ | 33 |
|
Forfeited and expired options from total cancellations in 20132016 were as follows:
| | | | Options Cancelled | | Weighted Average Exercise Price | Options Cancelled | | Weighted Average Exercise Price |
| | (in thousands) | | | (in thousands) | | |
| Forfeited | — |
| | $ | — |
| 31 |
| | $ | 38 |
|
| Expired | 27 |
| | $ | 17 |
| 28 |
| | $ | 28 |
|
| Total Options Cancelled during 2013 | 27 |
| | $ | 17 |
| |
| Total Options Cancelled during 2016 | | 59 |
| | $ | 33 |
|
The options outstanding and exercisable for equity share-based payment awards at October 31, 20132016 were as follows:
| | | | Options Outstanding | | Options Exercisable | Options Outstanding | | Options Exercisable |
Range of Exercise Prices | Number Outstanding | | Weighted Average Remaining Contractual Life | | Weighted Average Exercise Price | | Aggregate Intrinsic Value | | Number Exercisable | | Weighted Average Remaining Contractual Life | | Weighted Average Exercise Price | | Aggregate Intrinsic Value | Number Outstanding | | Weighted Average Remaining Contractual Life | | Weighted Average Exercise Price | | Aggregate Intrinsic Value | | Number Exercisable | | Weighted Average Remaining Contractual Life | | Weighted Average Exercise Price | | Aggregate Intrinsic Value |
| | (in thousands) | | (in years) | | | | (in thousands) | | (in thousands) | | (in years) | | | | (in thousands) | (in thousands) | | (in years) | | | | (in thousands) | | (in thousands) | | (in years) | | | | (in thousands) |
| $0 - 25 | 1,507 |
| | 2.4 | | $ | 20 |
| | $ | 45,750 |
| | 1,507 |
| | 2.4 | | $ | 20 |
| | $ | 45,750 |
| 361 |
| | 2.4 | | $ | 18 |
| | $ | 9,268 |
| | 361 |
| | 2.4 | | $ | 18 |
| | $ | 9,268 |
|
| $25.01 - 30 | 1,051 |
| | 5.9 | | $ | 29 |
| | 22,418 |
| | 691 |
| | 5.8 | | $ | 29 |
| | 14,727 |
| 1,633 |
| | 5.0 | | $ | 26 |
| | 28,095 |
| | 1,324 |
| | 4.7 | | $ | 26 |
| | 22,741 |
|
| $30.01 - 40 | 7,045 |
| | 5.6 | | $ | 35 |
| | 112,829 |
| | 3,870 |
| | 3.4 | | $ | 34 |
| | 66,448 |
| 898 |
| | 7.1 | | $ | 39 |
| | 3,995 |
| | 439 |
| | 7.1 | | $ | 39 |
| | 1,957 |
|
| $40.01 & over | 6 |
| | 8.4 | | $ | 45 |
| | 33 |
| | 1 |
| | 8.4 | | $ | 45 |
| | 8 |
| |
| $40.01 - over | | 1,214 |
| | 8.0 | | $ | 41 |
| | 3,259 |
| | 302 |
| | 8.0 | | $ | 41 |
| | 815 |
|
| | 9,609 |
| | 5.1 | | $ | 32 |
| | $ | 181,030 |
| | 6,069 |
| | 3.4 | | $ | 30 |
| | $ | 126,933 |
| 4,106 |
| | 6.1 | | $ | 33 |
| | $ | 44,617 |
| | 2,426 |
| | 5.2 | | $ | 29 |
| | $ | 34,781 |
|
The aggregate intrinsic value in the table above represents the total pre-tax intrinsic value, based on the company's closing stock price of $50.76$43.57 at October 31, 2013,2016, which would have been received by award holders had all award holders exercised their awards that were in-the-money as of that date. The total number of in-the-money awards exercisable at October 31, 20132016 was approximately 62.4 million.
The following table summarizes the aggregate intrinsic value of options exercised and the fair value of options granted in 20132016, 20122015 and 20112014:
|
| | | | | | | | | | | |
| | Aggregate Intrinsic Value | | Weighted Average Exercise Price | | Per Share Value Using Black-Scholes Model |
| | (in thousands) | | | | |
| Options exercised in fiscal 2011 | $ | 164,738 |
| | $ | 27 |
| | |
|
| Black-Scholes per share value of options granted during fiscal 2011 | |
| | |
| | $ | 12 |
|
| Options exercised in fiscal 2012 | $ | 38,188 |
| | $ | 23 |
| | |
|
| Black-Scholes per share value of options granted during fiscal 2012 | |
| | |
| | $ | 14 |
|
| Options exercised in fiscal 2013 | $ | 71,499 |
| | $ | 28 |
| | |
|
| Black-Scholes per share value of options granted during fiscal 2013 | |
| | |
| | $ | 12 |
|
|
| | | | | | | | | | | |
| | Aggregate Intrinsic Value | | Weighted Average Exercise Price | | Per Share Value Using Black-Scholes Model |
| | (in thousands) | | | | |
| Options exercised in fiscal 2014 | $ | 98,075 |
| | $ | 30 |
| | |
|
| Black-Scholes per share value of options granted during fiscal 2014 | |
| | |
| | $ | 19 |
|
| Options exercised in fiscal 2015 | $ | 33,258 |
| | $ | 24 |
| | |
|
| Black-Scholes per share value of options granted during fiscal 2015 | |
| | |
| | $ | 11 |
|
| Options exercised in fiscal 2016 | $ | 26,913 |
| | $ | 25 |
| | |
|
| Black-Scholes per share value of options granted during fiscal 2016 | |
| | |
| | $ | — |
|
As of October 31, 20132016, the unrecognized share-based compensation costs for outstanding stock option awards, net of expected forfeitures, was approximately $132 million which is expected to be amortized over a weighted average period of 2.21.7 years. The amount of cash received from the exercise of share-based awards granted was $16162 million in 20132016, $10058 million in 20122015 and $304188 million in 20112014. See Note 5, "Income Taxes" for the tax impact on share-based award exercises.
Non-vested Awards
The following table summarizes non-vested award activity in 20132016 primarily for our LTPP and restricted stock unit awards:awards.
| | | | Shares | | Weighted Average Grant Price | Shares | | Weighted Average Grant Price |
| | (in thousands) | | | (in thousands) | | |
| Non-vested at October 31, 2012 | 3,514 |
| | $ | 35 |
| |
| Non-vested at October 31, 2015 | | 2,417 |
| | $ | 36 |
|
| Granted | 1,394 |
| | $ | 38 |
| 1,732 |
| | $ | 40 |
|
| Vested | (1,251 | ) | | $ | 35 |
| (607 | ) | | $ | 35 |
|
| Forfeited | (76 | ) | | $ | 38 |
| (94 | ) | | $ | 39 |
|
| Change in LTPP shares vested in the year due to performance conditions | (35 | ) | | $ | 36 |
| |
| Non-vested at October 31, 2013 | 3,546 |
| | $ | 37 |
| |
| Change in LTPP shares in the year due to not meeting performance conditions | | (386 | ) | | $ | 28 |
|
| Non-vested at October 31, 2016 | | 3,062 |
| | $ | 40 |
|
As of October 31, 20132016, the unrecognized share-based compensation costs for non-vested restricted stock awards, net of expected forfeitures, was approximately $5445 million which is expected to be amortized over a weighted average period of 2.22.5 years. The total fair value of restricted stock awards vested was $4421 million for 20132016,$31 million for 2015 and $54 million for 2012 and $43 million for 20112014.
In the third quarter of fiscal year 2016, the company elected to early adopt new guidance that changes the accounting for certain aspects of share-based payments to employees. For additional details related to the new guidance see Note 2, "New Accounting Pronouncements."
5. INCOME TAXES
The domestic and foreign components of income from continuing operations before taxes are:
| | | | Years Ended October 31, | Years Ended October 31, |
| | 2013 | | 2012 | | 2011 | 2016 | | 2015 | | 2014 |
| | (in millions) | (in millions) |
| U.S. operations | $ | 39 |
| | $ | 45 |
| | $ | 88 |
| $ | 27 |
| | $ | 77 |
| | $ | (72 | ) |
| Non-U.S. operations | 820 |
| | 998 |
| | 944 |
| 517 |
| | 403 |
| | 301 |
|
| Total income before taxes | $ | 859 |
| | $ | 1,043 |
| | $ | 1,032 |
| |
| Total income from continuing operations before taxes | | $ | 544 |
| | $ | 480 |
| | $ | 229 |
|
The provision (benefit) for income taxes is comprised of:
| | | | Years Ended October 31, | Years Ended October 31, |
| | 2013 | | 2012 | | 2011 | 2016 | | 2015 | | 2014 |
| | (in millions) | (in millions) |
| U.S. federal taxes: | | | | | | | | | | |
| Current | $ | 24 |
| | $ | 6 |
| | $ | (1 | ) | $ | (1 | ) | | $ | (91 | ) | | $ | 17 |
|
| Deferred | 48 |
| | (144 | ) | | — |
| 19 |
| | 97 |
| | (80 | ) |
| Non-U.S. taxes: | | | | | | | | | | |
| Current | 77 |
| | 41 |
| | (6 | ) | 77 |
| | 62 |
| | 176 |
|
| Deferred | (24 | ) | | (22 | ) | | 28 |
| (14 | ) | | (27 | ) | | (111 | ) |
| State taxes, net of federal benefit: | | | | | | | | | | |
| Current | 3 |
| | 1 |
| | (11 | ) | 3 |
| | 1 |
| | — |
|
| Deferred | 7 |
| | 8 |
| | 10 |
| (2 | ) | | — |
| | (5 | ) |
| Total provision | $ | 135 |
| | $ | (110 | ) | | $ | 20 |
| |
| Total provision (benefit) | | $ | 82 |
| | $ | 42 |
| | $ | (3 | ) |
The income tax provision (benefit) does not reflect potential future tax savings resulting from excess deductions associated with our various share-based award plans.
The significant components of deferred tax assets and deferred tax liabilities included on the consolidated balance sheet are:
| | | | October 31, | October 31, |
| | 2013 | | 2012 | 2016 | | 2015 |
| | Deferred Tax Assets | | Deferred Tax Liabilities | | Deferred Tax Assets | | Deferred Tax Liabilities | Deferred Tax Assets | | Deferred Tax Liabilities | | Deferred Tax Assets | | Deferred Tax Liabilities |
| | (in millions) | (in millions) |
| Inventory | $ | 32 |
| | $ | — |
| | $ | 24 |
| | $ | — |
| $ | 13 |
| | $ | — |
| | $ | 13 |
| | $ | — |
|
| Intangibles | — |
| | 214 |
| | — |
| | 239 |
| — |
| | 92 |
| | — |
| | 95 |
|
| Property, plant and equipment | 18 |
| | — |
| | 11 |
| | — |
| 16 |
| | — |
| | 17 |
| | — |
|
| Warranty reserves | 25 |
| | — |
| | 21 |
| | — |
| 14 |
| | — |
| | 11 |
| | — |
|
| Retiree medical benefits | — |
| | — |
| | 5 |
| | — |
| |
| Pension benefits | 42 |
| | — |
| | 136 |
| | — |
| |
| Pension benefits and retiree medical benefits | | 136 |
| | — |
| | 93 |
| | — |
|
| Employee benefits, other than retirement | 57 |
| | — |
| | 60 |
| | — |
| 28 |
| | — |
| | 26 |
| | — |
|
| Net operating loss, capital loss, and credit carryforwards | 263 |
| | — |
| | 293 |
| | — |
| 293 |
| | — |
| | 173 |
| | — |
|
| Unrealized gains/losses on investments | 24 |
| | — |
| | 26 |
| | — |
| |
| Unremitted earnings of foreign subsidiaries | — |
| | 114 |
| | — |
| | 88 |
| — |
| | 53 |
| | — |
| | 33 |
|
| Share-based compensation | 54 |
| | — |
| | 57 |
| | — |
| 41 |
| | — |
| | 39 |
| | — |
|
| Deferred revenue | 27 |
| | — |
| | 27 |
| | — |
| 42 |
| | — |
| | 41 |
| | — |
|
| Other | 36 |
| | 3 |
| | 51 |
| | 1 |
| 12 |
| | — |
| | 4 |
| | — |
|
| Subtotal | 578 |
| | 331 |
| | 711 |
| | 328 |
| 595 |
| | 145 |
| | 417 |
| | 128 |
|
| Tax valuation allowance | (85 | ) | | — |
| | (93 | ) | | — |
| (129 | ) | | — |
| | (131 | ) | | — |
|
| Total deferred tax assets or deferred tax liabilities | $ | 493 |
| | $ | 331 |
| | $ | 618 |
| | $ | 328 |
| $ | 466 |
| | $ | 145 |
| | $ | 286 |
| | $ | 128 |
|
The significant decreaseincrease in 20132016 as compared to 20122015 for the deferred tax asset relating to pension benefits is due mainly to the tax effect of changes in post-retirement pension plans recognized in other comprehensive income.income (loss). The deferred increase in net operating losses and
tax liability relating to intangible assetscredits is due primarilymainly to acquired intangible assets from Dako. The amortization expenses associated with acquired intangible assets are not deductible for tax purposes.the early adoption of Accounting Standard Update (“ASU”) 2016-09 “Improvements to Employees Share-Based Payment Accounting".
Agilent records U.S. income taxes on the undistributed earnings of foreign subsidiaries unless the subsidiaries' earnings are considered indefinitely reinvested outside the U.S. As of October 31, 20132016 the Company recognized a $114$53 million deferred tax liability for the overall residual tax expected to be imposed upon the repatriation of unremitted foreign earnings that are not considered permanently reinvested. As of October 31, 2013,2016, the cumulative amount of undistributed earnings considered indefinitely reinvested was $6.1 billion.$5.5 billion. No deferred tax liability has been recognized on the basis difference created by such earnings since it is our intention to utilize those earnings in the company’s foreign operations. Because of the availability of U.S. foreign tax credits, the determination of the unrecognized deferred tax liability on these earnings is not practicable.
In November 2015, the FASB issued guidance to simplify accounting for deferred taxes. Beginning on November 1, 2017 and including the interim periods following that date, we will be required to present all deferred tax balances as non-current. Prior GAAP guidance required us to record deferred tax balances as either current or non-current in accordance with the classification of the underlying attributes. Early adoption of this guidance was permitted and could be applied either prospectively or retrospectively to all periods presented. We adopted this guidance at the end of the period ended April 30, 2016 prospectively. Therefore, the October 31, 2016 consolidated balance sheet reflects the new disclosure requirements but prior periods have not been adjusted.
The breakdown between current and long-term deferred tax assets and deferred tax liabilities was as follows for the years 20132016 and 20122015:
| | | | October 31, | October 31, |
| | 2013 | | 2012 | 2016 | | 2015 |
| | (in millions) | (in millions) |
| Current deferred tax assets (included within other current assets) | $ | 115 |
| | $ | 95 |
| $ | — |
| | $ | 84 |
|
| Long-term deferred tax assets (included within other assets) | 264 |
| | 400 |
| 386 |
| | 180 |
|
| Current deferred tax liabilities (included within other accrued liabilities) | (4 | ) | | (2 | ) | — |
| | (10 | ) |
| Long-term deferred tax liabilities (included within other long-term liabilities) | (213 | ) | | (203 | ) | (65 | ) | | (96 | ) |
| Total | $ | 162 |
| | $ | 290 |
| $ | 321 |
| | $ | 158 |
|
Valuation allowances require an assessment of both positive and negative evidence when determining whether it is more likely than not that deferred tax assets are recoverable. Such assessment is required on a jurisdiction by jurisdiction basis. In the fourth quarter of 2012, management concluded that the valuation allowance for most of Agilent's U.S. federal and state deferred tax assets is no longer needed primarily due to the emergence from cumulative losses in recent years, the return to sustainable U.S. operating profits and the expectation of sustainable profitability in future periods. As of October 31, 2012, the cumulative positive evidence outweighed the negative evidence regarding the likelihood that most of the deferred tax asset for Agilent's U.S.
consolidated income tax group will be realized. Accordingly, we recognized a non-recurring tax benefit of $280 million relating to the valuation allowance reversal. As of October 31, 2013,2016, we continued to maintain a valuation allowance of $85$129 million until sufficient positive evidence exists to support reversal. The valuation allowance is mainly related to deferred tax assets for California R&D credits, and net operating losses in the Netherlands.Netherlands and capital losses in the U.S. and Australia.
At October 31, 20132016, we had federal net operating loss carryforwards of approximately $2219 million and $142 milliontax credit carryforwards of approximately $113 million.carryforwards. The federal net operating losses expire in years beginning 20212020 through 2026, and the federal tax credits begin to expire in 2018, if not utilized.2034. At October 31, 20132016, we had state net operating loss carryforwards of approximately $161200 million which expire in years beginning 20142017 through 2031,2033, if not utilized. In addition, we had net state tax credit carryforwards of $2636 million that do not expire. All of the federal and some of the state net operating loss carryforwards are subject to change of ownership limitations provided by the Internal Revenue Code and similar state provisions. At October 31, 20132016, we also had foreign net operating loss carryforwards of approximately $472296 million. Of this foreign loss, $237148 million will expire in years beginning 20142017 through 2022,2026, if not utilized. The remaining $235148 million has an indefinite life. Some of the foreign losses are subject to annual loss limitation rules. These annual loss limitations in the U.S. and foreign jurisdictions may result in the expiration or reduced utilization of the net operating losses.
In March 2016, the Financial Accounting Standards Board (“FASB”) issued amendments that change the accounting for certain aspects of share-based payments to employees. The authoritativenew guidance prohibits recognition of a deferred tax asset forrequires excess tax benefits relatedand tax deficiencies to stock and stock option plansbe recorded in the income statement when the awards vest or are settled. Under the new guidance the benefit will be recorded when it arises with a cumulative effect adjustment to opening retained earnings for previously unrecognized benefits. The new guidance is effective for us beginning November 1, 2017, with early adoption permitted. We elected to early adopt the new guidance in the third quarter of fiscal year 2016, on a retrospective basis, which required us to reflect any adjustments as of November 1, 2015, the beginning of the annual period that have not yet been realized through reductionincludes the interim period of adoption. The impact of adoption on previously reported quarterly results was the recognition of tax shortfalls of $2 million in our provision for income taxes payable. Such unrecognizedfor the first quarter of fiscal year 2016. Additional amendments to the accounting for income taxes on previously reported quarterly results was the recognition of the windfall tax benefits as a cumulative effect adjustment to opening retained earnings of $196 million together with an increase in deferred tax benefit totals $150assets included in other assets of $98 million, as an increase in additional paid in
capital of $4 million, a reduction in income taxes payable. The Company recognized approximately $68other accrued liabilities of $1 million as and a credit to shareholders' equitydecrease of $99 million in other long term liabilities. See Note 2 "New Accounting Pronouncements" for cumulative excess tax benefits related to stock and stock option plans that have been realized as of October 31, 2013.additional information.
The differences between the U.S. federal statutory income tax rate and our effective tax rate are:
| | | | Years Ended October 31, | Years Ended October 31, |
| | 2013 | | 2012 | | 2011 | 2016 | | 2015 | | 2014 |
| | (in millions) | (in millions) |
| Profit before tax times statutory rate | $ | 301 |
| | $ | 365 |
| | $ | 361 |
| $ | 190 |
| | $ | 167 |
| | $ | 80 |
|
| State income taxes, net of federal benefit | 7 |
| | 8 |
| | (1 | ) | 2 |
| | (8 | ) | | (7 | ) |
| Non-U.S. income taxed at different rates | (162 | ) | | (144 | ) | | (153 | ) | (68 | ) | | (72 | ) | | (39 | ) |
| Change in unrecognized non-U.S. tax benefits | — |
| | (68 | ) | | (97 | ) | |
| Change in unrecognized U.S. tax benefits | | (27 | ) | | (116 | ) | | (111 | ) |
| Repatriation of foreign earnings | | — |
| | 68 |
| | 75 |
|
| Valuation allowances | (8 | ) | | (280 | ) | | (84 | ) | 18 |
| | (2 | ) | | 2 |
|
| Adjustments to earnings of foreign subsidiaries | | (11 | ) | | — |
| | — |
|
| Adjustment to income taxes payable | | — |
| | — |
| | (6 | ) |
| Other, net | (3 | ) | | 9 |
| | (6 | ) | (22 | ) | | 5 |
| | 3 |
|
| Provision for income taxes | $ | 135 |
| | $ | (110 | ) | | $ | 20 |
| |
| Provision (benefit) for income taxes | | $ | 82 |
| | $ | 42 |
| | $ | (3 | ) |
| Effective tax rate | 16 | % | | (11 | )% | | 2 | % | 15.1 | % | | 8.7 | % | | (1.3 | )% |
Agilent enjoys tax holidays in several different jurisdictions, most significantly in Singapore. The tax holidays provide lower rates of taxation on certain classes of income and require various thresholds of investments and employment or specific types of income in those jurisdictions. The tax holidays are due for renewal between 20152018 and 2023. As a result of the incentives, the impact of the tax holidays decreased income taxes by $12786 million, $12265 million, and $12727 million in 20132016, 20122015, and 20112014, respectively. The benefit of the tax holidays on net income per share (diluted) was approximately $0.370.26, $0.350.19, and $0.360.08 in 20132016, 20122015 and 20112014, respectively.
For 2013,2016, the company’s effective tax rate from continuing operations was 16 percent.15.1%. The 16 percentincome tax expense from continuing operations was $82 million. The income tax provision from continuing operations for the year ended October 31, 2016 included net discrete tax expense of $17 million. The net discrete tax expense for the year ended October 31, 2016 included $5 million of tax benefit for the extension of the U.S. research and development tax credit attributable to the company's prior fiscal year, $6 million of tax expense related to the curtailment gain recognized with respect to the U.S. retirement plan and Supplemental Benefits Plan, $18 million of tax expense related to the establishment of a valuation allowance on an equity method impairment that would generate a capital loss when realized, and a net $2 million of other discrete tax benefit. Included in the net $2 million discrete tax benefit are $9 million of out-of-period correcting tax expense entries recorded in the second and fourth quarters of fiscal year 2016 associated with German return-to-provision corrections. These are offset by an $11 million out-of-period correcting tax benefit associated with an adjustment to the deferred tax liability for unremitted foreign earnings. The out-of-period corrections were determined to be immaterial to the previously issued and current period financial statements.
For 2015, the company’s effective tax rate is lower thanfrom continuing operations was 8.7 percent. The income tax expense from continuing operations was $42 million. The income tax expense from continuing operations for the U.S. statutory rateyear ended October 31, 2015 included net discrete tax benefits of $55 million primarily due to the mixsettlement of earningsan Internal Revenue Service (“IRS) audit in non-U.S. jurisdictions taxed at lower statutory rates; in particular Singapore where we enjoythe U.S. and the recognition of tax holidays. Theexpense related to the repatriation of dividends.
For 2014, the company's effective tax rate alsofrom continuing operations was (1.3) percent. The income tax benefit from continuing operations was $3 million. The income tax benefit for the year ended October 31, 2014 included a $12net discrete benefit of $33 million out-of-period adjustment to increase Internal Revenue Service ("IRS") audit in the U.S. and the recognition of tax expense recognized in the second quarter of 2013, associated with the write off of deferred tax assets related to foreign tax credits incorrectly claimed in prior years.the repatriation of dividends.
For 2012, the effective tax was a benefit of 11 percent. The11 percent effective tax rate benefit reflected tax on earnings in jurisdictions that had low effective tax rates and includes a $280 million tax benefit due to the reversal of a valuation allowance for most U.S. federal and state deferred tax assets. Valuation allowances require an assessment of both positive and negative evidence when determining whether it is more likely than not that deferred tax assets are recoverable. Such assessment is required on a jurisdiction by jurisdiction basis. In the fourth quarter of 2012, management concluded that the valuation allowance for most of Agilent's U.S. federal and state deferred tax assets is no longer needed primarily due to the emergence from cumulative losses in recent years, the return to sustainable U.S. operating profits and the expectation of sustainable profitability in future periods. As of October 31, 2012, the cumulative positive evidence outweighed the negative evidence regarding the likelihood that most
of the deferred tax asset for Agilent's U.S. consolidated income tax group will be realized. Accordingly, the Company recognized a non-recurring tax benefit of $280 million relating to the valuation allowance reversal. The effective tax rate also included a non-recurring tax expense of $88 million relating to an increase in the overall residual U.S. tax expected to be imposed upon the repatriation of unremitted foreign earnings previously considered permanently reinvested. During the fourth quarter of 2012, the Company assessed the forecasted cash needs and the overall financial position of its foreign subsidiaries and determined that a portion of previously permanently reinvested earnings would no longer be reinvested overseas. The effective tax rate was also reduced by a $68 million tax benefit primarily associated with the recognition of previously unrecognized tax benefits and the reversal of the related interest accruals due to the reassessment of certain uncertain tax positions relating to foreign jurisdictions.
For 2011, the effective tax rate was 2 percent. The 2 percent effective tax rate reflected tax on earnings in jurisdictions that had low effective tax rates and included a $97 million net tax benefit primarily associated with a refund in Canada and the recognition of previously unrecognized tax benefits and the reversal of the related interest accruals due to the reassessment of certain uncertain tax positions. The income tax provision also included a $26 million out of period adjustment to reduce the carrying value of certain U.K. deferred tax assets for which the majority was recorded in the quarter ended April 30, 2011. The overstatement of these deferred tax assets resulted in an overstatement of the U.K. valuation allowance release in the fourth quarter of 2010. For the full year, this out of period adjustment was substantially offset by other out of period adjustments. The net impact of all out of period adjustments on the effective tax rate was immaterial. Without considering interest and penalties, the effective rate reflected taxes in all jurisdictions except the U.S. and certain foreign jurisdictions in which income tax expense or benefit continued to be offset by adjustments to valuation allowances.
The breakdown between current and long-term income tax assets and liabilities, excluding deferred tax assets and liabilities, was as follows for the years 20132016 and 2012:2015:
| | | | October 31, | October 31, |
| | 2013 | | 2012 | 2016 | | 2015 |
| | (in millions) | (in millions) |
| Current income tax assets (included within other current assets) | $ | 42 |
| | $ | 65 |
| $ | 83 |
| | $ | 104 |
|
| Long-term income tax assets (included within other assets) | 34 |
| | 49 |
| 19 |
| | 20 |
|
| Current income tax liabilities (included within other accrued liabilities) | (48 | ) | | (115 | ) | (49 | ) | | (62 | ) |
| Long-term income tax liabilities (included within other long-term liabilities) | (341 | ) | | (320 | ) | (190 | ) | | (227 | ) |
| Total | $ | (313 | ) | | $ | (321 | ) | $ | (137 | ) | | $ | (165 | ) |
The calculation of our tax liabilities involves dealing with uncertainties in the application of complex tax law and regulations in a multitude of jurisdictions. Although the guidance on the accounting for uncertainty in income taxes prescribes the use of a recognition and measurement model, the determination of whether an uncertain tax position has met those thresholds will continue to require significant judgment by management. In accordance with the guidance on the accounting for uncertainty in income taxes, for all U.S. and other tax jurisdictions, we recognize potential liabilities for anticipated tax audit issues based on our estimate of whether, and the extent to which, additional taxes and interest will be due. The ultimate resolution of tax uncertainties may differ from what is currently estimated, which could result in a material impact on income tax expense. If our estimate of income tax liabilities proves to be less than the ultimate assessment, a further charge to expense would be required. If events occur and the payment of these amounts ultimately proves to be unnecessary, the reversal of the liabilities would result in tax benefits being recognized in the period when we determine the liabilities are no longer necessary.
The aggregate changes in the balances of our unrecognized tax benefits including all federal, state and foreign tax jurisdictions are as follows:
| | | | 2013 | | 2012 | | 2011 | 2016 | | 2015 | | 2014 |
| | (in millions) | (in millions) |
| Balance, beginning of year | $ | 464 |
| | $ | 469 |
| | $ | 656 |
| $ | 289 |
| | $ | 417 |
| | $ | 512 |
|
| Additions for acquisitions | — |
| | — |
| | — |
| |
| Additions for tax positions related to the current year | 53 |
| | 56 |
| | 41 |
| 31 |
| | 33 |
| | 45 |
|
| Additions for tax positions from prior years | 11 |
| | 40 |
| | 18 |
| 1 |
| | 3 |
| | 11 |
|
| Reductions for tax positions from prior years | (6 | ) | | (90 | ) | | (170 | ) | (27 | ) | | (156 | ) | | (141 | ) |
| Settlements with taxing authorities | (3 | ) | | (2 | ) | | (67 | ) | — |
| | (4 | ) | | (2 | ) |
| Statute of limitations expirations | (3 | ) | | (9 | ) | | (9 | ) | (1 | ) | | (4 | ) | | (8 | ) |
| Balance, end of year | $ | 516 |
| | $ | 464 |
| | $ | 469 |
| $ | 293 |
| | $ | 289 |
| | $ | 417 |
|
As of October 31, 2013,2016, we had $516$293 million of unrecognized tax benefits of which $499$271 million,, if recognized, would affect our effective tax rate.
We recognized a tax expense of $5$2 million,, a tax benefit of $4$2 million and a tax expense of $14benefit $10 million of interest and penalties related to unrecognized tax benefits in 2013, 20122016, 2015 and 2011,2014, respectively. Interest and penalties accrued as of October 31, 20132016 and 20122015 were $39$25 million and $34$24 million,, respectively.
On November 1, 2014, Agilent transferred deferred tax assets of $237 million, deferred tax liabilities of $37 million, current income tax payable of $40 million, and other long-term liabilities related to uncertain tax positions totaling $8 million to Keysight as part of its separation from Agilent. A current prepaid income tax asset of $19 million and long-term prepaid income tax asset of $3 million related to sales of intercompany assets was also transferred to Keysight upon separation from Agilent.
In the U.S., tax years remain open back to the year 20062012 for federal income tax purposes and the year 2000 for significant states. Our U.S. federal incomeOn September 22, 2015, we reached an agreement with the Internal Revenue Service ("IRS") for the tax returnsyears 2008 through 2011. During the first quarter of 2016, we made a payment of approximately $9 million of tax plus interest as part of closing the exam. This amount was partially offset by a prepaid tax account of approximately $3 million that the IRS allowed as an offset to the $12 million in incremental taxes. The settlement resulted in the recognition, within the continuing operations, of previously unrecognized tax benefits of $119 million, offset by a tax liability on foreign distributions of approximately $99 million principally related to the repatriation of foreign earnings.
On January 29, 2014 we reached an agreement with the IRS for the tax years 2006 through 2007 are currently under audit2007. The settlement resulted in the recognition, within the continuing operations, of previously unrecognized tax benefits of $111 million, offset by the IRS. During the three months ended July 31, 2012, we received a Revenue Agents Report (“RAR”) for these years and filed a protest to dispute certain adjustments, the most significanttax liability on foreign distributions of which pertainsapproximately $75 million principally related to the amountrepatriation of a gain from the disposition of a business that was allocated to the U.S. for income tax purposes. There can be no assurance that the outcome of this dispute will not have a material effect on our operating results or financial condition. foreign earnings.
In other major jurisdictions where we conductthe company conducts business, the tax years generally remain open back to the year 2003.2001. With these jurisdictions and the U.S., it is reasonably possible that there could be significant changes to our unrecognized tax benefits in the next twelve months due to either the expiration of a statute of limitation or a tax audit settlement.settlement which will be partially offset by an anticipated tax liability related to unremitted foreign earnings, where applicable. Given the number of years and numerous matters that remain subject to examination in various tax jurisdictions, we aremanagement is unable to estimate the range of possible changes to the balance of our unrecognized tax benefits.
On July 27, 2015, the U.S. Tax Court issued an opinion in Altera Corp. v. Commissioner related to the treatment of stock-based compensation expense in an intercompany cost-sharing arrangement. A final decision was entered by the U.S. Tax Court on December 1, 2015. At this time, the U.S. Department of the Treasury has not withdrawn the requirement from its regulations to include stock-based compensation. The IRS notified the U.S. Court of Appeals for the Ninth Circuit on February 19, 2016 of its intent to appeal the Tax Court's decision in the case. We concluded that no adjustment to our consolidated financial statements is appropriate at this time due to the uncertainties with respect to the ultimate resolution of this case.
6. NET INCOME PER SHARE
The following is a reconciliation of the numerators and denominators of the basic and diluted net income per share computations for the periods presented below.
| | | | Years Ended October 31, | Years Ended October 31, |
| | 2013 | | 2012 | | 2011 | 2016 | | 2015 | | 2014 |
| | (in millions) | (in millions) |
| Numerator: | | | | | | | | | | |
| Income from continuing operations | | $ | 462 |
| | $ | 438 |
| | $ | 232 |
|
| Income (loss) from discontinued operations | | $ | — |
| | $ | (37 | ) | | $ | 317 |
|
| Net income | $ | 724 |
| | $ | 1,153 |
| | $ | 1,012 |
| 462 |
| | 401 |
| | 549 |
|
| Denominators: | | | | | | | | | | |
| Basic weighted average shares | 341 |
| | 348 |
| | 347 |
| 326 |
| | 333 |
| | 333 |
|
| Potentially dilutive common stock equivalents — stock options and other employee stock plans | 4 |
| | 5 |
| | 8 |
| |
| Potential common shares — stock options and other employee stock plans | | 3 |
| | 2 |
| | 5 |
|
| Diluted weighted average shares | 345 |
| | 353 |
| | 355 |
| 329 |
| | 335 |
| | 338 |
|
In connection with the separation of Keysight on November 1, 2014 and in accordance with the Employee Matters Agreement we made certain adjustments to the exercise price and number of our share-based compensation awards. These adjustments to our share-based awards did not have a material impact on our dilutive weighted average shares.
The dilutive effect of share-based awards is reflected in diluted net income per share by application of the treasury stock method, which includes consideration of unamortized share-based compensation expense the tax benefits or shortfalls charged to additional paid-in capital and the dilutive effect of in-the-money options and non-vested restricted stock units. Under the treasury stock method, the amount the employee must pay for exercising stock options and unamortized share-based compensation expense and tax benefits or shortfalls collectively are assumed proceeds to be used to repurchase hypothetical shares. An increase in the fair market value of the company's common stock can result in a greater dilutive effect from potentially dilutive awards. The total number of share-based awards issued in 20132016, 20122015 and 20112014 were 63 million, 53 million and 126 million, respectively.
We exclude stock options with exercise prices greater than the average market price of our common stock from the calculation of diluted earnings per share because their effect would be anti-dilutive. For 2013, 20122016, 2015 and 2011,2014, options to purchase 4,200, 436,500842,200, 1.2 million and 554,0001,500 shares respectively were excluded from the calculation of diluted earnings per share. In addition, we also exclude from the calculation of diluted earnings per share, stock options, ESPP, LTPP and restricted stock awards whose combined exercise price and unamortized fair value and excess tax benefits or shortfalls collectively were greater than the average market price of our common stock because their effect would also be anti-dilutive. For the year ended 2013, 20122016, 2015 and 2011,2014, options to purchase 18,300, 1,544,600229,600, 368,900 and 115,200383,200 shares respectively were excluded from the calculation of diluted earnings per share.
7. SUPPLEMENTAL CASH FLOW INFORMATION
Net cash paid for income taxes was $110 million in 2013, $86 million in 2012, and $22 million in 2011. Cash paid for interest was $112 million in 2013, $111 million in 2012 and $95 million in 2011.
8.7. INVENTORY
| | | | October 31, | October 31, |
| | 2013 | | 2012 | 2016 | | 2015 |
| | (in millions) | (in millions) |
| Finished goods | $ | 552 |
| | $ | 509 |
| $ | 339 |
| | $ | 362 |
|
| Purchased parts and fabricated assemblies | 514 |
| | 505 |
| 194 |
| | 179 |
|
| Inventory | $ | 1,066 |
| | $ | 1,014 |
| $ | 533 |
| | $ | 541 |
|
Inventory-related excess and obsolescence charges, included in continuing operations, of $48$20 million were recorded in total cost of products in 20132016, and $30 million each in 20122015 and $46 million in 20112014, respectively. We record excess and obsolete inventory charges for both inventory on our site as well as inventory at our contract manufacturers and suppliers where we have non-cancellable purchase commitments.
9.8. PROPERTY, PLANT AND EQUIPMENT, NET
| | | | October 31, | October 31, |
| | 2013 | | 2012 | 2016 | | 2015 |
| | (in millions) | (in millions) |
| Land | $ | 131 |
| | $ | 142 |
| $ | 53 |
| | $ | 53 |
|
| Buildings and leasehold improvements | 1,330 |
| | 1,475 |
| 757 |
| | 705 |
|
| Machinery and equipment | 1,019 |
| | 882 |
| 420 |
| | 405 |
|
| Software | 398 |
| | 383 |
| 176 |
| | 171 |
|
| Total property, plant and equipment | 2,878 |
| | 2,882 |
| 1,406 |
| | 1,334 |
|
| Accumulated depreciation and amortization | (1,744 | ) | | (1,718 | ) | (767 | ) | | (730 | ) |
| Property, plant and equipment, net | $ | 1,134 |
| | $ | 1,164 |
| $ | 639 |
| | $ | 604 |
|
There were no asset impairments in 2016 and 2015. Asset impairments other than restructuringrelated to our exit of the NMR business were $3 millionzero in 2013, zero2014. Asset impairments in 2012 andconnection with the exit of the NMR business were $7 million in 2011.2014. Depreciation expenses were $18195 million in 20132016, $17198 million in 20122015 and $142120 million in 20112014. For the year ended October 31, 2012 we recorded $15 million of accelerated depreciation related to a building classified as held and used. In accordance with the accounting guidance, it was determined that the building had been abandoned and an assessment was made of the remaining useful life of the building. The building was written down to its appropriate fair value.
10.9. GOODWILL AND OTHER INTANGIBLE ASSETS
The goodwill balances at October 31, 20132016, 20122015 and 20112014 and the movements in 20132016 and 20122015 for each of our reportable segments are shown in the table below:
|
| | | | | | | | | | | | | | | |
| | Life Sciences and Diagnostics | | Chemical Analysis | | Electronic Measurement | | Total |
| | (in millions) |
| Goodwill as of October 31, 2011 | $ | 363 |
| | $ | 760 |
| | $ | 444 |
| | $ | 1,567 |
|
| Foreign currency translation impact | 25 |
| | (10 | ) | | (9 | ) | | 6 |
|
| Goodwill arising from acquisitions | 1,419 |
| | 1 |
| | 32 |
| | 1,452 |
|
| Goodwill as of October 31, 2012 | $ | 1,807 |
| | $ | 751 |
| | $ | 467 |
| | $ | 3,025 |
|
| Foreign currency translation impact | 63 |
| | (10 | ) | | (47 | ) | | 6 |
|
| Goodwill arising from acquisitions and other adjustments | 13 |
| | 4 |
| | (1 | ) | | 16 |
|
| Goodwill as of October 31, 2013 | $ | 1,883 |
| | $ | 745 |
| | $ | 419 |
| | $ | 3,047 |
|
|
| | | | | | | | | | | | | | | |
| | Life Sciences and Applied Markets | | Diagnostics and Genomics | | Agilent CrossLab | | Total |
| | (in millions) |
| Goodwill as of October 31, 2014 | $ | 668 |
| | $ | 1,345 |
| | $ | 494 |
| | $ | 2,507 |
|
| Foreign currency translation impact | (18 | ) | | (166 | ) | | (12 | ) | | (196 | ) |
| Goodwill arising from acquisitions | — |
| | 55 |
| | — |
| | 55 |
|
| Goodwill as of October 31, 2015 | $ | 650 |
| | $ | 1,234 |
| | $ | 482 |
| | $ | 2,366 |
|
| Foreign currency translation impact | 3 |
| | (11 | ) | | 3 |
| | (5 | ) |
| Goodwill arising from acquisitions | 137 |
| | — |
| | 19 |
| | 156 |
|
| Goodwill as of October 31, 2016 | $ | 790 |
| | $ | 1,223 |
| | $ | 504 |
| | $ | 2,517 |
|
We formed a new operating segment in the fourth fiscal quarter of 2013. The new life sciences and diagnostics segment was formed by the combination of the life sciences business plus the diagnostics and genomics business. The historical segment information for the life sciences and diagnostics segment has been recast to conform to this new reporting structure. The goodwill balance as of October 31, 2011 has been revised due to miscategorization at acquisition. $4 million of goodwill from the life sciences and diagnostics segment and $5 million of goodwill from the chemical analysis segment has been reallocated to the electronic measurement segment. As of September 30, 2013,2016, we assessed goodwill impairment for our reporting units and no impairment of goodwill was indicated.
The component parts of other intangible assets at October 31, 20132016 and 20122015 are shown in the table below:
| | | | Other Intangible Assets | Other Intangible Assets |
| | Gross Carrying Amount | | Accumulated Amortization and Impairments | | Net Book Value | Gross Carrying Amount | | Accumulated Amortization and Impairments | | Net Book Value |
| | (in millions) | (in millions) |
| As of October 31, 2012: | | | | | | |
| As of October 31, 2015: | | | | | | |
| Purchased technology | | $ | 746 |
| | $ | 476 |
| | $ | 270 |
|
| Trademark/Tradename | | 141 |
| | 50 |
| | 91 |
|
| Customer relationships | | 230 |
| | 168 |
| | 62 |
|
| Total amortizable intangible assets | | $ | 1,117 |
| | $ | 694 |
| | $ | 423 |
|
| In-Process R&D | | 22 |
| | — |
| | 22 |
|
| Total | | $ | 1,139 |
| | $ | 694 |
| | $ | 445 |
|
| As of October 31, 2016: | | | | | | |
| Purchased technology | $ | 849 |
| | $ | 333 |
| | $ | 516 |
| $ | 823 |
| | $ | 572 |
| | $ | 251 |
|
| Backlog | 14 |
| | 14 |
| | — |
| 1 |
| | 1 |
| | — |
|
| Trademark/Tradename | 168 |
| | 27 |
| | 141 |
| 149 |
| | 61 |
| | 88 |
|
| Customer relationships | 391 |
| | 155 |
| | 236 |
| 263 |
| | 211 |
| | 52 |
|
| Total amortizable intangible assets | $ | 1,422 |
| | $ | 529 |
| | $ | 893 |
| $ | 1,236 |
| | $ | 845 |
| | $ | 391 |
|
| In-Process R&D | 193 |
| | — |
| | 193 |
| 17 |
| | — |
| | 17 |
|
| Total | $ | 1,615 |
| | $ | 529 |
| | $ | 1,086 |
| $ | 1,253 |
| | $ | 845 |
| | $ | 408 |
|
| As of October 31, 2013: | | | | | | |
| Purchased technology | $ | 1,019 |
| | $ | 460 |
| | $ | 559 |
| |
| Backlog | 14 |
| | 14 |
| | — |
| |
| Trademark/Tradename | 176 |
| | 40 |
| | 136 |
| |
| Customer relationships | 401 |
| | 215 |
| | 186 |
| |
| Total amortizable intangible assets | $ | 1,610 |
| | $ | 729 |
| | $ | 881 |
| |
| In-Process R&D | 35 |
| | — |
| | 35 |
| |
| Total | $ | 1,645 |
| | $ | 729 |
| | $ | 916 |
| |
In 2013,2016, we acquired Seahorse Bioscience, a leader in providing instruments and assay kits for measuring cell metabolism and bioenergetics, for $242 million and iLab Solutions LLC ("iLab"), a cloud-based solutions provider for core laboratory management for $26 million. We have not included the pro forma impact of these acquisitions since they are not material to our current or prior period results. In 2016, we recorded additions to goodwill of $156 million and to other intangible assets of $121 million related to these acquisitions. During the year other intangible assets decreased $2 million, due to the impact of foreign exchange translation.
In 2015, we recorded additions to goodwill of $16$55 million and to intangible assets of $13 million related to thea single acquisition of four businesses.the company, Cartegenia. During the year we also recorded $5other intangible assets decreased $58 million, of additions and adjustments to other intangibles mostly related due to the same four businesses. We recorded $25 millionimpact of foreign exchange translation impact to other intangibles in 2013. The $158translation. During 2015, we also removed the gross carrying amount of $246 million decrease in in-process R&D was largely due toand the completionrelated accumulated amortization of projects in our life sciences and diagnostics segment.fully amortized intangible assets which were no longer being used.
In 2012,addition, we recorded additions to goodwill$4 million, $3 million and $4 million of $1,452 millionimpairments of other intangibles related to ten businesses including the Dako acquisition discussed in Note 3, "Acquisitions". During the year, we also recorded additions to other intangiblescancellation of $786 million including $183 million of Dako in-process research and development related to the same ten businesses. We recorded $8 million of foreign exchange translation impact to other intangibles in 2012.projects during 2016, 2015 and 2014, respectively.
Amortization of intangible assets was $199152 million in 20132016, $136156 million in 20122015, and $111 million in 2011. In addition, we recorded $1 million of impairments of other intangibles related to the cancellation of an in-process research and development project during 2013. Future amortization expense related to finite-lived existing purchased intangible assets is estimated to be $194189 million in 2014, .$181 million
Future amortization expense related to existing finite-lived purchased intangible assets for 2015, $154 million for 2016, $106 million for 2017, $70 million for 2018,the next five fiscal years and $176 million thereafter.thereafter is estimated below:
|
| | | |
| Estimated future amortization expense: | |
| (in millions) | |
| 2017 | $ | 112 |
|
| 2018 | $ | 82 |
|
| 2019 | $ | 58 |
|
| 2020 | $ | 47 |
|
| 2021 | $ | 35 |
|
| Thereafter | $ | 57 |
|
Equity Investments10. INVESTMENTS
The following table summarizes the company's equity investments as of October 31, 20132016 and 20122015 (net book value):
| | | | October 31, | October 31, |
| | 2013 | | 2012 | 2016 | | 2015 |
| | (in millions) | (in millions) |
| Short-Term | | | | |
| Cost method investments | $ | — |
| | 11 |
| |
| | | | | |
| Long-Term | | | | | | |
| Cost method investments | $ | 44 |
| | $ | 59 |
| $ | 104 |
| | $ | 23 |
|
| Trading securities | 51 |
| | 50 |
| 31 |
| | 35 |
|
| Available-for-sale investments | 25 |
| | — |
| |
| Equity method investments | 19 |
| | — |
| — |
| | 28 |
|
| Total | $ | 139 |
| | $ | 109 |
| $ | 135 |
| | $ | 86 |
|
Cost method investments consist of non-marketable equity securities and two fundsa fund and are accounted for at historical cost. Approximately $80 million relates to our variable interest entity investment, see Note 1, "Overview and Summary of Significant Accounting Policies". Trading securities are reported at fair value, with gains or losses resulting from changes in fair value recognized currently in earnings. Investments designated as available-for-sale were reported at fair value, with unrealized gains and losses, net of tax, included in stockholders' equity. Equity method investments are reported at the amount of the company’s initial investment and adjusted each period for the company’s share of the investee’s income or loss and dividend paid.
Investments in available-for-sale securities at estimated fair value were as follows as of October 31, 2013:
|
| | | | | | | | | | | | | | | | |
| | | October 31, 2013 |
| | | Cost | | Gross Unrealized Gains | | Gross Unrealized Losses | | Estimated Fair Value |
| | (in millions) |
| Equity securities | | 15 |
| | 10 |
| | — |
| | 25 |
|
| | | $ | 15 |
| | $ | 10 |
| | $ | — |
| | $ | 25 |
|
All of our investments, excluding trading securities, are subject to periodic impairment review. The impairment analysis requires significant judgment to identify events or circumstances that would likely have significant adverse effect on the future value of the investment. We consider various factors in determining whether an impairment is other-than-temporary, including the severity and duration of the impairment, forecasted recovery, the financial condition and near-term prospects of the investee, and our ability and intent to hold the investment for a period of time sufficient to allow for any anticipated recovery in market value. During the year ended October 31, 2016, we have identified certain events and circumstances that indicates the decline in value of an equity method investment is other-than-temporary. As a result, we have written down the investment to its fair value of zero, resulting in an impairment charge of approximately $18 million.
Amounts included in other income (expense), net for realized gains on the sale of available-for-sale securities and the appropriate share of loss on equity method investments and other than temporary impairments were as follows:
| | | | Years Ended October 31, | Years Ended October 31, |
| | 2013 | | 2012 | | 2011 | 2016 | | 2015 | | 2014 |
| | (in millions) | (in millions) |
| Available-for-sale investments — realized gain | $ | 1 |
| | $ | 2 |
| | $ | 6 |
| |
| Equity method investments - share of losses | (2 | ) | | $ | — |
| | $ | — |
| $ | (10 | ) | | $ | (9 | ) | | $ | (7 | ) |
| Equity method investments - other than temporary impairments | | (18 | ) | | — |
| | — |
|
| Total | | $ | (28 | ) | | $ | (9 | ) | | $ | (7 | ) |
Net unrealized gains and losses on our trading securities portfolio were $81 million of unrealized gains in 20132016, $52 million of unrealized gains in 20122015 and $12 million of unrealized gains in 20112014.
Realized gains from the sale of cost method securities were zero for 2013, $2 million for 2012 and zero for 2011. Proceeds from the sale of cost method investments were $11 million in 2013.
Investments in Leases
In February 2001, we sold a parcel of surplus land in San Jose, California for $287 million in cash. In August 2001, we acquired a long-term leasehold interest in several municipal properties in southern California. In 2002, we received $237 million in non-refundable prepaid rent related to the leasehold interests described above.
In December 2011, we terminated our leasehold interest in the municipal properties, received $80 million in cash and recognized a loss of approximately $2 million.
12.11. FAIR VALUE MEASUREMENTS
The authoritative guidance defines fair value as the price that would be received from selling an asset or paid to transfer a liability in an orderly transaction between market participants at the measurement date. When determining the fair value measurements for assets and liabilities required or permitted to be recorded at fair value, we consider the principal or most advantageous market and assumptions that market participants would use when pricing the asset or liability.
Fair Value Hierarchy
The guidance establishes a fair value hierarchy that prioritizes the use of inputs used in valuation techniques into three levels. A financial instrument's categorization within the fair value hierarchy is based upon the lowest level of input that is significant to the fair value measurement. There are three levels of inputs that may be used to measure fair value:
Level 1 — applies to assets or liabilities for which there are quoted prices in active markets for identical assets or liabilities.
Level 2 — applies to assets or liabilities for which there are inputs other than quoted prices included within level 1 that are observable, either directly or indirectly, for the asset or liability such as: quoted prices for similar assets or liabilities in active markets; quoted prices for identical or similar assets or liabilities in less active markets; or other inputs that can be derived principally from, or corroborated by, observable market data.
Level 3 — applies to assets or liabilities for which there are unobservable inputs to the valuation methodology that are significant to the measurement of the fair value of the assets or liabilities.
Financial Assets and Liabilities Measured at Fair Value on a Recurring Basis
Financial assets and liabilities measured at fair value on a recurring basis as of October 31, 20132016 were as follows:
| | | | | | Fair Value Measurement at
October 31, 2013 Using | | | Fair Value Measurement at
October 31, 2016 Using |
| | October 31,
2013 | | Quoted Prices in Active Markets for Identical Assets (Level 1) | | Significant Other Observable Inputs (Level 2) | | Significant Unobservable Inputs (Level 3) | October 31,
2016 | | Quoted Prices in Active Markets for Identical Assets (Level 1) | | Significant Other Observable Inputs (Level 2) | | Significant Unobservable Inputs (Level 3) |
| | (in millions) | (in millions) |
| Assets: | | | | | | | | | | | | | | |
| Short-term | | | | | | | | | | | | | | |
| Cash equivalents (money market funds) | $ | 1,968 |
| | $ | 1,968 |
| | $ | — |
| | $ | — |
| $ | 1,482 |
| | $ | 1,482 |
| | $ | — |
| | $ | — |
|
| Derivative instruments (foreign exchange contracts) | 7 |
| | — |
| | 7 |
| | — |
| 9 |
| | — |
| | 9 |
| | — |
|
| Long-term | | | | | | | | | | | | | | |
| Trading securities | 51 |
| | 51 |
| | — |
| | — |
| 31 |
| | 31 |
| | — |
| | — |
|
| Available-for-sale investments | 25 |
| | 25 |
| | — |
| | — |
| |
| Total assets measured at fair value | $ | 2,051 |
| | $ | 2,044 |
| | $ | 7 |
| | $ | — |
| $ | 1,522 |
| | $ | 1,513 |
| | $ | 9 |
| | $ | — |
|
| Liabilities: | | | | | | | | | | | | | | |
| Short-term | | | | | | | | | | | | | | |
| Derivative instruments (foreign exchange contracts) | $ | 6 |
| | $ | — |
| | $ | 6 |
| | $ | — |
| $ | 8 |
| | $ | — |
| | $ | 8 |
| | $ | — |
|
| Long-term | | | | | | | | | | | | | | |
| Deferred compensation liability | 51 |
| | — |
| | 51 |
| | — |
| 31 |
| | — |
| | 31 |
| | — |
|
| Total liabilities measured at fair value | $ | 57 |
| | $ | — |
| | $ | 57 |
| | $ | — |
| $ | 39 |
| | $ | — |
| | $ | 39 |
| | $ | — |
|
Financial assets and liabilities measured at fair value on a recurring basis as of October 31, 20122015 were as follows:
| | | | | | Fair Value Measurement at October 31, 2012 Using | | | Fair Value Measurement at
October 31, 2015 Using |
| | October 31,
2012 | | Quoted Prices in Active Markets for Identical Assets (Level 1) | | Significant Other Observable Inputs (Level 2) | | Significant Unobservable Inputs (Level 3) | October 31,
2015 | | Quoted Prices in Active Markets for Identical Assets (Level 1) | | Significant Other Observable Inputs (Level 2) | | Significant Unobservable Inputs (Level 3) |
| | (in millions) | (in millions) |
| Assets: | | | | | | | | | | | | | | |
| Short-term | | | | | | | | | | | | | | |
| Cash equivalents (money market funds) | $ | 1,834 |
| | $ | 1,834 |
| | $ | — |
| | $ | — |
| $ | 1,411 |
| | $ | 1,411 |
| | $ | — |
| | $ | — |
|
| Derivative instruments (foreign exchange and interest rate swap contracts) | 7 |
| | — |
| | 7 |
| | — |
| |
| Derivative instruments (foreign exchange contracts) | | 4 |
| | — |
| | 4 |
| | — |
|
| Long-term | | | | | | | | | | | | | | |
| Trading securities | 50 |
| | 50 |
| | — |
| | — |
| 35 |
| | 35 |
| | — |
| | — |
|
| Total assets measured at fair value | $ | 1,891 |
| | $ | 1,884 |
| | $ | 7 |
| | $ | — |
| $ | 1,450 |
| | $ | 1,446 |
| | $ | 4 |
| | $ | — |
|
| Liabilities: | | | | | | |
| | | | | | |
|
| Short-term | | | | | | | | | | | | | | |
| Derivative instruments (foreign exchange contracts) | $ | 6 |
| | $ | — |
| | $ | 6 |
| | $ | — |
| $ | 5 |
| | $ | — |
| | $ | 5 |
| | $ | — |
|
| Long-term | | | | | | | | | | | | | | |
| Deferred compensation liability | 48 |
| | — |
| | 48 |
| | — |
| 35 |
| | — |
| | 35 |
| | — |
|
| Total liabilities measured at fair value | $ | 54 |
| | $ | — |
| | $ | 54 |
| | $ | — |
| $ | 40 |
| | $ | — |
| | $ | 40 |
| | $ | — |
|
Our money market funds and trading securities and available-for-sale investments are generally valued using quoted market prices and therefore are classified within level 1 of the fair value hierarchy. Our derivative financial instruments are classified within level 2, as there is not an active market for each hedge contract, but the inputs used to calculate the value of the instruments are tied to active markets. Our deferred compensation liability is classified as level 2 because although the values are not directly based on quoted market prices, the inputs used in the calculations are observable.
Trading securities and deferred compensation liability are reported at fair value, with gains or losses resulting from changes in fair value recognized currently in net income. Investments designated as available-for-sale and certainCertain derivative instruments are reported at fair value, with unrealized gains and losses, net of tax, included in stockholders' equity. Realized gains and losses from the sale of these instruments are recorded in net income.
Assets and Liabilities Measured at Fair Value on a Non-Recurring Basis
Long-Lived Assets
For assets measured at fair value on a non-recurring basis, the following table summarizes the impairments included in net income for the years ended October 31, 20132016, 2015 and 2012:2014:
| | | | Years Ended October 31, | Years Ended October 31, |
| | 2013 | | 2012 | 2016 | | 2015 | | 2014 |
| | (in millions) | (in millions) |
| Long-lived assets held and used | $ | 2 |
| | $ | 1 |
| $ | 4 |
| | $ | 3 |
| | $ | 23 |
|
| Long-lived assets held for sale | $ | 1 |
| | $ | — |
| $ | — |
| | $ | — |
| | $ | — |
|
Long-lived assets held and used with a carrying amount of $24 million were written down to their fair value of zero, resulting in an impairment charge of $24 million, which was included in net income for 20132016. Long-lived assets held and used with a carrying amount of $13 million were written down to their fair value of zero, resulting in an impairment charge of $13 million, which was included in net income for 20122015.
Long-lived assets held for saleand used with a carrying amount of $3$23 million were written down to their fair value of $2 million,zero, resulting in an impairment charge of $1$23 million, which was included in net income for 2014.2013.
The impairment charge in 2016 and 2015 of $4 million and $3 million, respectively, relates to IPR&D projects that were abandoned and written down to their fair value of zero. The impairment charge in 2014 includes $19 million relating to the exit of a business and $4 million related to various IPR&D projects that were abandoned and written down to their fair value of zero.
There were no impairments of long-lived assets held for sale in 2016, 2015 and 2014.
Fair values for the impaired long-lived assets were measured using level 2 inputs.
13.12. DERIVATIVES
We are exposed to foreign currency exchange rate fluctuations and interest rate changes in the normal course of our business. As part of risk management strategy, we use derivative instruments, primarily forward contracts, purchased options, and interest rate swaps, to hedge economic and/or accounting exposures resulting from changes in foreign currency exchange rates and interest rates.
Fair Value Hedges
We are exposed to interest rate risk due to the mismatch between the interest expense we pay on our loans at fixed rates and the variable rates of interest we receive from cash, cash equivalents and other short-term investments. We have issued long-term debt in U.S. dollars at fixed interest rates based on the market conditions at the time of financing. The fair value of our fixed rate debt changes when the underlying market rates of interest change, and, in the past, we have used interest rate swaps to change our fixed interest rate payments to U.S. dollar LIBOR-based variable interest expense to match the floating interest income from our cash, cash equivalents and other short term investments. As of October 31, 20132016, all interest rate swap contracts had either been terminated or had expired.
On November 25, 2008,, we terminated two interest rate swap contracts associated with our 2017 senior notes that represented the notional amount of $400$400 million. On October 20, 2014 we prepaid $500 million out of $600 million principal of our 2017 senior notes and fully amortized the associated proportionate deferred gain to other income (expense). The asset value, including interest receivable, upon termination was approximately $43 million and the amountremaining gain to be amortized related to the $100 million of 2017 senior notes at October 31, 20132016 was $22$1 million. On June 6, 2011, we also terminated five interest rate swap contracts associated with our 2015 senior notes that represented the notional amount of $500 million. The asset value, including interest receivable, upon termination was approximately $31 million and the amount to be amortized at October 31, 2013 was $12 million. On August 9, 2011,, we terminated five interest rate swap contracts related to our 2020 senior notes that represented the notional amount of $500 million.$500 million. The asset value, including interest receivable, upon termination for these contracts was approximately $34 million and the amountgain to be amortized at October 31, 20132016 was $26$15 million. The proceedsAll deferred gains from all such terminated interest rate swaps are recorded as operating cash flows and the gain is being deferred and amortized over the remaining life of the respective senior notes.
Cash Flow Hedges
We enter into foreign exchange contracts to hedge our forecasted operational cash flow exposures resulting from changes in foreign currency exchange rates. These foreign exchange contracts, carried at fair value, have maturities between one and twelve months. These derivative instruments are designated and qualify as cash flow hedges under the criteria prescribed in the authoritative guidance. The changes in the fair value of the effective portion of the derivative instrument are recognized in accumulated other comprehensive income. Amounts associated with cash flow hedges are reclassified to cost of sales in the consolidated statement of operations when the forecasted transaction occurs. If it becomes probable that the forecasted transaction will not occur, the hedge relationship will be de-designated and amounts accumulated in other comprehensive income will be reclassified to other income (expense) in the current period. Changes in the fair value of the ineffective portion of derivative instruments are recognized in earningsother income (expense) in the consolidated statement of operations in the current period. We record the premium paid (time value) of an option on the date of purchase as an asset. For options designated as cash flow hedges, changes in the time value are excluded from the assessment of hedge effectiveness and are recognized in other income (expense) over the life of the option contract. Ineffectiveness in 2013, 20122016, 2015 and 20112014 was not significant. For the yearyears ended October 31, 2013, 20122016, 2015 and 20112014 gains and losses recognized in earnings due to de-designation of cash flow hedge contracts were not significant.
In July 2012, Agilent executed treasury lock agreements for $400 million in connection with future interest payments to be made on our 2022 senior notes issued on September 10, 2012. We designated the treasury lock as a cash flow hedge. The treasury lock contracts were terminated on September 10, 2012 and we recognized a deferred gain in accumulated other comprehensive income of $3 million to bewhich is being amortized to interest expense over the life of the 2022 senior notes. The remaining gain to be amortized related to the treasury lock agreements at October 31, 2016 was $2 million.
In February 2016, Agilent executed three forward-starting pay fixed/receive variable interest rate swaps for the notional amount of $300 million in connection with future interest payments to be made on our 2026 senior notes issued on September 15, 2016. These derivative instruments were designated and qualified as cash flow hedges under the criteria prescribed in the authoritative guidance. The swap arrangements were terminated on September 15, 2016 with a payment of $10 million and we recognized this as a deferred loss in accumulated other comprehensive income which is being amortized to interest expense over the life of the 2026 senior notes. The remaining loss to be amortized related to the interest rate swap agreements at October 31, 2016 was $9 million.
Other Hedges
Additionally, we enter into foreign exchange contracts to hedge monetary assets and liabilities that are denominated in currencies other than the functional currency of our subsidiaries. These foreign exchange contracts are carried at fair value and do not qualify for hedge accounting treatment and are not designated as hedging instruments. Changes in value of the derivative are recognized in other income (expense) in the consolidated statement of operations, in the current period, along with the offsetting foreign currency gain or loss on the underlying assets or liabilities.
In connection with the acquisition of Dako, Agilent entered into several foreign currency forward contracts to mitigate the currency exchange risk associated with the payment of the purchase price in Danish Krone and the repayment of debt in multiple currencies. The aggregate notional amount of the currencies hedged was $1.7 billion. These foreign exchange contracts did not qualify for hedge accounting treatment and were not designated as hedging instruments. The resulting loss on settlement, on the date of acquisition, was $14 million and was recorded in other income (expense) in the consolidated statement of operations for the year ended October 31, 2012.
Our use of derivative instruments exposes us to credit risk to the extent that the counterparties may be unable to meet the terms of the agreement. We do, however, seek to mitigate such risks by limiting our counterparties to major financial institutions which are selected based on their credit ratings and other factors. We have established policies and procedures for mitigating credit risk that include establishing counterparty credit limits, monitoring credit exposures, and continually assessing the creditworthiness of counterparties.
A number of our derivative agreements contain threshold limits to the net liability position with counterparties and are dependent on our corporate credit rating determined by the major credit rating agencies. The counterparties to the derivative instruments may request collateralization, in accordance with derivative agreements, on derivative instruments in net liability positions.
The aggregate fair value of all derivative instruments with credit-risk-related contingent features that were in a net liability position as of October 31, 20132016, was $3$4 million. The credit-risk-related contingent features underlying these agreements had not been triggered as of October 31, 20132016.
There were 151 foreign exchange forward contracts and 19 foreign exchange option contracts open as of October 31, 2013 and designated as cash flow hedges. There were 17046 foreign exchange forward contracts open as of October 31, 20132016 and designated as cash flow hedges. There were 165 foreign exchange forward contracts open as of October 31, 2016 not designated as hedging instruments. The aggregated U.S. Dollar notional amounts by currency and designation as of October 31, 20132016 were as follows:
| | | | | Derivatives in Cash Flow Hedging Relationships | | Derivatives Not Designated as Hedging Instruments | | Derivatives Designated as
Cash Flow Hedges
| | Derivatives Not Designated as Hedging Instruments |
| | | Forward Contracts | | Option Contracts | | Forward Contracts | | Forward
Contracts USD | | Forward
Contracts USD | | Forward Contracts DKK |
| Currency | | Buy/(Sell) | | Buy/(Sell) | | Buy/(Sell) | | Buy/(Sell) | | Buy/(Sell) | | Buy/(Sell) |
| | | (in millions) | | (in millions) |
| Euro | | $ | (23 | ) | | $ | — |
| | $ | 243 |
| | $ | (32 | ) | | $ | 106 |
| | $ | (57 | ) |
| British Pound | | (17 | ) | | — |
| | 2 |
| | (22 | ) | | (2 | ) | | (3 | ) |
| Canadian Dollar | | (37 | ) | | — |
| | — |
| | (17 | ) | | — |
| | (4 | ) |
| Australian Dollars | | 11 |
| | — |
| | 9 |
| | 3 |
| | 12 |
| | (4 | ) |
| Malaysian Ringgit | | 113 |
| | — |
| | 14 |
| | — |
| | (3 | ) | | — |
|
| Japanese Yen | | (56 | ) | | (97 | ) | | 3 |
| | (46 | ) | | 15 |
| | (4 | ) |
| American Dollar | | | — |
| | — |
| | (49 | ) |
| Other | | (9 | ) | | — |
| | (10 | ) | | (5 | ) | | (6 | ) | | (14 | ) |
| | | $ | (18 | ) | | $ | (97 | ) | | $ | 261 |
| | $ | (119 | ) | | $ | 122 |
| | $ | (135 | ) |
The notional amounts within derivatives not designated as hedging instruments include forward cross currency contracts
Derivative instruments are subject to master netting arrangements and are disclosed gross in the balance sheet.sheet in accordance with the authoritative guidance. The gross fair values and balance sheet location of derivative instruments held in the consolidated balance sheet as of October 31, 20132016 and 20122015 were as follows:
| | Fair Values of Derivative Instruments | | Asset Derivatives | Asset Derivatives | | Liability Derivatives | Asset Derivatives | | Liability Derivatives |
| | | Fair Value | | | | Fair Value | | Fair Value | | | | Fair Value |
| Balance Sheet Location | | October 31,
2013 | | October 31,
2012 | | Balance Sheet Location | | October 31,
2013 | | October 31,
2012 | | October 31,
2016 | | October 31,
2015 | | Balance Sheet Location | | October 31,
2016 | | October 31,
2015 |
(in millions) | | Derivatives designated as hedging instruments: | | | | | | | | | | | | | | | | | | | | |
| Fair value hedges | | | | | | | | | | | |
| Interest rate contracts | | | | | | | | | | | |
| Other current assets | | $ | — |
| | $ | — |
| | Other accrued liabilities | | $ | — |
| | $ | — |
| |
| Other assets | | $ | — |
| | $ | — |
| | Other long-term liabilities | | $ | — |
| | $ | — |
| |
| Cash flow hedges | | | | | | | | | | | | | | | | | | | | |
| Foreign exchange contracts | | | | | | | | | | | | | | | | | | | | |
| Other current assets | | $ | 4 |
| | $ | 4 |
| | Other accrued liabilities | | $ | 4 |
| | $ | 2 |
| | $ | 5 |
| | $ | 2 |
| | Other accrued liabilities | | $ | 3 |
| | $ | 1 |
|
| | | $ | 4 |
| | $ | 4 |
| | | | $ | 4 |
| | $ | 2 |
| | $ | 5 |
| | $ | 2 |
| | | | $ | 3 |
| | $ | 1 |
|
| Derivatives not designated as hedging instruments: | | | | | | | | | | | | | | | | | | | | |
| Foreign exchange contracts | | | | | | | | | | | | | | | | | | | | |
| Other current assets | | $ | 3 |
| | $ | 3 |
| | Other accrued liabilities | | $ | 2 |
| | $ | 4 |
| | $ | 4 |
| | $ | 2 |
| | Other accrued liabilities | | $ | 5 |
| | $ | 4 |
|
| Total derivatives | | $ | 7 |
| | $ | 7 |
| | | | $ | 6 |
| | $ | 6 |
| | $ | 9 |
| | $ | 4 |
| | | | $ | 8 |
| | $ | 5 |
|
The effect of derivative instruments for interest rate swap contracts and for foreign exchange contracts designated as hedging instruments and not designated as hedging instruments in our consolidated statement of operations were as follows:
|
| | | | | | | | | | | |
| | 2013 | | 2012 | | 2011 |
| | (in millions) |
| Derivatives designated as hedging instruments: | | | | | |
| Fair Value Hedges | | | | | |
| Gain on interest rate swap contracts, including interest accrual, recognized in interest expense | $ | — |
| | $ | — |
| | $ | 27 |
|
| Gain (loss) on hedged item, recognized in interest expense | $ | — |
| | $ | 3 |
| | $ | (3 | ) |
| Cash Flow Hedges | | | | | |
| Gain recognized in accumulated other comprehensive income | $ | 10 |
| | $ | 7 |
| | $ | — |
|
| Gain (loss) reclassified from accumulated other comprehensive income into cost of sales | $ | 13 |
| | $ | 8 |
| | $ | (5 | ) |
| Treasury Lock Agreements | | | | | |
| Gain recognized in accumulated other comprehensive income | $ | — |
| | $ | 3 |
| | $ | — |
|
| Derivatives not designated as hedging instruments: | | | | | |
| Gain (loss) recognized in other income (expense), net | $ | 7 |
| | $ | (34 | ) | | $ | 13 |
|
|
| | | | | | | | | | | |
| | 2016 | | 2015 | | 2014 |
| | (in millions) |
| Derivatives designated as hedging instruments: | | | | | |
| Cash Flow Hedges | | | | | |
| Loss on interest rate swaps recognized in other comprehensive income (loss) | $ | (9 | ) | | $ | — |
| | $ | — |
|
| Gain (loss) recognized in accumulated other comprehensive income (loss) | $ | (1 | ) | | $ | 11 |
| | $ | 13 |
|
| Gain (loss) reclassified from accumulated other comprehensive income (loss) into cost of sales | $ | (3 | ) | | $ | 18 |
| | $ | (1 | ) |
| Derivatives not designated as hedging instruments: | | | | | |
| Gain (loss) recognized in other income (expense), net within continuing operations | $ | 1 |
| | $ | (21 | ) | | $ | (20 | ) |
The estimated net amount of existing lossgain at October 31, 20132016 that is expected to be reclassified from other comprehensive income to the cost of sales within the next twelve months is $14 million.
14. RESTRUCTURING
In the second quarter of 2013, in response to slow revenue growth due to macroeconomic conditions, we accrued for a targeted restructuring program that is expected to reduce Agilent's total headcount by approximately 450 regular employees, representing approximately 2 percent of our global workforce. The timing and scope of workforce reductions will vary based on local legal requirements. When completed, the restructuring program is expected to result in a reduction in annual cost of sales and operating expenses.
As previously announced, we are streamlining our manufacturing operations. As part of this action, we anticipate the reduction of approximately 250 positions to reduce our annual cost of sales.
Total headcount reductions from targeted restructuring and manufacturing streamlining will be approximately 700 positions. Within the U.S, we have substantially completed these restructuring activities. Internationally, we expect to complete the majority of these restructuring activities by the end of the second half of fiscal 2014. As of October 31, 2013, approximately 250 employees were terminated under the targeted restructuring program and 100 employees were terminated under the streamlining of manufacturing.
A summary of total restructuring accrual activity is shown in the table below:
|
| | | | |
| | Workforce Reduction | |
| | (in millions) |
| Balance as of October 31, 2012 | $ | — |
| |
| Income statement expense | 53 |
| |
| Cash payments | (29 | ) | |
| Balance as of October 31, 2013 | $ | 24 |
| |
The restructuring accruals, which totaled $24 million at October 31, 2013, are recorded in other accrued liabilities on the consolidated balance sheet. These balances reflect estimated future cash outlays.
A summary of the charges in the consolidated statement of operations resulting from all restructuring plans is shown below:
|
| | | |
| | Year Ended |
| | October 31, |
| | 2013 |
| | (in millions) |
| Cost of products and services | $ | 19 |
|
| Research and development | 9 |
|
| Selling, general and administrative | 25 |
|
| Total restructuring, asset impairments and other special charges | $ | 53 |
|
15.13. RETIREMENT PLANS AND POST RETIREMENT PENSION PLANS
General. Substantially all of our employees are covered under various defined benefit and/or defined contribution retirement plans. Additionally, we sponsor post-retirement health care benefits for our eligible U.S. employees.
Agilent provides U.S. employees, who meet eligibility criteria under the Agilent Technologies, Inc. Retirement Plan ("RP"(the "RP"), defined benefits which are based on an employee's base or target pay during the years of employment and on length of service. For eligible service through October 31, 1993, the benefit payable under the Agilent Retirement PlanPlans is reduced by any amounts due to the eligible employee under ourthe Agilent defined contribution Deferred Profit-Sharing Plan ("DPSP"(the "DPSP"), which was closed to new participants as of November 1993. Effective November 1, 2014, Agilent’s U.S. defined benefit retirement plan is closed to new entrants including new employees, new transfers to the U.S. payroll and rehires. As of April 30, 2016, benefits under the RP were frozen. See Plan Amendments below.
As of October 31, 2016 and 2015, the fair value of plan assets of the DPSP was $157 million and $169 million, respectively. Note that the projected benefit obligation for the DPSP equals the fair value of plan assets.
In addition to the DPSP, in the U.S., Agilent maintains thea Supplemental Benefits Retirement Plan ("SBRP"), a supplemental unfunded non-qualified defined benefit plan to provide benefits that would be provided under the RP but for limitations imposed by the Internal Revenue Code. The RP and the SBRP comprise the "U.S. Plans".
As of October 31, 2013 and 2012, in the fair value of plan assets of the DPSP for U.S. Agilent Employees was $552 million and $534 million, respectively. Note that the projected benefit obligation for the DPSP equals the fair value of plan assets.tables below.
Eligible employees outside the U.S. generally receive retirement benefits under various retirement plans based upon factors such as years of service and/or employee compensation levels. Eligibility is generally determined in accordance with local statutory requirements.
401(k) defined contribution plan. Eligible Agilent U.S. employees may participate in the Agilent Technologies, Inc. 401(k) Plan (the "401(k) Plan"). Enrollment inPlan. During the 401(k) Plan is automatic forsix months ended April 30, 2016, we provided matching contributions to employees who meet eligibility requirements unless they decline participation. Under the 401(k) Plan,up to a maximum of 6 percent of an employee's annual eligible compensation. Effective May 1, 2016, we provide matching contributions to employees up to a maximum of 46 percent of an employee's annual eligible compensation.compensation and an additional transitional company contribution for certain eligible employees equal to 3 percent, 4 percent or 5 percent of an employee's annual eligible compensation due to the RP benefits being frozen. The maximum contribution to the 401(k) Plan is 50 percent of an employee's annual eligible compensation, subject to regulatory limitations. The 401(k) Plan employer expense included in income from operations was $25 million in 2013, $25 million in 2012 and $24 million in 2011.
Post-retirement medical benefit plans. In addition to receiving retirement benefits, Agilent U.S. employees who meet eligibility requirements as of their termination date may participate in the Agilent Technologies, Inc. Health Plan for Retirees. Eligible retirees who were less than age 50 as of January 1, 2005 and who retire after age 55 with 15 or more years of service are eligible for a fixed amount which can be utilized to pay for either Agilent sponsored plans and/or individual medicare plans. Eligible retirees who were at least age 50 as of January 1, 2005 and who retire after age 55 with 15 or more years of service currently choose from managed-care, indemnity options or individual medicare plans, with the company subsidization level or stipend dependent on a number of factors including eligibility and length of service. See Plan Amendments below for changes to these benefits.
Plan Amendments. On April 1, 2011, changes to the Agilent Technologies, Inc. Health Plan for Retirees were approved. Effective January 1, 2012, employees who were at least age 50 as of January 1, 2005 and who retire after age 55 with 15 or more years of service are eligible for fixed dollar subsidies and stipends. Grandfathered retirees receive a fixed monthly subsidy toward pre-65 premium costs (subsidy capped at 2011 levels) and a fixed monthly stipend post-65. The subsidy amounts will not increase. In connection with these changes, we reduced our Accumulated Prospective Benefit Obligation by $194 million withaddition, any new employee hired on or after November 1, 2014, will not be eligible to participate in the offset goingretiree medical plans upon retiring. Current eligible employees will continue to accumulated other comprehensive income.participate in the retiree medical program in place as of November 1, 2014. Retirees will maintain the retiree medical benefits they are eligible for as of November 1, 2014. As of April 30, 2016, benefits under this plan were changed - see Plan Amendments below.
Plan Amendments. In 2016, we made changes to our U.S. Retirement Plan and Supplemental Benefits Retirement Plan ("U.S. Plans"). Effective April 30, 2016, benefit accruals under the U.S. Plans were frozen. Any pension benefit earned in the U.S. Plans through April 30, 2016 remained fully vested, and there were no additional benefit accruals after April 30, 2016. In addition, active employees who have not met the eligibility requirement for the Retiree Medical Account (RMA) under the U.S. Post Retirement Benefit Plan - 55 years old with at least 15 years of Agilent service - as of April 30, 2016 - will only be eligible for 50 percent of the current RMA reimbursement amount upon retirement.
89Due to these plan amendments, we recorded a curtailment gain of $15 million in the U.S. Plans during the year ended October 31, 2016. In addition, we recognized a settlement gain of $1 million related to the U.S. Supplemental Benefits Retirement Plan during the year ended October 31, 2016.
Components of net periodic cost. The company uses alternate methods of amortization as allowed by the authoritative guidance which amortizes the actuarial gains and losses on a consistent basis for the years presented. For U.S. Plans, gains and losses are amortized over the average future working lifetime.lifetime of participants using the corridor method. For most Non-U.S. Plans and U.S. Post-Retirement Benefit Plans, gains and losses are amortized using a separate layer for each year's gains and losses. For the years ended October 31, 2013, 20122016, 2015 and 2011,2014, components of net periodic benefit cost and other amounts recognized in other comprehensive income were comprised of:
| | | | | | | | | | | | | | | | | | | | | Pensions | | U.S. Post-Retirement Benefit Plans |
| | Pensions | | U.S. Post-Retirement Benefit Plans | U.S. Plans | | Non-U.S. Plans | |
| | U.S. Plans | | Non-U.S. Plans | | | | | | | | | | | | | | | | | | |
| | 2013 | | 2012 | | 2011 | | 2013 | | 2012 | | 2011 | | 2013 | | 2012 | | 2011 | 2016 | | 2015 | | 2014 | | 2016 | | 2015 | | 2014 | | 2016 | | 2015 | | 2014 |
| | (in millions) | (in millions) |
| Net periodic benefit cost (benefit) | | | | | | | | | | | | | | | | | | | | | | | | | | | | | | | | | | |
| Service cost — benefits earned during the period | $ | 44 |
| | $ | 40 |
| | $ | 42 |
| | $ | 36 |
| | $ | 33 |
| | $ | 32 |
| | $ | 4 |
| | $ | 3 |
| | $ | 3 |
| $ | 12 |
| | $ | 25 |
| | $ | 46 |
| | $ | 19 |
| | $ | 18 |
| | $ | 36 |
| | $ | 1 |
| | $ | 2 |
| | $ | 3 |
|
| Interest cost on benefit obligation | 24 |
| | 27 |
| | 28 |
| | 68 |
| | 74 |
| | 72 |
| | 12 |
| | 15 |
| | 21 |
| 16 |
| | 14 |
| | 34 |
| | 16 |
| | 23 |
| | 74 |
| | 4 |
| | 4 |
| | 12 |
|
| Expected return on plan assets | (51 | ) | | (46 | ) | | (44 | ) | | (97 | ) | | (92 | ) | | (94 | ) | | (20 | ) | | (19 | ) | | (21 | ) | (25 | ) | | (27 | ) | | (64 | ) | | (44 | ) | | (42 | ) | | (118 | ) | | (7 | ) | | (8 | ) | | (22 | ) |
| Amortization of net actuarial loss | 13 |
| | 7 |
| | 4 |
| | 55 |
| | 42 |
| | 40 |
| | 18 |
| | 16 |
| | 14 |
| 3 |
| | 3 |
| | 1 |
| | 27 |
| | 25 |
| | 48 |
| | 10 |
| | 6 |
| | 14 |
|
| Amortization of prior service benefit | (12 | ) | | (12 | ) | | (12 | ) | | (1 | ) | | (1 | ) | | (1 | ) | | (35 | ) | | (35 | ) | | (26 | ) | (3 | ) | | (5 | ) | | (12 | ) | | — |
| | — |
| | (1 | ) | | (10 | ) | | (12 | ) | | (35 | ) |
| Net periodic benefit cost (benefit) | 18 |
| | 16 |
| | 18 |
| | 61 |
| | 56 |
| | 49 |
| | (21 | ) | | (20 | ) | | (9 | ) | |
| Total periodic benefit cost (benefit) | | $ | 3 |
| | $ | 10 |
| | $ | 5 |
| | $ | 18 |
| | $ | 24 |
| | $ | 39 |
| | $ | (2 | ) | | $ | (8 | ) | | $ | (28 | ) |
| | | | | | | | | | | | | | | | | | | |
| Summary of total periodic benefit cost (benefit): | | | | | | | | | | | | | | | | | | |
| Continuing operations | | $ | 3 |
| | $ | 10 |
| | $ | 2 |
| | $ | 18 |
| | $ | 24 |
| | $ | 27 |
| | $ | (2 | ) | | $ | (8 | ) | | $ | (14 | ) |
| Discontinued operations | | — |
| | — |
| | 3 |
| | — |
| | — |
| | 12 |
| | — |
| | — |
| | (14 | ) |
| Total periodic benefit cost (benefit) | | $ | 3 |
| | $ | 10 |
| | $ | 5 |
| | $ | 18 |
| | $ | 24 |
| | $ | 39 |
| | $ | (2 | ) | | $ | (8 | ) | | $ | (28 | ) |
| Curtailments and settlements | — |
| | — |
| | (1 | ) | | — |
| | — |
| | — |
| | — |
| | — |
| | — |
| $ | (16 | ) | | $ | — |
| | $ | — |
| | $ | — |
| | $ | — |
| | $ | — |
| | $ | — |
| | $ | — |
| | $ | — |
|
| Total periodic benefit cost (benefit) | $ | 18 |
| | $ | 16 |
| | $ | 17 |
| | $ | 61 |
| | $ | 56 |
| | $ | 49 |
| | $ | (21 | ) | | $ | (20 | ) | | $ | (9 | ) | |
| Other changes in plan assets and benefit obligations recognized in other comprehensive (income) loss | | | | | | | | | | | | | | | | | | | | | | | | | | | | | | | | | | |
| Net actuarial (gain) loss | $ | (122 | ) | | $ | 69 |
| | $ | 31 |
| | $ | (85 | ) | | $ | 214 |
| | $ | 40 |
| | $ | (57 | ) | | $ | 22 |
| | $ | 12 |
| $ | 22 |
| | $ | 44 |
| | $ | 86 |
| | $ | 149 |
| | $ | 32 |
| | $ | 173 |
| | $ | 3 |
| | $ | 16 |
| | $ | 12 |
|
| Amortization of net actuarial loss | (13 | ) | | (7 | ) | | (4 | ) | | (55 | ) | | (42 | ) | | (40 | ) | | (18 | ) | | (16 | ) | | (14 | ) | (3 | ) | | (3 | ) | | (1 | ) | | (27 | ) | | (25 | ) | | (48 | ) | | (10 | ) | | (6 | ) | | (14 | ) |
| Prior service cost (benefit) | — |
| | — |
| | — |
| | — |
| | — |
| | 6 |
| | — |
| | — |
| | (194 | ) | 15 |
| | — |
| | — |
| | — |
| | — |
| | (2 | ) | | (7 | ) | | — |
| | — |
|
| Amortization of prior service benefit | 12 |
| | 12 |
| | 12 |
| | 1 |
| | 1 |
| | 1 |
| | 35 |
| | 35 |
| | 26 |
| 3 |
| | 5 |
| | 12 |
| | — |
| | — |
| | 1 |
| | 10 |
| | 12 |
| | 35 |
|
| Foreign currency | — |
| | — |
| | — |
| | 2 |
| | (5 | ) | | 11 |
| | — |
| | — |
| | — |
| — |
| | — |
| | — |
| | (3 | ) | | 10 |
| | (28 | ) | | — |
| | — |
| | — |
|
| Total recognized in other comprehensive (income) loss | $ | (123 | ) | | $ | 74 |
| | $ | 39 |
| | $ | (137 | ) | | $ | 168 |
| | $ | 18 |
| | $ | (40 | ) | | $ | 41 |
| | $ | (170 | ) | $ | 37 |
| | $ | 46 |
| | $ | 97 |
| | $ | 119 |
| | $ | 17 |
| | $ | 96 |
| | $ | (4 | ) | | $ | 22 |
| | $ | 33 |
|
| Total recognized in net periodic benefit cost (benefit) and other comprehensive (income) loss | $ | (105 | ) | | $ | 90 |
| | $ | 56 |
| | $ | (76 | ) | | $ | 224 |
| | $ | 67 |
| | $ | (61 | ) | | $ | 21 |
| | $ | (179 | ) | $ | 24 |
| | $ | 56 |
| | $ | 102 |
| | $ | 137 |
| | $ | 41 |
| | $ | 135 |
| | $ | (6 | ) | | $ | 14 |
| | $ | 5 |
|
In 2011, due to payments exceeding the sum of service cost plus interest cost in the U.S. Supplemental Benefits Retirement Plan, we recorded a $1 million settlement gain in the income statement as required by authoritative guidance.
Funded status. As of October 31, 20132016 and 2012,2015, the funded status of the defined benefit and post-retirement benefit plans was:
| | | | U.S. Defined Benefit Plans | | Non-U.S. Defined Benefit Plans | | U.S. Post-Retirement Benefit Plans | U.S. Defined Benefit Plans | | Non-U.S. Defined Benefit Plans | | U.S. Post-Retirement Benefit Plans |
| | 2013 | | 2012 | | 2013 | | 2012 | | 2013 | | 2012 | 2016 | | 2015 | | 2016 | | 2015 | | 2016 | | 2015 |
| | (in millions) | (in millions) |
| Change in fair value of plan assets: | | | | | | | | | | | | | | | | | | | | | | |
| Fair value — beginning of year | $ | 654 |
| | $ | 578 |
| | $ | 1,801 |
| | $ | 1,684 |
| | $ | 261 |
| | $ | 258 |
| $ | 347 |
| | $ | 837 |
| | $ | 778 |
| | $ | 2,108 |
| | $ | 91 |
| | $ | 284 |
|
| Actual return on plan assets | 132 |
| | 65 |
| | 267 |
| | 158 |
| | 47 |
| | 25 |
| 13 |
| | 6 |
| | 25 |
| | 53 |
| | 3 |
| | 2 |
|
| Employer contributions | 30 |
| | 30 |
| | 89 |
| | 54 |
| | 1 |
| | — |
| — |
| | 15 |
| | 24 |
| | 25 |
| | — |
| | — |
|
| Participants' contributions | — |
| | — |
| | 1 |
| | — |
| | — |
| | — |
| — |
| | — |
| | 1 |
| | 1 |
| | — |
| | — |
|
| Benefits paid | (34 | ) | | (19 | ) | | (49 | ) | | (46 | ) | | (21 | ) | | (22 | ) | (19 | ) | | (21 | ) | | (27 | ) | | (20 | ) | | (6 | ) | | (8 | ) |
| Transfer due to Keysight separation | | — |
| | (490 | ) | | — |
| | (1,327 | ) | | — |
| | (187 | ) |
| Currency impact | — |
| | — |
| | (64 | ) | | (49 | ) | | — |
| | — |
| — |
| | — |
| | (27 | ) | | (62 | ) | | — |
| | — |
|
| Fair value — end of year | $ | 782 |
| | $ | 654 |
| | $ | 2,045 |
| | $ | 1,801 |
| | $ | 288 |
| | $ | 261 |
| $ | 341 |
| | $ | 347 |
| | $ | 774 |
| | $ | 778 |
| | $ | 88 |
| | $ | 91 |
|
| Change in benefit obligation: | | | | | | | | | | | | | | | | | | | | | | |
| Benefit obligation — beginning of year | $ | 771 |
| | $ | 637 |
| | $ | 2,117 |
| | $ | 1,830 |
| | $ | 343 |
| | $ | 319 |
| $ | 415 |
| | $ | 889 |
| | $ | 900 |
| | $ | 2,344 |
| | $ | 112 |
| | $ | 309 |
|
| Service cost | 44 |
| | 40 |
| | 36 |
| | 33 |
| | 4 |
| | 3 |
| 12 |
| | 25 |
| | 19 |
| | 18 |
| | 1 |
| | 2 |
|
| Interest cost | 24 |
| | 27 |
| | 68 |
| | 74 |
| | 12 |
| | 15 |
| 16 |
| | 14 |
| | 16 |
| | 23 |
| | 4 |
| | 4 |
|
| Participants' contributions | — |
| | — |
| | 1 |
| | — |
| | — |
| | — |
| — |
| | — |
| | 1 |
| | 1 |
| | — |
| | — |
|
| Plan amendment | — |
| | — |
| | — |
| | — |
| | — |
| | — |
| — |
| | — |
| | — |
| | — |
| | (7 | ) | | — |
|
| Actuarial (gain) loss | (41 | ) | | 87 |
| | 85 |
| | 280 |
| | (31 | ) | | 28 |
| 41 |
| | 23 |
| | 130 |
| | 40 |
| | (1 | ) | | 11 |
|
| Benefits paid | (35 | ) | | (20 | ) | | (49 | ) | | (46 | ) | | (21 | ) | | (22 | ) | (20 | ) | | (22 | ) | | (27 | ) | | (20 | ) | | (6 | ) | | (8 | ) |
| Curtailments | — |
| | — |
| | — |
| | — |
| | — |
| | — |
| (30 | ) | | — |
| | — |
| | — |
| | — |
| | — |
|
| Transfer due to Keysight separation | | — |
| | (514 | ) | | — |
| | (1,429 | ) | | — |
| | (206 | ) |
| Currency impact | — |
| | — |
| | (59 | ) | | (54 | ) | | — |
| | — |
| — |
| | — |
| | (37 | ) | | (77 | ) | | — |
| | — |
|
| Benefit obligation — end of year | $ | 763 |
| | $ | 771 |
| | $ | 2,199 |
| | $ | 2,117 |
| | $ | 307 |
| | $ | 343 |
| $ | 434 |
| | $ | 415 |
| | $ | 1,002 |
| | $ | 900 |
| | $ | 103 |
| | $ | 112 |
|
| Overfunded (underfunded) status of PBO | $ | 19 |
| | $ | (117 | ) | | $ | (154 | ) | | $ | (316 | ) | | $ | (19 | ) | | $ | (82 | ) | $ | (93 | ) | | $ | (68 | ) | | $ | (228 | ) | | $ | (122 | ) | | $ | (15 | ) | | $ | (21 | ) |
| Amounts recognized in the consolidated balance sheet consist of: | | | | | | | | | | | | | | | | | | | | | | |
| Other assets | $ | 34 |
| | $ | — |
| | $ | 60 |
| | $ | — |
| | $ | — |
| | $ | — |
| $ | — |
| | $ | — |
| | $ | 1 |
| | $ | 26 |
| | $ | — |
| | $ | — |
|
| Employee compensation and benefits | (2 | ) | | (2 | ) | | — |
| | — |
| | — |
| | — |
| (1 | ) | | (2 | ) | | — |
| | — |
| | — |
| | — |
|
| Retirement and post-retirement benefits | (13 | ) | | (115 | ) | | (214 | ) | | (316 | ) | | (19 | ) | | (82 | ) | (92 | ) | | (66 | ) | | (229 | ) | | (148 | ) | | (15 | ) | | (21 | ) |
| Net asset (liability) | $ | 19 |
| | $ | (117 | ) | | $ | (154 | ) | | $ | (316 | ) | | $ | (19 | ) | | $ | (82 | ) | |
| Total net asset (liability) | | $ | (93 | ) | | $ | (68 | ) | | $ | (228 | ) | | $ | (122 | ) | | $ | (15 | ) | | $ | (21 | ) |
| Amounts Recognized in Accumulated Other Comprehensive Income (loss): | | | | | | | | | | | | | | | | | | | | | | |
| Actuarial (gains) losses | $ | (8 | ) | | $ | 127 |
| | $ | 525 |
| | $ | 683 |
| | $ | 119 |
| | $ | 194 |
| $ | 93 |
| | $ | 73 |
| | $ | 375 |
| | $ | 256 |
| | $ | 41 |
| | $ | 49 |
|
| Prior service costs (benefits) | (67 | ) | | (79 | ) | | (4 | ) | | (8 | ) | | (183 | ) | | (218 | ) | — |
| | (18 | ) | | — |
| | — |
| | (37 | ) | | (40 | ) |
| Total | $ | (75 | ) | | $ | 48 |
| | $ | 521 |
| | $ | 675 |
| | $ | (64 | ) | | $ | (24 | ) | $ | 93 |
| | $ | 55 |
| | $ | 375 |
| | $ | 256 |
| | $ | 4 |
| | $ | 9 |
|
In Japan, Agilent has employees' pension fund plans, which are defined benefit pension plans established under the Japanese Welfare Pension Insurance Law (JWPIL). The plans are composed of (a) a substitutional portion based on the pay-related part of the old-age pension benefits prescribed by JWPIL (similar to social security benefits in the United States) and (b) a corporate portion based on a contributory defined benefit pension arrangement established at the discretion of the company. As required by law, Agilent will disburse the substitutional portion of Agilent’s plans to the government. In December 2016, Agilent has received approval from the Japanese government to disburse the substitutional portion of Agilent’s plans, equal to $27 million. We anticipate that Agilent will recognize a settlement gain in the first quarter of 2017 on the payment of the substitutional portion.
In connection with the separation of Keysight Technologies on November 1, 2014, Agilent transferred certain liabilities and assets of the U.S. and Non-U.S. defined benefit pension plans, and U.S. Post-Retirement Benefit Plans to similar plans created for Keysight Technologies employees. Total transfers are as follows:
|
| | | | | | | | | | | |
| | U.S. Defined Benefit Plans | | Non-U.S. Defined Benefit Plans | | U.S. Post-Retirement Benefit Plans |
| | (in millions) |
| Fair value of plan assets transferred to Keysight | $ | 490 |
| | $ | 1,327 |
| | $ | 187 |
|
| Benefit obligation transferred to Keysight | $ | 514 |
| | $ | 1,429 |
| | $ | 206 |
|
The amounts in accumulated other comprehensive income expected to be recognized by Agilent as components of net expense during 20142017 are as follows:
| | | | U.S. Defined Benefit Plans | | Non-U.S. Defined Benefit Plans | | U.S. Post-Retirement Benefit Plans | U.S. Defined Benefit Plans | | Non-U.S. Defined Benefit Plans | | U.S. Post-Retirement Benefit Plans |
| | (in millions) | (in millions) |
| Amortization of net prior service cost (benefit) | $ | (12 | ) | | $ | (1 | ) | | $ | (35 | ) | $ | — |
| | $ | — |
| | $ | (9 | ) |
| Amortization of actuarial net loss (gain) | $ | (1 | ) | | $ | 45 |
| | $ | 14 |
| $ | 3 |
| | $ | 35 |
| | $ | 11 |
|
Investment policies and strategies as of October 31, 2013, 20122016 and 2011.2015. In the U.S., target asset allocations for our Agilent Retirement Planretirement and post-retirement benefit target asset allocationsplans are approximately 80 percent to equities and approximately 20 percent to fixed income investments. Our DPSP target asset allocation is approximately 60 percent to equities and approximately 40 percent to fixed income investments. Approximately, 5 percent of our U.S. equity portfolio consists of limited partnerships. The general investment objective for all our plan assets is to obtain the optimum rate of investment return on the total investment portfolio consistent with the assumption of a reasonable level of risk. Specific investment objectives for the plans' portfolios are to: maintain and enhance the purchasing power of the plans' assets; achieve investment returns consistent with the level of risk being taken;
and earn performance rates of return in accordance with the benchmarks adopted for each asset class. Outside the U.S., our target asset allocation is from 37 to 60 percent to equities, from 40 to 60 percent to fixed income investments, and from zero to 6 percent to real estate investments and from zero to 7 percent to cash, depending on the plan. All plans' assets are broadly diversified. Due to fluctuations in equity markets, our actual allocations of plan assets at October 31, 20132016 and 20122015 differ from the target allocation. Our policy is to bring the actual allocation in line with the target allocation.
Equity securities include exchange-traded common stock and preferred stock of companies from broadly diversified industries. Fixed income securities include a global portfolio of corporate bonds of companies from diversified industries, government securities, mortgage-backed securities, asset-backed securities, derivative instruments and other. Other investments include a group trust consisting primarily of private equity partnerships as well as other investments.partnerships. Portions of the cash and cash equivalent, equity, and fixed income investments are held in commingled funds.
Fair Value. The measurement of the fair value of pension and post-retirement plan assets uses the valuation methodologies and the inputs as described in Note 12.11, "Fair Value Measurements".
Cash and Cash Equivalents - Cash and cash equivalents consist of short-term investment funds. The funds also invest in short-term domestic fixed income securities and other securities with debt-like characteristics emphasizing short-term maturities and quality. Cash and cash equivalents are classified as Level 1 investments except when the cash and cash equivalents are held in commingled funds, which have a daily net value derived from quoted prices for the underlying securities in active markets; these are classified as Level 2 investments.
Equity - Some equity securities consisting of common and preferred stock are held in commingled funds, which have daily net asset values derived from quoted prices for the underlying securities in active markets; these are classified as Level 2 investments. Commingled funds which have quoted prices in active markets are classified as Level 1 investments.
Fixed Income - Some of the fixed income securities are held in commingled funds, which have daily net asset values derived from the underlying securities; these are classified as Level 2 investments. Commingled funds which have quoted prices in active markets are classified as Level 1 investments.
Other Investments - Other investments includes property based pooled vehicles which invest in real estate. Market net asset values are regularly published in the financial press or on corporate websites and so these investments are classified as Level 2. Other investments also includes partnership investments where, due to their private nature, pricing inputs are not readily observable. Asset valuations are developed by the general partners that manage the partnerships. These valuations are based on proprietary appraisals, application of public market multiples to private company cash flows, utilization of market transactions that provide valuation information for comparable companies and other methods. Holdings of limited partnerships are classified as Level 3.
The following tables present the fair value of U.S. Defined Benefit Plans assets classified under the appropriate level of the fair value hierarchy as of October 31, 20132016 and 20122015.
|
| | | | | | | | | | | | | | | |
| | | | Fair Value Measurement
at October 31, 2016 Using |
| | October 31,
2016 | | Quoted Prices in Active Markets for Identical Assets (Level 1) | | Significant Other Observable Inputs (Level 2) | | Significant Unobservable Inputs (Level 3) |
| | (in millions) |
| Cash and Cash Equivalents | $ | 4 |
| | $ | 1 |
| | $ | 3 |
| | $ | — |
|
| Equity | 248 |
| | 62 |
| | 186 |
| | — |
|
| Fixed Income | 80 |
| | 24 |
| | 56 |
| | — |
|
| Other Investments | 9 |
| | — |
| | — |
| | 9 |
|
| Total assets measured at fair value | $ | 341 |
| | $ | 87 |
| | $ | 245 |
| | $ | 9 |
|
|
| | | | | | | | | | | | | | | |
| | | | Fair Value Measurement at October 31, 2013 Using |
| | October 31,
2013 | | Quoted Prices in Active Markets for Identical Assets (Level 1) | | Significant Other Observable Inputs (Level 2) | | Significant Unobservable Inputs (Level 3) |
| | (in millions) |
| Cash and Cash Equivalents | $ | 8 |
| | $ | 1 |
| | $ | 7 |
| | $ | — |
|
| Equity | 616 |
| | 191 |
| | 425 |
| | — |
|
| Fixed Income | 139 |
| | 17 |
| | 122 |
| | — |
|
| Other Investments | 19 |
| | 2 |
| | — |
| | 17 |
|
| Total assets measured at fair value | $ | 782 |
| | $ | 211 |
| | $ | 554 |
| | $ | 17 |
|
| | | | | | Fair Value Measurement
at October 31, 2012 Using | | | Fair Value Measurement
at October 31, 2015 Using |
| | October 31,
2012 | | Quoted Prices in Active Markets for Identical Assets (Level 1) | | Significant Other Observable Inputs (Level 2) | | Significant Unobservable Inputs (Level 3) | October 31,
2015 | | Quoted Prices in Active Markets for Identical Assets (Level 1) | | Significant Other Observable Inputs (Level 2) | | Significant Unobservable Inputs (Level 3) |
| | (in millions) | (in millions) |
| Cash and Cash Equivalents | $ | 8 |
| | $ | 1 |
| | $ | 7 |
| | $ | — |
| $ | 3 |
| | $ | 1 |
| | $ | 2 |
| | $ | — |
|
| Equity | 486 |
| | 134 |
| | 352 |
| | — |
| 258 |
| | 61 |
| | 197 |
| | — |
|
| Fixed Income | 137 |
| | 15 |
| | 122 |
| | — |
| 76 |
| | 22 |
| | 54 |
| | — |
|
| Other Investments | 23 |
| | 2 |
| | — |
| | 21 |
| 10 |
| | — |
| | 1 |
| | 9 |
|
| Total assets measured at fair value | $ | 654 |
| | $ | 152 |
| | $ | 481 |
| | $ | 21 |
| $ | 347 |
| | $ | 84 |
| | $ | 254 |
| | $ | 9 |
|
| | | | | | | | | |
For U.S. Defined Benefit Plans assets measured at fair value using significant unobservable inputs (level 3), the following table summarizes the change in balances during 20132016 and 20122015: for continuing operations:
| | | | Years Ended October 31. | Years Ended October 31. |
| | 2013 | | 2012 | 2016 | | 2015 |
| Balance, beginning of year | $ | 21 |
| | $ | 26 |
| $ | 9 |
| | $ | 14 |
|
| Realized gains | 4 |
| | 3 |
| |
| Realized gains/(losses) | | — |
| | (1 | ) |
| Unrealized gains/(losses) | (2 | ) | | (2 | ) | 3 |
| | (2 | ) |
| Purchases, sales, issuances, and settlements | (6 | ) | | (6 | ) | (3 | ) | | (2 | ) |
| Transfers in (out) | — |
| | — |
| — |
| | — |
|
| Balance, end of year | $ | 17 |
| | $ | 21 |
| $ | 9 |
| | $ | 9 |
|
The following tables present the fair value of U.S. Post-Retirement Benefit Plans assets classified under the appropriate level of the fair value hierarchy as of October 31, 20132016 and 20122015.
| | | | | | Fair Value Measurement at October 31, 2013 Using | | | Fair Value Measurement at
October 31, 2016 Using |
| | October 31,
2013 | | Quoted Prices in Active Markets for Identical Assets (Level 1) | | Significant Other Observable Inputs (Level 2) | | Significant Unobservable Inputs (Level 3) | October 31,
2016 | | Quoted Prices in Active Markets for Identical Assets (Level 1) | | Significant Other Observable Inputs (Level 2) | | Significant Unobservable Inputs (Level 3) |
| | (in millions) | (in millions) |
| Cash and Cash Equivalents | $ | 5 |
| | $ | 2 |
| | $ | 3 |
| | $ | — |
| $ | 3 |
| | $ | 2 |
| | $ | 1 |
| | $ | — |
|
| Equity | 220 |
| | 68 |
| | 152 |
| | — |
| 59 |
| | 15 |
| | 44 |
| | — |
|
| Fixed Income | 52 |
| | 6 |
| | 46 |
| | — |
| 21 |
| | 6 |
| | 15 |
| | — |
|
| Other Investments | 11 |
| | 1 |
| | — |
| | 10 |
| 5 |
| | — |
| | — |
| | 5 |
|
| Total assets measured at fair value | $ | 288 |
| | $ | 77 |
| | $ | 201 |
| | $ | 10 |
| $ | 88 |
| | $ | 23 |
| | $ | 60 |
| | $ | 5 |
|
| | | | | | Fair Value Measurement at October 31, 2012 Using | | | Fair Value Measurement
at October 31, 2015 Using |
| | October 31,
2012 | | Quoted Prices in Active Markets for Identical Assets (Level 1) | | Significant Other Observable Inputs (Level 2) | | Significant Unobservable Inputs (Level 3) | October 31,
2015 | | Quoted Prices in Active Markets for Identical Assets (Level 1) | | Significant Other Observable Inputs (Level 2) | | Significant Unobservable Inputs (Level 3) |
| | (in millions) | (in millions) |
| Cash and Cash Equivalents | $ | 5 |
| | $ | 2 |
| | $ | 3 |
| | $ | — |
| $ | 3 |
| | $ | 2 |
| | $ | 1 |
| | $ | — |
|
| Equity | 189 |
| | 52 |
| | 137 |
| | — |
| 62 |
| | 15 |
| | 47 |
| | — |
|
| Fixed Income | 54 |
| | 6 |
| | 48 |
| | — |
| 20 |
| | 6 |
| | 14 |
| | — |
|
| Other Investments | 13 |
| | 1 |
| | — |
| | 12 |
| 6 |
| | — |
| | — |
| | 6 |
|
| Total assets measured at fair value | $ | 261 |
| | $ | 61 |
| | $ | 188 |
| | $ | 12 |
| $ | 91 |
| | $ | 23 |
| | $ | 62 |
| | $ | 6 |
|
For U.S. Post-Retirement Benefit Plans assets measured at fair value using significant unobservable inputs (level 3), the following table summarizes the change in balances during 20132016 and 20122015: for continuing operations:
| | | | Years Ended October 31, | Years Ended October 31, |
| | 2013 | | 2012 | 2016 | | 2015 |
| Balance, beginning of year | $ | 12 |
| | $ | 15 |
| $ | 6 |
| | $ | 8 |
|
| Realized gains | 2 |
| | 2 |
| |
| Realized gains/(losses) | | — |
| | (1 | ) |
| Unrealized gains/(losses) | (1 | ) | | (1 | ) | 1 |
| | — |
|
| Purchases, sales, issuances, and settlements | (3 | ) | | (4 | ) | (2 | ) | | (1 | ) |
| Transfers in (out) | — |
| | — |
| — |
| | — |
|
| Balance, end of year | $ | 10 |
| | $ | 12 |
| $ | 5 |
| | $ | 6 |
|
The following tables present the fair value of non-U.S. Defined Benefit Plans assets classified under the appropriate level of the fair value hierarchy as of October 31, 20132016 and 2012:2015:
| | | | | | Fair Value Measurement at October 31, 2013 Using | | | Fair Value Measurement at
October 31, 2016 Using |
| | October 31,
2013 | | Quoted Prices in Active Markets for Identical Assets (Level 1) | | Significant Other Observable Inputs (Level 2) | | Significant Unobservable Inputs (Level 3) | October 31,
2016 | | Quoted Prices in Active Markets for Identical Assets (Level 1) | | Significant Other Observable Inputs (Level 2) | | Significant Unobservable Inputs (Level 3) |
| | (in millions) | (in millions) |
| Cash and Cash Equivalents | $ | 10 |
| | $ | 10 |
| | $ | — |
| | $ | — |
| $ | 26 |
| | $ | 18 |
| | $ | 8 |
| | $ | — |
|
| Equity | 1,078 |
| | 296 |
| | 782 |
| | — |
| 422 |
| | 156 |
| | 266 |
| | — |
|
| Fixed Income | 919 |
| | 24 |
| | 895 |
| | — |
| 325 |
| | 9 |
| | 316 |
| | — |
|
| Other Investments | 38 |
| | — |
| | 38 |
| | — |
| 1 |
| | — |
| | 1 |
| | — |
|
| Total assets measured at fair value | $ | 2,045 |
| | $ | 330 |
| | $ | 1,715 |
| | $ | — |
| $ | 774 |
| | $ | 183 |
| | $ | 591 |
| | $ | — |
|
| | | | | | Fair Value Measurement
at October 31, 2012 Using | | | Fair Value Measurement
at October 31, 2015 Using |
| | October 31,
2012 | | Quoted Prices in Active Markets for Identical Assets (Level 1) | | Significant Other Observable Inputs (Level 2) | | Significant Unobservable Inputs (Level 3) | October 31,
2015 | | Quoted Prices in Active Markets for Identical Assets (Level 1) | | Significant Other Observable Inputs (Level 2) | | Significant Unobservable Inputs (Level 3) |
| | (in millions) | (in millions) |
| Cash and Cash Equivalents | $ | 3 |
| | $ | 3 |
| | $ | — |
| | $ | — |
| $ | 3 |
| | $ | 1 |
| | $ | 2 |
| | $ | — |
|
| Equity | 861 |
| | 226 |
| | 635 |
| | — |
| 396 |
| | 172 |
| | 224 |
| | — |
|
| Fixed Income | 900 |
| | 19 |
| | 881 |
| | — |
| 379 |
| | 13 |
| | 366 |
| | — |
|
| Other Investments | 37 |
| | — |
| | 37 |
| | — |
| — |
| | — |
| | — |
| | — |
|
| Total assets measured at fair value | $ | 1,801 |
| | $ | 248 |
| | $ | 1,553 |
| | $ | — |
| $ | 778 |
| | $ | 186 |
| | $ | 592 |
| | $ | — |
|
For non-U.S. Defined Benefit Plans, there was no activity relating to assets measured at fair value using significant unobservable inputs (level 3), the following table summarizes the changes in balances during fiscal year 2013 and 2012.2015 for continuing operations:
|
| | | | |
| | | Year Ended |
| | | October 31, 2015 |
| Balance, beginning of year | | $ | 4 |
|
| Realized gains/(losses) | | 1 |
|
| Unrealized gains/(losses) | | — |
|
| Purchases, sales, issuances, and settlements | | (5 | ) |
| Transfers in (out) | | — |
|
| Balance, end of year | | $ | — |
|
The table below presents the combined projected benefit obligation ("PBO"), accumulated benefit obligation ("ABO") and fair value of plan assets, grouping plans using comparisons of the PBO and ABO relative to the plan assets for continuing operations as of October 31, 20132016 or 2012.
2015.
| | | | 2013 | | 2012 | 2016 | | 2015 |
| | Benefit Obligation | | | | Benefit Obligation | | | Benefit Obligation | | | | Benefit Obligation | | |
| | Fair Value of Plan Assets | | Fair Value of Plan Assets | Fair Value of Plan Assets | | Fair Value of Plan Assets |
| | PBO | | PBO | | PBO | | PBO | |
| | (in millions) | (in millions) |
| U.S. defined benefit plans where PBO exceeds the fair value of plan assets | $ | 15 |
| | $ | — |
| | $ | 771 |
| | $ | 654 |
| $ | 434 |
| | $ | 341 |
| | $ | 415 |
| | $ | 347 |
|
| U.S. defined benefit plans where fair value of plan assets exceeds PBO | 748 |
| | 782 |
| | — |
| | — |
| — |
| | — |
| | — |
| | — |
|
| Total | $ | 763 |
| | $ | 782 |
| | $ | 771 |
| | $ | 654 |
| $ | 434 |
| | $ | 341 |
| | $ | 415 |
| | $ | 347 |
|
| | | | | | | | | |
| Non-U.S. defined benefit plans where PBO exceeds or is equal to the fair value of plan assets | $ | 1,697 |
| | $ | 1,482 |
| | $ | 2,117 |
| | $ | 1,801 |
| $ | 970 |
| | $ | 741 |
| | $ | 771 |
| | $ | 623 |
|
| Non-U.S. defined benefit plans where fair value of plan assets exceeds PBO | 502 |
| | 563 |
| | — |
| | — |
| 32 |
| | 33 |
| | 129 |
| | 155 |
|
| Total | $ | 2,199 |
| | $ | 2,045 |
| | $ | 2,117 |
| | $ | 1,801 |
| $ | 1,002 |
| | $ | 774 |
| | $ | 900 |
| | $ | 778 |
|
| | | | | | | | | | | | | | | |
| | ABO | | | | ABO | | | ABO | | | | ABO | | |
| U.S. defined benefit plans where ABO exceeds the fair value of plan assets | $ | 14 |
| | $ | — |
| | $ | 749 |
| | $ | 654 |
| $ | 434 |
| | $ | 341 |
| | $ | 389 |
| | $ | 347 |
|
| U.S. defined benefit plans where the fair value of plan assets exceeds ABO | 716 |
| | 782 |
| | — |
| | — |
| — |
| | — |
| | — |
| | — |
|
| Total | $ | 730 |
| | $ | 782 |
| | $ | 749 |
| | $ | 654 |
| $ | 434 |
| | $ | 341 |
| | $ | 389 |
| | $ | 347 |
|
| | | | | | | | | |
| Non-U.S. defined benefit plans where ABO exceeds or is equal to the fair value of plan assets | $ | 1,533 |
| | $ | 1,380 |
| | $ | 2,034 |
| | $ | 1,801 |
| $ | 737 |
| | $ | 542 |
| | $ | 732 |
| | $ | 623 |
|
| Non-U.S. defined benefit plans where fair value of plan assets exceeds ABO | 590 |
| | 665 |
| | — |
| | — |
| 226 |
| | 232 |
| | 127 |
| | 155 |
|
| Total | $ | 2,123 |
| | $ | 2,045 |
| | $ | 2,034 |
| | $ | 1,801 |
| $ | 963 |
| | $ | 774 |
| | $ | 859 |
| | $ | 778 |
|
Contributions and estimated future benefit payments. During fiscal year 20142017, we expect to contribute $3026 million to the U.S. defined benefit plans, $71$20 million to plans outside the U.S., and $2 millionzero to the Post-retirementPost-Retirement Medical Plans. The following table presents expected future benefit payments for the next 10 years.years:
|
| | | | | | | | | | | |
| | U.S. Defined Benefit Plans | | Non-U.S. Defined Benefit Plans | | U.S. Post-Retirement Benefit Plans |
| | (in millions) |
| 2014 | $ | 41 |
| | $ | 51 |
| | $ | 24 |
|
| 2015 | $ | 44 |
| | $ | 56 |
| | $ | 24 |
|
| 2016 | $ | 49 |
| | $ | 60 |
| | $ | 25 |
|
| 2017 | $ | 56 |
| | $ | 62 |
| | $ | 24 |
|
| 2018 | $ | 57 |
| | $ | 70 |
| | $ | 24 |
|
| 2019 - 2023 | $ | 362 |
| | $ | 448 |
| | $ | 116 |
|
|
| | | | | | | | | | | |
| | U.S. Defined Benefit Plans | | Non-U.S. Defined Benefit Plans | | U.S. Post-Retirement Benefit Plans |
| | (in millions) |
| 2017 | $ | 27 |
| | $ | 48 |
| | $ | 8 |
|
| 2018 | $ | 25 |
| | $ | 22 |
| | $ | 8 |
|
| 2019 | $ | 26 |
| | $ | 24 |
| | $ | 8 |
|
| 2020 | $ | 28 |
| | $ | 25 |
| | $ | 7 |
|
| 2021 | $ | 27 |
| | $ | 27 |
| | $ | 7 |
|
| 2022 - 2026 | $ | 137 |
| | $ | 168 |
| | $ | 35 |
|
Assumptions. The assumptions used to determine the benefit obligations and expense for our defined benefit and post-retirement benefit plans are presented in the tables below. The expected long-term return on assets below represents an estimate of long-term returns on investment portfolios consisting of a mixture of equities, fixed income and alternative investments in proportion to the asset allocations of each of our plans. We consider long-term rates of return, which are weighted based on the asset classes (both historical and forecasted) in which we expect our pension and post-retirement funds to be invested. Discount rates reflect the current rate at which pension and post-retirement obligations could be settled based on the measurement dates of the plans - October 31. The U.S. discount rates at October 31, 20132016 and 20122015, were determined based on the results of matching expected plan benefit payments with cash flows from a hypothetically constructed bond portfolio. The non-U.S. rates were generally
based on published rates for high-quality corporate bonds. The range of assumptions that were used for the non-U.S. defined benefit plans reflects the different economic environments within various countries.
Assumptions used to calculate the net periodic cost in each year were as follows:
| | | | For years ended October 31, | For years ended October 31, |
| | 2013 | | 2012 | | 2011 | 2016 | | 2015 | | 2014 |
| U.S. defined benefit plans: | | | | | | | | | | |
| Discount rate | 3.25% | | 4.50% | | 5.00% | 4.20% | | 4.00% | | 4.00-4.50% |
| Average increase in compensation levels | 3.50% | | 3.50% | | 3.50% | 3.50% | | 3.50% | | 3.50% |
| Expected long-term return on assets | 8.00% | | 8.00% | | 8.25% | 7.50% | | 8.00% | | 8.00% |
| Non-U.S. defined benefit plans: | | | | | | | | | | |
| Discount rate | 1.50-4.50% | | 2.00-5.50% | | 2.00-5.25% | 0.77-3.76% | | 1.50-4.00% | | 1.50-4.50% |
| Average increase in compensation levels | 2.50-3.00% | | 2.50-3.25% | | 2.50-3.75% | 2.25-4.00% | | 2.50-3.25% | | 2.50-3.25% |
| Expected long-term return on assets | 4.00-6.50% | | 4.00-6.50% | | 4.00-6.75% | 4.25-6.50% | | 4.00-6.50% | | 4.00-6.50% |
| U.S. post-retirement benefits plans: | | | | | | | | | | |
| Discount rate | 3.50% | | 4.75% | | 5.50% | 4.00% | | 4.00% | | 4.00-4.25% |
| Expected long-term return on assets | 8.00% | | 8.00% | | 8.25% | 7.50% | | 8.00% | | 8.00% |
| Current medical cost trend rate | 9.00% | | 9.00% | | 10.00% | 7.00% | | 8.00% | | 8.00% |
| Ultimate medical cost trend rate | 3.50% | | 4.50% | | 4.75% | 3.50% | | 3.50% | | 3.50% |
| Medical cost trend rate decreases to ultimate rate in year | 2027 | | 2026 | | 2025 | 2029 | | 2028 | | 2028 |
Assumptions used to calculate the benefit obligation were as follows:
| | | | As of the Years Ending October 31, | As of the Years Ending October 31, |
| | 2013 | | 2012 | 2016 | | 2015 |
| U.S. defined benefit plans: | | | | | | |
| Discount rate | 4.50% | | 3.25% | 3.75% | | 4.20% |
| Average increase in compensation levels | 3.50% | | 3.50% | N/A | | 3.50% |
| Non-U.S. defined benefit plans: | | | | | | |
| Discount rate | 1.75-4.25% | | 1.50-4.50% | 0.40-2.62% | | 0.77-3.76% |
| Average increase in compensation levels | 2.50-3.25% | | 2.50-3.00% | 2.00-4.25% | | 2.25-4.00% |
| U.S. post-retirement benefits plans: | | | | | | |
| Discount rate | 4.25% | | 3.50% | 3.50% | | 4.00% |
| Current medical cost trend rate | 9.00% | | 9.00% | 6.00% | | 7.00% |
| Ultimate medical cost trend rate | 3.50% | | 3.50% | 3.50% | | 3.50% |
| Medical cost trend rate decreases to ultimate rate in year | 2028 | | 2027 | 2029 | | 2029 |
Health care trend rates do not have a significant effect on the total service and interest cost components or on the post-retirement benefit obligation amounts reported for the U.S. Post-Retirement Benefit Plan for the year ended October 31, 20132016.
16.14. GUARANTEES
Standard Warranty
We accrue for standard warranty costs based on historical trends in warranty charges as a percentage of net product shipments. The accrual is reviewed regularly and periodically adjusted to reflect changes in warranty cost estimates. Estimated warranty charges are recorded within cost of products at the time products are sold. The standard warranty accrual balances are held in other accrued and other long-term liabilities on our consolidated balance sheet. Our standard warranty terms typically extend between one and three years from the date of delivery, depending on the product.
A summary of the standard warranty accrual activity is shown in the table below. The standard warranty accrual balances are held in other accrued and other long-term liabilities.
|
| | | | | | | |
| | October 31, |
| | 2013 | | 2012 |
| | (in millions) |
| Balance as of October 31, 2012 and 2011 | $ | 60 |
| | $ | 50 |
|
| Reserve acquired upon close of Dako acquisition | — |
| | 1 |
|
| Accruals for warranties including change in estimates | 92 |
| | 87 |
|
| Settlements made during the period | (83 | ) | | (78 | ) |
| Balance as of October 31, 2013 and 2012 | $ | 69 |
| | $ | 60 |
|
|
| | | | | | | |
| | October 31, |
| | 2016 | | 2015 |
| | (in millions) |
| Balance as of October 31, 2015 and 2014 | $ | 31 |
| | $ | 30 |
|
| Accruals for warranties including change in estimates | 53 |
| | 53 |
|
| Settlements made during the period | (49 | ) | | (52 | ) |
| Balance as of October 31, 2016 and 2015 | $ | 35 |
| | $ | 31 |
|
| | | Accruals for warranties due within one year | 48 |
| | 51 |
| 34 |
| | 29 |
|
| Accruals for warranties due after one year | 21 |
| | 9 |
| 1 |
| | 2 |
|
| Balance as of October 31, 2013 and 2012 | $ | 69 |
| | $ | 60 |
| |
| Balance as of October 31, 2016 and 2015 | | $ | 35 |
| | $ | 31 |
|
Indemnifications to Avagoin Connection with Transactions
In connection with the sale of our semiconductor products business in December 2005,various divestitures, acquisitions, spin-offs and other transactions, we have agreed to indemnify Avago, itscertain parties, their affiliates andand/or other related parties against certain damages and expenses that it might incuroccur in the future. The continuingThese indemnifications primarilymay cover damagesa variety of liabilities, including, but not limited to, employee, tax, environmental, intellectual property, litigation and expenses relatingother liabilities related to liabilitiesthe business conducted prior to the date of the businesses that Agilent retained and did not transfer to Avago, as well as pre-closing taxes and other specified items.transaction. In our opinion, the fair value of these indemnification obligations was not material as of October 31, 2013.2016.
Indemnifications to Verigy
In connection with the spin-off of Verigy, we agreed to indemnify Verigy and its affiliates against certain damages which it might incur in the future. These indemnifications primarily cover damages relating to liabilities of the businesses that Agilent did not transfer to Verigy, liabilities that might arise under limited portions of Verigy's IPO materials that relate to Agilent, and costs and expenses incurred by Agilent or Verigy to effect the IPO, arising out of the distribution of Agilent's remaining holding in Verigy ordinary shares to Agilent's stockholders, or incurred to effect the separation of the semiconductor test solutions business from Agilent to the extent incurred prior to the separation on June 1, 2006. On July 4, 2011, Verigy announced the completion by Advantest Corporation of its acquisition of Verigy. Verigy will operate as a wholly-owned subsidiary of Advantest and our indemnification obligations to Verigy should be unaffected. In our opinion, the fair value of these indemnification obligations was not material as of October 31, 2013.
Indemnifications to Hewlett-Packard
We have given multiple indemnities to Hewlett-Packard in connection with our activities prior to our spin-off from HP for the businesses that constituted Agilent prior to the spin-off. These indemnifications cover a variety of aspects of our business, including, but not limited to, employee, tax, intellectual property and environmental matters. The agreements containing these indemnifications have been previously disclosed as exhibits to our registration statement on Form S-1 filed on August 16, 1999. In our opinion, the fair value of these indemnification obligations was not material as of October 31, 2013.
Indemnifications to Varian Medical Systems and Varian Semiconductor Equipment Associates
In connection with our acquisition of Varian, we are subject to certain indemnification obligations to Varian Medical Systems (formerly Varian Associates, Inc. ("VAI")) and Varian Semiconductor Equipment Associates ("VSEA") in connection with the Instruments business as conducted by VAI prior to the Distribution (as described in Note 1 of Varian's Annual Report on Form 10-K filed on November 25, 2009). These indemnification obligations cover a variety of aspects of our business, including, but not limited to, employee, tax, intellectual property, litigation and environmental matters. Certain of the agreements containing these indemnification obligations are disclosed as exhibits to Varian's Annual Report on Form 10-K filed on November 25, 2009. On November 10, 2011, Applied Materials announced that it had completed the acquisition of VSEA, which is now a wholly-owned subsidiary of Applied Materials; our indemnification obligations to VSEA should be unaffected. In our opinion, the fair value of these indemnification obligations was not material as of October 31, 2013.
Indemnifications to Officers and Directors
Our corporate by-laws require that we indemnify our officers and directors, as well as those who act as directors and officers of other entities at our request, against expenses, judgments, fines, settlements and other amounts actually and reasonably incurred in connection with any proceedings arising out of their services to Agilent and such other entities, including service with respect to employee benefit plans. In addition, we have entered into separate indemnification agreements with each director and each board-appointed officer of Agilent which provide for indemnification of these directors and officers under similar circumstances and under additional circumstances. The indemnification obligations are more fully described in the by-laws and the indemnification agreements. We purchase standard insurance to cover claims or a portion of the claims made against our directors and officers. Since a maximum obligation is not explicitly stated in our by-laws or in our indemnification agreements and will depend on the facts and circumstances that arise out of any future claims, the overall maximum amount of the obligations cannot be reasonably estimated. Historically, we have not made payments related to these obligations, and the fair value for these indemnification obligations was not material as of October 31, 20132016.
Other Indemnifications
As is customary in our industry and as provided for in local law in the U.S. and other jurisdictions, many of our standard contracts provide remedies to our customers and others with whom we enter into contracts, such as defense, settlement, or payment of judgment for intellectual property claims related to the use of our products. From time to time, we indemnify customers, as well as our suppliers, contractors, lessors, lessees, companies that purchase our businesses or assets and others with whom we enter into contracts, against combinations of loss, expense, or liability arising from various triggering events related to the sale and the use of our products and services, the use of their goods and services, the use of facilities and state of our owned facilities, the state of the assets and businesses that we sell and other matters covered by such contracts, usually up to a specified maximum amount. In addition, from time to time we also provide protection to these parties against claims related to undiscovered liabilities, additional product liability or environmental obligations. In our experience, claims made under such indemnifications are rare and the associated estimated fair value of the liability was not material as of October 31, 20132016.
In connection with the sale of several of our businesses, we have agreed to indemnify the buyers of such business, their respective affiliates and other related parties against certain damages that they might incur in the future. The continuing indemnifications primarily cover damages relating to liabilities of the businesses that Agilent retained and did not transfer to the buyers, as well as other specified items. In our opinion, the fair value of these indemnification obligations was not material as of October 31, 20132016.
15. COMMITMENTS AND CONTINGENCIES
Operating Lease Commitments: We lease certain real and personal property from unrelated third parties under non-cancelable operating leases. Future minimum lease payments under operating leases at October 31, 20132016 were $56 million for 2014, $47 million for 2015, $31 million for 2016, $2138 million for 2017, $1235 million for 2018, $25 million for 2019, $14 million for 2020, $8 million for 2021 and $626 million thereafter. Future minimum subleaselease income under leases at October 31, 20132016 was $611 million for 20142017, $510 million for 20152018, $39 million for 20162019, $2and $19 million for 2017 and zero thereafter. Certain leases require us to pay property taxes, insurance and routine maintenance, and include escalation clauses. Total rent expense was $9061 million in 20132016, $8465 million in 20122015 and $8255 million in 20112014.
Contingencies: We are involved in lawsuits, claims, investigations and proceedings, including, but not limited to, patent, commercial and environmental matters, which arise in the ordinary course of business. There are no matters pending that we currently believe are reasonably possible of having a material impact to our business, consolidated financial condition, results of operations or cash flows.
On March 4, 2013, we made a report to the Inspector General of the Department of Defense (“DOD IG”) regarding pricing irregularities relating to certain sales of electronic measurement products to U.S. government agencies. We have conducted a thorough investigation with the help of external counsel, and we have approached the DOD IG with a proposed methodology for resolving possible overcharges to U.S. government purchasers resulting from these sales. Based on our investigation and our interactions with the DOD IG, we do not believe that this matter is reasonably possible of having a material impact on Agilent's financial condition, results of operations or cash flows. As of October 31, 2013, we have accrued for this matter based on our current understanding.
As part of routine internal audit activities, the Company determined that certain employees of Agilent's subsidiaries in China did not comply with the Company's Standards of Business Conduct and other policies. Based on those findings, the Company has initiated an internal investigation, with the assistance of outside counsel, relating to certain sales of our products through third
party intermediaries in China. The internal investigation includes a review of compliance by our employees in China with the requirements of the U.S. Foreign Corrupt Practices Act and other applicable laws and regulations. On September 5, 2013, the Company voluntarily contacted the United States Securities and Exchange Commission and United States Department of Justice to advise both agencies of this internal investigation. We will cooperate with any government investigation of this matter. At this point, we cannot predict or estimate the duration, scope, cost, or result of this matter, or whether the government will commence any legal action, which could result in possible fines and penalties, criminal or civil sanctions, or other consequences. Accordingly, no provision with respect to these matters has been made in the Company's consolidated financial statements. Adverse findings or other negative outcomes from any governmental proceedings could have a material impact on the Company's consolidated financial statements in future periods.
18.16. SHORT-TERM DEBT
Credit FacilityFacilities
On October 20, 2011, weSeptember 15, 2014, Agilent entered into a five-year credit agreement with a financial institution which provides for a $400$400 million five-year unsecured credit facility that will expire on October 20, 2016. The company may use amounts borrowedSeptember 15, 2019. On June 9, 2015, the commitments under the existing credit facility were increased by $300 million so that the aggregate commitments under the facility for general corporate purposes.now total $700 million. For the year ended October 31, 2016, we borrowed $255 million and repaid $255 million by October 31, 2016. As of October 31, 20132016, the company hashad no borrowings outstanding under the facility. We were in compliance with the covenants for the credit facilitiesfacility during the yearyears ended October 31, 2013.2016 and 2015.
As a result of the Dako acquisition, we have a credit facility in Danish Krone equivalent of $9 million with a Danish financial institution. As of October 31, 2013December 20, 2016, the company had no borrowings of $65 million outstanding under the facility.this credit facility and may borrow more during fiscal year 2017.
On July 13, 2010, the company issued an aggregate principal amount of $250 million in senior notes ("2013 senior notes"). The 2013 senior notes matured on July 15, 2013 and were paid in full.
2012 Senior Notes
On September 9, 2009, the company issued an aggregate principal amount of $250 million in senior notes ("2012 senior notes"). The 2012 senior notes matured on September 14, 2012 and were paid in full.
19.17. LONG-TERM DEBT
Senior Notes
The following table summarizes the company's long-term senior notes and the related interest rate swaps:
| | | | October 31, 2013 | | October 31, 2012 | October 31, 2016 | | October 31, 2015 |
| | Amortized Principal | | Swap | | Total | | Amortized Principal | | Swap | | Total | Amortized Principal | | Swap | | Total | | Amortized Principal | | Swap | | Total |
| | (in millions) | (in millions) |
| 2015 Senior Notes | 500 |
| | 12 |
| | 512 |
| | 499 |
| | 18 |
| | 517 |
| |
| 2017 Senior Notes | 599 |
| | 22 |
| | 621 |
| | 599 |
| | 26 |
| | 625 |
| 100 |
| | 1 |
| | 101 |
| | 100 |
| | 2 |
| | 102 |
|
| 2020 Senior Notes | 498 |
| | 26 |
| | 524 |
| | 498 |
| | 29 |
| | 527 |
| 499 |
| | 15 |
| | 514 |
| | 499 |
| | 19 |
| | 518 |
|
| 2022 Senior Notes | 399 |
| | — |
| | 399 |
| | 399 |
| | — |
| | 399 |
| 400 |
| | — |
| | 400 |
| | 399 |
| | — |
| | 399 |
|
| 2023 Senior Notes | 597 |
| | — |
| | 597 |
| | — |
| | — |
| | — |
| 598 |
| | — |
| | 598 |
| | 598 |
| | — |
| | 598 |
|
| 2026 Senior Notes | | 299 |
| | — |
| | 299 |
| | — |
| | — |
| | — |
|
| Total | $ | 2,593 |
| | $ | 60 |
| | $ | 2,653 |
| | $ | 1,995 |
| | $ | 73 |
| | $ | 2,068 |
| $ | 1,896 |
| | $ | 16 |
| | $ | 1,912 |
| | $ | 1,596 |
| | $ | 21 |
| | $ | 1,617 |
|
2015 Senior Notes
In September 2009, the company issued an aggregate principal amount of $500 million in senior notes ("2015 senior notes"). The 2015 senior notes were issued at 99.69% of their principal amount. The notes will mature on September 14, 2015, and bear interest at a fixed rate of 5.50% per annum. The interest is payable semi-annually on March 14th and September 14th of each year, payments commenced on March 14, 2010.
On June 6, 2011, we terminated our interest rate swap contracts related to our 2015 senior notes that represented the notional amount of $500 million. The asset value, including interest receivable, upon termination for these contracts was approximately $31 million and the amount to be amortized at October 31, 2013 was $12 million. The gain is being deferred and amortized to interest expense over the remaining life of the 2015 senior notes.
2017 Senior Notes
In October 2007, the company issued an aggregate principal amount of $600 million in senior notes ("2017 senior notes"). The 2017 senior notes were issued at 99.60% of their principal amount. The notes will mature on November 1, 2017, and bear interest at a fixed rate of 6.50% per annum. The interest is payable semi-annually on May 1st and November 1st of each year and payments commenced on May 1, 2008.
On November 25, 2008, we terminated two interest rate swap contracts associated with our 2017 senior notes that represented the notional amount of $400 million. The asset value, including interest receivable, upon termination was approximately $43 million and the amount to be amortized at October 31, 20132016 was $221 million. The gain is being deferred and amortized to interest expense over the remaining life of the 2017 senior notes.
On October 20, 2014, we settled the redemption of $500 million of the $600 million outstanding aggregate principal amount of our 2017 senior notes due November 1, 2017 that had been called for redemption on September 19, 2014. The redemption price of approximately $580 million included a $80 million prepayment penalty computed in accordance with the terms of the 2017 senior notes as the present value of the remaining scheduled payments of principal and unpaid interest related to $500 million partial redemption. The prepayment penalty less partial amortization of previously deferred interest rate swap gain of approximately $14 million together with $2 million of amortization of debt issuance costs and discount was disclosed in other income (expense), net in the condensed consolidated statement of operations. We also paid accrued and unpaid interest of $15 million on the 2017 senior notes up to but not including the redemption date.
2020 Senior Notes
In July 2010, the company issued an aggregate principal amount of $500 million in senior notes ("2020 senior notes"). The 2020 senior notes were issued at 99.54% of their principal amount. The notes will mature on July 15, 2020, and bear interest at a fixed rate of 5.00% per annum. The interest is payable semi-annually on January 15th and July 15th of each year, payments commenced on January 15, 2011.
On August 9, 2011, we terminated our interest rate swap contracts related to our 2020 senior notes that represented the notional amount of $500 million. The asset value, including interest receivable, upon termination for these contracts was approximately $34 million and the amount to be amortized at October 31, 20132016 was $2615 million. The gain is being deferred and amortized to interest expense over the remaining life of the 2020 senior notes.
2022 Senior Notes
In September 2012, the company issued an aggregate principal amount of $400 million in senior notes ("2022 senior notes"). The 2022 senior notes were issued at 99.80% of their principal amount. The notes will mature on October 1, 2022, and bear interest at a fixed rate of 3.20% per annum. The interest is payable semi-annually on April 1st and October 1st of each year, payments commenced on April 1, 2013.
2023 Senior Notes
In June 2013, the company issued aggregate principal amount of $600 million in senior notes ("2023 senior notes"). The 2023 senior notes were issued at 99.544% of their principal amount. The notes will mature on July 15, 2023 and bear interest at a fixed rate of 3.875% per annum. The interest is payable semi annuallysemi-annually on January 15th and July 15th of each year and payments will commence January 15, 2014.
All2026 Senior Notes
On September 15, 2016, the company issued aggregate principal amount of $300 million in senior notes ("2026 senior notes"). The 2026 senior notes were issued are unsecuredat 99.624%% of their principal amount. The notes will mature on September 22, 2026 and rank equally in rightbear interest at a fixed rate of payment with all3.050% per annum. The interest is payable semi-annually on March 22nd and September 22nd of Agilent's other senior unsecured indebtedness. The company incurred issuance costseach year and payments will commence March 22, 2017.
In February 2016, Agilent executed three forward-starting pay fixed/receive variable interest rate swaps for the notional amount of $5$300 million each in connection with the 2017 and 2023future interest payments to be made on our 2026 senior notes issued on September 15, 2016. The swap arrangements were terminated on September 15, 2016 with a payment of $10 million and incurred $3 million eachwe recognized this as a deferred loss in connection with the 2015, 2020 and 2022 senior notes. These costs were capitalized inaccumulated other assets on the consolidated balance sheet and the costs arecomprehensive income which is being amortized to interest expense over the termlife of the 2026 senior notes.notes.The remaining loss to be amortized related to the interest rate swap agreements at October 31, 2016 was $9 million.
Other debt
AsIn 2016, we paid approximately $37 million of October 31, 2013, and as a result of the Dako acquisition, we haveour mortgage debts,debt, secured on buildings in Denmark, in Danish Krone equivalent of $46 million aggregate principal outstanding withto a Danish financial institution. The loans have a variable interest rate basedgain recognized upon early payment was not material. No balance exists on 3 months Copenhagen Interbank Rate ("Cibor") and will mature on September 30, 2027. Interest payments are made in March, June, September and Decemberthis debt as of each year.October 31. 2016.
18. STOCKHOLDERS' EQUITY
Stock Repurchase Program
On November 19, 2009 our board of directors approved a share-repurchase program to reduce or eliminate dilution of basic outstanding shares in connection with issuances of stock under the company's equity incentive plans (the "2009 repurchase program"). The 2009 repurchase program did not require the company to acquire a specific number of shares and could be suspended or discontinued at any time. There was no fixed termination date for the 2009 repurchase program.
On January 16, 2013, our board of directors terminated the 2009 repurchase program and approved a new share-repurchase program (the "2013 repurchase program"). The 2013 repurchase program authorized the use of up to $500 million to repurchase shares of the company's common stock in open market transactions, inclusive of any amounts repurchased since November 1, 2012. On May 14,22, 2013 we announced that our board of directors had authorized an increase of $500 million to the 2013a share repurchase program. The program bringing the cumulative authorization to $1 billion. Unless terminated earlier by the board of directors, the 2013 repurchase program iswas designed to cover purchases until the endreduce or eliminate dilution resulting from issuance of the calendar year 2013 and any unused portion may be used in the calendar year 2014. The 2013 repurchase program does not require the company to acquire a specific number of shares and may be suspended or discontinued at any time. As of October 31, 2013, the remaining amount to be repurchasedstock under the 2013 program is $100 million. We repurchased the remaining $100company's employee equity incentive programs to target maintaining a weighted average share count of approximately 335 million worth of shares under the 2013 repurchase program in November 2013.
diluted shares. For the year ended October 31, 20132016, we repurchased 202.4 million shares for $90098 million, which completed the purchases under this authorization. For the year ended October 31, 2015 we repurchased approximately 6 million shares for $267 million. For the year ended October 31, 20122014 we repurchased approximately 54 million shares for $172 million. For the year ended October 31, 2011 we repurchased 12 million shares for $497200 million. All such shares and related costs are held as treasury stock and accounted for using the cost method.
On November 22, 2013May 28, 2015 we announced that our board of directors has authorizedhad approved a new share repurchase program effective(the "2015 repurchase program"). The 2015 share repurchase program authorizes the purchase of up to $1.14 billion of our common stock through and including November 1, 2018. The 2015 repurchase program does not require the company to acquire a specific number of shares and may be suspended or discontinued at any time. During the year ended October 31, 2016, upon the conclusioncompletion of our previous repurchase program, we repurchased approximately 8.3 million shares for $336 million under this authorization. All such shares and related costs are held as treasury stock and accounted for using the company's existing $1 billioncost method. As of October 31, 2016, we had remaining authorization to repurchase up to $804 million of our common stock under this program.
In the first quarter of 2017, we repurchased approximately 2.5 million shares for $111 million under the 2015 repurchase program. The new program is designedIn addition, we retired 292.5 million treasury shares at an aggregate cost of $10.6 billion, which represents all our previously repurchased shares over the past 11 years and our November 2016 repurchases. Also the retirement resulted in a decrease of $6.7 billion to reduce or eliminate dilution resulting from issuanceretained earnings and a decrease of stock under the company's employee equity incentive programs$3.9 billion to maintain a weighted average share count of approximately 335 million diluted shares.additional paid-in-capital.
Cash Dividends on Shares of Common Stock
During the year ended October 31, 2013,2016, cash dividends of $0.46 per share, or $156$150 million were declared and paid on the company's outstanding common stock. During the year ended October 31, 2012,2015, cash dividends of $0.30$0.40 per share, or $104$133 million were declared and paid on the company's outstanding common stock. During the year ended October 31, 2014, cash dividends of $0.53 per share, or $176 million were declared and paid on the company's outstanding common stock.
On November 16, 2016, we declared a quarterly dividend of $0.132 per share of common stock, or approximately $43 million which will be paid on January 25, 2017 to shareholders of record as of the close of business on January 3, 2017. The timing and amounts of any future dividends are subject to determination and approval by our board of directors.
On November 22, 2013 we announced that our board of directors has authorized a 10 percent increase in the quarterly dividend to $0.132 per share. The dividend was declared on November 22, 2013 and will be paid on January 22, 2014 to all stockholders of record as of close of business on December 31, 2013.
Accumulated other comprehensive income (loss)
The following table summarizes the components of our accumulated other comprehensive income (loss) as of October 31, 20132016 and 2012,2015, net of tax effect:
|
| | | | | | | |
| | October 31, |
| | 2013 | | 2012 |
| | (in millions) |
| Unrealized gain on equity securities, net of $2 of tax expense for 2013 | $ | 7 |
| | $ | — |
|
| Foreign currency translation, net of $102 of tax expense for 2013 and 2012 | 425 |
| | 424 |
|
| Unrealized losses on defined benefit plans, net of tax benefit of $(64) and $(162) for 2013 and 2012, respectively | (341 | ) | | (537 | ) |
| Unrealized gains (losses) on derivative instruments, net of tax expense of $2 and $3 for 2013 and 2012, respectively | — |
| | 2 |
|
| Total accumulated other comprehensive income (loss) | $ | 91 |
| | $ | (111 | ) |
|
| | | | | | | |
| | October 31, |
| | 2016 | | 2015 |
| | (in millions) |
| Foreign currency translation, net of tax expense of $(5) and $(2) for 2016 and 2015, respectively | (197 | ) | | (189 | ) |
| Unrealized losses on defined benefit plans, net of tax benefit of $176 and $126 for 2016 and 2015, respectively | (305 | ) | | (204 | ) |
| Unrealized gains (losses) on derivative instruments, net of tax (expense) benefit of $2 and $(2) for 2016 and 2015, respectively | (1 | ) | | 2 |
|
| Total accumulated other comprehensive loss | $ | (503 | ) | | $ | (391 | ) |
21.
Changes in accumulated other comprehensive income (loss) by component and related tax effects for the years ended October 31, 2016 and 2015 were as follows (in millions):
|
| | | | | | | | | | | | | | | | | | | | | | | | |
| | | | | | | Net defined benefit pension cost and post retirement plan costs | | | | |
| | | Unrealized gain on investments | | Foreign currency translation | | Prior service credits | | Actuarial Losses | | Unrealized gains (losses) on derivatives | | Total |
| | | (in millions) |
| As of October 31, 2014 | | $ | 17 |
| | $ | 156 |
| | $ | 255 |
| | $ | (771 | ) | | $ | 9 |
| | $ | (334 | ) |
| Transfer to Keysight | | (17 | ) | | (9 | ) | | (83 | ) | | 444 |
| | (3 | ) | | 332 |
|
| Balance after transfer to Keysight | | — |
| | 147 |
| | 172 |
| | (327 | ) | | 6 |
| | (2 | ) |
| | | | | | | | | | | | | |
| Other comprehensive income (loss) before reclassifications | | — |
| | (360 | ) | | — |
| | (90 | ) | | 11 |
| | (439 | ) |
| | | | | | | | | | | | | |
| Amounts reclassified out of accumulated other comprehensive income | | — |
| | — |
| | (17 | ) | | 35 |
| | (18 | ) | | — |
|
| | | | | | | | | | | | | |
| Tax benefit | | — |
| | 24 |
| | 6 |
| | 17 |
| | 3 |
| | 50 |
|
| | | | | | | | | | | | | |
| Other comprehensive loss | | — |
| | (336 | ) | | (11 | ) | | (38 | ) | | (4 | ) | | (389 | ) |
| | | | | | | | | | | | | |
| As of October 31, 2015 | | $ | — |
| | $ | (189 | ) | | $ | 161 |
| | $ | (365 | ) | | $ | 2 |
| | $ | (391 | ) |
| | | | | | | | | | | | | |
| Other comprehensive income (loss) before reclassifications | | — |
| | (5 | ) | | 6 |
| | (171 | ) | | (10 | ) | | (180 | ) |
| | | | | | | | | | | | | |
| Amounts reclassified out of accumulated other comprehensive income | | — |
| | — |
| | (29 | ) | | 43 |
| | 3 |
| | 17 |
|
| | | | | | | | | | | | | |
| Tax (expense) benefit | | — |
| | (3 | ) | | 8 |
| | 42 |
| | 4 |
| | 51 |
|
| | | | | | | | | | | | | |
| Other comprehensive loss | | — |
| | (8 | ) | | (15 | ) | | (86 | ) | | (3 | ) | | (112 | ) |
| | | | | | | | | | | | | |
| As of October 31, 2016 | | $ | — |
| | $ | (197 | ) | | $ | 146 |
| | $ | (451 | ) | | $ | (1 | ) | | $ | (503 | ) |
| | | | | | | | | | | | | |
Reclassifications out of accumulated other comprehensive income (loss) for the years ended October 31, 2016 and 2015 were as follows (in millions):
|
| | | | | | | | | | |
| Details about accumulated other |
| Amounts Reclassified | Affected line item in |
| comprehensive income components |
| from other comprehensive income | statement of operations |
|
| 2016 |
| 2015 |
|
|
|
|
|
|
|
|
|
| Unrealized gains and (losses) on derivatives |
| (3 | ) |
| 18 |
| | Cost of products |
|
| (3 | ) |
| 18 |
|
| Total before income tax |
|
| — |
|
| (6 | ) | | (Provision)/benefit for income tax |
|
| (3 | ) |
| 12 |
|
| Total net of income tax |
| Net defined benefit pension cost and post retirement plan costs: |
|
|
|
|
|
|
|
|
|
|
|
|
|
| Actuarial net loss |
| (43 | ) |
| (35 | ) |
|
|
| Prior service benefit |
| 29 |
|
| 17 |
|
|
|
|
| (14 | ) |
| (18 | ) |
| Total before income tax |
|
| 4 |
|
| 5 |
| | (Provision)/benefit for income tax |
|
| (10 | ) |
| (13 | ) |
| Total net of income tax |
|
|
|
|
|
|
|
| Total reclassifications for the period |
| $ | (13 | ) |
| $ | (1 | ) |
|
|
Amounts in parentheses indicate reductions to income and increases to other comprehensive income.
Reclassifications of prior service benefit and actuarial net loss in respect of retirement plans and post retirement pension plans are included in the computation of net periodic cost (see Note 13 "Retirement Plans and Post Retirement Pension Plans").
19. SEGMENT INFORMATION
Description of segments. We are a measurement company providing core bio-analytical and electronic measurement solutions to theglobal leader in life sciences, diagnostics and genomics,applied chemical analysis, communicationsmarkets, providing application focused solutions that include instruments, software, services and electronics industries.consumables for the entire laboratory workflow. In the fourthfirst fiscal quarter of 2013,2015, we formed a new operating segment fromcompleted the separation of our existing businesses. The new life sciences and diagnostics segment was formed by the combination of the life sciences business plus the diagnostics and genomicselectronic measurement business. Following this reorganization, See Note 3, "Discontinued Operations" for further information.
Agilent has three business segments comprised of the life sciences and applied markets business, diagnostics business, the chemical analysisand genomics business and the electronic measurement business.Agilent CrossLab business each of which comprises a reportable segment. The historical segment financial information for the life sciences and diagnostics segment has been recast to conform to this new reporting structure in our financial statements. The three operating segments were determined based primarily on how the chief operating decision maker views and evaluates our operations. Operating results are regularly reviewed by the chief operating decision maker to make decisions about resources to be allocated to the segment and to assess its performance. Other factors, including market separation and customer specific applications, go-to-market channels, products and services and manufacturing are considered in determining the formation of these operating segments.
A description of our three reportable segments is as follows:
Our life sciences and diagnosticsapplied markets business provides application-focused solutions that include reagents, instruments software, consumables, and servicessoftware that enable customers to identify, quantify and analyze the physical and biological properties of substances and products, as well as enable customers in the clinical and life sciences research areas to interrogate samples at the molecular level. Key product categories include: liquid chromatography ("LC") systems columns and components; liquid chromatography mass spectrometry ("LCMS") systems; gas chromatography ("GC") systems and components; gas chromatography mass spectrometry ("GCMS") systems; inductively coupled plasma mass spectrometry ("ICP-MS") instruments; atomic absorption ("AA") instruments; microwave plasma-atomic emission spectrometry (“MP-AES”) instruments; inductively coupled plasma optical emission spectrometry ("ICP-
OES") instruments; cell analysis plate based assays; laboratory software and informatics systems; laboratory automation and robotic systems;automation; dissolution testing; nucleic acid solutions; Nuclear Magnetic Resonance, Magnetic Resonance Imaging,vacuum pumps and X-Ray Diffraction systems; servicesmeasurement technologies.
Our diagnostics and supportgenomics business is comprised of five areas of activity providing solutions that include reagents, instruments, software and consumables, which enable customers in the clinical and life sciences research areas to interrogate samples at the cellular and molecular level. First, our genomics business includes arrays for the aforementioned products; immunohistochemistry ; In Situ Hybridization; Hematoxylin and Eosin staining; special staining, DNA mutation detection; genotyping;detection, genotyping, gene copy number determination;determination, identification of gene rearrangements;rearrangements, DNA methylation profiling;profiling, gene expression profiling;profiling, as well as next generation sequencing ("NGS") target enrichment;enrichment and automated gel electrophoresis-based sample analysis systems.genetic data management and interpretation support software. Second, our nucleic acid solutions business provides equipment and expertise focused on production of synthesized oligonucleotides under pharmaceutical good manufacturing practices ("GMP") conditions for use as active pharmaceutical ingredients ("API") in an emerging class of drugs that utilize nucleic acid molecules for disease therapy. Next, our pathology solutions business is focused on product offerings to cancer diagnostics and anatomic pathology workflows. The broad portfolio of offerings includes immunohistochemistry (“IHC”), in situ hybridization (“ISH”), hematoxylin and eosin (“H&E”) staining and special staining. We also collaborate with a number of major pharmaceutical companies to develop new potential pharmacodiagnostics, also calledknown as companion diagnostics, with the potential of identifyingwhich may be used to identify patients most likely to benefit from a specific targeted therapy. Finally, the reagent partnership business is a provider of reagents used for turbidimetry and flow cytometry.
Our chemical analysis
The Agilent CrossLab business provides application-focused solutions that include instruments, software,spans the entire lab with its extensive consumables and services that enableportfolio, which is designed to improve customer outcomes. The majority of the portfolio is vendor neutral, meaning Agilent can serve and supply customers regardless of their instrument purchase choices. Solutions range from chemistries and supplies to identify, quantifyservices and analyzesoftware helping to connect the physical and biological properties of substances and products.entire lab. Key product categories in chemical analysis include: gas chromatography (GC) systems,consumables include GC and LC columns, sample preparation products, custom chemistries, and components; gas chromatography mass spectrometry (GC-MS) systems; inductively coupled plasma mass spectrometry (ICP-MS) instruments; atomic absorption (AA) instruments; inductively coupled plasma optical emission spectrometry (ICP-OES) instruments; molecular spectroscopy instruments; softwarea large selection of laboratory instrument supplies. Services include startup, operational, training and data systems; vacuum pumpscompliance support, as well as asset management and measurement technologies; services and support for our products.
Our electronic measurement business provides electronic measurement instruments and systems, software design tools and relatedconsultative services that help increase customer productivity. Custom service and consumable bundles are used intailored to meet the design, development, manufacture, installation, deploymentspecific application needs of various industries and operation of electronics equipment,to keep instruments fully operational and microscopy products. Related services include start-up assistance, instrument productivity and application services and instrument calibration and repair. We also offer customization, consulting and optimization services throughoutcompliant with the customer's product lifecycle.
The historical segment numbers for the life sciences and diagnostics segment has been recast to conform to this new reporting structure in our financial statements.respective industry requirements.
A significant portion of the segments' expenses arise from shared services and infrastructure that we have historically provided to the segments in order to realize economies of scale and to efficiently use resources. These expenses, collectively called corporate charges, include costs of centralized research and development, legal, accounting, real estate, insurance services, information technology services, treasury, and other corporate infrastructure expenses.expenses and costs of centralized research and development. Charges are allocated to the segments, and the allocations have been determined on a basis that we consider to be a reasonable reflection of the utilization of services provided to or benefits received by the segments. Beginning in fiscal year 2012, we created the Agilent Order Fulfillment ("AOF") organizationCorporate charges previously allocated to centralize all order fulfillment and supply organizations and operations. AOF provides resources for manufacturing, engineering, strategic sourcing and logistics to life sciences, chemical analysis andour electronic measurement businesses.business, but not classified within discontinued operations, were not reallocated to our other segments. These charges are presented below as a component of the reconciliation between segments' income from operations and Agilent's income from continuing operations and are classified as unallocated corporate charges. In general, AOF employees are dedicatedaddition, we do not allocate amortization and impairment of acquisition-related intangible assets, restructuring and transformational expenses, acquisition and integration costs and certain other charges to specific businesses and the associated costs are directly allocated to businesses.operating margin for each segment because management does not include this information in its measurement of the performance of the operating segments.
The following tables reflect the results of our reportable segments under our management reporting system. These results are not necessarily in conformity with U.S. GAAP. The performance of each segment is measured based on several metrics,
including adjustedsegment income from operations. These results are used, in part, by the chief operating decision maker in evaluating the performance of, and in allocating resources to, each of the segments.
The profitability of each of the segments is measured after excluding restructuring and asset impairment charges, investment gains and losses, interest income, interest expense, acquisition and integration costs, one-time and pre-separation costs, non-cash amortization and other items as noted in the reconciliations below.
| | | | Life Sciences and Diagnostics | | Chemical Analysis | | Electronic Measurement | | Total Segments | Life Sciences and Applied Markets | | Diagnostics and Genomics | | Agilent CrossLab | | Total Segments |
| | (in millions) | (in millions) |
| Year ended October 31, 2013: | | | | | | | | |
| Year ended October 31, 2016: | | | | | | | | |
| Total net revenue | $ | 2,300 |
| | $ | 1,594 |
| | $ | 2,888 |
| | $ | 6,782 |
| $ | 2,073 |
| | $ | 709 |
| | $ | 1,420 |
| | $ | 4,202 |
|
| Income from operations | $ | 377 |
| | $ | 355 |
| | $ | 544 |
| | $ | 1,276 |
| $ | 429 |
| | $ | 114 |
| | $ | 316 |
| | $ | 859 |
|
| Depreciation expense | $ | 71 |
| | $ | 27 |
| | $ | 83 |
| | $ | 181 |
| $ | 36 |
| | $ | 31 |
| | $ | 28 |
| | $ | 95 |
|
| Share-based compensation expense | $ | 26 |
| | $ | 21 |
| | $ | 38 |
| | $ | 85 |
| $ | 29 |
| | $ | 10 |
| | $ | 21 |
| | $ | 60 |
|
| Year ended October 31, 2012: | | | | | | | | |
| Year ended October 31, 2015: | | | | | | | | |
| Total net revenue | $ | 1,984 |
| | $ | 1,559 |
| | $ | 3,315 |
| | $ | 6,858 |
| $ | 2,046 |
| | $ | 662 |
| | $ | 1,330 |
| | $ | 4,038 |
|
| Income from operations | $ | 295 |
| | $ | 338 |
| | $ | 751 |
| | $ | 1,384 |
| $ | 380 |
| | $ | 88 |
| | $ | 299 |
| | $ | 767 |
|
| Depreciation expense | $ | 57 |
| | $ | 31 |
| | $ | 83 |
| | $ | 171 |
| $ | 27 |
| | $ | 37 |
| | $ | 34 |
| | $ | 98 |
|
| Share-based compensation expense | $ | 21 |
| | $ | 18 |
| | $ | 37 |
| | $ | 76 |
| $ | 27 |
| | $ | 9 |
| | $ | 18 |
| | $ | 54 |
|
| Year ended October 31, 2011: | | | | | | | | |
| Total segment revenue | $ | 1,792 |
| | $ | 1,518 |
| | $ | 3,316 |
| | $ | 6,626 |
| |
| Varian acquisition deferred revenue fair value adjustment | $ | (4 | ) | | $ | (7 | ) | | — |
| | $ | (11 | ) | |
| Year ended October 31, 2014: | | | | | | | | |
| Total net revenue | $ | 1,788 |
| | $ | 1,511 |
| | $ | 3,316 |
| | $ | 6,615 |
| $ | 2,078 |
| | $ | 663 |
| | $ | 1,307 |
| | $ | 4,048 |
|
| Income from operations | $ | 237 |
| | $ | 313 |
| | $ | 760 |
| | $ | 1,310 |
| $ | 369 |
| | $ | 93 |
| | $ | 301 |
| | $ | 763 |
|
| Depreciation expense | $ | 39 |
| | $ | 28 |
| | $ | 75 |
| | $ | 142 |
| $ | 29 |
| | $ | 43 |
| | $ | 33 |
| | $ | 105 |
|
| Share-based compensation expense | $ | 20 |
| | $ | 17 |
| | $ | 36 |
| | $ | 73 |
| $ | 29 |
| | $ | 9 |
| | $ | 18 |
| | $ | 56 |
|
For the year ended October 31, 2014, depreciation expense and share-based compensation expense excludes unallocated corporate charges.
The following table reconciles reportable segments' income from operations to Agilent's total enterprise income before taxes:
| | | | Years Ended October 31, | Years Ended October 31, |
| | 2013 | | 2012 | | 2011 | 2016 | | 2015 | | 2014 |
| | (in millions) | (in millions) |
| Total reportable segments' income from operations | $ | 1,276 |
| | $ | 1,384 |
| | $ | 1,310 |
| $ | 859 |
| | $ | 767 |
| | $ | 763 |
|
| Restructuring related costs | (53 | ) | | — |
| | (2 | ) | |
| Acceleration of depreciation for held and used assets | — |
| | (15 | ) | | — |
| |
| Restructuring and business exit related costs | | (11 | ) | | (12 | ) | | (66 | ) |
| Asset Impairments | (3 | ) | | (1 | ) | | (9 | ) | (4 | ) | | (3 | ) | | (4 | ) |
| Transformational programs | (19 | ) | | (25 | ) | | (51 | ) | (38 | ) | | (56 | ) | | (29 | ) |
| Amortization of intangibles | (199 | ) | | (136 | ) | | (113 | ) | (152 | ) | | (156 | ) | | (189 | ) |
| Acquisition and integration costs | (29 | ) | | (74 | ) | | (54 | ) | (41 | ) | | (13 | ) | | (11 | ) |
| Acceleration of share-based compensation expense related to workforce reduction | (3 | ) | | — |
| | — |
| — |
| | (2 | ) | | (1 | ) |
| One-time and pre-separation costs | (5 | ) | | — |
| | — |
| — |
| | — |
| | (14 | ) |
| Varian acquisition related fair value adjustments | — |
| | — |
| | (9 | ) | |
| Pension curtailment gain | | 16 |
| | — |
| | — |
|
| Impairment of loans | | (7 | ) | | — |
| | — |
|
| Other | (14 | ) | | (14 | ) | | (1 | ) | (7 | ) | | (3 | ) | | 10 |
|
| Interest Income | 7 |
| | 9 |
| | 14 |
| 11 |
| | 7 |
| | 9 |
|
| Interest Expense | (107 | ) | | (101 | ) | | (86 | ) | (72 | ) | | (66 | ) | | (110 | ) |
| Other income (expense), net | 8 |
| | 16 |
| | 33 |
| (10 | ) | | 17 |
| | (89 | ) |
| Unallocated corporate charges | | — |
| | — |
| | (40 | ) |
| Income before taxes, as reported | $ | 859 |
| | $ | 1,043 |
| | $ | 1,032 |
| $ | 544 |
| | $ | 480 |
| | $ | 229 |
|
Major customers. No customer represented 10 percent or more of our total net revenue in 2013, 20122016, 2015 or 2011.2014.
The following table presents assets and capital expenditures directly managed by each segment. Unallocated assets primarily consist of cash, cash equivalents, accumulated amortization of other intangibles and other assets.
| | | | Life Sciences and Diagnostics | | Chemical Analysis | | Electronic Measurement | | Total Segments | Life Sciences and Applied Markets | | Diagnostics and Genomics | | Agilent CrossLab | | Total Segments |
| | (in millions) | (in millions) |
| As of October 31, 2013: | | | | | | | | |
| As of October 31, 2016: | | | | | | | | |
| Assets | $ | 4,291 |
| | $ | 1,756 |
| | $ | 1,997 |
| | $ | 8,044 |
| $ | 1,687 |
| | $ | 1,960 |
| | $ | 1,082 |
| | $ | 4,729 |
|
| Capital expenditures | $ | 77 |
| | $ | 30 |
| | $ | 88 |
| | $ | 195 |
| $ | 53 |
| | $ | 41 |
| | $ | 45 |
| | $ | 139 |
|
| As of October 31, 2012: | | | | | | | | |
| As of October 31, 2015: | | | | | | | | |
| Assets | $ | 4,072 |
| | $ | 1,768 |
| | $ | 2,157 |
| | $ | 7,997 |
| $ | 1,539 |
| | $ | 2,027 |
| | $ | 1,008 |
| | $ | 4,574 |
|
| Capital expenditures | $ | 56 |
| | $ | 32 |
| | $ | 106 |
| | $ | 194 |
| $ | 28 |
| | $ | 33 |
| | $ | 37 |
| | $ | 98 |
|
The following table reconciles segment assets to Agilent's total assets:
| | | | October 31, | October 31, |
| | 2013 | | 2012 | 2016 | | 2015 |
| | (in millions) | (in millions) |
| Total reportable segments' assets | $ | 8,044 |
| | $ | 7,997 |
| $ | 4,729 |
| | $ | 4,574 |
|
| Cash, cash equivalents and short-term investments | 2,675 |
| | 2,351 |
| 2,289 |
| | 2,003 |
|
| Short-term restricted cash and cash equivalents | | — |
| | 242 |
|
| Prepaid expenses | 198 |
| | 128 |
| 92 |
| | 105 |
|
| Investments | 139 |
| | 109 |
| 135 |
| | 86 |
|
| Long-term and other receivables | 162 |
| | 161 |
| 92 |
| | 104 |
|
| Other | (532 | ) | | (210 | ) | 465 |
| | 365 |
|
| Total assets | $ | 10,686 |
| | $ | 10,536 |
| $ | 7,802 |
| | $ | 7,479 |
|
The other category primarily includes deferred tax assets and long-term investments which are not allocated to the segments.
The following table represents the difference between how segments report deferred taxes and intangible assets at the initial purchased amount.total revenue by product category:
|
| | | | | | | | | | | |
| | Years Ended October 31, |
| | 2016 | | 2015 | | 2014 |
| | (in millions) |
| Instrumentation | $ | 1,871 |
| | $ | 1,827 |
| | $ | 1,839 |
|
| Analytical lab services | 910 |
| | 843 |
| | 831 |
|
| Analytical lab consumables | 510 |
| | 489 |
| | 476 |
|
| Diagnostics and genomics solutions | 709 |
| | 662 |
| | 663 |
|
| Informatics and other | 202 |
| | 217 |
| | 239 |
|
| Total | $ | 4,202 |
| | $ | 4,038 |
| | $ | 4,048 |
|
The following table presents summarized information for net revenue and long-lived assets by geographic region. Revenues from external customers are generally attributed to countries based upon the location of the Agilent sales representative.customer's location. Long lived assets consist of property, plant, and equipment, long-term receivables and other long-term assets excluding intangible assets. The rest of the world primarily consists of rest of Asia and Europe.
|
| | | | | | | | | | | | | | | | | | | |
| | United States | | China | | Japan | | Rest of the World | | Total |
| | (in millions) |
| Net revenue: | | | | | | | | | |
| Year ended October 31, 2013 | $ | 2,043 |
| | $ | 1,131 |
| | $ | 628 |
| | $ | 2,980 |
| | $ | 6,782 |
|
| Year ended October 31, 2012 | $ | 2,218 |
| | $ | 1,078 |
| | $ | 716 |
| | $ | 2,846 |
| | $ | 6,858 |
|
| Year ended October 31, 2011 | $ | 2,016 |
| | $ | 1,035 |
| | $ | 700 |
| | $ | 2,864 |
| | $ | 6,615 |
|
|
| | | | | | | | | | | | | | | |
| | United States | | China | | Rest of the World | | Total |
| | (in millions) |
| Net revenue: | | | | | | | |
| Year ended October 31, 2016 | $ | 1,251 |
| | $ | 821 |
| | $ | 2,130 |
| | $ | 4,202 |
|
| Year ended October 31, 2015 | $ | 1,206 |
| | $ | 633 |
| | $ | 2,199 |
| | $ | 4,038 |
|
| Year ended October 31, 2014 | $ | 1,019 |
| | $ | 543 |
| | $ | 2,486 |
| | $ | 4,048 |
|
|
| | | | | | | | | | | | | | | |
| | United States | | Japan | | Rest of the World | | Total |
| | (in millions) |
| Long-lived assets: | | | | | | | |
| October 31, 2013 | $ | 601 |
| | $ | 130 |
| | $ | 715 |
| | $ | 1,446 |
|
| October 31, 2012 | $ | 550 |
| | $ | 167 |
| | $ | 645 |
| | $ | 1,362 |
|
|
| | | | | | | | | | | | | | | |
| | United States | | Germany | | Rest of the World | | Total |
| | (in millions) |
| Long-lived assets: | | | | | | | |
| October 31, 2016 | $ | 449 |
| | $ | 89 |
| | $ | 266 |
| | $ | 804 |
|
| October 31, 2015 | $ | 391 |
| | $ | 64 |
| | $ | 315 |
| | $ | 770 |
|
20. SUBSEQUENT EVENT
On December 19, 2016 we signed an agreement to acquire 100 percent of the stock of Multiplicom NV (“Multiplicom”), a leading European diagnostics company with state-of-the-art genetic testing technology and products, for approximately €68 million in cash. Multiplicom, headquartered in Belgium, develops, manufactures and commercializes molecular diagnostic assays, provided as kits, which enable personalized medicine. The acquisition is expected to be completed by mid-January, subject to local laws and regulations and customary closing conditions. The financial results of Multiplicom will be included within Agilent's from the date of the close, which is expected to be during the first quarter of 2017.
QUARTERLY SUMMARY
(Unaudited)
| | | | Three Months Ended | Three Months Ended |
| | January 31, | | April 30, | | July 31, | | October 31, | January 31, (As Adjusted) | | April 30, | | July 31, | | October 31, |
| | (in millions, except per share data) | (in millions, except per share data) |
| 2013 | | | | | | |
| |
| 2016 | | | | | | | |
|
| Net revenue | $ | 1,680 |
| | $ | 1,732 |
| | $ | 1,652 |
| | $ | 1,718 |
| $ | 1,028 |
| | $ | 1,019 |
| | $ | 1,044 |
| | $ | 1,111 |
|
| Gross profit | 880 |
| | 891 |
| | 856 |
| | 908 |
| 537 |
| | 530 |
| | 542 |
| | 588 |
|
| Income from operations | 217 |
| | 213 |
| | 236 |
| | 285 |
| 155 |
| | 131 |
| | 146 |
| | 183 |
|
| Income from continuing operations | | 121 |
| | 91 |
| | 124 |
| | 126 |
|
| Loss from discontinued operations, net of tax | | — |
| | — |
| | — |
| | — |
|
| Net income | $ | 179 |
| | $ | 166 |
| | $ | 168 |
| | $ | 211 |
| $ | 121 |
| | $ | 91 |
| | $ | 124 |
| | $ | 126 |
|
| Net income per share — Basic: | $ | 0.52 |
| | $ | 0.48 |
| | $ | 0.50 |
| | $ | 0.64 |
| |
| Net income per share — Diluted: | $ | 0.51 |
| | $ | 0.48 |
| | $ | 0.49 |
| | $ | 0.63 |
| |
| Net income per share — basic: | | | | | | | | |
| Income from continuing operations | | $ | 0.37 |
| | $ | 0.28 |
| | $ | 0.38 |
| | $ | 0.39 |
|
| Loss from discontinued operations | | — |
| | $ | — |
| | $ | — |
| | $ | — |
|
| Net income per share - basic | | $ | 0.37 |
| | $ | 0.28 |
| | $ | 0.38 |
| | $ | 0.39 |
|
| Net income per share — diluted: | | | | | | | | |
| Income from continuing operations | | $ | 0.36 |
| | $ | 0.28 |
| | $ | 0.38 |
| | $ | 0.38 |
|
| Loss from discontinued operations | | — |
| | — |
| | — |
| | — |
|
| Net income per share — diluted | | $ | 0.36 |
| | $ | 0.28 |
| | $ | 0.38 |
| | $ | 0.38 |
|
| Weighted average shares used in computing net income per share: | | | | | | | | | | | | | | |
| Basic | 347 |
| | 345 |
| | 339 |
| | 331 |
| 329 |
| | 326 |
| | 325 |
| | 324 |
|
| Diluted | 352 |
| | 349 |
| | 343 |
| | 336 |
| 332 |
| | 328 |
| | 328 |
| | 328 |
|
| Cash dividends per common share | $ | 0.22 |
| | $ | — |
| | $ | 0.12 |
| | $ | 0.12 |
| $ | 0.115 |
| | $ | 0.115 |
| | $ | 0.115 |
| | $ | 0.115 |
|
| Range of stock prices on NYSE | $ 35.45-45.55 |
| | $ 40.19-45.66 |
| | $ 41.24-47.47 |
| | $ 45.32-53.47 |
| $36.01-$42.48 |
| | $34.15-$42.00 |
| | $40.39-$48.18 |
| | $43.11-$48.63 |
|
| 2012 (1) | | | | | | | | |
| 2015 | | | | | | | | |
| Net revenue | $ | 1,635 |
| | $ | 1,733 |
| | $ | 1,723 |
| | $ | 1,767 |
| $ | 1,026 |
| | $ | 963 |
| | $ | 1,014 |
| | $ | 1,035 |
|
| Gross profit | 874 |
| | 918 |
| | 890 |
| | 922 |
| 513 |
| | 480 |
| | 513 |
| | 535 |
|
| Income from operations | 271 |
| | 300 |
| | 270 |
| | 278 |
| 115 |
| | 107 |
| | 144 |
| | 156 |
|
| Income from continuing operations | | 93 |
| | 92 |
| | 113 |
| | 140 |
|
| Income from discontinued operations, net of tax | | (30 | ) | | (5 | ) | | (2 | ) | | — |
|
| Net income | $ | 230 |
| | $ | 255 |
| | $ | 243 |
| | $ | 425 |
| $ | 63 |
| | $ | 87 |
| | $ | 111 |
| | $ | 140 |
|
| Net income per share — Basic: | $ | 0.66 |
| | $ | 0.73 |
| | $ | 0.70 |
| | $ | 1.22 |
| |
| Net income per share — Diluted: | $ | 0.65 |
| | $ | 0.72 |
| | $ | 0.69 |
| | $ | 1.20 |
| |
| Net income per share — basic: | | | | | | | | |
| Income from continuing operations | | $ | 0.28 |
| | $ | 0.28 |
| | $ | 0.34 |
| | $ | 0.42 |
|
| Income from discontinued operations | | (0.09 | ) | | (0.02 | ) | | (0.01 | ) | | — |
|
| Net income per share - basic | | $ | 0.19 |
| | $ | 0.26 |
| | $ | 0.33 |
| | $ | 0.42 |
|
| Net income per share — diluted: | | | | | | | | |
| Income from continuing operations | | $ | 0.28 |
| | $ | 0.27 |
| | $ | 0.34 |
| | $ | 0.42 |
|
| Income from discontinued operations | | (0.09 | ) | | (0.01 | ) | | (0.01 | ) | | — |
|
| Net income per share — diluted | | $ | 0.19 |
| | $ | 0.26 |
| | $ | 0.33 |
| | $ | 0.42 |
|
| Weighted average shares used in computing net income per share: | | | | | | | | | | | | | | |
| Basic | 348 |
| | 348 |
| | 348 |
| | 348 |
| 336 |
| | 334 |
| | 332 |
| | 331 |
|
| Diluted | 352 |
| | 354 |
| | 353 |
| | 353 |
| 338 |
| | 337 |
| | 334 |
| | 333 |
|
| Cash dividends per common share | $ | 0.10 |
| | $ | — |
| | $ | 0.10 |
| | $ | 0.10 |
| $ | 0.100 |
| | $ | 0.100 |
| | $ | 0.100 |
| | $ | 0.100 |
|
| Range of stock prices on NYSE | $ 32.51-44.85 |
| | $ 39.15-46.28 |
| | $ 35.32-43.27 |
| | $ 35.38-40.97 |
| $37.68-$42.99 |
| | $37.71-$43.59 |
| | $38.48-$42.93 |
| | $33.12-$41.35 |
|
| (1) Consolidated financial data includes Dako acquired, acquired on June 21, 2012, and non-recurring tax benefit relating to the U.S. valuation allowance reversal in the fourth quarter of 2012 of $280 million. | |
The above quarterly financial data includes Keysight which is presented as discontinued operations. See Note 3, "Discontinued Operations" for additional information. In addition, the first quarter of fiscal year 2016 has been adjusted to include an additional $2 million of tax expense as a result of our early adoption of Accounting Standard Update (ASU) 2016-09 "Improvements to Employees Share-based Payment Accounting", in the third quarter of fiscal year 2016. Please refer to Note 2, "New Accounting Pronouncements."
105
Item 9. Changes in and Disagreements with Accountants on Accounting and Financial Disclosure
None.
Item 9A. Controls and Procedures
Evaluation of Disclosure Controls and Procedures
Our management has evaluated, under the supervision and with the participation of our Chief Executive Officer and Chief Financial Officer, the effectiveness of our disclosure controls and procedures as of October 31, 2013,2016, pursuant to and as required by Rule 13a-15(b) under the Securities Exchange Act of 1934 (“Exchange Act”). Based on that evaluation, our Chief Executive Officer and Chief Financial Officer have concluded that, as of October 31, 2013,2016, the company's disclosure controls and procedures, as defined by Rule 13a-15(e) under the Exchange Act, were effective and designed to ensure that (i) information required to be disclosed in the company's reports filed under the Exchange Act is recorded, processed, summarized and reported within the time periods specified in the SEC's rules and forms, and (ii) information is accumulated and communicated to management, including the Chief Executive Officer and Chief Financial Officer, as appropriate to allow timely decisions regarding required disclosures.
Management's Report on Internal Control overOver Financial Reporting
Our management is responsible for establishing and maintaining adequate internal control over financial reporting, as such term is defined in Exchange Act Rule 13a-15(f). Under the supervision and with the participation of our management, including our Chief Executive Officer and Chief Financial Officer, we conducted an evaluation ofassessed the effectiveness of our internal control over financial reporting based on the framework in Internal Control - Integrated Framework (1992)(2013) issued by the Committee of Sponsoring Organizations of the Treadway Commission. Based on the resultsCommission ("COSO"). As a result of this evaluation, ourthat assessment, management concluded that our internal control over financial reporting was effective as of October 31, 2013.2016 based on criteria in Internal Control - Integrated Framework (2013) issued by the COSO.
The effectiveness of our internal control over financial reporting as of October 31, 20132016 has been audited by PricewaterhouseCoopers LLP, an independent registered public accounting firm, as stated in their report which appears in Item 8 of this Annual Report on Form 10-K.
Remediation of Material Weakness in Internal Control Over Financial Reporting
During the year ended October 31, 2015, management identified certain errors in the tax accounts, primarily related to prior years, and disclosed a material weakness in our controls over the accounting for income taxes.
To remediate the material weakness described above, during fiscal 2016, we designed and implemented additional rigorous reviews and other controls and enhanced and revised the design of existing controls and procedures to validate the inputs and outputs for the significant tax accounting processes, as well as enhancing the tax accounting expertise within the tax function. During the fourth quarter of fiscal 2016, we successfully completed the testing necessary to conclude that the controls were operating effectively and have concluded that the material weakness has been remediated.
Changes in Internal Control Over Financial Reporting
There were no changes in our internal control over financial reporting that occurred during Agilent's last fiscal quarter that have materially affected, or are reasonably likely to materially affect, our internal control over financial reporting.
Item 9B. Other Information
None.
PART III
Item 10. Directors, Executive Officers and Corporate Governance
Information regarding our directors appears under “Proposal No. 1 - Election of Directors” in our Proxy Statement for the Annual Meeting of Stockholders (“Proxy Statement”), to be held March 19, 2014.15, 2017. That portion of the Proxy Statement is
incorporated by reference into this report. Information regarding our executive officers appears in Item 1 of this report under “Executive Officers of the Registrant.” Information regarding our Audit and Finance Committee and our Audit and Finance Committee's financial expert appears under “Audit and Finance Committee Report” and “Board Structure and Compensation” in our Proxy Statement. That portion of the Proxy Statement is incorporated by reference into this report.
There were no material changes to the procedures by which security holders may recommend nominees to our Board of Directors. Information regarding our code of ethics (the company's Standards of Business Conduct) applicable to our principal executive officer, our principal financial officer, our controller and other senior financial officers appears in Item 1 of this report under “Investor Information.” We will post amendments to or waivers from a provision of the Standards of Business Conduct with respect to those persons on our website at www.investor.agilent.com.
Compliance with Section 16(a) of the Exchange Act
Information about compliance with Section 16(a) of the Exchange Act appears under “Section 16(a) Beneficial Ownership Reporting Compliance” in the Proxy Statement. That portion of the Proxy Statement is incorporated by reference into this report.
Item 11. Executive Compensation
Information about compensation of our named executive officers appears under “Executive Compensation”, “Compensation Committee Interlocks and Insider Participation” in the Proxy Statement. Information about compensation of our directors appears under “Director Compensation” and “Compensation Committee Report” and “Stock Ownership Guidelines” in the Proxy Statement. Those portions of the Proxy Statement are incorporated by reference into this report.
Item 12. Security Ownership of Certain Beneficial Owners and Management and Related Stockholder Matters
Information about security ownership of certain beneficial owners and management appears under "Common Stock Ownership of Certain Beneficial Owners and Management" in the Proxy Statement. That portion of the Proxy Statement is incorporated by reference into this report.
EQUITY COMPENSATION PLAN INFORMATION
The following table summarizes information about our equity compensation plans as of October 31, 20132016. All outstanding awards relate to our common stock.
| | | Plan Category | Number of Securities to be Issued upon Exercise of Outstanding Options, Warrants and Rights | | Weighted-average Exercise Price of Outstanding Options, Warrants and Rights | | Number of Securities Remaining Available for Future Issuance under Equity Compensation Plans (Excluding Securities Reflected in Column (a)) | Number of Securities to be Issued upon Exercise of Outstanding Options, Warrants and Rights | | Weighted-average Exercise Price of Outstanding Options, Warrants and Rights | | Number of Securities Remaining Available for Future Issuance under Equity Compensation Plans (Excluding Securities Reflected in Column (a)) |
| | (a) | | (b) | | (c) | (a) | | (b) | | (c) |
| Equity compensation plans approved by security holders (1)(2)(3) | 13,155,214 |
| | $ | 32 |
| | 50,231,877 |
| 7,168,592 |
| | $ | 33 |
| | 55,484,274 |
|
| Equity compensation plans not approved by security holders | — |
| | — |
| | — |
| — |
| | — |
| | — |
|
| Total | 13,155,214 |
| | $ | 32 |
| | 50,231,877 |
| 7,168,592 |
| | $ | 33 |
| | 55,484,274 |
|
| |
| (1) | The number of securities remaining available for future issuance in column (c) includes 37,709,69245,168,192 shares of common stock authorized and available for issuance under the Agilent Technologies, Inc. Employee Stock Purchase Plan ("423(b) Plan"). The number of shares authorized for issuance under the 423(b) Plan is subject to an automatic annual increase of the lesser of one percent of the outstanding common stock of Agilent or an amount determined by the Compensation Committee of our Board of Directors. Under the terms of the 423(b) Plan, in no event shall the aggregate number of shares issued under the Plan exceed 75 million shares. |
Committee of our Board of Directors. Under the terms of the 423(b) Plan, in no event shall the aggregate number of shares issued under the Plan exceed 75 million shares. The number of securities to be issued upon exercise of outstanding options, warrants and rights in column (a) does not include shares of common stock issued to participants in consideration of the aggregate participant contributions under the 423(b) Plan totaling $23 million as of October 31, 2013.
| |
| (2) | We issue securities under our equity compensation plans in forms other than options, warrants or rights. On November 19, 2008 and March 11, 2009, the Board and the stockholders, respectively, approved the Agilent Technologies, Inc. 2009 Stock Plan ("2009 Plan") to replace the company's 1999 Plan and 1999 Non-Employee Director Stock Plan for awards of stock-based incentive compensation to our employees (including officers), directors and consultants. The 2009 Plan provides for the grant of awards in the form of stock options, stock appreciation rights, restricted stock, restricted stock units, performance shares and performance units with performance-based conditions to vesting or exercisability, and cash awards. The 2009 Plan has a term of ten years. |
the grant of awards in the form of stock options, stock appreciation rights, restricted stock, restricted stock units, performance shares and performance units with performance-based conditions to vesting or exercisability, and cash awards. The 2009 Plan has a term of ten years.
| |
| (3) | We issue securities under our equity compensation plans in forms which do not require a payment by the recipient to us at the time of exercise or vesting, including restricted stock, restricted stock units and performance units. Accordingly, the weighted-average exercise price in column (b) does not take these awards into account. |
Item 13. Certain Relationships and Related Transactions, and Director Independence
Information about certain relationships and related transactions appears under "Related Person Transaction Policy and Procedures" in the Proxy Statement. Information about director independence appears under the heading "Board Structure and Compensation — Director Independence" in the Proxy Statement. Each of those portions of the Proxy Statement is incorporated by reference into this report.
Item 14. Principal Accounting Fees and Services
Information about principal accountant fees and services as well as related pre-approval policies appears under "Fees Paid to PricewaterhouseCoopers" and "Policy on Audit and Finance Committee Preapproval of Audit and Permissible Non-Audit Services of Independent Registered Auditors" in the Proxy Statement. Those portions of the Proxy Statement are incorporated by reference into this report.
PART IV
Item 15. Exhibits and Financial Statement Schedules
| |
| (a) | The following documents are filed as part of this report: |
See Index to Consolidated Financial Statements under Item 8 on Page 5351 of this report.
| |
| 2. | Financial Statement Schedule. |
The following additional financial statement schedule should be considered in conjunction with our consolidated financial statements. All other schedules have been omitted because the required information is either not applicable or not sufficiently material to require submission of the schedule:
SCHEDULE II
SCHEDULE II
VALUATION AND QUALIFYING ACCOUNTS
| | | Column A | | Column B | | Column C | | Column D | | Column E | | Column B | | Column C | | Column D | | Column E |
| Description | | Balance at
Beginning
of Period | | Additions Charged to
Expenses or
Other Accounts* | | Deductions Credited to Expenses or Other Accounts** | | Balance at
End of
Period | | Balance at
Beginning
of Period | | Additions Charged to
Expenses or
Other Accounts* | | Deductions Credited to Expenses or Other Accounts** | | Balance at
End of
Period |
| | | (in millions) | | (in millions) |
| 2013 | | | | | | | | | |
| 2016 | | | | | | | | | |
| Tax valuation allowance | | $ | 93 |
| | $ | — |
| | $ | (8 | ) | | $ | 85 |
| | $ | 131 |
| | $ | 22 |
| | $ | (24 | ) | | $ | 129 |
|
| 2012 | | | | | | | | | |
| 2015 | | | | | | | | | |
| Tax valuation allowance | | $ | 369 |
| | $ | 4 |
| | $ | (280 | ) | | $ | 93 |
| | $ | 134 |
| | $ | 6 |
| | $ | (9 | ) | | $ | 131 |
|
| 2011 | | | | | | | | | |
| 2014 | | | | | | | | | |
| Tax valuation allowance | | $ | 527 |
| | $ | 3 |
| | $ | (161 | ) | | $ | 369 |
| | $ | 131 |
| | $ | 3 |
| | $ | — |
| | $ | 134 |
|
* Additions include current year additions charged to expenses and current year build due to increases in net deferred tax assets, return to provision true-ups, other adjustments and OCI impact to deferred taxes.
** Deductions include current year releases credited to expenses and current year reductions due to decreases in net deferred tax assets, return to provision true-ups, other adjustments and OCI impact to deferred taxes. For 2012, the amount reflects the reversal of the valuation allowance for most of our U.S. federal and state deferred tax assets since management concluded that it is more likely than not that these deferred tax assets will be realized primarily due to the emergence from cumulative losses in recent years, the return to sustainable U.S. operating profits and the expectation of sustainable profitability in future periods.
Exhibits are incorporated herein by reference or are filed with this report as indicated below (numbered in accordance with Item 601 of Regulation S-K):
| | | | | | Incorporation by Reference | | | | | | | | | | |
Exhibit Number | Exhibit Number | | Description | | Form | | Date | | Exhibit Number | | Filed Herewith | Exhibit Number | | Description | | Form | �� | Date | | Exhibit Number | | Filed Herewith |
| | | | |
| 2.1 |
| | Master Separation and Distribution Agreement between Hewlett‑Packard and Agilent Technologies, Inc., effective as of August 12, 1999. | | S-1/A | | 11/10/1999 | | 2.1 | |
| | Master Separation and Distribution Agreement between Hewlett‑Packard and Agilent Technologies, Inc., effective as of August 12, 1999. | | S-1/A | | 11/10/1999 | | 2.1 | |
| | | | |
| 2.2 |
| | General Assignment and Assumption Agreement between Hewlett‑Packard and Agilent Technologies, Inc. | | S-1/A | | 11/10/1999 | | 2.2 | |
| | General Assignment and Assumption Agreement between Hewlett‑Packard and Agilent Technologies, Inc. | | S-1/A | | 11/10/1999 | | 2.2 | |
| | | | |
| 2.3 |
| | Master Technology Ownership and License Agreement between Hewlett‑Packard and Agilent Technologies, Inc. | | S-1/A | | 11/10/1999 | | 2.3 | |
| | Master Technology Ownership and License Agreement between Hewlett‑Packard and Agilent Technologies, Inc. | | S-1/A | | 11/10/1999 | | 2.3 | |
| | | | |
| 2.4 |
| | Master Patent Ownership and License Agreement between Hewlett‑Packard and Agilent Technologies, Inc. | | S-1/A | | 11/10/1999 | | 2.4 | |
| | Master Patent Ownership and License Agreement between Hewlett‑Packard and Agilent Technologies, Inc. | | S-1/A | | 11/10/1999 | | 2.4 | |
| | | | |
| 2.5 |
| | Master Trademark Ownership and License Agreement between Hewlett‑Packard and Agilent Technologies, Inc. | | S-1/A | | 11/10/1999 | | 2.5 | |
| | Master Trademark Ownership and License Agreement between Hewlett‑Packard and Agilent Technologies, Inc. | | S-1/A | | 11/10/1999 | | 2.5 | |
| | | | |
| 2.6 |
| | ICBD Technology Ownership and License Agreement between Hewlett‑Packard and Agilent Technologies, Inc. | | S-1/A | | 11/10/1999 | | 2.6 | |
| | ICBD Technology Ownership and License Agreement between Hewlett‑Packard and Agilent Technologies, Inc. | | S-1/A | | 11/10/1999 | | 2.6 | |
| | | | |
| 2.7 |
| | Employee Matters Agreement between Hewlett‑Packard and Agilent Technologies, Inc. | | S-1/A | | 11/10/1999 | | 2.7 | |
| | Employee Matters Agreement between Hewlett‑Packard and Agilent Technologies, Inc. | | S-1/A | | 11/10/1999 | | 2.7 | |
| | | | |
| 2.8 |
| | Tax Sharing Agreement between Hewlett‑Packard and Agilent Technologies, Inc. | | S-1/A | | 11/10/1999 | | 2.8 | |
| | Tax Sharing Agreement between Hewlett‑Packard and Agilent Technologies, Inc. | | S-1/A | | 11/10/1999 | | 2.8 | |
| | | | |
| 2.9 |
| | Master IT Service Level Agreement between Hewlett‑Packard and Agilent Technologies, Inc. | | S-1/A | | 11/10/1999 | | 2.9 | |
| | Master IT Service Level Agreement between Hewlett‑Packard and Agilent Technologies, Inc. | | S-1/A | | 11/10/1999 | | 2.9 | |
| | | | |
| 2.10 |
| | Real Estate Matters Agreement between Hewlett‑Packard and Agilent Technologies, Inc. | | S-1/A | | 11/10/1999 | | 2.10 | |
| | Real Estate Matters Agreement between Hewlett‑Packard and Agilent Technologies, Inc. | | S-1/A | | 11/10/1999 | | 2.10 | |
| | | | |
| 2.11 |
| | Environmental Matters Agreement between Hewlett‑Packard and Agilent Technologies, Inc. | | S-1/A | | 11/10/1999 | | 2.11 | |
| | Environmental Matters Agreement between Hewlett‑Packard and Agilent Technologies, Inc. | | S-1/A | | 11/10/1999 | | 2.11 | |
| | | | |
| 2.12 |
| | Master Confidential Disclosure Agreement between Hewlett‑Packard and Agilent Technologies, Inc. | | S-1/A | | 11/10/1999 | | 2.12 | |
| | Master Confidential Disclosure Agreement between Hewlett‑Packard and Agilent Technologies, Inc. | | S-1/A | | 11/10/1999 | | 2.12 | |
| | | | |
| 2.13 |
| | Indemnification and Insurance Matters Agreement between Hewlett‑Packard and Agilent Technologies, Inc. | | S-1/A | | 11/10/1999 | | 2.13 | |
| | Indemnification and Insurance Matters Agreement between Hewlett‑Packard and Agilent Technologies, Inc. | | S-1/A | | 11/10/1999 | | 2.13 | |
| | | | |
| 2.14 |
| | Non U.S. Plan. | | S-1/A | | 11/10/1999 | | 2.14 | |
| | Non U.S. Plan. | | S-1/A | | 11/10/1999 | | 2.14 | |
| | | | |
| 2.15 |
| | Share Purchase Agreement, dated as of August 12, 2005, by and among Agilent Technologies, Inc. and Agilent LED International, Philips Lumileds Holding B.V. and Koninklijke Philips Electronics N.V. | | 8-K | | 8/15/2005 | | 2.2 | |
| | Share Purchase Agreement, dated as of August 12, 2005, by and among Agilent Technologies, Inc. and Agilent LED International, Philips Lumileds Holding B.V. and Koninklijke Philips Electronics N.V. | | 8-K | | 8/15/2005 | | 2.2 | |
| | | | |
| 2.16 |
| | Agreement and Plan of Merger dated as of July 26, 2009, by and among Agilent Technologies, Inc., Cobalt Acquisition Corp. and Varian, Inc. | | 10-Q | | 9/4/2009 | | 2.1 | |
| | Agreement and Plan of Merger dated as of July 26, 2009, by and among Agilent Technologies, Inc., Cobalt Acquisition Corp. and Varian, Inc. | | 10-Q | | 9/4/2009 | | 2.1 | |
| | | | |
| 2.17 |
| | Asset Purchase Agreement, dated February 10, 2010, by and between Agilent Technologies, Inc. and JDS Uniphase Corporation (pursuant to Item 601(b)(2) of Regulation S-K, schedules to the Asset Purchase Agreement have been omitted; they will be supplementally provided to the SEC upon request) | | 10-Q | | 3/10/2010 | | 2.1 | |
| | Asset Purchase Agreement, dated February 10, 2010, by and between Agilent Technologies, Inc. and JDS Uniphase Corporation (pursuant to Item 601(b)(2) of Regulation S-K, schedules to the Asset Purchase Agreement have been omitted; they will be supplementally provided to the SEC upon request) | | 10-Q | | 3/10/2010 | | 2.1 | |
| 3.1 |
| | Amended and Restated Certificate of Incorporation. | | S-1 | | 8/16/1999 | | 3.1 | | |
| 3.2 |
| | Amended and Restated Bylaws. | | 8-K | | 11/20/2012 | | 3.1 | | |
| 4.1 |
| | Preferred Stock Rights Agreement between Agilent Technologies, Inc. and Harris Trust and Savings Bank dated as of May 12, 2000. | | 8-A12B/A | | 5/24/2000 | | 1 | | |
| | | | | |
| 2.18 | |
| | Separation and Distribution Agreement, dated August 1, 2014, by and between Agilent Technologies, Inc. and Keysight Technologies, Inc. (pursuant to Item 601(b)(2) of Regulation S-K, schedules to the Separation and Distribution Agreement have been omitted; they will be supplementally provided to the SEC upon request) | | 8-K | | 8/1/2014 | | 2.1 | |
| | | | | | Incorporation by Reference | | | Incorporation by Reference |
Exhibit Number | Exhibit Number | | Description | | Form | | Date | | Exhibit Number | | Filed Herewith | Exhibit Number | | Description | | Form | | Date | | Exhibit Number | | Filed Herewith |
| | | | |
| 3.1 | |
| | Amended and Restated Certificate of Incorporation. | | S-1 | | 8/16/1999 | | 3.1 | |
| | | | |
| 3.2 | |
| | Amended and Restated Bylaws. | | 8-K | | 11/20/2012 | | 3.1 | |
| | | | |
| 4.1 | |
| | Registration Rights Agreement between Agilent Technologies, Inc. and Credit Suisse First Boston Corporation, J.P. Morgan Securities, Inc. and Salomon Smith Barney, Inc. dated November 27, 2001. | | 8-K | | 11/27/2001 | | 99.3 | |
| | | | |
| 4.2 |
| | Registration Rights Agreement between Agilent Technologies, Inc. and Credit Suisse First Boston Corporation, J.P. Morgan Securities, Inc. and Salomon Smith Barney, Inc. dated November 27, 2001. | | 8-K | | 11/27/2001 | | 99.3 | |
| | Indenture, dated October 24, 2007, between Agilent Technologies, Inc. and the trustee for the debt securities. | | S-3ASR | | 10/24/2007 | | 4.01 | |
| | | | |
| 4.3 |
| | Indenture, dated October 24, 2007, between Agilent Technologies, Inc. and the trustee for the debt securities. | | S-3ASR | | 10/24/2007 | | 4.01 | |
| | Form of First Supplemental Indenture, dated as of October 29, 2007, between Agilent Technologies, Inc. and U.S. Bank National Association and Form of Global Note for Agilent Technologies, Inc. 6.50% Senior Notes due 2017. | | 8-K | | 10/26/2007 | | 4.01 | |
| | | | |
| 4.4 |
| | Form of First Supplemental Indenture, dated as of October 29, 2007, between Agilent Technologies, Inc. and U.S. Bank National Association and Form of Global Note for Agilent Technologies, Inc. 6.50% Senior Notes due 2017. | | 8-K | | 10/26/2007 | | 4.01 | |
| | Fifth Supplemental Indenture, dated as of July 20, 2010, between the Company and U.S. Bank National Association and Form of Global Note for the Company's 5.00% Senior Notes due 2020. | | 8-K | | 7/20/2010 | | 4.02 | |
| | | | |
| 4.5 |
| | Form of Third Supplemental Indenture, dated as of September 14, 2009, between the Company and U.S. Bank National Association and Form of Global Note for Agilent Technologies, Inc. 5.50% Senior Notes due 2015. | | 8-K | | 9/14/2009 | | 4.02 | |
| | Sixth Supplemental Indenture, dated as of September 13, 2012, between the Company and U.S. Bank National Association | | 8-K | | 9/13/2012 | | 4.01 | |
| | | | |
| 4.6 |
| | Fifth Supplemental Indenture, dated as of July 20, 2010, between the Company and U.S. Bank National Association and Form of Global Note for the Company's 5.00% Senior Notes due 2020. | | 8-K | | 7/20/2010 | | 4.02 | |
| | Form of Global Note for the Company's 3.20% Senior Notes due 2022 (contained in Exhibit 4.01) | | 8-K | | 9/13/2012 | | 4.02 | |
| | | | |
| 4.7 |
| | Sixth Supplemental Indenture, dated as of September 13, 2012, between the Company and U.S. Bank National Association | | 8-K | | 9/13/2012 | | 4.01 | |
| | Seventh Supplemental Indenture, dated as of June 21, 2013, between the Company and U.S. Bank National Association and Form of Global Note for the Company’s 3.875% Senior Notes due 2023. | | 8-K | | 6/21/2013 | | 4.01 | |
| | | | |
| 4.8 |
| | Form of Global Note for the Company's 3.20% Senior Notes due 2022 (contained in Exhibit 4.01) | | 8-K | | 9/13/2012 | | 4.02 | |
| | Eighth Supplemental Indenture, dated as of September 22, 2016, between the Company and U.S. Bank National Association and Form of Global Note for the Company’s 3.050% Senior Note due 2026 | | 8-K | | 9/22/2016 | | 4.01 | |
| 4.9 |
| | Seventh Supplemental Indenture, dated as of June 21, 2013, between the Company and U.S. Bank National Association and Form of Global Note for the Company’s 3.875% Senior Notes due 2023. | | 8-K | | 6/21/2013 | | 4.01 | | |
| | | | |
| 10.1 |
| | Agilent Technologies, Inc. 1999 Stock Plan (Amendment and Restatement Effective November 14, 2006).* | | 10-K | | 12/22/2006 | | 10.8 | |
| | Agilent Technologies, Inc. 1999 Stock Plan (Amendment and Restatement Effective November 14, 2006).* | | 10-K | | 12/22/2006 | | 10.8 | |
| | | | |
| 10.2 |
| | Form of Award Agreement (U.S.) for grants under the Agilent Technologies, Inc. 1999 Stock Plan.* | | 8-K | | 11/12/2004 | | 10.1 | |
| | Form of Award Agreement (U.S.) for grants under the Agilent Technologies, Inc. 1999 Stock Plan.* | | 8-K | | 11/12/2004 | | 10.1 | |
| | | | |
| 10.3 |
| | Form of Award Agreement (Non-U.S.) for grants under the Agilent Technologies, Inc. 1999 Stock Plan.* | | 8-K | | 11/12/2004 | | 10.2 | |
| | Form of Award Agreement (Non-U.S.) for grants under the Agilent Technologies, Inc. 1999 Stock Plan.* | | 8-K | | 11/12/2004 | | 10.2 | |
| | | | |
| 10.4 |
| | Form of Award Agreement (SAR) for grants under the Agilent Technologies, Inc. 1999 Stock Plan.* | | 10-K | | 12/21/2004 | | 10.37 | |
| | Agilent Technologies, Inc. Employee Stock Purchase Plan (Amended and Restated, effective November 1, 2008).* | | 10-Q | | 9/5/2008 | | 10.1 | |
| | | | |
| 10.5 |
| | Form of Award Agreement (restricted stock) for grants under the Agilent Technologies, Inc. 1999 Stock Plan.* | | 10-K | | 12/21/2004 | | 10.39 | |
| | Agilent Technologies, Inc. 1999 Non-Employee Director Stock Plan (Amended and Restated Effective November 14, 2007).* | | 10-K | | 12/21/2007 | | 10.23 | |
| | | | |
| 10.6 |
| | Agilent Technologies, Inc. 1999 Stock Plan Stock Award Agreement For Standard Awards Granted to Employees.* | | 10-Q | | 6/5/2007 | | 10.3 | |
| | Form of Stock Option Agreement for grants under the Agilent Technologies, Inc. 1999 Non-Employee Director Stock Plan.* | | 8-K | | 11/12/2004 | | 10.3 | |
| | | | |
| 10.7 |
| | Agilent Technologies, Inc. 1999 Stock Plan Stock Award Agreement Under The Long-Term Performance Program.* | | 10-Q | | 6/5/2007 | | 10.7 | |
| | Form of Stock Option Award Agreement for grants under the Agilent Technologies, Inc. 1999 Non-Employee Director Stock Plan.* | | 10-Q | | 9/5/2008 | | 10.2 | |
| | | | |
| 10.8 |
| | Form of Amendment to the Form of Standard Long-Term Performance Program Award Agreement for awards granted under the Agilent Technologies, Inc. Stock Plan during FY07-09 and FY 08-10.* | | 10-K | | 12/19/2008 | | 10.22 | |
| | Agilent Technologies, Inc. 2009 Stock Plan.* | | DEF14A | | 1/27/2009 | | Appendix A | |
| 10.9 |
| | Form of Standard Long-Term Performance Program Award Agreement for awards granted under the Agilent Technologies, Inc. 1999 Stock Plan.* | | 10-K | | 12/19/2008 | | 10.23 | | |
| | | |
| | | |
| | | |
| | | |
| | | | | | Incorporation by Reference | | | Incorporation by Reference |
Exhibit Number | Exhibit Number | | Description | | Form | | Date | | Exhibit Number | | Filed Herewith | Exhibit Number | | Description | | Form | | Date | | Exhibit Number | | Filed Herewith |
| 10.10 |
| | Form of Standard Stock Award Agreement for Restricted Stock Units granted under the Agilent Technologies, Inc. 1999 Stock Plan.* | | 10-K | | 12/19/2008 | | 10.24 | | |
| | | | |
| 10.9 | |
| | Form of Stock Option Award Agreement under the 2009 Stock Plan for U.S. Employees (for awards made after October 31, 2010).* | | 10‑K | | 12/20/2010 | | 10.17 | |
| | | | |
| 10.1 | |
| | Form of Stock Option Award Agreement under the 2009 Stock Plan for U.S. Employees.* | | 10-K | | 12/21/2009 | | 10.31 | |
| | | | |
| 10.11 |
| | Form of Stock Award Agreement for awards granted to New Executives under the Agilent Technologies, Inc. 1999 Stock Plan.* | | 10-K | | 12/19/2008 | | 10.25 | |
| | Form of Stock Option Award Agreement under the 2009 Stock Plan for non-U.S. Employees (for awards made after October 31, 2010).* | | 10‑K | | 12/20/2010 | | 10.19 | |
| | | | |
| 10.12 |
| | Agilent Technologies, Inc. Employee Stock Purchase Plan (Amended and Restated, effective November 1, 2008).* | | 10-Q | | 9/5/2008 | | 10.1 | |
| | Form of Stock Option Award Agreement under the 2009 Stock Plan for non-U.S. Employees.* | | 10-K | | 12/21/2009 | | 10.32 | |
| | | | |
| 10.13 |
| | Agilent Technologies, Inc. 1999 Non-Employee Director Stock Plan (Amended and Restated Effective November 14, 2007).* | | 10-K | | 12/21/2007 | | 10.23 | |
| | Form of Stock Award Agreement for Standard Awards granted to Employees (for awards made after October 31, 2010).* | | 10‑K | | 12/20/2010 | | 10.21 | |
| | | | |
| 10.14 |
| | Form of Stock Option Agreement for grants under the Agilent Technologies, Inc. 1999 Non-Employee Director Stock Plan.* | | 8-K | | 11/12/2004 | | 10.3 | |
| | Form of Stock Award Agreement for Standard Awards granted to Employees.* | | 10-K | | 12/21/2009 | | 10.33 | |
| | | | |
| 10.15 |
| | Form of Stock Option Award Agreement for grants under the Agilent Technologies, Inc. 1999 Non-Employee Director Stock Plan.* | | 10-Q | | 9/5/2008 | | 10.2 | |
| | Form of New Executive Stock Award Agreement under the 2009 Stock Plan.* | | 8-K | | 3/25/2009 | | 10.4 | |
| | | | |
| 10.16 |
| | Agilent Technologies, Inc. 2009 Stock Plan.* | | DEF14A | | 1/27/2009 | | Appendix A | |
| | Form of Non-Employee Director Stock Option Award Agreement under the 2009 Stock Plan.* | | 8-K | | 3/25/2009 | | 10.5 | |
| | | | |
| 10.17 |
| | Form of Stock Option Award Agreement under the 2009 Stock Plan for U.S. Employees (for awards made after October 31, 2010).* | | 10‑K | | 12/20/2010 | | 10.17 | |
| | Form of Long-Term Performance Program Stock Award Agreement under the 2009 Stock Plan.* | | 10-K | | 12/21/2009 | | 10.36 | |
| | | | |
| 10.18 |
| | Form of Stock Option Award Agreement under the 2009 Stock Plan for U.S. Employees.* | | 10-K | | 12/21/2009 | | 10.31 | |
| | Form of Stock Award Agreement under the 2009 Stock Plan for Standard Awards granted to Employees (for awards made after November 17, 2015).* | | 10-K | | 12/21/2015 | | 10.26 | |
| | | | |
| 10.19 |
| | Form of Stock Option Award Agreement under the 2009 Stock Plan for non-U.S. Employees (for awards made after October 31, 2010).* | | 10‑K | | 12/20/2010 | | 10.19 | |
| | Form of Stock Award Agreement under the 2009 Stock Plan for Standard Awards granted to Officers (for awards made after November 17, 2015). * | | 10-K | | 12/21/2015 | | 10.27 | |
| | | | |
| 10.20 |
| | Form of Stock Option Award Agreement under the 2009 Stock Plan for non-U.S. Employees.* | | 10-K | | 12/21/2009 | | 10.32 | |
| | Form of Stock Award Agreement under the 2009 Stock Plan for Long-Term Performance Program Awards (for awards made after November 17, 2015). * | | 10-K | | 12/21/2015 | | 10.28 | |
| | | | |
| 10.21 |
| | Form of Stock Award Agreement for Standard Awards granted to Employees (for awards made after October 31, 2010).* | | 10‑K | | 12/20/2010 | | 10.21 | |
| | Form of Stock Award Agreement under the 2009 Stock Plan for New Executives (for awards made after November 17, 2015). * | | 10-K | | 12/21/2015 | | 10.29 | |
| | | | |
| 10.22 |
| | Form of Stock Award Agreement for Standard Awards granted to Employees.* | | 10-K | | 12/21/2009 | | 10.33 | |
| | Agilent Technologies, Inc. Supplemental Benefit Retirement Plan (Amended and Restated Effective January 1, 2005).* | | 10-K | | 12/21/2007 | | 10.25 | |
| | | | |
| 10.23 |
| | Form of New Executive Stock Award Agreement under the 2009 Stock Plan.* | | 8-K | | 3/25/2009 | | 10.4 | |
| | Agilent Technologies, Inc. Long-Term Performance Program (Amended and Restated through November 1, 2005).* | | 10-Q | | 3/9/2006 | | 10.63 | |
| | | | |
| 10.24 |
| | Form of Non-Employee Director Stock Option Award Agreement under the 2009 Stock Plan.* | | 8-K | | 3/25/2009 | | 10.5 | |
| | Agilent Technologies, Inc. 2005 Deferred Compensation Plan for Non-Employee Directors (Amended and Restated Effective November 18, 2009).* | | 10-K | | 12/21/2009 | | 10.39 | |
| | | | |
| 10.25 |
| | Form of Long-Term Performance Program Stock Award Agreement under the 2009 Stock Plan.* | | 10-K | | 12/21/2009 | | 10.36 | |
| | Agilent Technologies, Inc. 2005 Deferred Compensation Plan (Amended and Restated Effective January 1, 2011).* | | 10‑K | | 12/20/2010 | | 10.29 | |
| | | | |
| 10.26 |
| | Agilent Technologies, Inc. Supplemental Benefit Retirement Plan (Amended and Restated Effective January 1, 2005).* | | 10-K | | 12/21/2007 | | 10.25 | |
| | Agilent Technologies, Inc. 2010 Performance‑Based Compensation Plan for Covered Employees. (as adopted on November 19. 2014) | | DEF14A | | 2/6/2015 | | Annex A | |
| | | | |
| 10.27 |
| | Agilent Technologies, Inc. Long-Term Performance Program (Amended and Restated through November 1, 2005).* | | 10-Q | | 3/9/2006 | | 10.63 | |
| | Form of Amended and Restated Indemnification Agreement between Agilent Technologies, Inc. and Directors of the Company, Section 16 Officers and Board‑elected Officers of the Company.* | | 8-K | | 4/10/2008 | | 10.1 | |
| 10.28 |
| | Agilent Technologies, Inc. 2005 Deferred Compensation Plan for Non-Employee Directors (Amended and Restated Effective November 18, 2009).* | | 10-K | | 12/21/2009 | | 10.39 | | |
| 10.29 |
| | Agilent Technologies, Inc. 2005 Deferred Compensation Plan (Amended and Restated Effective January 1, 2011).* | | 10‑K | | 12/20/2010 | | 10.29 | | |
| 10.30 |
| | Agilent Technologies, Inc. 2005 Deferred Compensation Plan (Amended and Restated Effective October 28, 2009).* | | 10-K | | 12/21/2009 | | 10.40 | | |
| 10.31 |
| | Agilent Technologies, Inc. 2010 Performance‑Based Compensation Plan for Covered Employees. | | 10‑K | | 12/20/2010 | | 10.31 | | |
| | | | | | Incorporation by Reference | | | Incorporation by Reference |
Exhibit Number | Exhibit Number | | Description | | Form | | Date | | Exhibit Number | | Filed Herewith | Exhibit Number | | Description | | Form | | Date | | Exhibit Number | | Filed Herewith |
| | | | |
| 10.28 | |
| | Form of Tier I Change of Control Severance Agreement between Agilent Technologies, Inc. and the Chief Executive Officer* | | 10-K | | 12/22/2014 | | 10.35 | |
| | | | |
| 10.29 | |
| | Form of Amended and Restated Change of Control Severance Agreement between Agilent Technologies, Inc. and Section 16 Officers (other than the Company's Chief Executive Officer).* | | 8-K | | 4/10/2008 | | 10.3 | |
| | | | |
| 10.30 | |
| | Form of Tier II Change of Control Severance Agreement between Agilent Technologies, Inc. and Section 16 Officers (other than the Company’s Chief Executive Offier)* | | 10-K | | 12/22/2014 | | 10.37 | |
| | | | | �� |
| 10.31 | |
| | Form of New Executive Officer Change of Control Severance Agreement between Agilent Technologies, Inc. and specified executives of the Company (for executives hired, elected or promoted after July 14, 2009).* | | 10-K | | 12/21/2009 | | 10.50 | |
| | | | |
| 10.32 |
| | Agilent Technologies, Inc. Performance‑Based Compensation Plan for Covered Employees (Amended and Restated December 18, 2008).* | | 10-K | | 12/19/2008 | | 10.34 | |
| | Form of Tier III Change of Control Severance Agreement between Agilent Technologies, Inc. and specified executives of the Company* | | 10-K | | 12/22/2014 | | 10.39 | |
| | | | |
| 10.33 |
| | Form of Indemnification Agreement entered into by Agilent Technologies, Inc. with each of its directors and board‑appointed officers.* | | S-1 | | 8/16/1999 | | 10.9 | |
| | Tax Matters Agreement, dated August 1, 2014, by and between Agilent Technologies, Inc. and Keysight Technologies, Inc. | | 8-K | | 8/5/2014 | | 10.1 | |
| | | | |
| 10.34 |
| | Form of Amended and Restated Indemnification Agreement between Agilent Technologies, Inc. and Directors of the Company, Section 16 Officers and Board‑elected Officers of the Company.* | | 8-K | | 4/10/2008 | | 10.1 | |
| | Employee Matters Agreement, dated August 1, 2014, by and between Agilent Technologies, Inc. and Keysight Technologies, Inc. | | 8-K | | 8/5/2014 | | 10.2 | |
| | | | |
| 10.35 |
| | Form of Amended and Restated Change of Control Severance Agreement between Agilent Technologies, Inc. and the Chief Executive Officer.* | | 8-K | | 4/10/2008 | | 10.2 | |
| | Intellectual Property Matters Agreement, dated August 1, 2014, by and between Agilent Technologies, Inc. and Keysight Technologies, Inc. | | 8-K | | 8/5/2014 | | 10.3 | |
| | | | |
| 10.36 |
| | Form of Amended and Restated Change of Control Severance Agreement between Agilent Technologies, Inc. and Section 16 Officers (other than the Company's Chief Executive Officer).* | | 8-K | | 4/10/2008 | | 10.3 | |
| | Trademark License Agreement, dated August 1, 2014, by and between Agilent Technologies, Inc. and Keysight Technologies, Inc. | | 8-K | | 8/5/2014 | | 10.4 | |
| | | | |
| 10.37 |
| | Form of Amended and Restated Change of Control Severance Agreement between Agilent Technologies, Inc. and specified executives of the Company.* | | 8-K | | 4/10/2008 | | 10.4 | |
| | Real Estate Matters Agreement, dated August 1, 2014, by and between Agilent Technologies, Inc. and Keysight Technologies, Inc. | | 8-K | | 8/5/2014 | | 10.5 | |
| | | | |
| 10.38 |
| | Form of New Section 16 Officer Change of Control Severance Agreement between Agilent Technologies, Inc. and Section 16 Officers (other than the Company's Chief Executive Officer) (for executives hired, elected or promoted after July 14, 2009).* | | 8-K | | 9/28/2009 | | 10.1 | |
| | Underwriting Agreement, dated October 24, 2007, by and among Agilent Technologies, Inc., Citigroup Global Markets Inc. and J.P. Morgan Securities Inc., on behalf of the several underwriters named therein. | | 8-K | | 10/26/2007 | | 1.01 | |
| | | | |
| 10.39 |
| | Form of New Executive Officer Change of Control Severance Agreement between Agilent Technologies, Inc. and specified executives of the Company (for executives hired, elected or promoted after July 14, 2009).* | | 10-K | | 12/21/2009 | | 10.50 | |
| | Underwriting Agreement, dated September 9, 2009, by and among the Company, Barclays Capital Inc., Citigroup Global Markets Inc. and Credit Suisse Securities (USA) LLC, on behalf of the several underwriters named therein. | | 8-K | | 9/14/2009 | | 1.01 | |
| | | | |
| 10.40 |
| | Form of Change of Control Severance Agreement between Agilent Technologies, Inc. and certain other executive officers.* | | 10-K | | 12/21/2007 | | 10.79 | |
| | Underwriting Agreement, dated July 13, 2010, by and among the Company, Banc of America Securities LLC, Barclays Capital Inc. and Credit Suisse Securities (USA) LLC, on behalf of the several underwriters named therein. | | 8-K | | 7/19/2010 | | 1.01 | |
| | | | |
| 10.41 |
| | Master Separation and Distribution Agreement between Agilent Technologies, Inc. and Verigy Ltd., dated as of May 31, 2006. | | 10-Q | | 6/6/2006 | | 10.66 | |
| | Underwriting Agreement, dated September 10, 2012, by and among the Company, Barclays Capital Inc., J.P. Morgan Securities LLC and Merrill Lynch, Pierce, Fenner & Smith Incorporated, on behalf of the several underwriters named therein | | 8-K | | 9/13/2012 | | 1.01 | |
| 10.42 |
| | General Assignment and Assumption Agreement between Agilent Technologies, Inc. and Verigy Ltd., dated as of June 1, 2006. | | 10-Q | | 6/6/2006 | | 10.67 | | |
| 10.43 |
| | Intellectual Property Matters Agreement between Agilent Technologies, Inc., Verigy Ltd., and Verigy (Singapore) Pte. Ltd., dated as of June 1, 2006. | | 10-Q | | 6/6/2006 | | 10.68 | | |
| 10.44 |
| | Tax Sharing Agreement by and between Agilent Technologies, Inc. and Verigy Ltd., dated as of June 1, 2006. | | 10-Q | | 6/6/2006 | | 10.70 | | |
| 10.45 |
| | Five-Year Credit Agreement, dated October 20, 2011, by and among Agilent Technologies, Inc., the Lenders party thereto, JPMorgan Chase Bank, N.A., as Administration Agent and J.P. Morgan Europe Limited, as London Agent. | | 8-K | | 10/25/2011 | | 10.1 | | |
| 10.46 |
| | Underwriting Agreement, dated October 24, 2007, by and among Agilent Technologies, Inc., Citigroup Global Markets Inc. and J.P. Morgan Securities Inc., on behalf of the several underwriters named therein. | | 8-K | | 10/26/2007 | | 1.01 | | |
| 10.47 |
| | Underwriting Agreement, dated September 9, 2009, by and among the Company, Barclays Capital Inc., Citigroup Global Markets Inc. and Credit Suisse Securities (USA) LLC, on behalf of the several underwriters named therein. | | 8-K | | 9/14/2009 | | 1.01 | | |
| | | |
| | | | | | Incorporation by Reference | | | Incorporation by Reference |
Exhibit Number | Exhibit Number | | Description | | Form | | Date | | Exhibit Number | | Filed Herewith | Exhibit Number | | Description | | Form | | Date | | Exhibit Number | | Filed Herewith |
| | | | |
| 10.42 | |
| | Underwriting Agreement, dated June18, 2013, by and among the Company, BNP Paribas Securities Corp., Citigroup Global Markets Inc. and Merrill Lynch, Pierce, Fenner & Smith Incorporated, on behalf of the several underwriters named therein. | | 8-K | | 6/21/2013 | | 1.01 | |
| | | | |
| 10.43 | |
| | Credit Agreement, dated September 15, 2014, by and among the Company, the Lenders party thereto and BNP Paribas, as Administrative Agent. | | 8-K | | 9/15/2014 | | 10.2 | |
| | | | |
| 10.44 | |
| | Letter Agreement dated as of June 9, 2015 by and among the Company, BNP Paribas, as Administrative Agent under the Credit Agreement and certain banks | | 8-K | | 6/10/2015 | | 10.1 | |
| | | | |
| 10.45 | |
| | Share Purchase Agreement by and among Delphi S.a.r.l., Agilent Technologies Europe B.V. and Agilent Technologies, Inc., dated May 16, 2012. | | 8-K | | 5/22/2012 | | 10.1 | |
| | | | |
| 10.46 | |
| | Contract of Employment - Corporate Vice President, by and among Dako Denmark A/S and Jacob Thaysen* | | 10-K | | 12/22/2014 | | 10.61 | |
| | | | |
| 10.47 | |
| | Letter of Terms and Conditions International Long Term Assignment, by and among Jacob Thaysen and the Company* | | 10-K | | 12/22/2014 | | 10.62 | |
| | | | |
| 10.48 |
| | Underwriting Agreement, dated July 13, 2010, by and among the Company, Banc of America Securities LLC, Barclays Capital Inc. and Credit Suisse Securities (USA) LLC, on behalf of the several underwriters named therein. | | 8-K | | 7/19/2010 | | 1.01 | |
| | Bonus Retention Agreement, by and among Jacob Thaysen and the Company* | | 10-K | | 12/22/2014 | | 10.63 | |
| | | | |
| 10.49 |
| | Underwriting Agreement, dated September 10, 2012, by and among the Company, Barclays Capital Inc., J.P. Morgan Securities LLC and Merrill Lynch, Pierce, Fenner & Smith Incorporated, on behalf of the several underwriters named therein | | 8-K | | 9/13/2012 | | 1.01 | |
| | Bonus Retention Notification for FY 13 and FY13-FY15 Performance Periods, by and among Jacob Thaysen and the Company* | | 10-K | | 12/22/2014 | | 10.64 | |
| | | | |
| 10.50 |
| | Underwriting Agreement, dated June 21, 2013, by and among the Company, BNP Paribas Securities Corp., Citigroup Global Markets Inc. and Merrill Lynch, Pierce, Fenner & Smith Incorporated, on behalf of the several underwriters named therein. | | 8-K | | 6/21/2013 | | 1.01 | |
| | Letter of Terms and Conditions Localization Program by and among Jacob Thaysen and the Company * | | 10-K | | 12/21/2015 | | 10.70 | |
| | | | |
| 10.51 |
| | Share Purchase Agreement by and among Delphi S.a.r.l., Agilent Technologies Europe B.V. and Agilent Technologies, Inc., dated May 16, 2012. | | 8-K | | 5/22/2012 | | 10.1 | |
| | Letter of Terms and Conditions Localization Program by and among Patrick Kaltenbach and the Company * | | 10-K | | 12/21/2015 | | 10.71 | |
| | | | |
| 10.52 |
| | Separation Agreement and General Release, effective as of November 7, 2013 by and between Nicolas Roelofs and the Company. | | 8-K | | 11/13/2013 | | 10.1 | |
| | Letter of Terms and Conditions of U.S. Indefinite Relocation and U.S. Domestic Relocation Agreement, each by and among Michael R. McMullen and the Company* | | 10-Q | | 3/8/2016 | | 10.1 | |
| 10.53 |
| | Executive Service Contract - Chief Executive Officer, by and among Dako Denmark A/S, Dako A/S and Lars Holmkvist* | | X | |
| 10.54 |
| | Bonus Retention Agreement by and between the Company and Lars Holmkvist* | | X | |
| | | | |
| 11.1 |
| | See Note 6, “Net Income Per Share”, to our Consolidated Financial Statements on page 78. | | X |
| | See Note 6, “Net Income Per Share”, to our Consolidated Financial Statements on page 76. | | X |
| | | | |
| 12.1 |
| | Computation of ratio of earnings to fixed charges. | | X |
| | Computation of ratio of earnings to fixed charges. | | X |
| | | | |
| 14.1 |
| | See Investor Information in Item 1: Business on page 3 of this Annual Report on Form 10-K. | | X |
| | See Investor Information in Item 1: Business on page 16 of this Annual Report on Form 10-K. | | X |
| | | | |
| 21.1 |
| | Significant subsidiaries of Agilent Technologies, Inc. as of October 31, 2012. | | X |
| | Significant subsidiaries of Agilent Technologies, Inc. as of October 31, 2016. | | X |
| | | | |
| 23.1 |
| | Consent of Independent Registered Public Accounting Firm. | | X |
| | Consent of Independent Registered Public Accounting Firm. | | X |
| | | | |
| 24.1 |
| | Powers of Attorney. Contained in the signature page of this Annual Report on Form 10-K. | | X |
| | Powers of Attorney. Contained in the signature page of this Annual Report on Form 10-K. | | X |
| | | | |
| 31.1 |
| | Certification of Chief Executive Officer pursuant to Section 302 of the Sarbanes‑Oxley Act of 2002. | | X |
| | Certification of Chief Executive Officer pursuant to Section 302 of the Sarbanes‑Oxley Act of 2002. | | X |
| | | | |
| 31.2 |
| | Certification of Chief Financial Officer pursuant to Section 302 of the Sarbanes‑Oxley Act of 2002. | | X |
| | Certification of Chief Financial Officer pursuant to Section 302 of the Sarbanes‑Oxley Act of 2002. | | X |
| | | | |
| 32.1 |
| | Certification of Chief Executive Officer pursuant to Section 906 of the Sarbanes‑Oxley Act of 2002. | | X |
| | Certification of Chief Executive Officer pursuant to Section 906 of the Sarbanes‑Oxley Act of 2002. | | X |
| 32.2 |
| | Certification of Chief Financial Officer pursuant to Section 906 of the Sarbanes‑Oxley Act of 2002. | | X | |
| 101.INS |
| | XBRL Instance Document. | | X | |
| 101.SCH |
| | XBRL Taxonomy Extension Schema Document. | | X | |
| 101.CAL |
| | XBRL Taxonomy Extension Calculation Linkbase Document. | | X | |
| 101.LAB |
| | XBRL Taxonomy Extension Label Linkbase Document. | | X | |
| 101.PRE |
| | XBRL Taxonomy Extension Presentation Linkbase Document. | | X | |
| 101.DEF |
| | XBRL Taxonomy Extension Definition Linkbase Document. | | X | |
|
| | | | | | | | | | | | |
| | | | | | | | | | |
| | | | Incorporation by Reference |
Exhibit Number | | Description | | Form | | Date | | Exhibit Number | | Filed Herewith |
| | | | | | | | | | | |
| 32.2 |
| | | Certification of Chief Financial Officer pursuant to Section 906 of the Sarbanes‑Oxley Act of 2002. | | | | | | | | X |
| | | | | | | | | | | |
| 101.INS | | XBRL Instance Document. | | | | | | | | X |
| | | | | | | | | | |
| 101.SCH | | XBRL Taxonomy Extension Schema Document. | | | | | | | | X |
| | | | | | | | | | |
| 101.CAL | | XBRL Taxonomy Extension Calculation Linkbase Document. | | | | | | | | X |
| | | | | | | | | | |
| 101.LAB | | XBRL Taxonomy Extension Label Linkbase Document. | | | | | | | | X |
| | | | | | | | | | |
| 101.PRE | | XBRL Taxonomy Extension Presentation Linkbase Document. | | | | | | | | X |
| | | | | | | | | | |
| 101.DEF | | XBRL Taxonomy Extension Definition Linkbase Document. | | | | | | | | X |
| |
| * | Indicates management contract or compensatory plan, contract or arrangement. |
+ Pursuant to a request for confidential treatment, confidential portions of this Exhibit have been redacted and have been
filed separately with the Securities and Exchange Commission.
SIGNATURES
Pursuant to the requirements of Section 13 or 15(d) of the Securities Exchange Act of 1934, the registrant has duly caused this report to be signed on its behalf by the undersigned, thereunto duly authorized.
|
| | | | |
| | | AGILENT TECHNOLOGIES, INC. |
| | | | | |
| | | BY | | /s/ MARIE OH HUBERMICHAEL TANG |
| | | | | Marie Oh HuberMichael Tang |
| | | | | Senior Vice President, |
| | | | | General Counsel and Secretary |
Date: December 19, 201320, 2016
POWER OF ATTORNEY
KNOW ALL PERSONS BY THESE PRESENTS, that each person whose signature appears below constitutes and appoints Marie Oh Huber, Stephen D. Williams and Michael Tang and P. Diana Chiu, or anyeither of them, his or her attorneys-in-fact, for such person in any and all capacities, to sign any amendments to this report and to file the same, with exhibits thereto, and other documents in connection therewith, with the Securities and Exchange Commission, hereby ratifying and confirming all that any of said attorneys-in-fact, or substitute or substitutes, may do or cause to be done by virtue hereof. Pursuant to the requirements of the Securities Exchange Act of 1934, this report has been signed below by the following persons on behalf of the registrant and in the capacities and on the dates indicated.
|
| | | | |
| Signature | | Title | | Date |
| | | | | |
/s/ WILLIAM P. SULLIVANMICHAEL R. MCMULLEN | | Director, President and Chief Executive Officer | | December 19, 201320, 2016 |
William P. SullivanMichael R. McMullen | | (Principal Executive Officer) | | |
| | | | | |
| /s/ DIDIER HIRSCH | | Senior Vice President and Chief Financial Officer | | December 19, 201320, 2016 |
| Didier Hirsch | | (Principal Financial Officer) | | |
| | | | | |
/s/ SOLANGE GLAIZERODNEY GONSALVES | | Vice President, Corporate Controllership | | December 19, 201320, 2016 |
Solange GlaizeRodney Gonsalves | | (Principal Accounting Officer) | | |
| | | | | |
| /s/ JAMES G. CULLEN |
| Chairman of the Board of Directors |
| December 19, 201320, 2016 |
| James G. Cullen |
|
|
|
|
| | | | | |
| /s/ PAUL N. CLARK | | Director | | December 19, 201320, 2016 |
| Paul N. Clark | | | | |
| | | | | |
| /s/ HEIDI FIELDS | | Director | | December 19, 201320, 2016 |
| Heidi Fields | | | | |
| | | | | |
| /s/ ROBERT J. HERBOLD | | Director | | December 19, 201320, 2016 |
| Robert J. Herbold | | | | |
| | | | | |
| /s/ KOH BOON HWEE | | Director | | December 19, 201320, 2016 |
| Koh Boon Hwee | | | | |
| | | | | |
/s/ DAVID M. LAWRENCE,DANIEL K. PODOLSKY, M.D. | | Director | | December 19, 201320, 2016 |
David M. Lawrence,Daniel K. Podolsky, M.D. | | | | |
| | | | | |
/s/ A. BARRY RANDSUE H. RATAJ | | Director | | December 19, 201320, 2016 |
| Sue H. Rataj | | | | |
| | | | |
/s/ GEORGE A. Barry RandSCANGOS, Ph D | | Director | | December 20, 2016 |
| George A. Scangos, Ph D. | | | | |
| | | | | |
| /s/ TADATAKA YAMADA, M.D. | | Director | | December 19, 201320, 2016 |
| Tadataka Yamada, M.D. | | | | |