| TABLE OF CONTENTS | ||
| Page | |||||||||||||||||||||
| PART I | |||||||||||||||||||||
| Business | |||||||||||||||||||||
| Item | |||||||||||||||||||||
| Item 1B. | Unresolved Staff Comments | ||||||||||||||||||||
| Item 2. | Properties | ||||||||||||||||||||
| Item 3. | Legal Proceedings | ||||||||||||||||||||
| Item 4. | Mine Safety Disclosures | ||||||||||||||||||||
| PART II | |||||||||||||||||||||
| Item 5. | Market for Registrant's Common Equity, Related Stockholder Matters and Issuer Purchases of Equity Securities | ||||||||||||||||||||
| Item 6. | |||||||||||||||||||||
| Item 7. | Management's Discussion and Analysis of Financial Condition and Results of Operations | ||||||||||||||||||||
| Item 7A. | Quantitative and Qualitative Disclosures About Market Risk | ||||||||||||||||||||
| Item 8. | Financial Statements and Supplementary Data | ||||||||||||||||||||
| Item 9. | Changes in and Disagreements With Accountants on Accounting and Financial Disclosure | ||||||||||||||||||||
| Item 9A. | Controls and Procedures | ||||||||||||||||||||
| Item 9B. | Other Information | ||||||||||||||||||||
| Disclosure Regarding Foreign Jurisdictions that Prevent Inspections | |||||||||||||||||||||
| PART III | |||||||||||||||||||||
| Item 10. | Directors, Executive Officers and Corporate Governance | ||||||||||||||||||||
| Item 11. | Executive Compensation | ||||||||||||||||||||
| Item 12. | Security Ownership of Certain Beneficial Owners and Management and Related Stockholder Matters | ||||||||||||||||||||
| Item 13. | Certain Relationships and Related Transactions, and Director Independence | ||||||||||||||||||||
| Item 14. | Principal Accountant Fees and Services | ||||||||||||||||||||
| PART IV | |||||||||||||||||||||
| Item 15. | Exhibits and Financial Statement Schedules | ||||||||||||||||||||
| Item 16. | Form 10-K Summary | ||||||||||||||||||||
| Signatures | |||||||||||||||||||||
PART I
Item 1. Business
Background and business overview
Luxfer Holdings PLC ("Luxfer," "the Company," "we""we," "our") is a global producer of highly-engineered industrial company innovating niche applications in materials focusedengineering. Luxfer focuses on sustained value creation by using its broad array of technical knowhowknow-how and proprietary technologies to help create a safe, clean and energy-efficient world. Luxfer's high-performance materials, technologies. The company specializescomponents and high-pressure gas containment devices are used in the designdefense, first response and manufacture of high-performance products forhealthcare, transportation defense and emergency response, healthcare, and general industrial purposes. Luxfer customers include both end-users of its products and manufacturers that incorporate Luxfer products into finished goods.applications.
We focus primarily on innovationsproduct lines related to magnesium alloys, zirconium chemicals aluminum alloys and carbon composites. For example, we were the first to develop and patent a rare-earth-containing magnesium alloy (EZ33A) for use in high-temperature aerospace applications, including helicopter gearboxes; we were at the forefront of the commercial development of zirconia-rich mixed oxides for use in automotive catalysis; we were the first to manufacture a high-pressure gas cylinder out of a single piece of aluminum using cold-impact extrusion; and we developed and patented the superforming process and the first superplastic aluminum alloy (AA2004). We have a long history of innovation derived from our strong technical expertise, and we work closely with customers to apply innovative solutions to their most demanding product needs. Our proprietary technologies and technical expertise, coupled with strong customer service and global presence, provide competitive advantages and have established us as leaders in the global markets we serve. We believe that we have leading positions in key product areas, including magnesium alloys and powders for aerospace, alloys, photo-engraving plates,military, and commercial applications, zirconium chemicals for automotive catalytic converters and industrial catalysis, high-pressure aluminum and composite cylinders for self-contained breathing applicationsapparatus, as well as transport and storage of compressed natural gas ("CNG") and hydrogen, photo-engraving plates, and a wide variety of other uses.
We have a global presence, operating 1913 manufacturing plants in the U.S., the U.K., Canada France, the Czech Republic and China, one of which relates to discontinued operations, and we also have a joint venture in Japan. We employ approximately 1,6001,400 people, including temporary staff. We also have joint ventures in Japan and India.staff, of which fewer than 50 support our discontinued operations. In 2018,2022, our net sales from continuing operations were $487.9$423.4 million (2017: $441.3(2021: $374.1 million, 2016: $414.82020: $324.8 million), and our net income from continuing operations was $25.0$32.0 million (2017: $16.6(2021: $30.0 million, 2016: $17.82020: $20.8 million). In 2018, we manufactured and sold approximately 14,600 metric tons of our magnesium products, approximately 2,600 metric tons of our zirconium products (excluding water weight as sold as a solution) and approximately 1.8 million high-pressure gas cylinders.
Luxfer operates in two business segments - Elektron and Gas Cylinders.
Elektron Segment
Our Elektron Segment focuses on specialty materials based primarily on magnesium and zirconium. In 2018, revenues2022, sales from our Elektron Segment represented approximately 51% (2017: 50%57% (2021: 52%, 2016: 46%2020: 56%) of our consolidated net sales. sales from continuing operations. Our top ten customers represented 36%40% of segment sales. No singular customer represented 10% or more of our Elektron Segment sales.
Key product lines include:
•Advanced lightweight, corrosion-resistant and heat- and flame-resistant magnesium alloys for use in aerospace, healthcare and oil and gas applications.
•Magnesium powders used in countermeasure flares that protect aircraft from heat-seeking missiles and also for heating pads for self-heating meals used by the military and emergency-relief agencies.
•High-performance zirconium-based materials and oxides used as catalysts and in the manufacture of advanced ceramics, fiber-optic fuel cells, pharmaceuticals and many other performance products.
•Magnesium, copper, and zinc photo-engraving plates for graphic arts and luxury packaging.
Gas Cylinders Segment
Our Gas Cylinders Segment manufactures and markets specialized, productshighly-engineered cylinders using carbon composites and aluminum titanium and carbon composites.alloys. In 2018,2022, sales from our Gas Cylinders Segment represented approximately 49% (2017: 50%43% (2021: 48%, 2016: 54%2020: 44%) of our consolidated net sales. Our top ten customers represented 44%53.9% of segment sales. No customerTwo customers represented 10% or more12% of our Gas Cylinders Segment sales. No other singular customer represented greater than 10% of Gas Cylinders Segment sales.
Key product lines include:
•Carbon fiber composite cylinders for self-contained breathing apparatus (SCBA), used by firefighters and other emergency-responders. Our products are also used by scuba divers and personnel in potentially hazardous environments, such as mines.
•Carbon fiber composite cylinders for compressed natural gas (CNG) and hydrogen containment in alternative fuel (AF) vehicles.
1
Our U.S. aluminum gas cylinder business was sold in March 2021, our Superform U.K. business was sold in September 2021, and titanium panels superformed into highly complex shapes used mainlywe expect our Superform U.S. business to be sold within the next twelve months. As a result, only our Superform U.S. business remains on the balance sheet as held-for-sale at December 31, 2022. Results from the three operations were disclosed as discontinued in the transportation industry.income statement for the corresponding years' of ownership.
All information included within this section relates to continuing operations, unless otherwise stated.
Financial Information about Segments and Geographic Areas
See Note 1517 ("SegmentalSegment Information") to our consolidated financial statements for further information regarding our operating segments and our geographic areas.
Suppliers and raw materials
Update on global macro environment and related impact on supply chain disruption.
Demand from most end-markets we serve has continued to improve following the adverse impact of COVID-19 on volumes. This recovery in demand across the global macro environment following the onset of COVID-19 has resulted in supply chain challenges characterized by significant increases in cost of key inputs, including magnesium, aluminum, carbon fiber and energy, material and labor availability issues and transport cost increases. Additionally, during 2022 two critical suppliers for our Elektron Segment of magnesium and zirconium, respectively, had enforced force majeure, a standard clause in contracts to remove liability for unexpected and unavoidable catastrophes that interrupt the normal course of business and prevent participants from fulfilling contractual obligations. The force majeure for magnesium was declared in 2021 and remains in place, impacting our U.S. domestic procurement of this key material. The continuing conflict in Ukraine, which has resulted in punitive sanctions against the Russian Federation, has further exacerbated the availability and price of certain raw materials and energy supplies.
In response to these supply chain disruptions, we have secured alternative sources of supply for key material inputs affected by force majeure and have built additional raw material inventory throughout the year. Furthermore, in the majority of cases, we are able to pass through raw material inflation to our customers. Currently, we expect the impact of material availability and inflation, as well as energy cost inflation and labor and transport constraints to continue through 2023. We also expect to be able to source sufficient material to meet demand and in the majority of cases, we expect to be able to pass on cost increases to our customers. However, the outlook remains uncertain with both the size and timing of future cost increases difficult to predict.
Impact of conflict in Ukraine
The Russian invasion of Ukraine and ongoing military conflict which commenced on February 24, 2022, has resulted in displacement of the Ukrainian population and disruption to the Ukrainian economy. Wide ranging sanctions have been imposed on the Russian Federation by the international community, targeting individuals, banks, businesses, funds transfers and imports and exports and are expected to have a significant adverse impact on Russia's economy as well as on international businesses active in the region. Currently, we do not expect the impact on Luxfer from these developments to be significant. We hold no direct operations in the region, and our sales to Russia and Ukraine combined represent less than one percent of total revenue by destination. Furthermore, neither country is a critical supplier of our raw materials. While Russia is a major global exporter of magnesium, we are able to source the metal from various alternative locations, including China, Israel and Turkey. Historically, we also sourced magnesium domestically, however, due to the force majeure declared by U.S. Magnesium LLC, the only U.S. producer of magnesium, in 2021, we currently cannot source from the U.S.
Elektron Segment
Key raw materials used by our Elektron Segment are magnesium, zircon sand and rare earths.
The world demand for magnesium is around one million metric tons per year. China provides about 70%80% of the world supply. Western primary productionProduction outside of China, however, is however, significant, from North American suppliers,including, Dead Sea Magnesium in Israel, RIMA Industrial in Brazil, and two smelterssmaller producers in Turkey and Russia. We purchase approximately half40% of our magnesium needs from China. We usehistorically used only U.S.-sourced materials for our products sold to the U.S. military, for which U.S. and Canadian sourcing is mandatory. However, given the current force majeure declared by our U.S. supplier of magnesium, we are in the process of qualifying non-U.S.-sourced material for sale to the U.S. military.
We generally purchase raw materials from suppliers on a spot basis under standardpreviously contracted terms and conditions. In 2017, we entered into a three-year supply contract with Rio Tinto Alcan for a substantial portion of our aluminum requirements. In addition, weWe have long-term supply contracts in place with U.S. Magnesium for raw material purchases of magnesium ingot for both military and commercial applications. The military contract covers magnesium purchases through December 31, 2020,2023, whereas the commercial contract covers purchases through December
2
31, 2019.2023. However, given the current force majeure declared by U.S. Magnesium LLC, we do not know when or if we will be able to recommence the magnesium ingot purchases specified under this contract.
We purchase and process zircon sand, which is found in heavy-minerals sand, titanium dioxide and other products. Global production of zircon sand is estimated at approximately 1.61.5 million metric tons. We source premium-grade zircon sand from suppliers in South Africa, Senegal, Indonesia and Australia. We also purchase intermediate zirconium chemicals from suppliers in China; theChina. The level of these purchases is based on a number of factors, including required properties and relative market prices. During part of 2022, one of our suppliers of zircon sand had enforced force majeure.
There are 17 rare earth metals that are reasonably commoncommonly found in nature. Usually found mixed together with other mineral deposits, these rare earths haveexhibit magnetic and light-emitting properties that make them invaluable to high-technology manufacturers. As theyThese rare earth metals are used as ingredients in our zirconium chemical and magnesium alloy products, our use ofproducts. Our largest rare earths has expanded over the last few years. Our mainearth requirement is for cerium, which we use in automotive catalysis compounds because of its unique oxygen-storage capabilities.
Gas Cylinders Segment
In 2022, we purchased approximately 40% of our aluminum from Rio Tinto Alcan and its associated companies. Aluminum represented approximately 35% of Gas Cylinders Segment's raw material costs in 2022. The price of aluminum, and carbon fiber, has been volatile in the past and has increased substantially in 2022. While we generally have passed through changes in input costs to our customers, some of our Gas Cylinders Segment contracts contain look-back provisions that result in a lag to our ability to adjust pricing for changes in input costs.
3
Our end-markets
Key end-markets for Luxfer products fall into fourthree categories:
Transportation (31% of 20182022 sales): Many Luxfer products serve a growing need to improve and safeguard the environment in the field of transportation, including our (i) lightweight, high-pressure carbon composite cylinders that contain compressed natural gas and hydrogen; (ii) zirconium-based products that reduce automotive and other emissions; ourand (iii) lightweight magnesium alloys used in fuel-efficient aerospace and automotive designs; and our lightweight, high-pressure carbon composite alternative fuel cylinders that contain clean-burning compressed natural gas and hydrogen. We also superform single sheets of aluminum, magnesium or titanium to create complex, three-dimensional components used in automotive, aerospace and rail components.
designs.
| Area of Focus | Product | End-market drivers | ||||||||||||||||||
| Alternative fuels | • and systems• Bulk gas storage transportation cylinders and systems | • Clean energy initiatives • • Increasing adoption of hydrogen as fuel source for public transport, particularly in Europe • | ||||||||||||||||||
| Environmental | • Zirconium compounds | • aimed at reducing emissions from internal combustion engines, including gasoline particulate filtration• • Increasing demand for gasoline-electric hybrid vehicles | ||||||||||||||||||
• | ||||||||||||||||||||
• market• | ||||||||||||||||||||
4
Defense, and emergency response (26%First Response & Healthcare (32% of 20182022 sales): Luxfer offers severalmany products that address principal factors driving growth in this market, such as heightened societal expectations regarding protection ofhelp to protect people, equipment and property duringin hazardous conditions, conflicts and emergencies. OurThese products include magnesium powders used for countermeasure flares that defend aircraft against heat-seeking missile attack and formissiles, flameless ration heaters used in meals life-supportReady-to-Eat, cylinders used in SCBA equipment for firefighters and other emergency-serviceemergency service personnel, fire extinguisher cylinders, and chemical agent detection and decontamination products.
Other products include lightweight gas cylinders for containment of medical and laboratory gases, zirconium powders for pharmaceutical products, magnesium materials for lightweight orthopedic devices, specialized magnesium alloys for the automotive industry, and zirconium materials for biomedical applications and dental implants.
| Area of Focus | Product | End-market drivers | ||||||||||||||||||
| Life-support breathing apparatus | • Composite cylinders used in | • Increased awareness of importance of properly equipping firefighting services • Demand for lightweight products to upgrade from heavy all-metal cylinders • Periodic upgrade of new U.S. National Institute for Occupational Safety and Health (NIOSH) standards and natural replacement cycles • Asian and European fire services looking to adopt more modern SCBA equipment | ||||||||||||||||||
| • Ultra-fine magnesium powders for flares used to protect aircraft from attack by heat-seeking missiles | • exercises• Maintenance of countermeasures reserves (shelf-life restrictions) | |||||||||||||||||||
• Self-heating meals used by military personnel and emergency-relief agencies • Chemical detection and chemical decontamination kits | • Ensuring protection and well-being for military personnel and victims of natural disasters • | |||||||||||||||||||
| Medical gases | ||||||||||||||||||||||
• Portable aluminum and composite cylinders | • | • Growing trend to provide oxygen therapy in the home and to keep patients mobile | ||||||||||||||||||||
| • Magnesium sheets | • Improved mobility through use of easy-to-wear, lightweight braces and trusses | |||||||||||||||||||||
• MELsorb® material | • | • New technologies to remove noxious elements from the body | ||||||||||||||||||||
5
General industrial (36%(37% of 20182022 sales): Our core technologies have enabled us to serve various otherindustrial markets and applications. OurThese products include zirconium-based compounds to purify drinking water and clean industrial exhausts; magnesium alloys shaped for use in various general engineering applications; and high-pressure gas cylinders used for high-purity specialty gases, beverage dispensing, scuba diving and performance racing. MetalOur metal foil-stamping and embossing dies are used primarily for luxury packaging, labels and greeting cards. Our high-quality magnesium, copper, brass and zinc plates are ideal for these and other graphic applications.
| Area of Focus | Product | End-market drivers | ||||||||||||||||||
| General engineering | • Magnesium billets, sheets, coil, tooling plates • Zirconium ceramic compounds for hard working components | • Need for components to operate in more extreme environments for longer periods, such as underground or in the ocean | ||||||||||||||||||
| Hydraulic fracturing or "fracking" | • Dissolvable SoluMag® magnesium alloy | • Onshore | ||||||||||||||||||
| Paper | • Bacote™ and Zirmel™, both formaldehyde-free insolubilizers that aid high-quality printing | • Elimination of toxic chemicals | ||||||||||||||||||
| Graphic arts | • Photo-engraving plates | • Luxury packaging as part of marketing high-end products | ||||||||||||||||||
Our competitive advantages
Focus on innovation and product development for growing specialized end-markets.We continue to produce a steady stream of new products, including those developed in close collaboration with our customers.
Strong technical expertise and know-how.Using our expertise in metallurgy and material science, we specialize in advanced materials, developing products and materials with superior performance to satisfy the most demanding requirements in the most extreme environments. Further, we benefit from the fact that a growinggrowth in the number of our patented products, are patented, including many of our alloys and compounds.
Diversified customer base with long-standing relationships.We put the customer at the heart of our strategy, and we have long-standing relationships with many of our customers, including global leaders in our key markets.
•Strategy Deployment
6
Seasonality
Research and Development
Luxfer recognizes the importance of research in materials science and the need to develop innovative new products to meet future needs of customers and to continue providing growth opportunities for the business.grow sales and operating profit. Each year, we invest in the development of new products and processes directed towards transportation, defense and emergency response, healthcare and general industrialour end-markets. Direct expenditure on research and development amounted to $6.4 million in 2018 (2017: $7.8 million; 2016: $7.6 million). Our product development projects also include utilizing skills of our wider commercial technical sales staff, manufacturing engineers and general management, many of whom are highly qualified scientists and engineers. A large proportion of senior sales and management time is spent overseeing development of products and working with customers on integrating our products and solutions into their product designs.
To provide customers with improving products and services, we invest in new technology and research and employ some of the world's leading specialists in materials science and metallurgy. Our engineers and metallurgists collaborate closely with our customers to design, develop and manufacture our products. We also co-sponsor ongoing research programs at major universities in the U.S., Canada and Europe. Thanks to the ingenuity of our own research and development teams, Luxfer has developed a steady stream of new products, most recently including:
•Ultra-lightweight large composite cylinders, branded G-StorTM, for containment of CNG, hydrogen, helium and other gases;
•AF systems solutions for buses, trucks and bulk gas transportation;
•Zirconium catalysts for large-scale industrial chemical applications;automotive end-use, including advances in gasoline particulate filtration used in hybrid vehicles;
•L7X® high-strength aluminum alloy and carbon composite gas cylinders;
•Luxfer ECLIPSE, a new carbon composite cylinders for firefighter self-contained breathing apparatus (SCBA); and
•Unitized Group Ration - Express (UGR-E) heater meals developed to deliver hot meals to multiple soldiers in a combat or training environment. |
We believe that our commitment to research and new product development, through dedicated resources and significant use of management's time, isforms the core of Luxfer's growth potential worldwide.potential. This commitment reflects our strategy of focusing on high-performance, value-added product linesproducts and markets andas well as leveraging our collaboration with universities. We invest in developing products for end-markets that we believe havehold long-term growth potential.
7
Intellectual Property
In certain areas, we rely more heavily upon trade secrets and unpatented proprietary know-how than patent protection in order to establish and maintain our competitive advantage. We generally enter into non-disclosure and invention assignment agreements with our employees and subcontractors.subcontractors, as well as our customers and vendors.
Human Capital Management
The Company employed approximately 1,400 people as of December 31, 2022, fewer than 50 of whom support our discontinued operations. Of the approximately 1,350 employees associated with continuing operations, approximately 750 are employed in the United States and 600 are employed internationally.
Attracting and retaining talent remains a challenge in the post-COVID landscape. To succeed in today’s competitive labor market, Luxfer takes a proactive approach to human capital management by pursuing several priorities that we believe are critical in recruiting, retaining, motivating, and developing top talent. Such priorities include: (i) ensuring occupational health and safety; (ii) providing opportunities for professional growth and development; (iii) maintaining diverse and inclusive workplaces; and (iv) promoting financial, physical, and emotional well-being.
Our Board of Directors and Executive Leadership Team play a key role in setting our human capital management strategy and driving accountability for meaningful progress. Informed by data, our human capital management initiatives are supported by local leadership, with significant functional oversight by our local human resource teams. All Luxfer facilities collect data on employee retention, talent acquisition, training, and safety. Metrics are recorded quarterly on our internal scorecard and are reported to executive management regularly.
Occupational Health and Safety
Luxfer is committed to safeguarding the health and safety of our employees at work. We have well-defined health and safety policies and procedures that are reinforced by ongoing employee training. We conduct annual on-site audits to identify and manage environmental health and safety risks, as well as to evaluate compliance with regulatory requirements and Luxfer policy. All functional business units report metrics to assess health and safety performance, which are reviewed regularly by executive leadership and management. In fiscal year 2022, the Company had eight Lost Time Accidents and an Incident Frequency Rate of 1.59 with zero work-related fatalities.
Professional Growth and Development
Providing opportunities for professional growth and development is key to Luxfer’s retention strategy. Luxfer maintains talent and succession planning processes, including regular review by the Executive Leadership Team and reports to the Board of Directors. We operate leadership and management development programs, which provide a consistent approach to the development to the Company’s future leaders and managers. With a multi-faceted curriculum, these programs develop critical problem-solving, communication, management, and leadership skills. Luxfer also maintains training and development programs for employees at the workforce level, in addition to regular coaching and support from their supervisor and performance evaluations. To further support their career aspirations, employees can access Luxfer’s online learning platform which offers over 180,000 courses, videos, and books designed to strengthen critical business, leadership, productivity, and computer software skills.
8
Diverse and Inclusive Workplaces
The professional conduct of our employees furthers the Company’s mission, promotes productivity, minimizes disputes, and enhances our reputation. As such, the Company is committed to creating and maintaining a diverse, global workforce that provides fair and equitable opportunities, thereby advancing Luxfer’s innovation culture and customer first values. With continued focus on diversity and equity, Luxfer’s diversity initiatives include, but are not limited to, practices and policies on recruitment and selection, including targeted sourcing of personnel from diverse backgrounds; compensation and benefits; professional development and training; advancement opportunities; and the ongoing development of a diverse and inclusive work environment. All Luxfer personnel are required to complete a variety of anti-harassment, non-discrimination, diversity, and unconscious bias trainings annually. Luxfer’s talent acquisition teams and hiring managers undergo additional training to ensure that a diverse slate of candidates is considered for all job openings. Further, Luxfer monitors the composition of its current workforce for diversity, age, and gender demographics. This data is used to enhance employment and recruitment practices and is continually improved to ensure that a diverse and talented workforce is maintained.
Financial, Physical, and Emotional Well-Being
Fair Wages and Competitive Benefits: Luxfer offers competitive base pay and, depending on position, variable incentive pay associated with both Company and individual performance. Full-time employees and, in some cases, part-time employees who have met the minimum hours of service requirement are eligible to participate in various retirement savings plans, such as the Company’s 401(k) defined contribution plan in the U.S. and various pension schemes available to U.K. employees. We also offer paid time off, group medical, dental, and vision plans, in addition to various life, disability and paid family and sick leave options, which vary by jurisdiction.
Employee Share Plans: Luxfer encourages participation in its U.S. Employee Stock Purchase Plan (ESPP) and U.K. Share Incentive Plan (SIP), which provide employees an opportunity to become Luxfer shareholders at a reduced price. Under the ESPP, U.S. employees can purchase Company stock at a 15% discount through payroll deductions. Under the SIP, U.K. employees can purchase company stock through payroll deductions and, in turn, the Company matches one free share per every two shares purchased.
Fitness and Wellness Programs: Luxfer is proud to offer several optional fitness and wellness programs and healthy living incentives to our employees. Our Employee Healthy Lifestyle Program is available to U.S. employees and offers partial reimbursement for certain gym and fitness center memberships, weight loss programs, and group exercise classes. U.S. employees are also eligible to participate in a smoking cessation program through which employees who complete a 90-day program are rewarded with lower insurance rates.
Emotional Well-Being: We support the social and emotional health of our employees by providing access to wellness clinics and funded mental health counseling services. As a part of Luxfer’s group medical insurance plan, U.S. employees have convenient access to live video visits with a board-certified doctors or licensed therapists. Luxfer also offers access to the Employee Assistance Program, which connects employees and their families with credentialed counselors, free of charge, to provide a variety of work-life services and resources for family matters, including legal assistance, financial budgeting, and more.
Available Information
Our Annual Report on Form 10-K, Quarterly Reports on Form 10-Q , Current Reports on Form 8-K and 6-K and any exhibits or amendments to thesesuch are made available, free of charge, on our website at http://www.luxfer.com as soon as reasonably practicable after we electronically file such reports with, or furnish them to, the Securities and Exchange Commission ("SEC"). Information on our website is not incorporated by reference herein and is not made a part of this report.
Financial and other material information regarding the companyCompany is routinely posted and accessible on our website at http://www.luxfer.com/investors.
Item 1A. Risk Factors
The risks described below are not the only risks facing us. Any of the following risks could materially and adversely affect our business, financial condition or results of operations. Additional risks and uncertainties not currently known to us or those we currently view to be immaterial may also materially and adversely affect our business, financial condition or results of operations. See also "Information Regarding Forward-Looking Statements" for certain warnings regarding forward-looking information contained in this document.
Our results of operations may be negatively impacted by the ensuing effects of the coronavirus disease pandemic, as well as the subsequent adverse impact on availability of key inputs and associated cost inflation.
Activity in most of the end markets we serve improved throughout 2021 and continued to Our Operationsimprove in 2022 following the global COVID-19 outbreak. The sharp recovery in demand across the global macro environment has resulted in supply chain challenges characterized by significant increases in material cost inflation on key inputs (including magnesium, aluminum and carbon fiber), labor availability issues and energy and transport cost increases. Currently, our expectation is that the impact of material and energy cost inflation and labor and transport constraints will continue into 2023. While we aim to pass on cost increases to customers through increased price, there is no guarantee that we will be able to do so in all circumstances (see: We are exposed to fluctuations in the costs of the raw materials that are used to manufacture our products, and such fluctuations could lead us to incur unexpected costs and could affect our margins and / or working capital requirements), and failure to do so could have a material adverse impact on our results of operations, financial position and cash flows.
We depend on certain end-markets, including automotive, alternative fuels, self-contained breathing apparatus ("SCBA"), aerospace, and defense, healthcare, oil and gas and printing and paper. An economic downturn, or regulatory changes, in any of those end-markets, could reduce sales and profit margins on those end-markets.
We have significant exposures to certain end-markets, including some end-markets that are cyclical in nature or subject to high levels of regulatory control, including automotive, self-contained breathing apparatus ("SCBA"),SCBA, aerospace and defense and printing and paper.defense. Dependence of either of our segments on certain end-markets is even more pronounced.
To the extent that any of these cyclical end-markets are in decline, at a low point in their economic cycle, or subject to regulatory change, sales and margins on those sales may be adversely affected. It is possible that all or most of these end-markets could be in decline at the same time, such asi.e. during a recession.an economic downturn. Any significant reduction in sales could have a material adverse impact on our results of operations, financial position and cash flows.
Our global operations expose us to economic conditions, potential tax costs, political risks and specific regulations or restrictions in the countries in which we operate, which could have a material adverse impact on our results of operations, financial position and cash flows.
We derive our sales and earnings from operations in many countries and are subject to risks associated with doing business internationally. We have wholly-owned operations in the U.S., the U.K., Canada France, the Czech Republic,and China, and Australia;as well as a joint venture facilities in India and Japan; and an associate in Australia.Japan. Doing business in different countries has risks, including the potential for adverse changes in the local, social, political, financial or regulatory climate, difficulty in staffing and managing geographically diverse operations, and the costs of complying with a variety of laws and regulations. For example, the changeRussian invasion of Ukraine and ongoing military conflict which commenced on February 24, 2022, has resulted in massive displacement of the Ukrainian population and huge disruption to its economy. Wide ranging sanctions have been imposed on the Russian Federation by the international community, targeting individuals, banks, businesses, funds transfers and imports and exports and are expected to have a significant adverse impact on Russia's economy as well as on international businesses active in the political climateregion. The impact on Luxfer in 2022 was not significant as we have no direct operations in the U.S.region, and our sales to Russia and Ukraine combined typically represent less than one percent of total revenue by destination. Furthermore, neither country is a critical supplier of our raw material needs, and while Russia is a major global exporter of magnesium, we are able to source the metal from various alternative locations, including China, Israel, Turkey and the United States. However, this has caused macro-economic disruption which could make it more challenging adversely affect the Company and/or expensive to import products manufactured in Europe.our supply chain, business partners or customers.
10
Due to the fact we have operations in many countries, we are also liable to pay taxes in many fiscal jurisdictions. Our tax burden depends on the interpretation of local tax regulations, bilateral or multilateral international tax treaties and the administrative doctrines in each jurisdiction. Changes in these tax regulations may increase our tax burden, or otherwise affect our accounting for taxes. For example, as a result ofin March 2021, the reductionU.K. government announced an increase in the statutory corporate incomerate of Corporation tax rate infrom the U.S. pursuantcurrent 19% to 25%, which will take effect from April 2023, and is expected to increase the future tax reform bill enactedburden on December 22, 2017, we recorded a reduction in the value ofearnings from our deferred tax assets in the U.S. of $4.0 million. Moreover, theU.K. operations.
The principal markets for our products are located in North America, Europe and Asia, and any financial difficulties experienced in these markets may have a material adverse impact on our businesses. For example, the maturity of some of our markets, particularlysuch as the U.S. medical oxygen cylinder market and the European fire extinguisher market,for photo-engraving plates, could require us to increase sales in developing regions, which may involve greater economic and political risks. We cannot provide any assurances that we will be able to expand sales in these regions. Any of these factors could have a material adverse impact on our results of operations, financial position and cash flows.
Our operations rely on a number of large customers in certain areas of our business, and the loss of any of our major customers could negatively impact our results of operations.
If we fail to maintain our relationships with our major customers, or fail to replace lost customers, or if there is reduced demand from our customers or for products produced by our customers, such failures or reduced demand could materially reduce our sales. In addition, we could experience a reduction in sales if any of our customers fail to perform or default on any payment pursuant to our contracts with them. Long-term relationships with customers are especially important for suppliers of intermediate materials and components such as ourselves. We often work closely with customers to develop products that meet particular specifications as part of the design of a product intended for an end-user market. The bespoke nature of many of our products could make it difficult to replace lost customers. Our top 10 customers accounted for approximately 25%31% of our net sales in 2018.2022. Any significant reduction in sales or customercustomer payment default could have an adverse material impact on our results of operations, financial position and cash flows.
We depend upon our larger suppliers for a significant portion of our raw materials, and a loss of one of these suppliers, or a significant supply interruption could negatively impact our financial performance.
We rely, to varying degrees, on major suppliers for some of the principal raw materials of our engineered products, including aluminum, zirconium and carbon fiber.fiber. For example, in 2018,2022, we obtained approximately 70%42% of our aluminum the largest single raw material purchased by the Gas Cylinders Segment, from Rio Tinto Alcan and its associated companies. Moreover, demand for carbon fiber is increasing, which has led to occasional periods of short supply in recent years with a number of expanding applications competing for the same supply of this specialized raw material. Our largest suppliers of carbon fiber are Toray and Grafil, a subsidiary of Mitsubishi Chemical. For additional details of some of our major suppliers (see ITEM 1 - Suppliers and raw materials).
We generally purchase raw materials from suppliers on a spot basis under standard terms and conditions. In 2017, we enteredWe also enter into a three-year supply contractcontracts with Rio Tinto Alcan for a substantial portion of our aluminum requirements. In addition, we have supply contracts in place with U.S. Magnesium for raw material purchases of magnesium ingot for both military and commercial applications. TheIn 2021 U.S. magnesium entered force majeure and deliveries reduced up until late 2022, when they ceased completely, with an expectation that they would not recommence until the second half of 2023. We successfully secured and qualified magnesium from alternative sources to meet requirements for both military contract covers magnesium purchases through December 31, 2020, whereasand commercial applications for the commercial contract covers through December 31, 2019.remainder of 2023.
An interruption in the supply of essential raw materials used in our production processes or an increase in the costs of raw materials due to market shortages, supplier financial difficulties, government quotas or natural disturbances, could significantly affect our ability to provide competitively priced products to customers in a timely manner. For example, the significant increase in demand for materials and energy stemming from the post-COVID economic recovery and current conflict in Ukraine has resulted in significant constraints on availability of key inputs such as magnesium, aluminum and energy supplies with a consequent spike in prices. In the event of a significant interruption in the supply of any materials used in our production
processes, or a significant increase in their prices, (as we have experienced, for example, at different times with aluminum, magnesium and rare earths), we may have to purchase these materials from alternative sources, build additional inventory of raw materials, increase our prices, reduce our margins or possibly fail to fill customer orders by deadlines required in contracts, which could result in, among other things, contractual penalties. We can provide no assurance that we would be able to obtain replacement materials quickly on similar terms or at all. Failure to maintain relationships with key suppliers or to develop relationships with alternative suppliers could have a material adverse effect on our results of operations, financial position and cash flows.
In in the prior year we were faced with two critical suppliers of magnesium and zirconium respectively declaring force majeure, of which the former remains in place. We have been successful in securing alternative sources of supply for key material inputs affected by force majeure, although typically at an increased cost.
11
We are exposed to fluctuations in the costs of the raw materials that are used to manufacture our products, and such fluctuations could lead us to incur unexpected costs and could affect our margins and / or working capital requirements.
Fluctuations in the costs of these raw materials could affect margins and working capital requirements in the businesses in which we use them, see ITEM 7.7A. We cannot always pass on cost increases or increase our prices to offset these cost increases immediately or at all, whether because of fixed-price agreements with customers, competitive pressures that restrict our ability to pass on cost increases or increase prices, or other factors. It can be particularly difficult to pass on cost increases or increase prices in product areas such as gas cylinders, where competitors offer similar products made from alternative materials, such as steel, if those materials are not subject to the same cost increases. Higher prices necessitated by large increases in raw material costs could make our current or future products unattractive compared to competing products made from alternative materials that have not been so affected by raw material cost increases, or compared to products produced by competitors who have not incurred such large increases in their raw material costs.
In the past several years and during 2022, we have made additional purchases of large stocks of magnesium chemicalsalloys in an effort to delay the effect of potentially increased costs in the future. However, even though such purchases are not made for speculative purposes, there can be no assurance that costs will move as expected.
Moreover, these strategic purchases increase our working capital needs, thus reducing our liquidity and cash flow.
Accordingly, a substantial increase in raw material costs could have a material adverse effect on our results of operations, financial position and cash flows.
Changes in foreign exchange rates could reduce profit margins on our sales and reduce the reported sales of our non-U.S. operations and have a material adverse effect on our results of operations.
We conduct a large portion of our commercial transactions, purchases of raw materials and sales of goods in various countries and regions, including the U.S., the U.K., continental Europe, Australia and Asia. Our manufacturing operations based in the U.S., continental Europe and Asia usually purchase raw materials and sell goods denominated in their local currency, but our manufacturing operations in the U.K. often purchase raw materials and sell products in different currencies. Changes in the relative values of currencies can decrease the profits of our subsidiaries when they incur costs in currencies that are different from the currencies in which they generate all or part of their revenue. These transaction risks principally arise as a result of purchases of raw materials in U.S. dollars, coupled with sales of products to customers in euros. This impact is most pronounced in our exports to continental Europe from the U.K. In 2018,2022, our U.K. operations sold approximately €61€53 million of goods into the Eurozone.Eurozone. Our policy is to hedge a portion of our net exposure to fluctuations in exchange rates with forward foreign currency exchange contracts. Therefore, we are exposed to market risk and credit risk through the use of derivative financial instruments. Moreover, any failure of hedging policies could negatively impact our profits, and thus damage our ability to fund our operations and to service our indebtedness. Whilst exchange rates have been more stable in 2018 and 2017 than in 2016 (immediately following the E.U. referendum in the U.K.), until the termsExchange rate volatility continues to be experienced against a background of the COVID-19 pandemic and U.K.'s future relationship with the E.U. are known, further exchange rate political uncertainty, and continued volatility is to be expected.
In addition to subsidiaries and joint ventures in the U.S., we have operating subsidiaries located in the U.K., Canada, France, the Czech Republic, China Germany and Australia, as well as a joint venturesventure in Japan, and India, and an associate in Australia,each of whose revenue, costs, assets and liabilities are denominated in local currencies. As our consolidated financial statements are reported in U.S. dollars,dollars, we are exposed to fluctuations in those currencies when those amounts are translated to U.S. dollars for purposes of reporting our consolidated financial statements, which may cause declines in results of operations. The largest risk is from our operations in the U.K., which, in 20182022, generated an operating profit of $13.5$6.4 million and sales revenue of $169.0$176 million. FluctuationsFluctuations in exchange rates, particularly between the U.S. dollar and GBP sterling (which has been subject to significant fluctuations, as described above), can have a material effect on our consolidated income statement and consolidated balance sheet. In 2018,2022, movements in the average U.S. dollar exchange rate had a negative impact impact on net sales of $15.6 million. In 2021 movements in the average U.S. dollar exchange rate had a positive impact on revenuenet sales of $2.5 million, in 2017; movements in the average U.S. dollar exchange rate had a positive impact on revenue of $6.4$9.5 million. Changes in translation exchange rates decreased net assets by $6.4$13.2 million in 2018,2022, compared to a increasedecrease of $11.9$0.8 million in 2017.2021.
These foreign exchange risks could have a material adverse effect on our results of operations, financial position and cash flows. For additional information on these risks, and the historical impact on our results, see ITEM 7A.
12
Our defined benefit pension plans historically have had funding deficits, (currently a surplus) and are exposed to market forces that could require us to make increased ongoing cash contributions in response to changes in market conditions, actuarial assumptions and investment decisions These market forces could expose us to significant short-term liabilities if a wind-up trigger occurred in relation to such plans, each of which could have a material adverse impact on our results of operations and financial position.
We have defined benefit pension arrangements in the U.K., and in the U.S. and France,, see ITEM 8, note 12.Note 14. Our largest defined benefit plan, the Luxfer Group Pension Plan, which closed to new members in 1998, remained open for accrual of future benefits based on career-average salary until April 5, 2016. However, following a consultation, it was agreed with the trusteesTrustees and plan members to close the Luxfer Group Pension Plan in the
U.K. to future accrual of benefits, effective from April 5, 2016. Moreover, for the purpose ofwhen increasing pensions in payment,pension benefit payments, it was agreed to use the CPI as the reference index, in place of the RPI where applicable. The Luxfer Group Pension Plan is funded according to the regulations in effect in the U.K. and, as of December 31, 2018,2022, and December 31, 2017,2021, had an accounting deficitsurplus of $31.8$27.0 million and $43.4$13.7 million, respectively. Luxfer Group LimitedThere is no guarantee that the principal employer undersurplus funding position will be maintained and adverse market movements could result in a reversion to a deficit funding position. According to the latest triennial actuarial valuation of the Luxfer Group Pension Plan as of April 5, 2021, the Luxfer Group Pension Plan had a deficit of £12.2 million on a plan-specific basis (reduced from £26.5 million at the previous valuation in April 2018). This valuation was carried out prior to a one-off deficit reduction contribution of £9.6 million made in December 2021. Should a wind-up trigger occur in relation to the Luxfer Group Pension Plan, the buy-out deficit of that plan will become due and otherpayable by the employers. The aggregate deficit of the Luxfer Group Pension Plan on a buy-out basis was estimated at £86 million as of April 5, 2021 (reduced from £145 million in April 2018). The Trustee has the power to wind-up the Luxfer Group Pension Plan if it determines that in the best interests of members, there is no reasonable purpose in continuing the Luxfer Group Pension Plan.
Following the actuarial valuation as of April 5, 2021, we agreed with the Trustee to make a one-off cash contribution in December 2021 of £9.6 million in addition to the £4.1 million annual payment agreed as a result of the previous valuation. While there is an expectation that no further contributions will be required until at least after the next valuation in 2024, there is no guarantee that this will be the case; and no contributions were made during 2022. The Trustee can request additional contributions, and the U.K. subsidiariesPensions Regulator ("TPR") has the power to order further funding in the current three-year window should increasingly stringent regulation require it (see Environmental and regulatory risks: The Pensions Regulator in the U.K. has the power in certain circumstances to issue contribution notices or financial support directions that, if issued, could result in significant liabilities arising for us). We remain legally responsible and committed to ensuring that the Luxfer Group Pension Plan has the funding required to meet its liabilities as they fall due. Future funding requirements will likely be reassessed and revised following the next triennial actuarial valuation in April 2024. Regulatory burdens have also participate underproved to be a significant risk, such as the plan. U.K.'s Pension Protection Fund Levy, which was £0.3 million in 2022.
Our other defined benefit plans are less significant than the Luxfer Group Pension Plan and, as of December 31, 2018,2022, and December 31, 2017,2021, had aggregate accounting deficits of $8.2$4.5 million and $11.9$1.9 million, respectively. The largest of these additional plans is the BA Holdings, Inc. Pension Plan in the U.S., which was closed to further benefit accruals in December 2005, and merged with the much smaller Luxfer Hourly Pension Plan, effective January 1, 2016. AccordingIn September 2021, we commenced an exercise that we expect to the actuarial valuationresult in a buyout of the Luxfer Group Pension Plan as of April 5, 2018, the Luxfer Group Pension Plan had a deficit of £26.5 million on a plan-specific basis. Should a wind-up trigger occurU.S. plan liability. An initial lump sum exercise took place in relation to the Luxfer Group Pension Plan, the buy-out deficit of that plan will become dueDecember 2022, with an annuity purchase and payable by the employers. The aggregate deficit of the Luxfer Group Pension Plan on a buy-out basis was estimated at £145 million as of April 5, 2018. The trustees have the power to wind-up the Luxfer Group Pension Plan if they consider thatfull buyout expected in the best interests of members there is no reasonable purpose in continuing the Luxfer Group Pension Plan.
We are exposed to various risks related to our defined benefit plans, including the risk of loss of market value of the plan assets, the risk of actual investment returns being less than assumed rates of return, the trusteesTrustees of the Luxfer Group Pension Plan switching investment strategy (which does require consultation with the employer), and the risk of actual experience deviating from actuarial assumptions for such things as mortality of plan participants. In addition, fluctuations in interest rates cause changes in the annual cost and benefit obligations.obligations, and increasingly stringent regulation can further increase the financial burden. Any of these risks could have a material adverse impact on our results of operations, financial position and cash flows.
13
Environmental and regulatory risks
The Pensions Regulator in the U.K. has the power in certain circumstances to issue contribution notices or financial support directions that, if issued, could result in significant liabilities arising for us.
The Pensions Regulator may issue a contribution notice to the employers that participate in the Luxfer Group Pension Plan, or any person who is connected with, or is an associate of, these employers where the Pensions Regulator is of the opinion that the relevant person has been a party to an act, or a deliberate failure to act, which had as its main purpose (or one of its main purposes) the avoidance of pension liabilities or where such act has a materially detrimental effect on the likelihood of payment of accrued benefits under the Luxfer Group Pension Plan being received. A person holding alone or together with his or her associates, directly or indirectly, one-third or more of our voting power, could be the subject of a contribution notice. The terms "associate" and "connected person," which are taken from the Insolvency Act 1986, are widely defined and could cover our significant shareholders and others deemed to be shadow directors. If the Pensions Regulator considers that a plan employer is "insufficiently resourced" or a "service company" (which terms have statutory definitions), it may impose a financial support direction requiring such plan's employer or any member of the Group, or any person associated or connected with an employer, to put in place financial support in relation to the Luxfer Group Pension Plan. Liabilities imposed under a contribution notice or financial support direction may be up to the difference between the value of the assets of the Luxfer Group Pension Plan and the cost of buying out the benefits of members and other beneficiaries of the Luxfer Group Pension Plan. The Pension Schemes Act 2021 further strengthened regulation in this area and includes new criminal and civil penalties for breaches in pensions law (including unlimited fines) and new notifiable events that apply to certain corporate transactions which have the potential to adversely affect the security of the pension plan and therefore increase the likelihood of a contribution notice. In practice, the risk of a contribution notice being imposed may restrict our ability to restructure or undertake certain corporate activities. Additional security may also need to be provided to the trusteesTrustee of the Luxfer Group Pension Plan before certain corporate activities can be undertaken (such as the payment of an unusual dividend), and any additional funding of the Luxfer Group Pension Plan may have a material adverse effect on our financial position and cash flows.
Our operations may prove harmful to the environment resulting in reputational damage and clean-up or other related costs.
We are exposed to substantial environmental costs and liabilities, including liabilities associated with divested assets and prior activities performed on sites before we acquired an interest in them. Our operations, including the production and delivery of our products, are subject to a broad range of continually changing environmental laws and regulations in each of the jurisdictions in which we operate. These laws and regulations increasingly impose more stringent environmental protection standards on us with respect to, among other things, air emissions, wastewater discharges, the use and handling of hazardous materials, noise levels, waste disposal practices, soil and groundwater contamination and environmental clean-up. Complying with these regulations involves significant and recurring costs.
We cannot predict our future environmental liabilities and cannot assure investors that our management is aware of every fact or circumstance regarding potential liabilities, or that the amounts provided and budgeted to address such liabilities will be adequate for all purposes. In addition, future developments, such as changes in regulations, laws or environmental conditions, may result in reputational damage or increase environmental costs and liabilities that could have a material adverse effect on our results of operations, financial position and cash flows.
The health and safety of our employees and the safe operation of our business is subject to various health and safety regulations in each of the jurisdictions in which we operate. These regulations impose various obligations on us, including the provision of safe working environments and employee training on health and safety matters. Complying with these regulations involves recurring costs.
Certain of our operations are highly regulated by different agencies that require products to comply with their rules and procedures and can subject our operations to penalties or adversely affect production.
Certain of our operations are in highly regulated industries that require us to maintain regulatory approvals and, from time to time, obtain new regulatory approvals from various countries. This can involve substantial time and expense. In turn, higher costs of compliance reduce our cash flows from operations. For example, manufacturers of gas cylinders throughout the world must comply with high local safety and health standards and obtain regulatory approvals in the markets in which they sell their products. Furthermore, military organizations require us to comply with applicable government regulations and specifications when providing products or services to them directly or as subcontractors. In addition, we are required to comply with U.S. and other export regulations with respect to certain products and materials. The E.U. has also passed legislation governing the registration, evaluation and authorization of chemicals, known as REACH, pursuant to which we are required to register
14
chemicals and gain authorization for the use of certain substances. Following the U.K.’s withdrawal from the E.U. and the subsequent transition period, the E.U. REACH Regulation has been brought into U.K. law, and REACH, and related legislation, have therefore been replicated in the U.K. In the U.S., there is similar legislation under the Toxic Substance Control Act 1976 ("TSCA") which was substantially amended in 2016. Although we make reasonable efforts to obtain all licenses and certifications that are required by countries in which we operate, there is always a risk that we may be found not to comply with certain required procedures. This risk grows with increased complexity and variance in regulations across the globe. As regulatory schemes vary by country, we may also be subject to regulations of which we are not presently aware and could be subject to sanctions by a foreign government that could materially and adversely affect our operations in the relevant country.
Governments and their agencies have considerable discretion to determine whether regulations have been satisfied. They may also revoke or limit existing licenses and certifications or change the laws and regulations to which we are subject at any time. If our operations fail to obtain, experience delays in obtaining or lose a needed certification or approval, we may not be able to sell our products to our customers, expand into new geographic markets or expand into new product lines. In addition, new or more stringent regulations, if imposed, could result in us incurring significant costs in connection with compliance. Non-compliance with these regulations could result in administrative, civil, financial, criminal or other sanctions against us, which could have negative consequences on our business and financial position. Furthermore, if we begin to operate in new countries, we may need to obtain new licenses, certifications and approvals.
Our customers are also often subject to similar regulations and risks. We therefore face the risk that our customers may have the demand for their products reduced as a result of regulatory matters that fall outside our direct control. This would in turn reduce demand for our products and have a negative financial impact on our operating results.
Any of these factors could have a material adverse impact on our results of operations, financial position and cash flows.
We are subject to legislation and regulations to reduce carbon dioxide and other greenhouse gas emissions.
Although we are working to improve our energy efficiency, our manufacturing processes and the manufacturing processes of many of our suppliers and customers are still energy-intensive and use or generate, directly or indirectly, greenhouse gases ("GHGs"). In recent years, current regulatory programs impacting GHG emissions from large industrial plants and other sources include the E.U. Emissions Trading Scheme, the CRC Energy Efficiency Scheme in the U.K. and certain federal and state programs in the U.S., including GHG reporting and permitting rules issued by the U.S.E.P.A and the California Cap and Trade Program.
Moreover, in December 2015, 195 countries participating in the United Nations Framework Convention on Climate Change, at its 21st Conference of the Parties meeting held in Paris, adopted a new global agreement on the reduction of climate change (the "Paris Agreement"). The Paris Agreement set a goal of holding the increase in global average temperature to well below 2 degrees Celsius and pursuing efforts to limit the increase to 1.5 degrees Celsius, to be achieved by commitments by the participating countries to set emissions reduction targets, referred to as "nationally determined contributions." The Paris Agreement came into effect on November 4, 2016, after it was ratified the previous month, with implementation efforts beginning from 2018 with reassessment every five years.
In November 2021, 197 countries joined together at the 26th Conference "COP26" in Glasgow, U.K., resulting in the Glasgow Climate Pact, which contains all necessary guidelines for fully implementing the Paris Agreement. The package of decisions within the Pact consists of a range of agreed items, including strengthened efforts to build resilience to climate change, to curb greenhouse gas emissions and to provide the necessary finance for both. Nations collectively agreed to work to reduce the gap between existing emission reduction plans and what is required to reduce emissions, so that the rise in the global average temperature can be limited to 1.5 degrees Celsius.
Increased costs of compliance with climate change regulations and the potential impact on energy costs could have a material adverse effect on our results of operations, financial position and cash flows.
15
Due to the nature and use of the products that we manufacture, we may in the future face large liability claims.
We are subject to litigation in the ordinary course of our business, which could be costly to us and which may arise in the future. We are exposed to possible claims for personal injury, death or property damage, which could result from a failure of a product manufactured by us or of a product integrating one of our products. For example, improperly manufactured gas cylinders could explode at high pressure, which can cause substantial personal and property damage. This risk may be increased through the use of new technologies, materials and innovations. We also supply many components into aerospace applications in which the potential for significant liability exposures necessitates additional insurance costs.
Many factors beyond our control could lead to liability claims, including:
•the failure of a product manufactured by a third party that incorporated components manufactured by us;
•the reliability and skills of persons using our products or the products of our customers; and
•the use by customers of materials or products that we produced for applications for which the material or product was not designed.
If we cannot successfully defend ourselves against claims, we may incur substantial liabilities. Even successful defense would require significant financial and management resources. Regardless of the merits or eventual outcome, liability claims may result in:
•decreased demand for our products;
•reputational injury;
•initiation of investigation by regulators;
•costs to defend related litigation;
•diversion of management time and resources;
•compensatory damages and fines;
•product recalls, withdrawals or labeling, marketing or promotional restrictions;
•loss of revenue;
•exhaustion of any available insurance and our capital resources; and
•a decline in our stock price.
We could be required to pay a material amount if a claim is made against us that is not covered by insurance or otherwise subject to indemnification or that exceeds the insurance coverage that we maintain. Moreover, we do not currently carry insurance to cover the expense of product recalls, and litigation involving significant product recalls or product liability could have a material adverse effect on our results of operations, financial position and cash flows.
We are exposed to risks related to cybersecurity threats and general information security incidents which may also expose us to liability under data protection laws, including the GDPR.
In the conduct of our business, we increasingly collect, use, transmit and store data on information technology systems. This data includes confidential information belonging to us, our customers and other business partners, as well as personally identifiable information of individuals, including our employees. Like other global companies, we have experienced, and expect to continue to be subject to, cybersecurity threats and incidents, ranging from employee error or misuse, individual attempts to gain unauthorized access to information technology systems, and to sophisticated and targeted measures known as advanced persistent threats, none of which have been material to the Company to date.
Although we devote significant resources to network security, data encryption and other measures to protect our information technology systems and data from unauthorized access or misuse, including those measures necessary to meet certain information security standards that may be required by our customers, there can be no assurance that these measures will be successful in preventing a cybersecurity or general information security incident. We also rely in part on the reliability of certain tested third parties' cybersecurity measures, including firewalls, virus solutions and backup solutions, and our business may be affected if these third-party resources are compromised.
Cybersecurity incidents may result in business disruption, the misappropriation, corruption or loss of confidential information (including personally identifiable information) and critical data (ours or that of third parties), reputational damage, litigation with third parties, regulatory fines, diminution in the value of our investment in research and development and data privacy issues and increased information security protection and remediation costs. As these cybersecurity threats, and government and regulatory oversight of associated risks,
16
continue to evolve, we may be required to expend additional resources to remediate, enhance or expand upon the cybersecurity protection and security measures we currently maintain. For example, we are subject to the European Union’s General Data Protection Regulation ("GDPR"), which became enforceable from May 25, 2018, and, following the U.K.'s exit from the E.U. on January 31, 2020, our U.K. based businesses are subject to U.K.-GDPR, which enshrines equivalent requirements in U.K. law. The GDPR introduced a number of new obligations for subject companies, resulting in the need to continue dedicating financial resources and management time to GDPR compliance. Among other things, the GDPR places subject companies under obligations relating to the security of the personally identifiable information they process. While we have taken steps to ensure compliance with the GDPR, there can be no assurance that the measures we have taken will be successful in preventing an incident, including a cybersecurity incident or other data breach, which results in a breach of the GDPR. Fines for non-compliance with the GDPR may be levied up to a maximum of €20,000,000 or 4% of the subject company’s annual, group-wide turnover (whichever is higher). Individuals who have suffered damage as a result of a subject company’s non-compliance with the GDPR also have the right to seek compensation from such a company.
Future cybersecurity breaches, general information security incidents, further increases in data protection costs or failure to comply with relevant legal obligations regarding protection of data could therefore have a material adverse effect on our results of operations, financial position and cash flows.
We could incur future liability claims arising from previous businesses now closed or sold.
We have sold or closed a number of businesses over the years, but the products or services provided when the businesses were open and under our ownership could still result in potential liabilities, which could have a material adverse effect on our operations, financial position and cash flows.
17
Risks associated to new and existing products
Our ability to remain profitable depends on our ability to protect and enforce our intellectual property, and any failure to protect and enforce such intellectual property could have a material adverse impact on our results of operations and financial position.
We cannot ensure that we will always have the ability to protect proprietary information and our intellectual property rights. We protect our intellectual property rights (within the U.S., Europe and other countries) through various means, including patents and trade secrets. Due to the difference in foreign trademark, patent and other laws concerning proprietary rights, our intellectual property rights may not receive the same degree of protection in other countries as they would in the U.S. or the U.K. The patents we own could be challenged, invalidated or circumvented by others and may not be of sufficient scope or strength to provide us with any meaningful protection or commercial advantage. Further, competitors may infringe our patents and the costs of protecting our patents could be significant. We cannot assure you that we will have adequate resources to enforce our patents. Our patents will only be protected for the duration of the patent. Some of our older key patents have expired, and others will expire over the next few years. As a result, our competitors may introduce products using the technology previously protected, and these products may have lower prices than our products, which may negatively affect our market share. To compete, we may need to reduce our prices for those products. Additionally, the expiry of certain of those patents has reduced, or will reduce, barriers to entry to possible competitors for certain products and end-markets. With respect to our unpatented proprietary technology, it is possible that others will independently develop the same or similar technology or obtain access to our unpatented technology. To protect our trade secrets and other proprietary information, we require employees, consultants, advisors and collaborators to enter into confidentiality agreements. Nevertheless, we cannot assure you that these agreements will provide meaningful protection for our trade secrets, know-how or other proprietary information in the event of any unauthorized use, misappropriation or disclosure of such trade secrets, know-how or other proprietary information. We rely on our trademarks, trade names and brand names to distinguish our products from the products of our competitors, and we have registered or applied to register many of these trademarks. Third parties may also oppose our trademark applications, or otherwise challenge our use of the trademarks. In the event that our trademarks are successfully challenged, we could be forced to rebrand our products, which could result in loss of brand recognition and could require us to devote resources to advertising and marketing new brands. Further, we cannot assure you that competitors will not infringe our trademarks or that we will have adequate resources to enforce our trademarks.
Any failure to maintain, protect and enforce our intellectual property or the expiry of patent protection could have a material adverse impact on our results of operations, financial position and cash flows.
Expiration or termination of our right to use certain intellectual property granted by third parties, the right of those third parties to grant the right to use the same intellectual property to our competitors, and the right of certain third parties to use certain intellectual property used as part of our business, could have a material adverse impact on our results of operations, financial position and cash flows.
We have negotiated, and may from time to time in the future negotiate, licenses with third parties with respect to third party proprietary technologies used in certain of our manufacturing processes and products. If any of these licenses expire or terminate, we will no longer retain the rights to use the relevant third party proprietary technologies in our manufacturing processes and products, which could have a material adverse effect on our results of operations, financial position and cash flows. Further, the rights granted to us might be non-exclusive, which could result in our competitors gaining access to the same intellectual property.
Some of our patents may cover inventions that were conceived or first reduced to practice under, or in connection with, government contracts or other government funding agreements or grants. With respect to inventions conceived or first reduced to practice under such government funding agreements, a government may retain a non-exclusive, irrevocable, royalty-free license to practice, or have practiced for or on behalf of the relevant country, the invention throughout the world. In addition, if we fail to comply with our reporting obligations, or to adequately exploit the developed intellectual property under these government funding agreements, the relevant country may obtain additional rights to the developed intellectual property, including the right to take title to any patents related to government funded inventions or to license the same to our competitors. Furthermore, our ability to exclusively license or assign the intellectual property developed under these government funding agreements to third parties may be limited or subject to the relevant government's approval or oversight. These limitations could have a significant impact on the commercial value of the developed intellectual property.
We often enter into research and development agreements with academic institutions whereby they generally retain certain rights to the developed intellectual property. The academic institutions generally retain rights over the technology for use in non-commercial academic and research fields, including in some cases the right to license the technology to third parties for use in those fields. It is difficult to monitor and enforce such non-commercial academic and research uses, and we cannot predict whether the third party licensees would comply
18
with the use restrictions of these licenses. We could incur substantial expenses to enforce our rights against such licensees. In addition, even though the rights that academic institutions obtain are generally limited to the non-commercial academic and research fields, they may obtain rights to commercially exploit developed intellectual property in certain instances. Under research and development agreements with academic institutions, our rights to intellectual property developed thereunder are not always certain, but instead may be in the form of an option to obtain license rights to such intellectual property. If we fail to exercise our option rights in a timely way and / or we are unable to negotiate a license agreement, the academic institution may offer a license to the developed intellectual property to third parties for commercial purposes. Any such commercial exploitation could adversely affect our competitive position and have a material adverse effect on our business.
If third parties claim that intellectual property used by us infringes upon their intellectual property, our operating profits could be adversely affected.
We may, from time to time, be notified of claims that we are infringing upon patents, copyrights, or other intellectual property rights owned by third parties, and we cannot provide assurances that other companies will not in the future pursue such infringement claims against us or any third party proprietary technologies we have licensed. If we were found to infringe upon a patent or other intellectual property right, or if we failed to obtain or renew a license under a patent or other intellectual property right from a third party, or if a third party from whom we are licensing technologies was found to infringe upon a patent or other intellectual property rights of another third party, we may be required to pay damages, suspend the manufacture of certain products or re-engineer or rebrand our products, if feasible, or we may be unable to enter certain new product markets. Any such claims could also be expensive and time consuming to defend and could divert management's attention and resources. In addition, if we have omitted to enter into a valid non-disclosure or assignment agreement for any reason, we may not own the invention or our intellectual property and may not be adequately protected. Our competitive position could suffer as a result of any of these events and have a material adverse impact on our results of operations, financial position and cash flows.
Any failure of our research and development activity to improve our existing products and develop new products could cause us to lose market share.
Our products are highly technical in nature, and in order to maintain and improve our market position, we depend on successful research and development activity to continue to improve our existing products and develop new products. We cannot be certain that we will have sufficient research and development capability to respond to changes in the industries in which we operate. These changes could include changes in the technological environment in which we currently operate, increased demand for new products or the development of alternatives to our products. For example, the development of lighter weight steel alloys has made the use of steel in gas cylinders a more competitive alternative to aluminum than it had been previously. In addition, our superformed aluminum components compete with new high-performance composite materials developed for use in the aerospace industry. In our efforts to develop and market new products and enhancements to our existing products, we may fail to identify new product opportunities or timely bring new products to market. We may also experience delays in completing development of, enhancements to or new versions of our products, and product innovations may not achieve the market penetration or price stability necessary for profitability. In addition to benefiting from our research collaboration with universities, we spent $6.4$4.9 million, $7.8$3.9 million and $7.6$3.3 million in 2018, 20172022, 2021 and 20162020, respectively, on our own research and development activities. We expect to fund our future research and development expenditure requirements through operating cash flows and restricted levels of indebtedness, but if operating profit decreases, we may not be able to invest in research and development or continue to develop new products or enhancements.
Without the timely introduction of new products or enhancements to existing products, our products could become obsolete over time, in which case our results of operations, financial position and cash flows could be adversely affected.
While climate change regulation presents opportunities for Luxfer to develop new product lines and increase our operating costs, thus reducing cash flows from operations. In particular, the breakdownsales of some of our older equipment,climate-friendly products such as alternative fuel hydrogen cylinders and lightweight magnesium alloys, the large hot-rolling mill atimpact on our Madison, Illinois plant, could be difficult to repair and would be very costly should it need to be replaced. Any failure to deliver products to our customers in a timely manner could adversely affect our customer relationships and reputation. Any failure to implement required investments, due to the need to divert funds to repair existing
19
Operational Risks
We are exposed to substantial environmental costs and liabilities, including liabilities associated with divested assets and prior activities performed on sites before we acquired an interest in them. Our operations, including the production and delivery of our products, are subject to a broad range of continually changing environmental laws and regulations in each of the jurisdictions in which we operate. These laws and regulations increasingly impose more stringent environmental protection standards on us with respect to, among other things, air emissions, wastewater discharges, the use and handling of hazardous materials, noise levels, waste disposal practices, soil and groundwater contamination and environmental clean-up. Complying with these regulations involves significant and recurring costs.
As part of our strategy, we have supplemented and may continue to supplement organic growth by acquiring companies or operations engaged in connectionsimilar or complementary businesses. If the consummation of future acquisitions, together with compliance. Non-compliance with these regulationsintegration of acquired companies and businesses, excessively diverts management's attention from the operations of our existing businesses, operating results could result in administrative, civil, financial, criminalsuffer. Any acquisition made could be subject to a number of risks, including:
•failing to discover liabilities of the acquired company or other sanctions against us,business for which could have negative consequences on our business and financial position. Furthermore, if we begin to operate in new countries, we may need to obtain new licenses, certificationsbe responsible as a successor owner or operator, including litigation or environmental costs and approvals.liabilities;
•increased debt service requirements as a result of regulatory matters that fall outside our direct control. This wouldincreased indebtedness to complete acquisitions;
•the loss of key personnel in turn reduce demand for our products and have the acquired company or business;
•a negative financial impacteffect on our operating results.financial results resulting from an impairment of acquired intangible assets, the creation of provisions, or write downs; and / or
We cannot ensure that every acquisition will ultimately provide the benefits originally anticipated, which could ultimately have a material adverse impact on our results of operations, financial position and cash flows.
A failure to perform under purchase or sale contracts could result in the payment of penalties to suppliers and additional future legislation and regulations aimed at reducing GHG emissions/ or customers, which could have a negative impact on our results of operations, financial position or cash flows. Certain contracts with suppliers could obligate us to purchase a minimum product volume (clauses known as "take or pay"), and contracts with customers may impose firm commitments for the delivery of certain quantities of products within certain time periods. The risk of incurring liability under a take or pay supply contract would increase during an economic crisis, which in turn would increase the likelihood of a sharp drop in demand for our products, resulting in a potential material adverse effect on our results of operations, financial position and cash flows.
Our businesses could suffer if we lose certain employees or cannot attract and retain qualified employees.
We rely upon a number of key executives and employees, particularly members of the Executive Leadership Team. If these and certain other employees ceased to work for us, we would lose valuable expertise and industry experience and could become less profitable. We do not carry "key-man"key person insurance covering the loss of any of our executives or employees.
In addition, future operating results depend in part upon our ability to attract and retain qualified engineering and technical personnel. As a result of intense competition for talent in the market, we cannot ensure that we will be able to continue to attract and retain such personnel. While our key employees are generally subject to non-competition agreements for a limited period of time following the end of their employment, if we were to lose the services of key executives or employees, it could adversely impact our ability to maintain our technological position, and / or have a material adverse effect on our results of operations, financial position and cash flows.
20
We could suffer a material interruption in our operations as a result of unforeseen events or operating hazards.hazards, including severe weather events linked to climate change.
Our production facilities are located in a number of different locations around the world. Any of our facilities could suffer an interruption in production, either at separate times or at the same time, because of various and unavoidable occurrences, such asoccurrences. These include severe weather events that may become more frequent or extreme due to the effects of climate change (for example, hurricanes and floods), or other adverse events such as earthquakes, casualty events (for example, explosions, fires or material equipment breakdowns), acts of terrorism, pandemic disease, labor disruptions or other events (for example, required maintenance shutdowns). For example,instance, our operations in California are subject to risks related to earthquakes. Further disruption occurred during 2015 at our Riverside, California, facility when an electrical arc caused damage to electrical equipment which triggered a power outage at the facility. In addition, some of our products are highly flammable, and there is a risk of fire inherent in their production process. Such hazards could cause personal injury or death, serious damage to, or destruction of, property and equipment, suspension of operations, substantial damage to the environment and / or reputational harm. The risk is particularly high in the production and handling of ultra-fine magnesium powders, which are highly flammable and potentially explosive in certain situations.situations or if mishandled. Similar disruptions in the operations of our suppliers and / or customers could materially affect our business and operations. Although we carry certain levels of business interruption insurance, the coverage on certain catastrophic events or natural disasters, a failure of energy supplies and certain other events, is limited, and it is possible that the occurrence of such events may have a significant adverse impact on our results of operations, financial position and cash flows.
Employee strikes and other labor-related disruptions may adversely affect our operations.
Several of our production facilities depend on employees who are members of various trade union organizations. Strikes by, or labor disputes with, our employees may adversely affect our ability to conduct business. For example, on November 26, 2018, we announced a consultation process which proposes to close our Luxfer Gas Cylinders production facility in Gerzat, France, in 2019. There is therefore an increased risk of disruption to operations as negotiations with the workforce progress.
We cannot assure you that there will not be any strike, lock-out or material labor dispute in the future. Work interruptions or stoppages could have a material adverse effect on our results of operations, financial position and cash flows.
As a holding company, Luxfer Holdings PLC's main source of cash is distributions from our operating subsidiaries.
Our ultimate parent company, Luxfer Holdings PLC, conducts all of its operations through the subsidiaries of Luxfer Group.its subsidiaries. Accordingly, its main cash source is dividends from these subsidiaries. The ability of each subsidiary to make distributions depends on the funds that a subsidiary receives from its operations in excess of the funds necessary for its operations, obligations or other business plans. Since Luxfer Groupthe subsidiaries are wholly-owned, claims of Luxfer Holdings PLC will generally rank junior to all other obligations of the subsidiaries. If Luxfer GroupLuxfer's operating subsidiaries are unable to make distributions, Luxfer Group'sLuxfer's growth may slow, unless we are able to obtain additional debt or equity financing. In the event of a subsidiary's liquidation, there may not be assets sufficient for us to recoup our investment in the subsidiary.
We have a significant amountlevel of indebtedness which mayhas reduced over time, but could adversely affect our cash flows and our ability to operate our business, remain in compliance with debt covenants, make payments on our indebtedness, pay dividends and respond to changes in our business or take certain actions.
As of December 31, 2018,2022, we had $75.0$50.0 million of indebtedness under our senior notes (the "Loan Notes") divided into two equal tranches of $25.0 million $25.0 million and $25.0 million due 2021,in 2023 and 2026, respectively. There was also a nil$31.9 million balance on the revolving credit facility ("RCF") and a bank overdraft of $3.5 million as of December 31, 2018.2022.
Our indebtedness could have important consequences. For example, it could make it more difficult for us to satisfy obligations with respect to indebtedness, and any failure to comply with the obligations of any of our debt instruments, including financial and other restrictive covenants, could result in an event of default under agreements governing our indebtedness. Further, our indebtedness could require us to dedicate a substantial portion of available cash flows to pay principal and interest on our outstanding debt, which would reduce the funds available for working capital, capital expenditures, dividends, acquisitions and other general corporate purposes. Our indebtedness could also limit our ability to operate our business, including the ability to engage in strategic transactions or implement business strategies. Factors related to our indebtedness could materially and adversely affect our business and our results of operations. Furthermore, our interest expense could increase if interest rates rise, because certain portions of our debt facilities bear interest at floating rates. If we do not have sufficient cash flows to service our debt, we may be required to refinance all or part of our existing debt, sell assets, incur further indebtedness or sell securities, none of which we can guarantee we will be able to do.
21
In addition, the agreements that govern the terms of our indebtedness contain, and any future indebtedness would likely contain, a number of restrictive covenants imposing significant operating and financial restrictions on us, including restrictions that may limit our ability to engage in acts that may be in our long-term best interests, including:
•incurring or guaranteeing additional indebtedness;
•capital expenditures;
•paying dividends (including to fund cash interest payments at different entity levels) or making redemptions, repurchases or distributions with respect to ordinary shares or capital stock;
•creating or incurring certain security interests;
•making certain loans or investments;
•engaging in mergers, acquisitions, investment in joint ventures, amalgamations, asset sales and sale and leaseback transactions; and
•engaging in transactions with affiliates.
These restrictive covenants are subject to a number of qualifications and exceptions. The operating and financial restrictions and covenants in our existing debt agreements and any future financing agreements may adversely affect our ability to finance future operations or capital needs or to engage in other business activities.
We may be able to incur significant additional indebtedness in the future. Although the agreements governing our indebtedness contain restrictions on the incurrence of certain additional indebtedness, these restrictions are subject to a number of important qualifications and exceptions, and the indebtedness incurred in compliance with these restrictions could be substantial. If we incur new indebtedness, the related risks, including those described above, could intensify.
Any of these factors could have a material adverse impact on our results of operations, financial position and cash flows.
22
Our ability to pay regular dividends on our ordinary shares is subject to the discretion of our Board of Directors and will depend on many factors, including our results of operations, cash requirements, financial position, contractual restrictions, applicable laws and other factors, and may be limited by our structure and statutory restrictions and restrictions imposed by the Revolving Credit Facility and the Loan Notes, as well as any future debt facilities.
We may declare cash dividends on our ordinary shares as described in ITEM 8. However, the payment of future dividends will be at the discretion of our Board of Directors. Any recommendation by our Board to pay dividends will depend on many factors, including our results of operations, cash requirements, financial position, contractual restrictions, applicable laws and other factors, including availability of future debt facilities. Under English law, any payment of dividends would be subject to the Companies Act 2006 of England and Wales (the "Companies Act"), which requires, among other things, that we can only pay dividends on ordinary shares out of profits available for distribution determined in accordance with the Companies Act. Additionally, any change in the level of our dividends or the suspension of the payment thereof could adversely affect the market price of our ordinary shares.
If we fail to establish or maintain an effective system of internal controls, we may be unable to accurately report our financial results or prevent fraud, and investor confidence and the market price of our ordinary shares may, therefore, be adversely impacted.
We are subject to reporting obligations under U.S. securities laws. Our reporting obligations as a public company place a significant strain on our management, operational and financial resources and systems for the foreseeable future. Our management is required to report on the effectiveness of our internal control over financial reporting, as required annually by Section 404(a), and from January 1, 2019, quarterly by Section 302 of the Sarbanes-Oxley Act, for which we perform system and process evaluation and testing of our internal control over financial reporting.
Over time we may identify and correct deficiencies or weaknesses in our internal controls and, where and when appropriate, report on the identification and correction of these deficiencies or weaknesses. However, the internal control procedures can provide only reasonable, and not absolute, assurance that deficiencies or weaknesses are identified. Deficiencies or weaknesses that have not been identified by us could emerge, and the identification and correction of these deficiencies or weaknesses could have a material adverse impact on our results of operations. If our internal controlcontrols over financial reporting are not considered adequate, this may adversely affect our ability to report our financial results on a timely and accurate basis, which may result in a loss of public confidence or have an adverse effect on the market price of our ordinary shares, which could then adversely impact our ability to access equity markets and could have a material adverse impact on our results of operations, financial position and cash flows.
It may be difficult to effect service of U.S. process and enforce U.S. legal processprocesses against the directors of Luxfer.
Luxfer is a public limited company incorporated under the laws of England and Wales. A number of our directors and officers reside outside of the U.S., principally in the U.K. A substantial portion of our assets, and the assets of such persons, are located outside of the U.S. Therefore, it may not be possible to effect service of process within the U.S. upon Luxfer or these persons in order to enforce judgments of U.S. courts against Luxfer or these persons based on the civil liability provisions of the U.S. federal securities laws. There is doubt as to the enforceability in England and Wales, in original actions or in actions for enforcement of judgments of U.S. courts, of civil liabilities solely based on the U.S. federal securities laws.
23
Item 1B. Unresolved Staff Comments
None.
Item 2. Properties
Our principal office is located in owned premises in Manchester, United Kingdom, and our managementexecutive office in the United States is located in leased premises in Milwaukee, Wisconsin.Wisconsin and we also have a corporate office located in owned premises in Manchester, United Kingdom. Our operations are conducted in facilities throughout the world. These facilities house manufacturing and distribution operations, as well as sales and distribution offices.
We carry out Elektron manufacturing operations at six plants in the United States and one plant in the United Kingdom.
We carry out Gas Cylinders manufacturing operations at two plants in the United States and single plants in each of the United Kingdom, Canada and the Czech Republic.
We have a further plant in the United States which is classified as discontinued operations.
Our manufacturing plants comprise both owned and leased properties. We believe that our production facilities are suitable for their purpose and are adequate to support our businesses.
| Division | Property / Plant | Principal products manufactured | Ownership | Approximate area (square feet) | |||||||||||||||||||||||||||||||
| Elektron | |||||||||||||||||||||||||||||||||||
| Manchester, England | Magnesium alloys / zirconium chemicals | Split Lease / Own | |||||||||||||||||||||||||||||||||
| Madison, IL | Magnesium sheet | Lease | |||||||||||||||||||||||||||||||||
| Tamaqua, PA | Magnesium powders | Own | |||||||||||||||||||||||||||||||||
| Lakehurst, NJ | Magnesium powders | Own | |||||||||||||||||||||||||||||||||
| Flemington, NJ | Zirconium chemicals | Own | 65,000 | ||||||||||||||||||||||||||||||||
| Cincinnati, OH | Magnesium heating pads | Lease | 150,000 | ||||||||||||||||||||||||||||||||
| Saxonburg, PA | Magnesium powders | Own | |||||||||||||||||||||||||||||||||
| Gas Cylinders | |||||||||||||||||||||||||||||||||||
| Nottingham, England | Lease | ||||||||||||||||||||||||||||||||||
| Composite cylinders | Lease | ||||||||||||||||||||||||||||||||||
| Riverside, CA | Composite cylinders | Lease / Own | |||||||||||||||||||||||||||||||||
| Discontinued operations | |||||||||||||||||||||||||||||||||||
| Lease | |||||||||||||||||||||||||||||||||||
Item 3. Legal Proceedings
Item 4. Mine Safety Disclosures
Not applicable.
24
PART II
Item 5. Market for Registrant's Common Equity, Related Stockholder Matters and Issuer Purchases of Equity Securities
Market Information
Our common stock is listed on the New York Stock Exchange and is traded under the symbol "LXFR." As of December 31, 20182022, the companyCompany had 1819 shareholders of record.
Dividends
During the years ended December 31, 20182021 and 2017,2020, and in February 2022, the Company paid quarterly dividends of $0.125 per ordinary share whichshare. In the final three quarters of 2022, the Company paid quarterly dividends of $0.13 per ordinary. This equated to $13.4$14.2 million paid in 2022 and $13.3$13.6 million in 20182021 and 2017,2020 respectively. A further dividend of $3.6 million was declared and paid in the first quarter of 2023. The declaration and payment of any future dividends will be at the discretion of our Board of Directors and will depend upon our results of operations, cash requirements, financial position, contractual restrictions, restrictions imposed by our indebtedness, any future debt agreements or applicable laws and other factors that our Board of Directors may deem relevant. As with all dividends declared to date, we expect future dividends to be paid out of our earnings.
Any payment of dividends is also subject to the provisions of the U.K. Companies Act, according to which dividends may only be paid out of profits available for distribution determined by reference to financial statements prepared in accordance with the Companies Act and IFRS as adopted by the E.U.,International Accounting Standards Board, which differ in some respects from U.S. GAAP. In the event that dividends are paid in the future, holders of the ordinary shares will be entitled to receive payments in U.S. dollars in respect of dividends on the underlying ordinary shares in accordance with the deposit agreement. Furthermore, because we are a holding company, any dividend payments would depend on cash flows from our subsidiaries.
United Kingdom tax consequences for holders of common stock
The United Kingdom tax consequences discussed below do not reflect a complete analysis or listing of all the possible United Kingdom tax consequences that may be relevant to holders of our common stock. Furthermore,Moreover, the statements below only apply to holders of our common stock who are residentresidents for tax purposes outside of the United Kingdom.
Investors should consult their own tax advisers in respect of the tax consequences related to receipt, ownership, purchase or sale or other disposition of our common stock.
United Kingdom withholding tax
Under current law, the Company is not required to make any deduction or withholding for or on account of United Kingdom tax from dividends distributed on our common stock, irrespective of the tax residence or individual circumstances of the recipient shareholder.
United Kingdom income tax on dividends
A non-United Kingdom tax resident holder of our common stock will not be subject to United Kingdom income taxes on dividend income and similar distributions in respect of our shares, unless the shares are attributable to a permanent establishment or a fixed place of business maintained in the United Kingdom by such non-U.K.non-United Kingdom holder.
Stamp duty and stamp duty reserve tax ("SDRT")
While the ordinary shares are held within a depositarydepository trust company ("DTC"), provided that DTC satisfies various conditions specified in U.K. legislation, electronic book-entry transfers of such shares should not be subject to U.K. stamp duty, and agreements to transfer such shares should not be subject to U.K. stamp duty reserve tax (“SDRT”). The parties have obtained confirmation of this position by way of formal clearance by HMRC. Likewise, transfers of, or agreements to transfer, the ordinary shares from the DTC clearance service into another clearance service or into a depositarydepository receipt system should not, provided that the other clearance service or depositarydepository receipt system satisfies various conditions specified in U.K. legislation, be subject to U.K. stamp duty or SDRT.
In the event that the ordinary shares have left the DTC clearance service, otherwiseother than into another clearance service or depositarydepository receipt system, any subsequent transfer of, or agreement to transfer, such ordinary shares may, subject to any available exemption or relief, be subject to U.K. stamp duty or SDRT at a rate of 0.5% of the consideration for such transfer or agreement. Any such U.K. stamp duty or SDRT will generally be payable by the transferee and must be paid (and any relevant transfer document stamped by HMRC) before the transfer can be registered in the books of Luxfer Holdings PLC.
25
In the event that ordinary shares which have left the DTC clearance service, otherwiseother than into another clearance service or depositarydepository receipt system, are subsequently transferred back into a clearance service or depositarydepository receipt system, such transfer, or agreement to transfer, may, subject to any available exemption or relief, be subject to U.K. stamp duty or SDRT at a rate of 1.5% of the consideration for such transfer (or, where there is no such consideration, 1.5% of the value of such ordinary shares). In practice, this liability for stamp duty or SDRT is in generalgenerally borne by the person depositing the relevant shares in the clearance service or depositarydepository receipt system.
Share performance graph
The following information under the caption "Share Performance Graph" in this ITEM 5 of this Annual Report on Form 10-K is not deemed to be "soliciting material" or to be "filed" with the SEC or subject to Regulation 14A or 14C under the Securities Exchange Act of 1934, as amended (the "Exchange Act"), or subject to the liabilities of Section 18 of the Exchange Act and will not be deemed to be incorporated by reference into any filing under the Securities Act of 1933, as amended, or the Exchange Act, except to the extent we specifically incorporate it by reference into such a filing.
The following graph sets forth the cumulative total shareholder return on our ordinary shares for the last five years, assuming thean investment of $100 on December 31, 2013,2017, and the reinvestment of all dividends since that date to December 31, 2018.2022. The graph also contains for comparison purposes the Russell 2000 Index, assuming the same investment level and reinvestment of dividends.
By virtue of our market capitalization and characteristics, we believe the Russell 2000 Index is an appropriate published industry index for comparison purposes.
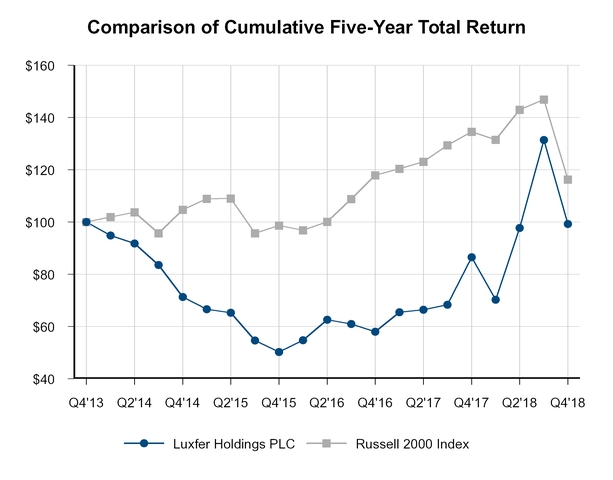
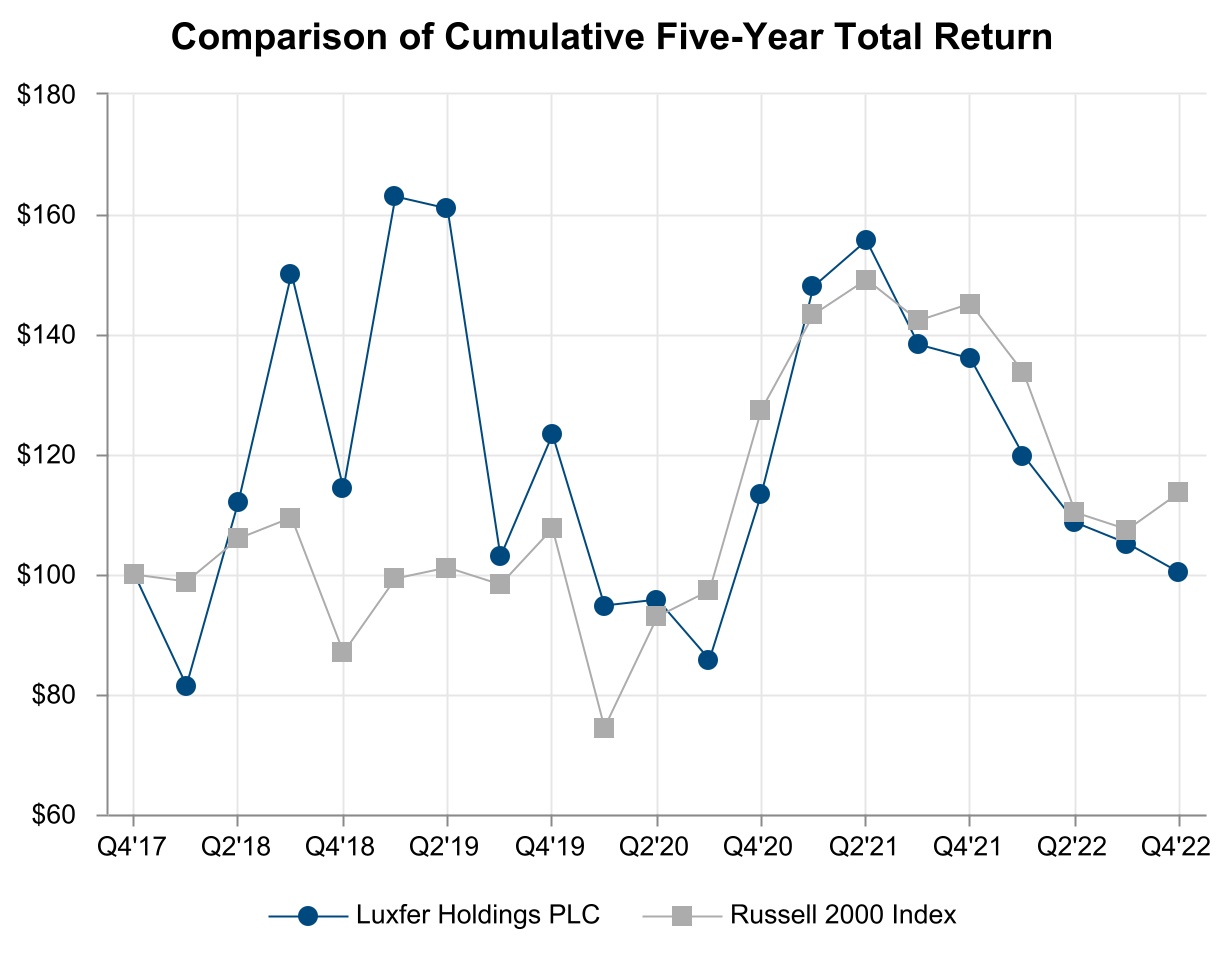
Purchase of Equity Securities
Item 6. Selected Financial and Other Data[Reserved]
26
| Years ended December 31, | ||||||||||||||||||||||
| In millions except share and per-share data | 2018 | 2017 | 2016 | 2015 | 2014 | |||||||||||||||||
| Consolidated statements of operations and comprehensive income data | ||||||||||||||||||||||
| Net sales | $ | 487.9 | $ | 441.3 | $ | 414.8 | $ | 460.3 | $ | 489.5 | ||||||||||||
| Operating income | 30.0 | 21.9 | 32.9 | 15.0 | 48.5 | |||||||||||||||||
| Net income / (loss) | 25.0 | 16.6 | 17.8 | (0.4 | ) | 37.3 | ||||||||||||||||
| Per-share data | ||||||||||||||||||||||
| Earnings / (loss) per ordinary share | ||||||||||||||||||||||
| Basic | 0.94 | 0.63 | 0.67 | (0.01 | ) | 1.39 | ||||||||||||||||
| Diluted | 0.90 | 0.62 | 0.67 | (0.01 | ) | 1.34 | ||||||||||||||||
| Weighted average ordinary shares outstanding | ||||||||||||||||||||||
| Basic | 26,708,469 | 26,460,947 | 26,443,662 | 26,918,987 | 26,889,330 | |||||||||||||||||
| Diluted | 27,692,262 | 26,723,981 | 26,654,638 | 27,328,190 | 27,735,793 | |||||||||||||||||
Cash dividends declared and paid1 | $ | 13.4 | $ | 13.3 | $ | 13.3 | $ | 10.8 | $ | 10.8 | ||||||||||||
Cash dividends declared and unpaid1 | 3.4 | 3.4 | 3.3 | 3.4 | 2.7 | |||||||||||||||||
| Consolidated balance sheets data | ||||||||||||||||||||||
| Total assets | $ | 390.4 | $ | 415.8 | $ | 399.8 | $ | 449.9 | $ | 474.5 | ||||||||||||
| Total long-term obligations | 118.4 | 157.3 | 196.2 | 197.2 | 219.4 | |||||||||||||||||
| Total shareholders' equity | 184.3 | 174.5 | 150.4 | 183.8 | 190.2 | |||||||||||||||||
Item 7. Management's Discussion and Analysis of Financial Condition and Results of Operations
Information regarding forward-looking statements
This Annual Report on Form 10-K contains certain statements, statistics and projections that are, or may be, forward-looking. These forward-looking statements are subject to known and unknown risks, uncertainties, assumptions and other factors that could cause our actual results of operations, financial condition, liquidity, performance, prospects, opportunities, achievements or industry results, as well as those of the markets we serve or intend to serve, to differ materially from those expressed in, or suggested by, these forward-looking statements. The accuracy and completeness of all such statements, including, without limitation, statements regarding our future financial position, strategy, plans and objectives for the management of future operations, is not warranted or guaranteed. These statements typically contain words such as "believes," "intends," "expects," "anticipates," "estimates," "may," "will," "should" and words of similar import. By their nature, forward-looking statements involve risk and uncertainty because they relate to events and depend on circumstances that will occur in the future. We undertake no obligation to update any forward-looking statements, whether as a result of new information, future events or otherwise. Although we believe that the expectations reflected in such statements are reasonable, no assurance can be given that such expectations will prove to be correct. There are a number of factors that could cause actual results and developments to differ materially from those expressed or implied by such forward-looking statements. These factors include, but are not limited to, factors identified in "Business," "Risk factors," and "Management's Discussion and Analysis of Financial Condition and Results of Operations," or elsewhere in this Annual Report, as well as:
•general economic conditions, or conditions affecting demand for the services offered by us in the markets in which we operate, both domestically and internationally, being less favorable than expected;
•worldwide economic and business conditions and conditions in the industries in which we operate;
•post-pandemic impact of COVID-19 and future pandemics;
•fluctuations in the cost and / or availability of raw materials, labor and utilities;energy, as well as the ability to pass on cost increases to customers;
•currency fluctuations and other financial risks;
•our ability to protect our intellectual property;
•the significant amount of indebtedness we have incurred and may incur, and the obligations to service such indebtedness and to comply with the covenants contained therein;
•relationships with our customers and suppliers;
•increased competition from other companies in the industries in which we operate;
•changing technology;
•our ability to execute and integrate new acquisitions;
•claims for personal injury, death or property damage arising from the use of products produced by us;
•the occurrence of accidents or other interruptions to our production processes;
•changes in our business strategy or development plans, and our expected level of capital expenditure;
•our ability to attract and retain qualified personnel;
•restrictions on the ability of Luxfer Holdings PLC to receive dividends or loans from certain of its subsidiaries;
•climate change regulations and the potential impact on energy costs;
•regulatory, environmental, legislative and judicial developments; and
•our intention to pay dividends.
Please read the sections "Business," "Risk factors," and "Management's Discussion and Analysis of Financial Condition and Results of Operations," of this Annual Report on Form 10-K for a more complete discussion of the factors that could affect our performance and the industries in which we operate, as well as those discussed in other documents we file or furnish with the SEC.
27
About Luxfer
Luxfer Holdings PLC ("Luxfer," "the Company," "we," "our") is a global manufacturer of highly-engineered industrial company innovating niche applications in materials whichengineering. Luxfer focuses on value creation by using its broad array of technical knowhowknow-how and proprietary technologies.technologies to help create a safe, clean and energy-efficient world. Luxfer's high-performance productsmaterials, components and high-pressure gas containment devices are used in defense, first response and emergency response, healthcare, transportation and general industrial settings. For more information, visit www.luxfer.com.applications.
Key trends and uncertainties regarding our existing business
Update on ongoing challenging global macro environment and related impact on supply chain disruption
Demand from most end-markets we serve has continued to improve following the adverse impact of COVID-19 on volumes, notably in 2020. This sharp recovery in demand across the global macro environment has resulted in supply chain challenges characterized by significant increases in material cost inflation on key inputs (including magnesium, aluminum and carbon fiber), labor availability issues and energy and transport cost increases. Additionally, during 2022, we were faced with two critical suppliers of magnesium and zirconium respectively declaring force majeure, of which the former remains in place. The continuing conflict in Ukraine which has resulted in punitive sanctions against the Russian Federation has further exacerbated the availability and price of certain raw materials and energy supplies. In response to the supply chain disruption, we have been successful in securing alternative sources of supply for key material inputs affected by force majeure. Furthermore, in the majority of cases, we are able to pass through inflation to our customers. Currently, our expectation is that the impact of material availability / inflation and energy cost inflation and labor and transport constraints will continue into 2023; that we will be able to source sufficient material to meet demand and that in the majority of cases we expect to be able to pass on cost increases. However the outlook remains highly uncertain with both the size and timing of future cost increases difficult to predict.
Impact of conflict in Ukraine
The Russian invasion of Ukraine and ongoing military conflict which commenced on February 24, 2022, has resulted in massive displacement of the Ukrainian population and huge disruption to its economy. Wide ranging sanctions have been imposed on the Russian Federation by the international community, targeting individuals, banks, businesses, funds transfers and imports and exports and are expected to have a significant adverse impact on Russia's economy as well as on international businesses active in the region. The impact on Luxfer is not expected to be significant as we have no direct operations in the region, and our sales to Russia and Ukraine combined typically represent less than one percent of total revenue by destination. Furthermore, neither country is a critical supplier of our raw material needs, and while Russia is a major global exporter of magnesium, we are able to source the metal from various alternative locations, including China, Israel, Turkey and the United States.
Operating objectives and trends
In 2023, we expect the following operating objectives and trends and uncertainties affected our financial performance in 2018, and will likelyto impact our results in the future:business:
•Actions to ensure continuity of supply of critical materials and initiated certain business restructuring initiatives aimed at reducing our fixed cost structure. We expect that these actions will contribute to further margin growth in 2019.services while safeguarding margins;
•Focus on recruiting, developing and maintaining talent, through our operating objectives and trends we expect to impact our business include the following:
28
CONSOLIDATED RESULTS OF OPERATIONS
The consolidated results of operations from continuing operations of Luxfer were as follows:
| Years ended December 31, | % / point change | |||||||||||||||||||||||||||||||||||||
| In millions | 2022 | 2021 | 2020 | 2022 v 2021 | 2021 v 2020 | |||||||||||||||||||||||||||||||||
| Net sales | $ | 423.4 | $ | 374.1 | $ | 324.8 | 13.2 | % | 15.2 | % | ||||||||||||||||||||||||||||
| Cost of sales | (328.4) | (278.1) | (243.9) | 18.1 | % | 14.0 | % | |||||||||||||||||||||||||||||||
| Gross profit | 95.0 | 96.0 | 80.9 | (1.0) | % | 18.7 | % | |||||||||||||||||||||||||||||||
| % of net sales | 22.4 | % | 25.7 | % | 24.9 | % | (3.3) | 0.8 | ||||||||||||||||||||||||||||||
| Selling, general and administrative expenses | (43.1) | (47.3) | (39.8) | (8.9) | % | 18.8 | % | |||||||||||||||||||||||||||||||
| % of net sales | 10.2 | % | 12.6 | % | 12.3 | % | (2.4) | 0.3 | ||||||||||||||||||||||||||||||
| Research and development | (4.9) | (3.9) | (3.3) | 25.6 | % | 18.2 | % | |||||||||||||||||||||||||||||||
| % of net sales | 1.2 | % | 1.0 | % | 1.0 | % | 0.2 | — | ||||||||||||||||||||||||||||||
| Restructuring charges | (1.9) | (6.2) | (8.9) | (69.4) | % | (30.3) | % | |||||||||||||||||||||||||||||||
| % of net sales | 0.4 | % | 1.7 | % | 2.7 | % | (1.3) | (1.0) | ||||||||||||||||||||||||||||||
| Acquisition and disposals costs | (0.3) | (1.5) | — | (80.0) | % | n/a | ||||||||||||||||||||||||||||||||
| % of net sales | 0.1 | % | 0.4 | % | — | % | (0.3) | 0.4 | ||||||||||||||||||||||||||||||
| Other income | — | 0.2 | — | (100.0) | % | n/a | ||||||||||||||||||||||||||||||||
| % of net sales | — | % | 0.1 | % | — | % | (0.1) | n/a | ||||||||||||||||||||||||||||||
| Other charges | — | (1.1) | (0.4) | (100.0) | % | 175.0 | % | |||||||||||||||||||||||||||||||
| % of net sales | — | % | 0.3 | % | 0.1 | % | (0.3) | 0.2 | ||||||||||||||||||||||||||||||
| Operating income | 44.8 | 36.2 | 28.5 | 23.8 | % | 27.0 | % | |||||||||||||||||||||||||||||||
| % of net sales | 10.6 | % | 9.7 | % | 8.8 | % | 0.9 | 0.9 | ||||||||||||||||||||||||||||||
| Net interest expense | (3.9) | (3.1) | (5.0) | 25.8 | % | (38.0) | % | |||||||||||||||||||||||||||||||
| % of net sales | 0.9 | % | 0.8 | % | 1.5 | % | 0.1 | (0.7) | ||||||||||||||||||||||||||||||
| Defined benefit pension credit | 0.1 | 2.3 | 4.3 | (95.7) | % | (46.5) | % | |||||||||||||||||||||||||||||||
| % of net sales | — | % | 0.6 | % | 1.3 | % | (0.6) | (0.7) | ||||||||||||||||||||||||||||||
| Income before income taxes and equity in net income of affiliates | 41.0 | 35.4 | 27.8 | 15.8 | % | 27.3 | % | |||||||||||||||||||||||||||||||
| % of net sales | 9.7 | % | 9.5 | % | 8.6 | % | 0.2 | 0.9 | ||||||||||||||||||||||||||||||
| Provision for income taxes | (9.0) | (5.4) | (6.9) | 66.7 | % | (21.7) | % | |||||||||||||||||||||||||||||||
| Effective tax rate | 22.0 | % | 15.3 | % | 24.8 | % | 6.7 | (9.5) | ||||||||||||||||||||||||||||||
| Income before equity in net income of affiliates | 32.0 | 30.0 | 20.9 | 6.7 | % | 43.5 | % | |||||||||||||||||||||||||||||||
| % of net sales | 7.6 | % | 8.0 | % | 6.4 | % | (0.4) | 1.6 | ||||||||||||||||||||||||||||||
| Equity in loss of unconsolidated affiliates (net of tax) | — | — | (0.1) | — | % | (100.0) | % | |||||||||||||||||||||||||||||||
| % of net sales | — | % | — | % | — | % | — | — | ||||||||||||||||||||||||||||||
| Net income from continuing operations | $ | 32.0 | $ | 30.0 | $ | 20.8 | 6.7 | % | 44.2 | % | ||||||||||||||||||||||||||||
| % of net sales | 7.6 | % | 8.0 | % | 6.4 | % | (0.4) | 1.6 | ||||||||||||||||||||||||||||||
29
| Years ended December 31, | % / point change | |||||||||||||||||||
| In millions | 2018 | 2017 | 2016 | 2018 v 2017 | 2017 v 2016 | |||||||||||||||
| Net sales | $ | 487.9 | $ | 441.3 | $ | 414.8 | 10.6 | % | 6.4 | % | ||||||||||
| Cost of goods sold | (365.8 | ) | (332.7 | ) | (320.2 | ) | 9.9 | % | 3.9 | % | ||||||||||
| Gross profit | 122.1 | 108.6 | 94.6 | 12.4 | % | 14.8 | % | |||||||||||||
| % of net sales | 25.0 | % | 24.6 | % | 22.8 | % | 0.4 | 1.8 | ||||||||||||
| Selling, general and administrative expenses | (60.8 | ) | (68.1 | ) | (56.2 | ) | (10.7 | )% | 21.2 | % | ||||||||||
| % of net sales | 12.5 | % | 15.4 | % | 13.5 | % | (2.9 | ) | 1.9 | |||||||||||
| Research and development | (6.4 | ) | (7.8 | ) | (7.6 | ) | (17.9 | )% | 2.6 | % | ||||||||||
| % of net sales | 1.3 | % | 1.8 | % | 1.8 | % | (0.5 | ) | — | |||||||||||
| Restructuring charges | (13.4 | ) | (8.4 | ) | (0.4 | ) | 59.5 | % | 2,000.0 | % | ||||||||||
| % of net sales | 2.7 | % | 1.9 | % | 0.1 | % | 0.8 | 1.8 | ||||||||||||
| Impairment charges | (7.2 | ) | (3.7 | ) | — | 94.6 | % | n/a | ||||||||||||
| % of net sales | 1.5 | % | 0.8 | % | — | % | 0.7 | 0.8 | ||||||||||||
| Acquisition related (costs) / credits | (4.3 | ) | 1.3 | — | n/a | n/a | ||||||||||||||
| % of net sales | 0.9 | % | 0.3 | % | — | % | 0.6 | 0.3 | ||||||||||||
| Other general income | — | — | 2.5 | n/a | n/a | |||||||||||||||
| % of net sales | — | % | — | % | 0.6 | % | — | (0.6 | ) | |||||||||||
| Operating income | 30.0 | 21.9 | 32.9 | 37.0 | % | (33.4 | )% | |||||||||||||
| % of net sales | 6.1 | % | 5.0 | % | 7.9 | % | 1.1 | (2.9 | ) | |||||||||||
| Net interest expense | (4.6 | ) | (6.3 | ) | (6.0 | ) | (27.0 | )% | 5.0 | % | ||||||||||
| % of net sales | 0.9 | % | 1.4 | % | 1.4 | % | (0.5 | ) | — | |||||||||||
| Defined benefit pension credit / (expense) | 4.7 | 4.2 | (2.8 | ) | 11.9 | % | n/a | |||||||||||||
| % of net sales | 1.0 | % | 1.0 | % | 0.7 | % | — | 0.3 | ||||||||||||
| Income before income taxes and equity in net income of affiliates | 30.1 | 19.8 | 24.1 | 52.0 | % | (17.8 | )% | |||||||||||||
| % of net sales | 6.2 | % | 4.5 | % | 5.8 | % | 1.7 | (1.3 | ) | |||||||||||
| Provision for income taxes | (5.5 | ) | (3.3 | ) | (6.8 | ) | 66.7 | % | (51.5 | )% | ||||||||||
| Effective tax rate | 18.3 | % | 16.7 | % | 28.2 | % | 1.6 | (11.5 | ) | |||||||||||
| Income before equity in net income of affiliates | 24.6 | 16.5 | 17.3 | 49.1 | % | (4.6 | )% | |||||||||||||
| % of net sales | 5.0 | % | 3.7 | % | 4.2 | % | 1.3 | (0.5 | ) | |||||||||||
| Equity in income of unconsolidated affiliates (net of tax) | 0.4 | 0.1 | 0.5 | 300.0 | % | (80.0 | )% | |||||||||||||
| % of net sales | 0.1 | % | — | % | 0.1 | % | 0.1 | (0.1 | ) | |||||||||||
| Net income / (loss) | $ | 25.0 | $ | 16.6 | $ | 17.8 | 50.6 | % | (6.7 | )% | ||||||||||
| % of net sales | 5.1 | % | 3.8 | % | 4.3 | % | 1.3 | (0.5 | ) | |||||||||||
Net sales
•Increased sales of magnesium alloys, especially those used in the aerospace market;
•Higher demand for our Superform business;zirconium products, particularly in industrial applications; and
These increases were partially offset by:
•Softening sales of our AF cylinders;flameless ration heaters ("FRH") due to lower levels of troop deployment and of Chemical detection kits due to supply chain constraints, and
The 15.2% increase in consolidated net sales across most major product groups in 2021 from 2020 was primarily due to the acquisition of SCI, as well as the recovery in volumes adversely impacted by COVID-19 in the prior year. The most significant factors were:
•An additional contribution of $24.9 million due to the acquisition of SCI;
•Increased sales of SCBA cylinders;cylinders used by first responders and of cylinders used for gas calibration and other industrial applications;
•Increased sales withinof military powders used in countermeasure flares;
•Increased sales of Luxfer Graphic Arts magnesium photo-engraving plates; and
•Favorable foreign exchange variances of $10.3 million or 3.2%.
These increases were partially offset by decreased sales of heater meals and chemical response kits in our SuperformLuxfer Magtech business.
Gross profit
The 0.43.3 percentage point decrease in gross profit as a percentage of sales in 2022 from 2021 was primarily the result of increased material and labor costs and other supply chain investments to overcome disruption, not fully covered by price increases, particularly in the Gas Cylinders Division.
The 0.8 percentage point increase in gross profit as a percentage of sales in 20182021 from 20172020 was primarily the result of:
30
Selling, general and administrative expenses ("SG&A")
Research and development costs
Research and development costs increasedas a percentage of sales were flat in line2021 when compared to 2020, with actual expenditure increasing by 18.2% as activity levels picked up as we recovered from the increase in sales in 2017 from 2016.COVID-19 economic downturn.
Restructuring charges
The $13.4$1.9 million restructuring charges in 2018 was the result of:2022 includes:
•$0.2 million relating to one-time employee termination benefits in the Elektron division in relation to the consolidation of production facilities in the Magnesium Powders operations.
The $6.2 million restructuring charges in 2021 includes:
•A further $5.0 million in relation to the closure of Luxfer Gas Cylinders France;
•$0.9 million of one-time employee termination costs in the Elektron division, largely in relation to the divestiture of our associate, Sub 161 Pty Limitedsmall Luxfer Magtech production facility in Ontario, Canada; and
•$0.3 million of miscellaneous restructuring project costs in the Gas Cylinders Segmentdivision.
Acquisition and disposals costs
Net costs of $0.3 million and $1.5 million of fixed asset write-downs across all businesses withinin 2022 and 2021 respectively, primarily relate to the Elektron segment.
Other charges
The $1.1 million wasother charges incurred in relation2021 relates to the revaluationsettlement of deferred contingent consideration, arisinga class action lawsuit in the Gas Cylinders segment from the acquisitionan alleged historic violation of the legacy businesses of Luxfer Magtech Inc. which was acquired in 2014.California Labor Code, concerning a Human Resources administration matter.
Net interest expense
Net interest expense remained relatively flat as a percentage of sales$3.1 million in 20172021 decreased from 2016 as$5.0 million in 2020 largely due to the average debt balance remained fairly level.$25 million early repayment in December 2020 of the Loan Notes due in 2021.
Defined benefit pension credit / (expense)
The 11.9% increase in defined benefit pension credit of $0.1 million in 2018 from 2017 was primarily due to :
The defined benefit pension credit of $2.3 million has decreased by $2.0 million in 2021 from 2020. This was primarily due to the combined effect on the U.K. plan of lower projected asset returns and a higher post-2030 inflation projection in the U.K., partially offset by a fall in the discount rate.
31
Provision for income taxes
The 1.66.7 percentage point increase in the effective tax rate in 20182022 from 20172021 was primarily due to:
The 11.59.5 percentage point decrease in the effective tax rate in 20172021 from 20162020 was primarily due to the impact of the above mentioned change in the U.K. tax rate. In addition, a net provisionaldeferred tax benefitcredit of $2.0$2.6 million has been recognized in 2017the income statement in respect of future tax relief available as a result of a special one-off pension contribution made to the enactment of U.S. tax reform legislation.U.K. plan in December 2021.
32
RECONCILIATION OF NON-GAAP FINANCIAL MEASURES TO GAAP MEASURES
The following table of non-GAAP summary financial data presents a reconciliation of net income from continuing operations to adjusted net income for the periods presented, being the most comparable GAAP measure. Management believes that adjusted net income, adjusted earnings per share, adjusted EBITA and adjusted EBITDA are key performance indicators (KPIs)("KPIs") used by the investment community and that such presentation will enhance an investor’s understanding of the Company's operational results. In addition, Luxfer's CEO and other senior management use these KPIs, among others, to evaluate business performance. However, investors should not consider adjusted net income and adjusted earnings per share in isolation as an alternative to net income and earnings per share when evaluating Luxfer's operating performance or measuring Luxfer's profitability.
| Years ended December 31, | |||||||||||||||||||||||
| In millions except per share data | 2022 | 2021 | 2020 | ||||||||||||||||||||
| Net income from continuing operations | 32.0 | 30.0 | 20.8 | ||||||||||||||||||||
| Accounting charges relating to acquisitions and disposals of businesses: | |||||||||||||||||||||||
| Amortization on acquired intangibles | 0.7 | 0.9 | 0.7 | ||||||||||||||||||||
| Acquisitions and disposals cost | 0.3 | 1.5 | — | ||||||||||||||||||||
| Defined benefit pension credit | (0.1) | (2.3) | (4.3) | ||||||||||||||||||||
| Restructuring charges | 1.9 | 6.2 | 8.9 | ||||||||||||||||||||
| Other charges | — | 1.1 | 0.4 | ||||||||||||||||||||
| Share-based compensation charges | 2.5 | 2.8 | 2.8 | ||||||||||||||||||||
| Other non-recurring tax items | — | (1.9) | — | ||||||||||||||||||||
| Income tax on adjusted items | 0.1 | (2.1) | (0.4) | ||||||||||||||||||||
| Adjusted net income from continuing operations | 37.4 | 36.2 | 28.9 | ||||||||||||||||||||
| Adjusted earnings per ordinary share from continuing operations | |||||||||||||||||||||||
| Diluted earnings per ordinary share | 1.16 | 1.07 | 0.74 | ||||||||||||||||||||
| Impact of adjusted items | 0.20 | 0.22 | 0.29 | ||||||||||||||||||||
Adjusted diluted earnings per ordinary share(1) | 1.36 | 1.29 | 1.03 | ||||||||||||||||||||
| Years ended December 31, | ||||||||||
| In millions except per share data | 2018 | 2017 | 2016 | |||||||
| Net income | 25.0 | 16.6 | 17.8 | |||||||
| Accounting charges / (credits) relating to acquisitions and disposals of businesses: | ||||||||||
| Unwind of discount on deferred consideration | 0.2 | 0.2 | 0.4 | |||||||
| Amortization on acquired intangibles | 1.2 | 1.3 | 1.0 | |||||||
| Acquisitions and disposals | 4.3 | (1.3 | ) | — | ||||||
| Defined benefit pension (credit) / expense | (4.7 | ) | (4.2 | ) | 2.8 | |||||
| Restructuring charges | 13.4 | 8.4 | 0.4 | |||||||
| Impairment charges | 7.2 | 3.7 | — | |||||||
Other charges (1) | — | 5.8 | — | |||||||
| Other general income | — | — | (2.5 | ) | ||||||
| Share-based compensation charges | 4.8 | 2.2 | 1.4 | |||||||
| Impact of U.S. tax reform | — | (2.0 | ) | — | ||||||
| Other non-recurring tax items | (2.9 | ) | — | — | ||||||
| Income tax thereon | (1.7 | ) | (3.1 | ) | (0.8 | ) | ||||
| Adjusted net income | 46.8 | 27.6 | 20.5 | |||||||
| Adjusted earnings per ordinary share | ||||||||||
| Diluted earnings per ordinary share | 0.90 | 0.62 | 0.67 | |||||||
| Impact of adjusted items | 0.79 | 0.41 | 0.10 | |||||||
Adjusted diluted earnings per ordinary share(2) | 1.69 | 1.03 | 0.77 | |||||||
(1) Other charges include costs incurred on: settlement and other legal expenses incurred in relation to patent infringement litigation against a competitor; and costs incurred in relation to the conversion of the Company's ADR listing to a direct listing of ordinary shares on the New York Stock Exchange, disclosed within selling, general and administrative expenses.
| Years ended December 31, | |||||||||||||||||||||||
| In millions except per share data | 2022 | 2021 | 2020 | ||||||||||||||||||||
| Adjusted net income from continuing operations | 37.4 | 36.2 | 28.9 | ||||||||||||||||||||
| Add back: | |||||||||||||||||||||||
| Other non-recurring tax items | — | 1.9 | — | ||||||||||||||||||||
| Income tax on adjusted items | (0.1) | 2.1 | 0.4 | ||||||||||||||||||||
| Income tax expense | 9.0 | 5.4 | 6.9 | ||||||||||||||||||||
| Net finance costs | 3.9 | 3.1 | 5.0 | ||||||||||||||||||||
| Adjusted EBITA from continuing operations | 50.2 | 48.7 | 41.2 | ||||||||||||||||||||
| Loss on disposal of property, plant and equipment | — | — | 0.1 | ||||||||||||||||||||
| Depreciation | 12.9 | 14.7 | 12.6 | ||||||||||||||||||||
| Adjusted EBITDA from continuing operations | 63.1 | 63.4 | 53.9 | ||||||||||||||||||||
33
| Years ended December 31, | ||||||||||
| In millions except per share data | 2018 | 2017 | 2016 | |||||||
| Adjusted net income | 46.8 | 27.6 | 20.5 | |||||||
| Add back / (deduct): | ||||||||||
| Impact of U.S. tax reform | — | 2.0 | — | |||||||
| Other non-recurring tax items | 2.9 | — | — | |||||||
| Income tax thereon | 1.7 | 3.1 | 0.8 | |||||||
| Income tax expense | 5.5 | 3.3 | 6.8 | |||||||
| Net finance costs | 4.6 | 6.3 | 6.0 | |||||||
| Adjusted EBITA | 61.5 | 42.3 | 34.1 | |||||||
| Loss on disposal of PPE | 0.3 | — | 0.2 | |||||||
| Depreciation | 17.8 | 17.0 | 17.0 | |||||||
| Adjusted EBITDA | 79.6 | 59.3 | 51.3 | |||||||
| Years ended December 31, | |||||||||||||||||||||||
| In millions | 2022 | 2021 | 2020 | ||||||||||||||||||||
| Adjusted net income from continuing operations | $ | 37.4 | $ | 36.2 | $ | 28.9 | |||||||||||||||||
| Add back: | |||||||||||||||||||||||
| Other non-recurring tax items | — | 1.9 | — | ||||||||||||||||||||
| Income tax on adjusted items | (0.1) | 2.1 | 0.4 | ||||||||||||||||||||
| Provision for income taxes | 9.0 | 5.4 | 6.9 | ||||||||||||||||||||
| Adjusted income from continuing operations before income taxes | $ | 46.3 | $ | 45.6 | $ | 36.2 | |||||||||||||||||
| Adjusted provision for income taxes | 8.9 | 9.4 | 7.3 | ||||||||||||||||||||
| Adjusted effective tax rate from continuing operations | 19.2 | % | 20.6 | % | 20.2 | % | |||||||||||||||||
SEGMENT RESULTS OF OPERATIONS
The summary that follows provides a discussion of the results of operations of each of our two reportable segments (Gas Cylinders and Elektron). Both segments comprise various product offerings that serve multiple end markets.end-markets.
Adjusted EBITDA, which is our segment income metric, represents operating income adjusted for qualifying restructuring charges; impairment charges; legal expenses incurred from patent litigation with a competitor; profit on sale of redundant site; direct listing costs; acquisition-related charges, / credits; loss on disposal of property, plantother charges, acquisitions and equipment;disposals cost, depreciation and amortization; share basedamortization, and share-based compensation expense; and unwind of discount on deferred consideration.charges. A reconciliation to net income and taxes can be found in ITEM 8. note 15.8, Note 17.
GAS CYLINDERS
The results of operations from the Gas Cylinders segment are for continuing operations only.
The net sales and adjusted EBITDA for Gas Cylinders were as follows:
| Years ended December 31, | % / point change | |||||||||||||||||||
| In millions | 2018 | 2017 | 2016 | 2018 v 2017 | 2017 v 2016 | |||||||||||||||
| Net sales | $ | 238.1 | $ | 220.2 | $ | 225.8 | 8.1 | % | (2.5 | )% | ||||||||||
| Adjusted EBITDA | 23.4 | 17.0 | 18.3 | 37.6 | % | (7.1 | )% | |||||||||||||
| % of net sales | 9.8 | % | 7.7 | % | 8.1 | % | 2.1 | (0.4 | ) | |||||||||||
| Years ended December 31, | % / point change | |||||||||||||||||||||||||||||||||||||
| In millions | 2022 | 2021 | 2020 | 2022 v 2021 | 2021 v 2020 | |||||||||||||||||||||||||||||||||
| Net sales | $ | 183.7 | $ | 178.3 | $ | 141.9 | 3.0 | % | 25.7 | % | ||||||||||||||||||||||||||||
| Adjusted EBITDA | 12.8 | 22.7 | 21.3 | (43.6) | % | 6.6 | % | |||||||||||||||||||||||||||||||
| % of net sales | 7.0 | % | 12.7 | % | 15.0 | % | (5.7) | (2.3) | ||||||||||||||||||||||||||||||
Net sales
The 8.1%3.0% increase in Gas Cylinders sales in 20182022 from 20172021 was primarily the result of:
in Gas Cylinders have been impacted throughout the year by the fixed-price contracts in place across the segment.
The 2.5% decrease25.7% increase in Gas Cylinders sales in 20172021 from 20162020 was primarily the result of:
34
Adjusted EBITDA
The 2.1 percentage point increase in adjusted EBITDA for Gas Cylinders as a percentage of net sales in 2018 from 2017 was primarily the result of:
The 2.3 percentage point decrease in adjusted EBITDA for Gas Cylinders as a percentage of net sales in 2021 from 2020 was primarily the result of:
ELEKTRON
The net sales and adjusted EBITDA for Elektron were as follows:
| Years ended December 31, | % / point change | |||||||||||||||||||||||||||||||||||||
| In millions | 2022 | 2021 | 2020 | 2022 v 2021 | 2021 v 2020 | |||||||||||||||||||||||||||||||||
| Net sales | $ | 239.7 | $ | 195.8 | $ | 182.9 | 22.4 | % | 7.1 | % | ||||||||||||||||||||||||||||
| Adjusted EBITDA | 50.3 | 40.7 | 32.6 | 23.6 | % | 24.8 | % | |||||||||||||||||||||||||||||||
| % of net sales | 21.0 | % | 20.8 | % | 17.8 | % | 0.2 | 3.0 | ||||||||||||||||||||||||||||||
| Years ended December 31, | % / point change | |||||||||||||||||||
| In millions | 2018 | 2017 | 2016 | 2018 v 2017 | 2017 v 2016 | |||||||||||||||
| Net sales | $ | 249.8 | $ | 221.1 | $ | 189.0 | 13.0 | % | 17.0 | % | ||||||||||
| Adjusted EBITDA | 56.2 | 42.3 | 33.0 | 32.9 | % | 28.2 | % | |||||||||||||
| % of net sales | 22.5 | % | 19.1 | % | 17.5 | % | 3.4 | 1.6 | ||||||||||||
Net sales
The 13.0%22.4% increase in Elektron sales in 20182022 from 20172021 was primarilyheavily impacted by the result of:passing through of material cost-inflation. Furthermore, there was benefit in the year from:
•Increased sales of zirconium-based automotivemagnesium powders used in commercial and industrial catalysts;military applications;
•Higher demand for our zirconium products, particularly in industrial applications.
These increases were partially offset by a decrease in sales of performance automotive wheels;
foreign exchange.
The 17.0%7.1% increase in Elektron sales in 20172021 from 20162020 was primarily the result of:of the recovery from COVID-19 related disruption affecting the prior year, especially:
•Increased sales of zirconium-based industrial catalysts; •Increased sales of magnesium photo-engraving plates; •Increased sales of military powders used |
•Increased sales of wrought magnesium alloys, especially those used in our transportation end markets.
This was partially offset by decreased revenues from Luxfer Magtech chemical detection kits and from heater meals.
Adjusted EBITDA
The 3.40.2 percentage point increase in adjusted EBITDA for Elektron as a percentage of net sales in 20182022 from 20172021 was primarily the result of:
positive foreign exchange variances.
The 1.63.0 percentage point increase in adjusted EBITDA for Elektron as a percentage of net sales in 20172021 from 20162020 was primarily the result of:of productivity improvements as volumes recovered from the Covid-19 affected prior year, as well as favorable product sales mix.
35
LIQUIDITY AND CAPITAL RESOURCES
Our liquidity requirements arise primarily from obligations under our indebtedness, capital expenditures, acquisitions, the funding of working capital and the funding of hedging facilities to manage foreign exchange and commodity purchase price risks. We meet these requirements primarily through cash flows from operating activities, cash deposits and borrowings under the Revolving Credit Facility ("RCF") and accompanying ancillary hedging facilities and the Loan Notes due 2021, 2023 and 2026. Our principal liquidity needs are:
•funding acquisitions, including deferred contingent consideration payments;acquisitions;
•capital expenditure requirements;
•payment of shareholder dividends;
•servicing interest on the Loan Notes, which is payable at each quarter end, in addition to interest and / or commitment fees on the Senior Facilities Agreement;RCF;
•working capital requirements, particularly in the short term as we aim to achieve organic sales growth; and
•hedging facilities used to manage our foreign exchange and aluminum purchase price risks.
We believe that, in the long term, cash generated from our operations will be adequate to meet our anticipated requirements for working capital, capital expenditures and interest payments on our indebtedness. In the short term, we believe we have sufficient credit facilities to cover any variation in our cash flow generation. However, any major repayments of indebtedness will be dependent on our ability to raise alternative financing or to realize substantial returns from operational sales. Also, our ability to expand operations through sales development and capital expenditures could be constrained by the availability of liquidity, which, in turn, could impact the profitability of our operations.
We have been in compliance with the covenants under the Loan Notes and the Senior Facilities AgreementRCF throughout all of the quarterly measurement dates from and including September 30, 2011, to December 31, 2018.2022.
In October 2021, the Company completed a refinancing of its existing RCF, extending its tenure to October 2026, while providing increased flexibility to incur additional indebtedness outside of this agreement if required and reducing the covenant burden. In January 2023, the Company has increased the capacity of its existing RCF to $125.0 million, an increase of $25.0 million.
Luxfer conducts all of its operations through its subsidiaries, joint ventures and affiliates. Accordingly, Luxfer's main cash source is dividends from its subsidiaries. The ability of each subsidiary to make distributions depends on the funds that a subsidiary receives from its operations in excess of the funds necessary for its operations, obligations or other business plans. We have not historically experienced any material impediment to these distributions, and we do not expect any local legal or regulatory regimes to have any impact on our ability to meet our liquidity requirements in the future. In addition, since our subsidiaries are wholly-owned, our claims will generally rank junior to all other obligations of the subsidiaries. If our operating subsidiaries are unable to make distributions, our growth may slow, unless we are able to obtain additional debt or equity financing. In the event of a subsidiary's liquidation, there may not be assets sufficient for us to recoup our investment in the subsidiary.
Our ability to maintain or increase the generation of cash from our operations in the future will depend significantly on the competitiveness of and demand for our products, including our success in launching new products. Achieving such success is a key objective of our business strategy. Due to commercial, competitive and external economic factors, however, we cannot guarantee that we will generate sufficient cash flows from operations or that future working capital will be available in an amount sufficient to enable us to service our indebtedness or make necessary capital expenditures.
36
Cash Flows from Continuing Operations
Operating activities
Cash provided by operating activities was $63.2$15.8 million and $26.0 million in 2018.2022 and 2021 respectively, which includes approximately $10.0 million and $4.0 million of cash spent on restructuring activities in those years. It was primarily related to net income from operating activities, net of the following non-cash items: (i) depreciation and amortization; asset impairment charges,(ii) share-based compensation charges; (iii) pension contributionsadjustments and (iv) net changes to assets and liabilities. In 2022, the Company has increased its working capital balances, predominantly as a result of inventory build to try and reduce inflationary price rises. In 2021, the Company also made an additional, special one-off deficit reduction payment in the U.K. for $12.7 million.
Investing activities
Net cash used byfor investing activities was $10.0$5.6 million in 2018,2022, compared to net cash used for investing activities of $16.0 million and $12.5$5.0 million in 2017 and 2016, respectively.2021. The following investing activities impacted our cash flow:
Capital expenditures
Capital expenditures in 2018, 2017 and 2016 were $13.92022 was $8.3 million $10.5compared to $9.1 million and $16.6 million, respectively.in 2021. 2021 included additional spend as we delayed some projects in the prior year in response to COVID-19. We anticipate capital expenditures for fiscal 20192023 to be approximately $20.0 million.around $15 million as we increase investment in order to grow the business.
Proceeds from sale of business
In March 2021, the forgivenessCompany sold its U.S. aluminum gas cylinder business for net cash proceeds of $20.2 million. In September 2021, the Company sold its Superform U.K. business for net consideration of $4.0 million, of which $3.0 million was received in 2021 and $1.0 million deferred until 2022. The deferred consideration, while still due to the Company, the payment has not yet been received so has been fully impaired in 2022.
In July 2020, the Company sold its 51% investment in Luxfer Uttam India Private Limited for net cash proceeds of $1.5 million. In September 2021, the Company received deferred consideration of $0.3 million for this sale.
Settlements from sale of business
In October 2022, the Company agreed a final settlement of $1.0 million to the purchasers of the joint venture partner's share onpreviously disposed aluminum gas cylinder business. The settlement was a loan from Luxfer Holdings PLC, (51%reduction to the original consideration paid.
Acquisitions, net of $4.0 million). Cash balances held bycash acquired
In March 2021, the acquired entity resulted in net cash inflow of $2.7 million recorded in investing activities.
Financing activities
In 2018,2022, net cash used for financing activities was $51.9$2.0 million, (2017: $25.1(2021: $16.1 million). We made net repayments todrawdowns on our bankingborrowing facilities of $37.0$24.8 million (2017: $9.2(2021: net drawdowns of $6.4 million) and dividend payments of $13.4$14.2 million (2017: $13.3(2021: $13.6 million), equating to $0.125$0.515 per ordinary share.share (2021: $0.50 per ordinary share). In 2022, the Company spent $11.1 million repurchasing approximately 700,000 shares, (2021: $6.4 million repurchasing approximately 300,000 shares).
Loan Notes due 2018, 2023 and 2026
The Note Purchase Agreement contains customary covenants and events of default, in each case with customary and appropriate grace periods and thresholds. In addition, the Note Purchase Agreement requires us to maintain compliance with a minimum interest coverage ratio and a leverage ratio. The interest coverage ratio measures our EBITDA (as defined in the Note Purchase Agreement) to Net Finance Charges (as defined in the Note Purchase Agreement). We are required to maintain an interest coverage ratio of 4.0:1. The leverage ratio measures our Total Net Debt (as defined in the Note Purchase Agreement) to Adjusted Acquisition EBITDA (as defined in the Note Purchase Agreement). We are required to maintain a leverage ratio of no more than 3.0:1. We have been in compliance with the covenants under the Note Purchase Agreement throughout all of the quarterly measurement dates from and including September 30, 2011, to December 31, 2018.2022.
37
The Loan Notes due 2018, 2023 and 2026 and the Note Purchase Agreement are governed by the law of the State of New York.
The Loan Notes due 2018, 2023 and 2026 are denominated in U.S. dollars, which creates a natural partial offset between the dollar-denominated net assets and earnings of our U.S. operations and the dollar-denominated debt and related interest expense of the notes. We have included the Note Purchase Agreement and a form of the Loan Notes due 2018, 2023 and 2026 as exhibits to this Annual Report and refer you to the exhibits for more information on the Note Purchase Agreement and the Loan Notes due 2018, 2023 and 2026.
Senior Facilities Agreement
Structure. At December 31, 2022 the Senior Facilities Agreement with Lloyds TSB Bank plc, Clydesdale Bank PLC and Bank of America, N.A. Lloyds TSB Bank plc and Clydesdale Bank PLC were Mandated Lead Arrangers under the Senior Facilities Agreement. This agreement has been subject to a series of amendments. The most significant of these amendments were dated March 25, 2014, when two new banks, Santander U.K. plc and National Westminster Bank plc (a subsidiary of The Royal Bank of Scotland plc), joined the banking syndicate and July 31, 2017, when two banks left the banking syndicate, Santander U.K. plc and Bank of America, N.A., and were replaced by two new banks, Citibank, N.A and HSBC Bank plc.
Availability. The facility is used for loans and overdrafts. Amounts unutilized under the Revolving Credit FacilityRCF (or, if the case, under the revolving portion of the Accordion)accordion) are allocated to ancillary facilities available under the Senior Facilities Agreement in connection with overdraft facilities, bilateral loan facilities and letter of credit facilities. As of December 31, 2018,2022, we had drawn down $nil$1.8 million under the ancillary facilities (December 31, 2017: $21.32021: $2.2 million). We may use amounts drawn under the Revolving Credit FacilityRCF for our general corporate purposes and certain capital expenditures, as well as for the financing of permitted acquisitions and reorganizations. As of December 31, 2018, $150.02022, $68.1 million (net of $31.9 million drawn down) was available under the Revolving Credit Facility.RCF. The last daymonth in which we may draw funds from the Revolving Credit FacilityRCF is June 30, 2022.September 2026.
The Company hasalso had a separate (uncommitted) bonding facility for bank guarantees and documentary letters of creditguarantees; denominated in GBP sterling of £10.0totaling £0.5 million ($12.80.6 million), of which £1.2 and £0.1 million ($1.50.2 million) was drawn as ofutilized at December 31, 2018. The amount drawn on the bonding facility as of December 31, 2017, was £1.0 million ($1.4 million).2022.
Interest rates and fees. Borrowings under the facility bear an interest rate equal to an applicable margin plus either EURIBOR, in the case of amounts drawn in euros, or LIBOR,SONIA (Sterling Overnight Index Average), in the case of amounts drawn in GBP sterling or U.S. dollars.
The tables below sets out the range of ratios and the related margin percentage currently in effect.
| Leverage | Margin | ||||||||||
| (% per annum) | |||||||||||
| Greater than | |||||||||||
| Less than or equal to 2.5:1, but greater than 2.0:1 | |||||||||||
| Less than or equal to 2.0:1, but greater than 1.5:1 | |||||||||||
| Less than or equal to 1.5:1, but greater than 1.0:1 | |||||||||||
| Less than or equal to 1.0:1 | |||||||||||
As of December 31, 2018,2022, we had drawn down $nil$31.9 million under the Revolving Credit FacilityRCF (December 31, 2017: $21.32021: $10.8 million). A commitment fee is levied each quarter against any unutilized element of the Revolving Credit Facility,RCF, excluding overdraft or ancillary facilities. This was calculated at 40% of the applicable margin in force before the July 2017 amendment, following which it is now calculated at 35% of the applicable margin in force. During 2018, this fee percentage ranged between 0.6 and 0.7%.
In addition, the Senior Facilities Agreement requires us to maintain compliance with an interest coverage ratio and a leverage ratio. The interest coverage ratio measures our EBITDA (as defined in the Senior Facilities Agreement) to Net Finance Charges (as defined in the Senior Facilities Agreement). We are required to maintain a minimum interest coverage ratio of 4.0:1. The leverage ratio measures our Total Net Debt (as defined in the Senior Facilities Agreement) to the Relevant Period Adjusted Acquisition EBITDA (as defined in the Senior Facilities Agreement). We are required to maintain a leverage ratio of no more than 3.0:1.
We have been in compliance with the covenants under the Senior Facilities Agreement throughout all of the quarterly measurement dates from and including September 30, 2011, to December 31, 2018.2022.
38
The Senior Facilities Agreement is governed by English law. For more information see ITEM 8, Note 11.
Dividends
We paid dividends in 20182022 of $13.4$14.2 million (2017: $13.3 (2021: $13.6 million), or $0.50$0.515 (2021: $0.50) per ordinary share.
Any payment of dividends is also subject to the provisions of the U.K. Companies Act, according to which dividends may only be paid out of profits available for distribution determined by reference to financial statements prepared in accordance with the Companies Act and IFRS as adopted by the E.U.,International Accounting Standards Board, which differ in some respects from U.S. GAAP. In the event that dividends are paid in the future, holders of the ordinary shares will be entitled to receive payments in U.S. dollars in respect of dividends on the underlying ordinary shares in accordance with the deposit agreement. Furthermore, because we are a holding company, any dividend payments would depend on cash flows from our subsidiaries.
Authorized shares
Our authorized share capital consists of 40.0 million ordinary shares with a par value of £0.50 per share.
Contractual obligations
The following summarizes our significant contractual obligations that impact our liquidity:
| Payments Due by Period | |||||||||||||||||||||||||||||
| In millions | Total | Less than 1 year | 1 – 3 years | 3 – 5 years | After 5 years | ||||||||||||||||||||||||
| Contractual cash obligations | |||||||||||||||||||||||||||||
| Loan Notes due 2023 | 25.0 | 25.0 | — | — | — | ||||||||||||||||||||||||
| Loan Notes due 2026 | 25.0 | — | — | 25.0 | — | ||||||||||||||||||||||||
| Revolving Credit Facility | 31.9 | — | — | 31.9 | — | ||||||||||||||||||||||||
| Obligations under operating leases | 29.9 | 5.1 | 10.1 | 5.3 | 9.4 | ||||||||||||||||||||||||
| Capital commitments | 1.4 | 1.4 | — | — | — | ||||||||||||||||||||||||
| Interest payments | 13.2 | 4.0 | 6.6 | 2.6 | — | ||||||||||||||||||||||||
| Total contractual cash obligations | $ | 126.4 | $ | 35.5 | $ | 16.7 | $ | 64.8 | $ | 9.4 | |||||||||||||||||||
| Payments Due by Period | |||||||||||||||||||||
| Total | Less than 1 year | 1 – 3 years | 3 – 5 years | After 5 years | |||||||||||||||||
| (in $ million) | |||||||||||||||||||||
| Contractual cash obligations | |||||||||||||||||||||
| Loan Notes due 2021 | 25.0 | — | — | 25.0 | — | ||||||||||||||||
| Loan Notes due 2023 | 25.0 | — | — | 25.0 | — | ||||||||||||||||
| Loan Notes due 2026 | 25.0 | — | — | — | 25.0 | ||||||||||||||||
| Deferred contingent consideration | 0.9 | 0.9 | — | — | — | ||||||||||||||||
| Obligations under operating leases | 27.4 | 4.2 | 7.4 | 5.4 | 10.4 | ||||||||||||||||
| Capital commitments | 2.5 | 2.5 | — | — | — | ||||||||||||||||
| Interest payments | 17.3 | 3.4 | 6.5 | 4.3 | 3.1 | ||||||||||||||||
| Total contractual cash obligations | $ | 123.1 | $ | 11.0 | $ | 13.9 | $ | 59.7 | $ | 38.5 | |||||||||||
Off-balance sheet measures
At December 31, 2018,2022, we had no off-balance sheet arrangements.arrangements other than the three bonding facilities as described above.
| In millions | December 31, 2018 | December 31, 2017 | December 31, 2016 | ||||||||||
| Minimum lease payments under operating leases recognized in the consolidated income statement | $ | 4.8 | $ | 5.1 | $ | 4.8 | |||||||
| In millions | 2019 | 2020 | 2021 | 2022 | Thereafter | Total | ||||||||||||||||||||
| Minimum lease payments | $ | 4.2 | $ | 4.1 | $ | 3.3 | $ | 2.7 | $ | 13.1 | $ | 27.4 | ||||||||||||||
| $ | 4.2 | $ | 4.1 | $ | 3.3 | $ | 2.7 | $ | 13.1 | $ | 27.4 | |||||||||||||||
Capital commitments
At December 31, 2018,2022, the Company had capital expenditure commitments of $2.5$1.4 million (2017: $0.6(2021: $1.5 million and 2016: $3.62020: $1.1 million) for the acquisitionpurchase of new plant and equipment.
Committed banking facilities
The Company refinanced in October 2021, see Note 11 for details of the refinance.
At December 31, 2018,2022 the Company had committed banking facilities of $150.0 million. The$100.0 million with an additional $50.0 million of uncommitted facilities were for providing loans and overdrafts, with a separate facility for letters of credit whichthrough an accordion provision. Of these committed facilities, $31.9 million was drawn at December 31, 2018, was £7.0 million ($8.9 million). Of the committed facilities, no loans were drawn and no letters of credit were utilized. The Company also has a separate bonding facility for bank guarantees denominated in GBP sterling of £3.0 million ($3.8 million), of which £1.5 million ($1.9 million) was utilized at December 31, 2018.2022.
At December 31, 2017,2021, the Company had committed banking facilities of $150.0 million. The$100.0 million with an additional $50.0 million of uncommitted facilities were for providing loans and overdrafts, with a separate facility for letters of credit which at December 31, 2017, was £7.0 million ($9.5 million).through an accordion provision. Of the committed facilities, $21.3$10.8 million of loans werewas drawn and $nil for letters of credit were utilized. The Company also has a separate bonding facility for bank guarantees denominated in GBP sterling of £3.0 million ($4.1 million), of which £1.0 million ($1.4 million) was utilized at December 31, 2017.2021.
39
Contingencies
In February 2014,November 2018, an alleged explosion occurred at a cylinder was sold tothird-party waste disposal and treatment site in Grand View, Idaho, reportedly causing property damage, personal injury, and one fatality. We contracted with a long-term customerservice company for removal and ruptureddisposal of certain waste resulting from the magnesium powder manufacturing operations at one of their gas facilities. As a result ofthe Reade facility in Manchester, New Jersey. We believe this rupture, three people were noted to have minor injuries such as loss of hearing. There was no major damage to assetsservice company, in turn, contracted with the third-party disposal company, at whose facility the explosion occurred, for treatment and disposal of the customer. A claim has been launchedwaste. In November 2020, we were named as a defendant in three lawsuits in relation to the incident – one by the three people who were injured in the incident and a prosecutor has been appointed. We reviewed our quality control checks from around the time which the cylinder was produced and no instances of failures have been noted. It has also been notedthird-party disposal company, one by the investigator thatestate of the customer has poor qualitydecedent, and safety checks. As a result we do notone by an injured employee of the third-party disposal company. We believe that we are not liable for the incident, have asserted such, and therefore,continue to fully defend the Company against these lawsuits. Therefore, we do not currently expect this caseany eventual outcome in these matters to have a material impact on the Company's financial position or results of operations.
NEW ACCOUNTING STANDARDS
See ITEM 8, Note 1 of the notes to the Consolidated Financial Statements, included in this Form 10-K, for information pertaining to recently adopted accounting standards or accounting standards to be adopted in the future.
CRITICAL ACCOUNTING POLICIESESTIMATES
We have adopted various accounting policies to prepare the consolidated financial statements in accordance with GAAP. Our significant accounting policies are more fully described in ITEM 8, Note 1 of the Notes to Consolidated Financial Statements. Certain of our accounting policies require the application of significant judgment by management in selecting the appropriate assumptions for calculating financial estimates. By their nature, these judgments are subject to an inherent degree of uncertainty. These judgments are based on our historical experience, terms of existing contracts, our observance of trends in the industry and information available from other outside sources, as appropriate. We consider an accounting estimate to be critical if:
•it requires us to make assumptions about matters that were uncertain at the time we were making the estimate; and
•changes in the estimate or different estimates that we could have selected would have had a material impact on our financial condition or results of operations.
Our critical accounting estimates include the following:
Impairment of goodwill and indefinite-lived intangiblesother identifiable intangible assets
Goodwill
Goodwill represents the excess of the cost of acquired businesses over the net of the fair value of identifiable tangible net assets and identifiable intangible assets purchased and liabilities assumed.
Goodwill is tested at least annually for impairment and is tested for impairment more frequently if events or changes in circumstances indicate that the asset might be impaired. Goodwill is tested for impairment by either performing a qualitative evaluation or a quantitative test. The impairment testqualitative evaluation is performed using a two-step process. In the first step,an assessment of factors to determine whether it is more likely than not that the fair value of eacha reporting unit is compared with theless than its carrying amount, of the reporting unit, including goodwill. IfWe may elect not to perform the estimated fair value is less than the carrying amount of thequalitative assessment for some or all reporting unit there is an indication that goodwillunits and perform a quantitative impairment exists and a second step must be completed in order to determine the amount of the goodwill impairment, if any that should be recorded. In the second step, an impairment loss is recognized for any excess of the carrying amount of the reporting unit's goodwill over the implied fair value of that goodwill. The implied fair value of goodwill is determined by allocating the fair value of the reporting unit in a manner similar to a purchase price allocation.
Identifiable intangible assets
Our primary identifiable intangible assets include: (i) customer relationships and technologytechnology; and (ii) traded related assets. Identifiable intangibles withAll our identifiable intangible assets have finite lives and are amortized and those identifiable intangibles with indefinite lives are not amortized.over that period. Identifiable intangible assets that are subject to amortization are evaluated for impairment whenever events or changes in circumstances indicate that the carrying amount may not be recoverable. Identifiable intangible assets not subject to amortization are tested for impairment annually or more frequently ifNo such events warrant. We complete our annual impairment testoccurred during the fourth quarter each year for those identifiable assets not subject to amortization.ended December 31, 2022.
40
Pension and other post-retirement plans
We sponsor U.S. and non-U.S. defined-benefit pension and other post-retirement plans. The amounts recognized in our consolidated financial statements related to our defined-benefit pension and other post-retirement plans are determined from actuarial valuations. Inherent in these valuations are assumptions, including: expected return on plan assets,(i) discount rates, rate of increase in future compensation levelsrates; (ii) inflation rates; (iii) pension increases; and health care cost trend rates.(iv) life expectancy. These assumptions are updated annually and are disclosed in ITEM 8, Note 1214 to the Notes to Consolidated Financial Statements. Differences in actual experience or changes in assumptions may affect ourcan have a material impact on the pension and other post-retirement obligations and future expense.
We recognize changes in the fair value of plan assets and net actuarial gains or losses for pension and other post-retirement benefits annually in the fourth quarter each year ("mark-to-market adjustment") and, if applicable, in any quarter in which an interim remeasurement is triggered. Net actuarial gains and losses occur when the actual experience differs from any of the various assumptions used to value our pension and other post-retirement plans or when assumptions change as they may each year. The primary factors contributing to actuarial gains and losses each year are (1)(i) changes in the discount rate used to value pension and other post-retirement benefit obligations as of the measurement date and (2)(ii) differences between the expected and the actual return on plan assets. This accounting method also results in the potential for volatile and difficult to forecast mark-to-market adjustments. The remaining components of pension expense, including service and interest costs and the expected return on plan assets, are recorded on a quarterly basis as ongoing pension expense.
Discount rate
The discount rate used represents the annualized yield based on a cash flow matched methodology with reference to an AA corporate bond spot curve and having regard to the duration of the Plan’s liabilities. This yield produced a weighted-average discount rate for our U.K. plans of 2.90% for 2018, 2.40%4.80% in 20172022, 1.90% in 2021 and 2.60%1.40% in 2016.2020. The discount rate on our U.S. plans was 4.20%5.10% in 2018, 3.60%2022, 2.70% in 20172021 and 4.20%2.30% in 2016.2020. There are no known or anticipated changes in our discount rate assumption that will impact our pension expense in 2019.2023.
To indicate the sensitivity of results to this assumption, a 0.1% per annum increase in the discount rate for our U.K. plans would reduce the value of the liabilities and therefore increase the pension surplus by approximately $2.4 million and increase the projected 2023 income statement credit by approximately $0.1 million.
Inflation rate
In September 2019, the UK Statistics Authority announced plans to reform the RPI inflation index. On November 25, 2020, the government and UK Statistics Authority confirmed these plans to reform the RPI index to bring it into line with the CPIH index from 2030, with no compensation for the holders of index-linked gilts. Inflation measured by the CPIH is consistently significantly lower than that measured by RPI, and therefore, these plans imply a significant expected reduction in RPI inflation from 2030 onwards. As a result we have taken a stepped approach and used different inflation rates pre and post 2030.
To indicate the sensitivity of results to the CPI assumption, a 0.1% per annum decrease in all CPI-linked assumptions, (including pension increases) for our U.K. plan, would reduce the value of the liabilities and therefore increase the pension surplus at December 31, 2022 by approximately $2.4 million and increase the projected 2023 income statement credit by approximately $0.1 million.
Pension increases
The pension increase assumptions have been set with reference to the corresponding CPI inflation assumption and take account of the caps and floors applicable to the various components of pension indexation.
Life expectancy
The life expectancies of male and female members aged 65 on 31 December 2022 are assumed to be 21.2 and 23.0 years, respectively, with the life expectancies of male and female members aged 65 on 31 December 2042 assumed to be 22.5 and 24.5 years, respectively.
To indicate the sensitivity of results to the life expectancy assumption, a one year increase in assumed life expectancy on the U.K. plan could increase the value of the liabilities and therefore decrease the pension surplus at December 31, 2022 by approximately $7.2 million.
41
Expected rate of return
Our expected rate of return on plan assets for our U.K. plans was 4.90% for 2018, 4.80%5.60% in 20172022, 3.30% in 2021 and 5.20%3.00% in 2016.2020. The expected rate of return on our U.S. plans was 6.20%4.70% in 2018, 6.00%2022, 2.50% in 20172021 and 6.30%5.00% in 2016.2020. The expected rate of return is designed to be a long-term assumption that may be subject to considerable year-to-year variance from actual returns. In developing the expected long-term rate of return, we considered our historical returns, with consideration given to forecast economic conditions, our asset allocations, input from external consultants and broader longer-term market indices.
See ITEM 8, Note 1214 of the Notes to Consolidated Financial Statements for further information regarding pension and other post-retirement plans.
Loss contingencies
Accruals are recorded for various contingencies, including legal proceedings, self-insurance and other claims that arise in the normal course of business. The accruals are based on judgment, the probability of losses and, where applicable, the consideration of opinions of internal and/or external legal counsel and actuariallyactuarial determined estimates. Additionally, we record receivables from third party insurers when recovery has been determined to be probable.
42
Item 7A. Quantitative and qualitative disclosures about market risk
Market risk is the potential economic loss arising from adverse changes in market rates and market prices such as interest rates, foreign currency exchange rates, commodity prices and changes in the market value of equity instruments. We are exposed to market risk, primarily related to foreign exchange, commodity prices and interest rates. Counterparties to all derivative contracts are major financial institutions. All instruments are entered into for other than trading purposes. The major accounting policies and utilization of these instruments is described more fully in ITEM 8, Note 1 of the Notes to Consolidated Financial Statements.
Foreign currency risk
We conduct business in various locations throughout the world and are subject to market risk due to changes in the value of foreign currencies in relation to our reporting currency, the U.S. dollar. Periodically, we use derivative financial instruments to manage these risks. The functional currencies of our foreign operating locations are generally the local currency in the country of domicile. We manage these operating activities at the local level and revenues, costs, assets and liabilities are generally denominated in local currencies, thereby mitigating the risk associated with changes in foreign exchange. However, our results of operations and assets and liabilities are reported in U.S. dollars and thus will fluctuate with changes in exchange rates between such local currencies and the U.S. dollar.
To hedge foreign currency risks, we enter into short duration currency contracts. The below table details the foreign currency contracts which we have in place over sales and purchases. Changes in the fair value of all derivatives are recognized immediately in income unless the derivative qualifies as a hedge of future cash flows. Gains and losses related to a hedge are deferred and recorded in the Consolidated Balance Sheets as a component of AOCIAccumulated Other Comprehensive Income ("AOCI") and are subsequently recognized in the Consolidated Statements of Income and Comprehensive Statements of Income / (Loss) when the hedged item affects earnings.
| December 31, 2022 | |||||||||||||||||||||||||||||
| Sales hedges | U.S. dollars | Euros | Canadian Dollars | ||||||||||||||||||||||||||
| Contract totals/£m | 13.4 | 12.8 | 0.1 | ||||||||||||||||||||||||||
| Maturity dates | 01/23 to 03/23 | 01/23 to 03/23 | 01/23 | ||||||||||||||||||||||||||
| Exchange rates | $1.1207 to $1.2083 | €1.1234 to €1.1468 | $1.6320 | ||||||||||||||||||||||||||
| Purchase hedges | U.S. dollars | Euros | Canadian dollars | Australian dollars | Chinese yuan | ||||||||||||||||||||||||||||||
| Contract totals/£m | 9.2 | 2.6 | 9.5 | 1.0 | 1.6 | ||||||||||||||||||||||||||||||
| Maturity dates | 01/23 to 04/23 | 01/23 to 04/23 | 01/23 | 01/23 | 01/23 to 03/23 | ||||||||||||||||||||||||||||||
| Exchange rates | $1.1040 to $1.2084 | €1.1437 to €1.2240 | $1.6796 to $1.6239 | $1.7787 | ¥8.3906 to ¥8.4126 | ||||||||||||||||||||||||||||||
| December 31, 2021 | |||||||||||||||||||||||
| Sales hedges | U.S. dollars | Euros | Japanese Yen | ||||||||||||||||||||
| Contract totals/£m | 5.0 | 9.8 | 0.1 | ||||||||||||||||||||
| Maturity dates | 01/22 to 03/22 | 01/22 to 03/22 | 01/22 to 03/22 | ||||||||||||||||||||
| Exchange rates | $1.3455 to $1.3788 | €1.1697 to €1.1906 | ¥155.2443 to ¥156.6793 | ||||||||||||||||||||
| Purchase hedges | U.S. dollars | Euros | Canadian dollars | Australian dollars | Chinese yuan | ||||||||||||||||||||||||||||||
| Contract totals/£m | 4.5 | 3.5 | 7.5 | 0.9 | 1.5 | ||||||||||||||||||||||||||||||
| Maturity dates | 01/22 to 04/22 | 01/22 to 02/22 | 01/22 | 01/22 | 03/22 | ||||||||||||||||||||||||||||||
| Exchange rates | $1.3451 to $1.3781 | €1.1812 to €1.1662 | $1.7172 to $1.6762 | $1.8598 | ¥8.6126 | ||||||||||||||||||||||||||||||
43
| December 31, 2018 | |||||||
| Sales hedges | U.S. dollars | Euros | |||||
| Contract totals/£m | 4.8 | 7.2 | |||||
| Maturity dates | 01/19 to 07/19 | 01/19 to 07/19 | |||||
| Exchange rates | $1.2519 to $1.3419 | €1.0949 to €1.1702 | |||||
| Purchase hedges | U.S. dollars | Euros | Canadian dollars | Czech koruna | |||||||||
| Contract totals/£m | 7.5 | 1.7 | 2.9 | 0.1 | |||||||||
| Maturity dates | 01/19 to 07/19 | 01/19 to 06/19 | 01/19 to 03/19 | 01/19 | |||||||||
| Exchange rates | $1.2609 to $1.3380 | €1.1074 to €1.1221 | $1.7039 to $1.7416 | CZK 28.4490 | |||||||||
| December 31, 2017 | ||||||||||
| Sales hedges | U.S. dollars | Euros | Australian dollars | |||||||
| Contract totals/£m | 17.1 | 27.5 | 2.8 | |||||||
| Maturity dates | 01/18 to 07/19 | 01/18 to 07/19 | 06/18 | |||||||
| Exchange rates | $1.2433 to $1.3444 | €1.0949 to €1.1803 | $1.7667 | |||||||
| Purchase hedges | U.S. dollars | Euros | Australian dollars | |||||||
| Contract totals/£m | 12.5 | 0.1 | 1.7 | |||||||
| Maturity dates | 01/18 to 07/19 | 01/18 | 06/18 | |||||||
| Exchange rates | $1.2414 to $1.3389 | €1.1084 | 1.7161 | |||||||
Commodity price risk
We are exposed to commodity price risks in relation to the purchases of our raw materials.
There is no financial market to hedge magnesium, zirconium raw materials or carbon fiber, and prices for these raw materials have been volatile in recent years, with substantial increases in the second half of 2021 and throughout 2022. To help mitigate these risks, we have a number of fixed-price supply contracts for a portion of these raw materials, which limits our exposure to price volatility over a calendar year. However, we remain exposed over time to rising prices in these markets, and therefore rely on the ability to pass on any major price increases to our customers in order to maintain our levels of profitability especially for for carbon fiber wrapped composite cylinders, zirconium, and magnesium-based products. We have also in the last few years, when we felt it was appropriate, made additional physical purchases of magnesium and some rare earth chemicals to delay the impact of higher prices, but this has had a cash flow impact on occasion, thereby leading to greater utilization of our revolving credit bank facilities.
Primary aluminum is a global commodity, with its principal trading market on the LME. In the normal course of business, we are exposed to aluminum price volatility to the extent that the costs of aluminum purchases are more closely related to the LME price than the sales prices of certain of our products. Our Gas Cylinders Segment will buy various aluminum alloys, in log, sheet, or tube form, and the contractual price will usually include an LME-linked base price plus a premium for a particular type of alloy, andas well as the cost of casting, rolling or extruding. The price of high-grade aluminum, which is actively traded on the LME, has fluctuated significantly in recent years. The price remains volatile and difficult to predict. Since aluminum is the Gas Cylinders Segment's largest single raw material cost, these fluctuations in the price of aluminum can affect this segment's and our financial results. In order to help mitigate this risk, we enter into LME-related transactions in the form of commodity contracts. Historically we have also ordered a certain amount of our aluminum billet purchases on a forward fixed price.
Interest rate risk
As of December 31, 2018,2022, we had both fixed rate and variable rate debt outstanding on our consolidated balance sheet. As a result of this exposure, we have in the past hedged interest payable under our floating rate indebtedness based on a combination of forward rate agreements, interest rate caps and swaps. There were no fixed or variable rate interest hedge agreements in place as of December 31, 2018,2022, and December 31, 2017.2021.
44
Item 8. Financial Statements and Supplementary Data
Luxfer Holdings PLC
Index to Consolidated Financial Statements
| Page | ||||||||||||||||||
| Report of Independent Registered Public Accounting Firm (PCAOB ID: 876) | ||||||||||||||||||
| Consolidated Statements of Income | ||||||||||||||||||
| Consolidated Statements of Comprehensive Income | ||||||||||||||||||
| Consolidated Balance Sheets | ||||||||||||||||||
| Consolidated Statements of Cash Flows | ||||||||||||||||||
| Consolidated Statements of Changes in Equity | ||||||||||||||||||
| Notes to Consolidated Financial Statements | ||||||||||||||||||
45
Report of Independent Registered Public Accounting Firm
To the Board of Directors and Shareholders of Luxfer Holdings PLC
Opinions on the Financial Statements and Internal Control over Financial Reporting
We have audited the accompanying consolidated balance sheets of Luxfer Holdings PLC and its subsidiaries(the (the “Company”) as of December 31, 20182022 and 2017,2021, and the related consolidated statements of income, comprehensive income, / (loss), changes in equity and cashflowscash flows for each of the three years in the period ended December 31, 2018,2022, including the related notes (collectively referred to as the “consolidated financial statements”).We also have audited the Company's internal control over financial reporting as of December 31, 2018,2022, based on criteria established in Internal Control - Integrated Framework(2013)issued by the Committee of Sponsoring Organizations of the Treadway Commission (COSO).
In our opinion, the consolidatedfinancial statements referred to above present fairly, in all material respects, the financial position of the Company as of December 31, 20182022and 20172021, and the results of itsoperations and itscash flows for each of the three years in the period ended December 31, 20182022in conformity with accounting principles generally accepted in the United States of America. Also in our opinion, the Company maintained, in all material respects, effective internal control over financial reporting as of December 31, 2018,2022, based on criteria established in Internal Control - Integrated Framework(2013)issued by the COSO.
Basis for Opinions
The Company's management is responsible for these consolidated financial statements, for maintaining effective internal control over financial reporting, and for its assessment of the effectiveness of internal control over financial reporting, included in the accompanying Management’sManagement's Annual Report on Internal Control Over Financial Reporting.Reporting appearing under Item 9A. Our responsibility is to express opinions on the Company’s consolidatedfinancial statements and on the Company's internal control over financial reporting based on our audits. We are a public accounting firm registered with the Public Company Accounting Oversight Board (United States) (PCAOB) and are required to be independent with respect to the Company in accordance with the U.S. federal securities laws and the applicable rules and regulations of the Securities and Exchange Commission and the PCAOB.
We conducted our audits in accordance with the standards of the PCAOB. Those standards require that we plan and perform the audits to obtain reasonable assurance about whether the consolidatedfinancial statements are free of material misstatement, whether due to error or fraud, and whether effective internal control over financial reporting was maintained in all material respects.
Our audits of the consolidated financial statements included performing procedures to assess the risks of material misstatement of the consolidated financial statements, whether due to error or fraud, and performing procedures that respond to those risks. Such procedures included examining, on a test basis, evidence regarding the amounts and disclosures in the consolidated financial statements. Our audits also included evaluating the accounting principles used and significant estimates made by management, as well as evaluating the overall presentation of the consolidated financial statements. Our audit of internal control over financial reporting included obtaining an understanding of internal control over financial reporting, assessing the risk that a material weakness exists, and testing and evaluating the design and operating effectiveness of internal control based on the assessed risk. Our audits also included performing such other procedures as we considered necessary in the circumstances. We believe that our audits provide a reasonable basis for our opinions.
46
Definition and Limitations of Internal Control over Financial Reporting
A company’s internal control over financial reporting is a process designed to provide reasonable assurance regarding the reliability of financial reporting and the preparation of financial statements for external purposes in accordance with generally accepted accounting principles. A company’s internal control over financial reporting includes those policies and procedures that (i) pertain to the maintenance of records that, in reasonable detail, accurately and fairly reflect the transactions and dispositions of the assets of the company; (ii) provide reasonable assurance that transactions are recorded as necessary to permit preparation of financial statements in accordance with generally accepted accounting principles, and that receipts and expenditures of the company are being made only in accordance with authorizations of management and directors of the company; and (iii) provide reasonable assurance regarding prevention or timely detection of unauthorized acquisition, use, or disposition of the company’s assets that could have a material effect on the financial statements.
Because of its inherent limitations, internal control over financial reporting may not prevent or detect misstatements. Also, projections of any evaluation of effectiveness to future periods are subject to the risk that controls may become inadequate because of changes in conditions, or that the degree of compliance with the policies or procedures may deteriorate.
Critical Audit Matters
The critical audit matter communicated below is a matter arising from the current period audit of the consolidated financial statements that was communicated or required to be communicated to the audit committee and that (i) relates to accounts or disclosures that are material to the consolidated financial statements and (ii) involved our especially challenging, subjective, or complex judgments. The communication of critical audit matters does not alter in any way our opinion on the consolidated financial statements, taken as a whole, and we are not, by communicating the critical audit matter below, providing a separate opinion on the critical audit matter or on the accounts or disclosures to which it relates.
Valuation of Pension Benefit Obligations
As described in Notes1 and 14 to the consolidated financial statements, the Company had pension benefit obligations of $258.2million as of December 31, 2022.As disclosed by management, the amounts in the consolidated financial statements related to the pension benefit obligations are determined from actuarial valuations. The valuation of the pension benefit obligations requires estimation in determining appropriate assumptions including: (i) discount rates; (ii) inflation rates; (iii) pension increases; and (iv) life expectancy. Differences in actual experience or changes in these assumptions can have a material impact on the determination of the liabilities in the Company’s pension schemes.
The principal considerations for our determination that performing procedures relating to the valuation of the pension benefit obligationsis a critical audit matter are the significant judgments and assumptions made by management, including the use of management’s specialists, when determining the pension benefit obligations. This in turn resulted in a high degree of auditor judgment, subjectivity and effort in performing procedures to evaluate management's significant assumptions for: (i) discount rates; (ii) inflation rates; (iii) pension increases; and (iv) life expectancy. The audit effort involved the use of professionals with specialized skill and knowledge.
Addressing the matter involved performing procedures and evaluating audit evidence in connection with forming our overall opinion on the consolidated financial statements.These procedures included testing the effectiveness of controls relating to the valuation of the pension benefit obligations. These procedures alsoincluded, among others, testing the completeness, accuracy and relevance of the underlying data used in the valuation of the pension benefit obligations. With the assistance of professionals with specialized skill and knowledge, these procedures also included (i) testing management’s process for estimating the pension benefit obligations, (ii) evaluating the reasonableness of the assumptions used in calculating the pension benefit obligations, including the discount rates, inflation rates, pension increases, and life expectancy assumptions; and (iii) assessing the appropriateness of management’s methodology in line with the requirements of ASC 715 Compensation — Retirement Benefits.
/s/ PricewaterhouseCoopers LLP
Manchester, United Kingdom
March 11, 20191, 2023
We have served as the Company’s auditor since 2015.
LUXFER HOLDINGS PLC
CONSOLIDATED STATEMENTS OF INCOME
| Years Ended December 31, | ||||||||||||||||||||||||||
| In millions, except share and per-share data | 2022 | 2021 | 2020 | |||||||||||||||||||||||
| Net sales | $ | 423.4 | $ | 374.1 | $ | 324.8 | ||||||||||||||||||||
| Cost of sales | (328.4) | (278.1) | (243.9) | |||||||||||||||||||||||
| Gross profit | 95.0 | 96.0 | 80.9 | |||||||||||||||||||||||
| Selling, general and administrative expenses | (43.1) | (47.3) | (39.8) | |||||||||||||||||||||||
| Research and development | (4.9) | (3.9) | (3.3) | |||||||||||||||||||||||
| Restructuring charges | (1.9) | (6.2) | (8.9) | |||||||||||||||||||||||
| Acquisitions and disposals costs | (0.3) | (1.5) | — | |||||||||||||||||||||||
| Other income | — | 0.2 | — | |||||||||||||||||||||||
| Other charges | — | (1.1) | (0.4) | |||||||||||||||||||||||
| Operating income | 44.8 | 36.2 | 28.5 | |||||||||||||||||||||||
| Interest expense | (3.9) | (3.1) | (5.0) | |||||||||||||||||||||||
| Defined benefit pension credit | 0.1 | 2.3 | 4.3 | |||||||||||||||||||||||
| Income before income taxes and equity in net income of affiliates | 41.0 | 35.4 | 27.8 | |||||||||||||||||||||||
| Provision for income taxes | (9.0) | (5.4) | (6.9) | |||||||||||||||||||||||
| Income before equity in net income of affiliates | 32.0 | 30.0 | 20.9 | |||||||||||||||||||||||
| Equity in loss of affiliates (net of tax) | — | — | (0.1) | |||||||||||||||||||||||
| Net income from continuing operations | 32.0 | 30.0 | 20.8 | |||||||||||||||||||||||
| Net gain on disposition of discontinued operations | — | 6.6 | — | |||||||||||||||||||||||
| Net loss from discontinued operations | (5.1) | (6.7) | (0.8) | |||||||||||||||||||||||
| Net income | $ | 26.9 | $ | 29.9 | $ | 20.0 | ||||||||||||||||||||
Earnings / (loss) per share(1) | ||||||||||||||||||||||||||
| Basic from continuing operations | 1.17 | 1.08 | 0.75 | |||||||||||||||||||||||
| Basic from discontinued operations | (0.19) | — | (0.03) | |||||||||||||||||||||||
| Basic | $ | 0.99 | $ | 1.08 | $ | 0.73 | ||||||||||||||||||||
| Diluted from continuing operations | 1.16 | 1.07 | 0.74 | |||||||||||||||||||||||
| Diluted from discontinued operations | (0.19) | — | (0.03) | |||||||||||||||||||||||
| Diluted | $ | 0.98 | $ | 1.07 | $ | 0.72 | ||||||||||||||||||||
| Weighted average ordinary shares outstanding | ||||||||||||||||||||||||||
| Basic | 27,304,847 | 27,698,691 | 27,557,219 | |||||||||||||||||||||||
| Diluted | 27,541,202 | 28,032,506 | 27,971,382 | |||||||||||||||||||||||
| Years Ended December 31, | ||||||||||||||
| In millions, except share and per-share data | 2018 | 2017 | 2016 | |||||||||||
| Net sales | $ | 487.9 | $ | 441.3 | $ | 414.8 | ||||||||
| Cost of goods sold | (365.8 | ) | (332.7 | ) | (320.2 | ) | ||||||||
| Gross profit | 122.1 | 108.6 | 94.6 | |||||||||||
| Selling, general and administrative expenses | (60.8 | ) | (68.1 | ) | (56.2 | ) | ||||||||
| Research and development | (6.4 | ) | (7.8 | ) | (7.6 | ) | ||||||||
| Restructuring charges | (13.4 | ) | (8.4 | ) | (0.4 | ) | ||||||||
| Impairment charges | (7.2 | ) | (3.7 | ) | — | |||||||||
| Acquisition related (costs) / credits | (4.3 | ) | 1.3 | — | ||||||||||
| Other general income | — | — | 2.5 | |||||||||||
| Operating income | 30.0 | 21.9 | 32.9 | |||||||||||
| Interest expense | (5.0 | ) | (6.6 | ) | (6.3 | ) | ||||||||
| Interest income | 0.4 | 0.3 | 0.3 | |||||||||||
| Defined benefit pension credit / (expense) | 4.7 | 4.2 | (2.8 | ) | ||||||||||
| Income before income taxes and equity in net income of affiliates | 30.1 | 19.8 | 24.1 | |||||||||||
| Provision for income taxes | (5.5 | ) | (3.3 | ) | (6.8 | ) | ||||||||
| Income before equity in net income of affiliates | 24.6 | 16.5 | 17.3 | |||||||||||
| Equity in income of affiliates (net of tax) | 0.4 | 0.1 | 0.5 | |||||||||||
| Net income | $ | 25.0 | $ | 16.6 | $ | 17.8 | ||||||||
| Earnings per share | ||||||||||||||
| Basic | $ | 0.94 | $ | 0.63 | $ | 0.67 | ||||||||
| Diluted | $ | 0.90 | $ | 0.62 | $ | 0.67 | ||||||||
| Weighted average ordinary shares outstanding | ||||||||||||||
| Basic | 26,708,469 | 26,460,947 | 26,443,662 | |||||||||||
| Diluted | 27,692,262 | 26,723,981 | 26,654,638 | |||||||||||
See accompanying notes to consolidated financial statements
48
LUXFER HOLDINGS PLC
CONSOLIDATED STATEMENTS OF COMPREHENSIVE INCOME / (LOSS)
| Years Ended December 31, | ||||||||||||||||||||||||||
| In millions | 2022 | 2021 | 2020 | |||||||||||||||||||||||
| Net income | $ | 26.9 | $ | 29.9 | $ | 20.0 | ||||||||||||||||||||
| Other comprehensive (loss) / income | ||||||||||||||||||||||||||
| Net change in foreign currency translation adjustment | (13.2) | (0.8) | 3.8 | |||||||||||||||||||||||
| Pension and post-retirement actuarial gains / (losses), net of $3.1, $10.6 and $4.8 of tax, respectively | 8.8 | 31.6 | (20.0) | |||||||||||||||||||||||
| Other comprehensive (loss) / income net of tax | (4.4) | 30.8 | (16.2) | |||||||||||||||||||||||
| Total comprehensive income | $ | 22.5 | $ | 60.7 | $ | 3.8 | ||||||||||||||||||||
| Years Ended December 31, | ||||||||||||||
| In millions | 2018 | 2017 | 2016 | |||||||||||
| Net income | $ | 25.0 | $ | 16.6 | $ | 17.8 | ||||||||
| Other comprehensive (loss) / income | ||||||||||||||
| Net change in foreign currency translation adjustment | (6.4 | ) | 11.9 | (14.8 | ) | |||||||||
| Pension and post-retirement actuarial gains / (losses), net of $0.3, $0.6 and $(2.9) tax, respectively | 1.1 | 3.3 | (17.2 | ) | ||||||||||
| Cash flow hedges, net of $0.0, $0.6 and $0.0 of tax, respectively | (0.6 | ) | 3.1 | 0.2 | ||||||||||
| Other comprehensive (loss) / income, net of tax | (5.9 | ) | 18.3 | (31.8 | ) | |||||||||
| Total comprehensive income / (loss) | $ | 19.1 | $ | 34.9 | $ | (14.0 | ) | |||||||
See accompanying notes to consolidated financial statements
49
LUXFER HOLDINGS PLC
CONSOLIDATED BALANCE SHEETS
| December 31, | ||||||||||||||||||||
| In millions, except share and per-share data | 2022 | 2021 | ||||||||||||||||||
| Current assets | ||||||||||||||||||||
| Cash and cash equivalents | $ | 12.6 | $ | 6.2 | ||||||||||||||||
| Restricted cash | 0.3 | 0.2 | ||||||||||||||||||
| Accounts and other receivables, net of allowances of $0.4 and $0.8, respectively | 67.8 | 57.8 | ||||||||||||||||||
| Inventories | 111.1 | 90.5 | ||||||||||||||||||
| Current assets held-for-sale | 9.3 | 8.5 | ||||||||||||||||||
| Total current assets | 201.1 | 163.2 | ||||||||||||||||||
| Non-current assets | ||||||||||||||||||||
| Property, plant and equipment, net | 77.7 | 87.5 | ||||||||||||||||||
| Right-of-use assets from operating leases | 19.8 | 12.6 | ||||||||||||||||||
| Goodwill | 65.6 | 69.7 | ||||||||||||||||||
| Intangibles, net | 12.5 | 13.7 | ||||||||||||||||||
| Deferred tax assets | 3.0 | 8.0 | ||||||||||||||||||
| Pensions and other retirement benefits | 27.0 | 13.7 | ||||||||||||||||||
| Investments and loans to joint ventures and other affiliates | 0.4 | 0.4 | ||||||||||||||||||
| Total assets | $ | 407.1 | $ | 368.8 | ||||||||||||||||
| Current liabilities | ||||||||||||||||||||
| Current maturities of long-term debt and short-term borrowings | $ | 25.0 | $ | — | ||||||||||||||||
| Accounts payable | 37.8 | 31.7 | ||||||||||||||||||
| Accrued liabilities | 29.4 | 28.2 | ||||||||||||||||||
| Taxes on income | 1.8 | 3.0 | ||||||||||||||||||
| Current liabilities held-for-sale | 5.0 | 1.4 | ||||||||||||||||||
| Other current liabilities | 11.2 | 19.6 | ||||||||||||||||||
| Total current liabilities | 110.2 | 83.9 | ||||||||||||||||||
| Non-current liabilities | ||||||||||||||||||||
| Long-term debt | 56.2 | 59.6 | ||||||||||||||||||
| Pensions and other retirement benefits | 4.5 | 1.9 | ||||||||||||||||||
| Deferred tax liabilities | 9.9 | 2.7 | ||||||||||||||||||
| Other non-current liabilities | 19.0 | 11.6 | ||||||||||||||||||
| Total liabilities | $ | 199.8 | $ | 159.7 | ||||||||||||||||
| Commitments and contingencies (Note 19) | ||||||||||||||||||||
| Shareholders' equity | ||||||||||||||||||||
| Ordinary shares of £0.50 par value; authorized 40,000,000 shares for 2022 and 2021; issued and outstanding 28,944,000 shares for 2022 and 2021 | $ | 26.5 | $ | 26.5 | ||||||||||||||||
| Deferred shares of £0.0001 par value; authorized, issued and outstanding 761,835,318,444 shares for 2021 | — | 149.9 | ||||||||||||||||||
| Additional paid-in capital | 221.4 | 70.9 | ||||||||||||||||||
| Treasury shares | (20.4) | (9.6) | ||||||||||||||||||
| Company shares held by ESOP | (1.0) | (1.1) | ||||||||||||||||||
| Retained earnings | 120.2 | 107.5 | ||||||||||||||||||
| Accumulated other comprehensive loss | (139.4) | (135.0) | ||||||||||||||||||
| Total shareholders' equity | $ | 207.3 | $ | 209.1 | ||||||||||||||||
| Total liabilities and shareholders' equity | $ | 407.1 | $ | 368.8 | ||||||||||||||||
| December 31, | ||||||||||
| In millions, except share and per-share data | 2018 | 2017 | ||||||||
| Current assets | ||||||||||
| Cash and cash equivalents | $ | 13.8 | $ | 12.6 | ||||||
| Restricted cash | 0.3 | 0.7 | ||||||||
| Accounts and other receivables, net of allowances of $2.4 and $4.1 respectively | 62.7 | 72.4 | ||||||||
| Inventories | 93.6 | 82.2 | ||||||||
| Investments and loans to joint ventures and other affiliates | — | 1.6 | ||||||||
| Other current assets | 10.7 | 1.2 | ||||||||
| Total current assets | $ | 181.1 | $ | 170.7 | ||||||
| Non-current assets | ||||||||||
| Property, plant and equipment, net | $ | 106.9 | $ | 129.1 | ||||||
| Goodwill | 67.6 | 71.2 | ||||||||
| Intangibles, net | 14.6 | 16.1 | ||||||||
| Deferred tax assets | 18.6 | 20.8 | ||||||||
| Investments and loans to joint ventures and other affiliates | 1.6 | 7.6 | ||||||||
| Other non-current assets | — | 0.3 | ||||||||
| Total assets | $ | 390.4 | $ | 415.8 | ||||||
| Current liabilities | ||||||||||
| Current maturities of long-term debt and short-term borrowings | $ | 3.5 | $ | 19.2 | ||||||
| Accounts payable | 36.9 | 28.4 | ||||||||
| Accrued liabilities | 33.8 | 29.7 | ||||||||
| Taxes on income | 1.6 | 0.3 | ||||||||
| Other current liabilities | 11.9 | 6.4 | ||||||||
| Total current liabilities | $ | 87.7 | $ | 84.0 | ||||||
| Non-current liabilities | ||||||||||
| Long-term debt | $ | 73.6 | $ | 94.6 | ||||||
| Pensions and other retirement benefits | 40.0 | 55.3 | ||||||||
| Deferred tax liabilities | 3.5 | 4.2 | ||||||||
| Other non-current liabilities | 1.3 | 3.2 | ||||||||
| Total liabilities | $ | 206.1 | $ | 241.3 | ||||||
| Shareholders' equity | ||||||||||
| Ordinary shares of £0.50 par value; authorized 40,000,000 shares for 2018 and 2017; issued and outstanding 29,000,000 shares for 2018 and 27,136,799 shares for 2017 | $ | 26.6 | $ | 25.3 | ||||||
| Deferred shares of £0.0001 par value; authorized 761,845,318,444; issued and outstanding 761,835,338,444 shares for 2018 and authorized 769,423,688,000; issued and outstanding 769,413,708,000 shares for 2017 | 149.9 | 150.9 | ||||||||
| Additional paid-in capital | 65.6 | 62.1 | ||||||||
| Treasury shares | (4.3 | ) | (5.8 | ) | ||||||
| Own shares held by ESOP | (2.2 | ) | (1.0 | ) | ||||||
| Retained earnings | 95.3 | 83.7 | ||||||||
| Accumulated other comprehensive loss | (146.6 | ) | (140.7 | ) | ||||||
| Total shareholders' equity | $184.3 | $174.5 | ||||||||
| Total liabilities and shareholders' equity | $390.4 | $415.8 | ||||||||
See accompanying notes to consolidated financial statements
50
LUXFER HOLDINGS PLC
CONSOLIDATED STATEMENTS OF CASH FLOWS
| Years Ended December 31, | ||||||||||||||||||||||||||
| In millions | 2022 | 2021 | 2020 | |||||||||||||||||||||||
| Operating activities | ||||||||||||||||||||||||||
| Net income | $ | 26.9 | $ | 29.9 | $ | 20.0 | ||||||||||||||||||||
| Net loss from discontinued operations | 5.1 | 0.1 | 0.8 | |||||||||||||||||||||||
| Net income from continuing operations | 32.0 | 30.0 | 20.8 | |||||||||||||||||||||||
| Adjustments to reconcile net income from continuing operations to net cash provided by operating activities | ||||||||||||||||||||||||||
| Equity in loss of affiliates | — | — | 0.1 | |||||||||||||||||||||||
| Depreciation | 12.9 | 14.7 | 12.6 | |||||||||||||||||||||||
| Amortization of purchased intangible assets | 0.7 | 0.9 | 0.7 | |||||||||||||||||||||||
| Amortization of debt issuance costs | 0.5 | 0.5 | 0.4 | |||||||||||||||||||||||
| Share-based compensation charge | 2.5 | 2.8 | 2.8 | |||||||||||||||||||||||
| Deferred income taxes | 8.7 | (1.6) | 4.8 | |||||||||||||||||||||||
| Loss on disposal of property, plant and equipment | — | — | 0.1 | |||||||||||||||||||||||
| Loss on disposal of business | 1.0 | — | — | |||||||||||||||||||||||
| Defined benefit pension expense / (credit) | 0.1 | (1.9) | (3.9) | |||||||||||||||||||||||
| Defined benefit pension contributions | (0.4) | (18.2) | (5.8) | |||||||||||||||||||||||
| Changes in assets and liabilities, net of effects of business acquisitions | ||||||||||||||||||||||||||
| Accounts and notes receivable | (27.2) | (9.8) | 10.7 | |||||||||||||||||||||||
| Inventories | (25.0) | (15.3) | 9.5 | |||||||||||||||||||||||
| Current assets held-for-sale | (3.3) | (2.9) | 10.0 | |||||||||||||||||||||||
| Other current assets | — | 1.3 | (0.4) | |||||||||||||||||||||||
| Accounts payable | 21.3 | 11.4 | (12.9) | |||||||||||||||||||||||
| Accrued liabilities | 2.4 | 7.5 | (1.9) | |||||||||||||||||||||||
| Current liabilities held-for-sale | 0.9 | (1.8) | 2.3 | |||||||||||||||||||||||
| Other current liabilities | (8.8) | 8.4 | 0.2 | |||||||||||||||||||||||
| Other non-current assets and liabilities | (2.5) | — | (0.8) | |||||||||||||||||||||||
| Net cash provided by operating activities - continuing | 15.8 | 26.0 | 49.3 | |||||||||||||||||||||||
| Net cash provided by operating activities - discontinued | 0.1 | 0.1 | 0.3 | |||||||||||||||||||||||
| Net cash provided by operating activities | 15.9 | 26.1 | 49.6 | |||||||||||||||||||||||
| Investing activities | ||||||||||||||||||||||||||
| Capital expenditures | (8.3) | (9.1) | (8.0) | |||||||||||||||||||||||
| Proceeds from sale of property, plant and equipment | 3.7 | — | — | |||||||||||||||||||||||
| Proceeds from sale of businesses | — | 23.4 | 1.5 | |||||||||||||||||||||||
| Settlements from sale of businesses | (1.0) | — | — | |||||||||||||||||||||||
| Acquisitions, net of cash acquired | — | (19.3) | — | |||||||||||||||||||||||
| Net cash used for investing activities - continuing | (5.6) | (5.0) | (6.5) | |||||||||||||||||||||||
| Net cash used for investing activities - discontinued | (0.1) | (0.1) | (0.3) | |||||||||||||||||||||||
| Net cash used for investing activities | (5.7) | (5.1) | (6.8) | |||||||||||||||||||||||
| Financing activities | ||||||||||||||||||||||||||
| Net drawdowns / (repayments) of long-term borrowings | 24.8 | 6.4 | (38.2) | |||||||||||||||||||||||
| Debt issuance costs | — | (1.0) | — | |||||||||||||||||||||||
| Deferred consideration paid | — | — | (0.4) | |||||||||||||||||||||||
| Proceeds from sale of shares | — | — | 1.1 | |||||||||||||||||||||||
| Dividends paid | (14.2) | (13.6) | (13.6) | |||||||||||||||||||||||
| Share-based compensation cash paid | (1.4) | (1.5) | (1.4) | |||||||||||||||||||||||
| Repurchase of deferred shares | (0.1) | — | — | |||||||||||||||||||||||
| Repurchase of ordinary shares | (11.1) | (6.4) | — | |||||||||||||||||||||||
| Net cash used for financing activities | (2.0) | (16.1) | (52.5) | |||||||||||||||||||||||
| Effect of exchange rate changes on cash and cash equivalents | (1.7) | — | 0.9 | |||||||||||||||||||||||
| Net increase / (decrease) | 6.5 | 4.9 | (8.8) | |||||||||||||||||||||||
| Cash, cash equivalents and restricted cash; beginning of year | 6.4 | 1.5 | 10.3 | |||||||||||||||||||||||
| Cash, cash equivalents and restricted cash; end of year | $ | 12.9 | $ | 6.4 | $ | 1.5 | ||||||||||||||||||||
| Supplemental cash flow information: | ||||||||||||||||||||||||||
| Interest payments | $ | 4.0 | $ | 3.2 | $ | 5.1 | ||||||||||||||||||||
| Income tax payments | 0.6 | 5.3 | 2.1 | |||||||||||||||||||||||
51
| Years Ended December 31, | ||||||||||||||
| In millions | 2018 | 2017 | 2016 | |||||||||||
| Operating activities | ||||||||||||||
| Net income | $ | 25.0 | $ | 16.6 | $ | 17.8 | ||||||||
| Adjustments to reconcile net income to net cash provided by (used for) operating activities | ||||||||||||||
| Equity income of unconsolidated affiliates | (0.4 | ) | (0.1 | ) | (0.5 | ) | ||||||||
| Depreciation | 17.8 | 17.0 | 17.0 | |||||||||||
| Amortization of purchased intangible assets | 1.2 | 1.3 | 1.1 | |||||||||||
| Amortization of debt issuance costs | 0.3 | 0.6 | 0.5 | |||||||||||
| Share-based compensation charge | 4.8 | 3.1 | 1.4 | |||||||||||
| Deferred income taxes | 0.2 | (2.7 | ) | 2.9 | ||||||||||
| Loss / (gain) on disposal of property, plant and equipment | 0.3 | 0.1 | (1.9 | ) | ||||||||||
| �� Asset impairment charges | 13.9 | 5.9 | — | |||||||||||
| Pension and other post-retirement expense | 0.4 | 0.6 | 7.2 | |||||||||||
| Pension and other post-retirement contributions | (12.3 | ) | (12.9 | ) | (10.9 | ) | ||||||||
| Changes in assets and liabilities, net of effects of business acquisitions | ||||||||||||||
| Accounts and notes receivable | 5.8 | (11.5 | ) | (2.9 | ) | |||||||||
| Inventories | (15.5 | ) | 4.9 | 4.5 | ||||||||||
| Other current assets | 1.1 | 1.3 | (1.5 | ) | ||||||||||
| Accounts payable | 7.3 | 1.5 | (9.0 | ) | ||||||||||
| Accrued liabilities | 4.8 | 14.0 | (4.1 | ) | ||||||||||
| Other current liabilities | 9.9 | (2.0 | ) | 0.2 | ||||||||||
| Other non-current assets and liabilities | (1.4 | ) | 1.1 | (1.2 | ) | |||||||||
| Net cash provided by operating activities | $ | 63.2 | $ | 38.8 | $ | 20.6 | ||||||||
| Investing activities | ||||||||||||||
| Capital expenditures | $ | (13.9 | ) | $ | (10.5 | ) | $ | (16.6 | ) | |||||
| Proceeds from sale of property, plant and equipment | 0.1 | 0.1 | 3.4 | |||||||||||
| Proceeds from sale of businesses and other | — | 0.1 | — | |||||||||||
| Investments in unconsolidated affiliates | 1.1 | (1.0 | ) | 1.0 | ||||||||||
| Acquisitions, net of cash acquired | 2.7 | (4.7 | ) | (0.3 | ) | |||||||||
| Net cash used for investing activities | $ | (10.0 | ) | $ | (16.0 | ) | $ | (12.5 | ) | |||||
| Financing activities | ||||||||||||||
| Net (repayments) / drawdowns in short term borrowings | $ | (15.7 | ) | $ | 4.2 | $ | — | |||||||
| Net repayments of long-term borrowings | (21.3 | ) | (13.4 | ) | (8.5 | ) | ||||||||
| Debt issuance costs | — | (0.6 | ) | (0.2 | ) | |||||||||
| Deferred consideration paid | (0.8 | ) | (1.4 | ) | — | |||||||||
| Proceeds from issue of share capital | 6.6 | — | — | |||||||||||
| Dividends paid | (13.4 | ) | (13.3 | ) | (13.3 | ) | ||||||||
| Share based compensation cash paid | (7.3 | ) | (0.6 | ) | (0.2 | ) | ||||||||
| Repurchases of ordinary shares | — | — | (7.3 | ) | ||||||||||
| Net cash used for financing activities | $ | (51.9 | ) | $ | (25.1 | ) | $ | (29.5 | ) | |||||
| Effect of exchange rate changes on cash and cash equivalents | (0.5 | ) | 2.0 | (1.9 | ) | |||||||||
| Net increase / (decrease) | $ | 0.8 | $ | (0.3 | ) | $ | (23.3 | ) | ||||||
| Cash, cash equivalents and restricted cash; beginning of year | 13.3 | 13.6 | 36.9 | |||||||||||
| Cash, cash equivalents and restricted cash; end of year | 14.1 | 13.3 | 13.6 | |||||||||||
| Supplemental cash flow information: | ||||||||||||||
| Interest payments | $ | 4.6 | $ | 6.2 | $ | 6.4 | ||||||||
| Income tax payments | 2.9 | 4.1 | 5.4 | |||||||||||
LUXFER HOLDINGS PLC
CONSOLIDATED STATEMENTS OF CHANGES IN EQUITY
| In millions, | Ordinary shares | Deferred shares | Additional paid-in capital | Treasury shares Number | Treasury shares Amount | Company shares held by ESOP Number | Company shares held by ESOP Amount | Retained earnings | Accumulated other comprehensive loss | Total shareholders' equity | ||||||||||||||||||||||||||||||||||||||||||||||||||||
| At January 1, 2020 | $ | 26.6 | $ | 149.9 | $ | 68.4 | (0.4) | $ | (4.0) | (1.2) | $ | (1.7) | $ | 84.8 | $ | (149.6) | $ | 174.4 | ||||||||||||||||||||||||||||||||||||||||||||
| Net income | — | — | — | — | — | — | — | 20.0 | — | 20.0 | ||||||||||||||||||||||||||||||||||||||||||||||||||||
| Shares sold from ESOP | — | — | 0.8 | — | — | 0.1 | 0.3 | — | — | 1.1 | ||||||||||||||||||||||||||||||||||||||||||||||||||||
| Other comprehensive loss, net of tax | — | — | — | — | — | — | — | — | (16.2) | (16.2) | ||||||||||||||||||||||||||||||||||||||||||||||||||||
| Dividends declared and paid | — | — | — | — | — | — | — | (13.6) | — | (13.6) | ||||||||||||||||||||||||||||||||||||||||||||||||||||
| Share-based compensation | — | — | 2.8 | — | — | — | — | — | — | 2.8 | ||||||||||||||||||||||||||||||||||||||||||||||||||||
| Utilization of treasury shares to satisfy share-based compensation | — | — | (0.1) | — | — | — | — | — | (0.1) | |||||||||||||||||||||||||||||||||||||||||||||||||||||
| Utilization of shares from ESOP to satisfy share-based compensation | — | — | (1.3) | — | — | 0.1 | — | — | — | (1.3) | ||||||||||||||||||||||||||||||||||||||||||||||||||||
| At December 31, 2020 | $ | 26.6 | $ | 149.9 | $ | 70.6 | (0.4) | $ | (4.0) | (1.0) | $ | (1.4) | $ | 91.2 | $ | (165.8) | $ | 167.1 | ||||||||||||||||||||||||||||||||||||||||||||
| Net income | — | — | — | — | — | — | — | 29.9 | — | 29.9 | ||||||||||||||||||||||||||||||||||||||||||||||||||||
| Other comprehensive income, net of tax | — | — | — | — | — | — | — | — | 30.8 | 30.8 | ||||||||||||||||||||||||||||||||||||||||||||||||||||
| Dividends declared and paid | — | — | — | — | — | — | — | (13.6) | — | (13.6) | ||||||||||||||||||||||||||||||||||||||||||||||||||||
| Share-based compensation | — | — | 2.8 | — | — | — | — | — | — | 2.8 | ||||||||||||||||||||||||||||||||||||||||||||||||||||
| Utilization of treasury shares to satisfy share-based compensation | — | — | (0.1) | — | 0.1 | — | — | — | — | — | ||||||||||||||||||||||||||||||||||||||||||||||||||||
| Utilization of shares from ESOP to satisfy share-based compensation | — | — | (1.8) | — | — | 0.2 | 0.3 | — | — | (1.5) | ||||||||||||||||||||||||||||||||||||||||||||||||||||
| Repurchase of ordinary shares | — | — | — | (0.3) | (6.4) | — | — | — | — | (6.4) | ||||||||||||||||||||||||||||||||||||||||||||||||||||
| Cancellation of ordinary shares | (0.1) | — | (0.6) | 0.1 | 0.7 | — | — | — | — | — | ||||||||||||||||||||||||||||||||||||||||||||||||||||
| At December 31, 2021 | $ | 26.5 | $ | 149.9 | $ | 70.9 | (0.6) | $ | (9.6) | (0.8) | $ | (1.1) | $ | 107.5 | $ | (135.0) | $ | 209.1 | ||||||||||||||||||||||||||||||||||||||||||||
| Net income for the year | — | — | — | — | — | — | — | 26.9 | — | 26.9 | ||||||||||||||||||||||||||||||||||||||||||||||||||||
| Other comprehensive loss, net of tax | — | — | — | — | — | — | — | — | (4.4) | (4.4) | ||||||||||||||||||||||||||||||||||||||||||||||||||||
| Dividends declared | — | — | — | — | — | — | — | (14.2) | — | (14.2) | ||||||||||||||||||||||||||||||||||||||||||||||||||||
| Share-based compensation charges | — | — | 2.5 | — | — | — | — | — | — | 2.5 | ||||||||||||||||||||||||||||||||||||||||||||||||||||
| Utilization of treasury shares to satisfy share-based compensation | — | — | (0.7) | — | 0.3 | — | — | — | — | (0.4) | ||||||||||||||||||||||||||||||||||||||||||||||||||||
| Utilization of shares from ESOP to satisfy share-based compensation | — | — | (1.1) | — | — | 0.1 | 0.1 | — | — | (1.0) | ||||||||||||||||||||||||||||||||||||||||||||||||||||
| Repurchase of ordinary shares | — | — | — | (0.7) | (11.1) | — | — | — | — | (11.1) | ||||||||||||||||||||||||||||||||||||||||||||||||||||
| Cancellation of deferred shares | — | (149.9) | 149.8 | — | — | — | — | — | — | (0.1) | ||||||||||||||||||||||||||||||||||||||||||||||||||||
| At December 31, 2022 | $ | 26.5 | $ | — | $ | 221.4 | (1.3) | $ | (20.4) | (0.7) | $ | (1.0) | $ | 120.2 | $ | (139.4) | $ | 207.3 | ||||||||||||||||||||||||||||||||||||||||||||
See accompanying notes to consolidated financial statements
52
| In millions, | Ordinary share capital | Deferred share capital | Additional paid-in capital | Treasury shares Number | Treasury shares Amount | Own shares held by ESOP Number | Own shares held by ESOP Amount | Retained earnings | Accumulated other comprehensive loss | Total equity | ||||||||||||||||||||||||||||
| At January 1, 2016 | $ | 25.3 | $ | 150.9 | $ | 60.3 | (0.1 | ) | $ | (1.3 | ) | — | $ | (0.2 | ) | $ | 76.0 | $ | (127.2 | ) | $ | 183.8 | ||||||||||||||||
| Net income | — | — | — | — | — | — | — | 17.8 | — | 17.8 | ||||||||||||||||||||||||||||
| Other comprehensive loss, net of tax | — | — | — | — | — | — | — | — | (31.8 | ) | (31.8 | ) | ||||||||||||||||||||||||||
| Dividends declared and paid | — | — | — | — | — | — | — | (13.3 | ) | — | (13.3 | ) | ||||||||||||||||||||||||||
| Share based compensation | — | — | 1.2 | — | — | — | — | — | — | 1.2 | ||||||||||||||||||||||||||||
| Arising from issue of share capital | — | — | — | (0.5 | ) | (6.3 | ) | — | — | — | — | (6.3 | ) | |||||||||||||||||||||||||
| Common shares repurchased and classified as treasury shares | — | — | — | — | — | (0.1 | ) | (1.0 | ) | — | — | (1.0 | ) | |||||||||||||||||||||||||
| Purchase of shares from ESOP | — | — | (0.6 | ) | — | 0.5 | — | — | 0.1 | — | — | |||||||||||||||||||||||||||
| Utilization of treasury shares to satisfy share based compensation | — | — | (0.9 | ) | — | — | — | 0.7 | 0.2 | — | — | |||||||||||||||||||||||||||
| At December 31, 2016 | $ | 25.3 | $ | 150.9 | $ | 60.0 | (0.6 | ) | $ | (7.1 | ) | (0.1 | ) | $ | (0.5 | ) | $ | 80.8 | $ | (159.0 | ) | $ | 150.4 | |||||||||||||||
| Net income | — | — | — | — | — | — | — | 16.6 | — | 16.6 | ||||||||||||||||||||||||||||
| Other comprehensive income, net of tax | — | — | — | — | — | — | — | — | 18.3 | 18.3 | ||||||||||||||||||||||||||||
| Dividends declared and paid | — | — | — | — | — | — | — | (13.3 | ) | — | (13.3 | ) | ||||||||||||||||||||||||||
| Share based compensation | — | — | 2.5 | — | — | — | — | — | — | 2.5 | ||||||||||||||||||||||||||||
| Purchase of shares into ESOP | — | — | — | 0.1 | 0.8 | (0.1 | ) | (0.8 | ) | — | — | — | ||||||||||||||||||||||||||
| Utilization of treasury shares to satisfy share based compensation | — | — | (0.5 | ) | — | 0.5 | — | — | — | — | — | |||||||||||||||||||||||||||
| Utilization of shares from ESOP to satisfy share based compensation | — | — | (0.4 | ) | — | — | 0.1 | 0.3 | 0.1 | — | — | |||||||||||||||||||||||||||
| Reclassification of deferred tax | — | — | 0.5 | — | — | — | — | (0.5 | ) | — | — | |||||||||||||||||||||||||||
| At December 31, 2017 | $ | 25.3 | $ | 150.9 | $ | 62.1 | (0.5 | ) | $ | (5.8 | ) | (0.1 | ) | $ | (1.0 | ) | $ | 83.7 | $ | (140.7 | ) | $ | 174.5 | |||||||||||||||
| Net income | — | — | — | — | — | — | — | 25.0 | — | 25.0 | ||||||||||||||||||||||||||||
| Issue of new shares | 1.3 | — | — | — | — | (1.9 | ) | (1.3 | ) | — | — | — | ||||||||||||||||||||||||||
| Cancellation of deferred shares | — | (1.0 | ) | 1.0 | — | — | — | — | — | — | — | |||||||||||||||||||||||||||
| Shares sold from ESOP | — | — | 6.2 | — | — | 0.5 | 0.4 | — | — | 6.6 | ||||||||||||||||||||||||||||
| Other comprehensive loss, net of tax | — | — | — | — | — | — | — | — | (5.9 | ) | (5.9 | ) | ||||||||||||||||||||||||||
| Dividends declared and paid | — | — | — | — | — | — | — | (13.4 | ) | — | (13.4 | ) | ||||||||||||||||||||||||||
| Share based compensation | — | — | (2.5 | ) | — | — | — | — | — | — | (2.5 | ) | ||||||||||||||||||||||||||
| Purchase of shares into ESOP | — | — | — | 0.1 | 1.4 | (0.1 | ) | (1.4 | ) | — | — | — | ||||||||||||||||||||||||||
| Utilization of treasury shares to satisfy share based compensation | — | — | (0.1 | ) | — | 0.1 | — | — | — | — | — | |||||||||||||||||||||||||||
| Utilization of shares from ESOP to satisfy share based compensation | — | — | (1.1 | ) | — | — | — | 1.1 | — | — | — | |||||||||||||||||||||||||||
| At December 31, 2018 | $ | 26.6 | $ | 149.9 | $ | 65.6 | (0.4 | ) | $ | (4.3 | ) | (1.6 | ) | $ | (2.2 | ) | $ | 95.3 | $ | (146.6 | ) | $ | 184.3 | |||||||||||||||
LUXFER HOLDINGS PLC
NOTES TO CONSOLIDATED FINANCIAL STATEMENTS
1. Summary of Significant Accounting Policies
Business description
Luxfer Holdings PLC is a global industrial company innovating niche applications in materials technology company specializing in the innovationengineering. Luxfer focuses on value creation by using its broad array of technical know-how and manufacture ofproprietary technologies to help create a safe, clean and energy-efficient world. Luxfer's high-performance materials, components and high-pressure gas containment devices forare used in defense, first response and healthcare, transportation defense and emergency response, healthcare and general industrial applications. It comprises two reportable segments being Gas Cylinders and Elektron.
Principles of consolidation
The consolidated financial statements comprise the financial statements of Luxfer Holdings PLC and its subsidiaries (collectively "we," "our," "Luxfer" or "the Company" ) that we control. Investments in unconsolidated affiliates, where we have the ability to exercise significant influence over the operating and financial policies, are accounted for using the equity method. All inter-company balances and transactions, including unrealized profits arising from intra-Companyintra-company transactions, have been eliminated in full.
The consolidated financial statements have been prepared in accordance with accounting principles generally accepted in the United States of America ("GAAP") and are presented in U.S. dollars ("USD"). The books of the Company's non-U.S. entities are converted to USD at each reporting period date in accordance with the accounting policy below. The functional currency of the holding company, Luxfer Holdings PLC, is USD (2020: pounds sterling ("GBP")) and that of its U.K. subsidiaries is pounds sterling (GBP),GBP, being the most appropriate currency for those particular operations.
Discontinued operations
Certain amounts relating to our discontinued businesses are recorded within assets or liabilities held-for-sale on the consolidated balance sheets and within net loss from discontinued operations on the consolidated statements of income.
Fiscal year
Our fiscal year ends on December 31. Beginning in the first quarter of 2018, we began reporting our interim quarterly periods on a 13-week basis ending on a Sunday. Prior to the first quarter of 2018 we reported our interim quarterly periods on a calendar quarter basis.
Use of estimates
The preparation of our consolidated financial statements in conformity with GAAP requires us to make estimates and assumptions that affect the amounts reported in these consolidated financial statements and accompanying notes, disclosures of contingent assets and liabilities at the date of the financial statements and in the reported amounts of revenues and expenses during the reporting period. TheseSignificant estimates include our accounting for valuationassessment of goodwill estimated losses on accounts receivable,for impairment, estimated realizable value on excess and obsolete inventory, cost-to-cost revenue recognition, assets acquired and liabilities assumed in acquisitions, estimated selling proceeds from assets held for sale, contingent liabilities, measurement of contingent consideration, income taxes and pension benefits. Actual results could differ from our estimates.
53
1. Summary of Significant Accounting Policies (continued)
Goodwill and other long-livedidentifiable intangible assets
Business combinations are accounted for using the purchase method. The cost of an acquisition is measured as the aggregate of the consideration transferred, measured at acquisition date fair value, and the amount of any non-controlling interest in the acquiree. The measurement of non-controlling interest is at fair value and is determined on a transaction by transaction basis. Acquisition costs are expensed as incurred.
Goodwill is initially measured at cost, beingrepresents the excess of the aggregatecost of acquired businesses over the acquisition-datenet of the fair value of the consideration transferredidentifiable tangible net assets, identifiable intangible assets purchased, and the amount recognized for the non-controlling interest over the net identifiable amounts of the assets acquired and the liabilities assumed in exchange for the business combination. After initial recognition, goodwill is measured at cost less any accumulated impairment losses. assumed.
Goodwill is tested at least annually for impairment and is tested for impairmentor more frequently if events or changes in circumstances indicate that the asset might be impaired. Goodwill is tested for impairment by either performing a qualitative evaluation or a quantitative test. The impairment testqualitative evaluation is performed using a two-step process. In the first step,an assessment of factors to determine whether it is more likely than not that the fair value of eacha reporting unit is compared with theless than its carrying amount, of the reporting unit, including goodwill. IfWe may elect not to perform the estimated fair value is less than the carrying amount of the reporting unit there is an indication that goodwill impairment exists and a second step must be completed in order to determine the amount of the goodwill impairment, if any, that should be recorded. In the second step, an impairment loss is recognizedqualitative assessment for any excess of the carrying amount of the reporting unit’s goodwill over the implied fair value of that goodwill. For the purpose of impairment testing, goodwill acquired in a business combination is, from the acquisition date, allocated to the Company's reporting units that are expected to benefit from the combination.
Other intangible assets are measured initially at cost, or, where acquired in a business combination, at fair value, and are amortized on a straight-line basis over their estimated useful lives, as shown in the table below.
| Customer relationships | |||||||||||
| Technology and trading related | 5 | ||||||||||
The carrying values are reviewed for impairment when events or changes in circumstances indicate that the carrying value may not be recoverable. Reviews are made annually of the estimated remaining lives and residual values of the patents and trademarks.
Investments in affiliates
The company owns interestsinterest in the following affiliates:
affiliate:
| Name of company | Country of incorporation | Holding | Proportion of voting rights and shares held | Classification | Consolidation method | ||||||||||||||||||
| Nikkei-MEL Co. Limited | Japan | Ordinary shares | 50% | Joint venture | Equity method | ||||||||||||||||||
Property, plant and equipment, net
Property, plant and equipment isare stated at historic cost less accumulated depreciation and any impairment in value. Depreciation is initially calculated on a straight-line basis over the estimated useful life of the particular asset. The depreciation expense during 2018, 20172022, 2021 and 20162020 was $17.8$12.9 million, $17.0$14.7 million and $17.0$12.6 million, respectively. As a result of the complexity of our manufacturing process, there is a wide range of plant and equipment in operation. The estimated useful lives isare summarized as follows:
| Freehold buildings | 10 - 33 years | ||||||||||
| Leasehold land and buildings | The lesser of life of lease or freehold rate | ||||||||||
| Machinery and equipment | 3 - 25 years | ||||||||||
| Including: | |||||||||||
| Heavy production equipment (including casting, rolling, extrusion and press equipment) | 20 - 25 years | ||||||||||
| Chemical production plant and robotics | 7 - 10 years | ||||||||||
| Other production machinery | 5 - 10 years | ||||||||||
| Furniture, fittings, storage and equipment | 3 - 10 years | ||||||||||
| Computer | |||||||||||
Freehold land is not depreciated.
54
1. Summary of Significant Accounting Policies (continued)
Property, plant and equipment, net (continued)
Reviews are made annually of the estimated remaining lives and residual values of individual productive assets, taking account of commercial and technological obsolescence, as well as normal wear and tear.
We review the carrying value for any individual asset or asset group for impairment when events or changes in circumstances indicate the carrying value may not be recoverable. If any such indication exists, and where the carrying value exceeds the estimated recoverable amount, the asset is written-down to its estimated recoverable amount. The assessment of possible impairment is based on our ability to recover the carrying value of the asset or asset group from the expected future pre-tax cash flows (undiscounted and without interest charges) of the related operations. If these cash flows are less than the carrying value of such asset or asset group, an impairment loss is recognized for the difference between estimated fair value and carrying value. Impairment losses on long-lived assets held for sale are determined in a similar manner, except that fair values are reduced for the cost to dispose of the assets. Theassets.The measurement of impairment requires us to estimate future cash flows and the fair value of long-lived assets. During 20182021, we recorded an impairment of $6.6 million (2017: $1.3 million) in relation to restructuring activities and $3.4 million (2017: $nil) from the fair value adjustment in relation to the sale of the Czech business, recorded in impairment charges. In 2017 we recorded an impairmentcharge of $1.5 million as part of an annual exercise to review the use of our long-lived assets.within discontinued operations. There waswere no impairment charges recognized in relation to 2016.2022 and 2020.
Impairments
The Company will recognize impairments in relation to property, plant and equipment, investments, and goodwill, other identifiable intangible assets and other long-lived assets in accordance with the above policies. Impairments relating to restructuring activities, incurred to exit an activity or location, will be recorded within the restructuring line on the StatementStatements of Income, otherIncome. Other impairments will be recorded within the impairment charges line on the StatementStatements of Income. Impairments related to discontinued operations will be recorded within the net loss from discontinued operations line on the Statements of Income.
Also within discontinued operations in 2021, there was a $1.5 million impairment charge relating to plant and equipment held in our Superform U.S. business, $3.4 million; $2.4m write-off in relation to the acquisitionreflecting updated expectations of GTM and $1.3 million of goodwill impairment within the Superform business unit.fair market value.
Revenue Recognition
A performance obligation is a promise in a contract to transfer a distinct good or service to the customer. The majority of the Company’s contracts have a single performance obligation, as the promise to transfer the individual goods or services is not separately identifiable from other promises in the contracts and, therefore, not distinct. There is no variable consideration or obligations for returns, refunds, and noor other related obligations in the Company’s contracts.
Payment terms and conditions vary by contract type and may include a requirement of payment in advance. In general, our payment terms are 30 to 60 days. In instances where the timing of revenue recognition differs from the timing of invoicing, the Company has determined its contracts do not include a significant financing component.
The Company’s revenue is primarily derived from the following sources and are recognized when or as the Company satisfies a performance obligation by transferring a good or service to a customer.customer:
Product revenues
We recognize revenue when it is realized or realizable and has been earned. Revenue is recognized when the following are met: (i) persuasive evidence of an arrangement exists,exists; (ii) shipment or delivery has occurred (depending on the terms of the sale), which is when the transfer of product or control occurs,occurs; (iii) our price to the buyer is fixed or determinable,determinable; and (iv) the ability to collect is reasonably assured.
Royalties
Royalty revenue is recognized on an accrual basis in accordance with the substance of the relevant agreements, provided that it is probable that the economic benefits will flow to the Company and the amount of revenue can be measured reliably.
Practical Expedients
The Company has applied the transition practical expedient and does not disclose the amount of the transaction price allocated to the remaining performance obligations and an explanation of when the Company expects to recognize that amount as revenue for the fiscal year beginning January 1, 2016.
55
1. Summary of Significant Accounting Policies (continued)
Cash, and Cash Equivalents and Restricted Cash
We consider all highly liquid investments purchased with an original maturity of three months or less to be cash equivalents.
Restricted cash is recognized separately in the Consolidated Balance Sheets. Restricted cash balances were $0.3 million at December 31, 20182022, and $0.7$0.2 million at December 31, 2017.2021. The $0.3 million in 2018 (2017: $0.4 million) isamounts held in escrow to disburse environmental liabilities recognized as a result of the acquisition of the Specialty Metals division of ESM Inc in 2017. A further $0.3 million waswere held in relation to deferred considerationa payment received for the same acquisitionan historic doubtful debt in 2017.our Elektron division and workers' compensation insurance.
Inventories
Inventories are stated at the lower of cost or net realizable value. Raw materials are valued on a first-in, first-out basis. Strategic purchases of inventories in order to secure supply and reduce the impact of price volatility on the cost of inventories are valued on a weighted-average cost basis. Work in progress and finished goods costs comprise direct materials and,including, where applicable, direct labor costs, an apportionment of production overheads and any other costs that have been incurred in bringing the inventories to their present location and condition. Inventories are reviewed on a regular basis, and we will make allowance for excess or obsolete inventories and write-down to net realizable value based primarily on committed sales prices and our estimates of expected and future product demand and related pricing.
Research and Development
Included within research and development costs are directly attributable salaries, materials and consumables, as well as third-party contractor fees and research costs. These costs are expensed as incurred.
Foreign currencies
Transactions in currencies other than an operation's functional currency are initially recorded in the functional currency at the rate of exchange prevailing on the dates of transactions. At each balance sheet date, the foreign currency monetary assets and liabilities of each operation are translated into the functional currency of that operation at the rates prevailing on the balance sheet date.
All differences are taken to the consolidated statement of income, / (loss), with the exception of differences on foreign currency borrowings that provide a hedge against a net investment in a foreign entity. These differences on foreign currency borrowings are taken directly to equity until the disposal of the net investment, at which time they are recognized in the consolidated statement of income / (loss).income. Tax charges and credits attributable to exchange differences on those borrowings are also included in equity.
On consolidation, the assets and liabilities of the Company's foreign operations are translated at exchange rates prevailing on the balance sheet date. Income and expense items are translated at the average exchange rates for the period. Exchange differences that arise, if any, are included in Accumulated other comprehensive income / (loss) (“AOCI”), a separate component of equity. Such translation differences are recognized in the consolidated statements of income / (loss) in the period in which the Company either loses control of the operation or liquidation.liquidation occurs.
During 2018,2022, the average USD/GBP sterling exchange rate was £0.7509£0.8108 compared to the 20172021 average of £0.7682.£0.7264. This change resulted in a positivenegative impact of $2.5$15.6 million on revenue and $0.2$2.3 million on operating income. Based on the 20182022 level of revenue and income, a weakening in GBP sterling leading to a £0.05 increase in the USD/GBP sterling exchange rate would result in a decrease of $6.4$8.7 million in revenue and $0.5a decrease of $1.0 million in operating net income.
56
1. Summary of $0.8 million on revenue and $0.1 million on operating profit. Based on the 2018 level of revenue and income, a weakening in the Euro leading to a €0.05 increase in the Euro to U.S. dollar exchange rate would result in a decrease of $1.1 million in revenue and no change to operating profit.Significant Accounting Policies (continued)
Income taxes
Income taxes are accounted for under the asset and liability method. Deferred tax assets and liabilities are recognized for the future tax consequences attributable to differences between the financial statement carrying amounts of existing assets and liabilities and their respective tax bases and operating loss and tax credit carry-forwards. Deferred tax assets and liabilities are measured using enacted tax rates expected to apply to taxable income in the years in which those temporary differences are expected to be recovered or settled. When the Company does not believe that, on the basis of available information, it is more likely than not that deferred tax assets will be fully recovered, it recognizes a valuation allowance against its deferred tax assets to reduce the deferred tax assets to the amount more likely than not to be realized. The effect on deferred tax assets and liabilities of a change in tax rates is recognized in income in the period that includes the enactments date.
Furthermore, a tax benefit from a tax position may be recognized in the financial statements only if it is more-likely-than-not that the position is sustainable, based solely on its technical merits and consideration of the relevant tax authority’s widely understood administrative practices and precedents. The tax benefit recognized, when the likelihood of realization is more likely-than-not (i.e. greater than 50 percent), is measured at the largest amount that is greater than 50 percent likely of being realized upon settlement.
Employee benefit plans
The Company operates funded defined benefit pension plans in the U.K., the U.S. and France. The levels of funding are determined by periodic actuarial valuations that take into account changes in actuarial assumptions, including discount rates and expected returns on plan assets. The assets of the plans are generally held in separate trustee-administeredTrustee-administered funds. The Company also operates defined contribution plans in the U.K., the U.S., Australia and Canada.
Actuarial assumptions are updated annually and are disclosed in Note 12.14. We recognize changes in the fair value of plan assets and net actuarial gains or losses for pension and other post-retirement benefits annually in the fourth quarter each year (“mark-to-market adjustment”) and, if applicable, in any quarter in which an interim remeasurement is triggered. Net actuarial gains and losses occur when the actual experience differs from any of the various assumptions used to value our pension and other post-retirement plans or when assumptions change, as they may each year. The remaining components of pension expense, including service and interest costs and estimated return on plan assets, are recorded on a quarterly basis.
Payments to defined contribution plans are charged as an expense as they fall due.
Commitments and contingencies
Loss contingencies are recognized when the Company has a present obligation as a result of a past event, it is probable that a transfer of resources will be required to settle the obligation, and a reliable estimate can be made of the amount of the obligation.
Share-based compensation
We account for share-based compensation awards on a fair value basis.basis at the grant date. The estimated grant date fair value of each option award is recognized in income on an accelerated basis over the requisite service period (generally the vesting period). The estimated fair value of each option award is calculated using either the Black-Scholes option-pricing model or a Monte-Carlo simulation, both of which isare subjective and involvesinvolve the application of significant estimates and assumptions, including the expected term of the award, implied volatility, expected dividend yield and the risk-free interest rate. Restricted share awards and units are recorded as compensation cost on an accelerated basis over the requisite service periods based on the market value on the date of the grant.
Performance share units ("PSU") are stock awards where the ultimate number of shares issued will be contingent on the Company's performance against certain financial performance targets. The fair value of each PSU is based on the market value on the date of grant. We recognize expense based upon the fair value of the awards on the grant date and the estimated vesting of the PSUs granted. The estimated vesting of the performance share unitsPSUs is based on the probability of achieving certain financial performance thresholds over the specified performance period.
57
1. Summary of Significant Accounting Policies (continued)
Trade receivables and concentration of credit riskWe record an
The Company is exposed to credit losses primarily through sales of products. The Company’s expected loss allowance methodology for doubtful accounts reducing ourreceivable is developed using historical collection experience, current and future economic and market conditions and a review of the current status of customers' trade accounts receivables. Due to the short-term nature of such receivables, balance to an amount wethe estimate is collectible from our customers. Estimates used in determining the allowance for doubtful accounts are based on current trends, aging of accounts receivable periodic credit evaluationsamounts that may not be collected is based on aging of our customers’the accounts receivable balances and the financial condition of customers. Additionally, specific allowance amounts are established to record the appropriate provision for customers that have a higher probability of default.
Estimates are used to determine the allowance. It is based on assessment of anticipated receipts and all other historical, collection experience.current and future information that is reasonably available.
We are exposed to credit risk in the event of nonpayment by customers. However, we mitigate our exposure to credit risk by performing ongoing credit evaluations and, when deemed necessary, utilizing credit insurance, prepayments or guarantees. No individual customer represented more than 10% of our revenue or accounts receivable. The concentration of credit risks from financial instruments related to the markets we serve is not expected to have a material adverse effect on our consolidated financial position, cash flows or future results of operations.
Derivative financial instruments
We recognize all derivatives as either assets or liabilities (within accounts and other receivables accounts payable,or other non-current assets and other non-currentcurrent liabilities) at fair value in our Consolidated Balance Sheets. If the derivative is designated and is effective as a cash-flow hedge, changes in the fair value of the derivative are recorded in AOCI as a separate component of equity in the Consolidated Statements of Changes in Equity and are recognized in cost of goods sold in the Consolidated Statements of Income / (loss) when the hedged item affects earnings. If the underlying hedged transaction ceases to exist or if the hedge becomes ineffective, all changes in fair value of the related derivatives that have not been settled are recognized in current earnings in cost of goods sold. For a derivative that is not designated as or does not qualify as a hedge,Any changes in fair value are reported in the income statement immediately again in cost of goods sold.sales. We use derivative instruments for the purpose of hedging commodity price risk and currency exposures, which exist as part of ongoing business operations.
New accounting standards
Accounting standards which have been early adopted
Accounting standards issued but not yet effective
58
2. Revenue
Disaggregated revenue from continuing operations for the guidancefiscal years ended December 31, 2022, 2021, and 2020, are included below and in ASU 2016-02,Note 17, Segment Information.
| Years ended December 31, | |||||||||||||||||||||||||||||||||||||||||
| 2022 | 2021 | 2020 | |||||||||||||||||||||||||||||||||||||||
| In millions | Gas Cylinders | Elektron | Total | Gas Cylinders | Elektron | Total | Gas Cylinders | Elektron | Total | ||||||||||||||||||||||||||||||||
| General industrial | $ | 34.0 | $ | 121.5 | $ | 155.5 | $ | 33.4 | $ | 95.8 | $ | 129.2 | $ | 24.2 | $ | 87.7 | $ | 111.9 | |||||||||||||||||||||||
| Transportation | 77.8 | 55.1 | 132.9 | 71.2 | 45.8 | 117.0 | 49.8 | 42.3 | 92.1 | ||||||||||||||||||||||||||||||||
| Defense, First Response & Healthcare | 71.9 | 63.1 | 135.0 | 73.7 | 54.2 | 127.9 | 67.9 | 52.9 | 120.8 | ||||||||||||||||||||||||||||||||
| $ | 183.7 | $ | 239.7 | $ | 423.4 | $ | 178.3 | $ | 195.8 | $ | 374.1 | $ | 141.9 | $ | 182.9 | $ | 324.8 | ||||||||||||||||||||||||
The Company’s performance obligations are satisfied at a point in time. With the Company has evaluated ASU 2018-11, which was issued in July 2018, and provides an optional transitional method.classification of our Superform business as discontinued operations, none of the Company's revenue is satisfied over time. As a result, of this evaluation, the Company elected to use the optional transitional method, which allows companies to use the effective date as the date of initial application on transitionCompany's contract receivables, contract assets and not adjust comparative period financial information or make the new required disclosures for periods prior to the effective date. Additionally, the Company elected to use the package of practical expedients permitted under the transition guidancecontract liabilities at December 31, 2022, December 31, 2021 and December 31, 2020 are included within the new standard.
current assets and liabilities held-for-sale.
3. Acquisitions and disposals
Acquisition-related costs of $0.3 million and $1.5 million in 2022 and 2021 respectively, represent transitional costs and professional fees incurred in relation to the above SCI acquisition.
In 2021, the Company recognized a net assetsgain on disposition of $6.6 million, consisting of a $7.1 million gain on our U.S. aluminum business, sold in March 2021, partially offset by a $0.5 million loss on our Superform U.K. business sold in September 2021.
In 2020, the Company sold its 51% investment in Luxfer Uttam India Private Limited to our joint venture partner for INR 137.4 million ($1.8 million) cash. Allowing for legal costs, we generated a profit on disposal of less than $0.1 million. During the year we also incurred $0.4 million costs in relation to M&A exploration activities offset by deferred consideration adjustment and profit on previous written-down inventory.
4. Restructuring charges
During 2022, 2021 and 2020, we initiated and continued execution of certain business restructuring initiatives aimed at reducing our fixed cost structure and realigning our business.
In 2022, there was an additional $1.7 million of costs in relation to the closure of Luxfer Holdings NA LLC atGas Cylinders' French site, which was largely legal and professional fees. In addition, $0.2 million of costs were incurred relating to one-time employee termination benefits, in the acquisition dateElektron division, in relation to the consolidation of production facilities in the Magnesium Powders operations.
In 2021, there was assessed as $4.0$5.0 million valuingof costs in relation to the residual 51% stake at $2.1closure of Luxfer Gas Cylinders' French site, which includes an additional $1.0 million charge for environmental remediation and $2.4 million employee litigation claims, with the remaining largely legal and professional fees. A further $0.3 million of miscellaneous project costs were incurred in the Gas Cylinders Segment during 2021. There was also $0.9 million of one-time employee termination costs in the Elektron division, largely in relation to the divestiture of our small Luxfer Magtech production facility in Ontario, Canada.
In 2020, there was $7.5 million of costs in relation to the closure of Luxfer Gas Cylinders' French site. In response to uncertain global economic conditions, we undertook actions to reduce the Company's cost structure and improve operating efficiency. These actions included a workforce reduction program resulting in no goodwill being recognized on$1.4 million of severance-related charges, of which $0.4 million and $0.9 million were incurred in the step acquisition.Gas Cylinders and Elektron Segments respectively, and $0.1 million which is unallocated.
59
4. Restructuring charges (continued)
All restructuring charges in the consolidated statement of income within impairment charges. At December 31, 2018, Luxfer Holdings NA LLC is 100% ownedare in relation to severance and related costs for 2022, 2021 and 2020.
Restructuring costs by the Company, is no longer considered a VIE and is a fully consolidated subsidiary. As the acquisition occurred very closereportable segment were as follows:
| Years ended December 31, | ||||||||||||||||||||||||||
| In millions | 2022 | 2021 | 2020 | |||||||||||||||||||||||
| Gas Cylinders Segment | $ | (1.7) | $ | (5.3) | $ | (7.9) | ||||||||||||||||||||
| Elektron Segment | (0.2) | (0.9) | (0.9) | |||||||||||||||||||||||
| Other | $ | — | $ | — | $ | (0.1) | ||||||||||||||||||||
| Total restructuring charges | $ | (1.9) | $ | (6.2) | $ | (8.9) | ||||||||||||||||||||
Activity related to the year end date, no revenue or earnings arerestructuring, recorded in other current liabilities in the consolidated statementbalance sheets is summarized as follows:
| In millions | 2022 | 2021 | |||||||||||||||
| Balance at January 1, | $ | 11.7 | $ | 9.0 | |||||||||||||
| Costs incurred | 1.9 | 6.2 | |||||||||||||||
| Cash payments and other | (9.9) | (3.5) | |||||||||||||||
| Balance at December 31, | $ | 3.7 | $ | 11.7 | |||||||||||||
5. Other charges
Other charges of income for$1.1 million in 2021 relates to the reporting period.
In 2020 the entity. Where appropriate, this is payable annually from 2015 to 2020. The deferred contingent consideration totaled $0.9Company recognized $0.4 million at December 31, 2018 (2017: $0.7 million), following a remeasurement of deferred contingent consideration at the year-end based upon the estimated future cash flows and the weighted probability of those cash flows being achieved, resulting in a debitother charges relating to the consolidated income statementremediation of $0.9 million (2017: $1.0 million), net of an unwind of discount on deferred contingent consideration of $0.2 million (2017: $0.2 million). The entire consideration is deemed to be current (2017: $0.5 million)a legacy environmental issue which commenced in 2019. This was completed in 2021 and shown on the balance sheet within other currentall liabilities as it is based on the performance of Luxfer Magtech for the year ending December 31, 2018. The potential undiscounted future payment has been estimated at $0.9 million (2017: $0.7 million). The maximum undiscounted amount payable under the sale agreement is $10.0 million.settled.
60
| Years ended December 31, | |||||||||
| In millions | 2018 | 2017 | |||||||
| Net cash flows on purchase of business: | |||||||||
| Included in net cash flows from investing activities: | |||||||||
| Consideration paid | $ | — | $ | (4.3 | ) | ||||
| Cash receipt on disposal of business | — | 0.1 | |||||||
| Acquisition and disposal costs paid | — | (0.5 | ) | ||||||
| Cash acquired | 2.7 | — | |||||||
| Net cash flows on purchase of business | $ | 2.7 | $ | (4.7 | ) | ||||
| Years ended December 31, | |||||||||
| In millions | 2018 | 2017 | |||||||
| Net cash flows on purchase of business: | |||||||||
| Included in net cash flows from financing activities: | |||||||||
| Deferred consideration paid | $ | (0.8 | ) | $ | (1.4 | ) | |||
| Net cash flows on purchase of business | $ | (0.8 | ) | $ | (1.4 | ) | |||
Basic earnings per share are computed by dividing net income for the period by the weighted-average number of ordinary shares outstanding, net of Treasury shares and shares held in ESOP. Diluted earnings per share are computed by dividing net income for the period by the weighted average number of ordinary shares outstanding and the dilutive ordinary sharesshare equivalents.
Basic and diluted earnings per share were calculated as follows:
| Years ended December 31, | |||||||||||||||||||||||
| In millions except share and per-share data | 2022 | 2021 | 2020 | ||||||||||||||||||||
| Basic earnings: | |||||||||||||||||||||||
| Net income from continuing operations | $ | 32.0 | $ | 30.0 | $ | 20.8 | |||||||||||||||||
| Net gain / (loss) from discontinued operations | (5.1) | (0.1) | (0.8) | ||||||||||||||||||||
| Net income | $ | 26.9 | $ | 29.9 | $ | 20.0 | |||||||||||||||||
| Weighted average number of £0.50 ordinary shares: | |||||||||||||||||||||||
| For basic earnings per share | 27,304,847 | 27,698,691 | 27,557,219 | ||||||||||||||||||||
| Dilutive effect of potential common stock | 236,355 | 333,815 | 414,163 | ||||||||||||||||||||
| For diluted earnings per share | 27,541,202 | 28,032,506 | 27,971,382 | ||||||||||||||||||||
Earnings / (loss) per share using weighted average number of ordinary shares outstanding:(1) | |||||||||||||||||||||||
| Basic from continuing operations | $ | 1.17 | $ | 1.08 | $ | 0.75 | |||||||||||||||||
| Basic from discontinued operations | $ | (0.19) | $ | — | $ | (0.03) | |||||||||||||||||
| Basic earnings per ordinary share | $ | 0.99 | $ | 1.08 | $ | 0.73 | |||||||||||||||||
| Diluted from continuing operations | $ | 1.16 | $ | 1.07 | $ | 0.74 | |||||||||||||||||
| Diluted from discontinued operations | $ | (0.19) | $ | — | $ | (0.03) | |||||||||||||||||
| Diluted earnings per ordinary share | $ | 0.98 | $ | 1.07 | $ | 0.72 | |||||||||||||||||
| Years ended December 31, | |||||||||||||
| In millions except share and per-share data | 2018 | 2017 | 2016 | ||||||||||
| Basic earnings: | |||||||||||||
| Net income | $ | 25.0 | $ | 16.6 | $ | 17.8 | |||||||
| Weighted average number of £0.50 ordinary shares: | |||||||||||||
| For basic earnings per share | 26,708,469 | 26,460,947 | 26,443,662 | ||||||||||
| Dilutive effect of potential common stock | 983,793 | 263,034 | 210,976 | ||||||||||
| For diluted earnings per share | 27,692,262 | 26,723,981 | 26,654,638 | ||||||||||
| Earnings per share using weighted average number of ordinary shares outstanding: | |||||||||||||
| Basic earnings per ordinary share | $ | 0.94 | $ | 0.63 | $ | 0.67 | |||||||
| Diluted earnings per ordinary share | $ | 0.90 | $ | 0.62 | $ | 0.67 | |||||||
| Years ended December 31, | |||||||||||||||||||||||||||||||
| 2018 | 2017 | 2016 | |||||||||||||||||||||||||||||
| In millions | Gas Cylinders | Elektron | Total | Gas Cylinders | Elektron | Total | Gas Cylinders | Elektron | Total | ||||||||||||||||||||||
| General industrial | $ | 50.7 | $ | 123.9 | $ | 174.6 | $ | 49.6 | $ | 95.6 | $ | 145.2 | $ | 45.7 | $ | 85.7 | $ | 131.4 | |||||||||||||
| Transportation | 79.0 | 72.8 | 151.8 | 63.8 | 66.5 | 130.3 | 72.9 | 62.9 | 135.8 | ||||||||||||||||||||||
| Defense and emergency | 79.3 | 49.4 | 128.7 | 76.5 | 54.1 | 130.6 | 83.1 | 36.2 | 119.3 | ||||||||||||||||||||||
| Healthcare | 29.1 | 3.7 | 32.8 | 30.3 | 4.9 | 35.2 | 24.1 | 4.2 | 28.3 | ||||||||||||||||||||||
| $ | 238.1 | $ | 249.8 | $ | 487.9 | $ | 220.2 | $ | 221.1 | $ | 441.3 | $ | 225.8 | $ | 189.0 | $ | 414.8 | ||||||||||||||
7. Discontinued operations
Our Superform aluminum superplastic forming business, which operated from contracts with customers is included in these amounts.
| In millions | December 31, 2018 | December 31, 2017 | |||||||
| Contract receivables | $ | 1.5 | $ | 1.6 | |||||
| Contract assets | 2.1 | 4.6 | |||||||
| Contract liabilities | (1.1 | ) | (0.9 | ) | |||||
| In millions | 2018 | 2017 | |||||||
| As at January 1, | $ | (0.9 | ) | $ | (0.2 | ) | |||
| Payments received / amounts billed | (3.8 | ) | (2.2 | ) | |||||
| Costs incurred / revenue recognized | 3.6 | 1.5 | |||||||
| As at December 31, | $ | (1.1 | ) | $ | (0.9 | ) | |||
Our U.S. aluminum gas cylinder business was sold in March 2021 for $20.2 million, net of working capital adjustments. The Company recognized a gain on disposition, net of tax, of $7.1 million.
In September 2021, our Superform U.K. business was sold for $4.0 million, net of working capital adjustments. The Company recognized a loss on disposition, net of tax, of $0.5 million.
In 2022, the Company recognized impairment and disposal-related costs of $2.6 million and $2.0 million respectively, in relation to the Company's announcement that it was under consultation to close its French site. There is an expectation that further costs will be incurredprevious dispositions which occurred in 2019. Within2021.
The assets and liabilities of the Elektron segment, thereabove businesses have been asset write-downs in connection to the closure of our Luxfer Graphic Arts site in Findlay, OH, with consolidation of operations in Madison, IL; presented within Current assets held-for-sale and the previously announced closure of our Luxfer Magtech site in Riverhead, NY (see below).
61
| Years ended December 31, | ||||||||||||||
| In millions | 2018 | 2017 | 2016 | |||||||||||
| Severance and related costs | $ | (6.7 | ) | $ | (4.6 | ) | $ | (0.4 | ) | |||||
| Asset impairment | (6.8 | ) | (2.3 | ) | — | |||||||||
| Other | 0.1 | (1.5 | ) | — | ||||||||||
| Total restructuring charges | $ | (13.4 | ) | $ | (8.4 | ) | $ | (0.4 | ) | |||||
| In millions | 2022 | 2021 | 2020 | |||||||||||||||||||||||
| Net sales | $ | 7.7 | $ | 20.9 | $ | 53.2 | ||||||||||||||||||||
| Cost of goods sold | (6.9) | (21.8) | (51.5) | |||||||||||||||||||||||
| Gross (loss) / profit | 0.8 | (0.9) | 1.7 | |||||||||||||||||||||||
| Selling, general and administrative expenses | (0.9) | (2.9) | (5.8) | |||||||||||||||||||||||
| Restructuring charges | (0.3) | (1.0) | (0.1) | |||||||||||||||||||||||
| Acquisition and disposal costs | (2.0) | — | — | |||||||||||||||||||||||
| Impairment charges | (2.6) | (1.5) | — | |||||||||||||||||||||||
| Other income | — | — | 3.4 | |||||||||||||||||||||||
| Net loss before income taxes | (5.0) | (6.3) | (0.8) | |||||||||||||||||||||||
| Provision for income taxes | (0.1) | (0.4) | — | |||||||||||||||||||||||
| Net loss | $ | (5.1) | $ | (6.7) | $ | (0.8) | ||||||||||||||||||||
| Years ended December 31, | ||||||||||||||
| In millions | 2018 | 2017 | 2016 | |||||||||||
| Gas Cylinders segment | $ | (10.0 | ) | $ | (2.9 | ) | $ | — | ||||||
| Elektron segment | (3.4 | ) | (5.5 | ) | (0.4 | ) | ||||||||
| Total restructuring charges | $ | (13.4 | ) | $ | (8.4 | ) | $ | (0.4 | ) | |||||
| In millions | December 31, 2022 | December 31, 2021 | |||||||||||||||
| Accounts and other receivables | $ | 2.7 | $ | 2.1 | |||||||||||||
| Inventories | 2.7 | 2.7 | |||||||||||||||
| Current assets | 5.4 | 4.8 | |||||||||||||||
| Right-of-use assets | 2.7 | — | |||||||||||||||
| Total assets | $ | 8.1 | $ | 4.8 | |||||||||||||
| Accounts payable | 0.8 | 0.5 | |||||||||||||||
| Accrued liabilities | 0.2 | 0.1 | |||||||||||||||
| Other current liabilities | 4.0 | 0.8 | |||||||||||||||
| Current liabilities | 5.0 | 1.4 | |||||||||||||||
| Total liabilities | $ | 5.0 | $ | 1.4 | |||||||||||||
The depreciation and amortization, capital expenditures and significant operating non-cash items were as follows:
| In millions | 2022 | 2021 | 2020 | |||||||||||||||||||||||
| Non-cash add-backs to cash flows from discontinued operating activities: | ||||||||||||||||||||||||||
| Depreciation | $ | 0.1 | $ | 0.5 | $ | 1.1 | ||||||||||||||||||||
| Impairment charges | — | 1.5 | — | |||||||||||||||||||||||
| Settlements from sale of businesses | 1.0 | — | — | |||||||||||||||||||||||
| Cash flows from discontinued investing activities: | ||||||||||||||||||||||||||
| Capital expenditures | $ | 0.1 | $ | 0.1 | $ | 0.3 | ||||||||||||||||||||
Cash balances are swept into the treasury entities at the end of each day, and these sweeps are recorded in other current liabilitieswithin operating cash flows in the consolidated balance sheets is summarized as follows:statements of cash flows.
62
| In millions | 2018 | 2017 | |||||||
| Balance at January 1, | $ | 2.1 | $ | 0.8 | |||||
| Costs incurred | 6.6 | 6.1 | |||||||
| Cash payments and other | (3.5 | ) | (4.8 | ) | |||||
| Balance at December 31, | $ | 5.2 | $ | 2.1 | |||||
Changes in goodwill during the years ended December 31, 20182022 and 20172021 were as follows:
| In millions | Gas Cylinders | Elektron | Total | ||||||||||||||||||||
| At January 1, 2021 | $ | 27.9 | $ | 42.3 | $ | 70.2 | |||||||||||||||||
| Exchange difference | (0.3) | (0.2) | (0.5) | ||||||||||||||||||||
| At December 31, 2021 | 27.6 | 42.1 | 69.7 | ||||||||||||||||||||
| Exchange difference | (2.6) | (1.5) | (4.1) | ||||||||||||||||||||
| Net balance at December 31, 2022 | $ | 25.0 | $ | 40.6 | $ | 65.6 | |||||||||||||||||
| In millions | Gas Cylinders | Elektron | Total | ||||||||||
| At January 1, 2017 | $ | 27.0 | $ | 40.9 | $ | 67.9 | |||||||
| Exchange difference | 2.0 | 1.3 | 3.3 | ||||||||||
| At December 31, 2017 | $ | 29.0 | $ | 42.2 | $ | 71.2 | |||||||
| Impairment | (1.3 | ) | — | (1.3 | ) | ||||||||
| Exchange difference | (1.4 | ) | (0.9 | ) | (2.3 | ) | |||||||
| Net balance at December 31, 2018 | $ | 26.3 | $ | 41.3 | $ | 67.6 | |||||||
Accumulated goodwill impairment losses in relation to continuing operations were $9.6$8.0 million as of December 31, 20182022 and $8.3 million as2021.
Changes in the gross value of identifiable intangible assets during the year ended December 31, 2017, with the difference due to an impairment of goodwill in 2018 associated with our Superform business.2022, were as follows:
| In millions | Customer relationships | Technology and trading related | Total | ||||||||||||||
| At January 1, 2021 | $ | 13.4 | $ | 8.3 | $ | 21.7 | |||||||||||
| Additions | 1.8 | — | 1.8 | ||||||||||||||
| Exchange movements | — | (0.1) | (0.1) | ||||||||||||||
| At December 31, 2021 | $ | 15.2 | $ | 8.2 | $ | 23.4 | |||||||||||
| Exchange movements | — | (0.8) | (0.8) | ||||||||||||||
| At December 31, 2022 | $ | 15.2 | $ | 7.4 | $ | 22.6 | |||||||||||
Identifiable intangible assets consisted of the following:
| December 31, 2022 | December 31, 2021 | ||||||||||||||||||||||||||||||||||||||||
| In millions | Gross | Accumulated amortization | Net | Gross | Accumulated amortization | Net | |||||||||||||||||||||||||||||||||||
| Customer relationships | $ | 15.2 | $ | (6.1) | $ | 9.1 | $ | 15.2 | $ | (5.7) | $ | 9.5 | |||||||||||||||||||||||||||||
| Technology and trading related | 7.4 | (4.0) | 3.4 | 8.2 | (4.0) | 4.2 | |||||||||||||||||||||||||||||||||||
| Total identifiable intangibles | $ | 22.6 | $ | (10.1) | $ | 12.5 | $ | 23.4 | $ | (9.7) | $ | 13.7 | |||||||||||||||||||||||||||||
| December 31, 2018 | December 31, 2017 | ||||||||||||||||||||||||
| In millions | Gross | Accumulated amortization | Net | Gross | Accumulated amortization | Net | |||||||||||||||||||
| Customer relationships | $ | 13.4 | $ | (3.8 | ) | $ | 9.6 | $ | 13.4 | $ | (2.9 | ) | $ | 10.5 | |||||||||||
| Technology and trading related | 7.9 | (2.9 | ) | 5.0 | 8.6 | (3.0 | ) | 5.6 | |||||||||||||||||
| $ | 21.3 | $ | (6.7 | ) | $ | 14.6 | $ | 22.0 | $ | (5.9 | ) | $ | 16.1 | ||||||||||||
Identifiable intangible asset amortization expense in 2018, 20172022, 2021 and 20162020 was $1.2$0.7 million, $1.3$0.9 million and $1.1$0.7 million, respectively.
Intangible asset amortization expense over the next five years is expected to be approximately $1.2$0.7 million in 2019, $1.1 million in 2020, $1.1 million in 2021, $1.1 million in 2022per year.
The weighted-average amortization period for the customer relationships is 16 years and $1.1 million in 2023.
for the technology and trading related assets is 14 years.
63
9. Supplementary balance sheet information
| In millions | 2018 | 2017 | ||||||||
| Accounts and other receivables | ||||||||||
| Trade receivables | $ | 49.8 | $ | 53.8 | ||||||
| Related parties | 0.9 | 1.8 | ||||||||
| Prepayments and accrued income | 7.7 | 10.5 | ||||||||
| Derivative financial instruments | 0.1 | 2.1 | ||||||||
| Other receivables | 4.2 | 4.2 | ||||||||
| Total accounts and other receivables | $ | 62.7 | $ | 72.4 | ||||||
| Inventories | ||||||||||
| Raw materials and supplies | $ | 30.5 | $ | 31.0 | ||||||
| Work-in-process | 33.1 | 28.1 | ||||||||
| Finished goods | 30.0 | 23.1 | ||||||||
| Total inventories | $ | 93.6 | $ | 82.2 | ||||||
| Other current assets | ||||||||||
| Held-for-sale assets | $ | 10.7 | $ | — | ||||||
| Income tax receivable | — | 1.2 | ||||||||
| Total other current assets | $ | 10.7 | $ | 1.2 | ||||||
| Property, plant and equipment, net | ||||||||||
| Land, buildings and leasehold improvements | $ | 73.3 | $ | 80.8 | ||||||
| Machinery and equipment | 286.0 | 292.7 | ||||||||
| Construction in progress | 10.1 | 6.7 | ||||||||
| Total property plant and equipment | 369.4 | 380.2 | ||||||||
| Accumulated depreciation and impairment | (262.5 | ) | (251.1 | ) | ||||||
| Total property, plant and equipment, net | $ | 106.9 | $ | 129.1 | ||||||
| Other non-current assets | ||||||||||
| Derivative financial instruments | $ | — | $ | 0.3 | ||||||
| Total other non-current assets | $ | — | $ | 0.3 | ||||||
| Current maturities of long-term debt and short-term borrowings | ||||||||||
| Bank and other loans | $ | — | $ | 15.0 | ||||||
| Overdrafts | 3.5 | 4.2 | ||||||||
| Total current maturities of long-term debt and short-term borrowings | $ | 3.5 | $ | 19.2 | ||||||
| Other current liabilities | ||||||||||
| Contingent liabilities | $ | 5.3 | $ | 2.8 | ||||||
| Held-for-sale liabilities | 2.5 | — | ||||||||
| Derivative financial instruments | — | 1.5 | ||||||||
| Other current liabilities | 4.1 | 2.1 | ||||||||
| Total other current liabilities | $ | 11.9 | $ | 6.4 | ||||||
| Other non-current liabilities | ||||||||||
| Contingent liabilities | $ | 0.8 | $ | 1.1 | ||||||
| Derivative financial instruments | — | 0.4 | ||||||||
| Other non-current liabilities | 0.5 | 1.7 | ||||||||
| Total other non-current liabilities | $ | 1.3 | $ | 3.2 | ||||||
| In millions | 2022 | 2021 | ||||||||||||||||||
| Accounts and other receivables | ||||||||||||||||||||
| Trade receivables, net | $ | 56.4 | $ | 45.8 | ||||||||||||||||
| Related parties | 0.1 | 0.1 | ||||||||||||||||||
| Prepayments and accrued income | 6.6 | 8.5 | ||||||||||||||||||
| Derivative financial instruments | 0.7 | 0.1 | ||||||||||||||||||
| Deferred consideration | — | 1.0 | ||||||||||||||||||
| Other receivables | 4.0 | 2.3 | ||||||||||||||||||
| Total accounts and other receivables | $ | 67.8 | $ | 57.8 | ||||||||||||||||
| Inventories | ||||||||||||||||||||
| Raw materials and supplies | $ | 42.7 | $ | 39.3 | ||||||||||||||||
| Work-in-process | 44.0 | 26.7 | ||||||||||||||||||
| Finished goods | 24.4 | 24.5 | ||||||||||||||||||
| Total inventories | $ | 111.1 | $ | 90.5 | ||||||||||||||||
| Property, plant and equipment, net | ||||||||||||||||||||
| Land, buildings and leasehold improvements | $ | 58.9 | $ | 64.6 | ||||||||||||||||
| Machinery and equipment | 254.9 | 266.3 | ||||||||||||||||||
| Construction in progress | 9.8 | 8.4 | ||||||||||||||||||
| Total property plant and equipment | 323.6 | 339.3 | ||||||||||||||||||
| Accumulated depreciation and impairment | (245.9) | (251.8) | ||||||||||||||||||
| Total property, plant and equipment, net | $ | 77.7 | $ | 87.5 | ||||||||||||||||
| Other current liabilities | ||||||||||||||||||||
| Short term provision | $ | 0.1 | $ | 0.2 | ||||||||||||||||
| Restructuring provision | 3.7 | 11.7 | ||||||||||||||||||
| Derivative financial instruments | 0.4 | 0.1 | ||||||||||||||||||
| Operating lease liability | 4.7 | 3.0 | ||||||||||||||||||
| Advance payments | 2.3 | 4.6 | ||||||||||||||||||
| Total other current liabilities | $ | 11.2 | $ | 19.6 | ||||||||||||||||
| Other non-current liabilities | ||||||||||||||||||||
| Contingent liabilities | $ | 0.7 | $ | 1.8 | ||||||||||||||||
| Operating lease liability | 18.2 | 9.8 | ||||||||||||||||||
| Other non-current liabilities | 0.1 | — | ||||||||||||||||||
| Total other non-current liabilities | $ | 19.0 | $ | 11.6 | ||||||||||||||||
Impairment of property, plant and equipment
64
| Reclassified to held-for-sale assets | December 31, 2018 | ||||
| In millions | |||||
| Property, plant and equipment | $ | 5.5 | |||
| Inventory | 2.9 | ||||
| Accounts and other receivables | 2.3 | ||||
| Held-for-sale assets | $ | 10.7 | |||
| Reclassified to held-for-sale liabilities | |||||
| Accounts payables | $ | 2.5 | |||
| Held-for-sale liabilities | $ | 2.5 | |||
Components of Accumulated Other Comprehensive Loss consist of the following:
| In millions | December 31, 2022 | December 31, 2021 | |||||||||||||||
| Cumulative translation adjustments | $ | (65.7) | $ | (52.5) | |||||||||||||
| Pension plans actuarial loss, net of tax | (73.7) | (82.5) | |||||||||||||||
| Accumulated other comprehensive loss | $ | (139.4) | $ | (135.0) | |||||||||||||
| In millions | December 31, 2018 | December 31, 2017 | |||||||
| Cumulative translation adjustments | $ | (55.6 | ) | $ | (49.2 | ) | |||
| Pension plans actuarial loss, net of tax | (90.2 | ) | (91.3 | ) | |||||
| Change in market value of derivative financial instruments, net of tax | (0.8 | ) | (0.2 | ) | |||||
| Accumulated other comprehensive loss | $ | (146.6 | ) | $ | (140.7 | ) | |||
Debt outstanding was as follows:
| In millions | December 31, 2022 | December 31, 2021 | |||||||||||||||
| 4.88% Loan Notes due June 2023 | 25.0 | 25.0 | |||||||||||||||
| 4.94% Loan Notes due June 2026 | 25.0 | 25.0 | |||||||||||||||
| Revolving credit facility | 31.9 | 10.8 | |||||||||||||||
| Unamortized debt issuance costs | (0.7) | (1.2) | |||||||||||||||
| Total debt | $ | 81.2 | $ | 59.6 | |||||||||||||
| Less current portion | (25.0) | — | |||||||||||||||
| Non-current debt | $ | 56.2 | $ | 59.6 | |||||||||||||
| In millions | December 31, 2018 | December 31, 2017 | |||||||
| 6.19% Loan Notes due 2018 | $ | — | $ | 15.0 | |||||
| 3.67% Loan Notes due 2021 | 25.0 | 25.0 | |||||||
| 4.88% Loan Notes due 2023 | 25.0 | 25.0 | |||||||
| 4.94% Loan Notes due 2026 | 25.0 | 25.0 | |||||||
| Revolving credit facility | — | 21.3 | |||||||
| Other - Bank overdraft | 3.5 | 4.2 | |||||||
| Unamortized debt issuance costs | (1.4 | ) | (1.7 | ) | |||||
| Total debt | $ | 77.1 | $ | 113.8 | |||||
| Less current portion | $ | (3.5 | ) | $ | (19.2 | ) | |||
| Non-current debt | $ | 73.6 | $ | 94.6 | |||||
The Senior Facilities Agreement was due to mature in April 2019, but has now been extended until the end of July 2022. Finance costs of $1.0 million were capitalized following this extension. The loan amendment has been treated, in part, as an extinguishment and new loan, as some of the lenders left the consortium, with the other portion deemed to be a modification of the existing facility. The Senior Facility AgreementRCF bears interest equal to aan applicable margin, based upon the Company's leverage, plus either EURIBOR, in the case of amounts drawn in euros, or LIBOR, depending onSONIA (Sterling Overnight Index Average), in the currencycase of amounts drawn down.
in GBP sterling, or SOFR (Secured Overnight Financing Rate) in the case of amounts drawn in U.S. dollars. The weighted-average interest rate on the revolving credit facilityRCF was 3.58%3.80% and 3.05%1.70% in 20182022 and 2017,2021, respectively.
The maturity profile of the Company's debt, excluding unamortized issuance costs and discounts is, as follows:
| In millions | 2023 | 2024 | 2025 | 2026 | Total | ||||||||||||||||||||||||||||||||||||
| Loan Notes due June 2023 | $ | 25.0 | $ | — | $ | — | $ | — | $ | 25.0 | |||||||||||||||||||||||||||||||
| Loan Notes due June 2026 | — | — | — | 25.0 | 25.0 | ||||||||||||||||||||||||||||||||||||
| Revolving credit facility due October 2026 | — | — | — | 31.9 | 31.9 | ||||||||||||||||||||||||||||||||||||
| Total debt | $ | 25.0 | $ | — | $ | — | $ | 56.9 | $ | 81.9 | |||||||||||||||||||||||||||||||
65
| In millions | 2019 | 2020 | 2021 | 2022 | 2023 | Thereafter | Total | ||||||||||||||||||||||
| Loan Notes due 2021 | $ | — | $ | — | $ | 25.0 | $ | — | $ | — | $ | — | $ | 25.0 | |||||||||||||||
| Loan Notes due 2023 | — | — | — | — | 25.0 | — | 25.0 | ||||||||||||||||||||||
| Loan Notes due 2026 | — | — | — | — | — | 25.0 | 25.0 | ||||||||||||||||||||||
| Other | 3.5 | — | — | — | — | — | 3.5 | ||||||||||||||||||||||
| Total debt | $ | 3.5 | $ | — | $ | 25.0 | $ | — | $ | 25.0 | $ | 25.0 | $ | 78.5 | |||||||||||||||
Loan notes due and shelf facility
We have been in compliance with the covenants under the Note Purchase and Private Shelf Agreement throughout all of the quarterly measurement dates from and including September 30, 2014, to December 31, 2018.
Senior Facilities Agreement
The Senior Facilities Agreement contains a number of additional undertakings and covenants that, among other things, restrict, subject to certain exceptions, our and our subsidiaries' ability to:
•engage in mergers, divestitures, consolidations or divisions;
•change the nature of our business;
•make certain acquisitions;
•participate in certain joint ventures;
•grant liens or other security interests on our assets;
•sell, lease, transfer or otherwise dispose of assets, including receivables;
•enter into certain non-arm's-length transactions;
•grant guarantees;
•pay off certain existing indebtedness;
•make investments, loans or grant credit; and
•issue shares or other securities; and
Any breach of a covenant in the Senior Facilities AgreementRCF could result in a default under the Senior Facilities Agreement,RCF, in which case lenders could elect to declare all borrowed amounts immediately due and payable if the default is not remedied or waived within any applicable grace periods. Additionally, our and our subsidiaries' ability to make investments, incur liens and make certain restricted payments is also tied to ratios based on EBITDA.controlled by limits within the RCF.
We have been in compliance with the covenants under the Senior Facilities AgreementSFA throughout all of the quarterly measurement dates from and including September 30, 2011, to December 31, 2018.in 2022, with an expectation of compliance in 2023.
66
12. Derivatives and Financial Instruments
The Company's financial instruments comprise bank and other loans, senior loan notes, derivatives and trade payables deferred and deferred contingent consideration.payables. Other than derivatives, the main purpose of these financial instruments is to raise finance for the Company's operations. The Company also has various financial assets, such as trade receivables and cash and cash equivalents, which arise directly from its operations.
Derivative financial instruments We are exposed to market risk during the normal course of business from changes in currency exchange rates, interest rates and commodity prices, such as magnesium and aluminum prices. We manage exposures through a combination of normal operating and financing activities and through the use of derivative financial instruments, such as foreign currency forward purchase contracts and aluminum forward purchase contracts. We do not use market risk-sensitive instruments for trading or speculative purposes. In 2018,2022, the Company had $0.1$0.7 million (2017: $2.1(2021: $0.1 million) derivative financial instruments disclosedrecorded within accounts and other receivables and nil (2017: $0.3 million) within other non-current assets. There were no. The value of derivative financial instruments recorded in liabilities in 2018 (2017: $1.5 million in other current liabilities andin 2022 was $0.4 million in other non-current liabilities)(2021: $0.1 million).
Forward foreign currency exchange contracts ��
The Company incurs currency transaction risk whenever one of the Company's operating subsidiaries enters into either a purchase or sales transaction in a currency other than its functional currency. Currency transaction risk is reduced by matching sales and expenses in the same currency. The Company's U.S. operations have little currency exposure as most purchases, costs and sales are conducted in U.S. dollars. The Company's U.K. operations are exposed to exchange transaction risks, mainly because these operations sell goods priced in euros and U.S. dollars and purchase raw materials priced in U.S. dollars. The Company also incurs currency transaction risk if it lends currency other than its functional currency to one of its joint venture partners.
At December 31, 20182022 and 2017,2021, the Company held various forward foreign currency exchange contracts designated as hedges in respect of forward sales for U.S. dollars, euros, Canadian dollars and Australian dollarsJapanese yen for the receipt of GBP sterling or euros. The Company also held forward foreign currency exchange contracts designated as hedges in respect of forward purchases for U.S. dollars, euros, Canadian dollars, Australian dollars and Chinese yuan by the sale of GBP sterling. The contract totals in GBP sterling and euros, range of maturity dates and range of exchange rates are disclosed below,overleaf, with the value denominated in GBP sterling, given that it is the currency the majority of the contracts are held in.
67
| December 31, 2022 | |||||||||||||||||||||||||||||
| Sales hedges | U.S. dollars | Euros | Canadian Dollars | ||||||||||||||||||||||||||
| Contract totals/£m | 13.4 | 12.8 | 0.1 | ||||||||||||||||||||||||||
| Maturity dates | 01/23 to 03/23 | 01/23 to 03/23 | 01/23 | ||||||||||||||||||||||||||
| Exchange rates | $1.1207 to $1.2083 | €1.1234 to €1.1468 | $1.6320 | ||||||||||||||||||||||||||
| Purchase hedges | U.S. dollars | Euros | Canadian dollars | Australian dollars | Chinese yuan | ||||||||||||||||||||||||||||||
| Contract totals/£m | 9.2 | 2.6 | 9.5 | 1.0 | 1.6 | ||||||||||||||||||||||||||||||
| Maturity dates | 01/23 to 04/23 | 01/23 to 04/23 | 01/23 | 01/23 | 01/23 to 03/23 | ||||||||||||||||||||||||||||||
| Exchange rates | $1.1040 to $1.2084 | €1.1437 to €1.2240 | $1.6796 to $1.6239 | $1.7787 | ¥8.3906 to ¥8.4126 | ||||||||||||||||||||||||||||||
| December 31, 2018 | |||||||
| Sales hedges | U.S. dollars | Euros | |||||
| Contract totals/£m | 4.8 | 7.2 | |||||
| Maturity dates | 01/19 to 07/19 | 01/19 to 07/19 | |||||
| Exchange rates | $1.2519 to $1.3419 | €1.0949 to €1.1702 | |||||
| December 31, 2021 | |||||||||||||||||||||||
| Sales hedges | U.S. dollars | Euros | Japanese Yen | ||||||||||||||||||||
| Contract totals/£m | 5.0 | 9.8 | 0.1 | ||||||||||||||||||||
| Maturity dates | 01/22 to 03/22 | 01/22 to 03/22 | 01/22 to 03/22 | ||||||||||||||||||||
| Exchange rates | $1.3455 to $1.3788 | €1.1697 to €1.1906 | ¥155.2443 to ¥156.6793 | ||||||||||||||||||||
| Purchase hedges | U.S. dollars | Euros | Canadian dollars | Australian dollars | Chinese yuan | ||||||||||||||||||||||||||||||
| Contract totals/£m | 4.5 | 3.5 | 7.5 | 0.9 | 1.5 | ||||||||||||||||||||||||||||||
| Maturity dates | 01/22 to 04/22 | 01/22 to 02/22 | 01/22 | 01/22 | 03/22 | ||||||||||||||||||||||||||||||
| Exchange rates | $1.3451 to $1.3781 | €1.1812 to €1.1662 | $1.7172 to $1.6762 | $1.8598 | ¥8.6126 | ||||||||||||||||||||||||||||||
| Purchase hedges | U.S. dollars | Euros | Canadian dollars | Czech koruna | |||||||||
| Contract totals/£m | 7.5 | 1.7 | 2.9 | 0.1 | |||||||||
| Maturity dates | 01/19 to 07/19 | 01/19 to 06/19 | 01/19 to 03/19 | 01/19 | |||||||||
| Exchange rates | $1.2609 to $1.3380 | €1.1074 to €1.1221 | $1.7039 to $1.7416 | CZK 28.4490 | |||||||||
| December 31, 2017 | ||||||||||
| Sales hedges | U.S. dollars | Euros | Australian dollars | |||||||
| Contract totals/£m | 17.1 | 27.5 | 2.8 | |||||||
| Maturity dates | 01/18 to 07/19 | 01/18 to 07/19 | 06/18 | |||||||
| Exchange rates | $1.2433 to $1.3444 | €1.0949 to €1.1803 | $1.7667 | |||||||
| Purchase hedges | U.S. dollars | Euros | Australian dollars | |||||||
| Contract totals/£m | 12.5 | 0.1 | 1.7 | |||||||
| Maturity dates | 01/18 to 07/19 | 01/18 | 06/18 | |||||||
| Exchange rates | $1.2414 to $1.3389 | €1.1084 | 1.7161 | |||||||
The above contracts are held in GBP sterling, thereforesterling. Therefore, the analysis in the table has been given in GBP sterling to avoid any movements as a result of translation.
Fair value of financial instruments
The following methods were used to estimate the fair values of each class of financial instrument:
Cash at bank and in hand / overdrafts
The carrying value approximates to the fair value as a result of the short-term maturity of the instruments. Cash at bank and in hand are subject to a right to offset in the U.S. and U.K.
At December 31, 2018, the Company had overdrafts of $3.5 million (2017: $4.2 million), which are disclosed within other current liabilities with its carrying value being equal to its fair value. All of the balance at December 31, 2018 and 2017 is subject to variable interest rate and subject to floating interest rate risk.
Forward foreign currency exchange rate contracts
The fair value of these contracts was calculated by determining what the Company would be expected to receive or pay on termination of each individual contract by comparison to present market prices.
68
12. Derivatives and Financial Instruments (continued)
Fair value of these contracts has been calculated by valuing the contracts against the equivalent forward rates quoted on the LME.
The Company uses the following hierarchy for determining and disclosing the fair value of financial instruments by valuation technique:
Level 1: quoted (unadjusted) prices in active markets for identical assets or liabilities.
Level 2: other techniques for which all inputs which have a significant effect on the recorded fair value are observable, either directly or indirectly.
Level 3: techniques which use inputs whichthat have a significant effect on the recorded fair value that are not based on observable market data.
The fair values of the financial instruments of the GroupCompany at December 31, 2018,2022 and 2021, were analyzed using the hierarchy as follows:
| December 31, 2022 | |||||||||||||||||||||||||||||
| In millions | Total | Level 1 | Level 2 | Level 3 | |||||||||||||||||||||||||
| Derivative financial assets: | |||||||||||||||||||||||||||||
| Foreign currency contract assets | $ | 0.7 | $ | — | $ | 0.7 | $ | — | |||||||||||||||||||||
| Derivative financial liabilities: | |||||||||||||||||||||||||||||
| Foreign currency contract liabilities | 0.4 | — | 0.4 | — | |||||||||||||||||||||||||
| Interest bearing loans and borrowings: | |||||||||||||||||||||||||||||
| Loan Notes due 2023 | 25.0 | — | 25.0 | — | |||||||||||||||||||||||||
| Loan Notes due 2026 | 25.0 | — | 25.0 | — | |||||||||||||||||||||||||
| Revolving credit facility | 31.9 | — | 31.9 | — | |||||||||||||||||||||||||
| December 31, 2021 | |||||||||||||||||||||||||||||
| In millions | Total | Level 1 | Level 2 | Level 3 | |||||||||||||||||||||||||
| Derivative financial assets: | |||||||||||||||||||||||||||||
| Foreign currency contract assets | $ | 0.1 | $ | — | $ | 0.1 | $ | — | |||||||||||||||||||||
| Derivative financial liabilities: | |||||||||||||||||||||||||||||
| Foreign currency contract liabilities | 0.1 | — | 0.1 | — | |||||||||||||||||||||||||
| Interest bearing loans and borrowings: | |||||||||||||||||||||||||||||
| Loan Notes due 2023 | 25.0 | — | 25.0 | — | |||||||||||||||||||||||||
| Loan Notes due 2026 | 25.0 | — | 25.0 | — | |||||||||||||||||||||||||
| Revolving credit facility | 10.8 | — | 10.8 | — | |||||||||||||||||||||||||
69
| In millions | Total | Level 1 | Level 2 | Level 3 | |||||||||||||
| Derivative financial assets: | |||||||||||||||||
| Foreign currency contract assets | $ | 0.1 | $ | — | $ | 0.1 | $ | — | |||||||||
| Interest bearing loans and borrowings: | |||||||||||||||||
| Loan Notes due 2021 | (24.8 | ) | — | (24.8 | ) | — | |||||||||||
| Loan Notes due 2023 | (25.9 | ) | — | (25.9 | ) | — | |||||||||||
| Loan Notes due 2026 | (26.4 | ) | — | (26.4 | ) | — | |||||||||||
| Other financial liabilities: | |||||||||||||||||
| Deferred contingent consideration | (0.9 | ) | — | — | (0.9 | ) | |||||||||||
| In millions | 2018 | ||||
| Balance at January 1 | $ | 1.0 | |||
| Payments made during year | (0.8 | ) | |||
| Unwind of discount on deferred consideration | (0.2 | ) | |||
| Remeasurement of deferred consideration (recognized in acquisition-related costs) | 0.9 | ||||
| Balance at December 31 | $ | 0.9 | |||
| Total losses for the period included in profit and loss for assets held at the end at December 31 | 0.7 | ||||
| Change in unrealized (gains) or losses for the period included in profit and loss for assets held at the end at December 31 | $ | 0.7 | |||
Income before income taxes consisted of the following:
| Years ended December 31, | ||||||||||||||||||||||||||
| In millions | 2022 | 2021 | 2020 | |||||||||||||||||||||||
| U.K. | $ | 10.9 | $ | 21.8 | $ | 21.0 | ||||||||||||||||||||
International(1) | 30.1 | 13.6 | 6.7 | |||||||||||||||||||||||
| Income before income taxes | $ | 41.0 | $ | 35.4 | $ | 27.7 | ||||||||||||||||||||
| Years ended December 31, | ||||||||||||||
| In millions | 2018 | 2017 | 2016 | |||||||||||
| U.K. | $ | 26.2 | $ | (3.0 | ) | $ | 13.1 | |||||||
International(1) | 4.3 | 22.9 | 11.5 | |||||||||||
| Income before income taxes | $ | 30.5 | $ | 19.9 | $ | 24.6 | ||||||||
(1) "International" reflects non-U.K. income before income taxes.
The provision for income taxes consisted of the following:
| Years ended December 31, | ||||||||||||||||||||||||||
| In millions | 2022 | 2021 | 2020 | |||||||||||||||||||||||
| Currently payable | ||||||||||||||||||||||||||
| U.K. | $ | (3.5) | $ | 2.0 | $ | (0.2) | ||||||||||||||||||||
International(1) | 2.7 | 5.4 | 2.3 | |||||||||||||||||||||||
| Total current taxes | $ | (0.8) | $ | 7.4 | $ | 2.1 | ||||||||||||||||||||
| Deferred | ||||||||||||||||||||||||||
| U.K. | $ | 7.1 | $ | (1.1) | $ | 2.1 | ||||||||||||||||||||
International(1) | 2.7 | (0.9) | 2.7 | |||||||||||||||||||||||
| Total deferred taxes | $ | 9.8 | $ | (2.0) | $ | 4.8 | ||||||||||||||||||||
| Total provision for income taxes | $ | 9.0 | $ | 5.4 | $ | 6.9 | ||||||||||||||||||||
| Years ended December 31, | ||||||||||||||
| In millions | 2018 | 2017 | 2016 | |||||||||||
| Currently payable | ||||||||||||||
| U.K. | $ | 0.2 | $ | (0.2 | ) | $ | 0.3 | |||||||
International(1) | 5.1 | 6.2 | 3.6 | |||||||||||
| Total current taxes | $ | 5.3 | $ | 6.0 | $ | 3.9 | ||||||||
| Deferred | ||||||||||||||
| U.K. | $ | 3.4 | $ | (0.1 | ) | $ | 3.4 | |||||||
International(1) | (3.2 | ) | (2.6 | ) | (0.5 | ) | ||||||||
| Total deferred taxes | $ | 0.2 | $ | (2.7 | ) | $ | 2.9 | |||||||
| Total provision for income taxes | $ | 5.5 | $ | 3.3 | $ | 6.8 | ||||||||
(1) "International" reflects non-U.K. income before income taxes.
Differences between the financial reporting and the corresponding tax basis of assets and liabilities and the different income tax rates and laws applicable to the Company, among other factors, give rise to permanent differences between the statutory tax rate applicable in the U.K. and the effective tax rate presented in the consolidated income statement,Consolidated Income Statement, which in 2018, 20172022, 2021 and 20162020, were as follows:
| Years ended December 31, | |||||||||||||||||||||||
| In millions | 2022 | 2021 | 2020 | ||||||||||||||||||||
| Income before income taxes | $ | 41.0 | $ | 35.4 | $ | 27.7 | |||||||||||||||||
| Provision for income taxes at the U.K. statutory tax rate (2022: 19%, 2021:19%, 2020: 19%) | 7.8 | 6.7 | 5.3 | ||||||||||||||||||||
| Effect of: | |||||||||||||||||||||||
| Non-deductible expenses | 0.7 | 1.9 | 1.7 | ||||||||||||||||||||
| Movement in valuation allowances | 0.6 | (0.6) | 0.8 | ||||||||||||||||||||
Differences in income tax rates in countries where the Company operates(1) | 1.5 | 0.5 | (0.1) | ||||||||||||||||||||
Effect of changes in tax rates (2) | (0.1) | (2.0) | 0.1 | ||||||||||||||||||||
| Movement in uncertain tax positions | — | — | (0.4) | ||||||||||||||||||||
| Other | (1.5) | (1.1) | (0.5) | ||||||||||||||||||||
| Total provision for income taxes | $ | 9.0 | $ | 5.4 | $ | 6.9 | |||||||||||||||||
| Years ended December 31, | |||||||||||||
| In millions | 2018 | 2017 | 2016 | ||||||||||
| Income before income taxes | $ | 30.5 | $ | 19.9 | $ | 24.6 | |||||||
| Provision for income taxes at the U.K. statutory tax rate (2018: 19%, 2017:19.25%, 2016: 20.0%) | 5.8 | 3.8 | 4.9 | ||||||||||
| Effect of: | |||||||||||||
| Non-deductible expenses | 0.1 | 0.8 | 0.4 | ||||||||||
| Movement in valuation allowances | — | (0.9 | ) | 0.7 | |||||||||
Differences in income tax rates in countries where the Company operates(1) | 0.3 | 2.2 | (0.5 | ) | |||||||||
| Effect of U.S. tax reform | — | (4.0 | ) | — | |||||||||
Effect of changes in tax rates (excluding U.S. tax reform) (2) | 0.2 | 1.1 | — | ||||||||||
| Movement in uncertain tax positions | 0.1 | 0.9 | 0.9 | ||||||||||
| Other | (1.0 | ) | (0.6 | ) | 0.4 | ||||||||
| Total provision for income taxes | $ | 5.5 | $ | 3.3 | $ | 6.8 | |||||||
(1) Refers mainly to the effects of the differences between the statutory income tax rate in the U.K. against the applicable income tax rates of each country where the Company operates.
(2) The U.K. corporation tax rate decreased from 21% to 20% with effect from April 1, 2015, and from 20% to 19% with effect from April 1, 2017. A further reduction An increase in the U.K. corporation tax rate is expectedfrom 19% to 17%25%, effective from April 1, 2020.2023, was announced in March 2021. Rate changes also occur in each period as a result of changes in the average state tax rate in the U.S.
70
Reconciliations of the beginning and ending gross unrecognized tax benefits were as follows:
| Years ended December 31, | |||||||||||||||||||||||
| In millions | 2022 | 2021 | 2020 | ||||||||||||||||||||
| Beginning balance | $ | 1.8 | $ | 2.4 | $ | 3.2 | |||||||||||||||||
| Gross increases based on tax positions related to the current year | — | 0.1 | 0.6 | ||||||||||||||||||||
| Reductions due to expiry of statute of limitations | (0.7) | (0.7) | (1.4) | ||||||||||||||||||||
| Ending balance | $ | 1.1 | $ | 1.8 | $ | 2.4 | |||||||||||||||||
| Non-current | $ | 1.1 | $ | 1.8 | $ | 2.4 | |||||||||||||||||
| Years ended December 31, | |||||||||||||
| In millions | 2018 | 2017 | 2016 | ||||||||||
| Beginning balance | $ | 2.8 | $ | 1.9 | $ | 1.0 | |||||||
| Gross increases based on tax positions related to the current year | 1.4 | 1.0 | 0.9 | ||||||||||
| Reductions due to expiry of statute of limitations | (1.0 | ) | (0.1 | ) | — | ||||||||
| Ending balance | $ | 3.2 | $ | 2.8 | $ | 1.9 | |||||||
| Non-current | $ | 3.2 | $ | 2.8 | $ | 1.9 | |||||||
The Company's unrecognized tax benefits relate to the pricing of its various inter-company transactions. Because the transfer pricing calculation is often multifaceted, taking into account economics, finance, industry practice, and functional analysis, a company's transfer pricing position often sits at a particular point along a wide continuum of possible pricing outcomes. The inherent subjectivity in pricing inter-company balances gives rise to measurement uncertainty. Management has considered the valuation uncertainty in determining the measurement of the uncertain tax position. There are no current tax audit examinations. Management estimates that it is reasonably possible that approximately $0.9 million of our gross unrecognized tax benefits ($0.1 million of our net unrecognized tax benefits) may be recognized by the end of 2019 as a result of a lapse of the statute of limitations.
At December 31, 2018, 20172022, 2021 and 2016,2020, there were $0.7$0.3 million, $0.6$0.4 million, and $0.4$0.5 million of unrecognized tax benefits, respectively, that, if recognized, would affect the annual effective tax rate.
The Company recognizes interest accrued and penalties relating to unrecognized tax benefits in the income tax line. During the years ended December 31, 2018, 20172022, 2021 and 2016,2020, the Company recognized approximately $nil, $nil and $0.1 million, and $nil respectively, in interest and penalties.
The following is a summary of the tax years open by major tax jurisdiction:
| Jurisdiction | Years open | |||||||||||||
| U.K. | ||||||||||||||
| U.S. Federal | ||||||||||||||
| U.S. State and local | ||||||||||||||
| France | ||||||||||||||
71
Taxes have not been provided on undistributed earnings of subsidiaries where it is our intention to reinvest these earnings permanently or to repatriate the earnings only when it is tax efficient to do so. The amount of unremitted earnings at December 31, 2018,2022 was approximately $62.4$83.1 million (at December 31, 2017: $59.02021: $70.3 million, at December 31, 2016: $69.92020: $56.4 million). If these earnings were remitted, it is estimated that the additional income tax arising would be approximately $0.6$1.2 million (at December 31, 2017: $0.32021: $1.0 million, at December 31, 2016: $0.22020: $0.8 million).
Deferred taxes were recorded in the Consolidated Balance Sheets as follows:
| December 31, | |||||||||
| In millions | 2018 | 2017 | |||||||
| Other non-current assets | $ | 18.6 | $ | 20.8 | |||||
| Other non-current liabilities | (3.5 | ) | (4.2 | ) | |||||
| Net deferred tax assets | $ | 15.1 | $ | 16.6 | |||||
| December 31, | |||||||||||||||||
| In millions | 2022 | 2021 | |||||||||||||||
| Deferred tax assets | $ | 3.0 | $ | 8.0 | |||||||||||||
| Deferred tax liabilities | (9.9) | (2.7) | |||||||||||||||
| Net deferred tax (liabilities) / assets | $ | (6.9) | $ | 5.3 | |||||||||||||
The tax effects of the major items recorded in deferred tax assets and liabilities were as follows:
| December 31, | |||||||||
| In millions | 2018 | 2017 | |||||||
| Deferred tax assets | |||||||||
| Pension benefits | $ | 7.7 | $ | 10.9 | |||||
| Tax loss and credit carry forwards | 20.7 | 24.8 | |||||||
| Other | 5.2 | 1.6 | |||||||
| Total deferred tax assets | 33.6 | 37.3 | |||||||
| Valuation allowances | (15.0 | ) | (15.0 | ) | |||||
| Deferred tax assets, net of valuation allowances | $ | 18.6 | $ | 22.3 | |||||
| Deferred tax liabilities | |||||||||
| Property, plant and equipment | $ | 3.5 | $ | 5.7 | |||||
| Total deferred tax liabilities | $ | 3.5 | $ | 5.7 | |||||
| Net deferred tax assets | $ | 15.1 | $ | 16.6 | |||||
| December 31, | |||||||||||||||||
| In millions | 2022 | 2021 | |||||||||||||||
| Deferred tax assets | |||||||||||||||||
| Pension benefits | $ | — | $ | 0.5 | |||||||||||||
| Accrued liabilities | 0.8 | 1.5 | |||||||||||||||
| Tax loss and credit carry forwards | 18.9 | 28.3 | |||||||||||||||
| Employee compensation benefits | 1.3 | 2.9 | |||||||||||||||
| Operating leases | 4.0 | 1.1 | |||||||||||||||
| Other | 0.4 | 1.0 | |||||||||||||||
| Total deferred tax assets | 25.4 | 35.3 | |||||||||||||||
| Valuation allowances | (16.5) | (18.0) | |||||||||||||||
| Deferred tax assets, net of valuation allowances | $ | 8.9 | $ | 17.3 | |||||||||||||
| Deferred tax liabilities | |||||||||||||||||
| Property, plant and equipment | $ | 4.3 | $ | 4.5 | |||||||||||||
| Pension benefits | 3.7 | 3.5 | |||||||||||||||
| Goodwill and other intangibles | 3.9 | 2.4 | |||||||||||||||
| Operating leases | 3.9 | 0.3 | |||||||||||||||
| Other | — | 1.3 | |||||||||||||||
| Total deferred tax liabilities | $ | 15.8 | $ | 12.0 | |||||||||||||
| Net deferred tax assets | $ | (6.9) | $ | 5.3 | |||||||||||||
Deferred tax liabilities and assets represent the tax effect of temporary differences between the value of assets and liabilities for financial statement purposes and such values as measured by the relevant jurisdiction's tax laws and regulations. Deferred tax assets and liabilities from the same tax jurisdiction have been netted, resulting in assets and liabilities being recorded under the deferred taxation captions on the consolidated balance sheet.
In assessing the realizability of deferred tax assets, management considers whether it is more likely than not that some portion or all of the deferred tax assets will not be realized. The ultimate realization of deferred tax assets is dependent upon the generation of future taxable income during the periods in which those temporary differences and carryforwards become deductible or creditable. Management considers the scheduled reversal of existing taxable temporary differences, projected future taxable income, and tax-planning strategies in making this assessment.
In March 2021 an increase in the U.K. corporation tax rate from 19% to 25% was announced, effective from April 1, 2023. Deferred tax liabilities and assets which are expected to unwind after April 1, 2023 have been valued at 25%.
72
At December 31, 2018,2022, the Company had carried forward tax losses and tax credits of $81.0$74.8 million (U.K.: $38.8$15.6 million, non-U.K.: $42.2$59.2 million). Carried forward tax losses and tax credits for 20172021 were $92.7$106.3 million (U.K.: $43.4$43.0 million, non-U.K.: $49.3$63.3 million) and for 20162020 were $82.4$104.2 million (U.K.: $35.3$30.0 million, non-U.K.: $47.1$74.2 million). To the extent that these losses are not already recognized as deferred income taxes assets and are available to offset against future taxable profits, it is expected that the future effective tax rate would be below the standard rate in the country where the profits are offset. A valuation allowance of $15.0$16.5 million (2017: $15.0(2021: $18.0 million, 2016: $15.92020: $19.3 million) exists for deferred tax benefits related to the tax loss and tax credit carry forwards and other benefits that may not be realized. The apportionment of the valuation allowance between the U.K. and non-U.K. jurisdictions is U.K.: $4.1$3.5 million, non-U.K.: $10.9$13.0 million (2017: U.K.: $4.6 million, non-U.K.: $10.4 million; 2016:(2021: U.K.: $4.1 million, non-U.K.: $11.8$13.9 million; 2020: U.K.: $3.2 million, non-U.K.: $16.1 million). The non-U.K. valuation allowances relate predominantlyrelates to tax losses in CanadaFrance and Germany.
Of the carried forward tax losses and tax credits as at December 31, 2018, $23.82022, $11.9 million expire between 2023 and 20342033, and $57.2$62.6 million are available for indefinite carry-forward.
73
14. Pension Plans
The Company has defined benefit pension plans in the U.K., the U.S. and France. The levels of funding are determined by periodic actuarial valuations. The assets of the plans are generally held in separate trustee-administeredTrustee-administered funds. The Company also operates defined contribution plans in the U.K., the U.S., Australia and Canada.
The "10% corridor" method for recognizing gains and losses has been adopted. This methodology means that cumulative gains and losses up to an amount equal to 10% of the higher of the liabilities and the assets (the corridor) have no impact on the pension cost. Cumulative gains or losses greater than this corridor are amortized over the average future lifetime of the members in the Plans.plans.
The principal defined benefit pension plansplan in the Company is the U.K. Luxfer Group Pension Plan ("the Plan"), which closed to new members in 1998, with new employees then being eligible for a defined contribution plan. In April 2016, the Plan was closed to further benefit accrual, with members being offered contributions to a defined contribution plan. The Company's other arrangements are less significant than the Plan, the largest being the BA Holdings, Inc. Pension Plan in the U.S. In December 2005, this plan was closed to further benefit accrual, with members being offered contributions to that company's 401(k) plan. At January 1, 2016, the U.S. pension plans (BA Holdings Inc. Pension Plan and Luxfer Hourly Pension Plan) merged into one plan.
The following tables present reconciliations of planpension benefit obligations, fair value of plan assets and the funded status of pension plans as of and for the years ended December 31, 20182022 and 2017:2021:
| 2018 | 2018 | 2018 | 2017 | 2017 | 2017 | ||||||||||||||||||||
| In millions | U.K. | U.S./ other | Total | U.K. | U.S./ other | Total | |||||||||||||||||||
| Change in benefit obligations | |||||||||||||||||||||||||
| Benefit obligation at January 1 | $ | 369.7 | $ | 53.1 | $ | 422.8 | $ | 334.8 | $ | 48.6 | $ | 383.4 | |||||||||||||
| Service cost | — | 0.1 | 0.1 | — | 0.1 | 0.1 | |||||||||||||||||||
| Interest cost | 8.6 | 1.8 | 10.4 | 8.9 | 1.9 | 10.8 | |||||||||||||||||||
| Actuarial (gain) / loss | (27.7 | ) | (5.9 | ) | (33.6 | ) | 10.1 | 4.3 | 14.4 | ||||||||||||||||
| Exchange difference | (19.7 | ) | (0.1 | ) | (19.8 | ) | 32.0 | 0.3 | 32.3 | ||||||||||||||||
| Benefits paid | (17.9 | ) | (2.2 | ) | (20.1 | ) | (16.1 | ) | (2.1 | ) | (18.2 | ) | |||||||||||||
| Prior service cost | 2.2 | — | 2.2 | — | — | — | |||||||||||||||||||
| Benefit obligation at December 31 | $ | 315.2 | $ | 46.8 | $ | 362.0 | $ | 369.7 | $ | 53.1 | $ | 422.8 | |||||||||||||
| Change in plan assets | |||||||||||||||||||||||||
| Fair value of plan assets at January 1 | $ | 326.3 | $ | 41.2 | $ | 367.5 | $ | 280.3 | $ | 36.6 | $ | 316.9 | |||||||||||||
| Actual return on assets | (13.0 | ) | (2.5 | ) | (15.5 | ) | 27.7 | 4.8 | 32.5 | ||||||||||||||||
| Exchange difference | (17.8 | ) | — | (17.8 | ) | 27.4 | — | 27.4 | |||||||||||||||||
| Contributions from employer | 5.8 | 2.1 | 7.9 | 7.0 | 1.9 | 8.9 | |||||||||||||||||||
| Benefits paid | (17.9 | ) | (2.2 | ) | (20.1 | ) | (16.1 | ) | (2.1 | ) | (18.2 | ) | |||||||||||||
| Fair value of plan assets at December 31 | $ | 283.4 | $ | 38.6 | $ | 322.0 | $ | 326.3 | $ | 41.2 | $ | 367.5 | |||||||||||||
| Funded status | |||||||||||||||||||||||||
| Benefit obligations in excess of the fair value of plan assets | $ | (31.8 | ) | $ | (8.2 | ) | $ | (40.0 | ) | $ | (43.4 | ) | $ | (11.9 | ) | $ | (55.3 | ) | |||||||
| 2022 | 2022 | 2022 | 2021 | 2021 | 2021 | ||||||||||||||||||||||||||||||||||||
| In millions | U.K. | U.S. / other | Total | U.K. | U.S. / other | Total | |||||||||||||||||||||||||||||||||||
| Change in benefit obligations | |||||||||||||||||||||||||||||||||||||||||
| Benefit obligation at January 1 | $ | 362.9 | $ | 48.7 | $ | 411.6 | $ | 404.0 | $ | 50.7 | $ | 454.7 | |||||||||||||||||||||||||||||
| Interest cost | 6.2 | 1.3 | 7.5 | 5.6 | 1.1 | 6.7 | |||||||||||||||||||||||||||||||||||
| Settlement gain | — | (5.9) | (5.9) | — | — | — | |||||||||||||||||||||||||||||||||||
| Actuarial gains | (93.7) | (9.0) | (102.7) | (29.6) | (0.8) | (30.4) | |||||||||||||||||||||||||||||||||||
| Exchange difference | (37.0) | — | (37.0) | (4.0) | — | (4.0) | |||||||||||||||||||||||||||||||||||
| Benefits paid | (12.8) | (2.5) | (15.3) | (13.1) | (2.3) | (15.4) | |||||||||||||||||||||||||||||||||||
| Benefit obligation at December 31 | $ | 225.6 | $ | 32.6 | $ | 258.2 | $ | 362.9 | $ | 48.7 | $ | 411.6 | |||||||||||||||||||||||||||||
| Change in plan assets | |||||||||||||||||||||||||||||||||||||||||
| Fair value of plan assets at January 1 | $ | 376.6 | $ | 46.8 | $ | 423.4 | $ | 358.9 | $ | 45.0 | $ | 403.9 | |||||||||||||||||||||||||||||
| Actual return on assets | (71.2) | (10.4) | (81.6) | 16.3 | 4.1 | 20.4 | |||||||||||||||||||||||||||||||||||
| Exchange difference | (40.4) | — | (40.4) | (3.7) | — | (3.7) | |||||||||||||||||||||||||||||||||||
| Contributions from employer | 0.4 | — | 0.4 | 18.2 | — | 18.2 | |||||||||||||||||||||||||||||||||||
| Benefits paid | (12.8) | (2.4) | (15.2) | (13.1) | (2.3) | (15.4) | |||||||||||||||||||||||||||||||||||
| Settlement loss | — | (5.9) | (5.9) | — | — | — | |||||||||||||||||||||||||||||||||||
| Fair value of plan assets at December 31 | $ | 252.6 | $ | 28.1 | $ | 280.7 | $ | 376.6 | $ | 46.8 | $ | 423.4 | |||||||||||||||||||||||||||||
| Funded status | |||||||||||||||||||||||||||||||||||||||||
| Net benefit surplus / (obligation) | $ | 27.0 | $ | (4.5) | $ | 22.5 | $ | 13.7 | $ | (1.9) | $ | 11.8 | |||||||||||||||||||||||||||||
The net benefit obligationssurplus of $40.0$27.0 million and $55.3 million(2021: $13.7 million) in the U.K. plan is recorded in non-current assets at December 31, 2018,2022, and December 31, 2017, respectively, arethe net benefit obligation of $4.5 million (2021: $1.9 million) in the U.S. / other is recorded in non-current liabilities at December 31, 2022.
In December 2021, the Company made a special one-off deficit reduction payment to the U.K. Plan of $12.7 million. The payment means the Company is not expected to make any additional deficit recovery contributions to the Plan until at least December 2024. Contributions of $0.4m were paid to the U.K. plan in relation to the consolidated balance sheets.Pension Protection Fund levy.
74
The amounts recognized in the consolidated statementsConsolidated Statements of incomeIncome in respect of the pension plans were as follows:
| 2022 | 2022 | 2022 | 2021 | 2021 | 2021 | 2020 | 2020 | 2020 | |||||||||||||||||||||||||||||||||||||||||||||||||||
| In millions | U.K. | U.S. / other | Total | U.K. | U.S. / other | Total | U.K. | U.S. / other | Total | ||||||||||||||||||||||||||||||||||||||||||||||||||
| In respect of defined benefit plans: | |||||||||||||||||||||||||||||||||||||||||||||||||||||||||||
| Current service cost | $ | — | $ | — | $ | — | $ | — | $ | — | $ | — | $ | — | $ | — | $ | — | |||||||||||||||||||||||||||||||||||||||||
| Interest cost | 6.2 | 1.3 | 7.5 | 5.6 | 1.1 | 6.7 | 7.0 | 1.4 | 8.4 | ||||||||||||||||||||||||||||||||||||||||||||||||||
| Expected return on assets | (10.4) | (0.7) | (11.1) | (10.2) | (1.8) | (12.0) | (12.2) | (2.3) | (14.5) | ||||||||||||||||||||||||||||||||||||||||||||||||||
| Curtailment gain | — | — | — | — | — | — | — | — | — | ||||||||||||||||||||||||||||||||||||||||||||||||||
| Settlement loss | — | 2.0 | 2.0 | — | — | — | — | — | — | ||||||||||||||||||||||||||||||||||||||||||||||||||
| Amortization of net actuarial loss | 1.8 | 0.3 | 2.1 | 3.4 | 0.4 | 3.8 | 2.3 | 0.3 | 2.6 | ||||||||||||||||||||||||||||||||||||||||||||||||||
| Amortization of prior service credit | (0.4) | — | (0.4) | (0.4) | — | (0.4) | (0.4) | — | (0.4) | ||||||||||||||||||||||||||||||||||||||||||||||||||
| Total (credit) / expense for defined benefit plans | $ | (2.8) | $ | 2.9 | $ | 0.1 | $ | (1.6) | $ | (0.3) | $ | (1.9) | $ | (3.3) | $ | (0.6) | $ | (3.9) | |||||||||||||||||||||||||||||||||||||||||
| In respect of defined contribution plans: | |||||||||||||||||||||||||||||||||||||||||||||||||||||||||||
| Total charge for defined contribution plans | $ | 2.0 | $ | 1.7 | $ | 3.7 | $ | 2.1 | $ | 1.5 | $ | 3.6 | $ | 1.5 | $ | 1.9 | $ | 3.4 | |||||||||||||||||||||||||||||||||||||||||
| Total charge / (credit) for benefit plans | $ | (0.8) | $ | 4.6 | $ | 3.8 | $ | 0.5 | $ | 1.2 | $ | 1.7 | $ | (1.8) | $ | 1.3 | $ | (0.5) | |||||||||||||||||||||||||||||||||||||||||
| 2018 | 2018 | 2018 | 2017 | 2017 | 2017 | 2016 | 2016 | 2016 | |||||||||||||||||||||||||||||
| In millions | U.K. | U.S. / other | Total | U.K. | U.S. / other | Total | U.K. | U.S. / other | Total | ||||||||||||||||||||||||||||
| In respect of defined benefit plans: | |||||||||||||||||||||||||||||||||||||
| Current service cost | $ | — | $ | 0.1 | $ | 0.1 | $ | — | $ | 0.1 | $ | 0.1 | $ | 0.3 | $ | 0.1 | $ | 0.4 | |||||||||||||||||||
| Interest cost | 8.6 | 1.8 | 10.4 | 8.9 | 1.9 | 10.8 | 10.9 | 2.5 | 13.4 | ||||||||||||||||||||||||||||
| Expected return on assets | (14.5 | ) | (2.2 | ) | (16.7 | ) | (14.8 | ) | (1.8 | ) | (16.6 | ) | (14.1 | ) | (2.3 | ) | (16.4 | ) | |||||||||||||||||||
| Settlement loss | — | — | — | — | — | — | — | 4.3 | 4.3 | ||||||||||||||||||||||||||||
| Amortization of net actuarial loss | 2.3 | 0.4 | 2.7 | 2.5 | 0.3 | 2.8 | 1.9 | 0.4 | 2.3 | ||||||||||||||||||||||||||||
| Amortization of prior service credit | (0.5 | ) | — | (0.5 | ) | (0.5 | ) | — | (0.5 | ) | (0.5 | ) | — | (0.5 | ) | ||||||||||||||||||||||
| Total (credit) / charge for defined benefit plans | $ | (4.1 | ) | $ | 0.1 | $ | (4.0 | ) | $ | (3.9 | ) | $ | 0.5 | $ | (3.4 | ) | $ | (1.5 | ) | $ | 5.0 | $ | 3.5 | ||||||||||||||
| In respect of defined contribution plans: | |||||||||||||||||||||||||||||||||||||
| Total charge for defined contribution plans | $ | 2.1 | $ | 2.3 | $ | 4.4 | $ | 1.9 | $ | 2.1 | $ | 4.0 | $ | 1.6 | $ | 2.1 | $ | 3.7 | |||||||||||||||||||
| Total (credit) / charge for pension plans | $ | (2.0 | ) | $ | 2.4 | $ | 0.4 | $ | (2.0 | ) | $ | 2.6 | $ | 0.6 | $ | 0.1 | $ | 7.1 | $ | 7.2 | |||||||||||||||||
In accordance with ASC 715, defined benefit pension charge / (credit)credit is split in the income statement, with $0.7$0.2 million (2017: $0.8(2021: $0.4 million; 2016: $0.72020: $0.4 million) of expenses recognized within sales, general and administrative expenses and a credit of $4.7$0.1 million (2017: $4.2(2021: $2.3 million credit; 2016: $2.82020: $4.3 million charge)credit) recognized below operating income in the income statement.
The following table shows other changes in plan assets and benefit obligations recognized in other comprehensive income (loss) ("AOCI") during the years ended December 31:
| In millions | 2022 | 2021 | 2020 | ||||||||||||||||||||
| Net actuarial gain / (loss) | $ | 8.2 | $ | 38.8 | $ | (26.9) | |||||||||||||||||
| Amortization of actuarial loss | 2.1 | 3.8 | 2.6 | ||||||||||||||||||||
| Actuarial loss recognized due to settlement event | 2.0 | — | — | ||||||||||||||||||||
| Prior service cost | — | — | (0.1) | ||||||||||||||||||||
| Amortization of prior service credit | (0.4) | (0.4) | (0.4) | ||||||||||||||||||||
| Total recognized in other comprehensive income / (loss) | 11.9 | 42.2 | (24.8) | ||||||||||||||||||||
| Total recognized in net periodic benefit cost and other comprehensive income / (loss) | $ | 11.8 | $ | 44.1 | $ | (20.9) | |||||||||||||||||
| In millions | 2018 | 2017 | |||||||
| Net actuarial gain | $ | 1.4 | $ | 1.6 | |||||
| Amortization of net gain | 2.7 | 2.8 | |||||||
| Prior service cost | (2.2 | ) | — | ||||||
| Amortization of prior service credit | (0.5 | ) | (0.5 | ) | |||||
| Total recognized in other comprehensive income | 1.4 | 3.9 | |||||||
| Total credit recognized in net periodic benefit cost and other comprehensive income | $ | 5.4 | $ | 7.3 | |||||
The estimated net loss for defined benefit plans included in AOCI that will be recognized in net periodic benefit cost during 20192023 is $2.3$12.7 million, consisting of amortization of net actuarial loss of $2.7$13.1 million, partially offset by amortization of prior service credit of $0.4 million. In accordance with ASC 715, recognition of all accumulated losses will be triggered at the settlement date of the planned buyout of the U.S. scheme.
The following table shows the amounts included in AOCI that have not yet been recognized as components of net periodic benefit cost for the years ended December 31:
| In millions | 2022 | 2021 | |||||||||||||||
| Gross actuarial loss | $ | (110.2) | $ | (122.5) | |||||||||||||
| Gross prior service credit | 11.0 | 11.4 | |||||||||||||||
| Total included in AOCI not yet recognized in the statement of income | $ | (99.2) | $ | (111.1) | |||||||||||||
75
| In millions | 2018 | 2017 | |||||||
| Net actuarial loss | $ | (136.4 | ) | $ | (140.5 | ) | |||
| Net prior service credit | 12.7 | 15.5 | |||||||
| Total included in AOCI not yet recognized in the statement of income | $ | (123.7 | ) | $ | (125.0 | ) | |||
In September 2019, the U.K. Statistics Authority announced plans to reform the RPI inflation index. On November 25, 2020, the government and U.K. Statistics Authority confirmed these plans to reform the RPI index to bring it into line with the CPIH index from 2030, with no compensation for the holders of index-linked gilts. Inflation measured by the CPIH is consistently significantly lower than that measured by RPI, and, therefore, these plans imply a significant expected reduction in RPI inflation from 2030 onwards. As a result.we have taken a stepped approach and used different inflation rates pre and post 2030.
The financial assumptions used in the calculations were:
| Projected Unit Credit Valuation | |||||||||||||
| U.K. | U.S. | ||||||||||||
| 2018 | 2017 | 2016 | 2018 | 2017 | 2016 | ||||||||
| % | % | % | % | % | % | ||||||||
| Discount rate | 2.90 | 2.40 | 2.60 | 4.20 | 3.60 | 4.20 | |||||||
| Expected return on assets | 4.90 | 4.80 | 5.20 | 6.20 | 6.00 | 6.30 | |||||||
| Retail price inflation | 3.30 | 3.10 | 3.20 | n/a | n/a | n/a | |||||||
| Inflation related assumptions: | |||||||||||||
| Salary inflation | n/a | n/a | n/a | n/a | n/a | n/a | |||||||
| Consumer price inflation | 2.20 | 2.10 | 2.20 | n/a | n/a | n/a | |||||||
| Pension increases—pre April 6, 1997 | 2.00 | 1.90 | 2.00 | n/a | n/a | n/a | |||||||
| —1997 - 2005 | 2.20 | 2.10 | 2.20 | n/a | n/a | n/a | |||||||
| —post April 5, 2005 | 1.80 | 1.70 | 1.80 | n/a | n/a | n/a | |||||||
| Projected Unit Credit Valuation | |||||||||||||||||||||||||||||||||||||||||
| U.K. | U.S. | ||||||||||||||||||||||||||||||||||||||||
| 2022 | 2021 | 2020 | 2022 | 2021 | 2020 | ||||||||||||||||||||||||||||||||||||
| % | % | % | % | % | % | ||||||||||||||||||||||||||||||||||||
| Discount rate | 4.80 | 1.90 | 1.40 | 5.10 | 2.70 | 2.30 | |||||||||||||||||||||||||||||||||||
| Expected return on assets | 5.60 | 3.30 | 3.00 | 4.70 | 2.50 | 5.00 | |||||||||||||||||||||||||||||||||||
| Pre-2030 | |||||||||||||||||||||||||||||||||||||||||
| Retail Price Inflation | 3.20 | 3.30 | 2.90 | n/a | n/a | n/a | |||||||||||||||||||||||||||||||||||
| Consumer Price Inflation | 2.10 | 2.20 | 1.80 | n/a | n/a | n/a | |||||||||||||||||||||||||||||||||||
| Pension increases | |||||||||||||||||||||||||||||||||||||||||
| Pre 6 April 1997 | 1.90 | 2.00 | 1.70 | n/a | n/a | n/a | |||||||||||||||||||||||||||||||||||
| 1997 - 2005 | 2.10 | 2.20 | 1.90 | n/a | n/a | n/a | |||||||||||||||||||||||||||||||||||
| Post 5 April 2005 | 1.70 | 1.80 | 1.60 | n/a | n/a | n/a | |||||||||||||||||||||||||||||||||||
| Post-2030 | |||||||||||||||||||||||||||||||||||||||||
| Retail Price Inflation | 3.20 | 3.30 | 2.70 | n/a | n/a | n/a | |||||||||||||||||||||||||||||||||||
| Consumer Price Inflation | 3.10 | 3.20 | 2.60 | n/a | n/a | n/a | |||||||||||||||||||||||||||||||||||
| Pension increases | |||||||||||||||||||||||||||||||||||||||||
| Pre 6 April 1997 | 2.40 | 2.50 | 2.20 | n/a | n/a | n/a | |||||||||||||||||||||||||||||||||||
| 1997 - 2005 | 3.00 | 3.10 | 2.60 | n/a | n/a | n/a | |||||||||||||||||||||||||||||||||||
| Post 5 April 2005 | 2.20 | 2.20 | 2.00 | n/a | n/a | n/a | |||||||||||||||||||||||||||||||||||
The discount rate used for the UK Plan represents the annualized yield based on a cash-flow matched methodology, with reference to an AA corporate bond spot curve and having regard to the duration of the Plan’s liabilities. The inflation rate is derived using a similar cash flow matched methodology as used for the discount rate but havingwith regard to the difference between yields on fixed-interest and index-linked United Kingdom government gilts. The expected return on assets assumption is set havingwith regard to the asset allocation and expected return on each asset class as atof the balance sheet date.
| 2018 | 2017 | ||||
| Other principal actuarial assumptions: | Years | Years | |||
| Life expectancy of male / female in the U.K. aged 65 at accounting date | 21.4 / 24.1 | 21.6 / 24.6 | |||
| Life expectancy of male / female in the U.K. aged 65 at 20 years after accounting date | 22.8 / 25.7 | 23.3 / 26.5 | |||
| 2022 | 2021 | ||||||||||||||||
| Other principal actuarial assumptions: | Years | Years | |||||||||||||||
| Life expectancy of male / female in the U.K. aged 65 at accounting date | 21.2 / 23.0 | 21.1 / 22.9 | |||||||||||||||
| Life expectancy of male / female in the U.K. aged 65 at 20 years after accounting date | 22.5 / 24.5 | 22.4 / 24.4 | |||||||||||||||
Investment strategies
For the principal defined benefit plan in the Company and the U.K., the Luxfer Group Pension Plan, (the "Plan," as defined above), the assets are invested in a diversified range of asset classes and include matching assets (comprising fixed-interest and index-linked bonds and swaps) and growth assets (comprising all other assets). The Trustees of the Plan have formulated a de-risking strategy to help control the short-term risk of volatility associated with holding growth assets. The Trustees also monitor the cost of a buy-in to secure pensioner liabilities with an insurance company to ensure they and the Company are able to act if such an opportunity arises. Other options to progressively reduce the scale of the liabilities are discussed between the Trustees and the Company.
76
14. Pension Plans (continued)
Risk exposures
The Company is at risk of adverse experience relatingU.K. plan currently has a long-term strategic target to the defined benefit plans.
Special events
In October 2018, following a High Court ruling2021, the Company decided to terminate its U.S. Pension Plan. In accordance with ASC 715, the liabilities must be valued based on market expectations for the period over which the obligations are to be settled. The Company is committed to buying out the U.S. plan with an insurer in 2023, with the U.K., a $2.2 million allowancefull buyout expected in relation toearly 2023. Therefore, at the 2022 year-end, the obligation reflects the expected future costscost of equalizing Guaranteed Minimum Pensions (GMPs) insecuring the U.K. Plan has been included in the obligations on the balance sheet at December 31, 2018. This allowance will be amortized in the income statement over the future lifetime of the Plan members.
The fair value of plan assets were:
| 2018 | 2018 | 2018 | 2017 | 2017 | 2017 | ||||||||||||||||||||
| In millions | U.K. | U.S./ other | Total | U.K. | U.S./ other | Total | |||||||||||||||||||
| Assets in active markets: | |||||||||||||||||||||||||
| Equities and growth funds | $ | 173.1 | $ | 20.6 | $ | 193.7 | $ | 203.4 | $ | 22.9 | $ | 226.3 | |||||||||||||
| Government bonds | 46.7 | — | 46.7 | 49.9 | — | 49.9 | |||||||||||||||||||
| Corporate bonds | 63.6 | 18.0 | 81.6 | 72.7 | 18.3 | 91.0 | |||||||||||||||||||
| Cash | — | — | — | 0.3 | — | 0.3 | |||||||||||||||||||
| Total fair value of plan assets | $ | 283.4 | $ | 38.6 | $ | 322.0 | $ | 326.3 | $ | 41.2 | $ | 367.5 | |||||||||||||
| 2022 | 2022 | 2022 | 2021 | 2021 | 2021 | ||||||||||||||||||||||||||||||||||||
| In millions | U.K. | U.S. / other | Total | U.K. | U.S. / other | Total | |||||||||||||||||||||||||||||||||||
| Assets in active markets: | |||||||||||||||||||||||||||||||||||||||||
| Equities and growth funds | $ | 78.3 | $ | — | $ | 78.3 | $ | 149.9 | $ | — | $ | 149.9 | |||||||||||||||||||||||||||||
| Government bonds | 65.7 | — | 65.7 | 64.6 | — | 64.6 | |||||||||||||||||||||||||||||||||||
| Corporate bonds | 106.1 | 27.5 | 133.6 | 147.5 | 46.6 | 194.1 | |||||||||||||||||||||||||||||||||||
| Cash | 2.5 | 0.6 | 3.1 | 14.6 | 0.2 | 14.8 | |||||||||||||||||||||||||||||||||||
| Total fair value of plan assets | $ | 252.6 | $ | 28.1 | $ | 280.7 | $ | 376.6 | $ | 46.8 | $ | 423.4 | |||||||||||||||||||||||||||||
All investments, apart from cash, were classified as Level 2 in the fair value hierarchy as of December 31, 20182022, and December 31, 2017.2021. Cash is classified as Level 1 in the fair value hierarchy as of December 31, 2022, and December 31, 2021.
The following benefit payments are expected to be paid by the plans for the years ended December 31 as follows:
| In millions | U.K. pension plans | U.S. / other pension plans (1) | ||||||||||||
| 2023 | $ | 13.1 | $ | 0.7 | ||||||||||
| 2024 | 13.4 | — | ||||||||||||
| 2025 | 13.6 | — | ||||||||||||
| 2026 | 13.9 | — | ||||||||||||
| 2027 | 14.2 | — | ||||||||||||
| Thereafter | 74.8 | — | ||||||||||||
| In millions | U.K. pension plans | U.S./ other pension plans | ||||||
| 2019 | $ | 17.6 | $ | 2.3 | ||||
| 2020 | 17.9 | 2.3 | ||||||
| 2021 | 18.3 | 2.3 | ||||||
| 2022 | 18.7 | 2.3 | ||||||
| 2023 | 19.1 | 2.3 | ||||||
| Thereafter | 102.2 | 11.7 | ||||||
The estimated amount of employer deficit recovery contributions expected to be paid to the defined benefit pension plans for the year ending December 31, 2019,2023, is $7.5 million (2018: $7.9 millionnil (2022: nil actual employer contributions).
There will also be an additional employer contribution into the U.S. plan as a result of the planned buyout, this is estimated to be approximately $3.5 million.
77
15. Shareholders' Equity
(a)Ordinary share capital
| December 31, 2018 | December 31, 2017 | December 31, 2018 | December 31, 2017 | ||||||||||||||
| No. | No. | Millions | Millions | ||||||||||||||
| Authorized: | |||||||||||||||||
| Ordinary shares of £0.50 each | 40,000,000 | 40,000,000 | $ | 35.7 | (1) | $ | 35.7 | (1) | |||||||||
| Deferred ordinary shares of £0.0001 each | 761,845,318,444 | 769,423,688,000 | 149.9 | (1) | 150.9 | (1) | |||||||||||
| 761,885,318,444 | 769,463,688,000 | $ | 185.6 | (1) | $ | 186.6 | (1) | ||||||||||
| Allotted, called up and fully paid: | |||||||||||||||||
| Ordinary shares of £0.50 each | 29,000,000 | 27,136,799 | $ | 26.6 | (1) | $ | 25.3 | (1) | |||||||||
| Deferred ordinary shares of £0.0001 each | 761,835,338,444 | 769,413,708,000 | 149.9 | (1) | 150.9 | (1) | |||||||||||
| 761,864,338,444 | 769,440,844,799 | $ | 176.5 | (1) | $ | 176.2 | (1) | ||||||||||
| | | | | | | | |||||||||||
| December 31, 2022 | December 31, 2021 | December 31, 2022 | December 31, 2021 | ||||||||||||||||||||||||||||||||
| No. | No. | Millions | Millions | ||||||||||||||||||||||||||||||||
| Authorized: | |||||||||||||||||||||||||||||||||||
| Ordinary shares of £0.50 each | 40,000,000 | 40,000,000 | $ | 35.7 | (1) | $ | 35.7 | (1) | |||||||||||||||||||||||||||
| Deferred ordinary shares of £0.0001 each | — | 761,835,318,444 | — | (1) | 149.9 | (1) | |||||||||||||||||||||||||||||
| 40,000,000 | 761,875,318,444 | $ | 35.7 | (1) | $ | 185.6 | (1) | ||||||||||||||||||||||||||||
| Allotted, called up and fully paid: | |||||||||||||||||||||||||||||||||||
| Ordinary shares of £0.50 each | 28,944,000 | 28,944,000 | $ | 26.5 | (1) | $ | 26.5 | (1) | |||||||||||||||||||||||||||
| Deferred ordinary shares of £0.0001 each | — | 761,835,318,444 | — | (1) | 149.9 | (1) | |||||||||||||||||||||||||||||
| 28,944,000 | 761,864,262,444 | $ | 26.5 | (1) | $ | 176.4 | (1) | ||||||||||||||||||||||||||||
(1)The Company's ordinary and deferred share capital are shown in U.S. dollars at the exchange rate prevailing at the month-end spot rate at the time of the share capital being issued.
The rights of the shares are as follows:
Ordinary shares of £0.50 each
The ordinary shares carry no entitlement to an automatic dividend but rank pari passu in respect of any dividend declared and paid. The ordinary shares were allotted and issued to satisfy share awards which vested under the Company's share award and share incentive plans.
At December 31, 2018,2022, there were 28,376,729 (2017: 25,929,312)26,934,973 (2021: 27,529,824) ordinary shares of Luxfer Holdings PLC listed on the New York Stock Exchange (NYSE).
Deferred ordinary shares of £0.0001 each
(b) Treasury Shares
| In millions | |||||||||||
| At January 1, 2021 | $ | (4.0) | |||||||||
| Purchase of treasury shares | (6.4) | ||||||||||
| Cancellation of treasury shares | 0.7 | ||||||||||
| Utilization of treasury shares | 0.1 | ||||||||||
| At December 31, 2021 | (9.6) | ||||||||||
| Purchase of treasury shares | (11.1) | ||||||||||
| Utilization of treasury shares | 0.3 | ||||||||||
| At December 31, 2022 | $ | (20.4) | |||||||||
In 2022, the deferred shares shall be entitled to the repayment of the paid up nominal amount of the deferred shares, but only after any payment to the holders ofCompany purchased 711,572 ordinary shares for a total cost of an amount equal to 100 times$11.1 million. 9,424 of these shares were utilized at $0.3 million, with the amount paid up on such ordinaryremaining 702,148 retained within Treasury shares.
| In millions | |||||
| At January 1, 2017 | $ | (7.1 | ) | ||
| Transfer of treasury shares into ESOP | 0.8 | ||||
| Utilization of treasury shares | 0.5 | ||||
| At December 31, 2017 | (5.8 | ) | |||
| Transfer of treasury shares into ESOP | 1.4 | ||||
| Utilization of treasury shares | 0.1 | ||||
| At December 31, 2018 | $ | (4.3 | ) | ||
In June 2015,2021, the Board announced a share buy-back program of up to $10Company purchased 297,678 total shares for $6.4 million. Of the 297,678 shares repurchased in the year, 56,000 at $0.7 million to cover the needs of employee share plans. Shareholder approval for this program was granted at the 2014 Annual General Meeting (for repurchases up to an aggregate amount of 2,700,000 ordinary shares or ADSs).
At December 31, 2018,2022, there were 378,201 (2017: 527,616)1,277,766 (2021: 575,618) treasury shares held at a cost of $4.3$20.4 million (2017: $5.8(2021: $9.6 million).
78
15. Shareholders' Equity (continued)
(c) OwnCompany shares held by ESOP
| In millions | |||||
| At January 1, 2017 | $ | (0.5 | ) | ||
| Transfer of treasury shares into ESOP | (0.8 | ) | |||
| Utilization of ESOP shares | 0.3 | ||||
| At December 31, 2017 | (1.0 | ) | |||
| Issue of new shares | (1.3 | ) | |||
| Shares sold from ESOP | 0.4 | ||||
| Transfer of treasury shares into ESOP | (1.4 | ) | |||
| Utilization of ESOP shares | 1.1 | ||||
| At December 31, 2018 | $ | (2.2 | ) | ||
| In millions | |||||||||||
| At January 1, 2021 | $ | (1.4) | |||||||||
| Utilization of ESOP shares | 0.3 | ||||||||||
| At December 31, 2021 | (1.1) | ||||||||||
| Utilization of ESOP shares | 0.1 | ||||||||||
| At December 31, 2022 | $ | (1.0) | |||||||||
At December 31, 2018,2022, there were 1,621,301721,261 ordinary shares ofat £0.50 each (2017: 104,709(2021: 838,558 ordinary shares of £0.50 each) held by The Luxfer Group Employee Share Ownership Plan (the "ESOP").
(d) Dividends paid and proposed
| In millions | 2022 | 2021 | 2020 | ||||||||||||||||||||
| Dividends declared and paid during the year: | |||||||||||||||||||||||
| Interim dividend paid February 5, 2020 ($0.125 per ordinary share) | $ | — | $ | — | $ | 3.4 | |||||||||||||||||
| Interim dividend paid May 6, 2020 ($0.125 per ordinary share) | — | — | 3.4 | ||||||||||||||||||||
| Interim dividend paid August 5, 2020 ($0.125 per ordinary share) | — | — | 3.4 | ||||||||||||||||||||
| Interim dividend paid November 4, 2020 ($0.125 per ordinary share) | — | — | 3.4 | ||||||||||||||||||||
| Interim dividend paid February 4, 2021 ($0.125 per ordinary share) | — | 3.4 | — | ||||||||||||||||||||
| Interim dividend paid May 5, 2021 ($0.125 per ordinary share) | — | 3.4 | — | ||||||||||||||||||||
| Interim dividend paid August 4, 2021 ($0.125 per ordinary share) | — | 3.4 | — | ||||||||||||||||||||
| Interim dividend paid November 3, 2021 ($0.125 per ordinary share) | — | 3.4 | — | ||||||||||||||||||||
| Interim dividend paid February 2, 2022 ($0.125 per ordinary share) | 3.4 | — | — | ||||||||||||||||||||
| Interim dividend paid May 4, 2022 ($0.130 per ordinary share) | 3.6 | — | — | ||||||||||||||||||||
| Interim dividend paid August 3, 2022 ($0.130 per ordinary share) | 3.6 | — | — | ||||||||||||||||||||
| Interim dividend paid November 2, 2022 ($0.130 per ordinary share) | 3.6 | — | — | ||||||||||||||||||||
| $ | 14.2 | $ | 13.6 | $ | 13.6 | ||||||||||||||||||
| In millions | 2022 | 2021 | 2020 | ||||||||||||||||||||
| Dividends declared and paid after December 31 (not recognized as a liability at December 31): | |||||||||||||||||||||||
| Interim dividend paid February 4, 2021: ($0.125 per ordinary share) | $ | — | $ | — | $ | 3.4 | |||||||||||||||||
| Interim dividend paid February 2, 2022: ($0.125 per ordinary share) | — | 3.4 | — | ||||||||||||||||||||
| Interim dividend paid February 1, 2023: ($0.130 per ordinary share) | 3.6 | — | — | ||||||||||||||||||||
| $ | 3.6 | $ | 3.4 | $ | 3.4 | ||||||||||||||||||
79
| In millions | 2018 | 2017 | 2016 | ||||||||||
| Dividends declared and paid during the year: | |||||||||||||
| Interim dividend paid February 3, 2016 ($0.125 per ordinary share) | $ | — | $ | — | $ | 3.4 | |||||||
| Interim dividend paid May 4, 2016 ($0.125 per ordinary share) | — | — | 3.3 | ||||||||||
| Interim dividend paid August 3, 2016 ($0.125 per ordinary share) | — | — | 3.3 | ||||||||||
| Interim dividend paid November 2, 2016 ($0.125 per ordinary share) | — | — | 3.3 | ||||||||||
| Interim dividend paid February 1, 2017 ($0.125 per ordinary share) | — | 3.3 | — | ||||||||||
| Interim dividend paid May 3, 2017 ($0.125 per ordinary share) | — | 3.3 | — | ||||||||||
| Interim dividend paid August 2, 2017 ($0.125 per ordinary share) | — | 3.3 | — | ||||||||||
| Interim dividend paid November 1, 2017 ($0.125 per ordinary share) | — | 3.4 | — | ||||||||||
| Interim dividend paid February 7, 2018 ($0.125 per ordinary share) | 3.4 | — | — | ||||||||||
| Interim dividend paid May 2, 2018 ($0.125 per ordinary share) | 3.3 | — | — | ||||||||||
| Interim dividend paid August 1, 2018 ($0.125 per ordinary share) | 3.3 | — | — | ||||||||||
| Interim dividend paid November 7, 2018 ($0.125 per ordinary share) | 3.4 | — | — | ||||||||||
| $ | 13.4 | $ | 13.3 | $ | 13.3 | ||||||||
| In millions | 2018 | 2017 | 2016 | ||||||||||
| Dividends declared and paid after December 31 (not recognized as a liability at December 31): | |||||||||||||
| Interim dividend paid February 1, 2017: ($0.125 per ordinary share) | $ | — | $ | — | $ | 3.3 | |||||||
| Interim dividend paid February 7, 2018: ($0.125 per ordinary share) | — | 3.4 | — | ||||||||||
| Interim dividend paid February 6, 2019: ($0.125 per ordinary share) | 3.4 | — | — | ||||||||||
| $ | 3.4 | $ | 3.4 | $ | 3.3 | ||||||||
| | | | | ||||||||||
(a) The Luxfer Group Employee Share Ownership Plan
The trust
In 1997, the Company established an employee benefit trust ("the ESOP") with independent Trustees, to purchase and hold shares in the Company in trust to be used to satisfy options granted to eligible senior employees under the Company's share plans established from time to time.
The ESOP was established with the benefit of a gift equivalent to the set up and running costs. Purchase monies and costs required by the ESOP Trustees to purchase shares for and under the provisions of the trust are provided by way of an interest free loan from a Company subsidiary. The loan is repayable, in normal circumstances, out of monies received from senior employees when they exercise options granted to them over shares. Surplus shares are held by the ESOP Trustees to satisfy future option awards. The ESOP Trustees have waived their right to receive dividends on shares held in trust. The Remuneration Committee is charged with determining which senior employees are to be granted options, and in what number, subject to the relevant plan rules.
The current plan
The current share option plan, implemented by the Company in February 2007 is The Luxfer Holdings Executive Share Option Plan ("the Plan"), which consists of two parts. Part A of the Plan is approved by HM Revenue & Customs, and Part B is unapproved. Options can be exercised at any time up to the tenth anniversary of their grant, subject to the rules of the relevant part of the Plan. As a result of the Company's initial public offering of ordinary shares in 2012, all leaver restrictions over the shares were released. There are no other performance criteria attached to the options.
Changes in the year
The change in the number of shares held by the Trustees of the ESOP and the number of share options held over those shares are shown below:
| Number of shares held by ESOP Trustees | |||||||
| £0.0001 deferred shares | £0.50 ordinary shares | ||||||
| At January 1, 2018 | 15,977,968,688 | 104,709 | |||||
| New shares issued | — | 1,863,201 | |||||
| Shares utilized during the year | — | (149,609 | ) | ||||
| Shares transferred into ESOP during the year | — | 120,000 | |||||
| Shares sold from the ESOP during the year | — | (317,000 | ) | ||||
| At December 31, 2018 | 15,977,968,688 | 1,621,301 | |||||
| Number of shares held by ESOP Trustees | |||||||||||||||||
| £0.0001 deferred shares | £0.50 ordinary shares | ||||||||||||||||
| At January 1, 2022 | 15,977,968,688 | 838,558 | |||||||||||||||
| Shares utilized during the year | — | (117,297) | |||||||||||||||
| Shares sold from the ESOP during the year | (15,977,968,688) | — | |||||||||||||||
| At December 31, 2022 | — | 721,261 | |||||||||||||||
At December 31, 2018,2022, the loan outstanding from the ESOP was $2.0$0.5 million (2017: $2.6(2021: $0.5 million).
The market value of each £0.50 ordinary share held by the ESOP at December 31, 2018,2022, was $17.63 (2017: $15.80)$13.72 (2021: $19.31).
(b) Share-based compensation
Luxfer Holdings PLC Long-Term Umbrella Incentive Plan and Luxfer Holdings PLC Non-Executive Directors Equity Incentive Plan
As an important retention tool and to align the long-term financial interests of our management with those of our shareholders, the Company adopted the Luxfer Holdings PLC Long-Term Umbrella Incentive Plan (the "LTIP") for the Company's senior employees and the Luxfer Holdings PLC Non-Executive Directors Equity Incentive Plan (the "Director EIP") for the Non-Executive Directors.
The equity or equity-related awards under the LTIP and the Director EIP are based on the ordinary shares of the Company. The Remuneration Committee administers the LTIP and has the power to determine to whom the awards will be granted, the amount, type and other terms. Awards granted under the LTIP generally vest one-thirdone-quarter each year over a three-yearfour-year period, subject to continuous employment and certain other conditions, with the exercise period expiring fivesix years after grant date. Awards granted under the Director EIP are non-discretionary, are purely time-based and vest over one year, with settlement occurring immediately on vesting.
80
16. Share Plans (continued)
(b) Share-based compensation (continued)
Share option and restricted stock awardsAs a tool to retain key people and align their interests with those of shareholders, a one-off award of market-value options was made to a small number of executives and the non-executive directors immediately prior to the Company's initial public offering in 2012. Of this award 40% of the options granted vested immediately and 20% of the options vested upon each of the first, second and third anniversaries of the I.P.O. All awards have therefore fully vested, with 126,000 remaining to be exercised before October 2019.
In March 2018,2022, a combined 432,600130,000 of Restricted Stock Units and Options over ordinary shares were granted under the LTIP, which were all time-based awards vesting over a period between three and four years and expiring two years later. Also throughout 2022, a maximum 280,000 awards were granted based on the achievement of shareholder return targets. In April 2018,May 2022, 19,000 additional awards were granted under the LTIP, which were all time-based awards vesting over four years and an additional 15,000 awards were granted under the LTIP, which vested immediately. In June 2022, a combined 11,936 of26,000 Restricted Stock Units and Options over ordinary shares were granted under the Director EIP, of which 2,000 would vest over three years and 9,936were all time-based awards that would fully vest one year later. The Director EIP are all time-based awards.
In March 2017,2021, a combined 139,800110,000 of Restricted Stock Units and Options over ordinary shares were granted under the LTIP, which were all time-based awards vesting over threefour years and expiring two years later. FollowingAlso throughout 2021, a maximum 100,000 awards were granted based on the Annual General Meeting on May 23, 2017,achievement of shareholder return targets. In June 2021, a combined 21,814 of19,000 Restricted Stock Units and Options over ordinary shares were granted under the Director EIP, which were all time-based awards which will bethat would fully vested and settledvest one year later in May 2018.later.
In March 2016, 95,1402020, a combined 132,900 Restricted Stock Units and Options over ordinary shares were granted under the LTIP, which were all time-based awards vesting over threefour years and expiring two years later. FollowingIn May 2020, a combined 2,000 Restricted Stock Units and Options over ordinary shares were granted under the Annual General MeetingLTIP, which were all time-based awards vesting over four years and expiring two years later. Also throughout 2020, a maximum 95,000 awards were granted based on May 24, 2016, 12,520the achievement of shareholder return targets. In June 2020, a combined 27,280 Restricted Stock Units and Options over ordinary shares were granted under the Director EIP, which were all time-based awards. All EIP awards havethat would fully vestedvest one year later. In September 2020, a combined 3,892 Restricted Stock Units and been exercised.
Total share-based compensation expense for 2018, 20172022, 2021 and 20162020 was as follows:
| Years ended December 31, | |||||||||||||
| In millions | 2018 | 2017 | 2016 | ||||||||||
| Other share-based compensation charges | $ | 4.8 | $ | 2.2 | $ | 1.4 | |||||||
| Restructuring share-based compensation charges | — | 0.9 | — | ||||||||||
| Total share-based compensation charges | $ | 4.8 | $ | 3.1 | $ | 1.4 | |||||||
| Years ended December 31, | |||||||||||||||||||||||
| In millions | 2022 | 2021 | 2020 | ||||||||||||||||||||
| Total share-based compensation charges | $ | 2.5 | $ | 2.8 | $ | 2.8 | |||||||||||||||||
There were no cancellations or modifications to the awards in 2018, 20172022, 2021 or 2016.2020.
The following tables illustrates the number of, and movements in, share options during the year, with each option relating to 1one ordinary share:
| Number of shares | Weighted- average exercise price | Weighted- average remaining contractual life (years) | Aggregate intrinsic value ($M) | ||||||||||||||||||||||||||
| At January 1, 2022 | 547,522 | $ | 0.99 | 2.2 | $ | 10.6 | |||||||||||||||||||||||
| Granted during the year | 472,695 | $ | 1.00 | ||||||||||||||||||||||||||
| Exercised during the year | (173,017) | $ | 0.98 | ||||||||||||||||||||||||||
| Accrued dividend awards | 8,829 | $ | 1.00 | ||||||||||||||||||||||||||
| Lapsed during the year | (276,876) | $ | 0.96 | ||||||||||||||||||||||||||
| At December 31, 2022 | 579,153 | $ | 1.00 | 3.0 | $ | 8.0 | |||||||||||||||||||||||
| Options exercisable at December 31, 2022 | 9,862 | $ | 1.00 | 3.3 | $ | 0.1 | |||||||||||||||||||||||
| Options expected to vest as of December 31, 2022 | 434,548 | $ | 1.00 | 3.0 | $ | 6.0 | |||||||||||||||||||||||
| Number of shares | Weighted- average exercise price | Weighted- average remaining contractual life (years) | Aggregate intrinsic value ($M) | |||||||||||
| At January 1, 2018 | 1,182,315 | $ | 6.42 | 2.4 | $ | 11.1 | ||||||||
| Granted during the year | 510,536 | $ | 0.67 | |||||||||||
| Exercised during the year | (833,360 | ) | $ | 7.43 | ||||||||||
| Accrued dividend awards | 18,776 | $ | 0.66 | |||||||||||
| Lapsed during the year | (29,205 | ) | $ | 0.67 | ||||||||||
| At December 31, 2018 | 849,062 | $ | 2.10 | 1.9 | $ | 13.3 | ||||||||
| Options exercisable at December 31, 2018 | 320,882 | $ | 4.31 | 2.4 | $ | 4.3 | ||||||||
| Options expected to vest as of December 31, 2018 | 528,180 | $ | 0.64 | 1.5 | $ | 9.0 | ||||||||
The weighted average fair value of options granted in 2018, 20172022, 2021 and 20162020 was estimated to be $11.02, $9.82$16.45, $20.56 and $9.39$9.41 per share, respectively. The total intrinsic value of options that were exercised during 2018, 20172022, 2021 and 20162020 was $9.3$2.9 million, $1.4$5.8 million and $1.4$3.0 million, respectively. At December 31, 2018,2022, the total unrecognized compensation cost related to share options was $3.8$3.1 million (2017: $3.4(2021: $2.8 million). This cost is expected to be recognized over a weighted average period of 1.8 years.2.7 years (2021: 1.9 years ).
81
16. Share Plans (continued)
(b) Share-based compensation (continued)
The following table illustrates the assumptions used in deriving the fair value of share options during the year:
| 2018 | 2017 | ||||
| Dividend yield (%) | 4.00 | 4.00 | |||
| Expected volatility range (%) | 22.65 - 35.77 | 26.81 - 35.81 | |||
| Risk-free interest rate (%) | 0.12 - 2.57 | 1.00 - 2.01 | |||
| Expected life of share options range (years) | 0.50 - 6.00 | 0.50 - 7.36 | |||
| Weighted average exercise price ($) | $0.65 | $0.65 | |||
| Model used | Black-Scholes & Monte-Carlo | Black-Scholes | |||
| 2022 | 2021 | 2020 | |||||||||||||||||||||
| Dividend yield (%) | 2.75 - 3.41 | 2.27 | 3.39 - 4.09 | ||||||||||||||||||||
| Expected volatility range (%) | 36.11 - 49.43 | 42.80 - 59.03 | 36.48 - 56.28 | ||||||||||||||||||||
| Risk-free interest rate (%) | 1.28 - 2.99 | 0.04 - 0.24 | 0.18 - 0.49 | ||||||||||||||||||||
| Expected life of share options range (years) | 0.50 - 4.00 | 0.50 - 4.00 | 0.50 - 4.00 | ||||||||||||||||||||
| Forfeiture rate (%) | 5.00 | 5.00 | 5.00 | ||||||||||||||||||||
| Weighted average exercise price ($) | $1.00 | $1.00 | $1.00 | ||||||||||||||||||||
| Models used | Black-Scholes & Monte-Carlo | Black-Scholes & Monte-Carlo | Black-Scholes & Monte-Carlo | ||||||||||||||||||||
The expected life of the share options is based on historical data and current expectations and is not necessarily indicative of exercise patterns that may occur. The expected volatility reflects the assumption that the historical volatility over a period similar to the life of the options is indicative of future trends, which may not necessarily be the actual outcome.
Employee share incentive plans The Company operates an all-employee share incentive plan in its U.K. and U.S. operations and may look to implement plans in other geographic regions.
82
17. Segment Information
We classify our operations into two core business segments, Gas Cylinders and the Elektron, based primarily on shared economic characteristics for the nature of the products and services; the nature of the production processes; the type or class of customer for their products and services; the methods used to distribute their products or provide their services; and the nature of the regulatory environment. The Company has sixfour identified business units, which aggregate into the two reportable segments. Luxfer Gas Cylinders and Luxfer Superform aggregate intoforms the Gas Cylinders segment, and Luxfer MEL Technologies, Luxfer Magtech and Luxfer Graphic Arts and Luxfer Czech Republic aggregate into the Elektron segment. The Superform business unit used to aggregate into the Gas Cylinders segment but is now recognized within discontinued operations. A summary of the operations of the segments is provided below:
Gas Cylinders segment
Our Gas Cylinders segment manufactures and markets specialized productshighly-engineered cylinders, using composites and aluminum titanium and carbon composites,alloys, including pressurized cylinders for use in various applications including self-containdself-contained breathing apparatus (SCBA) for firefighters, containment of oxygen and other medical gases for healthcare, alternative fuel vehicles, and general industrial. The segment also forms lightweight aluminum and titanium panels into highly complex shapes that are used mainly in the transportation industry.industrial applications.
Elektron segment Our Elektron segment focuses on specialty materials based primarily on magnesium and zirconium, with key product lines including advanced lightweight magnesium alloys with a variety of uses across a variety of industries; magnesium powders for use in countermeasure flares, as well as heater meals; photoengravingphoto-engraving plates for graphic arts; and high-performance zirconium-based materials and oxides used as catalysts and in the manufacture of advancedadvances ceramics, fiber-optic fuel cells, and many other performance products.
Other
Other, as used below, primarily represents unallocated corporate expense and includes non-service related defined benefit pension cost / credit and, in 2017, the cost of converting our ADR structure to a direct listing of our ordinary shares.credit.
Management monitors the operating results of its reportable segments separately for the purpose of making decisions about resource allocation and performance assessment. Segment performance is evaluated by the chief operating decision maker, the CEO, who is responsible for allocating resources and assessing performance of the operating segments, and has been identified as the CEO, using adjusted EBITA(1) and adjusted EBITDA, which is defined as segment income, and is based on operating income adjusted for share basedshare-based compensation expense; qualifying restructuring charges; impairment charges; legal expenses incurred from patent litigation with a competitor; profit on sale of redundant site; direct listing costs; acquisition-related charges / credits; loss on disposal of property, plant and equipment; restructuring charges; acquisitions and disposals costs; other charges, and depreciation and amortization; and unwind of discount on deferred consideration.amortization.
Unallocated assets and liabilities include those which are held on behalf of the GroupCompany and cannot be allocated to a segment, such as taxation, investments, cash, retirement benefits obligations, bank and other loans and holding company assets and liabilities.
Financial information by reportable segment for the years ended December 31 is included in the following summary:
| Net Sales | Adjusted EBITDA | |||||||||||||||||||||||||
| In millions | 2018 | 2017 | 2016 | 2018 | 2017 | 2016 | ||||||||||||||||||||
| Gas Cylinders segment | $ | 238.1 | $ | 220.2 | $ | 225.8 | $ | 23.4 | $ | 17.0 | $ | 18.3 | ||||||||||||||
| Elektron segment | 249.8 | 221.1 | 189.0 | 56.2 | 42.3 | 33.0 | ||||||||||||||||||||
| Consolidated | $ | 487.9 | $ | 441.3 | $ | 414.8 | $ | 79.6 | $ | 59.3 | $ | 51.3 | ||||||||||||||
| Net Sales | Adjusted EBITDA | |||||||||||||||||||||||||||||||||||||||||||
| In millions | 2022 | 2021 | 2020 | 2022 | 2021 | 2020 | ||||||||||||||||||||||||||||||||||||||
| Gas Cylinders segment | $ | 183.7 | $ | 178.3 | $ | 141.9 | $ | 12.8 | $ | 22.7 | $ | 21.3 | ||||||||||||||||||||||||||||||||
| Elektron segment | 239.7 | 195.8 | 182.9 | 50.3 | 40.7 | 32.6 | ||||||||||||||||||||||||||||||||||||||
| Consolidated | $ | 423.4 | $ | 374.1 | $ | 324.8 | $ | 63.1 | $ | 63.4 | $ | 53.9 | ||||||||||||||||||||||||||||||||
| Depreciation and amortization | Restructuring Charges | |||||||||||||||||||||||||
| In millions | 2018 | 2017 | 2016 | 2018 | 2017 | 2016 | ||||||||||||||||||||
| Gas Cylinders segment | $ | 7.3 | $ | 7.2 | $ | 7.4 | $ | 10.0 | $ | 2.9 | $ | — | ||||||||||||||
| Elektron segment | 11.7 | 11.1 | 10.6 | 3.4 | 5.5 | 0.4 | ||||||||||||||||||||
| Consolidated | $ | 19.0 | $ | 18.3 | $ | 18.0 | $ | 13.4 | $ | 8.4 | $ | 0.4 | ||||||||||||||
| Depreciation and amortization | Restructuring Charges | |||||||||||||||||||||||||||||||||||||||||||
| In millions | 2022 | 2021 | 2020 | 2022 | 2021 | 2020 | ||||||||||||||||||||||||||||||||||||||
| Gas Cylinders segment | $ | 4.8 | $ | 5.8 | $ | 3.7 | $ | 1.7 | $ | 5.3 | $ | 7.9 | ||||||||||||||||||||||||||||||||
| Elektron segment | 8.8 | 9.8 | 9.6 | 0.2 | 0.9 | 0.9 | ||||||||||||||||||||||||||||||||||||||
| Other segment | — | — | — | — | — | 0.1 | ||||||||||||||||||||||||||||||||||||||
| Consolidated | $ | 13.6 | $ | 15.6 | $ | 13.3 | $ | 1.9 | $ | 6.2 | $ | 8.9 | ||||||||||||||||||||||||||||||||
(1) Adjusted EBITA is adjusted EBITDA less depreciation and loss on disposal of property, plant and equipment.
83
17. Segment Information (continued)
| Total assets | Capital expenditure | |||||||||||||||||||||||||
| In millions | 2018 | 2017 | 2016 | 2018 | 2017 | 2016 | ||||||||||||||||||||
| Gas Cylinders segment | $ | 145.6 | $ | 156.9 | $ | 151.9 | $ | 2.8 | $ | 3.5 | $ | 7.2 | ||||||||||||||
| Elektron segment | 210.5 | 210.4 | 190.9 | 10.5 | 5.8 | 10.1 | ||||||||||||||||||||
| Other | 34.3 | 48.5 | 57.0 | 0.3 | 0.7 | — | ||||||||||||||||||||
| $ | 390.4 | $ | 415.8 | $ | 399.8 | $ | 13.6 | $ | 10.0 | $ | 17.3 | |||||||||||||||
| Total assets | Capital expenditure | ||||||||||||||||||||||||||||||||||
| In millions | 2022 | 2021 | 2022 | 2021 | 2020 | ||||||||||||||||||||||||||||||
| Gas Cylinders segment | $ | 133.1 | $ | 122.7 | $ | 1.2 | $ | 1.0 | $ | 2.0 | |||||||||||||||||||||||||
| Elektron segment | 216.4 | 206.5 | 7.4 | 7.9 | 5.1 | ||||||||||||||||||||||||||||||
| Other | 49.5 | 34.8 | — | — | — | ||||||||||||||||||||||||||||||
| Discontinued operations | 8.1 | 4.8 | — | 0.1 | 0.3 | ||||||||||||||||||||||||||||||
| $ | 407.1 | $ | 368.8 | $ | 8.6 | $ | 9.0 | $ | 7.4 | ||||||||||||||||||||||||||
The following table presents a reconciliation of Adjusted EBITDA to net income:income from continuing operations:
| In millions | 2022 | 2021 | 2020 | ||||||||||||||||||||
| Adjusted EBITDA | $ | 63.1 | $ | 63.4 | $ | 53.9 | |||||||||||||||||
| Share-based compensation charges | (2.5) | (2.8) | (2.8) | ||||||||||||||||||||
| Loss on disposal of property, plant and equipment | — | — | (0.1) | ||||||||||||||||||||
| Depreciation and amortization | (13.6) | (15.6) | (13.3) | ||||||||||||||||||||
| Restructuring charges | (1.9) | (6.2) | (8.9) | ||||||||||||||||||||
| Acquisition and disposal costs | (0.3) | (1.5) | — | ||||||||||||||||||||
| Other charges | — | (1.1) | (0.4) | ||||||||||||||||||||
| Defined benefits pension credit | 0.1 | 2.3 | 4.3 | ||||||||||||||||||||
| Interest expense, net | (3.9) | (3.1) | (5.0) | ||||||||||||||||||||
| Provision for taxes | (9.0) | (5.4) | (6.9) | ||||||||||||||||||||
| Net income from continuing operations | $ | 32.0 | $ | 30.0 | $ | 20.8 | |||||||||||||||||
| In millions | 2018 | 2017 | 2016 | ||||||||||
| Adjusted EBITDA | $ | 79.6 | $ | 59.3 | $ | 51.3 | |||||||
| Other share based compensation charges | (4.8 | ) | (2.2 | ) | (1.4 | ) | |||||||
| Loss on disposal of property, plant and equipment | (0.3 | ) | — | (0.2 | ) | ||||||||
| Depreciation and amortization | (19.0 | ) | (18.3 | ) | (18.0 | ) | |||||||
| Unwind discount on deferred consideration | (0.2 | ) | (0.2 | ) | (0.4 | ) | |||||||
| Restructuring charges | (13.4 | ) | (8.4 | ) | (0.4 | ) | |||||||
| Impairment charge | (7.2 | ) | (3.7 | ) | — | ||||||||
| Acquisition (costs) / credit | (4.3 | ) | 1.3 | — | |||||||||
Other charges (1) | — | (5.8 | ) | — | |||||||||
| Other general income | — | — | 2.5 | ||||||||||
| Defined benefits pension mark-to-market gain / (loss) | 4.7 | 4.2 | (2.8 | ) | |||||||||
| Interest expense, net | (4.6 | ) | (6.3 | ) | (6.0 | ) | |||||||
| Provision for taxes | (5.5 | ) | (3.3 | ) | (6.8 | ) | |||||||
| Net income | $ | 25.0 | $ | 16.6 | $ | 17.8 | |||||||
The following tables present certain geographic information by geographic region for the years ended December 31,:31:
Net Sales(1) | ||||||||||||||||||||||||||||||||
| 2022 | 2021 | 2020 | ||||||||||||||||||||||||||||||
| $M | Percent | $M | Percent | $M | Percent | |||||||||||||||||||||||||||
| United States | $ | 243.2 | 57.4 | % | $ | 207.8 | 55.6 | % | $ | 173.0 | 53.3 | % | ||||||||||||||||||||
| U.K. | 20.7 | 4.9 | % | 24.4 | 6.6 | % | 18.7 | 5.8 | % | |||||||||||||||||||||||
| Germany | 19.2 | 4.5 | % | 17.7 | 4.7 | % | 15.7 | 4.8 | % | |||||||||||||||||||||||
| Italy | 11.4 | 2.7 | % | 11.0 | 2.9 | % | 10.5 | 3.2 | % | |||||||||||||||||||||||
| France | 8.5 | 2.0 | % | 12.5 | 3.3 | % | 20.2 | 6.2 | % | |||||||||||||||||||||||
| Top five countries | $ | 303.0 | 71.5 | % | $ | 273.4 | 73.1 | % | $ | 238.1 | 73.3 | % | ||||||||||||||||||||
| Rest of Europe | 28.0 | 6.6 | % | 25.8 | 6.9 | % | 25.4 | 7.8 | % | |||||||||||||||||||||||
| Asia Pacific | 68.0 | 16.1 | % | 53.7 | 14.3 | % | 45.2 | 13.9 | % | |||||||||||||||||||||||
Other (2) | 24.4 | 5.8 | % | 21.2 | 5.7 | % | 16.1 | 5.0 | % | |||||||||||||||||||||||
| $ | 423.4 | $ | 374.1 | $ | 324.8 | |||||||||||||||||||||||||||
| Net Sales | |||||||||||||||||||
| 2018 | 2017 | 2016 | |||||||||||||||||
| $M | Percent | $M | Percent | $M | Percent | ||||||||||||||
| United States | $ | 249.2 | 51.1 | % | $ | 224.1 | 50.8 | % | $ | 211.3 | 50.9 | % | |||||||
| U.K. | 47.6 | 9.8 | % | 40.4 | 9.2 | % | 36.5 | 8.8 | % | ||||||||||
| Germany | 42.0 | 8.6 | % | 36.8 | 8.3 | % | 32.2 | 7.8 | % | ||||||||||
| Italy | 23.3 | 4.8 | % | 19.0 | 4.3 | % | 19.6 | 4.7 | % | ||||||||||
| France | 17.0 | 3.4 | % | 16.0 | 3.6 | % | 15.0 | 3.6 | % | ||||||||||
| Top five countries | $ | 379.1 | 77.7 | % | $ | 336.3 | 76.2 | % | $ | 314.6 | 75.8 | % | |||||||
| Rest of Europe | 33.2 | 6.8 | % | 31.1 | 7.0 | % | 27.4 | 6.6 | % | ||||||||||
| Asia Pacific | 53.0 | 10.9 | % | 47.5 | 10.8 | % | 45.6 | 11.0 | % | ||||||||||
Other (2) | 22.6 | 4.6 | % | 26.4 | 6.0 | % | 27.2 | 6.6 | % | ||||||||||
| $ | 487.9 | $ | 441.3 | $ | 414.8 | ||||||||||||||
| Property, plant and equipment, net | ||||||||||||||
| In millions | 2018 | 2017 | 2016 | |||||||||||
| United States | $ | 66.1 | $ | 75.4 | $ | 77.5 | ||||||||
| United Kingdom | 36.0 | 36.6 | 34.3 | |||||||||||
| Rest of Europe | 1.1 | 13.1 | 12.8 | |||||||||||
| Asia Pacific | 0.3 | 0.2 | 0.2 | |||||||||||
Other (2) | 3.4 | 3.8 | 3.8 | |||||||||||
| $ | 106.9 | $ | 129.1 | $ | 128.6 | |||||||||
| Property, plant and equipment, net | ||||||||||||||||||||
| In millions | 2022 | 2021 | ||||||||||||||||||
| United States | $ | 41.6 | $ | 46.9 | ||||||||||||||||
| United Kingdom | 32.0 | 36.0 | ||||||||||||||||||
| Canada | 2.8 | 3.3 | ||||||||||||||||||
| Rest of Europe | 1.0 | 1.0 | ||||||||||||||||||
| Asia Pacific | 0.3 | 0.3 | ||||||||||||||||||
| $ | 77.7 | $ | 87.5 | |||||||||||||||||
(1) Net sales are based on the geographic destination of sale.
(2) Other includesrepresents Africa, Brazil, Canada, South America, Latin AmericaMexico and Africa.Other Americas.
84
18. Leases
The components of the lease commitments Rental expense under operatingis as follows:
| Years ended December 31, | |||||||||||||||||||||||
| In millions | 2022 | 2021 | 2020 | ||||||||||||||||||||
| Operating lease cost | $ | 4.2 | $ | 3.4 | $ | 3.8 | |||||||||||||||||
Supplemental cash flow information related to leases was as follows:
| Years ended December 31, | |||||||||||||||||||||||
| In millions | 2022 | 2021 | 2020 | ||||||||||||||||||||
| Operating cash flows from operating leases | $ | 4.2 | $ | 3.4 | $ | 3.8 | |||||||||||||||||
| In millions | December 31, 2018 | December 31, 2017 | December 31, 2016 | ||||||||||
| Minimum lease payments under operating leases recognized in the consolidated income statement | $ | 4.8 | $ | 5.1 | $ | 4.8 | |||||||
Supplemental balance sheet information related to buildings, items of machinery and equipment and motor vehicles, falling dueleases was as follows:
| December 31, | December 31, | ||||||||||||||||
| In millions | 2022 | 2021 | |||||||||||||||
| Operating leases | |||||||||||||||||
| Operating lease right-of-use asset | $ | 19.8 | $ | 12.6 | |||||||||||||
| Other current liabilities | 4.7 | 3.0 | |||||||||||||||
| Other non-current liabilities | 18.2 | 9.8 | |||||||||||||||
| $ | 22.9 | $ | 12.8 | ||||||||||||||
| Weighted Average Remaining Lease Term (Years) | 12.0 | 17.2 | |||||||||||||||
| Weighted Average Discount Rate | 4.48 | % | 4.38 | % | |||||||||||||
Maturities of lease liabilities were as follows:
| In millions | 2022 | ||||||||||||||||
| 2023 | $ | 5.1 | |||||||||||||||
| 2024 | 5.2 | ||||||||||||||||
| 2025 | 4.9 | ||||||||||||||||
| 2026 | 3.9 | ||||||||||||||||
| 2027 | 1.4 | ||||||||||||||||
| Thereafter | 9.4 | ||||||||||||||||
| Total lease payments | $ | 29.9 | |||||||||||||||
| Less imputed interest | (7.0) | ||||||||||||||||
| Total | $ | 22.9 | |||||||||||||||
85
| In millions | 2019 | 2020 | 2021 | 2022 | Thereafter | Total | ||||||||||||||||||||
| Minimum lease payments | $ | 4.2 | $ | 4.1 | $ | 3.3 | $ | 2.7 | $ | 13.1 | $ | 27.4 | ||||||||||||||
19. Commitments and Contingencies
Capital commitments
At December 31, 2018,2022, the Company had capital expenditure commitments of $2.5$1.4 million (2017: $0.6(2021: $1.5 million and 2016: $3.62020: $1.1 million) for the acquisition of new plant and equipment.
Committed banking facilities
At December 31, 2018 and 20172022, the Company had committed banking facilities of $150.0 million. $100.0 million with an additional $50.0 million of uncommitted facilities through an accordion provision. Of these committed facilities, $31.9 million was drawn at December 31, 2022.
The facilities were for providing loans and overdrafts, withCompany had a separate (uncommitted) facility for letters of credit, which at December 31, 2018,2022, was £7.0$2.2 million. $1.8 million ($8.9 million), 2017of this was £7.0 million ($9.5 million). Of the committed facilities, $3.5 million was drawn for overdrafts, no loans were drawn and no letters of credit were utilized at December 31, 2018, $4.2 million, $1.3 million and nil for 2017. 2022.
The Company also hashad a separate (uncommitted) bonding facility for bank guaranteesguarantees; denominated in GBP sterling of £3.0totaling £0.5 million (2018: $3.8($0.6 million) and £0.1 million 2017: $4.1 million), of which £1.5 million ($1.9 million) (2017: £1.0 million / $1.40.2 million) was utilized at December 31, 2018.2022.
At December 31, 2021 the Company had committed banking facilities of $100.0 million with an additional $50.0 million of uncommitted facilities through an accordion provision. Of the committed facilities, $10.8 million was drawn at December 31, 2021.
The Company had a termination agreementseparate (uncommitted) facility for letters of credit, which at December 31, 2021, was $1.5 million. $0.9 million of this was utilized at December 31, 2021.
The Company also had a separate (uncommitted) bonding facility for bank guarantees; denominated in respectGBP sterling totaling £0.6 million ($0.9 million) and £0.1 million ($0.2 million) was utilized at December 31, 2021.
The Company has a separate overdraft facility of $4.0 million, of which none was drawn at December 31, 2021.
Additionally, the Company has various uncommitted transitional banking and foreign exchange lines available for day-to-day operational purposes.
Contingencies
In November 2018, an alleged explosion occurred at a third-party waste disposal and treatment site in Grand View, Idaho, reportedly causing property damage, personal injury, and one fatality. We contracted with a service company for removal and disposal of certain waste resulting from the magnesium powder manufacturing operations at the Reade facility in Manchester, New Jersey. We believe this service company, in turn, contracted with the third-party disposal company, at whose facility the explosion occurred, for treatment and disposal of the proposed acquisition of Neo Performance Materials Inc., announcedwaste. In November 2020, we were named as a defendant in December 2018. Underthree lawsuits in relation to the termsincident – one by the third-party disposal company, one by the estate of the agreement we are committed to make a payment of up to $3.5 million to cover Neo's costs.
86
20. Selected Quarterly Data (unaudited)
The following tables present 20182022 and 20172021 quarterly financial information:information for continuing operations:
| 2022 | ||||||||||||||||||||||||||||||||||||||
| In millions, except per-share data | First Quarter | Second Quarter | Third Quarter | Fourth Quarter | Full Year | |||||||||||||||||||||||||||||||||
| Net sales | $ | 97.0 | $ | 109.5 | $ | 100.2 | $ | 116.7 | $ | 423.4 | ||||||||||||||||||||||||||||
| Gross profit | 24.2 | 25.7 | 23.2 | 21.9 | 95.0 | |||||||||||||||||||||||||||||||||
| Operating income | 10.6 | 12.6 | 11.6 | 10.0 | 44.8 | |||||||||||||||||||||||||||||||||
| Net income from continuing operations | 7.7 | 9.6 | 8.5 | 6.2 | 32.0 | |||||||||||||||||||||||||||||||||
Earnings per ordinary share(1) | ||||||||||||||||||||||||||||||||||||||
| Basic earnings per ordinary share from continuing operations | $ | 0.28 | $ | 0.35 | $ | 0.31 | $ | 0.23 | $ | 1.17 | ||||||||||||||||||||||||||||
| Diluted earnings per ordinary share from continuing operations | 0.28 | 0.35 | 0.31 | 0.23 | 1.16 | |||||||||||||||||||||||||||||||||
| 2021 | ||||||||||||||||||||||||||||||||||||||
| In millions, except per-share data | First Quarter | Second Quarter | Third Quarter | Fourth Quarter | Full Year | |||||||||||||||||||||||||||||||||
| Net sales | $ | 85.2 | $ | 99.0 | $ | 91.2 | $ | 98.7 | $ | 374.1 | ||||||||||||||||||||||||||||
| Gross profit | 25.2 | 25.9 | 21.1 | 23.8 | $ | 96.0 | ||||||||||||||||||||||||||||||||
| Operating income | 11.1 | 11.5 | 8.1 | 5.5 | $ | 36.2 | ||||||||||||||||||||||||||||||||
| Net income from continuing operations | 8.6 | 11.9 | 6.0 | 3.5 | $ | 30.0 | ||||||||||||||||||||||||||||||||
Earnings per ordinary share(1) | ||||||||||||||||||||||||||||||||||||||
| Basic earnings per ordinary share from continuing operations | $ | 0.31 | $ | 0.43 | $ | 0.22 | $ | 0.13 | $ | 1.08 | ||||||||||||||||||||||||||||
| Diluted earnings per ordinary share from continuing operations | 0.31 | 0.42 | 0.21 | 0.13 | 1.07 | |||||||||||||||||||||||||||||||||
(1) Amounts may not total to annual earnings because each quarter and year are calculated separately based on basic and diluted weighted-average ordinary shares outstanding during the period.
87
| 2018 | ||||||||||||||||||||||
| In millions, except per-share data | First Quarter | Second Quarter | Third Quarter | Fourth Quarter | Full Year | |||||||||||||||||
| Net sales | $ | 119.7 | $ | 128.2 | $ | 129.1 | $ | 110.9 | $ | 487.9 | ||||||||||||
| Gross profit | 30.3 | 33.6 | 34.0 | 24.2 | 122.1 | |||||||||||||||||
| Operating income / (loss) | 12.8 | 14.6 | 15.7 | (13.1 | ) | 30.0 | ||||||||||||||||
| Net income / (loss) | 9.9 | 11.4 | 12.2 | (8.5 | ) | 25.0 | ||||||||||||||||
Earnings / (loss) per ordinary share(1) | ||||||||||||||||||||||
| Basic earnings / (loss) per ordinary share | $ | 0.37 | $ | 0.43 | $ | 0.46 | $ | (0.31 | ) | $ | 0.94 | |||||||||||
| Diluted earnings / (loss) per ordinary share | 0.36 | 0.42 | 0.44 | (0.31 | ) | 0.90 | ||||||||||||||||
| 2017 | ||||||||||||||||||||||
| In millions, except per-share data | First Quarter | Second Quarter | Third Quarter | Fourth Quarter | Full Year | |||||||||||||||||
| Net sales | $ | 103.4 | $ | 106.6 | $ | 115.2 | $ | 116.1 | $ | 441.3 | ||||||||||||
| Gross profit | 25.7 | 26.3 | 29.5 | 27.1 | $ | 108.6 | ||||||||||||||||
| Operating income / (loss) | 10.2 | 6.3 | 8.5 | (3.1 | ) | $ | 21.9 | |||||||||||||||
| Net income / (loss) | 7.9 | 3.9 | 5.8 | (1.0 | ) | $ | 16.6 | |||||||||||||||
Earnings / (loss) per ordinary share(1) | ||||||||||||||||||||||
| Basic earnings / (loss) per ordinary share | $ | 0.30 | $ | 0.15 | $ | 0.22 | $ | (0.04 | ) | $ | 0.63 | |||||||||||
| Diluted earnings / (loss) per ordinary share | 0.30 | 0.15 | 0.22 | (0.04 | ) | 0.62 | ||||||||||||||||
Joint venture in which the Company is a venturer
During 2018,2022, the Company maintained its 51% investment in the equity of the joint venture, Luxfer Uttam India Private Limited. During 2018, the Gas Cylinders segment made $1.7 million (2017: $1.9 million) of sales to the joint venture. At December 31, 2018, the gross amounts receivable from the joint venture amounted to $1.1 million (2017: $2.3 million) and the net amounts receivable amounted to $0.9 million (2017: $0.9 million). In addition, in 2018 we have transferred goods to Luxfer Uttam on extended credit terms with a sales value of $1.6 million (2017: $nil), where we do not deem it to be probable that we will collect substantially all of the consideration. In accordance with ASC 606, Revenue from Contracts with Customers, we have not recognized any revenue in relation to this transaction.
In July 2020, the Company sold its 51% investment in the equity of trade debtits previous joint venture (see note 3 Acquisitions and $nil (2017: $4.7 million)Disposals), Luxfer Uttam India Private Limited. During 2020, prior to the sale, the Gas Cylinders Segment made $1.5 million of debt investment, reflecting the step acquisition after which the entity became a fully consolidated subsidiary. All sales to the joint venture are made on similar terms to arm's length transactions.
Associates in which the Company holds an interest
During 20182020, Sub161 Pty Limited, in which the Company maintained itsheld 26.4% equity, of the associate, Sub161 Pty Limited.was liquidated as it no longer traded. During 2018, the Company2020, there were no sales made $nil sales (2017: $nil) to the associate. At December 31, 2018, theor amounts receivable from the associate denominated in Australian dollars was $nil (2017: $nil).associate.
Transactions with other related parties
At DecemberDecember 31, 2018,2022, the directors and key management comprising the members of the Executive Leadership Team owned 237,161 £0.50233,724 £0.50 ordinary shares (2017: 170,297(2021: 500,237 £0.50 ordinary shares) and held awards over a further 600,528231,668 £0.50 ordinary shares (2017: 316,797(2021: 299,021 £0.50 ordinary shares).
During the years ended December 31, 20182022, and December 31, 2017,2021, share options held by members of the Executive Leadership Team were exercised.
Other than the transactions with the joint ventures, and associates disclosed above and key management personnel disclosed above, no other related-party transactions have been identified.
The Company entered into negotiations withwas notified that Néos International Limited, including its subsidiaries Néos Technologies Limited and Néos Superform Limited (collectively, “Néos”) – the purchaser of our Superform U.K. business – filed for administration, a third party during the fourth quarterform of 2018, with a view to selling its Magnesium Elektron CZ s.r.o. subsidiary, which is involved in magnesium recycling and basedbankruptcy protection in the Czech Republic. An offer was receivedU.K., on or about February 22, 2023. Pursuant to the terms of the sale, Luxfer assigned and subsequently acceptedunderlet (as defined and in February 2019 which has resultedaccordance with the Landlord & Tenant (Covenants) Act 1995) certain building leases to Néos, recognizing a right of use asset and lease liability in the business being classified as held-for-salefinancial statements. Post year-end, the Company also received a Notice of Default from one Landlord, with respect to Néos’ non-payment of amounts owed under certain of the assigned leases in 2022. As a result of this information, and written downin accordance with ASC 360 and ASC 855, we have fully impaired the right of use asset, $2.6 million, and recognized this through discontinued operations in the consolidated statements of income in 2022.
On February 28, 2023 the Company agreed to fair value,the full buyout of the U.S. pension plan with an impairment charge of $3.4 million recognizedinsurer. Assets held in the 2018 statementpension plan, plus an additional employer contribution of consolidated income.
88
Item 9. Changes in and Disagreements With Accountants on Accounting and Financial Disclosure
Not applicable.
Item 9A. Controls and Procedures
Our management, with the participation of our Chief Executive Officer and our Chief Financial Officer, evaluated the effectiveness of the design and operation of our disclosure controls and procedures for the period covered by this report, pursuant to Rule 13a-15(b) of the Securities Exchange Act of 1934 ("the Exchange(the "Exchange Act"). Based upon their evaluation, our Chief Executive Officer and our Chief Financial Officer concluded that our disclosure controls and procedures were effective as of the year ended December 31, 2018,2022, to ensure that information required to be disclosed by us in the reports we file or submit under the Exchange Act is recorded, processed, summarized and reported, within the time periods specified in the Securities and Exchange Commission's rules and forms and to ensure that information required to be disclosed by us in the reports we file or submit under the Exchange Act is accumulated and communicated to our management, including our principal executive and principal financial officers, as appropriate to allow timely decisions regarding required disclosures.
Management's Annual Report on Internal Control Over Financial Reporting
Management is responsible for establishing and maintaining adequate internal control over financial reporting for the Company as defined in Rules 13a-15(f) or 15d-15(f) under the Securities Exchange Act of 1934.Act. Our internal control over financial reporting is a process designed to provide reasonable assurance regarding the reliability of financial reporting and the preparation of financial statements for external purposes in accordance with accounting principles generally accepted in the United States of America. Because of its inherent limitations, internal control over financial reporting may not prevent or detect misstatements.
Management has performed an evaluation of the effectiveness of our internal control over financial reporting as of December 31, 2018,2022, based on the framework and criteria established in Internal Control -– Integrated Framework issued by the Committee of Sponsoring Organizations of the Treadway Commission (2013 framework).
The effectiveness of the Company’s internal controlscontrol over financial reporting were effective as of December 31, 2018.
2022 has been audited by PricewaterhouseCoopers LLP, an independent registered public accounting firm, has provided an attestationas stated in their report, which is included herein on the Company's internal control over financial reporting. The Company's financial statements includedappears in this annual report on Form 10-K also have been audited by PricewaterhouseCoopers LLP.
Changes in Internal Control over Financial Reporting
There waswere no changechanges in our internal control over financial reporting (as defined in Rules 13a-15(f) and 15d-15(f) under the Exchange Act) that occurred during the quarter and annual period ended December 31, 20182022 that has materially affected, or is reasonably likely to materially affect, our internal control over financial reporting.
Item 9B. Other Information
Compensatory Arrangements of Certain Officers; Management Contract
On February 28, 2023, the Company entered into a new employment contract (the “New Employment Contract”) with Stephen Webster, Chief Financial Officer, to supersede his existing employment contract, originally dated May 31, 2016 and subsequently amended by an offer letter dated January 24, 2022 (collectively, the “Prior Employment Contract”). The New Employment Contract aligns the terms and conditions of Mr. Webster’s employment with those applicable to the Company’s Chief Executive Officer and updates certain other terms, consistent with industry practice for the employment of executives with a U.S. domestic issuer.
The New Employment Contract is substantially similar to the Prior Employment Contract, except that the New Employment Contract (i) provides for a longer notice period; (ii) clarifies and amends the compensation payable to Mr. Webster upon termination of his employment; (iii) includes an explicit change in control provision, clarifying the compensation payable to Mr. Webster in the event of a change in control; and (iv) modifies the pension benefit payable to Mr. Webster. Other than modification to the pension benefit (as further detailed below), the compensation and benefit terms set forth in the New Employment Contract are consistent with the terms established upon Mr. Webster’s appointment as Chief Financial Officer on March 1, 2022 and intended to apply from said date.
The key terms of the New Employment Contract are summarized below. The compensation and benefits payable to Mr. Webster are subject to annual review by the Company’s Board of Directors and Chief Executive Officer and may be modified in connection with such review.
89
a.Continuation of Employment: Mr. Webster’s term of employment as the Company’s Chief Financial Officer commenced on March 1, 2022 and will continue unless terminated in accordance with clause 15 of the New Employment Contract.
b.Notice Period: The New Employment Contract increases the notice period applicable to both the Company and Mr. Webster from six (6) months or twelve (12) months (the “Notice Period”).
c.Base Salary: Mr. Webster’s base salary in 2022 was £200,000 per annum and in 2023 is £206,000 per annum.
d.Perquisite: Mr. Webster’s perquisite allowance is £20,000 per annum.
e.Short-Term Incentive Compensation (Cash Bonus): With respect to his annual cash bonus, Mr. Webster’s target bonus opportunity is 50% of his annual base salary.
f.Long-Term Incentive Compensation (Equity Awards): Mr. Webster’s target annual equity award is equal to 65% of his annual base salary. On March 14, 2022, Mr. Webster was awarded 4,000 time-based stock options and 6,000 performance share units (at target and subject to the achievement of Earnings Per Share (EPS) Growth and Total Shareholder Return (TSR) performance metrics over the 2022-2024 performance period).
g.Pension Contributions:Given restrictions on the amount that can be contributed to pension schemes by high earners in the United Kingdom, Mr. Webster receives a salary supplement equal to 8% of his base salary in lieu of the Company’s contributions to the Luxfer Retirement Savings Plan (the “Pension Scheme”). Mr. Webster may choose to make contributions to the Pension Scheme, but no additional contributions will be made by the Company for the benefit of Mr. Webster. Before this modification, Mr. Webster participated in the Pension Scheme, and contributions and benefits were subject to the rules of the Pension Scheme.
h.Compensation Upon Termination:As set forth in clause 15.3 of the New Employment Contract, Mr. Webster will continue to receive the compensation and benefits described above and further detailed in clause 6 of the New Employment Contract through the end of the Notice Period, provided the Company does not exercise its right of payment in lieu of notice. Specifically, Mr. Webster will continue to earn a cash bonus during the Notice Period, and any outstanding equity awards will continue to vest during the Notice Period, in accordance with the applicable vesting schedule. If, as of the termination date, the actual cash bonus earned for the fiscal year has not been determined because the relevant performance period remains ongoing, Mr. Webster’s bonus for the fiscal year in which his employment terminates will be paid at Budget level and pro-rated to reflect actual dates of service, including the Notice Period, during said fiscal year. Except in the event of termination for cause (as outlined in sub-clause 15.2.2 of the New Employment Contract) or a Change in Control (as detailed in clause 15.7 of the New Employment Contract), the Company reserves the right, in lieu of notice and without giving any reason, to (i) pay Mr. Webster his gross salary (less such tax and national insurance, and any pension contributions, as may be properly deductible) for the Notice Period or outstanding balance thereof; (ii) pay Mr. Webster a cash bonus for the fiscal year in which his employment terminates, which shall be the actual cash bonus earned for said fiscal year, or, if the actual cash bonus has not been determined because the relevant performance period remains ongoing, the cash bonus at Budget level and pro-rated to reflect actual dates of service, including the Notice Period, during said fiscal year; and (iii) immediately vest any equity awards that would have vested during the Notice Period or balance thereof. This arrangement differs from that disclosed in the Company’s Proxy Statement on Form DEF 14A in relation to the 2022 Annual General Meeting of Shareholders, which was filed with the Securities and Exchange Commission on April 27, 2022, in that only those equity awards that are scheduled to vest during the Notice Period or balance thereof will immediately be vested, as opposed to the immediate vesting of all outstanding time-based awards. The foregoing modification was made to align the terms of the New Employment Contract with the rules of the Luxfer Holdings PLC Long-Term Umbrella Incentive Plan, as amended and restated on June 8, 2022 (the “LTIP”). Per the rules of the LTIP, any time-based awards that have not become vested or exercisable as of the termination date shall immediately lapse and any performance-based awards shall vest in accordance with the formula set forth in the LTIP, which considers performance as of the termination date and the total and elapsed number of days in the performance period.
i.Compensation Upon Change in Control: As set forth in clause 15.7 of the New Employment Contract, if Mr. Webster’s employment is terminated in connection with a Change in Control and Mr. Webster does not receive an offer of employment for an Equivalent Position with a Successor, then Mr. Webster will be eligible to receive (i) a redundancy payment equal to two times his base salary at the annualized rate in effect on the termination date; (ii) a payment equal to the actual cash bonus earned for the year in which his employment terminates, as determined in accordance with the Executive Incentive Compensation Plan then in effect; however, if the actual cash bonus earned has not been determined as of the termination date because the relevant performance period remains ongoing, then the cash bonus will be paid at Budget level; (iii) immediate vesting of all outstanding, unvested time-based equity awards, which may be settled in cash or shares in accordance with the rules of the LTIP; and (iv) immediate vesting of any performance-based equity awards, which may be settled in cash or shares and which amount shall
90
be calculated in accordance with the rules of the LTIP. This arrangement differs from that disclosed in the Company’s Proxy Statement on Form DEF 14A in relation to the 2022 Annual General Meeting of Shareholders, which was filed with the Securities and Exchange Commission on April 27, 2022, in that the payment representing the cash bonus will only be paid at Budget level if the actual cash bonus earned is not determined as of the termination date.
j.Restrictive Covenants: Mr. Webster is subject to restrictive covenants with respect to the disclosure of the Company’s confidential information, solicitation of the Company’s employees and customers, and activities which compete with the Company’s business.
The foregoing summary of the terms and conditions of Mr. Webster’s employment does not purport to be complete and is qualified, in its entirety, by reference to the full text of the New Employment Contract, which is filed as Exhibit 10.21 to this Annual Report on Form 10-K, and incorporated herein by reference.
Item 9C. Disclosure Regarding Foreign Jurisdictions that Prevent Inspections
Not applicable.
91
PART III
Item 10. Directors, Executive Officers and Corporate Governance
The information required by this Item is incorporated by reference to the following sections of our definitive Proxy Statement related to the 20192023 Annual General Meeting to be filed with the SEC not later than 120 days after the end of the fiscal year covered by this annual report, (the "2019"2023 Proxy Statement"): "Resolutions 1 - 5 - Election and Re-Election of Director Nominees," "Corporate Governance Matters" and "Section 16(a) Beneficial Ownership Reporting Compliance."
The Company has adopted a code of ethics which is applicable to all employees and is available on the corporate website, www.luxfer.com. A copy of the code can also be obtained, without charge, upon request. If there is an amendment to the code, then the nature of the amendment will also be made available of the corporate website.
Item 11. Executive Compensation
The information required by this Item is incorporated by reference to the following sections of the Proxy Statement for the 2019 annual general meeting:2023 Annual General Meeting: “Executive Compensation Discussion and Analysis” and “Director Compensation”.Compensation.”
Item 12. Security Ownership of Certain Beneficial Owners and Management and Related Stockholder Matters
The information required by this Item is incorporated by reference to the following sections of the Proxy Statement for the 2019 annual general meeting:2023 Annual General Meeting: "Equity Compensation Plan Information" and "Security Ownership."
Item 13. Certain Relationships and Related Transactions, and Director Independence
The information required by this Item is incorporated by reference to the following sections of the Proxy Statement for the 2019 annual general meeting:2023 Annual General Meeting: "Policies and Procedures Regarding Conflicts of Interest and Related Party Transactions" and "Corporate Governance Matters."
Item 14. Principal Accountant Fees and Services
The information required by this Item is incorporated by reference to the following section of the Proxy Statement for the 2019 annual general meeting:2023 Annual General Meeting: "Resolution 9 - Ratification of the appointment of PricewaterhouseCoopers LLP as the independent auditors of Luxfer Holdings PLC for 2019,2023, and to authorize, by binding vote, the Audit Committee to set the auditors’ remuneration".
92
PART IV
Item 15. Exhibits and Financial Statement Schedules
(a)(1) Financial Statements
The Financial Statements listed in the Index to Financial Statements in Item 8 are filed as part of this Annual Report on Form 10-K.
(a)(2) Financial Statement Schedules
N/A
(a)(3) Exhibits
93
101 The financial statements from the Company’s Annual Report on Form 10-K for the year ended December 31, 2022, formatted in XBRL: (i) Consolidated Statements of Income, (ii) Consolidated Statements of Comprehensive Income, (iii) Consolidated Balance Sheets, (iv) Consolidated Statements of Cash Flows, (v) Consolidated Statements of Changes in Equity, and (vi) Notes to Consolidated Financial Statements, tagged as blocks of text and including detailed tags.
* Management contract or compensatory plan or arrangement
Item 16. Form 10-K Summary
None.
94
SIGNATURES
Pursuant to the requirements of Section 13 or 15 (d) of the Securities Exchange Act of 1934, the registrant has duly caused this report to be signed on its behalf by the undersigned, thereunto duly authorized.
| Luxfer Holdings plc | ||||||||||||||
| (Registrant) | ||||||||||||||
| Chief Executive Officer | ||||||||||||||
| (Duly Authorized Officer) | ||||||||||||||
| March | ||||||||||||||
Pursuant to the requirements of the Securities Exchange Act of 1934, this report has been signed below by the following persons on behalf of the registrant and in the capacities and on the date indicated.
| Signature | Title | Date | ||||||||||||
| /s/Andrew Butcher | Chief Executive Officer (Principal Executive Officer) and Director | March 1, 2023 | ||||||||||||
| Andrew Butcher | ||||||||||||||
| Chief Financial Officer (Principal Financial and Accounting Officer) | March | |||||||||||||
| /s/Patrick K. Mullen | ||||||||||||||
| Chairman of the Board and Director | March | |||||||||||||
| /s/ | Director | March | ||||||||||||
| /s/Sylvia A. Stein | Director | March 1, 2023 | ||||||||||||
| Sylvia A. Stein | ||||||||||||||
| /s/Clive J. Snowdon | Director | March | ||||||||||||
| Clive J. Snowdon | ||||||||||||||
| /s/ | Director | March | ||||||||||||
95