Washington, D.C. 20549
Indicate by check mark whether the registrant is a large accelerated filer, an accelerated filer, a non-accelerated filer, a smaller reporting company, or an emerging growth company. See the definitions of "large accelerated filer," "accelerated filer," "smaller reporting company," and "emerging growth company" in Rule 12b-2 of the Exchange Act.
The aggregate market value of the shares of the registrant's Common Stock held by non-affiliates as of June 30, 20202023 was approximately $12,437,000,000.$18,051,000,000.
Item 1. BUSINESS
streams from our insurance operations beyond the traditional underwriting model. We believe this multi-platform approach provides us with a unique advantage through which we have the ability to unlock additional value for our customers and business partners, which we refer to as "the power of the platform."
Within our underwriting operations, we underwrite specialty insurance products on a risk-bearing basis. The specialty insurance market differs significantly from the standard market. In the standard market, insurance rates and forms are highly regulated, products and coverages are largely uniform with relatively predictable exposures, and companies tend to compete for customers on the basis of price. In contrast, the specialty market provides coverage for hard-to-place risks that generally do not fit the underwriting criteria of standard carriers.
Competition in the specialty insurance market tends to focus less on price than in the standard insurance market and more on other value-based considerations, such as availability, service and expertise. While specialty market exposures may have higher perceived insurance risks than their standard market counterparts, we seek to manage these risks and achieve higher financial returns. To reach our financial and operational goals, we must have extensive knowledge and expertise in our chosen markets. Many of our larger accounts are considered on an individual basis where customized forms and tailored solutions are employed.
We also participate in the reinsurance market in certain classes of reinsurance product offerings.offerings, primarily casualty lines and certain other specialty lines. In the reinsurance market, our clients are other insurance companies, or cedents. We typically write our reinsurance products in the form of treaty reinsurance contracts, which are contractual arrangements that provide for automatic reinsuring of a type or category of risk underwritten by cedents. Generally, we participateTreaty reinsurance products are written globally on reinsurance treaties withboth a numberquota share and excess of other reinsurers, each with an allocated portion of the treaty, with the terms and conditions of the treaty being substantially the same for each participating reinsurer.loss basis. With treaty reinsurance contracts, we do not separately evaluate each of the individual risks assumed under the contracts and are largely dependent on the individual underwriting decisions made by the cedent. Accordingly, we review and analyze the cedent's risk management and underwriting practices in deciding whether to provide treaty reinsurance and in pricing of treaty reinsurance contracts.
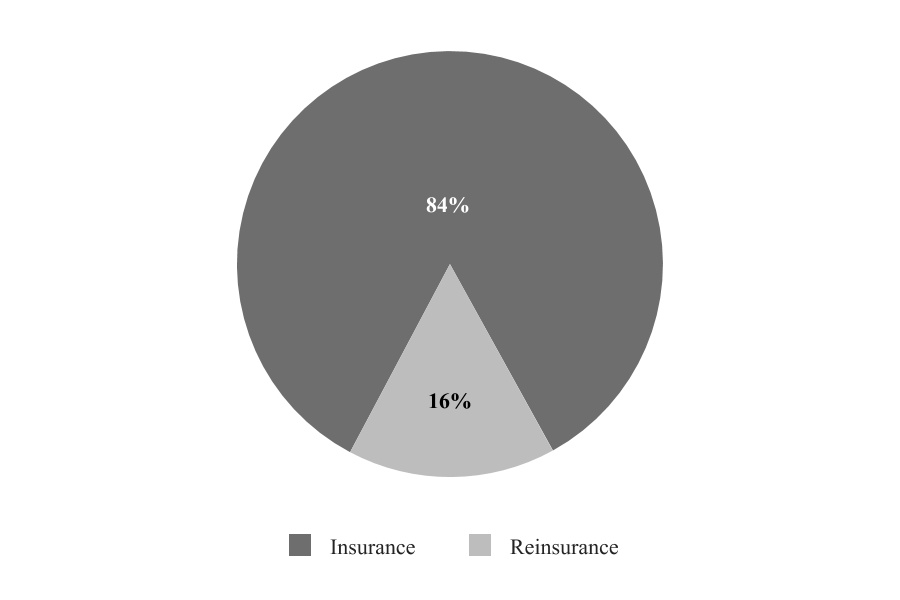
The following chart presents the composition of our underwriting operations between insuranceour Insurance segment and reinsuranceReinsurance segment based on 20202023 underwriting gross premium volume of $7.2 billion, which also aligns with our two reportable underwriting segments.
The following table summarizes our U.S. insurance and reinsurance underwriting subsidiaries.
In the U.S., we write business in the excess and surplus lines (E&S) and admitted insurance markets, as well as the reinsurance market. The primary distribution channels through which our U.S. business is placed are wholesale insurance and reinsurance markets. brokers, retail insurance agents and alternative channels, including third-party managing general agents.
We also participate in the London insurance and reinsurance market, which is known for its ability to provide innovative, tailored coverage and capacity for unique and hard-to-place risks. Hard-to-place risks, inmany of which have significantly higher limits than risks placed through the London market are generally distinguishable from standard risks due to the complexity or significant size of the risk. It is primarily a broker market, which means that insurancemarket. Insurance brokers bringplace most of the business toin the London market. Risks written in this market are written on either a direct basis or a subscription basis, the latter of which means that loss exposures brought into the market are typically insured by more than one insurance company or Lloyd's of London (Lloyd's) syndicate, often due to the high limits of insurance coverage required. When we write business in the subscription market, we prefer to participate as lead underwriter in order to control underwriting terms, policy conditions and claims handling. We participate in the London insurance and reinsurance market primarily through Markel Capital Limited (Markel Capital) and MIICL. Markel Capital is the corporate capital provider for Syndicate 3000, through which our Lloyd's operations are conducted. Syndicate 3000 is managed by Markel Syndicate Management Limited. In addition to their headquarters in London, Markel Capital and MIICL havemaintain branch offices across the United Kingdom (U.K.), Europe, Canada, Latin America, Asia, PacificAustralia and the Middle East through which we are able to offer insurance and reinsurance. The London insurance market produced approximately $76 billion of gross written premium in 2019, of which $47 billion was produced by Lloyd's syndicates.(1,2) In 2019, our share of the London market was approximately 2% as measured by gross written premiums.
In a reinsurance transaction, an insurance company transfers, or cedes, all or part of its exposure in return for a premium. In a retrocessional reinsurance transaction, a reinsured exposure is further ceded to another reinsurer. Within our underwriting operations, we seek to retain as much of our profitable business as possible while managing volatility within our underwriting results and capital requirements at our insurance subsidiaries. We purchase reinsurance and retrocessional reinsurance to manage our net retention on individual risks and overall exposure to losses, while providing us with the ability to offer policies with sufficient limits to meet policyholder needs. Additionally, with multiple platforms through which we are able to connect risk and capital, we may leverage our underwriting expertise to support third party capital in our ILS and program services platforms in order to most efficiently match our customer’s risk with the appropriate source of capital. In those instances where we are ceding risks within our underwriting operations to one of our other insurance platforms, we earn fees and commissions in exchange for our services.
When appropriate, we pursue reinsurance commutations that involve the termination of ceded reinsurance and retrocessional reinsurance contracts. Our commutation strategy related to ceded reinsurance and retrocessional contracts is to reduce credit exposure and eliminate administrative expenses associated with the run-off of ceded reinsurance placed with certain reinsurers.
See note 1012 of the notes to consolidated financial statements included under Item 8 and Item 7A Quantitative and Qualitative Disclosures About Market Risk for additional information about our ceded reinsurance programs and exposures.
Competition and Underwriting Philosophy
We compete with numerous domestic and international insurance companies and reinsurers, Lloyd's syndicates, risk retention groups, insurance buying groups, risk securitization programs, alternative capital sources, such as that provided through ILS, and alternative self-insurance mechanisms. We also compete with new companies that continue to be formed to enter the insurance and reinsurance markets, particularly companies with new or "disruptive" technologies or business models. Competition may take the form of lower prices, broader coverages, greater product flexibility, enhanced digital capabilities through which to distributefor distribution of insurance products, higher coverage limits, higher quality services or higher ratings by independent rating agencies. In all of our markets, we compete on the basis of overall financial strength, ratings assigned by independent rating agencies, development of specialty products to satisfy well-defined market needs and by maintaining relationships with agents, brokers and insureds who rely on our expertise. This expertise is our principal means of competing. We offer a diverse portfolio of products, each with its own distinct competitive environment, which requires us to be responsive to changes in
market conditions for individual product lines. With each of our products, we seek to write business that produces consistent underwriting profits by competing with innovative ideas, appropriate pricing, expense control and quality servicemaintaining adequate rates for our premium writings in relation to policyholders, agents and brokers. More recently, we have also leveraged our underwriting capacity and expertise through relationships with start-ups and digital distribution partners through which we can develop ideas that leverage emerging technologies and modern customer acquisition strategies to create the service and experience that consumers have grown to expect and demand.expected loss cost trends.
Few barriers exist to prevent insurers and reinsurerscompetition from entering our markets within the property and casualty industry. Market conditions, risk tolerance and capital capacity influence the degree of competition at any point in time. During periods of excess underwriting capacity, as defined by availability of capital, competition can result in lower pricing and less favorable policy terms and conditions for insurers. During periods of reduced underwriting capacity, pricing and policy terms and conditions are generally more favorable for insurers. Historically, the performance of the property and casualty reinsuranceinsurance and insurancereinsurance industries has tended to fluctuate in cyclical periods of price competition and excess underwriting capacity, followed by periods of high premium rates and shortages of underwriting capacity. At any given time, our portfolio of insurance products could be experiencing varying combinations of these characteristics. This cyclical market pattern can be more pronounced in the specialty insurance and reinsurance markets in which we compete than the standard insurance market.
Following several years of price decreases, and the high level of natural catastrophes that occurred in 2017, we began seeing more favorable rates in 2018, particularly onWithin our catastrophe-exposed and loss-affected business, that have continued and further strengthened through 2020 following the continued high level of natural catastrophes and the high level of losses attributed to the COVID-19 pandemic. We are also seeing improved pricing on many of our other product lines, the primary exception being workers' compensation, where we continue to see rate decreases given favorable loss experience in recent years. These rate increases have been been more significant in the primary, or insurance markets, than the reinsurance markets.
By focusing on market niches where we have underwriting expertise, and leveraging capabilities offered through our multiple insurance platforms,operations, we seek to earn consistentan underwriting profits, which are a key component of our strategy.profit every year. The property and casualty insurance industry commonly defines underwriting profit or loss as earned premiums net of losses and loss adjustment expenses and underwriting, acquisition and insurance expenses. We believe that the ability to achieve consistent underwriting profits demonstrates knowledge and expertise, commitment to superior customer service and the ability to manage insurance risk. We use underwriting profit or loss as a basis for evaluating our underwriting performance. The combined ratio is a measure of underwriting performance and represents the relationship of incurred losses, loss adjustment expenses and underwriting, acquisition and insurance expenses to earned premiums. A combined ratio less than 100% indicates an underwriting profit, while a combined ratio greater than 100% reflects an underwriting loss. In 2020,2023, our combined ratio was 98%. See Item 7 Management's Discussion & Analysis of Financial Condition and Results of Operations for a discussion of our underwriting results.
We routinely review the pricing for all of our major product lines. When we believe the prevailing market price will not support our underwriting profit targets, the business is not written. As a result of our underwriting discipline, gross premium volume may vary when we alter our product offerings to maintain or improve underwriting profitability.
Over the past few years, For example, in 2023, we have increasedadjusted our focus on growing our most profitable lines of business and have discontinued certain lines or programs that have not performed consistent with our expectations. This is particularly truewritings within our Reinsurance segment, where we made the decisionU.S. and Bermuda directors and officers and errors and omissions product lines in late 2020 to discontinue writing catastrophe-exposed property business on a risk-bearing basis, and instead, this business will either be written directly by, or ceded to, our ILS operations to be placed with third party capital. In more limited instances, we have taken similar actions within our Insurance segment in response to unfavorable loss cost trends and we have also made changes in our ceded reinsurance programs, as previously discussed. With these changes, along with the more favorable rates we are seeing in the market, we expect less volatility in our underwriting results going forward.downward pressure on rates.
Underwriting Segments
We monitor and assessesassess the performance of our ongoing underwriting operations on a global basis in the following two segments: Insurance and Reinsurance. See note 2 of the notes to consolidated financial statements included under Item 8 for additional segment reporting disclosures.
Insurance Segment
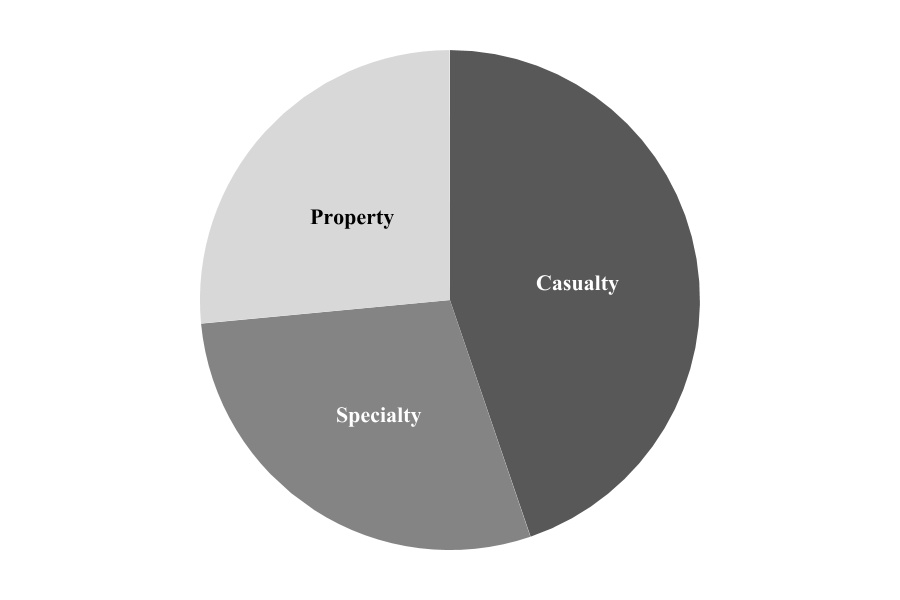
Our Insurance segment reported gross premium volume of $6.0$9.2 billion, earned premiums of $4.7$7.3 billion and an underwriting profit of $169.0$162.2 million in 2020.2023. The following chart presents the composition of our Insurance segment by division based on 20202023 gross premium volume.
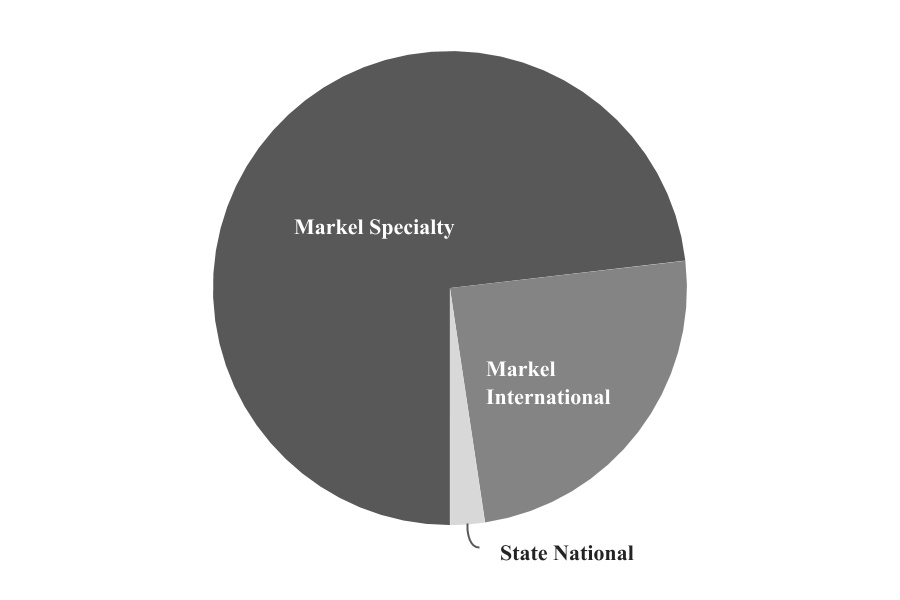

The Markel Specialty division is comprised of our U.S. and Bermuda based insurance underwriting operations and writes business on an admitted and non-admitted basis for insureds ranging from individuals and small businesses to Fortune 1000 companies for agents and brokers in the U.S., Bermuda, the U.K., the E.U., Asia and Ireland as well as program insurance and other specialty coverages for well-defined niche markets. This division was formed effective April 1, 2020 through the combination of our Markel Assurance andAustralia. The Markel Specialty divisions. The newly combined Markel Specialty division creates a unified platform that we believe makes it easier for our customersprovides easy access to access our diverse portfolio of products and capabilities and provides an improved customer experience.capabilities. The Markel International division writes business worldwide from our London and Munich-based platforms, which include branch offices aroundin Canada, Asia, Australia and across the world.E.U. The State National division writes collateral protection insurance which insures personal automobilesfor automobile and other vehicles held as collateral forvehicle loans made by credit unions, banks and specialty finance companies through its lender services product line on both an admitted and non-admitted basis.in the U.S.
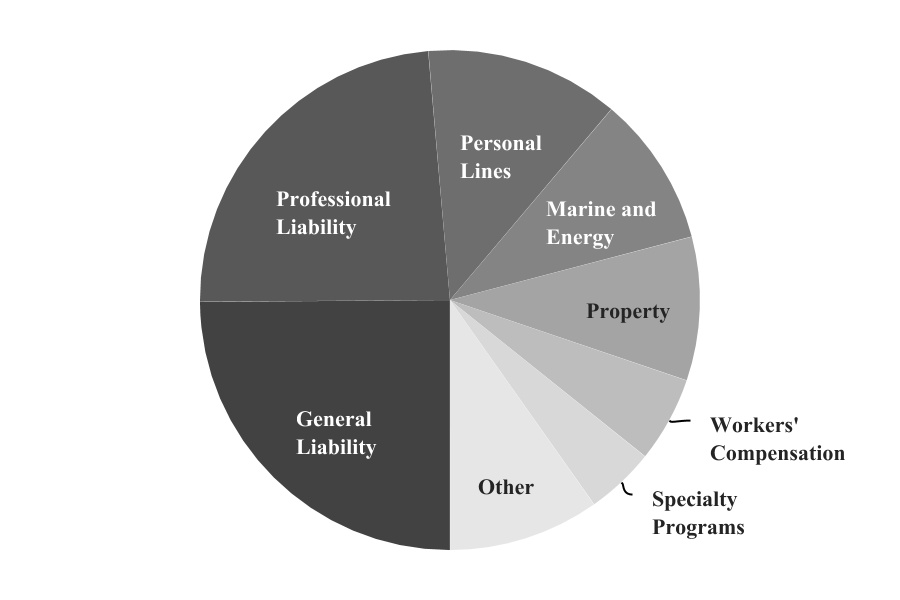
The following chart displays the types of products written in our Insurance segment based on 20202023 gross premium volume.
General Liabilityliability product offerings include a variety of primary and excess liability coverages targeting apartments and office buildings, retail stores, contractors, consultants, construction professionals, financial service professionals, professional practices, social welfare organizations and medical products, as well ascoverages. We focus on businesses in the construction, life sciences, energy, medical, healthcare, pharmaceutical, professional services, social welfare, recreational, transportation, heavy industrial and hospitality industries. Specific products include primary general liability, excess and umbrella products, products liability products, environmental liability products and casualty facultative reinsurance written for individual casualty risks.
Our professional liability product lines provide insurance solutions for small, middle market and risk management accounts with coverage that is tailored to their exposures and needs. Professional liability coverages include uniqueerrors and omissions, directors and officers, cyber, employment practices liability, professional indemnity, transaction liability, intellectual property and union liability. Errors and omissions coverage provides solutions for highly specialized professions including architects and engineers, lawyers, accountants, agents and brokers, service technicians and consultants.consultants, as well as other less-specialized professionals. Directors and officers coverage is provided for publicly-traded, private and non-profit companies, including financial institutions and Fortune 1000 companies. We also offer claims-made medical malpractice coverage for doctors and dentists; claims-made professional liability coverage for individual healthcare providers such as therapists, pharmacists, physician assistants and nurse anesthetists; and coverages for medical facilities and other allied healthcare risks such as clinics, laboratories, pharmacies and senior living facilities. Other professional liability coverages include errors and omissions, union liability, professional indemnity, intellectual property, executive liability for financial institutions and Fortune 1000 companies and management liability. Additionally, we offer cyber liability products, which provide coverage for, among other things, data breach and privacy liability, data breach loss to insureds and electronic media coverage.
Personal lines products provide first and third partythird-party coverages in the U.S. for classic cars, motorcycles and a variety of personal watercraft, including vintage boats, high performancehigh-performance boats and yachts and recreational vehicles, such as motorcycles, snowmobiles and ATVs. Based on the seasonal nature of much of our personal lines business, we generally will experience higher claims activity during the second and third quarters of the year. Additionally, property coverages are offered for mobile homes, dwellings and homeowners that do not qualify for standard homeowner's coverage, as well as personal umbrella coverage.
Marine and energy products include a portfolio of coverages for cargo, energy, hull, liability, war and terrorism risks.risks worldwide. The cargo product line is an international transit-based book providing coverage for many types of cargo. Energy coverage includes all aspects of oil, gas and renewable energy activities. Our renewable energy activities include coverages for onshore and offshore wind farms, as well as alternative energy generation and storage technology projects. Hull coverages consist of coverage for physical damage to ocean-going tonnage, yachts and mortgagees' interests. Liability coverage provides coverage for a broad range of energy liabilities, as well as traditional marine exposures including charterers, terminal operators and ship repairers. WarMarine war coverage includes protections for the hulls of ships, and aircraft, and other related interests, against war and associated perils. Terrorism coverage providesincludes coverage for property damage and business interruption related to political and civil violence includingand war and civil war.on land.
Property coverages consist principally of fire, allied lines (including windstorm, hail and water damage) and other specialized property coverages, including catastrophe-exposed property risks such as earthquake and wind on both a primary and excess basis. Catastrophe-exposed property risks are typically lower frequency andcan present higher severity in nature than more standard property risks.risks due to the impacts from earthquakes and severe weather events such as hurricanes, convective storms and wildfires. Our property coverages are exposed to windstorm losses that, based on the seasonal nature of those events, are more likely to occur in the third and fourth quarters of the year. Our property risks range from small, single-location accounts to large, multi-state, multi-location, multi-national accounts on a worldwide basis. Other types of property products include inland marine products, railroad-related products and specie coverage for fine art on exhibition and in private collections.
Specialty programs business is offered in the U.S. on a standalone or package basis and generally targets specialized commercial markets and various customer groups, such as amateur sports and fitness clubs. Certain specialty programs written in this segment use managing general agents to offer single source admitted and non-admitted programs for a specific industry, class or line of business.
Workers' compensation products are offered in the U.S. and provide wage replacement and medical benefits to employees injured in the course of employment and target main-street, service and artisan contractor businesses, retail stores and restaurants.
Specialty programs business included in this segment is offered onCredit and surety products consist primarily of trade credit and prepayment coverage and a standalone or package basisrange of bonds and generally targets specialized commercialguarantees that support contractual obligations, as well as other coverages for specific credit risks, markets and various customer groups,contingencies. Key credit risks covered include those of counterparty insolvency and defaults by government-owned entities. The key coverages under surety products include contractual performance and payment risks, commercial license and permit obligations and obligations related to judicial proceedings such as amateur sportscourt and senior living facilities. Other specialty programs business written in this segment includes general agent programs that use managing general agents to offer single source admitted and non-admitted programs for a specific class or line of business, including first and third party coverages.fiduciary bonds.
Other product lines within the Insurance segment primarily include credit and surety products and collateral protection insurance.insurance, which insures personal automobiles and other vehicles held as collateral for loans made by credit unions, banks and specialty finance companies.
Reinsurance Segment
Our Reinsurance segment product offerings are underwritten primarily by our Global Reinsurance division, which operates from platforms in the U.S., Bermuda and the U.K. We write quota share and excess of loss reinsurance on a local, national and global basis. Our Reinsurance segment reported gross premium volume of $1.1$1.0 billion, earned premiums of $929.3 million$1.0 billion and an underwriting loss of $34.0$19.3 million in 2020.2023. The following chart displays the types of products written in our Reinsurance segment based on 20202023 gross premium volume.

Our casualty treaty reinsurance programs are written on a quota share and excess of loss basis and include general liability, professional liability, medical malpractice and environmental impairment liability. General liability reinsurance includesprimarily consists of umbrella and excess casualty products, that are written worldwide. as well as environmental liability products covering pollution legal liability and contractors' pollution exposures.
Our professional liability reinsurance programs are offered worldwide and consist of directors and officers liability, including publicly traded, private, and non-profit companies in both commercial and financial institution arenas; lawyers errors and omissions for small, medium and large-sized law firms; accountants errors and omissions for small and medium-sized firms; technology errors and omissions and cyber liability focusing on network security and privacy exposures. Medical malpracticespecialty treaty reinsurance products are offered inwritten across a wide range of specialty product lines, primarily consisting of the United States and include coverage for physician, surgeon, hospital and long term care medical malpractice writers. Environmental treaty reinsurance provides coverage for pollution legal liability, contractors pollution and professional liability exposures on both a nationwide and regional basis within the U.S.following:
Specialty treaty reinsurance•Credit and surety products, offered in the Reinsurance segment includeincluding structured and whole turnover credit, political risk mortgage and contract and commercial surety reinsurance programs covering worldwide exposures, public entity reinsuranceexposures;
•Workers' compensation and accident and health products workers' compensation excess of losscovering both standard and quota share treaties, whole account, marine and agriculture reinsurance products. Our mortgage products offer coverage for private mortgage insurerscatastrophe-exposed business in the U.S., Australia and Europe. Our public entity reinsuranceworldwide;
•Marine and energy products offer customized programs for government risk pools, including counties, municipalities, schools, public housing authorities and special districts (e.g., water, sewer, parks) located in the U.S. Types of coverage for public entities include general liability, environmental impairment liability, cyber and errors and omissions. Our workers' compensation business includes standard and catastrophe exposed workers' compensation business. Marine reinsurance products includecovering both offshore and onshore marine, energy and renewable energy risks on a worldwide basis, including hull, cargo and liability. liability;
•Public entity reinsurance products offering casualty coverage for municipalities, schools, special districts, public housing authorities and public entity affiliated non-profits;
•Mortgage default insurance offering coverage for private mortgage insurers predominantly located in the U.S. and Australia;
•Aviation and space coverage, including major risk, general aviation, satellite launch and orbit;
•Agriculture reinsurance coverscovering multi-peril crop insurance, hail and related exposures for risks located in the U.S. and Canada.Canada; and
•Discrete political violence and national terror pools in select jurisdictions globally.
Property treaty products are offered on an excess of loss and quota share basis for catastrophe, per risk and retrocessional exposures worldwide. A significant portionProfessional liability reinsurance primarily consists of the property treaty business covers U.S. exposures, with the remainder coming from international property exposures. Our property treaty products includefollowing:
•Transaction liability, which provides representation, warranty and indemnity coverage for catastrophe exposures, as well as individual property risks such as buildings, structures, equipmentmergers and contents and provideacquisitions, including coverage for tax and contingent liability;
•Directors and officers liability for publicly-traded, private and non-profit companies;
•Cyber and technology errors and omissions covering both personal linesfirst and commercial property exposures. Our retrocessional products provide coveragethird-party exposures;
•Errors and omissions for all types of underlying exposureslawyers, accountants, agents and geographic zones. Our catastrophe exposures are generally written on an excess of loss basisbrokers, services technicians and target both personalconsultants; and commercial lines of business providing coverage
•Healthcare liability for losses from natural disasters, including hurricanes, wind stormsphysicians, hospitals, long-term care and earthquakes. Based on the seasonal nature of hurricanes and wind storms, certain catastrophic losses are more likely to occur in the third and fourth quarters of the year. In late 2020, we made the decision to discontinue writing catastrophe-exposed property reinsurance within our Reinsurance segment on a risk-bearing basis, and instead, any such business will either beother medical facilities.
written directly by, or ceded to, our Nephila ILS operations to be placed with third party capital to the extent it fits the ILS investors’ risk profile. However, as some of our reinsurance contracts are written with multi-year terms, we will continue to have catastrophe-exposure through the expiration of those contracts, some of which extend into 2023. Additionally, on the contracts that are ceded, we will continue to bear underwriting risk for aggregate agreement year losses on these exposures in excess of a limit that we believe is highly unlikely to be exceeded. We also continue to have exposure to catastrophes on our retrocessional reinsurance business.
Insurance-Linked Securities
Our insurance-linked securities operations are comprised of our NephilaProgram Services and run-off Markel CATCo operations, as further described below. We receive management fees for investment and insurance management services provided through these operations based on the net asset value of the accounts managed, and for certain funds, incentive fees based on the annual performance of the funds managed. Through our Nephila operations, we also provide managing general agent services and receive commissions based on the direct written premiums of the insurance contracts placed. Total revenues from our insurance-linked securities operations for the year ended December 31, 2020 were $212.3 million, which are included in services and other revenues in our consolidated statement of income and comprehensive income.
Nephila
In November 2018, we completed the acquisition of all of the outstanding shares of Nephila Holdings Ltd. (together with its subsidiaries, Nephila). Headquartered in Bermuda, Nephila serves as an insurance and investment fund manager and managing general agent that offers a broad range of investment products, including insurance-linked securities, catastrophe bonds, insurance swaps and weather derivatives.
Nephila serves as the investment manager to several Bermuda, Ireland and U.S. based private funds (the Nephila Funds). To provide access for the Nephila Funds to the insurance, reinsurance and weather markets, Nephila also acts as an insurance manager to certain Bermuda Class 3 and 3A reinsurance companies and Lloyd’s Syndicate 2357 (Syndicate 2357) (collectively, the Nephila Reinsurers). Nephila also serves as a managing general agent that underwrites and administers property insurance policies and provides delegated underwriting services to providers of insurance capital, including the Nephila Reinsurers. The results of the Nephila Reinsurers are attributed to the Nephila Funds primarily through derivative transactions between these entities. Neither the Nephila Funds nor the Nephila Reinsurers are subsidiaries of Markel Corporation, and as such, these entities are not included in our consolidated financial statements. As of December 31, 2020, Nephila's net assets under management were $9.6 billion.
See note 16 of the notes to consolidated financial statements included under Item 8 for further details regarding our Nephila operations.
Markel CATCo
Our Markel CATCo operations are conducted through Markel CATCo Investment Management Ltd. (MCIM). MCIM is an ILS investment fund manager headquartered in Bermuda and, through 2019, was focused on building and managing highly diversified, collateralized retrocession and reinsurance portfolios covering global property catastrophe risks. MCIM serves as the insurance manager for Markel CATCo Re Ltd. (Markel CATCo Re), a Bermuda Class 3 reinsurance company, and as the investment manager for Markel CATCo Reinsurance Fund Ltd., a Bermuda exempted mutual fund company comprised of multiple segregated accounts (Markel CATCo Funds). MCIM also serves as the investment manager to CATCo Reinsurance Opportunities Fund Ltd. (CROF), a limited liability closed-end Bermuda exempted mutual fund company listed on a market operated by the London Stock Exchange and on the Bermuda Stock Exchange. CROF invests substantially all of its assets in Markel CATCo Reinsurance Fund Ltd.
In July 2019, MCIM announced it would cease accepting new investments in the Markel CATCo Funds and would not write any new business in Markel CATCo Re. Both the Markel CATCo Funds and Markel CATCo Re have been placed into run-off, and MCIM is returning capital to investors as it becomes available. For further details regarding these developments within our Markel CATCo operations, see note 19 of the notes to consolidated financial statements included under Item 8. As of December 31, 2020, MCIM's remaining net assets under management were $1.0 billion.
See note 15 of the notes to consolidated financial statements included under Item 8 for further details regarding our Markel CATCo operations.
Lodgepine
In 2019, we established Lodgepine Capital Management Limited (Lodgepine), our new retrocessional insurance-linked securities fund manager in Bermuda. Lodgepine's initial product offering will be Lodgepine Fund Limited, a property catastrophe retrocessional investment fund, and subject to certain conditions, we have committed to invest up to $100 million in Lodgepine Fund Limited. Lodgepine Fund Limited initially plans to subscribe to a portfolio of retrocessional reinsurance, which includes contracts written in our Reinsurance segment.
Program ServicesOther Fronting
Our program services and other fronting business which is provided through our State National division, generates fee income in the form of ceding (program service) fees by offering issuing carrier capacity to both specialty managing general agentsin exchange for fronting insurance and reinsurance business for other producers who sell, control and administer books of insurance business that are supported by third parties that assume reinsurance risk, including Syndicate 2357 and other Nephila Reinsurers. These reinsurers are domestic and foreign insurers and institutional risk investorscarriers (capacity providers) that want to access specific lines of U.S. property and casualty insurance business, but may not have the required licenses and filings to do so.. In general, fronting refers to business in which we write insurance on behalf of a general agent or capacity provider and then cede all, or substantially all, of the risk under these policies to the capacity provider in exchange for ceding fees. The results of our program services and other fronting operations are not included in a reportable segment.
Our program services business, which is provided through our State National division, offers issuing carrier capacity to both specialty managing general agents and other producers who sell, control and administer books of insurance business that are supported by third parties that assume reinsurance risk, including the Nephila Reinsurers. These reinsurers include domestic and foreign insurers and institutional risk investors that want to access specific lines of U.S. property and casualty insurance business but may not have the required licenses, filings or financial strength ratings to do so.
Beginning in 2024, our State National division is expanding internationally through a partnership with our Markel International division to create an international program services division to serve managing general agents in the U.K. market. The new division is another example of how we can leverage our array of capabilities to effectively and efficiently connect capital with risk.
Through our program services business, we write a wide variety of insurance and reinsurance products, principally including general liability, insurance, commercial liability, insurance, commercial multi-peril, insurance, property insurance and workers' compensation insurance.compensation. Program services business written through our State National division is separately managed from our underwriting divisions, which may write similar products, in order to protect our program services customers and eliminate internal competition for this business.customers.
The following table summarizes the subsidiaries through which our program services business is primarily written.
| | | | | | | | | | | | | | |
| Legal Entity | | Abbreviation | | State of Domicile |
| City National Insurance Company | | CNIC | | Texas |
Independent Specialty Insurance Company | | ISIC | | Delaware |
| National Specialty Insurance Company | | NSIC | | Texas |
| Pinnacle National Insurance Company | | PNIC | | Texas |
| State National Insurance Company, Inc. | | SNIC | | Texas |
| Superior Specialty Insurance Company | | SSIC | | Delaware |
| United Specialty Insurance Company | | USIC | | Delaware |
All ofThrough these subsidiaries, areour program services business is licensed or authorized to write property and casualty insurancebusiness in all 50 states and the District of Columbia. USIC is also eligible to write business in the U.S. Virgin Islands. Many of our programs are arranged with the assistance of brokers that are seeking to provide customized insurance solutions for specialty insurance business that requires a carrier rated "A" by A.M. Best Company (Best)(A.M. Best). Our specialized business model relies on third partythird-party producers or capacity providers to provide the infrastructure associated with providing policy administration, claims handling, cash handling, underwriting, or other traditional insurance company services. We believe there are relatively few active competitors in the fronting business. We compete primarily on the basis of price, customer service, geographic coverage, financial strength ratings, licenses, reputation, business model and experience.
Total revenues attributed to our program services business for the year ended December 31, 20202023 were $104.2$151.8 million. Our program services business generated $2.1$2.9 billion of gross written premium volume for the year ended December 31, 2020.2023.
In our program services business, we generally enter into a 100% quota share reinsurance agreementagreements whereby we cede to the capacity providerproviders 100% of the premium written and substantially all of our gross liability under all policies issued by and on behalf of us by the producer. The capacity provider is generally entitled to 100% of the net premiums received on policies reinsured, less the ceding fee to us, the commission paid to the producer and premium taxes on the policies. In connection with writing this business, we also enter into agency agreements with both the producer and the capacity provider whereby the producer and capacity provider are generally required to deal directly with each other to develop business structures and terms to implement and maintain the ongoing contractual relationship. In a number of cases, the producer and capacity provider for a program are part of the same organization or are otherwise affiliated. As a result of our contract design, substantially all of the underwriting risk and operational risk inherent in the arrangement is borne by the capacity provider. The capacity provider assumes and is liable for substantially all losses incurred in connection with the risks under the reinsurance agreement, including judgments and settlements. providers.
Our contracts with capacity providers do not legally discharge us from our primary liability for the full amount of
the policies, and we will be required to pay the loss and bear collection risk if thea capacity provider fails to meet its obligations under the reinsurance agreement. As a result, we remain exposed to the credit risk of capacity providers, orincluding the risk that one of our capacity providers becomes insolvent or is otherwise unable or unwilling to pay policyholder claims. We mitigate this credit risk generally by either selecting well capitalized, highly rated authorized capacity providers or requiring that the capacity provider post substantial collateral to secure the reinsured risks.risks, which, in some instances, exceeds the related reinsurance recoverable.
In our other fronting business, we leverage the strength of our underwriting platform, including our highly rated insurance subsidiaries, to write business on behalf of our Nephila ILS operations, in exchange for ceding fees, to support its business plans and assist in meeting its desired return objectives. Our other fronting business is managed separately from our program services business. The results of our other fronting business are not included in a reportable segment. Total revenues attributed to our other fronting business for the year ended December 31, 2023 were $20.7 million. Our other fronting business generated $840.9 million of gross written premium volume for the year ended December 31, 2023.
Business written on behalf of our Nephila ILS operations within both our program services and other fronting operations primarily consists of catastrophe-exposed property insurance and reinsurance business, as well as specialty and climate reinsurance business. The business written is ceded to the Nephila Reinsurers, whose investors ultimately assume the risk. To mitigate credit risk for this business, we require collateral up to a specified level of annual aggregate agreement year losses, which is held in a trust for which we are the beneficiary. See note 18 of the notes to consolidated financial statements included under Item 8 for further details regarding our programs with Nephila Reinsurers.
Although we reinsure substantially all of the risks inherent in our program services business,and other fronting businesses, we have certain programs that contain limits on our reinsurers’reinsurers' obligations to us that expose us to underwriting risk, including loss ratio caps, aggregate reinsurance limits or exclusion of the credit risk of producers. Under certain programs, including one programprograms and contracts with Syndicate 2357, an unconsolidated affiliate,Nephila Reinsurers, we also bear underwriting risk for annual aggregate agreement year losses in excess of a limit that we believe is highly unlikely to be exceeded.
Insurance-Linked Securities
Our insurance-linked securities operations are primarily comprised of our Nephila operations and are not included in a reportable segment. Nephila Holdings Ltd. (together with its subsidiaries, Nephila) provides investment and insurance management services through which we offer alternative capital to the insurance and reinsurance markets while providing investors with investment strategies that typically are uncorrelated with traditional asset classes. We receive management fees for investment and insurance management services provided through these operations, and for certain funds, incentive fees based on their annual performance. Our management fees are based on the net asset value of the accounts managed for most of our funds and gross premium volume for the remaining funds. Total revenues from our insurance-linked securities operations for the year ended December 31, 2023 were $99.5 million. As of December 31, 2023, Nephila's net assets under management were $6.8 billion.
Our fund management operations provide insurance and investment management services for a broad range of investment products for insurance and reinsurance companies, government entities, banks, hedge funds, pension funds and institutional investors, including insurance-linked securities such as catastrophe bonds, insurance swaps, traditional reinsurance contracts, industry loss warranties and other financial instruments. Nephila serves as the investment manager to several Bermuda based private funds (the Nephila Funds). To provide access for the Nephila Funds to a variety of insurance-linked securities in the property catastrophe, climate and specialty markets, Nephila acts as an insurance manager to certain Bermuda Class 3, collateralized and special purpose reinsurance companies, Lloyd's Syndicate 2357 and Lloyd's Syndicate 2358 (collectively, the Nephila Reinsurers). The results of the Nephila Reinsurers are attributed to the Nephila Funds primarily through derivative transactions between these entities. Neither the Nephila Funds nor the Nephila Reinsurers are subsidiaries of Markel Group, and as such, these entities are not included in our consolidated financial statements.
The Nephila Reinsurers subscribe to various property, climate and specialty reinsurance contracts based on their investors' risk profiles, which include business ceded by our underwriting and program services and other fronting platforms. We write this business on behalf of our Nephila ILS operations to the extent it fits Nephila investors' risk profile and cede substantially all of the risk to Nephila Reinsurers. See note 1618 of the notes to consolidated financial statements included under Item 8 for further details regarding transactions with entities managed through our program with Syndicate 2357.Nephila operations.
Ratings
Financial stability and strength are important purchase considerations of policyholders, cedents and insurance agents and brokers. Because an insurance premium paid today purchases coverage for losses that might not be paid for many years, the financial viability of the insurer is of critical concern. Various independent rating agencies provide information and assign ratings to assist buyers in their search for financially sound insurers. Rating agencies periodically re-evaluate assigned ratings based upon changes in the insurer's operating results, financial condition or other significant factors influencing the insurer's business. ChangesDowngrades in assigned ratings and other negative actions could have an adverse impact on an insurer's ability to write new business.
Best assignsRating agencies assign financial strength ratings (FSRs) to property and casualty insurance companies, or group of companies, based on quantitative criteria such as profitability, leverage and liquidity, as well as qualitative assessments such as the spread of risk, themarket placement, business profile, adequacy and soundness of ceded reinsurance, the quality and estimated market value of assets, the adequacy of loss reserves and surplus and the competence, experience and integrity of management. Best's FSRs range from "A++" (superior) to "F" (in liquidation).
SeventeenSixteen of our eighteenseventeen insurance subsidiaries are rated by Best. All seventeen ofA.M. Best, while our insurance subsidiaries rated by Best have been assigned an FSR of "A" (excellent). Our Lloyd's syndicate is part of a group rating for the Lloyd's overall market, whichmarket. All sixteen of our insurance subsidiaries rated by A.M. Best have been assigned an FSR of "A" (excellent). The Lloyd's group has been assigned an FSR of "A" (excellent) by A.M. Best.
Nine of our eighteenseventeen insurance subsidiaries are rated by S&P.Standard & Poor's (S&P), while our Lloyd's syndicate is part of a group rating for the Lloyd's overall market. All nine of our insurance subsidiaries rated by S&P have been assigned an FSR of "A" (strong). OurThe Lloyd's syndicate is part of a group rating for the Lloyd's overall market, which has been assigned an FSR of "A+" (strong) by S&P.
Five of our eighteenseventeen insurance subsidiaries are rated by Moody's Corporation (Moody's). All five insurance subsidiaries rated by Moody's have been assigned an FSR of "A2" (good).
Investments
Our business strategy recognizesinvestment operations manage the importancecapital held within our underwriting operations, as well as capital allocated by Markel Group. Invested assets managed through our investment operations includes our portfolio of both consistentpublicly traded fixed maturity and equity securities, as well as cash and short-term investments.
Our underwriting and operating profits and superioroperations provide our investment returns to build shareholder value. We rely on sound underwriting practices to produce investable funds. The majorityoperations with steady inflows of our investable assets come from premiums paid by policyholders. Policyholderpremiums. These funds are invested predominantly in high-quality government and municipal bonds and corporate bondsmortgage-backed securities that generally match the duration and currency of our loss reserves. The balance, comprised of shareholder funds,We typically hold these investments until maturity. As a result, unrealized holding gains and losses on these securities are generally expected to reverse as the securities mature. Premiums collected through our underwriting operations may also be held as short-term investments or cash and cash equivalents to provide short-term liquidity for projected claims payments, reinsurance costs and operating expenses.
Our investments in equity securities are predominantly held within our regulated insurance subsidiaries to support capital requirements. Capital held by our insurance subsidiaries beyond that which we anticipate will be needed to cover claims payments and operating expenses is available to be invested in equity securities, which overalong with additional capital allocated for investment purposes by Markel Group. We allocate a higher percentage of capital to equity securities than most other insurance companies. Over the long run, equity securities have produced higher returns relative to fixed maturity securities and short-term investments.
When purchasing equity securities, we seek to invest in profitable companies with high returns on capital and low debt, with honest and talented management that exhibitand significant reinvestment opportunities and capital discipline, atall while paying reasonable prices.prices for those securities. We intend to hold these equity investments over the long term.long-term. We believe our long-term time horizon and internal sourcing of capital for investment provides us with a distinct competitive advantage compared to other companies. Substantially all of our investment portfolio is managed by company employees.employees, which helps minimize costs in our investment operations. The breadth of our operating businesses, and the experience we garner from supporting them, also informs and enhances the efficacy of our investment activities.
Invested assets, comprised of fixed maturity securities, equity securities, short-term investments, cash and cash equivalents and restricted cash and cash equivalents, were $30.9 billion at December 31, 2023. The following chart displays the composition of our invested assets as of December 31, 2023.

We evaluatemeasure our investment performance by analyzing net investment income earned on our investment portfolio, which reflects the recurring interest and netdividend earnings on our investment gains (losses) as well asportfolio. In 2023, our taxable equivalent total investment return, which is a non-GAAP financial measure. In 2020, net investment income was $371.8 million and$734.5 million. We also analyze net investment gains, were $618.0 million. We focuswhich include unrealized gains and losses on long-term total investment return, understandingour equity portfolio. Based on the potential for volatility in the financial markets, we understand that the level of investment gains or losses and unrealized gains or losses may vary from one period to the next. Throughnext, and therefore believe that our investment performance is best analyzed over longer periods of time. Our annual return on equity securities for the five-year period ended December 31, 2020, the five-year annual return for our investment portfolio2023 was 7.4%14.6%. See "Investing Results" under Item 7 Management's Discussion & Analysis of Financial Condition and Results of Operations for more information about our investing results, including taxable equivalent total investment return, and Item 7A Quantitative and Qualitative Disclosures About Market Risk for more information about our investments.
Markel Ventures
Through our wholly owned subsidiary Markel Ventures, Inc. (Markel Ventures), we own controlling interests in varioushigh-quality businesses that operate outsidein a variety of different industries with shared values and the specialty insurance marketplace. These businessesshared goal of positively contributing to the long-term financial performance of Markel Group. Management teams for each business operate autonomously and are viewed by management as separate and distinct from our insurance operations. Local management teams oversee theresponsible for developing strategic initiatives, managing day-to-day operations of these companies, includingand making investment and capital allocation decisions for their respective companies.
Our seniorMarkel Ventures management team is responsible for decisions regarding allocation of capital for acquisitions and new investments. Our strategy in making these investmentsacquisitions is similar to our strategy for purchasing equity securities. We seek to invest in profitable companies, with honest and talented management, that exhibit reinvestment opportunities and capital discipline, at reasonable prices. We intend to own the businesses acquired for a long period of time.
Our chief operating decision maker allocates resources to and assesses the performance of these various businesses in the aggregate as the Markel Ventures segment. This segment includes a diverse portfolio of businesses from different industries that offer various types of products and services to businesses and consumers. See note 2 of the notes to consolidated financial statements included under Item 8 for additional segment reporting disclosures.
During The Markel Ventures segment includes a diverse portfolio of specialized businesses from different industries that offer various types of products and services to businesses and consumers across many markets. All of our businesses in this segment are headquartered in the last three years,U.S., with subsidiaries of certain businesses located outside of the U.S. In 2021, our Markel Ventures operations have continued to expandexpanded through acquisitions of majority interests in various businesses, including Lansing Building Products,Metromont LLC in 2020, VSC Fire & Security, Inc. in 2019 and Brahmin Leather Works, LLC in 2018.Buckner HeavyLift Cranes. See note 3 of the notes to consolidated financial statements included under Item 8 for additional details related to these acquisitions. This follows the acquisition of Lansing Building Products, LLC in 2020 and VSC Fire & Security, Inc. in 2019. We continue to look for acquisition opportunities that align with our investment criteria and strategic objectives around diversification and specialization.
In 2020,2023, our Markel Ventures operations reported revenues of $2.8$5.0 billion, operating income of $254.1 million, net income to shareholders of $145.4$437.5 million and earnings before interest, income taxes, depreciation and amortization (EBITDA) of $366.9$628.5 million. We use Markel Ventures EBITDA, which is a non-GAAP financial measure, as an operating performance measure in conjunction with revenues, operating income and net income. See "Markel Ventures" under Item 7 Management's Discussion & Analysis of Financial Condition and Results of Operations for more information on our Markel Ventures results, including EBITDA.
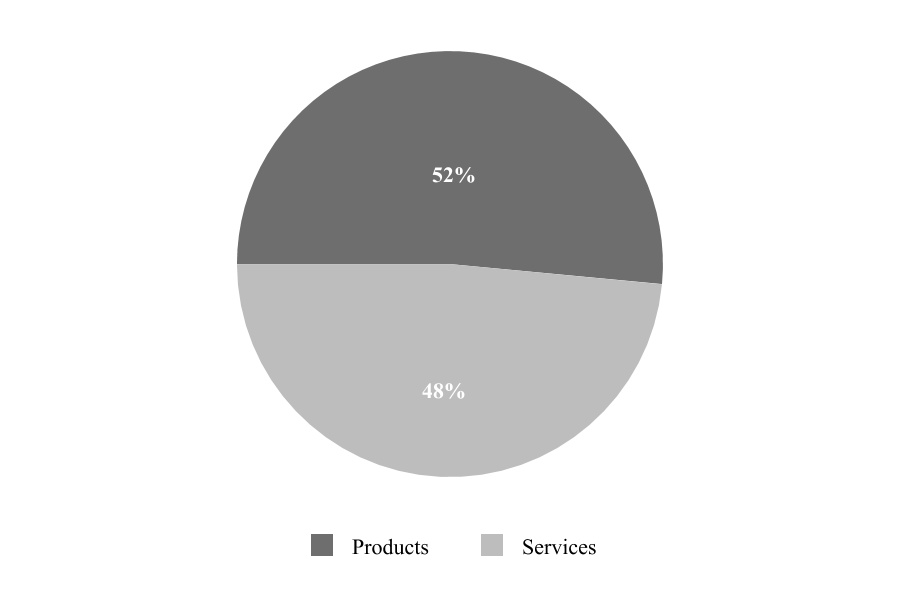
The following chart displays the types of businesses within our Markel Ventures segment based on 20202023 operating revenues.
Our Markel Ventures products group is comprisedmanagement team does not manage the Markel Ventures portfolio of businesses that manufacture or produce equipment, transportation-related products,at this level of aggregation due to the distinct characteristics of each business and consumer and building products. For example, types of products offered by businesses in this group include equipment used in baking systems and food processing, over-the-road car haulers and laminated oak and composite wood flooring used in the trucking industry as well as ornamental plants and residential homes.autonomy with which local management operates each business.

Our Markel Ventures services group is comprised of businesses that provide distribution, consulting and other types of services to businesses and consumers. For example, types of services offered by businesses in this group include distribution of exterior building products, fire protection and life safety services, management and technology consulting and retail intelligence.
The demand for manyfollowing table provides summary information about our portfolio of our Markel Ventures products and services is seasonal, with variations in revenues throughout the year depending on the industry, and cyclical based on certain larger economic trends and activity.companies by type of business.
The majority of our | | | | | | | | | | | | | | | | | | | | |
| Company | | Category | | Year Founded | | Joined Markel Group Family |
Markel Food Group - Global manufacturer and designer of industrial food equipment | | Equipment manufacturing | | 1915 | | 2005 |
ParkLand Ventures - Operator of manufactured housing communities in the U.S. | | Other | | 2008 | | 2008 |
Panel Specialists - Manufacturer of dorm room furniture and wall panel systems | | Consumer and building products | | 1990 | | 2009 |
Ellicott Dredges - Manufacturer and designer of cutter suction dredges | | Equipment manufacturing | | 1885 | | 2009 |
RetailData - Provider of retail intelligence solutions | | Consulting services | | 1988 | | 2010 |
PartnerMD - Concierge healthcare membership provider offering personalized primary care, advanced physicals, and wellness services | | Other | | 2003 | | 2011 |
Weldship - Manufacturer of industrial and specialty gas transportation and storage equipment | | Transportation-related products | | 1946 | | 2011 |
Havco - Manufacturer of laminated wood flooring for dry-van trailers, truck bodies and containers | | Transportation-related products | | 1978 | | 2012 |
Eagle - Designer and builder of single family attached and detached homes | | Consumer and building products | | 1984 | | 2013 |
Cottrell - Manufacturer of over-the-road auto hauler equipment | | Transportation-related products | | 1975 | | 2014 |
CapTech - Management and information technology consulting firm | | Consulting services | | 1997 | | 2015 |
Costa Farms - Largest producer of ornamental plants in the U.S. 4 | | Consumer and building products | | 1961 | | 2017 |
Rosemont Investment Group - Specialist investor in asset and wealth management companies | | Other | | 2018 | | 2018 |
Brahmin - Creator of fashion leather handbags | | Consumer and building products | | 1982 | | 2018 |
VSC Fire & Security - Distributor of comprehensive fire protection, life safety, and low voltage solutions | | Construction services | | 1958 | | 2019 |
Lansing Building Products - Supplier of exterior building products and materials to professional contractors | | Construction services | | 1955 | | 2020 |
Buckner Heavylift Cranes - Provider of heavylift crane rental solutions | | Construction services | | 1947 | | 2021 |
Metromont - Manufacturer of highly engineered precast concrete solutions | | Consumer and building products | | 1925 | | 2021 |
Markel Ventures businesses in this segment are headquartered across the U.S., with subsidiaries of certain businesses located outside of the U.S. This segment offers a wide range of products and services across many markets and encountersencounter a variety of competitors that vary by product line,industry, end market and geographic area. Each Markel Ventures business within the segment has several main competitors and numerous smaller ones in most of theirits respective end markets and geographic areas. Examples
Many of the end markets include U.S.businesses in this segment experience revenue fluctuations over time due to the cyclical nature of supply and international marketsdemand in their particular industry. For example, the construction industry is cyclical based on certain larger economic trends and factors, including the inflationary and interest rate environment and, for retailing, food productionsome businesses, the level of government investment. Additionally, many of our businesses experience fluctuation in demand throughout the year based on the seasonality of the products they sell or services they provide. For example, the demand for ornamental plants is particularly high during the spring and transportation,summer seasons as well as a varietycompared to the rest of U.S. markets including construction, housing, banking and financial services.the year.
4Measured by 2023 square footage of production. Greenhouse Grower's 2023 Top 100 Growers, Greenhouse Grower (May 11, 2023)
Businesses in this segment are reliant on inputs, such as raw materials and labor, to manufacture products and deliver services, and the operating results of these businesses could be impacted by the ability or inability to source these inputs and obtain price increases from customers in response to increases in the price of these inputs, including the cost of shipping. For example, shipping costs at some of our businesses increased significantly in 2022 before reverting to more typical levels in 2023, which has resulted in higher margins in 2023 compared to 2022 at the impacted businesses.
Management teams for each of our businesses proactively manage the risks and challenges posed by cyclicality, seasonality and inflation, among other things, in a variety of ways as appropriate and as needed for their business.
Regulatory Environment
We are subject to extensive U.S. state and federal, andas well as international, regulation and supervision in the jurisdictions in which we do business. Regulations vary from jurisdiction to jurisdiction. Additionally, as a company with publicly-tradedpublicly traded securities, we are also subject to certain legal and regulatory requirements applicable generally to public companies, including the rules and regulations of the U.S. Securities and Exchange Commission (SEC) and the New York Stock Exchange relating to reporting and disclosure, accounting and financial reporting, corporate governance and other matters.
The following is a summary of significant regulations that apply to our businesses, but it is not intended to be a comprehensive review of every regulation to which we are subject. For information regarding certain risks associated with regulations applicable to us,our businesses, see Item 1A Risk Factors.
U.S.Group Insurance Regulation
State Regulation
Overview. Our U.S. insurance company subsidiaries are subject to varying degrees of regulation and supervision by the states and other jurisdictions in which they do business. In the U.S., authority for the regulation, supervision and administration of the business of insurance in each state is generally delegated to a state insurance commissioner who oversees a regulatory body responsible for the supervision of the business of insurance. Through this authority, state regulatory authorities have broad regulatory, supervisory and administrative powers relating to: solvency standards; corporate conduct; market conduct activities; regulating unfair trade and claims practices; licensing of insurers; licensing and appointment of agents; approval of forms and policies used; the nature of, and limitations on, insurers' investments; the form and content of annual statements and other reports on the financial condition of insurers; and establishment of loss reserves. States also regulate various aspects of the contractual relationships between insurers and independent agents. In addition, the National Association of Insurance Commissioners (NAIC), comprised of the insurance commissioners of each U.S. jurisdiction, develops or amends model statutes and regulations that, in turn, most states adopt.Supervision
Group Supervision - Global Supervisory College; Global Common Framework. Framework. Regulators within and outside the U.S. are increasingly coordinating the regulation of multinational insurers by conducting a supervisory college. A supervisory college is a forum of the regulators having jurisdictional authority over an insurance holding company's worldwide insurance subsidiaries. The supervisory college meets with executive management to evaluate the insurance group on both a group-wide and legal-entity basis, particularly with respect to its financial data, business strategies, enterprise risk management and corporate governance. The Illinois Department of Insurance is our lead insurance regulator for purposes of conducting our supervisory college.
In 2020, the International Association of Insurance Supervisors adopted its Common Framework for the Supervision of Internationally Active Insurance Groups (ComFrame). ComFrame establishes a comprehensive framework for supervisors to address group-wide activities and risks of internationally active insurance groups (IAIGs) and lays the groundwork for better supervisory cooperation and coordination. ComFrame requires the designation of a group-wide supervisor (regulator) for each IAIG and imposes a group capital requirement that will be applied to an IAIG in addition to the current legal entity capital requirements imposed by state and international insurance regulators. In response to ComFrame, the NAICNational Association of Insurance Commissioners (NAIC) revised the model Insurance Holding Company System Regulatory Act to allow state insurance regulators in the U.S. to be designated as group-wide supervisors for U.S. based IAIGs. In 2023, it was determined that we meet the criteria to be identified as an IAIG. The Illinois Department of Insurance has been designated as our group-wide supervisor.
Holding Company StatutesStatutes. . In addition to regulatory supervision of our U.S. insurance subsidiaries, weWe also are subject to state statutes governing insurance holding company systems. Typically, those statutessystems, which typically require that we periodically file information with the appropriate state insurance commissioner, including information concerning our capital structure, ownership,
financial condition, dividend payments and other material transactions with affiliates, and general business operations. These statutes also require approval of changes in control of an insurer or an insurance holding company. Generally, "control" for these purposes is defined as ownership or voting power of 10% or more of a company's voting shares. Additional requirements include group-level reporting, submission ofWe also must submit an annual group-level enterprise risk report, by a regulated insurance company's ultimate controlling person and providingwhich provides information regarding an insurer's non-insurer affiliates.
Risk Based Capital Requirements. The NAIC uses amaterial risks within the insurance holding company system that could pose enterprise risk based capital (RBC) formula that is designed to measure the capital of an insurer taking into account the company's investments and products. RBC requirements provide a formula which, for property and casualty insurance companies, establishes capital thresholds for four categories of risk: asset risk, insurance risk, interest rate risk and business risk.
Financial Exams. State insurance regulators also prescribe the form and content of statutory financial statements, perform periodic financial examinations of insurers, set minimum reserve and loss ratio requirements, establish standards for permissible types and amounts of investments and require minimum capital and surplus levels. These statutory capital and surplus requirements include RBC rules promulgated by the NAIC.
Statutory Accounting Principles. Each of ourits U.S. insurance company subsidiaries is required to file detailed quarterly and annual reports, including financial statements, in accordance with prescribed statutory accounting rules, with regulatory officials in the jurisdictions in which they conduct business. The quarterly and annual financial reports filed with the states utilize statutory accounting principles (SAP) that are different from U.S. GAAP. In developing SAP, insurance regulators were primarily concerned with monitoring the solvency of insurance companies to assure an insurer's ability to pay all its current and future obligations to policyholders.subsidiaries.
Own Risk and Solvency Assessment and Enterprise Risk Management. We must submit an Own Risk and Solvency Assessment Summary Report (ORSA) annually to our lead insurance regulator. The ORSA is a confidential internal assessment of the material and relevant risks associated with an insurer's current business plan and the sufficiency of capital resources to support those risks. In addition, we must file an annual enterprise risk report with our lead insurance regulator. The report must identify the material risks within the insurance holding company system that could pose enterprise risk to theour U.S. insurance subsidiaries.
U.S. Insurance Regulation
State Regulation
Overview. Our U.S. insurance company subsidiaries are subject to varying degrees of regulation and supervision by the states and other jurisdictions in which they do business. In the U.S., authority for the regulation, supervision and administration of the business of insurance in each state is generally delegated to a state insurance commissioner who oversees a regulatory body responsible for the supervision of the business of insurance. State regulatory authorities have broad regulatory, supervisory and administrative powers relating to: solvency standards; corporate conduct; market conduct activities; regulating unfair trade and claims practices; licensing of insurers; licensing and appointment of agents; approval of forms and policies used; the nature of, and limitations on, insurers' investments; the form and content of annual statements and other reports on the financial condition of insurers; and establishment of loss reserves. States also regulate various aspects of the contractual relationships between insurers and independent agents. In addition, the NAIC, comprised of the insurance commissioners of each U.S. jurisdiction, develops or amends model statutes and regulations that, in turn, most states adopt.
Risk Based Capital Requirements. The NAIC uses a risk based capital (RBC) formula to measure the capital of an insurer, taking into account the company's investments and products. For property and casualty insurance companies, RBC requirements establish capital thresholds for four categories of risk: asset risk, insurance risk, interest rate risk and business risk.
Financial Exams. State insurance regulators also prescribe the form and content of statutory financial statements, perform periodic financial examinations of insurers regarding activities in their respective states, set minimum reserve and loss ratio requirements, establish standards for permissible types and amounts of investments and require minimum capital and surplus levels. These statutory capital and surplus requirements include RBC rules promulgated by the NAIC.
Statutory Accounting Principles. Each of our U.S. insurance companies is required to file detailed quarterly and annual reports, including financial statements, in accordance with prescribed statutory accounting rules. The quarterly and annual financial reports utilize statutory accounting principles (SAP) that are different from U.S. GAAP. In developing SAP, insurance regulators were primarily concerned with monitoring the solvency of insurance companies to assure an insurer's ability to pay all its current and future obligations to policyholders.
Rates and Form Filings. The policy forms and various premium rates of our U.S. admitted insurance subsidiaries are subject to regulation in every state in which they conduct business. In many states, rates and policy forms must be filed with the applicable insurance regulator prior to their use, and in some states, rates and forms must be affirmatively approved by the applicable insurance regulator prior to use.
Dividends. The laws of the domicile states of our U.S. insurance subsidiaries govern the amount of dividends that may be paid to our holding company, Markel Corporation.Group. Generally, statutes in the domicile states of our insurance subsidiaries require prior approval for payment of extraordinary, as opposed to ordinary, dividends. See note 2122 of the notes to consolidated financial statements included under Item 8.
Market Conduct. State insurance laws and regulations include numerous provisions governing trade practices and the marketplace activities of insurers, including provisions governing marketing and sales practices, data security, compliance of underwriting services to policyholders, confirmation of licensing and appointment of producers, claims management, anti-fraud controls and complaint handling. State regulatory authorities generally enforce these provisions through periodic market conduct examinations.
Investment Regulation. Investments by our U.S. insurance companies must comply with applicable laws and regulations that prescribe the kind, quality and concentration of investments. In general, these laws and regulations permit investments in federal, state and municipal obligations, corporate bonds, preferred and common equity securities, mortgage loans, real estate and certain other investments, subject to specified limits and certain other qualifications.
Cybersecurity; Data Privacy. Several states have enacted laws establishing cybersecurity requirements for financial services companies, including insurance companies, that require implementation of security measures for the monitoring, detection, prevention, mitigation and management of cybersecurity incidents. Several states also have enacted laws addressing data privacy concerns and the protection of consumer data.
Federal Regulation
The U.S. federal government and its regulatory agencies generally do not directly regulate the business of insurance. However, two federal government bodies, the Federal Insurance Office (FIO) and the Financial Stability Oversight Council (FSOC), each created under The Dodd Frank Wall Street Reform and Consumer Protection Act, may impact the regulation of insurance. Although the FIO is prohibited from directly regulating the business of insurance, it has authority to represent the U.S. in international insurance matters and has limited powers to preempt certain types of state insurance laws. The FIO also
can recommend to the FSOC that it designate an insurer as an entity posing risks to the U.S. financial stability in the event of the insurer's material financial distress or failure. We have not been so designated. The U.S. federal laws that most affect our day-to-day insurance operations are: the Gramm-Leach-Bliley Act; the Fair Credit Reporting Act; the Health Insurance Portability and Accountability Act of 1996, as amended;1996; the Terrorism Risk Insurance Act of 2002, as amended;2002; anti-money laundering laws and regulations; the Nonadmitted and Reinsurance Reform Act of 2010, as amended;2010; the Foreign Corrupt Practices Act, and the rules and regulations of the Office of Foreign Assets Control.
International Insurance Regulation
Overview. Our international insurance operations are subject to regulation and supervision in various jurisdictions. These regulations, which vary depending on the jurisdiction, include, among others, solvency and market conduct regulations; anti-corruption, anti-money laundering, and anti-terroristanti-terrorism financing guidelines, laws and regulations; various privacy, insurance, tax, tariff, trade and sanctions laws and regulations; and corporate, competition, employment, intellectual property and investment laws and regulations. Outside of the U.S., we haveOur international insurance operations are domiciled in the U.K., Europe and Bermuda whichand are subject to regulation in those jurisdictions. In addition, we conduct business in Canada, Latin America, Asia, PacificAustralia and the Middle East, where our businesses also are supervised by local regulatory authorities.
U.K. and European Regulation. We are subject to regulation by the Prudential Regulatory Authority and Financial Conduct Authority in respect of our U.K. insurance businesses. We are also subject to regulation by the Federal Financial Supervisory Authority, better known by its abbreviation BaFin, in respect of our German insurance carrier.
Our U.K. and German insurance businesses are subject to both the E.U.'s General Data Protection Regulation (GDPR) and the Solvency II. II Directive (Solvency II).
GDPR came into effect in May 2018, and requires businesses operating in the E.U., and businesses transacting with E.U. citizens, to comply with conditions for processing personal data. Following the U.K.'s exit from the E.U., GDPR was transposed into U.K. law. The E.U. has granted adequacy status to the U.K.'s data protection laws, valid until June 2025 with the possibility of renewal, meaning that they are deemed essentially equivalent to E.U. data protection laws.
Solvency II came into effect in January 2016, and requires our U.K. and German businesses to maintain certain capital standards and publish risk-related information in the form of a Solvency and Financial Condition Report. Following the U.K.'s exit from the E.U., the U.K.'s European Union (Withdrawal) Act 2018 transposes GDPR and Solvency II also was transposed into U.K. law as E.U. retained law. The U.K. government, under the Financial Services and Markets Act 2023, has opted to repeal certain portions of retained E.U. law. This repeal will occur in stages and, where necessary, after replacement regulations designed for the U.K. are in place. This repeal of retained E.U. law includes reforms to Solvency II. The Prudential Regulation Authority has consulted on the reforms, to be known as Solvency UK, which are expected to be implemented in 2024.
Bermuda Regulation. The insurance industry in Bermuda is regulated by the Bermuda Monetary Authority (BMA). Under the Bermuda Insurance Act 1978, and related regulations and standards of the BMA, each Bermuda insurance company is subject to, among other things: licensing, capital, surplus and liquidity requirements; solvency standards; restrictions on dividends and distributions; and periodic examinations of the company and its financial condition. In addition, each insurance company must obtain prior approval of ownership and transfer of shares and maintain a principal office and appoint and maintain a principal representative in Bermuda. The BMA also requires that each insurance company contract for local services, such as corporate secretary insurance manager and registered representative services, at market rates.
ILS Regulation
Our Nephila insurance-linked securities operations are subject to regulation and supervision by various regulatory authorities, both in the U.S. and internationally. Certain of our ILS subsidiaries are organized and regulated as follows:
•registered with the SEC as an investment adviser under the Investment Advisers Act of 1940, as amended,
•registered with the U.S. Commodity Futures Trading Commission as a commodity pool operator or a commodity trading advisor under the Commodity Exchange Act, as amended,and/or
•registered with the BMA as an insurance manager under the Bermuda Insurance Act 1978, and/or
•registered with the BMA as an investment manager under the Bermuda Investments Business Act 2003.1978.
Certain other ILS subsidiaries serve as the investment manager to one or more private funds that are registered with the BMA under the Investment Funds Act 2006, as amended, or the Segregated Accounts Companies Act 2000, as amended. In addition, these operations include business relationships with certain U.S., U.K. and Bermuda insurance companies that are subject to U.S. and international insurance regulation as previously described in this "Regulatory Environment" section.
As a result, subsidiaries involved in our ILS operations are subject to regulations that may impose substantive and material restrictions and requirements on their operations, including, among other things: a broader fiduciary duty to act in the best interests of their clients; disclosure of information about our businesses and conflicts of interests to clients; maintenance of written policies and procedures; maintenance of extensive books and records; restrictions on the types of fees we may charge, including performance fees; restrictions on solicitation arrangements; requirements regarding engaging in transactions with clients; maintenance of an effective compliance program; and other restrictions and requirements applicable to custody of
client assets, client privacy, advertising, pay-to-play prohibitions and cybersecurity; as well as possible sanctions, disciplinary actions or other penalties for non-compliance.
Markel Ventures Regulation
Our Markel Ventures businesses are subject to a wide variety of U.S. federal, state, and local laws and regulations, as well as international laws and regulations applicable to their international operations. Specifically, the most significant of these laws and regulations cover the following areas: safety, health, employment, the environment, transportation, U.S. and international trade, anti-corruption, data privacy and security and government contracts.
Human Capital
Our culture is our greatest asset and is defined by the Markel Style. Written in 1986, in preparation for our initial public offering, the Markel Style memorialized how we seek to operate our businesses and treat one another. It continues to provide our guiding principles across our diverse group of businesses. Key within the Markel Style is the encouragement to look for a better way to do things, to challenge management. We also seek spontaneity and flexibility and have a respect for authority, but disdain for bureaucracy. Our diverse financial holding company and each of our businesses is managed in a way to accomplish these principles. Each of our businesses operates with a high degree of autonomy so long as they operate within the principles of the Markel Style. This allows our managers to make decisions that are best for their employees and customers, as well as our shareholders. We believe this high degree of empowerment leads to the satisfaction that comes from being trusted in the responsibilities one has been given.
Further outlined in the Markel Style is our creed of honesty and fairness in all our dealings; holding the individual's right to self-determination in the highest light; putting aside individual concerns in the spirit of teamwork; and providing an atmosphere in which people can reach their full potential. We greatly value our employees, encourage their career development and reward their pursuit of excellence, while also celebrating a diverse workforce.
At December 31, 2020,2023, we had approximately 18,90021,600 employees, of whom approximately 4,6005,400 were employed within our insurance operations and approximately 14,30016,200 were employed within our Markel Ventures operations.
Insurance
Our principalspecialty insurance business, Markel, markets and underwrites specialty insurance products and within that business existsproducts. Markel has a well-developed process to ensure effective performance management, including an embedded annual and mid-year review process that enables goal setting, development planning and performance assessment. Within our insurance operations, weMarkel has also have undertaken significant work over recent years to establishestablished global leadership development programs for different levels of leadership at Markel, including partnering with various renowned business schools to create leading-edge curriculumcurricula in this area.
With the Markel Style as the foundation, Markel has identified five pillars of focus that relate to today's challenges and opportunities—diversity and inclusion, community, innovation, well-being, and recognition. This program is both company and employee led—collectively, we want to bring the values of the Markel Style to life with our actions, not just our words. The intent is to create an environment where employees are able to authentically bring their true selves to work, a place where all ideas are heard and diverse perspectives are valued, a culture that prioritizes innovation, the ability to make a difference for our local communities and the wider world, and a foundation for holding ourselves accountable for our own well-being and of those around us.
Employee health and overall well-being is also a key priority, and we provide a range of employee and eligible partner plans and programs, including health and voluntary benefits. These offerings include a variety of financial protection programs to help our employees meet their unique investment and savings needs including life insurance, retirement savings with company contributions in most situations and an employee stock purchase plan. Comprehensive employee assistance programs are available in all of our major markets along with other well-being and fitness resources.
We rely on our employees' ideas and input to help make Markel a great place to work. For example, we conductsenior leadership conducts regular pulse surveysemployee communication meetings, inclusive of employeesquestion and answer sessions, across our insurance operations regarding their well-being and provides opportunities for employees to share their ideas on how we can improve employee engagement. In addition, every two years we conduct a major, global employee engagement survey, across our insurance operations, which historically hasin early 2022 garnered more than 80%88% participation, and which enables us to identify, focus on and track progress against key engagement drivers.drivers and external norms for high performing companies. This survey has generated additional ideas for employee engagement;engagement, and we have made substantialmeaningful changes and improvements in our human capital practices based on this feedback. Plans are underway to conduct an employee engagement survey in early 2024. Additionally, Markel conducts regular pulse and employee net promoter score surveys on a departmental level across the organization throughout the year.
We are committed to embracing all aspects of diversity, including diversity of perspective, which we believe is crucial to sustainable success. Markel accordingly supports and encourages focused efforts to continue to build the diversity of our employee population and the inclusiveness of our culture. Our diversity and inclusion efforts seek to cultivate an inclusive environment in which every employee feels valued, respected and accepted. We believe this environment helps us increase creativity and innovation, foster business connections, serve our customers and maintain our market leadership.
Within our insurance business, ourMarkel's global Diversity and Inclusion (D&I) Steering Committee comprises more than 2015 senior managers from around the globe who are charged with advising on D&I strategy and providing leadership support and advocacy for our D&I efforts. We have a dedicated leader responsible for talent, diversity and inclusion,Our Human Resources leadership team works to further shape the D&I strategy for our global workforce, and to ensure the integration of our D&I efforts with our global talent acquisition and development processes. We recently introducedhave various early career programs open to a diverse range of applicants and a regional scholarship program that is focused on underrepresented groups in the insurance industry, and in late 2020, conducted unconscious bias awareness training that was completed by 79% of insurance employees globally. We are also undertaking a two-year diversity and inclusion training program, including micro learning on priority topics.groups.
Our insurance operations supportMarkel supports a range of employee-led D&I networks and resource groups, that provide employee support and development, while also engaging in community outreach, including our Markel Women's Network, BEAM (Black Engagement at Markel), PRISM (LGBTQ+), Jitneys (Young Professionals), Markel Asian Professionals Network, Markel Veterans Network, sponsorship of Dive-In (the insurance industry's annual diversityUN1DOS (Latin and inclusion festival)Hispanic Network), and across our international operations, an Inclusion Network with connections withto a number of the London market partner networks. All of these networks and organizations have put in place goals and programming that are focused on education and development, community engagement, talent acquisition and networking/support. Additionally, we continue our global sponsorship of Dive-In, the insurance industry's annual diversity and inclusion festival.
Markel Ventures
Our Markel Ventures operations are comprised of a diverse portfolio of businesses from different industries through which we own controlling interests. The Markel Ventures operations are viewed by management as separate and distinct from our insurance operations with local management teams that overseedirect the strategy and day-to-day operations of their respective companies, including human capital matters. When making these acquisitions, we seek, among other things, businesses whose leadership teams demonstrate equal measures of both integrity and talent. As a result, each Markel Ventures business fosters a culture within their operations, and with their employees, that aligns with the principles of the Markel Style.
Item 1A. RISK FACTORS
A wide range of factors could materially affect our future prospects and performance. The matters addressed under "Safe Harbor and Cautionary Statement," "Developments Related to COVID-19," and "Critical Accounting Estimates" in Item 7 Management's Discussion and Analysis of Financial Condition and Results of Operations, including under "Safe Harbor and Cautionary Statement" and "Critical Accounting Estimates", and Item 7A Quantitative and Qualitative Disclosures About Market Risk, andas well as other information included or incorporated in this report, describe many of the significant risks that could affect our businesses, results of operations and financial results.condition. We are also subject to the following risks.risks discussed below.
One or more of the risks discussed in this Item 1A. Risk Factors, and others we cannot anticipate, could have material adverse effects on our results of operations and financial condition; and the extent of these effects will depend, at least in part, on the scope, severity, frequency or duration of the specific event or circumstance. In addition, we may take steps to prevent, mitigate or manage potential risks or liabilities, and related developments, and some of those steps may have a material adverse effect on our results of operations and financial condition. Even if an unfavorable outcome does not materialize, these factors, and actions we may take in response, may have a material adverse impact on our reputation or result in substantial expense and disruption.
Headings and sub-headings for the Risk Factors below are for reference purposes only and are not intended to limit or affect in any way the meaning or scope of each Risk Factor.
Risks Primarily Related to Our Insurance OperationsCeded Reinsurance
Loss ExposuresIn a reinsurance transaction, an insurance company transfers, or cedes, all or part of its exposure in return for a premium. In a retrocessional reinsurance transaction, a reinsured exposure is further ceded to another reinsurer. Within our underwriting operations, we seek to retain as much of our profitable business as possible while managing volatility within our underwriting results and capital requirements at our insurance subsidiaries. We purchase reinsurance and retrocessional reinsurance to manage our net retention on individual risks and overall exposure to losses, while providing us with the ability to offer policies with sufficient limits to meet policyholder needs. This includes purchasing sufficient coverage for our catastrophe-exposed policies to ensure that our net retained catastrophe risk is within our corporate tolerances. The structure of our reinsurance purchases may vary from year to year depending on our risk tolerance and the availability and cost of reinsurance, as determined by current market conditions. In such instances, we may in turn modify our gross premium writings to manage our overall net loss exposures. Net retention of gross premium volume in our underwriting segments was 82% in 2023.
Ceded reinsurance and retrocessional contracts do not legally discharge us from our primary liability for the full amount of the policies, and we will be required to pay the loss and bear collection risk if the reinsurer fails to meet its obligations under the reinsurance agreement. We attempt to minimize credit exposure to reinsurers through adherence to internal ceded reinsurance guidelines. We manage our exposures so that no unsecured exposure to any one reinsurer is material to our ongoing business. Treaties typically contain provisions that allow us to demand that a reinsurer post letters of credit or assets as collateral if a reinsurer becomes an unauthorized reinsurer under applicable regulations or if its rating falls below an acceptable level.
2Market Segment Report - Global Reinsurance, A.M. Best (August 22, 2023)
3Offshore Reinsurance in the U.S. Market, Reinsurance Association of America (2022)
See note 12 of the notes to consolidated financial statements included under Item 8 and Item 7A Quantitative and Qualitative Disclosures About Market Risk for additional information about our ceded reinsurance programs and exposures.
Competition and Underwriting Philosophy
We compete with numerous domestic and international insurance companies and reinsurers, Lloyd's syndicates, risk retention groups, insurance buying groups, risk securitization programs, alternative capital sources, such as that provided through ILS, and alternative self-insurance mechanisms. We also compete with new companies that continue to be formed to enter the insurance and reinsurance markets, particularly companies with new or "disruptive" technologies or business models. Competition may take the form of lower prices, broader coverages, greater product flexibility, enhanced digital capabilities for distribution of insurance products, higher coverage limits, higher quality services or higher ratings by independent rating agencies. In all of our markets, we compete on the basis of overall financial strength, ratings assigned by independent rating agencies, development of specialty products to satisfy well-defined market needs and by maintaining relationships with agents, brokers and insureds who rely on our expertise. This expertise is our principal means of competing. We offer a diverse portfolio of products, each with its own distinct competitive environment, which requires us to be responsive to changes in market conditions for individual product lines. With each of our products, we seek to write business that produces consistent underwriting profits by maintaining adequate rates for our premium writings in relation to expected loss cost trends.
Few barriers exist to prevent competition from entering our markets within the property and casualty industry. Market conditions, risk tolerance and capital capacity influence the degree of competition at any point in time. During periods of excess underwriting capacity, as defined by availability of capital, competition can result in lower pricing and less favorable policy terms and conditions for insurers. During periods of reduced underwriting capacity, pricing and policy terms and conditions are generally more favorable for insurers. Historically, the performance of the property and casualty insurance and reinsurance industries has tended to fluctuate in cyclical periods of price competition and excess underwriting capacity, followed by periods of high premium rates and shortages of underwriting capacity. At any given time, our portfolio of insurance products could be experiencing varying combinations of these characteristics.
Within our underwriting operations, we seek to earn an underwriting profit every year. The property and casualty insurance industry commonly defines underwriting profit or loss as earned premiums net of losses and loss adjustment expenses and underwriting, acquisition and insurance expenses. We believe that the ability to achieve consistent underwriting profits demonstrates knowledge and expertise, commitment to superior customer service and the ability to manage insurance risk. We use underwriting profit or loss as a basis for evaluating our underwriting performance. The combined ratio is a measure of underwriting performance and represents the relationship of incurred losses, loss adjustment expenses and underwriting, acquisition and insurance expenses to earned premiums. A combined ratio less than 100% indicates an underwriting profit, while a combined ratio greater than 100% reflects an underwriting loss. In 2023, our combined ratio was 98%. See Item 7 Management's Discussion & Analysis of Financial Condition and Results of Operations for a discussion of our underwriting results.
We routinely review the pricing for all of our product lines. When we believe the prevailing market price will not support our underwriting profit targets, the business is not written. As a result of our underwriting discipline, gross premium volume may vary when we alter our product offerings to maintain or improve underwriting profitability. For example, in 2023, we adjusted our writings within our U.S. and Bermuda directors and officers and errors and omissions product lines in our Insurance segment in response to unfavorable loss cost trends and downward pressure on rates.
Underwriting Segments
We monitor and assess the performance of our ongoing underwriting operations on a global basis in the following two segments: Insurance and Reinsurance. See note 2 of the notes to consolidated financial statements included under Item 8 for additional segment reporting disclosures.
Insurance Segment
Our Insurance segment reported gross premium volume of $9.2 billion, earned premiums of $7.3 billion and an underwriting profit of $162.2 million in 2023. The following chart presents the composition of our Insurance segment by division based on 2023 gross premium volume.
The Markel Specialty division is comprised of our U.S. and Bermuda based insurance underwriting operations and writes business for insureds ranging from individuals and small businesses to Fortune 1000 companies in the U.S., the U.K., the E.U., Asia and Australia. The Markel Specialty platform provides easy access to our diverse portfolio of products and capabilities. The Markel International division writes business worldwide from our London and Munich-based platforms, which include branch offices in Canada, Asia, Australia and across the E.U. The State National division writes collateral protection insurance for automobile and other vehicle loans in the U.S.
The following chart displays the types of products written in our Insurance segment based on 2023 gross premium volume.
General liability product offerings include a variety of primary and excess liability coverages. We focus on businesses in the construction, life sciences, energy, medical, healthcare, pharmaceutical, professional services, social welfare, recreational, transportation, heavy industrial and hospitality industries. Specific products include primary general liability, excess and umbrella products, products liability products, environmental liability products and casualty facultative reinsurance written for individual casualty risks.
Our professional liability product lines provide insurance solutions for small, middle market and risk management accounts with coverage that is tailored to their exposures and needs. Professional liability coverages include errors and omissions, directors and officers, cyber, employment practices liability, professional indemnity, transaction liability, intellectual property and union liability. Errors and omissions coverage provides solutions for specialized professions including lawyers, accountants, agents and brokers, service technicians and consultants, as well as other less-specialized professionals. Directors and officers coverage is provided for publicly-traded, private and non-profit companies, including financial institutions and Fortune 1000 companies. We also offer claims-made professional liability coverage for individual healthcare providers and coverages for medical facilities.
Personal lines products provide first and third-party coverages in the U.S. for classic cars, motorcycles and a variety of personal watercraft, including vintage boats, high-performance boats and yachts and recreational vehicles, such as motorcycles, snowmobiles and ATVs. Additionally, property coverages are offered for homeowners that do not qualify for standard homeowner's coverage, as well as personal umbrella coverage.
Marine and energy products include a portfolio of coverages for cargo, energy, hull, liability, war and terrorism risks worldwide. The cargo product line is an international transit-based book providing coverage for many types of cargo. Energy coverage includes all aspects of oil, gas and renewable energy activities. Our renewable energy activities include coverages for onshore and offshore wind farms, as well as alternative energy generation and storage technology projects. Hull coverages consist of coverage for physical damage to ocean-going tonnage, yachts and mortgagees' interests. Liability coverage provides coverage for a broad range of energy liabilities, as well as traditional marine exposures including charterers, terminal operators and ship repairers. Marine war coverage includes protections for the hulls of ships, and other related interests, against war and associated perils. Terrorism coverage includes coverage for property damage and business interruption related to political and civil violence and war on land.
Property coverages consist principally of fire, allied lines (including windstorm, hail and water damage) and other specialized property coverages, including catastrophe-exposed property risks such as earthquake and wind on both a primary and excess basis. Catastrophe-exposed property risks can present higher severity than more standard property risks due to the impacts from earthquakes and severe weather events such as hurricanes, convective storms and wildfires. Our property coverages are exposed to windstorm losses that, based on the seasonal nature of those events, are more likely to occur in the third and fourth quarters of the year. Our property risks range from small, single-location accounts to large, multi-state, multi-location, multi-national accounts on a worldwide basis. Other types of property products include inland marine products, railroad-related products and specie coverage for fine art on exhibition and in private collections.
Specialty programs business is offered in the U.S. on a standalone or package basis and generally targets specialized commercial markets and various customer groups, such as amateur sports and fitness clubs. Certain specialty programs written in this segment use managing general agents to offer single source admitted and non-admitted programs for a specific industry, class or line of business.
Workers' compensation products are offered in the U.S. and provide wage replacement and medical benefits to employees injured in the course of employment and target main-street, service and artisan contractor businesses, retail stores and restaurants.
Credit and surety products consist primarily of trade credit and prepayment coverage and a range of bonds and guarantees that support contractual obligations, as well as other coverages for specific credit risks, markets and contingencies. Key credit risks covered include those of counterparty insolvency and defaults by government-owned entities. The key coverages under surety products include contractual performance and payment risks, commercial license and permit obligations and obligations related to judicial proceedings such as court and fiduciary bonds.
Other product lines within the Insurance segment primarily include collateral protection insurance, which insures personal automobiles and other vehicles held as collateral for loans made by credit unions, banks and specialty finance companies.
Reinsurance Segment
Our Reinsurance segment product offerings are underwritten primarily by our Global Reinsurance division, which operates from platforms in the U.S., Bermuda and the U.K. We write quota share and excess of loss reinsurance on a local, national and global basis. Our Reinsurance segment reported gross premium volume of $1.0 billion, earned premiums of $1.0 billion and an underwriting loss of $19.3 million in 2023. The following chart displays the types of products written in our Reinsurance segment based on 2023 gross premium volume.
General liability reinsurance primarily consists of umbrella and excess casualty products, as well as environmental liability products covering pollution legal liability and contractors' pollution exposures.
Our specialty treaty reinsurance products are written across a wide range of specialty product lines, primarily consisting of the following:
We may experience losses•Credit and surety products, including structured and whole turnover credit, political risk and contract and commercial surety reinsurance programs covering worldwide exposures;
•Workers' compensation and accident and health products covering both standard and catastrophe-exposed business in the U.S. and worldwide;
•Marine and energy products covering both offshore and onshore marine, energy and renewable energy risks on a worldwide basis, including hull, cargo and liability;
•Public entity reinsurance products offering casualty coverage for municipalities, schools, special districts, public housing authorities and public entity affiliated non-profits;
•Mortgage default insurance offering coverage for private mortgage insurers predominantly located in the U.S. and Australia;
•Aviation and space coverage, including major risk, general aviation, satellite launch and orbit;
•Agriculture reinsurance covering multi-peril crop insurance, hail and related exposures for risks located in the U.S. and Canada; and
•Discrete political violence and national terror pools in select jurisdictions globally.
Professional liability reinsurance primarily consists of the following:
•Transaction liability, which provides representation, warranty and indemnity coverage for mergers and acquisitions, including coverage for tax and contingent liability;
•Directors and officers liability for publicly-traded, private and non-profit companies;
•Cyber and technology errors and omissions covering both first and third-party exposures;
•Errors and omissions for lawyers, accountants, agents and brokers, services technicians and consultants; and
•Healthcare liability for physicians, hospitals, long-term care and other medical facilities.
Program Services and Other Fronting
Our program services and other fronting business generates fee income in the form of ceding fees in exchange for fronting insurance and reinsurance business for other insurance carriers (capacity providers). In general, fronting refers to business in which we write insurance on behalf of a general agent or disruptions from catastrophes. Ascapacity provider and then cede all, or substantially all, of the risk under these policies to the capacity provider in exchange for ceding fees. The results of our program services and other fronting operations are not included in a company with significantreportable segment.
Our program services business, which is provided through our State National division, offers issuing carrier capacity to both specialty managing general agents and other producers who sell, control and administer books of insurance business that are supported by third parties that assume reinsurance risk, including the Nephila Reinsurers. These reinsurers include domestic and foreign insurers and institutional risk investors that want to access specific lines of U.S. property and casualty insurance business but may not have the required licenses, filings or financial strength ratings to do so.
Beginning in 2024, our State National division is expanding internationally through a partnership with our Markel International division to create an international program services division to serve managing general agents in the U.K. market. The new division is another example of how we can leverage our array of capabilities to effectively and efficiently connect capital with risk.
Through our program services business, we write a wide variety of insurance and reinsurance products, principally including general liability, commercial liability, commercial multi-peril, property and workers' compensation. Program services business written through our State National division is separately managed from our underwriting divisions, which may write similar products, in order to protect our program services customers.
The following table summarizes the subsidiaries through which our program services business is written.
| | | | | | | | | | | | | | |
| Legal Entity | | Abbreviation | | State of Domicile |
| City National Insurance Company | | CNIC | | Texas |
| National Specialty Insurance Company | | NSIC | | Texas |
| Pinnacle National Insurance Company | | PNIC | | Texas |
| State National Insurance Company, Inc. | | SNIC | | Texas |
| Superior Specialty Insurance Company | | SSIC | | Delaware |
| United Specialty Insurance Company | | USIC | | Delaware |
Through these subsidiaries, our program services business is licensed or authorized to write business in all 50 states and the District of Columbia. Many of our programs are arranged with the assistance of brokers that are seeking to provide customized insurance solutions for specialty insurance business that requires a carrier rated "A" by A.M. Best Company (A.M. Best). Our specialized business model relies on third-party producers or capacity providers to provide policy administration, claims handling, cash handling, underwriting, or other traditional insurance company services. We compete primarily on the basis of price, customer service, financial strength ratings, licenses, reputation, business model and experience.
Total revenues attributed to our program services business for the year ended December 31, 2023 were $151.8 million. Our program services business generated $2.9 billion of gross written premium volume for the year ended December 31, 2023.
In our program services business, we enter into reinsurance agreements whereby we cede to the capacity providers 100% of the premium written and substantially all of our gross liability under all policies issued by and on behalf of us by the producer. As a result of our contract design, substantially all of the underwriting risk and operational risk inherent in the arrangement is borne by the capacity providers.
Our contracts with capacity providers do not legally discharge us from our primary liability for the full amount of the policies, and we will be required to pay the loss and bear collection risk if a capacity provider fails to meet its obligations under the reinsurance agreement. As a result, we remain exposed to the credit risk of capacity providers, including the risk that one of our capacity providers becomes insolvent or is otherwise unable or unwilling to pay policyholder claims. We mitigate this credit risk generally by either selecting well capitalized, highly rated authorized capacity providers or requiring that the capacity provider post substantial collateral to secure the reinsured risks, which, in some instances, exceeds the related reinsurance recoverable.
In our other fronting business, we leverage the strength of our underwriting platform, including our highly rated insurance subsidiaries, to write business on behalf of our Nephila ILS operations, we may experience lossesin exchange for ceding fees, to support its business plans and assist in meeting its desired return objectives. Our other fronting business is managed separately from man-made or natural catastrophes. Catastrophes include, butour program services business. The results of our other fronting business are not limitedincluded in a reportable segment. Total revenues attributed to windstorms, hurricanes, earthquakes, tornadoes, derechos, hail, severe winter weatherour other fronting business for the year ended December 31, 2023 were $20.7 million. Our other fronting business generated $840.9 million of gross written premium volume for the year ended December 31, 2023.
Business written on behalf of our Nephila ILS operations within both our program services and wildfiresother fronting operations primarily consists of catastrophe-exposed property insurance and may include pandemicsreinsurance business, as well as specialty and events relatedclimate reinsurance business. The business written is ceded to terrorism, riots and political and civil unrest. Whilethe Nephila Reinsurers, whose investors ultimately assume the risk. To mitigate credit risk for this business, we employ catastrophe modeling toolsrequire collateral up to a specified level of annual aggregate agreement year losses, which is held in a trust for which we are the beneficiary. See note 18 of the notes to consolidated financial statements included under Item 8 for further details regarding our programs with Nephila Reinsurers.
Although we reinsure substantially all of the risks inherent in our program services and other fronting businesses, we have certain programs that contain limits on our reinsurers' obligations to us that expose us to underwriting process, we cannot predict how severe a potential catastrophe will be before it occurs. The extent of losses from catastrophes is a functionrisk, including loss ratio caps, aggregate reinsurance limits or exclusion of the total amountcredit risk of producers. Under certain programs, including programs and contracts with Nephila Reinsurers, we also bear underwriting risk for annual aggregate agreement year losses incurred,in excess of a limit that we believe is unlikely to be exceeded.
Insurance-Linked Securities
Our insurance-linked securities operations are primarily comprised of our Nephila operations and are not included in a reportable segment. Nephila Holdings Ltd. (together with its subsidiaries, Nephila) provides investment and insurance management services through which we offer alternative capital to the number of insureds affected,insurance and reinsurance markets while providing investors with investment strategies that typically are uncorrelated with traditional asset classes. We receive management fees for investment and insurance management services provided through these operations, and for certain funds, incentive fees based on their annual performance. Our management fees are based on the frequency and severitynet asset value of the events, the effectivenessaccounts managed for most of our funds and gross premium volume for the remaining funds. Total revenues from our insurance-linked securities operations for the year ended December 31, 2023 were $99.5 million. As of December 31, 2023, Nephila's net assets under management were $6.8 billion.
Our fund management operations provide insurance and investment management services for a broad range of investment products for insurance and reinsurance companies, government entities, banks, hedge funds, pension funds and institutional investors, including insurance-linked securities such as catastrophe bonds, insurance swaps, traditional reinsurance contracts, industry loss warranties and other financial instruments. Nephila serves as the investment manager to several Bermuda based private funds (the Nephila Funds). To provide access for the Nephila Funds to a variety of insurance-linked securities in the property catastrophe, climate and specialty markets, Nephila acts as an insurance manager to certain Bermuda Class 3, collateralized and special purpose reinsurance companies, Lloyd's Syndicate 2357 and Lloyd's Syndicate 2358 (collectively, the Nephila Reinsurers). The results of the Nephila Reinsurers are attributed to the Nephila Funds primarily through derivative transactions between these entities. Neither the Nephila Funds nor the Nephila Reinsurers are subsidiaries of Markel Group, and as such, these entities are not included in our consolidated financial statements.
The Nephila Reinsurers subscribe to various property, climate and specialty reinsurance contracts based on their investors' risk managementprofiles, which include business ceded by our underwriting and program services and other fronting platforms. We write this business on behalf of our Nephila ILS operations to the extent it fits Nephila investors' risk profile and cede substantially all of the risk to Nephila Reinsurers. See note 18 of the notes to consolidated financial statements included under Item 8 for further details regarding transactions with entities managed through our Nephila operations.
Ratings
Financial stability and strength are important considerations of policyholders, cedents and insurance agents and brokers. Because an insurance premium paid today purchases coverage for losses that might not be paid for many years, the financial viability of the insurer is of critical concern. Various independent rating agencies provide information and assign ratings to assist buyers in their search for financially sound insurers. Rating agencies periodically re-evaluate assigned ratings based upon changes in the insurer's operating results, financial condition or other significant factors influencing the insurer's business. Downgrades in assigned ratings and other negative actions could have an adverse impact on an insurer's ability to write new business.
Rating agencies assign financial strength ratings (FSRs) to property and casualty insurance companies, or group of companies, based on quantitative criteria such as profitability, leverage and liquidity, as well as qualitative assessments such as market placement, business profile, adequacy and soundness of ceded reinsurance, quality and estimated market value of assets, adequacy of loss reserves and surplus and competence, experience and integrity of management.
Sixteen of our reinsurance coverage. Most catastrophes occur overseventeen insurance subsidiaries are rated by A.M. Best, while our Lloyd's syndicate is part of a small geographic area; however, some catastrophes may produce significant damage in large, heavily populated areas. In addition, catastrophes may have a material adverse effect ongroup rating for the investment management and incentive fees earned by our ILS operations and returns on our investments in ILS funds. Catastrophes also may result in significant disruptions inLloyd's overall market. All sixteen of our insurance and othersubsidiaries rated by A.M. Best have been assigned an FSR of "A" (excellent). The Lloyd's group has been assigned an FSR of "A" (excellent) by A.M. Best.
Nine of our seventeen insurance subsidiaries are rated by Standard & Poor's (S&P), while our Lloyd's syndicate is part of a group rating for the Lloyd's overall market. All nine of our insurance subsidiaries rated by S&P have been assigned an FSR of "A" (strong). The Lloyd's group has been assigned an FSR of "A+" (strong) by S&P.
Five of our seventeen insurance subsidiaries are rated by Moody's Corporation (Moody's). All five insurance subsidiaries rated by Moody's have been assigned an FSR of "A2" (good).
Investments
Our investment operations manage the capital held within our underwriting operations, as well as capital allocated by Markel Group. Invested assets managed through our investment operations includes our portfolio of publicly traded fixed maturity and equity securities, as well as cash and short-term investments.
Our underwriting operations provide our investment operations with steady inflows of premiums. These funds are invested predominantly in high-quality government and municipal bonds and mortgage-backed securities that generally match the duration and currency of our loss reserves. We typically hold these investments until maturity. As a result, unrealized holding gains and losses on these securities are generally expected to reverse as the securities mature. Premiums collected through our underwriting operations may also be held as short-term investments or cash and cash equivalents to provide short-term liquidity for projected claims payments, reinsurance costs and operating expenses.
Our investments in equity securities are predominantly held within our regulated insurance subsidiaries to support capital requirements. Capital held by our insurance subsidiaries beyond that which we anticipate will be needed to cover claims payments and operating expenses is available to be invested in equity securities, along with additional capital allocated for investment purposes by Markel Group. We allocate a higher percentage of capital to equity securities than most other insurance companies. Over the long run, equity securities have produced higher returns relative to fixed maturity securities and short-term investments.
When purchasing equity securities, we seek to invest in profitable companies with high returns on capital and low debt, with honest and talented management and significant reinvestment opportunities and capital discipline, all while paying reasonable prices for those securities. We intend to hold these equity investments over the long-term. We believe our long-term time horizon and internal sourcing of capital for investment provides us with a distinct competitive advantage compared to other companies. Substantially all of our investment portfolio is managed by company employees, which helps minimize costs in our investment operations. The breadth of our operating businesses, and the experience we garner from supporting them, also informs and enhances the efficacy of our investment activities.
Invested assets, comprised of fixed maturity securities, equity securities, short-term investments, cash and cash equivalents and restricted cash and cash equivalents, were $30.9 billion at December 31, 2023. The following chart displays the composition of our invested assets as of December 31, 2023.
We measure our investment performance by analyzing net investment income earned on our investment portfolio, which reflects the recurring interest and assets. If climate change results in an increasedividend earnings on our investment portfolio. In 2023, our net investment income was $734.5 million. We also analyze net investment gains, which include unrealized gains and losses on our equity portfolio. Based on the potential for volatility in the frequency and/financial markets, we understand that the level of gains or severitylosses may vary from one period to the next, and therefore believe that our investment performance is best analyzed over longer periods of weather-related catastrophes,time. Our annual return on equity securities for the five-year period ended December 31, 2023 was 14.6%.
Markel Ventures
Through our wholly owned subsidiary Markel Ventures, Inc. (Markel Ventures), we may experienceown controlling interests in high-quality businesses that operate in a variety of different industries with shared values and the shared goal of positively contributing to the long-term financial performance of Markel Group. Management teams for each business operate autonomously and are responsible for developing strategic initiatives, managing day-to-day operations and making investment and capital allocation decisions for their respective companies. Our Markel Ventures management team is responsible for decisions regarding allocation of capital for acquisitions and new investments. Our strategy in making these acquisitions is similar to our strategy for purchasing equity securities. We seek to invest in profitable companies, with honest and talented management, that exhibit reinvestment opportunities and capital discipline, at reasonable prices. We intend to own the businesses acquired for a long period of time.
Our chief operating decision maker allocates resources to and assesses the performance of these various businesses in the aggregate as the Markel Ventures segment. See note 2 of the notes to consolidated financial statements included under Item 8 for additional or elevated catastrophe-related losses or disruptions,segment reporting disclosures. The Markel Ventures segment includes a diverse portfolio of specialized businesses from different industries that offer various types of products and services to businesses and consumers across many markets. All of our businesses in this segment are headquartered in the U.S., with subsidiaries of certain businesses located outside of the U.S. In 2021, our Markel Ventures operations expanded through acquisitions of majority interests in Metromont LLC and Buckner HeavyLift Cranes. See note 3 of the notes to consolidated financial statements included under Item 8 for additional details related to these acquisitions. This follows the acquisition of Lansing Building Products, LLC in 2020 and VSC Fire & Security, Inc. in 2019. We continue to look for acquisition opportunities that align with our investment criteria and strategic objectives around diversification and specialization.
In 2023, our Markel Ventures operations reported revenues of $5.0 billion, operating income of $437.5 million and earnings before interest, income taxes, depreciation and amortization (EBITDA) of $628.5 million. We use Markel Ventures EBITDA, which may be material.is a non-GAAP financial measure, as an operating performance measure in conjunction with operating income. See "Markel Ventures" under Item 7 Management's Discussion & Analysis of Financial Condition and Results of Operations for more information on our Markel Ventures results, including EBITDA.
The following chart displays the types of businesses within our Markel Ventures segment based on 2023 operating revenues. Our Markel Ventures management team does not manage the Markel Ventures portfolio of businesses at this level of aggregation due to the distinct characteristics of each business and the autonomy with which local management operates each business.
The failurefollowing table provides summary information about our portfolio of anyMarkel Ventures companies by type of business.
| | | | | | | | | | | | | | | | | | | | |
| Company | | Category | | Year Founded | | Joined Markel Group Family |
Markel Food Group - Global manufacturer and designer of industrial food equipment | | Equipment manufacturing | | 1915 | | 2005 |
ParkLand Ventures - Operator of manufactured housing communities in the U.S. | | Other | | 2008 | | 2008 |
Panel Specialists - Manufacturer of dorm room furniture and wall panel systems | | Consumer and building products | | 1990 | | 2009 |
Ellicott Dredges - Manufacturer and designer of cutter suction dredges | | Equipment manufacturing | | 1885 | | 2009 |
RetailData - Provider of retail intelligence solutions | | Consulting services | | 1988 | | 2010 |
PartnerMD - Concierge healthcare membership provider offering personalized primary care, advanced physicals, and wellness services | | Other | | 2003 | | 2011 |
Weldship - Manufacturer of industrial and specialty gas transportation and storage equipment | | Transportation-related products | | 1946 | | 2011 |
Havco - Manufacturer of laminated wood flooring for dry-van trailers, truck bodies and containers | | Transportation-related products | | 1978 | | 2012 |
Eagle - Designer and builder of single family attached and detached homes | | Consumer and building products | | 1984 | | 2013 |
Cottrell - Manufacturer of over-the-road auto hauler equipment | | Transportation-related products | | 1975 | | 2014 |
CapTech - Management and information technology consulting firm | | Consulting services | | 1997 | | 2015 |
Costa Farms - Largest producer of ornamental plants in the U.S. 4 | | Consumer and building products | | 1961 | | 2017 |
Rosemont Investment Group - Specialist investor in asset and wealth management companies | | Other | | 2018 | | 2018 |
Brahmin - Creator of fashion leather handbags | | Consumer and building products | | 1982 | | 2018 |
VSC Fire & Security - Distributor of comprehensive fire protection, life safety, and low voltage solutions | | Construction services | | 1958 | | 2019 |
Lansing Building Products - Supplier of exterior building products and materials to professional contractors | | Construction services | | 1955 | | 2020 |
Buckner Heavylift Cranes - Provider of heavylift crane rental solutions | | Construction services | | 1947 | | 2021 |
Metromont - Manufacturer of highly engineered precast concrete solutions | | Consumer and building products | | 1925 | | 2021 |
Markel Ventures businesses encounter a variety of competitors that vary by industry, end market and geographic area. Each Markel Ventures business has several main competitors and numerous smaller ones in most of its respective end markets and geographic areas.
Many of the methods we employbusinesses in this segment experience revenue fluctuations over time due to managethe cyclical nature of supply and demand in their particular industry. For example, the construction industry is cyclical based on certain larger economic trends and factors, including the inflationary and interest rate environment and, for some businesses, the level of government investment. Additionally, many of our loss exposures could have a material adverse effectbusinesses experience fluctuation in demand throughout the year based on us.the seasonality of the products they sell or services they provide. For example, the demand for ornamental plants is particularly high during the spring and summer seasons as compared to the rest of the year.
4 We seekMeasured by 2023 square footage of production. Greenhouse Grower's 2023 Top 100 Growers, Greenhouse Grower (May 11, 2023)
Businesses in this segment are reliant on inputs, such as raw materials and labor, to manufacture products and deliver services, and the operating results of these businesses could be impacted by the ability or inability to source these inputs and obtain price increases from customers in response to increases in the price of these inputs, including the cost of shipping. For example, shipping costs at some of our businesses increased significantly in 2022 before reverting to more typical levels in 2023, which has resulted in higher margins in 2023 compared to 2022 at the impacted businesses.
Management teams for each of our businesses proactively manage our loss exposuresthe risks and challenges posed by cyclicality, seasonality and inflation, among other things, in a variety of ways as appropriate and as needed for their business.
Regulatory Environment
We are subject to extensive U.S. state and federal, as well as international, regulation and supervision in the jurisdictions in which we do business. Regulations vary from jurisdiction to jurisdiction. Additionally, as a company with publicly traded securities, we are also subject to certain legal and regulatory requirements applicable generally to public companies, including adheringthe rules and regulations of the U.S. Securities and Exchange Commission (SEC) and the New York Stock Exchange relating to maximumreporting and disclosure, accounting and financial reporting, corporate governance and other matters.
The following is a summary of significant regulations that apply to our businesses, but it is not intended to be a comprehensive review of every regulation to which we are subject. For information regarding certain risks associated with regulations applicable to our businesses, see Item 1A Risk Factors.
Group Insurance Regulation and Supervision
Group Supervision - Global Supervisory College; Global Common Framework. Regulators within and outside the U.S. are increasingly coordinating the regulation of multinational insurers by conducting a supervisory college. A supervisory college is a forum of the regulators having jurisdictional authority over an insurance holding company's worldwide insurance subsidiaries. The supervisory college meets with executive management to evaluate the insurance group on both a group-wide and legal-entity basis, particularly with respect to its financial data, business strategies, enterprise risk management and corporate governance. The Illinois Department of Insurance is our lead insurance regulator for purposes of conducting our supervisory college.
In 2020, the International Association of Insurance Supervisors adopted its Common Framework for the Supervision of Internationally Active Insurance Groups (ComFrame). ComFrame establishes a comprehensive framework for supervisors to address group-wide activities and risks of internationally active insurance groups (IAIGs) and lays the groundwork for better supervisory cooperation and coordination. ComFrame requires the designation of a group-wide supervisor (regulator) for each IAIG and imposes a group capital requirement that will be applied to an IAIG in addition to the current legal entity capital requirements imposed by state and international insurance regulators. In response to ComFrame, the National Association of Insurance Commissioners (NAIC) revised the model Insurance Holding Company System Regulatory Act to allow state insurance regulators in the U.S. to be designated as group-wide supervisors for U.S. based IAIGs. In 2023, it was determined that we meet the criteria to be identified as an IAIG. The Illinois Department of Insurance has been designated as our group-wide supervisor.
Holding Company Statutes. We also are subject to state statutes governing insurance holding company systems, which typically require that we periodically file information with the appropriate state insurance commissioner, including information concerning our capital structure, ownership, financial condition, dividend payments and other material transactions with affiliates, and general business operations. These statutes also require approval of changes in control of an insurer or an insurance holding company. Generally, "control" for these purposes is defined as ownership or voting power of 10% or more of a company's voting shares. We also must submit an annual group-level enterprise risk report, which provides information regarding material risks within the insurance holding company system that could pose enterprise risk to its U.S. insurance subsidiaries.
Own Risk and Solvency Assessment and Enterprise Risk Management. We must submit an Own Risk and Solvency Assessment Summary Report (ORSA) annually to our lead insurance regulator. The ORSA is a confidential internal assessment of the material and relevant risks associated with an insurer's current business plan and the sufficiency of capital resources to support those risks. In addition, we must file an annual enterprise risk report with our lead insurance regulator. The report must identify the material risks within the insurance holding company system that could pose enterprise risk to our U.S. insurance subsidiaries.
U.S. Insurance Regulation
State Regulation
Overview. Our U.S. insurance company subsidiaries are subject to varying degrees of regulation and supervision by the states and other jurisdictions in which they do business. In the U.S., authority for the regulation, supervision and administration of the business of insurance in each state is generally delegated to a state insurance commissioner who oversees a regulatory body responsible for the supervision of the business of insurance. State regulatory authorities have broad regulatory, supervisory and administrative powers relating to: solvency standards; corporate conduct; market conduct activities; regulating unfair trade and claims practices; licensing of insurers; licensing and appointment of agents; approval of forms and policies used; the nature of, and limitations on, policies writteninsurers' investments; the form and content of annual statements and other reports on the financial condition of insurers; and establishment of loss reserves. States also regulate various aspects of the contractual relationships between insurers and independent agents. In addition, the NAIC, comprised of the insurance commissioners of each U.S. jurisdiction, develops or amends model statutes and regulations that, in defined geographical zones, limiting program sizeturn, most states adopt.
Risk Based Capital Requirements. The NAIC uses a risk based capital (RBC) formula to measure the capital of an insurer, taking into account the company's investments and products. For property and casualty insurance companies, RBC requirements establish capital thresholds for each client, establishing perfour categories of risk: asset risk, insurance risk, interest rate risk and per occurrence limitationsbusiness risk.
Financial Exams. State insurance regulators also prescribe the form and content of statutory financial statements, perform periodic financial examinations of insurers regarding activities in their respective states, set minimum reserve and loss ratio requirements, establish standards for permissible types and amounts of investments and require minimum capital and surplus levels. These statutory capital and surplus requirements include RBC rules promulgated by the NAIC.
Statutory Accounting Principles. Each of our U.S. insurance companies is required to file detailed quarterly and annual reports, including financial statements, in accordance with prescribed statutory accounting rules. The quarterly and annual financial reports utilize statutory accounting principles (SAP) that are different from U.S. GAAP. In developing SAP, insurance regulators were primarily concerned with monitoring the solvency of insurance companies to assure an insurer's ability to pay all its current and future obligations to policyholders.
Rates and Form Filings. The policy forms and various premium rates of our U.S. admitted insurance subsidiaries are subject to regulation in every state in which they conduct business. In many states, rates and policy forms must be filed with the applicable insurance regulator prior to their use, and in some states, rates and forms must be affirmatively approved by the applicable insurance regulator prior to use.
Dividends. The laws of the domicile states of our U.S. insurance subsidiaries govern the amount of dividends that may be paid to our holding company, Markel Group. Generally, statutes in the domicile states of our insurance subsidiaries require prior approval for payment of extraordinary, as opposed to ordinary, dividends. See note 22 of the notes to consolidated financial statements included under Item 8.
Market Conduct. State insurance laws and regulations include numerous provisions governing trade practices and the marketplace activities of insurers, including provisions governing marketing and sales practices, data security, compliance of underwriting services to policyholders, confirmation of licensing and appointment of producers, claims management, anti-fraud controls and complaint handling. State regulatory authorities generally enforce these provisions through periodic market conduct examinations.
Investment Regulation. Investments by our U.S. insurance companies must comply with applicable laws and regulations that prescribe the kind, quality and concentration of investments. In general, these laws and regulations permit investments in federal, state and municipal obligations, corporate bonds, preferred and common equity securities, mortgage loans, real estate and certain other investments, subject to specified limits and certain other qualifications.
Cybersecurity; Data Privacy. Several states have enacted laws establishing cybersecurity requirements for financial services companies, including insurance companies, that require implementation of security measures for the monitoring, detection, prevention, mitigation and management of cybersecurity incidents. Several states also have enacted laws addressing data privacy concerns and the protection of consumer data.
Federal Regulation
The U.S. federal government and its regulatory agencies generally do not directly regulate the business of insurance. However, two federal government bodies, the Federal Insurance Office (FIO) and the Financial Stability Oversight Council (FSOC), each created under The Dodd Frank Wall Street Reform and Consumer Protection Act, may impact the regulation of insurance. Although the FIO is prohibited from directly regulating the business of insurance, it has authority to represent the U.S. in international insurance matters and has limited powers to preempt certain types of state insurance laws. The FIO also can recommend to the FSOC that it designate an insurer as an entity posing risks to the U.S. financial stability in the event of the insurer's material financial distress or failure. We have not been so designated. The U.S. federal laws that most affect our day-to-day insurance operations are: the Gramm-Leach-Bliley Act; the Fair Credit Reporting Act; the Health Insurance Portability and Accountability Act of 1996; the Terrorism Risk Insurance Act of 2002; anti-money laundering laws and regulations; the Nonadmitted and Reinsurance Reform Act of 2010; the Foreign Corrupt Practices Act, and the rules and regulations of the Office of Foreign Assets Control.
International Insurance Regulation
Overview.Our international insurance operations are subject to regulation and supervision in various jurisdictions. These regulations, which vary depending on the jurisdiction, include, among others, solvency and market conduct regulations; anti-corruption, anti-money laundering, and anti-terrorism financing guidelines, laws and regulations; various privacy, insurance, tax, tariff, trade and sanctions laws and regulations; and corporate, competition, employment, intellectual property and investment laws and regulations. Our international insurance operations are domiciled in the U.K., Europe and Bermuda and are subject to regulation in those jurisdictions. In addition, we conduct business in Canada, Asia, Australia and the Middle East, where our businesses also are supervised by local regulatory authorities.
U.K. and European Regulation. We are subject to regulation by the Prudential Regulatory Authority and Financial Conduct Authority in respect of our U.K. insurance businesses. We are also subject to regulation by the Federal Financial Supervisory Authority, better known by its abbreviation BaFin, in respect of our German insurance carrier.
Our U.K. and German insurance businesses are subject to both the E.U.'s General Data Protection Regulation (GDPR) and the Solvency II Directive (Solvency II).
GDPR requires businesses operating in the E.U., and businesses transacting with E.U. citizens, to comply with conditions for processing personal data. Following the U.K.'s exit from the E.U., GDPR was transposed into U.K. law. The E.U. has granted adequacy status to the U.K.'s data protection laws, valid until June 2025 with the possibility of renewal, meaning that they are deemed essentially equivalent to E.U. data protection laws.
Solvency II requires our U.K. and German businesses to maintain certain capital standards and publish risk-related information in the form of a Solvency and Financial Condition Report. Following the U.K.'s exit from the E.U., Solvency II also was transposed into U.K. law as retained law. The U.K. government, under the Financial Services and Markets Act 2023, has opted to repeal certain portions of retained E.U. law. This repeal will occur in stages and, where necessary, after replacement regulations designed for the U.K. are in place. This repeal of retained E.U. law includes reforms to Solvency II. The Prudential Regulation Authority has consulted on the reforms, to be known as Solvency UK, which are expected to be implemented in 2024.
Bermuda Regulation. The insurance industry in Bermuda is regulated by the Bermuda Monetary Authority (BMA). Under the Bermuda Insurance Act 1978, and related regulations and standards of the BMA, each Bermuda insurance company is subject to, among other things: licensing, capital, surplus and liquidity requirements; solvency standards; restrictions on dividends and distributions; and periodic examinations of the company and its financial condition. In addition, each insurance company must obtain prior approval of ownership and transfer of shares and maintain a principal office and appoint and maintain a principal representative in Bermuda. The BMA also requires that each insurance company contract for local services, such as corporate secretary and registered representative services, at market rates.
ILS Regulation
Our Nephila insurance-linked securities operations are subject to regulation and supervision by various regulatory authorities, both in the U.S. and internationally. Certain of our ILS subsidiaries are organized and regulated as follows:
•registered with the SEC as an investment adviser under the Investment Advisers Act of 1940,
•registered with the U.S. Commodity Futures Trading Commission as a commodity pool operator or a commodity trading advisor under the Commodity Exchange Act, and/or
•registered with the BMA as an insurance manager under the Bermuda Insurance Act 1978.
Certain other ILS subsidiaries serve as the investment manager to one or more private funds that are registered with the BMA under the Investment Funds Act 2006, as amended, or the Segregated Accounts Companies Act 2000, as amended. In addition, these operations include business relationships with certain U.S., U.K. and Bermuda insurance companies that are subject to U.S. and international insurance regulation as previously described in this "Regulatory Environment" section.
As a result, subsidiaries involved in our ILS operations are subject to regulations that may impose substantive and material restrictions and requirements on their operations, including, among other things: a broader fiduciary duty to act in the best interests of their clients; disclosure of information about our businesses and conflicts of interests to clients; maintenance of written policies and procedures; maintenance of extensive books and records; restrictions on the types of fees we may charge, including performance fees; restrictions on solicitation arrangements; requirements regarding engaging in transactions with clients; maintenance of an effective compliance program; and other restrictions and requirements applicable to custody of client assets, client privacy, advertising, pay-to-play prohibitions and cybersecurity; as well as possible sanctions, disciplinary actions or other penalties for non-compliance.
Markel Ventures Regulation
Our Markel Ventures businesses are subject to a wide variety of U.S. federal, state, and local laws and regulations, as well as international laws and regulations applicable to their international operations. Specifically, the most significant of these laws and regulations cover the following areas: safety, health, employment, the environment, transportation, U.S. and international trade, anti-corruption, data privacy and security and government contracts.
Human Capital
Our culture is our greatest asset and is defined by the Markel Style. Written in 1986, in preparation for our initial public offering, the Markel Style memorialized how we seek to operate our businesses and treat one another. It continues to provide our guiding principles across our diverse group of businesses. Key within the Markel Style is the encouragement to look for a better way to do things, to challenge management. We also seek spontaneity and flexibility and have a respect for authority, but disdain for bureaucracy. Our holding company and each of our businesses is managed in a way to accomplish these principles. Each of our businesses operates with a high degree of autonomy so long as they operate within the principles of the Markel Style. This allows our managers to make decisions that are best for their employees and customers, as well as our shareholders. We believe this high degree of empowerment leads to the satisfaction that comes from being trusted in the responsibilities one has been given.
Further outlined in the Markel Style is our creed of honesty and fairness in all our dealings; holding the individual's right to self-determination in the highest light; putting aside individual concerns in the spirit of teamwork; and providing an atmosphere in which people can reach their full potential. We greatly value our employees, encourage their career development and reward their pursuit of excellence, while also celebrating a diverse workforce.
At December 31, 2023, we had approximately 21,600 employees, of whom approximately 5,400 were employed within our insurance operations and approximately 16,200 were employed within our Markel Ventures operations.
Insurance
Our specialty insurance business, Markel, markets and underwrites specialty insurance products. Markel has a well-developed process to ensure effective performance management, including an embedded annual review process that enables goal setting, development planning and performance assessment. Markel has also established global leadership development programs for different levels of leadership at Markel, partnering with various schools to create leading-edge curricula in this area.
event, employing coverage restrictionsWith the Markel Style as the foundation, Markel has identified five pillars of focus that relate to today's challenges and following prudent underwriting guidelinesopportunities—diversity and inclusion, community, innovation, well-being, and recognition. This program is both company and employee led—collectively, we want to bring the values of the Markel Style to life with our actions, not just our words. The intent is to create an environment where employees are able to authentically bring their true selves to work, a place where all ideas are heard and diverse perspectives are valued, a culture that prioritizes innovation, the ability to make a difference for each program written. our local communities and the wider world, and a foundation for holding ourselves accountable for our own well-being and of those around us.
Employee health and overall well-being is a key priority, and we provide a range of employee and eligible partner plans and programs, including health and voluntary benefits. These offerings include a variety of financial protection programs to help our employees meet their unique investment and savings needs including life insurance, retirement savings with company contributions in most situations and an employee stock purchase plan. Comprehensive employee assistance programs are available in all of our major markets along with other well-being and fitness resources.
We alsorely on our employees' ideas and input to help make Markel a great place to work. For example, senior leadership conducts regular employee communication meetings, inclusive of question and answer sessions, across our insurance operations and provides opportunities for employees to share their ideas on how we can improve employee engagement. In addition, every two years we conduct a major, global employee engagement survey, which in early 2022 garnered 88% participation, and which enables us to identify, focus on and track progress against key engagement drivers and external norms for high performing companies. This survey has generated additional ideas for employee engagement, and we have made meaningful changes and improvements in our human capital practices based on this feedback. Plans are underway to conduct an employee engagement survey in early 2024. Additionally, Markel conducts regular pulse and employee net promoter score surveys on a departmental level across the organization throughout the year.
We are committed to embracing all aspects of diversity, including diversity of perspective, which we believe is crucial to sustainable success. Markel accordingly supports and encourages focused efforts to continue to build the diversity of our employee population and the inclusiveness of our culture. Our diversity and inclusion efforts seek to managecultivate an inclusive environment in which every employee feels valued, respected and accepted. We believe this environment helps us increase creativity and innovation, foster business connections, serve our loss exposures through geographic diversification. Underwritingcustomers and maintain our market leadership.
Markel's global Diversity and Inclusion (D&I) Steering Committee comprises more than 15 senior managers who are charged with advising on D&I strategy and providing leadership support and advocacy for our D&I efforts. Our Human Resources leadership team works to further shape the D&I strategy for our global workforce, and to ensure the integration of our D&I efforts with our global talent acquisition and development processes. We have various early career programs open to a diverse range of applicants and a regional scholarship program that is focused on underrepresented groups.
Markel supports a matterrange of judgment, involving assumptions about mattersemployee-led D&I networks and resource groups, including our Markel Women's Network, BEAM (Black Engagement at Markel), PRISM (LGBTQ+), Jitneys (Young Professionals), Markel Asian Professionals Network, Markel Veterans Network, UN1DOS (Latin and Hispanic Network), and across our international operations, an Inclusion Network with connections to a number of the London market partner networks. All of these networks and organizations have put in place goals and programming that are inherently unpredictablefocused on education and beyonddevelopment, community engagement, talent acquisition and networking/support. Additionally, we continue our control,global sponsorship of Dive-In, the insurance industry's annual diversity and forinclusion festival.
Markel Ventures
Our Markel Ventures operations are comprised of a diverse portfolio of businesses from different industries through which historical experiencewe own controlling interests. The Markel Ventures operations are viewed by management as separate and probability analysis may not provide sufficient guidance. distinct from our insurance operations with local management teams that direct the strategy and day-to-day operations of their respective companies, including human capital matters. When making these acquisitions, we seek, among other things, businesses whose leadership teams demonstrate equal measures of both integrity and talent. As a result, each Markel Ventures business fosters a culture within their operations, and with their employees, that aligns with the principles of the Markel Style.
Item 1A. RISK FACTORS
A wide range of factors could materially affect our future prospects and performance. The matters addressed in Item 7 Management's Discussion and Analysis of Financial Condition and Results of Operations, including under "Safe Harbor and Cautionary Statement" and "Critical Accounting Estimates", and Item 7A Quantitative and Qualitative Disclosures About Market Risk, as well as other information included or incorporated in this report, describe many of the significant risks that could affect our businesses, results of operations and financial condition. We are also subject to the risks discussed below.
One or more future eventsof the risks discussed in this Item 1A. Risk Factors, and others we cannot anticipate, could resulthave material adverse effects on our results of operations and financial condition; and the extent of these effects will depend, at least in claims that substantially exceed our expectations, which couldpart, on the scope, severity, frequency or duration of the specific event or circumstance. In addition, we may take steps to prevent, mitigate or manage potential risks or liabilities, and related developments, and some of those steps may have a material adverse effect on our results of operations and financial condition. In addition,Even if an unfavorable outcome does not materialize, these factors, and actions we seek to manage our loss exposures by policy terms, coverage exclusions and choice of legal forum. Disputes relating to coverage and choice of legal forum also arise. As a result, various provisions of our policies, such as choice of forum, or coverage limitations or exclusions, may not be enforceabletake in the manner we intend and some or all of our methods to manage loss exposures may prove ineffective.
The effects of emerging claim and coverage issues on our business are uncertain. As industry practices and legal, judicial, social and other environmental conditions change, unexpected and unintended issues related to claims and coverage may emerge. These issuesresponse, may have a material adverse effectimpact on our business by either broadening coverage beyond our underwriting intentreputation or by increasing the frequency and/or severity of claims. In some instances, these changes may not become apparent until after we have issued insurance or reinsurance contracts that are affected by the changes. As a result, the full extent of liability under our insurance or reinsurance contracts may not be known for many years after a contract is issued. For example, many states have recently extended the statute of limitations for certain victims of sexual abuse. This may result in a higher frequency of claims over a more extended reporting period than originally expected.substantial expense and disruption.
We use analytical modelsHeadings and sub-headings for the Risk Factors below are for reference purposes only and are not intended to assist our decision makinglimit or affect in key areas such as pricing, reserving and capital modeling and actual results may differ materially fromany way the model outputs and related analyses. We use various modeling techniques and data analytics (e.g., scenarios, predictive and stochastic modeling, and forecasting) to analyze and estimate exposures, loss trends and other risks associated with our insurance and ILS businesses. This includes both proprietary and third-party modeled outputs and related analyses to assist us in, among other things, decision-making related to underwriting, pricing, capital allocation, reserving, investing, reinsurance and catastrophe risk. We incorporate numerous assumptions and forecasts about the future level and variabilitymeaning or scope of policyholder behavior, loss frequency and severity, interest rates, equity markets, inflation, capital requirements, and currency exchange rates, among others. The modeled outputs and related analyses from both proprietary models and third party models are subject to various assumptions, uncertainties, model design errors, complexities and the inherent limitations of any statistical analysis, including those arising from the use of historical internal and industry data and assumptions.each Risk Factor.
In addition, the modeled outputs and related analyses may from time to time contain inaccuracies, perhaps in material respects, including as a result of inaccurate inputs or applications thereof (whether due to data error, human error or otherwise). Consequently, actual results may differ materially from our modeled results. Our profitability and financial condition substantially depend on the extent to which our actual experience is consistent with assumptions we use in our models and ultimate model outputs. If, based upon these models or other factors, we misprice our products or fail to appropriately estimate the risks we are exposed to, our business, results of operations and financial condition may be materially adversely affected.
Loss Reserves
Our results may be affected because actual insured or reinsured losses differ from our loss reserves. Significant periods of time often elapse between the occurrence of an insured or reinsured loss, the reporting of the loss to us and our payment of that loss. To recognize liabilities for unpaid losses, we establish reserves as balance sheet liabilities representing estimates of amounts needed to pay reported and unreported losses and the related loss adjustment expenses. The process of estimating loss reserves is a difficult and complex exercise involving many variables and subjective judgments. This process may also become more difficult if we experience a period of rising inflation. As part of the reserving process, we review historical data and consider the impact of such factors as:
•trends in claim frequency and severity,
•changes in operations,
•emerging economic and social trends,
•trends in insurance rates,
•inflation or deflation, and
•changes in the regulatory and litigation environments.
This process assumes that past experience, adjusted for the effects of current developments and anticipated trends, is an appropriate basis for predicting future events. There is no precise method, however, for evaluating the impact of any specific factor on the adequacy of reserves, and actual results will differ from original estimates. As part of the reserving process, we
regularly review our loss reserves and make adjustments as necessary. Future increases in loss reserves for our underwriting operations will, and for our programs services operations may, result in additional charges to earnings, which may be material.
In addition, reinsurance reserves are subject to greater uncertainty than insurance reserves primarily because a reinsurer relies on (i) the original underwriting decisions and claims decisions made by ceding companies and (ii) information and data from ceding companies. As a result, we are subject to the risk that our ceding companies may not have adequately evaluated the risks reinsured by us and the premiums ceded may not adequately compensate us for the risks we assume. In addition, reinsurance reserves may be less reliable than insurance reserves because there is generally a longer lapse of time from the occurrence of the event to the reporting of the loss or benefit to the reinsurer and ultimate resolution or settlement of the loss.
Changes in the assumptions and estimates used in establishing reserves for our life and annuity reinsurance book could result in material increases in our estimated loss reserves for such business. Our run-off life and annuity reinsurance book exposes us to mortality risk, which is the risk that the level of death claims may differ from that which we assumed in establishing the reserves for our life and annuity reinsurance contracts. Some of our life and annuity reinsurance contracts expose us to longevity risk, which is the risk that an insured person will live longer than expected when the reserves were established, or morbidity risk, which is the risk that an insured person will become critically ill or disabled. Our reserving process for the life and annuity reinsurance book is designed with the objective of establishing appropriate reserves for the risks we assumed. Among other things, this process relies heavily on analysis of mortality, longevity and morbidity trends, lapse rates, interest rates and expenses. As of December 31, 2020, our reserves for life and annuity benefits totaled $1.1 billion.
We expect mortality, morbidity, longevity, and lapse experience to fluctuate somewhat from period to period, but believe they should remain reasonably predictable over a period of many years. Mortality, longevity, morbidity or lapse experience that is less favorable than the mortality, longevity, morbidity or lapse rates that we used in establishing the reserves for a reinsurance agreement will negatively affect our net income because the reserves we originally set for the risks we assumed may not be sufficient to cover the future claims and expense payments. Furthermore, even if the total benefits paid over the life of the contract do not exceed the expected amount, unexpected increases in the incidence of deaths or illness can result in changes to our assumptions in a given reporting period, adversely affecting our net income in any particular reporting period. Fluctuations in interest rates will impact the performance of our investments related to our life and annuity reinsurance book. If there are changes to any of the above factors to the point where a reserve deficiency exists, a charge to earnings will be recorded, which may have a material adverse effect on our results of operations and financial condition.
Ceded Reinsurance
In a reinsurance transaction, an insurance company transfers, or cedes, all or part of its exposure in return for a premium. In a retrocessional reinsurance transaction, a reinsured exposure is further ceded to another reinsurer. Within our underwriting operations, we seek to retain as much of our profitable business as possible while managing volatility within our underwriting results and capital requirements at our insurance subsidiaries. We purchase reinsurance and retrocessional reinsurance to manage our net retention on individual risks and overall exposure to losses, while providing us with the ability to offer policies with sufficient limits to meet policyholder needs. This includes purchasing sufficient coverage for our catastrophe-exposed policies to ensure that our net retained catastrophe risk is within our corporate tolerances. The structure of our reinsurance purchases may vary from year to year depending on our risk tolerance and the availability and cost of reinsurance, as determined by current market conditions. In such instances, we may in turn modify our gross premium writings to manage our overall net loss exposures. Net retention of gross premium volume in our underwriting segments was 82% in 2023.
Ceded reinsurance and retrocessional contracts do not legally discharge us from our primary liability for the full amount of the policies, and we will be required to pay the loss and bear collection risk if the reinsurer fails to meet its obligations under the reinsurance agreement. We attempt to minimize credit exposure to reinsurers through adherence to internal ceded reinsurance guidelines. We manage our exposures so that no unsecured exposure to any one reinsurer is material to our ongoing business. Treaties typically contain provisions that allow us to demand that a reinsurer post letters of credit or assets as collateral if a reinsurer becomes an unauthorized reinsurer under applicable regulations or if its rating falls below an acceptable level.
2Market Segment Report - Global Reinsurance, A.M. Best (August 22, 2023)
3Offshore Reinsurance in the U.S. Market, Reinsurance Association of America (2022)
See note 12 of the notes to consolidated financial statements included under Item 8 and Item 7A Quantitative and Qualitative Disclosures About Market Risk for additional information about our ceded reinsurance programs and exposures.
Competition and Underwriting Philosophy
We compete with numerous domestic and international insurance companies and reinsurers, Lloyd's syndicates, risk retention groups, insurance buying groups, risk securitization programs, alternative capital sources, such as that provided through ILS, and alternative self-insurance mechanisms. We also compete with new companies that continue to be formed to enter the insurance and reinsurance markets, particularly companies with new or "disruptive" technologies or business models. Competition may take the form of lower prices, broader coverages, greater product flexibility, enhanced digital capabilities for distribution of insurance products, higher coverage limits, higher quality services or higher ratings by independent rating agencies. In all of our markets, we compete on the basis of overall financial strength, ratings assigned by independent rating agencies, development of specialty products to satisfy well-defined market needs and by maintaining relationships with agents, brokers and insureds who rely on our expertise. This expertise is our principal means of competing. We offer a diverse portfolio of products, each with its own distinct competitive environment, which requires us to be responsive to changes in market conditions for individual product lines. With each of our products, we seek to write business that produces consistent underwriting profits by maintaining adequate rates for our premium writings in relation to expected loss cost trends.
Few barriers exist to prevent competition from entering our markets within the property and casualty industry. Market conditions, risk tolerance and capital capacity influence the degree of competition at any point in time. During periods of excess underwriting capacity, as defined by availability of capital, competition can result in lower pricing and less favorable policy terms and conditions for insurers. During periods of reduced underwriting capacity, pricing and policy terms and conditions are generally more favorable for insurers. Historically, the performance of the property and casualty insurance and reinsurance industries has tended to fluctuate in cyclical periods of price competition and excess underwriting capacity, followed by periods of high premium rates and shortages of underwriting capacity. At any given time, our portfolio of insurance products could be experiencing varying combinations of these characteristics.
Within our underwriting operations, we seek to earn an underwriting profit every year. The property and casualty insurance industry commonly defines underwriting profit or loss as earned premiums net of losses and loss adjustment expenses and underwriting, acquisition and insurance expenses. We believe that the ability to achieve consistent underwriting profits demonstrates knowledge and expertise, commitment to superior customer service and the ability to manage insurance risk. We use underwriting profit or loss as a basis for evaluating our underwriting performance. The combined ratio is a measure of underwriting performance and represents the relationship of incurred losses, loss adjustment expenses and underwriting, acquisition and insurance expenses to earned premiums. A combined ratio less than 100% indicates an underwriting profit, while a combined ratio greater than 100% reflects an underwriting loss. In 2023, our combined ratio was 98%. See Item 7 Management's Discussion & Analysis of Financial Condition and Results of Operations for a discussion of our underwriting results.
We routinely review the pricing for all of our product lines. When we believe the prevailing market price will not support our underwriting profit targets, the business is not written. As a result of our underwriting discipline, gross premium volume may vary when we alter our product offerings to maintain or improve underwriting profitability. For example, in 2023, we adjusted our writings within our U.S. and Bermuda directors and officers and errors and omissions product lines in our Insurance segment in response to unfavorable loss cost trends and downward pressure on rates.
Underwriting Segments
We monitor and assess the performance of our ongoing underwriting operations on a global basis in the following two segments: Insurance and Reinsurance. See note 2 of the notes to consolidated financial statements included under Item 8 for additional segment reporting disclosures.
Insurance Segment
Our Insurance segment reported gross premium volume of $9.2 billion, earned premiums of $7.3 billion and an underwriting profit of $162.2 million in 2023. The following chart presents the composition of our Insurance segment by division based on 2023 gross premium volume.
The Markel Specialty division is comprised of our U.S. and Bermuda based insurance underwriting operations and writes business for insureds ranging from individuals and small businesses to Fortune 1000 companies in the U.S., the U.K., the E.U., Asia and Australia. The Markel Specialty platform provides easy access to our diverse portfolio of products and capabilities. The Markel International division writes business worldwide from our London and Munich-based platforms, which include branch offices in Canada, Asia, Australia and across the E.U. The State National division writes collateral protection insurance for automobile and other vehicle loans in the U.S.
The following chart displays the types of products written in our Insurance segment based on 2023 gross premium volume.
General liability product offerings include a variety of primary and excess liability coverages. We focus on businesses in the construction, life sciences, energy, medical, healthcare, pharmaceutical, professional services, social welfare, recreational, transportation, heavy industrial and hospitality industries. Specific products include primary general liability, excess and umbrella products, products liability products, environmental liability products and casualty facultative reinsurance written for individual casualty risks.
Our professional liability product lines provide insurance solutions for small, middle market and risk management accounts with coverage that is tailored to their exposures and needs. Professional liability coverages include errors and omissions, directors and officers, cyber, employment practices liability, professional indemnity, transaction liability, intellectual property and union liability. Errors and omissions coverage provides solutions for specialized professions including lawyers, accountants, agents and brokers, service technicians and consultants, as well as other less-specialized professionals. Directors and officers coverage is provided for publicly-traded, private and non-profit companies, including financial institutions and Fortune 1000 companies. We also offer claims-made professional liability coverage for individual healthcare providers and coverages for medical facilities.
Personal lines products provide first and third-party coverages in the U.S. for classic cars, motorcycles and a variety of personal watercraft, including vintage boats, high-performance boats and yachts and recreational vehicles, such as motorcycles, snowmobiles and ATVs. Additionally, property coverages are offered for homeowners that do not qualify for standard homeowner's coverage, as well as personal umbrella coverage.
Marine and energy products include a portfolio of coverages for cargo, energy, hull, liability, war and terrorism risks worldwide. The cargo product line is an international transit-based book providing coverage for many types of cargo. Energy coverage includes all aspects of oil, gas and renewable energy activities. Our renewable energy activities include coverages for onshore and offshore wind farms, as well as alternative energy generation and storage technology projects. Hull coverages consist of coverage for physical damage to ocean-going tonnage, yachts and mortgagees' interests. Liability coverage provides coverage for a broad range of energy liabilities, as well as traditional marine exposures including charterers, terminal operators and ship repairers. Marine war coverage includes protections for the hulls of ships, and other related interests, against war and associated perils. Terrorism coverage includes coverage for property damage and business interruption related to political and civil violence and war on land.
Property coverages consist principally of fire, allied lines (including windstorm, hail and water damage) and other specialized property coverages, including catastrophe-exposed property risks such as earthquake and wind on both a primary and excess basis. Catastrophe-exposed property risks can present higher severity than more standard property risks due to the impacts from earthquakes and severe weather events such as hurricanes, convective storms and wildfires. Our property coverages are exposed to windstorm losses that, based on the seasonal nature of those events, are more likely to occur in the third and fourth quarters of the year. Our property risks range from small, single-location accounts to large, multi-state, multi-location, multi-national accounts on a worldwide basis. Other types of property products include inland marine products, railroad-related products and specie coverage for fine art on exhibition and in private collections.
Specialty programs business is offered in the U.S. on a standalone or package basis and generally targets specialized commercial markets and various customer groups, such as amateur sports and fitness clubs. Certain specialty programs written in this segment use managing general agents to offer single source admitted and non-admitted programs for a specific industry, class or line of business.
Workers' compensation products are offered in the U.S. and provide wage replacement and medical benefits to employees injured in the course of employment and target main-street, service and artisan contractor businesses, retail stores and restaurants.
Credit and surety products consist primarily of trade credit and prepayment coverage and a range of bonds and guarantees that support contractual obligations, as well as other coverages for specific credit risks, markets and contingencies. Key credit risks covered include those of counterparty insolvency and defaults by government-owned entities. The key coverages under surety products include contractual performance and payment risks, commercial license and permit obligations and obligations related to judicial proceedings such as court and fiduciary bonds.
Other product lines within the Insurance segment primarily include collateral protection insurance, which insures personal automobiles and other vehicles held as collateral for loans made by credit unions, banks and specialty finance companies.
Reinsurance Segment
Our Reinsurance segment product offerings are underwritten primarily by our Global Reinsurance division, which operates from platforms in the U.S., Bermuda and the U.K. We write quota share and excess of loss reinsurance on a local, national and global basis. Our Reinsurance segment reported gross premium volume of $1.0 billion, earned premiums of $1.0 billion and an underwriting loss of $19.3 million in 2023. The following chart displays the types of products written in our Reinsurance segment based on 2023 gross premium volume.
General liability reinsurance primarily consists of umbrella and excess casualty products, as well as environmental liability products covering pollution legal liability and contractors' pollution exposures.
Our specialty treaty reinsurance products are written across a wide range of specialty product lines, primarily consisting of the following:
•Credit and surety products, including structured and whole turnover credit, political risk and contract and commercial surety reinsurance programs covering worldwide exposures;
•Workers' compensation and accident and health products covering both standard and catastrophe-exposed business in the U.S. and worldwide;
•Marine and energy products covering both offshore and onshore marine, energy and renewable energy risks on a worldwide basis, including hull, cargo and liability;
•Public entity reinsurance products offering casualty coverage for municipalities, schools, special districts, public housing authorities and public entity affiliated non-profits;
•Mortgage default insurance offering coverage for private mortgage insurers predominantly located in the U.S. and Australia;
•Aviation and space coverage, including major risk, general aviation, satellite launch and orbit;
•Agriculture reinsurance covering multi-peril crop insurance, hail and related exposures for risks located in the U.S. and Canada; and
•Discrete political violence and national terror pools in select jurisdictions globally.
Professional liability reinsurance primarily consists of the following:
•Transaction liability, which provides representation, warranty and indemnity coverage for mergers and acquisitions, including coverage for tax and contingent liability;
•Directors and officers liability for publicly-traded, private and non-profit companies;
•Cyber and technology errors and omissions covering both first and third-party exposures;
•Errors and omissions for lawyers, accountants, agents and brokers, services technicians and consultants; and
•Healthcare liability for physicians, hospitals, long-term care and other medical facilities.
Program Services and Other Fronting
Our program services and other fronting business generates fee income in the form of ceding fees in exchange for fronting insurance and reinsurance business for other insurance carriers (capacity providers). In general, fronting refers to business in which we write insurance on behalf of a general agent or capacity provider and then cede all, or substantially all, of the risk under these policies to the capacity provider in exchange for ceding fees. The results of our program services and other fronting operations are not included in a reportable segment.
Our program services business, which is provided through our State National division, offers issuing carrier capacity to both specialty managing general agents and other producers who sell, control and administer books of insurance business that are supported by third parties that assume reinsurance risk, including the Nephila Reinsurers. These reinsurers include domestic and foreign insurers and institutional risk investors that want to access specific lines of U.S. property and casualty insurance business but may not have the required licenses, filings or financial strength ratings to do so.
Beginning in 2024, our State National division is expanding internationally through a partnership with our Markel International division to create an international program services division to serve managing general agents in the U.K. market. The new division is another example of how we can leverage our array of capabilities to effectively and efficiently connect capital with risk.
Through our program services business, we write a wide variety of insurance and reinsurance products, principally including general liability, commercial liability, commercial multi-peril, property and workers' compensation. Program services business written through our State National division is separately managed from our underwriting divisions, which may write similar products, in order to protect our program services customers.
The following table summarizes the subsidiaries through which our program services business is written.
| | | | | | | | | | | | | | |
| Legal Entity | | Abbreviation | | State of Domicile |
| City National Insurance Company | | CNIC | | Texas |
| National Specialty Insurance Company | | NSIC | | Texas |
| Pinnacle National Insurance Company | | PNIC | | Texas |
| State National Insurance Company, Inc. | | SNIC | | Texas |
| Superior Specialty Insurance Company | | SSIC | | Delaware |
| United Specialty Insurance Company | | USIC | | Delaware |
Through these subsidiaries, our program services business is licensed or authorized to write business in all 50 states and the District of Columbia. Many of our programs are arranged with the assistance of brokers that are seeking to provide customized insurance solutions for specialty insurance business that requires a carrier rated "A" by A.M. Best Company (A.M. Best). Our specialized business model relies on third-party producers or capacity providers to provide policy administration, claims handling, cash handling, underwriting, or other traditional insurance company services. We compete primarily on the basis of price, customer service, financial strength ratings, licenses, reputation, business model and experience.
Total revenues attributed to our program services business for the year ended December 31, 2023 were $151.8 million. Our program services business generated $2.9 billion of gross written premium volume for the year ended December 31, 2023.
In our program services business, we enter into reinsurance agreements whereby we cede to the capacity providers 100% of the premium written and substantially all of our gross liability under all policies issued by and on behalf of us by the producer. As a result of our contract design, substantially all of the underwriting risk and operational risk inherent in the arrangement is borne by the capacity providers.
Our contracts with capacity providers do not legally discharge us from our primary liability for the full amount of the policies, and we will be required to pay the loss and bear collection risk if a capacity provider fails to meet its obligations under the reinsurance agreement. As a result, we remain exposed to the credit risk of capacity providers, including the risk that one of our capacity providers becomes insolvent or is otherwise unable or unwilling to pay policyholder claims. We mitigate this credit risk generally by either selecting well capitalized, highly rated authorized capacity providers or requiring that the capacity provider post substantial collateral to secure the reinsured risks, which, in some instances, exceeds the related reinsurance recoverable.
In our other fronting business, we leverage the strength of our underwriting platform, including our highly rated insurance subsidiaries, to write business on behalf of our Nephila ILS operations, in exchange for ceding fees, to support its business plans and assist in meeting its desired return objectives. Our other fronting business is managed separately from our program services business. The results of our other fronting business are not included in a reportable segment. Total revenues attributed to our other fronting business for the year ended December 31, 2023 were $20.7 million. Our other fronting business generated $840.9 million of gross written premium volume for the year ended December 31, 2023.
Business written on behalf of our Nephila ILS operations within both our program services and other fronting operations primarily consists of catastrophe-exposed property insurance and reinsurance business, as well as specialty and climate reinsurance business. The business written is ceded to the Nephila Reinsurers, whose investors ultimately assume the risk. To mitigate credit risk for this business, we require collateral up to a specified level of annual aggregate agreement year losses, which is held in a trust for which we are the beneficiary. See note 18 of the notes to consolidated financial statements included under Item 8 for further details regarding our programs with Nephila Reinsurers.
Although we reinsure substantially all of the risks inherent in our program services and other fronting businesses, we have certain programs that contain limits on our reinsurers' obligations to us that expose us to underwriting risk, including loss ratio caps, aggregate reinsurance limits or exclusion of the credit risk of producers. Under certain programs, including programs and contracts with Nephila Reinsurers, we also bear underwriting risk for annual aggregate agreement year losses in excess of a limit that we believe is unlikely to be exceeded.
Insurance-Linked Securities
Our insurance-linked securities operations are primarily comprised of our Nephila operations and are not included in a reportable segment. Nephila Holdings Ltd. (together with its subsidiaries, Nephila) provides investment and insurance management services through which we offer alternative capital to the insurance and reinsurance markets while providing investors with investment strategies that typically are uncorrelated with traditional asset classes. We receive management fees for investment and insurance management services provided through these operations, and for certain funds, incentive fees based on their annual performance. Our management fees are based on the net asset value of the accounts managed for most of our funds and gross premium volume for the remaining funds. Total revenues from our insurance-linked securities operations for the year ended December 31, 2023 were $99.5 million. As of December 31, 2023, Nephila's net assets under management were $6.8 billion.
Our fund management operations provide insurance and investment management services for a broad range of investment products for insurance and reinsurance companies, government entities, banks, hedge funds, pension funds and institutional investors, including insurance-linked securities such as catastrophe bonds, insurance swaps, traditional reinsurance contracts, industry loss warranties and other financial instruments. Nephila serves as the investment manager to several Bermuda based private funds (the Nephila Funds). To provide access for the Nephila Funds to a variety of insurance-linked securities in the property catastrophe, climate and specialty markets, Nephila acts as an insurance manager to certain Bermuda Class 3, collateralized and special purpose reinsurance companies, Lloyd's Syndicate 2357 and Lloyd's Syndicate 2358 (collectively, the Nephila Reinsurers). The results of the Nephila Reinsurers are attributed to the Nephila Funds primarily through derivative transactions between these entities. Neither the Nephila Funds nor the Nephila Reinsurers are subsidiaries of Markel Group, and as such, these entities are not included in our consolidated financial statements.
The Nephila Reinsurers subscribe to various property, climate and specialty reinsurance contracts based on their investors' risk profiles, which include business ceded by our underwriting and program services and other fronting platforms. We write this business on behalf of our Nephila ILS operations to the extent it fits Nephila investors' risk profile and cede substantially all of the risk to Nephila Reinsurers. See note 18 of the notes to consolidated financial statements included under Item 8 for further details regarding transactions with entities managed through our Nephila operations.
Ratings
Financial stability and strength are important considerations of policyholders, cedents and insurance agents and brokers. Because an insurance premium paid today purchases coverage for losses that might not be paid for many years, the financial viability of the insurer is of critical concern. Various independent rating agencies provide information and assign ratings to assist buyers in their search for financially sound insurers. Rating agencies periodically re-evaluate assigned ratings based upon changes in the insurer's operating results, financial condition or other significant factors influencing the insurer's business. Downgrades in assigned ratings and other negative actions could have an adverse impact on an insurer's ability to write new business.
Rating agencies assign financial strength ratings (FSRs) to property and casualty insurance companies, or group of companies, based on quantitative criteria such as profitability, leverage and liquidity, as well as qualitative assessments such as market placement, business profile, adequacy and soundness of ceded reinsurance, quality and estimated market value of assets, adequacy of loss reserves and surplus and competence, experience and integrity of management.
Sixteen of our seventeen insurance subsidiaries are rated by A.M. Best, while our Lloyd's syndicate is part of a group rating for the Lloyd's overall market. All sixteen of our insurance subsidiaries rated by A.M. Best have been assigned an FSR of "A" (excellent). The Lloyd's group has been assigned an FSR of "A" (excellent) by A.M. Best.
Nine of our seventeen insurance subsidiaries are rated by Standard & Poor's (S&P), while our Lloyd's syndicate is part of a group rating for the Lloyd's overall market. All nine of our insurance subsidiaries rated by S&P have been assigned an FSR of "A" (strong). The Lloyd's group has been assigned an FSR of "A+" (strong) by S&P.
Five of our seventeen insurance subsidiaries are rated by Moody's Corporation (Moody's). All five insurance subsidiaries rated by Moody's have been assigned an FSR of "A2" (good).
Investments
Our investment operations manage the capital held within our underwriting operations, as well as capital allocated by Markel Group. Invested assets managed through our investment operations includes our portfolio of publicly traded fixed maturity and equity securities, as well as cash and short-term investments.
Our underwriting operations provide our investment operations with steady inflows of premiums. These funds are invested predominantly in high-quality government and municipal bonds and mortgage-backed securities that generally match the duration and currency of our loss reserves. We typically hold these investments until maturity. As a result, unrealized holding gains and losses on these securities are generally expected to reverse as the securities mature. Premiums collected through our underwriting operations may also be held as short-term investments or cash and cash equivalents to provide short-term liquidity for projected claims payments, reinsurance costs and operating expenses.
Our investments in equity securities are predominantly held within our regulated insurance subsidiaries to support capital requirements. Capital held by our insurance subsidiaries beyond that which we anticipate will be needed to cover claims payments and operating expenses is available to be invested in equity securities, along with additional capital allocated for investment purposes by Markel Group. We allocate a higher percentage of capital to equity securities than most other insurance companies. Over the long run, equity securities have produced higher returns relative to fixed maturity securities and short-term investments.
When purchasing equity securities, we seek to invest in profitable companies with high returns on capital and low debt, with honest and talented management and significant reinvestment opportunities and capital discipline, all while paying reasonable prices for those securities. We intend to hold these equity investments over the long-term. We believe our long-term time horizon and internal sourcing of capital for investment provides us with a distinct competitive advantage compared to other companies. Substantially all of our investment portfolio is managed by company employees, which helps minimize costs in our investment operations. The breadth of our operating businesses, and the experience we garner from supporting them, also informs and enhances the efficacy of our investment activities.
Invested assets, comprised of fixed maturity securities, equity securities, short-term investments, cash and cash equivalents and restricted cash and cash equivalents, were $30.9 billion at December 31, 2023. The following chart displays the composition of our invested assets as of December 31, 2023.
We measure our investment performance by analyzing net investment income earned on our investment portfolio, which reflects the recurring interest and dividend earnings on our investment portfolio. In 2023, our net investment income was $734.5 million. We also analyze net investment gains, which include unrealized gains and losses on our equity portfolio. Based on the potential for volatility in the financial markets, we understand that the level of gains or losses may vary from one period to the next, and therefore believe that our investment performance is best analyzed over longer periods of time. Our annual return on equity securities for the five-year period ended December 31, 2023 was 14.6%.
Markel Ventures
Through our wholly owned subsidiary Markel Ventures, Inc. (Markel Ventures), we own controlling interests in high-quality businesses that operate in a variety of different industries with shared values and the shared goal of positively contributing to the long-term financial performance of Markel Group. Management teams for each business operate autonomously and are responsible for developing strategic initiatives, managing day-to-day operations and making investment and capital allocation decisions for their respective companies. Our Markel Ventures management team is responsible for decisions regarding allocation of capital for acquisitions and new investments. Our strategy in making these acquisitions is similar to our strategy for purchasing equity securities. We seek to invest in profitable companies, with honest and talented management, that exhibit reinvestment opportunities and capital discipline, at reasonable prices. We intend to own the businesses acquired for a long period of time.
Our chief operating decision maker allocates resources to and assesses the performance of these various businesses in the aggregate as the Markel Ventures segment. See note 2 of the notes to consolidated financial statements included under Item 8 for additional segment reporting disclosures. The Markel Ventures segment includes a diverse portfolio of specialized businesses from different industries that offer various types of products and services to businesses and consumers across many markets. All of our businesses in this segment are headquartered in the U.S., with subsidiaries of certain businesses located outside of the U.S. In 2021, our Markel Ventures operations expanded through acquisitions of majority interests in Metromont LLC and Buckner HeavyLift Cranes. See note 3 of the notes to consolidated financial statements included under Item 8 for additional details related to these acquisitions. This follows the acquisition of Lansing Building Products, LLC in 2020 and VSC Fire & Security, Inc. in 2019. We continue to look for acquisition opportunities that align with our investment criteria and strategic objectives around diversification and specialization.
In 2023, our Markel Ventures operations reported revenues of $5.0 billion, operating income of $437.5 million and earnings before interest, income taxes, depreciation and amortization (EBITDA) of $628.5 million. We use Markel Ventures EBITDA, which is a non-GAAP financial measure, as an operating performance measure in conjunction with operating income. See "Markel Ventures" under Item 7 Management's Discussion & Analysis of Financial Condition and Results of Operations for more information on our Markel Ventures results, including EBITDA.
The following chart displays the types of businesses within our Markel Ventures segment based on 2023 operating revenues. Our Markel Ventures management team does not manage the Markel Ventures portfolio of businesses at this level of aggregation due to the distinct characteristics of each business and the autonomy with which local management operates each business.
The following table provides summary information about our portfolio of Markel Ventures companies by type of business.
| | | | | | | | | | | | | | | | | | | | |
| Company | | Category | | Year Founded | | Joined Markel Group Family |
Markel Food Group - Global manufacturer and designer of industrial food equipment | | Equipment manufacturing | | 1915 | | 2005 |
ParkLand Ventures - Operator of manufactured housing communities in the U.S. | | Other | | 2008 | | 2008 |
Panel Specialists - Manufacturer of dorm room furniture and wall panel systems | | Consumer and building products | | 1990 | | 2009 |
Ellicott Dredges - Manufacturer and designer of cutter suction dredges | | Equipment manufacturing | | 1885 | | 2009 |
RetailData - Provider of retail intelligence solutions | | Consulting services | | 1988 | | 2010 |
PartnerMD - Concierge healthcare membership provider offering personalized primary care, advanced physicals, and wellness services | | Other | | 2003 | | 2011 |
Weldship - Manufacturer of industrial and specialty gas transportation and storage equipment | | Transportation-related products | | 1946 | | 2011 |
Havco - Manufacturer of laminated wood flooring for dry-van trailers, truck bodies and containers | | Transportation-related products | | 1978 | | 2012 |
Eagle - Designer and builder of single family attached and detached homes | | Consumer and building products | | 1984 | | 2013 |
Cottrell - Manufacturer of over-the-road auto hauler equipment | | Transportation-related products | | 1975 | | 2014 |
CapTech - Management and information technology consulting firm | | Consulting services | | 1997 | | 2015 |
Costa Farms - Largest producer of ornamental plants in the U.S. 4 | | Consumer and building products | | 1961 | | 2017 |
Rosemont Investment Group - Specialist investor in asset and wealth management companies | | Other | | 2018 | | 2018 |
Brahmin - Creator of fashion leather handbags | | Consumer and building products | | 1982 | | 2018 |
VSC Fire & Security - Distributor of comprehensive fire protection, life safety, and low voltage solutions | | Construction services | | 1958 | | 2019 |
Lansing Building Products - Supplier of exterior building products and materials to professional contractors | | Construction services | | 1955 | | 2020 |
Buckner Heavylift Cranes - Provider of heavylift crane rental solutions | | Construction services | | 1947 | | 2021 |
Metromont - Manufacturer of highly engineered precast concrete solutions | | Consumer and building products | | 1925 | | 2021 |
Markel Ventures businesses encounter a variety of competitors that vary by industry, end market and geographic area. Each Markel Ventures business has several main competitors and numerous smaller ones in most of its respective end markets and geographic areas.
Many of the businesses in this segment experience revenue fluctuations over time due to the cyclical nature of supply and demand in their particular industry. For example, the construction industry is cyclical based on certain larger economic trends and factors, including the inflationary and interest rate environment and, for some businesses, the level of government investment. Additionally, many of our businesses experience fluctuation in demand throughout the year based on the seasonality of the products they sell or services they provide. For example, the demand for ornamental plants is particularly high during the spring and summer seasons as compared to the rest of the year.
4Measured by 2023 square footage of production. Greenhouse Grower's 2023 Top 100 Growers, Greenhouse Grower (May 11, 2023)
Businesses in this segment are reliant on inputs, such as raw materials and labor, to manufacture products and deliver services, and the operating results of these businesses could be impacted by the ability or inability to source these inputs and obtain price increases from customers in response to increases in the price of these inputs, including the cost of shipping. For example, shipping costs at some of our businesses increased significantly in 2022 before reverting to more typical levels in 2023, which has resulted in higher margins in 2023 compared to 2022 at the impacted businesses.
Management teams for each of our businesses proactively manage the risks and challenges posed by cyclicality, seasonality and inflation, among other things, in a variety of ways as appropriate and as needed for their business.
Regulatory Environment
We are subject to extensive U.S. state and federal, as well as international, regulation and supervision in the jurisdictions in which we do business. Regulations vary from jurisdiction to jurisdiction. Additionally, as a company with publicly traded securities, we are also subject to certain legal and regulatory requirements applicable generally to public companies, including the rules and regulations of the U.S. Securities and Exchange Commission (SEC) and the New York Stock Exchange relating to reporting and disclosure, accounting and financial reporting, corporate governance and other matters.
The following is a summary of significant regulations that apply to our businesses, but it is not intended to be a comprehensive review of every regulation to which we are subject. For information regarding certain risks associated with regulations applicable to our businesses, see Item 1A Risk Factors.
Group Insurance Regulation and Supervision
Group Supervision - Global Supervisory College; Global Common Framework. Regulators within and outside the U.S. are increasingly coordinating the regulation of multinational insurers by conducting a supervisory college. A supervisory college is a forum of the regulators having jurisdictional authority over an insurance holding company's worldwide insurance subsidiaries. The supervisory college meets with executive management to evaluate the insurance group on both a group-wide and legal-entity basis, particularly with respect to its financial data, business strategies, enterprise risk management and corporate governance. The Illinois Department of Insurance is our lead insurance regulator for purposes of conducting our supervisory college.
In 2020, the International Association of Insurance Supervisors adopted its Common Framework for the Supervision of Internationally Active Insurance Groups (ComFrame). ComFrame establishes a comprehensive framework for supervisors to address group-wide activities and risks of internationally active insurance groups (IAIGs) and lays the groundwork for better supervisory cooperation and coordination. ComFrame requires the designation of a group-wide supervisor (regulator) for each IAIG and imposes a group capital requirement that will be applied to an IAIG in addition to the current legal entity capital requirements imposed by state and international insurance regulators. In response to ComFrame, the National Association of Insurance Commissioners (NAIC) revised the model Insurance Holding Company System Regulatory Act to allow state insurance regulators in the U.S. to be designated as group-wide supervisors for U.S. based IAIGs. In 2023, it was determined that we meet the criteria to be identified as an IAIG. The Illinois Department of Insurance has been designated as our group-wide supervisor.
Holding Company Statutes. We also are subject to state statutes governing insurance holding company systems, which typically require that we periodically file information with the appropriate state insurance commissioner, including information concerning our capital structure, ownership, financial condition, dividend payments and other material transactions with affiliates, and general business operations. These statutes also require approval of changes in control of an insurer or an insurance holding company. Generally, "control" for these purposes is defined as ownership or voting power of 10% or more of a company's voting shares. We also must submit an annual group-level enterprise risk report, which provides information regarding material risks within the insurance holding company system that could pose enterprise risk to its U.S. insurance subsidiaries.
Own Risk and Solvency Assessment and Enterprise Risk Management. We must submit an Own Risk and Solvency Assessment Summary Report (ORSA) annually to our lead insurance regulator. The ORSA is a confidential internal assessment of the material and relevant risks associated with an insurer's current business plan and the sufficiency of capital resources to support those risks. In addition, we must file an annual enterprise risk report with our lead insurance regulator. The report must identify the material risks within the insurance holding company system that could pose enterprise risk to our U.S. insurance subsidiaries.
U.S. Insurance Regulation
State Regulation
Overview. Our U.S. insurance company subsidiaries are subject to varying degrees of regulation and supervision by the states and other jurisdictions in which they do business. In the U.S., authority for the regulation, supervision and administration of the business of insurance in each state is generally delegated to a state insurance commissioner who oversees a regulatory body responsible for the supervision of the business of insurance. State regulatory authorities have broad regulatory, supervisory and administrative powers relating to: solvency standards; corporate conduct; market conduct activities; regulating unfair trade and claims practices; licensing of insurers; licensing and appointment of agents; approval of forms and policies used; the nature of, and limitations on, insurers' investments; the form and content of annual statements and other reports on the financial condition of insurers; and establishment of loss reserves. States also regulate various aspects of the contractual relationships between insurers and independent agents. In addition, the NAIC, comprised of the insurance commissioners of each U.S. jurisdiction, develops or amends model statutes and regulations that, in turn, most states adopt.
Risk Based Capital Requirements. The NAIC uses a risk based capital (RBC) formula to measure the capital of an insurer, taking into account the company's investments and products. For property and casualty insurance companies, RBC requirements establish capital thresholds for four categories of risk: asset risk, insurance risk, interest rate risk and business risk.
Financial Exams. State insurance regulators also prescribe the form and content of statutory financial statements, perform periodic financial examinations of insurers regarding activities in their respective states, set minimum reserve and loss ratio requirements, establish standards for permissible types and amounts of investments and require minimum capital and surplus levels. These statutory capital and surplus requirements include RBC rules promulgated by the NAIC.
Statutory Accounting Principles. Each of our U.S. insurance companies is required to file detailed quarterly and annual reports, including financial statements, in accordance with prescribed statutory accounting rules. The quarterly and annual financial reports utilize statutory accounting principles (SAP) that are different from U.S. GAAP. In developing SAP, insurance regulators were primarily concerned with monitoring the solvency of insurance companies to assure an insurer's ability to pay all its current and future obligations to policyholders.
Rates and Form Filings. The policy forms and various premium rates of our U.S. admitted insurance subsidiaries are subject to regulation in every state in which they conduct business. In many states, rates and policy forms must be filed with the applicable insurance regulator prior to their use, and in some states, rates and forms must be affirmatively approved by the applicable insurance regulator prior to use.
Dividends. The laws of the domicile states of our U.S. insurance subsidiaries govern the amount of dividends that may be paid to our holding company, Markel Group. Generally, statutes in the domicile states of our insurance subsidiaries require prior approval for payment of extraordinary, as opposed to ordinary, dividends. See note 22 of the notes to consolidated financial statements included under Item 8.
Market Conduct. State insurance laws and regulations include numerous provisions governing trade practices and the marketplace activities of insurers, including provisions governing marketing and sales practices, data security, compliance of underwriting services to policyholders, confirmation of licensing and appointment of producers, claims management, anti-fraud controls and complaint handling. State regulatory authorities generally enforce these provisions through periodic market conduct examinations.
Investment Regulation. Investments by our U.S. insurance companies must comply with applicable laws and regulations that prescribe the kind, quality and concentration of investments. In general, these laws and regulations permit investments in federal, state and municipal obligations, corporate bonds, preferred and common equity securities, mortgage loans, real estate and certain other investments, subject to specified limits and certain other qualifications.
Cybersecurity; Data Privacy. Several states have enacted laws establishing cybersecurity requirements for financial services companies, including insurance companies, that require implementation of security measures for the monitoring, detection, prevention, mitigation and management of cybersecurity incidents. Several states also have enacted laws addressing data privacy concerns and the protection of consumer data.
Federal Regulation
The U.S. federal government and its regulatory agencies generally do not directly regulate the business of insurance. However, two federal government bodies, the Federal Insurance Office (FIO) and the Financial Stability Oversight Council (FSOC), each created under The Dodd Frank Wall Street Reform and Consumer Protection Act, may impact the regulation of insurance. Although the FIO is prohibited from directly regulating the business of insurance, it has authority to represent the U.S. in international insurance matters and has limited powers to preempt certain types of state insurance laws. The FIO also can recommend to the FSOC that it designate an insurer as an entity posing risks to the U.S. financial stability in the event of the insurer's material financial distress or failure. We have not been so designated. The U.S. federal laws that most affect our day-to-day insurance operations are: the Gramm-Leach-Bliley Act; the Fair Credit Reporting Act; the Health Insurance Portability and Accountability Act of 1996; the Terrorism Risk Insurance Act of 2002; anti-money laundering laws and regulations; the Nonadmitted and Reinsurance Reform Act of 2010; the Foreign Corrupt Practices Act, and the rules and regulations of the Office of Foreign Assets Control.
International Insurance Regulation
Overview.Our international insurance operations are subject to regulation and supervision in various jurisdictions. These regulations, which vary depending on the jurisdiction, include, among others, solvency and market conduct regulations; anti-corruption, anti-money laundering, and anti-terrorism financing guidelines, laws and regulations; various privacy, insurance, tax, tariff, trade and sanctions laws and regulations; and corporate, competition, employment, intellectual property and investment laws and regulations. Our international insurance operations are domiciled in the U.K., Europe and Bermuda and are subject to regulation in those jurisdictions. In addition, we conduct business in Canada, Asia, Australia and the Middle East, where our businesses also are supervised by local regulatory authorities.
U.K. and European Regulation. We are subject to regulation by the Prudential Regulatory Authority and Financial Conduct Authority in respect of our U.K. insurance businesses. We are also subject to regulation by the Federal Financial Supervisory Authority, better known by its abbreviation BaFin, in respect of our German insurance carrier.
Our U.K. and German insurance businesses are subject to both the E.U.'s General Data Protection Regulation (GDPR) and the Solvency II Directive (Solvency II).
GDPR requires businesses operating in the E.U., and businesses transacting with E.U. citizens, to comply with conditions for processing personal data. Following the U.K.'s exit from the E.U., GDPR was transposed into U.K. law. The E.U. has granted adequacy status to the U.K.'s data protection laws, valid until June 2025 with the possibility of renewal, meaning that they are deemed essentially equivalent to E.U. data protection laws.
Solvency II requires our U.K. and German businesses to maintain certain capital standards and publish risk-related information in the form of a Solvency and Financial Condition Report. Following the U.K.'s exit from the E.U., Solvency II also was transposed into U.K. law as retained law. The U.K. government, under the Financial Services and Markets Act 2023, has opted to repeal certain portions of retained E.U. law. This repeal will occur in stages and, where necessary, after replacement regulations designed for the U.K. are in place. This repeal of retained E.U. law includes reforms to Solvency II. The Prudential Regulation Authority has consulted on the reforms, to be known as Solvency UK, which are expected to be implemented in 2024.
Bermuda Regulation. The insurance industry in Bermuda is regulated by the Bermuda Monetary Authority (BMA). Under the Bermuda Insurance Act 1978, and related regulations and standards of the BMA, each Bermuda insurance company is subject to, among other things: licensing, capital, surplus and liquidity requirements; solvency standards; restrictions on dividends and distributions; and periodic examinations of the company and its financial condition. In addition, each insurance company must obtain prior approval of ownership and transfer of shares and maintain a principal office and appoint and maintain a principal representative in Bermuda. The BMA also requires that each insurance company contract for local services, such as corporate secretary and registered representative services, at market rates.
ILS Regulation
Our Nephila insurance-linked securities operations are subject to regulation and supervision by various regulatory authorities, both in the U.S. and internationally. Certain of our ILS subsidiaries are organized and regulated as follows:
•registered with the SEC as an investment adviser under the Investment Advisers Act of 1940,
•registered with the U.S. Commodity Futures Trading Commission as a commodity pool operator or a commodity trading advisor under the Commodity Exchange Act, and/or
•registered with the BMA as an insurance manager under the Bermuda Insurance Act 1978.
Certain other ILS subsidiaries serve as the investment manager to one or more private funds that are registered with the BMA under the Investment Funds Act 2006, as amended, or the Segregated Accounts Companies Act 2000, as amended. In addition, these operations include business relationships with certain U.S., U.K. and Bermuda insurance companies that are subject to U.S. and international insurance regulation as previously described in this "Regulatory Environment" section.
As a result, subsidiaries involved in our ILS operations are subject to regulations that may impose substantive and material restrictions and requirements on their operations, including, among other things: a broader fiduciary duty to act in the best interests of their clients; disclosure of information about our businesses and conflicts of interests to clients; maintenance of written policies and procedures; maintenance of extensive books and records; restrictions on the types of fees we may charge, including performance fees; restrictions on solicitation arrangements; requirements regarding engaging in transactions with clients; maintenance of an effective compliance program; and other restrictions and requirements applicable to custody of client assets, client privacy, advertising, pay-to-play prohibitions and cybersecurity; as well as possible sanctions, disciplinary actions or other penalties for non-compliance.
Markel Ventures Regulation
Our Markel Ventures businesses are subject to a wide variety of U.S. federal, state, and local laws and regulations, as well as international laws and regulations applicable to their international operations. Specifically, the most significant of these laws and regulations cover the following areas: safety, health, employment, the environment, transportation, U.S. and international trade, anti-corruption, data privacy and security and government contracts.
Human Capital
Our culture is our greatest asset and is defined by the Markel Style. Written in 1986, in preparation for our initial public offering, the Markel Style memorialized how we seek to operate our businesses and treat one another. It continues to provide our guiding principles across our diverse group of businesses. Key within the Markel Style is the encouragement to look for a better way to do things, to challenge management. We also seek spontaneity and flexibility and have a respect for authority, but disdain for bureaucracy. Our holding company and each of our businesses is managed in a way to accomplish these principles. Each of our businesses operates with a high degree of autonomy so long as they operate within the principles of the Markel Style. This allows our managers to make decisions that are best for their employees and customers, as well as our shareholders. We believe this high degree of empowerment leads to the satisfaction that comes from being trusted in the responsibilities one has been given.
Further outlined in the Markel Style is our creed of honesty and fairness in all our dealings; holding the individual's right to self-determination in the highest light; putting aside individual concerns in the spirit of teamwork; and providing an atmosphere in which people can reach their full potential. We greatly value our employees, encourage their career development and reward their pursuit of excellence, while also celebrating a diverse workforce.
At December 31, 2023, we had approximately 21,600 employees, of whom approximately 5,400 were employed within our insurance operations and approximately 16,200 were employed within our Markel Ventures operations.
Insurance
Our specialty insurance business, Markel, markets and underwrites specialty insurance products. Markel has a well-developed process to ensure effective performance management, including an embedded annual review process that enables goal setting, development planning and performance assessment. Markel has also established global leadership development programs for different levels of leadership at Markel, partnering with various schools to create leading-edge curricula in this area.
With the Markel Style as the foundation, Markel has identified five pillars of focus that relate to today's challenges and opportunities—diversity and inclusion, community, innovation, well-being, and recognition. This program is both company and employee led—collectively, we want to bring the values of the Markel Style to life with our actions, not just our words. The intent is to create an environment where employees are able to authentically bring their true selves to work, a place where all ideas are heard and diverse perspectives are valued, a culture that prioritizes innovation, the ability to make a difference for our local communities and the wider world, and a foundation for holding ourselves accountable for our own well-being and of those around us.
Employee health and overall well-being is a key priority, and we provide a range of employee and eligible partner plans and programs, including health and voluntary benefits. These offerings include a variety of financial protection programs to help our employees meet their unique investment and savings needs including life insurance, retirement savings with company contributions in most situations and an employee stock purchase plan. Comprehensive employee assistance programs are available in all of our major markets along with other well-being and fitness resources.
We rely on our employees' ideas and input to help make Markel a great place to work. For example, senior leadership conducts regular employee communication meetings, inclusive of question and answer sessions, across our insurance operations and provides opportunities for employees to share their ideas on how we can improve employee engagement. In addition, every two years we conduct a major, global employee engagement survey, which in early 2022 garnered 88% participation, and which enables us to identify, focus on and track progress against key engagement drivers and external norms for high performing companies. This survey has generated additional ideas for employee engagement, and we have made meaningful changes and improvements in our human capital practices based on this feedback. Plans are underway to conduct an employee engagement survey in early 2024. Additionally, Markel conducts regular pulse and employee net promoter score surveys on a departmental level across the organization throughout the year.
We are committed to embracing all aspects of diversity, including diversity of perspective, which we believe is crucial to sustainable success. Markel accordingly supports and encourages focused efforts to continue to build the diversity of our employee population and the inclusiveness of our culture. Our diversity and inclusion efforts seek to cultivate an inclusive environment in which every employee feels valued, respected and accepted. We believe this environment helps us increase creativity and innovation, foster business connections, serve our customers and maintain our market leadership.
Markel's global Diversity and Inclusion (D&I) Steering Committee comprises more than 15 senior managers who are charged with advising on D&I strategy and providing leadership support and advocacy for our D&I efforts. Our Human Resources leadership team works to further shape the D&I strategy for our global workforce, and to ensure the integration of our D&I efforts with our global talent acquisition and development processes. We have various early career programs open to a diverse range of applicants and a regional scholarship program that is focused on underrepresented groups.
Markel supports a range of employee-led D&I networks and resource groups, including our Markel Women's Network, BEAM (Black Engagement at Markel), PRISM (LGBTQ+), Jitneys (Young Professionals), Markel Asian Professionals Network, Markel Veterans Network, UN1DOS (Latin and Hispanic Network), and across our international operations, an Inclusion Network with connections to a number of the London market partner networks. All of these networks and organizations have put in place goals and programming that are focused on education and development, community engagement, talent acquisition and networking/support. Additionally, we continue our global sponsorship of Dive-In, the insurance industry's annual diversity and inclusion festival.
Markel Ventures
Our Markel Ventures operations are comprised of a diverse portfolio of businesses from different industries through which we own controlling interests. The Markel Ventures operations are viewed by management as separate and distinct from our insurance operations with local management teams that direct the strategy and day-to-day operations of their respective companies, including human capital matters. When making these acquisitions, we seek, among other things, businesses whose leadership teams demonstrate equal measures of both integrity and talent. As a result, each Markel Ventures business fosters a culture within their operations, and with their employees, that aligns with the principles of the Markel Style.
Item 1A. RISK FACTORS
A wide range of factors could materially affect our future prospects and performance. The matters addressed in Item 7 Management's Discussion and Analysis of Financial Condition and Results of Operations, including under "Safe Harbor and Cautionary Statement" and "Critical Accounting Estimates", and Item 7A Quantitative and Qualitative Disclosures About Market Risk, as well as other information included or incorporated in this report, describe many of the significant risks that could affect our businesses, results of operations and financial condition. We are also subject to the risks discussed below.
One or more of the risks discussed in this Item 1A. Risk Factors, and others we cannot anticipate, could have material adverse effects on our results of operations and financial condition; and the extent of these effects will depend, at least in part, on the scope, severity, frequency or duration of the specific event or circumstance. In addition, we may take steps to prevent, mitigate or manage potential risks or liabilities, and related developments, and some of those steps may have a material adverse effect on our results of operations and financial condition. Even if an unfavorable outcome does not materialize, these factors, and actions we may take in response, may have a material adverse impact on our reputation or result in substantial expense and disruption.
Headings and sub-headings for the Risk Factors below are for reference purposes only and are not intended to limit or affect in any way the meaning or scope of each Risk Factor.
Risks Primarily Related to Our Insurance Operations
Loss Exposures
We may experience losses or disruptions from catastrophes. As a company with significant property and casualty insurance underwriting operations, we may experience losses from man-made or natural catastrophes. Catastrophes include, but are not limited to, windstorms, hurricanes, earthquakes, tornadoes, derechos, hail, severe winter weather, floods and wildfires and may include pandemics and events related to terrorism, broad reaching cyberattacks, riots and political and civil unrest. While we employ catastrophe modeling tools in our underwriting process, we cannot predict how severe a potential catastrophe will be before it occurs. The extent of losses from catastrophes is a function of the total amount of losses incurred, the number of insureds affected, the frequency and severity of the events, the effectiveness of our catastrophe risk management program and the adequacy of our reinsurance coverage. Catastrophes can occur over numerous geographic areas; however, some catastrophes may produce significant damage in large, heavily populated areas. We offer insurance and reinsurance coverage against terrorist acts in connection with some of our programs, and in other instances we are legally required to offer terrorism insurance; in both circumstances, we actively manage our exposure, but if there is a covered terrorist attack, we could sustain material losses. In addition, catastrophes may have a material adverse effect on the investment management and incentive fees earned by our insurance-linked securities (ILS) operations and returns on our investments in ILS funds. Catastrophes also may result in significant disruptions in our insurance and other operations, as well as loss of income and assets. The impacts of climate change may increase the frequency and/or severity of weather-related catastrophes, which may result in elevated catastrophe-related losses or disruptions, which may be material.
The failure of any of the methods we employ to manage our loss exposures could have a material adverse effect on us. We seek to manage our loss exposures in a variety of ways, including adhering to maximum limitations on policies written in defined geographical zones, implementing maximum gross limits by coverage for each insured, establishing per risk and per occurrence limitations for each event, employing coverage restrictions and following prudent underwriting guidelines for each program written. We also seek to manage our loss exposures through geographic and industry diversification. Underwriting is a matter of judgment, involving assumptions about matters that are inherently unpredictable and beyond our control, and for which historical experience and probability analysis may not provide sufficient guidance. One or more future events could result in claims that substantially exceed our expectations, which could have a material adverse effect on our results of operations and financial condition. In addition, we seek to manage our loss exposures by policy terms, coverage exclusions and choice of legal forum. Disputes relating to coverage and choice of legal forum also arise. As a result, various provisions of our policies, such as choice of forum, or coverage limitations or exclusions, may not be enforceable in the manner we intend and some or all of our methods to manage loss exposures may prove ineffective.
The effects of emerging claim and coverage issues on our business are uncertain. As industry practices and legal, judicial, social and other environmental conditions change, unexpected and unintended issues related to claims and coverage may emerge. These issues could have a material adverse effect on our results of operations or financial condition by either broadening coverage beyond our underwriting intent or increasing the frequency and/or severity of claims. For example, rising costs, litigation funding, social inflation, including new or expanded theories of liability, higher adverse verdicts, and
legislative changes, such as extended statutes of limitations, may result in higher and more frequent claims over a longer reporting period than originally expected. In some instances, these changes may not become apparent until after we have issued insurance or reinsurance contracts that are affected by the changes. As a result, the full extent of liability under our insurance or reinsurance contracts may not be known for many years after a contract is issued.
We use analytical models to assist our decision making in key areas such as pricing, reserving and capital modeling and actual results may differ materially from the model outputs and related analyses. We use various modeling techniques and data analytics (e.g., scenarios, predictive and stochastic modeling, and forecasting) to analyze and estimate exposures, loss trends and other risks associated with our insurance and ILS businesses. This includes both proprietary and third-party modeled outputs and related analyses to assist us in, among other things, decision-making related to underwriting, pricing, capital allocation, reserving, investing, reinsurance and catastrophe risk. We incorporate numerous assumptions and forecasts about the future level and variability of policyholder behavior, loss frequency and severity, interest rates, equity markets, inflation, capital requirements, and currency exchange rates, among others. The modeled outputs and related analyses from both proprietary models and third-party models are subject to various assumptions, uncertainties, model design errors, complexities and the inherent limitations of any statistical analysis, including those arising from the use of historical internal and industry data and assumptions.
In addition, the modeled outputs and related analyses may from time to time contain inaccuracies, perhaps in material respects, including as a result of inaccurate inputs or applications thereof (whether due to data error, human error or otherwise). Consequently, actual results may differ materially from our modeled results. Our profitability and financial condition substantially depend on the extent to which our actual experience is consistent with assumptions we use in our models and ultimate model outputs. If, based upon these models or other factors, we misprice our products or fail to appropriately estimate the risks we are exposed to, our business, results of operations and financial condition may be materially adversely affected.
Loss Reserves
Our results may be affected because actual insured or reinsured losses differ from our loss reserves. Significant periods of time often elapse between the occurrence of an insured or reinsured loss, the reporting of the loss to us and our payment of that loss. To recognize liabilities for unpaid losses, we establish reserves as balance sheet liabilities representing estimates of amounts needed to pay reported and unreported losses and the related loss adjustment expenses. The process of estimating loss reserves is a difficult and complex exercise involving analytical models with many variables and subjective judgments. This process may also become more difficult if we experience a period of rising inflation, as has been the case since early 2021.
As part of the reserving process, we review historical data and consider the impact of various factors, such as:
•trends in claim frequency and severity;
•changes in operations;
•changes to mix of business, terms and conditions, limits and layers;
•emerging economic and social trends;
•trends in insurance rates;
•inflation or deflation; and
•changes in the regulatory and litigation environments.
This process assumes that past experience, adjusted for the effects of current developments and anticipated trends, is an appropriate basis for predicting future events. There is no precise method, however, for evaluating the impact of any specific factor on the adequacy of reserves, and actual results will differ from original estimates. As part of the reserving process, we regularly review our loss reserves and make adjustments as necessary. Future increases in loss reserves for our underwriting operations will, and for our programs services operations may, result in additional charges to earnings, which may be material.
In addition, as discussed above, we use analytical models to assist our decision making in loss reserving, and actual results may differ materially from the model outputs and related analyses.
There is generally greater uncertainty in estimating reserves for long-tail coverages, such as general liability, professional liability and workers' compensation, as they require a longer period of time for claims to be reported and settled. The impact of changes in economic and social inflation and medical costs are also more pronounced for long-tail coverages due to the longer settlement period. In addition, reinsurance reserves are subject to greater uncertainty than insurance reserves primarily because a reinsurer relies on (i) the original underwriting decisions and claims decisions made by ceding companies and (ii)
information and data from ceding companies. As a result, we are subject to the risk that our ceding companies may not have adequately evaluated the risks reinsured by us and the premiums ceded may not adequately compensate us for the risks we assume. In addition, reinsurance reserves may be less reliable than insurance reserves because there is generally a longer lapse of time from the occurrence of the event to the reporting of the loss or benefit to the reinsurer and ultimate resolution or settlement of the loss. Reserves for contracts for which we are not the primary insurer, and participate only in excess layers of loss, are also subject to greater uncertainty than insurance reserves for contracts for which we are the primary insurer for many of the same reasons as reinsurance reserves.
Changes in the assumptions and estimates used in establishing reserves for our life and annuity reinsurance book could result in material increases in our estimated loss reserves for such business. Our run-off life and annuity reinsurance book exposes us to mortality risk, which is the risk that the level of death claims may differ from that which we assumed in establishing the reserves for our life and annuity reinsurance contracts. Some of our life and annuity reinsurance contracts expose us to longevity risk, which is the risk that an insured person will live longer than expected when the reserves were established, or morbidity risk, which is the risk that an insured person will become critically ill or disabled. Our reserving process for the life and annuity reinsurance book is designed with the objective of establishing appropriate reserves for the risks we assumed. Among other things, this process relies heavily on analysis of mortality, longevity and morbidity trends, lapse rates, interest rates and expenses. As of December 31, 2023, our reserves for life and annuity benefits totaled $649.1 million.
We expect mortality, morbidity, longevity, and lapse experience to fluctuate somewhat from period to period, but believe they should remain reasonably predictable over a period of many years. Mortality, longevity, morbidity or lapse experience that is less favorable than the mortality, longevity, morbidity or lapse rates that we used in establishing the reserves for a reinsurance agreement will negatively affect our net income because the reserves we originally set for the risks we assumed may not be sufficient to cover the future claims and expense payments. Furthermore, even if the total benefits paid over the life of the contract do not exceed the expected amount, unexpected increases in the incidence of deaths or illness can result in changes to our assumptions in a given reporting period, adversely affecting our net income in any particular reporting period. If there are adverse changes to any of the above factors, a charge to earnings may be recorded, which may have a material adverse effect on our results of operations and financial condition.
Ceded Reinsurance
We may be unable to purchase reinsurance protection on terms acceptable to us, or we may be unable to collect on reinsurance we purchase.loss recoveries from reinsurers. Our underwriting operations purchase reinsurance and retrocessional reinsurance to manage our net retention on individual risks and mitigate the volatility of losses on our results of operations and financial condition, while providing us with the ability to offer policies with sufficient limits to meet policyholder needs. In addition, we reinsure substantially all of the risks inherent in our program services business,and other fronting businesses, however, we have certain programs that contain limits on our reinsurers' obligations to us that expose us to underwriting risk, including loss ratio caps, aggregate reinsurance limits or exclusion of the credit risk of producers. See note 1012 of the notes to consolidated financial statements included under Item 8 for information about ceded reinsurance for our program services and other fronting businesses.
The ceding of insurance does not legally discharge us from our primary liability for the full amount of the policies. Reliance on reinsurance recoveries may create credit risk as a result of the reinsurer's inability or unwillingness to pay reinsurance claims when due. We generally select well capitalized and highly rated reinsurers and in certain instances we require reinsurers to post substantial collateral to secure the reinsured risks. Deterioration in the credit quality of existing reinsurers or disputes over the terms of reinsurance could result in charges to earnings, which may have a material adverse effect on our results of operations and financial condition. In addition, collateral may not be sufficient to cover the reinsurer's obligation to us, and we may not be able to cause the reinsurer to deliver additional collateral.
As of December 31, 2020,2023, we were the beneficiary of letters of credit, trust accounts and funds withheld in the aggregate amount of $3.8$5.1 billion, collateralizing $6.0$9.2 billion in reinsurance recoverables. The remaining unsecured reinsurance recoverables are ceded to highly-rated, well capitalized reinsurers. Our reinsurance recoverables are based on estimates, and our actual liabilities may exceed the amount we are able to recover from our reinsurers or any collateral securing the liabilities.reinsurance recoverables. The failure of a reinsurer to meet its obligations to us, whether due to insolvency, dispute or other unwillingness or inability to pay, or due to our inability to access sufficient collateral to cover our liabilities, could have a material adverse effect on our results of operations and financial condition.
The availability and cost of reinsurance are determined by market conditions beyond our control. There is no guarantee that our desired amounts of reinsurance or retrocessional reinsurance will be available in the marketplace in the future. In addition, available capacity may not be on terms we deem appropriate or acceptable or with companies with whom we want to do business. This could impact our ability to write certain products and have a material adverse effect on our results of operations and financial condition.
Market Competition and Broker Reliance
Competition in the insurance and reinsurance markets could reduce profits from our insurance operations. Insurance and reinsurance markets are highly competitive. We compete on an international and regional basis with major U.S.United States (U.S.), Bermuda, U.K.United Kingdom (U.K.), European, and other international insurers and reinsurers and with underwriting syndicates, some of which have greater financial, marketing, and management resources than we do, have greater access to "big data," and may be able to offer a wider range of, or more sophisticated, commercial and personal lines products. Recent industry consolidation, including business combinations among insurance and other financial services companies, has resulted in larger competitors with even greater financial resources. In addition, capital market participants have created alternative products that are intended to compete with reinsurance products.
Similar to other industries, the insurance industry is undergoing rapid and significant technological and other changes. There is increasing focus by traditional insurance industry participants, technology companies, "InsurTech" start-up companies and others on using technology and innovation to simplify and improve the customer experience, increase efficiencies, redesign products, alter business models and effect other potentially disruptive changes in the insurance industry. If we do not anticipate, keep pace with and adapt to technological and other changes impacting the insurance industry, it will harm our ability to compete, decrease the value of our products to customers, and materially and adversely affect our business. Furthermore, innovation, technological change and changing customer preferences in the markets in which we operate also pose other risks to our businesses. For example, they could result in increasing our service, administrative, policy acquisition or general expenses as we seek to distinguish our products and services from those of our competitors or otherwise keep up with such innovation and changes.
Increased competition could result in fewer submissions, lower premium rates, and less favorable policy terms and conditions, which could reduce our underwriting profits, or within our ILSprogram services and Program Servicesother fronting operations, our operating profits, and have a material adverse effect on our results of operations and financial condition.
The historical cyclicality in the property and casualty insurance industry could have a material adverse effect on our ability to improve or maintain underwriting profits or to grow or maintain premium volume. The insurance and reinsurance markets have historically been cyclical, characterized by extended periods of intense price competition due to excessive underwriting capacity, and more recently alternative sources of capital, as well as brief periods when shortages of capacity permitted more favorable rate levels. Among our competitive strengths have been our specialty product focus and our niche market strategy. These strengths also make us vulnerable in periods of intense competition to actions by other insurance companies who seek to write additional premiums without appropriate regard for underwriting profitability. At times it could be very difficult for us to grow or maintain premium volume levels without sacrificing underwriting profits. If we are not successful in maintaining rates or achieving rate increases, it may be difficult for us to improve or maintain underwriting profits or to grow or maintain premium volume levels.
Insurance Operations
Our efforts to develop new products, expand in targeted markets or improve business processes and workflows may not be successful and may increase or create new risks. From time to time, to protect and grow market share or improve our efficiency, we invest in strategic initiatives to:
•develop products that insure risks we have not previously insured, include new coverages or change coverage terms;
•change commission terms;
•change our underwriting processes;
•improve business processes and workflow to increase efficiencies and productivity and to enhance the experience of our customers and producers;
•expand distribution channels; and
•enter geographic markets where we previously have had relatively little or no market share.
We may not be successful in these efforts, and even if we are successful, they may increase or create the following risks, among others:
•demand for new products or expansion into new markets may not meet our expectations;
•new products and expansion into new markets may increase or change our risk exposures, and the data and models we use to manage those exposures may not be as effective as those we use in existing markets or with existing products;
•models underlying automated underwriting and pricing decisions may not be effective;
•efforts to develop new products or markets or to change commission terms may create or increase distribution channel conflicts;
•in connection with the conversion of existing policyholders to a new product, some policyholders' pricing may increase while the pricing for other policyholders may decrease, the net impact of which could negatively impact retention and profit margins; and
•changes to our business processes or workflow, including the use of new technologies, may give rise to execution risk.risk; and
•increased usage of artificial intelligence by us and third parties and the evolving regulatory landscape may increase underwriting and regulatory risk, while also presenting opportunity risk if we do not leverage artificial intelligence appropriately.
These efforts may require us to make substantial expenditures, which may negatively impact results in the near term, and if not successful, could materially and adversely affect our results of operations.
We depend on a few brokers for a large portion of our revenues and the loss of business provided by any one of them could have a material adverse effect on us. We market our insurance and reinsurance worldwide through insurance and reinsurance brokers. For the year ended December 31, 2020,2023, our top twofive independent brokers represented 31%37% of the gross premiums written by our underwriting operations. Loss of all or a substantial portion of the business provided by one or more of these brokers could have a material adverse effect on our business.
Financial Strength and Credit Ratings
Our insurance companies and senior debt are rated by various rating agencies, and a downgrade or potential downgrade in one or more of these ratings could have a material adverse effect on us. Financial strength ratings are an important factor in establishing the competitive position of insurance and reinsurance companies. Our senior debt ratings also affect the availability and cost of capital. Certain of our insurance and reinsurance company subsidiaries and our senior debt securities are rated by various rating agencies. Our financial strength and debt ratings are subject to periodic review, and are subject to revision or withdrawal at any time. The financial strength ratings of our insurance subsidiaries are significantly influenced by their statutory surplus amounts and leverage and capital adequacy ratios and other financial metrics. Rating agencies may implement changes to their ratings methodologies or internal models that have the effect of increasing or decreasing the amount of capital our insurance subsidiaries must hold or restrict how the company may deploy its capital in order to maintain its current ratings. For example, for certain of our insurance subsidiaries, rating agencies may take into account in their calculations the collateral provided to us by reinsurers. A change in this practice could adversely impact our ratings. We cannot be sure that we will be able to retain our current, or any future, ratings. If our ratings are reduced from their current levels by one or more rating agencies, our competitive position in our target markets within the insurance industry could suffer and it would be more difficult for us to market our products. A ratings downgrade could result in a substantial loss of business as policyholders and ceding company clients move to other companies with higher claims-paying and financial strength ratings. In addition, a downgrade could trigger contract provisions that allow cedents to terminate their reinsurance contracts on terms disadvantageous to us or require us to collateralize our obligations through trusts or letters of credit. A ratings downgrade could also have a material adverse effect on our liquidity, including the availability of our letter of credit facilities, and limit our access to capital markets, increase our cost of borrowing or issuing debt and require us to post collateral.
The amount of capital that our insurance subsidiaries have and must hold to maintain their financial strength and credit ratings and meet other requirements can vary significantly from time to time and is sensitive to a number of factors, some of which are outside of our control. Capital requirements for our insurance subsidiaries are prescribed by the applicable insurance regulators, while rating agencies establish requirements that inform ratings for our insurance subsidiaries and senior debt securities. Projecting surplus and the related capital requirements is complex and requires making assumptions regarding how our business will perform within the broader macroeconomic environment. Insurance regulators and rating
agencies evaluate company capital through financial models that calculate minimum capitalization requirements based on risk-based capital formulas for property and casualty insurance groups and their subsidiaries. In any particular year, capital levels and risk-based capital requirements may increase or decrease depending on a variety of factors including the mix of business written by our insurance subsidiaries and correlation or diversification in the business profile, the amount of additional capital our insurance subsidiaries must hold to support business growth, the value of securities in our investment portfolio, changes in interest rates and foreign currency exchange rates, as well as changes to the regulatory and rating agency models used to
determine our required capital. In addition, in December 2020, the NAIC adopted a group capital calculation (GCC) for U.S. based global insurance groups, along with model legislative language designed to enable the GCC once adopted by state legislatures. The first formal filings of a GCC are expected to occur in 2022. Even though it is not intended to be a prescribed capital requirement, the GCC, once implemented, could have an impact on the amount of group capital we are required to hold and how it is allocated.
Insurance Regulation
Our insurance subsidiaries are subject to supervision and regulation that may have a material adverse effect on our operations and financial condition. Our insurance subsidiaries are subject to supervision and regulation by the regulatory authorities in the various jurisdictions in which they conduct business, including state, nationalforeign and internationalU.S. state insurance regulators. Regulatory authorities have broad regulatory, supervisory and administrative powers relating to, among other things, data protection and data privacy, cybersecurity, solvency standards, licensing, coverage requirements, product terms and conditions, policy rates and forms, business and claims practices, disclosures to consumers, and the form and content of financial reports. RegulatoryIn some instances, we follow practices based on our interpretations of regulations or practices that we believe may be generally followed by the industry. These practices may turn out to be different from the interpretations of regulatory authorities. Insurance regulatory authorities have broad authority to initiate investigations or other proceedings, and, in connection with a failure to comply with applicable laws and regulations, could impose adverse consequences, including fines, penalties, injunctions, denial or revocation of an operating license or approval, increased scrutiny or oversight, limitations on engaging in a particular business, or redress to clients. These actions also could result in negative publicity, reputational damage or harm to client, employee or other relationships. Additionally, regulatory and legislative authorities continue to implement enhanced or new regulatory requirements to assure the stability of insurance companies or enhance policyholder protections or, in certain instances, intended to prevent or mitigate future financial crises or otherwise assure the stability of financial institutions.crises. Regulatory authorities also may seek to exercise their supervisory or enforcement authority in new or more extensive ways, such as imposing increased capital requirements. These actions, if they occur, could affect the competitive market, andas well as the way we conduct our business andor manage our capital, and could result in lower revenues and higher costs. As a result, such actions could have a material adverse effect on our results of operations and financial condition.
Regulators may challenge our use of fronting arrangements in states in which our capacity providers are not licensed. Our program services and other fronting business enters into fronting arrangements with general agents and domestic and foreign insurers that want to access specific U.S. property and casualty insurance business in states in which the capacity providers are not licensed or are not authorized to write particular lines of insurance. Some state insurance regulators may object to these fronting arrangements. In certain states, an insurance commissioner has the authority to prohibit an authorized insurer from acting as an issuing carrier for an unauthorized insurer. In addition, insurance departments in states in which there is no such statutory or regulatory prohibition, could deem the assuming insurer to be transacting insurance business without a license and the issuing carrier to be aiding and abetting the unauthorized sale of insurance.
If regulators in any of the states where we conduct our fronting business were to prohibit or limit those arrangements, we would be prevented or limited from conducting that business for which a capacity provider is not authorized in those states, unless and until the capacity provider is able to obtain the necessary licenses. This could have a material adverse effect on our results of operations and financial condition.
Insurance-Linked Securities
Our ILS operations and our management of third-party capital may expose us to risks. Some of our operating subsidiaries may owe certain legal duties and obligations to third-party investors. A failure to fulfill any of those duties or obligations could result in significant liabilities, penalties or other losses, and harm our businesses and results of operations. In addition, third-party investors may decide not to renew their investments in the funds we manage, which could materially impact the financial condition of those funds, and could, in turn, have a material adverse effect on our results of operations and financial condition. Moreover, we may not be able to maintain or raise additional third-party capital for the funds we manage or for potential new funds and therefore we may forego existing or potential fee income and other income generating opportunities. For example, investment performance at Nephila, as well as the broader ILS market, has been adversely impacted by consecutive years of elevated catastrophe losses, as well as by the COVID-19 pandemic in 2020. These events, as well as volatility in the capital markets, also have impacted investor decisions around allocation of capital to ILS, which in turn have impacted, and may continue to impact, our capital raises and redemptions within the funds we manage, as well as new funds, resulting in a decline in assets under management. See "Critical Accounting Estimates - Goodwill and Intangible
Assets" under Item 7. Management's Discussion & Analysis of Financial Condition and Results of Operations for discussion and considerations of these impacts on the valuation of goodwill and intangible assets attributed to our Nephila ILS operations.
Risks Primarily Related to Our Investments and Access to Capital
Changes in Economic Conditions
Our investment results may be impacted by changes in interest rates, U.S. and international monetary and fiscal policies as well as broader economic conditions. We receive premiums from customers for insuring their risks. We invest these funds until they are needed to pay policyholder claims. Fluctuations in the value of our investment portfolio can occur as a result of changes in interest rates and U.S. and international fiscal, monetary and trade policies as well as broader economic conditions (including, for example, equity market conditions and significant or prolonged inflation or deflation). Although we attempt to take measures to manage the risks of investing in these changing environments, we may not be able to mitigate our sensitivity to them effectively. Despite our mitigation efforts, which include duration and currency targets for asset portfolios, compliance monitoring of these targets and means to reasonably and effectively match asset duration and currency to the duration and currency of the loss reserves, changes in interest rates and U.S. and international fiscal, monetary and trade policies as well as broader economic conditions could have a material adverse effect on our investment results.results and, consequently, our results of operations and financial condition.
We invest a significant portion of our shareholders' equity in equity securities, which may result in significant variability in our investment results and net income and may have a material adverse effect on shareholders' equity. Additionally, our equity investment portfolio is concentrated, and declines in the value of these significant investments could have a material adverse effect on our financial results.results and on our ability to carry out our business plans. Equity securities were 55%64% and 69%58% of our shareholders' equity at December 31, 20202023 and 2019,2022, respectively. Equity securities have historically produced higher returns than fixed maturity securities over long periods of time; however, investing in equity securities may result in significant variability in investment returns from one period to the next. In volatile financial markets, we could experience significant declines in the fair value of our equity investment portfolio, which would result in a material decrease in net income and shareholders' equity. Our equity portfolio is concentrated in particular issuers and industries and, as a result, a decline in the fair value of these
concentrated investments also could result in a material decrease in net income and shareholders' equity. A material decrease in shareholders' equity may have a material adverse effect on our ability to carry out our business plans.
Access to Capital
We may require additional capital in the future, which may not be available or may only be available on unfavorable terms. To the extent that cash flows generated by our operations are insufficient to fund future operating requirements, or that our capital position is adversely impacted by a decline in the fair value of our investment portfolio, losses from catastrophe events or otherwise, we may need to raise additional funds through financings or curtail our growth. We also may be required to liquidate fixed maturity securities or equity securities, which may result in realized investment losses. Any further sources of capital, including capacity needed for letters of credit, if available at all, may be on terms that are unfavorable to us. Our access to additional sources of capital will depend on a variety of factors, such as market conditions, the general availability of credit, the availability of credit to the industries in which we operate, our results of operations, financial condition, credit ratings and credit capacity, as well as pending litigation or regulatory investigations. Our ability to borrow under our revolving credit facility and letter of credit facilities is contingent on our compliance with the covenants and other requirements under those facilities. Similarly, our access to capital may be impaired if regulatory authorities or rating agencies take negative actions against us. Our inability to obtain adequate capital when needed could have a negative impact on our ability to invest in, or take advantage of opportunities to expand, our businesses, such as possible acquisitions or the creation of new ventures, and inhibit our ability to refinance our existing indebtedness on terms acceptable to us. Any of these effects could have a material adverse effect on our results of operations and financial condition.
OurA failure to comply with covenants and other requirements under our revolving credit facility,facilities, senior debt and other indebtedness could have a material adverse effect on us. The agreements and indentures relating to our revolving credit facility,facilities, senior debt and other indebtedness, including letter of credit facilities used by certain of our insurance subsidiaries, contain covenants and other requirements. If we fail to comply with those covenants or requirements, the lenders, noteholders or counterparties under those agreements and indentures could declare a default and demand immediate repayment of all amounts owed to them. In addition, where applicable, our lenders may cancel their commitments to lend or issue letters of credit or require us to pledge additional or a different type of collateral. A default under one debt agreement may also put us at risk of a cross-default
under other debt agreements or other arrangements. Any of these effects could have a material adverse effect on our results of operations and financial condition.
Our liquidity and our ability to meet our debt and other obligations, and pay dividends on our preferred stock, depend on the receipt of funds from our subsidiaries. We are a holding company, and as a result, our cash flow and our ability to meet our debt and other obligations, and pay dividends on our preferred stock, depend upon the earnings of our subsidiaries and on the distribution of earnings, loans or other payments by our subsidiaries to us. The payment of dividends by our insurance subsidiaries, which account for a significant portion of our operating cash flows, may require prior regulatory notice or approval or may be restricted by capital requirements imposed by regulatory authorities. Similarly, our insurance subsidiaries may require capital contributions from us to satisfy their capital requirements. In addition, our reinsurance contracts typically allow the cedent, upon a reduction in an insurance company's capital in excess of specified amounts, to terminate its contract on terms disadvantageous to us or to exercise other remedies that may adversely affect us. Those contract provisions may have the effect of limiting distributions by our insurance subsidiaries to us.
Risks Primarily Related to Our ILS Operations
We may be exposed to risk in connection with our management of third party capital. Some of our operating subsidiaries may owe certain legal duties and obligations to third party investors. A failure to fulfill any of those duties or obligations could result in significant liabilities, penalties or other losses, and harm our businesses and results of operations. In addition, third party investors may decide not to renew their investments in the funds we manage, which could materially impact the financial condition of those funds, and could, in turn, have a material adverse effect on our results of operations and financial condition. Moreover, we may not be able to maintain or raise additional third party capital for the funds we manage or for potential new funds and therefore we may forego existing or potential fee income and other income generating opportunities.
Developments at our Markel CATCo operations could have a material adverse effect on us. In December 2018, the U.S. Department of Justice, U.S. Securities and Exchange Commission and Bermuda Monetary Authority initiated inquiries into loss reserves recorded in late 2017 and early 2018 at Markel CATCo Re (the Markel CATCo Inquiries). Subsequently, several related putative class actions were filed against Markel Corporation and certain present or former officers and directors alleging violations of the federal securities laws relating to the matters that are the subject of the Markel CATCo Inquiries. Those actions were consolidated and were voluntarily dismissed. See Item 3 Legal Proceedings and note 19 of the notes to
consolidated financial statements included under Item 8 for more information regarding the Markel CATCo Inquiries and other matters related to Markel CATCo. The Markel CATCo Inquiries and the related matters, as well as other matters of which we are currently unaware, could result in additional claims, litigation, investigations, enforcement actions or proceedings. For example, additional litigation may be filed by investors in the Markel CATCo Funds. We also could become subject to increased regulatory scrutiny, investigations or proceedings in any of the jurisdictions where we operate. If any regulatory authority takes action against us or we enter into an agreement to settle a matter, we may incur sanctions or be required to pay substantial fines or implement remedial measures that could prove costly or disruptive to our businesses and operations. An unfavorable outcome in one or more of these matters, and others we cannot anticipate, could have a material adverse effect on our results of operations and financial condition. In addition, we may take steps to mitigate potential risks or liabilities that may arise from the Markel CATCo Inquiries and related developments, and some of those steps may have a material impact on our results of operations or financial condition. Even if an unfavorable outcome does not materialize, these matters, and actions we may take in response, could have an adverse impact on our reputation, limit our access to capital markets and result in substantial expense and disruption.
Risks Related to All of Our Operations
Legal and Regulatory Risks
The legal and regulatory requirements applicable to our businesses are extensive. Failure to comply could have a material adverse effect on us.Each of our businesses is highly dependent on the ability to engage on a daily basis in a large number of financial and operational activities, including, among others, insurance underwriting, claim processing, investment activities, the management of third partythird-party capital and providing products and services to businesses and consumers, many of which are highly complex. These activities are subject to internal guidelines and policies, as well as legal and regulatory requirements, including, among others, those related to privacy and data security, economic and trade sanctions, anti-corruption, anti-bribery and global finance and investments, customer protection and insurance matters. Our continued expansion into new businesses, distribution channels and markets has broughtbrings about additional requirements. While we believe that we have adopted adequate and effective risk management and compliance programs, compliance risks remain, particularly as we become subject to additional rules and regulations. Failure to comply with, or to obtain, appropriate authorizations or exemptions under any applicable laws and regulations could result in restrictions on our ability to do business or undertake activities that are regulated in one or more of the jurisdictions in which we conduct business. Any such failure could also subject us to fines, penalties, equitable relief and changes to our business practices. In addition, a failure to comply could result in defaults under our senior unsecured debt agreements or credit facilities or damage our businesses or our reputation.
Compliance with applicable laws and regulations is time consuming and personnel- and systems-intensive. Shareholder activism, the current political environment, and the current high level of government intervention and regulatory reform may lead to substantial and complex new regulations and compliance obligations. Any changes in, or the enactment of new, applicable laws and regulations may increase the complexity of the regulatory environment in which we operate, which could materially increase our direct and indirect costs for compliance costs and other expenses of doing business, and have a material adverse effect on our results of operations and financial condition. For example, failure to implement data management and security controls in the use of artificial intelligence by us or third party providers may subject us to data privacy, intellectual property and general regulatory risk, particularly in light of emerging regulation on the use of artificial intelligence.
Losses from legal and regulatory actions may have a material adverse effect on us. From time to time we may be involved in various legal actions, including at times multi-party or class action litigation, some of which involve claims for substantial or indeterminate amounts. A significant unfavorable outcome in one or more of these actions could have a material adverse effect on our results of operations and financial condition. We are also involved from time to time in various regulatory actions, investigations and inquiries, including market conduct exams by insurance regulatory authorities. If a regulatory authority takes action against us or we enter into a consent order or agreement to settle a matter, a regulatory authority has the option to require us to pay substantial fines or implement remedial measures that could prove costly or disruptive to our businesses and operations. Even if an unfavorable outcome does not materialize, these matters could have an adverse impact on our reputation and result in substantial expense and disruption. See note 1921 of the notes to consolidated financial statements included under Item 8 and Item 3 Legal Proceedings.
We are subject to laws and regulations relating to economic and trade sanctions and bribery and corruption, the violation of which could have a material adverse effect on us. We are required to comply with the economic and trade sanctions and embargo programs administered by the U.S. Department of the Treasury's Office of Foreign Assets Control and similar multi-national bodies and governmental agencies worldwide, as well as applicable anti-corruption laws and anti-bribery laws and regulations of the U.S. and other jurisdictions where we operate. In some cases, we must comply with many new
economic, financial and trade sanctions that are imposed over a short period of time, as occurred with the Russia-Ukraine conflict. A violation of a sanction, embargo program, or anti-corruption law could subject us, and individual employees, to a regulatory enforcement action as well as significant civil and criminal penalties. In addition, a violation could result in defaults under our outstanding indebtedness or credit facilities or
damage our businesses or our reputation. Those penalties or defaults, or damage to our businesses or reputation, could have a material adverse effect on our results of operations and financial condition. In some cases, the requirements and limitations applicable to the global operations of U.S. companies and their affiliates are more restrictive than, and may even conflict with, those applicable to non-U.S. companies and their affiliates, which also could have a material adverse effect on our results of operations and financial condition.
Employee error and misconduct may be difficult to detect and prevent and may result in significant losses. There have been a number of cases involving misconduct by employees in a broad range of industries in recent years, and weWe run the risk of misconduct by employees across our employees.businesses. Instances of misconduct, fraud, illegal acts, errors, failure to document transactions properly or to obtain proper internal authorization, or failure to comply with regulatory requirements or our internal policies may result in losses.losses or reputational damage. It is not always possible to detect, deter or prevent employee errors or misconduct or fraud, and the controls and trainings that we have in place to prevent and detect this activitymitigate these activities may not be sufficient or effective in all cases.
Global Operations
We manage our global operations through a network of business entities, which could result in inconsistent management, governance and oversight practices. We manage our global operations through a network of business entities throughoutlocated in the U.S., Bermuda, the U.K., Europe, Canada, Latin America, Asia Pacific and the Middle East.East, Asia and Australia. These business entities are managed by executives, and supported by shared and centralized services, primarily at the holding company level;services; however, for certain of our businesses, subsidiary-level management is responsible for day-to-day operations, profitability, personnel decisions, the growth of the business, and legal and regulatory compliance, including adherence to applicable local laws. Operating through subsidiary-level management can make it difficult for us to implement strategic decisions and coordinated procedures throughout our global operations. In addition, some of our business entities operate with management, sales, and support personnel that may be insufficient to support growth in their respective locations and industries, without significant central oversight and coordination. We continue to enhance our operating,management, governance and oversight procedures to effectively support, and improve transparency throughout, our global operations and network of business entities; however, our operating strategy nonetheless could result in inconsistent management, governance, and oversight practices, which may have a material adverse effect on our results of operations and financial condition.
We have substantial international operations and investments, which expose us to increased political, civil, operational and economic risks. A substantial portion of our revenues and income is derived from our operations and investments outside the U.S., including from the U.K., Bermuda, Europe, Canada, Latin America, Asia Pacific and the Middle East.East, Asia and Australia. Our international operations and investments expose us to increased political, civil, operational and economic risks. Deterioration or volatility in foreign and international financial markets or general economic and political and civil conditions could adversely affect our operating results, financial condition and liquidity. Concerns about the economic conditions, capital markets, political, civil and economic stability and solvency of certain countries may contribute to global market volatility. Political and civil changes in the jurisdictions where we operate and elsewhere, some of which may be disruptive, can also interfere with our customers and our activities in a particular location. Our international operations also may be subject to a number of additional risks, particularly in emerging economies, including restrictions such as price controls, capital controls, currency exchange limits, ownership limits and other restrictive or anti-competitive governmental actions or requirements, which could have a material adverse effect on our businesses.
General economic, market or industry conditions could lead to investment losses, adverse effects on our businesses and limit our access to the capital markets. General economic and market conditions and industry specific conditions, including extended economic recessions or expansions; prolonged periods of slow economic growth; inflation or deflation; fluctuations and volatility in foreign currency exchange rates, commodity and energy prices and interest rates; volatility in the credit and capital markets; changes in U.S. government debt ratings; the imposition of tariffs and other changes in international trade regulation and other factors, could lead to: substantial realized and unrealized investment losses in future periods; declines in demand for, or increased frequency and severity of claims made under, our insurance products; disruptions in global supply chains and increased costs of inputs for our products and services; reduced demand for our services and the products we sell and distribute; changes in the carrying value of our other assets and liabilities; and limited or no access to the capital markets. Any of these impacts could have a material adverse effect on our results of operations, financial condition, debt and financial strength ratings or our insurance subsidiaries' capital. Markel Ventures businesses have been, and may continue to be, adversely affected by increased costs of labor and materials and declines in demand for certain products and services due to
economic and industry specific conditions. Our efforts to mitigate these impacts may not be successful and, even when they are successful, there may be a time lag before the impacts of these efforts are reflected in our results.
Our businesses, results of operations and financial condition could be adversely affected by ongoing regional or military conflicts and related disruptions in the global economy. The global economy has been, and may in the future be, negatively impacted by regional or military conflicts, for example, the on-going conflicts between Russia and Ukraine and between Israel and Hamas. We may have operations in areas affected by a conflict, and some of our businesses may be adversely affected by a conflict and its effects. Within our underwriting operations, we may have insurance contracts with exposure to losses attributed to a conflict. Our other operations also may have direct exposure to customers and vendors in an affected area. Certain of our businesses may experience shortages in materials and increased costs for transportation, energy, and raw materials due in part to the negative impact of a conflict on the global economy.
The exitFurthermore, governments in the U.S., U.K., and European Union, among others, may impose export controls on certain products and financial and economic sanctions on certain industry sectors and parties in affected areas. These export controls and sanctions, or our failure to comply with them, could result in restrictions on our ability to do business in one or more of the United Kingdom fromjurisdictions in which we conduct business or have the European Unionother adverse effects discussed above under this Item 1A. Risk Factors under "We are subject to laws and regulations relating to economic and trade sanctions and bribery and corruption, the violation of which could have a material adverse effect on us."
We are unable to predict the impact an ongoing conflict may have on our businesses or the global economy. The U.K. left the E.U. (Brexit) on January 31, 2020. The U.K. and the E.U. now exist as separate markets, with distinct legal and regulatory regimes. While certain aspectsimpact of the relationship between the U.K. and the E.U. have been agreed, including under the Trade and Cooperation Agreement that took effect January 1, 2021, many issuesgeopolitical tensions related to the provision of services between the U.K.these conflicts, including increased trade barriers or restrictions on global trade, is unknown and the E.U. have not been addressed, particularly for financial services.
The U.K.'s exit from the E.U. could continue to contribute to instabilityresult in, globalamong other things, heightened cybersecurity threats, supply disruptions, protracted or increased inflation, increased energy costs, lower consumer demand, fluctuations in interest and foreign exchange rates and increased volatility in financial markets, including foreign currency markets, and adversely affect European and worldwide economic or market conditions. Significant uncertainties remain related to the ultimate political, monetary and economic impactsany of Brexit, including related tax, accounting and financial reporting implications. Brexitwhich could also lead to legal and regulatory uncertainty and, a number, potentially large, of new and divergent national laws and regulations, including new tax rules and data privacy rules, as the U.K. and E.U. regulatory environments evolve. These impacts, combined with the legal and regulatory uncertainty, may adversely affect our operations and also may result in increased claims arising from the impact on our policyholders.
Any of these effects of Brexit, and others we cannot anticipate, could have a material adverse effect on ourbusinesses, results of operations and financial condition. In addition, an ongoing conflict may have the effect of triggering or intensifying many of the risks described under this Item 1A Risk Factors under Risks Primarily Related to Our Insurance Operations, Risks Primarily Related to Our Investments and Access to Capital, and Risks Related to All of Our Operations.
Acquisitions, Integration and Retention
We may not find suitable acquisition candidates or new ventures. As part of our growth strategy, we continue to evaluate possible acquisition transactionsReliance on an ongoing basis,Management and at any given time we may be engaged in discussions with respect to possible acquisitions and new ventures. We may not be able to identify suitable acquisition targets or ventures, any such transactions may not be financed or completed on acceptable terms and our future acquisitions or ventures may not be successful.Personnel
The integration of acquired companiesbusinesses may not be as successful as we anticipate. We have completed, and expect to complete, acquisitions in an effort to achieve profitable growth in our underwriting and other insurance operations and to create additional value on a diversified basis in our Markel Ventures operations. Acquisitions present operational, regulatory, strategic and financial risks, as well as risks associated with liabilities arising from the previous operations of the acquired companies.businesses. We also must make decisions about the degree to which we integrate acquisitions into our existing businesses, operations and systems, and over what timeframe. Those decisions may adversely affect how successfully the acquired businesses perform, both in the short termshort-term and in the long term.long-term. All of these risks are magnified in the case of a large acquisition. Integration of the operations, systems and personnel of acquired companiesbusinesses may prove more difficult than anticipated, which may result in failure to achieve financial objectives associated with the acquisition or diversion of management attention.attention and other resources. In addition, integration of formerly privately-held companies into the management and internal control and financial reporting systems of a publicly-held company presents additional risks. See note 3 of the notes to consolidated financial statements included under Item 8 for information about our recent acquisitions.
Impairment in the value of our goodwill or other intangible assets could have a material adverse effect on our operating results and financial condition. As of December 31, 2020,2023, goodwill and intangible assets totaled $4.4$4.2 billion and represented 34%28% of shareholders' equity. We record goodwill and intangible assets at fair value upon the acquisition of a business. Goodwill represents the excess of amounts paid to acquire businesses over the fair value of the net assets acquired. Goodwill and indefinite-lived intangible assets are evaluated for impairment annually, or more frequently if events or circumstances indicate that their carrying value may not be recoverable. Declines in operating results, divestitures, sustained market declines and other factors that impact the fair value of a reporting unit could result in an impairment of goodwill or intangible assets and, in turn, a charge to net income. Such a charge could have a material adverse effect on our results of operations or financial condition. Developments that adversely affect the future cash flows or earnings of an acquired business may cause the goodwill or intangible assets recorded for it to be impaired. See "Critical Accounting Estimates - Goodwill and Intangible Assets" included under Item 7 Management's Discussion and Analysis of Financial Condition and Results of Operations and note 68 of the notes to consolidated financial statements included under Item 8 for information about our goodwill and intangible assets.
The loss of, or failure to successfully implement succession planning for, one or more key executives or an inability to attract and retain qualified personnel in our various businesses could have a material adverse effect on us. Our success depends on our ability to retain the services of our existing key executives, implement successful succession planning and to attract and retain additional qualified personnel in the future. The temporary or permanent loss of the services of any of our key executives or the inability to hire and retain other highly qualified personnel in the future could have a material adverse effect on our ability to conduct or grow our business.
Additionally, in our decentralized business model, we rely on qualified personnel to manage and operate our various businesses.In our decentralized business model, we need qualified and competent management to direct day-to-day business activities of our operating subsidiaries and to manage changes in future business operations due to changing business or regulatory environments. Our operating subsidiaries also need qualified and competent personnel to execute business plans and serve their customers, suppliers and other stakeholders. Our inability to recruit, train and retain qualified and competent managers and personnel could negatively affect the operating results, financial condition and liquidity of our subsidiaries and Markel Group as a whole.
Information Technology Systems and Third-Party Systems and Service Providers
Information technology systems that we use could fail or suffer a security breach or cyberattack, which could have a material adverse effect on us or result in the loss of regulated or sensitive information. Our businesses are dependent upon the operational effectiveness and security of our enterprise systems and those maintained by third parties. Among other things, we rely on these systems to interact with producers, insureds, customers, clients, and other third parties, to perform actuarial and other
modeling functions, to underwrite business, to prepare policies and process premiums, to process claims and make claims payments, to prepare internal and external financial statements and information, as well as to engage in a wide variety of other business activities. A significant failure of our enterprise systems, or those of third parties upon which we may rely, whether because of a natural disaster, network outage or a cyber-attackcyberattack on those systems, including ransomware, could compromise our personal, confidential and proprietary information as well as that of our customers and business partners, impede or interrupt our business operations and could result in other negative consequences, including remediation costs, loss of revenue, additional regulatory scrutiny and fines, litigation and monetary and reputational damages. AlthoughIn addition, if we are unable to innovate, develop and acquire new technology, it may leave us more susceptible to these attacks. Like other companies, we have implementedbeen subject to cyberattacks, malicious viruses and malware, and denial of service attacks and expect that this will continue in the future with greater sophistication and frequency. Despite any controls and takeor protective actions to reduce the risk of an enterprise failure and protectwe take against a security breach, such attacks, those measures may be insufficient to prevent, or mitigate the effects of, a natural disaster, network outage or a cyber-attackcyberattack on our systems thatsystems. This could result in liability to us, cause our data to be corrupted or stolen and cause us to commit resources management time and money to prevent or correct those failures.
In addition, we are subject to numerous data privacy and cybersecurity laws and regulations enacted in the jurisdictions in which we do business. A misuse or mishandling of personal, confidential or proprietary information being sent to or received from a client,customer, business partner, employee or third party could damage our businesses or our reputation or result in significant monetary damages, regulatory enforcement actions, fines and criminal prosecution in one or more jurisdictions. For example, under the European General Data Protection Regulation there are significant new punishments for non-compliance which could result in a penalty of up to 4% of a firm's global annual revenue. In addition, a violation of data privacy laws and regulations could result in defaults under our outstanding indebtedness or credit facilities. Those monetary damages, penalties, regulatory or legal actions or defaults, or the damage to our businesses or reputation, could have a material adverse effect on our results of operations and financial condition. Third parties who we utilize to whom we outsourceperform certain functions are also subject to these risks, and their failure to adhere to these laws and regulations also could damage our businesses or reputation or result in regulatory intervention, which could have a material adverse effect on our results of operations and financial condition.
Further, we routinely transmit, receive and store personal, confidential and proprietary information by email and other electronicdigital means. Although we attempt to protect this personal, confidential and proprietary information, we may be unable to do so in all cases, especially with customers, business partners and other third parties who may not have or use appropriate controls to protect personal, confidential and proprietary information.
While we maintain cyber risk insurance providing first partyfirst-party and third partythird-party coverages, that insurance may not cover all costs associated with the consequences of personal, confidentialan enterprise failure, cyberattack, or proprietary information being compromised.breach of systems. A material cyber security breach could have a material adverse effect on our results of operations and financial condition.
Third-party providers may perform poorly, breach their obligations to us or expose us to enhanced risks. We outsource certainCertain of our business functions toare performed by third-party providers, and these providers may not perform as anticipatedexpected or may fail to adhere to the obligations owed to us. For example, certain of our business units rely on relationships with a number of third-party administrators under contracts pursuant to which these third-party administrators manage and pay claims on our behalf and advise us with respect to case reserves. In these relationships, we rely on controls incorporated in the provisions of the administration agreement, as well as on the administrator's internal controls, to manage the claims process within our prescribed parameters. In addition, certain of our business units use managing general agents, general agents and other producers to write and administer business on our behalf within prescribed underwriting authorities. Although we monitor these administrators, agents, producers and other service providers on an ongoing basis, our monitoring efforts may not be adequate, or our service providers could exceed their authorities or otherwise breach obligations owed to us, which could result in operational disruption, reputational damage and regulatory intervention and otherwise have a material adverse effect on our results of operation and financial condition.
In addition, we outsourceutilize third parties to perform certain technology and business process functions, to third partiessuch as data center hosting, cloud based operating environments, human resources and may do so increasingly in the future.other outsourced services. If we do not effectively develop and implement our outsourcing strategy, third partythese third-party providers do not perform as anticipated orexpected, we experience technological or other problems with a transition, we may not realize productivity improvements or cost efficiencies and may experience operational difficulties, increased costs and a loss of business.business, or we may not realize expected productivity improvements or cost efficiencies. Our outsourcinguse of third parties to perform certain technology and business process functions to third parties may expose us to enhanced riskrisks related to privacy and data security, including through their use of artificial intelligence without our knowledge or below our standards, which could result in monetary and reputational damages. We may be further exposed to risks associated with artificial intelligence and machine learning technology if third-party service providers or any counterparts, where known or unknown to us, use such technology in their business activities. In addition, our ability to receive services from third partythird-party providers might be impacted by cultural differences,a wide variety of factors, including political and civil instability, supply chain disruptions, volatility or disruptions in the financial markets, wide-spread health issues, unanticipated or additional regulatory requirements or policies. As a result, our ability to conduct our businessbusinesses may be adversely affected.
COVID-19 PandemicPandemics
The COVID-19 pandemic hasPandemics have had, and may continue tocould have, material adverse effects on us.The effects of the COVID-19a pandemic, and U.S. and internationalrelated governmental responses, aremay be wide-ranging, costly, disruptive and rapidly changing. The COVID-19 pandemic has had, and may continue to have,changing, resulting in material adverse effects on our underwriting, investment, Markel Ventures and other operations, and on our results of operations and financial condition.condition, as was the case with COVID-19. Factors that give rise, or may give rise, to those effects include, or may include, the following, as well as others that we cannot predict:
•Executive, legislativeInsured or regulatory mandatesreinsured losses from pandemic-related claims that are different, or more extensive, than we expect;
•Government actions or judicial decisions that require retroactive coverage of business interruption claims stemming from the COVID-19 pandemic orrelated to expand the scope of other types of insurance or reinsurance coverages or rates, including, for example, workers' compensation insurance;requiring retroactive coverage of claims or expanding the scope of coverage;
•Regulatory actions:
◦prohibitingDisputes, lawsuits and other legal actions challenging the promptness of coverage determinations, or postponing the cancellation or non-renewal of insurance policies in accordance with policy terms or requiring renewals on current terms and conditions;
◦requiring the coverage of losses irrespective of policy termsdeterminations themselves, under applicable insurance or exclusions;
◦relaxing policyholder reporting requirements forreinsurance policies, resulting in increased claims, which may affect coverage under our claims madelitigation and claims made and reported policies;
◦requiring or encouraging premium refunds;
◦granting extended grace periods for premium payments; and
◦extending due dates to pay past due premiums;
•Rapidly and dramatically changing business conditions and compliance obligations, including as a result of federal and state executive orders and regulatory guidance;related expenses;
•Disruptions, delays and increased costs and risks related to working remotely, having limited or no access to our facilities, workplace re-entry, employee safety concerns and reductions or interruptions of critical or essential services. Those effects may include, among others:
◦an inability, or a decreased ability, to provide our insurance and non-insurance products and services, provide customer service, pay third parties in a timely manner or perform other necessary business functions; and
◦exposure to additional and increased risks related to internal controls, data security and information privacy, for both us and for our suppliers, vendors and other third-parties with whom we do business;services;
•Illnesses suffered by key employees, or a significant percentage of our workforce or the workforce of our agents, brokers, suppliers or outsourcing providers, which could prevent or delay the performance of criticalContinually changing business functions;
•Illnesses suffered by employees who have continued to work, or who have or will return to work, in our facilities may expose us to increased risk of employment related claimsconditions and litigation;
•Lawsuits and other legal actions challenging the promptness of coverage determinations or the coverage determinations themselves on claims under applicable insurance or reinsurance policies, including, among others, business interruption claims, resulting in increased claims, litigation and related expenses;
•Delays in the reporting of non-COVID-19 claims, and the settlement of those claims, due to a variety of factors, including "stay-at-home" and similar orders instituted by many governmental authorities, potentially increasing the severity of those claims and reducing the predictability of the underlying statistical data used in establishing reserves, particularly for longer-tailed lines of business;
•Reduced demand for our insurance and non-insurance products and services due to reduced global economic activity, which could adversely impact our revenues and cash flows;
•Adverse impacts on our revenues and cash flows due to:
◦premium refunds or delayed receipt of premium payments;
◦delayed payment of reinsurance recoverables; and
◦expedited claims payments in response to regulatory requirements;
•Adverse effects on future cash flows or earnings of one or more of our underwriting, Markel Ventures or other acquired businesses, which could result in an impairment of goodwill or intangible assets and, in turn, a charge to net income;
•Increased needs for capital at our regulated insurance and reinsurance subsidiaries and non-insurance subsidiaries and the constraints that may be placed on our liquidity and other uses of holding company capital;
•Insured or reinsured losses from COVID-19-related claims could be greater than our reserves for those losses;
•Volatility and declines in global financial markets, defaults on fixed maturity securities (including corporate bonds, mortgage-backed securities and securities issued by municipalities, foreign governments and non-sovereign foreign institutions), and declines in interest rates and dividend payments, which have reduced, and could continue to reduce, future investment results and the fair market value of our invested assets;
•Deterioration in global financial and economic conditions, which have had, or could have, a broad range of material adverse effects on our businesses, and on our results of operations and financial condition, including, among others:
◦increased reinsurance costs and the inability to obtain the desired kinds and amounts of reinsurance;
◦furloughs and lay-offs of employees;
◦downgrades, or changes in outlook, by rating agencies of the financial strength or debt ratings of the Company or our insurance or reinsurance company subsidiaries;
◦reduced ability to access capital;
◦inability of our key vendors and contract counterparties to perform or pay the obligations required of them on a timely basis, or at all; and
◦increased credit risk, including credit risk related to our fixed maturity investments and receivables from insureds, reinsurers and customers;
•Deferred or reduced management and incentive fees from our insurance-linked securities operations, due to uncertainty regarding actual or potential COVID-19 related loss exposures, adverse impacts on our ability to maintain or raise third party capital for existing or new investment vehicles and increased risks related to our management of third party capital;
•A failure to satisfy financial covenants under our revolving credit agreement, which can be adversely affected by a significant decline in our consolidated net worth due to changes in the fair value of our equity investments, impairments in our fixed maturity investment portfolio, or impairment of our goodwill and intangible assets, as well as other things that adversely impact our results of operations. While we currently have no debt outstanding under our revolving credit facility, a failure to satisfy the financial covenants under the revolving credit agreement, unless waived or amended, would result in our inability to borrow or secure letters of credit under that facility;
•Increases in the number of consumer complaints challenging coverage or claims decisions under applicable insurance policies;
•Increases in the number of potential fraudulent claims made under insurance policies due to the economic hardships experienced by companies and individuals as a result of the COVID-19 pandemic;compliance obligations; and
•Increases in local, state and federal taxes to pay for costs incurred by governmental expenditures associated with the COVID-19 pandemic.
OneShort or more of these factors resulting from the COVID-19 pandemic, and others the Company cannot anticipate, could have material adverse effectslong-term impacts on the Company's resultscost, availability or timeliness of operations and financial condition; and the extent of these effects will depend, at least in part, on the scope, severity, duration and subsequent recurrences of the pandemic. In addition, the Company may take steps to mitigate potential risksrequired raw materials, supplies or liabilities that may arise from the COVID-19 pandemic and related developments and some of those steps may have a material adverse effect on the Company's results of operations and financial condition. Even if an unfavorable outcome does not materialize, these factors, and actions the Company may take in response, may have a material adverse impact on the Company's reputation and result in substantial expense and disruption.
See Item 7 Management's Discussion & Analysis of Financial Condition and Results of Operations,services provided by third parties, including "Developments Related to COVID-19", and the notes to consolidated financial statements included under Item 8, including note 20 Developments Related to COVID-19, for additional discussion of effects COVID-19 has had, and could have, on our businesses, results of operations and financial condition.services provided by state, federal or foreign governments or government agencies.
In addition, it is important to note and emphasize,a pandemic may, as has been the case with COVID-19, pandemic also may have the effect of triggering or intensifying many of the risks described elsewhere under this Item 1A. Risk Factors under Risks Primarily Related to Our Insurance Operations, Risks Primarily Related to Our Investments and Access to Capital, and Risks Related to All of Our Operations.
Climate Change
The impacts of climate change, and legal or regulatory measures to address climate change, may adversely affect our results of operations or financial condition.Our businesses, results of operations, and financial condition could be impacted by risks associated with climate change, including:
•changes from legislation, regulation and court decisions that:
◦create economic and regulatory uncertainty,
◦increase our compliance costs,
◦impose liability on or increase exposure for our policyholders not contemplated during our underwriting,
◦change our ability to provide insurance coverage to certain policyholders, or
◦impose new or additional requirements that increase the costs associated with, or disrupt, sourcing, manufacturing, and distribution of, our products and services,
•changes in the frequency, severity, and location of weather-related catastrophes, such as hurricanes, tornados, windstorms, floods, wildfires, and other extreme weather events, which may:
◦result in insured losses that exceed our expectations or make it more difficult for us to predict and model catastrophic events, reducing our ability to accurately price our exposure to such events and mitigate our risks,
◦make it more difficult or expensive for us to obtain reinsurance at desired levels, or
◦increase physical risks to and impacts on our operations,
•changing demand for insurance coverage we provide, such as demand from industries that produce or use carbon-based energy including those transitioning from those energy sources, decreased availability of reinsurance available for coverages we provide for carbon intensive industries, or increased claims and losses related to those industries, and
•losses on our invested assets, including from:
◦changes in supply and demand,
◦advances in low-carbon technology and renewable energy development,
◦effects of extreme weather events on the physical and operational exposure of industries and issuers, and
◦the transition that companies make towards addressing climate risk in their own businesses.
Item 1C. CYBERSECURITY
Markel Group is a holding company comprised of a diverse group of companies and investments. Our specialty insurance business, Markel, sits at the core of our company. Markel Group utilizes information technology systems and services, including cybersecurity, provided and/or administered by Markel. Through Markel Group's wholly owned subsidiary, Markel Ventures, Inc. (Markel Ventures), Markel Group owns controlling interests in businesses that operate in a variety of industries. The Markel Ventures businesses are independently managed with respect to their information security and data protection programs.
Insurance
In order to maintain a strong cybersecurity program, Markel uses a variety of controls and technology tools designed to identify, detect, prevent, respond to, and recover from security threats. Markel undergoes regular security audits including a System and Organization Controls (SOC) audit for Cybersecurity conducted annually by independent auditors in which cybersecurity threats are identified and assessed. Markel regularly tests aspects of its internal security and conducts security risk interviews and assessments on third parties with whom it does business, depending on the nature of the relationship. Markel has invested in technology that assists its risk management teams in measuring and addressing weaknesses in its third-party and supply chain community. Markel performs continuous monitoring of all its third parties to ensure they are maintaining acceptable levels of security controls and remediating any known weaknesses.
Markel participates in the Financial Services Information Sharing and Analysis Center to share information about the latest cyber threats and preparedness measures. Markel also shares threat intelligence information with other partners. Markel has a cybersecurity incident response plan, as well as a crisis management plan, that cover cyber events, including a process for determining the materiality of cyber events that includes evaluation by a cross functional crisis management group including security, information technology, finance, legal and business and escalation to Markel Group senior management as warranted by the severity of the situation. An internal team engages in tabletop exercises several times each year to enhance preparedness for such situations.
Information security and data protection risks are the responsibility of all employees. Markel has a mandatory training program covering a variety of security and data protection disciplines. In addition, all Markel employees are required to acknowledge annually policies on acceptable use of Markel's technology resources and enterprise information security. Contractors are required to provide certain representations and certifications relating to information security.
The Markel information security and data protection program is led by a Chief Information Security Officer (CISO) who supervises a team of security and data protection professionals across the globe. Markel's global information security and data protection program leverages the Cybersecurity Framework from the National Institutes of Standards and Technology as well as industry best practices. Markel also is able to map to both ISO (International Organization for Standardization) and BSI (British Standards Institution) among other cybersecurity standards. Markel's CISO has been with Markel 13 years and has 22 years' experience in information technology, with 17 years in information technology security, and is a certified Information Systems Security Professional (CISSP).
Markel Ventures
Each of our Markel Ventures businesses maintains its own, separate IT infrastructure, that often includes third-party providers, to support the needs of its business. As a result, cybersecurity risk for the Markel Ventures businesses is not concentrated in one system or service provider. Further, given the disparate nature of the businesses, systems, and providers, there is no single, uniform approach to managing cybersecurity risk at the Markel Ventures businesses – each is tailored to its unique needs. As is the case with all risks, management for each Markel Ventures business is responsible for evaluating and managing cybersecurity risks for its business. Therefore, each business determines the appropriate IT systems and providers needed to do so. Management for each business shares information on material risks from cybersecurity incidents with Markel Ventures management.
Markel Ventures has established processes for the Markel Ventures businesses to share information about how they assess, identify, and manage cybersecurity risk and shares information on material risks from cybersecurity incidents with Markel Group management, as appropriate. Each Markel Ventures business has a board that meets quarterly. Material matters regarding cybersecurity risk management and cybersecurity incidents are discussed at these meetings. In addition, Markel Ventures management regularly meets with the businesses to discuss their risk identification, assessment, and management approach. These discussions include how the business assesses, identifies, and manages key risks, including cybersecurity risks.
Markel Ventures requires real-time reporting of material cybersecurity incidents to understand how the matters are being managed, assess whether public disclosure is required and inform Markel Group senior management of relevant matters. Depending on the cybersecurity incident, third parties may be engaged by the Markel Ventures businesses to assist them in understanding and managing the event.
Given the varying size and complexity of the Markel Ventures businesses, a diverse array of individuals assume responsibility for managing cybersecurity risks within them. In some instances, primary responsibility may be with a member of the executive management team. In other instances, primary responsibility may land with information technology professionals. In all instances, however, ultimate responsibility rests with each business' Chief Executive Officer.
Markel Group Board Oversight
The Markel Group Board of Directors oversees Markel Group's risk management framework on an enterprise-wide basis, which includes cybersecurity risks. Periodic reports are provided to the Markel Group Board of Directors by members of management which, among other things, seek to systematically identify the principal risks facing our businesses and the manner in which such risks are addressed. For cybersecurity, this includes a review of the cybersecurity program and its governance, active and planned initiatives, protection and prevention matters, detection and response measures, and the threat landscape.
Cybersecurity Risks
No previous cybersecurity incident has had, or is reasonably likely to have, a material adverse effect on Markel Group, its business strategy, results of operations, or financial condition. For risks related to cybersecurity threats, see Item 1A Risk Factors.Factors, including under "Information technology systems that we use could fail or suffer a security breach or cyberattack, which could have a material adverse effect on us or result in the loss of regulated or sensitive information."
Item 2. PROPERTIES
We lease office space in Glen Allen, Virginia for our Markel Group corporate headquarters, which also serves as the headquarters for our insurance and Markel Ventures operations. Our insurance operations lease office space throughout the U.S. and in various locations in other countries. In total, we have 64 insurance offices in 17 countries. Additionally, our Markel Ventures businesses maintain office space, factories and warehouses, both through leased and owned properties, throughout the U.S. and in certain international locations. The property needs of our Markel Ventures businesses vary based on the nature of the operations of each business. We believe our properties are suitable and adequate for our current operations.
Item 3. LEGAL PROCEEDINGS
Markel CATCo Inquiries
We previously reported that in December 2018 the U.S. Department of Justice, U.S. Securities and Exchange Commission and Bermuda Monetary Authority (together, the Governmental Authorities) initiated inquiries into loss reserves recorded in late 2017 and early 2018 at our Markel CATCo operations. Those reserves are held at Markel CATCo Re, an unconsolidated
subsidiary of MCIM. The Markel CATCo Inquiries are limited to MCIM and its subsidiaries (together, Markel CATCo) and do not involve other Markel subsidiaries.
We retained outside counsel to conduct an internal review of Markel CATCo's loss reserving in late 2017 and early 2018. The internal review was completed in April 2019 and found no evidence that Markel CATCo personnel acted in bad faith in exercising business judgment in the setting of reserves and making related disclosures during late 2017 and early 2018. Our outside counsel has met with the Governmental Authorities and reported the findings from the internal review. At this time, we are unable to predict the duration, scope or result of the Markel CATCo Inquiries.
Thomas Yeransian v. Markel Corporation
In October 2010, we completed the acquisition of Aspen Holdings, Inc. (Aspen). As part of the consideration for that acquisition, Aspen shareholders received contingent value rights (CVRs). Based on a valuation of the CVRs as of their December 31, 2017 maturity date, we paid $9.9 million to the CVR holders on June 5, 2018, which represents 90% of the undisputed portion of the final amount we believe we are required to pay under the CVR agreement.
Prior to the December 31, 2017 CVR maturity date, the CVR holder representative, Thomas Yeransian, had disputed our prior estimation of the value of the CVRs. On September 15, 2016, Mr. Yeransian filed a suit, Thomas Yeransian v. Markel Corporation (U.S. District Court for the District of Delaware), alleging, among other things, that we are in default under the CVR agreement. The suit seeks: $47.3 million in damages, which represents the unadjusted value of the CVRs; plus interest ($19.229.1 million through December 31, 2020)2023) and default interest (up to an additional $16.2$24.4 million through December 31, 2020,2023, depending on the date any default occurred); and an unspecified amount of punitive damages, costs, and attorneys' fees.
At the initial hearing held February 21, 2017, the court stayed the proceedings and ordered the parties to discuss resolving the dispute pursuant to the independent CVR valuation procedure under the CVR agreement. The parties met on April 5, 2017, but were unsuccessful in reaching agreement on a process for resolving the dispute. We subsequently filed a motion to stay the litigation and compel arbitration, and, on July 31, 2017, the court issued an order granting that motion.
On September 20, 2018, a new judge was assigned to the case. On October 12, 2018, the court denied both Mr. Yeransian's motion to reconsider the order staying the litigation and compelling arbitration and our motion for sanctions against Mr. Yeransian for violating the confidentiality of mediation proceedings. The court subsequently (1) on December 3, 2018 ordered Mr. Yeransian to provide the court and us with the identity of an actuarial firm to participate in the selection of independent experts for the CVR valuation process under the CVR agreement and (2) on December 11, 2018 denied Mr. Yeransian's motion for judgment that we had waived our right to require Mr. Yeransian's participation in the CVR valuation process. On July 8, 2019, the Court granted our motion for instructions as to how the independent experts are to conduct the CVR valuation process and denied Mr. Yeransian's motion to have a hearing officer appointed to oversee the valuation process. The independent experts, who were jointly selected by the parties, have been engaged and are conducting the valuation process.
On November 13, 2018, Mr. Yeransian filed a second suit, Thomas Yeransian v. Markel Corporation (U.S. District Court for the District of Delaware), which also alleges that the Company is in default under the CVR agreement. The second suit seeks the same monetary damages and relief as the original suit. We filed a motion to stay this suit until the arbitration for the original suit hashad concluded and the CVR holders have received the remainder of the final amount due under the CVR Agreement. The court granted that motion on August 6, 2019.
On June 5, 2020, Mr. Yeransian filed a third suit, Thomas Yeransian v. Markel Corporation (U.S. District Court for the District of Delaware). Similar to the first and second suits, the third suit alleges that the Company is in default under the CVR agreement and, in addition, has interfered with the current, on-going arbitration for the CVR valuation. The third suit seeks the same monetary damages and relief as the original suit and the second suit, as well as other declaratory and non-monetary judgments and orders. We filed a motion to stay this suit.suit, which the court granted on March 16, 2021.
Under the arbitration terms of the CVR Agreement, independent experts were appointed to determine the final value of the CVRs. On September 20, 2021, the experts delivered their report indicating a final CVR valuation of $22.4 million, excluding interest. We had previously paid $8.0 million to the CVR holders, representing 90% of the undisputed value of the CVRs, plus interest of $1.9 million. On September 20, 2021, we paid $20.1 million, which represents $14.1 million for the unpaid portion of the final CVR amount (excluding fees payable to a third party), plus $6.0 million in additional interest.
The stay was lifted on each pending suit, and the three suits were consolidated. On June 8, 2023, the court ruled in favor of the Company and against Mr. Yeransian on all counts. Mr. Yeransian has appealed the court's decision.
We believe Mr. Yeransian's suits to be without merit. We further believe that any material loss resulting from the suits to be remote. We do not believe the contractual contingent consideration payments related to the CVRs, as ultimately determined by the independent experts in the valuation process, will have a material impact on the Company's liquidity.
Information About Our Executive Officers
Thomas S. Gayner
Co-ChiefChief Executive Officer since January 2016.2023. Co-Chief Executive Officer from January 2016 to December 2022. President and Chief Investment Officer from May 2010 to December 2015. Chief Investment Officer from January 2001 to December 2015. President, Markel-Gayner Asset Management Corporation, a subsidiary, since December 1990. Director from 1998 to 2004. Director since August 2016. Age 59.62.
RichardMichael R. Whitt, IIIHeaton
Co-ChiefExecutive Vice President and Chief Operating Officer since February 2024 and Executive Vice President since May 2022. President, Markel Ventures from January 2016 to May 2022. President and Chief Executive Officer, since January 2016.Markel Ventures, Inc., a subsidiary, from May 2020 to May 2022; President and Co-ChiefChief Operating Officer, Markel Ventures, Inc., from January 2016 to May 20102020. Chief Operating Officer, Markel Ventures, Inc., from September 2013 to December 2015. Age 47.
Andrew G. Crowley
President, Markel Ventures since May 2022. President, Markel Ventures, Inc., a subsidiary, since May 2022. Executive Vice President, Markel Ventures, Inc., from May 2020 to May 2022. Managing Director, Markel Ventures, Inc., from January 2017 to May 2020. Age 41.
Jeremy A. Noble
President, Insurance since January 2023. Senior Vice President and Chief Financial Officer from May 2005September 2018 to May 2010. Director since August 2016. Age 57.
Robert C. Cox
President and Chief Operating Officer, Insurance Operations since September 2018. Executive Vice President of Chubb Ltd. (a public company) and Division Chairman of Chubb Ltd.'s North American Financial Lines from January 2016 until retirement in July 2016; Executive Vice President of Chubb & Son and Chief Operating Officer of Chubb Specialty Insurance from June 2013 to January 2016. Age 62.
Michael R. Heaton
President, Markel Ventures since January 2016; President and Chief Operating Officer, Markel Ventures, Inc., a subsidiary, since January 2016 and September 2013, respectively. Age 44.
Bradley J. Kiscaden
President and Chief Administrative Officer, Insurance Operations since September 2018. Executive Vice President and Chief Actuarial Officer from July 2012 to September 2018. Chief Actuarial Officer from March 1999 to September 2018. Age 58.
Jeremy A. Noble
Senior Vice President and Chief Financial Officer since September 2018.December 2022. Senior Vice President, Finance from June 2018 to September 2018. Finance Director, Markel International from July 2015 to June 2018. Managing Director, Internal Audit from September 2011 to July 2015. Age 45.
Linda V. Schreiner
Senior Vice President, Strategic Management since January 2016. Senior Vice President, Human Resources and Communications of MeadWestvaco Corporation (a public company) from January 2002 to July 2015. Age 61.48.
Richard R. Grinnan
Senior Vice President, Chief Legal Officer and Secretary of Markel Group since February 2020.2020 and of Markel since October 2022. General Counsel and Secretary from June 2014 to February 2020. Assistant General Counsel from August 2012 to June 2014. Age 52.55.
Susan L. DaviesBrian J. Costanzo
Chief Human ResourcesFinancial Officer of Markel InsuranceGroup and of Markel since September 2018. Managing Executive, Human ResourcesDecember 2023. Senior Vice President, Finance, Chief Accounting Officer and Controller from October 2022 to December 2023. Principal financial officer (on an interim basis) from January 20182023 to August 2020. Senior Director Global Organization EffectivenessMarch 2023. Chief Accounting Officer and StrategyController from October 2016 to January 2018. Associate Vice President Talent Management of CarMax, Inc. (a public company) from September 2015June 2021 to October 2016.2022. Controller from December 2019 to June 2021. Segment Controller - U.S. Insurance from March 2014 to December 2019. Age 56.45.
PART II
Item 5. MARKET FOR REGISTRANT'S COMMON EQUITY, RELATED STOCKHOLDER MATTERS AND ISSUER PURCHASES OF EQUITY SECURITIES.SECURITIES
Performance Graph
The following graph compares the cumulative total return (based on share price) on our common stock with the cumulative total return of companies included in the S&PStandard & Poor's (S&P) 500 Index and the Dow Jones U.S. Property & Casualty Insurance Companies Index. We are a holding company comprised of a diverse group of businesses and investments, and we believe there are few companies with a mix of business operations comparable to ours. Our principal business markets and underwrites specialty insurance products, and therefore, we have used the Dow Jones U.S. Property & Casualty Insurance Companies Index as our peer group. However, we also own controlling interests in a diverse portfolio of businesses that operate in a variety of other industries. This information is not necessarily indicative of future results.
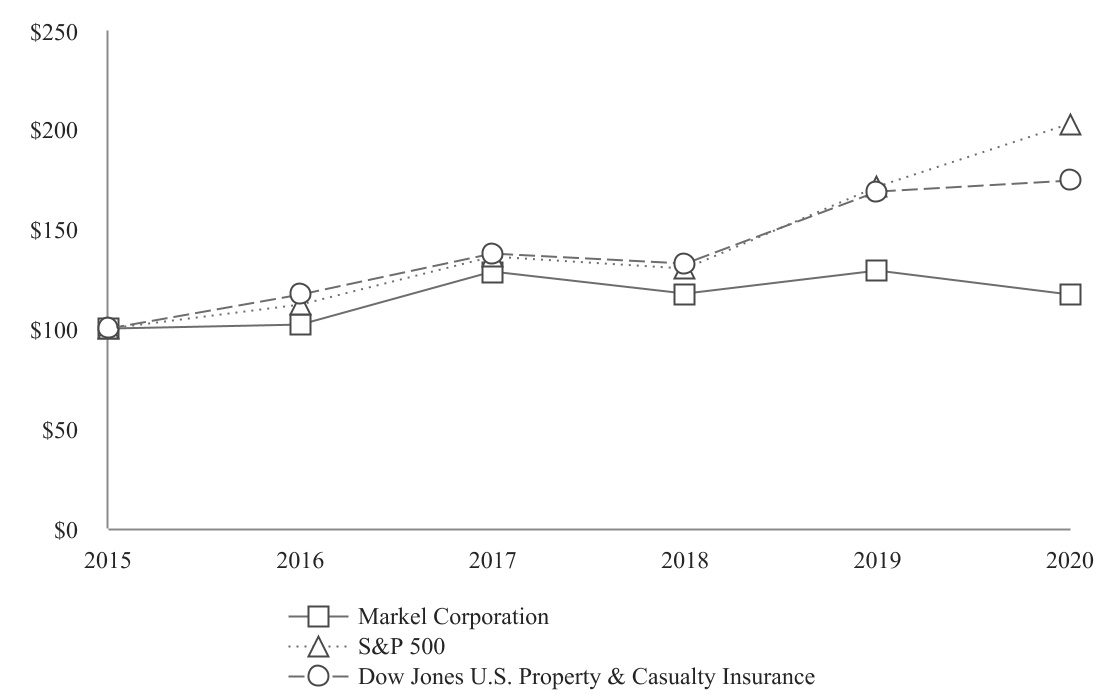
| | | | | | | | | | | | | | | | | | | | | | | | | | | | | | | | | | | |
| | Years Ended December 31, |
| | 2015 (1) | | 2016 | | 2017 | | 2018 | | 2019 | | 2020 |
| Markel Corporation | $ | 100 | | | $ | 102 | | | $ | 129 | | | $ | 118 | | | $ | 129 | | | $ | 117 | |
| S&P 500 | 100 | | | 112 | | | 136 | | | 130 | | | 171 | | | 203 | |
| Dow Jones U.S. Property & Casualty Insurance | 100 | | | 117 | | | 138 | | | 133�� | | | 169 | | | 174 | |

| | | | | | | | | | | | | | | | | | | | | | | | | | | | | | | | | | | |
| | Years Ended December 31, |
| | 2018 (1) | | 2019 | | 2020 | | 2021 | | 2022 | | 2023 |
| Markel Group Inc. | $ | 100 | | | $ | 110 | | | $ | 100 | | | $ | 119 | | | $ | 127 | | | $ | 137 | |
| S&P 500 Index | 100 | | | 131 | | | 156 | | | 200 | | | 164 | | | 207 | |
| Dow Jones U.S. Property & Casualty Insurance Index | 100 | | | 127 | | | 131 | | | 160 | | | 184 | | | 209 | |
(1)$100 invested on December 31, 20152018 in our common stock or the listed index. Includes reinvestment of dividends.
Common Stock and Dividend Information
Our common stock trades on the New York Stock Exchange under the symbol MKL. The number of shareholders of record as of February 2, 2021January 31, 2024 was approximately 300.260. The total number of shareholders, including those holding shares in street name or in brokerage accounts, is estimated to be in excess of 170,000.220,000. Our current strategy is to retain earnings and, consequently, we have not paid and do not expect to pay a cash dividend on our common stock.
Common Share Repurchases
The following table summarizes our common share repurchases for the quarter ended December 31, 2023.
| | | | | | | | | | | | | | | | | | | | | | | |
| Issuer Purchases of Equity Securities |
| | (a) | | (b) | | (c) | | (d) |
| | Total Number of Shares Purchased | | Average Price Paid per Share | | Total Number of Shares Purchased as Part of Publicly Announced Plans or Programs (1) | | Approximate Dollar Value of Shares that May Yet Be Purchased Under the Plans or Programs (in thousands) |
| October 1, 2023 through October 31, 2023 | 16,635 | | | $ | 1,470.02 | | | 16,635 | | | $ | 221,111 | |
| November 1, 2023 through November 30, 2023 | 75,841 | | | $ | 1,400.09 | | | 75,841 | | | $ | 748,196 | |
| December 1, 2023 through December 31, 2023 | 25,200 | | | $ | 1,396.70 | | | 25,200 | | | $ | 712,999 | |
| Total | 117,676 | | | $ | 1,409.25 | | | 117,676 | | | $ | 712,999 | |
(1) The Board of Directors approved the repurchase of up to $750 million of our common shares pursuant to a share repurchase program publicly announced in November 2023. The new program terminated and replaced a similar $750 million share repurchase program authorized in February 2022. Under our share repurchase program, we may repurchase outstanding common shares of our stock from time to time in privately negotiated or open market transactions, including under plans complying with Rule 10b5-1 and Rule 10b-18 under the Securities Exchange Act of 1934. The share repurchase program has no expiration date but may be terminated by the Board at any time.
Securities Authorized for Issuance Under Equity Compensation Plans
See Part III for information on securities authorized for issuance under our equity compensation plans.
Available Information
This document represents Markel Corporation'sGroup's Annual Report on Form 10-K, which is filed with the U.S. Securities and Exchange Commission. We make available free of charge on or through our website our annual reports on Form 10-K, quarterly reports on Form 10-Q, current reports on Form 8-K and all amendments to those reports as soon as reasonably practicable after such material is electronically filed with or furnished to the U.S. Securities and Exchange Commission. Our website address is www.markel.com.www.mklgroup.com.
Transfer Agent
American Stock Transfer & Trust Co., LLC, Operations Center, 6201 15th Avenue, Brooklyn, NY 11219
(800) 937-5449 help@astfinancial.com
Item 6. SELECTED FINANCIAL DATA
| | | | | | | | | | | | | | | | | | | | | | | | | | | | | | | | | | | |
| (dollars in millions, except per share data) | 2020 | | 2019 | | 2018 | | 2017 | | 2016 | | 5-Year CAGR (1) |
| Results of Operations | | | | | | | | | | | |
| Earned premiums | $ | 5,612 | | | $ | 5,050 | | | $ | 4,712 | | | $ | 4,248 | | | $ | 3,866 | | | 8 | % |
| Net investment income | 372 | | | 452 | | | 434 | | | 406 | | | 373 | | | 1 | % |
| Products revenues | 1,440 | | | 1,610 | | | 1,498 | | | 951 | | | 885 | | | 11 | % |
| Services and other revenues | 1,694 | | | 813 | | | 635 | | | 462 | | | 422 | | | 51 | % |
Total operating revenues (2) | 9,735 | | | 9,526 | | | 6,841 | | | 6,062 | | | 5,612 | | | 13 | % |
Net income (loss) to common shareholders (2) | 798 | | | 1,790 | | | (128) | | | 395 | | | 456 | | | |
| Comprehensive income (loss) to shareholders | 1,192 | | | 2,094 | | | (376) | | | 1,175 | | | 667 | | | |
| Diluted net income (loss) per common share | $ | 55.63 | | | $ | 129.07 | | | $ | (9.55) | | | $ | 25.81 | | | $ | 31.27 | | | |
| Financial Position | | | | | | | | | | | |
| Total investments, cash and cash equivalents and restricted cash and cash equivalents (invested assets) | $ | 24,927 | | | $ | 22,258 | | | $ | 19,238 | | | $ | 20,570 | | | $ | 19,059 | | | 7 | % |
| Total assets | 41,710 | | | 37,474 | | | 33,306 | | | 32,805 | | | 25,875 | | | 11 | % |
| Unpaid losses and loss adjustment expenses | 16,222 | | | 14,729 | | | 14,276 | | | 13,584 | | | 10,116 | | | 10 | % |
| Senior long-term debt and other debt | 3,484 | | | 3,534 | | | 3,010 | | | 3,099 | | | 2,575 | | | |
| Shareholders' equity | 12,800 | | | 11,071 | | | 9,081 | | | 9,504 | | | 8,461 | | | 10 | % |
| Common shares outstanding (at year end, in thousands) | 13,783 | | | 13,794 | | | 13,888 | | | 13,904 | | | 13,955 | | | |
Consolidated Performance Measures (3) | | | | | | | | | | | |
| Book value per common share outstanding | $ | 885.72 | | | $ | 802.59 | | | $ | 653.85 | | | $ | 683.55 | | | $ | 606.30 | | | 10 | % |
5-Year CAGR in book value per common share (1) | 10 | % | | 8 | % | | 7 | % | | 11 | % | | 11 | % | | |
| Closing stock price | $ | 1,033.30 | | | $ | 1,143.17 | | | $ | 1,038.05 | | | $ | 1,139.13 | | | $ | 904.50 | | | 3 | % |
5-Year CAGR in closing stock price (1) | 3 | % | | 11 | % | | 12 | % | | 21 | % | | 17 | % | | |
| U.S. GAAP combined ratio | 98 | % | | 94 | % | | 98 | % | | 105 | % | | 92 | % | | |
| Investment yield | 2 | % | | 3 | % | | 3 | % | | 3 | % | | 2 | % | | |
| Taxable equivalent total investment return | 9 | % | | 15 | % | | (1) | % | | 10 | % | | 4 | % | | |
| Debt to capital | 21 | % | | 24 | % | | 25 | % | | 25 | % | | 23 | % | | |
(800) 937-5449 helpast@equiniti.com
(1)
Annual Shareholders Meeting
CAGR—compound
Our annual growth rate.
(2)In accordance withshareholders meeting will take place on May 22, 2024 at the provisionsUniversity of Accounting Standards Update No. 2016-01, beginning January 1, 2018, all changesRichmond Robins Center in Richmond, Virginia at 2:00 p.m. (Eastern Time). The shareholders meeting will be part of a two-day event we are calling the fair value2024 Reunion, which is open to shareholders, employees, and friends of equity securities are recognized in net income.
(3)These measures provide a basis for management to evaluate performance. The method we use to compute these measures may differ from the methods used by other companies. See further discussionMarkel Group. More information on the calculation of these measuresagenda and management's evaluation of these measures in Item 7 Management's Discussion & Analysis of Financial Condition and Results of Operations.registration for the 2024 Reunion is available at www.mklreunion.com.
Item 7. MANAGEMENT'S DISCUSSION & ANALYSIS OF FINANCIAL CONDITION AND RESULTS OF OPERATIONS
The following discussion and analysis includes discussion of changes in our results of operations and financial condition from 2022 to 2023 and should be read in conjunction with the consolidated financial statements and related notes included under Item 8, Item 1 Business, Item 1A Risk Factors and "Safe Harbor and Cautionary Statement" under Item 7. The accompanying consolidated financial statements and related notes have been prepared in accordance with United States (U.S.) generally accepted accounting principles (GAAP) and include the accounts of our holding company, Markel CorporationGroup Inc. (Markel Group), and its consolidated subsidiaries, as well as any variable interest entities that meet the requirements for consolidation (the Company). A discussion of changes in our results of operations and financial condition from 2021 to 2022 may be found in Part II Item 7 Management's Discussion and Analysis of Financial Condition and Results of Operations in our 2022 Annual Report on Form 10-K, which was filed with the U.S. Securities and Exchange Commission on February 17, 2023.
Item 7 is divided into the following sections:
•Results of Operations
•Liquidity and Capital Resources
•Critical Accounting Estimates
•Safe Harbor and Cautionary Statement
For a discussion of our significant accounting policies, as well as recently issued accounting pronouncements that we have not yet adopted and their expected effects on our consolidated financial position, results of operations and cash flows, see note 1 of the notes to consolidated financial statements included under Item 8.
The following discussion and analysis includes discussion of changes in our results of operations and financial condition from 2019 to 2020 and should be read in conjunction with Item 6 Selected Financial Data, the consolidated financial statements and related notes included under Item 8, Item 1A Risk Factors and "Safe Harbor and Cautionary Statement" under Item 7. A discussion of changes in our results of operations and financial condition from 2018 to 2019 may be found in Part II Item 7 Management's Discussion and Analysis of Financial Condition and Results of Operations in our 2019 Annual Report on Form 10-K, which was filed with the U.S. Securities and Exchange Commission on February 21, 2020.
Results of Operations
The following table presents the components of net income to shareholders, net income to common shareholders andoperating revenues.
| | | | | | | | | | | |
| Years Ended December 31, |
| (dollars in thousands) | 2023 | | 2022 |
| Insurance segment | $ | 7,282,705 | | | $ | 6,528,263 | |
| Reinsurance segment | 1,014,294 | | | 1,063,347 | |
| Program services and other fronting, insurance-linked securities and other insurance | 280,131 | | | 493,746 | |
| Insurance operations | 8,577,130 | | | 8,085,356 | |
| Net investment income | 729,219 | | | 445,846 | |
| Net investment gains (losses) | 1,524,054 | | | (1,595,733) | |
| Other | (11,854) | | | (17,661) | |
| Investing segment | 2,241,419 | | | (1,167,548) | |
| Markel Ventures segment | 4,985,081 | | | 4,757,527 | |
| Total operating revenues | $ | 15,803,630 | | | $ | 11,675,335 | |
The following table presents the components of comprehensive income (loss) to shareholders.
| | | | | | | | | | | |
| Years Ended December 31, |
| (dollars in thousands) | 2020 | | 2019 |
| Insurance segment profit | $ | 169,001 | | | $ | 309,778 | |
| Reinsurance segment loss | (75,470) | | | (39,999) | |
Investing segment profit (1) | 989,564 | | | 2,052,874 | |
Markel Ventures segment profit (2) | 254,078 | | | 168,417 | |
Other operations (3) | (63,289) | | | (13,724) | |
| Interest expense | (177,582) | | | (171,687) | |
| Net foreign exchange losses | (95,853) | | | (2,265) | |
| Loss on early extinguishment of debt | — | | | (17,586) | |
| Income tax expense | (168,682) | | | (486,346) | |
| Net income attributable to noncontrolling interests | (15,737) | | | (8,996) | |
| Net income to shareholders | 816,030 | | | 1,790,466 | |
| Preferred stock dividends | (18,400) | | | — | |
| | | |
| Net income to common shareholders | 797,630 | | | 1,790,466 | |
| Other comprehensive income to shareholders | 375,604 | | | 303,422 | |
| Comprehensive income to shareholders | $ | 1,191,634 | | | $ | 2,093,888 | |
| | | | | | | | | | | |
| Years Ended December 31, |
| (dollars in thousands) | 2023 | | 2022 |
| Insurance segment profit | $ | 162,176 | | | $ | 549,871 | |
| Reinsurance segment profit (loss) | (19,265) | | | 83,859 | |
| Program services and other fronting, insurance-linked securities and other insurance | 205,234 | | | 294,979 | |
Amortization of intangible assets (1) | (98,244) | | | (99,735) | |
Impairment of goodwill (2) | — | | | (80,000) | |
| Insurance operations | 249,901 | | | 748,974 | |
| Investing segment profit (loss) | 2,241,419 | | | (1,167,548) | |
Markel Ventures segment profit (3) | 437,508 | | | 325,238 | |
| Operating income (loss) | 2,928,828 | | | (93,336) | |
| Interest expense | (185,077) | | | (196,062) | |
| Net foreign exchange gains (losses) | (90,045) | | | 137,832 | |
| | | |
| Income tax (expense) benefit | (552,616) | | | 48,209 | |
| Net income attributable to noncontrolling interests | (105,030) | | | (112,920) | |
| Net income (loss) to shareholders | 1,996,060 | | | (216,277) | |
| Preferred stock dividends | (36,000) | | | (36,000) | |
| | | |
| Net income (loss) to common shareholders | 1,960,060 | | | (252,277) | |
| Other comprehensive income (loss) to shareholders | 289,284 | | | (989,502) | |
| Comprehensive income (loss) to shareholders | $ | 2,285,344 | | | $ | (1,205,779) | |
(1) Net investment income and net investment gains, if any, Amortization of intangible assets includes all amortization attributable to Markel Ventures are included in segment profitour insurance operations. Amortization of intangible assets attributable to our underwriting segments was $37.1 million and $38.5 million for Markel Ventures. Allthe years ended December 31, 2023 and 2022, respectively; however, we do not allocate amortization of intangible assets between the Insurance and Reinsurance segments. Amortization of intangible assets attributable to our program services and other net investment incomefronting, insurance-linked securities and net investment gains are included in Investing segment profit.other insurance operations was $61.2 million for the years ended December 31, 2023 and 2022.
(2) Impairment of goodwill for the year ended December 31, 2022 was attributable to our Nephila ILS operations.
(3) Segment profit for the Markel Ventures segment includes amortization of intangible assets attributable to Markel Ventures.
(3) Other operations includes the results attributable to our operations that are not included in a reportable segment, as well as any amortization of intangible assets that is not allocated to a reportable segment. Amortization of intangible assets attributable to our underwriting segments was $41.9 million and $39.7 million for the years ended December 31, 2020 and 2019, respectively; however, we do not allocate amortization of intangible assets between the Insurance and Reinsurance segments.
The decreasechange in comprehensive income (loss) to shareholders in 20202023 compared to 2022 was primarily due to lowerpre-tax net investment gains of $1.5 billion in 2023 compared to pre-tax net investment losses of $1.6 billion in 2022, as well as pre-tax net unrealized gains on our equity portfoliofixed maturity securities of $389.5 million in 20202023 compared to 2019. Comprehensive income to shareholderspre-tax net unrealized losses of $1.5 billion in 2020 also reflects significant underwriting losses and other impacts attributed to COVID-19, a novel coronavirus outbreak that was declared a pandemic by the World Health Organization on March 11, 2020, which has caused unprecedented social and economic disruption, increased volatility of capital markets and interventions by various governments and central banks around the world. 2022.
The components of net income (loss) to shareholders and comprehensive income (loss) to shareholders are discussed in further detail under "Underwriting"Insurance Results," "Investing Results," "Markel Ventures" "Other Operations, Results," "Interest Expense, Loss on Early Extinguishment of DebtNet Foreign Exchange Gains (Losses) and Income Taxes" and "Comprehensive Income (Loss) to Shareholders.Shareholders and Book Value per Common Share."
Insurance Results
Our Insurance engine includes our underwriting, program services and other fronting and insurance-linked securities (ILS) operations. We have a suite of capabilities through which we can access capital to support our customers' risks, which includes our own capital through our underwriting operations and third-party capital through our program services and other fronting and ILS operations. Our underwriting operations, which are primarily comprised of our Insurance and Reinsurance segments, produce revenues primarily by underwriting insurance contracts and earning premiums in the specialty insurance market. Our program services and other fronting and insurance-linked securities operations produce revenues primarily through fees earned for fronting services and investment management services, respectively. Our insurance operations also include the underwriting results of run-off lines of business that were discontinued prior to, or in conjunction with, insurance acquisitions,
and the results of our run-off life and annuity reinsurance business. The following table presents the components of our Insurance engine gross premium volume and operating revenues.
| | | | | | | | | | | | | | | | | |
| Years Ended December 31, |
| (dollars in thousands) | 2023 | | 2022 | | % Change |
| Gross premium volume: | | | | | |
| Underwriting | $ | 10,277,632 | | | $ | 9,847,538 | | | 4 | % |
Program services and other fronting (1) | 3,724,605 | | | 3,354,144 | | | 11 | % |
| Insurance operations | $ | 14,002,237 | | | $ | 13,201,682 | | | 6 | % |
| | | | | |
| Operating revenues: | | | | | |
| Insurance segment | $ | 7,282,705 | | | $ | 6,528,263 | | | 12 | % |
| Reinsurance segment | 1,014,294 | | | 1,063,347 | | | (5) | % |
| Program services and other fronting, insurance-linked securities and other insurance | 280,131 | | | 493,746 | | | (43) | % |
| Insurance operations | $ | 8,577,130 | | | $ | 8,085,356 | | | 6 | % |
(1) Substantially all gross premiums from our program services and other fronting operations were ceded to third parties for the years ended December 31, 2023 and 2022.
Underwriting Results
Underwriting profits are a key component of our strategy to build shareholder value. We believe that the ability to achieve consistent underwriting profits demonstrates knowledge and expertise, commitment to superior customer service and the ability to manage insurance risk. The property and casualty insurance industry commonly defines underwriting profit or loss as earned premiums net of losses and loss adjustment expenses and underwriting, acquisition and insurance expenses. We use underwriting profit or loss and the combined ratio as a basis for evaluating our underwriting performance. The U.S. GAAP combined ratio is a measure of underwriting performance and represents the relationship of incurred losses, loss adjustment expenses and underwriting, acquisition and insurance expenses to earned premiums. The combined ratio is the sum of the loss ratio and the expense ratio. The loss ratio represents the relationship of incurred losses and loss adjustment expenses to earned premiums. The expense ratio represents the relationship of underwriting, acquisition and insurance expenses to earned premiums. A combined ratio less than 100% indicates an underwriting profit, while a combined ratio greater than 100% reflects an underwriting loss. Segment profit for our underwriting segments may also include other revenues and expenses that are attributable to our underwriting operations that are not captured in underwriting profit.
The following table presents selected data fromIn addition to the U.S. GAAP combined ratio, loss ratio and expense ratio, we also evaluate our underwriting operations.
| | | | | | | | | | | |
| Years Ended December 31, |
| (dollars in thousands) | 2020 | | 2019 |
Gross premium volume (1) | $ | 7,154,628 | | | $ | 6,436,168 | |
| Net written premiums | $ | 5,932,238 | | | $ | 5,412,071 | |
Net retention (1) | 83 | % | | 84 | % |
| Earned premiums | $ | 5,612,205 | | | $ | 5,049,793 | |
| Losses and loss adjustment expenses | $ | 3,466,961 | | | $ | 2,891,190 | |
| Underwriting, acquisition and insurance expenses | $ | 2,017,627 | | | $ | 1,878,093 | |
| Underwriting profit | $ | 127,617 | | | $ | 280,510 | |
| Disposal loss | $ | (41,461) | | | $ | 0 | |
| | | |
| U.S. GAAP Combined Ratios | | | |
| Insurance | 96 | % | | 93 | % |
| Reinsurance | 104 | % | | 104 | % |
| Consolidated | 98 | % | | 94 | % |
(1)Gross premium volumeperformance using measures that exclude the impacts of certain items on these ratios. We believe these adjusted measures, which are non-GAAP measures, provide financial statement users with a better understanding of the significant factors that comprise our underwriting results and net retention for the years ended December 31, 2020 and 2019 exclude $2.1 billion and $2.3 billion, respectively, of written premiums attributable to our program services business and other fronting arrangements that were ceded.how management evaluates underwriting performance.
Combined Ratio
Our consolidated combined ratio for 2020 included $360.4 million, or six points, of underwriting loss attributed to COVID-19 and $168.9 million, or three points, of underwriting loss attributed to natural catastrophes compared to $100.4 million, or two points, of catastrophe losses in 2019. Excluding the impacts of COVID-19 and catastrophe losses,When analyzing our combined ratio, improved due to a lower attritional loss ratio and a lower expense ratio arising from improved performance within our Insurance segment in 2020 compared to 2019.
COVID-19 Losses
The following table summarizes, by segment, the components of the underwriting loss attributed to the COVID-19 pandemic in 2020. Thewe exclude current accident year losses and loss adjustment expenses were netattributed to natural catastrophes and certain other significant, infrequent loss events, for example, the on-going military conflict between Russia and Ukraine that began following Russia's invasion of cededUkraine in February 2022. Due to the unique characteristics of these events, there is inherent variability as to the timing or loss amount, which cannot be predicted in advance. We believe measures that exclude the effects of such events are meaningful to understand the underlying trends and variability in our underwriting results that may be obscured by these items.
When analyzing our loss ratio, we evaluate losses and loss adjustment expenses attributable to the current accident year separate from losses and loss adjustment expenses attributable to prior accident years. Prior accident year reserve development, which can either be favorable or unfavorable, represents changes in our estimates of $106.2 million.losses and loss adjustment expenses related to loss events that occurred in prior years. We believe a discussion of current accident year loss ratios, which exclude prior accident year reserve development, is helpful since it provides more insight into estimates of current underwriting performance and excludes changes in estimates related to prior year loss reserves. We also analyze our current accident year loss ratio excluding losses and loss adjustment expenses attributable to catastrophes and, in 2022, the Russia-Ukraine conflict. The current accident year loss ratio excluding the impact of catastrophes and other significant, infrequent loss events is also commonly referred to as an attritional loss ratio within the property and casualty insurance industry.
| | | | | | | | | | | | | | | | | |
| Year Ended December 31, 2020 |
| (dollars in thousands) | Insurance | | Reinsurance | | Consolidated |
| Losses and loss adjustment expenses | $ | 296,420 | | | $ | 61,884 | | | $ | 358,304 | |
| Ceded (assumed) reinstatement premiums | 2,145 | | | (93) | | | 2,052 | |
| Underwriting loss | $ | 298,565 | | | $ | 61,791 | | | $ | 360,356 | |
| Impact on combined ratio | 6 | % | | 7 | % | | 6 | % |
The COVID-19 outbreak was identified as a potential exposure withinfollowing table presents summary data for our consolidated underwriting operations, in late February, at which point we began to regularly review allare comprised predominantly of our product lines to identifyInsurance and Reinsurance segments. Our consolidated underwriting results also include results from discontinued lines of business we believed could be directly impacted by COVID-19 and the retained portion of our program services and other fronting operations.
| | | | | | | | | | | | | | | | | |
| Years Ended December 31, |
| (dollars in thousands) | 2023 | | 2022 | | % Change |
| Gross premium volume | $ | 10,276,419 | | | $ | 9,843,555 | | | 4 | % |
| Net written premiums | $ | 8,397,575 | | | $ | 8,203,390 | | | 2 | % |
| Earned premiums | $ | 8,295,479 | | | $ | 7,587,792 | | | 9 | % |
| Underwriting profit | $ | 132,736 | | | $ | 626,620 | | | (79) | % |
| | | | | |
Underwriting Ratios (1) | | | | | Point Change |
| Loss ratio | | | | | |
| Current accident year loss ratio | 64.6 | % | | 60.8 | % | | 3.8 | |
| Prior accident years loss ratio | (0.5) | % | | (2.2) | % | | 1.7 | |
| Loss ratio | 64.2 | % | | 58.6 | % | | 5.6 | |
| Expense ratio | 34.2 | % | | 33.2 | % | | 1.0 | |
| Combined ratio | 98.4 | % | | 91.7 | % | | 6.7 | |
| | | | | |
Current accident year loss ratio catastrophe impact (2) | 0.5 | % | | 0.6 | % | | (0.1) | |
Current accident year loss ratio Russia-Ukraine conflict impact (2) | — | % | | 0.5 | % | | (0.5) | |
| | | | | |
| Current accident year loss ratio, excluding catastrophes and Russia-Ukraine conflict impact | 64.1 | % | | 59.7 | % | | 4.4 | |
| Combined ratio, excluding current year catastrophes and Russia-Ukraine conflict impact | 97.9 | % | | 90.7 | % | | 7.2 | |
(1) Amounts may not reconcile due to evaluaterounding.
(2) The point impact of catastrophes and the extent to which the virus may impact our coverages. In those instances where we identified COVID-19Russia-Ukraine conflict is calculated as the proximate, or direct, cause of loss, we established net reserves for losses and loss adjustment expenses totaling $325.0 million during the first quarter of 2020. Our direct losses from COVID-19 were primarily attributed to business written within our international insurance operations and were primarily associated with coverages for event cancellation and business interruption losses in policies where no specific pandemic exclusions exist. Since establishing these initial reserves in the first quarter of 2020, we have increased our estimate of direct net losses and loss adjustment expenses divided by total earned premiums.
Premiums
The increase in gross premium volume in our underwriting operations in 2023 was driven by growth within our Insurance segment, partially offset by lower gross premium volume within our Reinsurance segment. Net retention of gross premium volume for our underwriting operations was 82% in 2023 compared to 83% in 2022. The decrease was driven by lower retention in 2023 compared to 2022 across both of our underwriting segments. Within our underwriting operations, we purchase reinsurance and retrocessional reinsurance to manage our net retention on individual risks and overall exposure to losses and to enable us to write policies with sufficient limits to meet policyholder needs. The increase in earned premiums in 2023 was primarily attributable to COVID-19higher gross premium volume in recent periods.
Throughout 2023, we achieved an overall modest rate increase across the landscape of our diversified product portfolio. However, rate trends by $18.3 millionproduct class were more divergent in 2023 in contrast to the past few years, where we experienced rate increases across most of our product lines. These more nuanced rate trends, coupled with increases in loss cost trends due to heightened economic and social inflation, have forced us to examine each of our product classes more closely and target premium growth only in product lines where we are most confident in the levels of rate adequacy.
During 2023, we achieved significant rate increases on our property coverages and select marine and energy product lines, due to recent industry loss experience and the increasing cost of obtaining reinsurance protection, which led us to pursue opportunistic growth within these product lines. Additionally, within our general liability product lines, we continued to achieve modest rate increases across most product classes and saw the level of rate increases improve over the course of the year. We maintained modest growth in these product lines, while carefully selecting risks, managing limits and adjusting attachment points in response to heightened loss cost trends within general liability lines.
Within our insurance and reinsurance professional liability product lines, overall, we saw modest rate decreases driven by notable rate decreases within our public directors and officers product, consistent with broader trends across the industry, and,
to a lesser extent, within our errors and omissions coverages. Within these products, we are contracting our new premium writings when we believe rates are inadequate and are also allowing business to lapse. In other professional liability product lines, particularly within our international portfolio, we are generally seeing consistency in rates and are continuing to pursue growth opportunities where we find the business to be adequately priced. We also saw rate decreases globally within our cyber product line as that market matures, following changes in certain assumptionsseveral years of significant rate increases and strong industry underwriting performance. Despite these current trends, we view cyber as a long-term growth opportunity. Finally, we continued to realize low single digit rate decreases within our workers' compensation product line and are reacting accordingly on which our estimates are based, resulting in total direct net losses and loss adjustment expenses of $343.3 million for the year ended December 31, 2020.a state-by-state basis to maintain profitability.
Combined Ratio
In addition to loss exposures that are directly attributable to COVID-19, we also are exposed to losses indirectly related to the COVID-19 pandemic and associated with a broader range of coverages, including coverages within our trade credit, professional liability and workers' compensation product lines, among others, as well as certain of our reinsurance product lines. During 2020, we recognized $15.02023, underwriting results included $40.1 million of net losses and loss adjustment expenses in our trade credit product line within our Insurance segment related to losses that were indirectly attributableattributed to the pandemic. We do not believe any other significant indirect losses attributable to COVID-19 have been incurred. See "Developments Related to COVID-19" for further discussion of other potential indirect exposures arising from the pandemic.
The following table summarizes, by coverageHawaiian wildfires and underwriting platform, the components of our directHurricane Idalia (2023 Catastrophes). The net losses and loss adjustment expenses from COVID-19 for 2020.
| | | | | | | | | | | | | | | | | |
| | Year Ended December 31, 2020 |
| (dollars in millions) | Insurance | | Reinsurance | | Consolidated |
| Event cancellation | | | | | |
| International | $ | 185.7 | | | $ | — | | | $ | 185.7 | |
| United States | 7.5 | | | — | | | 7.5 | |
| Business interruption | | | | | |
| International | 72.3 | | | 21.6 | | | 93.9 | |
| United States | 8.0 | | | 13.6 | | | 21.6 | |
| All other coverages | 7.9 | | | 26.7 | | | 34.6 | |
| Total | $ | 281.4 | | | $ | 61.9 | | | $ | 343.3 | |
Both the gross and net loss estimates for direct losses attributed to COVID-19 represent our best estimates as of December 31, 2020 based upon information currently available. These estimates are based on reported claims, detailed policy level reviews and reviews of in-force assumed reinsurance contracts for potential exposures, as well as analysis of our ceded reinsurance contracts and analysis provided by our brokers and claims counsel. We also considered the results of recent judicial rulings. There are no recent historical events with similar characteristics to COVID-19, and therefore we have no past loss experience on which to base our estimates. Additionally, the economic and social impacts of the pandemic continue to evolve.
Significant assumptions on which our estimates of reserves for direct COVID-19 losses and loss adjustment expenses are based include:
•the scope of coverage provided under our policies, particularly those that provide for business interruption coverage, which generally falls under the following three categories:
◦coverage has not been triggered because the policy's insuring agreement has not been satisfied and/or a covered cause of loss has not been established;
◦the policy would not respond because the policy includes a communicable disease, virus or pandemic exclusion; or
◦the policy may provide coverage for communicable diseases and pandemics, but also includes conditions and limitations to coverage;
•coverage provided under our ceded reinsurance contracts;
•the expected duration of the disruption caused by the COVID-19 pandemic; and
•the ability of insureds to mitigate some or all of their losses. For example, in the case of our event cancellation coverages, by deferring the event or moving to a virtual format, and for our business interruption exposures, the ability to continue providing certain services or to provide services remotely.
Due to the inherent uncertainty associated with the assumptions surrounding the COVID-19 pandemic, these estimates are subject to a wide range of variability. Our initial estimates in the first quarter of 2020 reflected limited claims reporting and were based on broad assumptions about coverage, liability and reinsurance. A test case of a sample of business interruption coverages for policies written in the United Kingdom (U.K.), which do not have the same exclusions as policies commonly written in the U.S., concluded in the third quarter of 2020 with the court's judgment finding mostly in favor of policyholders. This ruling was subsequently upheld by the U.K. supreme court. This ruling was most impactful to certain estimates in our Reinsurance segment, where we increased our estimate of losses and loss adjustment expenses on certain treaties following an increase in estimated losses by the respective cedents on the treaties. The ruling did not meaningfully impact the reserves previously established for business interruption coverage within our Insurance segment given the assumptions made in our initial estimates and our policy terms and conditions. Our estimates at December 31, 2020 also reflect additional data gathered through increased claims reporting and changes in our expectation of the duration of the pandemic, which was most impactful to our event cancellation coverages.
As of December 31, 2020, assumptions about coverage, liability and reinsurance continue to be subject to judicial review and may be subject to other government action. Additionally, we have begun to see significant litigation involving the handling of business interruption claims associated with COVID-19, and in certain instances, assessing the validity of policy exclusions for pandemics and interpreting policy terms to determine coverage for pandemics, which are also in the process of being tested in various judicial systems. While we believe our net reserves for losses and loss adjustment expenses for COVID-19 as of December 31, 2020 are adequate based on information currently available, we continue to closely monitor reported claims, government actions, judicial decisions and changes in the levels of worldwide social disruption and economic activity arising from the pandemic and will adjust our estimates of gross and net losses as new information becomes available. Such adjustments to our reserves for COVID-19 losses and loss adjustment expenses may be material to our results of operations, financial condition and cash flows.
Catastrophe Losses
Underwriting results in 2020 included $168.9 million of underwriting loss from Hurricanes Isaias, Laura, Sally, Delta and Zeta, as well as wildfires in the western U.S. and the derecho in Iowa (2020 Catastrophes). These losses and loss adjustment expenses2023 Catastrophes were net of ceded losses of $125.7$9.3 million. UnderwritingIn 2022, underwriting results in 2019 included $100.4$46.2 million and $35.7 million of underwriting loss from Hurricane Dorian and Typhoons Faxai and Hagibis (2019 Catastrophes). Thesenet losses and loss adjustment expenses were net of ceded losses of $62.5 million. The following table summarizes, by segment,attributed to Hurricane Ian and the components of the underwriting losses related to the 2020 and 2019 Catastrophes.
| | | | | | | | | | | | | | | | | | | | | | | | | | | | | | | | | | | |
| Years Ended December 31, |
| 2020 | | 2019 |
| 2020 Catastrophes | | 2019 Catastrophes |
| (dollars in thousands) | Insurance | | Reinsurance | | Consolidated | | Insurance | | Reinsurance | | Consolidated |
| Losses and loss adjustment expenses | $ | 124,386 | | | $ | 47,848 | | | $ | 172,234 | | | $ | 8,317 | | | $ | 105,644 | | | $ | 113,961 | |
| Ceded (assumed) reinstatement premiums | — | | | (3,368) | | | (3,368) | | | — | | | (13,552) | | | (13,552) | |
| Underwriting loss | $ | 124,386 | | | $ | 44,480 | | | $ | 168,866 | | | $ | 8,317 | | | $ | 92,092 | | | $ | 100,409 | |
| Impact on combined ratio | 3 | % | | 5 | % | | 3 | % | | — | % | | 10 | % | | 2 | % |
Russia-Ukraine conflict, respectively. The net losses and loss adjustment expenses onfrom Hurricane Ian and the 2020 Catastrophes asRussia-Ukraine conflict were net of December 31, 2020 represent our best estimates based upon information currently available. Our estimates forceded losses of $115.3 million and $44.3 million, respectively. Excluding these losses, are based on claims receivedthe increase in our consolidated combined ratio in 2023 compared to date, detailed policy and reinsurance contract level reviews, preliminary industry2022 was primarily driven by a higher attritional loss estimates and output fromratio across both industry and proprietary models, as well as analysis of our ceded reinsurance contracts. Givenunderwriting segments.
Insurance Segment
| | | | | | | | | | | | | | | | | |
| Years Ended December 31, |
| (dollars in thousands) | 2023 | | 2022 | | % Change |
| Gross premium volume | $ | 9,217,150 | | | $ | 8,606,700 | | | 7 | % |
| Net written premiums | $ | 7,432,062 | | | $ | 7,040,176 | | | 6 | % |
| Earned premiums | $ | 7,282,705 | | | $ | 6,528,263 | | | 12 | % |
| Underwriting profit | $ | 162,176 | | | $ | 549,871 | | | (71) | % |
| | | | | |
Underwriting Ratios (1) | | | | | Point Change |
| Loss ratio | | | | | |
| Current accident year loss ratio | 64.4 | % | | 60.3 | % | | 4.1 | |
| Prior accident years loss ratio | (1.4) | % | | (2.2) | % | | 0.8 | |
| Loss ratio | 63.0 | % | | 58.1 | % | | 4.9 | |
| Expense ratio | 34.8 | % | | 33.5 | % | | 1.3 | |
| Combined ratio | 97.8 | % | | 91.6 | % | | 6.2 | |
| | | | | |
Current accident year loss ratio catastrophe impact (2) | 0.5 | % | | 0.7 | % | | (0.2) | |
Current accident year loss ratio Russia-Ukraine conflict impact (2) | — | % | | 0.4 | % | | (0.4) | |
| | | | | |
| Current accident year loss ratio, excluding catastrophes and Russia-Ukraine conflict impact | 63.9 | % | | 59.2 | % | | 4.7 | |
| Combined ratio, excluding current year catastrophes and Russia-Ukraine conflict impact | 97.2 | % | | 90.5 | % | | 6.7 | |
(1) Amounts may not reconcile due to rounding.
(2) The point impact of catastrophes and the numberRussia-Ukraine conflict is calculated as the associated net losses and loss adjustment expenses divided by total earned premiums.
Premiums
The increase in gross premium volume in our Insurance segment in 2023 was driven by more favorable rates and new business growth across many of events comprising the 2020 Catastrophes,our product lines, most notably within our personal lines and in certain instances, the limited claims activity thus far, these estimates are still dependent on broad assumptions about coverage,property product lines. The increase was partially offset by lower premium volume within select lines of our professional liability and reinsurancegeneral liability product lines, where we are adjusting our writings in response to changes in market conditions and are therefore subjectdownward pressure on rates. We continue to a wide rangefocus on rate adequacy, particularly within certain classes of variability. Whileour casualty and professional liability product lines, and will not write business that we believe will not meet our reserves for the 2020 Catastrophes as of December 31, 2020 are adequate, we continue to closely monitor reported claims and will adjust our estimates of gross and net losses as new information becomes available.underwriting profit targets.
Insurance SegmentNet retention of gross premium volume was 81% in 2023 compared to 82% in 2022. The decrease was driven by higher cession rates on our personal lines product lines in 2023 compared to 2022. The increase in earned premiums in 2023 was primarily due to higher gross premium volume across most product lines in recent periods.
Combined Ratio
The combined ratio for the Insurance segmentsegment's current accident year losses and loss adjustment expenses in 2020 was 96% (including six points for underwriting2023 included $39.6 million of net losses and loss adjustment expenses attributed to COVID-19the 2023 Catastrophes. Current accident year losses in 2022 included $46.2 million and three points for underwriting$23.0 million of net losses on the 2020 Catastrophes) compared to 93% in 2019.
The increase in the combined ratio was driven by the impact of lossesand loss adjustment expenses attributed to COVID-19 in 2020 and higher catastrophe losses in 2020 compared to 2019, partially offset by a lower attritional loss ratio and a lower expense ratio in 2020 compared to 2019. Higher earned premiums in 2020 compared to 2019 had a favorable impact on our expense ratio while reducing the benefit of the prior accident years' loss ratio.
•Excluding the impact of losses attributed to COVID-19Hurricane Ian and the 2020 and 2019 Catastrophes,Russia-Ukraine conflict, respectively. Excluding these losses, the increase in the current accident year loss ratio decreasedin 2023 compared to 2022 was primarily dueattributable to lowerhigher attritional loss experience and a benefit from improved pricing in 2020 onratios within our propertygeneral liability and professional liability product lines. We also experienced lowerlines in 2023 compared to 2022. Based on the adverse prior accident year loss development trends on these long-tail lines of business and the uncertainty around future loss cost trends, as discussed in further detail below, we increased our attritional loss ratios on certain product classes within our general liability and professional liability product lines in 2023. Consistent with our loss reserving philosophy and to increase the likelihood that the reserves established for our in-force portfolio will ultimately prove to be adequate, we are taking a more cautious approach in our reserving, resulting in higher attritional loss ratios on this business.
Additionally, we recognized losses on our marine and energyintellectual property collateral protection insurance written within our professional liability product linesline in 2020, primarily2023 due to changeshigher than anticipated levels of claims and loss experience. Losses on this product line also included $65.0 million of credit losses recognized in connection with fraudulent letters of credit that were provided by an affiliate of Vesttoo Ltd. as collateral for reinsurance purchased on two policies, which we believe represents our full exposure to credit losses on the mixrelated reinsurance recoverables. We are actively pursuing remedies to make recoveries on the reinsurance recoverables impacted by the fraudulent letters of business.credit and do not have any other ceded reinsurance contracts with Vesttoo Ltd. or its affiliates.
•The Insurance segment's 20202023 combined ratio included $554.6$104.7 million of favorable development on prior years'accident years loss reserves, comparedwhich was primarily attributable to $462.1 million in 2019. The increase in favorable development on our property, marine and energy, international professional liability, personal lines and workers' compensation product lines, partially offset by adverse development on our U.S. and Bermuda general liability and professional liability product lines. In 2022, the combined ratio included $142.9 million of favorable development on prior accident years loss reserves, which was primarily dueattributable to more favorable development on our workers' compensation, programs, property and credit and surety product lines. Favorable development in 2022 was partially offset by adverse development on our professional liability product lines in 2020 compared to 2019 and favorable development on our property product lines in 2020 compared to adverse development in 2019. These favorable changes were partially offset by less favorable development on our general liability product lines, in 2020 compared to 2019. In 2020 and 2019, favorable development was most significantprimarily on our general liability, professional liability, workers' compensationU.S. and marine and energy product lines.Bermuda business. See note 911 of the notes to consolidated financial statements included under Item 8 for more information on the Insurance segment's prior year loss reserve development.
•Net favorable development in 2022 was net of $128.5 million, or two points, of adverse development on our U.S. and Bermuda professional liability and general liability product lines, which was primarily attributable to unfavorable claim settlements and increased claim frequency and severity on the 2016 to 2019 accident years. The decreaseadverse development was across a number of products, including directors and officers, errors and omissions and employment practices liability within professional liability and contractors and excess and umbrella within general liability. Development on prior years loss reserves within our U.S. and Bermuda professional liability and general liability product lines in 2022 was impacted by broader market conditions. The impact of economic and social inflation, including the rising cost to adjust and settle claims and the impact of more pervasive litigation financing trends, has contributed to the loss cost trends, leading to higher than anticipated losses in older accident years for these product lines. The impacts of social inflation were most significant on our large, risk-managed excess professional liability accounts, corresponding with a notable rise in the number of class action lawsuits on these years and the recent unfavorable legal environment. The development of this claims trend was influenced by state and federal court closures following the onset of the COVID-19 pandemic in 2020, which delayed court proceedings for claims on the impacted product lines.
In 2023, we continued to see an increased frequency of large claims and unfavorable loss cost trends on our U.S. and Bermuda general liability and professional liability product lines. In response to consecutive quarters of adverse loss development, in the fourth quarter of 2023, we conducted an extensive reserve study on selected general liability and professional liability product lines, which resulted in further increases to our prior accident year loss reserves. Adverse development in 2023 on our U.S. and Bermuda general liability and professional liability product lines totaled $330.7 million, or five points. This adverse development was most substantial on our primary casualty contractors' liability and excess and umbrella general liability product lines.
A significant portion of our casualty portfolio is associated with construction business, which has grown meaningfully in recent years. Our study determined that the ultimate claim reporting tail on certain of our casualty construction lines is likely to be longer than we initially anticipated. Within our excess and umbrella general liability and risk-managed errors and omissions professional liability books, we determined that there was a greater than expected propensity for limits below our attachment point to erode, pushing more claims into our layers. Further, reporting of these claims has lagged historical loss development patterns due to the effect of court closures and claims backlogs arising from the COVID-19 pandemic, in addition to aggressive tactics by the plaintiffs' bar and delayed claims reporting trends. Although we have achieved significant rate increases since 2019 on many of these lines in response to heightened loss trends, the findings of our study led us to increase our loss development factors, and therefore our estimate of the ultimate loss ratios, on our primary casualty contractors' liability, excess and umbrella general liability and risk-managed errors and omissions professional liability product lines. This resulted in significant strengthening of reserves on the impacted lines, including on the 2020 to 2022 accident years where we determined that the incurred loss trends are following a similar loss development trend at the same stage as older accident years.
Consistent with our reserving philosophy to hold reserves that are more likely to be redundant than deficient, we increased reserves in areas where there were indications that our reserves may have been deficient, however, in instances where claims trends have been more favorable than we previously anticipated, we will wait to reduce loss reserves until those trends are observed over additional periods of time. For those lines in which we strengthened reserves, although we believe the gross and net reserves are adequate based on information available at this time, we continue to closely monitor reported claims, claim settlements, ceded reinsurance contract attachments and judicial decisions, among other things, and may adjust our estimates as new information becomes available.
The increase in the Insurance segment's expense ratio in 20202023 was primarily due to higher personnel costs, professional fees and other general and administrative expenses, which were partially offset by the favorable impact of higher earned premiums in 2020 while maintaining consistent levels of general expenses with 2019.premiums.
Reinsurance Segment
The combined ratio for the Reinsurance segment was 104% for both 2020 and 2019. In 2020, the Reinsurance segment combined ratio included seven points for underwriting losses attributed to COVID-19 and five points for underwriting losses on the 2020 Catastrophes. In 2019, the Reinsurance segment combined ratio included 10 points for underwriting losses on the 2019 Catastrophes. | | | | | | | | | | | | | | | | | |
| Years Ended December 31, |
| (dollars in thousands) | 2023 | | 2022 | | % Change |
| Gross premium volume | $ | 1,046,539 | | | $ | 1,229,851 | | | (15) | % |
| Net written premiums | $ | 967,799 | | | $ | 1,167,312 | | | (17) | % |
| Earned premiums | $ | 1,014,294 | | | $ | 1,063,347 | | | (5) | % |
| Underwriting profit (loss) | $ | (19,265) | | | $ | 83,859 | | | NM (1) |
| | | | | |
Underwriting Ratios (2) | | | | | Point Change |
| Loss ratio | | | | | |
| Current accident year loss ratio | 66.0 | % | | 63.6 | % | | 2.4 | |
| Prior accident years loss ratio | 5.6 | % | | (2.4) | % | | 8.0 | |
| Loss ratio | 71.7 | % | | 61.2 | % | | 10.5 | |
| Expense ratio | 30.2 | % | | 30.9 | % | | (0.7) | |
| Combined ratio | 101.9 | % | | 92.1 | % | | 9.8 | |
| | | | | |
| | | | | |
Current accident year loss ratio Russia-Ukraine conflict impact (3) | — | % | | 1.2 | % | | (1.2) | |
| | | | | |
| Current accident year loss ratio, excluding Russia-Ukraine conflict impact | 66.0 | % | | 62.4 | % | | 3.6 | |
| Combined ratio, excluding current year Russia-Ukraine conflict impact | 101.9 | % | | 90.9 | % | | 11.0 | |
Excluding the(2) Amounts may not reconcile due to rounding.
(3) The point impact of COVID-19the Russia-Ukraine conflict is calculated as the associated net losses and catastrophe losses, the combined ratio decreased in 2020 due to a lower attritional loss ratio, partially offsetadjustment expenses divided by the impact of less favorable development on prior accident years' loss reserves.
•Excluding the impact of losses attributed to COVID-19 and the 2020 and 2019 Catastrophes, the current accident year loss ratio decreased primarily due to fewer large loss events across several product lines in 2020 compared to 2019, most notably on our property product lines.
•The Reinsurance segment's 2020 combined ratio included $51.8 million of favorable development on prior years' loss reserves compared to $64.8 million in 2019. The decrease in favorable development was primarily due to more adverse development on our public entity product lines in 2020, which totaled $34.4 million in 2020 or four points on the segment combined ratio, as well as less favorable development on our whole account product line in 2020 compared to 2019. These unfavorable changes were partially offset by more favorable development on our property product lines in 2020 compared to 2019. In 2020, favorable development was most significant on our property product lines. In 2020 we also recognized additional exposure related to net favorable premium adjustments along with adverse development on certain of our professional liability product lines. The favorable development on prior years' loss reserves in 2019 was most significant on our property and whole account product lines. See note 9 of the notes to consolidated financial statements included under Item 8 for more information on the Reinsurance segment's prior year loss reserve development.total earned premiums.
Premiums
Gross Premium Volume
| | | | | | | | | | | |
| Years Ended December 31, |
| (dollars in thousands) | 2020 | | 2019 |
| Insurance | $ | 6,029,024 | | | $ | 5,320,253 | |
| Reinsurance | 1,130,923 | | | 1,114,153 | |
| Other underwriting | 58 | | | (79) | |
| Total Underwriting | 7,160,005 | | | 6,434,327 | |
| Program services and other | 2,106,660 | | | 2,345,644 | |
| Total | $ | 9,266,665 | | | $ | 8,779,971 | |
Gross premium volume in our underwriting operations increased 11% in 2020, primarily due to an increase in gross premium volume in our Insurance segment. Also impacting consolidated gross premium volume were gross premiums written through our program services business and other fronting arrangements, which decreased 10% in 2020. The decrease in gross premium volume in our program services businessReinsurance segment in 2023 was driven by the run-off of one large program and the cancellation of an in-force book of policies related to another large program. Substantially all gross premiums from our program services business and other fronting arrangements were ceded to third parties in 2020 and 2019. See "Other Operations" for further discussion on gross premiums from our program services operations.
Gross premium volume in our Insurance segment increased 13% in 2020, primarily driven by new business and more favorable rates within our professional liability, general liability, personal lines and marine and energy product lines.
Gross premium volume in our Reinsurance segment increased 2% in 2020, driven by higher gross premiums within our professional liability and general liability product lines, partially offset bysignificantly lower gross premiums within our credit and surety product lines. Higher gross premiums within our professional liability product lines, were primarily attributable to unfavorable premium adjustments in 2023 compared to favorable premium adjustments in 2022, largely driven by transaction liability business, due to lower volume of deal activity, and the deterioration in the pricing environment on directors and officers liability. Lower premium volume within professional liability also reflects decreases on renewals, due to decreased exposures and participation. The decrease in professional liability premium volume was partially offset by higher gross premiums within our marine and energy product lines due to increases on renewals, arising from increased exposures and improved pricing on renewals,more favorable rates, as well as new business. Higher gross premiums within our general liability product lines were primarily due to new business, partially offset by decreased exposures on renewals. Lower gross premiums within our credit and surety product lines in 2020 were primarily due to unfavorable premium adjustments. Significant variability in gross premium volume can be expected in our Reinsurance segment due to individually significant contracts and multi-year contracts.
FollowingNet retention of gross premium volume was 92% in 2023 compared to 95% in 2022. The decrease in net retention was driven by changes in mix of gross premium volume, as our professional liability business is fully retained and our marine and energy business carries a higher cession rate than the high levelrest of catastrophes that have occurredthe segment.
The decrease in recentearned premiums in 2023 was primarily due to less favorable premium adjustments in 2023 compared to 2022, primarily attributable to our professional liability and credit and surety product lines, and the non-renewal of a large treaty within our workers' compensation product line.
Combined Ratio
The increase in the Reinsurance segment's current accident year loss ratio in 2023 compared to 2022 was primarily due to less favorable premium adjustments on prior accident years and based on general market conditions, we are seeing more favorable rates, particularlyin 2023 compared to 2022, primarily on our catastrophe-exposedprofessional liability and loss-affected business. We are also seeing improved pricingcredit and surety product lines.
The Reinsurance segment's 2023 combined ratio included $57.1 million of adverse development on mostprior accident years loss reserves, which was driven by $95.5 million, or nine points, of adverse development on our othergeneral liability product lines and $53.7 million, or five points, of adverse development on our public entity product line, as well as additional exposures recognized on prior accident years related to net favorable premium adjustments on our general liability product lines. These increases in prior accident year reserves in 2023 were partially offset by favorable development across several product lines, including our property and workers' compensation product lines, as well as reduced exposures recognized on prior accident years related to net unfavorable premium adjustments on our professional liability product lines.
Adverse development on our general liability product lines was primarily attributable to large reported loss claims and adverse loss development trends across multiple accident years. Substantially all of the adverse development on our public entity product line was attributable to a segment of this business that we discontinued writing in 2020, which experienced an increased frequency of large claims over the past several quarters, most notably withinsignificantly on the 2014 to 2019 accident years. Adverse development on both our general liability and public entity product lines included notable strengthening as a result of actions taken in the fourth quarter in response to changes in loss trends observed in the reserve study previously discussed under "Insurance Segment" and the expectation that those loss trends will ultimately emerge within comparable reinsurance product lines.
In 2022, the combined ratio included $26.1 million of favorable development on prior accident years loss reserves, which was primarily attributable to favorable development within our property product lines related to natural catastrophes and our credit and surety product lines. Favorable development on prior years loss reserves in 2022 was partially offset by additional exposures recognized on prior accident years related to net favorable premium adjustments on our general liability, credit and surety and professional liability product lines. The primary exception is workers' compensation, where we continue to see low single digit rate decreases given generally favorable loss experience in recent years. When we believe the prevailing market price will not support our underwriting profit targets, the business is not written. As a result of our underwriting discipline, gross premium volume may vary when we alter our product offerings to maintain or improve underwriting profitability.
See "Developments Related to COVID-19" for discussion of potential impactsnote 11 of the pandemicnotes to consolidated financial statements included under Item 8 for more information on our premiums.the Reinsurance segment's prior year loss reserve development.
Net Written PremiumsProgram Services and Other Fronting, Insurance-linked Securities and Other Insurance
| | | | | | | | | | | |
| Years Ended December 31, |
| (dollars in thousands) | 2020 | | 2019 |
| Insurance | $ | 4,977,662 | | | $ | 4,444,702 | |
| Reinsurance | 960,123 | | | 964,947 | |
| Other underwriting | (170) | | | 581 | |
| Total Underwriting | 5,937,615 | | | 5,410,230 | |
| Program services and other | (5,377) | | | 1,841 | |
| Total | $ | 5,932,238 | | | $ | 5,412,071 | |
The following table presents the components of operating revenues and operating expenses attributable to our program services and other fronting, insurance-linked securities and other insurance operations, including our run-off block of life and annuity reinsurance contracts, none of which are included in a reportable segment.
Net retention | | | | | | | | | | | | | | | | | | | | | | | | | | | | | | | | | | | |
| Years Ended December 31, |
| 2023 | | 2022 |
| (dollars in thousands) | Operating revenues | | Operating expenses | | Net | | Operating revenues | | Operating expenses | | Net |
| Services and other: | | | | | | | | | | | |
| Program services and other fronting | $ | 155,654 | | | $ | 31,591 | | | $ | 124,063 | | | $ | 149,993 | | | $ | 27,613 | | | $ | 122,380 | |
| Program services - disposition gain | 16,923 | | | — | | | 16,923 | | | — | | | — | | | — | |
| Insurance-linked securities | 97,550 | | | 75,950 | | | 21,600 | | | 109,020 | | | 125,316 | | | (16,296) | |
| Insurance-linked securities - disposition gains | — | | | — | | | — | | | 225,828 | | | — | | | 225,828 | |
Life and annuity (1) | 40 | | | 12,070 | | | (12,030) | | | 1,040 | | | 11,073 | | | (10,033) | |
| Markel CATCo buy-out | — | | | — | | | — | | | — | | | 101,904 | | | (101,904) | |
Markel CATCo Re (2) | — | | | (71,491) | | | 71,491 | | | — | | | (89,862) | | | 89,862 | |
| Other | 11,484 | | | 18,122 | | | (6,638) | | | 11,683 | | | 19,431 | | | (7,748) | |
| 281,651 | | | 66,242 | | | 215,409 | | | 497,564 | | | 195,475 | | | 302,089 | |
Underwriting (3) | (1,520) | | | 8,655 | | | (10,175) | | | (3,818) | | | 3,292 | | | (7,110) | |
| 280,131 | | | 74,897 | | | 205,234 | | | 493,746 | | | 198,767 | | | 294,979 | |
| Amortization of intangible assets | | | 61,168 | | | (61,168) | | | | | 61,202 | | | (61,202) | |
| Impairment of goodwill | | | — | | | — | | | | | 80,000 | | | (80,000) | |
| $ | 280,131 | | | $ | 136,065 | | | $ | 144,066 | | | $ | 493,746 | | | $ | 339,969 | | | $ | 153,777 | |
(1) Investment income earned on the investments that support life and annuity policy benefit reserves are included in our Investing segment.
(2) Results attributable to Markel CATCo Re were entirely attributable to noncontrolling interest holders in Markel CATCo Re.
(3) Underwriting results attributable to our other insurance operations include results from discontinued lines of business and the retained portion of our program services and other fronting operations.
Program Services and Other Fronting
The increase in operating revenues in 2023 was due to modest increases at both our program services business and other fronting operations as a result of higher gross premium volume forin 2023 compared to 2022. The following table summarizes gross premium volume in our underwriting operations was 83% in 2020program services and 84% in 2019. The decrease in net retention in 2020 was driven by our Insurance segment, due in part to a new quota share agreement to fully cede premiums on a program that was put into run-off in 2020. Within our underwriting operations, we purchase reinsurance and retrocessional reinsurance in order to manage our net retention on individual risks and overall exposure to losses, and enable us to write policies with sufficient limits to meet policyholder needs.other fronting operations.
In late 2020, we decided to discontinue writing catastrophe-exposed property reinsurance within our Reinsurance segment on a risk-bearing basis, and beginning January 1, 2021, any such business will either be written directly by, or ceded to, our Nephila insurance-linked securities (ILS) operations to be placed with third party capital to the extent it fits the ILS investors’ risk profile. For the year ended December 31, 2020, gross and net written premiums for this business were $221.2 million and $125.2 million, respectively. | | | | | | | | | | | | | | | | | |
| Years Ended December 31, |
| (dollars in thousands) | 2023 | | 2022 | | % Change |
| Program services | $ | 2,883,737 | | | $ | 2,800,273 | | | 3 | % |
| Other fronting | $ | 840,868 | | | $ | 553,871 | | | 52 | % |
Earned Premiums
| | | | | | | | | | | |
| Years Ended December 31, |
| (dollars in thousands) | 2020 | | 2019 |
| Insurance | $ | 4,688,448 | | | $ | 4,144,073 | |
| Reinsurance | 929,348 | | | 903,587 | |
| Other underwriting | (170) | | | 581 | |
| Total Underwriting | 5,617,626 | | | 5,048,241 | |
| Program services and other | (5,421) | | | 1,552 | |
| Total | $ | 5,612,205 | | | $ | 5,049,793 | |
Earned premiums increased 11% in 2020, primarily due to theThe increase in gross premium volume within our Insurance segmentprogram services operations in 2023 was attributable to expansion of existing programs and growth from new programs. The increase in gross premium volume in our other fronting operating in 2023 was driven by expansion of our property catastrophe programs with Nephila Reinsurers and achieving more favorable rates on our professional liability and general liability product lines,this business, as previously discussed.well as growth from a new specialty program with Nephila Reinsurers.
Disposal LossIn June 2023, we sold Independent Specialty Insurance Company, a subsidiary within our program services operations, which resulted in a gain of $16.9 million.
ResultsInsurance-Linked Securities
The decrease in operating revenues and operating expenses in our Nephila insurance-linked securities operations in 2023 was primarily due to the disposition of our Velocity managing general agent operations in February 2022, which resulted in a gain of $107.3 million, and our Volante managing general agent operations in October 2022, which resulted in a gain of $118.5 million. Following these sales, our Nephila ILS operations are solely comprised of our fund management operations. In 2023, the increase in operating revenues within our fund management operations was primarily due to $31.1 million of management fees recognized upon the release of capital from side pocket reserves. Nephila's net assets under management were $6.8 billion as of December 31, 2023.
Additionally, in 2022, we recognized a goodwill impairment charge of $80.0 million attributable to our Nephila fund management operations. See note 8 of the notes to consolidated financial statements included under Item 8 for more information about this goodwill impairment.
Markel CATCo
In March 2022, we completed a buy-out transaction with Markel CATCo Re Ltd. (Markel CATCo Re) and Markel CATCo Reinsurance segmentFund Ltd. (the Markel CATCo Funds) that provided for an accelerated return of all remaining capital to investors in the Markel CATCo Funds and resulted in the consolidation of Markel CATCo Re upon completion of the transaction. In order to complete the transaction, we made $101.9 million in payments, net of insurance proceeds, to or for the year ended December 31, 2020 included a disposal lossbenefit of $41.5 million relatedinvestors that were recognized as an expense during the first quarter of 2022. See note 17 of the notes to consolidated financial statements for further details regarding our Markel CATCo operations, the planned dispositionbuy-out transaction and the consolidation of our reinsurance operations in Latin America, which was included in services and other expenses and was not included in the segment's underwriting loss. This disposal loss is primarily attributable to foreign currency translation adjustments for these operations, which were previously included in accumulated other comprehensive income.Markel CATCo Re.
Investing Results
Our business strategy recognizes the importance of both consistent underwriting and operating profits and superior investment returns to build shareholder value. We rely on sound underwriting practices to produce investable funds. We measure investing resultsour investment performance by ouranalyzing net investment income earned on our investment portfolio, which reflects the recurring interest and dividend earnings on our investment portfolio. We also analyze net investment gains, which include unrealized gains and the change in net unrealized investment gainslosses on available-for-sale investments, as well as investment yield and our taxable equivalent total investment return.equity portfolio. Based on the potential for volatility in the financial markets, we understand that the level of gains or losses may vary from one period to the next, and therefore believe that our investment performance is best analyzed over several years.longer periods of time.
The following table summarizes our consolidated investment performance.
| | | | | | | | | | | | | | | | | | | | | | | | | | | | | |
| Years Ended December 31, |
| (dollars in thousands) | 2020 | | 2019 | | 2018 | | 2017 | | 2016 |
| Net investment income | $ | 371,830 | | | $ | 451,888 | | | $ | 434,215 | | | $ | 405,709 | | | $ | 373,230 | |
Net investment gains (losses) (1) | $ | 617,979 | | | $ | 1,601,722 | | | $ | (437,596) | | | $ | (5,303) | | | $ | 65,147 | |
Change in net unrealized investment gains on available-for-sale investments (2) | $ | 442,089 | | | $ | 381,890 | | | $ | (299,446) | | | $ | 1,125,440 | | | $ | 342,111 | |
Investment yield (3) | 2.4 | % | | 3.0 | % | | 2.7 | % | | 2.6 | % | | 2.4 | % |
| Taxable equivalent total investment return | 9.4 | % | | 14.6 | % | | (1.0) | % | | 10.2 | % | | 4.4 | % |
| Invested assets, end of year | $ | 24,926,592 | | | $ | 22,258,265 | | | $ | 19,238,261 | | | $ | 20,570,337 | | | $ | 19,058,666 | |
(1)Effective January 1, 2018, we adopted Financial Accounting Standards Board Accounting Standards Update (ASU) No. 2016-01. As a result, equity securitiesperformance, which consists predominantly of the results of our Investing segment. Net investment gains or losses in any given period are no longer classified as available-for-sale with unrealized gains and losses recognized in other comprehensive income; rather, alltypically attributable to changes in the fair value of our equity securities are now recognized in net income. Prior periods have not been restatedportfolio due to conform to the current presentation.
(2)market value movements. The increasechange in net unrealized gains (losses) on available-for-sale securities forinvestments in any given period is typically attributable to changes in the years ended December 31, 2020 and 2019 was netfair value of an adjustment relatedour fixed maturity portfolio due to our life and annuity benefit reserves of $68.2 million and $51.4 million, respectively.changes in interest rates during the period.
| | | | | | | | | | | | | | | | | | | | | | | | | | | | | |
| Years Ended December 31, |
| (dollars in thousands) | 2023 | | 2022 | | 2021 | | 2020 | | 2019 |
| Net investment income | $ | 734,532 | | | $ | 446,755 | | | $ | 367,417 | | | $ | 375,826 | | | $ | 442,182 | |
Yield on fixed maturity securities (1) | 2.8 | % | | 2.3 | % | | 2.6 | % | | 3.1 | % | | 3.5 | % |
Yield on short-term investments (1) | 4.5 | % | | 1.5 | % | | 0.1 | % | | 0.5 | % | | 1.9 | % |
Yield on cash and cash equivalents and restricted cash and cash equivalents (1) | 2.8 | % | | 0.6 | % | | 0.0 | % | | 0.2 | % | | 0.9 | % |
| | | | | | | | | |
| Net realized investment gains (losses) | $ | (42,177) | | | $ | (40,983) | | | $ | 37,908 | | | $ | 14,780 | | | $ | (1,482) | |
| Change in fair value of equity securities | 1,566,231 | | | (1,554,750) | | | 1,940,626 | | | 603,199 | | | 1,603,204 | |
| Net investment gains (losses) | $ | 1,524,054 | | | $ | (1,595,733) | | | $ | 1,978,534 | | | $ | 617,979 | | | $ | 1,601,722 | |
| | | | | | | | | |
Return on equity securities (2) | 21.6 | % | | (16.1) | % | | 29.4 | % | | 15.1 | % | | 29.8 | % |
| Five-year annual return | 14.6 | % | | 9.3 | % | | 18.4 | % | | 15.2 | % | | 11.4 | % |
| Ten-year annual return | 11.9 | % | | 12.9 | % | | 16.9 | % | | 14.3 | % | | 14.7 | % |
| Twenty-year annual return | 10.2 | % | | 10.6 | % | | 11.0 | % | | 10.5 | % | | 11.0 | % |
| | | | | | | | | |
Other (3) | $ | (11,854) | | | $ | (17,661) | | | $ | 7,184 | | | $ | (3,996) | | | $ | 9,706 | |
| Change in net unrealized gains (losses) on available-for-sale investments | $ | 390,558 | | | $ | (1,463,876) | | | $ | (513,084) | | | $ | 510,247 | | | $ | 433,280 | |
(3)(1)Investment yield Yield reflects net investmentthe applicable interest income as a percentage of the applicable monthly average invested assets at amortized cost.
(2) Return on equity securities is calculated by dividing dividends and the change in fair value of equity securities by the monthly average equity securities at fair value and considers the timing of net purchases and sales.
(3) Other income or losses within our investing operations primarily relate to equity method investments in our investing segment, which are managed separately from the rest of our investment portfolio.
The increase in net investment income decreased 18% in 2020, driven2023 was primarily by the impactattributable to higher interest income on cash equivalents, fixed maturity securities and short-term investments due to higher yields during 2023 compared to 2022. Throughout 2023, we increased our allocation of lowercash to money market funds in response to increases in short-term interest rates on short-term investment income. We also earned lowerrates. Additionally, interest income on our fixed maturity investment portfoliosecurities increased in part due to lowerhigher average holdings of fixed maturity securities during 2020in 2023 compared to 2019 and a lower yield, as fixed maturity securities purchased in 2020 had lower interest rates than securities that matured or were called or sold in 2020.2022. See note 4(d) of the notes to consolidated financial statements included under Item 8 for further details onregarding the components of net investment income.
Net investment gains were $618.0 million and $1.6 billion in 2020 and 2019, respectively. See note 4(e) of the notes to consolidated financial statements included under Item 8 for further details on the components of net investment gains (losses). Net investment gains in both 2020 and 2019 were primarily attributable to an increase in the fair value of equity securities. Net investment gains for 2020 reflected significant market volatility experienced during the year. The impact of significant declines in the fair value of our equity portfolio in the first quarter of 2020, driven by unfavorable market value movements resulting from the onset of the COVID-19 pandemic, were more than offset by increases in the fair value of our equity portfolio over the subsequent three quarters of 2020.
Markel Ventures Results
In 2020, the increase in net unrealized gains on available-for-sale investments was $442.1 million compared to $381.9 million in 2019. The increase in net unrealized gains on available-sale investments in both 2020 and 2019 was attributable to an increase in the fair value of our fixed maturity portfolio as a result of decreases in interest rates.
We evaluate our investment performance by analyzing taxable equivalent total investment return, which is a non-GAAP financial measure. Taxable equivalent total investment return includes items that impact net income, such as coupon interest on fixed maturity securities, changes in fair value of equity securities, dividends on equity securities and realized investment gains or losses on available-for-sale securities, as well as changes in unrealized gains or losses on available-for-sale securities, which do not impact net income. Certain items that are included in net investment income have been excluded from the calculation of taxable equivalent total investment return, such as amortization and accretion of premiums and discounts on our fixed maturity portfolio, to provide a comparable basis for measuring our investment return against industry investment returns. The calculation of taxable equivalent total investment return also includes the current tax benefit associated with income on certain investments that is either taxed at a lower rate than the statutory income tax rate or is not fully included in U.S. taxable income. We believe the taxable equivalent total investment return is a better reflection of the economics of our decision to invest in certain asset classes. We focus on our long-term investment return, understanding that the level of investment gains or losses may vary from one period to the next.
We believe our investment performance is best analyzed from the review of taxable equivalent total investment return over several years. The following table presents taxable equivalent total investment return before and after the effects of foreign currency movements.
| | | | | | | | | | | | | | | | | | | | | | | | | | | | | | | | | | | | | | | | | |
| | | | | | | | | | | Five-Year
Annual
Return | | Ten-Year
Annual
Return |
| | Years Ended December 31, | | |
| | 2020 | | 2019 | | 2018 | | 2017 | | 2016 | | |
| Equities | 15.2 | % | | 30.0 | % | | (3.5) | % | | 25.5 | % | | 13.5 | % | | 15.5 | % | | 14.7 | % |
Fixed maturity securities, cash and short-term investments (1) | 5.7 | % | | 6.5 | % | | 1.3 | % | | 3.4 | % | | 2.4 | % | | 3.8 | % | | 4.0 | % |
| Total portfolio, before foreign currency effect | 8.6 | % | | 14.4 | % | | (0.7) | % | | 9.2 | % | | 5.0 | % | | 7.1 | % | | 6.7 | % |
| Total portfolio | 9.4 | % | | 14.6 | % | | (1.0) | % | | 10.2 | % | | 4.4 | % | | 7.4 | % | | 6.5 | % |
| | | | | | | | | | | | | |
(1)Includes cash and cash equivalents and restricted cash and cash equivalents.
The following table reconciles investment yield to taxable equivalent total investment return.
| | | | | | | | | | | | | | | | | | | | | | | | | | | | | |
| Years Ended December 31, |
| 2020 | | 2019 | | 2018 | | 2017 | | 2016 |
Investment yield (1) | 2.4 | % | | 3.0 | % | | 2.7 | % | | 2.6 | % | | 2.4 | % |
| Adjustment of investment yield from amortized cost to fair value | (0.5) | % | | (0.7) | % | | (0.6) | % | | (0.5) | % | | (0.4) | % |
| Net amortization of net premium on fixed maturity securities | 0.4 | % | | 0.4 | % | | 0.4 | % | | 0.4 | % | | 0.4 | % |
Net investment gains (losses) and change in net unrealized investment gains on available-for-sale securities (2) | 5.8 | % | | 10.3 | % | | (3.8) | % | | 5.9 | % | | 2.3 | % |
Taxable equivalent effect for interest and dividends (3) | 0.1 | % | | 0.2 | % | | 0.1 | % | | 0.4 | % | | 0.4 | % |
Other (4) | 1.2 | % | | 1.4 | % | | 0.2 | % | | 1.4 | % | | (0.7) | % |
| Taxable equivalent total investment return | 9.4 | % | | 14.6 | % | | (1.0) | % | | 10.2 | % | | 4.4 | % |
(1)Investment yield reflects net investment income as a percentage of monthly average invested assets at amortized cost.
(2)Adjustment includes the impact of changes in foreign currency exchange rates beginning in 2018.
(3)Adjustment to tax-exempt interest and dividend income to reflect a taxable equivalent basis.
(4)Adjustment to reflect the impact of time-weighting the inputs to the calculation of taxable equivalent total investment return and the impact of changes in foreign currency exchange rates prior to 2018.
Invested Assets
Investments, cash and cash equivalents and restricted cash and cash equivalents (invested assets) were $24.9 billion at December 31, 2020 compared to $22.3 billion at December 31, 2019, reflecting an increase of 12% in 2020 attributable to cash flows from operations of $1.7 billion and increases in the fair value of equity and fixed maturity securities totaling $1.0 billion.
The following table presents the composition of our investment portfolio.
| | | | | | | | | | | |
| | December 31, |
| | 2020 | | 2019 |
| Short-term investments, cash and cash equivalents and restricted cash and cash equivalents | 29 | % | | 21 | % |
| Fixed maturity securities | 43 | % | | 45 | % |
| Equity securities | 28 | % | | 34 | % |
| Total | 100 | % | | 100 | % |
| | | |
The change in the composition of the investment portfolio from December 31, 2019 to December 31, 2020 is primarily due to a decrease in holdings of equity securities and an increase in holdings of short-term investments during 2020. Given the dislocation in the financial markets and related uncertainty around the global credit markets following the onset of the COVID-19 pandemic in the first quarter of 2020, we sold significant holdings of equity securities and subsequently reallocated proceeds to purchase short-term investments and fixed maturity securities. See "Developments Related to COVID-19" for
further discussion of actions we took in our investment portfolio in response to the pandemic. In 2020, our holdings of cash and cash equivalents also increased due to operating cash inflows and proceeds from our issuance of preferred shares, partially offset by cash used for acquisitions, all of which are further discussed in "Liquidity and Capital Resources."
Markel Ventures
Our Markel Ventures segment includes a diverse portfolio of businesses from different industries that offer various types of products and services to businesses and consumers, predominately in the United States. We measure Markel Ventures' results by its operating income and net income, as well as earnings before interest, income taxes, depreciation and amortization (EBITDA). We consolidate the results of our Markel Ventures subsidiaries on a one-month lag, with the exception of significant transactions or events that occur during the intervening period. The following table summarizes the results from our Markel Ventures segment.
In April 2020, we acquired a controlling interest in Lansing Building Products, LLC, a supplier of exterior building products and materials to professional contractors throughout the U.S., which simultaneously acquired the distribution business of Harvey Building Products to enhance its geographic reach and scale (together, Lansing).
In November 2019, we acquired VSC Fire & Security, Inc. (VSC), a Virginia-based privately held provider of comprehensive fire protection, life safety and low voltage solutions. | | | | | | | | | | | | | | | | | |
| Years Ended December 31, |
| (dollars in thousands) | 2023 | | 2022 | | % Change |
| Operating revenues | $ | 4,985,081 | | | $ | 4,757,527 | | | 5 | % |
| Operating income | $ | 437,508 | | | $ | 325,238 | | | 35 | % |
| EBITDA | $ | 628,483 | | | $ | 506,336 | | | 24 | % |
The following tables summarize the amounts recognized on the consolidated balance sheetsincrease in operating revenues in 2023 was driven by higher revenues at our construction services businesses and consolidated statements of income related to Markel Ventures.
| | | | | | | | | | | |
| December 31, |
| (dollars in thousands) | 2020 | | 2019 |
| ASSETS | | | |
| Cash and cash equivalents | $ | 363,532 | | | $ | 256,758 | |
| Receivables | 299,051 | | | 225,630 | |
| Goodwill | 901,045 | | | 606,777 | |
| Intangible assets | 623,120 | | | 473,122 | |
| Other assets: | | | |
| Inventory | 412,554 | | | 303,053 | |
| Property, plant and equipment, net | 492,477 | | | 441,934 | |
| Right-of-use lease assets | 368,126 | | | 81,778 | |
| Other | 176,155 | | | 161,783 | |
| Total Other assets | 1,449,312 | | | 988,548 | |
| Total Assets | $ | 3,636,060 | | | $ | 2,550,835 | |
| LIABILITIES AND EQUITY | | | |
| Accounts payable and accrued liabilities | $ | 270,361 | | | $ | 139,068 | |
Senior long-term debt and other debt (1) | 775,650 | | | 929,243 | |
| Other liabilities: | | | |
| Lease liabilities | 374,667 | | | 85,680 | |
| Other | 380,190 | | | 281,660 | |
| Total Other liabilities | 754,857 | | | 367,340 | |
| Total Liabilities | 1,800,868 | | | 1,435,651 | |
| Redeemable noncontrolling interests | 245,642 | | | 177,562 | |
Shareholders' equity (2) | 1,599,466 | | | 950,086 | |
| Noncontrolling interests | (9,916) | | | (12,464) | |
| Total Equity | 1,589,550 | | | 937,622 | |
| Total Liabilities and Equity | $ | 3,636,060 | | | $ | 2,550,835 | |
(1) Debt as of December 31, 2020 and 2019 included $733.0 million and $858.8 million, respectively, of debttransportation-related businesses, due to other subsidiariesa combination of Markel Corporation, which was eliminated in consolidation.
(2) Shareholders' equityincreased demand, higher prices, and growth, as well as increased production at one of December 31, 2020 and 2019 included $1.2 billion and $654.3 million, respectively, of common stock, which represents Markel Corporation's investment in Markel Ventures, which was eliminated in consolidation.
| | | | | | | | | | | |
| Years ended December 31, |
| (dollars in thousands) | 2020 | | 2019 |
| OPERATING REVENUES | | | |
| Products revenues | $ | 1,439,515 | | | $ | 1,609,586 | |
| Services and other revenues | 1,355,199 | | | 445,659 | |
| Net investment income | 245 | | | 736 | |
| Total Operating Revenues | 2,794,959 | | | 2,055,981 | |
| OPERATING EXPENSES | | | |
| Products expenses | 1,256,159 | | | 1,455,245 | |
| Services and other expenses | 1,232,150 | | | 389,385 | |
| Amortization of intangible assets | 52,572 | | | 41,973 | |
| | | |
| Total Operating Expenses | 2,540,881 | | | 1,886,603 | |
| Operating Income | 254,078 | | | 169,378 | |
| Net foreign exchange gains (losses) | (1,092) | | | 384 | |
Interest expense (1) | (46,664) | | | (33,795) | |
| Income Before Income Taxes | 206,322 | | | 135,967 | |
| Income tax expense | (45,815) | | | (35,317) | |
| Net Income | 160,507 | | | 100,650 | |
| Net income attributable to noncontrolling interests | (15,058) | | | (7,749) | |
| Net Income to Shareholders | $ | 145,449 | | | $ | 92,901 | |
| EBITDA | $ | 366,934 | | | $ | 263,944 | |
(1) Interest expense for the years ended December 31, 2020 and 2019 included intercompany interest expense of $32.0 million and $24.9 million, respectively, which was eliminated in consolidation.
Operating revenues from our Markel Ventures segment increased in 2020 due to the contribution of revenues from Lansing, which was acquired in April 2020, and VSC, which was acquired in November 2019. Operating revenues in 2020 attributable to these acquisitions totaled $915.7 million. Excluding the contributions of Lansing and VSC in 2020, operating revenues from our other Markel Ventures businesses decreased in 2020, primarily due to lower sales volumes at our transportation-related and equipment manufacturing businesses duecompared to 2022. The increase also reflected a full-year contribution from Metromont, compared to an 11-month contribution in part to impacts attributable to the economic and social disruption caused by the COVID-19 pandemic.2022 following its acquisition. These decreasesincreases in operating revenues were partially offset by the impact of higher sales volumesdecreased demand at one of our consumer and building products businesses, in 2020 compared to 2019.consulting services businesses and one of our construction services businesses.
OperatingThe increases in operating income and EBITDA fromin 2023 were driven by our Markel Ventures segment increased in 2020 due in part to the acquisitions of Lansing and VSC, as well as higher sales volumes at one ofproducts businesses, particularly our consumer and building products businesses, as previously discussed.which had higher margins in 2023 compared to 2022. In 2022, the operating margins at many of our products businesses were impacted by increased costs of materials, freight and labor, which reflected the impact of broader economic conditions. As conditions stabilized throughout 2023, particularly in regard to materials and freight costs, our operating margins for those businesses improved. The increaseincreases in operating income and EBITDA in 2020 was also due to a loss recognized in 2019 related to the disposition of certain components of oneat many of our equipment manufacturing businesses. These increasesbusinesses were partially offset by the impact of lower revenues and operating revenuesmargins at one of our transportation-relatedconstruction services businesses as previously discussed.
Net income to shareholders from our Markel Ventures segment increased in 2020, primarily due to higher operating income, partially offset by higher interest expense and income tax expense.
See "Developments Related to COVID-19" for further discussion of impacts of the pandemic on our Markel Ventures operations.decreased demand.
Markel Ventures EBITDA is a non-GAAP financial measure. We use Markel Ventures EBITDA as an operating performance measure in conjunction with U.S. GAAP measures, including operating revenues, operating income, and net income to shareholders, to monitor and evaluate the performance of our Markel Ventures segment. Because EBITDA excludes interest, income taxes, depreciation and amortization, it provides an indicator of economic performance that is useful to both management and investors in evaluating our Markel Ventures businesses as it is not affected by levels of debt, interest rates, effective tax rates or levels of depreciation or amortization resulting from purchase accounting.
The following table reconciles Markel Ventures operating income to Markel Ventures EBITDA.
| | | | | | | | | | | |
| Years ended December 31, |
| (dollars in thousands) | 2020 | | 2019 |
| Markel Ventures operating income | $ | 254,078 | | | $ | 168,417 | |
| Depreciation expense | 60,284 | | | 53,554 | |
| Amortization of intangible assets | 52,572 | | | 41,973 | |
| Markel Ventures EBITDA | $ | 366,934 | | | $ | 263,944 | |
| | | | | | | | | | | |
| Years Ended December 31, |
| (dollars in thousands) | 2023 | | 2022 |
| Markel Ventures operating income | $ | 437,508 | | | $ | 325,238 | |
| Depreciation expense | 108,605 | | | 102,055 | |
| Amortization of intangible assets | 82,370 | | | 79,043 | |
| Markel Ventures EBITDA | $ | 628,483 | | | $ | 506,336 | |
The following table summarizestables present condensed financial information reflecting the financial position, results of operations and cash flows attributableof Markel Ventures, Inc., and also summarizing the amounts recognized in the consolidated financial statements included under Item 8 for the Markel Ventures segment, unless otherwise noted.
| | | | | | | | | | | |
| CONDENSED BALANCE SHEETS |
| | | |
| December 31, |
| (dollars in thousands) | 2023 | | 2022 |
| ASSETS | | | |
| Cash and cash equivalents | $ | 398,983 | | | $ | 315,452 | |
| Receivables | 655,875 | | | 636,161 | |
| Goodwill | 1,137,654 | | | 1,153,909 | |
| Intangible assets | 736,717 | | | 796,297 | |
| Other assets: | | | |
| Inventory | 617,250 | | | 639,562 | |
| Property, plant and equipment, net | 1,145,359 | | | 1,028,156 | |
| Right-of-use lease assets | 534,342 | | | 484,527 | |
| Other | 293,362 | | | 261,613 | |
| Total other assets | 2,590,313 | | | 2,413,858 | |
| Total Assets | $ | 5,519,542 | | | $ | 5,315,677 | |
| LIABILITIES AND EQUITY | | | |
Debt (1) | $ | 1,077,034 | | | $ | 1,222,152 | |
| Other liabilities: | | | |
| Accounts payable and accrued liabilities | 372,768 | | | 355,037 | |
| Lease liabilities | 547,099 | | | 489,877 | |
| Other | 622,986 | | | 556,427 | |
| Total other liabilities | 1,542,853 | | | 1,401,341 | |
| Total Liabilities | 2,619,887 | | | 2,623,493 | |
| Redeemable noncontrolling interests | 469,685 | | | 523,154 | |
Shareholders' equity (2) | 2,433,184 | | | 2,172,935 | |
| Noncontrolling interests | (3,214) | | | (3,905) | |
| Total Equity | 2,429,970 | | | 2,169,030 | |
| Total Liabilities and Equity | $ | 5,519,542 | | | $ | 5,315,677 | |
(1) Debt as of December 31, 2023 and 2022 included $738.0 million and $808.1 million, respectively, of debt due to other subsidiaries of Markel Group, which was eliminated in consolidation and is guaranteed by Markel Group.
(2) Shareholders' equity as of both December 31, 2023 and 2022 included $1.4 billion of common stock, which represents Markel Group's investment in Markel Ventures, Inc. and which was eliminated in consolidation.
| | | | | | | | | | | |
| CONDENSED STATEMENTS OF INCOME |
| | | |
| Years ended December 31, |
| (dollars in thousands) | 2023 | | 2022 |
| OPERATING REVENUES | | | |
| Products revenues | $ | 2,545,053 | | | $ | 2,427,096 | |
| Services and other revenues | 2,434,715 | | | 2,329,522 | |
| Net investment income | 5,313 | | | 909 | |
| Total Operating Revenues | 4,985,081 | | | 4,757,527 | |
| OPERATING EXPENSES | | | |
| Products expenses | 2,220,676 | | | 2,241,736 | |
| Services and other expenses | 2,244,527 | | | 2,111,510 | |
| Amortization of intangible assets | 82,370 | | | 79,043 | |
| | | |
| Total Operating Expenses | 4,547,573 | | | 4,432,289 | |
| Operating Income | 437,508 | | | 325,238 | |
Interest expense (1) | (47,227) | | | (46,780) | |
| Net foreign exchange gains (losses) | (6,295) | | | 3,140 | |
| Income Before Income Taxes | 383,986 | | | 281,598 | |
| Income tax expense | (85,295) | | | (61,588) | |
| Net Income | 298,691 | | | 220,010 | |
| Net income attributable to noncontrolling interests | (33,585) | | | (27,409) | |
| Net Income to Shareholders | $ | 265,106 | | | $ | 192,601 | |
(1) Interest expense for the years ended December 31, 20202023 and 2019.2022 included intercompany interest expense of $26.5 million and $27.4 million, respectively, which was eliminated in consolidation.
| | | | | | | | | | | |
| Years ended December 31, |
| (dollars in thousands) | 2020 | | 2019 |
| Cash, cash equivalents, restricted cash and restricted cash equivalents, beginning of year | $ | 256,758 | | | $ | 164,336 | |
| Net cash provided by operating activities | 357,675 | | | 201,514 | |
| Net cash used by investing activities | (607,641) | | | (321,950) | |
Net cash provided by financing activities (1) (2) | 356,542 | | | 213,032 | |
| Effect of foreign currency rate changes on cash, cash equivalents, restricted cash and restricted cash equivalents | 198 | | | (174) | |
| Increase in cash, cash equivalents, restricted cash and restricted cash equivalents | 106,774 | | | 92,422 | |
| Cash, cash equivalents, restricted cash and restricted cash equivalents, end of year | $ | 363,532 | | | $ | 256,758 | |
| | | | | | | | | | | |
| CONDENSED STATEMENTS OF CASH FLOWS |
| | | |
| Years ended December 31, |
| (dollars in thousands) | 2023 | | 2022 |
| Cash, cash equivalents, restricted cash and restricted cash equivalents, beginning of year | $ | 315,452 | | | $ | 321,473 | |
| Net cash provided by operating activities | 568,063 | | | 260,286 | |
| Net cash used by investing activities | (238,242) | | | (302,770) | |
Net cash provided (used) by financing activities (1) | (246,102) | | | 37,897 | |
| Effect of foreign currency rate changes on cash, cash equivalents, restricted cash and restricted cash equivalents | (188) | | | (1,434) | |
| Increase (decrease) in cash, cash equivalents, restricted cash and restricted cash equivalents | 83,531 | | | (6,021) | |
| Cash, cash equivalents, restricted cash and restricted cash equivalents, end of year | $ | 398,983 | | | $ | 315,452 | |
(1) Net cash provided (used) by financing activities for the yearyears ended December 31, 2020 included a capital contribution from our holding company, Markel Corporation, of $535.0 million, which was eliminated in consolidation. There were no capital contributions from our holding company for the year ended December 31, 2019.
(2) Net cash provided by financing activities for the year ended December 31, 20202023 and 2022 included net repayments of intercompany debt of $125.9$70.0 million which were eliminated in consolidation. Net cash provided by financing activities for the year ended December 31, 2019 included net additions to intercompany debt of $252.8and $44.9 million, respectively, which were eliminated in consolidation.
Other Operations
The following table presents the components of operating revenues and operating expenses that are not included in a reportable segment.
| | | | | | | | | | | | | | | | | | | | | | | | | | | | | | | | | | | | | | | |
| Years Ended December 31, |
| 2020 | | 2019 |
| (dollars in thousands) | Services and other revenues | | Services and other expenses | | Amortization of intangible assets | | | | Services and other revenues | | Services and other expenses | | Amortization of intangible assets | | |
| Other operations: | | | | | | | | | | | | | | | |
| Insurance-linked securities | $ | 212,307 | | | $ | 231,473 | | | $ | 38,447 | | | | | $ | 225,604 | | | $ | 217,412 | | | $ | 43,360 | | | |
| Program services | 104,171 | | | 20,427 | | | 20,937 | | | | | 108,813 | | | 19,556 | | | 20,938 | | | |
| Life and annuity | 1,233 | | | 17,713 | | | — | | | | | 1,507 | | | 21,062 | | | — | | | |
| Other | 20,627 | | | 17,896 | | | 5,453 | | | | | 32,580 | | | 28,264 | | | 2,700 | | | |
| 338,338 | | | 287,509 | | | 64,837 | | | | | 368,504 | | | 286,294 | | | 66,998 | | | |
| Underwriting operations | | | | | 41,906 | | | | | | | | | 39,667 | | | |
| Total | $ | 338,338 | | | $ | 287,509 | | | $ | 106,743 | | | | | $ | 368,504 | | | $ | 286,294 | | | $ | 106,665 | | | |
Insurance-Linked Securities
The decrease in operating revenues in our insurance-linked securities operations in 2020 was driven by lower revenues from our Markel CATCo operations, which are in run-off, primarily due to lower assets under management during 2020 compared to 2019 and a further reduction in the management fee rate in 2020. This decrease was partially offset by higher revenues from our Nephila operations. Higher revenues from our Nephila operations in 2020 were due to growth in our managing general agent operations, partially offset by lower investment management fees as a result of lower assets under management.
Nephila's net assets under management were $9.6 billion and $10.4 billion as of December 31, 2020 and 2019, respectively. Markel CATCo's net assets under management were $1.0 billion and $2.8 billion as of December 31, 2020 and 2019, respectively.
The increase in services and other expenses in our insurance-linked securities operations in 2020 was primarily due to an increase in expenses at our Nephila operations due to growth in our managing general agent operations in 2020, partially offset by a favorable impact from acquisition-related costs in 2019 that did not recur in 2020. Services and other expenses at our Markel CATCo operations in 2020 were consistent with 2019 as the expenses associated with a legal settlement in 2020 were offset by lower professional fees and general operating expenses in 2020, as these operations are in run-off. Services and other expenses for both periods also reflect start-up costs associated with our new retrocessional insurance-linked securities fund manager, Lodgepine.
Program Services
The decrease in operating revenues in our program services operations in 2020 compared to 2019 was primarily due to lower gross premium volume. Gross premiums in our program services operations were $2.1 billion and $2.3 billion for the years ended December 31, 2020 and 2019, respectively. The decrease in gross premium volume was driven by the run-off of one large program and the cancellation of an in-force book of policies related to another large program resulting in a one-time unfavorable premium adjustment of $55.0 million associated with the return of unearned premium in 2020. These decreases were partially offset by gross written premiums from new programs added in 2020.
See "Developments Related to COVID-19" for discussion of actual and potential impacts of the pandemic on our insurance-linked securities and program services operations.
Interest Expense, Loss on Early Extinguishment of DebtNet Foreign Exchange Gains (Losses) and Income Taxes
Interest Expense and Loss on Early Extinguishment of Debt
Interest expense was $177.6$185.1 million in 20202023 compared to $171.7$196.1 million in 2019.2022. The changedecrease in interest expense reflectswas attributable to the impact of the following transactions that occurred in 2019:
•the purchase and redemptionretirement of our 6.25% and 5.35%3.625% unsecured senior notes in the thirdMarch 2023 and fourth quarters of 2019,
•the repayment of our 7.125%4.9% unsecured senior notes in the third quarter of 2019 and
•the issuance of our 5.0% unsecured senior notes issued in the second quarter of 2019 and the issuance of our 3.35% and 4.15% unsecured senior notes in the third quarter of 2019.
In September 2019, we purchased a portion of our 6.25% unsecured senior notes and our 5.35% unsecured senior notes. In October 2019, we redeemed the remaining outstanding balance on these notes. In connection with these redemptions, we recognized losses on early extinguishment of debt of $17.6 million during 2019.
July 2022. See note 1214 of the notes to consolidated financial statements included under Item 8 for further details aboutregarding the retirement of our 2019 senior long-term debt transactions.debt.
Net Foreign Exchange Gains (Losses)
Net foreign exchange gains (losses) included in net income (loss) were losses of $90.0 million in 2023 compared to gains of $137.8 million in 2022. Net foreign exchange gains (losses) are primarily due to the remeasurement of our foreign currency denominated insurance reserves to the U.S. Dollar. The U.S. Dollar moderately weakened against the Euro and British Pound, the predominant foreign currencies within our insurance operations, during 2023, while it strengthened against the Euro and British Pound in 2022. Pre-tax net foreign exchange gains and losses attributed to changes in exchange rates on available-for-sale securities supporting our insurance reserves, which are included in the changes in net unrealized gains (losses) on available-for-sale investments in other comprehensive income (loss), were gains of $74.0 million in 2023 compared to losses of $79.5 million in 2022.
Income Taxes
The effective tax rate was 17%21% in 20202023 compared to 21%32% in 2019.2022. The effective tax rate for 20202022 differs from the effective tax rate for 20192023, and the statutory rate of 21% primarily, due to the impact of various immaterial items resulting in a net tax benefit that was recognizedmagnified due to the small pre-tax loss in 2020 for accumulated losses on certain investments we sold that were not previously deductible.2022. See note 1315 of the notes to consolidated financial statements included under Item 8 for further discussion of our income taxes.
The Inflation Reduction Act of 2022 (the IRA), which implemented a 15% corporate minimum tax based on adjusted financial statement income, became effective in 2023. The IRA did not have a material impact on our results of operations, financial conditions or cash flows in 2023, and is not expected to have a material impact on our results of operations, financial condition or cash flows in future periods. However, we will continue to evaluate the impacts of the IRA as additional guidance is issued by the U.S. Treasury.
10K - 49The Organization for Economic Co-operation and Development (OECD) recently introduced rules, commonly referred to as Pillar Two, to establish a 15% global corporate minimum tax on large, multi-national enterprises. Certain countries in which we have operations, including the United Kingdom, have enacted legislation consistent with Pillar Two, which generally became effective on January 1, 2024. Additionally, in response to Pillar Two, in December 2023, Bermuda enacted the Corporate Income Tax Act of 2023 (the Bermuda CIT Act) effective January 1, 2025, which imposes a 15% corporate income tax on certain Bermuda businesses of large, multi-national enterprises. We do not expect Pillar Two or the Bermuda CIT Act to have a material impact on our results of operations, financial condition or cash flows, however, we will continue to evaluate these tax law changes as additional guidance is issued by the OECD and relevant tax authorities.
Comprehensive Income (Loss) to Shareholders and Book Value per Common Share
The following table summarizes the components of comprehensive income (loss) to shareholders.
| | | | | | | | | | | |
| Years Ended December 31, |
| (dollars in thousands) | 2020 | | 2019 |
| Net income to shareholders | $ | 816,030 | | | $ | 1,790,466 | |
| Other comprehensive income | | | |
| Change in net unrealized gains on available-for-sale investments, net of taxes | 352,773 | | | 297,977 | |
| Other, net of taxes | 22,849 | | | 5,424 | |
| Other comprehensive (income) loss attributable to noncontrolling interest | (18) | | | 21 | |
| Other comprehensive income to shareholders | 375,604 | | | 303,422 | |
| Comprehensive income to shareholders | $ | 1,191,634 | | | $ | 2,093,888 | |
| | | | | | | | | | | |
| Years Ended December 31, |
| (dollars in thousands) | 2023 | | 2022 |
| Net income (loss) to shareholders | $ | 1,996,060 | | | $ | (216,277) | |
| Other comprehensive income (loss): | | | |
| Change in net unrealized gains (losses) on available-for-sale investments, net of taxes | 306,903 | | | (1,154,830) | |
| Change in discount rate for life and annuity benefits, net of taxes | (22,343) | | | 149,874 | |
| Other, net of taxes | 4,778 | | | 15,471 | |
| Other comprehensive income attributable to noncontrolling interests | (54) | | | (17) | |
| Other comprehensive income (loss) to shareholders | 289,284 | | | (989,502) | |
| Comprehensive income (loss) to shareholders | $ | 2,285,344 | | | $ | (1,205,779) | |
Book Value per Common Share and Total Shareholder Return
Book value per common share increased 10% for the year ended December 31, 2020 and 23% for the year ended December 31, 2019, primarily due to net income to shareholders, as shown above. Over the past five years, we have grown book value per common share at a compound annual rate of 10% to $885.72 per share17% from $935.65 at December 31, 2020.
Our stock price per share decreased 10% for the year ended2022 to $1,095.95 as of December 31, 2020 and increased 10% for the year ended December 31, 2019. Over the past five years, our stock price per share increased at a compound annual rate of 3%.2023.
Liquidity and Capital Resources
Holding Company
We seek to maintain prudent levels of liquidity and financial leverage for the benefit and protection of our policyholders, creditors and shareholders. Our consolidated debt to capital ratio was 21%20% at December 31, 20202023 and 24% at December 31, 2019.2022, both of which are within the range of our target capital structure. The decrease reflects the retirement of our 3.625% unsecured senior notes due March 30, 2023 and an increase in shareholders'shareholder's equity, primarily attributable to an increase in 2020, primarily due to net income to shareholders as well as proceeds from our preferred shares offering.the fair value of equity securities.
In May 2020, we issued 600,000 6.00% Fixed-Rate Reset Non-Cumulative Series A preferred shares, with no parHolding Company
Our holding company had $3.5 billion and $3.7 billion of investments, cash and cash equivalents and restricted cash and cash equivalents (invested assets) at December 31, 2023 and December 31, 2022, respectively. The decrease was primarily due to repurchases of our common stock and the retirement of our 3.625% unsecured senior notes due March 30, 2023, partially offset by dividends received from insurance subsidiaries and an increase in the fair value and a liquidation preference of $1,000 per share, for aggregate net proceeds after expenses of $591.9 million. Dividends, if declaredequity securities held by our Board of Directors, are payable semi-annually in arrears in December and June. If we do not declare and pay the full dividends for the latest completed dividend period on all outstanding Series A preferred shares, we may not (i) declare or pay a dividend on our common shares or (ii) purchase, redeem or otherwise acquire for consideration any common shares, subject to certain exceptions. In 2020, total dividends declared and paid on Series A preferred shares were $18.4 million.holding company. See note 1723 of the notes to consolidated financial statements included under Item 8 for furthercondensed financial information regardingfor our Series A preferred shares.holding company.
At December 31, 2020,The following table presents the composition of our holding company (Markel Corporation) held $4.1 billion ofcompany's invested assets compared to $4.0 billion at December 31, 2019. The increase in holding company invested assets was primarily due to the proceeds from our preferred shares offering and dividends from our subsidiaries, offset by cash used in connection with the acquisition of Lansing. assets.
| | | | | | | | | | | |
| | December 31, |
| | 2023 | | 2022 |
| Fixed maturity securities | 4 | % | | 4 | % |
| Equity securities | 49 | % | | 40 | % |
| Short-term investments, cash and cash equivalents and restricted cash and cash equivalents | 47 | % | | 56 | % |
| Total | 100 | % | | 100 | % |
| | | |
After satisfying our interest and principal obligations on our senior long-term debt and notes payable to subsidiaries,paying dividends on our preferred stock when declared by our Board of Directors, as well as any other holding company obligations, excess liquiditycapital at Markel CorporationGroup is available to, among other things, to allocate capital to our existing businesses, complete acquisitions, build our portfolio of equity securities or repurchase shares of our common stock.
OurIn November 2023, our Board of Directors has approved a new share repurchase program that replaced the previous share repurchase program. The program provides for the repurchase of up to $300$750 million of common stock under a share repurchase program. As of December 31, 2020, $240.8 million remained available for repurchases under the program. We temporarily suspended repurchases of our common shares in March 2020 in conjunction with other measures we took in response to COVID-19, and in February 2021, we announced that we are recommencing repurchases under the program. This share repurchasestock. The program has no expiration date but may be terminated by the Board of Directors at any time. As of December 31, 2023, $713.0 million remained available for repurchases under the program.
Our underwriting operations collect premiums and pay claims, reinsurance costs and operating expenses. Premiums collectedWe may from time to time seek to prepay, retire or repurchase our underwriting operations are invested primarily in short-term investments and long-term fixed maturity securities. Short-term investments held byoutstanding senior notes or preferred shares, through open market purchases, privately negotiated transactions or otherwise. Those prepayments, retirements or repurchases, if any, will depend on prevailing market conditions, our insurance subsidiaries provide liquidity for projected claims, reinsurance costs and operating expenses. As a holding company, Markel Corporation receives cash from its subsidiaries as reimbursement for operatingrequirements, contractual restrictions and other administrative expenses it incurs. The reimbursements are made within the guidelines of various management agreements between the holding company and its subsidiaries.factors.
The holding company relieshas historically primarily relied on dividends from its insurance subsidiaries to meet debt service obligations and pay dividends on our preferred stock.its obligations. Under the insurance laws of the various states in which our domestic insurance subsidiaries are incorporated, an insurer is restricted in the amount of dividends it may pay without prior approval of regulatory authorities. There are also regulatory restrictions on the amount of dividends that certain of our foreign insurance subsidiaries may pay based on applicable laws in their respective jurisdictions. At December 31, 2020,2023, our domestic insurance subsidiaries and Markel Bermuda Limited could pay ordinary dividends of $1.1$1.2 billion during the following twelve months under these laws.
We maintain aIn June 2023, we entered into an amended and restated credit agreement for our corporate revolving credit facility, which provides up to $300 million of capacity for future acquisitions, investments and stock repurchases, and for other working capital and general corporate purposes. At our discretion, up to $200 million of the total capacity may be used for letters of credit. We may increase the capacity of the facility by up to $200 million subject to obtaining commitments for the increase and satisfying certain other terms and conditions. Markel Group guaranteed the obligations under the facility of the insurance subsidiaries that are also parties to the credit agreement. This facility expires in April 2024. See note 12 of the notes to consolidated financial statements included under Item 8 for further discussion of our revolving credit facility.June 2028. As of December 31, 20202023 and 2019,2022, there were no borrowings outstanding on ourunder this revolving credit facility.
We were in compliance with all covenants contained in our corporate revolving credit facility at December 31, 2020.2023. To the extent that we are not in compliance with our
covenants, our access to the revolving credit facility could be restricted. While we believe this to be unlikely, the inability to access the revolving credit facility could adversely affect our liquidity. See note 14 of the notes to consolidated financial statements included under Item 8 for further discussion of our revolving credit facility.
We have access to various capital sources, including dividends from certain of our insurance and Markel Ventures subsidiaries, holding company invested assets, undrawn capacity under our revolving credit facility and access to the debt and equity capital markets. We believe that we have, sufficientor have access to, adequate liquidity to meet our capital needs.and operating needs, including that which may be required to support the operating needs of our subsidiaries. However, the availability of these sources of capital and the availability and terms of future financings will depend on a variety of factors, and could be adversely affected by, among other things, risks and uncertainties related to COVID-19.factors. See "Developments Related to COVID-19" for further discussion of the potential impacts of COVID-19 on our liquidity and capital resources and the "Access to Capital" risk factors under Item 1A Risk Factors for more discussion regarding our access to capital sources.
Operating Subsidiaries
Insurance
Within our insurance subsidiaries, our primary source of cash inflows is the collection of premiums, and our primary cash outflow is the subsequent payment of claims, reinsurance costs and operating expenses. Premiums collected by our underwriting operations are invested primarily in short-term investments and fixed maturity securities. Short-term investments held by our insurance subsidiaries provide liquidity for payment of projected claims, reinsurance costs and operating expenses. Fixed maturity securities are held by our insurance subsidiaries to support our loss reserves and the eventual payment of claims, and therefore have maturities that generally match the duration of the underlying net loss reserves.
We seek to maintain capital in each of our insurance subsidiaries that exceeds required capital levels, as prescribed by applicable regulators. Capital held at our insurance subsidiaries beyond that which we anticipate will be needed to cover payment of claims and operating expenses is typically invested in equity securities, which over the long run, have produced higher returns relative to fixed maturity securities and short-term investments. At least annually, when capital at an insurance subsidiary exceeds our target levels, it is typically paid to Markel Group in the form of dividends. In certain instances, an insurance subsidiary may require additional capital to meet our target capital levels. In these instances, Markel Group has historically contributed capital to the insurance subsidiary to restore capital to our target levels.
In 2023 and 2022, our insurance subsidiaries paid dividends totaling $310.0 million and $130.0 million, respectively, to Markel Group. Additionally, in 2022, as a result of unfavorable market value movements in the public equity markets, the portion of capital held in equity securities at our insurance subsidiaries declined significantly. Therefore, in order to maintain our target levels of excess capital within the impacted insurance subsidiaries, our holding company made capital contributions totaling $973.5 million in 2022. There were no capital contributions from our holding company to our insurance subsidiaries in 2023.
Markel Ventures
Our Markel Ventures operating subsidiaries include a diverse portfolio of businesses in a variety of industries. The nature of the cash inflows and outflows generated by each of the individual operating businesses varies based on their individual industries and business strategies. In general, these businesses operate using limited long-term debt and rely primarily on revolving lines of credit for their operational financing needs. Markel Ventures, Inc. may also provide loans or make contributions to these operating subsidiaries to fund strategic growth investments and projects. Capital used by Markel Ventures, Inc. to complete acquisitions consists of profits generated by Markel Ventures, as well as capital contributions from Markel Group and loans from our insurance subsidiaries.
Operating cash flows from our Markel Ventures operations was $568.1 million in 2023 and $260.3 million in 2022. After satisfying the obligations on their debt, along with any capital expenditures, operating cash flows from our Markel Ventures subsidiaries are available to be allocated across the Company by Markel Group. Historically, cash flows generated by our Markel Ventures operating subsidiaries have been retained by Markel Ventures, Inc., at Markel Group's direction, to fund growth opportunities within Markel Ventures or repay loans with our insurance subsidiaries, rather than making distributions to Markel Group. In 2023 and 2022, Markel Ventures, Inc. repaid $70.0 million and $44.9 million, respectively, of principle on debt with our insurance subsidiaries. As of December 31, 2023 and 2022, Markel Ventures, Inc.'s outstanding intercompany debt with our insurance subsidiaries was $738.0 million and $808.1 million, respectively, all of which is guaranteed by Markel Group.
As of December 31, 2023 and 2022, redeemable noncontrolling interests attributable to Markel Ventures, Inc. totaled $469.7 million and $523.2 million, respectively, which represents the obligation for Markel Ventures, Inc. to purchase the remaining equity interests in Markel Ventures businesses that are not wholly owned. Of the total balance at December 31, 2023, $82.6 million is available for redemption in 2024, with the remainder becoming redeemable between 2025 and 2030.
Various of our Markel Ventures subsidiaries maintain revolving credit facilities or lines of credit, which provide up to $680 million of aggregate capacity for working capital and other general operational purposes. A portion of the capacity on certain of these credit facilities may be used as security for letters of credit and other obligations. At December 31, 2023 and 2022, $169.5 million and $238.1 million, respectively, of borrowings were outstanding under these credit facilities. At December 31, 2023, all of our Markel Ventures subsidiaries were in compliance with all covenants contained in their respective credit facilities. To the extent our Markel Ventures subsidiaries are not in compliance with their respective covenants, access to their credit facilities could be restricted, which could adversely affect their operations.
Cash Flows and Invested Assets
Net cash provided by operating activities was $1.7$2.8 billion in 20202023 compared to $1.3$2.7 billion in 2019.2022. The increase was primarily due to an increase in netoperating cash flows from Markel Ventures and investments, partially offset by a decrease in operating activities for the year ended December 31, 2020 was primarily driven by higher net premium collections incash flows from our Insurance segment.insurance operations.
Net cash used by investing activities was $511.7 million$2.7 billion in 20202023 compared to $535.2 million$1.7 billion in 2019.2022. In 2020,2023, net cash used by investing activities included $829.5 million of net purchases of short-term investments and $550.8 million of net cash used for the acquisition of Lansing. Net cash used by investing activities in 2020 was net of $1.2 billion of proceeds from sales of equity securities, net of purchases equity securities. See "Investing Results - Invested Assets" for discussion of changes in our allocation of funds within the investment portfolio in 2020 and "Developments Related to COVID-19" for discussion of actions we took in our investment portfolio in response to the pandemic. Net cash used by investing activities in 2019 included $245.3 million of net cash used for acquisitions and $257.7 million of cash used for equity method investments, including $212.5 million of cash used to purchase a minority ownership interest in The Hagerty Group, LLC. Net cash used by investing activities in 2019 was net of $170.3 million of proceeds from maturities and sales of fixed maturity securities and sales of equity securities, net of purchases of fixed maturity securities and equity securities.securities of $2.2 billion and $339.7 million, respectively, and net sales of short-term investments of $202.9 million. In 2022, net cash used by investing activities included net purchases of fixed maturity securities, short-term investments and equity securities of $959.7 million, $846.0 million and $201.0 million, respectively. In 2022, net cash used by investing activities was net of $630.0 million of net cash and restricted cash acquired as part of our consolidation of Markel CATCo Re, of which $169.4 million was subsequently distributed to Markel CATCo investors for shares that were redeemed in conjunction with the buy-out transaction. Cash flow from investing activities is affected by various factors such as anticipated payment of claims, financing activity, acquisition opportunities and individual buy and sell decisions made in the normal course of our investment portfolio management.
In 2023, we continued to increase our allocation of cash and short-term investments to fixed maturity securities in response to higher interest rates and to support our growing underwriting business. Additionally, we increased our purchases of equity securities in 2023.
Invested assets were $24.9$30.9 billion at December 31, 20202023 compared to $22.3$27.4 billion at December 31, 2019. See "Investing Results - Invested Assets" for further discussion2022, reflecting an increase of changes13% in 2023. The increase was primarily attributable to operating cash flows, as well as an increase in the fair value of our equity portfolio. The following table presents the composition of our invested assets during 2020.assets.
| | | | | | | | | | | |
| | December 31, |
| | 2023 | | 2022 |
| Fixed maturity securities | 47 | % | | 43 | % |
| Equity securities | 31 | % | | 28 | % |
| Short-term investments, cash and cash equivalents and restricted cash and cash equivalents | 22 | % | | 29 | % |
| Total | 100 | % | | 100 | % |
| | | |
The change in the composition of the investment portfolio from December 31, 2022 to December 31, 2023 reflects our increased allocation of cash and short-term investments to fixed maturity and equity securities, as well as an increase in the fair value of our equity portfolio.
Net cash providedused by financing activities was $434.6$999.7 million in 2020 compared2023, which included $250.0 million to $359.3 million in 2019. In 2020, we issued preferred shares with net proceeds of $591.9 million, as previously discussed. In 2019, we issuedretire our 3.625% unsecured senior notes with net proceedsdue March 30, 2023. Net cash used by financing activities was $595.3 million in 2022, which included $350.0 million to retire our 4.90% unsecured senior notes due July 1, 2022. Financing activities in 2023 and 2022 also reflected borrowings and repayments at certain our Markel Ventures businesses, primarily on revolving lines of $1.4 billion, before expenses. Wecredit. Cash of $445.5 million and $290.8 million was used $861.9 millionto repurchase shares of these proceeds to repay our 7.125% unsecured seniorcommon stock during 2023 and 2022, respectively.
notesCash Obligations
As of December 31, 2023, our primary contractual cash obligations were unpaid losses and loss adjustment expenses, senior long-term debt and other debt and related interest payments, life and annuity benefits, lease liabilities and purchase obligations. These cash obligations, as well as purchasepresented in the following table, represent our estimate of total future cash payments and redeem two additional seriesmay differ from the corresponding liabilities on our consolidated balance sheet due to present value discounts and other adjustments required for presentation in accordance with U.S. GAAP. The following table summarizes our estimated contractual cash obligations at December 31, 2023 and the estimated amount expected to be paid in 2024.
| | | | | | | | | | | |
| (dollars in thousands) | Total cash obligations as of December 31, 2023 | | Cash obligations due in less than 1 year |
Unpaid losses and loss adjustment expenses (1) | $ | 23,616,295 | | | $ | 4,860,429 | |
Senior long-term debt and other debt (2) | $ | 3,823,709 | | | $ | 76,150 | |
Interest payments on senior long-term debt and other debt (3) | $ | 3,264,553 | | | $ | 171,515 | |
Life and annuity benefits (4) | $ | 900,958 | | | $ | 58,355 | |
Lease liabilities (5) | $ | 809,900 | | | $ | 125,845 | |
Purchase obligations (6) | $ | 388,069 | | | $ | 201,809 | |
(1) The actual cash payments for settled claims will vary, possibly significantly, from these estimates. As of December 31, 2023, the average duration of our unsecured senior notes.reserves for unpaid losses and loss adjustment expenses was 3.8 years. See note 1211 of the notes to consolidated financial statements included under Item 8 for morefurther details regarding the components of senior long-term debt. Cash of $26.8 million and $116.3 million was used to repurchase shares ofon our common stock during 2020 and 2019, respectively.loss reserve estimates.
Contractual Obligations
The following table summarizes our contractual cash payment obligations at December 31, 2020.
| | | | | | | | | | | | | | | | | | | | | | | | | | | | | |
| Payments Due by Period (1) |
| (dollars in thousands) | Total | | Less than 1
year | | 1-3 years | | 4-5 years | | More than
5 years |
| Unpaid losses and loss adjustment expenses (note 9) | $ | 16,279,119 | | | $ | 4,078,054 | | | $ | 5,743,319 | | | $ | 3,083,903 | | | $ | 3,373,843 | |
| Senior long-term debt and other debt (note 12) | 6,583,170 | | | 195,132 | | | 888,878 | | | 262,487 | | | 5,236,673 | |
| Life and annuity benefits (note 11) | 1,233,228 | | | 70,802 | | | 134,840 | | | 124,876 | | | 902,710 | |
| Lease payments (note 7) | 632,045 | | | 90,311 | | | 147,824 | | | 107,875 | | | 286,035 | |
| Total | $ | 24,727,562 | | | $ | 4,434,299 | | | $ | 6,914,861 | | | $ | 3,579,141 | | | $ | 9,799,261 | |
(1)(2)See respectivenote 14 of the notes to consolidated financial statements included under Item 8 for further discussiondetails on the scheduled maturity of these obligations.principal payments on our senior long-term debt and other debt.
Reserves for unpaid losses Interest expense is accrued in the period incurred and loss adjustment expenses representtherefore, only a portion of the future contractual obligations associated with property and casualty insurance and reinsurance contracts issued to our policyholders or other insurance companies. Informationinterest payments presented in thethis table of contractual cash payment obligations is an estimate ofrepresents a liability on our future payment of claimsconsolidated balance sheet as of December 31, 2020. Payment patterns for losses and loss adjustment expenses were generally based upon historical claims settlement patterns. Each claim is settled individually based upon its merits, and certain claims may take years to settle, especially if legal action is involved. The actual cash payments for settled claims will vary, possibly significantly, from the estimates shown in the preceding table. The unpaid losses and loss adjustment expenses in this table are our gross estimates of payments for known liabilities as of December 31, 2020. The expected payments by period are the estimated payments at a future time, whereas the reserves for unpaid losses and loss adjustment expenses included on the consolidated balance sheet include the unamortized portion of any fair value adjustments for unpaid losses and loss adjustment expenses assumed in conjunction with an acquisition and any adjustments to discount reserves.2023.
Senior long-term debt and other debt was $3.5 billion at both December 31, 2020 and December 31, 2019. The amounts in the contractual obligations table include interest expense and exclude net unamortized premium and net unamortized debt issuance costs.
Reserves for life and annuity benefits represent future contractual obligations associated with reinsurance contracts issued to other insurance companies. Information presented in the table of contractual cash payment obligations There is an estimate of our future payment of benefits as of December 31, 2020. The assumptions used in estimating the likely payments due by period are based on cedent experience, industry mortality tables, and our expense experience. Due to the inherent uncertainty in the process of estimating the timing of such payments there is a risk that the amounts paid in any such period can be significantly different from the estimates shown in the preceding table. Thefor life and annuity benefits in the table areand actual cash payments for settled contracts could vary significantly from these estimates. We expect $631.3 million of our gross estimates of known obligations as of December 31, 2020. These obligations are computed on a net present value basis on the consolidated balance sheet as of December 31, 2020, whereas the expected payments by period in the table are the estimated payments at a future timecash obligation for life and do not reflect a discountannuity benefits to be paid beyond five years. See note 13 of the amount payable or any adjustmentsnotes to consolidated financial statements included under Item 8 for further details on our estimates for life and annuity benefit reserves.
(5) See note 9 of the notes to consolidated financial statements included under Item 8 for further details on our lease obligations and the expected timing of future payments.
(6) Purchase obligations are primarily related to open purchase order commitments with subcontractors and suppliers under contracts in our insurance and Markel Ventures operations.
Restricted Assets and Capital
At December 31, 2020,2023, we had $4.7$5.0 billion of invested assets held in trust or on deposit for the benefit of policyholders or ceding companies or to support underwriting activities. Additionally, we have pledged investments and cash and cash equivalents totaling $387.2$450.5 million at December 31, 20202023 as security for letters of credit that have been issued by various banks on our behalf. These invested assets and the related liabilities are included in our consolidated balance sheet. See note 4(f) of the notes to consolidated financial statements included under Item 8 for further discussion of restrictions over our invested assets.
Our insurance operations require capital to support premium writings, and we remain committed to maintaining adequate capital and surplus at each of our insurance subsidiaries. The National Association of Insurance Commissioners (NAIC) developed a model law and risk-based capital formula designed to help regulators identify domestic property and casualty insurers that may be inadequately capitalized. Under the NAIC's requirements, a domestic insurer must maintain total capital
and surplus above a calculated threshold or face varying levels of regulatory action. Capital adequacy of our foreign insurance subsidiaries is regulated by applicable laws of the U.K.,United Kingdom, Bermuda and other jurisdictions, including Germany. At December 31, 2020,2023, the capital and surplus of each of our insurance subsidiaries significantly exceeded the amount of statutory capital and surplus necessary to satisfy regulatory requirements.
Developments Related to COVID-19
On March 11, 2020, COVID-19, a novel coronavirus outbreak, was declared a pandemic by the World Health Organization. This pandemic has caused unprecedented social and economic disruption, increased volatility of capital markets and intervention by various governments and central banks around the world. In addition to the losses incurred in our underwriting operations during 2020, and the decreased demand for certain products and services within our Markel Ventures operations, we are experiencing significant impacts across our business operations. Most of the workforce in our insurance operations is working remotely from their homes. For those employees who are returning to the office, we have taken significant measures and developed new policies and procedures to protect their health and safety. While remote working continues to be the predominate approach, and has been operating effectively, an extended period of remote work arrangements could strain our business continuity plans, introduce or increase operational and control risks, including but not limited to increased cybersecurity risks, and adversely impact our ability to effectively manage our businesses. Within our Markel Ventures operations, most of our businesses are operating on their premises, however, their ability to continue to do so may be impacted as the pandemic continues to evolve. For those employees in our insurance and Markel Ventures operations who are returning to work, or have continued work, on our premises, there is a risk that they will contract COVID-19, which could expose us to increased risk of employment related claims and litigation. Illnesses suffered by key employees, or a significant percentage of our workforce, also could prevent or delay the performance of critical business functions.
We are committed to serving the needs of our employees, customers, business partners and shareholders and continue to focus our efforts on safeguarding our people, supporting our front office and business operations and keeping our employees, customers, business partners and shareholders informed.
Other impacts we have experienced in our operations during the year ended December 31, 2020, as well as steps we are taking to respond to the economic disruption and dislocation caused by the pandemic, are discussed below, along with potential future impacts to our results of operations and financial condition. See "Critical Accounting Estimates - Goodwill and Intangible Assets" for discussion of our consideration of these impacts, among other things, on the valuation of our goodwill and intangible assets.
Liquidity and Capital Resources
We seek to maintain prudent levels of liquidity and financial leverage for the protection of our policyholders, creditors and shareholders. We began the year in a strong liquidity position, holding $4.0 billion of invested assets at our holding company, and at December 31, 2020, our holding company held $4.1 billion of invested assets. Invested assets at the holding company as of December 31, 2020 include net proceeds from our May 2020 issuance of preferred stock totaling $591.9 million, and following two debt issuances in 2019 and the 2019 purchase and redemption of our unsecured senior notes due to mature in 2020 and 2021, we have no unsecured senior notes maturing until July 2022. We also have access to our $300 million revolving credit facility. We continue to maintain a fixed maturity portfolio comprised of high credit quality, investment grade securities with an average rating of "AA."
Significant volatility in the equity markets arising from economic uncertainty following the onset of the COVID-19 pandemic resulted in a significant decline in the fair value of our equity portfolio in the first quarter of 2020. Although this decline was more than offset by subsequent increases in the fair value of our equity portfolio attributable to net favorable market value movements during the rest of the year, future declines in our investment portfolio are possible and could have a material adverse impact on the Company's financial condition, results of operations and liquidity.
Given the dislocation in the financial markets and related uncertainty around the global credit markets resulting from the onset of the pandemic, we took several steps within our investment portfolio to increase our allocation to cash. Initially, we were retaining cash proceeds from maturities of short-term investments and fixed maturity securities and paused our purchases of equity securities. However, as the global markets began to stabilize, we subsequently began reallocating cash to purchase short-term investments and fixed maturity securities and on a more limited basis, equity securities. We also sold certain equity securities based on our views of the underlying fundamentals of these positions and where pricing was deemed appropriate. We also suspended repurchases of our common shares in March 2020, but subsequently recommenced our share repurchase program in February 2021. We continue to focus on expense reductions across our company.
Underwriting losses arising from COVID-19, as well as the 2020 Catastrophes, reduced the capital held by some of our insurance subsidiaries. Capital at our insurance subsidiaries was also impacted by declines in the fair value of equity securities following the onset of the pandemic, which subsequently recovered in the latter part of 2020. Our insurance operations may require additional capital to support premium writings, and we remain committed to maintaining adequate capital and surplus at each of our insurance subsidiaries. As of December 31, 2020, the statutory capital of all of our insurance subsidiaries significantly exceeded required capital, and we believe we are well positioned to continue to pay claims, including those arising from the pandemic, promptly in accordance with the terms of our policies.
We continue to believe we have adequate liquidity to meet our capital and operating needs, including that which may be required to support the operating needs of our subsidiaries.
Underwriting Operations
As previously discussed, our underwriting results for the year ended December 31, 2020 included $343.3 million of net losses and loss adjustment expenses directly attributed to COVID-19 (where COVID-19 was deemed the proximate cause of loss). Due to the inherent uncertainty associated with the assumptions surrounding this pandemic, these estimates are subject to a wide range of variability. While we believe our net reserves for direct losses and loss adjustment expenses for COVID-19 as of December 31, 2020 are adequate based on information currently available, we continue to closely monitor reported claims, government actions, judicial decisions and changes in local and worldwide social disruption arising from the pandemic and will adjust our estimates of gross and net losses as new information becomes available. See "Results of Operations - Underwriting Results" for further discussion on our estimate of direct losses and loss adjustment expenses attributed to COVID-19.
We also have underwriting exposure to loss impacts that are indirectly related to the COVID-19 pandemic and associated with a broader range of coverages, including coverages within our trade credit, professional liability and workers' compensation product lines, among others, as well as certain of our reinsurance product lines. During the year ended December 31, 2020, we recognized $15.0 million of net losses and loss adjustment expenses in our trade credit product line within our Insurance segment related to losses that were indirectly attributable to the pandemic. As the impacts of the pandemic continue to evolve, we expect that further losses indirectly related to the COVID-19 pandemic are likely to emerge. As an example, we provide liability coverage for health and medical institutions and professions, as well as other professions, which have been strained or otherwise impacted by the pandemic. We do not believe any other significant indirect losses have been incurred.
The widespread economic and social disruption caused by COVID-19 has created significant financial hardships for individuals and businesses worldwide. However, we do not believe there has been any material change in our exposure to credit losses.
The significant decline in economic activity during the pandemic may have a material unfavorable impact on our premium volume, due to business closures, reduced recreational activity and lower gross receipts, revenues and payrolls of our insureds, among other things. While premium volume for the year ended December 31, 2020 was impacted by these effects of the pandemic, the impact was not material to our underwriting results. For those policies where the underlying loss exposures have been reduced as a result of decreased economic activity or stay-at-home orders resulting from COVID-19, we also may be required to refund premiums to policyholders, however, there have been no material adjustments required to date.
Within our underwriting operations, we also are reviewing and analyzing the underwriting guidelines and procedures we use to underwrite and reinsure policies that provide coverages related to communicable diseases, viruses, pathogens and other similar risks. Where appropriate, we are taking steps to mitigate our exposure to additional or further losses related to these types of risks, including increasing pricing and adding policy terms and conditions, including exclusions. These actions may reduce premium volume in certain classes of business. With few exceptions, we also stopped writing event cancellation risks, which has reduced our future exposure to losses even if the duration of the pandemic continues to extend. Premium volume attributable to this book of business was not material.
Markel Ventures Operations
Beginning in the second quarter of 2020, the economic and social disruption created by the pandemic impacted the results of operations, financial position and cash flows of our Markel Ventures operations. Revenues across many of our businesses decreased due to changes in consumer behavior and the overall impact of current economic conditions on commercial and consumer spending, all of which impacted demand for certain products and services within our businesses. We also saw orders and contracts canceled or postponed, and as a result of reduced demand, we temporarily reduced capacity at certain of our
operations. While demand for products and services at most of our impacted businesses has begun to recover, since the social and economic disruption caused by the pandemic is ongoing, we expect that revenues from our Markel Ventures operations will continue to be impacted, and these impacts may continue to be material.
In order to partially mitigate the impact of decreased revenues, certain of our businesses took actions to reduce expenses, including, but not limited to, elimination of non-essential expenses, cancellation or deferral of open positions, salary reductions and workforce furloughs and reductions. Our businesses may increase borrowings, if needed, to maintain the cash flow required to operate.
Further loss of revenues in certain of our products and services businesses could also impact the carrying value of inventory, goodwill and intangible assets and other long-lived assets within our Markel Ventures operations, which may become impaired. In certain cases, revenue declines also could result in ongoing cash and working capital constraints and could impact the companies' liquidity and their ability to comply with debt covenants, and, in response, we may take steps necessary to support these operations.
As a result of the economic hardship experienced by our customers, we may modify our payment terms or offer discounts to our customers, and we also are exposed to increased credit risk. However, we do not believe there has been any material change in our exposure to credit losses.
Insurance-Linked Securities and Program Services
Through our insurance-linked securities operations, we receive management fees for investment and insurance management services based on the net asset value of the accounts we manage, and, for certain funds, incentive fees based on the annual performance of the funds managed.
For the year ended December 31, 2020, investment losses attributed to COVID-19 within the investment funds we manage were not significant; however, uncertainty around potential COVID-19 loss exposures within the funds we manage, has reduced, and may further reduce, the net asset value on which our management fees are based. Volatility in the capital markets and investor uncertainty regarding insurance industry exposure to COVID-19 also has impacted, and may continue to impact, our ability to raise additional third party capital for the funds we manage, as well as for new funds. We also have experienced, and may continue to experience, higher than anticipated investor redemptions from our funds. Deferred or reduced investment management fees could have a material impact on our results of operations and financial condition, and the associated decline in cash flows also could impact the carrying value of our goodwill and intangible assets within our ILS operations, which may become impaired. See "Critical Accounting Estimates - Goodwill and Intangible Assets" for further discussion and considerations regarding the valuation of goodwill and intangible assets attributed to our ILS operations as of December 31, 2020.
Our program services business generates fee income, in the form of ceding (program service) fees. This fee income is calculated based on the gross premium volume of the insurance programs we support. Similar to our underwriting operations, the significant decline in economic activity may have an unfavorable impact on premium volume, which may result in a reduction in fee income.
For additional risks to our businesses related to COVID-19, see the risk factor titled "The COVID-19 pandemic has had, and may continue to have, material adverse effects on us" under Item 1A Risk Factors.
Critical Accounting Estimates
Critical accounting estimates are those estimates that both are important to the portrayal of our financial condition and results of operations and require us to exercise significant judgment. The preparation of financial statements in accordance with U.S. GAAP requires us to make estimates and assumptions that affect the reported amounts of assets, liabilities, revenues and expenses and the disclosure of material contingent assets and liabilities. These estimates, by necessity, are based on assumptions about numerous factors. Actual results may differ materially from the estimates and assumptions used in preparing the consolidated financial statements. Our accounts with accounting policies that involve critical accounting estimates are unpaid losses and loss adjustment expenses life and annuity benefits and goodwill and intangible assets.
Unpaid Losses and Loss Adjustment Expenses
Our consolidated balance sheets included estimated unpaid losses and loss adjustment expenses of $16.2$23.5 billion and reinsurance recoverables on unpaid losses of $5.7$8.8 billion at December 31, 20202023 compared to $14.7$20.9 billion and $5.3$8.0 billion, respectively, at December 31, 2019.2022. Included in these balances were unpaid losses and loss adjustment expenses and reinsurance recoverables on unpaid losses attributable to our program services business and other fronting arrangements totaling $3.3$5.2 billion for the year endedas of both December 31, 20202023 and $2.9 billion for the year ended2022. Additionally, consolidated unpaid losses and loss adjustment expenses as of December 31, 2019.2023 and December 31, 2022 included $185.0 million and $347.9 million, respectively, of fully collateralized reserves attributable to Markel CATCo Re, which we consolidate following the Markel CATCo buy-out. See note 17 of the notes to consolidated financial statements for further details regarding the consolidation of Markel CATCo Re. Our consolidated balance sheets do not include reserves for losses and loss adjustment expenses attributed to unconsolidated subsidiaries or affiliates that we manage through our Nephila insurance-linked securities operations, including Markel CATCo Re and the Nephila Reinsurers.operations.
We accrue liabilities for unpaid losses and loss adjustment expenses based upon estimates of the ultimate amounts payable. We maintain reserves for specific claims incurred and reported (case reserves) and reserves for claims incurred but not reported (IBNR reserves).
Reported claims are in various stages of the settlement process, and the corresponding reserves for reported claims are based upon all information available to us. Case reserves consider our estimate of the ultimate cost to settle the claims, including investigation and defense of lawsuits resulting from the claims, and may be subject to adjustment for differences between costs originally estimated and costs subsequently re-estimated or incurred. Claims are settled based upon their merits, and some claims may take years to settle, especially if legal action is involved. As of any balance sheet date, all claims have not yet been reported, and some claims may not be reported for many years. As a result, the liability for unpaid losses and loss adjustment expenses includes significant estimates for incurred but not reported claims.
There is normally a time lag between when a loss event occurs and when it is actually reported to us. The actuarial methods that we use to estimate losses have been designed to address the lag in loss reporting as well as the delay in obtaining information that would allow us to more accurately estimate future payments. There is also often a time lag between cedents establishing case reserves andor re-estimating their reserves and notifying us of thethose new or revised case reserves. As a result, the reporting lag is more pronounced in our reinsurance contracts than in our insurance contracts due to the reliance on ceding companies to report their claims to us.contracts. On reinsurance transactions, the reporting lag will generally be 60 to 90 days after the end of a reporting period but can be longer in some cases. There may also be a more pronounced reporting lag, as well as reliance on third-party claims handling practices and reserve estimates, on insurance contracts for which we are not the primary insurer and participate only in excess layers of loss. Based on the experience of our actuaries and management, we select loss development factors and trending techniques to mitigate the difficulties caused by reporting lags. At least annually, we evaluate and update our loss development factors and trending factor selectionsassumptions using cedent specificour own loss data, as well as cedent-specific and industry data.data, and update them as needed.
U.S. GAAP requires that IBNR reserves be based on the estimated ultimate cost of settling claims, including the effects of inflation and other social and economic factors, using past experience adjusted for current trends and any other factors that would modify past experience. IBNR reserves are generally calculated by subtracting paid losses and loss adjustment expenses and case reserves from estimated ultimate losses and loss adjustment expenses. IBNR reserves were 66%72% of total unpaid losses and loss adjustment expenses at December 31, 20202023 compared to 65%70% at December 31, 2019.2022.
The following table summarizes case reserves and IBNR reserves.reserves for our underwriting, program services and other fronting operations, which excludes $185.0 million and $347.9 million of fully collateralized reserves attributable to Markel CATCo Re as of December 31, 2023 and December 31, 2022, respectively. The amounts in the following table exclude the unamortized portion of any fair value adjustments for unpaid losses and loss adjustment expenses assumed in conjunction with an acquisition and any adjustments to discount reserves.
| | | | | | | | | | | | | | | | | | | | | | | | | | | | | |
| (dollars in thousands) | Insurance | | Reinsurance | | Other underwriting | | Program Services and other | | Consolidated |
| December 31, 2020 | | | | | | | | | |
| Case reserves | $ | 2,917,179 | | | $ | 1,386,976 | | | $ | 51,591 | | | $ | 1,155,540 | | | $ | 5,511,286 | |
| IBNR reserves | 6,311,344 | | | 2,101,169 | | | 224,499 | | | 2,130,821 | | | 10,767,833 | |
| Total | $ | 9,228,523 | | | $ | 3,488,145 | | | $ | 276,090 | | | $ | 3,286,361 | | (1) | $ | 16,279,119 | |
| December 31, 2019 | | | | | | | | | |
| Case reserves | $ | 2,597,273 | | | $ | 1,404,461 | | | $ | 127,639 | | | $ | 1,035,742 | | | $ | 5,165,115 | |
| IBNR reserves | 5,502,167 | | | 2,052,512 | | | 170,424 | | | 1,880,367 | | | 9,605,470 | |
| Total | $ | 8,099,440 | | | $ | 3,456,973 | | | $ | 298,063 | | | $ | 2,916,109 | | (1) | $ | 14,770,585 | |
| | | | | | | | | | | | | | | | | | | | | | | | | | | | | |
| (dollars in thousands) | Insurance segment | | Reinsurance segment | | Other underwriting | | Program services and other fronting | | Total |
| December 31, 2023 | | | | | | | | | |
| Case reserves | $ | 3,666,965 | | | $ | 1,175,883 | | | $ | 59,003 | | | $ | 1,668,765 | | | $ | 6,570,616 | |
| IBNR reserves | 10,551,643 | | | 2,620,699 | | | 106,068 | | | 3,516,788 | | | 16,795,198 | |
| Total | $ | 14,218,608 | | | $ | 3,796,582 | | | $ | 165,071 | | | $ | 5,185,553 | | (1) | $ | 23,365,814 | |
| December 31, 2022 | | | | | | | | | |
| Case reserves | $ | 3,361,400 | | | $ | 1,234,852 | | | $ | 70,072 | | | $ | 1,617,473 | | | $ | 6,283,797 | |
| IBNR reserves | 8,238,051 | | | 2,406,235 | | | 127,531 | | | 3,586,817 | | | 14,358,634 | |
| Total | $ | 11,599,451 | | | $ | 3,641,087 | | | $ | 197,603 | | | $ | 5,204,290 | | (1) | $ | 20,642,431 | |
(1)Substantially all of the premium written in our program services and other fronting business is ceded, resulting in reinsurance recoverables on unpaid losses of $3.3 billion and $2.9$5.2 billion as of both December 31, 20202023 and 2019, respectively.2022.
Each quarter, our actuaries prepare estimates of the ultimate liability for unpaid losses and loss adjustment expenses based on established actuarial methods. Management reviews these estimates, supplements the actuarial analyses with information provided by claims, underwriting and other operational personnel and determines its best estimate of loss reserves, which is recorded in our consolidated financial statements. Our procedures for determining the adequacy of loss reserves at the end of the year are substantially similar to the procedures applied at the end of each interim period.
Any adjustments to reserves resulting from our interim or year-end reviews, including changes in estimates, are recorded as a component of losses and loss adjustment expenses in the period of the change. Reserve changes that increase previous estimates of ultimate claims cost are referred to as unfavorable or adverse development, or reserve strengthening. Reserve changes that decrease previous estimates of ultimate claims cost are referred to as favorable development.
Program Services and Other Fronting
For our program services business and other fronting arrangements, case reserves are generally established based on reports received from the general agents or reinsurers with whom we do business. Our actuaries review the case loss reserve data received for sufficiency, consistency with historical data and for consistency with other programs we write that have similar characteristics. IBNR reservesUltimate losses and loss adjustment expenses are calculated using either our program experience or, where the program data is not credible, industry experience for similar products or lines of business. Substantially all of the premium written in our program services business and other fronting arrangements is ceded, and net reserves for unpaid losses and loss adjustment expenses as of December 31, 20202023 and December 31, 20192022 were $8.3$10.1 million and $2.2$10.0 million, respectively.
Underwriting
For our insurance operations, we are generally notified of insured losses by our insureds, their brokers or their brokers.the primary insurer in instances in which we participate in excess layers of insured losses on a contract. Based on this information, we establish case reserves by estimating the expected ultimate losses from the claim, (includingincluding any administrative or legal costs associated with settling the claim).claim. Our claims personnel use their knowledge of the policy provisions and details specific to the claim, along with information provided by internal and external experts, including underwriters, actuaries and legal counsel, to estimate the expected ultimate losses.
For our reinsurance operations, case reserves are generally established based on reports received from ceding companies or their brokers. For excess of loss contracts, we are typically notified of insurance losses on specific contracts and record a case reserve for the estimated expected ultimate losses from the claim. For quota share contracts, we typically receive aggregated claims information and record a case reserve based on that information. As with insurance business, we evaluate this information and estimate the expected ultimate losses.
Our liabilities for unpaid losses and loss adjustment expenses can generally be categorized into two distinct groups, short-tail business and long-tail business. Short-tail business refers to lines of business, such as property, accident and health, automobile, watercraft and marine hull exposures, for which losses are usually known and paid shortly after the loss actually occurs. Long-tail business describesrefers to lines of business for which specific losses take much longer to emerge and may not be known and reported for some period and losses take much longer to emerge.time. Given the time frame over which long-tail exposures are ultimately settled, there is greater uncertainty and volatility in these lines than in short-tail lines of business. Our long-tail coverages consist of most casualty lines, including professional liability, directors' and officers' liability, products liability, general and excess liability and excess and umbrella exposures, as well as workers' compensation insurance.insurance, many of which have been a significant source of growth in premium volume in recent years. Some factors that contribute to the uncertainty and volatility of long-tail casualty programs,business, and thus require a significant degree of judgment in the reserving process, include the effects of unanticipated levels of economic inflation, the impact of social inflation, the inherent uncertainty as to the length of reporting and payment development patterns, the possibility of judicial interpretations or legislative changes, including changes in workers' compensation benefit laws, that might impact future loss experience relative to prior loss experience and the potential lack of comparability of the underlying data used in performing loss reserve analyses.
Our ultimate liability may be greater or less than current reserves. Changes in our estimated ultimate liability for loss reserves generally occur as a result of the emergence of unanticipated loss activity, the completion of specific actuarial or claims studies or changes in internal or external factors. We closely monitor new information on reported claims and use statistical analyses prepared by our actuaries to evaluate the adequacy of our recorded reserves. We are required to exercise considerable judgment when assessing the relative credibility of loss development trends. Our philosophy is to establish loss reserves that are more likely redundant than deficient. This means that we seek to establish loss reserves that will ultimately prove to be adequate. As a result, if new information or trends indicate an increase in frequency or severity of claims in excess of what we initially anticipated, we generally respond quickly and increase loss reserves. If, however, frequency or severity trends are more favorable than initially anticipated, we often wait to reduce our loss reserves until we can evaluate experience in additional periods to confirm the credibility of the trend. In addition, for long-tail lines of business, trends develop over longer
periods of time, and as a result, we give credibility to these trends more slowly than for short-tail or less volatile lines of business. As part of our acquisition of underwriting operations, to the extent the reserving philosophy of the acquired business is less conservative than our reserving philosophy, the post-acquisition loss reserves will be strengthened until total loss reserves are consistent with our target level of confidence.
Actuarial Methods and Analysis
In establishing our liabilities for unpaid losses and loss adjustment expenses, our actuaries estimate an ultimate loss ratio, by accident year or policyunderwriting year, for each of our product lines with input from our underwriting and claims personnel. For product lines in which loss reserves are established on a policyunderwriting year basis, we have developed a methodology to convert from policyunderwriting year to accident year for financial reporting purposes. In estimating an ultimate loss ratio for a particular line of business, our actuaries may use one or more actuarial reserving methods and select from these a single point estimate. To varying degrees, these methods include detailed statistical analysis of past claim reporting, settlement activity, claim frequency and severity, policyholder loss experience, industry loss experience and changes in market and economic conditions, policy forms and exposures. The actuarial methods we use include:
Initial Expected Loss Ratio Method – This method multiplies earned premiums by an expected loss ratio. The expected loss ratio is selected utilizing industry data, our historical data, frequency-severity and rate level forecasts and professional judgment.
Paid Loss Development – This method uses historical loss payment patterns to estimate future loss payment patterns. Our actuaries use the historical loss patterns to develop factors that are applied to current paid loss amounts to calculate expected ultimate losses.
Incurred Loss Development – This method uses historical loss reporting patterns to estimate future loss reporting patterns. Our actuaries use the historical loss patterns to develop factors that are applied to current reported losses to calculate expected ultimate losses.
Bornhuetter-Ferguson Paid Loss Development – This method divides the projection of ultimate losses into the portion that has already been paid and the portion that has yet to be paid. The portion that has yet to be paid is estimated as the product of three amounts: the premium earned for the exposure period, the expected loss ratio and the estimated percentage of ultimate losses that are still unpaid. The expected loss ratio is selected by considering historical loss ratios, adjusted for any known changes in pricing, loss trends, adequacy of case reserves, changes in administrative practices and other relevant factors.
Bornhuetter-Ferguson Incurred Loss Development – This method is identical to the Bornhuetter-Ferguson paid loss development method, except that it uses the estimated percentage of ultimate losses that are still unreported, instead of the estimated percentage of ultimate losses that are still unpaid.
Frequency/Severity – Under this method, expected ultimate losses are equal to the product of the expected ultimate number of claims and the expected ultimate average cost per claim. Our actuaries use historical reporting patterns and severity patterns to develop factors that are applied to the current reported amounts to calculate expected ultimate losses.
Outstanding to IBNR Ratio Method Other Methods– Under this method, IBNR is based on a detailed review of remaining open claims. This method assumes that the estimated future loss development is indicated by the current level of case reserves.
Other Methods – We cannot estimate losses from widespread catastrophic events, such as hurricanes and earthquakes, as well as pandemics, using theThere are certain instances when traditional actuarial methods previously described. In the initial months after a catastrophic event occurs, our actuaries estimate losses and loss adjustment expenses based on claims received to date, detailed policy and reinsurance contract level reviews, industry loss estimates and output from both industry and proprietary models, as well as analysis of our ceded reinsurance contracts. The availability of data from these procedures varies depending on the timing of the event relative to the point at which we develop our estimate. We also consider loss experience on historical events that may have similar characteristics to the underlying event. Due to the inherent uncertainty innot be appropriate for estimating such losses, these estimates are subject to variability, which increases with the severity and complexity of the underlying event. As additional claims are reported and paid, and industry loss estimates are revised, we incorporate this new information into our analysis and adjust our estimate of ultimateunpaid losses and loss adjustment expenses. In these instances, we may employ other actuarial methods.
Each actuarial method has its own set of assumptions and its own strengths and limitations, with no one method being better than the others in all situations. Our actuaries select the reserving methods that they believe will produce the most reliable estimates for the class of businessbusiness being evaluated. Greater judgment may be required when we introduce new product lines or when there have been changes in claims handling practices, as the statistical data available may be insufficient. In these
instances, we may rely upon assumptions applied to similar lines of business, rely more heavily on industry experience, take into account changes in underwriting guidelines and risk selection or review the impact of changes in claims reserving practices with claims personnel. Greater judgment also may be required for product lines that experience a low frequency of high severity claims, particularly when we are reliant on third party case reserve estimates and claims handling practices. In these instances, we may perform detailed claims reviews, analyzing the characteristics of each individual claim, with input from both actuarial and claims personnel to assess the adequacy of the case and IBNR reserves on the underlying product line. Our claims personnel use their knowledge of the specific claims along with internal and external experts, to estimate the expected ultimate losses. While we use our best judgment in establishing our estimate for loss reserves, applying different assumptions and variables could lead to significantly different loss reserve estimates.
A key assumption in most actuarial analyses is that past development patterns will repeat themselves in the future, absent a significant change in internal or external factors that influence the ultimate cost of our unpaid losses and loss adjustment expenses. Our estimates reflect implicit and explicit assumptions regarding the potential effects of external factors, including economic and social inflation, judicial decisions, changes in law, general economic conditions and recent trends in these factors. Our actuarial analyses are based on statistical analysis but also consist of reviewing internal factors that are difficult to analyze statistically, including changes in underwriting and claims handling practices, as well as rate changes. In some of our markets,the London market, and where we act as a reinsurer or participate only in excess layers of insured losses, the timing and amount of information reported about underlying claims are in the control of third parties. This can also affect estimates and require re-estimation as new information becomes available.
We cannot estimate losses from widespread catastrophic events, such as hurricanes and earthquakes, as well as pandemics and wars, using the traditional actuarial methods previously described. In the initial months after a catastrophic event occurs, our actuaries estimate losses and loss adjustment expenses based on claims received to date, industry loss estimates and output from industry, broker and proprietary models, as well as analysis of our ceded reinsurance contracts. We may also perform detailed policy and reinsurance contract level reviews. The availability of data from these procedures varies depending on the timing of the event relative to the point at which we develop our estimate. We also consider loss experience on historical events that may have similar characteristics to the underlying event and current market conditions, including the level of economic inflation. In the period shortly after an event occurs, more weight is put on modeling and industry estimates, whereas with the passage of time, greater reliance is placed on incurred claims data and historical claim patterns. Due to the inherent uncertainty in estimating such losses, these estimates are subject to variability, which increases with the severity and complexity of the underlying event. As additional claims are reported and paid, and industry loss estimates are revised, we incorporate this new information into our analysis and adjust our estimate of ultimate losses and loss adjustment expenses as appropriate.
Management's Best Estimate
Loss reserves are established at management's best estimate, which is generally higher thandeveloped using the corresponding actuarially calculated point estimate due to subjective factors where management's perspective may differ from that ofas the actuaries.starting point. The actuarial point estimate represents our actuaries' estimate of the most likely amount that will ultimately be paid to settle the losses that have occurred at a particular point in time; however, there is inherent uncertainty in the point estimate as it is the expected value in a range of possible reserve estimates. Similarly, the point estimate for ceded losses is calculated based on the ultimate gross loss amount expected to be paid, as well as the frequency and severity of the underlying claims, which ultimately determines coverage under the applicable ceded reinsurance contracts. Therefore, ceded loss estimates are subject to many of the same judgments and assumptions as the gross loss estimates. In some cases, actuarial
analyses, which are generally based on statistical analysis, cannot fully incorporate all of the subjective factors that affect development of losses. In other cases, management's perspective of these more subjective factors may differ from the actuarial perspective. Subjective factors whereinfluencing the development of management's perspective may differ from that of the actuariesbest estimate include: the credibility and timeliness of claims and loss information received from cedents and other third parties,parties; and the impacts of economic and social inflation, judicial decisions, changes in law, changes in underwriting or claims handling practices, general economic conditions, the risk of moral hazard and other current and developing trends within the insurance and reinsurance markets, including the effects of competition. As a result,For example, our loss experience in recent years has reflected higher than anticipated levels of economic inflation, as well as the actuarially calculated point estimates for eachimpacts of our linessocial inflation, including the rising cost to adjust and settle claims and the impact of business represent starting points for management's quarterly reviewmore pervasive litigation financing trends.
In developing its best estimate of loss reserves.reserves, management's philosophy is to establish loss reserves that are more likely to be redundant rather than deficient, and therefore, will ultimately prove to be adequate. Management's approach to establishing loss reserves typically results in loss reserves that exceed the calculated actuarial point estimate. Management also considers the range, or variability, of reasonably possible lossesloss outcomes determined by our actuaries when establishing its best estimate for loss reserves. The actuarial ranges represent our actuaries' estimate of a likely lowest amount and likely highest amount that willcould ultimately be paid to settle the losses that have occurred at a particular point in time. The range determinations are based on estimates and actuarial judgements and are intended to encompass reasonably likely changes in one or more of the factors that were used to determine the point estimates. Using statistical models, our actuaries establish high and low ends of a range of reasonable reserve estimates for each of our underwriting segments. Additionally, following an acquisition of insurance operations, to the extent the reserving philosophy of the acquired business is less conservative thanreserves initially are recorded at fair value, and therefore our reserving philosophy, the percentage by which management's best estimate exceedsrecorded loss reserves may be closer to the actuarial point estimate will generally be lower until we build total loss reserves that are consistent with our historic level of confidence. Management's best estimate of net reserves for unpaid losses and loss adjustment expenses exceeded the actuarially calculated point estimate by $587.4$683.4 million, or 5.9%5.0%, at December 31, 2020,2023, compared to $577.5$688.4 million, or 6.5%5.8%, at December 31, 2019.2022.
The difference between management's best estimate and the actuarially calculated point estimate in both 20202023 and 20192022 is primarily associated with our long-tail business due to thethe subjective factors previously described that affect the development of losses and represent instances where management's perspectives may differlosses. The decrease in 2023 resulted from thosesignificant strengthening of reserves following increases in our actuaries. Management has attributed less credibility than our actuaries to favorable trends experienced on our long-tail business and has not incorporated these favorable trends into itsactuaries' best estimate of ultimate losses toon certain general liability and professional liability product lines, which management believes already considers the same extentsubjective factors that may impact the development of underlying losses on the impacted product lines. Certain subjective factors, particularly the credibility and timeliness of claims information, are more pronounced within our reinsurance operations, as previously discussed, and therefore, the actuaries.percentage difference between management's best estimate and the actuarially calculated point estimate is more significant in our Reinsurance segment than our Insurance segment.
Changes in Estimates
Loss frequency and loss severity are two key measures of loss activity that often result in adjustments to actuarial assumptions relative to ultimate loss reserve estimates. Loss frequency measures the number of claims per unit of insured exposure. When the number of newly reported claims is higher than anticipated, generally speaking, loss reserves are generally increased. Conversely, loss reserves are generally decreased when fewer claims are reported than expected. Loss severity measures the average size of a claim. When the average severity of reported claims is higher than originally estimated, loss reserves are typically increased. When the average claim size is lower than anticipated, loss reserves are typically decreased.
Our underwriting results in 20202023 included $606.4$38.6 million of net favorable development on prior years'years loss reserves compared to $535.3$167.4 million in 2019. In connection with2022. Favorable development on prior years loss reserves in 2023 and 2022 reflected significant favorable loss experience across several product lines, largely offset by adverse development on certain long-tail general liability and professional liability product lines following the emergence of multiple factors that impacted the claims and loss trends on those lines.
Favorable development in 2023 was most notable on our quarterly reviews ofproperty, international professional liability, marine and energy and workers' compensation product lines. Favorable development in 2022 was most significant on our property and workers' compensation product lines. Favorable development on our property product lines in 2023 and 2022 was driven by lower loss severity than previously anticipated, as well as net favorable development on our reserves for natural catastrophes that occurred in prior years. On our workers' compensation product line, the actuarial methods we used have exhibitedindicated a favorablecontinued decline in the loss severity trend predominately for the 2016 to 2019on prior accident years during 2020. This trend was observed using statistical analysis of actualin 2023 and 2022, consistent with our experience in recent years. Within our international operations, our professional liability and marine and energy product lines experienced lower loss experience for those years, particularly with regard to most of our long-tail books of business within the Insurance segment, which developed more favorablyseverity than we hadinitially expected. Additionally, as loss reserves are recorded at management's best estimate, which is generally higher than the corresponding actuarially calculated point estimate, the initial reserves established by management are more likely to be redundant than deficient. As actual losses continueon these product lines continued to be
lower than anticipated in 2023 and 2022, it has becomebecame more likely that the underwriting results willwould prove to be better than originally estimated. Additionally, as most actuarial methods rely upon historical reporting patterns, the favorable trends experienced on earlier accident years have resulted in a re-estimation of our ultimate incurred losses on more recent accident years. When we experience loss frequency or loss severity trends that are more favorable than we initially anticipated, we often evaluate the loss experience over a period of several years in order to assess the relative credibility of loss development trends. In both 2020 and 2019, based upon our evaluations of claims development patterns in our long-tail, and often volatile, lines of business, our actuaries reduced their estimates of ultimate losses. Management also gave greater credibility to the favorable trends experienced on earlier accident years and upon incorporating these favorable trends
into its best estimate, we reduced prior years'years loss reserves on more recent accident years accordingly. While we believe it is possiblelikely that there will be additional favorable development on prior years'years loss reserves in 2021,2024, we caution readers not to place undue reliance on this favorable trend.
The favorable development in 2023 and 2022 was largely offset by adverse development on certain long-tail general liability and professional liability product lines. Beginning in the latter half of 2022, select lines within our U.S. and Bermuda general liability and professional liability portfolio were impacted by consecutive quarters of unfavorable loss cost trends and increased claim frequency and severity, resulting in adverse development on these lines in both 2023 and 2022.
Net favorable development in 2022 was net of $128.5 million of adverse development on our U.S. and Bermuda professional liability and general liability product lines within our Insurance segment, which was primarily attributable to unfavorable claim settlements and increased claim frequency and severity on the 2016 to 2019 accident years. The adverse development was across a number of products, including directors and officers, errors and omissions and employment practices liability within professional liability and contractors and excess and umbrella within general liability. Development on prior years loss reserves within our U.S. and Bermuda professional liability and general liability product lines in 2022 was impacted by broader market conditions. The impact of economic and social inflation, including the rising cost to adjust and settle claims and the impact of more pervasive litigation financing trends, has contributed to the loss cost trends, leading to higher than anticipated losses in older accident years for these products lines. The impacts of social inflation were most significant on our large, risk-managed excess professional liability accounts, corresponding with a notable rise in the number of class action lawsuits on these years and the recent unfavorable legal environment. The development of this claims trend was influenced by state and federal court closures following the onset of the COVID-19 pandemic in 2020, which delayed court proceedings for claims on the impacted product lines.
In 2023, we continued to see an increased frequency of large claims and unfavorable loss cost trends on certain of our U.S. and Bermuda general liability and professional liability product lines. In response to consecutive quarters of adverse loss development, in the fourth quarter of 2023, we conducted an extensive reserve study on selected general liability and professional liability product lines, which resulted in further increases to our prior accident year loss reserves. Adverse development in 2023 on our U.S. and Bermuda general liability and professional liability product lines within our Insurance segment totaled $330.7 million. This adverse development was most substantial on our primary casualty contractors' liability and excess and umbrella general liability product lines.
A significant portion of our casualty portfolio is associated with construction business, which has grown meaningfully in recent years. Our study determined that the ultimate claim reporting tail on certain of our casualty construction lines is likely to be longer than we initially anticipated. Within our excess and umbrella general liability and risk-managed errors and omissions professional liability books, we determined that there was a greater than expected propensity for limits below our attachment point to erode, pushing more claims into our layers. Further, reporting of these claims has lagged historical loss development patterns due to the effect of court closures and claims backlogs arising from the COVID-19 pandemic, in addition to aggressive tactics by the plaintiffs' bar and delayed claims reporting trends. Although we have achieved significant rate increases since 2019 on many of these lines in response to heightened loss trends, the findings of our study led us to increase our loss development factors, and therefore our estimate of the ultimate loss ratios, on our primary casualty contractors' liability, excess and umbrella general liability and risk-managed errors and omissions professional liability product lines. This resulted in significant strengthening of reserves on the impacted lines, including on the 2020 to 2022 accident years, where we determined that the incurred loss trends are following a similar loss development trend at the same stage as older accident years.
Additionally, we experienced $149.2 million of adverse development on our general liability and public entity product lines within our Reinsurance segment. Adverse development on our general liability product lines was primarily attributable to large reported claims and adverse loss development trends across multiple accident years. Substantially all of the adverse development on our public entity product line was attributable to a segment of this business that we discontinued writing in 2020, which experienced an increased frequency of large claims over the past several quarters, most significantly on the 2014 to 2019 accident years. Adverse development on both our general liability and public entity product lines included notable strengthening as a result of actions taken in the fourth quarter in response to changes in loss trends observed in the reserve study and the expectation that those loss trends will ultimately emerge within comparable reinsurance product lines.
The loss trends observed over the past two years have created more uncertainty around the ultimate losses that will be incurred to settle claims on these longer-tail product lines. Consistent with our reserving philosophy, we are responding quickly to increase loss reserves following any indication of increased claims frequency or severity in excess of our previous expectations, whereas in instances where claims trends are more favorable than we previously anticipated, we are often
waiting to reduce loss reserves and will evaluate our experience over additional periods of time. For those lines in which we strengthened reserves, although we believe the gross and net reserves are adequate based on information available at this time, we continue to closely monitor reported claims, claim settlements, ceded reinsurance contract attachments and judicial decisions, among other things, and may adjust our estimates as new information becomes available.
Changes in prior years'years loss reserves, including the trends and factors that impacted loss reserve development in 20202023 and 20192022, as well as further details regarding the historical development of reserves for losses and loss adjustment expenses and changes in methodologies and assumptions used to calculate reserves for unpaid losses and loss adjustment expenseexpenses are discussed in further detail in note 911 of the notes to consolidated financial statements included under Item 8.
Actuarial Ranges
The following table summarizes our reserves for net unpaid losses and loss adjustment expenses and the actuarially established high and low ends of a range of reasonable reserve estimates at December 31, 2020.2023. This table excludes the fully collateralized reserves attributable to Markel CATCo Re. As described in note 911 of the notes to consolidated financial statements included under Item 8, unpaid losses and loss adjustment expenses attributable to acquisitions are recorded at fair value as of the acquisition date, which generally consists of the present value of the expected net loss and loss adjustment expense payments plus a risk premium. The net loss reserves presented in this table represent our estimated future payments for losses and loss adjustment expenses, whereas the reserves for unpaid losses and loss adjustment expenses included on the consolidated balance sheet include the unamortized portion of fair value adjustments recorded in conjunction with an acquisition.
| | | | | | | | | | | | | | | | | |
| (dollars in millions) | Net Loss
Reserves Held | | Low End of Actuarial Range(1) | | High End of Actuarial Range(1) |
| Insurance | $ | 7,211.4 | | | $ | 6,314.9 | | | $ | 7,849.0 | |
| Reinsurance | 3,104.8 | | | 2,421.8 | | | 3,556.5 | |
| Other underwriting | 146.5 | | | 105.6 | | | 185.5 | |
| | | | | | | | | | | | | | | | | |
| (dollars in millions) | Net Loss
Reserves Held | | Low End of Actuarial Range(1) | | High End of Actuarial Range(1) |
| Insurance | $ | 11,048.5 | | | $ | 8,940.1 | | | $ | 11,929.5 | |
| Reinsurance | $ | 3,339.5 | | | $ | 2,732.9 | | | $ | 3,795.0 | |
| Other underwriting | $ | 89.8 | | | $ | 62.1 | | | $ | 109.6 | |
(1)Due to the actuarial methods used to determine the separate ranges for each component of our business, it is not appropriate to aggregate the high or low ends of the separate ranges to determine the high and low ends of the actuarial range on a consolidated basis.
Undue reliance should not be placed on these ranges of estimates as they are only one of many points of reference used by management to determine its best estimate of ultimate losses. Further, actuarial ranges may not be a true reflection of the potential variability between loss reserves estimated at the balance sheet date and the ultimate cost of settling claims. ActuarialSimilar to the development of our estimate of ultimate losses, actuarial ranges are developed based on known events as of the valuation date, while ultimate paid losses are subject to events and circumstances that are unknown as of the valuation date.
OverDuring the past two years ended December 31, 2023 and 2022, we have experienced favorable development on prior years'years loss reserves of 6%0.3% and 1.5%, respectively, of beginning of year net loss reserves. The magnitude of our historical trend of favorable loss reserve development, which ranged from 4.6% to 6.4% of beginning of year net loss reserves over the preceding five years, was disrupted in 2022 and 2023 as a result of the emergence of multiple factors that impacted the claims and loss trends on certain of our general liability and professional liability product lines, which resulted in net adverse loss development within the select product lines previously discussed. The impacts of economic and social inflation, among other factors previously discussed, have also created more uncertainty around the ultimate losses that will be incurred to settle claims on our longer-tail product lines. As a result, in instances where claims trends are more favorable than we previously anticipated we are approaching reductions to prior year loss reserves years cautiously. It is difficult for management to predict the duration and magnitude of an existinga trend and, on a relative basis, it is even more difficult to predict the emergence of factors or trends that are unknown today but may have a material impact on loss reserve development. In assessing the likelihood of whether the favorable trends previously discussed will continue and whether other trends may develop, we believe that a reasonably likely movement in prior years'years loss reserves during 20212024 would range from favorableadverse development of less than 1%, or $100$150 million, to favorable development of approximately 6%5%, or $650$700 million, of December 31, 20202023 net loss reserves. See "Developments Related to COVID-19" for further discussion of factors related to the pandemic that could impact our net loss reserve estimates.
Life and Annuity Benefits
We have a run-off block of life and annuity reinsurance contracts which subject us to mortality, longevity and morbidity risks. The related reserves are compiled by our actuaries on a reinsurance contract-by-contract basis and are computed on a discounted basis using standard actuarial techniques and cash flow models. Since the development of our life and annuity reinsurance reserves is based upon cash flow projection models, we must make estimates and assumptions based on cedent experience, industry mortality tables, and expense and investment experience, including a provision for adverse deviation. The assumptions used to determine policy benefit reserves are generally locked-in for the life of the contract unless an unlocking
event occurs. We review the adequacy of reserves for life and annuity reinsurance benefits quarterly. To the extent existing policy reserves, together with the present value of future gross premiums and expected investment income earned thereon, are not adequate to cover the present value of future benefits, settlement and maintenance costs, the locked-in assumptions are revised to current best estimate assumptions and a charge to earnings for life and annuity benefits is recognized at that time. Life and annuity benefits are also adjusted to the extent unrealized gains on the investments supporting the policy benefit reserves would result in a reserve deficiency if those gains were realized.
Our consolidated balance sheets included reserves for life and annuity benefits of $1.1 billion and $1.0 billion at December 31, 2020 and 2019, respectively. During 2020 and 2019, we increased our reserves for life and annuity benefits by $68.2 million and $51.4 million, respectively, as a result of decreases in the market yield on the investment portfolio supporting the policy benefit reserves, and decreased the change in net unrealized holding gains included in other comprehensive income by corresponding amounts. As of December 31, 2020 and December 31, 2019, the cumulative adjustment to life and annuity benefits attributable to unrealized gains on the underlying investment portfolio totaled $119.6 million and $51.4 million, respectively.
Because of the assumptions and estimates used in establishing reserves for life and annuity benefit obligations and the long-term nature of these reinsurance contracts, the ultimate liability may be greater or less than the estimates. The average discount rate for the life and annuity benefit reserves was 2.3% as of December 31, 2020. The accretion of this discount is recognized in the statement of income and comprehensive income within services and other expenses. Invested assets and the related investment income that support the life and annuity reinsurance contracts are reported in the Investing segment. We expect the results from our life and annuity business will continue to reflect losses in future periods due to the accretion of the discount on the life and annuity benefit reserves, which are forecast to pay out over the next 40 to 50 years. Services and other revenues attributable to the life and annuity business represent ongoing premium adjustments on existing contracts.
Goodwill and Intangible Assets
Our consolidated balance sheet as of December 31, 20202023 included goodwill and intangible assets of $4.4$4.2 billion as follows:
| | | | December 31, 2020 | | December 31, 2023 |
| (dollars in millions) | (dollars in millions) | Underwriting | | Markel Ventures | | Other (1) | | Total | (dollars in millions) | Underwriting | | Markel Ventures | | Other (1) | | Total |
| Goodwill | Goodwill | $ | 895.5 | | | $ | 901.0 | | | $ | 808.1 | | | $ | 2,604.6 | |
| Intangible assets | Intangible assets | 442.6 | | | 623.1 | | | 717.0 | | | 1,782.7 | |
| Total | Total | $ | 1,338.1 | | | $ | 1,524.1 | | | $ | 1,525.1 | | | $ | 4,387.3 | |
(1)Amounts included in Other reflect our operations that are not included in a reportable segment, including our insurance-linked securities operationsprogram services and our program servicesinsurance-linked securities operations.
Goodwill and intangible assets are recorded as a result of business acquisitions. Goodwill represents the excess of the amount paid to acquire a business over the net fair value of assets acquired and liabilities assumed at the date of acquisition. Indefinite-lived and other intangible assets are recorded at fair value as of the acquisition date. The determination of the fair value of certain assets acquired, including goodwill and intangible assets, and liabilities assumed involves significant judgment and the use of valuation models and other estimates, which require assumptions that are inherently subjective. DuringWe did not make any significant acquisitions during the years ended December 31, 2020 and 2019, we recorded $497.1 million and $232.0 million, respectively, of goodwill and intangible assets in connection with acquisitions.2023 or 2022.
Intangible assets with definite lives are reviewed for impairment when events or circumstances indicate that their carrying value may not be recoverable. Goodwill and indefinite-lived intangible assets are tested for impairment annually, or when events or circumstances indicate that their carrying value may not be recoverable. A significant amount of judgment is required in performing impairment tests, including the optional assessment of qualitative factors for the annual impairment test, which is used to determine whether it is more likely than not that the fair value of a reporting unit is less than its carrying amount. This assessment serves as a basis for determining whether it is necessary to perform a quantitative impairment test.
We completed our annual tests for impairment as of October 1, 20202023 based upon results of operations through September 30, 2020.2023. We elected to perform a quantitative assessment for one of our reporting units and a qualitative assessment for certainall of our other reporting units andunits.
We performed a quantitative impairment assessment for otherone of our Markel Ventures reporting units.units, in which we estimated the fair value of the reporting unit using an income approach based on a discounted cash flow model. The cash flow projections included management's best estimate of future growth and margins. The discount rate was primarily based on a capital asset pricing model. Based on the results of our quantitative assessment, the estimated fair value of the reporting unit exceeded the carry value.
When performing our qualitative assessments, we considered macroeconomic factors such as industry conditions and market conditions, which, for some of our reporting units, reflected significant impacts attributable to the COVID-19 pandemic.conditions. We
also considered reporting unit-specific events, actual financial performance versus expectations and management's future business expectations, which, in some instances, were also affected by the impacts of the COVID-19 pandemic, as well as the amount by which the fair value of the reporting unit exceeded its carrying value at the date of the last quantitative assessment. As part of our qualitative assessment of recently acquired reporting units with material goodwill, we considered the fact that the businesses had been acquired in orderly transactions between market participants, and our purchase price represented fair value at acquisition. We considered similar factors to determine if there were any indicators requiring an assessment of the recoverability of our definite lived intangible assets and concluded there were not. For those recent acquisitions for which we elected to perform a qualitative assessment, there were no events since acquisition that had a significant adverse impact on the fair value of these reporting units through the assessment date. Based on the results of our qualitative assessments, we believe it is more likely than not that the fair value of each of thesethe assessed reporting units exceeded its respective carrying amount asamount.
Based on the results of the assessment date and December 31, 2020our assessments, there were no impairments of goodwill in 2023, and none of theseour reporting units are at risk of a material impairment of goodwill. We considered similar factors to determine ifAdditionally, there were any indicators requiring anno significant events or changes in circumstances impacting our reporting units between the assessment of the recoverability of our definite lived intangible assetsdate and concluded there were not.December 31, 2023. However, a longer than anticipated recovery or further deterioration inof market conditions related to the general economy or the specific industries in which we operate, a sustained trend of weaker than anticipated financial performance within a reporting unit beyond that which we considered or included in our assessments, or an increase in the market-based weighted average cost of capital, among other factors, could significantly impact the impairment analysis and may result in future goodwill or intangible asset impairment charges.
For those reporting units for which we used a quantitative approach to assess goodwill for impairment, we estimated the fair value primarily using an income approach based on a discounted cash flow model. The cash flow projections used in the discounted cash flow model included management's best estimate of future growth and margins. The discount rates used to determine the fair value estimates were developed based on a capital asset pricing model using market-based inputs as well as an assessment of the inherent risk in projected future cash flows. The estimated fair value of each of our reporting units for which we performed a quantitative analysis significantly exceeded its respective carrying amount as of the assessment date, except as discussed below. As there were no significant events or changes in circumstances impacting our reporting units between the assessment date and December 31, 2020, we also believe the estimated fair value of each of these reporting units significantly exceeded its respective carrying amount as of December 31, 2020.
At December 31, 2020, the carrying value of our Nephila fund management reporting unit included goodwill of $401.9 million. This Nephila reporting unit serves as an insurance and investment fund manager that offers a broad range of investment products, including insurance-linked securities, catastrophe bonds, insurance swaps and weather derivatives. Nephila receives management fees for these services based on the net asset value of the accounts managed and, for certain funds, incentive fees based on the annual performance of the funds managed. This reporting unit is a component of our Nephila operations, which were acquired in late 2018 and recorded at fair value at that time. Given the limited time since acquisition, its carrying value continues to closely approximate fair value, making our impairment assessment more sensitive to changes in assumptions used to calculate fair value. Since acquiring this business in 2018, investment performance in the broader ILS market has been adversely impacted by consecutive years of elevated catastrophe losses and uncertainty around potential COVID-19 loss exposures. These events, as well as recent volatility in the capital markets, also have impacted investor decisions around allocation of capital to ILS, which in turn have impacted our assumptions for capital raises and redemptions within the funds we manage. Our cash flow assumptions for the Nephila fund management reporting unit reflect management's best estimate of the reporting unit's future cash flows, based on information currently available, however, these assumptions are inherently uncertain, require a high degree of estimation and judgment and are subject to change depending on the outcome of future events. Changes to these assumptions or an increase in the market-based weighted average cost of capital could have an adverse impact on the fair value of the Nephila fund management reporting unit, which could result in an impairment of goodwill.
See the risk factor titled "Impairment in the value of our goodwill or other intangible assets could have a material adverse effect on our operating results and financial condition" within Item 1A Risk Factors for further discussion of risks associated with our goodwill and intangible assets.
We performed a quantitative impairment assessment for our Nephila reporting unit in 2022. Based on the results of the assessment, we reduced the carrying value of the goodwill of our Nephila reporting unit by $80.0 million to $221.8 million. We also evaluated our intangible assets within our Nephila reporting unit for impairment and determined they were not impaired. See note 8 of the notes to consolidated financial statements for further details.
Safe Harbor and Cautionary Statement
This report contains statements concerning or incorporating our expectations, assumptions, plans, objectives, future financial or operating performance and other statements that are not historical facts. These statements are "forward-looking statements" within the meaning of the Private Securities Litigation Reform Act of 1995. Such statements may use words such as "anticipate," "believe," "estimate," "expect," "intend," "predict," "project" and similar expressions as they relate to us or our management.
There are risks and uncertainties that may cause actual results to differ materially from predicted results in forward-looking statements. Factors that may cause actual results to differ are often presented with the forward-looking statements themselves.
Additional factors that could cause actual results to differ from those predicted are set forth under Item 1 Business, Item 1A Risk Factors, and Item 7 Management's Discussion and Analysis of Financial Condition and Results of Operations and Item 7A Quantitative and Qualitative Disclosures About Market Risk in this report or are included in the items listed below:
•current global economic, market and industry conditions, as well as significant volatility, uncertainty and disruption caused by the COVID-19 pandemic, including governmental, legislative, judicial or regulatory actions or developments affecting our businesses;
•our expectations about future results of our underwriting, investing, Markel Ventures and other operations are based on current knowledge and assume no significant man-made or natural catastrophes, no significant changes in products or personnel and no adverse changes in market conditions;
•the effect of cyclical trends or changes in market conditions on our underwriting, investing, Markel Ventures and other operations, including demand and pricing in the insurance, reinsurance and other markets in which we operate;
•actions by competitors, including the use of technology and innovation to simplify the customer experience, increase efficiencies, redesign products, alter models and effect other potentially disruptive changes in the insurance industry, and the effect of competition on market trends and pricing;
•our efforts to develop new products, expand in targeted markets or improve business processes and workflows may not be successful and may increase or create new risks (e.g., insufficient demand, change to risk exposures, distribution channel conflicts, execution risk, regulatory risk, increased expenditures);
•the frequency and severity of man-made, health-related and natural catastrophes (including earthquakes, wildfires and weather-related catastrophes) may exceed expectations, are unpredictable and, in the case of wildfires and weather-relatedsome natural catastrophes, may be exacerbated if, as many forecast,by changing conditions in the climate, oceans and atmosphere, resultresulting in increased hurricane, flood, drought frequency and/or other adverseseverity of extreme weather-related activity;events;
•we offer insurance and reinsurance coverage against terrorist acts in connection with some of our programs, and in other instances we are legally required to offer terrorism insurance; in both circumstances, we actively manage our exposure, but if there is a covered terrorist attack, we could sustain material losses;
•emerging claim and coverage issues, changing industry practices and evolving legal, judicial, social and socialother claims and coverage trends or conditions, can increase the scope of coverage, the frequency and inherentseverity of claims and the period over which claims may be reported; these factors, as well as uncertainties in the loss estimation process, can adversely impact the adequacy of our loss reserves and our allowance for reinsurance recoverables;
•reinsurance reserves are subject to greater uncertainty than insurance reserves, primarily because of reliance upon the original underwriting decisions made by ceding companies and the longer lapse of time from the occurrence of loss events to their reporting to the reinsurer for ultimate resolution;
•inaccuracies (whether due to data error, human error or otherwise) in the various modeling techniques and data analytics (e.g., scenarios, predictive and stochastic modeling, and forecasting) we use to analyze and estimate exposures, loss trends and other risks associated with our insurance and insurance-linked securities businesses could cause us to misprice our products or fail to appropriately estimate the risks to which we are exposed;
•changes in the assumptions and estimates used in establishing reserves for our life and annuity reinsurance book (which is in runoff), for example, changes in assumptions and estimates of mortality, longevity, morbidity and interest rates, could result in material increaseschanges in our estimated loss reserves for suchthat business;
•adverse developments in insurance coverage litigation or other legal or administrative proceedings could result in material increases in our estimates of loss reserves;
•initial estimates for catastrophe losses and other significant, infrequent events are often based on limited information, are dependent on broad assumptions about the nature and extent of losses, coverage, liability and reinsurance, and those losses may ultimately differ materially from our expectations;
•changes in the availability, costs, quality and providers of reinsurance coverage, which may impact our ability to write or continue to write certain lines of business or to mitigate the volatility of losses on our results of operations and financial condition;
•the ability or willingness of reinsurers to pay balances due may be adversely affected by industry and economic conditions, deterioration in reinsurer credit quality and coverage disputes, and collateral we hold, if any, may not be sufficient to cover a reinsurer's obligation to us;
•after the commutation of ceded reinsurance contracts, any subsequent adverse development in the re-assumed loss reserves will result in a charge to earnings;
•regulatory actions can impede our ability to charge adequate rates and efficiently allocate capital;
•general economic and market conditions and industry specific conditions, including extended economic recessions or expansions; prolonged periods of slow economic growth; inflation or deflation; fluctuations in foreign currency exchange rates, commodity and energy prices and interest rates; volatility in the credit and capital markets; and other factors;
•economic conditions, actual or potential defaults in corporate bonds, municipal bonds, mortgage-backed securities or sovereign debt obligations, volatility in interest and foreign currency exchange rates, changes in U.S. government debt ratings and changes in market value of concentrated investments can have a significant impact on the fair value of our fixed maturity securities and equity securities, as well as the carrying value of our other assets and liabilities, and this impact may be heightened by market volatility and our ability to mitigate our sensitivity to these changing conditions;
•economic conditions may adversely affect our access to capital and credit markets;
•the effects of government intervention, including material changes in the monetary policies of central banks, to address financial downturns, inflation and other economic and currency concerns;
•the impacts that political and civil unrest and regional conflicts may have on our businesses and the markets they serve or that any disruptions in regional or worldwide economic conditions generally arising from these situations may have on our businesses, industries or investments;
•the impacts thatof liability, transaction and physical risks associated with climate change;
•the significant volatility, uncertainty and disruption caused by health epidemics and pandemics, including the COVID-19 pandemic, as well as governmental, legislative, judicial or regulatory actions of local, state and federal authoritiesor developments in response thereto, may have on our business operations and claims activity;
•the impact on our businesses in the event of a repeal, in part or in whole, or modification of U.S. health care reform legislation and regulations;thereto;
•changes in U.S. tax laws, regulations or interpretations, or in the tax laws, regulations or interpretations of other jurisdictions in which we operate, and adjustments we may make in our operations or tax strategies in response to those changes;
•a failure or security breach of, or cyberattack on, enterprise information technology systems that we, or third parties who perform certain functions for us, use or a failure to comply with data protection or privacy regulations;
•outsourcedthird-party providers may perform poorly, breach their obligations to us or expose us to enhanced risks;
•our acquisitions may increase our operational and internal control risks for a period of time;
•we may not realize the contemplated benefits, including cost savings and synergies, of our acquisitions;
•any determination requiring the write-off of a significant portion of our goodwill and intangible assets;
•the failure or inadequacy of any methods we employ to manage our loss exposures;
•the loss of services of any senior executive officer or other key personnel, or an inability to attract and retain qualified personnel, for our businesses could adversely impact one or more of our operations;
•the manner in which we manage our global operations through a network of business entities could result in inconsistent management, governance and oversight practices and make it difficult for us to implement strategic decisions and coordinate procedures;
•our substantial international operations and investments expose us to increased political, civil, operational and economic risks, including foreign currency exchange rate and credit risk;
•the political, legal, regulatory, financial, tax and general economic impacts, and other impacts we cannot anticipate, related to the United Kingdom's withdrawal from the European Union (Brexit), which could have adverse consequences for our businesses, particularly our London-based international insurance operations;
•our ability to obtain additional capital for our operations on terms favorable to us;
•ourthe compliance, or failure to comply, with covenants and other requirements under our revolving credit facility,facilities, senior debt and other indebtedness and our preferred shares;
•our ability to maintain or raise third partythird-party capital for existing or new investment vehicles and risks related to our management of third partythird-party capital;
•the effectiveness of our procedures for compliance with existing and future guidelines, policies and legal and regulatory standards, rules, laws and regulations;
•the impact of economic and trade sanctions and embargo programs on our businesses, including instances in which the requirements and limitations applicable to the global operations of U.S. companies and their affiliates are more restrictive than, or conflict with, those applicable to non-U.S. companies and their affiliates;
•regulatory changes, or challenges by regulators, regarding the use of certain issuing carrier or fronting arrangements;
•our dependence on a limited number of brokers for a large portion of our revenues and third-party capital;
•adverse changes in our assigned financial strength, debt or preferred share ratings or outlook could adversely impact us, including our ability to attract and retain business, the amount of capital our insurance subsidiaries must hold and the availability and cost of capital;
•changes in the amount of statutory capital our insurance subsidiaries are required to hold, which can vary significantly and is based on many factors, some of which are outside our control;
•losses from litigation and regulatory investigations and actions; and
•a number of additional factors may adversely affect our Markel Ventures operations, and the markets they serve, and negatively impact their revenues and profitability, including, among others: adverse weather conditions, plant disease and other contaminants; changes in government support for education, healthcare and infrastructure projects; changes in capital spending levels; changes in the housing, commercial and commercialindustrial construction markets; liability for environmental matters; supply chain and shipping issues, including increases in freight costs; volatility in the market prices for their products; and volatility in commodity, wholesale and raw materials prices and interest and foreign currency exchange rates.
Results from our underwriting, investing, Markel Ventures and other operations have been and will continue to be potentially materially affected by these factors. In addition, with respect to previously reported developments at Markel CATCo and the decision to place both the Markel CATCo Reinsurance Fund Ltd., a Bermuda exempted mutual fund company comprised of multiple segregated accounts, and Markel CATCo Re Ltd. (Markel CATCo Re) into run-off:
•the inquiries by the U.S. Department of Justice, U.S. Securities and Exchange Commission and Bermuda Monetary Authority into loss reserves recorded in late 2017 and early 2018 at Markel CATCo Re (the Markel CATCo Inquiries) may result in adverse findings, reputational damage, the imposition of sanctions, increased costs, litigation and other negative consequences; and
•management time and resources may be diverted to address the Markel CATCo Inquiries, as well as related litigation.
By making forward-looking statements, we do not intend to become obligated to publicly update or revise any such statements whether as a result of new information, future events or other changes. Readers are cautioned not to place undue reliance on any forward-looking statements, which are based on our current knowledge and speak only as at their dates.
Item 7A. QUANTITATIVE AND QUALITATIVE DISCLOSURES ABOUT MARKET RISK
Market risk is the risk of economic losses due to adverse changes in the estimated fair value of a financial instrument as the result of changes in equity prices, interest rates, foreign currency exchange rates and commodity prices. Our consolidated balance sheets include assets and liabilities with estimated fair values that are subject to market risk. Our primary market risks have beenare equity price risk associated with investments in equity securities, interest rate risk associated with investments in fixed maturity securities and foreign currency exchange rate risk associated with our international operations. Some businesses within our Markel Ventures operations are exposed to commodity price risk resulting from changes in the price of raw materials, parts and other components necessary to manufacture products, however, this risk is not material to the Company. The operating results of these businesses could be adversely impacted should they be unable to obtain price increases from customers in response to significant increases in raw material, parts and other component prices.
The estimated fair value of our investment portfolio at December 31, 2020 was $24.9 billion, 43% of which was invested in fixed maturity securities and 28% of which was invested in equity securities. At December 31, 2019, the estimated fair value of our investment portfolio was $22.3 billion, 45% of which was invested in fixed maturity securities and 34% of which was invested in equity securities.
Our fixed maturity securities and equity securities are recorded at fair value, which is measured based upon quoted prices in active markets, if available. We determinevalue. See note 5 of the notes to consolidated financial statements included under Item 8 for details regarding the fair value for these investments after considering various sources of information, including information provided by a third party pricing service. The pricing service provides prices for substantially allmeasurement of our fixed maturity securities and equity securities. In determining fair value, we generally do not adjust the prices obtained from the pricing service. We obtain an understanding of the pricing service's valuation methodologies and related inputs, which include, but are not limited to, reported trades, benchmark yields, issuer spreads, bids, offers, duration, credit ratings, estimated cash flows and prepayment speeds. We validate prices provided by the pricing service by reviewing prices from other pricing sources and analyzing pricing data in certain instances.
Equity Price Risk
We invest a portion of shareholder fundsmake investments in equity securities, which have historically produced higher long-term returns relative to fixed maturity securities.securities, with capital that is allocated for such purposes. We seek to invest in profitable companies, with honest and talented management, that exhibit reinvestment opportunities and capital discipline, at reasonable prices. We intend to hold these investments over the long term and focus on long-term total investment return on equity securities, understanding that gains or losses on investments may fluctuate from one period to the next. Changes in the fair value of equity securities are recognized in net income.
At December 31, 2020,2023, our equity portfolio was concentrated in terms of the number of issuers and industries. Such concentrations can lead to higher levels of price volatility. At December 31, 2020,2023, our ten largest equity holdings represented $3.1$3.9 billion, or 44%41%, of the equity portfolio. Investments in the property and casualty insurance industry represented $1.1$1.7 billion, or 15%18%, of our equity portfolio at December 31, 20202023 and included a $744.4 million$1.2 billion investment in the common stock of Berkshire Hathaway Inc., a company whose subsidiaries engage in a number of diverse business activities in addition to insurance. We have investment guidelines that set limits on the equity holdings of our insurance subsidiaries.
The following table summarizes our equity price risk and shows the effect of a hypothetical 35% increase or decrease in market prices as of December 31, 20202023 and 2019.2022. The selected hypothetical changes do not indicate what could be the potential best or worst case scenarios.
| | | | | | | | | | | | | | | | | | | | | | | |
| (dollars in millions) | Estimated
Fair Value | | Hypothetical
Price Change | | Estimated
Fair Value after
Hypothetical
Change in Prices | | Estimated
Hypothetical
Percentage Increase
(Decrease) in
Shareholders' Equity |
| As of December 31, 2020 | | | | | | | |
| Equity securities | $ | 6,994 | | | 35% increase | | $ | 9,442 | | | 15.1 | % |
| | | 35% decrease | | 4,546 | | | (15.1) | |
| As of December 31, 2019 | | | | | | | |
| Equity securities | $ | 7,591 | | | 35% increase | | $ | 10,248 | | | 19.0 | % |
| | | 35% decrease | | 4,934 | | | (19.0) | |
| | | | | | | | | | | | | | | | | | | | | | | |
| (dollars in millions) | Estimated
Fair Value | | Hypothetical
Price Change | | Estimated
Fair Value after
Hypothetical
Change in Prices | | Estimated
Hypothetical
Percentage Increase
(Decrease) in
Shareholders' Equity |
| As of December 31, 2023 | | | | | | | |
| Equity securities | $ | 9,578 | | | 35% increase | | $ | 12,930 | | | 17.7 | % |
| | | 35% decrease | | 6,226 | | | (17.7) | |
| As of December 31, 2022 | | | | | | | |
| Equity securities | $ | 7,672 | | | 35% increase | | $ | 10,357 | | | 16.2 | % |
| | | 35% decrease | | 4,987 | | | (16.2) | |
Interest Rate Risk
Our fixed maturity investments and borrowingssenior long-term debt and other debt are subject to interest rate risk. Increases and decreases in interest rates typically result in decreases and increases, respectively, in the fair value of these financial instruments. Our fixed maturity investments are recorded at estimated fair value in our financial statements, and therefore, changes in interest rates impact our financial position and results of operations. Senior long-term debt and other debt is recorded at amortized cost in our financial statements, and therefore, changes in fair value do not impact our financial position or results of operations.
Our underwriting operations provide our investment operations with steady inflows of our investable assets come from premiums paid by policyholders.premiums. These funds are invested predominantly in high qualityhigh-quality government and municipal bonds and corporate bondsmortgage-backed securities that generally match the duration and currency of our loss reserves. TheAs of December 31, 2023, our fixed maturity portfolio including short-term investments and cash and cash equivalents, hashad an average duration of 3.34.1 years and an average rating97% of "AA."the portfolio was rated "AA" or better. See note 4(c) of the notes to consolidated financial statements included under Item 8 for disclosure ofdetails regarding contractual maturity dates of our fixed maturity portfolio. The changes in the estimated fair value of the fixed maturity portfolio are presented as a component of shareholders' equity in accumulated other comprehensive income, net of taxes. We typically hold these fixed maturity investments until maturity, and as a result, unrealized holding gains and losses on these securities are generally expected to reverse as the securities mature.
We work to manage the impact of interest rate fluctuations on our fixed maturity portfolio. The effective duration of the fixed maturity portfolio is managed with consideration given to the estimated duration of our liabilities.loss reserves. We have investment guidelines that limit the maximum duration and maturity of the fixed maturity portfolio.
We use a commercially available model to estimate the effect of interest rate risk on the fair values of our fixed maturity portfolio and borrowings.debt. The model estimates the impact of interest rate changes on a wide range of factors including duration, prepayment, put options and call options. Fair values are estimated based on the net present value of cash flows, using a representative set of possible future interest rate scenarios. The model requires that numerous assumptions be made about the future. To the extent that any of the assumptions are invalid, incorrect estimates could result. The usefulness of a single point-in-time model is limited, as it is unable to accurately incorporate the full complexity of market interactions.
The following table summarizes our interest rate risk and shows the effect of hypothetical changes in interest rates as of December 31, 20202023 and 2019.2022. The selected hypothetical changes do not indicate what could be the potential best or worst case scenarios.
| | | | | | | | | | | | | | | | | | | | | | | | | | | | | |
| (dollars in millions) | Estimated
Fair Value | | Hypothetical
Change in
Interest Rates
(bp=basis points) | | Estimated
Fair Value after
Hypothetical Change
in Interest Rates | | Hypothetical Percentage
Increase (Decrease) in |
| Fair Value of Fixed Maturity Securities | | Shareholders'
Equity |
| Fixed Maturity Securities | | | | | | | | | |
| As of December 31, 2020 | | | | | | | | | |
| Total fixed maturity securities | $ | 10,682 | | | 200 bp decrease | | $ | 11,938 | | | 11.8 | % | | 7.8 | % |
| | | 100 bp decrease | | 11,277 | | | 5.6 | | | 3.7 | |
| | | 100 bp increase | | 10,128 | | | (5.2) | | | (3.4) | |
| | | 200 bp increase | | 9,597 | | | (10.2) | | | (6.7) | |
| As of December 31, 2019 | | | | | | | | | |
| Total fixed maturity securities | $ | 9,971 | | | 200 bp decrease | | $ | 11,212 | | | 12.4 | % | | 8.9 | % |
| | | 100 bp decrease | | 10,570 | | | 6.0 | | | 4.3 | |
| | | 100 bp increase | | 9,407 | | | (5.7) | | | (4.0) | |
| | | 200 bp increase | | 8,881 | | | (10.9) | | | (7.8) | |
Liabilities (1) | | | | | | | | | |
| As of December 31, 2020 | | | | | | | | | |
| Borrowings | $ | 4,367 | | | 200 bp decrease | | $ | 5,727 | | | | | |
| | | 100 bp decrease | | 4,975 | | | | | |
| | | 100 bp increase | | 3,872 | | | | | |
| | | 200 bp increase | | 3,464 | | | | | |
| As of December 31, 2019 | | | | | | | | | |
| Borrowings | $ | 3,907 | | | 200 bp decrease | | $ | 5,050 | | | | | |
| | | 100 bp decrease | | 4,419 | | | | | |
| | | 100 bp increase | | 3,486 | | | | | |
| | | 200 bp increase | | 3,138 | | | | | |
| | | | | | | | | | | | | | | | | | | | | | | | | | | | | |
| (dollars in millions) | Estimated
Fair Value | | Hypothetical
Change in
Interest Rates
(bp=basis points) | | Estimated
Fair Value after
Hypothetical Change
in Interest Rates | | Hypothetical Percentage
Increase (Decrease) in |
| Fair Value of Fixed Maturity Securities | | Shareholders'
Equity |
| Assets | | | | | | | | | |
| As of December 31, 2023 | | | | | | | | | |
| Fixed maturity securities | $ | 14,373 | | | 200 bp decrease | | $ | 15,614 | | | 8.6 | % | | 6.5 | % |
| | | 100 bp decrease | | 14,978 | | | 4.2 | | | 3.2 | |
| | | 100 bp increase | | 13,815 | | | (3.9) | | | (2.9) | |
| | | 200 bp increase | | 13,280 | | | (7.6) | | | (5.8) | |
| As of December 31, 2022 | | | | | | | | | |
| Fixed maturity securities | $ | 11,857 | | | 200 bp decrease | | $ | 12,843 | | | 8.3 | % | | 6.0 | % |
| | | 100 bp decrease | | 12,334 | | | 4.0 | | | 2.9 | |
| | | 100 bp increase | | 11,406 | | | (3.8) | | | (2.7) | |
| | | 200 bp increase | | 10,972 | | | (7.5) | | | (5.3) | |
Liabilities (1) | | | | | | | | | |
| As of December 31, 2023 | | | | | | | | | |
| Senior long-term debt and other debt | $ | 3,353 | | | 200 bp decrease | | $ | 4,222 | | | | | |
| | | 100 bp decrease | | 3,747 | | | | | |
| | | 100 bp increase | | 3,026 | | | | | |
| | | 200 bp increase | | 2,753 | | | | | |
| As of December 31, 2022 | | | | | | | | | |
| Senior long-term debt and other debt | $ | 3,541 | | | 200 bp decrease | | $ | 4,384 | | | | | |
| | | 100 bp decrease | | 3,922 | | | | | |
| | | 100 bp increase | | 3,225 | | | | | |
| | | 200 bp increase | | 2,962 | | | | | |
(1)Changes in estimated fair value have no impact on shareholders' equity.
Foreign Currency Exchange Rate Risk
We have foreign currency exchange rate risk associated with certain of our international operations' assets and liabilities related to certain of our foreign operations.liabilities. We manage this risk primarily by matching assets and liabilities in each foreign currency, other than non-monetary assets, as closely as possible. Our non-monetary assets primarily consist of goodwill and intangible assets, a portion of which are remeasured into the U.S. Dollar at historic exchange rates and are therefore not subject to foreign currency exchange rate risk. As of December 31, 2020 and December 31, 2019, the carrying value of goodwill and intangible assets that are subject to foreign currency exchange rate risk was $119.1 million and $123.0 million, respectively.
as closely as possible. To assist with thethis matching, of assets and liabilities in foreign currencies, we periodically purchase foreign currency forward contracts and we purchase or sell foreign currencies in the open market. Realized and unrealized gains and losses on our forward contracts are recorded in earnings. Our forward contracts generally have maturities of three months.
At both December 31, 20202023 and 2019, substantially all of our monetary assets and liabilities denominated in foreign currencies were either matched or hedged.
At December 31, 2020 and 2019, 88% and 89%, respectively,2022, 90% of our invested assets were denominated in U.S.United States (U.S.) Dollars. At both December 31, 20202023 and 2019, 85% and 84%, respectively,2022, 89% of our combined reserves for unpaid losses and loss adjustment expenses and life and annuity benefits were denominated in U.S. Dollars. At those dates, the largest foreign currency denominated balances within both our invested assets and reserves for unpaid losses and loss adjustment expenses and life and annuity benefits were the Euro and British Pound Sterling.
10K - 67At December 31, 2023 and 2022, our foreign currency denominated assets and liabilities that are subject to foreign currency exchange rate risk were substantially matched or hedged.
Credit Risk
Credit risk, which is not considered a market risk, is the risk that an entity becomes unable or unwilling to fulfill their obligation to us. Our primary credit risks are the credit risk within our fixed maturity portfolio and the credit risk related to our reinsurance recoverables within our underwriting, program services and other fronting operations.
Fixed Maturity Investments
Credit risk exists within our fixed maturity portfolio from the potential for loss resulting from adverse changes in an issuer's ability to repay its debt obligations. We monitor our investment portfolio to ensure that credit risk does not exceed prudent levels. We have consistently invested in high credit quality, investment grade securities. OurAs of December 31, 2023, 97% of our fixed maturity portfolio has an average rating of "AA," with 98%was rated "A""AA" or better by at least one nationally recognized rating organization.better. Our policy is to invest in investment grade securities and to minimize investments in fixed maturity securities that are unrated or rated below investment grade. At December 31, 2020, less than 1% of our fixed maturity portfolio was unrated or rated below investment grade. Our fixed maturity portfolio includes securities issued with financial guaranty insurance. We purchase fixed maturity securities based on our assessment of the credit quality of the underlying assets without regard to insurance.
Our fixed maturity portfolio includes securities issued by foreign governments and non-sovereign foreign institutions. General concern exists about theforeign countries that experience financial difficulties facing certain foreign countries in lightduring periods of the adverse economic conditions experienced over the past several years.conditions. We monitor developments in foreign countries, currencies and issuers that could pose risks to our fixed maturity portfolio, including ratings downgrades, political and financial changes and the widening of credit spreads. We believe that ourOur fixed maturity portfolio is highly diversified and is comprised of high quality securities.
We obtain information from news services, data providers, rating agencies and various financial market participants to assess potential negative impacts on a country or company's financial risk profile. We analyze concentrations within our fixed maturity portfolio by country, currency and issuer, which allows us to assess our level of diversification with respect to these exposures, reduce troubled exposures should they occur and mitigate any future financial distress that these exposures could cause.
Our fixed maturity portfolio also includes securities issued by municipalities. General concern exists about municipalities that experience financial difficulties during periods of adverse economic conditions. We manage the exposure to credit risk in our municipal bond portfolio by investing in high quality securities and by diversifying our holdings, which are typically either general obligation or revenue bonds related to essential products and services.
Reinsurance Recoverables
We have credit risk within our reinsurance recoverables to the extent any of our reinsurers are unwilling or unable to meet their obligations to us under our ceded reinsurance agreements. We monitor changes in the financial condition of each of our reinsurers, and we assess our concentration of credit risk on a regular basis. While we believe our net reinsurance recoverable balances are collectible, deterioration in reinsurers' ability to pay, or collection disputes, could adversely affect our operating cash flows, financial position and results of operations.
Underwriting
Within our underwriting operations, our reinsurance recoverables balance for the ten largest reinsurers was $1.6$2.6 billion at December 31, 2020,2023, representing 60%65% of the $4.0 billion total reinsurance recoverables, before considering allowances for credit losses. All of our ten largest reinsurers within our underwriting operations were rated "A" or better by A.M. Best. We were the beneficiary of letters of credit, trust accounts and funds withheld in the aggregate amount of $473.2$919.2 million at December 31, 2020,2023, collateralizing reinsurance recoverable balances due from these ten reinsurers.
Within our program services business, our reinsurance recoverables balance for the ten largest reinsurers was $2.3 billion at December 31, 2020, representing 70% of the $3.3 billion total reinsurance recoverables, before considering allowances for credit losses. Six Nine of our ten largest reinsurers within our program services businessunderwriting operations were rated "A" or better by A.M. Best. We wereBest Company (A.M. Best). For the beneficiaryremaining reinsurer, which is a related party, our reinsurance recoverable was fully collateralized as of December 31, 2023.
In 2023, we recognized $65.0 million of credit losses in connection with fraudulent letters of credit trust accounts and funds withheld inthat were provided by an affiliate of Vesttoo Ltd. as collateral for reinsurance purchased on two policies, which we believe represents our full exposure to credit losses on the aggregate amount of $1.9 billion at December 31, 2020, collateralizingrelated reinsurance recoverable balances due from these ten reinsurers, and $2.8 billion for our totalrecoverables. We are actively pursuing remedies to make recoveries on the reinsurance recoverables balance. For reinsurersimpacted by the fraudulent letters of credit and do not have any other ceded reinsurance contracts with a credit rating of lower than "A" we employ a stringent collateral monitoring program, under which the majority of the reinsurance recoverable balances are fully collateralized. These collateral requirements are regularly monitored by a credit committee within our program services operations. See note 10 of the notes to consolidated financial statements included under Item 8 for additional details about our reinsurance recoverables and exposures.Vesttoo Ltd. or its affiliates.
Within our underwriting operations, we attempt to minimize credit exposure to reinsurers through adherence to internal reinsurance guidelines. To participate in our reinsurance program, prospective companies generally must: (i) maintain an A.M. Best Company (Best) or Standard & Poor's (S&P) rating of "A" (excellent) or better; (ii) maintain minimum capital and surplus of $500 million$750 million; and (iii) provide collateral for recoverables in excess of an individually established amount. We also consider qualitative factors when evaluating reinsurers for eligibility to participate in our reinsurance program. In addition, certain foreign reinsurers for our U.S. insurance operations must provide collateral equal to 100% of recoverables, with the exception of reinsurers who have been granted certified or authorized status by an insurance company's state of domicile. Our credit exposure to Lloyd's of London syndicates is managed through individual and aggregate exposure thresholds.
Within our program services business, our reinsurance recoverables balance for the ten largest reinsurers was $2.8 billion at December 31, 2023, representing 56% of the $4.9 billion total reinsurance recoverables, before considering allowances for credit losses. We monitor changeswere the beneficiary of letters of credit, trust accounts and funds withheld in the financial conditionaggregate amount of each$2.0 billion at December 31, 2023, collateralizing reinsurance recoverable balances due from these ten reinsurers, and $3.3 billion for our total reinsurance recoverables balance. Five of our ten largest reinsurers and we assess our concentrationwere rated "A" or better by A.M. Best. For four of credit risk on a regular basis. the remaining five reinsurers, as of December 31, 2023, collateral held exceeded the related reinsurance recoverable.
Within our program services business, we mitigate credit risk by either selecting well capitalized, highly rated authorized reinsurers or requiring that the reinsurer post substantial collateral to secure the reinsured risks, which, in some instances, exceeds the related reinsurance recoverable. WhileFor reinsurers with a credit rating of lower than "A" we believe that netemploy a stringent collateral monitoring program, under which the majority of the reinsurance recoverable balances is fully collateralized. These collateral requirements are collectible, deterioration in reinsurers' ability to pay, or collection disputes, could adversely affectregularly monitored by a credit committee within our operating cash flows, financial position and results ofprogram services operations.
Impact of InflationOther Fronting
Property and casualty insurance premiumsFor our other fronting arrangements, which are established beforewritten on behalf of our ILS operations, our total reinsurance recoverables balance was $448.3 million at December 31, 2023. As of December 31, 2023, our ILS operations held investor collateral in excess of the amountrelated reinsurance recoverables. For this business, we require collateral up to a specified level of annual aggregate agreement year losses, and loss adjustment expenses, orwhich is held in a trust for which we are the extentbeneficiary. The required collateral is monitored regularly against the annual aggregate agreement year losses to which inflation may affect such expenses, is known. Consequently, in establishing premiums, we attempt to anticipateensure adequacy of the potential impact of inflation. We also consider inflationcollateral in the determination and reviewevent of reserves for losses and loss adjustment expenses and life and annuity benefits since portions of these reserves are expected to be paid over extended periods of time. This is especially true for our long-tailed lines of business. Although our life and annuity reinsurance business is in run-off, we must monitor the effect that inflation, among other things, has on the related reserves. We regularly complete loss recognition testing to ensure that held reserves are sufficient to meet our future claim obligations in the current investment environment.a loss.
Item 8. FINANCIAL STATEMENTS AND SUPPLEMENTARY DATA
REPORT OF INDEPENDENT REGISTERED PUBLIC ACCOUNTING FIRM
To the Shareholders and Board of Directors
Markel Corporation:
Opinion on Internal Control Over Financial Reporting
We have audited Markel Corporation and subsidiaries' (the Company) internal control over financial reporting as of December 31, 2020, based on criteria established in Internal Control – Integrated Framework (2013) issued by the Committee of Sponsoring Organizations of the Treadway Commission. In our opinion, the Company maintained, in all material respects, effective internal control over financial reporting as of December 31, 2020, based on criteria established in Internal Control – Integrated Framework (2013) issued by the Committee of Sponsoring Organizations of the Treadway Commission.
We also have audited, in accordance with the standards of the Public Company Accounting Oversight Board (United States) (PCAOB), the consolidated balance sheets of the Company as of December 31, 2020 and 2019, the related consolidated statements of income (loss) and comprehensive income (loss), changes in equity, and cash flows for each of the years in the three-year period ended December 31, 2020, and the related notes (collectively, the consolidated financial statements), and our report dated February 19, 2021 expressed an unqualified opinion on those consolidated financial statements.
The Company acquired Lansing Building Products, LLC (Lansing) during 2020. Management excluded Lansing's internal control over financial reporting from its assessment of the effectiveness of the Company's internal control over financial reporting as of December 31, 2020, associated with 2% of the Company's consolidated assets and 7% of the Company's consolidated operating revenues included in the consolidated financial statements as of and for the year ended December 31, 2020. Our audit of internal control over financial reporting of the Company also excluded an evaluation of the internal control over financial reporting of Lansing.
Basis for Opinion
The Company's management is responsible for maintaining effective internal control over financial reporting and for its assessment of the effectiveness of internal control over financial reporting, included in the accompanying Management's Report on Internal Control over Financial Reporting. Our responsibility is to express an opinion on the Company's internal control over financial reporting based on our audit. We are a public accounting firm registered with the PCAOB and are required to be independent with respect to the Company in accordance with the U.S. federal securities laws and the applicable rules and regulations of the Securities and Exchange Commission and the PCAOB.
We conducted our audit in accordance with the standards of the PCAOB. Those standards require that we plan and perform the audit to obtain reasonable assurance about whether effective internal control over financial reporting was maintained in all material respects. Our audit of internal control over financial reporting included obtaining an understanding of internal control over financial reporting, assessing the risk that a material weakness exists, and testing and evaluating the design and operating effectiveness of internal control based on the assessed risk. Our audit also included performing such other procedures as we considered necessary in the circumstances. We believe that our audit provides a reasonable basis for our opinion.
Definition and Limitations of Internal Control Over Financial Reporting
A company's internal control over financial reporting is a process designed to provide reasonable assurance regarding the reliability of financial reporting and the preparation of financial statements for external purposes in accordance with generally accepted accounting principles. A company's internal control over financial reporting includes those policies and procedures that (1) pertain to the maintenance of records that, in reasonable detail, accurately and fairly reflect the transactions and dispositions of the assets of the company; (2) provide reasonable assurance that transactions are recorded as necessary to permit preparation of financial statements in accordance with generally accepted accounting principles, and that receipts and expenditures of the company are being made only in accordance with authorizations of management and directors of the company; and (3) provide reasonable assurance regarding prevention or timely detection of unauthorized acquisition, use, or disposition of the company's assets that could have a material effect on the financial statements.
Because of its inherent limitations, internal control over financial reporting may not prevent or detect misstatements. Also, projections of any evaluation of effectiveness to future periods are subject to the risk that controls may become inadequate because of changes in conditions, or that the degree of compliance with the policies or procedures may deteriorate.
| | |
|
|
Richmond, Virginia |
February 19, 2021 |
REPORT OF INDEPENDENT REGISTERED PUBLIC ACCOUNTING FIRM
To the Shareholders and Board of Directors
Markel Corporation:Group Inc.:
Opinion on the Consolidated Financial Statements
We have audited the accompanying consolidated balance sheets of Markel CorporationGroup Inc. and subsidiaries (the Company) as of December 31, 20202023 and 2019,2022, the related consolidated statements of income (loss) and comprehensive income (loss), changes in equity, and cash flows for each of the years in the three‑year period ended December 31, 2020,2023, and the related notes (collectively, the consolidated financial statements). In our opinion, the consolidated financial statements present fairly, in all material respects, the financial position of the Company as of December 31, 20202023 and 2019,2022, and the results of its operations and its cash flows for each of the years in the three‑year period ended December 31, 2020,2023, in conformity with U.S. generally accepted accounting principles.
We also have audited, in accordance with the standards of the Public Company Accounting Oversight Board (United States) (PCAOB), the Company's internal control over financial reporting as of December 31, 2020,2023, based on criteria established in Internal Control – Integrated Framework (2013) issued by the Committee of Sponsoring Organizations of the Treadway Commission, and our report dated February 19, 202123, 2024 expressed an unqualified opinion on the effectiveness of the Company's internal control over financial reporting.
Basis for Opinion
These consolidated financial statements are the responsibility of the Company's management. Our responsibility is to express an opinion on these consolidated financial statements based on our audits. We are a public accounting firm registered with the PCAOB and are required to be independent with respect to the Company in accordance with the U.S. federal securities laws and the applicable rules and regulations of the Securities and Exchange Commission and the PCAOB.
We conducted our audits in accordance with the standards of the PCAOB. Those standards require that we plan and perform the audit to obtain reasonable assurance about whether the consolidated financial statements are free of material misstatement, whether due to error or fraud. Our audits included performing procedures to assess the risks of material misstatement of the consolidated financial statements, whether due to error or fraud, and performing procedures that respond to those risks. Such procedures included examining, on a test basis, evidence regarding the amounts and disclosures in the consolidated financial statements. Our audits also included evaluating the accounting principles used and significant estimates made by management, as well as evaluating the overall presentation of the consolidated financial statements. We believe that our audits provide a reasonable basis for our opinion.
Critical Audit Matter
The critical audit matter communicated below is a matter arising from the current period audit of the consolidated financial statements that was communicated or required to be communicated to the audit committee and that: (1) relates to accounts or disclosures that are material to the consolidated financial statements and (2) involved our especially challenging, subjective, or complex judgments. The communication of a critical audit matter does not alter in any way our opinion on the consolidated financial statements, taken as a whole, and we are not, by communicating the critical audit matter below, providing a separate opinion on the critical audit matter or on the accounts or disclosures to which it relates.
Estimation of the liability for unpaid losses and loss adjustment expenses for the
Company's underwriting
operations
As described in Note 9,11, the Company has recorded a liability for unpaid losses and loss adjustment expenses (loss reserves) of $16.2$23.5 billion as of December 31, 2020.2023. Of this amount, $12.9$18.1 billion represents loss reserves for the Company's underwriting operations. The Company's actuaries use established actuarial methods and past development patterns to estimate ultimate losses to be paid. For its underwriting operations, loss reserves are established at the Company's best estimates, which incorporate the actuarial point estimates and are adjusted for certain subjective factors.
We identified the assessment of loss reserve estimation for the Company's underwriting operations as a critical audit matter because it involved significant measurement uncertainty.uncertainty, which required complex auditor judgment. The assessment of actuarial methods and key assumptions used to estimate ultimate losses required specialized actuarial skills and subjective auditor judgment. Key assumptions included weighting of actuarial methods, expected loss ratios, and patterns and variability of loss development.
The following are the primary procedures we performed to address this critical audit matter. WeWith the assistance of actuarial professionals, as appropriate, we evaluated the design and tested the operating effectiveness of internal controls over the Company's loss reserving process for its underwriting operations. This included controls over key assumptions and the determination of loss reserves. Additionally, we also involved actuarial professionals with specialized skills and knowledge, who assisted in:
•assessing the Company's actuarial methodologies by comparing to generally accepted actuarial methodologies and evaluating the weighting of the methods based on common industry practice
•evaluating certain assumptions about future claims reporting and payment patterns used to determine the Company's actuarial point estimate for consistency with the Company's historical loss development and payment patterns
•developing independent actuarial estimates for certain product lines with long-tail loss reporting and payment patterns using the Company's underlying historical claims and policy data as well as industry loss reporting and payment data for workers' compensation lines
•for certain product lines, assessing the Company's actuarial analyses, including their methodsassumptions about future claims reporting and assumptions,payments for certain remaining product lines comprised of thoseconsistency with smaller balances or shorter tailhistorical loss reportingdevelopment and payment patterns
•developing an independent range of consolidated loss reserves based on actuarial methods and assumptions, and comparing those results to the Company's recorded reserves
• and evaluating the movement of the Company's best estimaterecorded reserve within our independently determined range of consolidated loss reserves between reporting periods.
| | |
| /s/ KPMG LLP |
|
|
| We have served as the Company's auditor since 1980. |
|
| Richmond, Virginia |
February 19, 202123, 2024 |
MARKEL CORPORATION AND SUBSIDIARIES
CONSOLIDATED BALANCE SHEETS
| | | | | | | | | | | |
| December 31, |
| 2020 | | 2019 |
| (dollars in thousands) |
| ASSETS | | | |
| Investments, at estimated fair value: | | | |
| Fixed maturity securities, available-for-sale (amortized cost of $9,655,261 in 2020 and $9,448,840 in 2019) | $ | 10,681,734 | | | $ | 9,970,909 | |
| Equity securities (cost of $2,732,998 in 2020 and $3,266,735 in 2019) | 6,994,110 | | | 7,590,755 | |
| Short-term investments, available-for-sale (estimated fair value approximates cost) | 2,034,099 | | | 1,196,248 | |
| Total Investments | 19,709,943 | | | 18,757,912 | |
| Cash and cash equivalents | 4,341,736 | | | 3,072,807 | |
| Restricted cash and cash equivalents | 874,913 | | | 427,546 | |
| Receivables | 1,930,211 | | | 1,847,802 | |
| Reinsurance recoverables | 5,989,337 | | | 5,432,712 | |
| Deferred policy acquisition costs | 630,794 | | | 566,042 | |
| Prepaid reinsurance premiums | 1,451,858 | | | 1,415,857 | |
| Goodwill | 2,604,624 | | | 2,308,548 | |
| Intangible assets | 1,782,718 | | | 1,738,474 | |
| Other assets | 2,393,920 | | | 1,906,115 | |
| Total Assets | $ | 41,710,054 | | | $ | 37,473,815 | |
| LIABILITIES AND EQUITY | | | |
| Unpaid losses and loss adjustment expenses | $ | 16,222,376 | | | $ | 14,728,676 | |
| Life and annuity benefits | 1,069,986 | | | 985,729 | |
| Unearned premiums | 4,433,245 | | | 4,057,727 | |
| Payables to insurance and reinsurance companies | 493,470 | | | 406,720 | |
| Senior long-term debt and other debt (estimated fair value of $4,367,000 in 2020 and $3,907,000 in 2019) | 3,484,023 | | | 3,534,183 | |
| Other liabilities | 2,946,631 | | | 2,504,802 | |
| Total Liabilities | 28,649,731 | | | 26,217,837 | |
| Redeemable noncontrolling interests | 245,642 | | | 177,562 | |
| Commitments and contingencies | 0 | | 0 |
| Shareholders' equity: | | | |
| Preferred stock | 591,891 | | | 0 | |
| Common stock | 3,428,340 | | | 3,404,919 | |
| Retained earnings | 8,195,182 | | | 7,457,176 | |
| Accumulated other comprehensive income | 584,376 | | | 208,772 | |
| Total Shareholders' Equity | 12,799,789 | | | 11,070,867 | |
| Noncontrolling interests | 14,892 | | | 7,549 | |
| Total Equity | 12,814,681 | | | 11,078,416 | |
| Total Liabilities and Equity | $ | 41,710,054 | | | $ | 37,473,815 | |
See accompanying notes to consolidated financial statements.
MARKEL CORPORATIONGROUP INC. AND SUBSIDIARIES
CONSOLIDATED STATEMENTS OF INCOME (LOSS) AND COMPREHENSIVE INCOME (LOSS)BALANCE SHEETS
| | | | | | | | | | | | | | | | | |
| Years Ended December 31, |
| 2020 | | 2019 | | 2018 |
| (dollars in thousands, except per share data) |
| OPERATING REVENUES | | | | | |
| Earned premiums | $ | 5,612,205 | | | $ | 5,049,793 | | | $ | 4,712,060 | |
| Net investment income | 371,830 | | | 451,888 | | | 434,215 | |
| Net investment gains (losses) | 617,979 | | | 1,601,722 | | | (437,596) | |
| Products revenues | 1,439,515 | | | 1,609,586 | | | 1,497,523 | |
| Services and other revenues | 1,693,537 | | | 813,202 | | | 635,083 | |
| Total Operating Revenues | 9,735,066 | | | 9,526,191 | | | 6,841,285 | |
| OPERATING EXPENSES | | | | | |
| Losses and loss adjustment expenses | 3,466,961 | | | 2,891,190 | | | 2,820,715 | |
| Underwriting, acquisition and insurance expenses | 2,017,627 | | | 1,878,093 | | | 1,777,511 | |
| Products expenses | 1,256,159 | | | 1,455,245 | | | 1,413,248 | |
| Services and other expenses | 1,561,120 | | | 675,679 | | | 474,924 | |
| Amortization of intangible assets | 159,315 | | | 148,638 | | | 115,930 | |
| Impairment of goodwill and intangible assets | 0 | | | 0 | | | 199,198 | |
| Total Operating Expenses | 8,461,182 | | | 7,048,845 | | | 6,801,526 | |
| Operating Income | 1,273,884 | | | 2,477,346 | | | 39,759 | |
| Interest expense | (177,582) | | | (171,687) | | | (154,212) | |
| Net foreign exchange gains (losses) | (95,853) | | | (2,265) | | | 106,598 | |
| Loss on early extinguishment of debt | 0 | | | (17,586) | | | 0 | |
| Income (Loss) Before Income Taxes | 1,000,449 | | | 2,285,808 | | | (7,855) | |
| Income tax expense | (168,682) | | | (486,346) | | | (122,498) | |
| Net Income (Loss) | 831,767 | | | 1,799,462 | | | (130,353) | |
| Net (income) loss attributable to noncontrolling interests | (15,737) | | | (8,996) | | | 2,173 | |
| Net Income (Loss) to Shareholders | 816,030 | | | 1,790,466 | | | (128,180) | |
| Preferred stock dividends | (18,400) | | | 0 | | | 0 | |
| | | | | |
| Net Income (Loss) to Common Shareholders | $ | 797,630 | | | $ | 1,790,466 | | | $ | (128,180) | |
| | | | | |
| OTHER COMPREHENSIVE INCOME (LOSS) | | | | | |
| Change in net unrealized gains on available-for-sale investments, net of taxes: | | | | | |
| Net holding gains (losses) arising during the period | $ | 356,159 | | | $ | 299,125 | | | $ | (241,325) | |
| | | | | |
| Reclassification adjustments for net gains (losses) included in net income (loss) | (3,386) | | | (1,148) | | | 7,849 | |
| Change in net unrealized gains on available-for-sale investments, net of taxes | 352,773 | | | 297,977 | | | (233,476) | |
| Change in foreign currency translation adjustments, net of taxes | 29,847 | | | 382 | | | (16,495) | |
| Change in net actuarial pension loss, net of taxes | (6,998) | | | 5,042 | | | 2,341 | |
| Total Other Comprehensive Income (Loss) | 375,622 | | | 303,401 | | | (247,630) | |
| Comprehensive Income (Loss) | 1,207,389 | | | 2,102,863 | | | (377,983) | |
| Comprehensive (income) loss attributable to noncontrolling interests | (15,755) | | | (8,975) | | | 2,213 | |
| Comprehensive Income (Loss) to Shareholders | $ | 1,191,634 | | | $ | 2,093,888 | | | $ | (375,770) | |
| | | | | |
| NET INCOME (LOSS) PER COMMON SHARE | | | | | |
| Basic | $ | 55.67 | | | $ | 129.25 | | | $ | (9.55) | |
| Diluted | $ | 55.63 | | | $ | 129.07 | | | $ | (9.55) | |
| | | | | | | | | | | |
| December 31, |
| 2023 | | 2022 |
| (dollars in thousands) |
| ASSETS | | | |
| Investments, at estimated fair value: | | | |
| Fixed maturity securities, available-for-sale (amortized cost of $14,932,286 in 2023 and $12,805,887 in 2022) | $ | 14,372,732 | | | $ | 11,856,835 | |
| Equity securities (cost of $3,497,071 in 2023 and $3,100,040 in 2022) | 9,577,871 | | | 7,671,912 | |
| Short-term investments, available-for-sale (estimated fair value approximates cost) | 2,571,382 | | | 2,669,262 | |
| Total Investments | 26,521,985 | | | 22,198,009 | |
| Cash and cash equivalents | 3,747,060 | | | 4,137,432 | |
| Restricted cash and cash equivalents | 584,974 | | | 1,084,081 | |
| Receivables | 3,455,306 | | | 2,961,056 | |
| Reinsurance recoverables | 9,235,501 | | | 8,446,745 | |
| Deferred policy acquisition costs | 931,344 | | | 925,483 | |
| Prepaid reinsurance premiums | 2,365,243 | | | 2,066,114 | |
| Goodwill | 2,624,749 | | | 2,638,838 | |
| Intangible assets | 1,588,684 | | | 1,747,464 | |
| Other assets | 3,990,864 | | | 3,586,037 | |
| Total Assets | $ | 55,045,710 | | | $ | 49,791,259 | |
| LIABILITIES AND EQUITY | | | |
| Unpaid losses and loss adjustment expenses | $ | 23,483,321 | | | $ | 20,947,898 | |
| Life and annuity benefits | 649,054 | | | 650,721 | |
| Unearned premiums | 6,642,426 | | | 6,220,748 | |
| Payables to insurance and reinsurance companies | 1,037,722 | | | 669,742 | |
| Senior long-term debt and other debt (estimated fair value of $3,353,000 in 2023 and $3,541,000 in 2022) | 3,779,796 | | | 4,103,629 | |
| Other liabilities | 3,927,498 | | | 3,461,482 | |
| Total Liabilities | 39,519,817 | | | 36,054,220 | |
| Redeemable noncontrolling interests | 469,685 | | | 523,154 | |
| Commitments and contingencies | | | |
| Shareholders' equity: | | | |
| Preferred stock | 591,891 | | | 591,891 | |
| Common stock | 3,517,146 | | | 3,493,893 | |
| Retained earnings | 11,353,101 | | | 9,832,804 | |
| Accumulated other comprehensive loss | (478,210) | | | (767,494) | |
| Total Shareholders' Equity | 14,983,928 | | | 13,151,094 | |
| Noncontrolling interests | 72,280 | | | 62,791 | |
| Total Equity | 15,056,208 | | | 13,213,885 | |
| Total Liabilities and Equity | $ | 55,045,710 | | | $ | 49,791,259 | |
See accompanying notes to consolidated financial statements.
MARKEL CORPORATIONGROUP INC. AND SUBSIDIARIES
CONSOLIDATED STATEMENTS OF CHANGES IN EQUITYINCOME (LOSS) AND COMPREHENSIVE INCOME (LOSS)
| | | | | | | | | | | | | | | | | | | | | | | | | | | | | | | | | | | | | | | | | | | | | | | |
| (dollars in thousands) | Preferred Stock | | Common
Stock | | Retained
Earnings | | Accumulated
Other
Comprehensive
Income (Loss) | | Total
Shareholders'
Equity | | Noncontrolling
Interests | | Total Equity | | Redeemable Noncontrolling Interests |
| December 31, 2017 | $ | 0 | | | $ | 3,381,834 | | | $ | 3,776,743 | | | $ | 2,345,571 | | | $ | 9,504,148 | | | $ | (2,567) | | | $ | 9,501,581 | | | $ | 166,269 | |
| Cumulative effect of adoption of ASU No. 2014-09, net of taxes | | | | | 325 | | | 0 | | | 325 | | | 0 | | | 325 | | | 0 | |
| Cumulative effect of adoption of ASU No. 2016-01, net of taxes | | | | | 2,595,484 | | | (2,595,484) | | | — | | | — | | | — | | | — | |
| Cumulative effect of adoption of ASU No. 2018-02 | | | | | (402,853) | | | 402,853 | | | 0 | | | 0 | | | 0 | | | 0 | |
| January 1, 2018 | 0 | | | 3,381,834 | | | 5,969,699 | | | 152,940 | | | 9,504,473 | | | (2,567) | | | 9,501,906 | | | 166,269 | |
| Net loss | | | | | (128,180) | | | 0 | | | (128,180) | | | (1,175) | | | (129,355) | | | (998) | |
| Other comprehensive loss | | | | | 0 | | | (247,590) | | | (247,590) | | | 0 | | | (247,590) | | | (40) | |
| Comprehensive Loss | | | | | | | | | (375,770) | | | (1,175) | | | (376,945) | | | (1,038) | |
| Repurchase of common stock | 0 | | | 0 | | | (54,007) | | | 0 | | | (54,007) | | | 0 | | | (54,007) | | | 0 | |
| Restricted stock awards expensed | 0 | | | 16,191 | | | 0 | | | 0 | | | 16,191 | | | 0 | | | 16,191 | | | 0 | |
| Acquisition of Brahmin | 0 | | | 0 | | | 0 | | | 0 | | | 0 | | | 0 | | | 0 | | | 19,670 | |
| Acquisition of Nephila | 0 | | | 0 | | | 0 | | | 0 | | | 0 | | | 23,392 | | | 23,392 | | | 0 | |
| Adjustment of redeemable noncontrolling interests | 0 | | | 0 | | | (4,828) | | | 0 | | | (4,828) | | | 0 | | | (4,828) | | | 4,828 | |
| Purchase of noncontrolling interest | 0 | | | (4,986) | | | 0 | | | 0 | | | (4,986) | | | 0 | | | (4,986) | | | (7,104) | |
| Other | 0 | | | (46) | | | (374) | | | 0 | | | (420) | | | (1) | | | (421) | | | (8,563) | |
| December 31, 2018 | 0 | | | 3,392,993 | | | 5,782,310 | | | (94,650) | | | 9,080,653 | | | 19,649 | | | 9,100,302 | | | 174,062 | |
| Net income (loss) | | | | | 1,790,466 | | | 0 | | | 1,790,466 | | | (7,820) | | | 1,782,646 | | | 16,816 | |
| Other comprehensive income (loss) | | | | | 0 | | | 303,422 | | | 303,422 | | | 0 | | | 303,422 | | | (21) | |
| Comprehensive Income (Loss) | | | | | | | | | 2,093,888 | | | (7,820) | | | 2,086,068 | | | 16,795 | |
| Repurchase of common stock | 0 | | | 0 | | | (116,307) | | | 0 | | | (116,307) | | | 0 | | | (116,307) | | | 0 | |
| Restricted stock awards expensed | 0 | | | 16,000 | | | 0 | | | 0 | | | 16,000 | | | 0 | | | 16,000 | | | 0 | |
| Adjustment to Nephila purchase price allocation | 0 | | | 0 | | | 0 | | | 0 | | | 0 | | | (8,250) | | | (8,250) | | | 0 | |
| Adjustment of redeemable noncontrolling interests | 0 | | | 0 | | | 1,105 | | | 0 | | | 1,105 | | | 0 | | | 1,105 | | | (1,105) | |
| Purchase of noncontrolling interest | 0 | | | (4,219) | | | 0 | | | 0 | | | (4,219) | | | 0 | | | (4,219) | | | (4,542) | |
| Other | 0 | | | 145 | | | (398) | | | 0 | | | (253) | | | 3,970 | | | 3,717 | | | (7,648) | |
| December 31, 2019 | 0 | | | 3,404,919 | | | 7,457,176 | | | 208,772 | | | 11,070,867 | | | 7,549 | | | 11,078,416 | | | 177,562 | |
| Cumulative effect of adoption of ASU No. 2016-13, net of taxes | | | | | (3,827) | | | 0 | | | (3,827) | | | 0 | | | (3,827) | | | 0 | |
| January 1, 2020 | 0 | | | 3,404,919 | | | 7,453,349 | | | 208,772 | | | 11,067,040 | | | 7,549 | | | 11,074,589 | | | 177,562 | |
| Net income | | | | | 816,030 | | | 0 | | | 816,030 | | | 3,226 | | | 819,256 | | | 12,511 | |
| Other comprehensive income | | | | | 0 | | | 375,604 | | | 375,604 | | | 0 | | | 375,604 | | | 18 | |
| Comprehensive Income | | | | | | | | | 1,191,634 | | | 3,226 | | | 1,194,860 | | | 12,529 | |
| Issuance of preferred stock | 591,891 | | | 0 | | | 0 | | | 0 | | | 591,891 | | | 0 | | | 591,891 | | | 0 | |
| Repurchase of common stock | 0 | | | 0 | | | (26,832) | | | 0 | | | (26,832) | | | 0 | | | (26,832) | | | 0 | |
| Preferred stock dividends | 0 | | | 0 | | | (18,400) | | | 0 | | | (18,400) | | | 0 | | | (18,400) | | | 0 | |
| Restricted stock awards expensed | 0 | | | 29,779 | | | 0 | | | 0 | | | 29,779 | | | 0 | | | 29,779 | | | 0 | |
| Acquisition of Lansing | 0 | | | 0 | | | 0 | | | 0 | | | 0 | | | 0 | | | 0 | | | 43,566 | |
| Adjustment of redeemable noncontrolling interests | 0 | | | 0 | | | (28,705) | | | 0 | | | (28,705) | | | 0 | | | (28,705) | | | 28,705 | |
| Purchase of noncontrolling interest | 0 | | | (6,131) | | | 0 | | | 0 | | | (6,131) | | | 0 | | | (6,131) | | | (7,029) | |
| Other | 0 | | | (227) | | | (260) | | | 0 | | | (487) | | | 4,117 | | | 3,630 | | | (9,691) | |
| December 31, 2020 | $ | 591,891 | | | $ | 3,428,340 | | | $ | 8,195,182 | | | $ | 584,376 | | | $ | 12,799,789 | | | $ | 14,892 | | | $ | 12,814,681 | | | $ | 245,642 | |
| | | | | | | | | | | | | | | | | |
| Years Ended December 31, |
| 2023 | | 2022 | | 2021 |
| (dollars in thousands, except per share data) |
| OPERATING REVENUES | | | | | |
| Earned premiums | $ | 8,295,479 | | | $ | 7,587,792 | | | $ | 6,503,029 | |
| Net investment income | 734,532 | | | 446,755 | | | 367,417 | |
| Net investment gains (losses) | 1,524,054 | | | (1,595,733) | | | 1,978,534 | |
| Products revenues | 2,545,053 | | | 2,427,096 | | | 1,712,120 | |
| Services and other revenues | 2,704,512 | | | 2,809,425 | | | 2,285,325 | |
| Total Operating Revenues | 15,803,630 | | | 11,675,335 | | | 12,846,425 | |
| OPERATING EXPENSES | | | | | |
| Losses and loss adjustment expenses | 5,322,009 | | | 4,445,589 | | | 3,581,205 | |
| Underwriting, acquisition and insurance expenses | 2,840,734 | | | 2,515,583 | | | 2,293,739 | |
| Products expenses | 2,220,676 | | | 2,241,736 | | | 1,544,506 | |
| Services and other expenses | 2,310,769 | | | 2,306,985 | | | 2,024,931 | |
| Amortization of intangible assets | 180,614 | | | 178,778 | | | 160,539 | |
| Impairment of goodwill | — | | | 80,000 | | | — | |
| Total Operating Expenses | 12,874,802 | | | 11,768,671 | | | 9,604,920 | |
| Operating Income (Loss) | 2,928,828 | | | (93,336) | | | 3,241,505 | |
| Interest expense | (185,077) | | | (196,062) | | | (183,579) | |
| Net foreign exchange gains (losses) | (90,045) | | | 137,832 | | | 71,902 | |
| | | | | |
| Income (Loss) Before Income Taxes | 2,653,706 | | | (151,566) | | | 3,129,828 | |
| Income tax (expense) benefit | (552,616) | | | 48,209 | | | (683,961) | |
| Net Income (Loss) | 2,101,090 | | | (103,357) | | | 2,445,867 | |
| Net income attributable to noncontrolling interests | (105,030) | | | (112,920) | | | (22,732) | |
| Net Income (Loss) to Shareholders | 1,996,060 | | | (216,277) | | | 2,423,135 | |
| Preferred stock dividends | (36,000) | | | (36,000) | | | (36,000) | |
| | | | | |
| Net Income (Loss) to Common Shareholders | $ | 1,960,060 | | | $ | (252,277) | | | $ | 2,387,135 | |
| | | | | |
| OTHER COMPREHENSIVE INCOME (LOSS) | | | | | |
| Change in net unrealized gains (losses) on available-for-sale investments, net of taxes: | | | | | |
| Net holding gains (losses) arising during the period | $ | 278,363 | | | $ | (1,199,736) | | | $ | (398,076) | |
| Reclassification adjustments for net gains (losses) included in net income (loss) | 28,540 | | | 44,906 | | | (6,623) | |
| Change in net unrealized gains (losses) on available-for-sale investments, net of taxes | 306,903 | | | (1,154,830) | | | (404,699) | |
| Change in discount rate for life and annuity benefits, net of taxes | (22,343) | | | 149,874 | | | 49,411 | |
| Change in foreign currency translation adjustments, net of taxes | 4,704 | | | (9,259) | | | (213) | |
| Change in net actuarial pension loss, net of taxes | 74 | | | 24,730 | | | 8,390 | |
| Total Other Comprehensive Income (Loss) | 289,338 | | | (989,485) | | | (347,111) | |
| Comprehensive Income (Loss) | 2,390,428 | | | (1,092,842) | | | 2,098,756 | |
| Comprehensive income attributable to noncontrolling interests | (105,084) | | | (112,937) | | | (22,730) | |
| Comprehensive Income (Loss) to Shareholders | $ | 2,285,344 | | | $ | (1,205,779) | | | $ | 2,076,026 | |
| | | | | |
| NET INCOME (LOSS) PER COMMON SHARE | | | | | |
| Basic | $ | 147.32 | | | $ | (23.72) | | | $ | 176.79 | |
| Diluted | $ | 146.98 | | | $ | (23.72) | | | $ | 176.38 | |
See accompanying notes to consolidated financial statements.
MARKEL CORPORATIONGROUP INC. AND SUBSIDIARIES
CONSOLIDATED STATEMENTS OF CASH FLOWSCHANGES IN EQUITY
| | | | | | | | | | | | | | | | | |
| Years Ended December 31, |
| 2020 | | 2019 | | 2018 |
| (dollars in thousands) |
| OPERATING ACTIVITIES | | | | | |
| Net income (loss) | $ | 831,767 | | | $ | 1,799,462 | | | $ | (130,353) | |
| Adjustments to reconcile net income (loss) to net cash provided by operating activities: | | | | | |
| Deferred income tax expense (benefit) | (2,733) | | | 323,385 | | | 2,729 | |
| Depreciation and amortization | 307,069 | | | 269,239 | | | 227,846 | |
| Net investment losses (gains) | (617,979) | | | (1,601,722) | | | 437,596 | |
| | | | | |
| Net foreign exchange losses (gains) | 95,853 | | | 2,265 | | | (106,598) | |
| Impairment of goodwill and intangible assets | 0 | | | 0 | | | 199,198 | |
| | | | | |
| Increase in receivables | (28,174) | | | (103,982) | | | (27,961) | |
| Increase in reinsurance recoverables | (549,654) | | | (209,971) | | | (434,809) | |
| Increase in deferred policy acquisition costs | (61,569) | | | (93,015) | | | (15,585) | |
| Increase in prepaid reinsurance premiums | (34,480) | | | (84,835) | | | (230,199) | |
| Increase in unpaid losses and loss adjustment expenses | 1,383,430 | | | 436,234 | | | 733,605 | |
| Decrease in life and annuity benefits | (44,651) | | | (52,159) | | | (50,541) | |
| Increase in unearned premiums | 354,679 | | | 438,951 | | | 293,078 | |
| Increase (decrease) in payables to insurance and reinsurance companies | 76,586 | | | 65,460 | | | (4,313) | |
| Increase (decrease) in income taxes payable | (70,277) | | | 36,938 | | | 53,730 | |
| | | | | |
| | | | | |
| Other | 97,720 | | | 47,870 | | | (54,566) | |
| Net Cash Provided By Operating Activities | 1,737,587 | | | 1,274,120 | | | 892,857 | |
| INVESTING ACTIVITIES | | | | | |
| Proceeds from sales of fixed maturity securities and equity securities | 1,580,288 | | | 353,918 | | | 419,199 | |
| Proceeds from maturities, calls and prepayments of fixed maturity securities | 642,135 | | | 772,336 | | | 551,808 | |
| Cost of fixed maturity securities and equity securities purchased | (1,322,218) | | | (955,970) | | | (1,545,913) | |
| Net change in short-term investments | (829,457) | | | (95,867) | | | 1,101,636 | |
| Cost of equity method investments | (5,066) | | | (257,663) | | | (8,864) | |
| Additions to property and equipment | (101,301) | | | (123,376) | | | (106,593) | |
| Acquisitions, net of cash acquired | (554,127) | | | (245,332) | | | (1,175,211) | |
| Other | 77,998 | | | 16,795 | | | (33,301) | |
| Net Cash Used By Investing Activities | (511,748) | | | (535,159) | | | (797,239) | |
| FINANCING ACTIVITIES | | | | | |
| Additions to senior long-term debt and other debt | 223,183 | | | 1,645,182 | | | 206,949 | |
| Repayment of senior long-term debt and other debt | (275,996) | | | (1,103,674) | | | (289,199) | |
| Premiums and fees related to early extinguishment of debt | 0 | | | (27,073) | | | 0 | |
| Repurchases of common stock | (26,832) | | | (116,307) | | | (54,007) | |
| Issuance of preferred stock, net | 591,891 | | | 0 | | | 0 | |
| Dividends paid on preferred stock | (18,400) | | | 0 | | | 0 | |
| | | | | |
| | | | | |
| | | | | |
| Other | (59,290) | | | (38,811) | | | (42,728) | |
| Net Cash Provided (Used) By Financing Activities | 434,556 | | | 359,317 | | | (178,985) | |
| Effect of foreign currency rate changes on cash, cash equivalents, restricted cash and restricted cash equivalents | 55,901 | | | 5,643 | | | (21,047) | |
| Increase (decrease) in cash, cash equivalents, restricted cash and restricted cash equivalents | 1,716,296 | | | 1,103,921 | | | (104,414) | |
| Cash, cash equivalents, restricted cash and restricted cash equivalents at beginning of year | 3,500,353 | | | 2,396,432 | | | 2,500,846 | |
| CASH, CASH EQUIVALENTS, RESTRICTED CASH AND RESTRICTED CASH EQUIVALENTS AT END OF YEAR | $ | 5,216,649 | | | $ | 3,500,353 | | | $ | 2,396,432 | |
| | | | | | | | | | | | | | | | | | | | | | | | | | | | | | | | | | | | | | | | | | | | | | | |
| (dollars in thousands) | Preferred Stock | | Common
Stock | | Retained
Earnings | | Accumulated
Other
Comprehensive
Income (Loss) | | Total
Shareholders'
Equity | | Noncontrolling
Interests | | Total Equity | | Redeemable Noncontrolling Interests |
| December 31, 2020 | $ | 591,891 | | | $ | 3,428,340 | | | $ | 8,217,484 | | | $ | 584,376 | | | $ | 12,822,091 | | | $ | 14,892 | | | $ | 12,836,983 | | | $ | 245,642 | |
| Cumulative effect of adoption of ASU No. 2018-12 | | | | | — | | | (15,259) | | | (15,259) | | | — | | | (15,259) | | | — | |
| January 1, 2021 | 591,891 | | | 3,428,340 | | | 8,217,484 | | | 569,117 | | | 12,806,832 | | | 14,892 | | | 12,821,724 | | | 245,642 | |
| Net income | | | | | 2,423,135 | | | — | | | 2,423,135 | | | 7,257 | | | 2,430,392 | | | 15,475 | |
| Other comprehensive loss | | | | | — | | | (347,109) | | | (347,109) | | | — | | | (347,109) | | | (2) | |
| Comprehensive Income | | | | | | | | | 2,076,026 | | | 7,257 | | | 2,083,283 | | | 15,473 | |
| Repurchase of common stock | — | | | — | | | (206,518) | | | — | | | (206,518) | | | — | | | (206,518) | | | — | |
| Preferred stock dividends | — | | | — | | | (36,000) | | | — | | | (36,000) | | | — | | | (36,000) | | | — | |
| Restricted stock awards expensed | — | | | 30,916 | | | — | | | — | | | 30,916 | | | — | | | 30,916 | | | — | |
| Acquisition of Buckner | — | | | — | | | — | | | — | | | — | | | — | | | — | | | 26,438 | |
| Acquisition of Metromont | — | | | — | | | — | | | — | | | — | | | — | | | — | | | 269,908 | |
| Adjustment of redeemable noncontrolling interests | — | | | — | | | 46,874 | | | — | | | 46,874 | | | — | | | 46,874 | | | (46,874) | |
| Purchase of noncontrolling interest | — | | | (18,779) | | | — | | | — | | | (18,779) | | | — | | | (18,779) | | | (38,214) | |
| Other | — | | | 602 | | | (81) | | | — | | | 521 | | | 711 | | | 1,232 | | | (10,995) | |
| December 31, 2021 | 591,891 | | | 3,441,079 | | | 10,444,894 | | | 222,008 | | | 14,699,872 | | | 22,860 | | | 14,722,732 | | | 461,378 | |
| Net income (loss) | | | | | (216,277) | | | — | | | (216,277) | | | 86,739 | | | (129,538) | | | 26,181 | |
| Other comprehensive income (loss) | | | | | — | | | (989,502) | | | (989,502) | | | — | | | (989,502) | | | 17 | |
| Comprehensive Income (Loss) | | | | | | | | | (1,205,779) | | | 86,739 | | | (1,119,040) | | | 26,198 | |
| Repurchase of common stock | — | | | — | | | (290,796) | | | — | | | (290,796) | | | — | | | (290,796) | | | — | |
| Preferred stock dividends | — | | | — | | | (36,000) | | | — | | | (36,000) | | | — | | | (36,000) | | | — | |
| Restricted stock awards expensed | — | | | 41,684 | | | — | | | — | | | 41,684 | | | — | | | 41,684 | | | — | |
| Adjustment of redeemable noncontrolling interests | — | | | — | | | (69,896) | | | — | | | (69,896) | | | — | | | (69,896) | | | 69,896 | |
| Adjustment to Metromont purchase price allocation | — | | | — | | | — | | | — | | | — | | | — | | | — | | | (22,485) | |
| Disposition of Velocity | — | | | — | | | — | | | — | | | — | | | (22,059) | | | (22,059) | | | — | |
| Disposition of Volante | — | | | — | | | — | | | — | | | — | | | (3,490) | | | (3,490) | | | — | |
| Redemption of Markel CATCo Re noncontrolling interests | — | | | — | | | | | — | | | — | | | (22,261) | | | (22,261) | | | — | |
| Other | — | | | 11,130 | | | 879 | | | — | | | 12,009 | | | 1,002 | | | 13,011 | | | (11,833) | |
| December 31, 2022 | 591,891 | | | 3,493,893 | | | 9,832,804 | | | (767,494) | | | 13,151,094 | | | 62,791 | | | 13,213,885 | | | 523,154 | |
| Net income | | | | | 1,996,060 | | | — | | | 1,996,060 | | | 72,136 | | | 2,068,196 | | | 32,894 | |
| Other comprehensive income | | | | | — | | | 289,284 | | | 289,284 | | | — | | | 289,284 | | | 54 | |
| Comprehensive Income | | | | | | | | | 2,285,344 | | | 72,136 | | | 2,357,480 | | | 32,948 | |
| Repurchase of common stock | — | | | — | | | (445,479) | | | — | | | (445,479) | | | — | | | (445,479) | | | — | |
| Preferred stock dividends | — | | | — | | | (36,000) | | | — | | | (36,000) | | | — | | | (36,000) | | | — | |
| Restricted stock awards expensed | — | | | 35,787 | | | — | | | — | | | 35,787 | | | — | | | 35,787 | | | — | |
| Adjustment of redeemable noncontrolling interests | — | | | — | | | 6,212 | | | — | | | 6,212 | | | — | | | 6,212 | | | (6,212) | |
| Purchase of noncontrolling interest | — | | | (12,144) | | | — | | | — | | | (12,144) | | | — | | | (12,144) | | | (51,227) | |
| Redemption of Markel CATCo Re noncontrolling interests | — | | | — | | | — | | | — | | | — | | | (62,646) | | | (62,646) | | | — | |
| Other | — | | | (390) | | | (496) | | | — | | | (886) | | | (1) | | | (887) | | | (28,978) | |
| December 31, 2023 | $ | 591,891 | | | $ | 3,517,146 | | | $ | 11,353,101 | | | $ | (478,210) | | | $ | 14,983,928 | | | $ | 72,280 | | | $ | 15,056,208 | | | $ | 469,685 | |
See accompanying notes to consolidated financial statements.
MARKEL CORPORATIONGROUP INC. AND SUBSIDIARIES
CONSOLIDATED STATEMENTS OF CASH FLOWS
| | | | | | | | | | | | | | | | | |
| Years Ended December 31, |
| 2023 | | 2022 | | 2021 |
| (dollars in thousands) |
| OPERATING ACTIVITIES | | | | | |
| Net income (loss) | $ | 2,101,090 | | | $ | (103,357) | | | $ | 2,445,867 | |
| Adjustments to reconcile net income (loss) to net cash provided by operating activities: | | | | | |
| Deferred income tax expense (benefit) | 233,798 | | | (282,325) | | | 453,408 | |
| Depreciation and amortization | 259,924 | | | 366,954 | | | 336,393 | |
| Net investment losses (gains) | (1,524,054) | | | 1,595,733 | | | (1,978,534) | |
| | | | | |
| Net foreign exchange losses (gains) | 90,045 | | | (137,832) | | | (71,902) | |
| Gain on sale of businesses, net | (18,965) | | | (225,832) | | | (22,085) | |
| Impairment of goodwill | — | | | 80,000 | | | — | |
| | | | | |
| Increase in receivables | (486,305) | | | (653,261) | | | (372,491) | |
| Increase in reinsurance recoverables | (767,509) | | | (1,168,483) | | | (1,312,258) | |
| Increase in deferred policy acquisition costs | (1,602) | | | (140,630) | | | (139,609) | |
| Increase in prepaid reinsurance premiums | (298,049) | | | (271,292) | | | (347,982) | |
| Increase in unpaid losses and loss adjustment expenses | 2,443,178 | | | 2,383,268 | | | 2,042,486 | |
| Decrease in life and annuity benefits | (48,327) | | | (44,693) | | | (52,226) | |
| Increase in unearned premiums | 400,017 | | | 886,393 | | | 970,246 | |
| Increase in payables to insurance and reinsurance companies | 365,378 | | | 210,810 | | | 131,559 | |
| | | | | |
| | | | | |
| | | | | |
| Other | 38,188 | | | 213,989 | | | 191,195 | |
| Net Cash Provided By Operating Activities | 2,786,807 | | | 2,709,442 | | | 2,274,067 | |
| INVESTING ACTIVITIES | | | | | |
| Proceeds from sales, maturities, calls and prepayments of fixed maturity securities | 2,126,586 | | | 1,152,335 | | | 708,111 | |
| Cost of fixed maturity securities purchased | (4,302,864) | | | (2,112,066) | | | (3,165,323) | |
| Proceeds from sales of equity securities | 298,582 | | | 242,010 | | | 200,570 | |
| Cost of equity securities purchased | (638,306) | | | (442,991) | | | (255,436) | |
| Net change in short-term investments | 202,930 | | | (846,019) | | | 228,955 | |
| Cost of equity method and other investments purchased | (192,715) | | | (20,051) | | | (48,922) | |
| Additions to property and equipment | (258,619) | | | (254,712) | | | (145,249) | |
| Acquisitions, net of cash acquired | (3,584) | | | (79,000) | | | (517,439) | |
| Consolidation of Markel CATCo Re, net | — | | | 629,955 | | | — | |
| Distributions to Markel CATCo Re noncontrolling interests for buy-out transaction | — | | | (169,380) | | | — | |
| Proceeds from sale of businesses, net | 41,302 | | | 201,370 | | | 40,720 | |
| Other | 23,081 | | | 28,345 | | | 16,211 | |
| Net Cash Used By Investing Activities | (2,703,607) | | | (1,670,204) | | | (2,937,802) | |
| FINANCING ACTIVITIES | | | | | |
| Additions to senior long-term debt and other debt | 624,972 | | | 1,034,052 | | | 1,198,505 | |
| Repayment of senior long-term debt and other debt | (949,636) | | | (1,255,005) | | | (486,730) | |
| | | | | |
| Repurchases of common stock | (445,479) | | | (290,796) | | | (206,518) | |
| | | | | |
| Dividends paid on preferred stock | (36,000) | | | (36,000) | | | (36,000) | |
| | | | | |
| Purchase of noncontrolling interests | (63,371) | | | (30) | | | (57,134) | |
| Redemption of Markel CATCo Re noncontrolling interests | (88,997) | | | — | | | — | |
| Other | (41,205) | | | (47,532) | | | (42,356) | |
| Net Cash Provided (Used) By Financing Activities | (999,716) | | | (595,311) | | | 369,767 | |
| Effect of foreign currency rate changes on cash, cash equivalents, restricted cash and restricted cash equivalents | 27,037 | | | (103,361) | | | (41,734) | |
| Increase (decrease) in cash, cash equivalents, restricted cash and restricted cash equivalents | (889,479) | | | 340,566 | | | (335,702) | |
| Cash, cash equivalents, restricted cash and restricted cash equivalents at beginning of year | 5,221,513 | | | 4,880,947 | | | 5,216,649 | |
| CASH, CASH EQUIVALENTS, RESTRICTED CASH AND RESTRICTED CASH EQUIVALENTS AT END OF YEAR | $ | 4,332,034 | | | $ | 5,221,513 | | | $ | 4,880,947 | |
See accompanying notes to consolidated financial statements.
MARKEL GROUP INC. AND SUBSIDIARIES
NOTES TO CONSOLIDATED FINANCIAL STATEMENTS
1. Summary of Significant Accounting Policies
Markel Group Inc., formerly Markel Corporation, is a diverse financial holding company servingcomprised of a varietydiverse group of niche markets. Markel Corporation's principal business marketscompanies and underwritesinvestments with specialty insurance products.at its core. Effective May 26, 2023, Markel Corporation changed its name to Markel Group Inc. (Markel Group). Through its wholly owned subsidiary, Markel Ventures, Inc. (Markel Ventures), Markel Corporation alsoGroup owns controlling interests in various businesses that operate outsidein a variety of the specialty insurance marketplace.industries. See note 2 for details regarding reportable segments.
a) Basis of Presentation. The accompanying consolidated financial statements have been prepared in accordance with United States (U.S.) generally accepted accounting principles (GAAP) and include the accounts of Markel CorporationGroup and its consolidated subsidiaries, as well as any variable interest entities (VIEs) that meet the requirements for consolidation (the Company). All significant intercompany balances and transactions have been eliminated in consolidation. The Company consolidates the results of its Markel Ventures subsidiaries on a one-month lag, with the exception of significant transactions or events that occur during the intervening period. Certain prior yearperiod amounts have been reclassified to conform to the current period presentation.
b) Use of Estimates. The preparation of financial statements in accordance with U.S. GAAP requires management to make estimates and assumptions that affect the reported amounts of assets, liabilities, revenues and expenses and the disclosure of contingent assets and liabilities. Management periodically reviews its estimates and assumptions. Quarterly reviews include evaluating the adequacy of reserves for unpaid losses and loss adjustment expenses life and annuity reinsurance benefit reserves and contingencies. Estimates and assumptions for goodwill and intangible assets are reviewed in conjunction with an acquisition, and goodwill and indefinite-lived intangible assets are reassessed at least annually for impairment. Actual results may differ materially from the estimates and assumptions used in preparing the consolidated financial statements.
c) Investments. Available-for-sale investments and equity securities are recorded at estimated fair value. Available-for-sale investments include fixed maturity securities and short-term investments. Fixed maturity securities include government and municipal bonds and mortgage-backed securities with original maturities of more than one year. Short-term investments are primarily comprised of treasury bills with original maturities of one year or less.
Realized investment gains or losses on available-for-sale investments are included in net income. Realized gains or losses from sales of available-for-sale investments are derived using the first-in, first-out method on the trade date. Unrealized gains and losses on available-for-sale investments, net of income taxes, are included in other comprehensive income. Unrealized gains and losses on equity securities, net of income taxes, are included in net income.
The Company completes a detailed analysis each quarter to assess declines in the fair value of its available-for-sale investments. Effective January 1, 2020, the Company adopted Financial Accounting Standards Board (FASB) Accounting Standards Update (ASU) No. 2016-13, Financial Instruments—Credit Losses (Topic 326): Measurement of Credit Losses on Financial Instruments, and related amendments, which created a new comprehensive credit losses standard, FASB Accounting Standards Codification (ASC) 326, Financial Instruments—Credit Losses. Upon adoption of ASC 326, anyAny credit-related impairment losses on the Company's available-for-sale investments are recorded as an allowance, subject to reversal, rather thanand recognized in net income. Realized and unrealized gains and losses on equity securities are included in net income as a reduction in amortized cost, as was required under the previous other-than-temporary impairment (OTTI) model. In accordance with the provisions of ASU No. 2016-13, prior periods have not been restated. See note 1(w) for further discussion of the impact of adopting this standard.net investment gains or losses.
Premiums and discounts are amortized or accreted over the lives of the related fixed maturity securities as an adjustment to the yield using the effective interest method. Dividend and interest income are recognized when earned. Accrued interest receivable is excluded from both the estimated fair value and the amortized cost basis of available-for-sale securities and included within other assets on the Company's consolidated balance sheets. Any uncollectible accrued interest receivable is written off in the period it is deemed uncollectible. Realized investment gains or losses on available-for-sale investments are included in net income. Realized gains or losses from sales of available-for-sale investments are derived using the first-in, first-out method on the trade date.
Investments accounted for under the equity method of accounting are recorded at cost within other assets on the consolidated balance sheets and subsequently increased or decreased by the Company's proportionate share of the net income or loss of the investee. The Company records its proportionate share of net income or loss of the investee in net investment income. The Company records its proportionate share of other comprehensive income or loss of the investee as a component of other comprehensive income. Dividends or other equity distributions in excess of the Company's cumulative equity in earnings of the investee are recorded as a reduction of the investment. The Company reviews equity method investments for impairment when events or circumstances indicate that a decline in the fair value of the investment below its carrying value is other-than-temporary.
See note 4 and note 5 for further details regarding the Company's investment portfolio.
d)Cash and Cash Equivalents. The Company considers all investments with original maturities of 90 days or less to be cash equivalents.equivalents, with the exception of treasury bills, which are classified as short-term investments. The carrying value of the Company's cash and cash equivalents approximates fair value.
e) Restricted Cash and Cash Equivalents. Cash and cash equivalents that are restricted as to withdrawal or use are recorded as restricted cash and cash equivalents. The carrying value of the Company's restricted cash and cash equivalents approximates fair value.
f) Receivables. Receivables include amounts receivable from agents, brokers and insureds, which represent premiums that are both currently due and amounts not yet due on insurance and reinsurance policies. Premiums for insurance policies are generally due at inception. Premiums for reinsurance policies generally become due over the period of coverage based on the policy terms. Changes in the estimate of reinsurance premiums written will result in an adjustment to premiums receivable in the period they are determined. Receivables also include amounts receivable from contracts with customers, which represent the Company's unconditional right to consideration for satisfying the performance obligations outlined in the contract.
The Company monitors credit risk associated with receivables, taking into consideration the fact that in certain instances in the Company's insurance operations credit risk may be reduced by the Company's right to offset loss obligations or unearned premiums against premiums receivable. An allowance is established for amounts deemed uncollectible and receivables arecredit losses expected to be incurred over the life of the receivable, which is recorded net of this allowance. Following the adoption of ASC 326, as described in note 1(w), beginning January 1, 2020 theThe allowance is established for expected credit losses to be recognized over the life of the receivable. Any allowance for credit losses is charged to net income in the period the receivable is recorded and revised in subsequent periods to reflect changes in the Company's estimate of expected credit losses. The allowanceSee note 7 for credit losses associated with the Company's receivables was $24.2 million and $18.7 million as of December 31, 2020 and 2019, respectively.further details regarding receivables.
g) Reinsurance Recoverables. Amounts recoverable from reinsurers are estimated in a manner consistent with the claim liability associated with the reinsured business. The Company evaluates the financial condition of its reinsurers and monitors concentration of credit risk to minimize its exposure to significant losses from individual reinsurers. To further reduce credit exposure on reinsurance recoverables, the Company has received collateral, including letters of credit and trust accounts, from certain reinsurers. CollateralCash collateral related to these reinsurance agreements is available, without restriction, when the Company pays losses covered by the reinsurance agreements. An allowance is established for amounts deemed uncollectible and reinsurance recoverables are recorded net of this allowance. Following the adoption of ASC 326, as described in note 1(w), beginning January 1, 2020 the allowance is established for expected credit losses expected to be recognizedincurred over the life of the reinsurance recoverable. Anyrecoverable, which is recorded net of this allowance. The allowance for credit losses is charged to net income in the period the recoverable is recorded and revised in subsequent periods to reflect changes in the Company's estimate of expected credit losses. TheAs of December 31, 2023 and 2022, the allowance for credit losses associated with the Company's reinsurance recoverables was $28.4 million and $26.8 million as of December 31, 2020 and 2019, respectively.not material to the consolidated financial statements.
h) Deferred Policy Acquisition Costs. Costs directly related to the acquisition of insurance premiums are deferred and amortized over the related policy period, generally one year. The Company only defers acquisition costs incurred that are directly related directly to the successful acquisition of new or renewal insurance contracts, including commissions to agents and brokers, salaries and benefits and premium taxes. Commissions received related to reinsurance premiums ceded are netted against broker commissions in determining acquisition costs eligible for deferral. To the extent that future policy revenues on existing policies are not adequate to cover related costs and expenses, deferred policy acquisition costs are charged to earnings. The Company does not consider anticipated investment income in determining whether a premium deficiency exists. See note 2(a) and (e)(g) for further details regarding policy acquisition costs.
i) Goodwill and Intangible Assets. Goodwill and intangible assets are recorded as a result of business acquisitions. Goodwill represents the excess of the amount paid to acquire a business over the net fair value of assets acquired and liabilities assumed at the date of acquisition. Indefinite-lived and other intangible assets are recorded at fair value as of the acquisition date. The determination of the fair value of certain assets acquired and liabilities assumed involves significant judgment and the use of valuation models and other estimates, which require assumptions that are inherently subjective. Goodwill and indefinite-lived intangible assets are tested for impairment at least annually. The Company completes an annual test during the fourth quarter of each year based upon the results of operations through September 30. Intangible assets with definite lives are amortized using the straight-line method over their estimated useful lives, generally five to 20 years, and are reviewed for impairment when events or circumstances indicate that their carrying value may not be recoverable. See note 68 for further details regarding goodwill and intangible assets.
j) Equity Method Investments. The Company holds certain investments that are required to be accounted for under the equity method, whereby they initially are recorded at cost within other assets on the consolidated balance sheets and subsequently increased or decreased by the Company's proportionate share of the net income or loss of the investee and other transactions impacting the investee's equity. The Company records its proportionate share of net income or loss of the investee in services and other revenues. The Company records its proportionate share of other comprehensive income or loss of the investee as a component of other comprehensive income. Dividends or other equity distributions in excess of the Company's cumulative equity in earnings of the investee are recorded as a reduction of the investment. The Company reviews equity method investments for impairment when events or circumstances indicate that a decline in the fair value of the investment below its carrying value is other-than-temporary. See note 6 for further details regarding the Company's equity method investments.
k) Property and Equipment. Property and equipment is maintained primarily by certain of the Company's Markel Ventures businesses and is stated at cost less accumulated depreciation. Depreciation of property and equipment is calculated using the
straight-line method over the estimated useful lives of the respective assets. Property and equipment, net of accumulated depreciation, was $632.0 million$1.3 billion and $588.6 million$1.2 billion as of December 31, 20202023 and 2019,2022, respectively, and is included in other assets on the Company's consolidated balance sheets.
k)l) Leases. The present value of future lease payments for the Company's leases with terms greater than 12 months is included on the consolidated balance sheets as lease liabilities and right-of-use lease assets.assets within other liabilities and other assets, respectively.
The Company's lease portfolio primarily consists of operating leases for real estate.estate and equipment. Total expected lease payments are based on the lease payments specified in the contract and the stated term, including any options to extend or terminate that the Company is reasonably certain to exercise. The Company accounts for lease components and any associated non-lease components within a contract as a single lease component, and therefore allocates all of the expected lease payments to the lease component.
The lease liability, which represents the Company's contractual obligation to make lease payments, is calculated based on the present value of expected lease payments over the remaining lease term, discounted using the Company's collateralized incremental borrowing rate at the lease commencement date. The lease liability is then adjusted for any prepaid rent, lease incentives received or capitalized initial direct costs to determine the lease asset, which represents the Company's right to use the underlying asset for the lease term. Lease liabilities and lease assets are included in other liabilities and other assets, respectively, on the Company's consolidated balance sheets.
Total lease costs are primarily comprised of rental expense for operating leases, which is recognized on a straight line basis over the lease term. Rental expense attributable to the Company's underwriting operations is included in underwriting, acquisition and insurance expenses and rental expense attributable to the Company's other operations is included in products expenses and services and other expenses in the consolidated statements of income and comprehensive income. See note 79 for further details regarding leases.
l)m) Inventories. Inventories are maintained at certain of the Company's Markel Ventures businesses and consist primarily of raw materials, work-in-process and finished goods. Inventories are generally valued usingbased on the nature of the inventory, including the first-in-first-out, methodstandard cost and specific identification methods, and stated at the lower of cost or net realizable value. Inventories were $412.6$617.2 million and $303.1$639.6 million as of December 31, 20202023 and 2019,2022, respectively, and are included in other assets on the Company's consolidated balance sheets.
m)n) Redeemable Noncontrolling Interests. The Company owns controlling interests in various companies through its Markel Ventures operations. In some cases, the Company has the option to acquire the remaining equity interests, and the remaining equity interests have the option to sell their interests to the Company, in the future. The redemption value of the remaining equity interests is generally based on the respective company's earnings in specified periods preceding the redemption date. The redeemable noncontrolling interests generally are redeemable in 2024 or become redeemable through 2025.between 2025 and 2030.
The Company recognizes changes in the redemption value that exceed the carrying value of redeemable noncontrolling interests to retained earnings as if the balance sheet date was also the redemption date. Changes in the redemption value also result in an adjustment to net income to common shareholders in the calculation of basic and diluted net income per common share. See note 1719 for further details regarding the calculation of basic and diluted net income per common share.
n)o) Income Taxes. The Company records deferred income taxes to reflect the net tax effect of temporary differences between the carrying amounts of assets and liabilities for financial reporting purposes and their tax bases. Deferred tax assets and liabilities are measured using enacted tax rates expected to apply to taxable income in years in which those temporary differences are expected to be recovered or settled. Deferred tax assets are reduced by a valuation allowance when management believes it is more likely than not that some, or all, of the deferred tax assets will not be realized. The Company recognizes the tax benefit from an uncertain tax position taken or expected to be taken in income tax returns only if it is more likely than not that the tax position will be sustained upon examination by tax authorities, based on the technical merits of the position. Tax positions that meet the more likely than not threshold are then measured using a probability weighted approach, whereby the largest amount of tax benefit that is greater than 50% likely of being realized upon ultimate settlement is recognized. The Company recognizes interest and penalties related to uncertain tax positions in income tax expense. See note 1315 for further details regarding income taxes.
o)p) Unpaid Losses and Loss Adjustment Expenses. Unpaid losses and loss adjustment expenses on the Company's property and casualty insurance business are based on evaluations of reported claims and estimates for losses and loss adjustment expenses incurred but not reported. Estimates for losses and loss adjustment expenses incurred but not reported are based on
reserve development studies, among other things. Recorded reserves are estimates, and the ultimate liability may be greater or less than the estimates. See note 911 for further details regarding unpaid losses and loss adjustment expenses.
p)q) Life and Annuity Benefits. The Company has a run-off block of life and annuity reinsurance contracts that subject the Company to mortality, longevity and morbidity risks. Effective January 1, 2023, the Company adopted Financial Accounting Standards Board (FASB) Accounting Standards Update (ASU) No. 2018-12, Financial Services—Insurance (Topic 944): Targeted Improvements to the Accounting for Long-Duration Contracts and restated all prior periods presented to reflect the new accounting standard. The assumptions used to determine policy benefit reserves are generally locked-in for the lifeprimary component of the contract unless an unlocking event occurs. To the extent existing policy reserves, together with the present value of future gross premiums and expected investment income earned thereon, are not adequate to cover the present value of future benefits, settlement and maintenance costs, the locked-in assumptions are revised to current best estimate assumptions and a charge to earningsCompany's liabilities for life and annuity benefits is recognizedthe present value of the liability for future policyholder benefits. The cash flow assumptions used to determine the policyholder benefit reserves are reviewed, and updated as necessary, at least annually. Interest accretion for the reserves is calculated using the discount rate locked-in at contract inception. Policy benefit reserves are remeasured each period using current discount rates, based on yields for upper-medium grade fixed maturity securities, with the impact of changes in the discount rate included in other comprehensive income, net of taxes. All other results attributable to the run-off of life and annuity reinsurance contracts are included in services and other revenues and services and other expenses in the consolidated statements of income and comprehensive income. Investment income earned on the investments that time.support the policy benefit reserves are included in net investment income. Because of the uncertainty in the assumptions and estimates used in establishingto estimate reserves for life and annuity benefit obligations and the long-term nature of these reinsurance contracts, the ultimate liability may be greater or less than the estimates. Results attributable to the run-off of life and annuity reinsurance business are included in services and other revenues and services and other expenses in the Company's consolidated statements of income and comprehensive income.estimated liability. See note 1113 for further details regarding life and annuity benefits.
q)r) Revenue Recognition.
Property and Casualty Premiums
Insurance premiums written are generally recorded at the inception of a policy and earned on a pro rata basis over the policy period, typically one year. The cost of reinsurance ceded is initially recorded as prepaid reinsurance premiums and is amortized over the reinsurance contract period in proportion to the amount of insurance protection provided. Premiums ceded are netted against premiums written. For multi-year contracts where insurance premiums are payable in annual installments, written premiums are recorded at the inception of the contract based on management's best estimate of total premiums to be received. For contracts where the cedent has the ability to unilaterally commute or cancel coverage within the term of the policy, written premiums are generally recorded on an annual basis or up to the contract cancellation point. The remaining premiums are estimated and included as written at each successive anniversary date within the multi-year term.
Assumed reinsurance premiums are recorded at the inception of each contract based upon contract terms and information received from cedents and brokers and are earned on a pro rata basis over the coverage period, or for multi-year contracts, in proportion with the underlying risk exposure to the extent there is variability in the exposure through the coverage period. Changes in reinsurance premium estimates are expected and may result in significant adjustments in any period. These estimates change over time as additional information regarding changes in underlying exposures is obtained. Any subsequent differences arising on such estimates are recorded as premiums written in the period they are determined and are earned on a pro rata basis over the coverage period.period, or immediately if the coverage period has ended. The Company uses the periodic method to account for assumed reinsurance from foreign reinsurers. The Company's foreign reinsurers provide sufficientas a result of the sufficiency of the information to record foreignprovided by the reinsurer, which is consistent with its accounting for assumed business in the same manner as the Company records assumed businessreinsurance from U.S. reinsurers.
Certain contracts that the Company writes provide for reinstatement of coverage. Reinstatement premiums are the premiums for the restoration of the insurance or reinsurance limit of a contract to its full amount after a loss occurrence by the insured or reinsured. The Company accrues for reinstatement premiums resulting from losses recorded. Such accruals are based upon contractual terms and management judgment is involved with respect to the amount of losses recorded. Changes in estimates of losses recorded on contracts with reinstatement premium features will result in changes in reinstatement premiums based on contractual terms. Reinstatement premiums are recognized as premiums written at the time losses are recorded and are generally earned on a pro rata basis over the remaining coverage period.
Other Revenues
Other revenues primarily relate to the Company's Markel Ventures, program services and other fronting and insurance-linked securities (ILS) and program services operations and consist of revenues from the sale of products and services. Revenues are recognized when, or as, control of the promised goods or services is transferred to the Company's customers, in an amount that reflects the consideration the Company expects to be entitled to in exchange for those goods or services. Contracts with customers generally have an original term of one year or less. For contracts with customers that have an original term greater than one year, the Company recognizes revenue at the amount for which it has a right to invoice for the products delivered or services
performed. Certain customers may receive volume rebates or credits for products and services, which are accounted for as variable consideration. The Company estimates these amounts based on the expected amount to be provided to the customer and reduces revenues recognized by a corresponding amount. The Company does not expect significant changes to its estimates of variable consideration over the term of the contracts.
Payment terms for products and services vary by the type of product or service offered and the location of the customer, and payment is typically received at or shortly after the point of sale. For certain products, the Company requires partial payment in the form of a deposit before the products are delivered to the customer, which is included in other liabilities on the Company's consolidated balance sheets.
Through its Markel Ventures operations, the Company has several different businesses that manufacture or produce a variety of products, including ornamental plants, precast concrete, equipment used in baking systems, over-the-road transportation equipment, portable dredges, residential homes and flooring for the trucking industry. Most of the Company's product revenues are recognized when the products are shipped to the customer or the products arrive at the agreed upon destination with the end customer. Certain of the Company's products revenues are recognized based on percentage of completion. Some of the Company's contracts include multiple performance obligations. For such arrangements, revenues are allocated to each performance obligation based on the relative standalone selling price, which is derived from amounts stated in the contract.
Through its Markel Ventures operations, the Company also has several different businesses that provide various types of services, including distribution of exterior building products, fire protection and life safety services and consulting services. Service revenues are generally recognized either at a point-in-time when services are provided or over the term of the contracts based on hours incurred or as services are provided.
The Company's Markel Ventures operations also include certain businesses that earn revenues through the leasing of equipment. The revenues from these leases are generally recognized on a straight-line basis over the term of the lease.
The Company's other revenues also include fronting fees, or ceding fees, received in exchange for providing access to the U.S. property and casualty insurance market, which are based on the gross premiums written on behalf of general agent and capacity provider clients. Ceding fees are earned in a manner consistent with the recognition of the gross premiums earned on the underlying insurance policies, generally on a pro rata basis over the terms of the underlying policies reinsured.
The Company's other revenues also include investment management fee income and managing general agent (MGA) commissions provided through our ILS operations.income. Investment management fee income is recognized over the period in which investment management services are provided and is calculated and recognized monthly, based on the net asset value of the accounts managed.managed for most of the funds and underlying gross premium volume for the remaining funds. For certain accounts, the Company is also entitled to participate, on a fixed-percentage basis, in any net income generated in excess of an agreed-upon threshold as established by the underlying investment management agreements. In general, net income is calculated at the end of each calendar year and incentive fees are payable annually. Incentive fee income is recognized at the conclusion of the contractual performance period, when the uncertainty related to performance has been resolved. MGA commissions are based on the direct written premiums of the insurance contracts placed. Commissions received for these services are generally recognized when the related policy is written.
Program services fees, or ceding fees, received in exchange for providing access to the U.S. property and casualty insurance market are based on the gross premiums written on behalf of general agent and capacity provider clients. Ceding fees are earned in a manner consistent with the recognition of the gross premiums earned on the underlying insurance policies, generally on a pro rata basis over the terms of the underlying policies reinsured.
See note 810 for further details regarding products, services and other revenues.
r)s) Program Services. In connection with its program services business, the Company enters into contractual agreements with both producing general agents and reinsurers, whereby the general agents and reinsurers are typically obligated to each other for payment of insurance amounts, including premiums, commissions and losses. To the extent these funds are not the obligation of the Company and are settled directly between the general agent and the reinsurer, no receivables or payables are recorded for these amounts. All obligations of the Company's insurance subsidiaries owed to or on behalf of their policyholders are recorded by the Company and, to the extent appropriate, offsetting reinsurance recoverables are recorded.
s)t) Foreign Currency Transactions. The U.S. Dollar is the Company's reporting currency and the primary functional currency of its foreign underwriting operations. The functional currencies of the Company's other foreign operations are the currencies of the primary economic environments in which the majority of their business is transacted.
Foreign currency transaction gains and losses are the result of exchange rate changes on transactions denominated in currencies other than the functional currency at each foreign entity. Monetary assets and liabilities are remeasured to the functional currency at current exchange rates, with resulting gains and losses included in net foreign exchange gains within net income. Non-monetary assets and liabilities are remeasured to the functional currency at historic exchange rates. Available-for-sale securities are recorded at fair value with resulting gains and losses, including the portion attributable to movements in
exchange rates, included in the change in net unrealized gains on available-for-sale investments, net of taxes within other comprehensive income. While we attemptthe Company attempts to naturally hedge ourits exposure to foreign currency fluctuations by matching assets and liabilities in the same currencies, there is a financial statement mismatch between the gains or losses recorded in net income related to insurance reserves denominated in non-functional currencies and the gains or losses recorded in other comprehensive income related to the available-for-sale securities held in non-functional currencies supporting the reserves.
Assets and liabilities of foreign operations denominated in a functional currency other than the U.S. Dollar are translated into the U.S. Dollar at current exchange rates, with resulting gains or losses included, net of taxes, in the change in foreign
currency translation adjustments within other comprehensive income. See note 18 for further details regarding the components of other comprehensive income.
t)u) Comprehensive Income. Comprehensive income represents all changes in equity that result from recognized transactions and other economic events during the period. Other comprehensive income refers to revenues, expenses, gains and losses that under U.S. GAAP are included in comprehensive income but excluded from net income, such as unrealized gains or losses on available-for-sale investments, changes in discount rate for life and annuity benefits, foreign currency translation adjustments and changes in net actuarial pension loss. See note 1820 for further details regarding other comprehensive income.
u)v) Net Income Per Common Share. Basic net income per common share is computed by dividing adjusted net income to shareholders by the weighted average number of common shares outstanding during the year. Diluted net income per common share is computed by dividing adjusted net income to shareholders by the weighted average number of common shares and dilutive potential common shares outstanding during the year. See note 1719 for further details regarding the calculation of basic and diluted net income per common share.
v)w) Variable Interest Entities. The Company determines whether it has relationships with entities defined as VIEs in accordance with ASCFASB Accounting Standards Codification (ASC) 810, Consolidation. Under this guidance, a VIE is consolidated by the variable interest holder that is determined to be the primary beneficiary.
An entity in which the Company holds a variable interest is a VIE if any of the following conditions exist: (a) the total equity investment at risk is not sufficient to permit the entity to finance its activities without additional subordinated financial support, (b) as a group, the holders of equity investment at risk lack either the direct or indirect ability through voting rights or similar rights to make decisions about an entity's activities that most significantly impact the entity's economic performance or the obligation to absorb the expected losses or right to receive the expected residual returns, or (c) the voting rights of some investors are disproportionate to their obligation to absorb the expected losses of the entity, their rights to receive the expected residual returns of the entity, or both and substantially all of the entity's activities either involve or are conducted on behalf of an investor with disproportionately few voting rights.
The primary beneficiary is defined as the variable interest holder that is determined to have the controlling financial interest as a result of having both (a) the power to direct the activities of a VIE that most significantly impact the economic performance of the VIE and (b) the obligation to absorb losses or right to receive benefits from the VIE that could potentially be significant to the VIE.
The Company determines whether an entity is a VIE at the inception of its variable interest in the entity and upon the occurrence of certain reconsideration events. The Company continually reassesses whether it is the primary beneficiary of VIEs in which it holds a variable interest. See note 1517 for further details regarding the Company's involvement with VIEs.
w)x) Recent Accounting Pronouncements.
Accounting Standards Adopted in 20202023
Effective January 1, 2020,2023, the Company adopted ASC 326, Financial Instruments—Credit Losses. ASU No. 2018-12 and several ASUs issued as amendments to ASU No. 2018-12. This new standard replacedrequires insurance companies with long duration contracts to: (1) review and, if there is a change, update the incurred loss modelassumptions used to measure impairment losses for financial assets measuredexpected cash flows at amortized cost withleast annually; (2) update the discount rate assumption at each reporting date; and (3) enhance certain qualitative and quantitative disclosures. ASU No. 2018-12 was applied using a current expected credit loss (CECL) model and also made changesmodified retrospective approach that required restatement of prior periods presented, including a cumulative adjustment recorded to the impairment model for available-for-sale investments. Under the CECL model, allowances are established for expected credit losses to be recognized over the life of financial assets. Application of the CECL model impacted certain of the Company's financial assets, including its reinsurance recoverables and receivables. The CECL model did not impact the Company's investment portfolio, which is measured at fair value. However, ASC 326 replaced the OTTI model with an impairment allowance model, subject to reversal, for available-for-sale investments. As a result of adopting ASC 326, the Company increased its allowances for credit losses related to its reinsurance recoverables and receivables by $3.8 million and $1.0 million, respectively, which was recorded through a cumulative-effect adjustment to retained earningsaccumulated other comprehensive income as of January 1, 2020 ($3.8 million,2021 (the transition date) as a result of updating the discount rate assumption. At the transition date, the adoption of ASU 2018-12 had no impact on retained earnings but resulted in a decrease to accumulated other comprehensive income, net of taxes). The Company continuestaxes, of $15.3 million, which was comprised of the following corresponding adjustments to apply the previous guidance to 2019life and prior periods.annuity benefits and deferred tax liabilities.
| | | | | |
| (dollars in thousands) | January 1, 2021 |
| Reverse reserve deficiency adjustment related to unrealized gains on underlying investment portfolio of available-for-sale securities | $ | 119,548 | |
| Apply updated discount rate to the liability for future policyholder benefits | (138,865) | |
| Increase in life and annuity benefits | (19,317) | |
| Decrease in deferred tax liability | 4,058 | |
| Decrease in accumulated other comprehensive income, net of taxes | $ | (15,259) | |
The impact of changes in the discount rate on the liability for future policyholder benefits following ASUsthe transition date are relevantincluded in other comprehensive income (loss) in the respective periods and, combined with the transition adjustment, resulted in the following cumulative changes to the Company's operationspreviously presented consolidated balance sheets.
| | | | | | | | | | | |
| December 31, |
| (dollars in thousands) | 2022 | | 2021 |
| Decrease (increase) in life and annuity benefits | $ | 113,396 | | | $ | (19,759) | |
| Decrease (increase) in deferred tax liability | (23,813) | | | 4,149 | |
| Increase (decrease) in accumulated other comprehensive income (loss), net of taxes | $ | 89,583 | | | $ | (15,610) | |
Changes in the discount rate on the liability for future policyholder benefits also resulted in an increase of $105.2 million and were adopted effective January 1, 2020. These ASUsa decrease of $0.4 million to the other comprehensive loss previously presented in 2022 and 2021, respectively, which was comprised of the following adjustments.
| | | | | | | | | | | |
| Years Ended December 31, |
| (dollars in thousands) | 2022 | | 2021 |
| Reverse benefit included in change in net unrealized gains (losses) on available-for-sale-investments, net of taxes, related to reversal of previously recognized reserve deficiency adjustment | $ | (44,682) | | | $ | (49,761) | |
| Change in discount rate for life and annuity benefits, net of taxes | 149,874 | | | 49,411 | |
| Increase (decrease) in other comprehensive loss, net of taxes | $ | 105,192 | | | $ | (350) | |
The adoption of other provisions of this ASU did not have a material impact on the Company's financial position, results of operations or cash flows:flows for any of the periods presented.
•
Effective January 1, 2023, the Company adopted ASU No. 2018-13,2021-08, Fair Value MeasurementBusiness Combinations (Topic 820)805): Disclosure Framework—Changes to the Disclosure RequirementsAccounting for Fair Value MeasurementContract Assets and Contract Liabilities from Contracts with Customer
•s. ASU No. 2018-15,2021-08 requires contract assets and liabilities accounted for under FASB ASC 606, Intangibles—Goodwill and Other—Internal-Use Software (Subtopic 350-40): Customer's Accounting for Implementation Costs Incurred in a Cloud Computing Arrangement That is a Service ContractRevenue from Contracts with Customers
•, to be recorded at the acquisition date as if the acquirer entered into those contracts itself on the contract inception dates, rather than at fair value. At adoption, ASU No. 2018-17, Consolidation (Topic 810): Targeted Improvements to Related Party Guidance2021-08 did not impact the Company's financial position, results of operations or cash flows, but prospectively, this ASU will impact amounts recorded by the Company for Variable Interest Entitiesassets acquired and liabilities assumed in conjunction with certain acquisitions.
Accounting Standards Not Yet Adopted
In August 2018,November 2023, the FASB issued ASU No. 2018-12,2023-07, Financial Services—InsuranceSegment Reporting (Topic 944)280): Targeted Improvements to the Accounting for Long-Duration ContractsReportable Segment Disclosures. The FASB subsequently issued several ASUsstandard requires public companies to, among other things: (1) disclose, on an annual and interim basis, significant segment expenses that are regularly provided to the chief operating decision maker and included within each reported measure of segment profit or loss; (2) disclose, on an annual and interim basis, an amount for other segment expenses that are not separately disclosed as amendmentssignificant segment expenses and a description of its composition; (3) provide all annual disclosures about a reportable segment's profit or loss and assets currently required by Topic 280 in interim periods; and (4) disclose the title and position of the chief operating decision maker and an explanation of how the chief operating decision maker uses the reported measures of segment profit or loss in assessing segment performance and deciding how to allocate resources. ASU No. 2018-12. The standard requires insurance entities with long duration contracts to: (1) review and, if there is a change, update the assumptions used to measure cash flows at least annually, as well as update the discount rate assumption at each reporting date; (2) measure all market risk benefits associated with deposit (or account balance) contracts at fair value; and (3) disclose liability rollforwards and information about significant inputs, judgments, assumptions and methods used in measurement, including changes thereto and the effect of those changes on measurement. ASU No. 2018-122023-07 becomes effective for the Company duringin the firstfourth quarter of 2023.2024 and will be applied using a retrospective approach that requires recasting of all prior periods presented. The standard will among other things,not impact the discount rate used in estimating reserves for the Company's life and annuity reinsurance portfolio, which is in runoff. Currently, the discount rate assumption is locked-in for the life of the contracts, unless there is a loss recognition event. The Company is currently evaluating ASU No. 2018-12 to determine the impact that adopting this standard will have on its consolidated financial statements.
The following ASUs are relevant to the Company's operations and are not yet effective. These ASUs are not expected to have a material impact on the Company's financial position, results of operations or cash flows:flows.
•
In December 2023, the FASB issued ASU No. 2019-12,2023-09, Income Taxes (Topic 740): Simplifying the AccountingImprovements to Income Tax Disclosures. The standard requires public companies, on an annual basis, to provide enhanced rate reconciliation disclosures, including disclosure of specific categories and additional information for Income Taxes
•reconciling items that meet a quantitative threshold. The standard also requires public companies to, among other things, disaggregate income taxes paid by federal, state and foreign taxes. ASU No. 2020-04, Reference Rate Reform (Topic 848): Facilitation2023-09 becomes effective for the Company in the first quarter of 2025. The standard will not impact the EffectsCompany's financial position, results of Reference Rate Reform on Financial Reportingoperations or cash flows.
2. Segment Reporting Disclosures
The Company has four reportable segments: Insurance, Reinsurance, Investing and Markel Ventures.
The chief operating decision maker reviews the Company's ongoing underwriting operations on a global basis in the following two segments: Insurance and Reinsurance. In determining how to allocate resources and assess the performance of itsthe Company's underwriting results, management considers many factors, including the nature of the insurance product sold, the type of account written and the type of customer served. The Insurance segment includes all direct business and facultative reinsurance placements written on a risk-bearing basis within the Company's underwriting operations. The Reinsurance segment includes all treaty reinsurance written on a risk-bearing basis within the Company's underwriting operations. All investing activities related to the Company's insurance operations are included in the Investing segment.
The chief operating decision maker reviews and assesses Markel Ventures' performance in the aggregate, as a single operating segment. The Markel Ventures segment primarily consists of controlling interests in a diverse portfolio of businesses that operate in various industries.
The Company's other insurance operations includeprimarily consist of the results of the Company's program services and other fronting business and insurance-linked securities operations and program services business, as well as the results of its legal and professional consulting services.operations. Other insurance operations also include results for lines of business discontinued prior to, or in conjunction with, acquisitions, including development on asbestos and environmental loss reserves and results attributable to the run-off of life and annuity reinsurance business, which are monitored separately from the Company's ongoing underwriting operations. For purposes of segment reporting, none of these other insurance operations are considered to be reportable segments.
The Company's chief operating decision maker reviews and assesses Markel Ventures' performance in the aggregate, as a single operating segment. The Markel Ventures segment primarily consists of controlling interests in a diverse portfolio of businesses that operate in various industries.
Segment profit for each of the Company's underwriting segments is measured by underwriting profit. The property and casualty insurance industry commonly defines underwriting profit as earned premiums net of losses and loss adjustment expenses and underwriting, acquisition and insurance expenses. Underwriting profit does not replace operating income or net income computed in accordance with U.S. GAAP as a measure of profitability. Underwriting profit or loss provides a basis for management to evaluate the Company's underwriting performance. Segment profit for the Company's underwriting segments may also include other revenues and expenses that are attributable to the Company's underwriting operations that are not captured in underwriting profit. Segment profit for the Investing segment is measured by income from the Company's investment portfolio, which is comprised of net investment income and net investment gains. Segment profit for the Investing segment also includes income from equity method investments, which is included within services and other revenues. Segment profit for the Markel Ventures segment is measured by operating income.
For management reporting purposes, the Company allocates assets to its underwriting operations and to its Investing and Markel Ventures segments and certain of its other operations, including its program services and other fronting and insurance-linked securities and program services
operations. Underwriting assets include assets attributed to the Company's Insurance and Reinsurance segments, discontinued underwriting lines of business, as well as assets that are not specifically allocated to the Company's other operations. Underwriting and investing assets are not allocated to the Company's underwriting segments sinceGenerally, the Company does not managemanages its underwriting assets by underwriting segment. The Companyin the aggregate and therefore does not allocate capital expenditures for long-lived assets to either of itsindividual underwriting segments for management reporting purposes.segments.
a) The following tables summarize the Company's segment disclosures.
| | Year Ended December 31, 2020 |
| Year Ended December 31, 2023 | | | Year Ended December 31, 2023 |
| (dollars in thousands) | (dollars in thousands) | Insurance | | Reinsurance | | Investing | | Markel Ventures (1) | | Other (2) | | Consolidated | (dollars in thousands) | Insurance | | Reinsurance | | Investing | | Markel Ventures | | Other (1) | | Consolidated |
| Gross premium volume | $ | 6,029,024 | | | $ | 1,130,923 | | | $ | 0 | | | $ | 0 | | | $ | 2,106,718 | | | $ | 9,266,665 | |
| Net written premiums | 4,977,662 | | | 960,123 | | | 0 | | | 0 | | | (5,547) | | | 5,932,238 | |
| | Earned premiums | Earned premiums | 4,688,448 | | | 929,348 | | | 0 | | | 0 | | | (5,591) | | | 5,612,205 | |
| Losses and loss adjustment expenses: | |
| Current accident year | (3,373,085) | | | (700,240) | | | 0 | | | 0 | | | 0 | | | (4,073,325) | |
| Prior accident years | 554,586 | | | 51,755 | | | 0 | | | 0 | | | 23 | | | 606,364 | |
| Amortization of policy acquisition costs | (988,668) | | | (240,493) | | | 0 | | | 0 | | | 0 | | | (1,229,161) | |
| Other operating expenses | (712,280) | | | (74,379) | | | 0 | | | 0 | | | (1,807) | | | (788,466) | |
| Underwriting profit (loss) | 169,001 | | | (34,009) | | | 0 | | | 0 | | | (7,375) | | | 127,617 | |
| Net investment income | Net investment income | 0 | | | 0 | | | 371,585 | | | 245 | | | 0 | | | 371,830 | |
| Net investment gains | Net investment gains | 0 | | | 0 | | | 617,979 | | | 0 | | | 0 | | | 617,979 | |
| Products revenues | Products revenues | 0 | | | 0 | | | 0 | | | 1,439,515 | | | 0 | | | 1,439,515 | |
| Services and other revenues | Services and other revenues | 0 | | | 0 | | | 0 | | | 1,355,199 | | | 338,338 | | | 1,693,537 | |
| Total operating revenues | |
| Losses and loss adjustment expenses: | |
| Current accident year | |
| Current accident year | |
| Current accident year | |
| Prior accident years | |
| Underwriting, acquisition and insurance expenses: | |
| Amortization of policy acquisition costs | |
| Amortization of policy acquisition costs | |
| Amortization of policy acquisition costs | |
| Other underwriting expenses | |
| Products expenses | Products expenses | 0 | | | 0 | | | 0 | | | (1,256,159) | | | 0 | | | (1,256,159) | |
| Services and other expenses | Services and other expenses | 0 | | | (41,461) | | | 0 | | | (1,232,150) | | | (287,509) | | | (1,561,120) | |
Amortization of intangible assets (3) | 0 | | | 0 | | | 0 | | | (52,572) | | | (106,743) | | | (159,315) | |
Amortization of intangible assets (2) | |
| | Segment profit (loss) | |
| Segment profit (loss) | |
| Segment profit (loss) | Segment profit (loss) | $ | 169,001 | | | $ | (75,470) | | | $ | 989,564 | | | $ | 254,078 | | | $ | (63,289) | | | $ | 1,273,884 | |
| Interest expense | Interest expense | | | | | | | | | | | (177,582) | |
| Net foreign exchange losses | Net foreign exchange losses | | (95,853) | |
| | Income before income taxes | Income before income taxes | | $ | 1,000,449 | |
U.S. GAAP combined ratio (4) | 96 | % | | 104 | % | | NM | (5) | 98 | % |
| Income before income taxes | |
| Income before income taxes | |
(1)Products expenses and services and other expenses for the Markel Ventures segment include depreciation expense of $60.3 million for the year ended December 31, 2020.
(2)Other represents the total profit (loss) attributable to the Company's operations that are not included in a reportable segment, as well as any amortization of intangible assets that is not allocated to a reportable segment. Amortization of intangible assets attributable to the Company's underwriting segments, was $41.9 million for the year ended December 31, 2020, however, the Company doeswhich is not allocate amortization of intangible assetsallocated between the Insurance and Reinsurance segments.
(3)(2) Segment profit for the Markel Ventures segment includes amortization of intangible assets attributable to Markel Ventures. Amortization of intangible assets is not allocatedattributable to the Company's Insurance and Reinsurance segments.
(4)The U.S. GAAP combined ratio is a measure of underwriting performance and representssegments, included in Other, was $37.1 million for the relationship of incurred losses, loss adjustment expenses and underwriting, acquisition and insurance expenses to earned premiums.
(5)NM - Ratio is not meaningfulyear ended December 31, 2023.
| | Year Ended December 31, 2019 |
| Year Ended December 31, 2022 | | | Year Ended December 31, 2022 |
| (dollars in thousands) | (dollars in thousands) | Insurance | | Reinsurance | | Investing | | Markel Ventures (1) | | Other (2) | | Consolidated | (dollars in thousands) | Insurance | | Reinsurance | | Investing | | Markel Ventures | | Other (1) | | Consolidated |
| Gross premium volume | $ | 5,320,253 | | | $ | 1,114,153 | | | $ | 0 | | | $ | 0 | | | $ | 2,345,565 | | | $ | 8,779,971 | |
| Net written premiums | 4,444,702 | | | 964,947 | | | 0 | | | 0 | | | 2,422 | | | 5,412,071 | |
| | Earned premiums | Earned premiums | 4,144,073 | | | 903,587 | | | 0 | | | 0 | | | 2,133 | | | 5,049,793 | |
| Net investment income | |
| Net investment losses | |
| Products revenues | |
| Services and other revenues | |
| Total operating revenues | |
| Losses and loss adjustment expenses: | Losses and loss adjustment expenses: | |
| Current accident year | Current accident year | (2,730,971) | | | (695,470) | | | 0 | | | 0 | | | 0 | | | (3,426,441) | |
| Current accident year | |
| Current accident year | |
| Prior accident years | Prior accident years | 462,124 | | | 64,768 | | | 0 | | | 0 | | | 8,359 | | | 535,251 | |
| Underwriting, acquisition and insurance expenses: | |
| Amortization of policy acquisition costs | Amortization of policy acquisition costs | (860,917) | | | (239,579) | | | 0 | | | 0 | | | 0 | | | (1,100,496) | |
| Other operating expenses | (704,531) | | | (73,305) | | | 0 | | | 0 | | | 239 | | | (777,597) | |
| Underwriting profit (loss) | 309,778 | | | (39,999) | | | 0 | | | 0 | | | 10,731 | | | 280,510 | |
| Net investment income | 0 | | | 0 | | | 451,152 | | | 736 | | | 0 | | | 451,888 | |
| Net investment gains | 0 | | | 0 | | | 1,601,722 | | | 0 | | | 0 | | | 1,601,722 | |
| Products revenues | 0 | | | 0 | | | 0 | | | 1,609,586 | | | 0 | | | 1,609,586 | |
| Services and other revenues | 0 | | | 0 | | | 0 | | | 444,698 | | | 368,504 | | | 813,202 | |
| Amortization of policy acquisition costs | |
| Amortization of policy acquisition costs | |
| Other underwriting expenses | |
| Products expenses | Products expenses | 0 | | | 0 | | | 0 | | | (1,455,245) | | | 0 | | | (1,455,245) | |
| Services and other expenses | Services and other expenses | 0 | | | 0 | | | 0 | | | (389,385) | | | (286,294) | | | (675,679) | |
Amortization of intangible assets (3) | 0 | | | 0 | | | 0 | | | (41,973) | | | (106,665) | | | (148,638) | |
| Amortization of intangible assets (2) | |
| Impairment of goodwill | |
| Segment profit (loss) | Segment profit (loss) | $ | 309,778 | | | $ | (39,999) | | | $ | 2,052,874 | | | $ | 168,417 | | | $ | (13,724) | | | $ | 2,477,346 | |
| Interest expense | Interest expense | | | | | | | | | | | (171,687) | |
| Net foreign exchange losses | | (2,265) | |
| Loss on early extinguishment of debt | | (17,586) | |
| Income before income taxes | | $ | 2,285,808 | |
U.S. GAAP combined ratio (4) | 93 | % | | 104 | % | | NM | (5) | 94 | % |
| Net foreign exchange gains | |
| | Loss before income taxes | |
| Loss before income taxes | |
| Loss before income taxes | |
(1)Products expenses and services and other expenses for the Markel Ventures segment include depreciation expense of $53.6 million for the year ended December 31, 2019.
(2)Other represents the total profit (loss) attributable to the Company's operations that are not included in a reportable segment, as well as any amortization of intangible assets that is not allocated to a reportable segment. Amortization of intangible assets attributable to the Company's underwriting segments, was $39.7 million for the year ended December 31, 2019, however, the Company doeswhich is not allocate amortization of intangible assetsallocated between the Insurance and Reinsurance segments.
(3)(2) Segment profit for the Markel Ventures segment includes amortization of intangible assets attributable to Markel Ventures. Amortization of intangible assets is not allocatedattributable to the Company's Insurance and Reinsurance segments.
(4)The U.S. GAAP combined ratio is a measure of underwriting performance and representssegments, included in Other, was $38.5 million for the relationship of incurred losses, loss adjustment expenses and underwriting, acquisition and insurance expenses to earned premiums.
(5)NM - Ratio is not meaningfulyear ended December 31, 2022.
| | Year Ended December 31, 2018 |
| Year Ended December 31, 2021 | | | Year Ended December 31, 2021 |
| (dollars in thousands) | (dollars in thousands) | Insurance | | Reinsurance | | Investing | | Markel Ventures (1) | | Other (2) | | Consolidated | (dollars in thousands) | Insurance | | Reinsurance | | Investing | | Markel Ventures | | Other (1) | | Consolidated |
| Gross premium volume | $ | 4,749,166 | | | $ | 1,050,870 | | | $ | 0 | | | $ | 0 | | | $ | 2,064,433 | | | $ | 7,864,469 | |
| Net written premiums | 3,904,773 | | | 882,285 | | | 0 | | | 0 | | | 520 | | | 4,787,578 | |
| | Earned premiums | Earned premiums | 3,783,939 | | | 928,574 | | | 0 | | | 0 | | | (453) | | | 4,712,060 | |
| Net investment income | |
| Net investment gains | |
| Products revenues | |
| Services and other revenues | |
| Total operating revenues | |
| Losses and loss adjustment expenses: | Losses and loss adjustment expenses: | |
| Current accident year | Current accident year | (2,596,057) | | | (775,642) | | | 0 | | | 0 | | | 0 | | | (3,371,699) | |
| Current accident year | |
| Current accident year | |
| Prior accident years | Prior accident years | 502,260 | | | 42,982 | | | 0 | | | 0 | | | 5,742 | | | 550,984 | |
| Underwriting, acquisition and insurance expenses: | |
| Amortization of policy acquisition costs | Amortization of policy acquisition costs | (770,183) | | | (239,120) | | | 0 | | | 0 | | | 0 | | | (1,009,303) | |
| Other operating expenses | (691,186) | | | (75,081) | | | 0 | | | 0 | | | (1,941) | | | (768,208) | |
| Underwriting profit (loss) | 228,773 | | | (118,287) | | | 0 | | | 0 | | | 3,348 | | | 113,834 | |
| Net investment income | 0 | | | 0 | | | 433,702 | | | 513 | | | 0 | | | 434,215 | |
| Net investment losses | 0 | | | 0 | | | (437,596) | | | 0 | | | 0 | | | (437,596) | |
| Products revenues | 0 | | | 0 | | | 0 | | | 1,497,523 | | | 0 | | | 1,497,523 | |
| Services and other revenues | 0 | | | 0 | | | 0 | | | 414,542 | | | 220,541 | | | 635,083 | |
| Amortization of policy acquisition costs | |
| Amortization of policy acquisition costs | |
| Other underwriting expenses | |
| Products expenses | Products expenses | 0 | | | 0 | | | 0 | | | (1,413,248) | | | 0 | | | (1,413,248) | |
| Services and other expenses | Services and other expenses | 0 | | | 0 | | | 0 | | | (366,739) | | | (108,185) | | | (474,924) | |
Amortization of intangible assets (3) | 0 | | | 0 | | | 0 | | | (40,208) | | | (75,722) | | | (115,930) | |
| Impairment of goodwill and intangible assets | 0 | | | 0 | | | 0 | | | (14,904) | | | (184,294) | | | (199,198) | |
Amortization of intangible assets (2) | |
| | Segment profit (loss) | |
| Segment profit (loss) | |
| Segment profit (loss) | Segment profit (loss) | $ | 228,773 | | | $ | (118,287) | | | $ | (3,894) | | | $ | 77,479 | | | $ | (144,312) | | | $ | 39,759 | |
| Interest expense | Interest expense | | | | | | | | | | | (154,212) | |
| Net foreign exchange gains | |
| | Net foreign exchange gains | | 106,598 | |
| Loss before income taxes | | $ | (7,855) | |
U.S. GAAP combined ratio (4) | 94 | % | | 113 | % | | NM | (5) | 98 | % |
| Income before income taxes | |
| Income before income taxes | |
| Income before income taxes | |
The Company does not manage products at this level of aggregation as it offers a diverse portfolio of products and manages these products in logical groupings within each underwriting segment.
4. Investments
Substantially all of the incurred losses and loss adjustment expenses in the Company's program services and other fronting operations whichwere ceded. These losses totaled $1.6$2.5 billion and $3.0 billion for the years ended December 31, 20202023 and 2019, were ceded.2022, respectively.
The following table summarizes the effect of reinsurance and retrocessional reinsurance on losses and loss adjustment expenses in the Company's underwriting operations.
The following table summarizes the Company's senior long-term debt and other debt.
The Company's 7.35% unsecured senior notes due August 15, 2034 are not redeemable. The Company's other unsecured senior notes are redeemable by the Company at any time, subject to payment of a make-whole premium to the noteholders. None of the Company's senior long-term debt is subject to any sinking fund requirements.
The estimated fair value of the Company's senior long-term debt and other debt was $4.4$3.4 billion and $3.9$3.5 billion at December 31, 20202023 and 2019,2022, respectively.
The following table summarizes the future principal payments due at maturity on senior long-term debt and other debt as of December 31, 2020.2023.
The following table presents the components of domestic and foreign deferred tax assets and liabilities.
The Company is subject to income tax in the U.S. and in foreign jurisdictions. The Internal Revenue Service is currently examining the Company's 2017 U.S. federal income tax return. The Company believes its income tax liabilities wereare adequate as of December 31, 2020,2023, however, these liabilities could be adjusted as a result of this examination. With few exceptions, including the 2017 U.S. federal income tax return, the Company is no longer subject to income tax examination by tax authorities for years ended before January 1, 2017.2020.
MCIM, a wholly-owned consolidated subsidiary of the Company, is an insurance-linked securities investment fund manager and reinsurance manager headquartered in Bermuda. Results attributable to MCIM are not included in a reportable segment.
The Company engages in certain related party transactions in the normal course of business at arm's length.
Within the Company's insurance-linked securities operations, the Company provides investment and insurance management services through MCIM and Nephila. See note 15 for details regarding operations conducted through MCIM.Nephila Holdings Ltd. (together with its subsidiaries, Nephila). Nephila serves as the investment manager to several Bermuda Ireland and U.S. based private funds (the Nephila Funds). To provide access for the Nephila Funds to a variety of insurance-linked securities in the insurance, reinsuranceproperty catastrophe, climate and weatherspecialty markets, Nephila also provides managing general agent services and acts as an insurance manager to certain Bermuda Class 3 and 3A reinsurance companies, and Lloyd’sLloyd's Syndicate 2357 (Syndicate 2357)and Lloyd's Syndicate 2358 (collectively, the Nephila Reinsurers). The CompanyNephila receives management fees for investment and insurance management services provided through its insurance-linked securities operations primarily based on the net asset value of the accounts managed, and, for certain funds, incentive fees based on their annual performance. Prior to the annual performancedisposition of the funds managed.Velocity in February 2022, Nephila also receives commissions fromprovided managing general agent services to the Nephila Reinsurers which are based on the direct written premiums of the insurance contracts placed.in exchange for commissions. For the years ended December 31, 2020, 20192023, 2022 and 2018,2021, total revenues from the Company's insurance-linked securities operations were $212.3 million, $225.6 million and $91.5 million, respectively, of which $177.8 million, $200.8 million and $90.6 million, respectively, were attributed to unconsolidated entities managed by Nephila were $97.5 million, $79.5 million and MCIM.$141.9 million, respectively.
The Company has also entered into other assumed and ceded reinsurance transactions with the Nephila Reinsurers in the normal course of business, which are not material to the Company's consolidated financial statements.
A "rating agency event" means that any nationally recognized statistical rating organization that publishes a rating for the Company amends, clarifies or changes the criteria it uses to assign equity credit to securities like the Series A preferred shares, which results in shortening the length of time that the Series A preferred shares are assigned a particular level of equity credit or in the lowering of the equity credit assigned to the preferred shares.
A "regulatory capital event" means that the Company becomes subject to capital adequacy supervision by a capital regulator and determines that, under such capital adequacy guidelines, the liquidation preference amount of the Series A preferred shares would not qualify as capital.
The following table summarizes statutory net income (loss) for the Company's insurance subsidiaries.
The laws of the domicile states of the Company's U.S. insurance subsidiaries govern the amount of dividends that may be paid to the Company.holding company. Generally, statutes in the domicile states of the Company's U.S. insurance subsidiaries require prior approval for payment of extraordinary, as opposed to ordinary, dividends. As of December 31, 2020,2023, the Company's U.S. insurance subsidiaries could pay up to $670.5$592.5 million to the holding company during the following 12 months under the ordinary dividend regulations.
In converting from U.S. statutory accounting principles to U.S. GAAP, typical adjustments include deferral of policy acquisition costs, differences in the calculation of deferred income taxes and the inclusion of net unrealized gains or losses relating to fixed maturity securities in shareholders' equity. The Company does not use any permitted statutory accounting practices that are different from prescribed statutory accounting practices which impact statutory capital and surplus.
The Company's U.K. insurance subsidiary, Markel International Insurance Company Limited (MIICL), and its Lloyd's of London (Lloyd's) managing agent, Markel Syndicate Management Limited (MSM), are authorized by the Prudential Regulation Authority (PRA) and regulated by both the PRA and the Financial Conduct Authority (FCA). The PRA oversees compliance with established periodic auditing and reporting requirements, minimum solvency margins and individual capital assessment requirements under the Solvency II Directive (Solvency II) and imposes dividend restrictions, while both the PRA and the FCA oversee compliance with risk assessment reviews and various other requirements. MIICL is required to give advance notice to the PRA for any transaction or proposed transaction with a connected or related person. MSM is required to satisfy the solvency requirements of Lloyd's. In addition, the Company's U.K. subsidiaries must comply with the United Kingdom Companies Act of 2006, which provides that dividends may only be paid out of profits available for that purpose. Earnings of the Company's U.K. insurance subsidiaries are available for distribution to the holding company to the extent not otherwise restricted.
The Company's Bermuda insurance subsidiary, Markel Bermuda Limited (MBL), is subject to enhanced capital requirements in addition to minimum solvency and liquidity requirements. The enhanced capital requirement is determined by reference to a risk-based capital model that determines a control threshold for statutory capital and surplus by taking into account the risk characteristics of different aspects of the insurer's business. At December 31, 2020,2023, MBL satisfied both the enhanced capital requirements and the minimum solvency and liquidity requirements.
Under the Bermuda Insurance Act, MBL is prohibited from paying or declaring dividends during a fiscal year if it is in breach of its enhanced capital requirement, solvency margin or minimum liquidity ratio or if the declaration or payment of the dividend would cause a breach of those requirements. If an insurer fails to meet its solvency margin or minimum liquidity ratio on the last day of any financial year, it is prohibited from declaring or paying any dividends during the next financial year without the approval of the Bermuda Monetary Authority (BMA). Further, MBL is prohibited from declaring or paying, in any financial year, dividends of more than 25% of its total statutory capital and surplus as set forth in its previous year's statutory balance sheet unless at least seven days before payment of those dividends it files with the BMA an affidavit stating that it will continue to meet its solvency margin and minimum liquidity ratio. MBL must obtain the BMA's prior approval for a reduction by 15% or more of the total statutory capital as set forth in its previous year's financial statements. In addition, as a long-term insurer, MBL may not declare or pay a dividend to any person other than a policyholder unless the value of the assets in its long-term business fund, as certified by MBL's approved actuary, exceeds the liabilities of its long-term business. The amount of the dividend cannot exceed the aggregate of that excess and any other funds legally available for the payment of the dividend. As of December 31, 2020,2023, MBL could pay up to $476.3$588.3 million to the holding company during the following 12 months without making any additional filings with the BMA.
The following parent company only condensed financial information reflects the financial position, results of operations and cash flows of Markel Corporation.Group Inc.
Item 9A. CONTROLS AND PROCEDURES
Management is responsible for establishing and maintaining adequate internal control over financial reporting, as defined in Rules 13a-15(f) and 15d-15(f) of the Exchange Act. Our internal control over financial reporting is a process designed to provide reasonable assurance regarding the reliability of financial reporting and the preparation of financial statements for external purposes in accordance with generally accepted accounting principles.
Management does not expect that its internal control over financial reporting will prevent all error and all fraud. A control system, no matter how well conceived and operated, can provide only reasonable, not absolute, assurance that the objectives of the control system are met. Internal control over financial reporting is a process that involves human diligence and compliance and is subject to lapses in judgment and breakdowns resulting from human failures. Because of the inherent limitations in all control systems, no evaluation of controls can provide absolute assurance that all control issues and instances of fraud, if any, have been detected. The design of any system of internal control over financial reporting also is based in part upon certain assumptions about the likelihood of future events, and there can be no assurance that any design will succeed in achieving its stated goals under all potential future conditions.
KPMG LLP, our independent registered public accounting firm, has issued an attestation report on the effectiveness of our internal control over financial reporting as of December 31, 2020,2023, which is included in Item 8 Financial Statements and Supplementary Data.herein.
There were no changes in our internal control over financial reporting during the fourth quarter of 20202023 that materially affected, or are reasonably likely to materially affect, our internal control over financial reporting.
Except for the information set forth under "Information About Our Executive Officers" in Part I, the information required by Part III (Items 10, 11 (excluding information required pursuant to Item 402(v) of Regulation S-K), 12, 13 and 14) will be incorporated by reference from the Company's Proxy Statement for its 20212024 Annual Meeting of Shareholders pursuant to instructions G(1) and G(3) of the General Instructions to Form 10-K.
Item 15. EXHIBITEXHIBITS AND FINANCIAL STATEMENT SCHEDULES
(a) 1. Financial Statements
Other schedules are omitted because they are not required, information therein is not applicable, or is reflected in the consolidated financial statements or notes to consolidated financial statements.
The registrant hereby agrees to furnish to the Securities and Exchange Commission, upon request, a copy of all other instruments defining the rights of holders of long-term debt of the registrant and its subsidiaries.
Pursuant to the requirements of Section 13 or 15(d) of the Securities Exchange Act of 1934, the registrant has duly caused this report to be signed on its behalf by the undersigned, thereunto duly authorized.
Pursuant to the requirements of the Securities Exchange Act of 1934, this report has been signed below by the following persons on behalf of the registrant and in the capacities and on the dates indicated.