UNITED STATES
SECURITIES AND EXCHANGE COMMISSION
WASHINGTON, D.C. 20549
FORM 10-K
|
|
☒x
| ANNUAL REPORT UNDER SECTION 13 OR 15(d) OF THE SECURITIES EXCHANGE ACT OF 1934 |
FOR THE FISCAL YEAR ENDED DECEMBER 31, 20182021
OR
|
|
o | TRANSITION REPORT PURSUANT TO SECTION 13 OR 15(d) OF THE SECURITIES EXCHANGE ACT OF 1934 |
For the transition period from ______________to______________________
COMMISSION FILE NUMBER 001-38229
FIDELITY D & D BANCORP, INC.
COMMONWEALTH OF PENNSYLVANIA I.R.S. EMPLOYER IDENTIFICATION NO: 23-3017653
BLAKELY AND DRINKER STREETS
DUNMORE, PENNSYLVANIA 18512
TELEPHONE NUMBER (570) 342-8281
SECURITIES REGISTERED UNDER SECTION 12(b) OF THE ACT:
Common Stock, without par value
|
|
|
|
|
Title of each class |
| Trading Symbol(s) |
| Name of each exchange on which registered |
Common Stock, without par value |
| FDBC |
| The NASDAQ Stock Market, LLC |
NAME OF EACH EXCHANGE ON WHICH REGISTERED:
The NASDAQ Stock Market LLC
SECURITIES REGISTERED UNDER SECTION 12(g) OF THE ACT:
Indicate by check mark if the registrant is a well-known seasoned issuer, as defined in Rule 405 of the Securities Act. Yes ☐o No ☒x
Indicate by check mark if the registrant is not required to file reports pursuant to Section 13 or Section 15(d) of the Act. Yes ☐o No ☒x
Indicate by check mark whether the registrant (1) has filed all reports required to be filed by Section 13 or 15(d) of the Securities Exchange Act of 1934 during the preceding 12 months (or for such shorter period that the registrant was required to file such reports), and (2) has been subject to such filing requirements for the past 90 days. Yes ☒x No ☐o
Indicate by check mark whether the registrant has submitted electronically every Interactive Data File required to be submitted pursuant to Rule 405 of Regulation S-T (§ 232.405 of this chapter) during the preceding 12 months (or for such shorter period that the registrant was required to submit such files). Yes☒Yes x No ☐o
Indicate by check mark if disclosure of delinquent filers pursuant to Item 405 of Regulation S-K is not contained herein, and will not be contained, to the best of the registrant’s knowledge, in definitive proxy or information statements incorporated by references in Part III of this Form 10-K or any amendment to this Form 10-K. ☒
Indicate by check mark whether the registrant is a large accelerated filer, an accelerated filer, a non-accelerated filer or a smaller reporting company. See definition of “large accelerated filer,” “accelerated filer,” “smaller reporting company” and “emerging growth company” in Rule 12b-2 of the Exchange Act.
|
|
|
|
|
|
Large accelerated filer ☐o | Non-accelerated filer ☐x | Accelerated filer ☒o |
| Smaller reporting company ☒x | Emerging growth company ☐o |
If an emerging growth company, indicate by check mark if the registrant has elected not to use the extended transition period for complying with any new or revised financial accounting standards provided pursuant to Section 13(a) of the Exchange Act. ☐o
Indicate by check mark whether the registrant has filed a report on the attestation to its management’s assessment of the effectiveness of its internal control over financial reporting under Section 404(b) of the Sarbanes-Oxley Act (15 U.S.C. 7262(b)) by the registered public accounting firm that prepared or issued its audit report. o
Indicate by check mark whether the registrant is a shell company (as defined in Rule 12b-2 of the Act). Yes ☐o No ☒x
The aggregate market value of the voting common stock held by non-affiliates of the registrant was $172.4$216.2 million as of June 30, 2018,2021, based on the closing price of $61.99.$54.10. The number of shares of common stock outstanding as of February 28, 2019,2022, was 3,780,975.5,659,018.
DOCUMENTS INCORPORATED BY REFERENCE
Portions of the Registrant’s definitive Proxy Statement to be used in connection with the 20192022 Annual Meeting of Shareholders are incorporated herein by reference in partial response to Part III.
Fidelity D & D Bancorp, Inc.
20182021 Annual Report on Form 10-K
Table of Contents
FIDELITY D & D BANCORP, INC.
PART I
Forward-Looking Statements
Certain of the matters discussed in this Annual Report on Form 10-K may constitute forward-looking statements for purposes of the Securities Act of 1933, as amended, and the Securities Exchange Act of 1934, as amended, and as such may involve known and unknown risks, uncertainties and other factors which may cause the actual results, performance or achievements of the Company to be materially different from future results, performance or achievements expressed or implied by such forward-looking statements. The words “expect,” “anticipate,” “intend,” “plan,” “believe,” “estimate,” and similar expressions are intended to identify such forward-looking statements.
The Company’s actual results may differ materially from the results anticipated in these forward-looking statements due to a variety of factors, including, without limitation:
| §
| | the effects of economic conditions on current customers, specifically the effect of the economy on loan customers’ ability to repay loans;
|
| §
| | the costs and effects of litigation and of unexpected or adverse outcomes in such litigation;
|
| §
| | the impact of new or changes in existing laws and regulations, including the Tax Cuts and Jobs Act and Dodd-Frank Wall Street Reform and Consumer Protection Act of 2010 and the regulations promulgated there under;
|
| §
| | impacts of the capital and liquidity requirements of the Basel III standards and other regulatory pronouncements, regulations and rules;
|
| §
| | governmental monetary and fiscal policies, as well as legislative and regulatory changes;
|
| §
| | effects of short- and long-term federal budget and tax negotiations and their effect on economic and business conditions;
|
| §
| | the effect of changes in accounting policies and practices, as may be adopted by the regulatory agencies, as well as the Financial Accounting Standards Board and other accounting standard setters;
|
| §
| | the risks of changes in interest rates on the level and composition of deposits, loan demand, and the values of loan collateral, securities and interest rate protection agreements, as well as interest rate risks;
|
| §
| | the effects of competition from other commercial banks, thrifts, mortgage banking firms, consumer finance companies, credit unions, securities brokerage firms, insurance companies, money market and other mutual funds and other financial institutions operating in our market area and elsewhere, including institutions operating locally, regionally, nationally and internationally, together with such competitors offering banking products and services by mail, telephone, computer and the internet;
|
| §
| | the interruption or breach in security of our information systems and other technological risks and attacks resulting in failures or disruptions in customer account management, general ledger processing and loan or deposit updates and potential impacts resulting therefrom including additional costs, reputational damage, regulatory penalties, and financial losses;
|
| §
| | acquisitions and integration of acquired businesses;
|
| §
| | the failure of assumptions underlying the establishment of reserves for loan losses and estimations of values of collateral and various financial assets and liabilities;
|
| §
| | volatilities in the securities markets;
|
| §
| | acts of war or terrorism;
|
| §
| | disruption of credit and equity markets; and
|
| §
| | the risk that our analyses of these risks and forces could be incorrect and/or that the strategies developed to address them could be unsuccessful.
|
the effects of economic conditions particularly with regard to the negative impact of severe, wide-ranging and continuing disruptions caused by the spread of Coronavirus Disease 2019 (COVID-19) and any other pandemic, epidemic or other health-related crisis and responses thereto on current customers and the operations of the Company, specifically the effect of the economy on loan customers’ ability to repay loans;
the costs and effects of litigation and of unexpected or adverse outcomes in such litigation;
the impact of new or changes in existing laws and regulations, including laws and regulations concerning taxes, banking, securities and insurance and their application with which the Company and its subsidiaries must comply;
impacts of the capital and liquidity requirements of the Basel III standards and other regulatory pronouncements, regulations and rules;
governmental monetary and fiscal policies, as well as legislative and regulatory changes;
effects of short- and long-term federal budget and tax negotiations and their effect on economic and business conditions;
the effect of changes in accounting policies and practices, as may be adopted by the regulatory agencies, as well as the Financial Accounting Standards Board and other accounting standard setters;
the risks of changes in interest rates on the level and composition of deposits, loan demand, and the values of loan collateral, securities and interest rate protection agreements, as well as interest rate risks;
the effects of competition from other commercial banks, thrifts, mortgage banking firms, consumer finance companies, credit unions, securities brokerage firms, insurance companies, money market and other mutual funds and other financial institutions operating in our market area and elsewhere, including institutions operating locally, regionally, nationally and internationally, together with such competitors offering banking products and services by mail, telephone, computer and the internet;
technological changes;
the interruption or breach in security of our information systems, continually evolving cybersecurity and other technological risks and attacks resulting in failures or disruptions in customer account management, general ledger processing and loan or deposit updates and potential impacts resulting therefrom including additional costs, reputational damage, regulatory penalties, and financial losses;
acquisitions and integration of acquired businesses;
the failure of assumptions underlying the establishment of reserves for loan losses and estimations of values of collateral and various financial assets and liabilities;
inflation, securities markets and monetary fluctuations and volatility;
the short-term and long-term effects of inflation, and rising costs to the Company, its customers and on the economy;
acts of war or terrorism;
disruption of credit and equity markets; and
the risk that our analyses of these risks and forces could be incorrect and/or that the strategies developed to address them could be unsuccessful.
The Company cautions readers not to place undue reliance on forward-looking statements, which reflect analyses only as of the date of this document. The Company has no obligation to update any forward-looking statements to reflect events or circumstances after the date of this document.
Readers should review the risk factors described in this document and other documents that we file or furnish, from time- to-time, with the Securities and Exchange Commission, including quarterly reports filed on Form 10-Q and any current reports filed or furnished on Form 8-K.
ITEM 1:
BUSINESS
Fidelity D & D Bancorp, Inc. (the Company) was incorporated in the Commonwealth of Pennsylvania, on August 10, 1999, and is a bank holding company, whose wholly-owned state chartered commercial bank subsidiary is The Fidelity Deposit and Discount Bank (the Bank) (collectively, the Company). The Company is headquartered at Blakely and Drinker Streets in Dunmore, Pennsylvania.
The Bank has offered a full range of traditional banking services since it commenced operations in 1903. The Bank has a personal and corporate trust department and also provides alternative financial and insurance products with asset management services. A full list of services provided by the Bank is detailed in the section entitled “Products and Services” contained
within the 20182021 Annual Report to Shareholders, incorporated by reference. The service area is comprised of the Borough of Dunmore and the surrounding communities within Lackawanna and Luzerne counties in Northeastern Pennsylvania and Northampton County in Eastern Pennsylvania. In 2018,2021, the Company had 6.12%12.95% of the Scranton-Wilkes-Barre metropolitan statistical area’sLackawanna County’s total deposit market share ranking 7th2nd in total deposits, 6.94% of Luzerne County’s total deposit market share ranking 6th in total deposits and 6.49% of Northampton County’s total deposit market share ranking 6th in total deposits. The
On July 1, 2021, the Company had 181 full-time equivalent employees on December 31, 2018,completed its acquisition of Landmark Bancorp, Inc. (“Landmark”) of Pittston, Pennsylvania. Landmark was the holding company of Landmark Community Bank (“Landmark Bank”) which includes exempt officers, exempt, non-exempt and part-time employees.operated 5 retail community banking offices in Northeastern Pennsylvania.
On May 1, 2020, the Company completed its acquisition of MNB Corporation (“MNB”) of Bangor, Pennsylvania. MNB was the holding company Merchants Bank of Bangor (“Merchants Bank”) which operated nine bank centers located in Northampton County, Pennsylvania.
The banking business is highly competitive, and the success and profitability of the Company depends principally on its ability to compete in its market area. Competition includes, among other sources: local community banks; savings banks; regional banks; national banks; credit unions; savings & loans; insurance companies; money market funds; mutual funds; small loan companies and other financial services companies. The Company has been able to compete effectively with other financial institutions by emphasizing customer service enhanced by local decision making. These efforts enable the Company to establish long-term customer relationships and build customer loyalty by providing products and services designed to address their specific needs.
The banking industry is affected by general economic conditions including the effects of inflation, recession, unemployment, real estate values, trends in national and global economies and other factors beyond the Company’s control. The Company’s success is dependent, to a significant degree, on economic conditions in Northeastern Pennsylvania, especially within Lackawanna and Luzerne counties and Eastern Pennsylvania, especially Northampton County which the Company defines as its primary market area.areas. An economic recession or a delayed economic recovery over a prolonged period of time in the Company’s market could cause an increase in the level of the Company’s non-performing assets and loan losses, and thereby cause operating losses, impairment of liquidity and erosion of capital. There are no concentrations of loans or customers that, if lost, would have a material adverse effect on the continued business of the Company. There is no material concentration within a single industry or a group of related industries that is vulnerable to the risk of a near-term severe impact.
The Company’s profitability is significantly affected by general economic and competitive conditions, changes in market interest rates, government policies and actions of regulatory authorities. The Company’s loan portfolio is comprised principally of residential real estate, consumer, commercial and commercial real estate loans. The properties underlying the Company’s mortgages are concentrated in Northeastern and Eastern Pennsylvania. Credit risk, which represents the possibility of the Company not recovering amounts due from its borrowers, is significantly related to local economic conditions in the areas where the properties are located as well as the Company’s underwriting standards. Economic conditions affect the market value of the underlying collateral as well as the levels of adequate cash flow and revenue generation from income-producing commercial properties.
During 2018,2021, the national economy continuedstarted to improverecover from the effects of the COVID-19 pandemic with the unemployment rate droppingfalling to 3.9% compared to 4.1%6.7% at the end of 2017.2020. The unemployment raterates in the Company’s local statistical market, Scranton-Wilkes-Barre, fellmarkets, Scranton-Wilkes-Barre-Hazleton and Allentown-Bethlehem-Easton, dropped to 4.8% and 4.0%, respectively, from 5.0%8.0% and 6.6%, respectively, at the end of 2017.2020. The local economy has been volatile in recent years and generally lags the national market trends. The Company’s credit function strives to mitigate the negative impact of economic conditions by maintaining strict underwriting principles for commercial and consumer lending and ensuring that home mortgage underwriting adheres to the standards of secondary market makers. In addition,As it has in the past, the Company strivescontinued to accelerate thepursue property foreclosure, process thereby lesseningwherever possible, to lessen the negative financial impact of foreclosed property ownership. However, during 2020 and 2021, the Company respected the foreclosure and eviction moratoriums for all loans similar to those outlined in the CARES Act for Federal National Mortgage Association (“FNMA”) and Federal Home Loan Mortgage Corporation (“FHLMC”) loans. Also, the pandemic forced the closure of courthouses which delayed the Company’s ability to affect foreclosures for those borrowers where CARES Act moratoriums would not reasonably apply. Refer to Item 1A, “Risk Factors” for material risks and uncertainties that management believes affect the Company.
Federal and state banking laws contain numerous provisions that affect various aspects of the business and operations of the Company and the Bank. The Company is subject to, among others, the regulations of the Securities and Exchange Commission (the SEC) and the Federal Reserve Board (the FRB) and the Bank is subject to, among others, the regulations of the Pennsylvania Department of Banking and Securities, the Federal Deposit Insurance Corporation (the FDIC) and the rules promulgated by the Consumer Financial Protection Bureau (the CFPB) but continues to be examined and supervised by federal banking regulators for consumer compliance purposes. Refer to Part II, Item 7 “Supervision and Regulation” for
descriptions of and references to applicable statutes and regulations which are not intended to be complete descriptions of these provisions or their effects on the Company or the Bank. They are summaries only and are qualified in their entirety by reference to such statutes and regulations. Applicable regulations relate to, among other things:
|
|
|
• operations | • consolidation | • disclosure |
• securities | • reserves | • community reinvestment |
• risk management | • dividends | • mergers |
• consumer compliance | • branches | |
• mergers
| • capital adequacy | |
The Bank is examined periodically by the Pennsylvania Department of Banking and Securities and the FDIC.
The Company’s website address is http://www.bankatfidelity.com. The Company makes available free of charge on or through this website the annual reports on Form 10-K, quarterly reports on Form 10-Q and current reports on Form 8-K and amendments to those reports as soon as reasonably practical after filing with the SEC. You may read and copyThis reference to the Company’s website shall not, under any materialscircumstances, be deemed to incorporate the information available at such Internet address into this Form 10-K or other SEC filings. The information available at the Company’s website is not part of this Form 10-K or any other report filed by the Company with the SEC at the SEC’s Public Reference Room at 100 F Street, NE, Washington, DC 20549. You may obtain information on the operation of the Public Reference Room by calling the SEC at 1-800-SEC-0330.SEC. The SEC also maintains an internet site that contains reports, proxy and information statements and other information about the Company at http://www.sec.gov.
The Company’s accounting policies and procedures are designed to comply with accounting principles generally accepted in the United States of America (GAAP). Refer to “Critical Accounting Policies,” which are incorporated by reference in Part II, Item 7.
Human Capital
Mission and Core Values
Mission: We are Fidelity Bank. We are passionate about success and committed to building strong relationships through exceptional experiences. We will be the Best Bank for our Bankers to work, our Clients to bank, our Shareholders to invest and for our Community to prosper. Our bankers are our first stakeholder by design as their actions, knowledge and focus on the client experience drive our success. We continuously invest in our bankers by offering a competitive compensation, a strong benefit package for themselves and their families, opportunity to invest in the Company through stock ownership, continuous learning, career development and programs to engage and enhance the work experience.
Fidelity Bankers have a voice in the Company and are called upon to provide opinions and ideas through dialogue programs, Service Quality Surveys and the annual Climate Survey. Collectively, they have assisted in the development of the Core Values:
Relationships
Integrity
Commitment
Passion
Innovation
Success
Culturally, the Fidelity Model Experience provides a strategic vision to build a performance based corporation. It guides all bankers on solidifying internal and external relationships and becoming the Trusted Financial Advisor for our clients.
Demographics
As of December 31, 2021, the Company employed 319 bankers within our network located in Northeast and Lehigh Valley, Pennsylvania. The Company employed 28 part-time bankers and 291 full-time bankers. Employment levels are aligned with the needs of the business.
Health and Wellness - Supporting Bankers during the COVID-19 Pandemic.
In response to the pandemic, the Company took substantial steps to protect and to provide for the safety of the workforce. An immediate shift was made to provide support bankers with the tools to work from home. Safety protocols were put into place in all offices – bankers on-site were required to wear masks, handwashing protocols were established, social distancing measures were implemented including instruction for all bankers and signage for client entry into offices. Enhanced cleaning protocols were implemented in accordance with CDC guidelines. Protective barriers were installed in all areas of client interaction. The Company continues these mitigating practices and modifies as needed.
The Company adhered to the guidelines of the Families First Coronavirus Response Act (FFCRA) ensuring bankers were paid while encountering the effects of COVID-19 isolations, quarantines and child care needs. Where applicable, bankers were compensated above the requirements of the Act for needed time off. Additionally, special compensation practices were put into place including a Front Line Heroes Bonus to reward retail branch bankers that face clients daily. Incentive payouts were enhanced because of the bankers’ inability to cultivate face-to-face branch sales opportunities and earn rewards. To
help promulgate the health and wellness of our bankers, special well-being programs and initiatives were instituted. Bankers are granted additional time off for COVID-19 vaccine administration.
Diversity and Inclusion
We are committed to promoting a diverse and inclusive workforce and value the strength it brings to our organization. Our hiring practices include outreach to organizations representing groups of color and ethnicity, veteran status, disabled persons and women. Recruitment sources are varied to reach a broad audience. Our practices have resulted in a continuously increased diverse representation and an enhanced ability to provide for the diverse needs of the communities we serve. The Affirmative Action Plan monitors our success in creating equal employment opportunities for our bankers and our applicants and guides us in hiring practices.
Training and Development
The investment into the continuous improvement of all of our bankers is evident in the bank’s commitment of training dollars and resources. Key Performance Indicators (KPIs), tracked quarterly, outline training goals bank-wide and training dollars spent. The Company has a devoted training team and all bankers are offered and encouraged to participate in continuous training initiatives. Innovative programs, including Fidelity Bank University, are offered to educate bankers at all levels.
The bank monitors other Human Capital KPIs tracking banker activities; KPIs include and are not limited to community service and participation goals, turnover, new hire retention and climate survey scores. Results are monitored against goals.
We believe the banker engagement is a tenet of our success. Our practice of giving each banker a voice, providing fair compensation and opportunity for stock ownership, recognizing exceptional service, providing a quality benefit and retirement package, promoting career development opportunities and delivering strong programs and processes creates a strong and engaged workforce. The programs assist in aligning the interests of the bankers with those of the shareholders and they provide further incentive to bankers to enhance the financial results of the Company.
ITEM 1A:RISK FACTORS
An investment in the Company’s common stock is subject to risks inherent to the Company’s business. The material risks and uncertainties that management believes affect the Company are described below. Before making an investment decision, you should carefully consider the risks and uncertainties described below together with all of the other information included or incorporated by reference in this report. The risks and uncertainties described below are not the only ones facing the Company. Additional risks and uncertainties that management is not aware of or focused on or that management currently deems immaterial may also impair the Company’s business operations. This report is qualified in its entirety by these risk factors.
If any of the following risks actually occur, the Company’s financial condition and results of operations could be materially and adversely affected. If this were to happen, the value of the Company’s common stock could decline significantly, and you could lose all or part of your investment.
Risks Related to the Company’s Business
The short-term and long-term effects of inflation and rising costs may adversely affect the Company’s financial performance.
Inflation, both in the short-term and/or in the long-term, may adversely affect the Company’s business in that it may increase our overall costs even if it does not adversely affect every aspect of our business evenly. The Company employs various strategies to manage its costs but there is no assurance that these strategies will be successful in containing costs as higher rates of inflation may result in increased costs for goods and services, including employee salaries and benefits, which may adversely affect the Company’s results of operation and financial performance. Inflation may also increase the cost of doing business for the Company’s borrowers thereby affecting the creditworthiness of current or prospective customers.
The Company’s business is subject to interest rate risk and variations in interest rates may negatively affect its financial performance.
Changes in the interest rate environment may reduce profits. The Company’s earnings and cash flows are largely dependent upon its net interest income. Net interest income is the difference between the interest earned on loans, securities and other interest-earning assets, and interest paid on deposits, borrowings and other interest-bearing liabilities. As prevailing interest rates change, net interest spreads are affected by the difference between the maturities and re-pricing characteristics of interest-earning assets and interest-bearing liabilities. In addition, loan volume and yields are affected by market interest rates on loans, and rising interest rates generally are associated with a lower volume of loan originations. An increase in the general level of interest rates may also adversely affect the ability of certain borrowers to pay the interest on and principal of their obligations. Accordingly, changes in levels of market interest rates could materially adversely affect the Company’s net interest spread, asset quality, loan origination volume and overall profitability.
The Company is subject to lending risk.
There are inherent risks associated with the Company’s lending activities. These risks include, among other things, the impact of changes in interest rates and changes in the economic conditions in the markets where the Company operates as
well as those across the Commonwealth of Pennsylvania and the United States. Increases in interest rates and/or weakening economic conditions could adversely impact the ability of borrowers to repay outstanding loans or the value of the collateral securing these loans. The Company is also subject to various laws and regulations that affect its lending activities. Failure to comply with applicable laws and regulations could subject the Company to regulatory enforcement action that could result in the assessment of significant civil money penalties against the Company.
Commercial, commercial real estate and real estate construction loans are generally viewed as having more risk of default than residential real estate loans or consumer loans. These types of loans are also typically larger than residential real estate loans and consumer loans. Because these loans generally have larger balances than residential real estate loans and consumer loans, the deterioration of one or a few of these loans could cause a significant increase in non-performing loans. An increase in non-performing loans could result in a net loss of earnings from these loans, an increase in the provision for possible loan losses and an increase in loan charge-offs, all of which could have a material adverse effect on the Company’s financial condition and results of operations.
The Company’s allowance for possible loan losses may be insufficient.
The Company maintains an allowance for possible loan losses, which is a reserve established through a provision for possible loan losses charged to expense, that represents management’s best estimate of probable losses that have been incurred within the existing portfolio of loans. The allowance, in the judgment of management, is necessary to reserve for estimated loan losses and risks inherent in the loan portfolio. The level of the allowance reflects management’s continuing evaluation of industry concentrations; specific credit risks; loan loss experience; current loan portfolio quality; present economic, political and regulatory conditions and unidentified losses inherent in the current loan portfolio. The determination of the appropriate level of the allowance for possible loan losses inherently involves a high degree of subjectivity and requires the Company to make significant estimates of current credit risks and future trends, all of which may undergo material changes. Changes in economic conditions affecting borrowers, new information regarding existing loans, identification of additional problem loans and other factors, both within and outside of the Company’s control, may require an increase in the allowance for possible loan losses. In addition, bank regulatory agencies periodically review the Company’s allowance for loan losses and may require an increase in the provision for possible loan losses or the recognition of further loan charge-offs, based on judgments different than those of management. In addition,Further, if charge-offs in future periods exceed the allowance for possible loan losses, the Company will need additional provisions to increase the allowance for possible loan losses. Any increases in the allowance for loan losses will result in a decrease in net income and capital and may have a material adverse effect on the
Company’s financial condition and results of operations.
The FASB has recently issued an accounting standard update that will result in a significant change in how we recognize credit losses and may have a material impact on our financial condition or results of operations.
In June 2016, the Financial Accounting Standards Board (“FASB”) issued an accounting standard update (“ASU”) entitled “Financial Instruments-Credit Losses (Topic 326), Measurement of Credit Losses on Financial Instruments,” which replaces the current “incurred loss” model for recognizing credit losses with an “expected loss” model referred to as the Current Expected Credit Loss (“CECL”) model. Under the CECL model, banks will be required to present certain financial assets carried at amortized cost, such as loans held for investment and held-to-maturity debt securities, at the net amount expected to be collected. The measurement of expected credit losses is to be based on information about past events, including historical experience, current conditions, and reasonable and supportable forecasts that affect the collectability of the reported amount. This measurement will take place at the time the financial asset is first added to the balance sheet and periodically thereafter. This differs significantly from the “incurred loss” model required under current generally accepted accounting principles (“GAAP”), which delays recognition until it is probable a loss has been incurred.
TheUntil recently, the new CECL standard willwas expected to become effective for the Company for the fiscal year beginningon January 1, 2020, and for interim periods thereafter.within that year. In November 2019, FASB agreed to delay implementation of the new CECL standard for certain companies, including those companies that qualify as a smaller reporting company under SEC rules, until January 1, 2023. The Company is currently evaluatingexpects to continue to qualify as a smaller reporting company, based upon the current SEC definition, and as a result will likely be able to defer implementation of the new CECL standard for a period of time. Nevertheless, the Company continues to evaluate the impact the CECL model will have on its accounting. There is a risk thatthe accounting for credit losses, but the Company mayexpects to recognize a one-time cumulative-effect adjustment to itsthe allowance for loan losses as of the beginning of the first reporting period in which the new standard is effective, consistent with regulatory expectations set forth in interagency guidance issued at the end of 2016. The Company cannot yet determine the magnitude of any such one-time cumulative adjustment or of the overall impact of the new standard on its business, financial condition, and results of operations. Accordingly, it is possible the new standard may require an increase in the allowance for credit losses for the estimated life of the financial asset, including an allowance for debt securities. The amount of the change in the allowance for credit losses, if any, resulting from the new guidance will be impacted by the portfolio composition and asset quality at the adoption date, as well as economic conditions and forecasts at the time of adoption. Moreover, the CECL model may create more volatility in the level of the allowance for loan losses. If the Company is required to materially increase the level of its allowance for loan losses for any reason, such increase could adversely affect its business, financial condition and results of operations.
If we conclude that the decline in value of any of our investment securities is other-than-temporary, we will be required to write down the credit-related portion of the impairment of that security through a charge to earnings.
We review our investment securities portfolio at each quarter-end reporting period to determine whether the fair value is below the current carrying value. When the fair value of any of our investment securities has declined below its carrying value, we are required to assess whether the decline is other-than-temporary. If we conclude that the decline is other-than-temporary, we will be required to write down the credit-related portion of the impairment of that security through a charge to earnings.
The Basel III capital requirements may require us to maintain higher levels of capital, which could reduce our profitability.
Basel III targets higher levels of base capital, certain capital buffers and a migration toward common equity as the key source of regulatory capital. Although the new capital requirements are phased in over the next decade and may change substantially before final implementation, Basel III signals a growing effort by domestic and international bank regulatory agencies to require financial institutions, including depository institutions, to maintain higher levels of capital. The direction of the Basel III implementation activities or other regulatory viewpoints could require additional capital to support our business risk profile prior to final implementation of the Basel III standards. If the Company and the Bank are required to maintain higher levels of capital, the Company and the Bank may have fewer opportunities to invest capital into interest-earning assets, which could limit the profitable business operations available to the Company and the Bank and adversely impact our financial condition and results of operations.
The Company may need or be compelled to raise additional capital in the future, but that capital may not be available when it is needed and on terms favorable to current shareholders.
Federal banking regulators require the Company and Bank to maintain adequate levels of capital to support their operations. These capital levels are determined and dictated by law, regulation and banking regulatory agencies. In addition, capital levels are also determined by the Company’s management and board of directors based on capital levels that they believe are necessary to support the Company’s business operations. The Company is evaluating its present and future capital requirements and needs, is developing a comprehensive capital plan and is analyzing capital raising alternatives, methods and options. Even if the Company succeeds in meeting the current regulatory capital requirements, the Company may need to raise additional capital in the near future to support possible loan losses during future periods or to meet future regulatory capital requirements.
Further, the Company’s regulators may require it to increase its capital levels. If the Company raises capital through the issuance of additional shares of its common stock or other securities, it may dilute the ownership interests of current investors and may dilute the per-share book value and earnings per share of its common stock. Furthermore, it may have an adverse impact on the Company’s stock price. New investors may also have rights, preferences and privileges senior to the Company’s current shareholders, which may adversely impact its current shareholders. The Company’s ability to raise
additional capital will depend on conditions in the capital markets at that time, which are outside its control, and on its financial performance. Accordingly, the Company cannot assure you of its ability to raise additional capital on terms and time frames acceptable to it or to raise additional capital at all. If the Company cannot raise additional capital in sufficient amounts when needed, its ability to comply with regulatory capital requirements could be materially impaired. Additionally, the inability to raise capital in sufficient amounts may adversely affect the Company’s operations, financial condition and results of operations.
The Company is subject to environmental liability risk associated with lending activities.
A significant portion of the Company’s loan portfolio is secured by real property. During the ordinary course of business, the Company may foreclose on and take title to properties securing certain loans. In doing so, there is a risk that hazardous or toxic substances could be found on these properties. If hazardous or toxic substances are found, the Company may be liable for remediation costs, as well as for personal injury and property damage. Environmental laws may require the Company to incur substantial expense and may materially reduce the affected property’s value or limit the Company’s ability to use or sell the affected property. In addition, future laws or more stringent interpretations or enforcement policies with respect to existing laws may increase the Company’s exposure to environmental liability. Although the Company has policies and procedures to perform an environmental review before initiating any foreclosure action on real property, these reviews may not be sufficient to detect all potential environmental hazards. The remediation costs and any other financial liabilities associated with an environmental hazard could have a material adverse effect on the Company’s financial condition and results of operations.
The Company’s profitability depends significantly on economic conditions in the Commonwealth of Pennsylvania and the local region in which it conducts business.
The Company’s success depends primarily on the general economic conditions of the Commonwealth of Pennsylvania and the specific local markets in which the Company operates. Unlike larger national or other regional banks that are more geographically diversified, the Company provides banking and financial services to customers primarily in Lackawanna and Luzerne Counties in Northeastern Pennsylvania and Northampton County in Eastern Pennsylvania. The local economic conditions in these areas have a significant impact on the demand for the Company’s products and services as well as the
ability of the Company’s customers to repay loans, the value of the collateral securing loans and the stability of the Company’s deposit funding sources. A significant decline in general economic conditions caused by inflation, recession, acts of terrorism, an outbreak of hostilities or other international or domestic occurrences, unemployment, changes in securities markets or other factors could impact these local economic conditions and, in turn, have a material adverse effect on the Company’s financial condition and results of operations.
There is no assurance that the Company will be able to successfully compete with others for business.
The Company competes for loans, deposits and investment dollars with numerous regional and national banks and other community banking institutions, as well as other kinds of financial institutions and enterprises, such as securities firms, insurance companies, savings associations, credit unions, mortgage brokers and private lenders. Many competitors have substantially greater resources than the Company does, and operate under less stringent regulatory environments. The differences in resources and regulations may make it more difficult for the Company to compete profitably, reduce the rates that it can earn on loans and on its investments, increase the rates it must offer on deposits and other funds, and adversely affect its overall financial condition and earnings.
The Company is subject to extensive government regulation and supervision.
The Company, primarily through the Bank, is subject to extensive federal and state regulation and supervision. Banking regulations are primarily intended to protect depositors’ funds, federal deposit insurance funds and the banking system as a whole, not shareholders. These regulations affect the Company’s lending practices, capital structure, investment practices, dividend policy and growth, among other things. Federal or commonwealth regulatory agencies continually review banking laws, regulations and policies for possible changes. Changes to statutes, regulations or regulatory policies, including changes in interpretation or implementation of statutes, regulations or policies, could affect the Company in substantial and unpredictable ways. Such changes could subject the Company to additional costs, limit the types of financial services and products the Company may offer and/or increase the ability of non-banks to offer competing financial services and products, among other things. Failure to comply with laws, regulations or policies could result in sanctions by regulatory agencies, civil money penalties and/or reputation damage, which could have a material adverse effect on the Company’s business, financial condition and results of operations. While the Company has policies and procedures designed to prevent any such violations, there can be no assurance that such violations will not occur.
The Company’s controls and procedures may fail or be circumvented.
Management regularly reviews and updates the Company’s internal controls, disclosure controls and procedures, and corporate governance policies and procedures. Any system of controls, however well designed and operated, is based in part on certain assumptions and can provide only reasonable, not absolute, assurances that the objectives of the system are met. Any failure or circumvention of the Company’s controls and procedures or failure to comply with regulations related to controls and procedures could have a material adverse effect on the Company’s business, results of operations and financial condition.
New lines of business or new products and services may subject the Company to additional risks.
From time-to-time, the Company may implement new lines of business or offer new products and services within existing lines of business. There are substantial risks and uncertainties associated with these efforts, particularly in instances where the markets are not fully developed. In developing and marketing new lines of business and/or new products and services the Company may invest significant time and resources. Initial timetables for the introduction and development of new lines of business and/or new products or services may not be achieved and price and profitability targets may not prove feasible. External factors, such as compliance with regulations, competitive alternatives, and shifting market preferences, may also impact the successful implementation of a new line of business or a new product or service. Furthermore, any new line of business and/or new product or service could have a significant impact on the effectiveness of the Company’s system of internal controls. Failure to successfully manage these risks in the development and implementation of new lines of business or new products or services could have a material adverse effect on the Company’s business, results of operations and financial condition.
The Company’s future acquisitions could dilute your ownership and may cause it to become more susceptible to adverse economic events.
The Company may use its common stock to acquire other companies or make investments in banks and other complementary businesses in the future. The Company may issue additional shares of common stock to pay for future acquisitions, which would dilute your ownership interest in the Company. Future business acquisitions could be material to the Company, and the degree of success achieved in acquiring and integrating these businesses into the Company could have a material effect on the value of the Company’s common stock. In addition, any acquisition could require it to use substantial cash or other liquid assets or to incur debt. In those events, it could become more susceptible to economic downturns and competitive pressures.
The Company may not be able to attract and retain skilled people.
The Company’s success depends, in large part, on its ability to attract and retain key people. Competition for the best people in most activities engaged in by the Company can be intense and the Company may not be able to hire people or to retain
them. The unexpected loss of services of one or more of the Company’s key personnel could have a material adverse impact on the Company’s business because of their skills, knowledge of the Company’s market, years of industry experience and the difficulty of promptly finding qualified replacement personnel.
The Company’s information systems may experience an interruption or breach in security.
The Company relies heavily on communications and information systems to conduct its business. Any failure, interruption or breach in security of these systems could result in failures or disruptions in the Company’s customer relationship management, general ledger, deposit, loan and other systems. The Company has policies and procedures designed to prevent or limit the effect of the failure, interruption or security breach of its information systems, however there can be no assurance that any such failures, interruptions or security breaches will not occur. The occurrence of any failures, interruptions or security breaches of the Company’s information systems could damage the Company’s reputation, result in a loss of customer business, subject the Company to additional regulatory scrutiny, or expose the Company to civil litigation and possible financial liability, any of which could have a material adverse effect on the Company’s financial condition and results of operations.
The Company continually encounters technological change.
The financial services industry is continually undergoing rapid technological change with frequent introductions of new technology-driven products and services. The effective use of technology increases efficiency and enables financial institutions to better serve customers and to reduce costs. The Company’s future success depends, in part, upon its ability to address the needs of its customers by using technology to provide products and services that will satisfy customer demands, as well as to create additional efficiencies in the Company’s operations. Many of the Company’s competitors have substantially greater resources to invest in technological improvements. The Company may not be able to effectively implement new technology-driven products and services or be successful in marketing these products and services to its customers. Failure to successfully keep pace with technological change affecting the financial services industry could have a material adverse impact on the Company’s business and, in turn, the Company’s financial condition and results of operations.
The operations of our business, including our interaction with customers, are increasingly done via electronic means, and this has increased our risks related to cyber security.
We are exposed to the risk of cyber-attacks in the normal course of business. In general, cyber incidents can result from deliberate attacks or unintentional events. We have observed an increased level of attention in the industry focused on cyber-attacks that include, but are not limited to, gaining unauthorized access to digital systems for purposes of misappropriating assets or sensitive information, corrupting data, or causing operational disruption. To combat against these attacks, policies and procedures are in place to prevent or limit the effect of the possible security breach of our information systems and we have insurance against some cyber-risks and attacks. While we have not incurred any material losses related to cyber-attacks, nor are we aware of any specific or threatened cyber-incidents as of the date of this report, we may incur substantial costs and suffer other negative consequences if we fall victim to successful cyber-attacks. Such negative consequences could include remediation costs that may include liability for stolen assets or information and repairing system damage that may have been
caused; deploying additional personnel and protection technologies, training employees, and engaging third party experts and consultants; lost revenues resulting from unauthorized use of proprietary information or the failure to retain or attract customers following an attack; litigation; and reputational damage adversely affecting customer or investor confidence.
The Company is subject to claims and litigation pertaining to fiduciary responsibility.
From time-to-time, customers make claims and take legal action pertaining to the Company’s performance of its fiduciary responsibilities. Whether customer claims and legal action related to the Company’s performance of its fiduciary responsibilities are founded or unfounded, if such claims and legal actions are not resolved in a manner favorable to the Company, they may result in significant financial liability and/or adversely affect the market perception of the Company and its products and services as well as impact customer demand for those products and services. Any financial liability or reputation damage could have a material adverse effect on the Company’s business, which, in turn, could have a material adverse effect on the Company’s financial condition and results of operations.
Pennsylvania Business Corporation Law and various anti-takeover provisions under our articles and bylaws could impede the takeover of the Company.
Various Pennsylvania laws affecting business corporations may have the effect of discouraging offers to acquire the Company, even if the acquisition would be advantageous to shareholders. In addition, we have various anti-takeover measures in place under our articles of incorporation and bylaws, including a supermajority vote requirement for mergers, a staggered board of directors, and the absence of cumulative voting. Any one or more of these measures may impede the takeover of the Company without the approval of our board of directors and may prevent our shareholders from taking part in a transaction in which they could realize a premium over the current market price of our common stock.
The Company is a holding company and relies on dividends from its banking subsidiary for substantially all of its revenue and its ability to make dividends, distributions, and other payments.
As a bank holding company, the Company’s ability to pay dividends depends primarily on its receipt of dividends from its subsidiary bank. Dividend payments from the bank are subject to legal and regulatory limitations, generally based on net profits and retained earnings, imposed by bank regulatory agencies. The ability of the bank to pay dividends is also subject to profitability, financial condition, regulatory capital requirements, capital expenditures and other cash flow requirements. There is no assurance that the bank will be able to pay dividends in the future or that the Company will generate cash flow to pay dividends in the future. The Company’s failure to pay dividends on its common stock may have a material adverse effect on the market price of its common stock.
The Company’s banking subsidiary may be required to pay higher FDIC insurance premiums or special assessments which may adversely affect its earnings.
The Company generally is unable to control the amount of premiums or special assessments that its subsidiary is required to pay for FDIC insurance. Any future changes in the calculation or assessment of FDIC insurance premiums may have a material adverse effect on our results of operations, financial condition, and our ability to continue to pay dividends on our common stock at the current rate or at all.
Severe weather, natural disasters, acts of war or terrorism, pandemics and other external events could significantly impact the Company’s business.
Severe weather, natural disasters, acts of war or terrorism, pandemics and other adverse external events could have a significant impact on the Company’s ability to conduct business. Such events could affect the stability of the Company’s deposit base, impair the ability of borrowers to repay outstanding loans, impair the value of collateral securing loans, cause significant property damage, result in loss of revenue and/or cause the Company to incur additional expenses. Severe weather or natural disasters, acts of war or terrorism, pandemics or other adverse external events may occur in the future. Although management has established disaster recovery policies and procedures, the occurrence of any such event could have a material adverse effect on the Company’s business, which, in turn, could have a material adverse effect on the Company’s financial condition and results of operations.
The increasing use of social media platforms presents new risks and challenges and our inability or failure to recognize, respond to and effectively manage the accelerated impact of social media could materially adversely impact our business.
There has been a marked increase in the use of social media platforms, including weblogs (blogs), social media websites, and other forms of Internet-based communications which allow individuals access to a broad audience of consumers and other interested persons. Social media practices in the banking industry are evolving, which creates uncertainty and risk of noncompliance with regulations applicable to our business. Consumers value readily available information concerning businesses and their goods and services and often act on such information without further investigation and without regard to its accuracy. Many social media platforms immediately publish the content their subscribers and participants post, often without filters or checks on accuracy of the content posted. Information posted on such platforms at any time may be adverse to our interests and/or may be inaccurate. The dissemination of information online could harm our business, prospects, financial condition, and results of operations, regardless of the information’s accuracy. The harm may be immediate without affording us an opportunity for redress or correction.
Other risks associated with the use of social media include improper disclosure of proprietary information, negative comments about our business, exposure of personally identifiable information, fraud, out-of-date information, and improper use by employees and customers. The inappropriate use of social media by our customers or employees could result in negative consequences including remediation costs including training for employees, additional regulatory scrutiny and possible regulatory penalties, litigation or negative publicity that could damage our reputation adversely affecting customer or investor confidence.
Federal income tax reform could have unforeseen effects on our financial condition and results of operations.
On December 22, 2017, the President of the United States signed into law H.R. 1, originally known as the “Tax Cuts and Jobs Act.” The Tax Cuts and Jobs Act includes a number of provisions, including the lowering of the U.S. corporate tax rate from 35 percent to 21 percent, effective January 1, 2018. There are also provisions that may partially offset the benefit of such rate reduction. Financial statement impacts include adjustments for, among other things, the re-measurement of deferred tax assets and liabilities. While there are benefits, there is also substantial uncertainty regarding the details of U.S. Tax Reform. The long-term intended and unintended consequences of Tax Cuts and Jobs Act on our business and on holders of our common shares is uncertain and could be adverse. The Company anticipates that the impact of Tax Cuts and Jobs Act may be material to our business, financial condition and results of operations.
Risks Associated with the Company’s Common Stock
The Company’s stock price can be volatile.
Stock price volatility may make it more difficult for you to resell your common stock when you want and at prices you find attractive. The Company’s stock price can fluctuate significantly in response to a variety of factors including, among other things:
Actual or anticipated variations in quarterly results of operations.
Recommendations by securities analysts.
Operating and stock price performance of other companies that investors deem comparable to the Company.
News reports relating to trends, concerns and other issues in the financial services industry.
Perceptions in the marketplace regarding the Company and/or its competitors.
New technology used, or services offered, by competitors.
Significant acquisitions or business combinations, strategic partnerships, joint ventures or capital commitments by or involving the Company or its competitors.
Failure to integrate acquisitions or realize anticipated benefits from acquisitions.
Changes in government regulations.
Geopolitical conditions such as acts or threats of terrorism or military conflicts.
General market fluctuations, industry factors and general economic and political conditions and events, such as economic slowdowns or recessions, interest rate changes or credit loss trends, could also cause the Company’s stock price to decrease regardless of operating results.
The trading volume in the Company’s common stock is less than that of other larger financial services companies.
The Company’s common stock is listed for trading on Nasdaq and the trading volume in its common stock is less than that of other larger financial services companies. A public trading market having the desired characteristics of depth, liquidity and orderliness depends on the presence in the marketplace of willing buyers and sellers of the Company’s common stock at any given time. This presence depends on the individual decisions of investors and general economic and market conditions over which the Company has no control. Given the lower trading volume of the Company’s common stock, significant sales of the Company’s common stock, or the expectation of these sales, could cause the Company’s stock price to fall.
Furthermore, from time to time, the Company’s common stock may be included in certain and various stock market indices. Inclusion in these indices may positively impact the price, trading volume, and liquidity of the Company’s common stock, in part, because index funds or other institutional investors often purchase securities that are in these indices. Conversely, if the Company’s market capitalization falls below the minimum necessary to be included in any of the indices at any annual reconstitution date, the opposite could occur. Further, the Company’s inclusion in indices may be weighted based on the size of its market capitalization, so even if the Company’s market capitalization remains above the amount required to be included on these indices, if its market capitalization is below the amount it was on the most recent reconstitution date, the Company’s common stock could be weighted at a lower level, holders attempting to track the composition of these indices will be required to sell the Company’s common stock to match the reweighting of the indices.
Risks Associated with the Company’s Industry
Future governmental regulation and legislation could limit the Company’s future growth.
The Company is a registered bank holding company, and its subsidiary bank is a depository institution whose deposits are insured by the FDIC. As a result, the Company is subject to various regulations and examinations by various regulatory authorities. In general, statutes establish the corporate governance and eligible business activities for the Company, certain acquisition and merger restrictions, limitations on inter-company transactions such as loans and dividends, capital adequacy requirements, requirements for anti-money laundering programs and other compliance matters, among other regulations. The Company is extensively regulated under federal and state banking laws and regulations that are intended primarily for the protection of depositors, federal deposit insurance funds and the banking system as a whole. Compliance with these statutes and regulations is important to the Company’s ability to engage in new activities and consummate additional acquisitions.
In addition, the Company is subject to changes in federal and state tax laws as well as changes in banking and credit regulations, accounting principles and governmental economic and monetary policies. The Company cannot predict whether any of these changes may adversely and materially affect it. Federal and state banking regulators also possess broad powers
to take supervisory actions as they deem appropriate. These supervisory actions may result in higher capital requirements, higher insurance
premiums and limitations on the Company’s activities that could have a material adverse effect on its business and profitability. While these statutes are generally designed to minimize potential loss to depositors and the FDIC insurance funds, they do not eliminate risk, and compliance with such statutes increases the Company’s expense, requires management’s attention and can be a disadvantage from a competitive standpoint with respect to non-regulated competitors.
The earnings of financial services companies are significantly affected by general business and economic conditions.
The Company’s operations and profitability are impacted by general business and economic conditions in the United States and abroad. These conditions include short-term and long-term interest rates, inflation, money supply, political issues, legislative and regulatory changes, fluctuations in both debt and equity capital markets, broad trends in industry and finance, and the strength of the U.S. economy and the local economies in which the Company operates, all of which are beyond the Company’s control. Deterioration in economic conditions could result in an increase in loan delinquencies and non-performing assets, decreases in loan collateral values and a decrease in demand for the Company’s products and services, among other things, any of which could have a material adverse impact on the Company’s financial condition and results of operations.
Financial services companies depend on the accuracy and completeness of information about customers and counterparties.
In deciding whether to extend credit or enter into other transactions, the Company may rely on information furnished by or on behalf of customers and counterparties, including financial statements, credit reports and other financial information. The Company may also rely on representations of those customers, counterparties or other third parties, such as independent auditors, as to the accuracy and completeness of that information. Reliance on inaccurate or misleading financial statements, credit reports or other financial information could have a material adverse impact on the Company’s business and, in turn, the Company’s financial condition and results of operations.
Consumers may decide not to use banks to complete their financial transactions.
Technology and other changes are allowing parties to complete financial transactions that historically have involved banks through alternative methods. For example, consumers can now maintain funds that would have historically been held as bank deposits in brokerage accounts or mutual funds. Consumers can also complete transactions such as paying bills and/or transferring funds directly without the assistance of banks. The process of eliminating banks as intermediaries, known as “disintermediation,” could result in the loss of fee income, as well as the loss of customer deposits and the related income generated from those deposits. The loss of these revenue streams and the lower cost deposits as a source of funds could have a material adverse effect on the Company’s financial condition and results of operations.
A protracted government shutdown or issues relating to debt and the deficit may adversely affect the Company.
Extended shutdowns of parts of the federal government could negatively impact the financial performance of certain customers and could impact customers’ future access to certain loan and guarantee programs. As a result, this could impact the Company’s business, financial condition and results of operations.
As a result of past difficulties of the federal government to reach agreement over federal debt and issues connected with the debt ceiling, certain rating agencies placed the United States government's long-term sovereign debt rating on their equivalent of negative watch and announced the possibility of a rating downgrade. The rating agencies, due to constraints related to the rating of the United States, also placed government-sponsored enterprises in which the Company invests and receives lines of credit on negative watch and a downgrade of the United States government's credit rating would trigger a similar downgrade in the credit rating of these government-sponsored enterprises. Furthermore, the credit rating of other entities, such as state and local governments, may also be downgraded should the United States government's credit rating be downgraded. The impact that a credit rating downgrade may have on the national and local economy could have an adverse effect on the Company’s financial condition and results of operations.
The regulatory environment for the financial services is being significantly impacted by financial regulatory reform initiatives in the United States and elsewhere, including Dodd-Frank and regulations promulgated to implement it.
Dodd-Frank, which was signed into law on July 21, 2010, comprehensively reforms the regulation of financial institutions, products and services. Dodd-Frank requires various federal regulatory agencies to implement numerous rules and regulations. Because the federal agencies are granted broad discretion in drafting these rules and regulations, many of the details and the impact of Dodd-Frank may not be known for many months or years.
While much of how the Dodd-Frank and other financial industry reforms will change our current business operations depends on the specific regulatory reforms and interpretations, many of which have yet to be released or finalized, it is clear that the reforms, both under Dodd-Frank and otherwise, will have a significant effect on our entire industry. Although Dodd-Frank and other reforms will affect a number of the areas in which we do business, it is not clear at this time the full extent of the adjustments that will be required and the extent to which we will be able to adjust our businesses in response to the requirements. Although it is difficult to predict the magnitude and extent of these effects at this stage, we believe compliance with Dodd-Frank and implementing its regulations and initiatives will negatively impact revenue and increase the cost of
doing business, both in terms of transition expenses and on an ongoing basis, and it may also limit our ability to pursue certain business opportunities.
Risks related to the merger of Landmark Bancorp, Inc. (Landmark) into the Company
The combined company will incur significant transaction and merger-related costs in connection with the merger.
The Company expects to incur costs associated with combining the operations of the two companies. The Company is formulating detailed integration plans to deliver planned synergies. Additional unanticipated costs may be incurred in the integration of the businesses of the Company and Landmark. Whether or not the merger is consummated, the Company will incur substantial expenses, such as legal, accounting, printing, contract termination fees, and financial advisory fees, in pursuing the merger. Although the Company expects that the elimination of duplicative costs, as well as the realization of other efficiencies related to the integration of the businesses, may offset incremental transaction and merger-related costs over time, the net benefit may not be achieved in the near term, or at all.
Some of the conditions to closing of the merger may result in delay or prevent completion of the merger, which may adversely affect the value of the Company’s and Landmark’s securities.
Completion of the merger is conditioned upon the receipt of certain governmental consents and approvals, including consents and approvals required by the Federal Reserve Board, the FDIC, and the Pennsylvania Department of Banking and Securities. Failure to obtain these consents would prevent consummation of the merger. Even if the approvals are obtained, the effort involved may delay consummation of the merger. Governmental authorities may also impose conditions in connection with the merger that may adversely affect the combined company’s operations after the merger. However, the Company is not required to take any action or agree to any condition or restriction in connection with obtaining any approvals that would reasonably be expected to have a material adverse effect on the Company or the combined company.
The merger may distract the Company’s management team from its other responsibilities.
The merger could cause the management of the Company to focus their time and energies on matters related to the merger that otherwise would be directed to its business and operations. Any such distraction on the part of management, if significant, could affect management’s ability to service existing business and develop new business and adversely affect the combined company’s business and earnings following the merger.
Post-merger integration and operations may fail to achieve expected results.
The success of the transaction depends heavily on a smooth post-merger integration and operations of the combined bank. Benefits of the transaction to shareholders may not be realized if the post-merger integration and operations are not well executed or well received by each bank’s historical customers.
The Company may fail to realize the cost savings it expects to achieve from the merger.
The success of the merger will depend, in part, on the Company’s ability to realize the estimated cost savings from combining the businesses of the Company and Landmark. While the Company believes that the cost savings estimates are achievable, it is possible that the potential cost savings could be more difficult to achieve than the Company anticipates. The Company’s cost savings estimates also depend on its ability to combine the businesses of the Company and Landmark in a manner that permits those cost savings to be realized. If the Company’s estimates are incorrect or it is unable to combine the two companies successfully, the anticipated cost savings may not be realized fully or at all or may take longer to realize than expected.
Combining the Company and Landmark may be more difficult, costly, or time-consuming than expected.
The Company and Landmark have operated, and, until the completion of the merger, will continue to operate, independently. Following the completion of the merger, the combination process could result in the loss of key employees, the disruption of the Company’s ongoing business, and inconsistencies in standards, controls, procedures and policies that adversely affect the Company’s ability to maintain relationships with clients and employees or achieve the anticipated benefits of the merger. As with any merger of financial institutions, there also may be disruptions that cause the Company to lose customers or cause customers to withdraw their deposits from the Company, or other unintended consequences that could have a material adverse effect on the Company’s results of operations or financial condition.
Risks related to the COVID-19 pandemic
The COVID-19 Pandemic Has Adversely Impacted Our Business And Financial Results, And The Ultimate Impact Will Depend On Future Developments, Which Are Highly Uncertain And Cannot Be Predicted, Including The Scope And Duration Of The Pandemic And Actions Taken By Governmental Authorities In Response To The Pandemic.
The COVID-19 pandemic has negatively impacted the global, national and local economies, disrupted global and national supply chains, lowered equity market valuations, created significant volatility and disruption in financial markets, and increased unemployment levels. In addition, the pandemic resulted in temporary closures of many businesses and the institution of social distancing and sheltering in place requirements in many states and communities and may result in the same or similar restrictions in the future. As a result, the demand for our products and services have been and may continue to be significantly impacted, which could adversely affect our revenue and results of operations. Furthermore, the pandemic could continue to result in the recognition of credit losses in our loan portfolios and increases in our allowance for credit losses, particularly if businesses remain required to operate at diminished capacities or are required to close again, the impact on the global, national and local economies worsen, or more customers draw on their lines of credit or seek additional loans to help finance their businesses. Similarly, because of changing economic and market conditions affecting issuers, we may be required to recognize further impairments on the securities we hold as well as reductions in other comprehensive income. Our business operations may also be disrupted if significant portions of our workforce are unable to work effectively, including because of illness, quarantines, government actions, or other restrictions in connection with the pandemic. The extent to which the COVID-19 pandemic impacts our business, results of operations, and financial condition, as well as our regulatory capital and liquidity ratios, will depend on future developments, which are highly uncertain and cannot be predicted, including the scope and duration of the pandemic and actions taken by governmental authorities and other third parties in response to the pandemic.
We continue to closely monitor the COVID-19 pandemic and related risks as they evolve. The magnitude, duration and likelihood of the current outbreak of COVID-19, further outbreaks of COVID-19, future actions taken by governmental authorities and/or other third parties in response to the COVID-19 pandemic, and its future direct and indirect effects on the global, national and local economy generally and our business and results of operation specifically are highly uncertain. The COVID-19 pandemic may cause prolonged global or national recessionary economic conditions or longer lasting effects on economic conditions than currently exist, which could have a material adverse effect on our business, results of operations and financial condition.
Due to the Company’s participation in the U.S. Small Business Administration ("SBA") Paycheck Protection Program ("PPP"), the Company is subject to additional risks of litigation from its clients or other parties regarding the processing of loans for the PPP and risks that the SBA may not fund some or all PPP loan guaranties.
On March 27, 2020, the Coronavirus Aid, Relief, and Economic Security Act ("CARES Act") was enacted, which included a $349 billion loan program administered through the SBA referred to as the PPP. Under the PPP, small businesses and other entities and individuals could apply for loans from existing SBA lenders and other approved regulated lenders. The Company participated as a lender in the PPP. Because of the short timeframe between the passing of the CARES Act and the opening of the PPP, there was some ambiguity in the laws, rules and guidance regarding the operation of the PPP along with the continually evolving nature of SBA the rules, interpretations and guidelines concerning this program, which exposes us to risks relating to noncompliance with the PPP. Since the launch of the PPP, several large banks have been subject to litigation regarding the process and procedures that such banks used in processing applications for the PPP. As such, we may be exposed to the risk of litigation, from both clients and non-clients that approached the Company regarding PPP loans, regarding its process and procedures used in processing applications for the PPP. If any such litigation is filed against the us and is not resolved in a manner favorable to us, it may result in significant financial liability or adversely affect our reputation. In addition, litigation can be costly, regardless of outcome. Any financial liability, litigation costs or reputational damage caused by PPP related litigation could have a material adverse impact on our business, financial condition and results of operations.
The Company also has credit risk on PPP loans if a determination is made by the SBA that there is a deficiency in the manner in which the loan was originated, underwritten, certified by the borrower, funded, or serviced by the Company, such as an issue with the eligibility of a borrower to receive a PPP loan, which may or may not be related to the ambiguity in the laws, rules and guidance regarding the operation of the PPP. In the event of a loss resulting from a default on a PPP loan and a determination by the SBA that there was a deficiency in the manner in which the PPP loan was originated, certified by the borrower, funded, or serviced by the Company, the SBA may deny its liability under the guaranty, reduce the amount of the guaranty, or, if it has already paid under the guaranty, seek recovery of any loss related to the deficiency from us.
ITEM 1B:UNRESOLVED STAFF COMMENTS
None
ITEM 2:PROPERTIES
As of December 31, 2018,2021, the Company and the Bank operated 1123 full-service banking offices, of which sixtwelve were owned and fiveeleven were leased. NoneThe Pittston branch property is subject to a lease with a company of which director, William J. Joyce, Sr., is a partner. With the exception of the Pittston branch, none of the lessors of the properties leased by the Company are affiliated with the Company and all of the properties are located in the Commonwealth of Pennsylvania. The Company is headquartered at its owner-occupied main branch located on the corner of Blakely and Drinker Streets in Dunmore, PA. Executive and administrative, commercial lending, trust and asset management services are located at the Main Branch. The Company also operates a financial center in downtown Scranton, PA. Executive, mortgage and consumer lending, finance, operations and a full-service call center are located in this building. The Company is actively searching for a corporate headquarters within the Scranton area. We believe each of our facilities is suitable and adequate to meet our current operational needs.
The following table provides informationCompany also operates a wealth management office in Minersville, PA under a short-term lease agreement.
Additionally, the Company has a limited production office in Pittston, PA that is currently leased for certain commercial lenders and credit department employees.
The Company currently owns a property in Wilkes-Barre, PA that will become a full service branch upon termination of an existing lease to a third party.
The Company acquired a leased building in Scranton from the merger with respectLandmark. The branch in the building was closed in September 2021 and the building is currently vacant. If the Company decides to terminate the principal properties from whichlease before the Bank conducts business:
| | | | | | | | | | |
Location
| | Owned / leased*
| | Type of use
| | Full service
| | Drive-thru
| | ATM
|
Drinker & Blakely Streets,
Dunmore, PA
| | Owned
| | Main Branch (1) (2)
| | x
| | x
| | x
|
| | | | | | | | | | |
111 Green Ridge St.,
Scranton, PA
| | Leased
| | Green Ridge Branch (2)
| | x
| | x
| | x
|
| | | | | | | | | | |
1311 Morgan Hwy.,
Clarks Summit, PA
| | Leased
| | Abington Branch
| | x
| | x
| | x
|
| | | | | | | | | | |
1232 Keystone Industrial Park Rd.,
Dunmore, PA
| | Owned
| | Keystone Industrial Park Branch
| | x
| | x
| | x
|
| | | | | | | | | | |
338 North Washington Ave., Scranton, PA
| | Owned
| | Financial Center Branch (3)
| | x
| | | | x
|
| | | | | | | | | | |
4010 Birney Ave.,
Moosic, PA
| | Owned
| | Moosic Branch
| | x
| | x
| | x
|
| | | | | | | | | | |
225 Kennedy Blvd.,
Pittston, PA
| | Leased
| | Pittston Branch
| | x
| | x
| | x
|
| | | | | | | | | | |
1598 Main St.,
Peckville, PA
| | Leased
| | Peckville Branch
| | x
| | x
| | x
|
| | | | | | | | | | |
247 Wyoming Ave.,
Kingston, PA
| | Owned
| | Kingston Branch
| | x
| | x
| | x
|
| | | | | | | | | | |
400 S. Main St.,
Scranton, PA
| | Owned
| | West Scranton Branch(2)
| | x
| | x
| | x
|
| | | | | | | | | | |
2363 Memorial Hwy.,
Dallas, PA 18612
| | Leased
| | Back Mountain Branch
| | x
| | x
| | |
*Allend of the owned properties are free of encumbrances. At the Green Ridge branch office, Back Mountain branch office and Pittston branch office,lease term in January 2030, a termination fee would be incurred.
On February 28, 2022, the Company leasesclosed its Martins Creek branch which will be consolidated with the land from an unrelated third party, however the buildings are the Company’s own capital improvement.
| (1)
| | Executive and administrative, commercial lending, trust and asset management services are located at the Main Branch.
|
| (2)
| | This office has two automated teller machines (ATMs).
|
| (3)
| | Executive, mortgage and consumer lending, finance, operations and a full-service call center are located in this building.
|
During 2018, the Bank entered into a lease for a new branch in Mountaintop, Pennsylvania and lease payments will commence in August 2019.Forks branch.
As of December 31, 2018, the Bank maintained five free standing 24-hour ATMs located at the following locations:
| ·
| | The Shoppes at Montage, 1035 Shoppes Blvd., Moosic, PA;
|
| ·
| | Mountain Plaza Shopping Mall, 307 Moosic St., Scranton, PA;
|
| ·
| | Antonio’s Pizza, 45 Luzerne St., West Pittston, PA;
|
| ·
| | 511 Scranton Carbondale Highway, Eynon, PA;
|
| ·
| | Back Mountain, 32 Dallas Shopping Ctr., Dallas, PA.
|
Foreclosed assets held-for-sale includes other real estate owned (ORE). The Company had sixfive ORE properties as of December 31, 2018,2021, which stemmed from sixfive unrelated borrowers. Upon possession, foreclosed properties are recorded on
the Company’s balance sheet at the lower of cost or fair value. For a further discussion of ORE properties, see “Foreclosed assets held-for-sale”, located in the comparison of financial condition section of managements’ discussion and analysis.
ITEM 3: LEGAL PROCEEDINGS
The nature of the Company’s business generates some litigation involving matters arising in the ordinary course of business. However, in the opinion of the Company after consulting with legal counsel, no legal proceedings are pending, which, if determined adversely to the Company or the Bank, would have a material effect on the Company’s undivided profits or financial condition or results of operations. No legal proceedings are pending other than ordinary routine litigation incidental to the business of the Company and the Bank. In addition, to management’s knowledge, no governmental authorities have initiated or contemplated any material legal actions against the Company or the Bank.
ITEM 4: MINE SAFETY DISCLOSURES
Not Applicable
PART II
ITEM 5:MARKET FOR REGISTRANT’S COMMON EQUITY, RELATED STOCKHOLDER MATTERS AND ISSUER PURCHASES OF EQUITY SECURITIES
The common stock of the Company is listed on Nasdaq and traded on The NASDAQ Global Market under the symbol “FDBC.” Shareholders requesting information about the Company’s common stock may contact:
Salvatore R. DeFrancesco, Jr., Treasurer
Fidelity D & D Bancorp, Inc.
Blakely and Drinker Streets
Dunmore, PA 18512
(570) 342-8281
The Company’s common stock began trading on the Nasdaq Global Market on October 6, 2017. Dividends are determined and declared by the Board of Directors of the Company. The Company expects to continue to pay cash dividends in the future; however, future dividends are dependent upon earnings, financial condition, capital strength and other factors of the Company. For a further discussion of regulatory capital requirements see Note 15, “Regulatory Matters,” contained within the notes to the consolidated financial statements, incorporated by reference in Part II, Item 8.
The Company offers a dividend reinvestment plan (DRP) for its shareholders. The DRP provides shareholders with a convenient and economical method of investing cash dividends payable on their common stock and the opportunity to make voluntary optional cash payments to purchase additional shares of the Company’s common stock. Participants pay no brokerage commissions or service charges when they acquire additional shares of common stock through the DRP. The administrator may purchase shares directly from the Company, in the open market, in negotiated transactions with third parties or using a combination of these methods.
The Company had approximately 1,3101,644 shareholders at December 31, 20182021 and 1,3241,680 shareholders as of February 28, 2019.2022. The number of shareholders is the actual number of individualdistinct shareholders of record. Each security depository is considered a single shareholder for purposes of determining the approximate number of shareholders.
Performance graph
The following graph and table compare the cumulative total shareholder return on the Company’s common stock against the cumulative total return of the NASDAQ Composite and SNL U.S.KBW NASDAQ Bank NASDAQ index (the SNLKBW NASDAQ index) for the period of five fiscal years commencing January 1, 2014,2017, and ending December 31, 2018. As of December 31, 2018, the SNL NASDAQ index consisted of 277 banks. A listing of the banks that comprise the SNL NASDAQ index can be found on the Company’s website at www.bankatfidelity.com and then on the bottom of the page clicking on, Investor Relations, Fidelity D & D Bancorp Stock, Stock Information, List of all companies in The SNL U.S. Bank NASDAQ index link at bottom of page.2021. The graph illustrates the cumulative investment return to shareholders, based on the assumption that a $100 investment was made on December 31, 2013,2016, in each of: the Company’s common stock, the NASDAQ Composite and the SNLKBW NASDAQ index. As of December 31, 2021, the KBW NASDAQ index consisted of 24 banks. A listing of the banks that comprise the KBW NASDAQ index can be found on the Company’s website at www.bankatfidelity.com and then on the bottom of the page clicking on, Investor Relations, Fidelity D & D Bancorp Stock, Stock Information, List of all companies in the KBW NASDAQ Bank index link at bottom of page. All cumulative total returns are computed assuming the reinvestment of dividends into the applicable securities. The shareholder return shown on the graph and table below is not necessarily indicative of future performance:
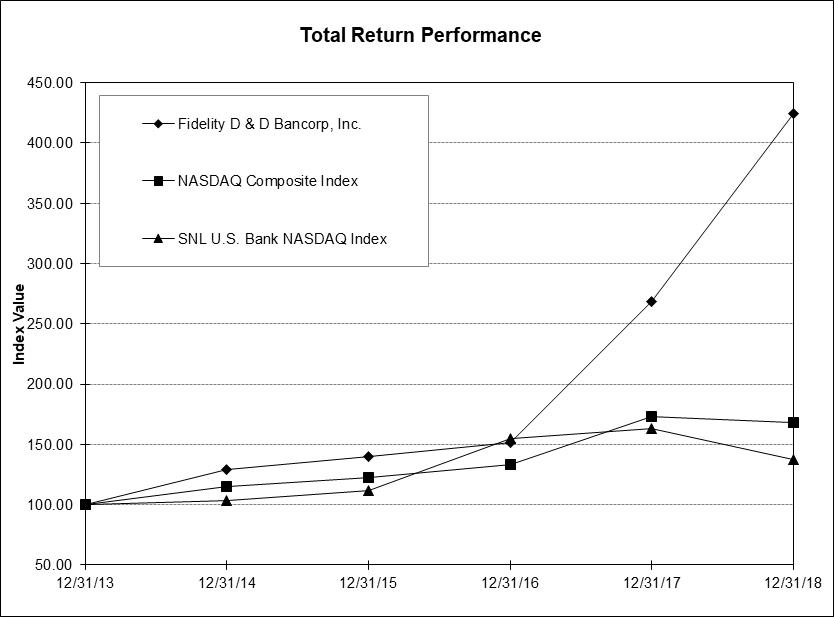
| | | | | | | |
| | Period Ending |
| Index | 12/31/13 | 12/31/14 | 12/31/15 | 12/31/16 | 12/31/17 | 12/31/18 |
| Fidelity D & D Bancorp, Inc. | 100.00 | 129.39 | 139.86 | 151.91 | 268.14 | 424.39 |
| NASDAQ Composite Index | 100.00 | 114.75 | 122.74 | 133.62 | 173.22 | 168.30 |
| SNL U.S. Bank NASDAQ Index | 100.00 | 103.57 | 111.80 | 155.02 | 163.20 | 137.56 |
| | | | | | | |
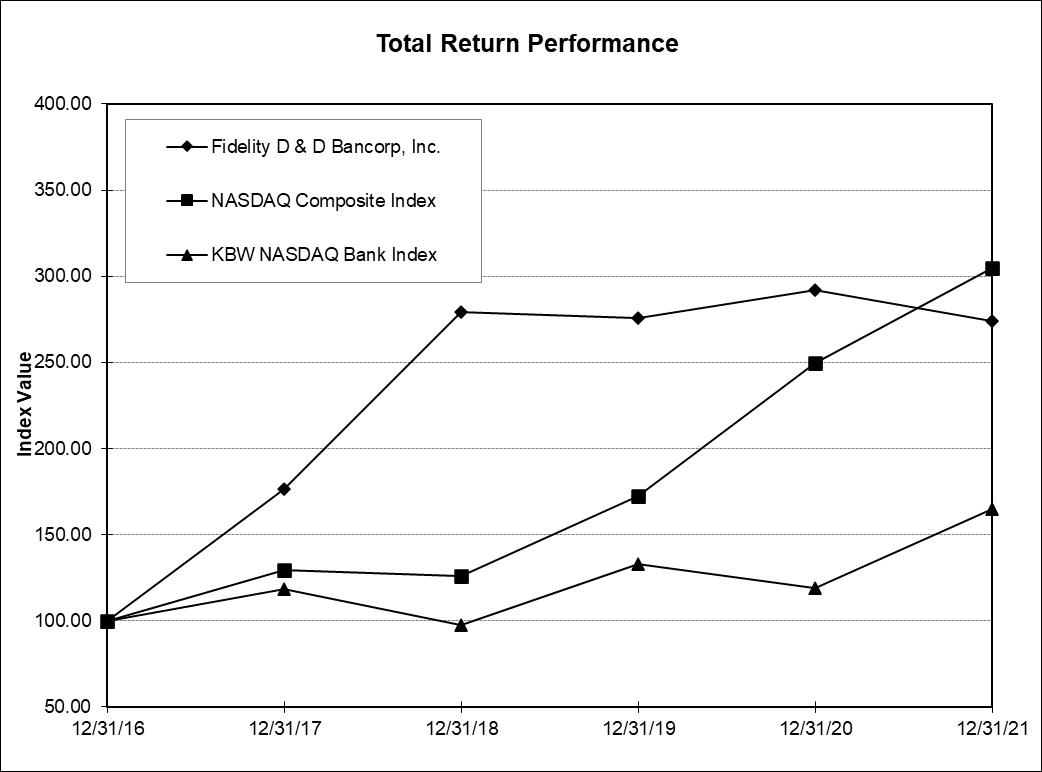
|
|
|
|
|
|
|
|
|
| Period Ending |
| Index | 12/31/16 | 12/31/17 | 12/31/18 | 12/31/19 | 12/31/20 | 12/31/21 |
| Fidelity D & D Bancorp, Inc. | 100.00 | 176.53 | 279.38 | 275.53 | 291.87 | 273.80 |
| NASDAQ Composite Index | 100.00 | 129.64 | 125.96 | 172.18 | 249.51 | 304.85 |
| KBW NASDAQ Bank Index | 100.00 | 118.59 | 97.58 | 132.84 | 119.14 | 164.80 |
|
|
|
|
|
|
|
|
ITEM 6:SELECTED FINANCIAL DATA [Reserved]
Set forth below are our selected consolidated financial and other data. This financial data is derived in part from, and should be read in conjunction with the consolidated financial statements and notes thereto included in Part II, Item 8 of this report:
| | | | | | | | | | |
| | | | | | | | | | |
(dollars in thousands except per share data) | | | | | | | | | | |
| | | | | | | | | | |
Balance sheet data: | 2018 | 2017 | 2016 | 2015 | 2014 |
Total assets | $ | 981,102 | $ | 863,637 | $ | 792,944 | $ | 729,358 | $ | 676,485 |
Total investment securities | | 182,810 | | 157,385 | | 130,037 | | 125,232 | | 97,896 |
Net loans and leases | | 707,233 | | 628,767 | | 588,130 | | 546,682 | | 506,327 |
Loans held-for-sale | | 5,707 | | 2,181 | | 2,854 | | 1,421 | | 1,161 |
Total deposits | | 770,183 | | 730,146 | | 703,459 | | 620,675 | | 586,944 |
Short-term borrowings | | 76,366 | | 18,502 | | 4,223 | | 28,204 | | 3,969 |
FHLB advances | | 31,704 | | 21,204 | | - | | - | | 10,000 |
Total shareholders' equity | | 93,557 | | 87,383 | | 80,631 | | 76,351 | | 72,219 |
| | | | | | | | | | |
Operating data for the year ended: | | | | | | | | | | |
Total interest income | $ | 35,330 | $ | 31,064 | $ | 27,495 | $ | 26,014 | $ | 24,844 |
Total interest expense | | 4,873 | | 3,223 | | 2,358 | | 2,529 | | 2,917 |
Net interest income | | 30,457 | | 27,841 | | 25,137 | | 23,485 | | 21,927 |
Provision for loan losses | | 1,450 | | 1,450 | | 1,025 | | 1,075 | | 1,060 |
Net interest income after provision for loan losses | | 29,007 | | 26,391 | | 24,112 | | 22,410 | | 20,867 |
Other income | | 9,200 | | 8,367 | | 8,005 | | 7,533 | | 7,354 |
Other operating expense | | 25,072 | | 24,836 | | 21,655 | | 21,022 | | 19,703 |
Income before income taxes | | 13,135 | | 9,922 | | 10,462 | | 8,921 | | 8,518 |
Provision for income taxes | | 2,129 | | 1,206 | | 2,769 | | 1,818 | | 2,166 |
Net income | $ | 11,006 | $ | 8,716 | $ | 7,693 | $ | 7,103 | $ | 6,352 |
| | | | | | | | | | |
Per share data: | | | | | | | | | | |
Net income per share, basic | $ | 2.93 | $ | 2.35 | $ | 2.09 | $ | 1.94 | $ | 1.75 |
Net income per share, diluted | $ | 2.90 | $ | 2.33 | $ | 2.09 | $ | 1.94 | $ | 1.75 |
Dividends declared | $ | 3,708 | $ | 3,285 | $ | 3,061 | $ | 2,844 | $ | 2,667 |
Dividends per share | $ | 0.98 | $ | 0.88 | $ | 0.83 | $ | 0.77 | $ | 0.73 |
Book value per share | $ | 24.89 | $ | 23.40 | $ | 21.91 | $ | 20.83 | $ | 19.83 |
Weighted-average shares outstanding | | 3,752,704 | | 3,711,490 | | 3,679,507 | | 3,658,687 | | 3,619,443 |
Shares outstanding | | 3,759,426 | | 3,734,478 | | 3,680,707 | | 3,665,107 | | 3,641,650 |
| | | | | | | | | | |
Ratios: | | | | | | | | | | |
Return on average assets | | 1.20% | | 1.03% | | 1.02% | | 1.00% | | 0.96% |
Return on average equity | | 12.36% | | 10.34% | | 9.64% | | 9.55% | | 9.12% |
Net interest margin (1) (2) | | 3.64% | | 3.70% | | 3.72% | | 3.70% | | 3.75% |
Efficiency ratio (1) | | 62.10% | | 66.25% | | 63.20% | | 65.49% | | 65.03% |
Expense ratio | | 1.73% | | 1.95% | | 1.81% | | 1.89% | | 1.87% |
Allowance for loan losses to loans | | 1.36% | | 1.44% | | 1.57% | | 1.71% | | 1.78% |
Dividend payout ratio | | 33.69% | | 37.69% | | 39.79% | | 40.04% | | 41.99% |
Equity to assets | | 9.54% | | 10.12% | | 10.17% | | 10.47% | | 10.68% |
Equity to deposits | | 12.15% | | 11.97% | | 11.46% | | 12.30% | | 12.30% |
(1) Non-GAAP disclosure – For a discussion on these ratios, see “Non-GAAP Financial Measures,” located in management’s discussion and analysis.
(2) Net interest margin is calculated using the fully-taxable equivalent (FTE) yield on tax-exempt securities and loans. See the “Non-GAAP Financial Measures” in management’s discussion and analysis for the FTE adjustments.
ITEM 7: MANAGEMENT’S DISCUSSION AND ANALYSIS OF FINANCIAL CONDITION ANDRESULTS OF OPERATION
Critical accounting policies
The presentation of financial statements in conformity with U.S. GAAP requires management to make estimates and assumptions that affect many of the reported amounts and disclosures. Actual results could differ from these estimates.
A material estimate that is particularly susceptible to significant change relates to the determination of the allowance for loan losses. Management believes that the allowance for loan losses at December 31, 20182021 is adequate and reasonable. Given the subjective nature of identifying and valuing loan losses, it is likely that well-informed individuals could make different assumptions and could, therefore, calculate a materially different allowance value. While management uses available information to recognize losses on loans, changes in economic conditions may necessitate revisions in the future. In addition, various regulatory agencies, as an integral part of their examination process, periodically review the Company’s allowance for loan losses. Such agencies may require the Company to recognize adjustments to the allowance based on their judgment of information available to them at the time of their examination.
Another material estimate is the calculation of fair values of the Company’s investment securities. Fair values of investment securities are determined by pricing provided by a third-party vendor, who is a provider of financial market data, analytics and related services to financial institutions. Based on experience, management is aware that estimated fair values of
investment securities tend to vary among valuation services. Accordingly, when selling investment securities, price quotes may be obtained from more than one source. As described in Notes 1 and 4 of the consolidated financial statements, incorporated by reference in Part II, Item 8, all of the Company’s investment securities are classified as available-for-sale (AFS). AFS securities are carried at fair value on the consolidated balance sheets, with unrealized gains and losses, net of income tax, reported separately within shareholders’ equity as a component of accumulated other comprehensive income (loss) (AOCI).
The fair value of residential mortgage loans, classified as held-for-sale (HFS), is obtained from the Federal National Mortgage Association (FNMA) or the Federal Home Loan Bank (FHLB). Generally, the market to which the Company sells residential mortgages it originates for sale is restricted and price quotes from other sources are not typically obtained. On occasion, the Company may transfer loans from the loan portfolio to loans HFS. Under these circumstances, pricing may be obtained from other entities and the loans are transferred at the lower of cost or market value and simultaneously sold. For a further discussion on the accounting treatment of HFS loans, see the section entitled “Loans held-for-sale,” contained within this management’s discussion and analysis.
We account for business combinations under the purchase method of accounting. The application of this method of accounting requires the use of significant estimates and assumptions in the determination of the fair value of assets acquired and liabilities assumed in order to properly allocate purchase price consideration between assets that are amortized, accreted or depreciated from those that are recorded as goodwill. Estimates of the fair values of assets acquired and liabilities assumed are based upon assumptions that management believes to be reasonable.
Goodwill is tested at least annually at November 30 for impairment, or more often if events or circumstances indicate there may be impairment. Impairment write-downs are charged to the consolidated statement of income in the period in which the impairment is determined. In testing goodwill for impairment, the Company performed a qualitative assessment, resulting in the determination that the fair value of its reporting unit exceeded its carrying amount. Accordingly, there is no goodwill impairment at December 31, 2021. Other acquired intangible assets that have finite lives, such as core deposit intangibles, are amortized over their estimated useful lives and subject to periodic impairment testing.
All significant accounting policies are contained in Note 1, “Nature of Operations and Summary of Significant Accounting Policies”, within the notes to consolidated financial statements and incorporated by reference in Part II, Item 8.
The following discussion and analysis presents the significant changes in the financial condition and in the results of operations of the Company as of December 31, 20182021 and 2017and2020 and for each of the years then ended. This discussion should be read in conjunction with the consolidated financial statements and notes thereto included in Part II, Item 8 of this report.
Non-GAAP Financial Measures
The following are non-GAAP financial measures which provide useful insight to the reader of the consolidated financial statements but should be supplemental to GAAP used to prepare the Company’s financial statements and should not be read in isolation or relied upon as a substitute for GAAP measures. In addition, the Company’s non-GAAP measures may not be comparable to non-GAAP measures of other companies. The Company’s tax rate used to calculate the fully-taxable equivalent (FTE) adjustment was 21% at December 31, 2021, 2020, 2019 and 2018 compared to 34% at December 31, 2017, 2016, 2015 and 2014.2017.
The following table reconciles the non-GAAP financial measures of FTE net interest income:
| | | | | | | | | | |
|
|
|
|
|
|
|
|
|
|
| | | | | | | | | |
|
|
|
|
|
|
|
|
|
(dollars in thousands) | 2018 | | 2017 | | 2016 | | 2015 | | 2014 | 2021 |
| 2020 |
| 2019 |
| 2018 |
| 2017 |
| | | | | | | | | | | |
Interest income (GAAP) | $ | 35,330 | | $ | 31,064 | | $ | 27,495 | | $ | 26,014 | | $ | 26,014 | $ | 65,468 |
| $ | 49,496 |
| $ | 39,269 |
| $ | 35,330 |
| $ | 31,064 |
Adjustment to FTE | | 718 | | 1,281 | | 1,124 | | 1,084 | | 1,017 |
| 2,135 |
| 1,095 |
| 750 |
| 718 |
| 1,281 |
Interest income adjusted to FTE (Non-GAAP) | | 36,048 | | 32,345 | | 28,619 | | 27,098 | | 27,031 | |
Interest expense | | 4,873 | | 3,223 | | 2,358 | | 2,529 | | 2,529 | |
Net interest income adjusted to FTE (Non-GAAP) | $ | 31,175 | | $ | 29,122 | | $ | 26,261 | | $ | 24,569 | | $ | 24,502 | |
Interest income adjusted to FTE (non-GAAP) | |
| 67,603 |
| 50,591 |
| 40,019 |
| 36,048 |
| 32,345 |
Interest expense (GAAP) | |
| 3,639 |
| 5,311 |
| 7,554 |
| 4,873 |
| 3,223 |
Net interest income adjusted to FTE (non-GAAP) | | $ | 63,964 |
| $ | 45,280 |
| $ | 32,465 |
| $ | 31,175 |
| $ | 29,122 |
| | | | | | | | | | |
|
|
|
|
|
|
|
|
|
|
The efficiency ratio is non-interest expenses as a percentage of FTE net interest income plus non-interest income. The following table reconciles the non-GAAP financial measures of the efficiency ratio to GAAP:
| | | | | | | | | | |
|
|
|
|
|
|
|
|
|
|
| | | | | | | | | | |
|
|
|
|
|
|
|
|
|
|
| | | | | | | | | | | | | | |
|
|
|
|
|
|
|
|
|
|
|
|
(dollars in thousands) | 2018 | | 2017 | | 2016 | | 2015 | | 2014 | 2021 |
| 2020 |
| 2019 |
| 2018 |
| 2017 |
| | | | | | | | | | | |
Efficiency Ratio (non-GAAP) | | | | | | | | | | |
|
|
|
|
|
|
|
|
|
|
Non-interest expenses (GAAP) | $ | 25,072 | | $ | 24,836 | | $ | 21,655 | | $ | 21,022 | | $ | 19,703 | $ | 50,107 |
| $ | 38,319 |
| $ | 26,921 |
| $ | 25,072 |
| $ | 24,836 |
| | | | | | | | | | |
|
|
|
|
|
|
|
|
|
|
Net interest income (GAAP) | | 30,457 | | 27,841 | | 25,137 | | 23,485 | | 21,927 |
| 61,829 |
| 44,185 |
| 31,715 |
| 30,457 |
| 27,841 |
Plus: taxable equivalent adjustment | | 718 | | 1,281 | | 1,124 | | 1,084 | | 1,017 |
| 2,135 |
| 1,095 |
| 750 |
| 718 |
| 1,281 |
Non-interest income (GAAP) | | 9,200 | | 8,367 | | 8,005 | | 7,533 | | 7,354 |
| 18,287 |
| 14,668 |
| 10,193 |
| 9,200 |
| 8,367 |
Net interest income (FTE) plus non-interest income (non-GAAP) | $ | 40,375 | | $ | 37,489 | | $ | 34,266 | | $ | 32,102 | | $ | 30,298 | $ | 82,250 |
| $ | 59,948 |
| $ | 42,658 |
| $ | 40,375 |
| $ | 37,489 |
Efficiency ratio (non-GAAP) | | 62.10% | | 66.25% | | 63.20% | | 65.49% | | 65.03% |
| 60.92% |
| 63.92% |
| 63.11% |
| 62.10% |
| 66.25% |
| | | | | | | | | | |
|
|
|
|
|
|
|
|
|
|
The following table provides a reconciliation of the tangible common equity (non-GAAP) and the calculation of tangible book value per share:
|
|
|
|
|
|
|
|
|
|
|
|
|
|
|
(dollars in thousands) | 2021 |
| 2020 |
| 2019 |
| 2018 |
| 2017 |
Tangible Book Value per Share (non-GAAP) |
|
|
|
|
|
|
|
|
|
|
|
|
|
|
Total assets (GAAP) | $ | 2,419,104 |
| $ | 1,699,510 |
| $ | 1,009,927 |
| $ | 981,102 |
| $ | 863,637 |
Less: Intangible assets, primarily goodwill |
| (21,569) |
|
| (8,787) |
|
| (209) |
|
| (209) |
|
| (209) |
Tangible assets |
| 2,397,534 |
|
| 1,690,723 |
|
| 1,009,718 |
|
| 980,893 |
|
| 863,428 |
Total shareholders' equity (GAAP) |
| 211,729 |
|
| 166,670 |
|
| 106,835 |
|
| 93,557 |
|
| 87,383 |
Less: Intangible assets, primarily goodwill |
| (21,569) |
|
| (8,787) |
|
| (209) |
|
| (209) |
|
| (209) |
Tangible common equity | $ | 190,160 |
| $ | 157,883 |
| $ | 106,626 |
| $ | 93,348 |
| $ | 87,174 |
|
|
|
|
|
|
|
|
|
|
|
|
|
|
|
Common shares outstanding, end of period |
| 5,645,687 |
|
| 4,977,750 |
|
| 3,781,500 |
|
| 3,759,426 |
|
| 3,734,478 |
Tangible Common Book Value per Share | $ | 33.68 |
| $ | 31.72 |
| $ | 28.20 |
| $ | 24.83 |
| $ | 23.34 |
|
|
|
|
|
|
|
|
|
|
|
|
|
|
|
The following tables provides a reconciliation of the Company’s earnings results under GAAP to comparative non-GAAP results excluding merger-related expenses and an FHLB prepayment penalty:
|
|
|
|
|
|
|
|
|
|
|
|
|
|
|
|
|
|
|
|
|
|
|
|
| 2021 |
(dollars in thousands except per share data) | Income before
income taxes |
| Provision for
income taxes |
| Net income |
| Diluted earnings
per share |
Results of operations (GAAP) | $ | 28,009 |
| $ | 4,001 |
| $ | 24,008 |
| $ | 4.48 |
Add: Merger-related expenses |
| 3,033 |
|
| 491 |
|
| 2,542 |
|
| 0.47 |
Add: FHLB prepayment penalty |
| 369 |
|
| 78 |
|
| 291 |
|
| 0.05 |
Adjusted earnings (non-GAAP) | $ | 31,411 |
| $ | 4,570 |
| $ | 26,841 |
| $ | 5.00 |
|
|
|
|
|
|
|
|
|
|
|
|
|
|
|
|
|
|
|
|
|
|
|
|
| 2020 |
(dollars in thousands except per share data) | Income before
income taxes |
| Provision for
income taxes |
| Net income |
| Diluted earnings
per share |
Results of operations (GAAP) | $ | 15,284 |
| $ | 2,249 |
| $ | 13,035 |
| $ | 2.82 |
Add: Merger-related expenses |
| 2,452 |
|
| 426 |
|
| 2,026 |
|
| 0.44 |
Add: FHLB prepayment penalty |
| 481 |
|
| 101 |
|
| 380 |
|
| 0.08 |
Adjusted earnings (non-GAAP) | $ | 18,217 |
| $ | 2,776 |
| $ | 15,441 |
| $ | 3.34 |
|
|
|
|
|
|
|
|
|
|
|
|
|
|
|
|
|
|
|
|
|
|
|
|
| 2019 |
(dollars in thousands except per share data) | Income before
income taxes |
| Provision for
income taxes |
| Net income |
| Diluted earnings
per share |
|
|
|
|
|
|
|
|
|
|
|
|
Results of operations (GAAP) | $ | 13,902 |
| $ | 2,326 |
| $ | 11,576 |
| $ | 3.03 |
Add: Merger-related expenses |
| 440 |
|
| 29 |
|
| 411 |
|
| 0.11 |
Adjusted earnings (non-GAAP) | $ | 14,342 |
| $ | 2,355 |
| $ | 11,987 |
| $ | 3.14 |
|
|
|
|
|
|
|
|
|
|
|
|
Comparison of Financial Condition as of December 31, 20182021
and 20172020 and Results of Operations for each of the Years then Ended
Executive Summary
Nationally, the unemployment rate declined from 4.1% at December 31, 2017 to 3.9% at December 31, 2018. However, the unemployment rate in the Scranton-Wilkes-Barre Metropolitan Statistical Area (local) remained at a higher level than the national unemployment rate. According to the U.S. Bureau of Labor Statistics, the local unemployment rate at December 31, 2018 was 4.8%, a decrease of 0.2 percentage points from 5.0% at December 31, 2017. This is a positive sign for our local economy as the labor force and the number of employed both increased which decreased the unemployment rate. The median home values in the region increased 9.8% from a year ago, according to Zillow, an online database advertising firm providing access to its real estate search engines to various media outlets, and values are expected to grow 1.3% during 2019. In light of these expectations, we will continue to monitor the economic climate in our region and scrutinize growth prospects with credit quality as a principal consideration.
During 2018, the Company’s assets grew by 14% from deposit growth, borrowings and retained net earnings, which were used to fund growth in the loan and securities portfolios. In 2019, we expect to continue to grow most facets of loans with funding provided primarily by deposit growth. We expect to grow the investment portfolio weighted heavier in mortgage-backed securities as an interest rate risk strategy in the event rates continue to rise. The cash flow from these securities will provide liquidity to reinvest in higher yielding assets. About 24% of the municipal bond portfolio is subject to call during 2019 totaling approximately $12.5 million that management expects to reinvest into high credit quality municipal securities to maintain the portfolio allocation. We also plan to roll over $16.7 million in maturing FHLB advances in 2019 while the focus will be on paying down short-term borrowings.
Non-performing assets represented 0.64% of total assets as of December 31, 2018, down from 0.73% at the prior year end. Non-performing assets to total assets was lower during 2018 mostly due to non-performing assets remaining stable while total assets grew. For 2019, management expects to maintain non-performing assets to total assets at historically low levels despite a volatile economic environment.
Branch managers, relationship bankers, mortgage originators and our business service partners are all focused on developing a mutually profitable full banking relationship. We understand our market, offer products and services along with financial advice that is appropriate for our community, clients and prospects. The Company continues to focus on the trusted financial advisor model by utilizing the team approach of experienced bankers that are fully engaged and dedicated towards maintaining and growing profitable relationships.
We generated $11.0$24.0 million in net income in 2018,2021, or $4.48 diluted earnings per share, up $2.3$11.0 million, or 26%84%, from $8.7$13.0 million, or $2.82 diluted earnings per share, in 2017.2020. In 2018,2021, our larger and better positionedwell diversified balance sheet from organic and inorganic growth contributed to the success of our earnings performance. Federal Open Market Committee (FOMC) officials dropped the federal funds rate down to 0%-0.25% during the first quarter of 2020 at the start of the pandemic where it remained through 2021. The 2019Company expects the fed funds rate to begin to rise in 2022. The 2022 focus is to manage net interest income through a rising forecasted rate cycle by mitigating expected interest expense increases after many years of a sustained low interest rate environmentcontrolling loan pricing and deposit costs to maintain a reasonable spread. Federal Open Market Committee (FOMC) officials began increasing interest rates at the end of 2015 in an attempt to return to a “normal” stance. As we continue through this nine-time 25 basis point rising rate cycle, global economic and financial developments will be closely monitored for signals of future rate hikes, and more so a potential rate pause. From a financial condition and performance perspective, our mission for 20192022 will be to continue to strengthen our capital position from strategic growth oriented objectives, implement creative marketing and revenue enhancing strategies, grow and cultivate more of our wealth management and business services and to manage credit risk at tolerable levels thereby maintaining overall asset quality.
Finally,Nationally, the unemployment rate fell from 6.7% at December 31, 2020 to 3.9% at December 31, 2021. The unemployment rates in the Scranton - Wilkes-Barre - Hazleton and the Allentown – Bethlehem - Easton Metropolitan Statistical Areas (local) decreased but remained at a higher level than the national unemployment rate. According to the U.S. Bureau of Labor Statistics, the local unemployment rates at December 31, 2021 were 4.8% and 4.0%, respectively, a decrease of 3.2 and 2.6 percentage points from the 8.0% and 6.6%, respectively, at December 31, 2020. The national and local unemployment rates have decreased as a result of the improving economic environment. The pandemic-related business restrictions have been lifted in our local area and employees started heading back to work. Stimulus payments and enhanced unemployment benefits have supported the economy throughout 2020 and 2021 and it is uncertain if the government could continue to provide this support in the future. The median home values in the Scranton-Wilkes-Barre-Hazleton metro and Allentown-Bethlehem-Easton metro each increased 20.4% and 17.9% from a year ago, according to Zillow, an online database advertising firm providing access to its real estate search engines to various media outlets, and values are expected to grow 18.2% and 17.3% in the next year. In light of these expectations, we are buildinguncertain if real estate values could continue to increase at these levels with the pending rising rate environment, however we will continue to monitor the economic climate in our region and scrutinize growth prospects with credit quality as a new branch in Mountaintop, PA, which is scheduled to open during the third quarter of 2019. We are expecting $1.5 million in investment related to the construction of this new branch in 2019.principal consideration. The Company is also
expecting construction in process to increase $1.7 million in 2019 due to remodeling of the Main Branch building which is scheduled to begin in the second quarter. The Company isremains committed to selectively expanding branch banking and wealth management locations in LackawannaNortheastern and Luzerne CountiesEastern Pennsylvania as opportunities arrive going forward.
On May 1, 2020, the Company completed its previously announced acquisition of MNB Corporation (“MNB”). The merger expanded the Company’s full-service footprint into Northampton County, PA and the Lehigh Valley. Non-recurring costs to facilitate the merger and integrate systems of $2.5 million were incurred during 2020.
On July 1, 2021, the Company completed its previously announced acquisition of Landmark Bancorp, Inc. (“Landmark”). Non-recurring costs to facilitate the merger and integrate systems of $3.0 million were incurred during 2021.
Non-recurring merger-related costs and a FHLB prepayment penalty incurred during 2021 and 2020 are not a part of the Company’s normal operations. If these expenses had not occurred, adjusted net income (non-GAAP) for the years ended December 31, 2021 and 2020 would have been $26.8 million and $15.4 million, respectively. Adjusted diluted EPS (non-GAAP) would have been $5.00 and $3.34 for the years ended December 31, 2021 and 2020. For the same time periods, adjusted ROA (non-GAAP) would have been 1.27% and 1.03%, respectively, and adjusted ROE (non-GAAP) would have been 14.18% and 10.73%, respectively.
For the years ended December 31, 2021 and 2020, tangible common book value per share (non-GAAP) was $33.68 and $31.72, respectively, an increase of 6.2%. These non-GAAP measures should be reviewed in connection with the reconciliation of these non-GAAP ratios. See “Non-GAAP Financial Measures” located above within this management’s discussion and analysis.
During 2021, the Company’s assets grew by 42% primarily from assets acquired from the merger with Landmark and additional growth in deposits, which were used to fund growth in the loan and security portfolios. In 2022, we expect total loans to increase despite paydowns as loans issued under the U.S. Small Business Administration Paycheck Protection Program (“PPP”) are forgiven. The increase in the loan portfolio is expected to be funded primarily by deposit growth. We expect funds generated from operations, deposit growth along with calls and maturities will be used to replace, reinvest and grow the investment portfolio. The cash flow from these securities will provide liquidity to reinvest. No short-term or FHLB borrowings are expected in 2022.
Non-performing assets represented 0.27% of total assets as of December 31, 2021, down from 0.39% at the prior year end. Non-performing assets to total assets was lower during 2021 mostly due to the amount (or dollar value) of non-performing assets decreasing while there was growth in total assets.
Branch managers, relationship bankers, mortgage originators and our business service partners are all focused on developing a mutually profitable full banking relationship. We understand our markets, offer products and services along with financial
advice that is appropriate for our community, clients and prospects. The Company continues to focus on the trusted financial advisor model by utilizing the team approach of experienced bankers that are fully engaged and dedicated towards maintaining and growing profitable relationships.
For the near-term, we expect to continue to operate in a slowly-risingrising interest rate environment. The Company’s balance sheet is positioned to improve its net interest income performance, but the risingincreases in yields may not keep pace with higher cost of funds will continue towhich may compress net interest spread and margin. Although we expect interest rates to continue to rise, we anticipateThe Company expects net interest margin to decline in 2019. The FOMC had been adjusting the short-term federal funds rate up during 2018.for 2022. Expectations are for short-term rates to continue to climbincrease throughout 2019, potentially pressuring2022, which could cause deposit rate pricing. A U.S. Treasury yield curve inversion is becoming more likely in 2019. Growth in depositspricing to fund loans originated at prudent pricing along with paying down short-term borrowings should mitigate the projected increase in interest expense from higher deposit and borrowing rates and help maintain an acceptable interest rate margin during 2019 and beyond. increase.
Financial Condition
Consolidated assets increased $117.5$719.6 million, or 14%42%, to $981.1 million$2.4 billion as of December 31, 20182021 from $863.6 million$1.7 billion at December 31, 2017.2020. The increase in assets occurred predominantlyprimarily from assets acquired in the loanmerger with Landmark and investment portfolios.deposit inflow. The asset growth was funded by utilizing growth in deposits of $40.0 million, borrowings of $68.4 million and $7.7 million in retained earnings, net of dividends declared. $660.4 million.
The following table is a comparison of condensed balance sheet data as of December 31:
| | | | | | | | | | | | | | | | |
|
|
|
|
|
|
|
|
|
|
|
|
|
|
|
|
| | | | | | | | | | | | | | | | |
|
|
|
|
|
|
|
|
|
|
|
|
|
|
|
|
(dollars in thousands) | | | | | | | | | | | | | | | | |
|
|
|
|
|
|
|
|
|
|
|
|
|
|
|
|
Assets: | 2018 | | % | | 2017 | | % | | 2016 | | % | 2021 |
| % |
| 2020 |
| % |
| 2019 |
| % |
Cash and cash equivalents | $ | 17,485 | | 1.8 | % | | $ | 15,825 | | 1.9 | % | | $ | 25,843 | | 3.3 | % | $ | 96,877 |
| 4.0 | % |
| $ | 69,346 |
| 4.1 | % |
| $ | 15,663 |
| 1.6 | % |
Investment securities | | 182,810 | | 18.6 | | | | 157,385 | | 18.2 | | | 130,037 | | 16.4 | |
| 738,980 |
| 30.6 |
|
|
| 392,420 |
| 23.1 |
|
| 185,117 |
| 18.3 |
|
Federal Home Loan Bank stock | | 6,339 | | 0.6 | | | | 2,832 | | 0.3 | | | 2,606 | | 0.3 | | |
Restricted investments in bank stock | |
| 3,206 |
| 0.1 |
|
|
| 2,813 |
| 0.2 |
|
| 4,383 |
| 0.4 |
|
Loans and leases, net | | 712,940 | | 72.7 | | | | 630,948 | | 73.1 | | | 590,984 | | 74.5 | |
| 1,449,231 |
| 59.9 |
|
|
| 1,135,236 |
| 66.8 |
|
| 745,306 |
| 73.8 |
|
Bank premises and equipment | | 18,289 | | 1.9 | | | | 16,576 | | 1.9 | | | 17,164 | | 2.2 | |
| 29,310 |
| 1.2 |
|
|
| 27,626 |
| 1.6 |
|
| 21,557 |
| 2.1 |
|
Life insurance cash surrender value | | 20,615 | | 2.1 | | | | 20,017 | | 2.3 | | | 11,435 | | 1.4 | |
| 52,745 |
| 2.2 |
|
|
| 44,285 |
| 2.6 |
|
| 23,261 |
| 2.3 |
|
Other assets | | 22,624 | | 2.3 | | | | 20,054 | | 2.3 | | | 14,875 | | 1.9 | |
| 48,755 |
| 2.0 |
|
|
| 27,784 |
| 1.6 |
|
| 14,640 |
| 1.5 |
|
Total assets | $ | 981,102 | | 100.0 | % | | $ | 863,637 | | 100.0 | % | | $ | 792,944 | | 100.0 | % | $ | 2,419,104 |
| 100.0 | % |
| $ | 1,699,510 |
| 100.0 | % |
| $ | 1,009,927 |
| 100.0 | % |
| | | | | | | | | | | | | | | | |
|
|
|
|
|
|
|
|
|
|
|
|
|
|
|
|
Liabilities: | | | | | | | | | | | | | | | | |
|
|
|
|
|
|
|
|
|
|
|
|
|
|
|
|
Total deposits | $ | 770,183 | | 78.5 | % | | $ | 730,146 | | 84.6 | % | | $ | 703,459 | | 88.7 | % | $ | 2,169,865 |
| 89.7 | % |
| $ | 1,509,505 |
| 88.8 | % |
| $ | 835,737 |
| 82.8 | % |
Secured borrowings | |
| 10,620 |
| 0.4 |
|
|
| - |
| - |
|
| - |
| - |
|
Short-term borrowings | | 76,366 | | 7.8 | | | | 18,502 | | 2.1 | | | 4,223 | | 0.5 | |
| - |
| - |
|
|
| - |
| - |
|
| 37,839 |
| 3.7 |
|
FHLB advances | | 31,704 | | 3.2 | | | | 21,204 | | 2.5 | | | - | | - | |
| - |
| - |
|
|
| 5,000 |
| 0.3 |
|
| 15,000 |
| 1.5 |
|
Other liabilities | | 9,292 | | 1.0 | | | | 6,402 | | 0.7 | | | 4,631 | | 0.6 | |
| 26,890 |
| 1.1 |
|
|
| 18,335 |
| 1.1 |
|
| 14,516 |
| 1.4 |
|
Total liabilities | | 887,545 | | 90.5 | | | | 776,254 | | 89.9 | | | 712,313 | | 89.8 | |
| 2,207,375 |
| 91.2 |
|
|
| 1,532,840 |
| 90.2 |
|
| 903,092 |
| 89.4 |
|
Shareholders' equity | | 93,557 | | 9.5 | | | | 87,383 | | 10.1 | | | 80,631 | | 10.2 | |
| 211,729 |
| 8.8 |
|
|
| 166,670 |
| 9.8 |
|
| 106,835 |
| 10.6 |
|
Total liabilities and shareholders' equity | $ | 981,102 | | 100.0 | % | | $ | 863,637 | | 100.0 | % | | $ | 792,944 | | 100.0 | % | $ | 2,419,104 |
| 100.0 | % |
| $ | 1,699,510 |
| 100.0 | % |
| $ | 1,009,927 |
| 100.0 | % |
A comparison of net changes in selected balance sheet categories as of December 31, are as follows:
| | | | | | | | | | | | | | | | | | | | |
|
|
|
|
|
|
|
|
|
|
|
|
|
|
|
|
|
|
|
|
| | | | | | Earning | | | | | | | | Short-term | | | | FHLB | | |
|
|
|
|
| Earning |
|
|
|
|
|
|
| Other |
|
|
| FHLB |
|
|
(dollars in thousands) | Assets | | % | | assets* | | % | | Deposits | | % | | borrowings | | % | | advances | | % | Assets |
| % |
| assets* |
| % |
| Deposits |
| % |
| borrowings |
| % |
| advances |
| % |
| | | | | | | | | | | | | | | | | | | | |
|
|
|
|
|
|
|
|
|
|
|
|
|
|
|
|
|
|
|
|
2021 | | $ | 719,594 |
| 42 |
| $ | 682,812 |
| 43 |
| $ | 660,360 |
| 44 |
| $ | 10,620 |
| 100 |
| $ | (5,000) |
| (100) |
2020 | |
| 689,583 |
| 68 |
| 648,880 |
| 69 |
|
| 673,768 |
| 81 |
|
| (37,839) |
| (100) |
| (10,000) |
| (67) |
2019 | |
| 28,825 |
| 3 |
| 21,878 |
| 2 |
|
| 65,554 |
| 9 |
|
| (38,527) |
| (50) |
| (16,704) |
| (53) |
2018 | $ | 117,465 | | 14 | | $ | 110,399 | | 14 | | $ | 40,037 | | 5 | | $ | 57,864 | | 313 | | $ | 10,500 | | 50 |
| 117,465 |
| 14 |
| 112,078 |
| 14 |
|
| 40,037 |
| 5 |
|
| 57,864 |
| 313 |
| 10,500 |
| 50 |
2017 | | 70,693 | | 9 | | 59,991 | | 8 | | | 26,687 | | 4 | | | 14,279 | | 338 | | 21,204 | | 100 |
| 70,693 |
| 9 |
| 61,985 |
| 8 |
|
| 26,687 |
| 4 |
|
| 14,279 |
| 338 |
| 21,204 |
| 100 |
2016 | | 63,586 | | 9 | | 62,612 | | 9 | | | 82,784 | | 13 | | | (23,981) | | (85) | | - | | - | |
2015 | | 52,873 | | 8 | | 50,304 | | 8 | | | 33,731 | | 6 | | | 24,235 | | 611 | | (10,000) | | (100) | |
2014 | | 52,660 | | 8 | | 52,213 | | 9 | | | 57,246 | | 11 | | | (4,673) | | (54) | | (6,000) | | (38) | |
| | | | | | | | | | | | | | | | | | | | |
|
|
|
|
|
|
|
|
|
|
|
|
|
|
|
|
|
|
|
|
* Earning assets include interest-bearing deposits with financial institutions, gross loans and leases, loans held-for-sale, available-for-sale securities and FHLBrestricted investments in bank stock excluding loans placed on non-accrual status.
Funds Provided:
Deposits
The Company is a community based commercial depository financial institution, member FDIC, which offers a variety of deposit products with varying ranges of interest rates and terms. Generally, deposits are obtained from consumers, businesses and public entities within the communities that surround the Company’s 1123 branch offices and all deposits are insured by the FDIC up to the full extent permitted by law. Deposit products consist of transaction accounts including: savings; clubs; interest-bearing checking; money market and non-interest bearing checking (DDA). The Company also offers short- and long-term time deposits or certificates of deposit (CDs). CDs are deposits with stated maturities which can range from seven days to ten years. Cash flow from deposits is influenced by economic conditions, changes in the interest rate environment, pricing and competition. To determine interest rates on its deposit products, the Company considers local competition, spreads to earning-asset yields, liquidity position and rates charged for alternative sources of funding such as short-term borrowings and FHLB advances.
The following table represents the components of total deposits as of December 31:
| | | | | | | | | | |
|
|
|
|
|
|
|
|
|
|
| | | | | | | | | | |
|
|
|
|
|
|
|
|
|
|
| 2018 | 2017 | 2021 | 2020 |
(dollars in thousands) | Amount | | % | Amount | | % | Amount |
| % | Amount |
| % |
| | | | | | | | | | |
|
|
|
|
|
|
|
|
|
|
Interest-bearing checking | $ | 224,185 | | 29.1 | % | $ | 202,536 | | 27.7 | % | $ | 730,595 |
| 33.7 | % | $ | 453,896 |
| 30.0 | % |
Savings and clubs | | 118,971 | | 15.4 | | | 129,992 | | 17.8 | |
| 234,747 |
| 10.8 |
|
| 179,676 |
| 11.9 |
|
Money market | | 116,010 | | 15.1 | | | 111,921 | | 15.3 | |
| 475,447 |
| 21.9 |
|
| 340,654 |
| 22.6 |
|
Certificates of deposit | | 116,286 | | 15.1 | | | 107,066 | | 14.7 | |
| 138,793 |
| 6.4 |
|
| 127,783 |
| 8.5 |
|
Total interest-bearing | | 575,452 | | 74.7 | | | 551,515 | | 75.5 | |
| 1,579,582 |
| 72.8 |
|
| 1,102,009 |
| 73.0 |
|
Non-interest bearing | | 194,731 | | 25.3 | | | 178,631 | | 24.5 | |
| 590,283 |
| 27.2 |
|
| 407,496 |
| 27.0 |
|
Total deposits | $ | 770,183 | | 100.0 | % | $ | 730,146 | | 100.0 | % | $ | 2,169,865 |
| 100.0 | % | $ | 1,509,505 |
| 100.0 | % |
Total deposits increased $40.0$660.4 million, or 5%44%, from $730.2 million$1.5 billion at December 31, 20172020 to $770.2 million$2.2 billion at December 31, 2018. Interest-bearing2021. Non-interest bearing and non-interest bearinginterest-bearing checking accounts contributed the most to the deposit growth with increases of $21.6$182.8 million and $16.1$276.7 million, respectively. The growth in non-interest bearing checking accounts was primarily due to accounts acquired from the Landmark merger supplemented by business and personal account growth. The increase in interest-bearing checking accounts was primarily due to accounts from the transferLandmark merger, seasonal tax cycles, business activity, federal pandemic relief funds and shifts from maturing CDs. Money market accounts also increased $134.8 million, mostly due to acquired Landmark accounts, higher balances of repurchase agreementpersonal and business accounts into checking accounts at the endand shifts from other types of 2018 and growth throughout 2018 in business account balances.deposit accounts. The Company focusedfocuses on obtaining a full-banking relationship with existing checking account customers as well as forming new customer relationships. During 2018,Savings accounts increased $55.1 million due to accounts added from the Company received $11.2 millionLandmark merger and also an increase in non-interest bearing deposits from a new business relationship. The remainder of the growth in non-interest bearing checking resulted mostly from growth in business and personal accounts. Additionally, money market accounts grew $4.1 million primarily from personal account activity and CDs also increased $9.2 million during 2018. These increases were partially offset by a $11.0 million decrease in savings and clubs, of which $5.6 million was from one customer.balances. The Company will continue to execute on its relationship development strategy, explore the demographics within its marketplace and develop creative programs for its customers. For 2019,2022, the Company will focus onexpects deposit growth to fund asset growth and pay down short-term borrowings. Growth in deposits from new markets is expected from a full year with the Back Mountain branch plus the Mountaintop branch scheduled to open during the third quarter of 2019.growth. Seasonal public deposit fluctuations are expected to remain volatile and at times may partially offset thisfuture deposit growth.
Customers’ interest in long-term time deposit products started to pick up in 2018 as interest rates have risen. The Company’s portfolio ofAdditionally, CDs also increased mostly$11.0 million due to CDs acquired from the merger with Landmark. Otherwise, CD promotionsbalances continue to decline as rates dropped during 2020 and customers’ desire for higher-yielding deposit alternatives. During 2018, deposit customers began2021 and previous years' promotional CDs reached maturity. Of the balance of outstanding CDs at December 31, 2021, $70.8 million, or 51%, had a balance at December 31, 2020. The majority of the remaining maturing CD balances were transferred to move some money from savingstransactional accounts primarily interest-bearing checking and money market accountsaccounts. During the third quarter of 2021, $12.0 million in CDs from one public customer was transferred to CDs. If rates continue to rise, demand for higher rate money market accounts and CDs may continue to grow thereby increasing funding costs.an interest-bearing checking account. The Company will continue to pursue strategies to grow and retain retail and business customers with an emphasis on deepening and broadening existing and creating new relationships.
The Company uses the Certificate of Deposit Account Registry Service (CDARS) reciprocal program and Insured Cash Sweep (ICS) reciprocal program to obtain FDIC insurance protection for customers who have large deposits that at times may exceed the FDIC maximum insured amount of $250,000. In the CDARS program, deposits with varying termsThe Company did not have any CDARs as of December 31, 2021 and interest rates, originated in the Company’s own markets, are exchanged for deposits of other financial institutions that are members in the CDARS network. By placing the deposits in other participating institutions, the deposits of our customers are fully insured by the FDIC. In return for deposits placed with network institutions, the Company receives from network institutions deposits that are approximately equal in amount and are comprised of terms similar to those placed for our customers. Deposits the Company receives from other institutions are considered reciprocal deposits by regulatory definitions.2020. As of December 31, 20182021 and 2017, CDARS and2020, ICS reciprocal deposits represented $4.7$27.6 million and $1.1$46.2 million, or less than 1% and 3%, of total deposits.deposits which are included in interest-bearing checking accounts in the table above. The $18.6 million decrease in ICS deposits is primarily due to public funds deposit transfers from ICS accounts to other interest-bearing checking accounts partially offset by ICS accounts acquired from Landmark.
As of December 31, 2021, total uninsured deposits were estimated to be $919.3 million. The estimate of uninsured deposits is based on the same methodologies and assumptions used for regulatory reporting requirements. The Company aggregates deposit products by taxpayer identification number and classifies into ownership categories to determine amounts over the FDIC insurance limit.
The maturity distribution of certificates of deposit that meet or exceed the FDIC limit, by account, at December 31, 20182021 is as follows:
| | | | | | | | | | | | | | |
| | | | More than | | More than | | More | | | |
| Three months | | three months | | six months to | | than twelve | | | |
(dollars in thousands) | or less | | to six months | | twelve months | | months | | Total |
CDs of $100,000 or more | $ | 11,150 | | $ | 8,989 | | $ | 28,228 | | $ | 18,573 | | $ | 66,940 |
CDs of less than $100,000 | | 7,386 | | | 6,150 | | | 12,896 | | | 22,914 | | | 49,346 |
Total CDs | $ | 18,536 | | $ | 15,139 | | $ | 41,124 | | $ | 41,487 | | $ | 116,286 |
|
|
|
|
|
|
(dollars in thousands) |
|
Three months or less | $ | 4,688 |
More than three months to six months |
| 3,715 |
More than six months to twelve months |
| 11,641 |
More than twelve months |
| 2,908 |
Total | $ | 22,952 |
There is a remaining purchase accounting time deposit discount of $2 thousand that will be amortized into income on a level yield amortization method over the contractual life of the deposits that is not included in the table above.
Approximately 64%76% of the CDs, with a weighted-average interest rate of 1.42%0.33%, are scheduled to mature in 20192022 and an additional 26%14%, with a weighted-average interest rate of 1.89%0.50%, are scheduled to mature in 2020.2023. Renewing CDs mayare currently expected to re-price to lower or higher market rates depending on the rate on the maturing CD, the pace and direction of interest rate movements, the shape of the yield curve, competition, the rate profile of the maturing accounts and depositor preference for alternative, non-term products. The Company does expectplans to address repricing CDs in the ordinary course of business on a relationship basis and is prepared to match rates when prudent to maintain relationships. Growth in CD growth to continue during 2019,accounts is challenged by the current and will develop CD promotional programs when the Company deems that it is economically feasible to do so or when demand exists.expected rate environment and clients’ preference for short-term rates, as well as aggressive competitor rates. The Company is not currently expectsoffering any CD promotions but may resume promotions in the cost of deposit funds to rise due to the current increasing interest rate environment. As with all promotions, thefuture. The Company will consider the needs of the customers and simultaneously be mindful of the liquidity levels, borrowing rates and the interest rate sensitivity exposure of the Company.
Short-term borrowings
Borrowings are used as a complement to deposit generation as an alternative funding source whereby the Company will borrow under customer repurchase agreements in the local market, advances from the FHLB of Pittsburgh and other correspondent banks for asset growth and liquidity needs.
The components of short-term borrowings are as follows:
| | | | | |
| | As of December 31, |
(dollars in thousands) | | 2018 | | | 2017 |
| | | | | |
Overnight borrowings | $ | 76,366 | | $ | 7,455 |
Securities sold under repurchase agreements | | - | | | 11,047 |
Total | $ | 76,366 | | $ | 18,502 |
| | | | | |
Repurchase agreements are non-insured interest-bearing liabilities that have a perfected security interest in qualified investments of the Company as required by the FDIC Depositor Protection Act of 2009. Repurchase agreements are offered through a sweep product. A sweep account is designed to ensure that on a daily basis, an attached DDA is adequately funded and excess funds are transferred, or swept, into an interest-bearing overnight repurchase agreement account. Due to the constant inflow and outflow of funds of the sweep product, their balances tend to be somewhat volatile, similar to a DDA. Customer liquidity is the typical cause for variances in repurchase agreements. At the end of 2018, the Company transferred all repurchase agreement accounts to interest-bearing checking accounts. In addition, short-termShort-term borrowings may include overnight balances with FHLB line of credit and/or correspondent bank’s federal funds lines which the Company may require to fund daily liquidity needs such as deposit outflow, loan demand and operations. Short-termThere were no short-term borrowings increased $57.9 million during 2018 to fund loanas of December 31, 2021 and 2020 as growth in deposits funded asset growth. The Company expectsdoes not expect to have short-term borrowings in 2022. As of December 31, 2021, the Company had the ability to decrease in 2019.borrow $91.7 million from the Federal Reserve borrower-in-custody program and $31.0 million from lines of credit with correspondent banks.
Information with respect to the Company’s short-term borrowing’s maximum and average outstanding balances and interest rates are contained in Note 8, “Short-term Borrowings,” of the notes to consolidated financial statements incorporated by reference in Part II, Item 8.
FHLB advancesSecured borrowings
AtAs of December 31, 2018,2021, the Company had $31.7secured borrowings with a fair value of $10.6 million related to certain sold loan participations that did not qualify for sales treatment acquired from Landmark. Secured borrowings are expected to decrease in 2022 from scheduled amortization and, when possible, early pay-offs.
FHLB advances
The Company had no FHLB advances as of December 31, 2021. During the first quarter of 2021, the Company paid off $5 million in FHLB advances with a weighted average interest rate of 2.15%3.07%. During the first quarter of 2018, the Company paid off $2.5 million of FHLB advances and another $2.0 million was paid off during the third quarter of 2018. During September 2018,2021, the Company borrowed $15acquired $4.5 million with maturity dates laddered outin FHLB advances from 3 to 5 years in order to purchase securities.the Landmark merger that was subsequently paid off. As of December 31, 2018,2021, the Company had the ability to borrow an additional $124.9$568.9 million from the FHLB. The Company does not expect to have any FHLB advances in 2022.
Funds Deployed:
Investment Securities
The Company’s investment policy is designed to complement its lending activities, provide monthly cash flow, manage interest rate sensitivity and generate a favorable return without incurring excessive interest rate and credit risk while managing liquidity at acceptable levels. In establishing investment strategies, the Company considers its business, growth strategies or restructuring plans, the economic environment, the interest rate sensitivity position, the types of securities in its portfolio, permissible purchases, credit quality, maturity and re-pricing terms, call or average-life intervals and investment concentrations. The Company’s policy prescribes permissible investment categories that meet the policy standards and management is responsible for structuring and executing the specific investment purchases within these policy parameters. Management buys and sells investment securities from time-to-time depending on market conditions, business trends, liquidity needs, capital levels and structuring strategies. Investment security purchases provide a way to quickly invest excess liquidity in order to generate additional earnings. The Company generally earns a positive interest spread by
assuming interest rate risk using deposits or borrowings to purchase securities with longer maturities.
At the time of purchase, management classifies investment securities into one of three categories: trading, available-for-sale (AFS) or held-to-maturity (HTM). To date, management has not purchased any securities for trading purposes. All of the securities the Company purchases are classified as AFS even though there is no immediate intent to sell them. The AFS designation affords management the flexibility to sell securities and position the balance sheet in response to capital levels, liquidity needs or changes in market conditions. Debt securities AFS are carried at fair value on the consolidated balance sheets with unrealized gains and losses, net of deferred income taxes, reported separately within shareholders’ equity as a component of accumulated other comprehensive income (AOCI). Beginning on January 1, 2018, equity securities were carried at fair value on the consolidated balance sheets with unrealized gains and losses, net of deferred income taxes, reported separately within the consolidated statements of income as a component of non-interest income. The Company sold all of its remaining equity securities during the first half of 2018. Securities designated as HTM are carried at amortized cost and represent debt securities that the Company has the ability and intent to hold until maturity.
As of December 31, 2018,2021, the carrying value of investment securities amounted to $182.8$739.0 million, or 19%31% of total assets, compared to $157.4$392.4 million, or 18%23% of total assets, at December 31, 2017.2020. On December 31, 2018, 68%2021, 35% of the carrying value of the investment portfolio was comprised of U.S. Government Sponsored Enterprise residential mortgage-backed securities (MBS – GSE residential or mortgage-backed securities) that amortize and provide monthly cash flow that the Company can use for reinvestment, loan demand, unexpected deposit outflow, facility expansion or operations. The mortgage-backed securities portfolio includes only pass-through bonds issued by Fannie Mae, Freddie Mac and the Government National Mortgage Association (GNMA).
The Company’s municipal (obligations of states and political subdivisions) portfolio is comprised of tax-free municipal bonds with a book value of $267.5 million and taxable municipal bonds with a book value of $93.2 million. The overall credit ratings of these municipal bonds was as follows: 36% AAA, 62% AA, 1% A and 1% escrowed.
During 2021, the carrying value of total investments increased $346.6 million, or 88%. Purchases for the year totaled $411.4 million, while maturities and principal reductions totaled $54.2 million and proceeds from sales were $44.5 million. The purchases were funded principally by cash flow generated from the portfolio and excess overnight liquidity. The growth in the investment portfolio was due to the increase in low earning cash that was used to purchase higher yielding securities. As a result of the acquisition of Landmark, the Company acquired $49.4 million in securities of which $16.5 million was retained and the remaining securities were liquidated and reinvested. The Company attempts to maintain a well-diversified and proportionate investment portfolio that is structured to complement the strategic direction of the Company. Its growth typically supplements the lending activities but also considers the current and forecasted economic conditions, the Company’s liquidity needs and interest rate risk profile.
A comparison of total investment securities as of December 31 follows:
|
|
|
|
|
|
|
|
|
|
|
|
|
|
|
|
|
|
|
|
|
|
|
|
|
|
|
|
|
|
|
|
|
|
|
|
|
|
|
|
|
|
|
|
| 2021 | 2020 |
(dollars in thousands) | Amount |
| % |
| Book yield |
| Reprice term |
| Amount |
| % |
| Book yield |
| Reprice term |
|
|
|
|
|
|
|
|
|
|
|
|
|
|
|
|
|
|
|
|
|
|
MBS - GSE residential | $ | 257,267 |
| 34.8 | % |
| 1.6 | % |
| 5.1 |
| $ | 147,260 |
| 37.5 | % |
| 1.7 | % |
| 2.8 |
Obligations of states & political subdivisions |
| 364,710 |
| 49.4 |
|
| 2.3 |
|
| 7.5 |
|
| 199,713 |
| 50.9 |
|
| 2.6 |
|
| 7.5 |
Agency - GSE |
| 117,003 |
| 15.8 |
|
| 1.4 |
|
| 5.2 |
|
| 45,447 |
| 11.6 |
|
| 1.3 |
|
| 4.4 |
Total | $ | 738,980 |
| 100.0 | % |
| 1.9 | % |
| 6.3 |
| $ | 392,420 |
| 100.0 | % |
| 2.1 | % |
| 5.4 |
The investment securities portfolio contained no private label mortgage-backed securities, collateralized mortgage obligations, collateralized debt obligations, or trust preferred securities, and no off-balance sheet derivatives were in use. The portfolio had no adjustable-rate instruments as of December 31, 2021 and 2020.
Investment securities were comprised of AFS securities as of December 31, 20182021 and December 31, 2017.2020. The AFS securities were recorded with a net unrealized lossgain of $1.4$0.2 million and a net unrealized gain of $2.3$11.3 million as of December 31, 20182021 and 2017. On January 1, 2018, $0.5 million of net unrealized gains on equity securities were reclassified from AOCI to retained earnings.2020, respectively. Of the remaining net decline in the unrealized gain position of $3.1 million, $2.1$11.1 million: $3.3 million was net unrealized losses on mortgages-backedattributable to municipal securities; $5.1 million was attributable to mortgage-backed securities and $1.0$2.7 million was net unrealized losses on municipalattributable to agency securities. The direction and magnitude of the change in value of the Company’s investment portfolio is attributable to the direction and magnitude of the change in interest rates along the treasury yield curve. Generally, the values of debt securities move in the opposite direction of the changes in interest rates. As interest rates along the treasury yield curve decline,rise, especially at the intermediate and long end, the values of debt securities tend to rise.decline. Whether or not the value of the Company’s investment portfolio will continue to fallchange above or below its amortized cost will be largely dependent on the direction and magnitude of interest rate movements and the duration of the debt securities within the Company’s investment portfolio. WhenManagement does not consider the reduction in value attributable to changes in credit quality. Correspondingly, when interest rates rise,decline, the market values of the Company’s debt securities portfolio could be subject to market value declines.increases.
As of December 31, 2018,2021, the Company had $118.9$417.8 million in public deposits, or 15%19% of total deposits. Pennsylvania state law requires the Company to maintain pledged securities on these public deposits.deposits or otherwise obtain a FHLB letter of credit
or FDIC insurance for these customers. As of December 31, 2018,2021, the balance of pledged securities required for deposit accountspublic and trust deposits was $82.6$394.3 million, or 45%53% of total securities.
Quarterly, management performs a review of the investment portfolio to determine the causes of declines in the fair value of each security. The Company uses inputs provided by independent third parties to determine the fair value of its investment securities portfolio. Inputs provided by the third parties are reviewed and corroborated by management. Evaluations of the causes of the unrealized losses are performed to determine whether impairment exists and whether the impairment is temporary or other-than-temporary. Considerations such as the Company’s intent and ability to hold the securities until or sell prior to maturity, recoverability of the invested amounts over the intended holding period, the length of time and the severity in pricing decline below cost, the interest rate environment, the receipt of amounts contractually due and whether or not there is an active market for the securities, for example, are applied, along with an analysis of the financial condition of the issuer for management to make a realistic judgment of the probability that the Company will be unable to collect all amounts (principal and interest) due in determining whether a security is other-than-temporarily impaired. If a decline in value is deemed to be other-than-temporary, the amortized cost of the security is reduced by the credit impairment amount and a corresponding charge to current earnings is recognized. During the year ended December 31, 2018,2021, the Company did not incur other-than-temporary impairment charges from its investment securities portfolio.
Restricted investments in bank stock
During 2018, the carrying value of total investments increased $25.4 million, or 16%. The Company attempts to maintain a well-diversified and proportionate investment portfolio that is structured to complement the strategic direction of the Company. Its growth typically supplements the lending activities but also considers the current and forecasted economic conditions, the Company’s liquidity needs and interest rate risk profile. The Company expects to grow the portfolio and increase its relative size with a preference toward mortgage-backed securities. If rates rise, the strategy is expected to provide a good source of cash flow to reinvest into higher yielding interest-sensitive assets. During the third quarter of 2018, the Company purchased approximately $15 million of securities, primarily MBS-GSE residential, funded by FHLB advances with maturity dates laddered out from 3 to 5 years matching a spread expected to produce a suitable after-tax return.
A comparison of total investment securities as of December 31 follows:
| | | | | | | | | | |
| | | | | | | | | | |
| 2018 | 2017 |
(dollars in thousands) | Amount | | % | Amount | | % |
| | | | | | | | | | |
MBS - GSE residential | $ | 124,318 | | 68.0 | % | $ | 103,152 | | 65.5 | % |
State & municipal subdivisions | | 52,575 | | 28.8 | | | 44,306 | | 28.2 | |
Agency - GSE | | 5,917 | | 3.2 | | | 9,099 | | 5.8 | |
Equity securities - financial services | | - | | - | | | 828 | | 0.5 | |
Total | $ | 182,810 | | 100.0 | % | $ | 157,385 | | 100.0 | % |
As of December 31, 2018, there were no investments from any one issuer with an aggregate book value that exceeded 10% of the Company’s shareholders’ equity.
The distribution of debt securities by stated maturity and tax-equivalent yield at December 31, 2018 are as follows:
| | | | | | | | | | | | | | | | | | | | | | | | |
| | | | | | | | | | | | | | | | | | | | | | | | |
| | | | | | More than | | More than | | More than | | | | | |
| One year or less | | one year to five years | | five years to ten years | | ten years | | Total |
(dollars in thousands) | $ | % | | $ | % | | $ | % | | $ | % | | $ | % |
| | | | | | | | | | | | | | | | | | | | | | | | |
MBS - GSE residential | $ | - | - | % | | $ | 150 | 5.85 | % | | $ | 996 | 4.26 | % | | $ | 123,172 | 3.38 | % | | $ | 124,318 | 3.39 | % |
State & municipal subdivisions | | 9,339 | 5.00 | | | | 3,122 | 5.24 | | | | 2,620 | 5.01 | | | | 37,494 | 4.67 | | | | 52,575 | 4.78 | |
Agency - GSE | | - | - | | | | 4,945 | 2.69 | | | | 972 | 2.72 | | | | - | - | | | | 5,917 | 2.70 | |
Total debt securities | $ | 9,339 | 5.00 | % | | $ | 8,217 | 3.69 | % | | $ | 4,588 | 4.36 | % | | $ | 160,666 | 3.67 | % | | $ | 182,810 | 3.76 | % |
| | | | | | | | | | | | | | | | | | | | | | | | |
In the above table, the book yields on state & municipal subdivisions were adjusted to a tax-equivalent basis using the corporate federal tax rate of 21%. In addition, average yields on securities AFS are based on amortized cost and do not reflect unrealized gains or losses.
Investment in Federal Home Loan Bank Stock
Investment in FHLB(FHLB) stock is required for membership in the organization and is carried at cost since there is no market value available. The amount the Company is required to invest is dependent upon the relative size of outstanding borrowings the Company has with the FHLB of Pittsburgh. Excess stock is repurchased from the Company at par if the amount of borrowings decline to a predetermined level. In addition, the Company earns a return or dividend based on the amount invested. Atlantic Community Bankers Bank (ACBB) stock totaled $82 thousand and $45 thousand as of December 31, 2021 and 2020. ACBB stock totaling $37 thousand was acquired from the merger with Landmark in 2021. The dividends received from the FHLB totaled $194$130 thousand and $135$203 thousand for the years ended December 31, 20182021 and 2017,2020, respectively. The balance in FHLB and ACBB stock was $6.3$3.2 million and $2.8 million as of December 31, 20182021 and 2017,2020, respectively.
Loans and leases
As of December 31, 2018,2021, the Company had gross loans and leases, including originated and acquired loans and leases, totaling $718.0 million$1.4 billion compared to $638.6 million$1.1 billion at December 31, 2017 which represented2020, an increase of $79.4$314 million, or 12%28%. From
Growth in the portfolio was attributed to a percentage point of view, the auto and leases portfolio recognized the most growth at $28.0$118 million, or 34%13%, followedincrease in the originated portfolio and a $196 million, or 93%, increase in the acquired portfolio. Growth in the originated portfolio was primarily attributed to the $83 million increase in the commercial real estate portfolio, resulting from the origination of several large commercial real estate loans during 2021, and the $95 million increase in the residential portfolio, stemming from the strength of the housing market in the Company’s service area and the low interest rate environment along with management’s decision to retain a greater percentage of potentially saleable mortgages. Growth in the acquired portfolio was attributed to the $299 million in loans added to the Company’s balance sheet from the Landmark merger, which closed in the third quarter of 2021.
A comparison of loan originations, net of participations is as follows for the periods indicated:
|
|
|
|
|
|
| 2021 |
| 2020 |
(dollars in thousands) | Amount |
| Amount |
Loans: |
|
|
|
|
|
Commercial and industrial | $ | 128,768 |
| $ | 198,785 |
Commercial real estate |
| 89,653 |
|
| 32,236 |
Consumer |
| 68,482 |
|
| 48,725 |
Residential real estate |
| 241,395 |
|
| 201,440 |
|
| 528,298 |
|
| 481,186 |
Lines of credit: |
|
|
|
|
|
Commercial |
| 77,194 |
|
| 36,622 |
Residential construction |
| 54,110 |
|
| 31,444 |
Home equity and other consumer |
| 40,214 |
|
| 22,859 |
|
| 171,518 |
|
| 90,925 |
Total originations closed | $ | 699,816 |
| $ | 572,111 |
|
|
|
|
|
|
Commercial and industrial originations decreased by $70 million, or 35%, to $129 million in 2021. This occurred because the Company recorded PPP loans in the commercial and industrial growth of $13.3category. PPP loan originations decreased from $159 million or 12%,in 2020 to $77 million in 2021.
Commercial and industrial (C&I) and commercial real estate growth of $17.9 million, or 9%.(CRE)
In 2019, management does not have the same loan growth expectations because the auto portfolio has reached the desired risk management levels. Going forward, the Company will maintain auto loan balances relative to its total risk-based capital level. However, the continued growth of all other loan and lease portfolios is fully anticipated.
We continue to emphasize relationship banking by providing products and services that are needed by our existing clients and new clients we are developing within our marketplace.
In 2018, the Company originated $26.0 million of commercial and industrial loans and $34.1 million of commercial real estate loans compared to $43.8 million and $23.9 million, respectively, net of loan participations in 2017. Also, during 2018, the Company originated $68.0 million of residential real estate loans compared to $63.2 million in 2017. Included in mortgage loans were $21.5 million of residential real estate construction lines in 2018 and $17.2 million in 2017. In 2018, the Company originated $77.1 million of consumer loans compared to $61.1 million in 2017. Of the consumer loan originations, $62.3 million were dealer loans in the auto and leases portfolio in 2018 compared to $50.1 million in 2017. In
addition for 2018, the Company had originations of lines of credit in the amounts of $61.0 million for commercial borrowers and $17.9 million in home equity and other consumer lines of credit.
Commercial and industrial and commercial real estate
As of December 31, 2018,2021, the commercial loan portfolio recognized net growth of $31.2increased by $156 million, or 10%24%, compared to $819 million over the
December 31, 2017. This2020 balance of $663 million due to $145 million in growth in the acquired portfolio and $11 million in growth in the originated portfolio. Excluding the $98 million reduction in originated PPP loans (net of deferred fees) during the twelve months ended December 31, 2021, the originated commercial portfolio grew $110 million due to the origination of several large CRE loans during the year along with increased overall lending activity due to the Company’s larger size and market area.
The commercial loan portfolio consisted of $513 million in originated loans, including $32 million in originated PPP loans, and $306 million in loans acquired from MNB and Landmark, including $8 million in acquired PPP loans, as of December 31, 2021.
Paycheck Protection Program Loans
The Coronavirus Aid, Relief, and Economic Security Act, or CARES Act, was largelysigned into law on March 27, 2020, and provided over $2.0 trillion in emergency economic relief to individuals and businesses impacted by the COVID-19 pandemic. The CARES Act authorized the Small Business Administration (SBA) to temporarily guarantee loans under a new 7(a) loan program called the Paycheck Protection Program (PPP).
As a qualified SBA lender, the Company was automatically authorized to originate PPP loans, and during the second and third quarter of 2020, the Company originated 1,551 loans totaling $159 million under the Paycheck Protection Program.
Under the PPP, the entire principal amount of the borrower’s loan, including any accrued interest, is eligible to be reduced by the loan forgiveness amount, so long as the employer maintains or quickly rehires employees and maintains salary levels and 60% of the loan proceeds are used for payroll expenses, with the remaining 40% of the loan proceeds used for other qualifying expenses.
As part of the Economic Relief Act, which became law on December 27, 2020, an additional $284 billion of federal resources was allocated to a reauthorized and revised PPP. On January 19, 2021, the Company began processing and originating PPP loans for this second round, which subsequently ended on May 31, 2021, and during this round, the Company originated 1,022 loans totaling $77 million.
Beginning in the fourth quarter of 2020 and continuing during 2021, the Company submitted PPP forgiveness applications to the SBA, and through December 31, 2021, the Company received forgiveness or paydowns of $203 million, or 86%, of the original PPP loan balances of $236 million with $176 million occurring during the twelve months ended December 31, 2021.
As a PPP lender, the Company received fee income of approximately $9.9 million with $8.7 million recognized to date, including $3.3 million of PPP fee income recognized during 2020 and $5.4 million recognized during 2021. Unearned fees attributed to PPP loans, net of $0.1 million in fees paid to referral sources as prescribed by the commercial real estate categorySBA under the PPP, were $1.2 million as of $17.9December 31, 2021.
The PPP loans originated by size were as follows as of December 31, 2021:
|
|
|
|
|
|
|
|
|
|
|
|
|
|
|
|
|
|
|
|
|
|
|
|
(dollars in thousands) | Balance originated |
| Current balance |
| Total SBA fee |
| SBA fee recognized |
$150,000 or less | $ | 76,594 |
| $ | 12,877 |
| $ | 4,866 |
| $ | 4,085 |
Greater than $150,000 but less than $2,000,000 |
| 128,082 |
|
| 20,331 |
|
| 4,765 |
|
| 4,254 |
$2,000,000 or higher |
| 31,656 |
|
| - |
|
| 316 |
|
| 316 |
Total PPP loans originated | $ | 236,332 |
| $ | 33,208 |
| $ | 9,947 |
| $ | 8,655 |
|
|
|
|
|
|
|
|
|
|
|
|
The table above does not include the $20.3 million or 9%,in PPP loans acquired because of the merger with Landmark during the owner occupied category increasing $14.7 million, or 13%.third quarter of 2021. As of December 31, 2021, the balance of outstanding acquired PPP loans was $7.9 million.
Consumer
The consumer loan portfolio grew 20%, or $33.4 million, from $169.7 million at December 31, 2017 to $203.1 million at December 31, 2018. The growth was largely supported by a 34%, or $28.0 million, increase in auto loans and leases. A shift to fixed rate products due to a rising rate environment was realized asconsisted of home equity installment, home equity line of credit, balances slidautomobile, direct finance leases and other consumer loans.
As of December 31, 2021, the consumer loan portfolio increased by 1%$39 million, or 18%, or $0.8 million. Offsetting this was fixed rateto $255 million compared to the December 31, 2020 balance of $216 million, due to $27 million in growth in the acquired portfolio, primarily automobile, related to the Landmark merger and $12 million in growth in the originated portfolio, specifically from the home equity installmentline of credit and direct finance lease portfolios.
Residential
As of December 31, 2021, the residential loan portfolio increased by $119 million, or 49%, to $361 million compared to the December 31, 2020 balance of $242 million. For the twelve months ended December 31, 2021, $25 million in was attributed to loans acquired in the Landmark merger and $94 million in growth of 20%, or $5.4 million.originated mainly in the Company’s service area spurred by a historically low interest rate environment, strong demand for residential loans and management’s decision to retain potentially saleable mortgages.
The residential loan portfolio grew approximately $14.9consisted primarily of held-for-investment residential loans for primary residences. Originated loans totaled $298 million or 10%, from $146.8and acquired loans totaled $63 million atas of December 31, 20172021 compared to $161.7originated loans of $204 million atand acquired loans of $38 million as of December 31, 2018. Held-for-investment2020.
The Company’s service team is experienced, knowledgeable, and construction real estate mortgages both demonstrated growth overdedicated to servicing the course of 2018. Held-for-investment residentialcommunity and its clients. The Company will continue to provide products and services that benefit our clients as well as the community which is very important to our success. There is much uncertainty regarding the effects COVID-19 may have on demand for loans grew $9.1 million from $136.9 millionand leases. The Company has been proactively trying to $146.0 million and construction loan balances grew $5.8 million from $9.9 millionreach out to $15.7 million. Held-for-investment real estate makes up approximately 90% of the total residential portfolio at December 31, 2018.customers to understand their needs during this crisis.
A comparison of loans and related percentage of gross loans, at December 31, for the five previous periods is as follows:
| | | | | | | | | | | | | | | | | | | | | | | | | |
|
|
|
|
|
|
|
|
|
| 2018 | | 2017 | | 2016 | | 2015 | | 2014 | 2021 |
| 2020 |
(dollars in thousands) | Amount | | % | | Amount | | % | | Amount | | % | | Amount | | % | | Amount | | % | Amount |
| % |
| Amount |
| % |
| | | | | | | | | | | | | | | | | | | | | | | | | | |
Commercial and industrial | $ | 126,884 | | 17.7 | % | | $ | 113,601 | | 17.8 | % | | $ | 98,477 | | 16.5 | % | | $ | 102,653 | | 18.4 | % | | $ | 80,301 | | 15.6 | % | $ | 236,304 |
| 16.5 | % |
| $ | 280,757 |
| 25.0 | % |
Commercial real estate: | | | | | | | | | | | | | | | | | | | | | | | | | |
|
|
|
|
|
|
|
|
|
Non-owner occupied | | 95,515 | | 13.3 | | | 92,851 | | 14.5 | | | 87,220 | | 14.5 | | | 95,745 | | 17.2 | | | 94,771 | | 18.4 | |
| 312,848 |
| 21.8 |
| 192,143 |
| 17.1 |
|
Owner occupied | | 124,092 | | 17.3 | | | 109,383 | | 17.1 | | | 113,104 | | 18.9 | | | 101,652 | | 18.3 | | | 95,780 | | 18.5 | |
| 248,755 |
| 17.3 |
| 179,923 |
| 16.1 |
|
Construction | | 6,761 | | 0.9 | | | 6,228 | | 1.0 | | | 3,987 | | 0.7 | | | 4,481 | | 0.8 | | | 5,911 | | 1.1 | |
| 21,147 |
| 1.5 |
| 10,231 |
| 0.9 |
|
Consumer: | | | | | | | | | | | | | | | | | | | | | | | | | |
|
|
|
|
|
|
|
|
|
Home equity installment | | 32,729 | | 4.6 | | | 27,317 | | 4.3 | | | 28,466 | | 4.8 | | | 30,935 | | 5.6 | | | 32,819 | | 6.4 | |
| 47,571 |
| 3.3 |
| 40,147 |
| 3.6 |
|
Home equity line of credit | | 52,517 | | 7.3 | | | 53,273 | | 8.3 | | | 51,609 | | 8.6 | | | 48,060 | | 8.7 | | | 42,188 | | 8.2 | |
| 54,878 |
| 3.8 |
| 49,725 |
| 4.4 |
|
Auto and leases | | 111,496 | | 15.5 | | | 83,510 | | 13.1 | | | 56,841 | | 9.5 | | | 29,758 | | 5.3 | | | 27,972 | | 5.4 | | |
Auto | |
| 118,029 |
| 8.2 |
| 98,386 |
| 8.8 |
|
Direct finance leases | |
| 26,232 |
| 1.8 |
| 20,095 |
| 1.8 |
|
Other | | 6,314 | | 0.9 | | | 5,604 | | 0.9 | | | 13,301 | | 2.2 | | | 6,208 | | 1.1 | | | 6,501 | | 1.3 | |
| 8,013 |
| 0.6 |
| 7,602 |
| 0.7 |
|
Residential: | | | | | | | | | | | | | | | | | | | | | | | | | |
|
|
|
|
|
|
|
|
|
Real estate | | 145,951 | | 20.3 | | | 136,901 | | 21.5 | | | 134,475 | | 22.5 | | | 126,992 | | 22.8 | | | 119,154 | | 23.1 | |
| 325,861 |
| 22.8 |
| 218,445 |
| 19.5 |
|
Construction | | 15,749 | | 2.2 | | | 9,931 | | 1.5 | | | 10,496 | | 1.8 | | | 10,060 | | 1.8 | | | 10,298 | | 2.0 | |
| 34,919 |
| 2.4 |
| 23,357 |
| 2.1 |
|
Gross loans | | 718,008 | | 100.0 | % | | 638,599 | | 100.0 | % | | 597,976 | | 100.0 | % | | 556,544 | | 100.0 | % | | 515,695 | | 100.0 | % |
| 1,434,557 |
| 100.0 | % |
| 1,120,811 |
| 100.0 | % |
Less: | | | | | | | | | | | | | | | | | | | | | | | | | |
|
|
|
|
|
|
|
|
|
Allowance for loan losses | | (9,747) | | | | | (9,193) | | | | | (9,364) | | | | | (9,527) | | | | | (9,173) | | | |
| (15,624) |
|
|
|
| (14,202) |
|
|
|
Unearned lease revenue | | (1,028) | | | | | (639) | | | | | (482) | | | | | (335) | | | | | (195) | | | |
| (1,429) |
|
|
|
| (1,159) |
|
|
|
Net loans | $ | 707,233 | | | | | $ | 628,767 | | | | | $ | 588,130 | | | | | $ | 546,682 | | | | | $ | 506,327 | | | | $ | 1,417,504 |
|
|
| $ | 1,105,450 |
|
|
|
| | | | | | | | | | | | | | | | | | | | | | | | | |
|
|
|
|
|
|
|
|
|
|
Loans held-for-sale | $ | 5,707 | | | | | $ | 2,181 | | | | | $ | 2,854 | | | | | $ | 1,421 | | | | | $ | 1,161 | | | | $ | 31,727 |
|
|
| $ | 29,786 |
|
|
|
| |
|
|
|
|
|
|
|
|
|
|
|
|
|
|
|
|
|
|
|
|
|
|
|
|
|
|
|
|
| 2019 |
| 2018 |
| 2017 |
(dollars in thousands) | Amount |
| % |
| Amount |
| % |
| Amount |
| % |
Commercial and industrial | $ | 122,594 |
| 16.2 | % |
| $ | 126,884 |
| 17.4 | % |
| $ | 113,601 |
| 17.5 | % |
Commercial real estate: |
|
|
|
|
|
|
|
|
|
|
|
|
|
|
|
|
|
Non-owner occupied |
| 99,801 |
| 13.2 |
|
|
| 95,515 |
| 13.1 |
|
|
| 92,851 |
| 14.3 |
|
Owner occupied |
| 130,558 |
| 17.3 |
|
|
| 124,092 |
| 17.0 |
|
|
| 109,383 |
| 16.9 |
|
Construction |
| 4,654 |
| 0.6 |
|
|
| 6,761 |
| 0.9 |
|
|
| 6,228 |
| 1.0 |
|
Consumer: |
|
|
|
|
|
|
|
|
|
|
|
|
|
|
|
|
|
Home equity installment |
| 36,631 |
| 4.9 |
|
|
| 32,729 |
| 4.5 |
|
|
| 27,317 |
| 4.2 |
|
Home equity line of credit |
| 47,282 |
| 6.3 |
|
|
| 52,517 |
| 7.2 |
|
|
| 53,273 |
| 8.2 |
|
Auto |
| 105,870 |
| 14.0 |
|
|
| 105,576 |
| 14.5 |
|
|
| 79,340 |
| 12.3 |
|
Direct finance leases |
| 16,355 |
| 2.2 |
|
|
| 17,004 |
| 2.3 |
|
|
| 13,575 |
| 2.1 |
|
Other |
| 5,634 |
| 0.7 |
|
|
| 6,314 |
| 0.9 |
|
|
| 5,604 |
| 0.9 |
|
Residential: |
|
|
|
|
|
|
|
|
|
|
|
|
|
|
|
|
|
Real estate |
| 167,164 |
| 22.2 |
|
|
| 145,951 |
| 20.0 |
|
|
| 136,901 |
| 21.1 |
|
Construction |
| 17,770 |
| 2.4 |
|
|
| 15,749 |
| 2.2 |
|
|
| 9,931 |
| 1.5 |
|
Gross loans |
| 754,313 |
| 100.0 | % |
|
| 729,092 |
| 100.0 | % |
|
| 648,004 |
| 100.0 | % |
Less: |
|
|
|
|
|
|
|
|
|
|
|
|
|
|
|
|
|
Allowance for loan losses |
| (9,747) |
|
|
|
|
| (9,747) |
|
|
|
|
| (9,193) |
|
|
|
Unearned lease revenue |
| (903) |
|
|
|
|
| (1,028) |
|
|
|
|
| (639) |
|
|
|
Net loans | $ | 743,663 |
|
|
|
| $ | 718,317 |
|
|
|
| $ | 638,172 |
|
|
|
|
|
|
|
|
|
|
|
|
|
|
|
|
|
|
|
|
|
Loans held-for-sale | $ | 1,643 |
|
|
|
| $ | 5,707 |
|
|
|
| $ | 2,181 |
|
|
|
The following table sets forth the maturity distribution of select commercial and construction components of the loan portfolio at December 31, 2018.2021. The determination of maturities is based on contractual terms. Non-contractual rollovers or extensions are included in one year or less category of the maturity classification. Excluded from the table are residential real estate and consumer loans:
| | | | | | | | |
|
|
|
|
|
|
|
|
|
|
| | | | More than | | | | |
|
|
| More than |
| More than |
|
|
|
|
| One year | | one year to | | More than | | | One year |
| one year to |
| five years to |
| More than |
|
|
(dollars in thousands) | or less | | five years | | five years | | Total | or less |
| five years |
| fifteen years |
| fifteen years |
| Total |
Commercial and industrial | $ | 56,364 | | $ | 29,188 | | $ | 41,332 | | $ | 126,884 | $ | 51,545 |
| $ | 92,608 |
| $ | 56,183 |
| $ | 35,968 |
| $ | 236,304 |
Commercial real estate | | 78,379 | | | 114,287 | | | 26,941 | | | 219,607 |
| 42,236 |
|
| 49,593 |
| 322,870 |
|
| 146,905 |
|
| 561,604 |
Commercial real estate construction * | | 6,761 | | | - | | | - | | | 6,761 |
| 21,147 |
|
| - |
| - |
|
| - |
|
| 21,147 |
Residential real estate construction * | | 15,749 | | | - | | | - | | | 15,749 |
| 34,919 |
|
| - |
| - |
|
| - |
|
| 34,919 |
Total | $ | 157,253 | | $ | 143,475 | | $ | 68,273 | | $ | 369,001 | $ | 149,847 |
| $ | 142,201 |
| $ | 379,053 |
| $ | 182,873 |
| $ | 853,974 |
*In the table above, both residential and CRE construction loans are included in the one year or less category since, by their nature, these loans are converted into residential and CRE loans within one year from the date the real estate construction loan was consummated. Upon conversion, the residential and CRE loans would normally mature after five years.
The following table sets forth the total amount of C&I and CRE loans due after one year which have predetermined interest rates (fixed) and floating or adjustable interest rates (variable) as of December 31, 2018:2021:
| | | | | | |
|
|
|
|
|
|
|
|
| One to five | | More than | | | One to five |
| Five to |
| Over |
|
|
(dollars in thousands) | years | | five years | | Total | years |
| fifteen years |
| fifteen years |
| Total |
| | | | | | |
|
|
|
|
|
|
|
|
Fixed interest rate | $ | 26,269 | | $ | 39,706 | | $ | 65,975 | $ | 102,557 |
| $ | 48,808 |
| $ | 27,354 |
| $ | 178,719 |
Variable interest rate | | 117,206 | | | 28,567 | | | 145,773 |
| 39,644 |
|
| 330,245 |
|
| 155,519 |
|
| 525,408 |
Total | $ | 143,475 | | $ | 68,273 | | $ | 211,748 | $ | 142,201 |
| $ | 379,053 |
| $ | 182,873 |
| $ | 704,127 |
Non-refundable fees and costs associated with all loan originations are deferred. Using either the interest method or straight-line amortization, the deferral is released as credits or charges to loan interest income over the life of the loan.
There are no concentrations of loans or customers to a number ofseveral borrowers engaged in similar industries exceeding 10% of total loans that are not otherwise disclosed as a category in the tables above. There are no concentrations of loans that, if resulted in a loss, would have a material adverse effect on the business of the Company. The Company’s loan portfolio does not have a material concentration within a single industry or group of related industries or customers that is vulnerable to the risk of a near-term severe negative business impact. As of December 31, 2018,2021, approximately 79%75% of the gross loan portfolio was secured by real estate compared to 69%66% at December 31, 20172020 and 73%67% at December 31, 2016. The auto and lease portfolio was 15.5% of the gross loan portfolio at December 31, 2018, increasing from 13.1% at December 31, 2017 and 9.5% at December 31, 2016. We do not anticipate the auto and lease portfolio to grow as a percent of gross loans for 2019.
The Company considers its portfolio segmentation, including the real estate secured portfolio, to be normal and reasonably diversified. The banking industry is affected by general economic conditions including, among other things, the effects of real estate values. The Company ensures that its mortgage lending adheres to standards of secondary market compliance. Furthermore, the Company’s credit function strives to mitigate the negative impact of economic conditions by maintaining strict underwriting principles for all loan types.
Loans held-for-sale
Upon origination, most residential mortgages and certain Small Business Administration (SBA) guaranteed loans may be classified as held-for-sale (HFS). In the event of market rate increases, fixed-rate loans and loans not immediately scheduled to re-price would no longer produce yields consistent with the current market. In declining interest rate environments, the Company would be exposed to prepayment risk as rates on fixed-rate loans decrease, and customers look to refinance loans. Consideration is given to the Company’s current liquidity position and projected future liquidity needs. To better manage prepayment and interest rate risk, loans that meet these conditions may be classified as HFS. Occasionally, residential mortgage and/or other nonmortgage loans may be transferred from the loan portfolio to HFS. The carrying value of loans HFS is based on the lower of cost or estimated fair value. If the fair values of these loans decline below their original cost, the difference is written down and charged to current earnings. Subsequent appreciation in the portfolio is credited to current earnings but only to the extent of previous write-downs.
As of December 31, 20182021 and 2017,2020, loans HFS consisted of residential mortgages with carrying amounts of $5.7$31.7 million and $2.2$29.8 million, respectively, which approximated their fair values. During the year ended December 31, 2018,2021, residential mortgage loans with principal balances of $32.1$159.8 million were sold into the secondary market and the Company recognized net gains of $0.6$4.1 million, compared to $40.7$155.1 million and $0.8$3.5 million, respectively, during the year ended December 31, 2017.2020. During the year ended December 31, 2018,2021, the Company also sold one SBA guaranteed loan with a principal balance of $0.4$0.2 million and recognized a net gain of $24 thousand compared to one SBA guaranteed loan with a principal balance of $0.6 million and recognized a net gain on the sale of $47$93 thousand compared to $2.4 million and $100 thousand, respectively, during the year ended December 31, 2017. 2020.
During 2021, management decided to hold mortgages HFS longer to earn interest income. Management completed a $13 million transfer of mortgages HFS to the held-for-investment portfolio during the first quarter of 2022.
The Company retains mortgage servicing rights (MSRs) on loans sold into the secondary market. MSRs are retained so that the Company can foster personal relationships. At December 31, 20182021 and 2017,2020, the servicing portfolio balance of sold residential mortgage loans was $304.9$430.9 million and $299.3$366.5 million, respectively. At December 31, 2018 and 2017, therespectively, with mortgage servicing portfolio balancerights of sold SBA loans was $5.5$1.7 million and $5.6$1.3 million for the same periods, respectively.
Allowance for loan losses
Management evaluates the credit quality of the Company’s loan portfolio and performs a formal review of the adequacy of the allowance for loan losses (the allowance)(allowance) on a quarterly basis. The allowance reflects management’s best estimate of the amount of credit losses in the loan portfolio. Management’s judgment is based on the evaluation of individual loans, past experience, the assessment of current economic conditions and other relevant factors including the amounts and timing of cash flows expected to be received on impaired loans. Those estimates may be susceptible to significant change. The provision for loan losses represents the amount necessary to maintain an appropriate allowance. Loan losses are charged directly against the allowance when loans are deemed to be uncollectible. Recoveries from previously charged-off loans are added to the allowance when received.
Management applies two primary components during the loan review process to determine proper allowance levels. The two components are a specific loan loss allocation for loans that are deemed impaired and a general loan loss allocation for those loans not specifically allocated. The methodology to analyze the adequacy of the allowance for loan losses is as follows:
| ·
| | identification of specific impaired loans by loan category;
|
| ·
| | calculation of specific allowances where required for the impaired loans based on collateral and other objective and quantifiable evidence;
|
| ·
| | determination of loans with similar credit characteristics within each class of the loan portfolio segment and eliminating the impaired loans;
|
| ·
| | application of historical loss percentages (trailing twelve-quarter average) to pools to determine the allowance allocation;
|
| ·
| | application of qualitative factor adjustment percentages to historical losses for trends or changes in the loan portfolio, regulations, and/or current economic conditions.
|
identification of specific impaired loans by loan category;
calculation of specific allowances where required for the impaired loans based on collateral and other objective and quantifiable evidence;
determination of loans with similar credit characteristics within each class of the loan portfolio segment and eliminating the impaired loans;
application of historical loss percentages (trailing twelve-quarter average) to pools to determine the allowance allocation; and
application of qualitative factor adjustment percentages to historical losses for trends or changes in the loan portfolio, regulations, and/or current economic conditions.
A key element of the methodology to determine the allowance is the Company’s credit risk evaluation process, which includes credit risk grading of individual commercial loans. Commercial loans are assigned credit risk grades based on the Company’s assessment of conditions that affect the borrower’s ability to meet its contractual obligations under the loan agreement. That process includes reviewing borrowers’ current financial information, historical payment experience, credit documentation, public information and other information specific to each individual borrower. Upon review, the commercial loan credit risk grade is revised or reaffirmed. The credit risk grades may be changed at any time management determines an upgrade or downgrade may be warranted. The credit risk grades for the commercial loan portfolio are taken into accountconsidered in the reserve methodology and loss factors are applied based upon the credit risk grades. The loss factors applied are based upon the Company’s historical experience as well as what management believes to be best practices and within common industry standards. Historical experience reveals there is a direct correlation between the credit risk grades and loan charge-offs. The changes in allocations in the commercial loan portfolio from period-to-period are based upon the credit risk grading system and from periodic reviews of the loan portfolio.
Acquired loans are initially recorded at their acquisition date fair values with no carryover of the existing related allowance for loan losses. Fair values are based on a discounted cash flow methodology that involves assumptions and judgements as to credit risk, expected lifetime losses, environmental factors, collateral values, discount rates, expected payments and expected prepayments. Upon acquisition, in accordance with GAAP, the Company has individually determined whether each acquired loan is within the scope of ASC 310-30. These loans are deemed purchased credit impaired loans and the excess of cash flows expected at acquisition over the estimated fair value is referred to as the accretable discount and is recognized into interest income over the remaining life of the loan. The difference between contractually required payments at acquisition and the cash flows expected to be collected at acquisition is referred to as the non-accretable discount.
Acquired ASC 310-20 loans, which are loans that did not meet the criteria of ASC 310-30, were pooled into groups of similar loans based on various factors including borrower type, loan purpose, and collateral type. These loans are initially recorded at fair value and include credit and interest rate marks associated with purchase accounting adjustments. Purchase premiums or discounts are subsequently amortized as an adjustment to yield over the estimated contractual lives of the loans. There is no allowance for loan losses established at the acquisition date for acquired performing loans. An allowance for loan losses is recorded for any credit deterioration in these loans after acquisition.
Each quarter, management performs an assessment of the allowance for loan losses. The Company’s Special Assets Committee meets quarterly, and the applicable lenders discuss each relationship under review and reach a consensus on the appropriate estimated loss amount, if applicable, based on current accounting guidance. The Special Assets Committee’s focus is on ensuring the pertinent facts are considered regarding not only loans considered for specific reserves, but also the collectability of loans that may be past due. The assessment process also includes the review of all loans on non-accrual status as well as a review of certain loans to which the lenders or the Credit Administration function have assigned a criticized or classified risk rating.
The following table sets forth the activity in the allowance for loan losses and certain key ratios for the periods indicated:
| | | | | | | | | | | | | | | |
|
|
|
|
|
|
|
|
|
|
|
|
|
|
|
| | | | | | | | | | |
|
|
|
|
|
|
|
|
|
|
| | | | | | | | | | |
|
|
|
|
|
|
|
|
|
|
(dollars in thousands) | 2018 | 2017 | 2016 | 2015 | | 2014 | | 2021 | 2020 | 2019 | 2018 |
| 2017 |
|
| | | | | | | | | | | | | | | |
|
|
|
|
|
|
|
|
|
|
|
|
|
|
|
Balance at beginning of period | $ | 9,193 | | $ | 9,364 | | $ | 9,527 | | $ | 9,173 | | $ | 8,928 | | $ | 14,202 |
| $ | 9,747 |
| $ | 9,747 |
| $ | 9,193 |
| $ | 9,364 |
|
| | | | | | | | | | | | | | | |
|
|
|
|
|
|
|
|
|
|
|
|
|
|
|
Charge-offs: | | | | | | | | | | | | | | | |
|
|
|
|
|
|
|
|
|
|
|
|
|
|
|
Commercial and industrial | | (196) | | | (143) | | | (224) | | | (25) | | | (309) | |
| (130) |
|
| (372) |
|
| (184) |
|
| (196) |
|
| (143) |
|
Commercial real estate | | (268) | | | (635) | | | (592) | | | (432) | | | (239) | |
| (491) |
|
| (465) |
|
| (597) |
|
| (268) |
|
| (635) |
|
Consumer | | (391) | | | (658) | | | (504) | | | (437) | | | (361) | |
| (206) |
|
| (296) |
|
| (398) |
|
| (391) |
|
| (658) |
|
Residential | | (371) | | | (309) | | | (60) | | | (15) | | | (93) | |
| (162) |
|
| (35) |
|
| (330) |
|
| (371) |
|
| (309) |
|
Total | | (1,226) | | | (1,745) | | | (1,380) | | | (909) | | | (1,002) | |
| (989) |
|
| (1,168) |
|
| (1,509) |
|
| (1,226) |
|
| (1,745) |
|
| | | | | | | | | | | | | | | |
|
|
|
|
|
|
|
|
|
|
|
|
|
|
|
Recoveries: | | | | | | | | | | | | | | | |
|
|
|
|
|
|
|
|
|
|
|
|
|
|
|
Commercial and industrial | | 77 | | | 10 | | | 55 | | | 47 | | | 32 | |
| 23 |
|
| 26 |
|
| 32 |
|
| 77 |
|
| 10 |
|
Commercial real estate | | 42 | | | 47 | | | 37 | | | 18 | | | 91 | |
| 250 |
|
| 30 |
|
| 317 |
|
| 42 |
|
| 47 |
|
Consumer | | 211 | | | 67 | | | 100 | | | 95 | | | 30 | |
| 138 |
|
| 120 |
|
| 67 |
|
| 211 |
|
| 67 |
|
Residential | | - | | | - | | | - | | | 28 | | | 34 | |
| - |
|
| 197 |
|
| 8 |
|
| - |
|
| - |
|
Total | | 330 | | | 124 | | | 192 | | | 188 | | | 187 | |
| 411 |
|
| 373 |
|
| 424 |
|
| 330 |
|
| 124 |
|
Net charge-offs | | (896) | | | (1,621) | | | (1,188) | | | (721) | | | (815) | |
| (578) |
|
| (795) |
|
| (1,085) |
|
| (896) |
|
| (1,621) |
|
Provision for loan losses | | 1,450 | | | 1,450 | | | 1,025 | | | 1,075 | | | 1,060 | |
| 2,000 |
|
| 5,250 |
|
| 1,085 |
|
| 1,450 |
|
| 1,450 |
|
Balance at end of period | $ | 9,747 | | $ | 9,193 | | $ | 9,364 | | $ | 9,527 | | $ | 9,173 | | $ | 15,624 |
| $ | 14,202 |
| $ | 9,747 |
| $ | 9,747 |
| $ | 9,193 |
|
| | | | | | | | | | | | | | | |
|
|
|
|
|
|
|
|
|
|
|
|
|
|
|
Allowance for loan losses to total loans | | 1.36 | % | | 1.44 | % | | 1.57 | % | | 1.71 | % | | 1.78 | % |
| 1.09 | % |
| 1.27 | % |
| 1.29 | % |
| 1.34 | % |
| 1.42 | % |
Net charge-offs to average total loans outstanding | | 0.13 | % | | 0.26 | % | | 0.21 | % | | 0.13 | % | | 0.16 | % |
| 0.04 | % |
| 0.08 | % |
| 0.15 | % |
| 0.13 | % |
| 0.25 | % |
Average total loans | $ | 677,726 | | $ | 630,960 | | $ | 568,953 | | $ | 534,903 | | $ | 495,758 | | $ | 1,299,960 |
| $ | 1,019,373 |
| $ | 732,152 |
| $ | 687,853 |
| $ | 639,477 |
|
Loans 30 - 89 days past due and accruing | $ | 5,891 | | $ | 2,893 | | $ | 2,241 | | $ | 3,707 | | $ | 3,932 | | $ | 1,982 |
| $ | 1,598 |
| $ | 1,366 |
| $ | 5,938 |
| $ | 2,893 |
|
Loans 90 days or more past due and accruing | $ | 1 | | $ | 6 | | $ | 19 | | $ | 356 | | $ | 1,060 | | $ | 64 |
| $ | 61 |
| $ | - |
| $ | 1 |
| $ | 6 |
|
Non-accrual loans | $ | 4,298 | | $ | 3,441 | | $ | 7,370 | | $ | 9,003 | | $ | 4,215 | | $ | 2,949 |
| $ | 3,769 |
| $ | 3,674 |
| $ | 4,298 |
| $ | 3,441 |
|
Allowance for loan losses to non-accrual loans | | 2.27 | x | | 2.67 | x | | 1.27 | x | | 1.06 | x | | 2.18 | x |
| 5.30 | x |
| 3.77 | x |
| 2.65 | x |
| 2.27 | x |
| 2.67 | x |
Allowance for loan losses to non-performing loans | | 2.27 | x | | 2.67 | x | | 1.27 | x | | 1.02 | x | | 1.74 | x |
| 5.19 | x |
| 3.71 | x |
| 2.65 | x |
| 2.27 | x |
| 2.67 | x |
| | | | | | | | | | | | | | | |
|
|
|
|
|
|
|
|
|
|
|
|
|
|
|
For the twelve months ended December 31, 2021, the allowance increased $1.4 million, or 10%, to $15.6 million from $14.2 million at December 31, 2020 due to provisioning of $2.0 million partially offset by $0.6 million in net charge-offs. The allowance for loan and lease losses was $9.7 milliondecreased as a percentage of total loans to 1.09% from 1.27% at December 31, 2018 compared to $9.2 million at December 31, 2017. Relative to2020 as the growth in the loan portfolio the allowance decreased from 1.44% of total loans at December 31, 2017 to 1.36% at December 31, 2018, as loan growth(28%) outpaced the highergrowth in the allowance for loan losses. The actual allowance increased $0.5 million, or 6%,losses (10%) during 2018, while total loans increased $79.0 million, or 12%, over the same time period. The decline in
Loans acquired from the Merchants and Landmark mergers (performing and non-performing) were initially recorded at their acquisition-date fair values. Since there is no initial credit valuation allowance relativerecorded under this method, the Company establishes a post-acquisition allowance for loan losses to totalrecord losses which may subsequently arise on the acquired loans.
PPP loans made to eligible borrowers have a 100% SBA guarantee. Given this guarantee, no allowance for loan and lease losses was considered appropriate by management due to the strength of the Company’s asset quality.recorded for these loans.
During the first quarter of 2018, management reduced qualitative factors associated with owner occupied commercial real estate and home equity lines of credit due to lower levels of delinquency associated with these loan categories. During the fourth quarter of 2018, management reduced qualitative factors associated with auto loans and leases due to an improving trend in delinquency observed for this loan category. Otherwise, the qualitative factors remained unchanged for 2018.
The allocation of net charge-offs among major categories of loans are as follows for the periods indicated:
| | | | | | | | | | | |
| | | % of Total | | | | % of Total |
| | | Net | | | | Net |
(dollars in thousands) | 2018 | | Charge-offs | | 2017 | | Charge-offs |
| | | | | | | | | | | |
Net charge-offs | | | | | | | | | | | |
Commercial and industrial | $ | (119) | | 13 | % | | $ | (133) | | 8 | % |
Commercial real estate | | (226) | | 25 | | | | (588) | | 36 | |
Consumer | | (180) | | 20 | | | | (591) | | 37 | |
Residential | | (371) | | 42 | | | | (309) | | 19 | |
Total net charge-offs | $ | (896) | | 100 | % | | $ | (1,621) | | 100 | % |
| | | | | | | | | | | |
Net charge-offs against the allowance totaled $0.9 million for the year ended December 31, 2018 compared with $1.6 million for the year ended December 31, 2017, representing a $0.7 million, or 45%, decrease. The decline in net charge-offs was attributed to total charge-offs decreasing $0.5 million for 2018 compared to 2017, and total recoveries increasing $0.2 million over the same period. The $0.7 million decrease in net charge-offs coupled with the $46.8 million increase in average total loans caused net charge-offs to average total loans outstanding to decline from 0.26% at December 31, 2017 to 0.13% at December 31, 2018.
For the year ended December 31, 2018, allowance levels rose by $0.5 million to $9.7 million compared to $9.2 million at December 31, 2017, while total loans increased by $79.0 million to $717.0 million from $638.0 million at December 31, 2017. Management believes that the current balance in the allowance for loan losses is sufficient to meet the identified potential credit quality issues that may arise and other issues unidentified but inherent to the portfolio. Potential problem loans are those where there is known information that leads management to believe repayment of principal and/or interest is in jeopardy and the loans are currently neither on non-accrual status nor past due 90 days or more.
During the first quarter of 2021, management increased the qualitative factors associated with its commercial, consumer, and residential portfolios related to the rise in rates that occurred during the quarter, and the adverse impact that these increased rates are anticipated to have on estimated credit losses.
During the second quarter of 2021, management increased the qualitative factors associated with its commercial & industrial portfolio related to the rising delinquency observed during this period, which was on a worsening trend on both a quarter-over-quarter and year-over-year basis.
During the third quarter of 2021, management reduced the qualitative factors associated with its commercial, consumer, and residential portfolios related to the improvement in the economic environment compared to the prior period, which was attributed to the improving key risk indicators used in the analysis including national unemployment rate, personal consumer expenditures, industrial production and consumer sentiment.
During the fourth quarter of 2021, management reduced the qualitative factors associated with its commercial, consumer, and residential portfolios related to the sustained, low level of delinquency in these portfolios observed during the year and improvement compared to the year earlier period. Management also reduced the qualitative factors associated with its commercial portfolio related to the improvement in the key risk indicators used in the analysis including national unemployment rate, personal consumer expenditures, and industrial production.
The allocation of net charge-offs among major categories of loans are as follows for the periods indicated:
|
|
|
|
|
|
|
|
|
|
|
|
|
|
| % of Total |
|
|
| % of Total |
|
|
| Net |
|
|
| Net |
(dollars in thousands) | 2021 |
| Charge-offs |
| 2020 |
| Charge-offs |
Net charge-offs |
|
|
|
|
|
|
|
|
|
|
|
Commercial and industrial | $ | (107) |
| 18 | % |
| $ | (346) |
| 43 | % |
Commercial real estate |
| (241) |
| 42 |
|
|
| (435) |
| 55 |
|
Consumer |
| (68) |
| 12 |
|
|
| (176) |
| 22 |
|
Residential |
| (162) |
| 28 |
|
|
| 162 |
| (20) |
|
Total net charge-offs | $ | (578) |
| 100 | % |
| $ | (795) |
| 100 | % |
|
|
|
|
|
|
|
|
|
|
|
|
For the twelve months ended December 31, 2021, net charge-offs against the allowance totaled $578 thousand compared with net charge-offs of $795 thousand for the twelve months ended December 31, 2020, representing a $217 thousand, or 27%, decrease. This decrease was attributed to general economic improvement and continued high levels of liquidity for the Company’s customers.
For a discussion on the provision for loan losses, see the “Provision for loan losses,” located in the results of operations section of management’s discussion and analysis contained herein.
The allowance for loan losses can generally absorb losses throughout the loan portfolio. However, in some instances an allocation is made for specific loans or groups of loans. Allocation of the allowance for loan losses for different categories of loans is based on the methodology used by the Company, as previously explained. The changes in the allocations from period-to-period are based upon quarter-end reviews of the loan portfolio.
Allocation of the allowance among major categories of loans for the periods indicated, as well as the percentage of loans in each category to total loans, is summarized in the following table. This table should not be interpreted as an indication that charge-offs in future periods will occur in these amounts or proportions, or that the allocation indicates future charge-off trends. When present, the portion of the allowance designated as unallocated is within the Company’s guidelines:
| | | | | | | | | | | | | | | | | | | | | | | | | | | | | |
|
|
|
|
|
|
|
|
|
|
|
|
|
|
|
|
|
|
|
|
|
|
|
|
|
|
|
|
|
| | | | | | | | | | | | | | | | | | | | | | | | | | | | | |
|
|
|
|
|
|
|
|
|
|
|
|
|
|
|
|
|
|
|
|
|
|
|
|
|
|
|
|
|
| 2018 | | 2017 | | 2016 | | 2015 | | 2014 | 2021 |
| 2020 |
| 2019 |
| 2018 |
| 2017 |
| | | | Category | | | | | Category | | | | | Category | | | | | Category | | | | | Category |
|
|
| Category |
|
|
|
| Category |
|
|
|
| Category |
|
|
|
| Category |
|
|
|
| Category |
| | | | % of | | | | | % of | | | | | % of | | | | | % of | | | | | % of |
|
|
| % of |
|
|
|
| % of |
|
|
|
| % of |
|
|
|
| % of |
|
|
|
| % of |
(dollars in thousands) | Allowance | | Loans | | Allowance | | Loans | | Allowance | | Loans | | Allowance | | Loans | | Allowance | | Loans | Allowance |
| Loans |
| Allowance |
| Loans |
| Allowance |
| Loans |
| Allowance |
| Loans |
| Allowance |
| Loans |
Category | | | | | | | | | | | | | | | | | | | | | | | | | | | | | |
|
|
|
|
|
|
|
|
|
|
|
|
|
|
|
|
|
|
|
|
|
|
|
|
|
|
|
|
|
Commercial real estate | $ | 3,901 | | 32 | % | | $ | 4,060 | | 33 | % | | $ | 4,808 | | 35 | % | | $ | 5,014 | | 36 | % | | $ | 4,672 | | 38 | % | $ | 7,422 |
| 41 | % |
| $ | 6,383 |
| 34 | % |
| $ | 3,933 |
| 31 | % |
| $ | 3,901 |
| 31 | % |
| $ | 4,060 |
| 32 | % |
Commercial and industrial | | 1,432 | | 18 | | | | 1,374 | | 18 | | | | 1,131 | | 16 | | | | 1,336 | | 18 | | | | 1,052 | | 16 | |
| 2,204 |
| 16 |
|
|
| 2,407 |
| 25 |
|
|
| 1,484 |
| 16 |
|
|
| 1,432 |
| 18 |
|
|
| 1,374 |
| 17 |
|
Consumer | | 2,548 | | 28 | | | | 2,063 | | 26 | | | | 1,788 | | 24 | | | | 1,533 | | 21 | | | | 1,519 | | 21 | |
| 2,404 |
| 18 |
|
|
| 2,552 |
| 19 |
|
|
| 2,013 |
| 28 |
|
|
| 2,548 |
| 29 |
|
|
| 2,063 |
| 28 |
|
Residential real estate | | 1,844 | | 22 | | | | 1,608 | | 23 | | | | 1,357 | | 25 | | | | 1,407 | | 25 | | | | 1,316 | | 25 | |
| 3,508 |
| 25 |
|
|
| 2,781 |
| 22 |
|
|
| 2,278 |
| 25 |
|
|
| 1,844 |
| 22 |
|
|
| 1,608 |
| 23 |
|
Unallocated | | 22 | | - | | | | 88 | | - | | | | 112 | | - | | | | 237 | | - | | | | 614 | | - | |
| 86 |
| - |
|
|
| 79 |
| - |
|
|
| 39 |
| - |
|
|
| 22 |
| - |
|
|
| 88 |
| - |
|
Total | $ | 9,747 | | 100 | % | | $ | 9,193 | | 100 | % | | $ | 9,196 | | 100 | % | | $ | 9,527 | | 100 | % | | $ | 9,173 | | 100 | % | $ | 15,624 |
| 100 | % |
| $ | 14,202 |
| 100 | % |
| $ | 9,747 |
| 100 | % |
| $ | 9,747 |
| 100 | % |
| $ | 9,193 |
| 100 | % |
The allocationAs of the allowance forDecember 31, 2021, the commercial loan portfolio, which isconsisting of CRE and C&I loans, comprised of commercial real estate and commercial & industrial loans, accounted for approximately 55%62% of the total allowance for loan losses atcompared with 62% on December 31, 2018, which represents a four percentage point decrease from 59%2020. The commercial loan allowance allocation remained unchanged, and higher than the commercial loan allocation, due to the greater inherent risk in this portfolio.
As of December 31, 2021, the consumer loan portfolio comprised 15% of the total allowance for loan losses atcompared with 18% on December 31, 2017.2020. The 3-percentage point decrease in the consumer loan allowance allocated toallocation was the commercial loan portfolio was attributed to lower historical loss percentages applied to the commercial real estate portfolio as a result of the relative reduction in commercial real estate net charge-offs observed for 2018 versus 2017. The allowance also decreased when a previously impaired single commercial real estatethis loan that had a large specific impairment was reclassifiedcategory, which declined from 19% as of December 31, 2020 to performing status during18% as of December 31, 2021.
As of December 31, 2021, the fourth quarter of 2018.
The allocation of the allowance for the consumerresidential loan portfolio accounted for approximately 26% of the total allowance for loan losses at December 31, 2018, which represents a four percentage point increase fromcomprised 22% of the total allowance for loan losses atcompared with 19% on December 30, 2017. This higher allocation to31, 2020. The 3-percentage point increase was the consumer loan portfolio was mostly related to consumer loan growth, specifically in the Company’s auto portfolio, along with the addition of a consumer installment TDR loan with a large specific impairment in the first quarter of 2018.
The allocationresult of the allowance for the residential real estate portfolio, accounted for approximately 19%relative increase in this loan category, which increased from 22% as of the total allowance for loan losses at December 31, 2018, which represents a two percentage point increase from 17%2020 to 25% as of the total allowance for loan losses December 31, 2017. The increase in2021.
As of December 31, 2021, the allowance allocated to residential real estate was attributed to growth in this category of loans.
The unallocated amount representsreserve, representing the portion of the allowance not specifically identified with a loan or groups of loans. The unallocated reserve wasloans, less than 1% of the total allowance for loan losses at December 31, 2018, practically unchanged fromcompared with less than 1% of the total allowance for loan losses aton December 31, 2017. 2020.
Non-performing assets
The Company defines non-performing assets as accruing loans past due 90 days or more, non-accrual loans, TDRs,troubled debt restructurings (TDRs), other real estate owned (ORE) and repossessed assets. At December 31, 2018, non-performing assets represented 0.64% of total assets compared with 0.73% at December 31, 2017. The improvement in the ratio of non-performing assets to total assets was attributed to total asset growth of $117.5 million, or 14%, during 2018 while non-performing assets remained essentially unchanged at $6.3 million at December 31, 2017 and December 31, 2018.
The following table sets forth non-performing assets at December 31:
| | | | | | | | | | |
|
|
|
|
|
|
|
|
|
|
| | | | | | | | | | |
|
|
|
|
|
|
|
|
|
|
(dollars in thousands) | 2018 | | 2017 | | 2016 | | 2015 | | 2014 | 2021 |
| 2020 |
| 2019 |
| 2018 |
| 2017 |
| | | | | | | | | | |
|
|
|
|
|
|
|
|
|
|
Loans past due 90 days or more and accruing | $ | 1 | | $ | 6 | | $ | 19 | | $ | 356 | | $ | 1,060 | $ | 64 |
| $ | 61 |
| $ | - |
| $ | 1 |
| $ | 6 |
Non-accrual loans * | | 4,298 | | 3,441 | | 7,370 | | | 9,003 | | | 4,215 |
| 2,949 |
| 3,769 |
|
| 3,674 |
|
| 4,298 |
|
| 3,441 |
Total non-performing loans | | 4,299 | | 3,447 | | 7,389 | | | 9,359 | | | 5,275 |
| 3,013 |
| 3,830 |
|
| 3,674 |
|
| 4,299 |
|
| 3,447 |
Troubled debt restructurings | | 1,830 | | 1,871 | | 1,823 | | | 2,423 | | | 753 |
| 2,987 |
| 2,571 |
|
| 991 |
|
| 1,830 |
|
| 1,871 |
Other real estate owned and repossessed assets | | 190 | | 973 | | 1,306 | | | 1,074 | | | 1,972 |
| 434 |
| 256 |
|
| 369 |
|
| 190 |
|
| 973 |
Total non-performing assets | $ | 6,319 | | $ | 6,291 | | $ | 10,518 | | $ | 12,856 | | $ | 8,000 | $ | 6,434 |
| $ | 6,657 |
| $ | 5,034 |
| $ | 6,319 |
| $ | 6,291 |
| | | | | | | | | | | | |
|
|
|
|
|
|
|
|
|
|
|
|
|
Total loans, including loans held-for-sale | $ | 722,687 | | $ | 640,141 | | $ | 600,348 | | $ | 557,630 | | $ | 516,661 | $ | 1,464,855 |
| $ | 1,149,438 |
| $ | 755,053 |
| $ | 755,053 |
| $ | 733,771 |
Total assets | $ | 981,102 | | $ | 863,637 | | $ | 792,944 | | $ | 729,358 | | $ | 676,485 | $ | 2,419,104 |
| $ | 1,699,510 |
| $ | 1,009,927 |
| $ | 981,102 |
| $ | 863,637 |
Non-accrual loans to total loans | | 0.59% | | 0.54% | | 1.23% | | | 1.61% | | | 0.82% |
| 0.20% |
| 0.33% |
|
| 0.49% |
|
| 0.57% |
|
| 0.47% |
Non-performing loans to total loans | | 0.59% | | 0.54% | | 1.23% | | 1.68% | | 1.02% |
| 0.21% |
| 0.33% |
| 0.49% |
| 0.57% |
| 0.47% |
Non-performing assets to total assets | | 0.64% | | 0.73% | | 1.33% | | 1.76% | | 1.18% |
| 0.27% |
| 0.39% |
| 0.50% |
| 0.64% |
| 0.73% |
* In the table above, the amount includes non-accrual TDRs of $0.6 million, $0.7 million, $0.6 million, $1.7 million $1.6 million, $1.5 million and $0.9$1.6 million as of 2021, 2020, 2019, 2018 and 2017, 2016 and 2014, respectively. There were no non-accrual TDRs as of December 31, 2015.
InManagement routinely reviews the review of loans for both delinquency and collateral sufficiency, management concluded that there were a number ofloan portfolio to identify loans that lacked the abilityare either delinquent or are otherwise deemed by management unable to repay in accordance with contractual terms. The decision to placeGenerally, loans on non-accrual status is made on an individual basis after considering factors pertaining to each specific loan. Generally, commercial loansof all types are placed on non-accrual status when management has determined that paymentif a loan of all contractualany type is past due 90 or more days or if collection of principal and interest is in doubt or the loan is past due 90 days or more as to principal and interest, unless well-secured and in the process of collection. Consumer loans secured by residential real estate and residential mortgage loans are placed on non-accrual status at 120 days past due as to principal and interest, anddoubt. Further, unsecured consumer loans are charged-off when the loanprincipal and/or interest is 90 days or more past due as to principal and interest.due. Uncollected interest income accrued on all loans placed on non-accrual is reversed and charged to interest income.
Non-performing assets represented 0.27% of total assets at December 31, 2021 compared with 0.39% at December 31, 2020 with the improvement resulting from the $0.2 million, or 3%, decrease in non-performing assets, specifically non-accrual loans, coupled with the $720 million, or 42%, increase in total assets to $2.4 billion at December 31, 2021.
From December 31, 20172020 to December 31, 2018, non-performing2021, non-accrual loans which consistsdeclined $0.8 million, or 21%, from $3.8 million to $3.0 million. The $0.8 million decline in non-accrual loans was the result of accruing$1.3 million in payments, $0.7 million in charge-offs, $0.2 million in moves to ORE, and $0.2 million in moves back to accrual offset by $1.6 million in additions. At December 31, 2021, there were a total of 31 loans to 28 unrelated borrowers with balances that ranged from less than $1 thousand to $0.7 million. At December 31, 2020, there were a total of 46 loans to 38 unrelated borrowers with balances that ranged from less than $1 thousand to $0.5 million.
There were two direct finance leases totaling $64 thousand that were over 90 days past due as well as all non-accrual loans, increased from $3.4 million to $4.3 million, a $0.9 million, or 25%, increase. The rise in non-performing loans was the result of additions of $3.4 million and miscellaneous expenses totaling $0.1 million added to balances of respective non-accrual loans. These increases were partially offset by payments received of $0.9 million, charge-offs of $0.7 million, transfers back to accrual of $0.3 million and transfers to ORE of $0.7 million for all non-accrual loans.
From December 31, 20172021 compared to December 31, 2018, the portion of accruing loanstwo direct finance leases totaling $61 thousand that were over 90 days past due decreased from one loan totaling $6 thousand to three loans totaling $1 thousand. as of December 31, 2020. The delinquent direct finance leases are fully guaranteed under a formal recourse agreement with the originating auto dealer and were in process of orderly collection.
The Company seeks payments from all past due customers through an aggressive customer communication process. AUnless well-secured and in the process of collection, past due loanloans will be placed on non-accrual at the 90 day90-day point when it is deemed that a customer is non-responsive and uncooperative to collection efforts.
From December 31, 2017 to December 31, 2018, non-accrual loans increased by $0.9 million, or 25%, from $3.4 million to $4.3 million. At December 31, 2017, there were a total of 39 loans to 32 unrelated borrowers with balances that ranged from less than $1 thousand to $0.6 million. At December 31, 2018, there were a total of 40 loans to 34 unrelated borrowers with balances that ranged from less than $1 thousand to $0.6 million. The increase in non-accrual loans is primarily attributed to two loans to a single borrower, totaling $0.7 million, being placed on non-accrual status during the third quarter of 2018 along with two loans to a single borrower, totaling $0.8 million, being placed on non-accrual status during the fourth quarter of 2018.
The composition of non-performing loans as of December 31, 20182021 is as follows:
| | | | | | | | | | |
|
|
|
|
|
|
|
|
|
|
| | | | | | | | | | | | | |
|
|
|
|
|
|
|
|
|
|
|
|
|
| | | | | | | | | | |
|
|
|
|
|
|
|
|
|
|
| | | | Past due | | | | | | | | |
|
|
| Past due |
|
|
|
|
|
|
|
|
| Gross | | 90 days or | | Non- | | Total non- | | % of | Gross |
| 90 days or |
| Non- |
| Total non- |
| % of |
| loan | | more and | | accrual | | performing | | gross | loan |
| more and |
| accrual |
| performing |
| gross |
(dollars in thousands) | balances | | still accruing | | loans | | loans | | loans | balances |
| still accruing |
| loans |
| loans |
| loans |
Commercial and industrial | $ | 126,858 | | $ | - | | $ | 156 | | $ | 156 | | 0.12% | $ | 236,304 |
| $ | - |
| $ | 154 |
| $ | 154 |
| 0.07% |
Commercial real estate: | | | | | | | | | | | | | |
|
|
|
|
|
|
|
|
|
|
|
|
|
Non-owner occupied | | 95,541 | | | - | | | 472 | | | 472 | | 0.49% |
| 312,848 |
|
| - |
|
| 478 |
|
| 478 |
| 0.15% |
Owner occupied | | 124,092 | | | - | | | 1,634 | | | 1,634 | | 1.32% |
| 248,755 |
|
| - |
|
| 1,570 |
|
| 1,570 |
| 0.63% |
Construction | | 6,761 | | | - | | | - | | | - | | 0.00% |
| 21,147 |
|
| - |
|
| - |
|
| - |
| - |
Consumer: | | | | | | | | | | | | | |
|
|
|
|
|
|
|
|
|
|
|
|
|
Home equity installment | | 32,729 | | | - | | | 463 | | | 463 | | 1.41% |
| 47,571 |
|
| - |
|
| - |
|
| - |
| - |
Home equity line of credit | | 52,517 | | | - | | | 34 | | | 34 | | 0.06% |
| 54,878 |
|
| - |
|
| 97 |
|
| 97 |
| 0.18% |
Auto loans and leases * | | 110,468 | | | - | | | 25 | | | 25 | | 0.02% | |
Auto loans | |
| 118,029 |
|
| - |
|
| 78 |
|
| 78 |
| 0.07% |
Direct finance leases * | |
| 24,803 |
|
| 64 |
|
| - |
|
| 64 |
| 0.26% |
Other | | 6,314 | | | 1 | | | - | | | 1 | | 0.02% |
| 8,013 |
|
| - |
|
| - |
|
| - |
| - |
Residential: | | | | | | | | | | | | | |
|
|
|
|
|
|
|
|
|
|
|
|
|
Real estate | | 145,951 | | | - | | | 1,514 | | | 1,514 | | 1.04% |
| 325,861 |
|
| - |
|
| 572 |
|
| 572 |
| 0.18% |
Construction | | 15,749 | | | - | | | - | | | - | | - |
| 34,919 |
|
| - |
|
| - |
|
| - |
| - |
Loans held-for-sale | | 5,707 | | | - | | | - | | | - | | - |
| 31,727 |
|
| - |
|
| - |
|
| - |
| - |
| | | | | | | | | | | | | | |
Total | $ | 722,687 | | $ | 1 | | $ | 4,298 | | $ | 4,299 | | 0.59% | $ | 1,464,855 |
| $ | 64 |
| $ | 2,949 |
| $ | 3,013 |
| 0.21% |
| | | | | | | | | | | | | |
|
|
|
|
|
|
|
|
|
|
|
|
|
*Net of unearned lease revenue of $1.0$1.4 million.
Payments received from non-accrual loans are recognized on a cost recovery method. Payments are first applied to the outstanding principal balance, then to the recovery of any charged-off loan amounts. Any excess is treated as a recovery of interest income. If the non-accrual loans that were outstanding as of December 31, 20182021 had been performing in accordance with their original terms, the Company would have recognized interest income with respect to such loans of $303$169 thousand.
The following tables set forth the activity in accruing and non-accruing TDRs as of the period indicated:
| | | | | | | | | | | | | | | | | | |
|
|
|
|
|
|
|
|
| | | | | | | | | | | | | | | | | | |
|
|
|
|
|
|
|
|
As of and for the year ended December 31, 2018 | | | | | | | | | | | | | | |
As of and for the year ended December 31, 2021 | | As of and for the year ended December 31, 2021 |
|
|
|
|
| Accruing | | Non-accruing | | | | Accruing |
| Non-accruing |
|
|
|
| Commercial | | Commercial | | Consumer | | Commercial | | Residential | | Consumer | | | Commercial |
| Commercial |
| Commercial |
|
|
(dollars in thousands) | & industrial | | real estate | | HELOC | | real estate | | real estate | | installment | | Total | real estate |
| real estate |
| & industrial |
| Total |
| | | | | | | | | | | | | | | | | | | |
Troubled Debt Restructures: | | | | | | | | | | | | | | | | | | |
|
|
|
|
|
|
|
|
Beginning balance | $ | 24 | | $ | 1,847 | | $ | 395 | | $ | 542 | | $ | 636 | | $ | - | | $ | 3,444 | $ | 2,571 |
| $ | 456 |
| $ | 206 |
| $ | 3,233 |
Additions | | - | | | - | | - | | | - | | | 365 | | | 414 | | 779 |
| 519 |
| - |
| - |
| 519 |
Transfers | | - | | | - | | (395) | | | - | | | | | | - | | (395) | |
Pay downs / payoffs | | - | | | (41) | | - | | | (22) | | | - | | | (1) | | (64) |
| (103) |
| (37) |
| (6) |
| (146) |
Charge offs | | - | | | - | | - | | | - | | | (237) | | | - | | (237) |
| - |
| - |
| (65) |
| (65) |
Ending balance | $ | 24 | | $ | 1,806 | | $ | - | | $ | 520 | | $ | 764 | | $ | 413 | | $ | 3,527 | $ | 2,987 |
| $ | 419 |
| $ | 135 |
| $ | 3,541 |
Number of loans | | 1 | | | 10 | | - | | | 1 | | | 2 | | | 1 | | | 15 |
| 8 |
| 1 |
| 2 |
|
| 11 |
|
|
|
|
|
|
|
|
|
|
|
|
|
|
|
|
|
|
|
|
|
|
|
|
As of and for the year ended December 31, 2020 |
|
|
|
|
|
|
|
|
|
| Accruing |
| Non-accruing |
|
|
|
| Commercial |
| Commercial |
| Commercial |
|
|
(dollars in thousands) | real estate |
| real estate |
| & industrial |
| Total |
Troubled Debt Restructures: |
|
|
|
|
|
|
|
|
|
|
|
Beginning balance | $ | 991 |
| $ | 561 |
| $ | - |
| $ | 1,552 |
Additions |
| 1,600 |
|
| 2 |
|
| 206 |
|
| 1,808 |
Pay downs / payoffs |
| (20) |
|
| (8) |
|
| - |
|
| (28) |
Charge offs |
| - |
|
| (99) |
|
| - |
|
| (99) |
Ending balance | $ | 2,571 |
| $ | 456 |
| $ | 206 |
| $ | 3,233 |
Number of loans |
| 8 |
|
| 2 |
|
| 2 |
|
| 12 |
29
| | | | | | | | | | | | | | | | | | | | |
| | | | | | | | | | | | | | | | | | | | |
As of and for the year ended December 31, 2017 | | | | | | | | | | | | | | | |
| Accruing | | Non-accruing | | | | | | |
| Commercial | | Commercial | | Consumer | | Commercial | | | Residential | | | | | |
(dollars in thousands) | & industrial | | real estate | | HELOC | | real estate | | | real estate | | | | | Total |
| | | | | | | | | | | | | | | | | | | | |
Troubled Debt Restructures: | | | | | | | | | | | | | | | | | | | | |
Beginning balance | $ | 25 | | $ | 1,798 | | $ | 650 | | $ | - | | $ | 881 | | | | | $ | 3,354 |
Additions | | - | | | 1,059 | | | - | | | - | | | - | | | | | | 1,059 |
Transfers | | - | | | (969) | | | - | | | 969 | | | - | | | | | | - |
Pay downs / payoffs | | (1) | | | (41) | | | - | | | (227) | | | (18) | | | | | | (287) |
Charge offs | | - | | | - | | | (255) | | | (200) | | | (227) | | | | | | (682) |
Ending balance | $ | 24 | | $ | 1,847 | | $ | 395 | | $ | 542 | | $ | 636 | | | | | $ | 3,444 |
Number of loans | | 1 | | | 10 | | | 1 | | | 1 | | | 1 | | | | | | 14 |
The Company, on a regular basis, reviews changes to loans to determine if they meet the definition of a TDR. TDRs arise when a borrower experiences financial difficulty and the Company grants a concession that it would not otherwise grant based on current underwriting standards in order to maximize the Company’s recovery.
Consistent with Section 4013 and the Revised Statement of Section 4013 of the CARES Act, specifically “Temporary Relief From Troubled Debt Restructurings”, the Company approved requests by borrowers to modify loan terms and defer principal and/or interest payment for loans. U.S. GAAP permits the temporary suspension of TDR determination defined under ASC 310-40 provided that such modifications are made on a good faith basis in response to COVID-19 to borrowers who were current prior to any relief. This includes short-term (i.e., six months) modifications such as payment deferrals, fee waivers, extensions of repayment terms, or delays in payment that are insignificant. Borrowers considered current for purposes of Section 4013 are those that are less than 30 days past due on their contractual payments at the time the modification program is implemented.
From December 31, 20172020 to December 31, 2018,2021, TDRs increased $0.3 million, or 10%, primarily due to the addition of a $0.5 million commercial real estate TDR in the fourth quarter offset by paydowns of $0.1 million from $3.4 millionand charge-offs for two non-accrual commercial real estate TDRs to $3.5a single borrower totaling $0.1 million. At December 31, 2017,2020, there were a total of 1412 TDRs to 10by 9 unrelated borrowers with balances that ranged from $24$1 thousand to $0.6 million. At$1.3 million, and at December 31, 2018,2021, there were a total of 1511 TDRs to 11by 8 unrelated borrowers with balances that ranged from $24$50 thousand to $0.5$1.3 million. The increase was driven by the addition of 2 TDRs to a single borrower totaling $0.7 million in the first quarter of 2018. This increase was partially offset by the transfer to ORE of a consumer HELOC TDR with a balance of $0.4 million in the first quarter of 2018 along with a $0.2 million charge off of a residential real estate TDR in the fourth quarter of 2018.
Loans modified in a TDR may or may not be placed on non-accrual status. At December 31, 2017,2021, there were three TDRs totaling $1.6$0.6 million that were on non-accrual. At December 31, 2018,non-accrual status compared to four TDRs totaling $1.7$0.7 million wereat December 31, 2020.
Beginning the week of March 16, 2020, the Company began receiving requests for temporary modifications to the repayment structure for borrower loans. Modification terms included interest only or full payment deferral for up to 6 months. As of December 31, 2021, the Company had no COVID-related modifications outstanding. Although contractual payments have returned to normal, residual impacts on non-accrual. Duringborrowers’ ability to repay due to the COVID-19 pandemic may persist.
Foreclosedassets held-for-sale
From December 31, 2020 to December 31, 2021, foreclosed assets held-for-sale (ORE) increased from $256 thousand to $435 thousand, a $179 thousand increase, which was primarily attributed to one $236 thousand ORE property that was added during the first quarter of 2018, one non-accrual consumer HELOC TDR was transferred to ORE. During the third quarter of 2018, two TDRs were placed on non-accrual status.2021.
If applicable, a TDR loan classified as non-accrual would require a minimum of six months of payments before consideration for a return to accrual status. The concessions granted consisted of temporary interest-only payments or a reduction in the rate of interest to a below-market rate for a contractual period of time. The Company believes concessions have been made in the best interests of the borrower and the Company. If loans characterized as a TDR perform according to the restructured terms for a satisfactory period of time, the TDR designation may be removed in a new calendar year if the loan yields a market rate of interest.
Foreclosedassets held-for-sale
From December 31, 2017 to December 31, 2018, foreclosed assets held-for-sale (ORE) decreased from $1.0 million to $0.2 million, a $0.8 million, or 80%, decrease. The following table sets forth the activity in the ORE component of foreclosed assets held-for-sale:
| | | | | | |
|
|
|
|
|
|
| | | | | | | |
|
|
|
|
|
|
|
| 2018 | | 2017 | 2021 |
| 2020 |
(dollars in thousands) | Amount | # | | Amount | # | Amount | # |
| Amount | # |
| | | | | | | |
|
|
|
|
|
|
|
Balance at beginning of period | $ | 973 | 11 | | $ | 1,298 | 13 | $ | 256 | 6 |
| $ | 349 | 7 |
| | | | | | | |
|
|
|
|
|
|
|
Additions | | 714 | 8 | | | 272 | 5 |
| 969 | 7 |
|
| 770 | 10 |
Pay downs | | (2) | | | | (18) | |
| - |
|
|
| (1) |
|
Write downs | | (123) | | | | (100) | |
| (16) |
|
|
| (36) |
|
Sold | | (1,372) | (13) | | | (479) | (7) |
| (775) | (8) |
|
| (826) | (11) |
Balance at end of period | $ | 190 | 6 | | $ | 973 | 11 | $ | 434 | 5 |
| $ | 256 | 6 |
As of December 31, 2018,2021, ORE consisted of sixfive properties from sixsecuring loans to five unrelated borrowers totaling $190$435 thousand. Three of theseFour properties ($100434 thousand) to four unrelated borrowers were added in 2018; two of these properties ($48 thousand) were added in 2017;2021 and one property ($1 thousand) was added in 2014 ($42 thousand).2017. Of the sixfive properties, one totaling $15 thousand had a signed salesthree properties are under agreement while the five remainingof sale and two properties totaling $175 thousand wereare listed for sale.
As of December 31, 20182021 and 2017,December 31, 2020, the Company had no other repossessed assets held-for-sale.
Cash surrender value of bank owned life insurance
The Company maintains bank owned life insurance (BOLI) for a chosen group of employees at the time of purchase, namely its officers, where the Company is the owner and sole beneficiary of the policies. BOLI is classified as a non-interest earning asset. Increases in the cash surrender value are recorded as components of non-interest income. The BOLI is profitable from the appreciation of the cash surrender values of the pool of insurance and its tax-free advantage to the Company. This profitability is used to offset a portion of current and future employee benefit costs. In March 2017,2019, the Company invested $8.0$2.0 million in additional BOLI as a source of funding for additional life insurance benefits that provides for payments upon death for officers and employee benefit expenses related to the Company’s non-qualified SERP implemented for certain executive officers. In December 2020, the Company invested $6 million in BOLI and $5 million in BOLI with taxable annuity rider investments. As a result of the Landmark acquisition, the Company acquired $7.2 million in BOLI during the third quarter of 2021. The BOLI cash surrender value build-up can be liquidated if necessary, with associated tax costs. However, the Company intends to hold this pool of insurance, because it provides income that enhances the Company’s
capital position. Therefore, the Company has not provided for deferred income taxes on the earnings from the increase in cash surrender value.
Premises and equipment
Net of depreciation, premises and equipment increased $1.7 million during 2018. Additions of $3.32021. The Company added $3.4 million in fixed assets from the Landmark merger and purchased $2.2 million in fixed assets throughout 2021. These increases were partially offset by $1.3$2.2 million ofin depreciation expense and $0.3$1.5 million transferredin transfers to other assets held-for-saleheld-for-sale. The Company expects to begin branch remodeling and corporate headquarters planning which may increase construction in 2018. The additions were primarily due toprocess and is evaluating its branch network looking for consolidation that makes sense for more efficient operations. On December 23, 2020, the constructionCommonwealth of Pennsylvania authorized the release of $2.0 million in Redevelopment Assistance Capital Program (RACP) funding for the Company’s headquarters project in Lackawanna County. On December 2, 2021, the Company announced it would be receiving an additional $2.0 million in RACP funding in support of the Back Mountain branch. For 2019, we expect premisesproject. Although the Company was awarded the grants, funds will not be available until a final project is selected and equipment to increase, projected to grow by $1.8 million, net of depreciation, bycertain requirements are met.
Other assets
During 2021, the end of the year primarily due to the building of a new Mountaintop branch scheduled for completion during the third quarter.
Other assets
During 2018, the $2.5$3.2 million, or 16%57%, increase in other assets was due mostly to $1.7 million in higher residual values associated with recording new automobile leases, net of lease disposals; a $0.6$3.1 million increase in the prepaid dealer reserve; $0.5 million higher prepaid expenses; $0.3 million more in construction in process and $0.2 million added to other assets held-for-sale. These increases were partially offset by a $0.9 million higher net deferred tax liability. For 2019, other assets are projected to increase $4.1 million due to classifying operating leases as right-of-use assetsprimarily from the reduction in accordance withunrealized gains in the new lease accounting standard and approximately $1.7 million for construction-in-process from remodeling the Main branch office with completion anticipated in early 2020.investment portfolio.
Results of Operation
Earnings Summary
The Company’s earnings depend primarily on net interest income. Net interest income is the difference between interest income and interest expense. Interest income is generated from yields earned on interest-earning assets, which consist principally of loans and investment securities. Interest expense is incurred from rates paid on interest-bearing liabilities, which consist of deposits and borrowings. Net interest income is determined by the Company’s interest rate spread (the difference between the yields earned on its interest-earning assets and the rates paid on its interest-bearing liabilities) and the relative amounts of interest-earning assets and interest-bearing liabilities. Interest rate spread is significantly impacted by: changes in interest rates and market yield curves and their related impact on cash flows; the composition and characteristics of interest-earning assets and interest-bearing liabilities; differences in the maturity and re-pricing characteristics of assets compared to the maturity and re-pricing characteristics of the liabilities that fund them and by the competition in the marketplace.
The Company’s earnings are also affected by the level of its non-interest income and expenses and by the provisions for loan losses and income taxes. Non-interest income mainly consists of: service charges on the Company’s loan and deposit products; interchange fees; trust and asset management service fees; increases in the cash surrender value of the bank owned life insurance and from net gains or losses from sales of loans and securities. Non-interest expense consists of: compensation and related employee benefit costs; occupancy; equipment; data processing; advertising and marketing; FDIC insurance premiums; professional fees; loan collection; net other real estate owned (ORE) expenses; supplies and other operating overhead.
Net interest income, net interest rate margin, net interest rate spread and the efficiency ratio are presented in the MD&A on a fully-taxable equivalent (FTE) basis. The Company believes this presentation to be the preferred industry measurement of net interest income as it provides a relevant comparison between taxable and non-taxable amounts.
Overview
For the year ended December 31, 2018,2021, the Company generated net income of $11.0$24.0 million, or $2.90$4.48 per diluted share, compared to $8.7$13.0 million, or $2.33$2.82 per diluted share, for the year ended December 31, 2017.2020. The $2.3$11.0 million, or 26%84%, increase in net income stemmed from $2.6$17.6 million more net interest income, and $0.8$3.6 million in additional non-interest income and $3.3 million lower provision for loan losses which more than offset a $0.2an $11.8 million rise in non-interest expenses and $0.9$1.7 million higher provision for income taxes.
For the year ended December 31, 2018,2021, return on average assets (ROA) and return on average shareholders’ equity (ROE) were 1.20%1.13% and 12.36%12.69%, respectively, compared to 1.03%0.87% and 10.34%9.06% for the same period in 2017.2020. The increase in ROA and ROE was the result of the growth in net income growthrelative to the increase in average assets and equity during 2018.2021.
Net interest income and interest sensitive assets / liabilities
Net interest income (FTE) increased $2.6$18.7 million, or 9%41%, from $27.8$45.3 million for the year ended December 31, 20172020 to $30.4$64.0 million for the year ended December 31, 2018,2021, due to the higher interest income increasing more rapidly thanand lower interest expense. Total average interest-earning assets increased $70.5$607.3 million andwhile the FTE yields earned on these assets rose ninedeclined 27 basis points resulting in $3.7$17.0 million of growth in FTE interest income. In theThe loan portfolio contributed the Company experiencedmost to this growth due to average balance growth of $46.8$280.6 million combined with higher yields earned in the commercial and residential portfolios, which had the effect of producing $3.0$12.2 million ofmore FTE interest income. Although all loan portfolios showed more interest income, including $2.0 million in additional fees earned under the consumer loan portfolio increased due to average balance growth while the commercial and residential loan portfolios experienced increases due to both average volume growth and higher yields.Paycheck Protection Program (PPP). In the investment portfolio, an increase in the average balances and yields of mortgage-backedmunicipal securities was the biggest driver of interest income growth. The average
balance of total securities grew $20.9$291.1 million producing $0.6$4.8 million in additional FTE interest income.income despite a decrease of 44 basis points in yields earned on investments. On the liability side, total interest-bearing liabilities grew $39.9$392.7 million onin average balances with a 2327 basis point increasedecrease in rates paid on these interest-bearing liabilities. Growth in average interest-bearing deposits of $28.6$442.4 million mostly interest-bearing checking accounts, andwas offset by the 16effect of a 26 basis point higherreduction in rates paid on these deposits caused an increase of $1.1 million inlowering interest expense.expense by $1.3 million. In addition, the Company had $11.2utilized $49.7 million moreless in average borrowings on which they paid higher rates in 20182021 compared to 2017 which resulted2020 resulting in $0.6$0.4 million moreless interest expense. expense from borrowings.
The FTE net interest rate spread was unchanged at 3.16% for the years ended December 31, 2021 and 2020. The FTE net interest rate margin decreased by fourteen and six7 basis points, respectively, for the year ended December 31, 20182021 compared to the year ended December 31, 2017.2020. The Company’s lower tax rate in 2018 caused FTE interest income from nontaxableyields earned on interest-earning assets to decline. The negative impact of this lower FTE adjustment haddeclined at the effect of reducing net interest rate spread by eight basis points and margin by seven basis points. Thesame pace as the decline in the rates paid on interest-bearing liabilities rose faster thancausing the yields earned on interest-earning assets causing a further decline in FTE net interest rate spread of 6 basis points. If not for the reductionto remain flat. The decrease in yields from the lower FTE adjustment, FTE net interest rate margin would have increased by one basis pointwas due to the $27.7 million increase inhigher average non-interest bearing deposits.balance of interest-bearing cash. The overall cost of funds, which includes the impact of non-interest bearing deposits, increased sixteendecreased 21 basis points for the year ended December 31, 20182021 compared to the same period in 2017.2020. The primary reason for the increasedecline was higherthe reduction in rates paid on largerdeposits coupled with the increased average borrowings which were used to fund asset growth along with an increase in average interest-bearing deposits and the rates paid thereon.balances of non-interest bearing deposits.
For 2019,2022, the Company expects to operate in a slowly changingrising interest rate environment. A rate environment with rising interest rates positions the Company to improve its interest income performance from new and maturing earning assets. Until there is a sustained period of yield curve steepening, with rates rising more sharply at the long end, the interest rate margin may experience compression. However for 2019,2022, the Company anticipates net interest income to improve as growth in interest-earning assets would help mitigate an adverse impact of rate movements on cost of funds. The Federal Open Market Committee (FOMC) has been gradually increasingFOMC began easing the short-term federal funds rate sinceduring the endsecond half of 2015,2019 and it has started to effectcontinued through the first quarter of 2020 which reduced rates paid on funding sources. interest-bearing liabilities. On the asset side, the prime interest rate, the benchmark rate that banks use as a base rate for adjustable rate loans rose 100was cut 75 basis points in 2018.the second half of 2019 and another 150 basis points in the first quarter of 2020. Consensus economic forecasts are predicting gradual increases in short-term rates throughout 2022. The 2022 focus for 2019 is to manage net interest income after years of a sustained low interest rate environment through a rising forecasted rate environmentcycle by maintaining a reasonable spread. Interest income and interest expense isare both projected to continue to grow in 2019 from growth in deposits and borrowings and an increase in rates paid on both.for 2022. Continued growth in the loan portfolios complemented with investment security growth is expected to boost interest income, and when coupled with a proactive relationship approach to deposit cost setting strategies should help mitigate spread compression and contain the interest rate margin atfrom further reductions below acceptable levels.
The Company’s cost of interest-bearing liabilities was 78 basis points0.26% for the year ended December 31, 2018,2021, or 2327 basis points higherlower than the cost for the year ended December 31, 2017.2020. The increasedecrease in average borrowings and average interest-bearing deposits combined with higher ratesinterest paid on both deposits and borrowings contributed to the higherlower cost of interest-bearing liabilities. During 2017 and 2018,The FOMC is expected to increase the federal funds rate which could cause rates paid on interest-bearing deposits started to inch uprise from historicthe current low levels. Interest rates along the treasury yield curve have been volatile with shorter-term rates rising faster than long-term rates producing a flatter yield curve during 2018. Competition among banks has already begun to pressure banks to increase deposit rates. If rates continue to rise, the effect could pressure net interest income if short-term rates rise more rapidly than longer-term interest rates, thereby compressing the interest rate spread. To help mitigate the impact of the imminent change to the economic landscape, the Company has successfully developed and will continue to strengthen its association with existing customers, develop new business relationships, generate new loan volumes, and retain and generate higher levels of average non-interest bearing deposit balances. Strategically deploying no- and low-cost deposits into interest earning-assets is an effective margin-preserving strategy that the Company expects to continue to pursue and expand to help stabilize net interest margin.
The Company’s Asset Liability Management (ALM) team meets regularly to discuss among other things, interest rate risk and when deemed necessary adjusts interest rates. ALM is actively addressing the Company's sensitivity to a declining rate environment to ensure interest rate risks are contained within acceptable levels. ALM also discusses revenue enhancing strategies to help combat the potential for a decline in net interest income. The Company’s marketing department, together with ALM, lenders and deposit gatherers, continue to develop prudent strategies that will grow the loan portfolio and accumulate low-cost deposits to improve net interest income performance.
The table that follows sets forth a comparison of average balances of assets and liabilities and their related net tax equivalent yields and rates for the years indicated. Within the table, interest income was FTE adjusted, using the corporate federal tax
rate of 21% for 20182021, 2020 and 34% for both 2017 and 2016,2019, to recognize the income from tax-exempt interest-earning assets as if the interest was taxable. See “Non-GAAP Financial Measures” within this management’s discussion and analysis for the FTE adjustments. This treatment allows a uniform comparison among yields on interest-earning assets. Loans include loans held-for-sale (HFS) and non-accrual loans but exclude the allowance for loan losses. HELOC are included in the residential real estate category since they are secured by real estate. Net deferred loan cost fee/(cost) accretion/amortization of $0.7$3.8 million in 2018, $0.52021, $2.1 million in 20172020 and $0.5 million($0.7 million) in 2016,2019, respectively, are included in interest income from loans. MNB and Landmark loan fair value purchase accounting adjustments of $3.0 million and $0.6 million are included in interest income from loans and $72 thousand and $213 thousand reduced interest expense on deposits for 2021 and 2020. Average balances are based on amortized cost and do not reflect net unrealized gains or losses. Residual values for direct finance leases are included in the average balances for consumer loans. Net interest margin is calculated by dividing net interest income-FTE by total average interest-earning assets. Cost of funds includes the effect of average non-interest bearing deposits as a funding source:
| | | | | | | | | | | | | | | | | | | | | | | | | | |
| | | | | | | | | | |
(dollars in thousands) | 2018 | | 2017 | | 2016 | |
| Average | | | | Yield / | | Average | | | | Yield / | | Average | | | | | Yield / |
Assets | balance | | Interest | | rate | | balance | | Interest | | rate | | balance | | Interest | | rate |
| | | | | | | | | | | | | | | | | | | | | | | | | | |
Interest-earning assets | | | | | | | | | | | | | | | | | | | | | | | | | | |
Interest-bearing deposits | $ | 6,134 | | $ | 104 | | 1.70 | % | | $ | 3,960 | | $ | 48 | | 1.22 | % | | $ | 12,489 | | $ | 67 | | 0.53 | % |
Restricted regulatory securities | | 3,740 | | | 194 | | 5.17 | | | | 3,105 | | | 135 | | 4.34 | | | | 1,391 | | | 54 | | 3.89 | |
Investments: | | | | | | | | | | | | | | | | | | | | | | | | | | |
Agency - GSE | | 6,140 | | | 147 | | 2.39 | | | | 17,313 | | | 248 | | 1.43 | | | | 18,279 | | | 237 | | 1.29 | |
MBS - GSE residential | | 118,197 | | | 3,167 | | 2.68 | | | | 89,909 | | | 2,267 | | 2.52 | | | | 69,437 | | | 1,472 | | 2.12 | |
State and municipal (nontaxable) | | 45,420 | | | 2,055 | | 4.53 | | | | 41,528 | | | 2,278 | | 5.49 | | | | 35,776 | | | 2,010 | | 5.62 | |
Other | | 189 | | | 13 | | 6.85 | | | | 295 | | | 30 | | 10.12 | | | | 295 | | | 29 | | 9.85 | |
Total investments | | 169,946 | | | 5,382 | | 3.17 | | | | 149,045 | | | 4,823 | | 3.24 | | | | 123,787 | | | 3,748 | | 3.03 | |
Loans and leases: | | | | | | | | | | | | | | | | | | | | | | | | | | |
C&I and CRE (taxable) | | 299,789 | | | 14,675 | | 4.89 | | | | 294,652 | | | 13,675 | | 4.64 | | | | 275,214 | | | 12,235 | | 4.45 | |
C&I and CRE (nontaxable) | | 32,224 | | | 1,213 | | 3.76 | | | | 30,894 | | | 1,304 | | 4.22 | | | | 26,244 | | | 1,141 | | 4.35 | |
Consumer | | 135,723 | | | 5,413 | | 3.99 | | | | 104,700 | | | 4,321 | | 4.13 | | | | 74,482 | | | 3,828 | | 5.14 | |
Residential real estate | | 209,990 | | | 9,067 | | 4.32 | | | | 200,714 | | | 8,039 | | 4.01 | | | | 193,013 | | | 7,546 | | 3.91 | |
Total loans and leases | | 677,726 | | | 30,368 | | 4.48 | | | | 630,960 | | | 27,339 | | 4.33 | | | | 568,953 | | | 24,750 | | 4.35 | |
Total interest-earning assets | | 857,546 | | | 36,048 | | 4.20 | % | | | 787,070 | | | 32,345 | | 4.11 | % | | | 706,620 | | | 28,619 | | 4.05 | % |
Non-interest earning assets | | 60,396 | | | | | | | | | 57,277 | | | | | | | | | 49,226 | | | | | | |
Total assets | $ | 917,942 | | | | | | | | $ | 844,347 | | | | | | | | $ | 755,846 | | | | | | |
| | | | | | | | | | | | | | | | | | | | | | | | | | |
Liabilities and shareholders' equity | | | | | | | | | | | | | | | | | | | | | | | | | | |
| | | | | | | | | | | | | | | | | | | | | | | | | | |
Interest-bearing liabilities | | | | | | | | | | | | | | | | | | | | | | | | | | |
Deposits: | | | | | | | | | | | | | | | | | | | | | | | | | | |
Interest-bearing checking | $ | 210,277 | | $ | 1,182 | | 0.56 | % | | $ | 188,833 | | $ | 764 | | 0.40 | % | | $ | 157,324 | | $ | 483 | | 0.31 | % |
Savings and clubs | | 131,050 | | | 221 | | 0.17 | | | | 126,877 | | | 176 | | 0.14 | | | | 119,695 | | | 151 | | 0.13 | |
MMDA | | 112,158 | | | 1,000 | | 0.89 | | | | 117,852 | | | 802 | | 0.68 | | | | 130,017 | | | 818 | | 0.63 | |
Certificates of deposit | | 111,278 | | | 1,408 | | 1.27 | | | | 102,561 | | | 1,008 | | 0.98 | | | | 98,043 | | | 857 | | 0.87 | |
Total interest-bearing deposits | | 564,763 | | | 3,811 | | 0.67 | | | | 536,123 | | | 2,750 | | 0.51 | | | | 505,079 | | | 2,309 | | 0.46 | |
Repurchase agreements | | 9,666 | | | 16 | | 0.16 | | | | 10,274 | | | 21 | | 0.20 | | | | 10,239 | | | 20 | | 0.19 | |
Overnight borrowings | | 27,892 | | | 667 | | 2.39 | | | | 18,399 | | | 205 | | 1.11 | | | | 2,805 | | | 29 | | 1.02 | |
FHLB advances | | 22,109 | | | 379 | | 1.71 | | | | 19,778 | | | 247 | | 1.25 | | | | - | | | - | | - | |
Total interest-bearing liabilities | | 624,430 | | | 4,873 | | 0.78 | % | | | 584,574 | | | 3,223 | | 0.55 | % | | | 518,123 | | | 2,358 | | 0.46 | % |
Non-interest bearing deposits | | 196,790 | | | | | | | | | 169,075 | | | | | | | | | 152,826 | | | | | | |
Non-interest bearing liabilities | | 7,697 | | | | | | | | | 6,379 | | | | | | | | | 5,120 | | | | | | |
Total liabilities | | 828,917 | | | | | | | | | 760,028 | | | | | | | | | 676,069 | | | | | | |
Shareholders' equity | | 89,025 | | | | | | | | | 84,319 | | | | | | | | | 79,777 | | | | | | |
Total liabilities and shareholders' equity | $ | 917,942 | | | | | | | | $ | 844,347 | | | | | | | | $ | 755,846 | | | | | | |
Net interest income - FTE | | | | $ | 31,175 | | | | | | | | $ | 29,122 | | | | | | | | $ | 26,261 | | | |
| | | | | | | | | | | | | | | | | | | | | | | | | | |
Net interest spread | | | | | | | 3.42 | % | | | | | | | | 3.56 | % | | | | | | | | 3.59 | % |
Net interest margin | | | | | | | 3.64 | % | | | | | | | | 3.70 | % | | | | | | | | 3.72 | % |
Cost of funds | | | | | | | 0.59 | % | | | | | | | | 0.43 | % | | | | | | | | 0.35 | % |
|
|
|
|
|
|
|
|
|
|
|
|
|
|
|
|
|
|
|
|
|
|
|
|
|
|
|
|
|
|
|
|
|
|
|
|
|
|
(dollars in thousands) | 2021 |
| 2020 |
| 2019 |
|
| Average |
|
|
| Yield / |
| Average |
|
|
| Yield / |
| Average |
|
|
|
| Yield / |
Assets | balance |
| Interest |
| rate |
| balance |
| Interest |
| rate |
| balance |
| Interest |
| rate |
|
|
|
|
|
|
|
|
|
|
|
|
|
|
|
|
|
|
|
|
|
|
|
|
|
|
|
Interest-earning assets |
|
|
|
|
|
|
|
|
|
|
|
|
|
|
|
|
|
|
|
|
|
|
|
|
|
|
Interest-bearing deposits | $ | 111,936 |
| $ | 148 |
| 0.13 | % |
| $ | 76,404 |
| $ | 121 |
| 0.16 | % |
| $ | 2,185 |
| $ | 47 |
| 2.14 | % |
Restricted investments in bank stock |
| 3,181 |
|
| 127 |
| 4.00 |
|
|
| 3,044 |
|
| 162 |
| 5.33 |
|
|
| 4,208 |
|
| 417 |
| 9.92 |
|
Investments: |
|
|
|
|
|
|
|
|
|
|
|
|
|
|
|
|
|
|
|
|
|
|
|
|
|
|
Agency - GSE |
| 89,754 |
|
| 1,231 |
| 1.37 |
|
|
| 18,074 |
|
| 301 |
| 1.66 |
|
|
| 5,934 |
|
| 160 |
| 2.69 |
|
MBS - GSE residential |
| 197,556 |
|
| 2,837 |
| 1.44 |
|
|
| 145,343 |
|
| 2,896 |
| 1.99 |
|
|
| 127,533 |
|
| 3,473 |
| 2.72 |
|
State and municipal (nontaxable) |
| 207,819 |
|
| 6,171 |
| 2.97 |
|
|
| 89,350 |
|
| 3,146 |
| 3.52 |
|
|
| 49,988 |
|
| 2,195 |
| 4.39 |
|
State and municipal (taxable) |
| 68,343 |
|
| 1,281 |
| 1.87 |
|
|
| 19,555 |
|
| 398 |
| 2.03 |
|
|
| - |
|
| - |
| - |
|
Other |
| 27 |
|
| - |
| 0.40 |
|
|
| 89 |
|
| 3 |
| 3.42 |
|
|
| - |
|
| - |
| - |
|
Total investments |
| 563,499 |
|
| 11,520 |
| 2.04 |
|
|
| 272,411 |
|
| 6,744 |
| 2.48 |
|
|
| 183,455 |
|
| 5,828 |
| 3.18 |
|
Loans and leases: |
|
|
|
|
|
|
|
|
|
|
|
|
|
|
|
|
|
|
|
|
|
|
|
|
|
|
C&I and CRE (taxable) |
| 712,838 |
|
| 34,507 |
| 4.84 |
|
|
| 526,805 |
|
| 24,485 |
| 4.65 |
|
|
| 317,023 |
|
| 16,434 |
| 5.18 |
|
C&I and CRE (nontaxable) |
| 48,574 |
|
| 1,890 |
| 3.89 |
|
|
| 41,261 |
|
| 1,579 |
| 3.83 |
|
|
| 34,056 |
|
| 1,363 |
| 4.00 |
|
Consumer |
| 180,991 |
|
| 7,100 |
| 3.92 |
|
|
| 166,389 |
|
| 6,690 |
| 4.02 |
|
|
| 159,937 |
|
| 6,208 |
| 3.88 |
|
Residential real estate |
| 357,557 |
|
| 12,311 |
| 3.44 |
|
|
| 284,918 |
|
| 10,810 |
| 3.79 |
|
|
| 221,136 |
|
| 9,722 |
| 4.40 |
|
Total loans and leases |
| 1,299,960 |
|
| 55,808 |
| 4.29 |
|
|
| 1,019,373 |
|
| 43,564 |
| 4.27 |
|
|
| 732,152 |
|
| 33,727 |
| 4.61 |
|
Total interest-earning assets |
| 1,978,576 |
|
| 67,603 |
| 3.42 | % |
|
| 1,371,232 |
|
| 50,591 |
| 3.69 | % |
|
| 922,000 |
|
| 40,019 |
| 4.34 | % |
Non-interest earning assets |
| 137,011 |
|
|
|
|
|
|
|
| 124,433 |
|
|
|
|
|
|
|
| 62,552 |
|
|
|
|
|
|
Total assets | $ | 2,115,587 |
|
|
|
|
|
|
| $ | 1,495,665 |
|
|
|
|
|
|
| $ | 984,552 |
|
|
|
|
|
|
|
|
|
|
|
|
|
|
|
|
|
|
|
|
|
|
|
|
|
|
|
|
|
|
|
|
|
Liabilities and shareholders' equity |
|
|
|
|
|
|
|
|
|
|
|
|
|
|
|
|
|
|
|
|
|
|
|
|
|
|
|
|
|
|
|
|
|
|
|
|
|
|
|
|
|
|
|
|
|
|
|
|
|
|
|
|
|
Interest-bearing liabilities |
|
|
|
|
|
|
|
|
|
|
|
|
|
|
|
|
|
|
|
|
|
|
|
|
|
|
Deposits: |
|
|
|
|
|
|
|
|
|
|
|
|
|
|
|
|
|
|
|
|
|
|
|
|
|
|
Interest-bearing checking | $ | 608,441 |
| $ | 1,742 |
| 0.29 | % |
| $ | 369,645 |
| $ | 1,405 |
| 0.38 | % |
| $ | 234,603 |
| $ | 1,636 |
| 0.70 | % |
Savings and clubs |
| 209,890 |
|
| 113 |
| 0.05 |
|
|
| 148,505 |
|
| 115 |
| 0.08 |
|
|
| 111,687 |
|
| 139 |
| 0.12 |
|
MMDA |
| 425,282 |
|
| 957 |
| 0.22 |
|
|
| 280,344 |
|
| 1,573 |
| 0.56 |
|
|
| 156,178 |
|
| 2,290 |
| 1.47 |
|
Certificates of deposit |
| 132,751 |
|
| 644 |
| 0.49 |
|
|
| 135,487 |
|
| 1,663 |
| 1.23 |
|
|
| 119,150 |
|
| 2,111 |
| 1.77 |
|
Total interest-bearing deposits |
| 1,376,364 |
|
| 3,456 |
| 0.25 |
|
|
| 933,981 |
|
| 4,756 |
| 0.51 |
|
|
| 621,618 |
|
| 6,176 |
| 0.99 |
|
Secured borrowings |
| 9,122 |
|
| 156 |
| 1.71 |
|
|
| - |
|
| - |
| - |
|
|
| - |
|
| - |
| - |
|
Short-term borrowings |
| 97 |
|
| 1 |
| 1.06 |
|
|
| 49,165 |
|
| 248 |
| 0.50 |
|
|
| 35,243 |
|
| 878 |
| 2.49 |
|
FHLB advances |
| 848 |
|
| 26 |
| 3.07 |
|
|
| 10,608 |
|
| 307 |
| 2.90 |
|
|
| 18,074 |
|
| 500 |
| 2.77 |
|
Total interest-bearing liabilities |
| 1,386,431 |
|
| 3,639 |
| 0.26 | % |
|
| 993,754 |
|
| 5,311 |
| 0.53 | % |
|
| 674,935 |
|
| 7,554 |
| 1.12 | % |
Non-interest bearing deposits |
| 517,599 |
|
|
|
|
|
|
|
| 340,211 |
|
|
|
|
|
|
|
| 195,393 |
|
|
|
|
|
|
Non-interest bearing liabilities |
| 22,322 |
|
|
|
|
|
|
|
| 17,765 |
|
|
|
|
|
|
|
| 13,517 |
|
|
|
|
|
|
Total liabilities |
| 1,926,352 |
|
|
|
|
|
|
|
| 1,351,730 |
|
|
|
|
|
|
|
| 883,845 |
|
|
|
|
|
|
Shareholders' equity |
| 189,235 |
|
|
|
|
|
|
|
| 143,935 |
|
|
|
|
|
|
|
| 100,707 |
|
|
|
|
|
|
Total liabilities and shareholders' equity | $ | 2,115,587 |
|
|
|
|
|
|
| $ | 1,495,665 |
|
|
|
|
|
|
| $ | 984,552 |
|
|
|
|
|
|
Net interest income - FTE |
|
|
| $ | 63,964 |
|
|
|
|
|
|
| $ | 45,280 |
|
|
|
|
|
|
| $ | 32,465 |
|
|
|
|
|
|
|
|
|
|
|
|
|
|
|
|
|
|
|
|
|
|
|
|
|
|
|
|
|
|
Net interest spread |
|
|
|
|
|
| 3.16 | % |
|
|
|
|
|
|
| 3.16 | % |
|
|
|
|
|
|
| 3.22 | % |
Net interest margin |
|
|
|
|
|
| 3.23 | % |
|
|
|
|
|
|
| 3.30 | % |
|
|
|
|
|
|
| 3.52 | % |
Cost of funds |
|
|
|
|
|
| 0.19 | % |
|
|
|
|
|
|
| 0.40 | % |
|
|
|
|
|
|
| 0.87 | % |
Changes in net interest income are a function of both changes in interest rates and changes in volume of interest-earning assets and interest-bearing liabilities. The following table presents the extent to which changes in interest rates and changes in volumes of interest-earning assets and interest-bearing liabilities have affected the Company’s interest income and interest expense during the periods indicated. Information is provided in each category with respect to (1) the changes attributable to changes in volume (changes in volume multiplied by the prior period rate), (2) the changes attributable to changes in interest rates (changes in rates multiplied by prior period volume) and (3) the net change. The combined effect of changes in both volume and rate has been allocated proportionately to the change due to volume and the change due to rate. Tax-exempt income was not converted to a tax-equivalent basis on the rate/volume analysis:
| | | | | | | | | | | | |
|
|
|
|
|
|
|
|
|
|
|
|
| Years ended December 31, | Years ended December 31, |
(dollars in thousands) | 2018 compared to 2017 | | 2017 compared to 2016 | 2021 compared to 2020 |
| 2020 compared to 2019 |
| Increase (decrease) due to | Increase (decrease) due to |
| Volume | | Rate | | Total | | Volume | | Rate | | Total | Volume |
| Rate |
| Total |
| Volume |
| Rate |
| Total |
Interest income: | | | | | | | | | | | | |
|
|
|
|
|
|
|
|
|
|
|
|
Interest-bearing deposits | $ | 33 | | $ | 23 | | $ | 56 | | $ | (66) | | $ | 47 | | $ | (19) | $ | 50 |
| $ | (23) |
| $ | 27 |
| $ | 156 |
| $ | (82) |
| $ | 74 |
Restricted regulatory securities | | 30 | | 29 | | 59 | | 74 | | 7 | | 81 | |
Restricted investments in bank stock | |
| 7 |
| (42) |
| (35) |
| (95) |
| (160) |
| (255) |
Investments: | | | | | | | | | | | | |
|
|
|
|
|
|
|
|
|
|
|
|
Agency - GSE | | (213) | | 112 | | (101) | | (13) | | 24 | | 11 |
| 992 |
| (62) |
| 930 |
| 222 |
| (81) |
| 141 |
MBS - GSE residential | | 750 | | 150 | | 900 | | 484 | | 311 | | 795 |
| 877 |
| (936) |
| (59) |
| 440 |
| (1,017) |
| (577) |
State and municipal | | 137 | | 8 | | 145 | | 200 | | (33) | | 167 |
| 3,537 |
| (615) |
| 2,922 |
| 1,599 |
| (558) |
| 1,041 |
Other | | (7) | | (4) | | (11) | | - | | 1 | | 1 |
| (1) |
| (2) |
| (3) |
| 3 |
| - |
| 3 |
Total investments | | 667 | | 266 | | 933 | | 671 | | 303 | | 974 |
| 5,405 |
| (1,615) |
| 3,790 |
| 2,264 |
| (1,656) |
| 608 |
Loans and leases: | | | | | �� | | | | | | | | |
|
|
|
|
|
|
|
|
|
|
|
|
Residential real estate | | 387 | | 642 | | 1,029 | | 306 | | 187 | | 493 |
| 2,569 |
|
| (1,067) |
|
| 1,502 |
|
| 2,544 |
|
| (1,456) |
|
| 1,088 |
C&I and CRE | | 288 | | 809 | | 1,097 | | 1,067 | | 480 | | 1,547 |
| 9,102 |
| 1,177 |
| 10,279 |
| 9,960 |
| (1,730) |
| 8,230 |
Consumer | | 1,245 | | (153) | | 1,092 | | 1,348 | | (855) | | 493 |
| 576 |
| (167) |
| 409 |
| 255 |
| 227 |
| 482 |
Total loans and leases | | 1,920 | | 1,298 | | 3,218 | | 2,721 | | (188) | | 2,533 |
| 12,247 |
| (57) |
| 12,190 |
| 12,759 |
| (2,959) |
| 9,800 |
Total interest income | | 2,650 | | 1,616 | | 4,266 | | 3,400 | | 169 | | 3,569 |
| 17,709 |
| (1,737) |
| 15,972 |
| 15,084 |
| (4,857) |
| 10,227 |
| | | | | | | | | | | | |
|
|
|
|
|
|
|
|
|
|
|
|
Interest expense: | | | | | | | | | | | | |
|
|
|
|
|
|
|
|
|
|
|
|
Deposits: | | | | | | | | | | | | |
|
|
|
|
|
|
|
|
|
|
|
|
Interest-bearing checking | | 91 | | 326 | | 417 | | 111 | | 170 | | 281 |
| 745 |
| (408) |
| 337 |
| 702 |
| (933) |
| (231) |
Savings and clubs | | 6 | | 40 | | 46 | | 12 | | 13 | | 25 |
| 39 |
| (41) |
| (2) |
| 38 |
| (62) |
| (24) |
Money market | | (40) | | 238 | | 198 | | (79) | | 63 | | (16) |
| 588 |
| (1,204) |
| (616) |
| 1,188 |
| (1,905) |
| (717) |
Certificates of deposit | | 90 | | 310 | | 400 | | 40 | | 111 | | 151 |
| (33) |
| (986) |
| (1,019) |
| 262 |
| (710) |
| (448) |
Total deposits | | 147 | | 914 | | 1,061 | | 84 | | 357 | | 441 |
| 1,339 |
| (2,639) |
| (1,300) |
| 2,190 |
| (3,610) |
| (1,420) |
Repurchase agreements | | (1) | | (4) | | (5) | | - | | 1 | | 1 | |
Secured borrowings | |
| 156 |
| - |
| 156 |
| - |
| - |
| - |
Overnight borrowings | | 143 | | 319 | | 462 | | 173 | | 3 | | 176 |
| (377) |
| 130 |
| (247) |
| 255 |
| (885) |
| (630) |
FHLB advances | | 32 | | 100 | | 132 | | 247 | | - | | 247 |
| (299) |
| 18 |
| (281) |
| (215) |
| 22 |
| (193) |
Total interest expense | | 321 | | 1,329 | | 1,650 | | 504 | | 361 | | 865 |
| 819 |
| (2,491) |
| (1,672) |
| 2,230 |
| (4,473) |
| (2,243) |
Net interest income | $ | 2,329 | | $ | 287 | | $ | 2,616 | | $ | 2,896 | | $ | (192) | | $ | 2,704 | $ | 16,890 |
| $ | 754 |
| $ | 17,644 |
| $ | 12,854 |
| $ | (384) |
| $ | 12,470 |
Provision for loan losses
The provision for loan losses represents the necessary amount to charge against current earnings, the purpose of which is to increase the allowance for loan losses (the allowance) to a level that represents management’s best estimate of known and inherent losses in the Company’s loan portfolio. Loans determined to be uncollectible are charged off against the allowance. The required amount of the provision for loan losses, based upon the adequate level of the allowance, is subject to the ongoing analysis of the loan portfolio. The Company’s Special Assets Committee meets periodically to review problem loans. The committee is comprised of management, including credit administration officers, loan officers, loan workout officers and collection personnel. The committee reports quarterly to the Credit Administration Committee of the board of directors.
Management continuously reviews the risks inherent in the loan portfolio. Specific factors used to evaluate the adequacy of the loan loss provision during the formal process include:
•specific loans that could have loss potential;
•levels of and trends in delinquencies and non-accrual loans;
•levels of and trends in charge-offs and recoveries;
•trends in volume and terms of loans;
•changes in risk selection and underwriting standards;
•changes in lending policies and legal and regulatory requirements;
•experience, ability and depth of lending management;
•national and local economic trends and conditions; and
•changes in credit concentrations.
For the yeartwelve months ended December 31, 20182021 and 2017,2020, the Company recorded a provision for loan losses of $1.5 million. $2.0 million and $5.3 million, respectively, a $3.3 million, or 62%, decrease. The decrease in the provision for loan losses from the year earlier period was primarily attributed to the COVID-related provisioning that occurred during the twelve
months ended December 31, 2020, which was not similarly warranted during the twelve months ended December 31, 2021 due to the higher level of economic certainty in the Company’s operating area when compared to the year earlier period. At this time, management expects the required provision for loan losses for 2022 to replicate the 2021 amount, subject to the level and type of loan origination production and unperceived changes to the credit quality landscape during 2022.
See the discussion of the qualitative factors within the “Allowance for loan losses” section of this management’s discussion and analysis. Although uncertainty over COVID’s duration and severity complicates management’s ability to render a more precise estimate of credit losses, management currently believes the level of provisioning for the twelve months ended December 31, 2021 was adequate based on the information that was available as of the reporting date and subsequent period up to the filing date.
The provision for loan losses derives from the reserve required from the allowance for loan losses calculation. In response to the level of loan growth observed during 2018, theThe Company continued provisioning in orderfor the twelve months ended December 31, 2021 to maintain an allowance level that management deemed adequate. Management maintained a $1.5 million provision during 2018, despite a larger loan portfolio compared with 2017, because of strengthening asset quality.
For a discussion on the allowance for loan losses, see “Allowance for loan losses,” located in the comparison of financial condition section of management’s discussion and analysis contained herein.
Other income
For the year ended December 31, 2018,2021, non-interest income amounted to $9.2$18.3 million, a $0.8$3.6 million, or 10%25%, increase compared to $8.4$14.7 million recorded for the year ended December 31, 2017.2020. Interchange fees grew $0.3$1.1 million due to a higher volume of debit card transactionstransactions. Wealth management fees (fees from trust fiduciary activities and an increase in merchant credit card income in 2018. Trust feesfinancial services) increased $0.7 million year-over-year as assets under management and administration grew from $364 million to $427 million. Gains on loan sales were $0.6 million higher for the year ended December 31, 2021 than the year earlier period due to the higher dollar amount of loans sold. Service charges on deposits increased $0.5 million. Earnings on bank-owned life insurance increased $0.4 million from the larger amount of BOLI due to the Landmark acquisition. Service charges on loans were $0.3 million higher duein 2021 compared to 2020 primarily driven by more assets under management which added $0.2 million and a full year of fees earned from the assumption of the accounts of another bank during 2017 which added $0.1 million. Fees from financial services increased $0.2 million. Gains on the sale of securities were $0.2 million higher in 2018 due a $0.1 million loss on the sale of securities in 2017 and gains recognized on the sale of equity securities in 2018. Losses on the write-down, sale or disposal of premises and equipment were $0.1 million lower due to a $0.2 million loss on the abandonment of leasehold improvements in 2017. Partially offsetting these items was $0.2 million fewer gains on the sale of loans and $0.1 million less service charges onfor commercial loans.
Other operating expenses
For the year ended December 31, 2018,2021, total other operating expenses totaled $25.0$50.1 million, an increase of $0.2$11.8 million, or 1%31%, compared to $24.8$38.3 million for the year ended December 31, 2017. Salary2020. Merger related expenses were $0.5 million of this increase. Salaries and employee benefits contributed the most to the increase rising $0.6$5.4 million, or 5%27%, in 20182021 compared to 2017.2020. The basis of the increase includes $0.6$3.0 million increasedhigher salaries with six more full-time equivalent employees, $0.2$1.7 million increase in stock-based compensationemployee bonuses, $0.8 million more in group insurance and $0.1$0.5 million in expenses from the post-retirement benefit plan implemented in 2017.higher commissions. These increases in salaries and employee benefits were partially offset by $0.2$0.9 million lessmore in employee bonuses from a one-time bonus paidloan origination costs deferred. Premises and equipment expenses were $1.4 million higher due to an increase in 2017depreciation, equipment maintenance and $0.1rental expenses. Advertising and marketing increased $1.0 million lower group insurance costs.due to more advertising and donations in 2021. Professional services were $0.5 million higher due to pandemic-related expenses and higher consulting and audit expenses. The FDIC assessment was $0.4 million higher due to the larger average assets. Automated transaction processing expenses increased $0.3 million. Data processing and communications expense increased $0.2$0.3 million during 20182021 compared to 20172020 because of additional costs for data center services. Partially offsetting these increases in expenses was a decrease in professional services of $0.3 million primarily from a NASDAQ entry feemore accounts and stock split expenses paid in 2017. Advertising and marketing also decreased $0.2 million resulting from a $0.5 million one-time donation to a charitable foundation in 2017 that was partially offset by $0.2 million higher advertising costs and $0.1 million more in tax credit donations. Loan collectionexpenses also declined $0.1 million. During the fourth quarter of 2017, the Company utilized tax strategies in response to the passage of the Tax Act that led to a $0.5 million donation, $0.2 million in certain employee bonuses and $0.1 million of early lease termination expenses.additional branches.
The ratios of non-interest expense less non-interest income to average assets, known as the expense ratio, at December 31, 20182021 and 20172020 were 1.73%1.50% and 1.95%1.58%, respectively. The expense ratio decreased because of one-time expenses recorded during the year ended December 31, 2017 as partincreased levels of tax strategies.average assets. The efficiency ratio also decreased from 66.25%63.92 % at December 31, 20172020 to 62.10%60.92% at December 31, 20182021 due to theserevenue increasing faster than expenses in 2017.2021. For more information on the calculation of the efficiency ratio, see “Non-GAAP Financial Measures” located within this management’s discussion and analysis.
Provision for income taxes
The Company’s effective income tax rate approximated 16.2%14.3% in 20182021 and 12.2%14.7% in 2017.2020. The difference between the effective rate and the enacted statutory corporate rate of 21% is due mostly to the effect of tax exempttax-exempt income in relation to the level of pre-tax income. On December 22, 2017, the Tax Act was signed into law and as a result the Company’s federal corporate tax rate was reduced from 34% to 21% effective January 1, 2018. The Company was required to re-measure its deferred tax assets and liabilities for the change in tax rate and recorded a $1.1 million adjustment that reduced the provision for income taxes at the end of 2017. The provision for income taxes increased $0.9$1.8 million, or 77%78%, from $1.2$2.2 million at December 31, 20172020 to $2.1$4.0 million at December 31, 2018.2021. The increase was primarily due to higher pre-tax income in 2021 which partially offset the effect of higher tax-exempt interest income. If notthe federal corporate tax rate is increased, the Company’s net deferred tax liabilities will be re-valued upon adoption of the new tax rate. A federal tax rate increase will increase deferred tax liabilities with a corresponding increase to provision for income taxes, while a corresponding opposite impact will occur to reduce deferred tax assets and provision for income taxes, resulting in a net valuation adjustment in the period when the tax rate change adjustment in 2017, the provision would have decreased because the higher income before taxes in 2018 was taxed at a lower tax rate.becomes effective.
Comparison of Financial Condition as of December 31, 20172020
and 20162019 and Results of Operations for each of the Years then Ended
Executive Summary
On March 11, 2020, the World Health Organization declared a coronavirus, identified as COVID-19, a global pandemic. The Company began proactive initiatives in March 2020 to assist clients, Fidelity Bankers and communities impacted by the effects of the novel coronavirus pandemic. Management activated its established pandemic contingency plan response in March 2020 to ensure business continuity while assuring the health, safety and well-being of bankers, clients and the community. Special measures included:
Installing proper social distancing signs and markers, to include safety barriers for both bankers and clients that encourage proper separation as recommended by the CDC.
Encouraging use of online, mobile, telephone banking, night drop and ATMs to meet clients’ banking needs.
Adding resources to the Customer Care Center to manage increased call and chat volume.
Activating telecommunications capabilities to enable Fidelity Bankers to work-from-home, as appropriate.
Providing Fidelity Bankers personal protective equipment and disinfectant supplies when working on-site.
Scheduling in-person meetings by appointment only, observing the guidelines of social distancing and personal safety as recommended by health and safety officials.
Enhancing EPA approved cleaning and disinfecting protocols implemented at all locations, including utilizing ionization machines when required.
Increasing the fresh air intake and using anti-viral filters in all HVAC units, above OSHA regulations.
Conducting meetings virtually.
The Company incurred approximately $0.3 million in non-interest expenses during 2020 to implement programs and provide supplies and services in order to respond to the pandemic.
Nationally, the unemployment rate declinedgrew from 4.7%3.6% at December 31, 20162019 to 4.1%6.7% at December 31, 2017. However, the2020. The unemployment raterates in the Scranton-Wilkes-BarreScranton - Wilkes-Barre - Hazleton and the Allentown – Bethlehem - Easton Metropolitan Statistical Area Areas (local) lagged behind increased and the Scranton – Wilkes-Barre - Hazleton rate remained at a higher level than the national
unemployment rate. According to the U.S. Bureau of Labor Statistics, the local unemployment raterates at December 31, 2017 was 5.0%2020 were 7.6% and 6.2%, a decreaserespectively, an increase of 0.42.0 and 1.7 percentage points from 5.4%the 5.6% and 4.5%, respectively, at December 31, 2016.2019. The national and local unemployment rate dropped during 2017 mostly due torates rose as a decrease in the sizeresult of the local labor force. effects of the pandemic.
During 2017,2020, the Company’s assets grew by 9%68% primarily from depositassets acquired from the merger with MNB and additional growth borrowingsin deposits and retained net earnings, which were used to fund growth in the loan and securities portfolios.portfolio. Non-performing assets represented 0.73%0.39% of total assets as of December 31, 2017,2020, down from 1.33%0.50% at the prior year end. Non-performing assets wereto total assets was lower during 20172020 mostly due to less non-accrual loans and other foreclosednon-performing assets increasing slower than the growth in total assets.
On December 22, 2017, the Tax Act was signed into law. The Tax Act lowered the Company’s federal income tax rate to 21%, effective January 1, 2018, from the previous rate of 34%. Net income in 2017 included a reduction in income tax expense related to an adjustment to lower the carrying value of the net deferred tax liability by $1.1 million to reflect the change in tax rate.
WeCompany generated $8.7$13.0 million in net income in 2017,2020, up $1.0$1.4 million, or 13%, from $7.7$11.6 million in 2016.2019. In 2017,2020, our larger and better positionedwell diversified balance sheet from organic and inorganic growth contributed to the success of our earnings performance. As described above, the Company recognized a $1.1 million credit to the provision for income taxes at the end of 2017. Also as a result of the Tax Act, the Company decided to make a donation to a charitable foundation, paid one-time bonuses to employees, sold securities at a loss and paid off the lease of a former branch early amounting to $0.7 million, net of taxes, during the fourth quarter of 2017 which mitigated the impact of this credit.
Financial Condition
Consolidated assets increased $70.7$689.6 million, or 9%68%, to $863.6 million$1.7 billion as of December 31, 20172020 from $792.9 million$1.0 billion at December 31, 2016.2019. The increase in assets occurred predominantlyprimarily from assets acquired in the loanmerger with MNB. Of the growth in net loans and investment portfolios and, to a lesser extent, the purchase of additional bank owned life insurance during 2017.leases, $132.1 million was from PPP loans. The asset growth was funded by utilizing available cash balances along with growth in deposits of $26.7 million, borrowings of $35.5$673.8 million and $5.1$7.7 million in retained earnings, net of dividends declared.
Funds Provided:
Deposits
Total deposits increased $26.7$673.8 million, or 4%81%, from $703.5$835.7 million at December 31, 20162019 to $730.2 million$1.5 billion at December 31, 2017. Interest-bearing2020. Non-interest bearing and interest-bearing checking accounts contributed the most to the deposit growth with increases of $215.5 million and $211.7 million, respectively. The Company acquired checking accounts from the merger with MNB and also added accounts in the Lehigh Valley after the merger. Expectations are that customers preferred to keep money in their checking accounts during this uncertain economic climate and did not spend as much as normal due to business and travel restrictions. Of the growth in non-interest bearing checking accounts, $116.8 million was new accounts in the Lehigh Valley. The remaining growth of over $98 million was primarily due to an increase of $41.0 million.in existing business and personal deposit account balances. The growthincrease in interest-bearing checking accounts cameincluded $121.1 million in new deposits from a combinationthe Lehigh Valley. The remaining increase of new and existing personal, business and public accounts. CDs contributed $14.3over $90 million to deposit growthwas primarily due to CDs acquired in a branch acquisitionseasonal tax cycles, business activity and $5.0relief from the CARES Act. Money market accounts increased $160.2 million, $97.7 million of which was added from the Lehigh Valley, and the remainder was mostly due to higher balances of personal and business accounts and shifts from other
types of deposit accounts. Savings accounts increased $74.8 million due to $53.4 million in accounts added in the Lehigh Valley and also an increase in personal account balances.
Additionally, CDs to one public customer during 2017. Additionally, savings and clubsalso increased by $9.5 million. These increases were$11.6 million with $42.3 million from accounts in the Lehigh Valley partially offset by a $32.5 million reduction in non-interest bearing depositsrunoff as rates dropped during 2020 and a $5.6 million decrease in money market accounts. promos reached maturity.
The decrease in non-interest bearing deposits was due to a $48.7 million temporary deposit received at the endCompany did not have any CDARs as of 2016December 31, 2020 and transferred to a trust escrow account in January of 2017. Excluding this temporary deposit, the Company experienced growth in non-interest bearing deposits of $16.2 million. During the first quarter of 2017, the Company completed the acquisition of Wayne Bank’s West Scranton branch which increased deposits by $13.9 million.
Customers’ interest in long-term time deposit products continued to be weak with a sustaining preference for non-maturing transaction deposits. The Company’s portfolio of CDs increased mostly due to $11.5 million in CDs acquired from the West Scranton branch of Wayne Bank during the first quarter of 2017.
2019. As of December 31, 20172020 and 2016, CDARS2019, ICS reciprocal deposits represented $1.1$46.2 million and $19.7 million, or less than 1%3% and 2%, of total deposits.deposits which are included in interest-bearing checking accounts in the table above. The $26.5 million increase in ICS deposits is primarily due to public funds deposit transfers from other interest-bearing checking accounts to ICS accounts.
Short-term borrowings
Short-term borrowings increased $14.3decreased $37.8 million during 2017. If not for2020 as a $48.7 million temporaryresult of deposit at the end of 2016,growth.
FHLB advances
During 2020, the Company would have had to use overnight borrowings at December 31, 2016.
FHLB advances
As of December 31, 2017, the Company had $21.2paid off $10.0 million in FHLB advances. During the first quarteradvances with a weighted average interest rate of 2017, the Company borrowed $17 million from the FHLB to purchase securities. The borrowings were laddered out with maturities ranging from July 2017 to January 2019 and interest rates ranging from 0.64% to 1.34%2.97%. During the second quarter of 2017,2020, the Company borrowed another $6.7acquired $7.6 million of FHLB advances from the MNB merger that was subsequently paid off. At December 31, 2019, the Company had $15.0 million in FHLB to fund loan growth and replace seasonal deposits. The borrowing matures in May 2019 and has anadvances with a weighted average interest rate of 1.43%3.01%. During the third quarter of 2017, $2.0 million that was borrowed in January 2017 matured and was rolled into a new $2.0 million advance from the FHLB that matures July 2018 and has an interest rate of 1.52%. During the fourth quarter of 2017, $2.5 million that was borrowed in January matured. As of December 31, 2016,2020, the Company did not require any FHLB advances.had the ability to borrow an additional $428.7 million from the FHLB.
Funds Deployed:
Investment Securities
As of December 31, 2017,2020, the carrying value of investment securities amounted to $157.4$392.4 million, or 23% of total assets, compared to $185.1 million, or 18% of total assets,
compared to $130.0 million, or 16% of total assets, at December 31, 2016. 2019.
Investment securities were comprised of AFS securities as of December 31, 2017.2020 and 2019. The AFS securities were recorded with a net unrealized gain of $2.3$11.3 million and $2.1a net unrealized gain of $4.5 million as of December 31, 20172020 and December 31, 2016, or a2019, respectively. Of the net improvement in the unrealized gain position of $0.2$6.8 million, during 2017.$4.5 million was net unrealized gains on municipal securities, $2.2 million was net unrealized gains on mortgage-backed securities and $0.1 million was net unrealized gains on agency securities.
As of December 31, 2017,2020, the Company had $124.2$278.4 million in public deposits, or 17%18% of total deposits. Pennsylvania state law requires the Company to maintain pledged securities on these public deposits. As of December 31, 2017,2020, the balance of pledged securities required for deposit and repurchase agreement accounts was $132.4 million.$270.4 million, or 69% of total securities.
During the year ended December 31, 2017,2020, the Company did not incur other-than-temporary impairment charges from its investment securities portfolio.
During 2017,2020, the carrying value of total investments increased $27.3$207.3 million, or 21%112%.
The Company acquired securities with a fair value of $123.4 million as a result of the merger with MNB on May 1, 2020. The Company immediately sold $107.4 million of these securities. During the firstsecond quarter of 2017,2020, the Company purchased approximately $20 millionimplemented an investment strategy to redeploy the acquired portfolio that was liquidated on May 1, 2020. The re-investment strategy was completed in the third quarter of securities, primarily MBS - GSE residential, funded mostly by $10 million in debt maturing in two years and another $7 million in borrowings laddered out from six months to one year matching a spread expected to produce a suitable after-tax return.2020.
As of December 31, 2017,2020, there were no investments from any one issuer with an aggregate book value that exceeded 10% of the Company’s shareholders’ equity.
The distribution of debt securities by stated maturity and tax-equivalent yield at December 31, 20172020 were as follows:
| | | | | | | | | | | | | | | | |
|
|
|
|
|
|
|
|
|
|
|
|
|
|
|
|
| | | | More than | | More than | | More than | | | | | |
|
|
| More than |
| More than |
| More than |
|
|
|
|
|
| One year or less | | one year to five years | | five years to ten years | | ten years | | Total | One year or less |
| one year to five years |
| five years to ten years |
| ten years |
| Total |
(dollars in thousands) | $ | % | | $ | % | | $ | % | | $ | % | | $ | % | $ | % |
| $ | % |
| $ | % |
| $ | % |
| $ | % |
| | | | | | | | | | | | | | | | |
|
|
|
|
|
|
|
|
|
|
|
|
|
|
|
|
MBS - GSE residential | $ | - | % | | $ | 2,472 | 3.46 | % | | $ | 3,520 | 3.92 | % | | $ | 97,160 | 3.28 | % | | $ | 103,152 | 3.30 | % | $ | - | % |
| $ | 204 | 4.19 | % |
| $ | 5,154 | 3.43 | % |
| $ | 141,902 | 2.75 | % |
| $ | 147,260 | 2.77 | % |
State & municipal subdivisions | | - | | | 921 | 6.44 | | 2,611 | 5.24 | | 40,774 | 5.03 | | 44,306 | 5.07 | |
| - |
|
| 1,003 | 6.02 |
| 22,456 | 1.67 |
| 176,254 | 3.51 |
| 199,713 | 3.31 |
|
Agency - GSE | | 4,997 | 1.39 | | | 4,102 | 1.67 | | - | - | | - | - | | 9,099 | 1.52 | |
| - |
|
| 6,336 | 2.70 |
| 33,634 | 1.09 |
| 5,477 | 1.45 |
| 45,447 | 1.35 |
|
Total debt securities | $ | 4,997 | 1.39 | % | | $ | 7,495 | 2.80 | % | | $ | 6,131 | 4.48 | % | | $ | 137,934 | 3.78 | % | | $ | 156,557 | 3.68 | % | $ | - | % |
| $ | 7,543 | 3.18 | % |
| $ | 61,244 | 1.50 | % |
| $ | 323,633 | 3.14 | % |
| $ | 392,420 | 2.88 | % |
In the above table, the book yields on state & municipal subdivisions were adjusted to a tax-equivalent basis using the corporate federal tax rate of 34%21%. In addition, average yields on securities AFS are based on amortized cost and do not reflect unrealized gains or losses.
Federal Home LoanRestricted investments in bank stock
Atlantic Community Bankers Bank Stock
(ACBB) stock totaling $45 thousand was acquired from the merger with MNB. The dividends received from the FHLB totaled $135$203 thousand and $54$343 thousand for the years ended December 31, 20172020 and 2016,2019, respectively. The balance in FHLB and ACBB stock was $2.8 million and $2.6$4.4 million as of December 31, 20172020 and 2016,2019, respectively.
Loans and leases
As of December 31, 2017,2020, the Company had gross loans and leases totaling $638.6 million$1.1 billion compared to $598.0$754 million at December 31, 2016. The growth2019, an increase of $40.6$366 million, or 7%, was largely attributed to49%.
The increase resulted primarily from $210 million in loans acquired from the Company’s continued efforts to grow the commercialmerger with MNB and industrial portfolio through opportunities with local government entities including counties, townships, boroughs, cities, school districts and municipalities and authorities. Additionally, the indirect auto and lease portfolio recognized substantial planned growth during 2017 due to new relationships with automobile dealerships$130 million in Northeastern Pennsylvania.
In 2017, the Company originated $43.8 million of commercial and industrial loans, and $23.9 million of commercial real estate loans compared to $25.2 million and $19.4 million, respectively, net of loan participationsdeferred fees, originated under the PPP primarily during the second quarter 2020 that were still outstanding at year-end.
As of December 31, 2020, Company-originated loans, excluding the PPP loans, totaled $781 million compared with $754 million as of December 31, 2019, an increase of $27 million, or 4%, primarily in 2016. Also, during 2017, the Company originated $63.2 million of residential real estate loan held-for-investment portfolio, resulting from loan modifications to refinance existing loans comparedat market rates to $68.8 million in 2016. Included in mortgage loans were $17.2 million of residential real estate construction lines in 2017 and $12.7 million in 2016. In 2017, the Company originated $61.1 million of consumer loans compared to $52.1 million in 2016. Of the consumer loan originations, $50.1 million were dealer loans in the auto and leases portfolio in 2017 compared to $42.6 million in 2016. In addition for 2017, the Company had originations of lines of credit in the amounts of $36.9 million for commercial borrowers and $16.9 million in home equity and other consumer lines of credit.qualified customers.
Commercial and industrial and commercial real estate
TheAs of December 31, 2020, the commercial loan portfolio totaled $663 million and consisted of commercial and industrial (C&I) portfolio and commercial real estate (CRE) loans. Company-originated loans totaled $502 million and acquired loans from MNB totaled $161 million. As of December 31, 2019, the commercial loan portfolio had growth of $15.1totaled $358 million. and therefore, loans originated by the Company experienced a $144 million, or 15%40%, and $4.2year-over-year increase.
Company-originated loans, net of fees, excluding $130 million in PPP loans, which were recorded as C&I loans, increased $14 million, or 2%4%, respectively, atfrom $358 million as of December 31, 2017 compared2019 to $372 million as of December 31, 2016. The major contributors2020.
This increase resulted primarily from the origination of a $7.2 million C&I loan and a $6.5 million CRE loan during the fourth quarter.
Paycheck Protection Program Loans
During the second and third quarter, the Company originated 1,551 loans totaling $159 million under the Paycheck Protection Program, and during the fourth quarter, the Company began the process of submitting PPP forgiveness applications to the growth inSBA. As of December 31, 2020, the C&I portfolio were local government entities. These opportunities continue through developing influential relationships utilized throughremaining principal balance of these loans was $132 million as the Company’s strategy.Company received full and partial forgiveness totaling $27 million, or 17% of the balance originated.
As a PPP lender, the Company received fee income of approximately $5.6 million. The Company also expanded commercial real estate secured lending. Mitigating the CRE growth, the Company foreclosed on one large owner occupied CRE collateral during 2017, which was subsequently sold. In addition, the increase in CRE construction loans was due to loans addedrecognized $3.3 million of PPP fee income during the second, third, quarterand fourth quarters of 20172020 with the remaining amount to one customer for several construction projects.be recognized in future quarters. Unearned fees attributed to PPP loans net of fees paid to referral sources, as prescribed by the SBA under the PPP program, was $2.2 million as of December 31, 2020.
Consumer
Consumer
TheAs of December 31, 2020, the consumer loan portfolio grew nearly 13%, or $19.5totaled $216 million from $150.2 million on December 31, 2016 to $169.7 million at December 31, 2017. This planned growth was largely driven by a 47% increase, or a liftand consisted of $26.7 million, in auto loans and leases. Additional growth was realized from $1.7 million inhome equity installment, home equity line of credit, usage from newauto, direct finance leases and existing clients. These increases more than offset a $7.7 million reduction in other consumer loans. Company-originated loans totaled $205 million and acquired loans from $13.3 million at December 31, 2016 to $5.6 million at December 31, 2017. Other consumer loans settled back to more normalized levels at the end of 2017 as the December 31, 2016 balance was overstated by a temporary overdraft.
Residential
The residential loan portfolio grew approximately $1.8 million, or 1%, from $145.0 million at December 31, 2016 to $146.8 million at December 31, 2017. Construction loans were recorded at $9.9 million after a nominal reduction of $0.6 million while the held-for-investment real estate mortgages grew $2.4 million to $136.9 million from $134.5MNB totaled $11 million. Held-for-investment real estate made up approximately 93% of the total residential portfolio.
As of December 31, 2017, approximately 69% of2019, the grossconsumer loan portfolio totaled $212 million. The $4 million, or 2%, increase in the consumer loan portfolio was secureddue to the MNB acquisition.
Net of MNB-acquired loans, company-originated loans decreased by real estate, reflecting a 3 year decreasing trend from 73% at December 31, 2016 and 76% at December 31, 2015. The$7 million, or 3%. This reduction in company-originated consumer loans was primarily the result of net runoff in the auto and leases portfolio was 13.1% of the gross loan portfolio, at December 31, 2017, increasing from 9.5% at December 31, 2016the result of COVID-19’s impact on car sales during the second and 5.3% at December 31, 2015.third quarters of 2020.
Loans held-for-saleResidential
As of December 31, 20172020, the residential loan portfolio totaled $242 million and 2016,consisted primarily of held-for-investment residential loans for primary residences. Company-originated loans totaled $204 million and acquired loans from MNB totaled $38 million. As of December 31, 2019, the residential loan portfolio totaled $185 million. The $57 million, or 31%, increase in the residential loan portfolio was primarily due to the MNB acquisition.
Net of MNB-acquired loans, Company-originated loans increased by $19 million, or 10%, mainly due to $29 million in 145 mortgage modifications to refinance existing loans at market rates to qualified customers.
Loans held-for-sale
As of December 31, 2020 and 2019, loans HFS consisted of residential mortgages with carrying amounts of $2.2$29.8 million and $2.9$1.6 million, respectively, which approximated their fair values. During the year ended December 31, 2017,2020, residential mortgage loans with principal balances of $40.7$155.1 million were sold into the secondary market and the Company recognized net gains of $0.8$3.5 million, compared to $51.3$52.4 million and $1.0$0.8 million, respectively, during the year ended December 31, 2016.2019. During 2017,the year ended December 31, 2020, the Company also sold one SBA guaranteed loan with a principal balance of $2.4$0.6 million and recognized a net gain of $93 thousand compared to two SBA guaranteed loans with principal balances of $0.3 million and recognized a net gain on the sale of $0.1 million. $34 thousand during the year ended December 31, 2019.
The Company did not sell any SBA guaranteedretains mortgage servicing rights (MSRs) on loans in 2016.
sold into the secondary market. MSRs are retained so that the Company can foster personal relationships. At December 31, 20172020 and 2016,2019, the servicing portfolio balance of sold residential mortgage loans was $299.3$366.5 million and $285.2$302.3 million, respectively. At December 31, 2017 and 2016, therespectively, with mortgage servicing portfolio balancerights of sold SBA loans was $5.6 $1.3
million and $4.1$1.0 million for the same periods, respectively.
Allowance for loan losses
The allowance for loan losses was $9.2 million at December 31, 2017 and $9.4 million at December 31, 2016. Relative to the loan portfolio, which grew $40.6 million in 2017, the allowance decreased from 1.57% of total loans at December 31, 2016 to 1.44% at December 31, 2017.
DuringFor the year ended December 31, 2017, management2020, the allowance increased qualitative factor loss estimates$4.5 million, or 46%, to $14.2 million from $9.7 million at December 31, 2019 due to certain macroeconomic and business factors. One factor identifiedprovisioning of $5.3 million partially offset by $0.8 million in net charge-offs.
For the inverse effect of rising interest rates on commercial real estate values. Another involved relatively higher delinquency rates on urban residential properties (3.1% regionally vs. 1.6% nationally) within the Company’s operating area on properties that were relatively more likelyyear ended December 31, 2020, total loans, which represent gross loans less unearned lease revenue, increased $366 million, or 49%, to have negative equity (29.1% regionally vs. 10.4% nationally). An additional factor concerned the increased exposure$1.1 billion compared to $753 million at December 31, 2019.
The increase in the auto and leases segment of the loan portfolio resulted primarily from $210 million in loans, net of deferred costs, acquired in the merger with MNB and $130 million in loans originated under the PPP, net of deferred fees, primarily during the second quarter 2020.
Loans acquired from the MNB merger (performing and non-performing) were initially recorded at their acquisition-date fair values. Because there is no initial credit valuation allowance recorded under this method, the Company establishes a post-acquisition allowance of loan losses to record losses which went from 9.5% ofmay subsequently arise on the grossacquired loans. Since no deterioration was noted for any such loans following acquisition, no allowance for loan portfolio in 2016and lease losses was provided at this time.
PPP loans made to 13.1% of the grosseligible borrowers have a 100% SBA guarantee. Given this guarantee, no allowance for loan portfolio in 2017. Lastly, management identified potentially increased legal and regulatory requirements as the result of the Company’s growing asset size.lease losses was recorded for these loans.
For the twelve month periodyear ended December 31, 2017, allowance levels fell by $0.2 million to $9.2 million, while gross loans2020, the loan portfolio increased by $40.6 million49% while the allowance for loan losses increased by 46% during the same period. This caused the allowance for loan and lease losses to $638.6 million compared to December 31, 2016. The inverse movement between allowance levels and gross loans was justified by improving asset quality. Improving asset quality was noted in a reduction of non-performing loansdecrease slightly as a percentage of total loans which fell to 0.54% versus 1.23% and greater coverage of allowance to non-accrual loans, which improved to 2.67x1.27% from 1.29% at December 31, 2017 versus 1.27x at2019. Loan growth exceeded allowance for loan and lease losses growth because $340 million in loans, or 30% of the loan portfolio, included loans acquired from the MNB merger and PPP loans.
As of December 31, 2016, respectively.2020, the loan portfolio, net of PPP loans and MNB acquired loans, totaled $780 million, an increase of $27 million, or 4%, from $754 million as of December 31, 2019.
NetDuring the first quarter of 2020, management increased the qualitative factors associated with its commercial, consumer, and residential portfolios related to potential adverse changes in both the volume and severity of past due and non-accrual loans along with national and local economic conditions as a result of the COVID-19 pandemic. A statewide shutdown of non-essential business activity was ordered on March 16th in Pennsylvania. General economic reports and data indicate a recession with elevated unemployment and sustained low inflation. The duration and severity of the recession or the ultimate path of the recovery was not known at that point.
During the second quarter of 2020, management increased the qualitative factors associated with its loan portfolio, despite the decrease in the Company-originated loan portfolio, to recognize higher inherent risk characteristics for loans that were deemed to have greater exposure to the economic impact of the COVID-19 pandemic. These characteristics included loans that received forbearance of any kind (see COVID-19 Accommodations in this section below), loans that were in high risk industries, and loans that had prior delinquency of over 60 days. High risk industries include hotel accommodations, food service, energy, recreation, certain parts of the transportation segment, and other service industries. The duration and severity of the recession or the ultimate path of the recovery remained uncertain.
During the third quarter of 2020, management increased the qualitative factors associated with its loan portfolio by estimating higher inherent risk characteristics for loans that received second, COVID-related deferrals. Management further modeled the potential impact on the existing loan portfolio given the potential negative impact to the local economy given a lack of further COVID-related fiscal stimulus.
During the fourth quarter of 2020, management increased the qualitative factors associated with its loan portfolio by estimating higher inherent risk characteristics for loans that received COVID-related deferrals during the fourth quarter (both first time and additional deferrals). Management further modeled the potential impact on the existing loan portfolio given the prolonged duration of the COVID-19 pandemic and the associated restrictions, with a greater relative increase in qualitative factors to the commercial portfolio compared to the residential and consumer portfolios.
For the year ended December 31, 2020, net charge-offs against the allowance totaled $1.6$0.8 million compared with $1.1 million for the year ended December 31, 2017 compared with $1.22019, representing a $0.3 million, or 27%, decrease. The decrease was attributed to a $0.2 million recovery during the first quarter of 2020 in the form of a reimbursement from the Federal National Mortgage Association (“FNMA”) for previously sold mortgages charged-off during the third quarter of 2019. Excluding this recovery, net charge-offs for the year ended December 31, 2016. For the year ended December 31, 2017, commercial loan net charge-offs were $0.72020 would have shown an improvement, decreasing by $0.1 million, or 45%9%, of net charge-offs. This was primarily due to two commercial real estate secured borrowers who experienced charge-offs of $0.5 million throughoutover the prior year. Consumer net charge-offs totaled $0.6 million, or 36%, of net charge-offs. One home equity line of credit borrower accounted for $0.3 million of these consumer net charge-offs. Residential charge-offs were $0.3 million, or roughly 19%, of net charge-offs, with one borrower accounting for $0.2 million during the fourth quarter of 2017.
The allocation of the allowance for the commercial loan portfolio, which is comprised of commercial real estateCRE and commercial & industrialC&I loans, accounted for approximately 59%62% of the total allowance for loan losses at December 31, 2017,2020, which represents a 3six percentage point decreaseincrease from 56% of the total allowance for loan losses at December 31, 2016. 2019 and a seven percentage point increase from the 55% of the total allowance for loan and lease losses at December 31, 2018.
The decreaseincrease in the commercial real estate and commercial & industrial allocation from December 31, 2016 to December 31, 2017 was mostly relatedallowance allocated to the payoffcommercial portfolio was attributed to the recognition of two large commercial real estate loans from a single borrower, which had a substantial specifically reserved impairment. increased inherent risk due to the economic impact of the COVID-19 pandemic.
The allocation of the allowance for the consumer category of loans,loan portfolio, accounted for approximately 22%18% of the total allowance for
loan losses at December 31, 2017,2020, which represents a 2three percentage point increasedecrease from 21% of the total allowance for loan losses at December 31, 2016. This higher allocation was mostly related to increases2019 and a eight percentage point decrease from 26% of the total allowance for loan losses at December 31, 2018.
The decrease in the qualitative factor assigned for this segment dueallowance allocated to the rising rate environment,consumer loan portfolio was attributed to the Company’s increased auto exposure, and concerns aboutrelative decrease in the urban residential housing market. percentage of consumer loans in the portfolio.
The allocation of the allowance for the residential real estate category of loans,portfolio, accounted for approximately 17%20% of the total allowance for loan losses at December 31, 2017,2020, which remains unchangedrepresents a three percentage point decrease from 23% of the total allowance for loan losses at December 31, 2016. 2019 and a one percentage point increase from 19% of the total allowance for loan losses at December 31, 2018.
The stable allocation wasyear-over-year decrease in the result of a $0.8 million reduction in non-accrualallowance allocated to the residential real estate loans from December 31, 2016 to December 31, 2017, whichportfolio was offset by the increased qualitative factor for this segment associated with risks relatedattributed to the urbanrelative decrease in the percentage of residential housing market. loans in the portfolio.
The unallocated amount represents the portion of the allowance not specifically identified with a loan or groups of loans. The unallocated reserve was approximatelyless than 1% of the total allowance for loan losses at December 31, 2017, which remains2020, unchanged from less than 1% of the total allowance for loan losses at December 31, 2016. Management provided the amount to support growth in the loan portfolio2019 and reinforce the allowance for identified and potential credit risks that still exist from an uncertain local economic climate.
Non-performing assets
At December 31, 2017, non-performing2018.
Non-performing assets
Non-performing assets represented 0.73%0.39% of total assets at December 31, 2020 compared with 1.33% as of0.50% at December 31, 2016.2019. The year-over-year improvement resulted from a combination of $70.7 million in total asset growth and a $4.2 million net reduction in totalthe non-performing assets year-over-year.
From December 31, 2016 to December 31, 2017, non-performing loans, which consists of accruing loans that were over 90 days past due as well as all non-accrual loans, decreased from $7.4 million to $3.4 million, a $4.0 million, or a 53% decrease. The decrease in non-performing loansratio was the result of payments receivedthe $690 million, or 68%, increase in total assets to $1.7 billion at December 31, 2020 outpacing the $1.7 million, or 32%, increase in non-performing assets.
As of $3.5December 31, 2020, non-performing assets increased to $6.7 million charge-offs of $1.2from $5.0 million transfers back to accrual of $1.0at December 31, 2019. The $1.7 million year-over-year increase resulted from a $1.6 million increase in accruing TDRs and transfers to ORE of $0.2 million. These reductions were partially offset by additions and miscellaneous expenses totaling $2.0 million. The payments received were mostly related to the payoff of two commercial real estate secured loans for a single borrower during the third quarter. $0.1 million increase in non-accrual loans.
From December 31, 20162019 to December 31, 2017, the portion of accruing2020, non-accrual loans that were over 90 days past due decreased from $19 thousand to $6 thousand. Accruing loans over 90 days past due at December 31, 2016 consisted of four loans to four unrelated borrowers ranging from $1 thousand to $9 thousand. Accruing loans over 90 days past due at December 31, 2017 consisted of one loan.
From December 31, 2016 to December 31, 2017, non-accruing loans of all types decreased by $4.0increased $0.1 million, or 53%3%, from $7.4$3.7 million to $3.4$3.8 million. At December 31, 2016,2020, there were a total of 46 loans to 3938 unrelated borrowers with balances that ranged from less than $1 thousand to $2.3$0.5 million. At December 31, 2017,2019, there were a total of 3944 loans to 3234 unrelated borrowers with balances that ranged from less than $1 thousand to $0.6$0.5 million. The decrease$0.1 million increase in non-accruingnon-accrual loans is primarily attributablewas the result of $2.9 million in new non-accruals, $0.2 million in expenses added to the payoffbalances, $1.7 million in payments, $0.8 million in charge-offs and $0.5 million in transfers to ORE.
There were two direct finance leases totaling $61 thousand that were over 90 days past due as of two significant non-accrual owner occupied commercial real estate securedDecember 31, 2020 compared to no loans to one borrower with balances totaling $3.0 million. During the third quarterover 90 days past due as of 2017, the Company foreclosed on the collateral for these loans and sold the foreclosed assets.December 31, 2019.
If the non-accrual loans that were outstanding as of December 31, 20172020 had been performing in accordance with their original terms, the Company would have recognized interest income with respect to such loans of $0.2 million.$186 thousand.
From December 31, 20162019 to December 31, 2017,2020, TDRs increased $1.7 million, or 108%, due to two loans totaling $1.6 million to a single commercial borrower modified during the balancethird quarter being designated as TDRs and two loans totaling $0.2 million to a single commercial borrower modified during the fourth quarter being designated as TDRs. At December 31, 2019, there were a total of 8 TDRs by 7 unrelated borrowers with balances that ranged from $80 thousand to $0.5 million. At December 31, 2020, there were a total of 12 TDRs by 9 unrelated borrowers with balances that ranged from $5 thousand to $1.3 million.
Loans modified in a TDR may or may not be placed on non-accrual status. At December 31, 2020, there were four TDRs totaling $0.7 million that were on non-accrual status compared to two TDRs totaling $0.6 million at December 31, 2019.
Beginning the week of March 16, 2020, the Company began receiving requests for temporary modifications to the repayment structure for borrower loans. Modification terms included interest only or full payment deferral for up to 6 months. As of December 31, 2020, the Company had 10 temporary modifications with principal balances totaling $2.2 million outstanding, which included 5 additional deferral requests for temporary forbearance modifications totaling $0.7 million and 7 first requests for temporary forbearance modifications totaling $1.5 million.
Foreclosedassets held-for-sale
From December 31, 2019 to December 31, 2020, foreclosed assets held-for-sale (ORE) declined from $349 thousand to $256 thousand, a $93 thousand, or 27%, decrease. Two properties to two unrelated borrowers for $338 thousand were added during the second quarter and eight properties to four unrelated borrowers for $432 thousand were added during the third quarter. Two properties were sold for $250 thousand during the first quarter, two properties were sold for $281 thousand during the second quarter, one property securing one loan was relatively unchanged from ninesold for $14 thousand during the third quarter, and two properties were sold for $37 thousand in the fourth quarter. The Company also sold one of two properties securing one loan for $142
thousand and two of four properties securing another loan relationship for $82 thousand in the third quarter, and one of four properties securing one loan relationship for $20 thousand in the fourth quarter. Further, one foreclosed asset was written down by $14 thousand to fair market value in the third quarter and one foreclosed asset was written down by $22 thousand to fair market value in the fourth quarter.
As of December 31, 2020, ORE consisted of six properties securing loans to six unrelated borrowers totaling $3.4 million to fourteen loans to ten unrelated borrowers totaling $3.4 million. The addition of six commercial real estate secured loans$256 thousand. Four properties ($223 thousand) to four unrelated borrowers totaling $1.0 millionwere added in 2020; one property ($32 thousand) was offset by $0.3 millionadded in payments and $0.7 million2019; one property ($1 thousand) was added in charge-offs during 2017.
At December 31, 2016, two TDRs totaling $1.5 million were on non-accrual. At December 31, 2017, three TDRs totaling $1.6 million were on non-accrual. During 2017, two CRE loans to one borrower were transferred to non-accrual status and subsequently one of these loans was charged off.
Foreclosedassets held-for-sale
From December 31, 2016 to December 31, 2017, foreclosed assets held-for-sale (ORE) decreased from $1.3 million to $1.0 million, a $0.3 million, or 25%, decrease.As of December 31, 2017, ORE consisted of eleven properties from eleven unrelated borrowers totaling $1.0 million. Four of these properties ($0.2 million) were added in 2017; two were added in 2016 ($0.5 million); one was added in 2015 ($0.1 million); two were added in 2014 ($42 thousand); one was added in 2012 ($100); and one was added in 2011 ($0.2 million). Of the eleven properties, seven totaling $0.8 million were listed for sale, while the four remaining properties totaling $0.2 million were either in negotiations for sale, in process for disposition, or had a signed sales agreement.
As of December 31, 2017,2020, the Company had no other repossessed asset held-for-sale. There was oneassets held-for-sale compared to two other repossessed assetassets held-for-sale, at December 31, 2016, with a balance of $8 thousand.$20 thousand as of December 31, 2019.
Cash surrender value of bank owned life insurance
In December 2020, the Company invested in $6 million in BOLI and $5 million in BOLI with annuity rider investments.
Premises and equipment
Net of depreciation, premises and equipment decreased $0.6increased $6.1 million during 2017. The Company recorded $1.32020. Additions of $1.6 million in depreciation expense plus $0.2and assets acquired from the merger of $6.9 million in losses on the disposal of premises and equipment which waswere partially offset by $0.9$1.9 million of depreciation expense in additions to fixed assets.2020.
Other assets
The $4.8During 2020, the $1.2 million, or 26%, increase in other assets was due mostly to $2.0 million in higher residual values associated with recording new automobile leases, net of lease disposals and $1.4 million lower net deferred tax liability. Other items that contributed to the increase were $0.5$0.6 million higher prepaid expenses, $0.4 million in additional miscellaneous receivable and $0.3 million moreincrease in construction in process and $0.5mortgage servicing rights partially offset by $0.4 million higherlower prepaid dealer reserve.
Results of Operations
Overview
For the year ended December 31, 2017,2020, the Company generated net income of $8.7$13.0 million, or $2.33$2.82 per diluted share, compared to $7.7$11.6 million, or $2.09$3.03 per diluted share, for the year ended December 31, 2016.2019. The $1.0$1.4 million, or 13%, increase in net income stemmed from $2.7$12.5 million more net interest income $1.6 million less provision for income taxes and $0.4$4.5 million in additional non-interest income which more than offset a $3.2$11.4 million rise in non-interest expenses and $0.4$4.2 million higher provision for loan loss provision.losses. The increase in non-interest expenses was driven by merger-related expenses incurred in connection with the acquisition of MNB along with the impact of adding the operations of MNB.
For the year ended December 31, 2017,2020, return on average assets (ROA) and return on average shareholders’ equity (ROE) were 1.03%0.87% and 10.34%9.06%, respectively, compared to 1.02%1.18% and 9.64%11.49% for the same period in 2016.2019. The increasedecrease in ROA and ROE was the result of net income growthgrowing at a slower pace than average assets and equity during 2017.2020.
Net interest income and interest sensitive assets / liabilities
Net interest income (FTE) increased $2.7$12.8 million, or 11%39%, from $25.1$32.5 million for the year ended December 31, 20162019 to $27.8$45.3 million for the year ended December 31, 2017,2020, due to interest income increasing more rapidly than interest expense. Total average interest-earning assets increased $80.5$449.2 million andwhile the FTE yields earned on these assets rose sixdeclined 65 basis points resulting in $3.7$10.6 million of growth in FTE interest income. In theThe loan portfolio the Company experienceddrove this growth due to average balance growth of $62.0$287.2 million which had the effect of producing $2.7$9.8 million of FTE interest income, more than offsetting the $0.2 million negative impact of a two basis point lower yield earned thereon. Although all loan portfolios showed more interest income from growth, the commercial loan portfolio made the biggest impact.income. In the investment portfolio, an increase in the average balances and yields of mortgage-backedmunicipal securities was the biggest driver of interest income growth. The average balance growth of total securities of $25.3grew $89.0 million combined with a 21 basis point increase in their yields produced $1.1producing $0.9 million in additional FTE interest income.income despite a decrease of 70 basis points in yields earned on investments. On the liability side, total interest-bearing liabilities grew $66.5$318.8 million on average with a nine58 basis point increasedecrease in rates paid on these interest-bearing liabilities. Growth in average interest-bearing deposits of $31.0$312.4 million mostly interest-bearing checking accounts, andwas offset by the highereffect of a 48 basis point reduction in rates paid on these deposits caused an increase of $0.4 million inlowering interest expense.expense by $1.4 million. In addition, the Company had $35.4 million morelower rates paid on average borrowings in 20172020 compared to 2016 which2019 resulted in $0.4$0.8 million moreless interest expense.
The FTE net interest rate spread and margin decreased by three7 and two22 basis points, respectively, for the year ended December 31, 20172020 compared to the year ended December 31, 2016.2019. The decrease in the spread was due toyields earned on interest-earning assets declined faster than the rates paid on interest-bearing liabilities increasing faster thancausing the yields earned on interest-earning assets. Net interest margin declined because average interest-earning assets grew faster thandecline in net interest income.rate spread. The overall cost of funds, which includes the impact of non-interest bearing deposits, increased eightdecreased 47 basis points for the year ended December 31, 20172020 compared to the same period in 2016.2019. The primary reason for the increasedecline was higher average borrowings which were used to fund asset growth along with an increasethe reduction in average interest-bearingrates paid on deposits and the rates paid thereon.borrowings.
The Company’s cost of interest-bearing liabilities was 55 basis points0.53% for the year ended December 31, 2017,2020, or nine59 basis points higherlower than the cost for the year ended December 31, 2016.2019. The higher average borrowings combined with an increasedecrease in average interest-bearinginterest paid on both deposits and their ratesborrowings contributed to the higherlower cost of interest-bearing liabilities.
Provision for loan losses
For the year ended December 31, 20172020 and 2016,2019, the Company recorded a provision for loan losses of $1.5$5.3 million and $1.0$1.1 million, respectively, a $0.5$4.2 million, or 384%, increase. ThisManagement increased the provision by $1.7 million, $1.2 million, and $1.3 million during the second, third, and fourth quarters of 2020, respectively, compared to the prior year periods.
The increase in the provision for loan losses from the year earlier period was due primarily attributed to net growth inhigher credit losses inherent within the loan portfolio particularly in the auto segmentbecause of the portfolio, but also to fund the expected allowance requirements implied from certain macroeconomic and other business factors. COVID-19 crisis.
Other income
For the year ended December 31, 2017,2020, non-interest income amounted to $8.4$14.7 million, a $0.4$4.5 million, or 5%44%, increase compared to $8.0$10.2 million recorded for the year ended December 31, 2016. The biggest contributor2019. Gains on loan sales contributed the most to thisthe increase was $0.3with $2.7 million higher trust feesmore recognized for the year ended December 31, 2020 than the year earlier period due to the assumption of the trust accounts of another bank during 2017 which added $0.2heightened mortgage activity. Interchange fees grew $0.9 million and organic market growth which added another $0.1 million. The Company also experienced an increase of $0.2 million in earnings on bank-owned life insurance (BOLI) due to the purchase of $8.0 million of additional BOLI during the first quarter of 2017. Debit card interchange fees contributed $0.2 million to the increase due to a higher volume of debit card transactions and an increase in merchant credit card income.transactions. Service charges on deposit accounts increased by $0.1 million from higher customer overdraft charges and other revenue increased $0.1 million from higher lease acquisition fees. Partially offsetting these items was $0.2loans were $0.6 million higher losses on the disposal of equipment, $0.2 million in additional losses on the sale of investment securities, $0.1 million fewer gains on the sale of loans and $0.1 million less2020 compared to 2019 primarily driven by more service charges on mortgage loans.
DuringFees from trust fiduciary activities increased $0.4 million year-over-year. While non-sufficient fund charges primarily led the fourth quarter of 2017, the Company utilized tax strategies in response to the passage of the Tax Act that resulted in a $0.1 million loss on the sale of securities and $0.2 million loss on the abandonmentreduction of leasehold improvements duedeposit service charges throughout 2020 compared to the early payoff of a former lease.2019 activities.
Other operating expenses
For the year ended December 31, 2017,2020, total other operating expenses totaled $24.8$38.3 million, an increase of $3.2$11.4 million, or 15%42%, compared to $21.6$26.9 million for the year ended December 31, 2016. Salary2019. Merger related expenses were $2.0 million of this increase. Salaries and employee benefits contributed the most to the increase rising $1.5$5.1 million, or 13%34%, in 20172020 compared to 2016.2019. The basis of the increase includes $0.6$3.3 million increasedmore salaries with eight more full-time equivalent employees, $1.0 million more in commissions, $0.9 million more in employee bonuses, $0.4 million more in additional incentivesocial security taxes, $0.4 million more in group insurance, $0.3 million more in stock-based compensation and $0.4$0.2 million more in 401k expenses. These increases in salaries and employee benefits were partially offset by $1.4 million more in loan origination costs deferred. Premises and equipment expenses from the post-retirement benefit plan implementedwere $1.5 million higher due to an increase in 2017.depreciation, equipment maintenance and rental expenses and expenses for pandemic response. Professional services were $1.5 million higher due to pandemic-related expenses and higher legal and audit expenses. Advertising and marketing increased $0.6$0.7 million resulting from a $0.5 million donation to a charitable foundation and $0.1 million in additional educational improvement donations. Professional services expenses were $0.3 million higher due to more professional services incurred, primarily from a NASDAQ entry fee and stock split expenses. Premises and equipment expense was $0.3 million higher due to the early payoff of a leased property.donations in 2020. Data processing and communications expense increased $0.3$0.5 million during 20172020 compared to 20162019 because of additional costs for data center services a new integrated dealer lending computer system and higher telecommunications expense from more circuits.accounts and additional branches. The Company incurred a $0.5 million FHLB prepayment penalty during 2020. Automated transaction processing expenses increased $0.1 million due to higher transaction volumes.$0.3 million. Partially offsetting these increases in expenses was a $0.1 million decrease in FDIC assessment. During the fourth quarter of 2017, the Company utilized tax strategies in response to the passage of the Tax Act that led to a $0.5 million donation, $0.2$0.7 million in certain employee bonusesother expenses due to higher loan origination cost deferrals from PPP lending and $0.1 million of early lease termination expenses.mortgage activity.
The ratios of non-interest expense less non-interest income to average assets, known as the expense ratio, at December 31, 20172020 and 20162019 were 1.95%1.58% and 1.81%1.70%, respectively. The expense ratio increaseddecreased because of higher non-interest expenses during the year ended December 31, 2017 compared to the year ended December 31, 2016.increased levels of average assets. The efficiency ratio also increased from 63.20%63.11 % at December 31, 20162019 to 66.25%63.92% at December 31, 20172020 due to higherthe increase in non-interest expenses.expenses in 2020.
Provision for income taxes
The Company’s effective income tax rate approximated 12.2%14.7% in 20172020 and 26.5%16.7% in 2016.2019. The difference between the effective rate and the enacted statutory corporate rate of 34%21% is due mostly to a $1.1 million adjustment made that reduced the provision foreffect of tax-exempt income taxes atin relation to the endlevel of 2017 as a result of the Tax Act. On December 22, 2017, the Tax Act was signed into law and as a result the Company’s federal corporate tax rate was reduced from 34% to 21% effective January 1, 2018. The Company was required to re-measure its deferred tax assets and liabilities for the change in tax rate and record the adjustment in the provision for income taxes in 2017.pre-tax income. The provision for income taxes decreased $1.6$0.1 million, or 56%3%, from $2.8$2.3 million at December 31, 20162019 to $1.2$2.2 million at December 31, 2017.2020. The tax reform adjustment coupled with lowerdecrease was primarily due to higher tax-exempt interest income before taxes in 2017 caused2020 which offset the decrease in the provision for income taxes. effect of higher pre-tax income.
Off-Balance Sheet Arrangements and Contractual Obligations
The Company is a party to financial instruments with off-balance sheet risk in the normal course of business in order to meet the financing needs of its customers and in connection with the overall interest rate management strategy. These instruments involve, to a varying degree, elements of credit, interest rate and liquidity risk. In accordance with GAAP, these instruments are either not recorded in the consolidated financial statements or are recorded in amounts that differ from the notional amounts. Such instruments primarily include lending commitments and lease obligations.
Lending commitments include commitments to originate loans and commitments to fund unused lines of credit. Commitments to extend credit are agreements to lend to a customer as long as there is no violation of any condition established in the contract. Commitments generally have fixed expiration dates or other termination clauses and may require payment of a fee. Since some of the commitments are expected to expire without being drawn upon, the total commitment amounts do not necessarily represent future cash requirements.
In addition to lending commitments, the Company has contractual obligations related to operating lease and capital lease commitments. Operating lease commitments are obligations under various non-cancelable operating leases on buildings and land used for office space and banking purposes. Capital lease commitments are obligations under one capital lease on buildings and equipment.
The following table presents, as of December 31, 2018,2021, the Company’s significant determinable contractual obligations and significant commitments by payment date. The payment amounts represent those amounts contractually due to the recipient, excluding interest:
| | | | | | | | | | | | | | |
| | | | | | | | | | | | | | |
| | | | Over one | | Over three | | | | | | |
| One year | | year through | | years through | | Over | | | |
(dollars in thousands) | or less | | three years | | five years | | five years | | Total |
Contractual obligations: | | | | | | | | | | | | | | |
Certificates of deposit | $ | 74,799 | | $ | 36,953 | | $ | 3,950 | | $ | 584 | | $ | 116,286 |
FHLB advances | | 16,704 | | | 5,000 | | | 10,000 | | | - | | | 31,704 |
Short-term borrowings | | 76,366 | | | - | | | - | | | - | | | 76,366 |
Operating leases | | 354 | | | 811 | | | 831 | | | 8,486 | | | 10,482 |
Capital leases | | 77 | | | 154 | | | 129 | | | - | | | 360 |
Commitments: | | | | | | | | | | | | | | |
Letters of credit | | 1,983 | | | 347 | | | 210 | | | 150 | | | 2,690 |
Loan commitments (1) | | 22,739 | | | - | | | - | | | - | | | 22,739 |
Total | $ | 193,022 | | $ | 43,265 | | $ | 15,120 | | $ | 9,220 | | $ | 260,627 |
| (1)
| | Available credit to borrowers in the amount of $122.0 million is excluded from the above table since, by its nature, the borrowers may not have the need for additional funding, and, therefore, the credit may or may not be disbursed by the Company.
|
|
|
|
|
|
|
|
|
|
|
|
|
|
|
|
|
|
|
|
|
|
|
|
|
|
|
|
|
|
|
|
|
|
| Over one |
| Over three |
|
|
|
|
|
|
| One year |
| year through |
| years through |
| Over |
|
|
|
(dollars in thousands) | or less |
| three years |
| five years |
| five years |
| Total |
Contractual obligations: |
|
|
|
|
|
|
|
|
|
|
|
|
|
|
Certificates of deposit | $ | 104,801 |
| $ | 25,007 |
| $ | 8,121 |
| $ | 798 |
| $ | 138,727 |
Secured borrowings |
| 766 |
|
| 2,726 |
|
| - |
|
| 6,952 |
|
| 10,444 |
Operating leases |
| 619 |
|
| 1,208 |
|
| 1,227 |
|
| 10,482 |
|
| 13,536 |
Finance leases |
| 247 |
|
| 384 |
|
| 308 |
|
| 463 |
|
| 1,402 |
Commitments: |
|
|
|
|
|
|
|
|
|
|
|
|
|
|
Letters of credit |
| 3,370 |
|
| 967 |
|
| - |
|
| 2,015 |
|
| 6,352 |
Loan commitments (1) |
| 39,761 |
|
| - |
|
| - |
|
| - |
|
| 39,761 |
Total | $ | 149,564 |
| $ | 30,292 |
| $ | 9,656 |
| $ | 20,710 |
| $ | 210,222 |
(1)Available credit to borrowers in the amount of $267.1 million is excluded from the above table since, by its nature, the borrowers may not have the need for additional funding, and, therefore, the credit may or may not be disbursed by the Company.
Related Party Transactions
Information with respect to related parties is contained in Note 16, “Related Party Transactions”, within the notes to the consolidated financial statements, and incorporated by reference in Part II, Item 8.
Impact of Accounting Standards and Interpretations
Information with respect to the impact of accounting standards is contained in Note 19, “Recent Accounting Pronouncements”, within the notes to the consolidated financial statements, and incorporated by reference in Part II, Item 8.
Impact of Inflation and Changing Prices
The consolidated financial statements and notes thereto presented herein have been prepared in accordance with U.S. GAAP, which requires the measurement of the Company’s financial condition and results of operations in terms of historical dollars without considering the changes in the relative purchasing power of money over time due to inflation. The impact of inflation is reflected in the increased cost of our operations. Unlike industrial businesses, most all of the Company’s assets and liabilities are monetary in nature. As a result, interest rates have a greater impact on our performance than do the effects of general levels of inflation as interest rates do not necessarily move in the same direction or, to the same extent, as the price of goods and services.
Capital Resources
The Company (on a consolidated basis) and the Bank are subject to various regulatory capital requirements administered by the federal banking agencies. Failure to meet minimum capital requirements can initiate certain mandatory and possible additional discretionary actions by regulators that, if undertaken, could have a direct material effect on the Company’s and the Bank’s financial statements. Under capital adequacy guidelines and the regulatory framework for prompt corrective action, the Company and the Bank must meet specific capital guidelines that involve quantitative measures of their assets, liabilities and certain off-balance-sheet items as calculated under regulatory accounting practices. The capital amounts and classification are also subject to qualitative judgments by the regulators about components, risk-weightings and other factors. Prompt corrective action provisions are not applicable to bank holding companies.
Under these guidelines, assets and certain off-balance sheet items are assigned to broad risk categories, each with appropriate weights. The resulting ratios represent capital as a percentage of total risk-weighted assets and certain off-balance sheet items. The guidelines require all banks and bank holding companies to maintain a minimum ratios for capital adequacy purposes. Refer to the information with respect to capital requirements contained in Note 15, “Regulatory Matters”, within the notes to the consolidated financial statements, and incorporated by reference in Part II, Item 8.
During the year ended December 31, 2018,2021, total shareholders' equity increased $6.2$45.1 million, or 7%27%, due principally from the $11.0$35.1 million in common stock issued as a result of the merger with Landmark. Capital was further enhanced by $24.0 million in net income added into retained earnings. Capital was further enhanced by $0.1earnings, $0.3 million from investments in the Company’s common stock via the Employee Stock Purchase Plan (ESPP), $0.9 and $1.1 million from stock-based compensation expense from the ESPP and unvested restricted stock and $0.3 million from issuance of stock through the dividend reinvestment program.SSARs. These items were partially offset by $3.7 million of cash dividends declared on the Company’s common stock and the $2.5a $8.8 million after tax reduction in the net unrealized gain position in the Company’s investment portfolio.portfolio and $6.6 million of cash dividends declared on the Company’s common stock. The Company’s dividend payout ratio, defined as the rate at which current earnings are paid to shareholders, was 33.7%27.5% for the year ended December 31, 2018.2021. The balance of earnings is retained to further strengthen the Company’s
capital position. The Company’s sources (uses) of capital during the previous five years are indicated below:
| | | | | | | | | | | | | | |
|
|
|
|
|
|
|
|
|
|
|
|
|
|
|
|
| | | | Cash | | Other retained | | | | DRP | | Changes in | | |
|
|
| Cash |
| Other retained |
|
|
| DRP |
| Issuance of |
| Changes in |
|
|
| Net | | dividends | | earnings | | Earnings | | and ESPP | | AOCI and | | Capital | Net |
| dividends |
| earnings |
| Earnings |
| and ESPP |
| common stock |
| AOCI and |
| Capital |
(dollars in thousands) | income | | declared | | adjustments | | retained | | infusion | | other changes | | retained | income |
| declared |
| adjustments |
| retained |
| infusion |
| for acquisition |
| other changes |
| retained |
2021 | | $ | 24,008 |
| $ | (6,608) |
| $ | - |
| $ | 17,400 |
| $ | 270 |
| $ | 35,056 |
| $ | (7,667) |
| $ | 45,059 |
2020 | |
| 13,035 |
| (5,378) |
| - |
| 7,657 |
| 219 |
| 45,408 |
| 6,551 |
| 59,835 |
2019 | |
| 11,576 |
| (4,037) |
| (91) |
| 7,448 |
| 175 |
| - |
| 5,655 |
| 13,278 |
2018 | $ | 11,006 | | $ | (3,708) | | $ | 421 | | $ | 7,719 | | $ | 460 | | $ | (2,005) | | $ | 6,174 |
| 11,006 |
| (3,708) |
| 421 |
| 7,719 |
| 460 |
| - |
| (2,005) |
| 6,174 |
2017 | | 8,716 | | (3,285) | | (308) | | 5,123 | | 457 | | 1,172 | | 6,752 |
| 8,716 |
| (3,285) |
| (308) |
| 5,123 |
| 457 |
| - |
| 1,172 |
| 6,752 |
2016 | | 7,693 | | (3,061) | | - | | 4,632 | | 111 | | (463) | | 4,280 | |
2015 | | 7,103 | | (2,844) | | - | | 4,259 | | 102 | | (229) | | 4,132 | |
2014 | | 6,352 | | (2,667) | | - | | 3,685 | | 763 | | 1,711 | | 6,159 | |
As of December 31, 2018,2021, the Company reported a net unrealized lossgain position of $1.1$0.2 million, net of tax, from the securities AFS portfolio compared to a net unrealized gain of $1.8$9.0 million as of December 31, 2017.2020. The decline during 20182021 was primarily from $2.5$8.8 million in net unrealized losses on AFS securities, net of tax and to a lesser extent a $0.4 million adjustment to re-classifytax. Lower unrealized gains on equity securities. Higher netand higher unrealized losses on municipal and mortgage-backedall types of securities causedcontributed to the net unrealized losses in investment portfolio. Management believes that changes in fair value of the Company’s securities are due to changes in interest rates and not in the creditworthiness of the issuers. Generally, when U.S. Treasury rates rise, investment securities’ pricing declines and fair values of investment securities also decline. While volatility has existed in the yield curve within the past twelve months, a rising rate environment is expected and during the period of rising rates, the Company expects pricing in the bond portfolio to decline. There is no assurance that future realized and unrealized losses will not be recognized from the Company’s portfolio of investment securities. To help maintain a healthy capital position, the Company can issue stock to participants in the DRP and ESPP plans. The DRP affords the Company the option to acquire shares in open market purchases and/or issue shares directly from the Company to plan participants. During 2018,2021, the Company utilized both methods of fulfillingacquired shares in the open market to fulfill the needs of the DRP. Both the DRP and the ESPP plans have been a consistent source of capital from the Company’s loyal employees and shareholders and their participation in these plans will continue to help strengthen the Company’s balance sheet.
See the section entitled “Supervision and Regulation”, below for a discussion on regulatory capital changes and other recent enactments, including a summary of the federal banking agencies final rules to implement the Basel III regulatory capital reforms and changes required by the Dodd-Frank Act.
Liquidity
Liquidity management ensures that adequate funds will be available to meet customers’ needs for borrowings, deposit withdrawals and maturities, facility expansion and normal operating expenses. Sources of liquidity are cash and cash equivalents, asset maturities and pay-downs within one year, loans HFS, investments AFS, growth of core deposits, utilization of borrowing capacities from the FHLB, correspondent banks, ICS and CDARs, the Discount Window of the Federal Reserve Bank of Philadelphia (FRB), Atlantic Community Bankers Bank (ACBB) and proceeds from the issuance of capital stock. Though regularly scheduled investment and loan payments are dependable sources of daily liquidity, sales of both loans HFS and investments AFS, deposit activity and investment and loan prepayments are significantly influenced by general economic conditions including the interest rate environment. During low and declining interest rate environments, prepayments from interest-sensitive assets tend to accelerate and provide significant liquidity that can be used to invest in other interest-earning assets but at lower market rates. Conversely, in periods of high or rising interest rates, prepayments from interest-sensitive assets tend to decelerate causing prepayment cash flows from mortgage loans and mortgage-backed securities to decrease. Rising interest rates may also cause deposit inflow but priced at higher market interest rates or could also cause deposit outflow due to higher rates offered by the Company’s competition for similar products. The Company closely monitors activity in the capital markets and takes appropriate action to ensure that the liquidity levels are adequate for funding, investing and operating activities.
The Company’s contingency funding plan (CFP) sets a framework for handling liquidity issues in the event circumstances arise which the Company deems to be less than normal. The Company established guidelines for identifying, measuring, monitoring and managing the resolution of potentially serious liquidity crises. The CFP outlines required monitoring tools, acceptable alternative funding sources and required actions during various liquidity scenarios. Thus, the Company has implemented a proactive means for the measurement and resolution for handling potentially significant adverse liquidity conditions. At least quarterly, the CFP monitoring tools, current liquidity position and monthly projected liquidity sources and uses are presented and reviewed by the Company’s Asset/Liability Committee. As of December 31, 2018,2021, the Company had not experienced any adverse issues that would give rise to its inability to raise liquidity in an emergency situation.
During the year ended December 31, 2018,2021, the Company accumulated $1.7generated $27.5 million of cash. During the period, the Company’s operations provided approximately $13.7$7.2 million mostly from $31.3$62.5 million of net cash inflow from the components of net interest income partially offset by net non-interest expense/income related payments of $13.2 million, $0.6 million in estimated tax payments, a $1.7 million increase in the residual value from the Company’s automobile leasing activities and $2.1$24.4 million in originations of loans HFS over proceeds.proceeds; net non-interest expense/income related payments of $28.7 million and $2.7 million in estimated tax payments. Cash inflow from interest-earning assets, deposits, borrowingsloan payments and the sale of securities were used to purchase investment securities and replace maturing and cash runoff of
securities, fund the loan portfolio, purchasepay down borrowings, invest in bank premises and equipment and make net dividend payments. The Company received a large amount of public deposits over the past twofive years. The seasonal nature of deposits from municipalities and other public funding sources requires the Company to be prepared for the inherent volatility and the unpredictable timing of cash outflow from this customer base, including maintaining the requirements to
pledge investment securities. Accordingly, the use of short-term overnight borrowings could be used to fulfill funding gap needs. The CFP is a tool to help the Company ensure that alternative funding sources are available to meet its liquidity needs.
During 2020 and 2021, the Company also experienced deposit inflow resulting from businesses and municipalities that received relief from the CARES Act and other government stimulus and less consumer spending. There is uncertainty about the length of time that these deposits will remain which could require the Company to maintain elevated cash balances. The Company will continue to monitor deposit fluctuation for significant changes.
As of December 31, 2018,2021, the Company maintained $17.5$96.9 million in cash and cash equivalents and $188.5$770.7 million of investments AFS and loans HFS. Also as of December 31, 2018,2021, the Company had approximately $124.9$568.9 million available to borrow from the FHLB, $21.0$31.0 million from correspondent banks, $91.5$91.7 million from the FRB and $47.5$361.5 million from the CDARSIntraFi Network One-Way Buy program. The combined total of $490.9$1,920.7 million represented 50%79% of total assets at December 31, 2018.2021. Management believes this level of liquidity to be strong and adequate to support current operations.
For a discussion on the Company’s significant determinable contractual obligations and significant commitments, see “Off-Balance Sheet Arrangements and Contractual Obligations,” above.
Management of interest rate risk and market risk analysis
The adequacy and effectiveness of an institution’s interest rate risk management process and the level of its exposures are critical factors in the regulatory evaluation of an institution’s sensitivity to changes in interest rates and capital adequacy. Management believes the Company’s interest rate risk measurement framework is sound and provides an effective means to measure, monitor, analyze, identify and control interest rate risk in the balance sheet.
The Company is subject to the interest rate risks inherent in its lending, investing and financing activities. Fluctuations of interest rates will impact interest income and interest expense along with affecting market values of all interest-earning assets and interest-bearing liabilities, except for those assets or liabilities with a short term remaining to maturity. Interest rate risk management is an integral part of the asset/liability management process. The Company has instituted certain procedures and policy guidelines to manage the interest rate risk position. Those internal policies enable the Company to react to changes in market rates to protect net interest income from significant fluctuations. The primary objective in managing interest rate risk is to minimize the adverse impact of changes in interest rates on net interest income along with creating an asset/liability structure that maximizes earnings.
Asset/Liability Management. One major objective of the Company when managing the rate sensitivity of its assets and liabilities is to stabilize net interest income. The management of and authority to assume interest rate risk is the responsibility of the Company’s Asset/Liability Committee (ALCO), which is comprised of senior management and members of the board of directors. ALCO meets quarterly to monitor the relationship of interest sensitive assets to interest sensitive liabilities. The process to review interest rate risk is a regular part of managing the Company. Consistent policies and practices of measuring and reporting interest rate risk exposure, particularly regarding the treatment of non-contractual assets and liabilities, are in effect. In addition, there is an annual process to review the interest rate risk policy with the board of directors which includes limits on the impact to earnings from shifts in interest rates.
Interest Rate Risk Measurement. Interest rate risk is monitored through the use of three complementary measures: static gap analysis, earnings at risk simulation and economic value at risk simulation. While each of the interest rate risk measurements has limitations, collectively, they represent a reasonably comprehensive view of the magnitude of interest rate risk in the Company and the distribution of risk along the yield curve, the level of risk through time and the amount of exposure to changes in certain interest rate relationships.
Static Gap. The ratio between assets and liabilities re-pricing in specific time intervals is referred to as an interest rate sensitivity gap. Interest rate sensitivity gaps can be managed to take advantage of the slope of the yield curve as well as forecasted changes in the level of interest rate changes.
To manage this interest rate sensitivity gap position, an asset/liability model commonly known as cumulative gap analysis is used to monitor the difference in the volume of the Company’s interest sensitive assets and liabilities that mature or re-price within given time intervals. A positive gap (asset sensitive) indicates that more assets will re-price during a given period compared to liabilities, while a negative gap (liability sensitive) indicates the opposite effect. The Company employs computerized net interest income simulation modeling to assist in quantifying interest rate risk exposure. This process measures and quantifies the impact on net interest income through varying interest rate changes and balance sheet compositions. The use of this model assists the ALCO to gauge the effects of the interest rate changes on interest-sensitive assets and liabilities in order to determine what impact these rate changes will have upon the net interest spread. At December 31, 2018,2021, the Company maintained a one-year cumulative gap of positive (asset sensitive) $2.0$47.8 million, or less than 1%2%, of total assets. The effect of this positive gap position provided a mismatch of assets and liabilities which may expose the Company to interest rate risk during periods of falling interest rates. Conversely, in an increasing interest rate environment, net interest income could be positively impacted because more assets than liabilities will re-price upward during the one-year period.
Certain shortcomings are inherent in the method of analysis discussed above and presented in the next table. Although certain assets and liabilities may have similar maturities or periods of re-pricing, they may react in different degrees to
changes in market interest rates. The interest rates on certain types of assets and liabilities may fluctuate in advance of changes in market interest rates, while interest rates on other types of assets and liabilities may lag behind changes in market interest rates. Certain assets, such as adjustable-rate mortgages, have features which restrict changes in interest rates on a short-term basis and over the life of the asset. In the event of a change in interest rates, prepayment and early withdrawal levels may deviate significantly from those assumed in calculating the table amounts. The ability of many borrowers to service their adjustable-rate debt may decrease in the event of an interest rate increase.
The following table reflects the re-pricing of the balance sheet or “gap” position at December 31, 2018:2021:
| | | | | | | | | | |
|
|
|
|
|
|
|
|
|
|
| | | | | | | | | | |
|
|
|
|
|
|
|
|
|
|
| | | | More than three | | More than | | | | | |
|
|
| More than three |
| More than |
|
|
|
|
|
| Three months | | months to | | one year | | More than | | | | Three months |
| months to |
| one year |
| More than |
|
|
|
(dollars in thousands) | or less | | twelve months | | to three years | | three years | | Total | or less |
| twelve months |
| to three years |
| three years |
| Total |
| | | | | | | | | | | | | | |
|
|
|
|
|
|
|
|
|
|
|
|
|
|
Cash and cash equivalents | $ | 1,460 | | $ | - | | $ | - | | $ | 16,025 | | $ | 17,485 | $ | 69,560 |
| $ | - |
| $ | - |
| $ | 27,317 |
| $ | 96,877 |
Investment securities (1)(2) | | 8,927 | | 21,427 | | 35,911 | | 122,884 | | 189,149 |
| 9,920 |
| 37,192 |
| 110,728 |
| 584,346 |
| 742,186 |
Loans and leases(2) | | 186,501 | | 127,326 | | 214,202 | | 184,911 | | 712,940 |
| 391,297 |
| 246,985 |
| 416,267 |
| 394,682 |
| 1,449,231 |
Fixed and other assets | | - | | 20,615 | | - | | 40,913 | | 61,528 |
| - |
| 52,745 |
| - |
| 78,065 |
| 130,810 |
Total assets | $ | 196,888 | | $ | 169,368 | | $ | 250,113 | | $ | 364,733 | | $ | 981,102 | $ | 470,777 |
| $ | 336,922 |
| $ | 526,995 |
| $ | 1,084,410 |
| $ | 2,419,104 |
Total cumulative assets | $ | 196,888 | | $ | 366,256 | | $ | 616,369 | | $ | 981,102 | | | $ | 470,777 |
| $ | 807,699 |
| $ | 1,334,694 |
| $ | 2,419,104 |
|
|
| | | | | | | | | | |
|
|
|
|
|
|
|
|
|
|
Non-interest-bearing transaction deposits (3) | $ | - | | $ | 19,493 | | $ | 53,512 | | $ | 121,726 | | $ | 194,731 | $ | - |
| $ | 59,087 |
| $ | 162,209 |
| $ | 368,987 |
| $ | 590,283 |
Interest-bearing transaction deposits (3) | | 176,936 | | - | | 141,115 | | 141,115 | | 459,166 |
| 589,521 |
| - |
| 340,508 |
| 510,760 |
| 1,440,789 |
Certificates of deposit | | 18,536 | | 56,263 | | 36,953 | | 4,534 | | 116,286 |
| 34,942 |
| 69,859 |
| 25,007 |
| 8,985 |
| 138,793 |
Short-term borrowings | | 76,366 | | - | | - | | - | | 76,366 | |
FHLB advances | | 10,000 | | 6,704 | | 5,000 | | 10,000 | | 31,704 | |
Secured borrowings | |
| 5,282 |
| 1,246 |
| 2,668 |
| 1,424 |
| 10,620 |
Other liabilities | | - | | - | | - | | 9,292 | | 9,292 |
| - |
| - |
| - |
| 26,890 |
| 26,890 |
Total liabilities | $ | 281,838 | | $ | 82,460 | | $ | 236,580 | | $ | 286,667 | | $ | 887,545 | $ | 629,745 |
| $ | 130,192 |
| $ | 530,392 |
| $ | 917,046 |
| $ | 2,207,375 |
Total cumulative liabilities | $ | 281,838 | | $ | 364,298 | | $ | 600,878 | | $ | 887,545 | | | $ | 629,745 |
| $ | 759,937 |
| $ | 1,290,329 |
| $ | 2,207,375 |
|
|
| | | | | | | | | | |
|
|
|
|
|
|
|
|
|
|
Interest sensitivity gap | $ | (84,950) | | $ | 86,908 | | $ | 13,533 | | $ | 78,066 | | | $ | (158,968) |
| $ | 206,730 |
| $ | (3,397) |
| $ | 167,364 |
|
|
Cumulative gap | $ | (84,950) | | $ | 1,958 | | $ | 15,491 | | $ | 93,557 | | | $ | (158,968) |
| $ | 47,762 |
| $ | 44,365 |
| $ | 211,729 |
|
|
| | | | | | | | | | |
|
|
|
|
|
|
|
|
|
|
Cumulative gap to total assets | | -8.7% | | 0.2% | | 1.6% | | 9.5% | | |
| -6.6% |
| 2.0% |
| 1.8% |
| 8.8% |
|
|
| (1)
| | Includes FHLB stock and the net unrealized gains/losses on available-for-sale securities.
|
| (2)
| | Investments and loans are included in the earlier of the period in which interest rates were next scheduled to adjust or the period in which they are due. In addition, loans were included in the periods in which they are scheduled to be repaid based on scheduled amortization. For amortizing loans and MBS – GSE residential, annual prepayment rates are assumed reflecting historical experience as well as management’s knowledge and experience of its loan products.
|
| (3)
| | The Company’s demand and savings accounts were generally subject to immediate withdrawal. However, management considers a certain amount of such accounts to be core accounts having significantly longer effective maturities based on the retention experiences of such deposits in changing interest rate environments. The effective maturities presented are the recommended maturity distribution limits for non-maturing deposits based on historical deposit studies.
|
(1)Includes restricted investments in bank stock and the net unrealized gains/losses on available-for-sale securities.
(2)Investments and loans are included in the earlier of the period in which interest rates were next scheduled to adjust or the period in which they are due. In addition, loans were included in the periods in which they are scheduled to be repaid based on scheduled amortization. For amortizing loans and MBS – GSE residential, annual prepayment rates are assumed reflecting historical experience as well as management’s knowledge and experience of its loan products.
(3)The Company’s demand and savings accounts were generally subject to immediate withdrawal. However, management considers a certain amount of such accounts to be core accounts having significantly longer effective maturities based on the retention experiences of such deposits in changing interest rate environments. The effective maturities presented are the recommended maturity distribution limits for non-maturing deposits based on historical deposit studies.
Earnings at Risk and Economic Value at Risk Simulations. The Company recognizes that more sophisticated tools exist for measuring the interest rate risk in the balance sheet that extend beyond static re-pricing gap analysis. Although it will continue to measure its re-pricing gap position, the Company utilizes additional modeling for identifying and measuring the interest rate risk in the overall balance sheet. The ALCO is responsible for focusing on “earnings at risk” and “economic value at risk”, and how both relate to the risk-based capital position when analyzing the interest rate risk.
Earnings at Risk. An earnings at risk simulation measures the change in net interest income and net income should interest rates rise and fall. The simulation recognizes that not all assets and liabilities re-price one-for-one with market rates (e.g., savings rate). The ALCO looks at “earnings at risk” to determine income changes from a base case scenario under an increase and decrease of 200 basis points in interest rate simulation models.
Economic Value at Risk. An earnings at risk simulation measures the short-term risk in the balance sheet. Economic value (or portfolio equity) at risk measures the long-term risk by finding the net present value of the future cash flows from the Company’s existing assets and liabilities. The ALCO examines this ratio quarterly utilizing an increase and decrease of 200 basis points in interest rate simulation models. The ALCO recognizes that, in some instances, this ratio may contradict the “earnings at risk” ratio.
The following table illustrates the simulated impact of an immediate 200 basis points upward or downward movement in interest rates on net interest income, net income and the change in the economic value (portfolio equity). This analysis
assumed that the adjusted interest-earning asset and interest-bearing liability levels at December 31, 20182021 remained constant. The impact of the rate movements was developed by simulating the effect of the rate change over a twelve-month period from the December 31, 20182021 levels:
| | | | |
|
|
|
|
| | | | |
|
|
|
|
| % change | % change |
| Rates +200 | Rates -200 | Rates +200 | Rates -200 |
Earnings at risk: | | | | |
|
|
|
|
Net interest income | (2.7) | % | (4.6) | % | (1.8) | % | (4.2) | % |
Net income | (5.2) | | (10.6) | | (2.4) |
| (9.1) |
|
Economic value at risk: | | | | |
|
|
|
|
Economic value of equity | (3.1) | | (30.3) | | (2.1) |
| (33.6) |
|
Economic value of equity as a percent of total assets | (0.5) | | (4.9) | | (0.3) |
| (4.8) |
|
Economic value has the most meaning when viewed within the context of risk-based capital. Therefore, the economic value may normally change beyond the Company’s policy guideline for a short period of time as long as the risk-based capital ratio (after adjusting for the excess equity exposure) is greater than 10%. At December 31, 2018,2021, the Company’s risk-based capital ratio was 14.75%14.51%.
The table below summarizes estimated changes in net interest income over a twelve-month period beginning January 1, 2019,2022, under alternate interest rate scenarios using the income simulation model described above:
| | | | | | | |
|
|
|
|
|
|
|
| | | | | | | |
|
|
|
|
|
|
|
| Net interest | | $ | | % | Net interest |
| $ |
| % |
(dollars in thousands) | income | | variance | | variance | income |
| variance |
| variance |
Simulated change in interest rates | | | | | | | |
|
|
|
|
|
|
|
+200 basis points | $ | 32,852 | | $ | (898) | | (2.7) | % | $ | 66,707 |
| $ | (1,240) |
| (1.8) | % |
+100 basis points | | 33,385 | | (365) | | (1.1) | |
| 66,929 |
| (1,018) |
| (1.5) |
|
Flat rate | | 33,750 | | - | | - | |
| 67,947 |
| - |
| - |
|
-100 basis points | | 33,251 | | (499) | | (1.5) | |
| 67,556 |
| (391) |
| (0.6) |
|
-200 basis points | | 32,213 | | (1,537) | | (4.6) | |
| 65,109 |
| (2,838) |
| (4.2) |
|
Simulation models require assumptions about certain categories of assets and liabilities. The models schedule existing assets and liabilities by their contractual maturity, estimated likely call date or earliest re-pricing opportunity. MBS – GSE residential securities and amortizing loans are scheduled based on their anticipated cash flow including estimated prepayments. For investment securities, the Company uses a third-party service to provide cash flow estimates in the various rate environments. Savings, money market and interest-bearing checking accounts do not have stated maturities or re-pricing terms and can be withdrawn or re-price at any time. This may impact the margin if more expensive alternative sources of deposits are required to fund loans or deposit runoff. Management projects the re-pricing characteristics of these accounts based on historical performance and assumptions that it believes reflect their rate sensitivity. The model reinvests all maturities, repayments and prepayments for each type of asset or liability into the same product for a new like term at current product interest rates. As a result, the mix of interest-earning assets and interest bearing-liabilities is held constant.
Supervision and Regulation
The following is a brief summary of the regulatory environment in which the Company and the Bank operate and is not designed to be a complete discussion of all statutes and regulations affecting such operations, including those statutes and regulations specifically mentioned herein. Changes in the laws and regulations applicable to the Company and the Bank can affect the operating environment in substantial and unpredictable ways. We cannot accurately predict whether legislation will ultimately be enacted, and if enacted, the ultimate effect that legislation or implementing regulations would have on our financial condition or results of operations. While banking regulations are material to the operations of the Company and the Bank, it should be noted that supervision, regulation and examination of the Company and the Bank are intended primarily for the protection of depositors, not shareholders.
Tax Cuts and Jobs Act of 2017
On December 22, 2017, the Tax Cuts and Jobs Act (the “Tax Act”) was signed into law. Among other changes, the Tax Act reduces the Company’s federal corporate income tax rate from 34% to 21% effective January 1, 2018. The Company anticipates that this tax rate change should reduce its federal income tax liability in future years beginning with 2018. However, the Company did recognize certain effects of the tax law changes in 2017. U.S. generally accepted accounting principles require companies to re-value their deferred tax assets and liabilities as of the date of enactment, with resulting tax
effects accounted for in the reporting period of enactment. Since the enactment took place in December 2017, the Company revalued its net deferred tax liabilities in the fourth quarter of 2017 resulting in a $1.1 million addition to earnings in 2017.
Sarbanes-Oxley Act of 2002
The Sarbanes-Oxley Act (SOX), also known as the “Public Company Accounting Reform and Investor Protection Act,” was established in 2002 and introduced major changes to the regulation of financial practice. SOX represents a comprehensive revision of laws affecting corporate governance, accounting obligations, and corporate reporting. SOX is applicable to all companies with equity or debt securities that are either registered, or file reports under the Securities Exchange Act of 1934. In particular, SOX establishes: (i) requirements for audit committees, including independence, expertise, and responsibilities; (ii) additional responsibilities regarding financial statements for the Principal Executive Officer and Principal Financial Officer of the reporting company; (iii) standards for auditors and regulation of audits; (iv) increased disclosure and reporting obligations for the reporting company and its directors and executive officers; and (v) increased civil and criminal penalties for violations of the securities laws.
Federal Deposit Insurance Corporation Improvement Act of 1991 (FDICIA)
The FDICIA established five different levels of capitalization of financial institutions, with “prompt corrective actions” and significant operational restrictions imposed on institutions that are capital deficient under the categories. The five categories are:
| ·
| | significantly undercapitalized, and
|
| ·
| | critically undercapitalized.
|
well capitalized;
adequately capitalized;
undercapitalized;
significantly undercapitalized, and
critically undercapitalized.
To be considered well capitalized, an institution must have a total risk-based capital ratio of at least 10%, a Tier 1 risk-based capital ratio of at least 8%, a leverage capital ratio of at least 5%, and must not be subject to any order or directive requiring the institution to improve its capital level. An institution falls within the adequately capitalized category if it has a total risk-based capital ratio of at least 8%, a Tier 1 risk-based capital ratio of at least 6%, and a leverage capital ratio of at least 4%. Institutions with lower capital levels are deemed to be undercapitalized, significantly undercapitalized or critically undercapitalized, depending on their actual capital levels. In addition, the appropriate federal regulatory agency may downgrade an institution to the next lower capital category upon a determination that the institution is in an unsafe or unsound condition, or is engaged in an unsafe or unsound practice. Institutions are required under the FDICIA to closely monitor their capital levels and to notify their appropriate regulatory agency of any basis for a change in capital category.
Regulatory oversight of an institution becomes more stringent with each lower capital category, with certain “prompt corrective actions” imposed depending on the level of capital deficiency.
Recent Legislation and Rulemaking
Regulatory Capital Changes
In July 2013, the federal banking agencies issued final rules to implement the Basel III regulatory capital reforms and changes required by the Dodd-Frank Act. The phase-in period for community banking organizations began on January 1, 2015, while larger institutions (generally those with assets of $250 billion or more) began compliance on January 1, 2014. The final rules call for the following capital requirements:
| ·
| | A minimum ratio of common tier 1 capital to risk-weighted assets of 4.5%.
|
| ·
| | A minimum ratio of tier 1 capital to risk-weighted assets of 6%.
|
| ·
| | A minimum ratio of total capital to risk-weighted assets of 8% (no change from current rule).
|
| ·
| | A minimum leverage ratio of 4%.
|
A minimum ratio of common tier 1 capital to risk-weighted assets of 4.5%.
A minimum ratio of tier 1 capital to risk-weighted assets of 6%.
A minimum ratio of total capital to risk-weighted assets of 8% (no change from current rule).
A minimum leverage ratio of 4%.
In addition, the final rules established a common equity tier 1 capital conservation buffer of 2.5% of risk-weighted assets applicable to all banking organizations. If a banking organization fails to hold capital above the minimum capital ratios and the capital conservation buffer, it will be subject to certain restrictions on capital distributions and discretionary bonus payments. The phase-in period for the capital conservation and countercyclical capital buffers for all banking organizations began on January 1, 2016.
Under the proposed rules, accumulated other comprehensive income (AOCI) would have been included in a banking organization’s common equity tier 1 capital. The final rules allow community banks to make a one-time election not to include these additional components of AOCI in regulatory capital and instead use the existing treatment under the general risk-based capital rules that excludes most AOCI components from regulatory capital. The Company made the opt-out election in the first call report or FR Y-9 series report that was filed after the financial institution became subject to the final rule.
The final rules permanently grandfather non-qualifying capital instruments (such as trust preferred securities and cumulative perpetual preferred stock) issued before May 19, 2010 for inclusion in the tier 1 capital of banking organizations with total
consolidated assets less than $15 billion as of December 31, 2009 and banking organizations that were mutual holding companies as of May 19, 2010.
The proposed rules would have modified the risk-weight framework applicable to residential mortgage exposures to require banking organizations to divide residential mortgage exposures into two categories in order to determine the applicable risk weight. In response to commenter concerns about the burden of calculating the risk weights and the potential negative effect on credit availability, the final rules do not adopt the proposed risk weights but retain the current risk weights for mortgage exposures under the general risk-based capital rules.
Consistent with the Dodd-Frank Act, the new rules replace the ratings-based approach to securitization exposures, which is based on external credit ratings, with the simplified supervisory formula approach in order to determine the appropriate risk weights for these exposures. Alternatively, banking organizations may use the existing gross-up approach to assign securitization exposures to a risk weight category or choose to assign such exposures a 1,250 percent risk weight.
Under the new rules, mortgage servicing assets (MSAs) and certain deferred tax assets (DTAs) are subject to stricter limitations than those applicable under the current general risk-based capital rule. The new rules also increase the risk weights for past-due loans, certain commercial real estate loans, and some equity exposures, and makes selected other changes in risk weights and credit conversion factors.
As noted above the phase-in period for the Company began on January 1, 2015. The new rules will not have a material impact on the Company’s capital, operations, liquidity and earnings.
JOBS Act
In 2012, the Jumpstart Our Business Startups Act (the “JOBS Act”) became law. The JOBS Act is aimed at facilitating capital raising by smaller companies and banks and bank holding companies by implementing the following changes:
| ·
| | raising the threshold requiring registration under the Securities Exchange Act of 1934 (the "Exchange Act") for banks and bank holdings companies from 500 to 2,000 holders of record;
|
| ·
| | raising the threshold for triggering deregistration under the Exchange Act for banks and bank holding companies from 300 to 1,200 holders of record;
|
| ·
| | raising the limit for Regulation A offerings from $5 million to $50 million per year and exempting some Regulation A offerings from state blue sky laws;
|
| ·
| | permitting advertising and general solicitation in Rule 506 and Rule 144A offerings;
|
| ·
| | allowing private companies to use "crowdfunding" to raise up to $1 million in any 12-month period, subject to certain conditions; and
|
| ·
| | creating a new category of issuer, called an "Emerging Growth Company," for companies with less than $1 billion in annual gross revenue, which will benefit from certain changes that reduce the cost and burden of carrying out an equity IPO and complying with public company reporting obligations for up to five years.
|
raising the threshold requiring registration under the Securities Exchange Act of 1934 (the "Exchange Act") for banks and bank holdings companies from 500 to 2,000 holders of record;
raising the threshold for triggering deregistration under the Exchange Act for banks and bank holding companies from 300 to 1,200 holders of record;
raising the limit for Regulation A offerings from $5 million to $50 million per year and exempting some Regulation A offerings from state blue sky laws;
permitting advertising and general solicitation in Rule 506 and Rule 144A offerings;
allowing private companies to use "crowdfunding" to raise up to $1 million in any 12-month period, subject to certain conditions; and
creating a new category of issuer, called an "Emerging Growth Company," for companies with less than $1 billion in annual gross revenue, which will benefit from certain changes that reduce the cost and burden of carrying out an equity IPO and complying with public company reporting obligations for up to five years.
While the JOBS Act is not expected to have any immediate application to the Company, management will continue to monitor the implementation rules for potential effects which might benefit the Company.
Dodd-Frank Wall Street Reform and Consumer Protection Act.
In 2010, the Dodd-Frank Wall Street Reform and Consumer Protection Act (Dodd-Frank) became law. Dodd-Frank is intended to effect a fundamental restructuring of federal banking regulation. Among other things, Dodd-Frank creates a new Financial Stability Oversight Council to identify systemic risks in the financial system and gives federal regulators new authority to take control of and liquidate financial firms. Dodd-Frank additionally creates a new independent federal regulator to administer federal consumer protection laws. Dodd-Frank is expected to have a significant impact on our business operations as its provisions take effect. Overtime, it is expected that at a minimum they will increase our operating and compliance costs and could increase our interest expense. Among the provisions that are likely to affect us and the community banking industry are the following:
Holding Company Capital Requirements. Dodd-Frank requires the Federal Reserve to apply consolidated capital requirements to bank holding companies that are no less stringent than those currently applied to depository institutions. Under these standards, pooled trust preferred securities will be excluded from Tier 1 capital unless such securities were issued prior to May 19, 2010 by a bank holding company with less than $15 billion in assets. Dodd-Frank additionally requires that bank regulators issue countercyclical capital requirements so that the required amount of capital increases in times of economic expansion and decreases in times of economic contraction, consistent with safety and soundness.
Deposit Insurance. Dodd-Frank permanently increases the maximum deposit insurance amount for banks, savings institutions and credit unions to $250,000 per depositor, and extended unlimited deposit insurance to non-interest bearing transaction accounts through December 31, 2012. Dodd-Frank also broadens the base for FDIC insurance assessments. Assessments will now be based on the average consolidated total assets less tangible equity capital of a financial institution. Dodd-Frank requires the FDIC to increase the reserve ratio of the Deposit Insurance Fund from 1.15% to 1.35% of insured deposits by 2020 and eliminates the requirement that the FDIC pay dividends to insured depository institutions when the
reserve ratio exceeds certain thresholds. Dodd-Frank also eliminated the federal statutory prohibition against the payment of interest on business checking accounts.
Corporate Governance. Dodd-Frank requires publicly traded companies to give shareholders a non-binding vote on executive compensation at least every three years, a non-binding vote regarding the frequency of the vote on executive compensation at least every six years, and a non-binding vote on “golden parachute” payments in connection with approvals of mergers and acquisitions unless previously voted on by shareholders. The SEC has finalized the rules implementing these requirements. Additionally, Dodd-Frank directs the federal banking regulators to promulgate rules prohibiting excessive compensation paid to executives of depository institutions and their holding companies with assets in excess of $1.0 billion, regardless of whether the company is publicly traded. Dodd-Frank also gives the SEC authority to prohibit broker discretionary voting on elections of directors and executive compensation matters.
Prohibition Against Charter Conversions of Troubled Institutions. Dodd-Frank prohibits a depository institution from converting from a state to federal charter or vice versa while it is the subject of a cease and desist order or other formal enforcement action or a memorandum of understanding with respect to a significant supervisory matter unless the appropriate federal banking agency gives notice of the conversion to the federal or state authority that issued the enforcement action and that agency does not object within 30 days. The notice must include a plan to address the significant supervisory matter. The converting institution must also file a copy of the conversion application with its current federal regulator which must notify the resulting federalregulator of any ongoing supervisory or investigative proceedings that are likely to result in an enforcement action and provide access to all supervisory and investigative information relating thereto.
Interstate Branching. Dodd-Frank authorizes national and state banks to establish branches in other states to the same extent as a bank chartered by that state would be permitted. Previously, banks could only establish branches in other states if the host state expressly permitted out-of-state banks to establish branches in that state. Accordingly, banks will be able to enter new markets more freely.
Limits on Interstate Acquisitions and Mergers. Dodd-Frank precludes a bank holding company from engaging in an interstate acquisition – the acquisition of a bank outside its home state – unless the bank holding company is both well capitalized and well managed. Furthermore, a bank may not engage in an interstate merger with another bank headquartered in another state unless the surviving institution will be well capitalized and well managed. The previous standard in both cases was adequately capitalized and adequately managed.
Limits on Interchange Fees. Dodd-Frank amends the Electronic Fund Transfer Act to, among other things, give the Federal Reserve the authority to establish rules regarding interchange fees charged for electronic debit transactions by payment card issuers having assets over $10 billion and to enforce a new statutory requirement that such fees be reasonable and proportional to the actual cost of a transaction to the issuer. The interchange rules became effective on October 1, 2011.
Consumer Financial Protection Bureau. Dodd-Frank creates a new, independent federal agency called the Consumer Financial Protection Bureau (CFPB), which is granted broad rulemaking, supervisory and enforcement powers under various federal consumer financial protection laws, including the Equal Credit Opportunity Act, Truth in Lending Act, Real Estate Settlement Procedures Act, Fair Credit Reporting Act, Fair Debt Collection Act, the Consumer Financial Privacy provisions of the Gramm-Leach-Bliley Act and certain other statutes. The CFPB has examination and primary enforcement authority with respect to depository institutions with $10 billion or more in assets. Smaller institutions are subject to rules promulgated by the CFPB but continue to be examined and supervised by federal banking regulators for consumer compliance purposes. The CFPB has authority to prevent unfair, deceptive or abusive practices in connection with the offering of consumer financial products. Dodd-Frank authorizes the CFPB to establish certain minimum standards for the origination of residential mortgages including a determination of the borrower’s ability to repay. In addition, Dodd-Frank will allow borrowers to raise certain defenses to foreclosure if they receive any loan other than a “qualified mortgage” as defined by the CFPB. Dodd-Frank permits states to adopt consumer protection laws and standards that are more stringent than those adopted at the federal level and, in certain circumstances, permits state attorneys general to enforce compliance with both the state and federal laws and regulations.
In summary, the Dodd-Frank Act provides for sweeping financial regulatory reform and may have the effect of increasing the cost of doing business, limiting or expanding permissible activities and affect the competitive balance between banks and other financial intermediaries. While many of the provisions of the Dodd-Frank Act do not impact the existing business of the Company, the extension of FDIC insurance to all non-interest bearing deposit accounts and the repeal of prohibitions on the payment of interest on demand deposits, thereby permitting depository institutions to pay interest on business transaction and other accounts, will likely increase deposit funding costs paid by the Company in order to retain and grow deposits. In addition, the limitations imposed on the assessment of interchange fees have reduced the Company’s ability to set revenue pricing on debit and credit card transactions. Many aspects of the Dodd-Frank Act are subject to rulemaking and will take effect over several years, making it difficult to anticipate the overall financial impact on the Company, its customers or the financial industry as a whole. The Company will continue to monitor legislative developments and assess their potential impact on our business.
Department of Defense Military Lending Rule.In 2015, the U.S. Department of Defense issued a final rule which restricts pricing and terms of certain credit extended to active duty military personnel and their families. This rule, which was
implemented effective October 3, 2016, caps the interest rate on certain credit extensions to an annual percentage rate of 36% and restricts other fees. The rule requires financial institutions to verify whether customers are military personnel subject to the rule. The impact of this final rule, and any subsequent amendments thereto, on the Company’s lending activities and the
Company’s statements of income or condition has had little or no impact; however, management will continue to monitor the implementation of the rule for any potential side effects on the Company’s business.
Future Federal and State Legislation and Rulemaking
From time-to-time, various types of federal and state legislation have been proposed that could result in additional regulations and restrictions on the business of the Company and the Bank. We cannot predict whether legislation will be adopted, or if adopted, how the new laws would affect our business. As a consequence, we are susceptible to legislation that may increase the cost of doing business. Management believes that the effect of any current legislative proposals on the liquidity, capital resources and the results of operations of the Company and the Bank will be minimal.
It is possible that there will be regulatory proposals which, if implemented, could have a material effect upon our liquidity, capital resources and results of operations. In addition, the general cost of compliance with numerous federal and state laws does have, and in the future may have, a negative impact on our results of operations. As with other banks, the status of the financial services industry can affect the Bank. Consolidations of institutions are expected to continue as the financial services industry seeks greater efficiencies and market share. Bank management believes that such consolidations may enhance the Bank’s competitive position as a community bank.
Future Outlook
The Company is highly impacted by local economic factors that could influence the performance and strength of our loan portfolios and results of operations. Though the national economy is improving, the local operating environmentEconomic uncertainty continues due to be challenginginflationary pressures, COVID-19 and is expected to be challenging for the near term time horizonglobal risks such as war, terrorism and lags national economic trends.geopolitical instability. A consensus of economists predicts rising short-term rates and long-term rates in 2022. Uncertainty surrounding deposit costs from an increasing competitive environment in 2019the velocity and timing of rate increases and the effect on the interest rate margin is the Company’s greatest interest rate risk. However, continued growth in earning-assetEarning-asset yields isare expected to improve throughout the year stemming from recentthe rising rates. A consensus of top analysts predicts slower growth in the economy for 2019 into 2020. It is uncertain whether the Federal Reserve will continue recent policyrate environment while rates on interest-bearing liabilities are expected to normalize interest rates.rise to a lesser extent from their already low levels. Jobs improvedgrew in December 20182021 from a year earlier in the Scranton/Wilkes-BarreWilkes-Barre/Hazleton and Allentown/Bethlehem/Easton metropolitan statistical area. According to Zillow Research,areas. In 2022, we will experience a full year of operating branches acquired from Landmark which expanded the percentage of delinquent mortgagesCompany’s footprint in the Scranton Metro market is above the national average at 1.5%. Luzerne County. We believe expanding our market conditions are slowly improving butarea gives us opportunity for growth and we will continue to monitor the economic climate in our region, scrutinize growth prospects and proactively observe existing credits for early warning signs of risk deterioration.
In addition to the challenging economic environment, regulatory oversight has changed significantly in recent years. As described in more detail in the “supervision and regulation” section above, the federal banking agencies issued final rules to implement the Basel III regulatory capital reforms and changes required by the Dodd-Frank Act. The rules revise the quantity and quality of required minimum risk-based and leverage capital requirements and revise the calculation of risk-weighted assets.
Management believes that the Company is prepared to face the challenges ahead. We expect that there will be further improvement in asset quality. Our conservative approach to loan underwriting we believe will help improve and keep non-performing asset levels at bay. The Company expects to overcome the relative flattening of the positively sloped yield curve by cautiously growing the balance sheet to enhance financial performance. We intend to grow all lending portfolios in both the business and retail sectors using growth in market-place low costing deposits to stabilize net interest margin and to enhance revenue performance.
I
TEM 7A: QUANTITATIVE AND QUALITATIVE DISCLOSURES ABOUT MARKET RISK
The information required by 7A is set forth at Item 7, under “Liquidity” and “Management of interest rate risk and market risk analysis,” contained within management’s discussion and analysis of financial condition and results of operations and incorporated herein by reference.
ITEM 8: FINANCIAL STATEMENTS AND SUPPLEMENTARY DATA
Report of Independent Registered Public Accounting Firm
To the Shareholders and the Board of Directors of Fidelity D & D Bancorp, Inc. and Subsidiary
Opinion on the Internal Control Over Financial ReportingStatements
We have audited Fidelity D & D Bancorp, Inc. and its subsidiary's (the Company) internal control over financial reporting as of December 31, 2018, based on criteria established in Internal Control — Integrated Framework issued by the Committee of Sponsoring Organizations of the Treadway Commission in 2013. In our opinion, the Company maintained, in all material respects, effective internal control over financial reporting as of December 31, 2018, based on criteria established in Internal Control — Integrated Framework issued by the Committee of Sponsoring Organizations of the Treadway Commission in 2013.
We have also audited, in accordance with the standards of the Public Company Accounting Oversight Board (United States) (PCAOB), the consolidated financial statements of the Company and our report dated March 13, 2019 expressed an unqualified opinion.
Basis for Opinion
The Company’s management is responsible for maintaining effective internal control over financial reporting and for its assessment of the effectiveness of internal control over financial reporting in the accompanying Management’s Report on Internal Control Over Financial Reporting. Our responsibility is to express an opinion on the Company’s internal control over financial reporting based on our audit. We are a public accounting firm registered with the PCAOB and are required to be independent with respect to the Company in accordance with U.S. federal securities laws and the applicable rules and regulations of the Securities and Exchange Commission and the PCAOB.
We conducted our audit in accordance with the standards of the PCAOB. Those standards require that we plan and perform the audit to obtain reasonable assurance about whether effective internal control over financial reporting was maintained in all material respects. Our audit included obtaining an understanding of internal control over financial reporting, assessing the risk that a material weakness exists, and testing and evaluating the design and operating effectiveness of internal control based on the assessed risk. Our audit also included performing such other procedures as we considered necessary in the circumstances. We believe that our audit provides a reasonable basis for our opinion.
Definition and Limitations of Internal Control Over Financial Reporting
A company's internal control over financial reporting is a process designed to provide reasonable assurance regarding the reliability of financial reporting and the preparation of financial statements for external purposes in accordance with generally accepted accounting principles. A company's internal control over financial reporting includes those policies and procedures that (1) pertain to the maintenance of records that, in reasonable detail, accurately and fairly reflect the transactions and dispositions of the assets of the company; (2) provide reasonable assurance that transactions are recorded as necessary to permit preparation of financial statements in accordance with generally accepted accounting principles, and that receipts and expenditures of the company are being made only in accordance with authorizations of management and directors of the company; and (3) provide reasonable assurance regarding prevention or timely detection of unauthorized acquisition, use or disposition of the company's assets that could have a material effect on the financial statements.
Because of its inherent limitations, internal control over financial reporting may not prevent or detect misstatements. Also, projections of any evaluation of effectiveness to future periods are subject to the risk that controls may become inadequate because of changes in conditions, or that the degree of compliance with the policies or procedures may deteriorate.
/s/ RSM US LLP
Blue Bell, Pennsylvania
March 13, 2019
Report of Independent Registered Public Accounting Firm
To the Shareholders and Board of Directors of Fidelity D & D Bancorp, Inc. and Subsidiary
We have audited the accompanying consolidated balance sheets of Fidelity D & D Bancorp, Inc. and its subsidiary (the Company) as of December 31, 20182021 and 2017,2020, the related consolidated statements of income, comprehensive income, changes in shareholders'stockholders’ equity and cash flows for each of the three years in the period ended December 31, 2018,2021, and the related notes to the consolidated financial statements (collectively, the financial statements). In our opinion, the financial statements present fairly, in all material respects, the financial position of the Company as of December 31, 20182021 and 2017,2020, and the results of its operations and its cash flows for the each of the three years in the three-year period ended December 31, 2018,2021, in conformity with accounting principles generally accepted in the United States of America.
We have also audited, in accordance with the standards of the Public Company Accounting Oversight Board (United States) (PCAOB), the Company's internal control over financial reporting as of December 31, 2018, based on criteria established in Internal Control — Integrated Framework issued by the Committee of Sponsoring Organizations of the Treadway Commission in 2013, and our report dated March 13, 2019 expressed an unqualified opinion on the effectiveness of the Company's internal control over financial reporting.
Basis for Opinion
These financial statements are the responsibility of the Company’s management. Our responsibility is to express an opinion on the Company’s financial statements based on our audits. We are a public accounting firm registered with the PCAOBPublic Company Accounting Oversight Board (United States) (PCAOB) and are required to be independent with respect to the Company in accordance with U.S. federal securities laws and the applicable rules and regulations of the Securities and Exchange Commission and the PCAOB.
We conducted our audits in accordance with the standards of the PCAOB. Those standards require that we plan and perform the auditsaudit to obtain reasonable assurance about whether the financial statements are free of material misstatement, whether due to error or fraud. The Company is not required to have, nor were we engaged to perform, an audit of its internal control over financial reporting. As part of our audits we are required to obtain an understanding of internal control over financial reporting but not for the purpose of expressing an opinion on the effectiveness of the Company’s internal control over financial reporting. Accordingly, we express no such opinion.
Our audits included performing procedures to assess the risks of material misstatement of the financial statements, whether due to error or fraud, and performing procedures that respond to those risks. Such procedures included examining, on a test basis, evidence regarding the amounts and disclosures in the financial statements. Our audits also included evaluating the accounting principles used and significant estimates made by management, as well as evaluating the overall presentation of the financial statements. We believe that our audits provide a reasonable basis for our opinion.
Critical Audit Matters
The critical audit matters communicated below are matters arising from the current period audit of the financial statements that were communicated or required to be communicated to the audit committee and that: (1) relate to accounts or disclosures that are material to the financial statements and (2) involved our especially challenging, subjective or complex judgments. The communication of critical audit matters does not alter in any way our opinion on the financial statements, taken as a whole, and we are not, by communicating the critical audit matters below, providing separate opinions on the critical audit matters or on the accounts or disclosures to which they relate.
Allowance for loan losses – Qualitative Factors
The allowance for loan losses as of December 31, 2021 was $15.6 million. As described in Notes 1 and 5 to the consolidated financial statements, the allowance for loan losses is established through a provision for loan losses and represents an amount which, in management’s judgement, will be adequate to absorb losses on existing loans. The allowance consists of specific and general components in the amounts of $1.3 million and $14.3 million, respectively. The general loan loss allocation is set based upon a representative average historical net charge-off rate adjusted for the following qualitative factors: delinquency and nonaccrual trends, volume and loan term trends, changes in the lending policy, changes in legal and regulatory requirements, national and local economic trends and conditions, changes in concentrations of credit, changes in risk selection and underwriting standards, the experience, ability and depth of lending management, and charge-off and recovery trends. The evaluation of the qualitative factors requires a significant amount of judgement by management and involves a high degree of subjectivity.
We identified the qualitative factor component of the allowance for loan losses as a critical audit matter as auditing the underlying qualitative factors required significant auditor judgment as amounts determined by management rely on analysis that is often subjective in nature and the estimate is highly sensitive to changes in significant assumptions.
Our audit procedures related to the qualitative factors of the allowance for loan losses included the following, among others:
We obtained an understanding of the relevant controls related to management’s assessment and review of the qualitative factors, and tested such controls for design and operating effectiveness, including controls over management’s establishment, review and approval of the qualitative factors including the data used in determining the qualitative factors.
We obtained an understanding of how management developed the estimates and related assumptions, including:
−Testing completeness and accuracy of key data inputs used in forming assumptions or calculations and testing the reliability of the underlying data on which these factors are based by comparing information to source documents and external information sources.
−Evaluating the reasonableness of the qualitative factors established by management as compared to the underlying internal or external information sources.
Business Combination – Valuation of Acquired Loan Portfolio
As described in Note 20 to the consolidated financial statements, on July 1, 2021, the Company completed its acquisition of Landmark Bancorp, Inc. for total consideration of $42.9 million. The fair value of total assets acquired as a result of the merger totaled $375.5 million (net of cash consideration), with loans totaling $298.9 million and resulting in $12.6 million of acquired goodwill. Acquired loans (impaired and nonimpaired) were initially recorded at their acquisition-date fair value. Fair values were based on a discounted cash flow methodology that involved assumptions and judgments as to credit risk, expected lifetime losses, environmental factors, collateral values, discount rates, expected payments and expected prepayments. Specifically, the Company prepared three separate loan fair value adjustments that it believed approximated the entire fair value adjustment necessary under the fair value measurements accounting guidance for the acquired loan portfolio. The three, separate fair valuation methodologies employed were: 1) an interest rate loan fair value adjustment; 2) a general credit fair value adjustment; and 3) a specific credit fair value adjustment for purchased credit impaired loans applicable to purchased loans with deteriorated credit quality at acquisition. The acquired loans were recorded at fair value at the acquisition date without carryover of Landmark’s previously established allowance for loan losses. The credit adjustment on purchased credit impaired loans was derived in accordance with accounting guidance prevailing over purchased loans with deteriorated credit quality and represented the portion of the loan balances that has been deemed uncollectible based on the Company’s expectations of future cash flows for each respective loan.
We identified the fair value of acquired loans as a critical audit matter because of the judgments necessary by management to determine the fair value of the loan portfolio acquired, and the related high degree of auditor judgment and the extensive audit effort involved in testing management’s estimates and assumptions. The significant estimates and assumptions necessary to estimate fair value and that required a high degree of auditor judgment and increased audit effort included expected prepayments, credit risk, expected lifetime losses, environmental factors, and market discount rates.
Our audit procedures related to the significant estimates and assumptions of the valuation of the acquired loan portfolio identified above included the following, among others:
We obtained an understanding of the relevant controls related to the business combination, including the valuation of the acquired loan portfolio and management’s review related to the development of expected prepayments, credit risk, expected lifetime losses, environmental factors, and market discount rates, and tested such controls for design and operating effectiveness.
We obtained the valuation report supporting the fair value adjustments and gained an understanding of the valuation methodology applied, as well as key inputs and assumptions.
We tested the completeness and accuracy of data inputs provided by management and utilized in the calculation by comparing the data to source documents and external information sources.
We utilized internal valuation specialists to assist in testing management’s methodologies and techniques for appropriateness, as well as evaluating significant assumptions such as expected prepayment, credit risk, expected lifetime losses, environmental factors, and market discount rate by comparing the data to source documents provided by the Company, obtaining comparative information from external sources and performing mathematical accuracy checks.
/s/ RSM US LLP
We have served as the Company's auditor since 2015.
Blue Bell, Pennsylvania
March 13, 201923, 2022
|
|
|
|
|
|
|
Fidelity D & D Bancorp, Inc. and Subsidiary |
|
|
|
|
|
|
Consolidated Balance Sheets |
|
|
|
|
|
|
|
| As of December 31, |
(dollars in thousands) |
| 2021 |
| 2020 |
Assets: |
|
|
|
|
|
|
Cash and due from banks |
| $ | 27,317 |
| $ | 19,408 |
Interest-bearing deposits with financial institutions |
|
| 69,560 |
|
| 49,938 |
Total cash and cash equivalents |
|
| 96,877 |
|
| 69,346 |
Available-for-sale securities |
|
| 738,980 |
|
| 392,420 |
Restricted investments in bank stock |
|
| 3,206 |
|
| 2,813 |
Loans and leases, net (allowance for loan losses of |
|
|
|
|
|
|
$15,624 in 2021; $14,202 in 2020) |
|
| 1,417,504 |
|
| 1,105,450 |
Loans held-for-sale (fair value $32,013 in 2021, $30,858 in 2020) |
|
| 31,727 |
|
| 29,786 |
Foreclosed assets held-for-sale |
|
| 434 |
|
| 256 |
Bank premises and equipment, net |
|
| 29,310 |
|
| 27,626 |
Leased property under finance leases, net |
|
| 1,307 |
|
| 283 |
Right-of-use assets |
|
| 9,006 |
|
| 7,082 |
Cash surrender value of bank owned life insurance |
|
| 52,745 |
|
| 44,285 |
Accrued interest receivable |
|
| 7,526 |
|
| 5,712 |
Goodwill |
|
| 19,628 |
|
| 7,053 |
Core deposit intangible, net |
|
| 1,942 |
|
| 1,734 |
Other assets |
|
| 8,912 |
|
| 5,664 |
Total assets |
| $ | 2,419,104 |
| $ | 1,699,510 |
Liabilities: |
|
|
|
|
|
|
Deposits: |
|
|
|
|
|
|
Interest-bearing |
| $ | 1,579,582 |
| $ | 1,102,009 |
Non-interest-bearing |
|
| 590,283 |
|
| 407,496 |
Total deposits |
|
| 2,169,865 |
|
| 1,509,505 |
Accrued interest payable and other liabilities |
|
| 15,943 |
|
| 10,400 |
Finance lease obligation |
|
| 1,320 |
|
| 291 |
Operating lease liabilities |
|
| 9,627 |
|
| 7,644 |
Secured borrowings |
|
| 10,620 |
|
| - |
FHLB advances |
|
| - |
|
| 5,000 |
Total liabilities |
|
| 2,207,375 |
|
| 1,532,840 |
Shareholders' equity: |
|
|
|
|
|
|
Preferred stock authorized 5,000,000 shares with no par value; NaN issued |
|
| - |
|
| - |
Capital stock, no par value (10,000,000 shares authorized; shares issued and outstanding; 5,645,687 at December 31, 2021; and 4,977,750 at December 31, 2020) |
|
| 114,108 |
|
| 77,676 |
Retained earnings |
|
| 97,442 |
|
| 80,042 |
Accumulated other comprehensive income |
|
| 179 |
|
| 8,952 |
Total shareholders' equity |
|
| 211,729 |
|
| 166,670 |
Total liabilities and shareholders' equity |
| $ | 2,419,104 |
| $ | 1,699,510 |
|
|
|
|
|
|
|
See notes to consolidated financial statements |
|
|
|
|
|
|
| | | | | | |
Fidelity D & D Bancorp, Inc. and Subsidiary | | | | | | |
Consolidated Balance Sheets | | | | | | |
| | |
(dollars in thousands) | | December 31, 2018 | | December 31, 2017 |
Assets: | | | | | | |
Cash and due from banks | | $ | 16,025 | | $ | 14,143 |
Interest-bearing deposits with financial institutions | | | 1,460 | | | 1,682 |
Total cash and cash equivalents | | | 17,485 | | | 15,825 |
Available-for-sale securities | | | 182,810 | | | 157,385 |
Federal Home Loan Bank stock | | | 6,339 | | | 2,832 |
Loans and leases, net (allowance for loan losses of | | | | | | |
$9,747 in 2018; $9,193 in 2017) | | | 707,233 | | | 628,767 |
Loans held-for-sale (fair value $5,789 in 2018, $2,221 in 2017) | | | 5,707 | | | 2,181 |
Foreclosed assets held-for-sale | | | 190 | | | 973 |
Bank premises and equipment, net | | | 18,289 | | | 16,576 |
Leased property under capital leases, net | | | 333 | | | - |
Cash surrender value of bank owned life insurance | | | 20,615 | | | 20,017 |
Accrued interest receivable | | | 3,271 | | | 2,786 |
Goodwill | | | 209 | | | 209 |
Other assets | | | 18,621 | | | 16,086 |
Total assets | | $ | 981,102 | | $ | 863,637 |
Liabilities: | | | | | | |
Deposits: | | | | | | |
Interest-bearing | | $ | 575,452 | | $ | 551,515 |
Non-interest-bearing | | | 194,731 | | | 178,631 |
Total deposits | | | 770,183 | | | 730,146 |
Accrued interest payable and other liabilities | | | 8,956 | | | 6,402 |
Capital lease obligation | | | 336 | | | - |
Short-term borrowings | | | 76,366 | | | 18,502 |
FHLB advances | | | 31,704 | | | 21,204 |
Total liabilities | | | 887,545 | | | 776,254 |
Shareholders' equity: | | | | | | |
Preferred stock authorized 5,000,000 shares with no par value; none issued | | | - | | | - |
Capital stock, no par value (10,000,000 shares authorized; shares issued and outstanding; 3,759,426 in 2018; and 3,734,478 in 2017) | | | 29,715 | | | 28,361 |
Retained earnings | | | 64,937 | | | 57,218 |
Accumulated other comprehensive (loss) income | | | (1,095) | | | 1,804 |
Total shareholders' equity | | | 93,557 | | | 87,383 |
Total liabilities and shareholders' equity | | $ | 981,102 | | $ | 863,637 |
| | | | | | |
See notes to consolidated financial statements | | | | | | |
| | | | | | | | | |
|
|
|
|
|
|
|
|
|
Fidelity D & D Bancorp, Inc. and Subsidiary | | | | | | | | | |
|
|
|
|
|
|
|
|
|
Consolidated Statements of Income | | | | | | | | | |
|
|
|
|
|
|
|
|
|
| | Years ended December 31, |
| Years ended December 31, |
(dollars in thousands except per share data) | | 2018 | | 2017 | | 2016 |
| 2021 |
| 2020 |
| 2019 |
Interest income: | | | | | | | | | |
|
|
|
|
|
|
|
|
|
Loans and leases: | | | | | | | | | |
|
|
|
|
|
|
|
|
|
Taxable | | $ | 29,155 | | $ | 26,035 | | $ | 23,609 |
| $ | 53,918 |
| $ | 41,985 |
| $ | 32,364 |
Nontaxable | | | 958 | | | 860 | | | 753 |
|
| 1,513 |
|
| 1,256 |
|
| 1,077 |
Interest-bearing deposits with financial institutions | | | 104 | | | 48 | | | 67 |
|
| 148 |
|
| 121 |
|
| 47 |
Restricted regulatory securities | | | 194 | | | 135 | | | 54 | |
Restricted investments in bank stock | |
|
| 127 |
|
| 162 |
|
| 417 |
Investment securities: | | | | | | | | | |
|
|
|
|
|
|
|
|
|
U.S. government agency and corporations | | | 3,314 | | | 2,515 | | | 1,709 |
|
| 4,068 |
|
| 3,197 |
|
| 3,633 |
States and political subdivisions (nontaxable) | | | 1,594 | | | 1,449 | | | 1,282 |
|
| 4,413 |
|
| 2,374 |
|
| 1,731 |
States and political subdivisions (taxable) | |
|
| 1,281 |
|
| 398 |
|
| - |
Other securities | | | 11 | | | 22 | | | 21 |
|
| - |
|
| 3 |
|
| - |
Total interest income | | | 35,330 | | | 31,064 | | | 27,495 |
|
| 65,468 |
|
| 49,496 |
|
| 39,269 |
Interest expense: | | | | | | | | | |
|
|
|
|
|
|
|
|
|
Deposits | | | 3,811 | | | 2,750 | | | 2,309 |
|
| 3,456 |
|
| 4,756 |
|
| 6,176 |
Securities sold under repurchase agreements | | | 16 | | | 21 | | | 20 | |
Other short-term borrowings and other | | | 667 | | | 205 | | | 29 | |
Secured borrowings | |
|
| 156 |
|
| - |
|
| - |
Other short-term borrowings | |
|
| 1 |
|
| 248 |
|
| 878 |
FHLB advances | | | 379 | | | 247 | | | - |
|
| 26 |
|
| 307 |
|
| 500 |
Total interest expense | | | 4,873 | | | 3,223 | | | 2,358 |
|
| 3,639 |
|
| 5,311 |
|
| 7,554 |
Net interest income | | | 30,457 | | | 27,841 | | | 25,137 |
|
| 61,829 |
|
| 44,185 |
|
| 31,715 |
Provision for loan losses | | | 1,450 | | | 1,450 | | | 1,025 |
|
| 2,000 |
|
| 5,250 |
|
| 1,085 |
Net interest income after provision for loan losses | | | 29,007 | | | 26,391 | | | 24,112 |
|
| 59,829 |
|
| 38,935 |
|
| 30,630 |
Other income: | | | | | | | | | |
|
|
|
|
|
|
|
|
|
Service charges on deposit accounts | | | 2,244 | | | 2,227 | | | 2,139 |
|
| 2,623 |
|
| 2,117 |
|
| 2,286 |
Interchange fees | | | 2,051 | | | 1,756 | | | 1,551 |
|
| 4,286 |
|
| 3,153 |
|
| 2,208 |
Service charges on loans | |
|
| 1,980 |
|
| 1,681 |
|
| 1,054 |
Fees from trust fiduciary activities | | | 1,319 | | | 1,040 | | | 721 |
|
| 2,253 |
|
| 1,785 |
|
| 1,350 |
Fees from financial services | | | 759 | | | 596 | | | 586 |
|
| 984 |
|
| 749 |
|
| 946 |
Service charges on loans | | | 579 | | | 728 | | | 859 | |
Fees and other revenue | | | 969 | | | 872 | | | 783 |
|
| 902 |
|
| 813 |
|
| 845 |
Earnings on bank-owned life insurance | | | 598 | | | 581 | | | 353 |
|
| 1,227 |
|
| 794 |
|
| 647 |
Gain (loss) on write-down, sale or disposal of: | | | | | | | | | |
|
|
|
|
|
|
|
|
|
Loans | | | 645 | | | 878 | | | 1,009 |
|
| 4,172 |
|
| 3,603 |
|
| 856 |
Available-for-sale debt securities | | | 10 | | | (147) | | | 9 |
|
| 46 |
|
| 115 |
|
| 14 |
Equity securities | | | 44 | | | - | | | - | |
Premises and equipment | | | (18) | | | (164) | | | (5) |
|
| (186) |
|
| (142) |
|
| (13) |
Total other income | | | 9,200 | | | 8,367 | | | 8,005 |
|
| 18,287 |
|
| 14,668 |
|
| 10,193 |
Other expenses: | | | | | | | | | |
|
|
|
|
|
|
|
|
|
Salaries and employee benefits | | | 13,678 | | | 13,072 | | | 11,594 |
|
| 25,249 |
|
| 19,831 |
|
| 14,761 |
Premises and equipment | | | 3,775 | | | 3,838 | | | 3,543 |
|
| 6,998 |
|
| 5,623 |
|
| 4,124 |
Data processing and communication | |
|
| 2,566 |
|
| 2,246 |
|
| 1,765 |
Advertising and marketing | | | 1,656 | | | 1,859 | | | 1,223 |
|
| 3,253 |
|
| 2,269 |
|
| 1,610 |
Professional services | | | 1,606 | | | 1,863 | | | 1,561 |
|
| 3,415 |
|
| 2,869 |
|
| 1,362 |
Data processing and communication | | | 1,470 | | | 1,233 | | | 981 | |
Merger-related expenses | |
|
| 3,033 |
|
| 2,452 |
|
| 440 |
Automated transaction processing | | | 784 | | | 735 | | | 607 |
|
| 1,479 |
|
| 1,158 |
|
| 877 |
Office supplies and postage | | | 399 | | | 460 | | | 472 |
|
| 640 |
|
| 541 |
|
| 413 |
FDIC assessment | | | 267 | | | 267 | | | 351 | |
PA shares tax | | | 242 | | | 262 | | | 320 |
|
| 395 |
|
| 381 |
|
| 303 |
Loan collection | | | 132 | | | 224 | | | 194 |
|
| 126 |
|
| 131 |
|
| 264 |
Other real estate owned | | | 177 | | | 200 | | | 207 |
|
| 29 |
|
| 28 |
|
| 121 |
FDIC assessment | |
|
| 679 |
|
| 280 |
|
| 133 |
FHLB prepayment fee | |
|
| 369 |
|
| 481 |
|
| - |
Other | | | 886 | | | 823 | | | 602 |
|
| 1,876 |
|
| 29 |
|
| 748 |
Total other expenses | | | 25,072 | | | 24,836 | | | 21,655 |
|
| 50,107 |
|
| 38,319 |
|
| 26,921 |
Income before income taxes | | | 13,135 | | | 9,922 | | | 10,462 |
|
| 28,009 |
|
| 15,284 |
|
| 13,902 |
Provision for income taxes | | | 2,129 | �� | | 1,206 | | | 2,769 |
|
| 4,001 |
|
| 2,249 |
|
| 2,326 |
Net income | | $ | 11,006 | | $ | 8,716 | | $ | 7,693 |
| $ | 24,008 |
| $ | 13,035 |
| $ | 11,576 |
Per share data : | | | | | | | | | | |
Per share data: | |
|
|
|
|
|
|
|
|
|
Net income - basic | | $ | 2.93 | | $ | 2.35 | | $ | 2.09 |
| $ | 4.51 |
| $ | 2.84 |
| $ | 3.06 |
Net income - diluted | | $ | 2.90 | | $ | 2.33 | | $ | 2.09 |
| $ | 4.48 |
| $ | 2.82 |
| $ | 3.03 |
Dividends | | $ | 0.98 | | $ | 0.88 | | $ | 0.83 |
| $ | 1.23 |
| $ | 1.14 |
| $ | 1.06 |
| | | | | | | |
|
|
|
|
|
|
|
See notes to consolidated financial statements | | | | | | | |
|
|
|
|
|
|
| | | | | | | | |
|
|
|
|
|
|
|
|
| | | | | | | | |
|
|
|
|
|
|
|
|
Fidelity D & D Bancorp, Inc. and Subsidiary | | | | | | | | |
|
|
|
|
|
|
|
|
Consolidated Statements of Comprehensive Income | | | | | | |
|
|
|
|
|
|
| Years ended December 31, |
| Years ended December 31, |
(dollars in thousands) | 2018 | | 2017 | | 2016 |
| 2021 |
| 2020 |
| 2019 |
| | | | | | |
|
|
|
|
|
|
Net income | $ | 11,006 | | $ | 8,716 | | $ | 7,693 |
| $ | 24,008 |
| $ | 13,035 |
| $ | 11,576 |
| | | | | | |
|
|
|
|
|
|
Other comprehensive (loss) income, before tax: | | | | | | |
|
|
|
|
|
|
Unrealized holding (loss) gain on available-for-sale debt securities | | (3,127) | | 44 | | (1,213) |
| (11,059) |
| 6,887 |
| 5,960 |
Reclassification adjustment for net gains realized in income | | (10) | | 147 | | (9) |
| (46) |
| (115) |
| (14) |
Net unrealized (loss) gain | | (3,137) | | 191 | | (1,222) |
| (11,105) |
| 6,772 |
| 5,946 |
Tax effect | | 659 | | (65) | | 415 |
| 2,332 |
| (1,422) |
| (1,249) |
Unrealized (loss) gain, net of tax | | (2,478) | | 126 | | (807) |
| (8,773) |
| 5,350 |
| 4,697 |
Other comprehensive (loss) income, net of tax | | (2,478) | | 126 | | (807) | |
Total comprehensive income, net of tax | $ | 8,528 | | $ | 8,842 | | $ | 6,886 | |
Other comprehensive (loss) gain, net of tax | |
| (8,773) |
| 5,350 |
| 4,697 |
Total comprehensive income (loss), net of tax | |
| $ | 15,235 |
| $ | 18,385 |
| $ | 16,273 |
| | | | | | |
|
|
|
|
|
|
See notes to consolidated financial statements | | | | | | |
|
|
|
|
|
|
| | | | | | | | | | | | | | |
|
|
|
|
|
|
|
|
|
|
|
|
|
|
| | | | | | | | | | | | | | |
|
|
|
|
|
|
|
|
|
|
|
|
|
|
Fidelity D & D Bancorp, Inc. and Subsidiary | Fidelity D & D Bancorp, Inc. and Subsidiary | | | | | | | | | | | | | Fidelity D & D Bancorp, Inc. and Subsidiary |
|
|
|
|
|
|
|
|
|
|
|
|
Consolidated Statements of Changes in Shareholders' Equity | Consolidated Statements of Changes in Shareholders' Equity | | | | | | | | | | | | | Consolidated Statements of Changes in Shareholders' Equity |
|
|
|
|
|
|
|
|
|
|
|
|
For the years ended December 31, 2018, 2017 and 2016 | | | | | | | | | | | | | |
For the years ended December 31, 2021, 2020 and 2019 | | For the years ended December 31, 2021, 2020 and 2019 |
|
|
|
|
|
|
|
|
|
|
|
|
| | | | | | | | | | Accumulated | | | |
|
|
|
|
|
|
|
|
| Accumulated |
|
|
|
| | | | | | | | | | other | | | |
|
|
|
|
|
|
|
|
| other |
|
|
|
| Capital stock | | Retained | | comprehensive | | | | Capital stock |
| Retained |
| comprehensive |
|
|
|
(dollars in thousands) | Shares | | Amount | | earnings | | income (loss) | | Total | Shares |
| Amount |
| earnings |
| income (loss) |
| Total |
Balance, December 31, 2015 | | 2,443,405 | | $ | 26,700 | | $ | 47,463 | | $ | 2,188 | | $ | 76,351 | |
| |
|
|
|
|
|
|
|
|
|
|
|
|
|
|
Balance, December 31, 2018 | |
| 3,759,426 |
| $ | 29,715 |
| $ | 64,937 |
| $ | (1,095) |
| $ | 93,557 |
Net income | |
|
|
|
|
|
|
| 11,576 |
|
|
|
|
| 11,576 |
Other comprehensive income | |
|
|
|
|
|
|
|
|
|
| 4,697 |
|
| 4,697 |
Effect of adopting ASU 2016-02 | |
|
|
|
|
|
|
| (91) |
|
|
|
|
| (91) |
Issuance of common stock through Employee Stock Purchase Plan | |
| 4,535 |
|
| 175 |
|
|
|
|
|
|
|
| 175 |
Issuance of common stock from vested restricted share grants through stock compensation plans | |
| 15,574 |
|
|
|
|
|
|
|
|
|
|
|
|
Issuance of common stock through exercise of SSARs | |
| 1,965 |
|
|
|
|
|
|
|
|
|
|
| - |
Stock-based compensation expense | |
|
|
|
| 958 |
|
|
|
|
|
|
|
| 958 |
Cash dividends declared | |
|
|
|
|
|
|
| (4,037) |
|
|
|
|
| (4,037) |
Balance, December 31, 2019 | |
| 3,781,500 |
| $ | 30,848 |
| $ | 72,385 |
| $ | 3,602 |
| $ | 106,835 |
Net income | |
|
|
|
|
|
|
| 13,035 |
|
|
|
|
| 13,035 |
Other comprehensive income | |
|
|
|
|
|
|
|
|
|
| 5,350 |
|
| 5,350 |
Issuance of common stock through Employee Stock Purchase Plan | |
| 3,885 |
|
| 219 |
|
|
|
|
|
|
|
| 219 |
Issuance of common stock from vested restricted share grants through stock compensation plans | |
| 15,395 |
|
|
|
|
|
|
|
|
|
|
|
|
Stock-based compensation expense | |
|
|
|
| 1,201 |
|
|
|
|
|
|
|
| 1,201 |
Issuance of common stock for acquisition | |
| 1,176,970 |
|
| 45,408 |
|
|
|
|
|
|
|
| 45,408 |
Cash dividends declared | |
|
|
|
|
|
|
| (5,378) |
|
|
|
|
| (5,378) |
Balance, December 31, 2020 | |
| 4,977,750 |
| $ | 77,676 |
| $ | 80,042 |
| $ | 8,952 |
| $ | 166,670 |
Net income | | | | | | | | 7,693 | | | | | | 7,693 |
|
|
|
|
|
|
| 24,008 |
|
|
|
|
| 24,008 |
Other comprehensive loss | | | | | | | | | | | (807) | | | (807) |
|
|
|
|
|
|
|
|
|
| (8,773) |
|
| (8,773) |
Issuance of common stock through Employee Stock Purchase Plan | | 3,695 | | | 111 | | | | | | | | | 111 |
| 4,738 |
|
| 270 |
|
|
|
|
|
|
|
| 270 |
Issuance of common stock from vested restricted share grants through stock compensation plans | | 6,205 | | | | | | | | | | | | |
| 13,209 |
|
|
|
|
|
|
|
|
|
|
|
|
Issuance of common stock through exercise of stock options | | 500 | | | 14 | | | | | | | | | 14 | |
Issuance of common stock through exercise of SSARs | |
| 2,000 |
|
|
|
|
|
|
|
|
|
|
|
|
Stock-based compensation expense | | | | | 330 | | | | | | | | | 330 |
|
|
|
| 1,106 |
|
|
|
|
|
|
|
| 1,106 |
Issuance of common stock for acquisition | |
| 647,990 |
|
| 35,056 |
|
|
|
|
|
|
|
| 35,056 |
Cash dividends declared | | | | | | | | (3,061) | | | | | | (3,061) |
|
|
|
|
|
|
| (6,608) |
|
|
|
|
| (6,608) |
Balance, December 31, 2016 | | 2,453,805 | | $ | 27,155 | | $ | 52,095 | | $ | 1,381 | | $ | 80,631 | |
Net income | | | | | | | | 8,716 | | | | | | 8,716 | |
Other comprehensive income | | | | | | | | | | | 126 | | | 126 | |
Effect of adopting ASU 2018-02 | | | | | | | | (297) | | | 297 | | | - | |
Issuance of common stock through Employee Stock Purchase Plan | | 4,085 | | | 126 | | | | | | | | | 126 | |
Issuance of common stock through Dividend Reinvestment Plan | | 7,744 | | | 331 | | | | | | | | | 331 | |
Issuance of common stock from vested restricted share grants through stock compensation plans | | 9,657 | | | | | | | | | | | | | |
Issuance of common stock through exercise of stock options | | 16,000 | | | 416 | | | | | | | | | 416 | |
Stock-based compensation expense | | | | | 333 | | | | | | | | | 333 | |
Issuance of common stock from stock split | | 1,243,187 | | | | | | | | | | | | | |
Cash in lieu of fractional shares paid due to the stock split | | | | | | | | (11) | | | | | | (11) | |
Cash dividends declared | | | | | | | | (3,285) | | | | | | (3,285) | |
Balance, December 31, 2017 | | 3,734,478 | | $ | 28,361 | | $ | 57,218 | | $ | 1,804 | | $ | 87,383 | |
Net income | | | | | | | | 11,006 | | | | | | 11,006 | |
Other comprehensive loss | | | | | | | | | | | (2,478) | | | (2,478) | |
Effect of adopting ASU 2016-01 | | | | | | | | 421 | | | (421) | | | - | |
Issuance of common stock through Employee Stock Purchase Plan | | 6,783 | | | 149 | | | | | | | | | 149 | |
Issuance of common stock through Dividend Reinvestment Plan | | 5,486 | | | 311 | | | | | | | | | 311 | |
Issuance of common stock from vested restricted share grants through stock compensation plans | | 9,994 | | | | | | | | | | | | | |
Issuance of common stock through exercise of stock options and SSARs | | 2,685 | | | 14 | | | | | | | | | 14 | |
Stock-based compensation expense | | | | | 880 | | | | | | | | | 880 | |
Cash dividends declared | | | | | | | | (3,708) | | | | | | (3,708) | |
Balance, December 31, 2018 | | 3,759,426 | | $ | 29,715 | | $ | 64,937 | | $ | (1,095) | | $ | 93,557 | |
Balance, December 31, 2021 | |
| 5,645,687 |
| $ | 114,108 |
| $ | 97,442 |
| $ | 179 |
| $ | 211,729 |
| | | | | | | | | | | | | | |
|
|
|
|
|
|
|
|
|
|
|
|
|
|
See notes to consolidated financial statements | See notes to consolidated financial statements | | | | | | | | | | | | |
|
|
|
|
|
|
|
|
|
|
|
|
|
|
| | | | | | |
|
|
|
|
|
|
| | | | | | |
|
|
|
|
|
|
Fidelity D & D Bancorp, Inc. and Subsidiary | | | | | | |
|
|
|
|
|
|
Consolidated Statements of Cash Flows | | | | | | |
|
|
|
|
|
|
| | | Years ended December 31, |
| Years ended December 31, |
(dollars in thousands) | | 2018 | | 2017 | | 2016 |
| 2021 |
| 2020 |
| 2019 |
| | | | | | | |
|
|
|
|
|
|
|
Cash flows from operating activities: | | | | | | | |
|
|
|
|
|
|
|
Net income | | $ | 11,006 | | $ | 8,716 | | $ | 7,693 |
| $ | 24,008 |
| $ | 13,035 |
| $ | 11,576 |
Adjustments to reconcile net income to net cash provided by | | | | | | | |
|
|
|
|
|
|
|
operating activities: | | | | | | | |
|
|
|
|
|
|
|
Depreciation, amortization and accretion | | | 3,029 | | 3,113 | | 3,301 |
|
| 5,423 |
| 4,539 |
| 3,301 |
Provision for loan losses | | | 1,450 | | 1,450 | | 1,025 |
|
| 2,000 |
| 5,250 |
| 1,085 |
Deferred income tax expense | | | 1,019 | | (666) | | 1,248 | |
Deferred income tax expense (benefit) | |
|
| 1,194 |
| (400) |
| 341 |
Stock-based compensation expense | | | 749 | | 550 | | 519 |
|
| 1,096 |
| 1,077 |
| 817 |
Excess tax benefit from exercise of stock options | | | 28 | | 96 | | - | |
Excess tax benefit from exercise of SSARs | |
|
| 26 |
| - |
| 23 |
Proceeds from sale of loans held-for-sale | | | 32,721 | | 43,350 | | 51,656 |
|
| 162,343 |
| 158,300 |
| 52,718 |
Originations of loans held-for-sale | | | (34,858) | | (38,624) | | (46,670) |
|
| (186,768) |
| (176,939) |
| (42,328) |
Earnings from bank-owned life insurance | | | (598) | | (581) | | (353) |
|
| (1,227) |
| (794) |
| (647) |
Net gain from sales of loans | | | (645) | | (878) | | (1,009) |
|
| (4,172) |
| (3,603) |
| (856) |
Net gain from sales of investment securities | | | (54) | | 147 | | (9) |
|
| (46) |
| (115) |
| (14) |
Net loss from sale and write-down of foreclosed assets held-for-sale | | | 90 | | 79 | | 70 | |
Net (gain) loss from sale and write-down of foreclosed assets held-for-sale | |
|
| (44) |
| (23) |
| 44 |
Net loss from write-down and disposal of bank premises and equipment | | | 18 | | 164 | | 5 |
|
| 186 |
| 142 |
| 13 |
Operating lease payments | |
|
| 60 |
| 29 |
| 81 |
Change in: | | | | | | | |
|
|
|
|
|
|
|
Accrued interest receivable | | | (486) | | (536) | | (36) |
|
| (900) |
| (985) |
| (10) |
Other assets | | | (2,503) | | (3,989) | | (1,895) |
|
| 1,099 |
| (710) |
| 420 |
Accrued interest payable and other liabilities | | | 2,684 | | 1,496 | | 314 |
|
| 2,921 |
| 1,493 |
| (778) |
Net cash provided by operating activities | | | 13,650 | | 13,887 | | 15,859 |
|
| 7,199 |
| 296 |
| 25,786 |
| | | | | | | |
|
|
|
|
|
|
|
Cash flows from investing activities: | | | | | | | |
|
|
|
|
|
|
|
Available-for-sale securities: | | | | | | | |
|
|
|
|
|
|
|
Proceeds from sales | | | 13,514 | | 5,970 | | 2,884 |
|
| 44,474 |
| 123,459 |
| 10,952 |
Proceeds from maturities, calls and principal pay-downs | | | 20,434 | | 20,578 | | 20,378 |
|
| 54,213 |
| 68,906 |
| 35,045 |
Purchases | | | (63,571) | | (55,016) | | (30,654) |
|
| (411,406) |
| (271,504) |
| (43,384) |
Increase in FHLB stock | | | (3,507) | | (226) | | (486) | |
Net increase in loans and leases | | | (81,887) | | (44,584) | | (49,579) | |
Decrease in restricted investments in bank stock | |
|
| 792 |
| 2,149 |
| 1,956 |
Net decrease (increase) in loans and leases | |
|
| 7,134 |
| (132,541) |
| (36,912) |
Principal portion of lease payments received under direct finance leases | |
|
| 5,262 |
| 3,551 |
| 3,170 |
Purchase of life insurance policies | | | - | | (8,000) | | - |
|
| - |
| (11,000) |
| (2,000) |
Purchases of bank premises and equipment | | | (3,572) | | (921) | | (1,476) |
|
| (2,520) |
| (1,390) |
| (4,128) |
Net cash acquired in acquisition of bank branch | | | - | | 11,817 | | - | |
Net cash (used in) provided by acquisition | |
|
| (3,746) |
| 53,004 |
| - |
Proceeds from sale of bank premises and equipment | | | 8 | | 6 | | 1 |
|
| 1,719 |
| 187 |
| 240 |
Proceeds from sale of foreclosed assets held-for-sale | | | 1,462 | | 534 | | 771 |
|
| 835 |
| 936 |
| 1,065 |
Net cash used in investing activities | | | (117,119) | | (69,842) | | (58,161) |
|
| (303,243) |
| (164,243) |
| (33,996) |
| | | | | | | |
|
|
|
|
|
|
|
Cash flows from financing activities: | | | | | | | |
|
|
|
|
|
|
|
Net increase in deposits | | | 40,037 | | 12,878 | | 82,784 |
|
| 351,903 |
| 278,342 |
| 65,554 |
Net increase in short-term borrowings | | | 57,864 | | 14,278 | | (23,980) | |
Proceeds from issuance of FHLB advances | | | 15,000 | | 25,704 | | - | |
Net decrease in other borrowings | |
|
| (12,223) |
| (37,839) |
| (38,527) |
Proceeds from Paycheck Protection Program Liquidity Facility (PPPLF) | |
|
| - |
| 152,791 |
| - |
Repayment of PPPLF | |
|
| - |
| (152,791) |
| - |
Repayment of FHLB advances | | | (4,500) | | (4,500) | | - |
|
| (9,602) |
| (17,627) |
| (16,704) |
Repayment of capital lease obligation | | | (38) | | - | | - | |
Repayment of finance lease obligation | |
|
| (159) |
| (83) |
| (73) |
Proceeds from employee stock purchase plan participants | | | 149 | | 126 | | 111 |
|
| 270 |
| 219 |
| 175 |
Exercise of stock options | | | 14 | | 416 | | 14 | |
Dividends paid, net of dividends reinvested | | | (3,397) | | (2,954) | | (3,061) | |
Dividends paid | |
|
| (6,608) |
| (5,378) |
| (4,037) |
Cash paid in lieu of fractional shares | | | - | | (11) | | - |
|
| (6) |
| (4) |
| - |
Net cash provided by financing activities | | | 105,129 | | 45,937 | | 55,868 |
|
| 323,575 |
| 217,630 |
| 6,388 |
Net increase (decrease) in cash and cash equivalents | | | 1,660 | | (10,018) | | 13,566 |
|
| 27,531 |
| 53,683 |
| (1,822) |
Cash and cash equivalents, beginning | | | 15,825 | | 25,843 | | 12,277 |
|
| 69,346 |
| 15,663 |
| 17,485 |
| | | | | | | |
|
|
|
|
|
|
|
Cash and cash equivalents, ending | | $ | 17,485 | | $ | 15,825 | | $ | 25,843 |
| $ | 96,877 |
| $ | 69,346 |
| $ | 15,663 |
| | | | | | | |
|
|
|
|
|
|
|
See notes to consolidated financial statements | | | | | | |
|
|
|
|
|
|
| | | | | | |
|
|
|
|
|
|
Fidelity D & D Bancorp, Inc. and Subsidiary | | | | | | |
|
|
|
|
|
|
Consolidated Statements of Cash Flows (continued) | | | | | | |
|
|
|
|
|
|
| | Years ended December 31, |
| Years ended December 31, |
(dollars in thousands) | | 2018 | | 2017 | | 2016 |
| 2021 |
| 2020 |
| 2019 |
Supplemental Disclosures of Cash Flow Information | | | | | | | | |
|
|
|
|
|
|
|
|
Cash payments for: | | | | | | |
|
|
|
|
|
|
Interest | | $ | 4,689 | | $ | 3,058 | | $ | 2,366 |
| $ | 3,851 |
| $ | 5,820 |
| $ | 7,440 |
Income tax | | 600 | | 2,700 | | 800 |
| 2,650 |
| 3,250 |
| 1,950 |
Supplemental Disclosures of Non-cash Investing Activities: | | | | | | |
|
|
|
|
|
|
Net change in unrealized gains on available-for-sale securities | | (3,137) | | 191 | | (1,222) |
| (11,105) |
| 6,772 |
| 5,946 |
Transfers from loans to foreclosed assets held-for-sale | | 781 | | 280 | | 1,132 |
| 481 |
| 800 |
| 1,288 |
Transfers from loans to loans held-for-sale | | 1,204 | | 3,821 | | 6,037 | |
Transfers from loans to loans held-for-sale, net | |
| (23,821) |
| 6,642 |
| 6,038 |
Transfers from premises and equipment to other assets held-for-sale | | 253 | | - | | - |
| 1,495 |
| - |
| - |
Right-of-use asset | |
| 1,519 |
| 72 |
| 6,211 |
Lease liability | |
| 1,519 |
| 72 |
| 6,710 |
| | | | | | | |
|
|
|
|
|
|
Acquisition of West Scranton Branch from Wayne Bank | | | | March 17, 2017 | | | |
Non-cash assets acquired: | | | | | | | | |
Transactions related to acquisition | |
|
|
|
|
|
|
Increase in assets and liabilities: | |
|
|
|
|
|
|
Securities | |
| $ | 49,430 |
| $ | 123,420 |
|
|
Loans | | | | $ | 1,574 | | |
| 298,860 |
| 245,283 |
|
|
Bank premises and equipment | | | | 264 | | | |
Restricted investments in bank stocks | |
| 1,186 |
| 692 |
|
|
Premises and equipment | |
| 3,405 |
| 6,907 |
|
|
Investment in bank-owned life insurance | |
| 7,233 |
| 9,230 |
|
|
Goodwill | | | | 209 | | |
| 12,575 |
| 6,843 |
|
|
Accrued interest receivable and other assets | | | | | 4 | | | |
Total non-cash assets acquired | | | | $ | 2,051 | | | |
Liabilities assumed: | | | | | | | | |
Deposits | | | | $ | 13,809 | | | |
Accrued interest payable and other liabilities | | | | | 59 | | | |
Total liabilities assumed | | | | $ | 13,868 | | | |
Core deposit intangible asset | |
| 597 |
| 1,973 |
|
|
Leased property under finance leases | |
| 1,188 |
| - |
|
|
Right-of-use assets | |
| 756 |
| 1,354 |
|
|
Other assets | |
| 4,127 |
| 2,680 |
|
|
Non-interest-bearing deposits | |
| (100,472) |
| (118,822) |
|
|
Interest-bearing deposits | |
| (208,057) |
| (276,816) |
|
|
Short-term borrowings | |
| (2,224) |
| - |
|
|
FHLB advances | |
| (4,602) |
| (7,627) |
|
|
Secured borrowings | |
| (20,619) |
| - |
|
|
Finance lease obligation | |
| (1,188) |
| - |
|
|
Operating lease liabilities | |
| (756) |
| (1,354) |
|
|
Other liabilities | |
| (2,631) |
| (1,356) |
|
|
Fair value of common shares issued | |
| (35,056) |
| (45,408) |
|
|
| |
|
|
|
|
|
|
| | | | | | | |
|
|
|
|
|
|
See notes to consolidated financial statements | | | | | | |
|
|
|
|
|
|
| | | | | | |
|
|
|
|
|
|
FIDELITY D & D BANCORP, INC.
AND SUBSIDIARY
NOTES TO CONSOLIDATED FINANCIAL STATEMENTS
1.NATURE OF OPERATIONS AND SUMMARY OF SIGNIFICANT ACCOUNTING POLICIES
PRINCIPLES OF CONSOLIDATION
The accompanying consolidated financial statements include the accounts of Fidelity D & D Bancorp, Inc. and its wholly-owned subsidiary, The Fidelity Deposit and Discount Bank (the Bank) (collectively, the Company). All significant inter-company balances and transactions have been eliminated in consolidation.
NATURE OF OPERATIONS
The Company provides a full range of banking, trust and financial services to individuals, small businesses and corporate customers. Its primary market areas are Lackawanna, Luzerne and LuzerneNorthampton Counties, Pennsylvania. The Company's primary deposit products are demand deposits and interest-bearing time, money market and savings accounts. It offers a full array of loan products to meet the needs of retail and commercial customers. The Company is subject to regulation by the Federal Deposit Insurance Corporation (FDIC) and the Pennsylvania Department of Banking.
USE OF ESTIMATES
The preparation of financial statements in conformity with accounting principles generally accepted in the United States of America (GAAP)(U.S. GAAP) requires management to make estimates and assumptions that affect the reported amounts of assets and liabilities and disclosure of contingent assets and liabilities at the date of the financial statements and the reported amounts of revenues and expenses during the reporting period. Actual results could differ from those estimates.
Material estimates that are particularly susceptible to significant change relate to the determination of the allowance for loan losses, the valuation of investment securities, the determination and the amount of impairment in the securities portfolios, and the related realization of the deferred tax assets related to the allowance for loan losses, other-than-temporary impairment on and valuations of investment securities.
In connection with the determination of the allowance for loan losses, management generally obtains independent appraisals for significant properties, utilizes historical loss factors and applies judgement to determine qualitative factor adjustments. While management uses available information to recognize losses on loans, further reductions in the carrying amounts of loans may be necessary based on changes in economic conditions. In addition, regulatory agencies, as an integral part of their examination process, periodically review the estimated losses on loans. Such agencies may require the Company to recognize additional losses based on their judgments about information available to them at the time of their examination. Because of these factors, it is reasonably possible that the estimated losses on loans may change materially in the near-term. However, the amount of the change that is reasonably possible cannot be estimated.
The Company’s investment securities are comprised of a variety of financial instruments. The fair values of the securities are subject to various risks including changes in the interest rate environment and general economic conditions including illiquid conditions in the capital markets. Due to the increased level of these risks and their potential impact on the fair values of the securities, it is possible that the amounts reported in the accompanying financial statements could materially change in the near-term. Any credit-related impairment is included as a component of non-interest income in the consolidated income statements while non-credit-related impairment is charged to other comprehensive income, net of tax.
SIGNIFICANT GROUP CONCENTRATION OF CREDIT RISK
The Company originates commercial, consumer, and mortgage loans to customers primarily located in Lackawanna, Luzerne, Northampton, and LuzerneLehigh Counties of Pennsylvania. Although the Company has a diversified loan portfolio, a substantial portion of its debtors’ ability to honor their contracts is dependent on the economic sector in which the Company operates. The loan portfolio does not have any significant concentrations from one industry or customer.
HELD-TO-MATURITY SECURITIES
Debt securities, for which the Company has the positive intent and ability to hold to maturity, are reported at cost. Premiums and discounts are amortized or accreted, as a component of interest income over the life of the related security as an adjustment to yield using the interest method. The Company did not0t have any held-to-maturity securities at December 31, 20182021 or 2017.2020.
TRADING SECURITIES
Debt securities held principally for resale in the near-term, or trading securities, are recorded at their fair values. Unrealized gains and losses are included in other income. The Company did not0t have investment securities held for trading purposes during 20182021 or 2017.2020.
AVAILABLE-FOR-SALE SECURITIES
Available-for-sale (AFS) securities consist of debt and equity securities classified as neither held-to-maturity nor trading and are reported at fair value. Premiums and discounts are amortized or accreted as a component of interest income over the life of the related security as an adjustment to yield using the interest method. Unrealized holding gains and losses, including non-credit-related other-than-temporary impairment (OTTI), on AFS securities are reported as a separate component of shareholders’ equity, net of deferred income taxes, until realized. The net unrealized holding gains and losses are a component of accumulated other comprehensive income. Gains and losses from sales of securities AFS are determined using the specific identification method.
FEDERAL HOME LOAN BANK STOCK
The Company, is a member of the Federal Home Loan Bank system, and as such is required to maintain an investment in capital stock of the Federal Home Loan Bank of Pittsburgh (FHLB). The amount the Company is required to invest is dependent upon the relative size of outstanding borrowings the Company has with the FHLB. Based on redemption provisions of the FHLB, the stock has no quoted market value and is carried at cost.
LOANS
LoansOriginated loans that management has the intent and ability to hold for the foreseeable future or until maturity or payoff are stated at face value, net of unamortized loan fees and costs and the allowance for loan losses. Interest on residential real estate loans is recorded based on principal pay downs on an actual days basis. Commercial loan interest is accrued on the principal balance on an actual days basis. Interest on consumer loans is determined using the simple interest method.
Acquired loans are initially recorded at their acquisition date fair values with no carryover of the existing related allowance for loan losses. Fair values are based on a discounted cash flow methodology that involves assumptions and judgements as to credit risk, expected lifetime losses, environmental factors, collateral values, discount rates, expected payments and expected prepayments. Upon acquisition, in accordance with GAAP, the Company has individually determined whether each acquired loan is within the scope of ASC 310-30. These loans are deemed purchased credit impaired loans and the excess of cash flows expected at acquisition over the estimated fair value is referred to as the accretable discount and is recognized into interest income over the remaining life of the loan. The difference between contractually required payments at acquisition and the cash flows expected to be collected at acquisition is referred to as the non accretable discount.
Acquired ASC 310-20 loans, which are loans that did not meet the criteria of ASC 310-30, were pooled into groups of similar loans based on various factors including borrower type, loan purpose, and collateral type. These loans are initially recorded at fair value, and include credit and interest rate marks associated with purchase accounting adjustments. Purchase premiums or discounts are subsequently amortized as an adjustment to yield over the estimated contractual lives of the loans. There is no allowance for loan losses established at the acquisition date for acquired performing loans. An allowance for loan losses is recorded for any credit deterioration in these individual loans subsequent to acquisitions.
Generally, loans are placed on non-accrual status when principal or interest is past due 90 days or more. When a loan is placed on non-accrual status, all interest previously accrued but not collected is charged against current earnings. Any payments received on non-accrual loans are applied, first to the outstanding loan amounts, then to the recovery of any charged-off loan amounts. Any excess is treated as a recovery of lost interest.
Acquired loans that meet the criteria for impaired or non-accrual status prior to the acquisition may be considered performing upon acquisition, regardless of whether the customer is contractually delinquent, if the Company expects to fully collect the fair value of the loans.
A modification of a loan constitutes a troubled debt restructuring (TDR) when a borrower is experiencing financial difficulty and the Company grants a concession that it would not otherwise grant based on current underwriting standards. Although concessions may be made when modifying a loan, forgiveness of principal is rarely granted.
MORTGAGE BANKING OPERATIONS AND MORTGAGE SERVICING RIGHTS
The Company sells one-to-four family residential mortgage loans on a servicing retained basis. On a loan sold where servicing was retained, the Company determines at the time of sale the value of the retained servicing rights, which represents the present value of the differential between the contractual servicing fee and adequate compensation, defined as the fee a sub-servicer would require to assume the role of servicer, after considering the estimated effects of prepayments. If material, a portion of the gain on the sale of the loan is recognized due to the value of the servicing rights, and a mortgage servicing asset is recorded.
Commitments to sell one-to-four family residential mortgage loans are made primarily during the period between the intent to proceed and the closing of the mortgage loan. The timing of making these sale commitments is dependent upon the timing of the borrower’s election to lock-in the mortgage interest rate and fees prior to loan closing. Most of these sales commitments are made on a best-efforts basis whereby the Company is only obligated to sell the mortgage if the mortgage loan is approved and closed by the Company. Commitments to fund mortgage loans (rate lock commitments) to be sold into the secondary market and forward commitments for the future delivery of these mortgage loans are accounted for as free standing derivatives. Fair values of these derivatives are estimated based on changes in mortgage interest rates from the date
the interest rate on the loan is locked. The Company enters into forward commitments for the future delivery of mortgage loans when interest rate locks are entered into, in order to hedge the change in interest rates resulting from its commitments to fund the loans. Changes in the fair values of these derivatives are included in gains or losses on sales of loans. The fair value of these derivative instruments was not significant at December 31, 20182021 and 2017.2020.
Servicing assets are reported in other assets and amortized in proportion to and over the period during which estimated servicing income will be received. Servicing loans for others consists of collecting mortgage payments, maintaining escrow accounts, disbursing payments to investors, and processing foreclosures. Loan servicing income is recorded when earned and represents servicing fees from investors and certain charges collected from borrowers, such as late payment fees. The Company has fiduciary responsibility for related escrow and custodial funds.
Servicing assets are recognized as separate assets when rights are acquired through the sale of financial assets. For sales of mortgage loans originated by the Company, a portion of the cost of originating the loan is allocated to the servicing retained right based on fair value. Capitalized servicing rights are amortized into interest income in proportion to, and over the period of, the estimated future net servicing income of the underlying financial assets. Remaining servicing rights are charged against income upon payoff of the loan. Servicing fee income is recorded for fees earned for servicing loans. The fees are based on a contractual percentage of the outstanding principal and are recorded as income when earned.
LOANS HELD-FOR-SALE
Loans originated and intended for sale in the secondary market are carried at the lower of cost or estimated fair value in the aggregate. Net unrealized losses are recognized through a valuation allowance by charges to income. Unrealized gains are recognized but only to the extent of previous write-downs.
AUTOMOBILE LEASING
Financing of automobiles, provided to customers under lease arrangements of varying terms obtained via an indirect arrangement primarily through a single dealer on a full recourse basis, are accounted for as direct finance leases. Interest on automobile direct finance leasing is determined using the interest method. Generally, the interest method is used to arrive at a level effective yield over the life of the lease. The lease residual and the lease receivable, net of unearned lease income, are recorded within loans and leases on the balance sheet.
ALLOWANCE FOR LOAN LOSSES
The allowance for loan losses is established through a provision for loan losses. The allowance represents an amount which, in management’s judgment, will be adequate to absorb losses on existing loans. Management’s judgment in determining the adequacy of the allowance is based on evaluations of the collectability of the loans. These evaluations take into consideration such factors as changes in the nature and volume of the loan portfolio, current economic conditions that may affect the borrower’s ability to pay, collateral value, overall portfolio quality and review of specific loans for impairment. Management applies two primary components during the estimation process to determine proper allowance levels; a specific loan loss allocation for loans that are deemed impaired and a general loan loss allocation for those loans not specifically allocated based on historical charge-off history and qualitative factor adjustments for trends or changes in the loan portfolio.portfolio and economic factors. Delinquencies, changes in lending policies and local economic conditions are some of the items used for the qualitative factor adjustments. Loans considered uncollectible are charged against the allowance. Recoveries on loans previously charged off are added to the allowance.
A loan is considered impaired when, based on current information and events, it is probable that the Company will be unable to collect the scheduled payments in accordance with the contractual terms of the loan. Factors considered in determining impairment include payment status, collateral value and the probability of collecting payments when due. The significance of payment delays and/or shortfalls is determined on a case by casecase-by-case basis. All circumstances surrounding the loan are taken into account. Such factors include the length of the delinquency, the underlying reasons and the borrower’s prior payment record. Impairment is measured on these loans on a loan-by-loan basis. Impaired loans include non-accrual loans, TDRs and other loans deemed to be impaired based on the aforementioned factors.
Acquired loans are marked to fair value on the date of acquisition and are evaluated on a quarterly basis to ensure the necessary purchase accounting updates are made in parallel with the allowance for loan loss calculation. The carryover of allowance for loan losses related to acquired loans is prohibited as any credit losses in the loans are included in the determination of the fair value of the loans at the acquisition date. The allowance for loan losses on acquired loans reflects only those losses incurred after acquisition and represents the present value of cash flows expected at acquisition that is no longer expected to be collected. In conjunction with the quarterly evaluation of the adequacy of the allowance for loan losses, the Company performs an analysis on acquired loans to determine whether or not there has been subsequent deterioration in relation to these loans. If deterioration has occurred, the Company will include these loans in the calculation of the allowance for loan losses after the initial valuation and provide accordingly.
For acquired ASC 310-30 loans, the Company continues to estimate cash flows expected to be collected. Subsequent decreases to the expected cash flows would require the Company to evaluate the need for an additional allowance for loan losses. Subsequent improvement in expected cash flows would result in the reversal of a corresponding amount of the non
accretable discount which would be reclassified as an accretable discount that will be recognized in interest income over the remaining life of the loan.
The risk characteristics of each of the identified portfolio segments are as follows:
Commercial and industrial loans (C&I): C&I loans are primarily based on the identified historic and/or the projected cash flows of the borrower and secondarily on the underlying collateral provided by the borrower. The cash flows of the borrower, however, do fluctuate based on changes in the Company’s internal and external environment including management, human and capital resources, economic conditions, competition and regulation. Most C&I loans are secured by business assets being financed such as equipment, accounts receivable, and/or inventory and generally incorporate a secured or unsecured personal guarantee. Unsecured loans may be made on a short-term basis. Loans to municipal borrowers, which carry the full faith and credit of each respective local government unit consistent with the PA Local Government Unit Debt Act (LGUDA) as well as loans to municipal authorities are included in C&I loans. The ability of the borrower to collect amounts due from its customers and perform under the terms of its loan may be affected by its customers’ economic and financial condition.
Commercial real estate loans (CRE): Commercial real estate loans are made to finance the purchase of real estate, refinance existing obligations and/or to provide capital. These commercial real estate loans are generally secured by first lien security interests in the real estate as well as assignment of leases and rents. The real estate may include apartments, hotels, retail stores or plazas and healthcare facilities whether they are owner or non-owner occupied. These loans are typically originated in amounts of no more than 80% of the appraised value of the property. The ability of the borrower to collect amounts due from its customers and perform under the terms of its loan may be affected by its customers’ or lesseeslessees' customers’ economic and financial condition.
Consumer loans: The Company offers home equity installment loans and lines of credit. Risks associated with loans secured by residential properties are generally lower than commercial real estate loans and include general economic risks, such as the strength of the job market, employment stability and the strength of the housing market. Since most loans are secured by a primary or secondary residence or an automobile, the borrower’s continued employment is considered the greatest risk to repayment. The Company also offers a variety of loans to individuals for personal and household purposes. These loans are generally considered to have greater risk than mortgages on real estate because they may be unsecured, or if they are secured, the value of the collateral may be difficult to assess and more likely to decrease in value than real estate.
Residential mortgage loans: Residential mortgages are secured by a first lien position of the borrower’s residential real estate. These loans have varying loan rates depending on the financial condition of the borrower and the loan to value ratio. Since most loans are secured by a primary or secondary residence, the borrower’s continued employment is considered the greatest risk to repayment. Residential mortgages have terms up to thirty years with amortizations varying from 10 to 30 years. The majority of the loans are underwritten according to FNMA and/or FHLB standards.
TRANSFER OF FINANCIAL ASSETS
Transfers of financial assets are accounted for as sales when control over the assets has been surrendered. Control over transferred assets is deemed to be surrendered when:when (1) the assets have been isolated from the Company—put presumptively beyond the reach of the transferor and its creditors, even in bankruptcy or other receivership;Company, (2) the transferee obtains the right (free of conditions that constrain it from taking advantage of that right) to pledge or exchange the transferred assets;assets, and (3) the Company does not maintain effective control over the transferred assets through an agreement to repurchase them before their maturitymaturity. The Company accounts for certain participation interests in commercial loans receivable (loan participation agreements) sold as a sale of financial assets pursuant to ASC 860, Transfers and Servicing. Loan participation agreements that meet the sale criteria under ASC 860 are derecognized from the Consolidated Balance Sheets at the time of transfer. If the transfer of loans does not meet the sale criteria or participating interest criteria under ASC 860, the ability to unilaterally causetransfer is accounted for as a secured borrowing and the holder to return specific assets, other than throughloan is not de-recognized and a cleanup call.participating liability is recorded in the Consolidated Balance Sheets.
LOAN FEES AND COSTS
Nonrefundable loan origination fees and certain direct loan origination costs are recognized as a component of interest income over the life of the related loans as an adjustment to yield. The unamortized balance of the deferred fees and costs are included as components of the loan balances to which they relate.
BANK PREMISES AND EQUIPMENT
Land is carried at cost. Bank premises and equipment are stated at cost less accumulated depreciation. Depreciation is computed on the straight-line method over the estimated useful lives of the assets. Leasehold improvements are amortized over the shorter of the term of the lease or the estimated useful lives of the improved property. The Company leases several branches which are classified as operating leases. The Company also leases three stand-alone ATMs which are classified as operating leases and several copiers which area building and equipment classified as capitalfinance leases. In most circumstances, management expects that in the normal course of business, leases will be renewed or replaced by other leases. Rent expense is recognized on the straight-line method over the term of the lease.
BANK OWNED LIFE INSURANCE
The Company maintains bank owned life insurance (BOLI) for a selected group of employees, namely its officers where the Company is the owner and sole beneficiary of the policies. The earnings from the BOLI are recognized as a component of other income in the consolidated statements of income. The BOLI is an asset that can be liquidated, if necessary, with tax consequences. However, the Company intends to hold these policies and, accordingly, the Company has not provided for deferred income taxes on the earnings from the increase in the cash surrender value.
EMPLOYEE BENEFITS
The Company holds separate supplemental executive retirement (SERP) agreements for certain officers and an amount is credited to each participant’s SERP account monthly while they are actively employed by the bank until retirement. A deferred tax asset is provided for the non-deductible SERP expense. The Company also entered into separate split dollar life insurance arrangements with three4 executives providing post-retirement benefits and accrues monthly expense for this benefit. Monthly expenses for the SERP and post-retirement split dollar life benefit are recorded as components of salaries and employee benefit expense on the consolidated statements of income.
FORECLOSED ASSETS HELD-FOR-SALE
Foreclosed assets held-for-sale are carried at the lower of cost or fair value less cost to sell. Foreclosed assets held-for-sale is primarily other real estate owned, but also includes other repossessed assets. Losses from the acquisition of property in full and partial satisfaction of debt are treated as credit losses. Routine holding costs, gains and losses from sales, write-downs for subsequent declines in value and any rental income received are recognized net, as a component of other real estate owned expense in the consolidated statements of income. Gains or losses are recorded when the properties are sold.
IMPAIRMENT OF LONG-LIVED ASSETS
Long-lived assets, including bank premises and equipment, are reviewed for impairment whenever events or changes in circumstances indicate that the carrying amount of an asset may not be recoverable. If impairment is indicated by that review, the asset is written down to its estimated fair value through a charge to non-interest expense.
GOODWILL AND INTANGIBLE ASSETS
Goodwill is recorded on the consolidated balance sheets as the excess of liabilities assumed over identifiable assets acquired on the acquisition date. Goodwill is recorded at its net carrying value which represents estimated fair value. The goodwill is deductible for tax purposes over a 15 year period.
Goodwill is reviewed for impairment annually as of November 30 and between annual tests when events and circumstances indicate that impairment may have occurred. Goodwill impairment exists when the carrying amount of a reporting unit exceeds its fair value. A qualitative test can be performed to determine whether it is more likely than not that the fair value of the Company is less than its carrying amount, including goodwill. In this qualitative assessment, the Company evaluates events and circumstances which include general banking industry conditions and trends, the overall financial performance of the Company, the performance of the Company’s common stock and key financial performance metrics of the Company. If the qualitative review indicates that it is not more likely than not that the carrying value exceeds its fair value, no further evaluation needs to be performed. If the results of the qualitative review indicate it is more likely than not that the fair value
is less than the carrying value, then the Company performs a quantitative impairment test. During 2018,2021, the Company determined it is not more likely than not that the carryingfair value exceeds its carrying value therefore no quantitative analysis was necessary.
Other acquired intangible assets that have finite lives, such as core deposit intangibles, are amortized over their estimated useful lives and subject to periodic impairment testing.
STOCK PLANS
The Company has two2 stock-based compensation plans. The Company accounts for these plans under the recognition and measurement accounting principles, which requires the cost of share-based payment transactions be recognized in the financial statements. The stock-based compensation accounting guidance requires that compensation cost for stock awards be calculated and recognized over the employees’ service period, generally defined as the vesting period. Compensation cost is recognized on a straight-line basis over the requisite service period. When granting stock options, the Company uses the Black-Sholes option pricing model to determine their estimated fair value on the date of grant. When granting stock-settled stock appreciation rights (SSARs), the Company uses Black-Scholes-Merton valuation model to determine fair value on the date of grant.
TRUST AND FINANCIAL SERVICE FEES
Trust and financial service fees are recorded on the cash basis, which is not materially different from the accrual basis.
ADVERTISING COSTS
Advertising costs are charged to expense as incurred.
LEGAL AND PROFESSIONAL EXPENSES
Generally, the Company recognizes legal and professional fees as incurred and are included as a component of professional services expense in the consolidated statements of income. Legal costs incurred that are associated with the collection of outstanding amounts due from delinquent borrowers are included as a component of loan collection expense in the consolidated statements of income. In the event of litigation proceedings brought about by an employee or third party against the Company, expenses for damages will be accrued if the likelihood of the outcome against the Company is probable, the amount can be reasonably estimated and the amount would have a material impact on the financial results of the Company.
INCOME TAXES
Deferred tax assets and liabilities are reflected at currently enacted income tax rates applicable to the period in which the deferred tax assets or liabilities are expected to be realized or settled. As changes in tax laws or rates are enacted, deferred tax assets and liabilities are adjusted through the provision for income taxes.
The benefit of a tax position is recognized on the financial statements in the period during which, based on all available evidence, management believes it is more-likely-than-not that the position will be sustained upon examination, including the resolution of appeals or litigation processes, if any. Tax positions taken are not offset or aggregated with other positions. Tax positions that meet the more-likely-than-not recognition threshold are measured as the largest amount of tax benefit that is more than 50% likely of being realized upon settlement with the applicable taxing authority. For tax positions not meeting the more likely than not threshold, no tax benefit is recorded. Under the more likely than not threshold guidelines, the Company believes no significant uncertain tax positions exist, either individually or in the aggregate, that would give rise to the non-recognition of an existing tax benefit. The Company had no0 material unrecognized tax benefits or accrued interest and penalties for the years ended December 31, 2018, 20172021, 2020 or 2016,2019, respectively.
COMPREHENSIVE INCOME (LOSS)
Accounting principles generally require that recognized revenue, expenses, gains and losses be included in net income. Although certain changes in assets and liabilities, such as unrealized gains and losses on available-for-sale securities, are reported as a separate component of the shareholders’ equity section of the consolidated balance sheets, such items, along with net income, are components of comprehensive income (loss).
CASH FLOWS
For purposes of reporting cash flows, cash and cash equivalents include cash on hand, amounts due from banks and interest-bearing deposits with financial institutions.
Expenditures for construction in process, a component of other assets in the consolidated balance sheets, are included in acquisition of premises and equipment.2.CASH
2.CASH
The Company is required by the Federal Reserve Bank to maintain average reserve balances based on a percentage of deposits. The amounts of thoseThere were 0 reserve requirements on December 31, 20182021 and 2017 were $1.4 million and $1.4 million, respectively.2020.
Deposits with any one financial institution are insured up to $250,000. From time-to-time, the Company may maintain cash and cash equivalents with certain other financial institutions in excess of the insured amount.
3.ACCUMULATED OTHER COMPREHENSIVE INCOME
The following tables illustrate the changes in accumulated other comprehensive income by component and the details about the components of accumulated other comprehensive income as of and for the periods indicated:
|
|
|
|
|
|
As of and for the year ended December 31, 20182021 |
| Unrealized gains |
| (losses) on |
| available-for-sale |
(dollars in thousands) | debt securities |
Beginning balance | $ | 1,804 |
| | 8,952 |
|
|
|
Other comprehensive loss before reclassifications, net of tax |
| (2,470)(8,737) |
Amounts reclassified from accumulated other comprehensive income, net of tax |
| (8)(36) |
Effect of adopting ASU 2016-01, net of tax*
| | (421) |
Net current-period other comprehensive loss |
| (2,899)(8,773) |
Ending balance | $ | (1,095)179 |
*The Company adopted ASU 2016-01 on January 1, 2018. As a result, unrealized gains on equity securities were reclassified from accumulated other comprehensive income to retained earnings.
|
|
|
As of and for the year ended December 31, 20172020 |
| Unrealized gains |
| (losses) on |
| available-for-sale |
(dollars in thousands) | debt securities |
Beginning balance | $ | 1,381 |
| | 3,602 |
|
|
|
Other comprehensive income before reclassifications, net of tax |
| 29 5,441 |
Amounts reclassified from accumulated other comprehensive income, net of tax |
| 97 (91) |
Effect of adopting ASU 2018-02*
| | 297 |
Net current-period other comprehensive income |
| 423 5,350 |
Ending balance | $ | 1,804 8,952 |
|
|
|
*The Company elected to reclassify from accumulated other comprehensive income to retained earnings stranded tax effects resulting from the Tax Cuts and Jobs Act at the end of 2017 according to ASU 2018-02. These stranded tax effects were related to the adjustment made to retained earnings at the end of 2017 to re-measure the deferred tax liability for unrealized gains on available for sale securities at the new tax rate effective January 1, 2018.
|
|
|
As of and for the year ended December 31, 20162019 |
| Unrealized gains |
| (losses) on |
| available-for-sale |
(dollars in thousands) | debt securities |
Beginning balance | $ | 2,188 |
| | (1,095) |
|
|
|
Other comprehensive lossincome before reclassifications, net of tax |
| (801)4,708 |
Amounts reclassified from accumulated other comprehensive income, net of tax |
| (6)(11) |
Net current-period other comprehensive lossincome |
| (807)4,697 |
Ending balance | $ | 1,381 3,602 |
|
|
|
|
|
|
|
|
|
|
|
|
|
|
|
|
|
|
|
|
|
|
|
|
|
|
|
Details about accumulated other |
|
|
|
|
|
|
|
|
|
|
|
comprehensive income components | Amount reclassified from accumulated |
| Affected line item in the statement |
(dollars in thousands) | other comprehensive income |
| where net income is presented |
|
|
|
|
|
|
|
|
|
|
|
|
|
|
|
|
|
|
|
|
|
|
|
| 2021 |
| 2020 |
| 2019 |
|
|
|
|
|
|
|
|
|
|
|
|
|
|
Unrealized gains (losses) on AFS debt securities |
| $ | 46 |
| $ | 115 |
| $ | 14 |
| Gain (loss) on sale of investment securities |
Income tax effect |
|
| (10) |
|
| (24) |
|
| (3) |
| Provision for income taxes |
Total reclassifications for the period |
| $ | 36 |
| $ | 91 |
| $ | 11 |
| Net income |
| | | | | | | | | | |
| | | | | | | | | | |
Details about accumulated other | | | | | | | | | | |
comprehensive income components | Amount reclassified from accumulated | | Affected line item in the statement |
(dollars in thousands) | other comprehensive income | | where net income is presented |
| | | | | | |
| Years ended December 31, | | |
| 2018 | | 2017 | | 2016 | | |
| | | | | | | | | | |
Unrealized gains on AFS debt securities | $ | 10 | | $ | (147) | | $ | 9 | | Gain (loss) on sale of investment securities |
Income tax effect | | (2) | | | 50 | | | (3) | | Provision for income taxes |
Total reclassifications for the period | $ | 8 | | $ | (97) | | $ | 6 | | Net income |
4.INVESTMENT SECURITIES
Agency – Government-sponsored enterprise (GSE) and MBSMortgage-backed securities (MBS) - GSE residential
Agency – GSE and MBS – GSE residential securities consist of short- to long-term notes issued by Federal Home Loan Mortgage Corporation (FHLMC), FNMA, FHLB and Government National Mortgage Association (GNMA). These securities have interest rates that are fixed and adjustable, have varying short to long-term maturity dates and have contractual cash flows guaranteed by the U.S. government or agencies of the U.S. government.
Obligations of states and political subdivisions (municipal)
The municipal securities are bank qualified or bank eligible, general obligation and revenue bonds rated as investment grade by various credit rating agencies and have fixed rates of interest with mid- to long-term maturities. Fair values of these securities are highly driven by interest rates. Management performs ongoing credit quality reviews on these issues.
Amortized cost and fair value of investment securities as of the period indicated are as follows:
| | | | | | | | |
|
|
|
|
|
|
|
|
| | | | | | | | |
|
|
|
|
|
|
|
|
| | | | Gross | | Gross | | | |
|
|
| Gross |
| Gross |
|
|
|
| | Amortized | | unrealized | | unrealized | | Fair |
| Amortized |
| unrealized |
| unrealized |
| Fair |
(dollars in thousands) | | cost | | gains | | losses | | value |
| cost |
| gains |
| losses |
| value |
December 31, 2018 | | | | | | | | | | | | |
December 31, 2021 | |
|
|
|
|
|
|
|
|
|
|
|
Available-for-sale debt securities: | | | | | | | | |
|
|
|
|
|
|
|
|
Agency - GSE | | $ | 5,926 | | $ | 8 | | $ | (17) | | $ | 5,917 |
| $ | 119,399 |
| $ | 204 |
| $ | (2,600) |
| $ | 117,003 |
Obligations of states and political subdivisions | | 51,603 | | 1,259 | | (287) | | 52,575 |
| 360,680 |
| 6,708 |
| (2,678) |
| 364,710 |
MBS - GSE residential | | 126,667 | | 266 | | (2,615) | | 124,318 |
| 258,674 |
| 1,654 |
| (3,061) |
| 257,267 |
| | | | | | | | |
|
|
|
|
|
|
|
|
Total available-for-sale debt securities | | $ | 184,196 | | $ | 1,533 | | $ | (2,919) | | $ | 182,810 |
| $ | 738,753 |
| $ | 8,566 |
| $ | (8,339) |
| $ | 738,980 |
| | | | | | | | |
|
|
|
|
|
|
|
|
| | | | | | | | | | | | |
| | | | | | | | | | | | |
| | | | | Gross | | Gross | | | |
| | Amortized | | unrealized | | unrealized | | Fair |
(dollars in thousands) | | cost | | gains | | losses | | value |
December 31, 2017 | | | | | | | | | | | | |
Available-for-sale securities: | | | | | | | | | | | | |
Agency - GSE | | $ | 9,120 | | $ | 3 | | $ | (24) | | $ | 9,099 |
Obligations of states and political subdivisions | | | 42,300 | | | 2,036 | | | (30) | | | 44,306 |
MBS - GSE residential | | | 103,386 | | | 519 | | | (753) | | | 103,152 |
| | | | | | | | | | | | |
Total debt securities | | | 154,806 | | | 2,558 | | | (807) | | | 156,557 |
| | | | | | | | | | | | |
Equity securities - financial services | | | 294 | | | 534 | | | - | | | 828 |
| | | | | | | | | | | | |
Total available-for-sale securities | | $ | 155,100 | | $ | 3,092 | | $ | (807) | | $ | 157,385 |
|
|
|
|
|
|
|
|
|
|
|
|
|
|
|
|
|
|
|
|
|
|
|
|
|
|
|
|
|
|
| Gross |
| Gross |
|
|
|
|
| Amortized |
| unrealized |
| unrealized |
| Fair |
(dollars in thousands) |
| cost |
| gains |
| losses |
| value |
December 31, 2020 |
|
|
|
|
|
|
|
|
|
|
|
|
Available-for-sale debt securities: |
|
|
|
|
|
|
|
|
|
|
|
|
Agency - GSE |
| $ | 45,146 |
| $ | 392 |
| $ | (91) |
| $ | 45,447 |
Obligations of states and political subdivisions |
|
| 192,385 |
|
| 7,480 |
|
| (152) |
|
| 199,713 |
MBS - GSE residential |
|
| 143,557 |
|
| 3,881 |
|
| (178) |
|
| 147,260 |
|
|
|
|
|
|
|
|
|
|
|
|
|
Total available-for-sale debt securities |
| $ | 381,088 |
| $ | 11,753 |
| $ | (421) |
| $ | 392,420 |
|
|
|
|
|
|
|
|
|
|
|
|
|
The Company adopted ASU 2016-01, Financial Instruments – Overall (Topic 825-10): Recognition and Measurement of Financial Assets and Financial Liabilities effective January 1, 2018. The Company sold all of its equity securities during the first half of 2018.
Some of the Company’s debt securities are pledged to secure trust funds, public deposits, repurchase agreements, other short-term borrowings, FHLB advances, Federal Reserve Bank of Philadelphia Discount Window borrowings and certain other deposits as required by law.
The amortized cost and fair value of debt securities at December 31, 20182021 by contractual maturity are shown below:
| | | | | |
|
|
|
|
|
| | | |
|
|
|
| | Amortized | | Fair |
| Amortized |
| Fair |
(dollars in thousands) | | cost | | value |
| cost |
| value |
Available-for-sale securities: | | | | | |
|
|
|
|
|
Debt securities: | | | | | |
|
|
|
|
|
Due in one year or less | | $ | 9,287 | | $ | 9,339 |
| $ | 1,990 |
| $ | 2,022 |
Due after one year through five years | | | 7,958 | | 8,067 |
|
| 13,653 |
| 13,742 |
Due after five years through ten years | | | 3,582 | | 3,592 |
|
| 115,223 |
| 112,659 |
Due after ten years | | | 36,702 | | 37,494 |
|
| 349,213 |
| 353,290 |
| | | | | |
|
|
|
|
|
MBS - GSE residential | | | 126,667 | | 124,318 |
|
| 258,674 |
| 257,267 |
| | | | | |
|
|
|
|
|
Total available-for-sale debt securities | | $ | 184,196 | | $ | 182,810 |
| $ | 738,753 |
| $ | 738,980 |
Actual maturities will differ from contractual maturities because issuers and borrowers may have the right to call or repay obligations with or without call or prepayment penalty. Agency – GSE and municipal securities are included based on their original stated maturity. MBS – GSE residential, which are based on weighted-average lives and subject to monthly principal pay-downs, are listed in total. Most of the securities have fixed rates or have predetermined scheduled rate changes and many have call features that allow the issuer to call the security at par before its stated maturity without penalty.
Gross realized gains and losses from sales, determined using specific identification, for the periods indicated were as follows:
| | | | | | |
|
|
|
|
|
|
| December 31, | December 31, |
(dollars in thousands) | 2018 | | 2017 | | 2016 | 2021 |
| 2020 |
| 2019 |
| | | | | | |
|
|
|
|
|
|
Gross realized gain | $ | 114 | | $ | - | | $ | 16 | $ | 98 |
| $ | 147 |
| $ | 104 |
Gross realized loss | | (60) | | (147) | | (7) |
| (52) |
| (32) |
| (90) |
Net gain | $ | 54 | | $ | (147) | | $ | 9 | $ | 46 |
| $ | 115 |
| $ | 14 |
| | | | | | |
|
|
|
|
|
|
The following table presents the fair value and gross unrealized losses of investments aggregated by investment type, the length of time and the number of securities that have been in a continuous unrealized loss position as of the period indicated:
| | | | | | | | | | | | |
|
|
|
|
|
|
|
|
|
|
|
|
| | | | | | | | | | | | |
|
|
|
|
|
|
|
|
|
|
|
|
| | Less than 12 months | | More than 12 months | | Total |
| Less than 12 months |
| More than 12 months |
| Total |
| | Fair | | Unrealized | | Fair | | Unrealized | | Fair | | Unrealized |
| Fair |
| Unrealized |
| Fair |
| Unrealized |
| Fair |
| Unrealized |
(dollars in thousands) | | value | | losses | | value | | losses | | value | | losses |
| value |
| losses |
| value |
| losses |
| value |
| losses |
| | | | | | | | | | | | | | | |
|
|
|
|
|
|
|
|
|
|
|
|
|
|
|
December 31, 2018 | | | | | | | | | | | | | | | | |
December 31, 2021 | |
|
|
|
|
|
|
|
|
|
|
|
|
|
|
|
Agency - GSE | | $ | 3,937 | | $ | (17) | | $ | | | $ | - | | $ | 3,937 | | $ | (17) |
| $ | 84,308 |
| $ | (1,460) |
| $ | 26,516 |
| $ | (1,140) |
| $ | 110,824 |
| $ | (2,600) |
Obligations of states and political subdivisions | | 6,123 | | (91) | | 8,447 | | (196) | | 14,570 | | (287) |
| 193,124 |
| (2,662) |
| 12,796 |
| (399) |
| 205,920 |
| (3,061) |
MBS - GSE residential | | 25,612 | | (353) | | 74,864 | | (2,262) | | 100,476 | | (2,615) |
| 137,495 |
| (2,351) |
| 9,469 |
| (327) |
| 146,964 |
| (2,678) |
Total | | $ | 35,672 | | $ | (461) | | $ | 83,311 | | $ | (2,458) | | $ | 118,983 | | $ | (2,919) |
| $ | 414,927 |
| $ | (6,473) |
| $ | 48,781 |
| $ | (1,866) |
| $ | 463,708 |
| $ | (8,339) |
Number of securities | | 31 | | | | 69 | | | | 100 | | |
| 187 |
|
|
| 26 |
|
|
| 213 |
|
|
| | | | | | | | | | | | | | | |
|
|
|
|
|
|
|
|
|
|
|
|
|
|
|
December 31, 2017 | | | | | | | | | | | | | | | | |
December 31, 2020 | |
|
|
|
|
|
|
|
|
|
|
|
|
|
|
|
Agency - GSE | | $ | 6,020 | | $ | (14) | | $ | 1,008 | | $ | (10) | | $ | 7,028 | | $ | (24) |
| $ | 27,602 |
| $ | (91) |
| $ | - |
| $ | - |
| $ | 27,602 |
| $ | (91) |
Obligations of states and political subdivisions | | 425 | | (1) | | 2,109 | | (29) | | 2,534 | | (30) |
| 15,256 |
| (152) |
| - |
| - |
| 15,256 |
| (152) |
MBS - GSE residential | | 61,349 | | (437) | | 15,309 | | (316) | | 76,658 | | (753) |
| 14,753 |
| (178) |
| - |
| - |
| 14,753 |
| (178) |
Total | | $ | 67,794 | | $ | (452) | | $ | 18,426 | | $ | (355) | | $ | 86,220 | | $ | (807) |
| $ | 57,611 |
| $ | (421) |
| $ | - |
| $ | - |
| $ | 57,611 |
| $ | (421) |
Number of securities | | 45 | | | | 14 | | | | 59 | | |
| 30 |
|
|
| - |
|
|
| 30 |
|
|
| | | | | | | | | | | | |
|
|
|
|
|
|
|
|
|
|
|
|
The Company had 100213 debt securities in an unrealized loss position at December 31, 2018,2021, including four44 agency securities, sixty-eight61 mortgage-backed securities and twenty-eight108 municipal securities. The severity of these unrealized losses based on their underlying cost basis was as follows at December 31, 2018: 0.44%2021: 2.29% for agencies; 2.54%agency - GSE, 1.46% for total MBS-GSE;MBS-GSE residential; and
1.93% 1.79% for municipals. Of26 of these securities, fifty-four mortgage-backed securities and fifteen municipal securities had been in an unrealized loss position in excess of 12 months. The changes in the prices on theseManagement has no intent to sell any securities in an unrealized loss position in excessas of 12 months are the result of interest rate movement and management believes they are temporary in nature.December 31, 2021.
Management believes the cause of the unrealized losses is related to changes in interest rates, instability in the capital markets or the limited trading activity due to illiquid conditions in the debt market and is not directly related to credit quality. Quarterly, management conducts a formal review of investment securities for the presence of other than temporary impairment (OTTI). The accounting guidance related to OTTI requires the Company to assess whether OTTI is present when the fair value of a debt security is less than its amortized cost as of the balance sheet date. Under those circumstances, OTTI is considered to have occurred if: (1) the entity has the intent to sell the security; (2) more likely than not the entity will be required to sell the security before recovery of its amortized cost basis; or (3) the present value of expected cash flows is not sufficient to recover the entire amortized cost. The accounting guidance requires that credit-related OTTI be recognized in earnings while non-credit-related OTTI on securities not expected to be sold be recognized in other comprehensive income (OCI). Non-credit-related OTTI is based on other factors affecting market value, including illiquidity.
The Company’s OTTI evaluation process also follows the guidance set forth in topics related to debt securities. The guidance set forth in the pronouncements require the Company to take into consideration current market conditions, fair value in relationship to cost, extent and nature of changes in fair value, issuer rating changes and trends, volatility of earnings, current analysts’ evaluations, all available information relevant to the collectability of debt securities, the ability and intent to hold investments until a recovery of fair value which may be to maturity and other factors when evaluating for the existence of OTTI. The guidance requires that credit-related OTTI be recognized as a realized loss through earnings when there has been an adverse change in the holder’s expected cash flows such that the full amount (principal and interest) will probably not be received. This requirement is consistent with the impairment model in the guidance for accounting for debt securities.
For all debt securities, as of December 31, 2018,2021, the Company applied the criteria provided in the recognition and presentation guidance related to OTTI. That is, management has no intent to sell the securities and nor any conditions were identified by management that, more likely than not, would require the Company to sell the securities before recovery of their amortized cost basis. The results indicated there was no presence of OTTI in the Company’s security portfolio. In addition, management believes the change in fair value is attributable to changes in interest rates.
5.LOANS AND LEASES
The classifications of loans and leases at December 31, 20182021 and 20172020 are summarized as follows:
| | | | |
|
|
|
|
| | |
|
|
(dollars in thousands) | 2018 | | 2017 | December 31, 2021 |
| December 31, 2020 |
| | | | | |
Commercial and industrial | $ | 126,884 | | $ | 113,601 | $ | 236,304 |
| $ | 280,757 |
Commercial real estate: | | | | |
|
|
|
|
|
Non-owner occupied | | 95,515 | | 92,851 |
| 312,848 |
| 192,143 |
Owner occupied | | 124,092 | | 109,383 |
| 248,755 |
| 179,923 |
Construction | | 6,761 | | 6,228 |
| 21,147 |
| 10,231 |
Consumer: | | | | |
|
|
|
|
Home equity installment | | 32,729 | | 27,317 |
| 47,571 |
| 40,147 |
Home equity line of credit | | 52,517 | | 53,273 |
| 54,878 |
| 49,725 |
Auto loans and leases | | 111,496 | | 83,510 | |
Auto loans | |
| 118,029 |
| 98,386 |
Direct finance leases | |
| 26,232 |
| 20,095 |
Other | | 6,314 | | 5,604 |
| 8,013 |
| 7,602 |
Residential: | | | | |
|
|
|
|
Real estate | | 145,951 | | 136,901 |
| 325,861 |
| 218,445 |
Construction | | 15,749 | | 9,931 |
| 34,919 |
| 23,357 |
Total | | 718,008 | | 638,599 |
| 1,434,557 |
| 1,120,811 |
Less: | | | | |
|
|
|
|
Allowance for loan losses | | (9,747) | | (9,193) |
| (15,624) |
| (14,202) |
Unearned lease revenue | | (1,028) | | (639) |
| (1,429) |
| (1,159) |
| | | | | |
Loans and leases, net | $ | 707,233 | | $ | 628,767 | $ | 1,417,504 |
| $ | 1,105,450 |
NetAs of December 31, 2021, total loans of $1.4 billion were reflected net of deferred loan costs of $2.6$3.0 million, including $1.2 million in deferred fee income from Paycheck Protection Program (PPP) loans and $2.1$4.2 million have beenin deferred loan costs. As of December 31, 2020, total loans of $1.1 billion were reflected net of deferred loan costs of $1.7 million, including $2.2 million in deferred fee income from PPP loans and $3.9 million in deferred loan costs.
Commercial and industrial (C&I) loan balances were $237.6 million at December 31, 2021 and $280.8 million on December 31, 2020. As of December 31, 2021, the commercial and industrial loan balance included $39.9 million in PPP loans (net of deferred fees), including $7.9 million in PPP loans acquired from Landmark, compared to $129.9 million as of December 31, 2020. Excluding PPP loans, the carrying valuesbalance of C&I loans at December 31, 20182021 increased $46.9 million primarily from loans acquired from Landmark during the third quarter of 2021.
Direct finance leases include the lease receivable and 2017, respectively.
the guaranteed lease residual. Unearned lease revenue represents the difference between the lessor’s investment in the property and the gross investment in the lease. Unearned revenue is accrued over the life of the lease using the effective interest method. The residual value of leases is fully guaranteed by the dealership. Residual values, a component of other assets on the balance sheet, amounted to $11.1 million and $9.4 million at December 31, 2018 and 2017, respectively.
The Company services real estate loans for investors in the secondary mortgage market which are not included in the accompanying consolidated balance sheets. The approximate unpaid principal balance of mortgages serviced for others amounted to $304.9$430.9 million as of December 31, 20182021 and $299.3$366.5 million as of December 31, 2017.2020. Mortgage servicing rights amounted to $1.1$1.7 million and $1.3 million as of December 31, 20182021 and 2017,2020, respectively.
Management is responsible for conducting the Company’s credit risk evaluation process, which includes credit risk grading of individual commercial and industrial and commercial real estate loans. Commercial and industrial and commercial real estate loans are assigned credit risk grades based on the Company’s assessment of conditions that affect the borrower’s ability to meet its contractual obligations under the loan agreement. That process includes reviewing borrowers’ current financial information, historical payment experience, credit documentation, public information and other information specific to each individual borrower. Upon review, the commercial loan credit risk grade is revised or reaffirmed as the case may be.reaffirmed. The credit risk grades may be changed at any time management feels an upgrade or downgrade may be warranted. The Company utilizes an external independent loan review firm that reviews and validates the credit risk program on at least an annual basis. Results of these reviews are presented to management and the board of directors. The loan review process complements and reinforces the risk identification and assessment decisions made by lenders and credit personnel, as well as the Company’s policies and procedures.
Paycheck Protection Program Loans
The Coronavirus Aid, Relief, and Economic Security Act, or CARES Act, was signed into law on March 27, 2020, and provided over $2.0 trillion in emergency economic relief to individuals and businesses impacted by the COVID-19 pandemic. The CARES Act authorized the Small Business Administration (SBA) to temporarily guarantee loans under a new 7(a) loan program called the Paycheck Protection Program (PPP).
As a qualified SBA lender, the Company was automatically authorized to originate PPP loans. The SBA guaranteed 100% of the PPP loans made to eligible borrowers. The entire principal amount of the borrowers’ PPP loan, including any accrued interest, is eligible to be reduced by the loan forgiveness amount under the PPP.
On December 27, 2020, the Economic Aid to Hard-Hit Small Businesses, Nonprofits, and Venues Act (Economic Aid Act) was enacted, extending the authority to make PPP loans through May 31, 2021, revising certain PPP requirements, and permitting second draw PPP loans. On March 11, 2021, the American Rescue Plan Act of 2021 (American Rescue Plan Act) was enacted expanding eligibility for first and second draw PPP loans and revising the exclusions from payroll costs for purposes of loan forgiveness.
Acquired loans
Acquired loans are marked to fair value on the date of acquisition. For detailed information on calculating the fair value of acquired loans, see Footnote 20, “Acquisition.”
The carryover of allowance for loan losses related to acquired loans is prohibited as any credit losses in the loans are included in the determination of the fair value of the loans at the acquisition date. The allowance for loan losses on acquired loans reflects only those losses incurred after acquisition and represents the present value of cash flows expected at acquisition that is no longer expected to be collected.
The Company reported provisional fair value adjustments regarding the acquired Landmark loan portfolio. Therefore, the Company did not record an allowance on the acquired non-purchased credit impaired loans. In conjunction with the quarterly evaluation of the adequacy of the allowance for loan losses, the Company performs an analysis on acquired loans to determine whether there has been subsequent deterioration in relation to those loans. If deterioration has occurred, the Company will include these loans in the calculation of the allowance for loan losses after the initial valuation and provide reserves accordingly.
Upon acquisition, in accordance with U.S. GAAP, the Company has individually determined whether each acquired loan is within the scope of ASC 310-30 deemed as purchased credit impaired (PCI). As part of this process, the Company’s senior management and other relevant individuals reviewed the seller’s loan portfolio on a loan-by-loan basis to determine if any loans met the two-part definition of an impaired loan as defined by ASC 310-30: 1) Credit deterioration on the loan from its inception until the acquisition date, and 2) It is probable that not all contractual cash flows will be collected on the loan.
With regards to ASC 310-30 loans, for external disclosure purposes, the aggregate contractual cash flows less the aggregate expected cash flows result in a credit related non-accretable yield amount. The aggregate expected cash flows less the acquisition date fair value result in an accretable yield amount. The accretable yield reflects the contractual cash flows management expects to collect above the loan's acquisition date fair value and will be recognized over the life of the loan on a level-yield basis as a component of interest income.
Over the life of the acquired ASC 310-30 loan, the Company continues to estimate cash flows expected to be collected. Decreases in expected cash flows, other than from prepayments or rate adjustments, are recognized as impairments through a charge to the provision for credit losses resulting in an increase in the allowance for credit losses. Subsequent improvements in cash flows result in first, reversal of existing valuation allowances recognized after acquisition, if any, and next, an increase in the amount of accretable yield to be subsequently recognized on a prospective basis over the loan’s remaining life.
Acquired ASC 310-30 loans that met the criteria for non-accrual of interest prior to acquisition are considered performing upon acquisition, regardless of whether the customer is contractually delinquent, if the Company can reasonably estimate the timing and amount of expected cash flows on such loans. Accordingly, the Company does not consider acquired contractually delinquent loans to be non-accruing and continues to recognize accretable yield on these loans which is recognized as interest income on a level yield method over the life of the loan.
Acquired ASC 310-20 loans, which are loans that did not meet the criteria above, were pooled into groups of similar loans based on various factors including borrower type, loan purpose, and collateral type. For these pools, the Company used certain loan information, including outstanding principal balance, estimated expected losses, weighted average maturity, weighted average margin, and weighted average interest rate along with estimated prepayment rates, expected lifetime losses, and environment factors to estimate the expected cash flow for each loan pool.
Within the ASC 310-20 loans, the Company identified certain loans that have higher risk. Although performing at the time of acquisition and likely will continue making payments in accordance with contractual terms, management elected a higher credit adjustment on these loans to reflect the greater inherent risk that the borrower will default on payments. Risk factors used to identify these loans included: loans that received COVID-19 related forbearance consistent with the regulatory guidance, loans that were in industries determined to be at greater risk to economic disruption due to COVID-19, loans that had a prior history of delinquency greater than 60 days at any point in the lifetime of the loan; loans with a Special Mention or Substandard risk rating; and/or loans borrowers in the Gasoline Station industry due to the environmental risk potential of these loans.
The following table provides changes in accretable yield for all acquired loans accounted for under ASC 310-30. Loans accounted for under ASC 310-20 are not included in this table.
|
|
|
|
|
|
|
|
|
|
|
|
| For the years ended |
(dollars in thousands) | December 31, 2021 |
| December 31, 2020 |
Balance at beginning of period | $ | 563 |
| $ | - |
Accretable yield on acquired loans |
| 589 |
|
| 248 |
Reclassification from non-accretable difference |
| 453 |
|
| 429 |
Accretion of accretable yield |
| (517) |
|
| (114) |
Balance at end of period | $ | 1,088 |
| $ | 563 |
|
|
|
|
|
|
The above table excludes the $275 thousand in non-accretable yield accreted to interest income for the year ended December 31, 2021 and $10 thousand in non-accretable yield accreted to interest income for the year ended December 31, 2020.
During the twelve months ended December 31, 2021, management performed an analysis of all loans acquired from mergers, consistent with and applicable to ASC 310-30 (Purchased Credit Impaired loans – PCI). The accretable yield balance increased from $563 thousand at December 31, 2020 to $1,088 thousand at December 31, 2021. The $525 thousand increase resulted from $589 thousand in accretable yield on loans acquired from the Landmark merger during the third quarter of 2021; $453 thousand reclassified from non-accretable yield to accretable yield including $167 thousand from improved collateral values and $286 thousand from payments received on PCI in excess of estimates; and $517 thousand in accretable yield accreted to interest income due to contractual payments received during the twelve months ended December 31, 2021.
Expected cash flows on acquired loans are estimated quarterly by incorporating several key assumptions. These key assumptions include probability of default and the number of actual prepayments after the acquisition date. Prepayments affect the estimated life of the loans and could change the amount of interest income, and possibly principal expected to be collected. In reforecasting future estimated cash flows, credit loss expectations are adjusted as necessary. Improved cash flow expectations for loans or pools are recorded first as a reversal of previously recorded impairment, if any, and then as an increase in prospective yield when all previously recorded impairment has been recaptured.
Non-accrual loans
Non-accrual loans, segregated by class, at December 31, were as follows:
|
|
|
|
|
|
|
|
(dollars in thousands) | December 31, 2021 |
| December 31, 2020 |
Commercial and industrial | $ | 154 |
| $ | 590 |
Commercial real estate: |
|
|
|
|
|
Non-owner occupied |
| 478 |
|
| 846 |
Owner occupied |
| 1,570 |
|
| 1,123 |
Consumer: |
|
|
|
|
|
Home equity installment |
| - |
|
| 61 |
Home equity line of credit |
| 97 |
|
| 395 |
Auto loans |
| 78 |
|
| 27 |
Residential: |
|
|
|
|
|
Real estate |
| 572 |
|
| 727 |
Total | $ | 2,949 |
| $ | 3,769 |
The table above excludes $4.7 million and $1.3 million in purchased credit impaired loans, net of unamortized fair value adjustments as of December 31, 2021 and 2020, respectively.
The decision to place loans on non-accrual status is made on an individual basis after considering factors pertaining to each specific loan. C&I and CRE loans are placed on non-accrual status when management has determined that payment of all contractual principal and interest is in doubt or the loan is past due 90 days or more as to principal and interest, unless well-secured and in the process of collection. Consumer loans secured by real estate and residential mortgage loans are placed on non-accrual status at 12090 days past due as to principal and interest and unsecured consumer loans are charged-off when the loan is 90 days or more past due as to principal and interest. The Company considers all non-accrual loans to be impaired loans.
Non-accrual loans, segregated by class, at December 31, were as follows:
| | | | | |
| |
(dollars in thousands) | 2018 | | 2017 |
| | | | | |
Commercial and industrial | $ | 156 | | $ | 36 |
Commercial real estate: | | | | | |
Non-owner occupied | | 472 | | | 649 |
Owner occupied | | 1,634 | | | 942 |
Construction | | - | | | 161 |
Consumer: | | | | | |
Home equity installment | | 463 | | | 15 |
Home equity line of credit | | 34 | | | 559 |
Auto loans and leases | | 25 | | | 5 |
Residential: | | | | | |
Real estate | | 1,514 | | | 1,074 |
Total | $ | 4,298 | | $ | 3,441 |
Troubled Debt Restructuring
A modification of a loan constitutes a TDR when a borrower is experiencing financial difficulty and the modification constitutes a concession. The Company considers all TDRs to be impaired loans. The Company typically considers the following concessions when modifying a loan, which may include lowering interest rates below the market rate, temporary interest-only payment periods, term extensions at interest rates lower than the current market rate for new debt with similar risk and/or converting revolving credit lines to term loans. The Company typically does not consider forgiveness offorgive principal when granting a TDR modification.
Consistent with Section 4013 and the Revised Statement of Section 4013 of the CARES Act, specifically “Temporary Relief From Troubled Debt Restructurings”, the Company approved requests by borrowers to modify loan terms and defer principal and/or interest payment for loans. U.S. GAAP permits the suspension of TDR determination defined under ASC 310-40 provided that such modifications are made on a good faith basis in response to COVID-19 to borrowers who were current prior to any relief. This includes short-term (i.e. six months) modifications such as payment deferrals, fee waivers, extensions of repayment terms, or delays in payment that are insignificant. Borrowers considered current for purposes of Section 4013 are those that are less than 30 days past due on their contractual payments at the time the modification program is implemented.
Beginning the week of March 16, 2020, the Company began receiving requests for temporary modifications to the repayment structure for borrower loans. Modification terms included interest only or full payment deferral for up to 6 months. As of December 31, 2021, the Company had 0 temporary modifications outstanding compared to 10 temporary modifications with principal balances totaling $2.2 million as of December 31, 2020.
The following presents by class, information related to loans modified in a TDR:
|
|
|
|
|
|
|
|
|
|
|
|
|
|
|
|
|
| Loans modified as TDRs for the twelve months ended: |
(dollars in thousands) | December 31, 2021 |
| December 31, 2020 |
|
|
|
|
|
|
|
|
|
|
|
|
|
|
|
|
|
|
|
|
| Recorded |
| Increase in |
|
|
| Recorded |
| Increase in |
|
| Number |
| investment |
| allowance |
| Number |
| investment |
| allowance |
|
| of |
| (as of |
| (as of |
| of |
| (as of |
| (as of |
|
| contracts |
| period end) |
| period end) |
| contracts |
| period end) |
| period end) |
Commercial and industrial |
| - |
| $ | - |
| $ | - |
| 2 |
| $ | 206 |
| $ | 66 |
Commercial real estate - non-owner occupied |
| - |
|
| - |
|
| - |
| 2 |
|
| 1,598 |
|
| 453 |
Commercial real estate - owner occupied |
| 1 |
|
| 512 |
|
| - |
| - |
|
| - |
|
| - |
Total |
| 1 |
| $ | 512 |
| $ | - |
| 4 |
| $ | 1,804 |
| $ | 519 |
|
|
|
|
|
|
|
|
|
|
|
|
|
|
|
|
|
In the above table, the period end balance is inclusive of all partial pay downs and charge-offs since the modification date. For all loans modified in a TDR, the pre-modification recorded investment was the same as the post-modification recorded investment.
Of the TDRs outstanding as of December 31, 20182021 and 2017,2020, when modified, the concessions granted consisted of temporary interest-only payments, extensions of maturity date, or a reduction in the rate of interest to a below-market rate for a contractual period of time. Other than the TDRs that were placed on non-accrual status, the TDRs were performing in accordance with their modified terms.
The following presents by class, information related to loans modified in a TDR:
| | | | | | | | | | | | | | | | |
| Loans modified as TDRs for the twelve months ended: |
(dollars in thousands) | December 31, 2018 | | December 31, 2017 |
| | | | | | | | | | | | | | | | |
| | | | Recorded | | Increase in | | | | Recorded | | Increase in |
| | Number | | investment | | allowance | | Number | | investment | | allowance |
| | of | | (as of | | (as of | | of | | (as of | | (as of |
| | contracts | | period end) | | period end) | | contracts | | period end) | | period end) |
Commercial real estate - non-owner occupied | | - | | $ | - | | $ | - | | 1 | | $ | 118 | | $ | 7 |
Commercial real estate - owner occupied | | - | | | - | | | - | | 5 | | | 924 | | | 332 |
Consumer home equity installment | | 1 | | | 413 | | | 356 | | - | | | - | | | - |
Residential real estate | | 1 | | | 316 | | | - | | - | | | - | | | - |
Total | | 2 | | $ | 729 | | $ | 356 | | 6 | | $ | 1,042 | | $ | 339 |
| | | | | | | | | | | | | | | | |
In the above table, the period end balance is inclusive of all partial pay downs and charge-offs since the modification date. For all loans modified in a TDR, the pre-modification recorded investment was the same as the post-modification recorded investment.
The following presents by class, loans modified as a TDR that subsequently defaulted (i.e. 90 days or more past due following a modification) during the periods indicated:
| | | | | | | | | | | |
Loans modified as a TDR within the previous twelve months that subsequently defaulted during the twelve months ended: |
(dollars in thousands) | December 31, 2018 | | December 31, 2017 |
| | | | | | | | | | | |
| | Number of | | | Recorded | | | Number of | | | Recorded |
| | contracts | | | investment | | | contracts | | | investment |
Consumer home equity installment | | 1 | | $ | 413 | | | - | | $ | - |
Residential real estate | | 1 | | | 316 | | | - | | | - |
Total | | 2 | | $ | 729 | | | - | | $ | - |
| | | | | | | | | | | |
In the above table, the period end balances are inclusive of all partial pay downs and charge-offs since the modification date.
Loans modified in a TDR are closely monitored for delinquency as an early indicator of possible future default. If loans modified in a TDR subsequently default, the Company evaluates the loan for possible further impairment.
The following presents by class, loans modified as a TDR that subsequently defaulted (i.e. 90 days or more past due following a modification) during the periods indicated:
|
|
|
|
|
|
|
|
|
|
|
|
Loans modified as a TDR within the previous twelve months that subsequently defaulted during the twelve months ended: |
(dollars in thousands) | December 31, 2021 |
| December 31, 2020 |
|
|
|
|
|
|
|
|
|
|
|
|
|
| Number of |
|
| Recorded |
|
| Number of |
|
| Recorded |
|
| contracts |
|
| investment |
|
| contracts |
|
| investment |
Commercial and industrial |
| - |
| $ | - |
|
| 2 |
| $ | 206 |
Total |
| - |
| $ | - |
|
| 2 |
| $ | 206 |
|
|
|
|
|
|
|
|
|
|
|
|
In the above table, the period end balances are inclusive of all partial pay downs and charge-offs since the modification date.
The allowance for loan losses (allowance) may be increased, adjustments may be made in the allocation of the allowance or partial charge-offs may be taken to further write-down the carrying value of the loan. An allowance for impaired loans that have been modified in a TDR is measured based on the present value of expected future cash flows discounted at the loan’s effective interest rate or the loan’s observable market price. If the loan is collateral dependent, the estimated fair value of the collateral is used to establish the allowance.
As of December 31, 20182021 and 2017, respectively,2020, the balance of outstanding TDRs was $3.5 million and $3.2 million, respectively. As of December 31, 2021 and 2020, the allowance for impaired loans that have been modified in a TDR was $0.8$0.5 million and $0.4$0.7 million, respectively.
Past due loans
Loans are considered past due when the contractual principal and/or interest is not received by the due date. For loans reported 30-59 days past due, certain categories of loans are reported past due as and when the loan is in arrears for two payments or billing cycles. An aging analysis of past due loans, segregated by class of loans, as of the period indicated is as follows (dollars in thousands):
Table Of Contents
|
|
|
|
|
|
|
|
|
|
|
|
|
|
|
|
|
|
|
|
|
|
|
|
|
|
|
|
|
|
|
|
|
|
|
|
|
|
|
|
|
|
|
|
|
|
|
|
|
|
|
|
|
|
|
|
|
|
|
|
| Recorded |
|
|
|
|
|
|
| Past due |
|
|
|
|
|
|
|
|
| investment past |
| 30 - 59 Days |
| 60 - 89 Days |
| 90 days |
| Total |
|
|
|
| Total |
| due ≥ 90 days |
December 31, 2021 | past due |
| past due |
| or more (1) |
| past due |
| Current |
| loans (3) |
| and accruing |
|
|
|
|
|
|
|
|
|
|
|
|
|
|
|
|
|
|
|
|
|
Commercial and industrial | $ | - |
| $ | 4 |
| $ | 154 |
| $ | 158 |
| $ | 236,146 |
| $ | 236,304 |
| $ | - |
Commercial real estate: |
|
|
|
|
|
|
|
|
|
|
|
|
|
|
|
|
|
|
|
|
Non-owner occupied |
| - |
|
| 675 |
|
| 478 |
|
| 1,153 |
|
| 311,695 |
|
| 312,848 |
|
| - |
Owner occupied |
| - |
|
| - |
|
| 1,570 |
|
| 1,570 |
|
| 247,185 |
|
| 248,755 |
|
| - |
Construction |
| - |
|
| - |
|
| - |
|
| - |
|
| 21,147 |
|
| 21,147 |
|
| - |
Consumer: |
|
|
|
|
|
|
|
|
|
|
|
|
|
|
|
|
|
|
|
|
Home equity installment |
| 87 |
|
| 32 |
|
| - |
|
| 119 |
|
| 47,452 |
|
| 47,571 |
|
| - |
Home equity line of credit |
| - |
|
| - |
|
| 97 |
|
| 97 |
|
| 54,781 |
|
| 54,878 |
|
| - |
Auto loans |
| 410 |
|
| 45 |
|
| 78 |
|
| 533 |
|
| 117,496 |
|
| 118,029 |
|
| - |
Direct finance leases |
| 173 |
|
| 38 |
|
| 64 |
|
| 275 |
|
| 24,528 |
|
| 24,803 | (2) |
| 64 |
Other |
| 49 |
|
| 17 |
|
| - |
|
| 66 |
|
| 7,947 |
|
| 8,013 |
|
| - |
Residential: |
|
|
|
|
|
|
|
|
|
|
|
|
|
|
|
|
|
|
|
|
Real estate |
| - |
|
| 452 |
|
| 572 |
|
| 1,024 |
|
| 324,837 |
|
| 325,861 |
|
| - |
Construction |
| - |
|
| - |
|
| - |
|
| - |
|
| 34,919 |
|
| 34,919 |
|
| - |
Total | $ | 719 |
| $ | 1,263 |
| $ | 3,013 |
| $ | 4,995 |
| $ | 1,428,133 |
| $ | 1,433,128 |
| $ | 64 |
| | | | | | | | | | | | | | | | | | | | |
| | | | | | | | | | | | | | | | | | | | |
| | | | | | | | | | | | | | | | | | | Recorded |
| | | | | | | Past due | | | | | | | | | | investment past |
| 30 - 59 Days | | 60 - 89 Days | | 90 days | | Total | | | | | Total | | due ≥ 90 days |
December 31, 2018 | past due | | past due | | or more (1) | | past due | | Current | | loans (3) | | and accruing |
| | | | | | | | | | | | | | | | | | | | |
Commercial and industrial | $ | 1,711 | | $ | 135 | | $ | 156 | | $ | 2,002 | | $ | 124,882 | | $ | 126,884 | | $ | - |
Commercial real estate: | | | | | | | | | | | | | | | | | | | | |
Non-owner occupied | | 388 | | | 113 | | | 472 | | | 973 | | | 94,542 | | | 95,515 | | | - |
Owner occupied | | 263 | | | 513 | | | 1,634 | | | 2,410 | | | 121,682 | | | 124,092 | | | - |
Construction | | - | | | - | | | - | | | - | | | 6,761 | | | 6,761 | | | - |
Consumer: | | | | | | | | | | | | | | | | | | | | |
Home equity installment | | 50 | | | 182 | | | 463 | | | 695 | | | 32,034 | | | 32,729 | | | - |
Home equity line of credit | | 725 | | | 175 | | | 34 | | | 934 | | | 51,583 | | | 52,517 | | | - |
Auto loans and leases | | 331 | | | 86 | | | 25 | | | 442 | | | 110,026 | | | 110,468 | (2) | | - |
Other | | 79 | | | 10 | | | 1 | | | 90 | | | 6,224 | | | 6,314 | | | 1 |
Residential: | | | | | | | | | | | | | | | | | | | | |
Real estate | | 557 | | | 573 | | | 1,514 | | | 2,644 | | | 143,307 | | | 145,951 | | | - |
Construction | | - | | | - | | | - | | | - | | | 15,749 | | | 15,749 | | | - |
Total | $ | 4,104 | | $ | 1,787 | | $ | 4,299 | | $ | 10,190 | | $ | 706,790 | | $ | 716,980 | | $ | 1 |
(1) Includes $4.3 million of non-accrual loans. (2) Net of unearned lease revenue of $1.0$1.4 million. (3) Includes net deferred loan costs of $2.6$3.0 million.
| | | | | | | | | | | | | | |
|
|
|
|
|
|
|
|
|
|
|
|
|
|
| | | | | | | | | | | | | | |
|
|
|
|
|
|
|
|
|
|
|
|
|
|
| | | | | | | | | | | | | | | | | | | Recorded |
|
|
|
|
|
|
|
|
|
|
|
|
|
|
|
|
|
| Recorded |
| | | | | | | Past due | | | | | | | | | | investment past |
|
|
|
|
|
| Past due |
|
|
|
|
|
|
|
|
| investment past |
| 30 - 59 Days | | 60 - 89 Days | | 90 days | | Total | | | | | Total | | due ≥ 90 days | 30 - 59 Days |
| 60 - 89 Days |
| 90 days |
| Total |
|
|
|
| Total |
| due ≥ 90 days |
December 31, 2017 | past due | | past due | | or more (1) | | past due | | Current | | loans (3) | | and accruing | |
December 31, 2020 | | past due |
| past due |
| or more (1) |
| past due |
| Current |
| loans (3) |
| and accruing |
| | | | | | | | | | | | | | |
|
|
|
|
|
|
|
|
|
|
|
|
|
|
Commercial and industrial | $ | 286 | | $ | - | | $ | 36 | | $ | 322 | | $ | 113,279 | | $ | 113,601 | | $ | - | $ | 288 |
| 505 |
| 590 |
| 1,383 |
| 279,374 |
| 280,757 |
| - |
Commercial real estate: | | | | | | | | | | | | | | |
|
|
|
|
|
|
|
|
|
|
|
|
|
|
Non-owner occupied | | 51 | | 1,018 | | 649 | | 1,718 | | 91,133 | | 92,851 | | - |
| 79 |
| - |
| 846 |
| 925 |
| 191,218 |
| 192,143 |
| - |
Owner occupied | | 52 | | 85 | | 942 | | 1,079 | | 108,304 | | 109,383 | | - |
| 1 |
| - |
| 1,123 |
| 1,124 |
| 178,799 |
| 179,923 |
| - |
Construction | | - | | - | | 161 | | 161 | | 6,067 | | 6,228 | | - |
| - |
| - |
| - |
| - |
| 10,231 |
| 10,231 |
| - |
Consumer: | | | | | | | | | | | | | | |
|
|
|
|
|
|
|
|
|
|
|
|
|
|
Home equity installment | | 130 | | 30 | | 15 | | 175 | | 27,142 | | 27,317 | | - |
| 102 |
| - |
| 61 |
| 163 |
| 39,984 |
| 40,147 |
| - |
Home equity line of credit | | 276 | | - | | 559 | | 835 | | 52,438 | | 53,273 | | - |
| 24 |
| - |
| 395 |
| 419 |
| 49,306 |
| 49,725 |
| - |
Auto loans and leases | | 449 | | 85 | | 11 | | 545 | | 82,326 | | 82,871 | (2) | | 6 | |
Auto loans | |
| 197 |
| 25 |
| 27 |
| 249 |
| 98,137 |
| 98,386 |
| - |
Direct finance leases | |
| 294 |
| - |
| 61 |
| 355 |
| 18,581 |
| 18,936 | (2) |
| 61 |
Other | | 42 | | - | | - | | 42 | | 5,562 | | 5,604 | | - |
| 9 |
| - |
| - |
| 9 |
| 7,593 |
| 7,602 |
| - |
Residential: | | | | | | | | | | | | | | |
|
|
|
|
|
|
|
|
|
|
|
|
|
|
Real estate | | 38 | | 351 | | 1,074 | | 1,463 | | 135,438 | | 136,901 | | - |
| - |
| 74 |
| 727 |
| 801 |
| 217,644 |
| 218,445 |
| - |
Construction | | - | | - | | - | | - | | 9,931 | | 9,931 | | - |
| - |
| - |
| - |
| - |
| 23,357 |
| 23,357 |
| - |
Total | $ | 1,324 | | $ | 1,569 | | $ | 3,447 | | $ | 6,340 | | $ | 631,620 | | $ | 637,960 | | $ | 6 | $ | 994 |
| $ | 604 |
| $ | 3,830 |
| $ | 5,428 |
| $ | 1,114,224 |
| $ | 1,119,652 |
| $ | 61 |
(1) Includes $3.4 million of non-accrual loans. (2) Net of unearned lease revenue of $0.6$1.2 million. (3) Includes net deferred loan costs of $2.1$1.7 million.
Impaired loans
Impaired loans, segregated by class, as of the period indicated are detailed below:
|
|
|
|
|
|
|
|
|
|
|
|
|
|
|
|
|
|
|
|
|
|
|
|
|
|
|
|
|
|
|
|
|
| Recorded |
| Recorded |
|
|
|
|
|
|
| Unpaid |
| investment |
| investment |
| Total |
|
|
|
| principal |
| with |
| with no |
| recorded |
| Related |
(dollars in thousands) | balance |
| allowance |
| allowance |
| investment |
| allowance |
December 31, 2021 |
|
|
|
|
|
|
|
|
|
|
|
|
|
|
Commercial and industrial | $ | 218 |
| $ | 18 |
| $ | 136 |
| $ | 154 |
| $ | 18 |
Commercial real estate: |
|
|
|
|
|
|
|
|
|
|
|
|
|
|
Non-owner occupied |
| 2,470 |
|
| 1,674 |
|
| 796 |
|
| 2,470 |
|
| 474 |
Owner occupied |
| 3,185 |
|
| 1,802 |
|
| 762 |
|
| 2,564 |
|
| 763 |
Consumer: |
|
|
|
|
|
|
|
|
|
|
|
|
|
|
Home equity installment |
| 33 |
|
| - |
|
| - |
|
| - |
|
| - |
Home equity line of credit |
| 137 |
|
| - |
|
| 97 |
|
| 97 |
|
| - |
Auto loans |
| 98 |
|
| 10 |
|
| 68 |
|
| 78 |
|
| 4 |
Residential: |
|
|
|
|
|
|
|
|
|
|
|
|
|
|
Real estate |
| 699 |
|
| - |
|
| 572 |
|
| 572 |
|
| - |
Total | $ | 6,840 |
| $ | 3,504 |
| $ | 2,431 |
| $ | 5,935 |
| $ | 1,259 |
|
|
|
|
|
|
|
|
|
|
|
|
|
|
|
|
|
|
|
|
|
|
|
|
|
|
|
|
|
|
|
|
|
| Recorded |
| Recorded |
|
|
|
|
|
|
| Unpaid |
| investment |
| investment |
| Total |
|
|
|
| principal |
| with |
| with no |
| recorded |
| Related |
(dollars in thousands) | balance |
| allowance |
| allowance |
| investment |
| allowance |
December 31, 2020 |
|
|
|
|
|
|
|
|
|
|
|
|
|
|
Commercial and industrial | $ | 688 |
| $ | 549 |
| $ | 41 |
| $ | 590 |
| $ | 213 |
Commercial real estate: |
|
|
|
|
|
|
|
|
|
|
|
|
|
|
Non-owner occupied |
| 2,960 |
|
| 1,677 |
|
| 1,171 |
|
| 2,848 |
|
| 481 |
Owner occupied |
| 2,058 |
|
| 1,219 |
|
| 473 |
|
| 1,692 |
|
| 309 |
Consumer: |
|
|
|
|
|
|
|
|
|
|
|
|
|
|
Home equity installment |
| 106 |
|
| - |
|
| 61 |
|
| 61 |
|
| - |
Home equity line of credit |
| 443 |
|
| 105 |
|
| 290 |
|
| 395 |
|
| 48 |
Auto loans |
| 50 |
|
| 27 |
|
| - |
|
| 27 |
|
| 4 |
Residential: |
|
|
|
|
|
|
|
|
|
|
|
|
|
|
Real estate |
| 774 |
|
| 559 |
|
| 168 |
|
| 727 |
|
| 151 |
Total | $ | 7,079 |
| $ | 4,136 |
| $ | 2,204 |
| $ | 6,340 |
| $ | 1,206 |
At December 31, 2021, impaired loans totaled $5.9 million consisting of $3.0 million in accruing TDRs and $2.9 million in non-accrual loans. At December 31, 2020, impaired loans totaled $6.3 million consisting of $2.5 million in accruing TDRs and $3.8 million in non-accrual loans. As of December 31, 2021, the non-accrual loans included 3 TDRs to 2 unrelated borrowers totaling $0.6 million compared with 4 TDRs to 3 unrelated borrowers totaling $0.7 million as of December 31, 2020.
A loan is considered impaired when, based on current information and events; it is probable that the Company will be unable to collect the payments in accordance with the contractual terms of the loan. Factors considered in determining impairment include payment status, collateral value, and the probability of collecting payments when due. The significance of payment delays and/or shortfalls is determined on a case-by-case basis. All circumstances surrounding the loan are taken into account.considered. Such factors include the length of the delinquency, the underlying reasons and the borrower’s prior payment record. Impairment is measured on these loans on a loan-by-loan basis. Impaired loans include non-accrual loans, TDRs and other loans deemed to be impaired based on the aforementioned factors.
At December 31, 2018, impaired loans totaled $6.1 million consisting of $1.8 million in accruing TDRs and $4.3 million in non-accrual loans. At December 31, 2017, impaired loans totaled $6.9 million consisting of $1.9 million in accruing TDRs, $3.4 million in non-accrual loans and $1.6 million in accruing impaired loans. As of December 31, 2018, the non-accrual loans included four TDRs to three unrelated borrowers totaling $1.7 million compared with three TDRs totaling $1.6 million to three unrelated borrowers as of December 31, 2017.
Impaired loans, segregated by class, as of the period indicated are detailed below:
| | | | | | | | | | | | | | |
| | | | | | | | | | | | | | |
| | | | Recorded | | Recorded | | | | | | |
| Unpaid | | investment | | investment | | Total | | | |
| principal | | with | | with no | | recorded | | Related |
(dollars in thousands) | balance | | allowance | | allowance | | investment | | allowance |
December 31, 2018 | | | | | | | | | | | | | | |
Commercial and industrial | $ | 251 | | $ | 156 | | $ | 24 | | $ | 180 | | $ | 41 |
Commercial real estate: | | | | | | | | | | | | | | |
Non-owner occupied | | 1,176 | | | 715 | | | 269 | | | 984 | | | 36 |
Owner occupied | | 3,266 | | | 1,473 | | | 1,455 | | | 2,928 | | | 559 |
Construction | | - | | | - | | | - | | | - | | | - |
Consumer: | | | | | | | | | | | | | | |
Home equity installment | | 496 | | | 414 | | | 49 | | | 463 | | | 356 |
Home equity line of credit | | 74 | | | 33 | | | 1 | | | 34 | | | 16 |
Auto loans and leases | | 31 | | | 17 | | | 8 | | | 25 | | | 10 |
Other | | - | | | - | | | - | | | - | | | - |
Residential: | | | | | | | | | | | | | | |
Real estate | | 2,091 | | | 29 | | | 1,485 | | | 1,514 | | | 2 |
Construction | | - | | | - | | | - | | | - | | | - |
Total | $ | 7,385 | | $ | 2,837 | | $ | 3,291 | | $ | 6,128 | | $ | 1,020 |
| | | | | | | | | | | | | | |
| | | | | | | | | | | | | | |
| | | | Recorded | | Recorded | | | | | | |
| Unpaid | | investment | | investment | | Total | | | |
| principal | | with | | with no | | recorded | | Related |
(dollars in thousands) | balance | | allowance | | allowance | | investment | | allowance |
December 31, 2017 | | | | | | | | | | | | | | |
Commercial and industrial | $ | 281 | | $ | 225 | | $ | 24 | | $ | 249 | | $ | 196 |
Commercial real estate: | | | | | | | | | | | | | | |
Non-owner occupied | | 2,426 | | | 1,975 | | | 363 | | | 2,338 | | | 488 |
Owner occupied | | 2,742 | | | 1,768 | | | 725 | | | 2,493 | | | 433 |
Construction | | 384 | | | - | | | 161 | | | 161 | | | - |
Consumer: | | | | | | | | | | | | | | |
Home equity installment | | 48 | | | - | | | 15 | | | 15 | | | - |
Home equity line of credit | | 878 | | | 32 | | | 527 | | | 559 | | | 25 |
Auto | | 13 | | | - | | | 5 | | | 5 | | | - |
Other | | - | | | - | | | - | | | - | | | - |
Residential: | | | | | | | | | | | | | | |
Real estate | | 1,350 | | | 131 | | | 943 | | | 1,074 | | | 37 |
Construction | | - | | | - | | | - | | | - | | | - |
Total | $ | 8,122 | | $ | 4,131 | | $ | 2,763 | | $ | 6,894 | | $ | 1,179 |
The following table presents the average recorded investments in impaired loans and related amount of interest income recognized during the periods indicated below. The average balances are calculated based on the quarter-end balances of impaired loans. Payments received from non-accruing impaired loans are first applied against the outstanding principal balance, then to the recovery of any charged-off amounts. Any excess is treated as a recovery of interest income. Payments received from accruing impaired loans are applied to principal and interest, as contractually agreed upon.
| | | | | | | | | | | | |
|
|
|
|
|
|
|
|
|
|
|
|
| |
|
| December 31, 2018 | | December 31, 2017 | December 31, 2021 |
| December 31, 2020 |
| | | | | | Cash basis | | | | | | Cash basis |
|
|
|
|
| Cash basis |
|
|
|
|
| Cash basis |
| Average | | Interest | | interest | | Average | | Interest | | interest | Average |
| Interest |
| interest |
| Average |
| Interest |
| interest |
| recorded | | income | | income | | recorded | | income | | income | recorded |
| income |
| income |
| recorded |
| income |
| income |
(dollars in thousands) | investment | | recognized | | recognized | | investment | | recognized | | recognized | investment |
| recognized |
| recognized |
| investment |
| recognized |
| recognized |
| | | | | | | | | | | | | | | | | |
|
|
|
|
|
|
|
|
|
|
|
|
|
|
|
|
|
Commercial and industrial | $ | 192 | | $ | 2 | | $ | - | | $ | 231 | | $ | 10 | | $ | - | $ | 380 |
| $ | 2 |
| $ | - |
| $ | 404 |
| $ | 1 |
| $ | - |
Commercial real estate: | | | | | | | | | | | | |
|
|
|
|
|
|
|
|
|
|
|
|
Non-owner occupied | | 1,976 | | 98 | | - | | 2,907 | | 140 | | - |
| 2,698 |
| 195 |
| - |
| 1,939 |
| 96 |
| - |
Owner occupied | | 2,578 | | 77 | | - | | 3,832 | | 245 | | - |
| 1,883 |
| 55 |
| - |
| 1,848 |
| 48 |
| - |
Construction | | 107 | | 205 | | - | | 176 | | - | | - |
| - |
| - |
| - |
| - |
| - |
| - |
Consumer: | | | | | | | | | | | | |
|
|
|
|
|
|
|
|
|
|
|
|
Home equity installment | | 373 | | 5 | | - | | 15 | | - | | - |
| 28 |
| 6 |
| - |
| 53 |
| - |
| - |
Home equity line of credit | | 140 | | 10 | | - | | 682 | | 5 | | - |
| 202 |
| 20 |
| - |
| 368 |
| - |
| - |
Auto | | 31 | | 3 | | - | | 15 | | 4 | | - | |
Auto loans | |
| 42 |
| 2 |
| - |
| 51 |
| 2 |
| - |
Direct finance leases | |
| - |
| - |
| - |
| - |
| - |
| - |
Other | | 4 | | - | | - | | 2 | | 1 | | - |
| - |
| - |
| - |
| - |
| - |
| - |
Residential: | | | | | | | | | | | | |
|
|
|
|
|
|
|
|
|
|
|
|
Real estate | | 1,322 | | 37 | | - | | 1,473 | | 77 | | - |
| 682 |
| - |
| - |
| 819 |
| - |
| - |
Construction | | - | | - | | - | | - | | - | | - |
| - |
| - |
| - |
| - |
| - |
| - |
Total | $ | 6,723 | | $ | 437 | | $ | - | | $ | 9,333 | | $ | 482 | | $ | - | $ | 5,915 |
| $ | 280 |
| $ | - |
| $ | 5,482 |
| $ | 147 |
| $ | - |
| | | | | | | | | | | | |
|
|
|
|
|
|
|
|
|
|
|
|
The average recorded investment in the above chart is based on the five quarter average in the impaired loan balance through the quarter ending December 31, 2021. The average recorded investment for the year ended December 31, 20162019 was $9.5$5.2 million. There was also interest income recognized of $402$247 thousand and cash basis interest income recognized of $0.
Credit Quality Indicators
Commercial and industrial and commercial real estate
The Company utilizes a loan grading system and assigns a credit risk grade to its loans in the C&I and CRE portfolios. The grading system provides a means to measure portfolio quality and aids in the monitoring of the credit quality of the overall loan portfolio. The credit risk grades are arrived at using a risk rating matrix to assign a grade to each of the loans in the C&I and CRE portfolios.
The following is a description of each risk rating category the Company uses to classify each of its C&I and CRE loans:
Pass
Loans in this category have an acceptable level of risk and are graded in a range of one to five. Secured loans generally have good collateral coverage. Current financial statements reflect acceptable balance sheet ratios, sales and earnings trends. Management is considered to be competent, and a reasonable succession plan is evident. Payment experience on the loans has been good with minor or no delinquency experience. Loans with a grade of one are of the highest quality in the range. Those graded five are of marginally acceptable quality.
Special Mention
Loans in this category are graded a six and may be protected but are potentially weak. They constitute a credit risk to the Company but have not yet reached the point of adverse classification. Some of the following conditions may exist: little or no collateral coverage; lack of current financial information; delinquency problems; highly leveraged; available financial information reflects poor balance sheet ratios and profit and loss statements reflect uncertain trends; and document exceptions. Cash flow may not be sufficient to support total debt service requirements.
Substandard
Loans in this category are graded a seven and have a well-defined weakness which may jeopardize the ultimate collectability of the debt. The collateral pledged may be lacking in quality or quantity. Financial statements may indicate insufficient cash flow to service the debt; and/or do not reflect a sound net worth. The payment history indicates chronic delinquency problems. Management is considered to be weak. There is a distinct possibility that the Company may sustain a loss. All loans on non-accrual are rated substandard. Other loans that are included in the substandard category can be accruing, as well as loans that are current or past due. Loans 90 days or more past due, unless otherwise fully supported, are classified substandard. Also, borrowers that are bankrupt or have loans categorized as TDRs can be graded substandard.
Doubtful
Loans in this category are graded an eight and have a better than 50% possibility of the Company sustaining a loss, but the loss cannot be determined because of specific reasonable factors which may strengthen credit in the near-term. Many of the
weaknesses present in a substandard loan exist. Liquidation of collateral, if any, is likely. Any loan graded lower than an eight is considered to be uncollectible and charged-off.
Consumer and residential
The consumer and residential loan segments are regarded as homogeneous loan pools and as such are not risk rated. For these portfolios, the Company utilizes payment activity and history in assessing performance. Non-performing loans are comprised of non-accrual loans and loans past due 90 days or more and accruing. All loans not classified as non-performing are considered performing.
The following table presents loans including $2.6$3.0 million and $2.1$1.7 million of deferred costs, segregated by class, categorized into the appropriate credit quality indicator category as of December 31, 20182021 and 2017,2020, respectively:
Commercial credit exposure
Credit risk profile by creditworthiness category
| | | | | | | | | | | |
| | | | | | | | | | |
|
|
|
|
|
|
|
|
|
|
| |
|
|
|
|
|
|
|
|
|
|
| December 31, 2018 | December 31, 2021 |
(dollars in thousands) | Pass | | Special mention | | Substandard | | Doubtful | | Total | Pass |
| Special mention |
| Substandard |
| Doubtful |
| Total |
| | | | | | | | | | |
|
|
|
|
|
|
|
|
|
|
Commercial and industrial | $ | 125,272 | | $ | 334 | | $ | 1,278 | | $ | - | | $ | 126,884 | $ | 234,822 |
| $ | 339 |
| $ | 2,400 |
| $ | - |
| $ | 237,561 |
Commercial real estate - non-owner occupied | | 90,373 | | 938 | | 4,204 | | - | | 95,515 |
| 289,679 |
| 16,614 |
| 6,555 |
| - |
| 312,848 |
Commercial real estate - owner occupied | | 116,577 | | 1,685 | | 5,830 | | - | | 124,092 |
| 228,889 |
| 7,089 |
| 11,520 |
| - |
| 247,498 |
Commercial real estate - construction | | 6,761 | | - | | - | | - | | 6,761 |
| 21,147 |
| - |
| - |
| - |
| 21,147 |
Total commercial | $ | 338,983 | | $ | 2,957 | | $ | 11,312 | | $ | - | | $ | 353,252 | $ | 774,537 |
| $ | 24,042 |
| $ | 20,475 |
| $ | - |
| $ | 819,054 |
Consumer & Mortgage lending credit exposure
Credit risk profile based on payment activity
| | | | | | | | | | |
|
|
|
|
|
|
|
|
|
|
| | | | | | | | |
|
|
|
|
|
|
|
|
| | | December 31, 2018 |
|
| December 31, 2021 |
(dollars in thousands) | | | | | Performing | | Non-performing | | Total |
|
|
|
| Performing |
| Non-performing |
| Total |
| | | | | | | | | | | |
Consumer | | | | | | | | | | |
|
|
|
|
|
|
|
|
|
|
Home equity installment | | | | | | $ | 32,266 | | $ | 463 | | $ | 32,729 |
|
|
|
|
| $ | 47,571 |
| $ | - |
| $ | 47,571 |
Home equity line of credit | | | | | | 52,483 | | 34 | | 52,517 |
|
|
|
|
| 54,781 |
| 97 |
| 54,878 |
Auto loans and leases (1) | | | | | | 110,443 | | 25 | | 110,468 | |
Auto loans | |
|
|
|
|
| 117,951 |
| 78 |
| 118,029 |
Direct finance leases (1) | |
|
|
|
|
| 24,739 |
| 64 |
| 24,803 |
Other | | | | | | 6,313 | | 1 | | 6,314 |
|
|
|
|
| 8,013 |
| - |
| 8,013 |
Total consumer | | | | | | $ | 201,505 | | $ | 523 | | $ | 202,028 |
|
|
|
|
| 253,055 |
| 239 |
| 253,294 |
Residential | | | | | | | | | | |
|
|
|
|
|
|
|
|
|
|
Real estate | | | | | | $ | 144,437 | | $ | 1,514 | | $ | 145,951 |
|
|
|
|
| 325,289 |
| 572 |
| 325,861 |
Construction | | | | | | 15,749 | | - | | 15,749 |
|
|
|
|
| 34,919 |
| - |
| 34,919 |
Total residential | | | | | | $ | 160,186 | | $ | 1,514 | | $ | 161,700 |
|
|
|
|
| 360,208 |
| 572 |
| 360,780 |
Total consumer & residential | | | | | | $ | 361,691 | | $ | 2,037 | | $ | 363,728 |
|
|
|
|
| $ | 613,263 |
| $ | 811 |
| $ | 614,074 |
(1)Net of unearned lease revenue of $1.0$1.4 million.
Commercial credit exposure
Credit risk profile by creditworthiness category
| | | | | | | | | | |
|
|
|
|
|
|
|
|
|
|
| December 31, 2017 | December 31, 2020 |
(dollars in thousands) | Pass | | Special mention | | Substandard | | Doubtful | | Total | Pass |
| Special mention |
| Substandard |
| Doubtful |
| Total |
| | | | | | | | | | |
|
|
|
|
|
|
|
|
|
|
Commercial and industrial | $ | 112,398 | | $ | 509 | | $ | 694 | | $ | - | | $ | 113,601 | $ | 272,889 |
| $ | 4,162 |
| $ | 3,706 |
| $ | - |
| $ | 280,757 |
Commercial real estate - non-owner occupied | | 84,892 | | 998 | | 6,961 | | - | | 92,851 |
| 179,311 |
| 6,445 |
| 6,387 |
| - |
| 192,143 |
Commercial real estate - owner occupied | | 103,426 | | 2,479 | | 3,478 | | - | | 109,383 |
| 167,873 |
| 3,241 |
| 8,809 |
| - |
| 179,923 |
Commercial real estate - construction | | 6,067 | | - | | 161 | | - | | 6,228 |
| 8,635 |
| 1,233 |
| 363 |
| - |
| 10,231 |
Total commercial | $ | 306,783 | | $ | 3,986 | | $ | 11,294 | | $ | - | | $ | 322,063 | $ | 628,708 |
| $ | 15,081 |
| $ | 19,265 |
| $ | - |
| $ | 663,054 |
Consumer & Mortgage lending credit exposure
Credit risk profile based on payment activity
| | | | | | | | | | |
|
|
|
|
|
|
|
|
|
|
| | | | | | December 31, 2017 |
|
|
|
|
| December 31, 2020 |
(dollars in thousands) | | | | | | Performing | | Non-performing | | Total |
|
|
|
|
| Performing |
| Non-performing |
| Total |
| | | | | | | | | | |
|
|
|
|
|
|
|
|
|
|
Consumer | | | | | | | | | | |
|
|
|
|
|
|
|
|
|
|
Home equity installment | | | | | | $ | 27,302 | | $ | 15 | | $ | 27,317 |
|
|
|
|
| $ | 40,086 |
| $ | 61 |
| $ | 40,147 |
Home equity line of credit | | | | | | 52,714 | | 559 | | 53,273 |
|
|
|
|
| 49,330 |
| 395 |
| 49,725 |
Auto loans and leases (2) | | | | | | 82,860 | | 11 | | 82,871 | |
Auto loans | |
|
|
|
|
| 98,359 |
| 27 |
| 98,386 |
Direct finance leases (2) | |
|
|
|
|
| 18,875 |
| 61 |
| 18,936 |
Other | | | | | | 5,604 | | - | | 5,604 |
|
|
|
|
| 7,602 |
| - |
| 7,602 |
Total consumer | | | | | | $ | 168,480 | | $ | 585 | | $ | 169,065 |
|
|
|
|
| 214,252 |
| 544 |
| 214,796 |
Residential | | | | | | | | | | |
|
|
|
|
|
|
|
|
|
|
Real estate | | | | | | $ | 135,827 | | $ | 1,074 | | $ | 136,901 |
|
|
|
|
| 217,718 |
| 727 |
| 218,445 |
Construction | | | | | | 9,931 | | - | | 9,931 |
|
|
|
|
| 23,357 |
| - |
| 23,357 |
Total residential | | | | | | $ | 145,758 | | $ | 1,074 | | $ | 146,832 |
|
|
|
|
| 241,075 |
| 727 |
| 241,802 |
Total consumer & residential | | | | | | $ | 314,238 | | $ | 1,659 | | $ | 315,897 |
|
|
|
|
| $ | 455,327 |
| $ | 1,271 |
| $ | 456,598 |
(2) Net of unearned lease revenue of $0.6$1.2 million.
Allowance for loan losses
Management continually evaluates the credit quality of the Company’s loan portfolio and performs a formal review of the adequacy of the allowance on a quarterly basis. The allowance reflects management’s best estimate of the amount of credit losses in the loan portfolio. Management’s judgment is based on the evaluation of individual loans, past experience, the assessment of current economic conditions and other relevant factors including the amounts and timing of cash flows expected to be received on impaired loans. Those estimates may be susceptible to significant change. Loan losses are charged directly against the allowance when loans are deemed to be uncollectible. Recoveries from previously charged-off loans are added to the allowance when received.
Management applies two primary components during the loan review process to determine proper allowance levels. The two components are a specific loan loss allocation for loans that are deemed impaired and a general loan loss allocation for those loans not specifically allocated. The methodology to analyze the adequacy of the allowance for loan losses is as follows:
| §
| | identification of specific impaired loans by loan category;
|
| §
| | identification of specific loans that are not impaired, but have an identified potential for loss;
|
| §
| | calculation of specific allowances where required for the impaired loans based on collateral and other objective and quantifiable evidence;
|
| §
| | determination of loans with similar credit characteristics within each class of the loan portfolio segment and eliminating the impaired loans;
|
| §
| | application of historical loss percentages (trailing twelve-quarter average) to pools to determine the allowance allocation;
|
| §
| | application of qualitative factor adjustment percentages to historical losses for trends or changes in the loan portfolio.
|
| §
| | Qualitative factor adjustments include:
|
| o
| | levels of and trends in delinquencies and non-accrual loans;
|
| o
| | levels of and trends in charge-offs and recoveries;
|
| o
| | trends in volume and terms of loans;
|
| o
| | changes in risk selection and underwriting standards;
|
| o
| | changes in lending policies and legal and regulatory requirements;
|
| o
| | experience, ability and depth of lending management;
|
| o
| | national and local economic trends and conditions; and
|
| o
| | changes in credit concentrations.
|
identification of specific impaired loans by loan category;
identification of specific loans that are not impaired, but have an identified potential for loss;
calculation of specific allowances where required for the impaired loans based on collateral and other objective and quantifiable evidence;
determination of loans with similar credit characteristics within each class of the loan portfolio segment and eliminating the impaired loans;
application of historical loss percentages (trailing twelve-quarter average) to pools to determine the allowance allocation;
application of qualitative factor adjustment percentages to historical losses for trends or changes in the loan portfolio.
Qualitative factor adjustments include:
olevels of and trends in delinquencies and non-accrual loans;
olevels of and trends in charge-offs and recoveries;
otrends in volume and terms of loans;
ochanges in risk selection and underwriting standards;
ochanges in lending policies and legal and regulatory requirements;
oexperience, ability and depth of lending management;
onational and local economic trends and conditions; and
ochanges in credit concentrations.
Allocation of the allowance for different categories of loans is based on the methodology as explained above. A key element of the methodology to determine the allowance is the Company’s credit risk evaluation process, which includes credit risk grading of individual C&I and CRE loans. C&I and CRE loans are assigned credit risk grades based on the Company’s assessment of conditions that affect the borrower’s ability to meet its contractual obligations under the loan agreement. That process includes reviewing borrowers’ current financial information, historical payment experience, credit documentation, public information and other information specific to each individual borrower. Upon review, the commercial loan credit risk grade is revised or reaffirmed as the case may be.reaffirmed. The credit risk grades may be changed at any time management feels an upgrade or downgrade may be warranted. The credit risk grades for the C&I and CRE loan portfolios are taken into accountconsidered in the reserve methodology and loss factors are applied based upon the credit risk grades. The loss factors applied are based upon the Company’s historical experience as well as what we believe to be best practices and common industry standards. Historical experience reveals there is a direct correlation between the credit risk grades and loan charge-offs. The changes in allocations in the C&I and CRE loan portfolio from period to period are based upon the credit risk grading system and from periodic reviews of the loan portfolio. An unallocated component is maintained to cover uncertainties that could affect
management’s estimate of probable losses. The unallocated component of the allowance reflects the margin of imprecision inherent in the underlying assumptions used in the methodologies.
Each quarter, management performs an assessment of the allowance. The Company’s Special Assets Committee meets quarterly, and the applicable lenders discuss each relationship under review and reach a consensus on the appropriate estimated loss amount, if applicable, based on current accounting guidance. The Special Assets Committee’s focus is on ensuring the pertinent facts are considered regarding not only loans considered for specific reserves, but also the collectability of loans that may be past due in payment. The assessment process also includes the review of all loans on a non-accruing basis as well as a review of certain loans to which the lenders or the Company’s Credit Administration function have assigned a criticized or classified risk rating.
The Company’s policy is to charge-off unsecured consumer loans when they become 90 days or more past due as to principal and interest. In the other portfolio segments, amounts are charged-off at the point in time when the Company deems the balance, or a portion thereof, to be uncollectible.
Information related to the change in the allowance for loan losses and the Company’s recorded investment in loans by portfolio segment as of the period indicated is as follows:
| | | | | | | | | | | | |
|
|
|
|
|
|
|
|
|
|
|
|
| | | | | | | | | | | | |
|
|
|
|
|
|
|
|
|
|
|
|
As of and for the year ended December 31, 2018 | | | | | | | | | | | |
As of and for the year ended December 31, 2021 | | As of and for the year ended December 31, 2021 |
|
|
|
|
|
|
|
|
|
|
| Commercial & | | Commercial | | | | Residential | | | | | Commercial & |
| Commercial |
|
|
| Residential |
|
|
|
|
(dollars in thousands) | industrial | | real estate | | Consumer | | real estate | | Unallocated | | Total | industrial |
| real estate |
| Consumer |
| real estate |
| Unallocated |
| Total |
Allowance for Loan Losses: | | | | | | | | | | | | |
|
|
|
|
|
|
|
|
|
|
|
|
Beginning balance | $ | 1,374 | | $ | 4,060 | | $ | 2,063 | | $ | 1,608 | | $ | 88 | | $ | 9,193 | $ | 2,407 |
| $ | 6,383 |
| $ | 2,552 |
| $ | 2,781 |
| $ | 79 |
| $ | 14,202 |
Charge-offs | | (196) | | (268) | | (391) | | (371) | | - | | (1,226) |
| (130) |
| (491) |
| (206) |
| (162) |
| - |
| (989) |
Recoveries | | 77 | | 42 | | 211 | | - | | - | | 330 |
| 23 |
| 250 |
| 138 |
| - |
| - |
| 411 |
Provision | | 177 | | 67 | | 665 | | 607 | | (66) | | 1,450 |
| (96) |
| 1,280 |
| (80) |
| 889 |
| 7 |
| 2,000 |
Ending balance | $ | 1,432 | | $ | 3,901 | | $ | 2,548 | | $ | 1,844 | | $ | 22 | | $ | 9,747 | $ | 2,204 |
| $ | 7,422 |
| $ | 2,404 |
| $ | 3,508 |
| $ | 86 |
| $ | 15,624 |
Ending balance: individually evaluated for impairment | $ | 41 | | $ | 595 | | $ | 382 | | $ | 2 | | $ | - | | $ | 1,020 | $ | 18 |
| $ | 1,237 |
| $ | 4 |
| $ | - |
| $ | - |
| $ | 1,259 |
Ending balance: collectively evaluated for impairment | $ | 1,391 | | $ | 3,306 | | $ | 2,166 | | $ | 1,842 | | $ | 22 | | $ | 8,727 | $ | 2,186 |
| $ | 6,185 |
| $ | 2,400 |
| $ | 3,508 |
| $ | 86 |
| $ | 14,365 |
Loans Receivables: | | | | | | | | | | | | |
|
|
|
|
|
|
|
|
|
|
|
|
Ending balance (2) | $ | 126,884 | | $ | 226,368 | | $ | 202,028 | (1) | $ | 161,700 | | $ | - | | $ | 716,980 | $ | 236,304 |
| $ | 582,750 |
| $ | 253,294 | (1) | $ | 360,780 |
| $ | - |
| $ | 1,433,128 |
Ending balance: individually evaluated for impairment | $ | 180 | | $ | 3,912 | | $ | 522 | | $ | 1,514 | | $ | - | | $ | 6,128 | $ | 154 |
| $ | 5,034 |
| $ | 175 |
| $ | 572 |
| $ | - |
| $ | 5,935 |
Ending balance: collectively evaluated for impairment | $ | 126,704 | | $ | 222,456 | | $ | 201,506 | | $ | 160,186 | | $ | - | | $ | 710,852 | $ | 236,150 |
| $ | 577,716 |
| $ | 253,119 |
| $ | 360,208 |
| $ | - |
| $ | 1,427,193 |
(1) Net of unearned lease revenue of $1.0$1.4 million. (2) Includes $2.6$3.0 million of net deferred loan costs.
| | | | | | | | | | | | |
|
|
|
|
|
|
|
|
|
|
|
|
| | | | | | | | | | | | |
|
|
|
|
|
|
|
|
|
|
|
|
As of and for the year ended December 31, 2017 | | | | | | | | | | | | | |
As of and for the year ended December 31, 2020 | |
|
|
|
|
|
|
|
|
|
|
|
|
| Commercial & | | Commercial | | | | Residential | | | | | Commercial & |
| Commercial |
|
|
| Residential |
|
|
|
|
(dollars in thousands) | industrial | | real estate | | Consumer | | real estate | | Unallocated | | Total | industrial |
| real estate |
| Consumer |
| real estate |
| Unallocated |
| Total |
Allowance for Loan Losses: | | | | | | | | | | | | |
|
|
|
|
|
|
|
|
|
|
|
|
Beginning balance | $ | 1,075 | | $ | 4,706 | | $ | 1,834 | | $ | 1,622 | | $ | 127 | | $ | 9,364 | $ | 1,484 |
| $ | 3,933 |
| $ | 2,013 |
| $ | 2,278 |
| $ | 39 |
| $ | 9,747 |
Charge-offs | | (143) | | (635) | | (658) | | (309) | | - | | (1,745) |
| (372) |
| (465) |
| (296) |
| (35) |
| - |
| (1,168) |
Recoveries | | 10 | | 47 | | 67 | | - | | - | | 124 |
| 26 |
| 30 |
| 120 |
| 197 |
| - |
| 373 |
Provision | | 432 | | (58) | | 820 | | 295 | | (39) | | 1,450 |
| 1,269 |
| 2,885 |
| 715 |
| 341 |
| 40 |
| 5,250 |
Ending balance | $ | 1,374 | | $ | 4,060 | | $ | 2,063 | | $ | 1,608 | | $ | 88 | | $ | 9,193 | $ | 2,407 |
| $ | 6,383 |
| $ | 2,552 |
| $ | 2,781 |
| $ | 79 |
| $ | 14,202 |
Ending balance: individually evaluated for impairment | $ | 196 | | $ | 921 | | $ | 25 | | $ | 37 | | $ | - | | $ | 1,179 | $ | 213 |
| $ | 790 |
| $ | 52 |
| $ | 151 |
| $ | - |
| $ | 1,206 |
Ending balance: collectively evaluated for impairment | $ | 1,178 | | $ | 3,139 | | $ | 2,038 | | $ | 1,571 | | $ | 88 | | $ | 8,014 | $ | 2,194 |
| $ | 5,593 |
| $ | 2,500 |
| $ | 2,630 |
| $ | 79 |
| $ | 12,996 |
Loans Receivables: | | | | | | | | | | | | |
|
|
|
|
|
|
|
|
|
|
|
|
Ending balance (2) | $ | 113,601 | | $ | 208,462 | | $ | 169,065 | (1) | $ | 146,832 | | $ | - | | $ | 637,960 | $ | 280,757 |
| $ | 382,297 |
| $ | 214,796 | (1) | $ | 241,802 |
| $ | - |
| $ | 1,119,652 |
Ending balance: individually evaluated for impairment | $ | 249 | | $ | 4,992 | | $ | 579 | | $ | 1,074 | | $ | - | | $ | 6,894 | $ | 590 |
| $ | 4,540 |
| $ | 483 |
| $ | 727 |
| $ | - |
| $ | 6,340 |
Ending balance: collectively evaluated for impairment | $ | 113,352 | | $ | 203,470 | | $ | 168,486 | | $ | 145,758 | | $ | - | | $ | 631,066 | $ | 280,167 |
| $ | 377,757 |
| $ | 214,313 |
| $ | 241,075 |
| $ | - |
| $ | 1,113,312 |
(1) Net of unearned lease revenue of $0.6$1.2 million. (2) Includes $2.1$1.7 million of net deferred loan costs.
| | | | | | | | | | | | |
|
|
|
|
|
|
|
|
|
|
|
|
As of and for the year ended December 31, 2016 | | | | | | | | | | | | | |
As of and for the year ended December 31, 2019 | |
|
|
|
|
|
|
|
|
|
|
|
|
| Commercial & | | Commercial | | | | Residential | | | | | Commercial & |
| Commercial |
|
|
| Residential |
|
|
|
|
(dollars in thousands) | industrial | | real estate | | Consumer | | real estate | | Unallocated | | Total | industrial |
| real estate |
| Consumer |
| real estate |
| Unallocated |
| Total |
Allowance for Loan Losses: | | | | | | | | | | | | |
|
|
|
|
|
|
|
|
|
|
|
|
Beginning balance | $ | 1,336 | | $ | 5,014 | | $ | 1,533 | | $ | 1,407 | | $ | 237 | | $ | 9,527 | $ | 1,432 |
| $ | 3,901 |
| $ | 2,548 |
| $ | 1,844 |
| $ | 22 |
| $ | 9,747 |
Charge-offs | | (224) | | (592) | | (504) | | (60) | | - | | (1,380) |
| (184) |
| (597) |
| (398) |
| (330) |
| - |
| (1,509) |
Recoveries | | 55 | | 37 | | 100 | | - | | - | | 192 |
| 32 |
| 317 |
| 67 |
| 8 |
| - |
| 424 |
Provision | | (92) | | 247 | | 705 | | 275 | | (110) | | 1,025 |
| 204 |
| 312 |
| (204) |
| 756 |
| 17 |
| 1,085 |
Ending balance | $ | 1,075 | | $ | 4,706 | | $ | 1,834 | | $ | 1,622 | | $ | 127 | | $ | 9,364 | $ | 1,484 |
| $ | 3,933 |
| $ | 2,013 |
| $ | 2,278 |
| $ | 39 |
| $ | 9,747 |
Direct finance leases
On January 1, 2019, the Company adopted ASU 2016-02, Leases (Topic 842), and subsequent related updates to revise the accounting for leases. Lessor accounting was largely unchanged as a result of the standard. Additional disclosures required under the standard are included in this section and in Footnote 24, “Leases”.
The Company originates direct finance leases through 2 automobile dealerships. The carrying amount of the Company’s lease receivables, net of unearned income, was $7.7 million and $6.0 million as of December 31, 2021 and 2020, respectively. The residual value of the direct finance leases is fully guaranteed by the dealerships. Residual values amounted to $17.1 million and $12.9 million at December 31, 2021 and 2020, respectively, and are included in the carrying value of direct finance leases.
The undiscounted cash flows to be received on an annual basis for the direct finance leases are as follows:
|
|
|
|
|
|
(dollars in thousands) | Amount |
|
|
|
2022 | $ | 7,881 |
2023 |
| 6,286 |
2024 |
| 8,497 |
2025 |
| 3,444 |
2026 |
| 124 |
2027 and thereafter |
| - |
Total future minimum lease payments receivable |
| 26,232 |
Less: Unearned income |
| (1,429) |
Undiscounted cash flows to be received | $ | 24,803 |
|
|
|
6.BANK PREMISES AND EQUIPMENT
Components of bank premises and equipment are summarized as follows:
| | | | |
|
|
|
|
| | As of December 31, |
| As of December 31, |
(dollars in thousands) | 2018 | | 2017 | 2021 |
| 2020 |
| | | | |
|
|
|
|
Land | $ | 2,865 | | $ | 2,865 | $ | 3,657 |
| $ | 3,655 |
Bank premises | | 13,902 | | | 13,981 |
| 20,515 |
|
| 19,788 |
Furniture, fixtures and equipment | | 11,075 | | | 10,413 |
| 15,833 |
|
| 13,728 |
Leasehold improvements | | 7,263 | | | 5,187 |
| 9,851 |
|
| 9,618 |
Construction in process | |
| 494 |
|
| 307 |
| | | | | |
|
|
|
|
|
Total | | 35,105 | | | 32,446 |
| 50,350 |
|
| 47,096 |
| | | | | |
|
|
|
|
|
Less accumulated depreciation and amortization | | (16,816) | | | (15,870) |
| (21,040) |
|
| (19,470) |
| | | | | |
|
|
|
|
|
Bank premises and equipment, net | $ | 18,289 | | $ | 16,576 | $ | 29,310 |
| $ | 27,626 |
Depreciation expense, which includes amortization of leasehold improvements, was $1.3$2.2 million, $1.3$1.9 million and $1.4$1.5 million for the years ended December 31, 2018, 20172021, 2020 and 2016.2019. The estimated useful life was 40 years for bank premises, 3 to 7 years for furniture and fixtures and for leasehold improvements was the term of the lease.
The Company has one lease of several copiers that was classified as a capital lease in 2018. The following is an analysis of the leased property under a capital lease:
| | | | | |
| | Asset Balance at |
| | December 31, |
(dollars in thousands) | 2018 | | 2017 |
| | | | | |
Copiers | $ | 375 | | $ | - |
| | | | | |
Less accumulated depreciation and amortization | | (42) | | | - |
| | | | | |
Leased property under capital leases, net | $ | 333 | | $ | - |
| | | | | |
The following is a schedule of future minimum lease payments under capital leases together with the present value of the net minimum lease payments as of December 31, 2018:
| | |
(dollars in thousands) | Amount |
| | |
2019 | $ | 77 |
2020 | | 77 |
2021 | | 77 |
2022 | | 77 |
2023 | | 52 |
2024 and thereafter | | - |
| | |
Total minimum lease payments (a) | | 360 |
| | |
Less amount representing interest (b) | | (24) |
| | |
Present value of net minimum lease payments | $ | 336 |
| | |
| (a)
| | The future minimum lease payments have not been reduced by estimated executory costs (such as taxes and maintenance) since this amount was deemed immaterial by management.
|
| (b)
| | Amount necessary to reduce net minimum lease payments to present value calculated at the Company’s incremental borrowing rate upon lease inception.
|
During 2018, the Company recognized $42 thousand of amortization expense and $6 thousand of interest expense related to leased assets. The total expense of $48 thousand is included in premises and equipment expense on the consolidated statements of income.
In 2018, the Company leased its Green Ridge, Pittston, Peckville, Back Mountain and Clarks Summit branches under the terms of operating leases. In April 2018, the Company entered into an agreement to lease a branch in Mountaintop, PA expected to open in August 2019. The Company also leases three standalone ATMs under operating leases. Rental expense for the branches and equipment under operating leases was $0.4 million, $0.4 million and $0.3 million in 2018, 2017 and 2016. The future minimum lease payments for the Company’s branch network and equipment under operating leases that have lease terms in excess of one year as of December 31, 2018 are as follows:
| | |
(dollars in thousands) | Amount |
| | |
2019 | $ | 354 |
2020 | | 403 |
2021 | | 408 |
2022 | | 414 |
2023 | | 417 |
2024 and thereafter | | 8,486 |
| | |
Total | $ | 10,482 |
During the first quarter of 2014, the Company received through foreclosure the deed that secured the collateral for a non-owner occupied commercial real estate loan that was on non-accrual status. The loan, in the amount $1.0 million, was
transferred from loans to foreclosed assets held-for-sale and then to bank premises. Currently the building has a tenant under a lease agreement expiring in 2021,April 2022, but the Company expects to use the property for future facility expansion.
7.DEPOSITS
The scheduled maturities of certificates of deposit as of December 31, 20182021 were as follows:
| | | | | |
|
|
|
|
|
(dollars in thousands) | Amount | | Percent | Amount |
| Percent |
2019 | $ | 74,799 | | 64.3 | % | |
2020 | | 29,979 | | 25.8 | | |
2021 | | 6,974 | | 6.0 | | |
2022 | | 2,752 | | 2.4 | | $ | 104,801 |
| 75.5 | % |
2023 | | 1,198 | | 1.0 | |
| 19,791 |
| 14.3 |
|
2024 and thereafter | | 584 | | 0.5 | | |
2024 | |
| 5,216 |
| 3.8 |
|
2025 | |
| 3,206 |
| 2.3 |
|
2026 | |
| 4,915 |
| 3.5 |
|
2027 and thereafter | |
| 798 |
| 0.6 |
|
| | | | | |
|
|
|
|
|
Total | $ | 116,286 | | 100.0 | % | $ | 138,727 |
| 100.0 | % |
Including $0 and $1.1 million of certificates reciprocated in the Certificate of Deposit Account Registry Service (CDARS) deposits, certificates of deposit of $100,000 or more aggregated $66.9 million and $58.1 million as of December 31, 2018 and 2017, respectively. Including CDARS, certificatesCertificates of deposit of $250,000 or more aggregated $38.4$23.0 million and $30.9$41.1 million at December 31, 20182021 and 2017,2020, respectively.
As of December 31, 2018,2021 and 2020, $0.6 million and $0.5 million of overdraft deposits have been reclassified as loan balances.
As of December 31, 2021, investment securities with a combined fair value of $182.8 million and letters of credit with a notional value of $32.3$738.7 million were available to be pledged as qualifying collateral to secure public deposits and trust funds. The Company required $114.8$447.6 million of the qualifying collateral to secure such deposits as of December 31, 20182021 and the balance of $100.2$291.1 million was available for other pledging needs.
8.SHORT-TERM BORROWINGS
The components ofCompany had no short-term borrowings are summarizedoutstanding as follows:of December 31, 2021 and 2020.
| | | | | |
| | As of December 31, |
(dollars in thousands) | | 2018 | | | 2017 |
| | | | | |
Overnight borrowings | $ | 76,366 | | $ | 7,455 |
Securities sold under repurchase agreements | | - | | | 11,047 |
Total | $ | 76,366 | | $ | 18,502 |
| | | | | |
The maximum and average amounts of short-term borrowings outstanding and related interest rates as of the periods indicated are as follows:
| | | | | | | | | | |
|
|
|
|
|
|
|
|
|
|
| Maximum | | | | | Weighted- | | | Maximum |
|
|
|
| Weighted- |
|
|
| outstanding | | | | | average | | | outstanding |
|
|
|
| average |
|
|
| at any | | Average | | rate during | Rate at | at any |
| Average |
| rate during | Rate at |
(dollars in thousands) | month end | | outstanding | | the year | year-end | month end |
| outstanding |
| the year | year-end |
December 31, 2018 | | | | | | | | | | | |
December 31, 2021 | |
|
|
|
|
|
|
|
|
|
|
Overnight borrowings | $ | 76,366 | | $ | 27,893 | | 2.38 | % | 2.62 | % | $ | - |
| $ | 97 |
| 1.06 | % | - | % |
Repurchase agreements | | 22,202 | | | 9,666 | | 0.16 | | - | | |
| | | | | | | | | | |
|
|
|
|
|
|
|
|
|
|
Total | $ | 98,568 | | $ | 37,559 | | | | | | $ | - |
| $ | 97 |
|
|
| |
|
| | | | | | | | | | |
|
|
|
|
|
|
|
|
|
|
December 31, 2017 | | | | | | | | | | | |
December 31, 2020 | |
|
|
|
|
|
|
|
|
|
|
Overnight borrowings | $ | 46,737 | | $ | 18,399 | | 1.09 | % | 1.56 | % | $ | 9,159 |
| $ | 4,175 |
| 2.13 | % | - | % |
Repurchase agreements | | 17,179 | | | 10,274 | | 0.20 | | 0.18 | | |
| | | | | | | | | | | |
Paycheck Protection Program Liquidity Facility | |
| 152,791 |
|
| 44,990 |
| 0.35 |
| - |
|
Total | $ | 63,916 | | $ | 28,673 | | | | | | $ | 161,950 |
| $ | 49,165 |
|
|
| |
|
| | | | | | | | | | |
|
|
|
|
|
|
|
|
|
|
December 31, 2016 | | | | | | | | | | | |
December 31, 2019 | |
|
|
|
|
|
|
|
|
|
|
Overnight borrowings | $ | 17,862 | | $ | 2,805 | | 0.65 | % | - | % | $ | 58,747 |
| $ | 35,243 |
| 2.49 | % | 1.81 | % |
Repurchase agreements | | 18,765 | | | 10,239 | | 0.19 | | 0.13 | | |
Total | $ | 36,627 | | $ | 13,044 | | | | | | $ | 58,747 |
| $ | 35,243 |
|
|
| |
|
Overnight borrowings may include Fed funds purchased from correspondent banks, open repurchase agreements with the FHLB and borrowings at the Discount Window from the Federal Reserve Bank of Philadelphia (FRB). Securities sold under agreements to repurchase, or repurchase agreements, are non-insured interest-bearing liabilities that have a perfected security interest in qualified investment securities of the Company. Repurchase agreements are reflected at the amount of cash received in connection with the transaction. The carrying value of the underlying qualified investment securities was approximately $12.2 million at December 31, 2017. During the fourthfirst half of 2020, the Company utilized the Paycheck Protection Program Liquidity Facility (PPPLF) to fund PPP lending. The PPPLF borrowings were paid off during the third quarter of 2018, the Company transferred2020.
FHLB borrowings are collateralized by a blanket lien on all of the repurchase agreement accounts to reciprocal demand deposits placed through Insured Cash Sweep (ICS).
commercial and residential real estate loans. At December 31, 2018,2021, the Company had approximately $124.9$568.9 million available to borrow from the FHLB, $21.0$31.0 million from correspondent banks and approximately $91.5$91.7 million that it could borrow at the FRB.
9.FHLB ADVANCES AND OTHER BORROWINGS
During the first quarter of 2021, the Company paid off $5 million in FHLB advances with a weighted average interest rate of 3.07%. During the third quarter of 2018,2021, the Company utilized $15.0acquired $4.5 million in FHLB advances from the Landmark merger that was subsequently paid off. The Company had 0 FHLB advances as of December 31, 2021.
As of December 31, 2021, the Company had secured borrowings with the FHLBa fair value of $10.6 million related to purchase securities matching a spread expected to produce a suitable after-tax return. certain sold loan participations that did not qualify for sales treatment acquired from Landmark.
The maturity and weighted-average interest rate of FHLB advancessecured borrowings as of the periods indicated is as follows:
| | | | | |
|
|
|
|
|
| | As of December 31, 2018 |
| As of December 31, 2021 |
(dollars in thousands) | Amount | | Rate | | Amount |
| Rate |
|
| | | | | |
|
|
|
|
|
2019 | $ | 16,704 | | 1.38 | % | |
2020 | | - | | - | | |
2021 | | 5,000 | | 2.95 | | |
2022 | | 5,000 | | 2.99 | | $ | 766 |
| 3.25 | % |
2023 | | 5,000 | | 3.07 | |
| 26 |
| 4.25 |
|
2024 | |
| 2,700 |
| 4.13 |
|
2025 | |
| - |
| - |
|
2026 | |
| - |
| - |
|
2027 and thereafter | |
| 6,952 |
| 2.43 |
|
Total | $ | 31,704 | | 2.15 | % | $ | 10,444 |
| 2.69 | % |
| | | | | |
|
|
|
|
|
10.STOCK PLANS
The Company has two2 stock-based compensation plans (the stock compensation plans) from which it can grant stock-based compensation awards and applies the fair value method of accounting for stock-based compensation provided under current accounting guidance. The guidelines require the cost of share-based payment transactions (including those with employees and non-employees) be recognized in the financial statements. The Company’s stock compensation plans were shareholder-approved and permit the grant of share-based compensation awards to its employees and directors. The Company believes that the stock-based compensation plans will advance the development, growth and financial condition of the Company by providing incentives through participation in the appreciation in the value of the Company’s common stock. In return, the Company hopes to secure, retain and motivate the employees and directors who are responsible for the operation and the management of the affairs of the Company by aligning the interest of its employees and directors with the interest of its shareholders. In the stock compensation plans, employees and directors are eligible to be awarded stock-based compensation grants which can consist of stock options (qualified and non-qualified), stock appreciation rights (SARs) and restricted stock.
At the 2012 annual shareholders’ meeting, the Company’s shareholders approved and the Company adopted the 2012 Omnibus Stock Incentive Plan and the 2012 Director Stock Incentive Plan (collectively, the 2012 stock incentive plans). The 2012 stock incentive plans replaced both the expired 2000 Independent Directors Stock Option Plan and the 2000 Stock Incentive Plan (collectively, the 2000 stock incentive plans). Unless terminated by the Company’s board of directors, the 2012 stock incentive plans will expire on and no stock-based awards shall be granted after the year 2022.2022.
In each of the 2012 stock incentive plans, the Company has reserved 750,000 shares of its no-par0-par common stock for future issuance. The Company recognizes share-based compensation expense over the requisite service or vesting period. During 2015, the Company created a Long-Term Incentive Plan (LTIP) that awardsawarded restricted stock and stock-settled stock appreciation rights (SSARs) to senior officers based on the attainment of performance goals. The service requirement iswas the participant’s continued employment throughout the LTIP with a three-yearthree year vesting period. TheUnder this plan, the restricted stock hashad a two-yeartwo year post vesting holding period requirement. The SSAR awards have a ten year term from the date of each grant. The
During the first quarter of 2019, the Company grantedapproved a 1 year LTIP and awarded restricted stock and SSARs to senior officers and managers in February 20162019 based on 2015 performance,2018 performance. Under this plan, the restricted stock had a two year post vesting holding period requirement. The SSAR awards have a ten year term from the date of each grant.
During the first quarter of 2020, the Company approved a 1 year LTIP and awarded restricted stock to senior officers and managers in February 2017and March 2020 based on 2016 performance2019 performance. During the second quarter of 2020, 500 shares of restricted stock were granted to 1 new employee after the merger.
During the first quarter of 2021, the Company approved a 1-year LTIP and awarded restricted stock to senior officers and managers in February 2018and March 2021 based on 2017 performance and 2015-2017 3-year cumulative2020 performance. During the third quarter of 2021, 476 shares of restricted stock were granted to 1 new employee after the merger.
The following table summarizes the weighted-average fair value and vesting of restricted stock grants awarded during 2018, 20172021, 2020 and 20162019 under the 2012 stock incentive plans:
|
|
|
|
|
|
|
|
|
|
|
|
|
|
|
|
|
|
|
|
|
|
|
|
|
|
|
|
|
|
| 2021 |
| 2020 |
| 2019 |
|
|
| Weighted- |
|
|
| Weighted- |
|
|
| Weighted- |
| Shares |
| average grant |
| Shares |
| average grant |
| Shares |
| average grant |
| granted |
| date fair value |
| granted |
| date fair value |
| granted |
| date fair value |
|
|
|
|
|
|
|
|
|
|
|
|
|
|
|
Director plan | 12,500 | (2) | $ | 52.00 |
| 6,000 | (2) | $ | 56.63 |
| 5,600 | (2) | $ | 54.69 |
Omnibus plan | 13,552 | (3) |
| 52.00 |
| 11,761 | (3) |
| 55.06 |
| 7,251 | (2) |
| 54.69 |
Omnibus plan | 50 | (1) |
| 58.17 |
| 50 | (1) |
| 57.62 |
| 50 | (1) |
| 58.08 |
Omnibus plan | 36 | (3) |
| 58.17 |
| 500 | (2) |
| 34.02 |
| - |
|
| - |
Omnibus plan | 476 | (2) |
| 52.62 |
| - |
|
| - |
| - |
|
| - |
Total | 26,614 |
| $ | 52.03 |
| 18,311 |
| $ | 55.00 |
| 12,901 |
| $ | 54.70 |
(1)Vest after 1 year (2) Vest after 3 years – 33% each year (3) Vest fully after 3 years
| | | | | | | | | | | | | | |
| | | | | | | | | | | | | | |
| 2018 | | 2017 | | 2016 |
| | | Weighted- | | | | Weighted- | | | | Weighted- |
| | | average | | | | average | | | | average |
| Shares | | grant date | | Shares | | grant date | | Shares | | grant date |
| granted | | fair value | | granted | | fair value | | granted | | fair value |
| | | | | | | | | | | | | | |
Director plan | 8,400 | (3) | $ | 49.50 | | 8,400 | (2) | $ | 26.17 | | 8,400 | (1) | $ | 21.60 |
Omnibus plan | 10,800 | (3) | | 45.83 | | 4,749 | (3) | | 23.93 | | 4,734 | (3) | | 19.48 |
Omnibus plan | 50 | (1) | | 49.50 | | 75 | (1) | | 26.17 | | 75 | (1) | | 21.00 |
Total | 19,250 | | $ | 47.44 | | 13,224 | | $ | 25.36 | | 13,209 | | $ | 20.84 |
| (1)
| | Vest after 1 year (2) Vest over 2 years –50% each year (3) Vest over 3 years – 33% each year
|
The fair value of the 10,800 shares granted on February 6, 2018in 2021 was calculated using the grant date stock price with a discount valuation. The Chaffe model was used to calculate the discount. Since the shares vest over three years and then have a further two-year holding period, the historical volatility of the five years prior to the issue date was used to estimate volatility. The five year treasury yield was used as the interest rate. The Company does pay a dividend, but since the shareholder will receive the dividends during vesting and the post-vest restriction period, no dividend yield was used in the calculation as not to inflate the discount. The grant date stock price was $49.50 and the discount of 7.423% was calculatedprice.
using an interest rate of 2.504% and a 5 year historical volatility of 17.617%.
A summary of the status of the Company’s non-vested restricted stock as of and changes during the period indicated are presented in the following table:
| | | | | | | |
|
|
|
|
|
|
|
| | | | | | | |
|
|
|
|
|
|
|
| 2012 Stock incentive plans | 2012 Stock incentive plans |
| Director | | Omnibus | | Total | | Weighted- average grant date fair value | Director |
| Omnibus |
| Total |
| Weighted- average grant date fair value |
Non-vested balance at December 31, 2015 | 4,800 | | 13,262 | | 18,062 | | $ | 19.67 | |
Non-vested balance at December 31, 2018 | | 12,600 |
| 17,360 |
| 29,960 |
| $ | 38.99 |
Granted | 8,400 | | 4,809 | | 13,209 | | 20.84 | 5,600 |
| 7,301 |
| 12,901 |
| 54.70 |
Forfeited | | - |
| (126) |
| (126) |
| 54.69 |
Vested | (4,800) | | (4,509) | | (9,309) | | 19.79 | (7,000) |
| (8,574) |
| (15,574) |
| 33.81 |
Non-vested balance at December 31, 2016 | 8,400 | | 13,562 | | 21,962 | | $ | 20.31 | |
Non-vested balance at December 31, 2019 | | 11,200 |
| 15,961 |
| 27,161 |
| $ | 49.48 |
Granted | 8,400 | | 4,824 | | 13,224 | | 25.36 | 6,000 |
| 12,311 |
| 18,311 |
| 55.00 |
Forfeited | | - |
| - |
| - |
|
|
Vested | (8,400) | | (6,082) | | (14,482) | | 20.47 | (7,798) |
| (7,597) |
| (15,395) |
| 48.47 |
Non-vested balance at December 31, 2017 | 8,400 | | 12,304 | | 20,704 | | $ | 23.59 | |
Non-vested balance at December 31, 2020 | | 9,402 |
| 20,675 |
| 30,077 |
| $ | 53.36 |
Granted | 8,400 | | 10,850 | | 19,250 | | 47.44 | 12,500 |
| 14,114 |
| 26,614 |
| 52.03 |
Forfeited | | - |
| (439) |
| (439) |
| 52.66 |
Vested | (4,200) | | (5,794) | | (9,994) | | 23.69 | (6,982) |
| (6,227) |
| (13,209) |
| 51.23 |
Non-vested balance at December 31, 2018 | 12,600 | | 17,360 | | 29,960 | | $ | 38.99 | |
Non-vested balance at December 31, 2021 | | 14,920 |
| 28,123 |
| 43,043 |
| $ | 53.20 |
| | | | | | | |
|
|
|
|
|
|
|
The Company granted 38,941 SSARs under the Omnibus Plan on February 6, 2018. The Company estimated the fair value of SSARs using the Black-Scholes-Merton valuation model on the grant date. The Company used the following assumptions: the risk-free interest rate is the rate equivalent to the expected term of the option interpolated from the U.S. Treasury Yield Curve on the valuation date and historical volatility is calculated by taking the standard deviation of historical returns using weekly and monthly data. The fair value of these SSARs was $13.73 per share, based on a risk-free interest rate of 2.771%, a dividend yield of 1.762% and a volatility of 23.906% using an expected term of ten years.
A summary of the status of the Company’s SSARs as of and changes during the period indicated are presented in the following table:
| | | | | | |
|
|
|
|
|
|
| | | | | | |
|
|
|
|
|
|
| | Awards | | | Weighted-average grant date fair value | | Weighted-average remaining contractual term (years) |
| Awards |
|
| Weighted-average grant date fair value |
| Weighted-average remaining contractual term (years) |
Outstanding December 31, 2015 | | - | | - | | - | |
Outstanding December 31, 2018 | |
| 89,250 |
| $ | 8.36 |
| 8.2 |
Granted | | 29,014 | | $ | 3.48 | | 10.0 |
| 11,073 |
| 16.79 |
| 10.0 |
Exercised | | - | | - | | |
| (3,059) |
| 3.48 |
|
|
Forfeited | | - | | - | | |
| - |
| - |
|
|
Outstanding December 31, 2016 | | 29,014 | | $ | 3.48 | | 9.1 | |
Outstanding December 31, 2019 | |
| 97,264 |
| $ | 9.47 |
| 7.5 |
Granted | | 24,346 | | 5.06 | | 10.0 |
| - |
| - |
| - |
Exercised | | - | | - | | |
| 0 |
| - |
| - |
Forfeited | | - | | - | | |
| - |
| - |
| - |
Outstanding December 31, 2017 | | 53,360 | | $ | 4.20 | | 8.5 | |
Outstanding December 31, 2020 | |
| 97,264 |
| $ | 9.47 |
| 6.5 |
Granted | | 38,941 | | 13.73 | | 10.0 |
| - |
|
|
|
|
Exercised | | (3,051) | | 4.03 | | |
| (2,932) |
| 3.48 |
|
|
Forfeited | | - | | - | | |
| - |
|
|
|
|
Outstanding December 31, 2018 | | 89,250 | | $ | 8.36 | | 8.2 | |
Outstanding December 31, 2021 | |
| 94,332 |
| $ | 9.66 |
| 5.5 |
| | | | | | |
|
|
|
|
|
|
Of the SSARs outstanding at December 31, 2018, 24,4022021, 90,639 vested and were exercisable. SSARs vest over a three year period – 33% per year.
During 2018,the first quarter of 2021, there were 3,0512,932 SSARs exercised. The intrinsic value recorded for these SSARs was $12,288.$10,190. The tax deduction realized from the exercise of these SSARs was $122,969$125,810 resulting in a tax benefit of $25,823.$26,420. There were 0 SSARs exercised during 2020. During 2019, there were 3,059 SSARs exercised. The intrinsic value recorded for these SSARs was $10,631. The tax deduction realized from the exercise of these SSARs was $108,134 resulting in a tax benefit of $22,708.
Share-based compensation expense is included as a component of salaries and employee benefits in the consolidated statements of income. The following tables illustrate stock-based compensation expense recognized on non-vested equity awards during the years ended December 31, 2018, 20172021, 2020 and 20162019 and the unrecognized stock-based compensation expense as of December 31, 2018:2021:
| | | | | | |
|
|
|
|
|
|
| | | |
|
|
|
|
|
|
| |
|
|
|
|
|
|
(dollars in thousands) | 2018 | | 2017 | | 2016 |
| 2021 |
| 2020 |
| 2019 |
Stock-based compensation expense: | | | | | | |
|
|
|
|
|
|
Director stock incentive plan | $ | 237 | | $ | 116 | | $ | 174 |
| $ | 422 |
| $ | 434 |
| $ | 240 |
Omnibus stock incentive plan | | 500 | | 194 | | 141 |
| 640 |
| 740 |
| 611 |
Employee stock purchase plan | | 143 | | 23 | | 15 |
| 44 |
| 27 |
| 107 |
Total stock-based compensation expense | $ | 880 | | $ | 333 | | $ | 330 |
| $ | 1,106 |
| $ | 1,201 |
| $ | 958 |
In addition, during 2018, 20172021, 2020 and 20162019 the Company reversed accruals of ($10 thousand), ($0.1 million) and accrued $0.2 million and $0.2 million($0.1 million) in stock-based compensation expense for restricted stock and SSARs to be awarded under the Omnibus Plan.
|
|
|
|
|
| As of |
(dollars in thousands) |
| December 31, 20182021 |
Unrecognized stock-based compensation expense: |
|
|
|
Director plan | $
| 298 $ | 498 |
Omnibus plan |
| 812
| 781 |
Total unrecognized stock-based compensation expense | $
| 1,110 $ | 1,279 |
The unrecognized stock-based compensation expense as of December 31, 20182021 will be recognized ratably over the periods ended January 2021February 2024 and January 2021July 2024 for the Director Plan and the Omnibus Plan, respectively.
Transactions under the Company’s stock option plans as of and changes during the periods indicated are presented in the following table:
| | | | | | | |
| | | | | | | |
| | Options | | | Weighted-average exercise price | | Weighted-average remaining contractual term (years) |
Outstanding and exercisable, December 31, 2015 | | 23,250 | | | 19.09 | | 2.0 |
Granted | | - | | | - | | |
Exercised | | (750) | | | 18.50 | | |
Forfeited | | - | | | - | | |
Outstanding and exercisable, December 31, 2016 | | 22,500 | | $ | 19.12 | | 1.0 |
Granted | | - | | | - | | |
Exercised | | (21,750) | | | 19.14 | | |
Forfeited | | - | | | - | | |
Outstanding and exercisable, December 31, 2017 | | 750 | | $ | 18.50 | | 0.2 |
Granted | | - | | | - | | |
Exercised | | (750) | | | 18.50 | | |
Forfeited | | - | | | - | | |
Outstanding and exercisable, December 31, 2018 | | - | | $ | - | | - |
| | | | | | | |
During the first quarter of 2018, there were 750 stock options exercised at a price of $18.50 per share. The intrinsic value of these stock options was $2,585. The tax deduction realized from the exercise of these options was $22,875 resulting in a tax benefit of $4,804. During 2017, there were 21,750 stock options exercised at a price of $19.14 per share. The intrinsic value of these stock options was $79,715. The tax deduction realized from the exercise of these options was $363,392 resulting in a tax benefit of $123,553. The Company has not issued stock options since 2008.
In addition to the 2012 stock incentive plans, the Company established the 2002 Employee Stock Purchase Plan (the ESPP) and reserved 165,000 shares of its un-issued capital stock for issuance under the plan. The ESPP was designed to promote broad-based employee ownership of the Company’s stock and to motivate employees to improve job performance and enhance the financial results of the Company. Under the ESPP, participation is voluntary whereby employees use automatic payroll withholdings to purchase the Company’s capital stock at a discounted price based on the fair market value of the capital stock as measured on either the commencement or termination dates, as defined. As of December 31, 2018, 76,4842021, 89,642 shares have been issued under the ESPP. The ESPP is considered a compensatory plan and is required to comply with the provisions of current accounting guidance. The Company recognizes compensation expense on its ESPP on the date the
shares are purchased, and it is included as a component of salaries and employee benefits in the consolidated statements of income.
The Company also established the dividend reinvestment plan (the DRP) for its shareholders. The DRP is designed to avail the Company’s stock at no transactional cost to its shareholders. Cash dividends paid to shareholders who are enrolled in the DRP plus voluntary cash deposits received can be used to purchase shares, directly from the Company, from shares that become available in the open market or in negotiated transactions with third parties. The Company has reserved 750,000 shares of its un-issued capital stock for issuance under the DRP. As of December 31, 2018,2021, there were 591,730 shares available for future issuance.
11.INCOME TAXES
Pursuant to the accounting guidelines related to income taxes, the Company has evaluated its material tax positions as of December 31, 20182021 and 2017.2020. Under the “more-likely-than-not” threshold guidelines, the Company believes no significant uncertain tax positions exist, either individually or in the aggregate, that would give rise to the non-recognition of an existing tax benefit. In periods subsequent to December 31, 2018,2021, determinations of potentially adverse material tax positions will be evaluated to determine whether an uncertain tax position may have previously existed or has been originated. In the event an adverse tax position is determined to exist, penalty and interest will be accrued, in accordance with the Internal Revenue Service (IRS) guidelines, and will be recorded as a component of other expenses in the Company’s consolidated statements of income.
As of December 31, 2018,2021, there were no0 unrecognized tax benefits that, if recognized, would significantly affect the Company’s effective tax rate. Also, there were no0 penalties and interest recognized in the consolidated statements of income in 2018, 20172021, 2020 and 20162019 as a result of management’s evaluation of whether an uncertain tax position may exist nor does the Company foresee a change in its material tax positions that would give rise to the non-recognition of an existing tax benefit during the forthcoming twelve months. Tax returns filed with the IRS are subject to review by law under a three-year statute
of limitations. The Company has not received notification from the IRS regarding adverse tax issues for the current year or from tax returns filed for tax years 2017, 20162020, 2019 or 2015. 2018.
On December 22, 2017, the Tax Cuts and Jobs Act (the “Tax Act”) was signed into law. The bill reduced the Company’s federal corporate income tax rate from 34% to 21% effective January 1, 2018. An adjustment of $1.1 million was made in December 2017 to re-measure the net deferred tax liability at the new tax rate.
The following temporary differences gave rise to the net deferred tax liability, a component of other assets in the consolidated balance sheets, as of the periods indicated:
| | | | | |
|
|
|
|
|
| As of December 31, | As of December 31, |
(dollars in thousands) | 2018 | | 2017 | 2021 |
| 2020 |
Deferred tax assets: | | | | | |
|
|
|
|
|
Allowance for loan losses | $ | 2,047 | | $ | 1,930 | $ | 3,281 |
| $ | 2,936 |
Net unrealized losses on available-for-sale securities | | 291 | | | - | |
Deferred interest from non-accrual assets | | 167 | | | 180 |
| 251 |
|
| 206 |
Operating lease liabilities | |
| 2,022 |
|
| 1,605 |
Acquisition accounting | |
| 2,087 |
|
| 479 |
Other | | 697 | | | 471 |
| 1,029 |
|
| 594 |
Total | | 3,202 | | | 2,581 |
| 8,670 |
|
| 5,820 |
| | | | | |
|
|
|
|
|
Deferred tax liabilities: | | | | | |
|
|
|
|
|
Net unrealized gains on available-for-sale securities | | - | | | (480) |
| (48) |
|
| (2,380) |
Loan fees and costs | | (1,151) | | | (1,023) |
| (1,397) |
|
| (1,013) |
Automobile leasing | | (3,393) | | | (2,298) |
| (5,162) |
|
| (4,287) |
Operating lease right-of-use assets | |
| (1,891) |
|
| (1,487) |
Depreciation | | (416) | | | (263) |
| (1,594) |
|
| (1,411) |
Mortgage loan servicing rights | | (241) | | | (268) |
| (357) |
|
| (278) |
Total | | (5,201) | | | (4,332) |
| (10,449) |
|
| (10,856) |
Deferred tax liability, net | $ | (1,999) | | $ | (1,751) | $ | (1,779) |
| $ | (5,036) |
The components of the total provision for income taxes for the years indicated are as follows:
| | | | | | | |
|
|
|
|
|
|
|
| Years ended December 31, | Years ended December 31, |
(dollars in thousands) | 2018 | | 2017 | | 2016 | 2021 |
| 2020 |
| 2019 |
| | | | | | | |
|
|
|
|
|
|
|
Current | $ | 1,110 | | $ | 1,872 | | $ | 1,521 | $ | 4,904 |
| $ | 2,336 |
| $ | 1,985 |
Deferred | | 1,019 | | (666) | | | 1,248 |
| (903) |
| (87) |
|
| 341 |
Total provision for income taxes | $ | 2,129 | | $ | 1,206 | | $ | 2,769 | $ | 4,001 |
| $ | 2,249 |
| $ | 2,326 |
The deferred tax liability at December 31, 2017 included a $1.1 million credit to the provision for income taxes for the effects of the Tax Cuts and Jobs Act.
The reconciliation between the expected statutory income tax and the actual provision for income taxes is as follows:
| | | | | | | | |
|
|
|
|
|
|
|
|
| Years ended December 31, | Years ended December 31, |
| | | | | | | | |
|
|
|
|
|
|
|
|
(dollars in thousands) | 2018 | | 2017 | | 2016 | 2021 |
| 2020 |
| 2019 |
Expected provision at the statutory rate | $ | 2,758 | | $ | 3,373 | | $ | 3,557 | $ | 5,873 |
| $ | 3,203 |
| $ | 2,919 |
Tax-exempt income | | (567) | | | (845) | | | (742) |
| (1,686) |
|
| (865) |
|
| (592) |
Bank owned life insurance | | (126) | | | (198) | | | (120) |
| (232) |
|
| (167) |
|
| (136) |
Nondeductible interest expense | | 18 | | | 19 | | | 14 |
| 87 |
|
| 54 |
|
| 37 |
Nondeductible other expenses and other, net | | 43 | | | (59) | | | 60 |
| 49 |
|
| (8) |
|
| 98 |
Tax rate change adjustment | | 3 | | | (1,084) | | | - | |
Tax credits | |
| (135) |
|
| - |
|
| - |
State income tax | |
| 45 |
|
| 32 |
|
| - |
Actual provision for income taxes | $ | 2,129 | | $ | 1,206 | | $ | 2,769 | $ | 4,001 |
| $ | 2,249 |
| $ | 2,326 |
12.RETIREMENT PLAN
The Company has a defined contribution profit sharing 401(k) plan covering substantially all of its employees. The plan is subject to the provisions of the Employee Retirement Income Security Act of 1974 (ERISA). Contributions to the plan approximated $0.4$1.0 million, $0.4$0.7 million and $0.4$0.5 million in 2018, 20172021, 2020 and 2016.2019.
13.FAIR VALUE MEASUREMENTS
The accounting guidelines establish a framework for measuring and disclosing information about fair value measurements. The guidelines of fair value reporting instituted a valuation hierarchy for disclosure of the inputs used to measure fair value. This hierarchy prioritizes the inputs into three broad levels as follows:
Level 1 - inputs are quoted prices (unadjusted) in active markets for identical assets or liabilities;
Level 2 - inputs are quoted prices for similar assets and liabilities in active markets; quoted prices for identical or similar assets or liabilities in markets that are not active; or inputs that are observable for the asset or liability, either directly or indirectly through market corroboration, for substantially the full term of the financial instrument;
Level 3 - inputs are unobservable and are based on the Company’s own assumptions to measure assets and liabilities at fair value. Level 3 pricing for securities may also include unobservable inputs based upon broker-traded transactions.
A financial asset or liability’s classification within the hierarchy is determined based on the lowest level input that is significant to the fair value measurement.
The Company uses fair value to measure certain assets and, if necessary, liabilities on a recurring basis when fair value is the primary measure for accounting. Thus, the Company uses fair value for AFS securities. Fair value is used on a non-recurring basis to measure certain assets when adjusting carrying values to market values, such as impaired loans, other real estate owned (ORE) and other repossessed assets.
The following table represents the carrying amount and estimated fair value of the Company’s financial instruments:
| | | | | | | | | | |
|
|
|
|
|
|
|
|
|
|
December 31, 2018 | |
December 31, 2021 | | December 31, 2021 |
| | | | | | Quoted prices | | Significant | | Significant |
|
|
|
|
| Quoted prices |
| Significant |
| Significant |
| | | | | | in active | | other | | other |
|
|
|
|
| in active |
| other |
| other |
| Carrying | | Estimated | | markets | | observable inputs | | unobservable inputs | Carrying |
| Estimated |
| markets |
| observable inputs |
| unobservable inputs |
(dollars in thousands) | amount | | fair value | | (Level 1) | | (Level 2) | | (Level 3) | amount |
| fair value |
| (Level 1) |
| (Level 2) |
| (Level 3) |
| | | | | | | | | | | |
Financial assets: | | | | | | | | | | |
|
|
|
|
|
|
|
|
|
|
Cash and cash equivalents | $ | 17,485 | | $ | 17,485 | | $ | 17,485 | | $ | - | | $ | - | $ | 96,877 |
| $ | 96,877 |
| $ | 96,877 |
| $ | - |
| $ | - |
Available-for-sale debt securities | | 182,810 | | 182,810 | | - | | 182,810 | | - |
| 738,980 |
| 738,980 |
| - |
| 738,980 |
| - |
FHLB stock | | 6,339 | | 6,339 | | - | | 6,339 | | - | |
Restricted investments in bank stock | |
| 3,206 |
| 3,206 |
| - |
| 3,206 |
| - |
Loans and leases, net | | 707,233 | | 686,645 | | - | | - | | 686,645 |
| 1,417,504 |
| 1,404,103 |
| - |
| - |
| 1,404,103 |
Loans held-for-sale | | 5,707 | | 5,789 | | - | | 5,789 | | - |
| 31,727 |
| 32,013 |
| - |
| 32,013 |
| - |
Accrued interest receivable | | 3,271 | | 3,271 | | - | | 3,271 | | - |
| 7,526 |
| 7,526 |
| - |
| 7,526 |
| - |
Financial liabilities: | | | | | | | | | | |
|
|
|
|
|
|
|
|
|
|
Deposits with no stated maturities | | 653,897 | | 653,897 | | - | | 653,897 | | - |
| 2,031,072 |
| 2,031,072 |
| - |
| 2,031,072 |
| - |
Time deposits | | 116,286 | | 114,876 | | - | | 114,876 | | - |
| 138,793 |
| 138,291 |
| - |
| 138,291 |
| - |
Short-term borrowings | | 76,366 | | 76,366 | | - | | 76,366 | | - | |
FHLB advances | | 31,704 | | 31,698 | | - | | 31,698 | | - | |
Secured borrowings | |
| 10,620 |
| 10,690 |
| - |
| - |
| 10,690 |
Accrued interest payable | | 530 | | 530 | | - | | 530 | | - |
| 155 |
| 155 |
| - |
| 155 |
| - |
| | | | | | | | | | |
|
|
|
|
|
|
|
|
|
|
| | | | | | | | | | |
|
|
|
|
|
|
|
|
|
|
|
|
|
|
|
|
|
|
|
|
|
|
|
|
|
December 31, 2020 |
|
|
|
|
|
|
| Quoted prices |
| Significant |
| Significant |
|
|
|
|
|
|
| in active |
| other |
| other |
| Carrying |
| Estimated |
| markets |
| observable inputs |
| unobservable inputs |
(dollars in thousands) | amount |
| fair value |
| (Level 1) |
| (Level 2) |
| (Level 3) |
Financial assets: |
|
|
|
|
|
|
|
|
|
|
|
|
|
|
Cash and cash equivalents | $ | 69,346 |
| $ | 69,346 |
| $ | 69,346 |
| $ | - |
| $ | - |
Available-for-sale debt securities |
| 392,420 |
|
| 392,420 |
|
| - |
|
| 392,420 |
|
| - |
Restricted investments in bank stock |
| 2,813 |
|
| 2,813 |
|
| - |
|
| 2,813 |
|
| - |
Loans and leases, net |
| 1,105,450 |
|
| 1,116,711 |
|
| - |
|
| - |
|
| 1,116,711 |
Loans held-for-sale |
| 29,786 |
|
| 30,858 |
|
| - |
|
| 30,858 |
|
| - |
Accrued interest receivable |
| 5,712 |
|
| 5,712 |
|
| - |
|
| 5,712 |
|
| - |
Financial liabilities: |
|
|
|
|
|
|
|
|
|
|
|
|
|
|
Deposits with no stated maturities |
| 1,381,722 |
|
| 1,381,722 |
|
| - |
|
| 1,381,722 |
|
| - |
Time deposits |
| 127,783 |
|
| 128,200 |
|
| - |
|
| 128,200 |
|
| - |
FHLB advances |
| 5,000 |
|
| 5,348 |
|
| - |
|
| 5,348 |
|
| - |
Accrued interest payable |
| 337 |
|
| 337 |
|
| - |
|
| 337 |
|
| - |
|
|
|
|
|
|
|
|
|
|
|
|
|
|
|
| | | | | | | | | | | | | | |
December 31, 2017 |
| | | | | | | Quoted prices | | Significant | | Significant |
| | | | | | | in active | | other | | other |
| Carrying | | Estimated | | markets | | observable inputs | | unobservable inputs |
(dollars in thousands) | amount | | fair value | | (Level 1) | | (Level 2) | | (Level 3) |
| | | | | | | | | | | | | | |
Financial assets: | | | | | | | | | | | | | | |
Cash and cash equivalents | $ | 15,825 | | $ | 15,825 | | $ | 15,825 | | $ | - | | $ | - |
Available-for-sale securities | | 157,385 | | | 157,385 | | | 828 | | | 156,557 | | | - |
FHLB stock | | 2,832 | | | 2,832 | | | - | | | 2,832 | | | - |
Loans and leases, net | | 628,767 | | | 625,052 | | | - | | | - | | | 625,052 |
Loans held-for-sale | | 2,181 | | | 2,221 | | | - | | | 2,221 | | | - |
Accrued interest receivable | | 2,786 | | | 2,786 | | | - | | | 2,786 | | | - |
Financial liabilities: | | | | | | | | | | | | | | |
Deposits with no stated maturities | | 623,080 | | | 623,080 | | | - | | | 623,080 | | | - |
Time deposits | | 107,066 | | | 105,758 | | | - | | | 105,758 | | | - |
Short-term borrowings | | 18,502 | | | 18,502 | | | - | | | 18,502 | | | - |
FHLB advances | | 21,204 | | | 21,066 | | | - | | | 21,066 | | | - |
Accrued interest payable | | 346 | | | 346 | | | - | | | 346 | | | - |
| | | | | | | | | | | | | | |
The carrying value of short-term financial instruments, as listed below, approximates their fair value. These instruments generally have limited credit exposure, no stated or short-term maturities, carry interest rates that approximate market and generally are recorded at amounts that are payable on demand:
Cash and cash equivalents; Non-interest bearing deposit accounts; | ·
| | Cash and cash equivalents;
|
| ·
| | Non-interest bearing deposit accounts;
|
| ·
| | Savings, interest-bearing checking and money market accounts and
|
Savings, interest-bearing checking and money market accounts and
Short-term borrowings.
Securities: Fair values on investment securities are determined by prices provided by a third-party vendor, who is a provider of financial market data, analytics and related services to financial institutions.
LoansOriginated loans and leases: The fair value of accruing loans is estimated by calculating the net present value of the future expected cash flows discounted using the exit price notion. The discount rate is based upon current offering rates, with an additional discount for expected potential charge-offs. Additionally, an environmental general credit risk adjustment is subtracted from the net present value to arrive at the total estimated fair value of the accruing loan portfolio.
The carrying value that fair value is compared to is net of the allowance for loan losses and since there is significant judgment included in evaluating credit quality, loans are classified within Level 3 of the fair value hierarchy. The net carrying value of loans acquired through the Wayne Bank branch acquisition approximates the fair value of the loans.
Non-accrual loans: Loans which the Company has measured as non-accruing are generally based on the fair value of the loan’s collateral. Fair value is generally determined based upon independent third-party appraisals of the properties. These loans are classified within Level 3 of the fair value hierarchy. The fair value consists of loan balances less the valuation allowance.
Acquired loans: Acquired loans (performing and non-performing) are initially recorded at their acquisition-date fair values using Level 3 inputs. For more information on the calculation of the fair value of acquired loans, see Footnote 21, “Acquisition.”
Loans held-for-sale: The fair value of loans held-for-sale is estimated using rates currently offered for similar loans and is typically obtained from the Federal National Mortgage Association (FNMA) or the Federal Home Loan Bank of Pittsburgh (FHLB).
Certificates of deposit: The fair value of certificates of deposit is based on discounted cash flows using rates which approximate market rates for deposits of similar maturities.
Secured borrowings: The fair value of certificates of deposit acquired through the Wayne Bank branch acquisition represents the estimated fair value offor these deposits.obligations uses an income approach based on expected cash flows on a pooled basis.
FHLB advances: Fair value is estimated using the rates currently offered for similar borrowings.
The following tables illustrate the financial instruments measured at fair value on a recurring basis segregated by hierarchy fair value levels as of the periods indicated:
| | | | | | | | |
|
|
|
|
|
|
|
|
| | | | | | | | |
|
|
|
|
|
|
|
|
| | | | Quoted prices | | | | |
|
|
| Quoted prices |
|
|
|
|
| | | | in active | | Significant other | | Significant other |
|
|
| in active |
| Significant other |
| Significant other |
| Total carrying value | | markets | | observable inputs | | unobservable inputs | Total carrying value |
| markets |
| observable inputs |
| unobservable inputs |
(dollars in thousands) | December 31, 2018 | | (Level 1) | | (Level 2) | | (Level 3) | December 31, 2021 |
| (Level 1) |
| (Level 2) |
| (Level 3) |
Available-for-sale securities: | | | | | | | | |
|
|
|
|
|
|
|
|
Agency - GSE | $ | 5,917 | | $ | - | | $ | 5,917 | | $ | - | $ | 117,003 |
| $ | - |
| $ | 117,003 |
| $ | - |
Obligations of states and political subdivisions | | 52,575 | | - | | 52,575 | | - |
| 364,710 |
| - |
| 364,710 |
| - |
MBS - GSE residential | | 124,318 | | - | | 124,318 | | - |
| 257,267 |
| - |
| 257,267 |
| - |
Total available-for-sale debt securities | $ | 182,810 | | $ | - | | $ | 182,810 | | $ | - | $ | 738,980 |
| $ | - |
| $ | 738,980 |
| $ | - |
| | | | | | | | |
|
|
|
|
|
|
|
|
| | | | | | | | |
|
|
|
|
|
|
|
|
| | | | | | | | |
|
|
|
|
|
|
|
|
| | | | Quoted prices | | | | |
|
|
| Quoted prices |
|
|
|
|
| | | | in active | | Significant other | | Significant other |
|
|
| in active |
| Significant other |
| Significant other |
| Total carrying value | | markets | | observable inputs | | unobservable inputs | Total carrying value |
| markets |
| observable inputs |
| unobservable inputs |
(dollars in thousands) | December 31, 2017 | | (Level 1) | | (Level 2) | | (Level 3) | December 31, 2020 |
| (Level 1) |
| (Level 2) |
| (Level 3) |
Available-for-sale securities: | | | | | | | | |
|
|
|
|
|
|
|
|
Agency - GSE | $ | 9,099 | | $ | - | | $ | 9,099 | | $ | - | $ | 45,447 |
| $ | - |
| $ | 45,447 |
| $ | - |
Obligations of states and political subdivisions | | 44,306 | | - | | 44,306 | | - |
| 199,713 |
| - |
| 199,713 |
| - |
MBS - GSE residential | | 103,152 | | - | | 103,152 | | - |
| 147,260 |
| - |
| 147,260 |
| - |
Equity securities - financial services | | 828 | | 828 | | - | | - | |
Total available-for-sale securities | $ | 157,385 | | $ | 828 | | $ | 156,557 | | $ | - | |
Total available-for-sale debt securities | | $ | 392,420 |
| $ | - |
| $ | 392,420 |
| $ | - |
| | | | | | | | |
|
|
|
|
|
|
|
|
Equity securities are measured at fair value using quoted market prices for identical assets and are classified within Level 1 of the valuation hierarchy. Debt securities in the AFS portfolio are measured at fair value using market quotations provided by a third-party vendor, who is a provider of financial market data, analytics and related services to financial institutions. Assets classified as Level 2 use
valuation techniques that are common to bond valuations. That is, in active markets whereby bonds of similar characteristics frequently trade, quotes for similar assets are obtained. For the periods ending December 31, 2018 and December 31, 2017, there were no transfers to or from Level 1 and Level 2 fair value measurements for financial assets measured on a recurring basis.
There were no changes in Level 3 financial instruments measured at fair value on a recurring basis as of and for the periods ending December 31, 20182021 and December 31, 2017,2020, respectively.
The following table illustrates the financial instruments measured at fair value on a non-recurring basis segregated by hierarchy fair value levels as of the periods indicated:
| | | | | | | | | | | |
|
|
|
|
|
|
|
|
|
|
|
| | | | | | | | | | | |
|
|
|
|
|
|
|
|
|
|
|
| | | | Quoted prices in | | Significant other | | Significant other |
|
|
| Quoted prices in |
| Significant other |
| Significant other |
| Total carrying value | | active markets | | observable inputs | | unobservable inputs | Total carrying value |
| active markets |
| observable inputs |
| unobservable inputs |
(dollars in thousands) | at December 31, 2018 | | (Level 1) | | (Level 2) | | (Level 3) | at December 31, 2021 |
| (Level 1) |
| (Level 2) |
| (Level 3) |
| | | | | | | | | | | | |
Impaired loans | $ | 1,817 | | $ | - | | $ | - | | $ | 1,817 | $ | 2,245 |
| $ | - |
| $ | - |
| $ | 2,245 |
Other real estate owned | | 184 | | | - | | | - | | | 184 |
| 198 |
|
| - |
|
| - |
|
| 198 |
Total | $ | 2,001 | | $ | - | | $ | - | | $ | 2,001 | $ | 2,443 |
| $ | - |
| $ | - |
| $ | 2,443 |
| | | | | | | | | | | |
|
|
|
|
|
|
|
|
|
|
|
| | | | | | | | | | | |
|
|
|
|
|
|
|
|
|
|
|
| | | | | | | | | | | |
|
|
|
|
|
|
|
|
|
|
|
| | | | Quoted prices in | | Significant other | | Significant other |
|
|
| Quoted prices in |
| Significant other |
| Significant other |
| Total carrying value | | active markets | | observable inputs | | unobservable inputs | Total carrying value |
| active markets |
| observable inputs |
| unobservable inputs |
(dollars in thousands) | at December 31, 2017 | | (Level 1) | | (Level 2) | | (Level 3) | at December 31, 2020 |
| (Level 1) |
| (Level 2) |
| (Level 3) |
| | | | | | | | | | | | |
Impaired loans | $ | 2,952 | | $ | - | | $ | - | | $ | 2,952 | $ | 2,930 |
| $ | - |
| $ | - |
| $ | 2,930 |
Other real estate owned | | 814 | | | - | | | - | | | 814 |
| 182 |
|
| - |
|
| - |
|
| 182 |
Total | $ | 3,766 | | $ | - | | $ | - | | $ | 3,766 | $ | 3,112 |
| $ | - |
| $ | - |
| $ | 3,112 |
| | | | | | | | | | | |
|
|
|
|
|
|
|
|
|
|
|
From time-to-time, the Company may be required to record at fair value financial instruments on a non-recurring basis, such as impaired loans, ORE and other repossessed assets. These non-recurring fair value adjustments involve the application of lower-of-cost-or-market accounting on write downs of individual assets. The fair value of impaired loans was calculated using the value of the impaired loans with an allowance less the related allowance.
The following describes valuation methodologies used for financial instruments measured at fair value on a non-recurring basis. Impaired loans that are collateral dependent are written down to fair value through the establishment of specific reserves, a component of the allowance for loan losses, and as such are carried at the lower of net recorded investment or the estimated fair value. Estimates of fair value of the collateral are determined based on a variety of information, including available valuations from certified appraisers for similar assets, present value of discounted cash flows and inputs that are estimated based on commonly used and generally accepted industry liquidation advance rates and estimates and assumptions developed by management.
Valuation techniques for impaired loans are typically determined through independent appraisals of the underlying collateral or may be determined through present value of discounted cash flows. Both techniques include various Level 3 inputs which are not identifiable. The valuation technique may be adjusted by management for estimated liquidation expenses and qualitative factors such as economic conditions. If real estate is not the primary source of repayment, present value of discounted cash flows and estimates using generally accepted industry liquidation advance rates and other factors may be utilized to determine fair value.
At December 31, 20182021 and December 31, 2017,2020, the range of liquidation expenses and other valuation adjustments applied to impaired loans ranged from -16.70% to -57.89%-33.08% and -47.66% and from -15.95%-27.04% to -51.55%-70.66%, respectively. The weighted-averageweighted average of liquidation expenses and other valuation adjustments applied to impaired loans amounted to -44.42%-44.50% as of December 31, 20182021 and -23.03%-44.49% as of December 31, 2017,2020, respectively. Due to the multitude of assumptions, many of which are subjective in nature, and the varying inputs and techniques used to determine fair value, the Company recognizes that valuations could differ across a wide spectrum of techniques employed. Accordingly, fair value estimates for impaired loans are classified as Level 3.
For ORE, fair value is generally determined through independent appraisals of the underlying properties which generally include various Level 3 inputs which are not identifiable. Appraisals form the basis for determining the net realizable value from these properties. Net realizable value is the result of the appraised value less certain costs or discounts associated with liquidation which occurs in the normal course of business. Management’s assumptions may include consideration of the location and occupancy of the property, along with current economic conditions. Subsequently, as these properties are actively marketed, the estimated fair values may be periodically adjusted through incremental subsequent write-downs. These write-downs usually reflect decreases in estimated values resulting from sales price observations as well as changing economic and market conditions. At December 31, 20182021 and December 31, 2017,2020, the discounts applied to the appraised values of ORE ranged from -18.47% to -68.96%-20.16% and -77.60% and from -17.95% to -99.00%-21.47% and -77.60%, respectively. As of December 31, 20182021, and December 31, 2017,2020, the weighted-averageweighted average of discount to the appraisal values of ORE amounted to -45.83%-28.21% and -35.30%-31.30%, respectively.
At December 31, 2021 and 2020, there were 0 other repossessed assets. The Company refers to the National Automobile Dealers Association (NADA) guide to determine a vehicle’s fair value.
Financial Instruments with Off-Balance Sheet Risk
The Company is a party to financial instruments with off-balance sheet risk in the normal course of business to meet the financing needs of its customers. These financial instruments include commitments to extend credit and standby letters of credit. Those instruments involve, to varying degrees, elements of credit risk in excess of the amount recognized in the balance sheet. The contract or notional amounts of those instruments reflect the extent of the Company’s involvement in particular classes of financial instruments. Because of the nature of these instruments, the fair values of these off-balance sheet items are not material.
The notional amount of the Company’s financial instruments with off-balance sheet risk was as follows:
| | | | |
|
|
|
|
| December 31, | December 31, |
(dollars in thousands) | | 2018 | | | 2017 |
| 2021 |
|
| 2020 |
Off-balance sheet financial instruments: | | | | |
|
|
|
|
Commitments to extend credit | $ | 144,710 | | $ | 136,398 | $ | 306,852 |
| $ | 262,816 |
Standby letters of credit | | 2,690 | | 4,488 |
| 6,352 |
| 3,946 |
Commitments to Extend Credit and Standby Letters of Credit
The Company’s exposure to credit loss from nonperformance by the other party to the financial instruments for commitments to extend credit and standby letters of credit is represented by the contractual amount of those instruments. The Company uses the same credit policies in making commitments and conditional obligations as it does for on-balance sheet instruments.
Commitments to extend credit are legally binding agreements to lend to customers. Commitments generally have fixed expiration dates or other termination clauses and may require payment of fees. Since commitments may expire without being drawn upon, the total commitment amounts do not necessarily represent future liquidity requirements. The Company
evaluates each customer’s credit-worthiness on a case-by-case basis. The amount of collateral obtained, if considered necessary by the Company on extension of credit, is based on management’s credit assessment of the customer.
Financial standby letters of credit are conditional commitments issued by the Company to guarantee performance of a customer to a third party. Those guarantees are issued primarily to support public and private borrowing arrangements, including commercial paper, bond financing, and similar transactions. The Company’s performance under the guarantee is required upon presentation by the beneficiary of the financial standby letter of credit. The credit risk involved in issuing letters of credit is essentially the same as that involved in extending loan facilities to customers. The Company was not required to recognize any liability in connection with the issuance of these financial standby letters of credit.
The following table summarizes outstanding financial letters of credit as of December 31, 2018:2021:
| | | | | | | | |
|
|
|
|
|
|
|
|
| | | | More than | | | | | |
|
|
| More than |
|
|
|
|
|
| Less than | | one year to | | Over five | | | Less than |
| one year to |
| Over five |
|
|
(dollars in thousands) | one year | | five years | | years | | Total | one year |
| five years |
| years |
| Total |
Secured by: | | | | | | | | |
|
|
|
|
|
|
|
|
Collateral | $ | 1,897 | | $ | 235 | | $ | 150 | | $ | 2,282 | $ | 1,835 |
| $ | 423 |
| $ | 2,014 |
| $ | 4,272 |
Bank lines of credit | | 3 | | - | | - | | 3 |
| 353 |
| 108 |
| - |
| 461 |
Other | |
| 1,152 |
| - |
| - |
| 1,152 |
| | 1,900 | | 235 | | 150 | | 2,285 |
| 3,340 |
| 531 |
| 2,014 |
| 5,885 |
Unsecured | | 83 | | 322 | | - | | 405 |
| 30 |
| 437 |
| - |
| 467 |
Total | $ | 1,983 | | $ | 557 | | $ | 150 | | $ | 2,690 | $ | 3,370 |
| $ | 968 |
| $ | 2,014 |
| $ | 6,352 |
The Company has not0t incurred losses on its commitments in 2018, 20172021, 2020 or 2016.2019.
14.EARNINGS PER SHARE
Basic earnings per share (EPS) is computed by dividing net income available to common shareholders by the weighted-average number of common shares outstanding for the period. Diluted EPS is computed in the same manner as basic EPS but also reflects the potential dilution that could occur from the grant of stock-based compensation awards. The Company maintains two2 active share-based compensation plans that may generate additional potentially dilutive common shares. For granted and unexercised stock options and stock-settled stock appreciation rights (SSARs), dilution would occur if Company-issued stock options or SSARs were exercised and converted into common stock. As of the years ended December 31, 2018, 20172021, 2020 and 2016,2019, there were 29,301, 14,30028,770, 24,644 and 2,96932,091 potentially dilutive shares related to issued and unexercised stock options and SSARs. The calculation did not include 11,073 unexercised SSARs that could potentially dilute earnings per share but their effect was antidilutive as of December 31, 2021. For restricted stock, dilution would occur from the Company’s previously granted but unvested shares.
There were 13,893, 9,61912,705, 5,496 and 8,11410,720 potentially dilutive shares related to unvested restricted share grants as of the years ended December 31, 2018, 20172021, 2020 and 2016,2019, respectively.
In the computation of diluted EPS, the Company uses the treasury stock method to determine the dilutive effect of its granted but unexercised stock options and SSARs and unvested restricted stock. Under the treasury stock method, the assumed proceeds, as defined, received from shares issued in a hypothetical stock option exercise or restricted stock grant, are assumed to be used to purchase treasury stock. Proceeds include:include amounts received from the exercise of outstanding stock options and compensation cost for future service that the Company has not yet recognized in earnings. The Company does not consider awards from share-based grants in the computation of basic EPS.
The following table illustrates the data used in computing basic and diluted EPS for the years indicated:
| | | | | | |
|
|
|
|
|
|
| | | | | | |
|
|
|
|
|
|
| Years ended December 31, |
|
|
|
|
|
| 2018 | | 2017 | | 2016 | 2021 |
| 2020 |
| 2019 |
(dollars in thousands except per share data) | | | | | | |
|
|
|
|
|
|
Basic EPS: | | | | | | |
|
|
|
|
|
|
Net income available to common shareholders | $ | 11,006 | | $ | 8,716 | | $ | 7,693 | $ | 24,008 |
| $ | 13,035 |
| $ | 11,576 |
Weighted-average common shares outstanding | | 3,752,704 | | 3,711,490 | | 3,679,507 |
| 5,321,687 |
| 4,586,224 |
| 3,779,582 |
Basic EPS | $ | 2.93 | | $ | 2.35 | | $ | 2.09 | $ | 4.51 |
| $ | 2.84 |
| $ | 3.06 |
| | | | | | |
|
|
|
|
|
|
Diluted EPS: | | | | | | |
|
|
|
|
|
|
Net income available to common shareholders | $ | 11,006 | | $ | 8,716 | | $ | 7,693 | $ | 24,008 |
| $ | 13,035 |
| $ | 11,576 |
Weighted-average common shares outstanding | | 3,752,704 | | 3,711,490 | | 3,679,507 |
| 5,321,687 |
| 4,586,224 |
| 3,779,582 |
Potentially dilutive common shares | | 43,194 | | 23,919 | | 11,083 |
| 41,475 |
| 30,140 |
| 42,811 |
Weighted-average common and potentially dilutive shares outstanding | | 3,795,898 | | 3,735,409 | | 3,690,590 |
| 5,363,162 |
| 4,616,364 |
| 3,822,393 |
Diluted EPS | $ | 2.90 | | $ | 2.33 | | $ | 2.09 | $ | 4.48 |
| $ | 2.82 |
| $ | 3.03 |
15.REGULATORY MATTERS
The Company (on a consolidated basis) and the Bank are subject to various regulatory capital requirements administered by the federal banking agencies. Failure to meet minimum capital requirements can initiate certain mandatory and possible additional discretionary actions by regulators that, if undertaken, could have a direct material effect on the Company’s and the Bank’s financial statements. Under capital adequacy guidelines and the regulatory framework for prompt corrective action, the Company and the Bank must meet specific capital guidelines that involve quantitative measures of their assets, liabilities and certain off-balance-sheet items as calculated under regulatory accounting practices. The capital amounts and classification are also subject to qualitative judgments by the regulators about components, risk-weightings and other factors. Prompt corrective action provisions are not applicable to bank holding companies.
Under these guidelines, assets and certain off-balance sheet items are assigned to broad risk categories, each with appropriate weights. The resulting capital ratios represent capital as a percentage of total risk-weighted assets. The guidelines require all banks and bank holding companies to maintain a minimum ratio of total risk-based capital to total risk-weighted assets (Total Risk Adjusted Capital) of 8%, including Tier I common equity to total risk-weighted assets (Tier I Common Equity) of 4.5%, Tier I capital to total risk-weighted assets (Tier I Capital) of 6% and Tier I capital to average total assets (Leverage Ratio) of at least 4%. A capital conservation buffer, comprised of common equity Tier I capital, is also established above the regulatory minimum capital requirements rising up toof 2.50% by 2019.. As of December 31, 20182021 and 2017,2020, the Company and the Bank exceeded all capital adequacy requirements to which it was subject.
The following table reflects the actual and required capital and the related capital ratios as of the periods indicated. No amounts were deducted from capital for interest-rate risk in either 20182021 or 2017. 2020.
|
|
|
|
|
|
|
|
|
|
|
|
|
|
|
|
|
|
|
|
|
|
|
|
|
|
|
|
|
|
|
|
|
|
|
|
|
|
|
|
|
|
|
|
|
|
|
|
|
|
| For capital adequacy |
| To be well capitalized |
|
|
|
|
| For capital |
| purposes with capital |
| under prompt corrective |
| Actual | adequacy purposes |
| conservation buffer* |
| action provisions |
(dollars in thousands) | Amount |
| Ratio | Amount | Ratio |
| Amount | Ratio |
| Amount | Ratio |
As of December 31, 2021: |
|
|
|
|
|
|
|
|
|
|
|
|
|
|
|
|
|
|
|
|
|
|
|
|
|
|
|
|
|
|
|
|
|
|
|
|
|
|
|
|
|
Total capital (to risk-weighted assets) |
|
|
|
|
|
|
|
|
|
|
|
|
|
|
|
|
|
|
|
|
Consolidated | $ | 205,667 |
| 14.5% | ≥ | $ | 113,421 |
| 8.0% | ≥ | $ | 148,866 |
| 10.5% |
|
|
| N/A |
| N/A |
Bank | $ | 205,726 |
| 14.5% | ≥ | $ | 113,406 |
| 8.0% | ≥ | $ | 148,845 |
| 10.5% |
| ≥ | $ | 141,757 |
| 10.0% |
|
|
|
|
|
|
|
|
|
|
|
|
|
|
|
|
|
|
|
|
|
Tier 1 common equity (to risk-weighted assets) |
|
|
|
|
|
|
|
|
|
|
|
|
|
|
|
|
|
|
|
|
Consolidated | $ | 189,980 |
| 13.4% | ≥ | $ | 63,800 |
| 4.5% | ≥ | $ | 99,244 |
| 7.0% |
|
|
| N/A |
| N/A |
Bank | $ | 190,039 |
| 13.4% | ≥ | $ | 63,791 |
| 4.5% | ≥ | $ | 99,230 |
| 7.0% |
| ≥ | $ | 92,142 |
| 6.5% |
|
|
|
|
|
|
|
|
|
|
|
|
|
|
|
|
|
|
|
|
|
Tier I capital (to risk-weighted assets) |
|
|
|
|
|
|
|
|
|
|
|
|
|
|
|
|
|
|
|
|
Consolidated | $ | 189,980 |
| 13.4% | ≥ | $ | 85,066 |
| 6.0% | ≥ | $ | 120,510 |
| 8.5% |
|
|
| N/A |
| N/A |
Bank | $ | 190,039 |
| 13.4% | ≥ | $ | 85,054 |
| 6.0% | ≥ | $ | 120,493 |
| 8.5% |
| ≥ | $ | 113,406 |
| 8.0% |
|
|
|
|
|
|
|
|
|
|
|
|
|
|
|
|
|
|
|
|
|
Tier I capital (to average assets) |
|
|
|
|
|
|
|
|
|
|
|
|
|
|
|
|
|
|
|
|
Consolidated | $ | 189,980 |
| 7.9% | ≥ | $ | 95,688 |
| 4.0% | ≥ | $ | 95,688 |
| 4.0% |
|
|
| N/A |
| N/A |
Bank | $ | 190,039 |
| 7.9% | ≥ | $ | 95,680 |
| 4.0% | ≥ | $ | 95,680 |
| 4.0% |
| ≥ | $ | 119,600 |
| 5.0% |
|
|
|
|
|
|
|
|
|
|
|
|
|
|
|
|
|
|
|
|
|
| | | | | | | | | | | | | | | | | | | | |
|
|
|
|
|
|
|
|
|
|
|
|
|
|
|
|
|
|
|
|
| | | | | | | | | | | | | | | | | | |
|
|
|
|
|
|
|
|
|
|
|
|
|
|
|
|
|
|
|
|
| | | | | | | | | | | For capital adequacy | | To be well capitalized | |
| | | | | For capital | | purposes with capital | | under prompt corrective | |
| Actual | adequacy purposes | | conservation buffer* | | action provisions | |
(dollars in thousands) | Amount | | Ratio | Amount | Ratio | | Amount | Ratio | | Amount | Ratio | |
As of December 31, 2018: | | | | | | | | | | | | | | | | | | | | | |
As of December 31, 2020: | |
|
|
|
|
|
|
|
|
|
|
|
|
|
|
|
|
|
|
|
|
| | | | | | | | | | | | | | | | | | | | |
|
|
|
|
|
|
|
|
|
|
|
|
|
|
|
|
|
|
|
|
Total capital (to risk-weighted assets) | | | | | | | | | | | | | | | | | | | | |
|
|
|
|
|
|
|
|
|
|
|
|
|
|
|
|
|
|
|
|
Consolidated | $ | 103,201 | | 14.8% | ≥ | $ | 55,975 | | 8.0% | ≥ | $ | 69,094 | | 9.9% | | | | N/A | | N/A | $ | 161,199 |
| 16.5% | ≥ | $ | 78,356 |
| 8.0% | ≥ | $ | 102,842 |
| 10.5% |
|
|
| N/A |
| N/A |
Bank | $ | 103,313 | | 14.8% | ≥ | $ | 55,970 | | 8.0% | ≥ | $ | 69,088 | | 9.9% | | ≥ | $ | 69,962 | | 10.0% | $ | 161,145 |
| 16.5% | ≥ | $ | 78,342 |
| 8.0% | ≥ | $ | 102,823 |
| 10.5% |
| ≥ | $ | 97,927 |
| 10.0% |
| | | | | | | | | | | | | | | | | | | | |
|
|
|
|
|
|
|
|
|
|
|
|
|
|
|
|
|
|
|
|
Tier 1 common equity (to risk-weighted assets) | | | | | | | | | | | | | | | | | | | | |
|
|
|
|
|
|
|
|
|
|
|
|
|
|
|
|
|
|
|
|
Consolidated | $ | 94,442 | | 13.5% | ≥ | $ | 31,486 | | 4.5% | ≥ | $ | 44,605 | | 6.4% | | | | N/A | | N/A | $ | 148,931 |
| 15.2% | ≥ | $ | 44,075 |
| 4.5% | ≥ | $ | 68,562 |
| 7.0% |
|
|
| N/A |
| N/A |
Bank | $ | 94,554 | | 13.5% | ≥ | $ | 31,483 | | 4.5% | ≥ | $ | 44,601 | | 6.4% | | ≥ | $ | 45,475 | | 6.5% | $ | 148,879 |
| 15.2% | ≥ | $ | 44,067 |
| 4.5% | ≥ | $ | 68,549 |
| 7.0% |
| ≥ | $ | 63,653 |
| 6.5% |
| | | | | | | | | | | | | | | | | | | | |
|
|
|
|
|
|
|
|
|
|
|
|
|
|
|
|
|
|
|
|
Tier I capital (to risk-weighted assets) | | | | | | | | | | | | | | | | | | | | |
|
|
|
|
|
|
|
|
|
|
|
|
|
|
|
|
|
|
|
|
Consolidated | $ | 94,442 | | 13.5% | ≥ | $ | 41,981 | | 6.0% | ≥ | $ | 55,100 | | 7.9% | | | | N/A | | N/A | $ | 148,931 |
| 15.2% | ≥ | $ | 58,767 |
| 6.0% | ≥ | $ | 83,253 |
| 8.5% |
|
|
| N/A |
| N/A |
Bank | $ | 94,554 | | 13.5% | ≥ | $ | 41,977 | | 6.0% | ≥ | $ | 55,095 | | 7.9% | | ≥ | $ | 55,970 | | 8.0% | $ | 148,879 |
| 15.2% | ≥ | $ | 58,756 |
| 6.0% | ≥ | $ | 83,238 |
| 8.5% |
| ≥ | $ | 78,342 |
| 8.0% |
| | | | | | | | | | | | | | | | | | | | |
|
|
|
|
|
|
|
|
|
|
|
|
|
|
|
|
|
|
|
|
Tier I capital (to average assets) | | | | | | | | | | | | | | | | | | | | |
|
|
|
|
|
|
|
|
|
|
|
|
|
|
|
|
|
|
|
|
Consolidated | $ | 94,442 | | 9.8% | ≥ | $ | 38,593 | | 4.0% | ≥ | $ | 38,593 | | 4.0% | | | | N/A | | N/A | $ | 148,931 |
| 8.8% | ≥ | $ | 67,584 |
| 4.0% | ≥ | $ | 67,584 |
| 4.0% |
|
|
| N/A |
| N/A |
Bank | $ | 94,554 | | 9.8% | ≥ | $ | 38,591 | | 4.0% | ≥ | $ | 38,591 | | 4.0% | | ≥ | $ | 48,238 | | 5.0% | $ | 148,879 |
| 8.8% | ≥ | $ | 67,584 |
| 4.0% | ≥ | $ | 67,584 |
| 4.0% |
| ≥ | $ | 84,479 |
| 5.0% |
| | | | | | | | | | | | | | | | | | | | |
|
|
|
|
|
|
|
|
|
|
|
|
|
|
|
|
|
|
|
|
| | | | | | | | | | | | | | | | | | | | |
| | | | | | | | | | | | | | | | | | | | |
As of December 31, 2017: | | | | | | | | | | | | | | | | | | | | |
| | | | | | | | | | | | | | | | | | | | |
Total capital (to risk-weighted assets) | | | | | | | | | | | | | | | | | | | | |
Consolidated | $ | 93,204 | | 14.9% | ≥ | $ | 50,028 | | 8.0% | ≥ | $ | 57,845 | | 9.3% | | | | N/A | | N/A |
Bank | $ | 93,130 | | 14.9% | ≥ | $ | 50,122 | | 8.0% | ≥ | $ | 57,954 | | 9.3% | | ≥ | $ | 62,653 | | 10.0% |
| | | | | | | | | | | | | | | | | | | | |
Tier 1 common equity (to risk-weighted assets) | | | | | | | | | | | | | | | | | | | | |
Consolidated | $ | 85,369 | | 13.7% | ≥ | $ | 28,141 | | 4.5% | ≥ | $ | 35,957 | | 5.8% | | | | N/A | | N/A |
Bank | $ | 85,280 | | 13.6% | ≥ | $ | 28,194 | | 4.5% | ≥ | $ | 36,025 | | 5.8% | | ≥ | $ | 40,724 | | 6.5% |
| | | | | | | | | | | | | | | | | | | | |
Tier I capital (to risk-weighted assets) | | | | | | | | | | | | | | | | | | | | |
Consolidated | $ | 85,369 | | 13.7% | ≥ | $ | 37,521 | | 6.0% | ≥ | $ | 45,338 | | 7.3% | | | | N/A | | N/A |
Bank | $ | 85,280 | | 13.6% | ≥ | $ | 37,592 | | 6.0% | ≥ | $ | 45,423 | | 7.3% | | ≥ | $ | 50,122 | | 8.0% |
| | | | | | | | | | | | | | | | | | | | |
Tier I capital (to average assets) | | | | | | | | | | | | | | | | | | | | |
Consolidated | $ | 85,369 | | 9.9% | ≥ | $ | 34,471 | | 4.0% | ≥ | $ | 34,471 | | 4.0% | | | | N/A | | N/A |
Bank | $ | 85,280 | | 9.9% | ≥ | $ | 34,483 | | 4.0% | ≥ | $ | 34,483 | | 4.0% | | ≥ | $ | 43,103 | | 5.0% |
| | | | | | | | | | | | | | | | | | | | |
* The minimums under Basel III increase by 0.625% (theincreased to include the capital conservation buffer) annually until 2019.buffer of 2.50%.
The Company’s principal source of funds for dividend payments is dividends received from the Bank. Banking regulations and Pennsylvania law limit the amount of dividends that may be paid from the Bank to the Company without prior approval of regulatory agencies. Accordingly, at December 31, 2018,2021, approximately $86.0$114.6 million was available for dividend distribution from the Bank to the Company in 2019. 2021.
16.RELATED PARTY TRANSACTIONS
During the ordinary course of business, loans are made to executive officers, directors, greater than 5% shareholders and associates of such persons. These transactions are executed on substantially the same terms and at the rates prevailing at the time for comparable transactions with others. These loans do not involve more than the normal risk of collectability or present other unfavorable features. A summary of loan activity with officers, directors, associates of such persons and shareholders who own more than 5% of the Company’s outstanding shares is as follows:
| | | | | | |
|
|
|
|
|
|
| Years ended December 31, | Years ended December 31, |
(dollars in thousands) | 2018 | | 2017 | | 2016 | 2021 |
| 2020 |
| 2019 |
Balance, beginning | $ | 6,497 | | $ | 7,849 | | $ | 6,983 | $ | 9,885 |
| $ | 6,765 |
| $ | 6,542 |
Adjustments for changes in position | |
| 1,022 |
| (1,063) |
| - |
Additions | | 1,314 | | 1,111 | | 2,629 |
| 7,228 |
| 7,156 |
| 1,864 |
Collections | | (1,269) | | (2,463) | | (1,763) |
| (6,630) |
| (2,973) |
| (1,641) |
| | | | | | |
|
|
|
|
|
|
Balance, ending | $ | 6,542 | | $ | 6,497 | | $ | 7,849 | $ | 11,505 |
| $ | 9,885 |
| $ | 6,765 |
As of December 31, 2018, 20172021, 2020 and 2016,2019, deposits from executive officers and directors and associates of such persons approximated $14.4$39.0 million, $14.3$27.9 million and $12.9$14.8 million, respectively.
17.QUARTERLY FINANCIAL INFORMATION (UNAUDITED)CONTINGENCIES
The following is a summary of quarterly results of operations for the years indicated:
| | | | | | | | | | | | | | |
| 2018 |
| First | | Second | | Third | | Fourth | | | |
(dollars in thousands except per share data) | quarter | | quarter | | quarter | | quarter | | Total |
Interest income | $ | 8,143 | | $ | 8,535 | | $ | 9,028 | | $ | 9,624 | | $ | 35,330 |
Interest expense | | (884) | | | (1,012) | | | (1,317) | | | (1,660) | | | (4,873) |
| | | | | | | | | | | | | | |
Net interest income | | 7,259 | | | 7,523 | | | 7,711 | | | 7,964 | | | 30,457 |
Provision for loan losses | | (300) | | | (425) | | | (400) | | | (325) | | | (1,450) |
Loss on write-down/sale of investment securities | | (58) | | | 107 | | | 5 | | | - | | | 54 |
Other income | | 2,341 | | | 2,264 | | | 2,278 | | | 2,263 | | | 9,146 |
Other expenses | | (6,208) | | | (6,162) | | | (6,172) | | | (6,530) | | | (25,072) |
Income before taxes | | 3,034 | | | 3,307 | | | 3,422 | | | 3,372 | | | 13,135 |
(Provision) credit for income taxes | | (506) | | | (539) | | | (559) | | | (525) | | | (2,129) |
Net income | $ | 2,528 | | $ | 2,768 | | $ | 2,863 | | $ | 2,847 | | $ | 11,006 |
Net income per share - basic | $ | 0.67 | | $ | 0.74 | | $ | 0.76 | | $ | 0.76 | | $ | 2.93 |
Net income per share - diluted | $ | 0.67 | | $ | 0.73 | | $ | 0.75 | | $ | 0.75 | | $ | 2.90 |
| | | | | | | | | | | | | | |
| 2017 |
| First | | Second | | Third | | Fourth | | | |
(dollars in thousands except per share data) | quarter | | quarter | | quarter | | quarter | | Total |
Interest income | $ | 7,366 | | $ | 7,854 | | $ | 7,928 | | $ | 7,916 | | $ | 31,064 |
Interest expense | | (688) | | | (787) | | | (882) | | | (866) | | | (3,223) |
| | | | | | | | | | | | | | |
Net interest income | | 6,678 | | | 7,067 | | | 7,046 | | | 7,050 | | | 27,841 |
Provision for loan losses | | (325) | | | (225) | | | (375) | | | (525) | | | (1,450) |
Loss on sale of investment securities | | - | | | - | | | - | | | (147) | | | (147) |
Other income | | 2,105 | | | 2,131 | | | 2,248 | | | 2,029 | | | 8,513 |
Other expenses | | (5,797) | | | (6,051) | | | (6,035) | | | (6,953) | | | (24,836) |
Income before taxes | | 2,661 | | | 2,922 | | | 2,884 | | | 1,455 | | | 9,922 |
(Provision) credit for income taxes | | (681) | | | (739) | | | (658) | | | 872 | | | (1,206) |
Net income | $ | 1,980 | | $ | 2,183 | | $ | 2,226 | | $ | 2,327 | | $ | 8,716 |
Net income per share - basic | $ | 0.53 | | $ | 0.59 | | $ | 0.60 | | $ | 0.63 | | $ | 2.35 |
Net income per share - diluted | $ | 0.53 | | $ | 0.59 | | $ | 0.60 | | $ | 0.61 | | $ | 2.33 |
| | | | | | | | | | | | | | |
| 2016 |
| First | | Second | | Third | | Fourth | | | |
(dollars in thousands except per share data) | quarter | | quarter | | quarter | | quarter | | Total |
Interest income | $ | 6,736 | | $ | 6,715 | | $ | 7,006 | | $ | 7,038 | | $ | 27,495 |
Interest expense | | (598) | | | (574) | | | (585) | | | (601) | | | (2,358) |
| | | | | | | | | | | | | | |
Net interest income | | 6,138 | | | 6,141 | | | 6,421 | | | 6,437 | | | 25,137 |
Provision for loan losses | | (150) | | | (275) | | | (225) | | | (375) | | | (1,025) |
Gain on sale of investment securities | | - | | | 9 | | | - | | | - | | | 9 |
Other income | | 1,687 | | | 2,091 | | | 2,024 | | | 2,194 | | | 7,996 |
Other expenses | | (5,388) | | | (5,369) | | | (5,409) | | | (5,489) | | | (21,655) |
Income before taxes | | 2,287 | | | 2,597 | | | 2,811 | | | 2,767 | | | 10,462 |
Provision for income taxes | | (586) | | | (669) | | | (776) | | | (738) | | | (2,769) |
Net income | $ | 1,701 | | $ | 1,928 | | $ | 2,035 | | $ | 2,029 | | $ | 7,693 |
Net income per share - basic | $ | 0.46 | | $ | 0.53 | | $ | 0.55 | | $ | 0.55 | | $ | 2.09 |
Net income per share - diluted | $ | 0.46 | | $ | 0.53 | | $ | 0.55 | | $ | 0.55 | | $ | 2.09 |
18.CONTINGENCIES
The nature of the Company’s business generates litigation involving matters arising in the ordinary course of business. However, in the opinion of management of the Company after consulting with the Company’s legal counsel, no legal proceedings are pending, which, if determined adversely to the Company or the Bank, would have a material effect on the Company’s shareholders’ equity or results of operations. NoNaN legal proceedings are pending other than ordinary routine litigation incident to the business of the Company and the Bank. In addition, to management’s knowledge, no government authorities have initiated or contemplated any material legal actions against the Company or the Bank.
19.18.RECENT ACCOUNTING PRONOUNCEMENTS
In June 2016, the Financial Accounting Standards Board (FASB) issued Accounting Standard Update (ASU) 2016-13, Financial Instruments – Credit Losses (Topic 326) Measurement of Credit Losses on Financial Instruments (CECL). The amendments in this update require financial assets measured at amortized cost basis to be presented at the net amount expected to be collected, through an allowance for credit losses that is deducted from the amortized cost basis. Previously, when credit losses were measured under GAAP, an entity only considered past events and current conditions when measuring the incurred loss. The amendments in this update broaden the information that an entity must consider in developing its expected credit loss estimate for assets measured either collectively or individually. The measurement of expected credit losses is based on relevant information about past events, including historical experience, current conditions, and reasonable and supportable forecasts that affect the collectability of the reported amount. An entity must use judgement in determining the relevant information and estimation methods that are appropriate under the circumstances. The amendments in this update also require that credit losses on available-for-sale debt securities be presented as an allowance for credit losses rather than a writedown.
In November 2018, the FASB issued ASU 2018-19, Codification Improvements to Topic 326, which clarifies that receivables arising from operating leases are not within the scope of Topic 326. In December 2018, regulators issued a final rule related to regulatory capital (Regulatory Capital Rule: Implementation and Transition of the Current Expected Credit Losses Methodology for Allowances and Related Adjustments to the Regulatory Capital Rule and Conforming Amendments to Other Regulations) which is intended to provide regulatory capital relief for entities transitioning to CECL. In April 2019, the FASB issued ASU 2019-04, Codification Improvements to Topic 326, Financial Instruments – Credit Losses, Topic 815, Derivatives and Hedging and Topic 825, Financial Instruments. As it relates to CECL, this guidance amends certain provisions contained in ASU 2016-13, particularly in regards to the inclusion of accrued interest in the definition of amortized cost, as well as clarifying that extension and renewal options that are not unconditionally cancelable by the entity that are included in the original or modified contract should be considered in the entity’s determination of expected credit losses.
The amendments in this update are effective for fiscal years, including interim periods within those fiscal years, beginning after December 15, 2019 for public companies. Early adoption is permitted beginning after December 15, 2018, including interim periods within those fiscal years. An entity will apply the amendments in this update through a cumulative-effect adjustment to retained earnings as of the beginning of the period of adoption (modified-retrospective approach). Upon adoption, the change in this accounting guidance could result in an increase in the Company's allowance for loan losses and require the Company to record loan losses more rapidly. On October 16, 2019, the FASB decided to move forward with finalizing its proposal to defer the effective date for ASU 2016-13 for smaller reporting companies to fiscal years beginning after December 31, 2022, including interim periods within those fiscal periods. Since the Company currently meets the SEC definition of a smaller reporting company, the delay will be applicable to the Company. The Company has engaged the
services of a qualified third-party service provider to assist management in estimating credit allowances under this standard and is currently evaluating the impact of ASU 2016-13 on its consolidated financial statements. The current allowance for loan losses calculation is expected to be run side-by-side with the CECL model in the 2nd, 3rd and 4th quarters of 2022 to gain a better understanding of the effects of the change.
In May 2014,August 2018, the FASB issued ASU 2014-09, Revenue from Contracts with Customers, which supersedes nearly all existing revenue recognition guidance under U.S. GAAP. The core principle of ASU 2014-09 is to recognize revenues when promised goods or services are transferred to customers in an amount that reflects the consideration to which an entity expects to be entitled for those goods or services. ASU 2014-09 defines a five step process to achieve this core principle and, in doing so, more judgment and estimates may be required within the revenue recognition process than are required under existing U.S. GAAP: identify the contract(s) with a customer; identify the performance obligations in the contract; determine the transaction price; allocate the transaction price to the performance obligations in the contract; recognize revenue when (or as) the entity satisfies a performance obligation.
The Company adopted this guidance on January 1, 2018 using the modified retrospective approach. The adoption of ASU 2014-09 did not materially change the method in which the Company recognizes revenue. As a result, the Company changed the process for recognizing revenue for estate fees within fees from trust fiduciary services. The Company concluded the cumulative adjustment to retained earnings for estates in process was immaterial and the income was recognized during the first quarter of 2018. See “Revenue Recognition” in footnote 1 for more information.
In January 2016, the FASB issued ASU 2016-01 related to Financial Instruments2018-14, Compensation - OverallRetirement Benefits - Defined Benefit Plans - General (Subtopic 825-10) Recognition and Measurement of Financial Assets and Financial Liabilities715-20). The update applies to all entities that hold financial assets or owe financial liabilities. The amendments in this update make targeted improvements to U.S. GAAP as follows:
| ·
| | Require equity investments to be measured at fair value with changes in fair value recognized in net income;
|
| ·
| | Simplify the impairment assessment of equity investments without readily determinable fair values by requiring a qualitative assessment to identify impairment;
|
| ·
| | Require public business entities to use the exit price notion when measuring fair value of financial instruments for disclosure purposes;
|
| ·
| | Require separate presentation of financial assets and financial liabilities by measurement category and form of financial asset;
|
| ·
| | Clarify that an entity should evaluate the need for a valuation allowance on a deferred tax asset related to available-for-sale securities.
|
The Company adopted this guidance on January 1, 2018. The adoption did not have a material impact onchange the consolidated financial statements. As a result of this guidance, the Company reclassified $0.4 million in net unrealized gains on equity securities from accumulated other comprehensive income to retained earnings on January 1, 2018 and the Company measured the fair value of its loan portfolio using the exit price notion. See “Fair Value Measurements” in footnote 13disclosure requirements for more information about the fair value measurement of the loan portfolio.
In February 2016, the FASB issued ASU 2016-02, Leases (Topic 842) to increase transparency and comparability among organizations by recognizing lease assets and lease liabilities on the balance sheet and disclosing key information about
leasing arrangements. ASU 2016-02 requires the recognition of a right-of-use asset and related lease liability by lessees for leases classified as operating leases under GAAP. The Company is expected to make an election to exclude leases less than 12 months from the provisions of this ASU. The amendments in this update are effective for the Company for fiscal years beginning after December 15, 2018, including interim periods within those fiscal years. Early adoption of the amendments in this update is permitted. A modified retroactive approach must be applied for leases existing at, or entered into after, the beginning of the earliest comparative period. The Company had several lease agreements, such as branch locations, which were considered operating leases, and therefore not recognized on the Company’s consolidated balance sheets. Upon adoption, this change in accounting guidance could also potentially impact debt covenant agreements with our customers. On January 1, 2019, the Company made an adjustment to add $4.1 million to the consolidated balance sheet as a right-of-use-asset and $4.6 million as a lease liability. There was not any significant effect on the consolidated statements of income.
In July 2018, the FASB issued ASU 2018-10, Codification Improvements to Topic 842, Leases and ASU 2018-11, Leases (Topic 842) Targeted Improvements to clarify how to apply certain aspects of ASU 2016-02 and to simplify adoption and reduce costs. ASU 2018-11 allows companies the option to apply the provisions of the new lease standard prospectively as of the effective date, without adjusting comparative periods, and recognizes a cumulative-effect adjustment to the opening balance of retained earnings in the period of adoption. The Company used this additional transition method. The amendments in this update are effective upon adoption of Topic 842.
In December 2018, the FASB issued ASU 2018-20, Leases (Topic 842): Narrow-Scope Improvements for Lessors to assist stakeholders with implementation questions and issues on certain issues. The amendments in this update are effective upon adoption of Topic 842.
In August 2016, the FASB released ASU 2016-15, Statement of Cash Flows (Topic 230) to clarify the presentation of certain cash receipts and payments on the statement of cash flows. The update addressed eight specific cash flow issues with the objective of reducing the existing diversity in practice. The amendments in this update are effective for public business entities for fiscal years beginning after December 15, 2017, and interim periods within those fiscal years. Early adoption is permitted, including adoption in an interim period. The amendments in this update should be applied using a retrospective transition method to each period presented. The Company adopted ASU 2016-15 on January 1, 2018 and it did not have a significant impact on the Company’s consolidated financial statements.
In January 2017, the FASB issued ASU 2017-04, Intangibles-Goodwill and Other (Topic 350) to simplify the test for goodwill impairment. To simplify the subsequent measurement of goodwill, the FASB eliminated Step 2 from the goodwill impairment test. Under the amendments in this update, an entity should perform its annual goodwill impairment test by comparing the fair value of a reporting unit with its carrying amount. An entity should recognize an impairment charge for the amount by which the carrying amount exceeds the reporting units fair value; however, the loss recognized should not exceed the total amount of goodwill allocated to that reporting unit. An entity should apply the amendments in his update on a prospective basis. The amendments in this update are effective for the Company for its annual goodwill impairment tests in fiscal years beginning after December 15, 2019. Early adoption is permitted for interim or annual goodwill impairment tests performed on testing dates after January 1, 2017. The Company adopted this standard in 2017 and it did not have an impact on its consolidated financial statements. The Company did not have any goodwill prior to adoption of this update.
In March 2017, the FASB issued ASU 2017-08, Receivables-Nonrefundable Fees and Other Costs (Subtopic 310-20) Premium Amortization on Purchased Callable Debt Securities to amend the amortization period for certain purchased callable debt securities held at a premium. The amendments in this update shorten the amortization period for the premium to the earliest call date.defined benefit plans. The amendments in this update are effective for fiscal years and interim periods within those fiscal years, beginningending after December 15, 2018. Early adoption is permitted, including adoption in an interim period.2020 for the Company. An entity should apply the amendments in this update on a modified retrospective basis through a cumulative effect adjustment directly to retained earnings as ofall periods presented. The update was adopted by the beginning ofCompany on January 1, 2021 and the period of adoption. The Company adoptedamendments in this standard in 2017 and itupdate did not have an effecta material impact on its consolidated financial statements.the Company’s disclosures.
In February 2018,March 2020, the FASB releasedissued ASU 2018-02, Income Statement2020-04, Reference Rate Reform (Topic 848) – Reporting Comprehensive Income (Topic 220) to allow a reclassification from accumulated other comprehensive income to retained earnings for stranded tax effects resulting fromFacilitation of the Tax Act.Effects of Reference Rate Reform on Financial Reporting. The amendments in this update also require certain disclosures about stranded tax effects.provide temporary optional guidance to ease the potential burden in accounting for reference rate reform. The amendments in this update are elective and apply to all entities that have contracts that reference LIBOR or another reference rate expected to be discontinued. The guidance isincludes a general principle that permits an entity to consider contract modifications due to reference rate reform to be an event that does not require contract remeasurement at the modification date or reassessment of a previous accounting determination. An optional expedient simplifies accounting for contract modifications to loans receivable and debt, by prospectively adjusting the effective for all entities for fiscal years beginning afterinterest rate. The amendments in ASU 2020-04 are effective as of March 12, 2020 through December 15, 2018, and interim periods within those fiscal years. Early adoption is permitted for periods for which financial statements have not yet been issued or available for issuance, including in the period the Act was enacted.31, 2022. The Company electedexpects to early adoptapply the amendments prospectively for applicable loan and reclassifyother contracts within the stranded income tax effectseffective period of ASU 2020-04. As of December 31, 2021, the Act from accumulated other comprehensive incomeCompany had approximately $43 million in loans with rates tied to retained earnings during the fourth quarterLIBOR. The Company is working on modifying each of 2017. The reclassification increased AOCI and decreased retained earningsthese contracts to have all modifications completed by $0.3 million, with zero net effect on total shareholders’ equity. December 31, 2022.
20.19.PARENT COMPANY ONLY
The following is the condensed financial information for Fidelity D & D Bancorp, Inc. on a parent company only basis as of and for the years indicated:
| | | | |
|
|
|
|
Condensed Balance Sheets | As of December 31, | As of December 31, |
(dollars in thousands) | 2018 | | 2017 | 2021 |
| 2020 |
Assets: | | | | |
|
|
|
|
Cash | $ | 232 | | $ | 205 | $ | 515 |
| $ | 256 |
Investment in subsidiary | | 93,669 | | 86,873 |
| 211,788 |
| 166,618 |
Securities available-for-sale | | - | | 828 | |
Other assets | | 106 | | 45 |
| 198 |
| 180 |
Total | $ | 94,007 | | $ | 87,951 | $ | 212,501 |
| $ | 167,054 |
| | | | |
|
|
|
|
Liabilities and shareholders' equity: | | | | |
|
|
|
|
Liabilities | $ | 450 | | $ | 568 | $ | 772 |
| $ | 384 |
Capital stock and retained earnings | | 94,652 | | 85,579 |
| 211,550 |
| 157,718 |
Accumulated other comprehensive (loss) income | | (1,095) | | 1,804 | |
Accumulated other comprehensive income (loss) | |
| 179 |
| 8,952 |
Total | $ | 94,007 | | $ | 87,951 | $ | 212,501 |
| $ | 167,054 |
| | | | | | | |
|
|
|
|
|
|
|
Condensed Income Statements | Years ended December 31, | Years ended December 31, |
(dollars in thousands) | 2018 | | 2017 | | 2016 | 2021 |
| 2020 |
| 2019 |
Income: | | | | | | | |
|
|
|
|
|
|
|
Equity in undistributed earnings of subsidiary | $ | 9,273 | | $ | 6,685 | | $ | 5,289 | $ | 19,898 |
| $ | 9,934 |
| $ | 8,839 |
Dividends from subsidiary | | 2,723 | | 2,574 | | | 2,960 |
| 6,608 |
| 5,378 |
|
| 4,037 |
Gain on sale of investment securities | | 44 | | - | | | - | |
Other income | | 11 | | 22 | | | 21 | |
Total income | | 12,051 | | 9,281 | | | 8,270 |
| 26,506 |
| 15,312 |
|
| 12,876 |
Operating expenses | | 1,269 | | 1,094 | | | 864 |
| 3,016 |
| 2,779 |
|
| 1,598 |
Income before taxes | | 10,782 | | 8,187 | | | 7,406 |
| 23,490 |
| 12,533 |
|
| 11,278 |
Credit for income taxes | | 224 | | 529 | | | 287 |
| 518 |
| 502 |
|
| 298 |
Net income | $ | 11,006 | | $ | 8,716 | | $ | 7,693 | $ | 24,008 |
| $ | 13,035 |
| $ | 11,576 |
| | | | | | | | |
Statements of Comprehensive Income | Years ended December 31, |
(dollars in thousands) | 2018 | | 2017 | | 2016 |
Bancorp net loss | $ | (990) | | $ | (542) | | $ | (556) |
Equity in net income of subsidiary | | 11,996 | | | 9,258 | | | 8,249 |
Net income | | 11,006 | | | 8,716 | | | 7,693 |
| | | | | | | | |
Other comprehensive (loss) income, before tax: | | | | | | | | |
Unrealized holding gains (losses) on available-for-sale securities | | - | | | 197 | | | 86 |
Tax effect | | - | | | (67) | | | (29) |
Unrealized gain (loss), net of tax | | - | | | 130 | | | 57 |
Equity in other comprehensive loss of subsidiary | | (2,478) | | | (4) | | | (864) |
Other comprehensive (loss) income, net of tax | | (2,478) | | | 126 | | | (807) |
Total comprehensive income, net of tax | $ | 8,528 | | $ | 8,842 | | $ | 6,886 |
| | | | | | | | |
Condensed Statements of Cash Flows | Years ended December 31, |
(dollars in thousands) | 2018 | | 2017 | | 2016 |
Cash flows from operating activities: | | | | | | | | |
Net income | $ | 11,006 | | $ | 8,716 | | $ | 7,693 |
Adjustments to reconcile net income to net cash used in operations: | | | | | | | | |
Equity in earnings of subsidiary | | (11,996) | | | (9,258) | | | (8,249) |
Stock-based compensation expense | | 749 | | | 550 | | | 519 |
Deferred income tax | | (60) | | | (69) | | | - |
Gain on sale of investment securities | | (44) | | | - | | | - |
Changes in other assets and liabilities, net | | 12 | | | (26) | | | (36) |
Net cash used in operating activities | | (333) | | | (87) | | | (73) |
| | | | | | | | |
Cash flows provided by investing activities: | | | | | | | | |
Dividends received from subsidiary | | 2,723 | | | 2,574 | | | 2,960 |
Proceeds from sales of investment securities | | 871 | | | - | | | - |
Net cash provided by investing activities | | 3,594 | | | 2,574 | | | 2,960 |
| | | | | | | | |
Cash flows used in financing activities: | | | | | | | | |
Dividends paid, net of dividend reinvestment | | (3,397) | | | (2,954) | | | (3,061) |
Exercise of stock options | | 14 | | | 416 | | | 14 |
Withholdings to purchase capital stock | | 149 | | | 126 | | | 111 |
Cash paid in lieu of fractional shares | | - | | | (11) | | | - |
Net cash used in financing activities | | (3,234) | | | (2,423) | | | (2,936) |
Net change in cash | | 27 | | | 64 | | | (49) |
| | | | | | | | |
Cash, beginning | | 205 | | | 141 | | | 190 |
| | | | | | | | |
Cash, ending | $ | 232 | | $ | 205 | | $ | 141 |
|
|
|
|
|
|
|
|
|
Statements of Comprehensive Income | Years ended December 31, |
(dollars in thousands) | 2021 |
| 2020 |
| 2019 |
Bancorp net loss | $ | (2,498) |
| $ | (2,277) |
| $ | (1,300) |
Equity in net income of subsidiary |
| 26,506 |
|
| 15,312 |
|
| 12,876 |
Net income |
| 24,008 |
|
| 13,035 |
|
| 11,576 |
|
|
|
|
|
|
|
|
|
Equity in other comprehensive income (loss) of subsidiary |
| (8,773) |
|
| 5,350 |
|
| 4,697 |
Other comprehensive (loss) income, net of tax |
| (8,773) |
|
| 5,350 |
|
| 4,697 |
Total comprehensive income, net of tax | $ | 15,235 |
| $ | 18,385 |
| $ | 16,273 |
|
|
|
|
|
|
|
|
|
Condensed Statements of Cash Flows | Years ended December 31, |
(dollars in thousands) | 2021 |
| 2020 |
| 2019 |
Cash flows from operating activities: |
|
|
|
|
|
|
|
|
Net income | $ | 24,008 |
| $ | 13,035 |
| $ | 11,576 |
Adjustments to reconcile net income to net cash used in operations: |
|
|
|
|
|
|
|
|
Equity in earnings of subsidiary |
| (26,506) |
|
| (15,312) |
|
| (12,876) |
Stock-based compensation expense |
| 1,096 |
|
| 1,077 |
|
| 817 |
Deferred income tax |
| (10) |
|
| (84) |
|
| 2 |
Changes in other assets and liabilities, net |
| 390 |
|
| 71 |
|
| 137 |
Net cash used in operating activities |
| (1,022) |
|
| (1,213) |
|
| (344) |
|
|
|
|
|
|
|
|
|
Cash flows provided by investing activities: |
|
|
|
|
|
|
|
|
Dividends received from subsidiary |
| 6,608 |
|
| 5,378 |
|
| 4,037 |
Operating dividend from subsidiary |
| 1,075 |
|
| 1,129 |
|
| - |
Net cash (used in) acquired in acquisition |
| (64) |
|
| 58 |
|
| - |
Net cash provided by investing activities |
| 7,619 |
|
| 6,565 |
|
| 4,037 |
|
|
|
|
|
|
|
|
|
Cash flows used in financing activities: |
|
|
|
|
|
|
|
|
Dividends paid, net of dividend reinvestment |
| (6,608) |
|
| (5,378) |
|
| (4,037) |
Withholdings to purchase capital stock |
| 270 |
|
| 219 |
|
| 175 |
Net cash used in financing activities |
| (6,338) |
|
| (5,159) |
|
| (3,862) |
Net change in cash |
| 259 |
|
| 193 |
|
| (169) |
|
|
|
|
|
|
|
|
|
Cash, beginning |
| 256 |
|
| 63 |
|
| 232 |
|
|
|
|
|
|
|
|
|
Cash, ending | $ | 515 |
| $ | 256 |
| $ | 63 |
21.ACQUISITION
20.ACQUISITION
On March 17, 2017,July 1, 2021, the Company completed its previously announced acquisition of Landmark. Landmark was a 1-bank holding company organized under the laws of the Commonwealth of Pennsylvania and was headquartered in Pittston, PA. Its wholly owned subsidiary, Landmark Community Bank, was an independent community bank chartered under the laws of the Commonwealth of Pennsylvania. Landmark Community Bank conducted full-service commercial banking services through five bank centers located in Lackawanna and Luzerne Counties, Pennsylvania. The acquisition expanded Fidelity Deposit and Discount Bank’s full-service footprint in Luzerne County, Pennsylvania. The Company transacted the merger to complement the Company’s existing operations, while consistent with the Company’s strategic plan of enhancing long-term shareholder value. The fair value of total assets acquired as a result of the merger totaled $375.5 million (net of cash consideration), loans totaled $298.9 million and deposits totaled $308.5 million. Goodwill recorded in the merger was $12.6 million.
In accordance with the terms of the Reorganization Agreement, on July 1, 2021 each share of Landmark common stock was converted into the right to receive 0.272 shares of the Company’s common stock and $3.26 in cash. As a result of the merger, the Company issued 647,990 shares of its common stock, valued at $35.1 million, and $7.8 million in cash based upon $54.10, the determined market price of the Company’s common stock in accordance with the Reorganization Agreement. The results of the combined entity’s operations are included in the Company’s Consolidated Financial Statements from the date of acquisition. The acquisition of Landmark was accounted for as a business combination using the acquisition method of accounting and, accordingly, assets acquired, liabilities assumed, and consideration paid were recorded at estimated fair values on the West Scranton branch of Wayne Bank,acquisition date.
Effective July 1, 2021, in connection with the wholly owned banking subsidiary of Norwood Financial Corp.,merger and pursuant to the terms of the Branch Purchase and Deposit AssumptionReorganization Agreement, dated September 29, 2016. The Company purchased allPaul C. Woelkers was appointed as a Class C Director of the deposit liabilities associated with the branch, certain loans, and the branch real estate, and immediately closed the branch and consolidated the acquired deposits and loans into its nearby West Scranton branch office. The Company expects this transaction to expand its customer base in West Scranton.Fidelity’s Board of Directors. Mr. Woelkers was also appointed as a Director of Fidelity Bank’s Board of Directors.
The transaction has been accounted for using the acquisition method of accounting. The acquired assets and assumed liabilities were recorded at book value which also represented estimated fair value at the date of acquisition. Management made significant estimates and exercised significant judgement in estimating fair value, but the fair value adjustments were deemed immaterial to the financial statements.
The Company recognized $41 thousand of acquisition-related costs during 2017. These costs are being expensed as incurred and are presented in non-interest expenses on the consolidated statements of income. Costs incurred in 2017 consist principally of legal fees and other professional fees.
The following table summarizes the estimatedconsideration paid for Landmark and the fair value of assets acquired, and liabilities assumed as of the acquisition date:
|
|
|
|
Purchase Price Consideration in Common Stock |
|
|
|
Landmark shares settled for stock |
|
| 2,382,695 |
Exchange ratio |
|
| 0.272 |
Total FDBC shares issued |
|
| 647,990 |
Value assigned to FDBC common share (6/30/2021 closing price) |
| $ | 54.10 |
|
|
|
|
Purchase price assigned to Landmark common shares exchanged for FDBC common shares |
| $ | 35,056,259 |
|
|
|
|
Purchase Price Consideration - Cash for Common Stock |
|
|
|
Landmark shares exchanged for cash, excluding fractional shares |
|
| 2,382,695 |
Cash consideration (per Landmark share) |
| $ | 3.26 |
Cash portion of purchase price |
| $ | 7,767,586 |
|
|
|
|
Cash portion of purchase price (cash paid fractional shares) |
| $ | 5,559 |
|
|
|
|
Cash for outstanding Landmark stock options |
| $ | 69,250 |
|
|
|
|
Total consideration paid |
| $ | 42,898,654 |
|
|
|
|
Allocation of Purchase Price | In thousands |
|
|
Total Purchase Price |
| $ | 42,899 |
|
|
|
|
Estimated Fair Value of Assets Acquired |
|
|
|
Cash and cash equivalents | 4,090 |
|
|
Investment securities | 49,430 |
|
|
Loans | 298,860 |
|
|
Restricted investments in bank stock | 1,186 |
|
|
Premises and equipment | 3,405 |
|
|
Lease property under finance leases | 1,188 |
|
|
Core deposit intangible asset | 597 |
|
|
Other real estate owned | 488 |
|
|
Other assets | 11,629 |
|
|
Total assets acquired | 370,873 |
|
|
|
|
|
|
Estimated Fair Value of Liabilities Assumed |
|
|
|
Non-interest bearing deposits | 100,472 |
|
|
Interest bearing deposits | 208,057 |
|
|
Short-term borrowings | 2,224 |
|
|
FHLB borrowings | 4,602 |
|
|
Secured borrowings | 20,619 |
|
|
Finance lease obligation | 1,188 |
|
|
Other liabilities | 3,387 |
|
|
Total liabilities assumed | 340,549 |
|
|
|
|
|
|
Net Assets Acquired |
|
| 30,324 |
Goodwill Recorded in Acquisition |
| $ | 12,575 |
|
|
|
|
Pursuant to the accounting requirements, the Company assigned a fair value to the assets acquired and liabilities assumed of Landmark. ASC 820 defines fair value as “the price that would be received to sell an asset or paid to transfer a liability in an orderly transaction between market participants at the measurement date.”
The assets acquired and liabilities assumed in the acquisition of Landmark were recorded at their estimated fair values based on management’s best estimates using information available at the date of acquisition:the acquisition and are subject to adjustment for up to one year after the closing date of the acquisition. While the fair values are not expected to be materially different from the estimates, any material adjustments to the estimates will be reflected, retroactively, as of the date of the acquisition. The items most susceptible to adjustment are the fair value adjustments on loans, core deposit intangible and the deferred income tax assets resulting from the acquisition. Fair values of the major categories of assets acquired and liabilities assumed were determined as follows:
Investment securities available-for-sale
The estimated fair values of the investment securities available for sale, primarily comprised of U.S. Government agency mortgage-backed securities, U.S. government agencies and municipal bonds, were determined using Level 1 and Level 2 inputs in the fair value hierarchy. The fair values were determined using executable market bids or independent pricing services. The Company’s independent pricing service utilized matrix pricing, which is a mathematical technique used widely in the industry to value debt securities without relying exclusively on quoted market prices for the specific security but rather relying on the security’s relationship to other benchmark quoted prices. Management reviewed the data and assumptions used in pricing the securities.
Loans
Acquired loans (performing and non-performing) are initially recorded at their acquisition-date fair values using Level 3 inputs. Fair values are based on a discounted cash flow methodology that involves assumptions and judgments as to credit risk, expected lifetime losses, environmental factors, collateral values, discount rates, expected payments and expected prepayments. Specifically, the Company has prepared 3 separate loan fair value adjustments that it believed a market participant might employ in estimating the entire fair value adjustment necessary under ASC 820-10 for the acquired loan portfolio. The 3-separate fair valuation methodologies employed are: 1) an interest rate loan fair value adjustment, 2) a general credit fair value adjustment, and 3) a specific credit fair value adjustment for purchased credit impaired loans subject to ASC 310-30 procedures. The acquired loans were recorded at fair value at the acquisition date without carryover of Landmark’s previously established allowance for loan losses. The fair value of the financial assets acquired included loans receivable with a gross amortized cost basis of $309.8 million.
The table below illustrates the fair value adjustments made to the amortized cost basis in order to present the fair value of the loans acquired. The credit adjustment on purchased credit impaired loans is derived in accordance with ASC 310-30 and represents the portion of the loan balances that has been deemed uncollectible based on the Company’s expectations of future cash flows for each respective loan.
|
|
|
|
Dollars in thousands |
|
|
(dollars in thousands)Gross amortized cost basis at June 30, 2021
| March 17, 2017
| $ | 309,767 |
Interest rate fair value adjustment on pools of homogeneous loans |
|
| (1,855) |
Cash and cash equivalentsCredit fair value adjustment on pools of homogeneous loans
| $
| 11,817 |
Loans
| | 1,574 |
Bank premises and equipment
| | 264 |
Goodwill
| | 209 |
Accrued interest receivable and other assets
| | 4 |
Total assets acquired
| $
| 13,868 |
| | (7,915) |
DepositsCredit fair value adjustment on purchased credit impaired loans
| $
| 13,809
| (1,137) |
Accrued interest payable and other liabilitiesFair value of acquired loans at June 30, 2021
|
| 59 $ | 298,860 |
Total liabilities assumed
| $
| 13,868 |
|
|
|
The CompanyFor loans acquired $1.6 million in residential and consumer loans. None of the loans that were acquired hadwithout evidence of credit quality deterioration.
deterioration, the Company prepared the interest rate loan fair value and credit fair value adjustments. Loans were grouped into homogeneous pools by characteristics such as loan type, term, collateral, and rate. Market rates for similar loans were obtained from various internal and external data sources and reviewed by management for reasonableness. The average of these rates was used as the fair value interest rate a market participant would utilize. A present value approach was utilized to calculate the interest rate fair value discount of $1.9 million. Additionally, for loans acquired without credit deterioration, a credit fair value adjustment was calculated using a two-part credit fair value analysis: 1) expected lifetime credit migration losses; and 2) estimated fair value adjustment for certain qualitative factors. The expected lifetime losses were calculated using historical losses observed by the Company, Landmark and peer banks. The Company also estimated an environmental factor to apply to each loan type. The environmental factor represents the potential discount which may arise due to general credit and economic factors. A credit fair value discount of $7.9 million was determined. Both the interest rate and credit fair value adjustments relate to loans acquired with evidence of credit quality deterioration will be substantially recognized as interest income on a level yield amortization method over the expected life of the loans.
The following table presents the acquired purchased credit impaired loans receivable at the acquisition date:
|
|
|
|
Dollars in thousands |
|
|
Contractual principal and interest at acquisition |
| $ | 5,306 |
Non-accretable difference |
|
| (1,691) |
Expected cash flows at acquisition |
|
| 3,615 |
Accretable yield |
|
| (588) |
Fair value of purchased impaired loans |
| $ | 3,027 |
|
|
|
|
Premises and Equipment
The Company assumed leases on 2 branch facilities of Landmark. The Company compared the lease contract obligations to comparable market rental rates determined by third-party licensed appraisers. The Company believed that the leased contract rates were in a reasonable range of market rental rates and concluded that no fair market value adjustment related to leasehold interest was necessary. The fair value of Landmark’s premises, including land, buildings and improvements, was determined based upon independent third-party appraisals performed by licensed appraisers or sales agreements.
Core Deposit Intangible
The fair value of the core deposit intangible was determined based on a discounted cash flow (present value) analysis using a discount rate commensurate with market participants. To calculate cash flows, deposit account servicing costs (net of deposit fee income) and interest expense on deposits were compared to the higher cost of alternative funding sources available through national brokered CD offering rates and FHLB advance rates. The projected cash flows were developed using projected deposit attrition rates based on the average rate experienced by both institutions. The core deposit intangible will be amortized over ten years using the sum-of-years digits method.
Time Deposits
The fair value adjustment for time deposits represents a discount from the value of the contractual repayments of fixed maturity deposits using prevailing market interest rates for similar-term time deposits. The time deposit premium is being amortized into income on a level yield amortization method over the contractual life of the deposits.
Secured Borrowings
The Company identified 19 sold participations acquired from Landmark that did not meet the criteria for sales treatment under ASC 860-10-40 and should be recorded goodwill associatedas obligations from secured borrowing arrangements. The Company has estimated the fair value of these obligations using an income approach based on the expected cash flows method on a pooled basis using Level 3 assumptions.
FHLB Borrowings
The Company assumed FHLB borrowings in connection with the merger. The fair value of FHLB Borrowings was determined by using FHLB prepayment penalty as a proxy for the fair value adjustment. The Company decided to pay off the borrowing post acquisition date therefore no amortization is warranted.
Supplemental Pro Forma Financial Information
The following table presents certain unaudited pro forma financial information for illustrative purposes only, for the twelve months ended December 31, 2021 and 2020, respectively, as if Landmark had been acquired on January 1, 2020. This unaudited pro forma information combines the historical results of Landmark with the Company’s consolidated historical results and includes certain adjustments reflecting the estimated impact of certain fair value adjustments for the respective periods. The pro forma information is not indicative of what would have occurred had the acquisition occurred as of the West Scranton branchbeginning of Wayne bankthe year prior to the acquisition. The unaudited pro forma information does not consider any changes to the provision expense resulting from recording loan assets at fair value, merger expenses, cost savings or business synergies. As a result, actual amounts would have differed from the unaudited pro forma information presented and the differences could be significant.
|
|
|
|
|
|
Unaudited | Twelve months ended December 31, |
(Dollars in thousands) | 2021 |
| 2020 |
Net interest income | $ | 68,970 |
| $ | 57,531 |
Other income |
| 18,959 |
|
| 15,978 |
Total net interest income and other income | $ | 87,929 |
| $ | 73,509 |
|
|
|
|
|
|
Net income |
| 29,080 |
|
| 18,402 |
|
|
|
|
|
|
Basic earnings per common share | $ | 5.15 |
| $ | 3.52 |
Diluted earnings per common share | $ | 5.11 |
| $ | 3.50 |
|
|
|
|
|
|
Merger-related expenses
For year ended December 31, 2021, the Company incurred $3.0 million in merger-related expenses related to the merger with Landmark, primarily consisting of data processing, salaries and employee benefits, and professional fee expenses. For the year ended December 31, 2020, the Company incurred merger-related expenses related to the merger with MNB totaling $0.2 million. Goodwill is not amortized, but is periodically evaluated for impairment. The Company did not recognize any impairment during 2018 or 2017. For income tax purposes, goodwill will be deducted over a 15 year period.$2.5 million, primarily consisting of professional fees, salaries and employee benefits and data processing fees.
22.21.EMPLOYEE BENEFITS
Bank-Owned Life Insurance (BOLI)
The Company has purchased single premium BOLI policies on certain officers. The policies are recorded at their cash surrender values. Increases in cash surrender values are included in non-interest income in the consolidated statements of income. In March 2017,As a result of the acquisition of Landmark, the Company purchased an additional $8.0added BOLI with a value of $7.2 million of BOLI.during 2021. The policies’ cash surrender value totaled $20.6$52.7 million and $20.0$44.3 million, respectively, as of December 31, 20182021 and 20172020 and is reflected as an asset on the consolidated balance sheets. As ofFor the years ended December 31, 20182021 and 2017,2020, the Company has recorded income of $598$1.2 million and $794 thousand, and $581 thousand, respectively.
Officer Life Insurance
In 2017, the Bank entered into separate split dollar life insurance arrangements (Split Dollar Agreements) with eleven11 officers. This plan provides each officer a specified death benefit should the officer die while in the Bank’s employ. The Bank paid the insurance premiums in March 2017 and the arrangements were effective in March 2017. In March 2019, the Bank entered into a new Split Dollar Agreement with 1 officer. In January 2021, the Bank entered into Split Dollar Agreements with 15 officers. The Bank owns the policies and all cash values thereunder. Upon death of the covered employee, the agreed-upon amount of death proceeds from the policies will be paid directly to the insured’s beneficiary. As of December 31, 2018,2021, the policies had total death benefits of $20.6$49.7 million of which $4.1$8.4 million would have been paid to the officer’s beneficiaries and the remaining $16.5$41.3 million would have been paid to the Bank. In addition, three4 executive officers have the opportunity to retain a split dollar benefit equal to two times their highest base salary after separation from service if the vesting requirements are met. As of December 31, 20182021 and 2017,2020, the Company accrued expenses of $63$200 thousand and $30$154 thousand for the split dollar benefit.
Supplemental Executive Retirement plan (SERP)
On March 29, 2017, the Bank entered into separate supplemental executive retirement agreements (individually the “SERP Agreement”) with five5 officers, pursuant to which the Bank will credit an amount to a SERP account established on each participant’s behalf while they are actively employed by the Bank for each calendar month from March 1, 2017 until retirement. On March 20, 2019, the Bank entered into a SERP Agreement with 1 officer, pursuant to which the Bank will credit an amount to a SERP account established for the participant’s behalf while they are actively employed by the Bank for each calendar month from March 1, 2019 until normal retirement age. As a result of the acquisition of Landmark, the Company added $1.0 million in accrued SERP expenses to the consolidated balance sheets. As of December 31, 20182021 and 2017,2020, the Company accrued expenses of $863 thousand$3.6 million and $383 thousand$2.0 million in connection with the SERP.
23.22.REVENUE RECOGNITION
As disclosed in Footnote 19, as of January 1, 2018, the Company adopted ASU 2014-09, Revenue from Contracts with Customers (Topic 606) and all subsequent ASUs that modified Topic 606. The Company has elected to use the modified retrospective approach with prior period financial statements unadjusted and presented with historical revenue recognition methods. The implementation of the new standard had no material impact on the measurement or recognition of revenue; as such, a cumulative effect adjustment to opening retained earnings was not deemed necessary.
The majority of the Company’s revenues are generated through interest earned on securities and loans, which is explicitly excluded from the scope of the guidance. In addition, certain non-interest income streams such as fees associated with mortgage servicing rights, loan service charges, life insurance earnings, rental income and gains/losses on the sale of
loans and securities are not in the scope of the new guidance. The main types of contracts with customers that are in the scope of the new guidance are:
Table Of ContentsService charges on deposit accounts – Deposit service charges represent fees charged by the Company for the performance obligation of providing services to a customer’s deposit account. The transaction price for deposit services includes both fixed and variable amounts based on the Company’s fee schedules. Revenue is recognized and payment is received either at a point in time for transactional fees or on a monthly basis for non-transactional fees.
Interchange fees – Interchange fees represent fees charged by the Company for customers using debit cards. The contract is between the Company and the processor and the performance obligation is the ability of customers to use debit cards to make purchases at a point in time. The transaction price is a percentage of debit card usage and the processor pays the Company and revenue is recorded throughout the month as the performance obligations are being met.
| ·
| | Service charges on deposit accounts – Deposit service charges represent fees charged by the Company for the performance obligation of providing services to a customer’s deposit account. The transaction price for deposit services includes both fixed and variable amounts based on the Company’s fee schedules. Revenue is recognized and payment is received either at a point in time for transactional fees or on a monthly basis for non-transactional fees.
|
| ·
| | Interchange fees – Interchange fees represent fees charged by the Company for customers using debit cards. The contract is between the Company and the processor and the performance obligation is the ability of customers to use debit cards to make purchases at a point in time. The transaction price is a percentage of debit card usage and the processor pays the Company and revenue is recorded throughout the month as the performance obligations are being met.
|
| ·
| | Fees from trust fiduciary activities – Trust fees represent fees charged by the Company for the management, custody and/or administration of trusts. These are mostly monthly fees based on the market value of assets in the trust account at the prior month end. Payment is generally received a few weeks after month end through a direct charge to customers’ accounts. Estate fees are recognized and charged as the Company reaches each of six different stages of the estate administration process.
|
| ·
| | Fees from financial services – Financial service fees represent fees charged by the Company for the performance obligation of providing various services for an investment account. Revenue is recognized twice monthly for fees on sales transactions and on a monthly basis for advisory fees and quarterly for trail fees.
|
| ·
| | Gain/loss on ORE sales – Gain/loss on the sale of ORE is recognized at the closing date when the sales proceeds are received. In seller-financed ORE transactions, the contract is made subject to our normal underwriting standards and pricing. The Company does not have any obligation or right to repurchase any sales of ORE.
|
Fees from trust fiduciary activities – Trust fees represent fees charged by the Company for the management, custody and/or administration of trusts. These are mostly monthly fees based on the market value of assets in the trust account at the prior month end. Payment is generally received a few weeks after month end through a direct charge to customers’ accounts. Estate fees are recognized and charged as the Company reaches each of six different stages of the estate administration process.
Fees from financial services – Financial service fees represent fees charged by the Company for the performance obligation of providing various services for an investment account. Revenue is recognized twice monthly for fees on sales transactions and on a monthly basis for advisory fees and quarterly for trail fees.
Gain/loss on ORE sales – Gain/loss on the sale of ORE is recognized at the closing date when the sales proceeds are received. In seller-financed ORE transactions, the contract is made subject to our normal underwriting standards and pricing. The Company does not have any obligation or right to repurchase any sales of ORE.
Contract balances
A contract asset balance occurs when an entity performs a service for a customer before the customer pays consideration (resulting in a contract receivable) or before the payment is due (resulting in a contract asset). A contract liability balance is an entity’s obligation to transfer a service to a customer for which the entity already received payment (or payment is due) from the customer. The Company’s non-interest income streams are largely based on transactional activity, or standard month-end revenue accruals such as asset management fees based on month-end market values. Consideration is often received immediately or shortly after the Company satisfies its performance obligation and revenue is recognized. The Company typically does not enter into long-term revenue contracts with customers, and therefore, does not experience significant contract balances. As of December 31, 20182021 and 2017,2020, the Company did not0t have any significant contract balances.
Remaining performance obligations
The Company’s performance obligations have an original expected duration of less than one year and follow the relevant guidance for recognizing revenue over time. There is no variable consideration subject to constraint that is not included in information about transaction price.
Contract acquisition costs
In connection with the adoption of Topic 606, anAn entity is required to capitalize and subsequently amortize into expense, certain incremental costs of obtaining a contract if these costs are expected to be recovered. The incremental costs of obtaining a contract are those costs that an entity incurs to obtain a contract with a customer that it would not have incurred if the contract had not been obtained (for example, sales commission). The Company utilizes the practical expedient which allows entities to immediately expense contract acquisition costs when the asset that would have resulted from capitalizing these costs would have been amortized in one year or less. Upon adoption of Topic 606,
23.LEASES
ASU 2016-02 Leases (Topic 842) became effective for the Company didon January 1, 2019. For all operating lease contracts where the Company is lessee, a right-of-use (ROU) asset and lease liability were recorded as of the effective date. The Company assumed all renewal terms will be exercised when calculating the ROU assets and lease liabilities. For leases existing at the transition date, any prepaid or deferred rent was added to the ROU asset to calculate the lease liability. The discount rate used to calculate the present value of future payments at the transition date was the Company’s incremental borrowing rate. The Company used the FHLB fixed rate borrowing rates on December 29, 2018 as the discount rate at transition. For all classes of underlying assets, the Company has elected not capitalize anyto record short-term leases (leases with a term of 12 months or less) on the balance sheet when the Company is lessee. Instead, the Company will recognize the lease payment on a straight-line basis over the lease term and variable lease payments in the period in which the obligation for those payments is incurred. For all asset classes, the Company has elected, as a lessee, not to separate nonlease components from lease components and instead to account for each separate lease component and nonlease components associated with that lease component as a single lease component.
Management determines if an arrangement is or contains a lease at contract acquisition costs.inception. If an arrangement is determined to be or contains a lease, the Company recognizes a ROU asset and a lease liability when the asset is placed in service.
The Company’s operating leases, where the Company is lessee, include property, land and equipment. As of December 31, 2021, 11 of the Company’s branch properties and one future branch were leased under operating leases. In 4 of the branch leases, the Company leases the land from an unrelated third party, and the buildings are the Company’s own capital improvement. The Company also leases 3 standalone ATMs under operating leases. Additionally, the Company has one property lease and 4 equipment leases classified as finance leases. The Company acquired a leased property classified as a finance lease with a fair value of $1.2 million from the Landmark merger during 2021.
The following is an analysis of the leased property under finance leases:
|
|
|
|
|
|
|
|
|
|
|
|
(dollars in thousands) | December 31, 2021 |
| December 31, 2020 |
|
|
|
|
|
|
Property and equipment | $ | 1,673 |
| $ | 485 |
Less accumulated depreciation and amortization |
| (366) |
|
| (202) |
Leased property under finance leases, net | $ | 1,307 |
| $ | 283 |
|
|
|
|
|
|
The following is a schedule of future minimum lease payments under finance leases together with the present value of the net minimum lease payments as of December 31, 2021:
|
|
|
(dollars in thousands) | Amount |
|
|
|
2022 | $ | 247 |
2023 |
| 220 |
2024 |
| 164 |
2025 |
| 158 |
2026 |
| 150 |
2027 and thereafter |
| 463 |
Total minimum lease payments (a) |
| 1,402 |
Less amount representing interest (b) |
| (82) |
Present value of net minimum lease payments | $ | 1,320 |
|
|
|
(a)The future minimum lease payments have not been reduced by estimated executory costs (such as taxes and maintenance) since this amount was deemed immaterial by management.
(b)Amount necessary to reduce net minimum lease payments to present value calculated at the Company’s incremental borrowing rate upon lease inception.
As of December 31, 2021, the Company leased its Green Ridge, Pittston, Peckville, Back Mountain, Mountain Top, Abington, Nazareth, Easton, Bethlehem, Martins Creek and Wyoming branches under the terms of operating leases. During 2021, the Company entered into a new lease for the Bethlehem branch which will be relocated in 2022. Common area maintenance is included in variable lease payments in the table below. The Abington branch has variable lease payments which are calculated as a percentage of the national prime rate of interest and are expensed as incurred. The Bethlehem and Easton branches have variable lease payments that increase annually and are expensed as incu
|
|
|
|
(dollars in thousands) | 2021 |
|
Lease cost |
|
|
|
Finance lease cost: |
|
|
|
Amortization of right-of-use assets | $ | 164 |
|
Interest on lease liabilities |
| 16 |
|
Operating lease cost |
| 637 |
|
Short-term lease cost |
| 59 |
|
Variable lease cost |
| 4 |
|
Total lease cost | $ | 880 |
|
|
|
|
|
Other information |
|
|
|
Cash paid for amounts included in the measurement of lease liabilities |
|
|
|
Operating cash flows from finance leases | $ | 16 |
|
Operating cash flows from operating leases (Fixed payments) | $ | 560 |
|
Operating cash flows from operating leases (Liability reduction) | $ | 291 |
|
Financing cash flows from finance leases | $ | 159 |
|
Right-of-use assets obtained in exchange for new finance lease liabilities | $ | 1,188 |
|
Right-of-use assets obtained in exchange for new operating lease liabilities | $ | 2,775 |
|
Weighted-average remaining lease term - finance leases |
| 7.22 yrs |
|
Weighted average remaining lease term - operating leases |
| 21.42 yrs |
|
Weighted-average discount rate - finance leases |
| 1.79% |
|
Weighted-average discount rate - operating leases |
| 3.38% |
|
|
|
|
|
During 2021, $845 thousand of the total lease cost is included in premises and equipment expense and $35 thousand is included in other expenses on the consolidated statements of income. Operating lease expense is recognized on a straight-line basis over the lease term. We recognized both the interest expense and amortization expense for finance leases in premises and equipment expense since the interest expense portion was immaterial.
The future minimum lease payments for the Company’s branch network and equipment under operating leases that have lease terms in excess of one year as of December 31, 2021 are as follows:
|
|
|
(dollars in thousands) | Amount |
|
|
|
2022 | $ | 619 |
2023 |
| 606 |
2024 |
| 602 |
2025 |
| 610 |
2026 |
| 617 |
2027 and thereafter |
| 10,482 |
Total future minimum lease payments |
| 13,536 |
Plus variable payment adjustment |
| 340 |
Less amount representing interest |
| (4,249) |
Present value of net future minimum lease payments | $ | 9,627 |
|
|
|
The Company leases several properties, where the Company is lessor, under operating leases to unrelated parties. Some of these properties are residential properties surrounding the Main Branch that the Company leases on a month-to-month basis and are considered short-term leases. The undiscounted cash flows to be received on an annual basis for the remaining two properties under long-term operating leases are as follows:
|
|
|
(dollars in thousands) | Amount |
|
|
|
2022 | $ | 104 |
2023 |
| 48 |
2024 |
| 51 |
2025 |
| 54 |
2026 |
| 54 |
2027 and thereafter |
| 27 |
Total lease payments to be received | $ | 338 |
|
|
|
The Company also indirectly originates automobile leases classified as direct finance leases. See Footnote 5, “Loans and leases”, for more information about the Company’s direct finance leases.
Lease income recognized from direct finance leases was included in interest income from loans and leases on the consolidated statements of income. Lease income related to operating leases is included in fees and other revenue on the consolidated statements of income. The Company only receives a variable payment for taxes from one of its lessees, but the amount is immaterial and excluded from rental income. The amount of lease income recognized on the consolidated statements of income was as follows for the periods indicated:
|
|
|
|
|
|
|
|
|
|
|
| For the years ended December 31, |
(dollars in thousands) |
| 2021 |
| 2020 |
| 2019 |
Lease income - direct finance leases |
|
|
|
|
|
|
|
|
|
Interest income on lease receivables |
| $ | 807 |
| $ | 722 |
| $ | 683 |
|
|
|
|
|
|
|
|
|
|
Lease income - operating leases |
|
| 257 |
|
| 236 |
|
| 239 |
Total lease income |
| $ | 1,064 |
| $ | 958 |
| $ | 922 |
|
|
|
|
|
|
|
|
|
|
ITEM 9: CHANGES IN AND DISAGREEMENTS WITH ACCOUNTANTS ON ACCOUNTING AND FINANCIAL DISCLOSURE
None
ITEM 9A: CONTROLS AND PROCEDURES
As of the end of the period covered by this Annual Report on Form 10-K, an evaluation was carried out by the Company’s management, with the participation of its President and Chief Executive Officer and the Chief Financial Officer, of the effectiveness of the Company’s disclosure controls and procedures, as defined in Rule 13a-15(e) under the Securities Exchange Act of 1934. Based on such evaluation, the President and Chief Executive Officer and the Chief Financial Officer concluded that the Company’s disclosure controls and procedures are designed to ensure that information required to be disclosed in the reports the Company files or furnishes under the Securities Exchange Act of 1934 is recorded, processed, summarized and reported within the time periods specified in the SEC’s rules and regulations, and are effective. The
Company made no changes in its internal controls over financial reporting or in other factors that materially affected, or are reasonably likely to materially affect, these controls during the last fiscal quarter ended December 31, 2018.2021.
Management’s Report on Internal Control Over Financial Reporting
Management of the Company is responsible for establishing and maintaining adequate internal control over financial reporting. The Company’s internal control over financial reporting is a process designed under the supervision of the Company’s President and Chief Executive Officer and the Chief Financial Officer, and implemented in conjunction with management and other personnel, to provide reasonable assurance regarding the reliability of financial reporting and the preparation of the Company’s consolidated financial statements for external purposes in accordance with generally accepted accounting principles.
There are inherent limitations in the effectiveness of any internal control, including the possibility of human error and the circumvention or overriding of controls. Accordingly, even effective internal control can provide only reasonable assurance with respect to financial statement preparation. Further, because of changes in conditions, the effectiveness of internal control may vary over time.
Management assessed the effectiveness of the Company’s internal control over financial reporting as of December 31, 2018.2021. This assessment was based on criteria for effective internal control over financial reporting described in “Internal Control – Integrated Framework,” (2013) issued by the Committee of Sponsoring Organizations of the Treadway Commission (COSO). Based on this assessment, management determined that, as of December 31, 2018,2021, the Company maintained effective internal control over financial reporting.
RSM US LLP, the independent registered public accounting firm that audited our consolidated financial statements as of and for the year ended December 31, 2018 included in this report, has also audited the effectiveness of the Company’s internal control over financial reporting as of December 31, 2018. This report is included in Item 8 under the heading “Report of Independent Registered Public Accounting Firm.”
ITEM 9B: OTHER INFORMATION
None
ITEM 9C: DISCLOSURE RELATING TO FOREIGN JURISDICTIONS THAT PREVENT INSPECTIONS
None
PART III
ITEM 10: DIRECTORS, EXECUTIVE OFFICERS AND CORPORATE GOVERNANCE
The information required in this item is incorporated by reference herein to the information presented in the Company’s definitive Proxy Statement for its 20192022 Annual Meeting of Shareholders to be filed with the SEC.
Section 16(a) Beneficial Ownership Reporting Compliance
The information required in this item is incorporated by reference herein to the information presented in the Company’s definitive Proxy Statement for its 20192022 Annual Meeting of Shareholders to be filed with the SEC.
Code of Ethics
Pursuant to Item 406 of Regulation S-K, the Company adopted a written code of ethics that applies to our directors, officers and employees, including our chief executive officer and chief financial officer, which is available on our website at http://www.bankatfidelity.com through the Investor Relations link and then under the headings “Other Information”, “Governance Documents.” In addition, copies of our code of ethics will be provided to shareholders upon written request to Fidelity D & D Bancorp, Inc., Blakely and Drinker Streets, Dunmore, PA 18512 at no charge.
ITEM 11: EXECUTIVE COMPENSATION
The information required in this item is incorporated by reference herein to the information presented in the Company’s definitive Proxy Statement for its 20192022 annual meeting of shareholders to be filed with the SEC.
ITEM 12: SECURITY OWNERSHIP OF CERTAIN BENEFICIAL OWNERS AND MANAGEMENTAND RELATED STOCKHOLDER MATTERS
The information required in this item is incorporated by reference herein to the information presented in the Company’s definitive Proxy Statement for its 20192022 annual meeting of shareholders to be filed with the SEC.
Securities authorized for issuance under equity compensation plans
The following table summarizes the Company’s equity compensation plans as of December 31, 20182021 that have been approved and not approved by Fidelity D & D Bancorp, Inc. shareholders:
| | | | |
|
|
|
|
| (a) | (b) | (c) | (a) | (b) | (c) |
Plan Category | Number of securities to be issued upon exercise of outstanding options, warrants and rights | Weighted-average exercise price of outstanding options, warrants and rights | Number of securities remaining available for future issuance under equity compensation plans (excluding securities reflected in column (a)) | Number of securities to be issued upon exercise of outstanding options, warrants and rights | Weighted-average exercise price of outstanding options, warrants and rights | Number of securities remaining available for future issuance under equity compensation plans (excluding securities reflected in column (a)) |
Equity compensation plans approved by security holders: | | | | |
|
|
|
|
2002 Employee Stock Purchase Plan | 4,536 | $ | 38.70 | 88,365 | 4,891 | $ | 59.50 | 74,852 |
2012 Omnibus Stock Incentive Plan | 17,360 | $ | 37.01 | 709,579 | |
2012 Omnibus Stock Incentive Plan | 40,629 | $ | 34.97 | 709,579 | |
2012 Director Stock Incentive Plan | 12,600 | $ | 41.72 | 705,000 | |
2012 Omnibus Stock Incentive Plan (Restricted stock) | | 28,123 | $ | 53.31 | 672,453 |
2012 Omnibus Stock Incentive Plan (SSARs) | | 32,561 | $ | 38.72 | 672,453 |
2012 Director Stock Incentive Plan (Restricted stock) | | 14,920 | $ | 52.99 | 680,900 |
Equity compensation plans not approved by security holders - none | - | | - | - | - |
| - | - |
Total | 75,125 | $ | 36.80 | 1,502,944 | 80,495 | $ | 47.73 | 1,428,205 |
ITEM 13: CERTAIN RELATIONSHIPS AND RELATED TRANSACTIONS, AND DIRECTOR INDEPENDENCE
The information required in this item is set forth in Footnote No. 16 “Related Party Transactions”, of Part II, Item 8 “Financial Statements and Supplementary Data”, and the information required by Items 404 and 407(a) of Regulation S-K is incorporated by reference herein to the information presented in the Company’s definitive Proxy Statement for its 20182022 annual meeting of shareholders to be filed with the SEC.
ITEM 14:PRINCIPAL ACCOUNTANT FEES AND SERVICES
The information required by this item is incorporated by reference herein, to the information presented in the Company’s definitive Proxy Statement for its 20192022 annual meeting of shareholders to be filed with the SEC.
PART IV
ITEM 15: EXHIBITS AND FINANCIAL STATEMENT SCHEDULES
(a) (1) Financial Statements - The following financial statements are included by reference in Part II, Item 8 hereof:
|
|
| Report of Independent Registered Public Accounting Firm (PCAOB ID: 49) |
| Consolidated Balance Sheets |
| Consolidated Statements of Income |
| Consolidated Statements of Comprehensive Income |
| Consolidated Statements of Changes in Shareholders’ Equity |
| Consolidated Statements of Cash Flows |
| Notes to Consolidated Financial Statements |
(2) Financial Statement Schedules
Financial Statement Schedules are omitted because the required information is either not applicable, the data is not significant or the required information is shown in the respective financial statements or in the notes thereto or elsewhere herein.
(3) Exhibits
The following exhibits are filed herewith or incorporated by reference as a part of this Form 10-K:
3(i) Amended and Restated Articles of Incorporation of Registrant. Incorporated by reference to Annex B of the Proxy Statement/Prospectus included in Registrant’s Amendment 4 to its Registration Statement No. 333-90273 on Form S-4, filed with the SEC on April 6, 2000.
3(ii) Amended and Restated Bylaws of Registrant. Incorporated by reference to Exhibit 3(ii)3.1 to Registrant’s Form 8-K filed with the SEC on November 21, 2007.April 16, 2020.
2.1 Agreement and Plan of Reorganization by and among Fidelity D & D Bancorp, Inc., The Fidelity Deposit and Discount Bank, MNB Corporation and Merchants Bank of Bangor dated as of December 9, 2019. Incorporated by reference to Annex A of the Registrant’s Registration Statement No. 333-236453 on Form S-4, filed with the Commission on February 14, 2020. (Schedules have been omitted pursuant to Item 601(b)(2) of Regulation S-K. Fidelity agrees to furnish supplementally to the SEC a copy of any omitted schedule upon request.)
2.1 Agreement and Plan of Reorganization by and among Fidelity D & D Bancorp, Inc., The Fidelity Deposit and Discount Bank, NEPA Acquisition Subsidiary, LLC, Landmark Bancorp, Inc. and Landmark Community Bank dated as of February 25, 2021. Incorporated by reference to Annex A of the Registrant’s Registration Statement No. 333-236453 on Form S-4, filed with the Commission on April 23, 2021. (Schedules have been omitted pursuant to Item 601(b)(2) of Regulation S-K. Fidelity agrees to furnish supplementally to the SEC a copy of any omitted schedule upon request.)
*10.1 Registrant’s 2012 Dividend Reinvestment and Stock Repurchase Plan. Incorporated by reference to Exhibit 4.1 to Registrant’s Registration Statement No. 333-183216 on Form S-3 filed with the SEC on August 10, 2012 as amended February 3, 2014.
*10.2 Registrant’s 2000 Independent Directors Stock Option Plan. Incorporated by reference to Exhibit 4.3 to Registrant’s Registration Statement No. 333-64356 on Form S-8 filed with the SEC on July 2, 2001.
*10.3 Amendment, dated October 2, 2007, to the Registrant’s 2000 Independent Directors Stock Option Plan. Incorporated by reference to Exhibit 10.2 to Registrant’s Form 8-K filed with the SEC on October 4, 2007.
*10.4 Registrant’s 2000 Stock Incentive Plan. Incorporated by reference to Exhibit 4.4 to Registrant’s Registration Statement No. 333-64356 on Form S-8 filed with the SEC on July 2, 2001.
*10.5 Amendment, dated October 2, 2007, to the Registrant’s 2000 Stock Incentive Plan. Incorporated by reference to Exhibit 10.1 to Registrant’s Form 8-K filed with the SEC on October 4, 2007.
*10.6 Registrant’s 2002 Employee Stock Purchase Plan. Incorporated by reference to Appendix A to Definitive proxy Statement filed with the SEC on March 28, 2002.
*10.710.3 Amended and Restated Executive Employment Agreement between Fidelity D & D Bancorp, Inc., The Fidelity Deposit and Discount Bank and Daniel J. Santaniello, dated March 23, 2011. Incorporated by reference to Exhibit 99.1 to Registrant’s Current Report on Form 8-K filed with the SEC on March 29, 2011.
*10.8 Amended and Restated Executive Employment Agreement between Fidelity D & D Bancorp, Inc., The Fidelity Deposit and Discount Bankand Timothy P. O’Brien, dated March 23, 2011. Incorporated by reference to Exhibit 99.2 to Registrant’s Current Report on Form 8-K filed with the SEC on March 29, 2011.
*10.910.4 2012 Omnibus Stock Incentive Plan. Incorporated by reference to Appendix A to Registrant’s Definitive Proxy Statement filed with the SEC on March 30, 2012.
*10.1010.5 2012 Director Stock Incentive Plan. Incorporated by reference to Appendix B to Registrant’s Definitive Proxy Statement filed with the SEC on March 30, 2012.
*10.1110.6 Employment Agreement between Fidelity D & D Bancorp, Inc., The Fidelity Deposit and Discount Bank and Salvatore R. DeFrancesco, Jr. dated as of March 17, 2016. Incorporated by reference to Exhibit 99.1 to Registrant’s Current Report on Form 8-K filed with the SEC on March 18, 2016.
*10.12 Change in Control and Severance Agreement between the Registrant, The Fidelity Deposit and Discount Bank and Michael J. Pacyna dated as of March 29, 2017. Incorporated by reference to Exhibit 99.1 to Registrant’s Current Report on Form 8-K filed with the SEC on April 4, 2017.
*10.1310.7 Employment Agreement between Fidelity D & D Bancorp, Inc., The Fidelity Deposit and Discount Bank and Eugene J. Walsh dated as of March 29, 2017. Incorporated by reference to Exhibit 99.1 to Registrant’s Current Report on Form 8-K filed with the SEC on April 4, 2017.
*10.1410.8 Form of Supplemental Executive Retirement Plan – Applicable to Daniel J. Santaniello and Salvatore R. DeFrancesco, Jr. Incorporated by reference to Exhibit 99.1 to Registrant’s Current Report on Form 8-K filed with the SEC on April 4, 2017.
*10.1510.9 Form of Supplemental Executive Retirement Plan – Applicable to Eugene J. Walsh and Timothy P O’Brien.Walsh. Incorporated by reference to Exhibit 99.2 to Registrant’s Current Report on Form 8-K filed with the SEC on April 4, 2017.
*10.1610.10 Form of Split Dollar Life Insurance Agreement – Applicable to Daniel J. Santaniello, Salvatore R. DeFrancesco, Jr. and Eugene J. Walsh. Incorporated by reference to Exhibit 99.3 to Registrant’s Current Report on Form 8-K filed with the SEC on April 4, 2017.
*10.17 Form of Split Dollar Life Insurance10.11 Employment Agreement – Applicable to Timothy P O’Brien between Fidelity D & D Bancorp, Inc., The Fidelity Deposit and Discount Bank and Michael Pacyna.J. Pacyna dated as of March 20, 2019. Incorporated by reference to Exhibit 99.499.1 to Registrant’s Current Report on Form 8-K filed with the SEC on April 4, 2017.March 21, 2019.
11*10.12 Form of Supplemental Executive Retirement Plan for Michael J. Pacyna. Incorporated by reference to Exhibit 99.2 to Registrant’s Current Report on Form 8-K filed with the SEC on March 21, 2019.
*10.13 Form of Split Dollar Life Insurance Agreement for Michael J. Pacyna. Incorporated by reference to Exhibit 99.3 to Registrant’s Current Report on Form 8-K filed with the SEC on March 21, 2019.
13 Annual Report to Shareholders. Incorporated by reference to the 20182021 Annual Report to Shareholders filed with the SEC on Form ARS.
21 Subsidiaries of the Registrant, filed herewith.
23 Consent of RSM US LLP, filed herewith.
31.1 Rule 13a-14(a) Certification of Principal Executive Officer, filed herewithherewith..
31.2 Rule 13a-14(a) Certification of Principal Financial Officer, filed herewithherewith..
32.1 Certification of Principal Executive Officer pursuant to 18 U.S.C. Section 1350, as adopted pursuant to Section 906 of the Sarbanes-Oxley Act of 2002, filed herewithherewith..
32.2 Certification of Principal Financial Officer pursuant to 18 U.S.C. Section 1350, as adopted pursuant to Section 906 of the Sarbanes-Oxley Act of 2002, filed herewith.
101 Interactive data files: The following, from Fidelity D&D Bancorp, Inc.’s. Annual Report on Form 10-K for the year ended December 31, 2018,2021, is formatted in XBRL (eXtensible Business Reporting Language): Consolidated Balance Sheets as of December 31, 20182021 and 2017;2020; Consolidated Statements of Income for the years ended December 31, 2018, 20172021, 2020 and 2016;2019; Consolidated Statements of Comprehensive Income for the years ended December 31, 2018, 20172021, 2020 and 2016;2019; Consolidated Statements of Changes in Shareholders’ Equity for the years ended December 31, 2018, 20172021, 2020 and 2016;2019; Consolidated Statements of Cash Flows for the years ended December 31, 2018, 20172021, 2020 and 20162019 and the Notes to the Consolidated Financial Statements.
104 Cover Page Interactive Data File (formatted as inline XBRL and contained in Exhibit 101)
(b)The exhibits required to be filed by this Item are listed under Item 15(a) 3, above.
(c)Not applicable.
_________________________
* Management contract or compensatory plan or arrangement.
ITEM 16: FORM 10-K SUMMARY
None.
SIGNATURES
Pursuant to the requirements of Section 13 or 15(d) of the Securities and Exchange Act of 1934, the registrant has duly caused this report to be signed on its behalf by the undersigned, thereunto duly authorized.
|
|
|
|
| FIDELITY D & D BANCORP, INC. |
|
| (Registrant) |
|
|
|
|
|
|
|
Date: March 13, 201923, 2022 | By: | /s/s/ Daniel J. Santaniello |
|
|
| Daniel J. Santaniello, |
|
| President and Chief Executive Officer |
|
|
|
|
|
|
Date: March 13, 201923, 2022 | By: | /s/ Salvatore R. DeFrancesco, Jr. |
|
|
| Salvatore R. DeFrancesco, Jr., |
|
| Treasurer and Chief Financial Officer |
Pursuant to the requirements of the Securities and Exchange Act of 1934, this report has been signed below by the following person on behalf of the registrant and in the capacities and on the dates indicated.
|
|
|
|
|
| DATE |
|
|
|
|
By: | /s/ Daniel J. Santaniello |
| March 13, 201923, 2022 |
|
| Daniel J. Santaniello, President and Chief |
|
|
| Executive Officer |
|
|
|
|
|
By: | /s/ Salvatore R. DeFrancesco, Jr. |
| March 13, 201923, 2022 |
|
| Salvatore R. DeFrancesco, Jr., Treasurer |
|
|
| and Chief Financial Officer |
|
|
|
|
|
By: | /s/ Brian J. Cali |
| March 13, 201923, 2022 |
|
| Brian J. Cali, Chairman of the |
|
|
| Board of Directors and Director |
|
|
|
|
|
|
|
By: | /s/ John T. Cognetti |
| March 13, 201923, 2022 |
|
| John T. Cognetti, Secretary and Director |
|
|
|
|
|
|
By: | /s/ David L. TresslerRichard M. Hotchkiss | March 13, 201923, 2022 |
|
| David L. Tressler,Richard M. Hotchkiss, Director
|
|
|
|
|
|
By: | /s/ Michael J. McDonald |
| March 13, 201923, 2022 |
|
| Michael J. McDonald, Vice Chairman |
|
|
| of the Board of Directors and Director |
|
|
|
|
|
By: | /s/ Mary E. McDonaldPaul C. Woelkers |
| March 13, 201923, 2022 |
|
| Mary E. McDonald, Assistant Secretary andPaul C. Woelkers, Director
|
|
|
|
|
|
By: | /s/ Patrick J. DempseyHelenBeth G. Vilcek |
| March 13, 201923, 2022 |
|
| Patrick J. Dempsey,HelenBeth G. Vilcek, Director
|
|
|
|
|
|
|
By: | /s/ Kristin Dempsey O’Donnell |
| March 13, 201923, 2022 |
| Kristin Dempsey O’Donnell, Director |
|
|
|
|
|
By: | /s/ Richard Lettieri |
| March 13, 201923, 2022 |
| Richard Lettieri, Director |
|
|
|
|
By: | /s/ William J. Joyce, Sr. | March 23, 2022 |
| William J. Joyce, Sr., Director |
|
|
|
|
By: | /s/ Alan Silverman | March 23, 2022 |
| Alan Silverman, Director |
|