UNITED STATES
SECURITIES AND EXCHANGE COMMISSION
Washington, D.C. 20549
FORM 10-K
| | | | | | | | |
| (Mark One) | |
| ☒ | ANNUAL REPORT PURSUANT TO SECTION 13 OR 15(d) OF THE SECURITIES EXCHANGE ACT OF 1934 |
FOR THE FISCAL YEAR ENDED December 26, 202030, 2023
| | | | | | | | | | | | | | |
| OR |
| ☐ | TRANSITION REPORT PURSUANT TO SECTION 13 OR 15(d) OF THE SECURITIES EXCHANGE ACT OF 1934 |
| FOR THE TRANSITION PERIOD FROM TO |
Commission File No. 001-15943
CHARLES RIVER LABORATORIES INTERNATIONAL, INC.
(Exact Name of Registrant as Specified in Its Charter)
| | | | | | | | | | | |
| Delaware | | | 06-1397316 |
(State or Other Jurisdiction of
Incorporation or Organization) | | | (I.R.S. Employer
Identification No.) |
| 251 Ballardvale Street | Wilmington | Massachusetts | 01887 |
| (Address of Principal Executive Offices) | (Zip Code) |
(Registrant’s telephone number, including area code): (781) 222-6000
____________________________________________________________________________ | | | | | | | | |
| Securities registered pursuant to Section 12(b) of the Act: |
| Title of each class | Ticker symbol(s) | Name of each exchange on which registered |
| Common stock, $0.01 par value | CRL | New York Stock Exchange |
Securities registered pursuant to Section 12(g) of the Act: Yes ☐ No ☒
Indicate by check mark whether the registrant is a well-known seasoned issuer, as defined in Rule 405 of the Securities Act. Yes ☒ No ☐
Indicate by check mark if the registrant is not required to file reports pursuant to Section 13 or Section 15(d) of the Act. Yes ☐ No ☒
Indicate by check mark whether the registrant (1) has filed all reports required to be filed by Section 13 or 15(d) of the Securities Exchange Act of 1934 during the preceding 12 months (or for such shorter period that the registrant was required to file such reports), and (2) has been subject to such filing requirements for the past 90 days. Yes ☒ No ☐
Indicate by check mark whether the registrant has submitted electronically every Interactive Data File required to be submitted pursuant to Rule 405 of Regulation S-T (§ 232.405 of this chapter) during the preceding 12 months (or for such shorter period that the registrant was required to submit such files.) Yes ☒ No ☐
Indicate by check mark whether the registrant is a large accelerated filer, an accelerated filer, a non-accelerated filer, a smaller reporting company, or an emerging growth company. See the definitions of “large accelerated filer,” “accelerated filer”, “smaller reporting company”, and “emerging growth company” in Rule 12b-2 of the Exchange Act. Large accelerated filer ☑ Accelerated filer ☐ Non-accelerated filer ☐
| | | | | | | | | | | |
Large accelerated filer | ☑ | Accelerated filer | Smaller reporting company ☐ Emerging growth company ☐ |
Non-accelerated filer | ☐ | Smaller reporting company | ☐ |
| | Emerging growth company | ☐ |
If an emerging growth company, indicate by a check mark if the registrant has elected not to use the extended transition period for complying with any new or revised financial accounting standards provided pursuant to Section 13(a) of the Exchange Act. ��☐
Indicate by check mark whether the registrant has filed a report on and attestation to its management’s assessment of the effectiveness of its internal control over financial reporting under Section 404(b) of the Sarbanes-Oxley Act (15 U.S.C. 7262(b)) by the registered public accounting firm that prepared or issued its audit report. ☑
If securities are registered pursuant to Section 12(b) of the Act, indicate by check mark whether the financial statements of the registrant included in the filing reflect the correction of an error to previously issued financial statements. ☐
Indicate by check mark whether any of those error corrections are restatements that required a recovery analysis of incentive-based compensation received by any of the registrant’s executive officers during the relevant recovery period pursuant to §240.10D-1(b). ☐
Indicate by check mark whether the registrant is a shell company (as defined in Rule 12b-2 of the Exchange Act). Yes ☐ No ☒
On June 27, 2020,30, 2023, the aggregate market value of the registrant’s voting common stock held by non-affiliates of the registrant was approximately $8,333,378,287.$10,686,736,278. As of January 22, 2021,27, 2024, there were 49,776,22751,349,770 shares of the registrant’s common stock outstanding, $0.01 par value per share.
DOCUMENTS INCORPORATED BY REFERENCE
Portions of the registrant’s definitive Proxy Statement for its 20212024 Annual Meeting of Shareholders currently scheduled to be held on May 6, 2021,8, 2024, which will be filed with the Securities and Exchange Commission (SEC) not later than 120 days after December 26, 2020,30, 2023, are incorporated by reference into Part III of this Annual Report on Form 10-K. With the exception of the portions of the 20212024 Proxy Statement expressly incorporated into this Annual Report on Form 10-K by reference, such document shall not be deemed filed as part of this Form 10-K.
CHARLES RIVER LABORATORIES INTERNATIONAL, INC.
ANNUAL REPORT ON FORM 10-K
FOR FISCAL YEAR 20202023
TABLE OF CONTENTS
| | | | | | | | |
| Item | | Page |
| PART I | |
| 1 | | |
| 1A | | |
| 1B | | |
| 2 | | |
| 3 | | |
| 4 | Mine Safety Disclosures | |
| PART II | |
| 5 | Market for Registrant’s Common Equity, Related Stockholder Matters and Issuer Purchases of Equity Securities | |
| 6 | | |
| 7 | | |
| 7A | | |
| 8 | | |
| 9 | | |
| 9A | | |
| 9B | | |
| PART III | |
| 10 | | |
| 11 | | |
| 12 | | |
| 13 | | |
| 14 | | |
| PART IV | |
| 15 | | |
| 16 | Form 10-K Summary | |
| | |
| Signatures | |
| Exhibit Index | |
| | | | | | | | |
| Item | | Page |
| PART I | |
| 1 | | |
| 1A | | |
| 1B | | |
| 1C | | |
| 2 | | |
| 3 | | |
| 4 | | |
| PART II | |
| 5 | | |
| 6 | | |
| 7 | | |
| 7A | | |
| 8 | | |
| 9 | | |
| 9A | | |
| 9B | | |
| 9C | | |
| PART III | |
| 10 | | |
| 11 | | |
| 12 | | |
| 13 | | |
| 14 | | |
| PART IV | |
| 15 | | |
| 16 | | |
| | |
| |
PART I
Item 1. Business
General
This Annual Report on Form 10-K contains forward-looking statements regarding future events and the future results of Charles River Laboratories International, Inc. that are based on our current expectations, estimates, forecasts and projections about the industries in which we operate and the beliefs and assumptions of our management. Words such as “expect,” “anticipate,” “target,” “goal,” “project,” “intend,” “plan,” “believe,” “seek,” “estimate,” “will,” “likely,” “may,” “designed,” “would,” “future,” “can,” “could” and other similar expressions, thatwhich are predictions of, indicate future events and trends or which do not relate to historical matters are intended to identify such forward-looking statements. These statements are based on our current expectations and beliefs and involve a number of risks, uncertainties and assumptions that are difficult to predict. For example, we may use forward-looking statements when addressing topics such as: trendsour expectations regarding the availability of non-human primates and our ability to diversify our non-human primate supply chain; the outcome of (1) the U.S. government investigations and inquiries related to the non-human primate supply chain (including shipments of non-human primates from Cambodia received by the Company), (2) the putative securities class action lawsuit filed against us and certain current/former officers on May 19, 2023, and (3) the derivative lawsuit filed against members of the Board of Directors and certain current/former officers on November 8, 2023; the timing and impact of the development and implementation of enhanced procedures to reasonably ensure that non-human primates we source are purpose-bred; changes and uncertainties in ourthe global economy and financial markets, including any changes in business, political, or economic conditions due to the November 16, 2022 announcement by the U.S. Department of Justice through the U.S. Attorney’s Office for the Southern District of Florida that a Cambodian non-human primate supplier and industry; goodwill and asset impairments still under review;two Cambodian officials had been criminally charged in connection with illegally importing non-human primates into the United States; client demand, particularly future demand for drug discovery and development products and services, including the outsourcing of these services; our expectations with respect to our ability to meet financial targets; our expectations regarding stock repurchases, including the number of shares to be repurchased, expected timing and duration, the amount of capital that may be expended and the treatment of repurchased shares; our ability to successfully execute our business strategy; our ability to timely build infrastructure to satisfy capacity needs and support business growth, our ability to fund our operations for the foreseeable future, the impact of unauthorized access into our information systems, including the timing and effectiveness of any enhanced security and monitoring present spending trends and other cost reduction activities by our clients; future actions by our management; the outcome of contingencies; changes in our business strategy, business practices and methods of generating revenue; the development and performance of our services and products; market and industry conditions, including competitive and pricing trends;trends and the impact of those conditions, including on our allowances for credit losses; our strategic relationships with leading pharmaceutical and biotechnology companies, and venture capital limited partnerships,investments, and opportunities for future similar arrangements; our cost structure; the impact of completed and in-processour expectations regarding our acquisitions and the timing of closing of in-process acquisitions;divestitures, including their impact and projected timing; our expectations with respect to revenue growth and operating synergies (including the impact of specific actions intended to cause related improvements)improvements, particularly with respect to our CDMO business); the impact of specific actions intended to improve overall operating efficiencies and profitability (and our ability to accommodate future demand with our infrastructure), including gains and losses attributable to businesses we plan to close, consolidate, divest or divest;repurpose and the impact of operations and cost structure alignment efforts (including as estimated on an annualized basis); our expectations with respect to study cancellation rates and the impact of such cancellations; changes in our expectations regarding future stock option, restricted stock, performance share units and other equity grants to employees and directors; expectations with respect to foreign currency exchange; assessing (or changing our assessment of) our tax positions for financial statement purposes; our liquidity; and the impact of litigation, including our liquidity.ability to successfully defend litigation against us. In addition, these statements include the impact of economic and market conditions on us and our clients, the effects of our cost-saving actions and the steps to optimize returns to shareholders on an effective and timely basis.basis; and our ability to withstand the current market conditions.
Forward-looking statements are predictions and are subject to risks, uncertainties and assumptions that are difficult to predict. Therefore, actual results may differ materially and adversely from those expressed in any forward-looking statements. You are cautioned not to place undue reliance on these forward-looking statements, which speak only as of the date of this document or, in the case of statements incorporated by reference, on the date of the document incorporated by reference. Factors that might cause or contribute to such differences include, but are not limited to, those discussed in this Form 10-K under the sections entitled “Our Strategy,” “Risk Factors,” “Management's Discussion and Analysis of Financial Condition and Results of Operations,” in our press releases and other financial filings with the SEC. We have no obligation to publicly update or revise any forward-looking statements, whether as a result of new information, future events or risks. New information, future events or risks may cause the forward-looking events we discuss in this report not to occur.
CHARLES RIVER LABORATORIES INTERNATIONAL, INC.
Corporate History
We began operating in 1947 and, since then, have undergone several changes to our business structure. Charles River Laboratories International, Inc. was incorporated in 1994 and we completed our initial public offering in 2000. Our stock is traded on the New York Stock Exchange under the symbol “CRL” and is included in the Standard & Poor’s 1000, MidCap 400500 and Composite 1500 indices, the Dow Jones U.S. Health Care Index, the NYSENew York Stock Exchange (NYSE) Arca Biotechnology Index, the NYSE Composite and many of the Russell indices, among others. We are headquartered in Wilmington, Massachusetts. Our headquarters mailing address is 251 Ballardvale Street, Wilmington, MA, 01887, and the telephone number at that location is (781) 222-6000. Our Internet site is www.criver.com. Material contained on our Internet site is not incorporated by reference into this Form 10-K. Unless the context otherwise requires, references in this Form 10-K to “Charles River,” “we,” “us,” “the Company” or “our” refer to Charles River Laboratories International, Inc. and its subsidiaries.
This Form 10-K, as well as all other reports filed with the SEC, is available free of charge through the Investor Relations section of our Internet site (www.criver.com) as soon as practicable after we electronically file such material with, or furnish it to, the SEC. The SEC maintains an Internet site (http://www.sec.gov) that contains reports, proxy and information statements, and other information regarding issuers that file electronically with the SEC.
Overview
We are a full service, early-stage contract research organization (CRO).leading, non-clinical global drug development partner with a mission to create healthier lives. We have built upon our original core competency of laboratory animal medicine and science (research model technologies) to develop a diverse portfolio of discovery and safety assessment services, both Good Laboratory Practice (GLP) and non-GLP, which is able to supportthat supports our clients from target identification through non-clinical development. We also provide a suite of products and services to support our clients’ manufacturing activities. Utilizing our broad portfolio of products and services enables our clients to create a more efficient and flexible drug development model, which reduces their costs, enhances their productivity and effectiveness, and increases speed to market.
The development of new drugs requires a steadily increasing investment of time and money. Various studies and reports estimate that it takes between 10 to 15 years, up to $2.5 billion excluding time costs and exploration of between 10,000 and 15,000 drug molecules to produce a single Food and Drug Administration (FDA)-approved drug.
Discovery represents the earliest stages of research in the life sciences, directed at the identification, screening, and selection of a lead molecule for future drug development. Discovery activities typically extend anywhere from 4 to 67 years in conventional pharmaceutical research and development (R&D) timelines.
Development activities, which follow, and which can take up to 7 to 10 years, are directed at demonstrating the safety, tolerability and clinical efficacy of the selected drug candidates. During the non-clinical stage of the development process, a drug candidate is tested in vitro (non-animal, typically on a cellular or sub-cellular level in a test tube or multi-well petri plate) and in vivo (in research models) to establish drug safety prior to and in support of human clinical trials.
For over 7075 years, we have been in the business of providing the research models required in the research and development of new drugs, devices and therapies. Over this time, we have built upon our core competency of in vivo biology to develop a diverse and expanding portfolio of products and services, which now encompasses the broader early-stagenon-clinical drug research process. We are positioned to leverage our leading portfolio in early-stagenon-clinical drug research in an efficient and cost-effective way to aid our clients in bringing their drugs to market faster.
Our client base includes major global pharmaceutical companies, a broad range ofmany biotechnology companies,companies; agricultural and manyindustrial chemical, life science, veterinary medicine, medical device, diagnostic and consumer product companies; contract research and contract manufacturing organizations; and other commercial entities, as well as leading hospitals, academic institutions, and government agencies hospitals and academic institutions around the world. In recent years, we have focused our efforts on improving the efficiency of our global operations to enhance our ability to support our clients. Our pharmaceutical and biotechnology clients are increasingly seeking full service, “one-stop” global partners to whom they can outsource more of their drug discovery and development efforts. It is estimated that the market for regulated safety assessment services is 60% outsourced or more, while emerging growth areas such as discovery and certain research model services are currently believed to be less outsourced.
We currently operate in over 100 facilities155 sites and in over 20 countries worldwide (excluding ourcertain Insourcing Solutions sites). Our products and services, supported by our global infrastructure and deep scientific expertise, enable our clients to overcome many of the challenges of early-stagenon-clinical life sciences research. In 2020,2023, our total revenue was $2.9 billion and our operating income from continuing operations, before income taxes, was $447.1 million.$4.1 billion.
We have three reportingreportable segments: Research Models and Services (RMS), Discovery and Safety Assessment (DSA) and Manufacturing SupportSolutions (Manufacturing).
Through our RMS segment, we have suppliedprovided foundational tools for the discovery of new molecules by supplying research models to the drug development industry since 1947. With over 150 different stocks and strains, weWe continue to maintain our position as a global leader in the production
CHARLES RIVER LABORATORIES INTERNATIONAL, INC.
and sale of the most widely used rodent research modelmodels, including over 140 different stocks and strains andof purpose-bred rats and mice.rodents. We also provide a variety of related services that are designed to support our clients in the use of research models in drug discovery and development. We maintain multiple production centers, including barrier rooms and isolator facilities, on three continents (North America, Europe, and Asia). We are also a premier provider of high quality, purpose bred, large research models to the biomedical research community. Our RMS segment also includes our Insourcing Solutions business, which includes our CRADL™ (Charles River Accelerator and Development Lab) footprint. In 2020,2023, RMS accounted for 19.6%19.2% of our total revenue and approximately 3,9004,300 of our employees, including approximately 220200 science professionals with advanced degrees. In addition, in 2020, we added new services in our Research Products business through the acquisition of HemaCare Corporation (HemaCare) and Cellero, LLC (Cellero).
Our DSA business segment provides services that enable our clients to outsource their innovative drug discovery research, their related nonclinical and some clinical drug development activities, and their regulatory-required safety testing of potential new drugs, vaccines, industrial and agricultural chemicals, consumer products, veterinary medicines and medical devices. The demand for these services is driven by the needs of large global pharmaceutical companies that have exceeded their internal capacity or that continue to transition to an outsourced drug development model, as well as by the needs of smallin addition to mid-size and emerging biotechnology companies, chemicalindustrial and agrochemical companies and non-governmental organizations that rely on outsourcing for most of their discovery, development and safety testing programs.outsourcing. These entities may choose to outsource their discovery, development and safety activities to reduce fixed costs and to gain access to additional scientific expertise and capabilities.
We are the largest provider of outsourced drug discovery, non-clinical development and regulated safety testing services worldwide. We have extensive expertise in the discovery of clinicalnonclinical candidates and in the design, execution and reporting of safety assessment studies for numerous types of compounds including cell and gene therapies, small and large molecule pharmaceuticals, industrial and agricultural chemicals, vaccines, consumer products, veterinary medicines, cell and gene therapies, biocides and medical devices. We currently provide discovery and safety assessment services at multiple facilities located in the United States (U.S.), Canada, and Europe. In 2020,2023, our DSA segment represented 62.8%63.3% of our total revenue and employed approximately 11,60013,400 of our employees including approximately 2,0001,800 science professionals with advanced degrees.
Within our Manufacturing segment, we helpwork with our clients and the biopharmaceutical industry to ensure the quality and safe production and release of commercial therapies and products manufactured both by our clients and internally for our clients. Our Manufacturing Segment is comprised of threetwo businesses: Microbial Solutions and Biologics Testing Solutions and Avian Vaccine Services.Solutions. Our Microbial Solutions products and services businesses provide in vitro methods for conventional and rapid quality control testing of sterile and non-sterile pharmaceuticals and consumer products. OurBiologics Solutions is comprised of both our Biologics Testing Solutions business, which provides specialized testing of biologics frequently outsourced by global pharmaceutical and biotechnology companies. Our Avian Vaccine Servicescompanies, and our CDMO business, which provides specific-pathogen-free (SPF) fertile chicken eggs, SPF chickenscomprehensive contract development and diagnostic products used to manufacture vaccines.manufacturing solutions for cell and gene therapies. In 2020,2023, Manufacturing accounted for 17.6%17.4% of our total revenue from continuing operations and approximately 2,0003,000 of our employees, including approximately 180400 science professionals with advanced degrees.
Research Models and Services. Our RMS segment is comprised of three businesses:businesses that provide foundational tools that enable our clients to discover new molecules: Research Models, Research Model Services and Research Products.Cell Solutions.
Research Models. Our Research Models business is principally comprised of the production and sale of the most widely used small research models.models, primarily rodents. A significant portion of thisour Research Models business involves the commercial production and sale of small research models, principally purpose-bred rats and mice for use by researchers. The FDA and foreign regulatory agencies typically require that the safety and efficacy of new drug candidates be tested on research models like ours prior to testing in humans. As a result, our research models are an essential part of the drug discovery and development process.
We provide our research models to numerous clients around the world, including most pharmaceutical companies, a broad range of biotechnology companies, other contract research organizations and many government agencies, hospitals, and academic institutions. We have a global footprint with production facilities strategically located in 87 countries, in close proximity to our clients.major biohubs and client concentrations. Our research models include commonly used laboratory strains, disease models and specialized strains with compromised immune systems, which are in demand as early-stage tools in the drug discoveryresearch and development process.
The research models we supply have been, and continue to be, some of the most extensively used in the world, largely as a result of our geographic footprint and continuous commitment to innovation, quality, and quality.biosecurity. Our research models are bred and maintained in controlled environments, which are designed to ensure that the models are free of specific viral and bacterial agents and other contaminants that can disrupt research operations and distort scientific results. With our production capabilities, we are able to deliver consistently high-quality research models worldwide.
Our small research models include:
•include inbred, which are bred to be homogeneous;
•outbred, and hybrid which are the offspring of parents from two different genotypes;
•outbred, which are purposefully bred for heterogeneity;
•spontaneousstrains, as well as mutant whose genotype results in a naturally occurring genetic mutation (such as immune deficiency);strains and
•other genetically modified research models, such as knock-outengineered models with one or more disabled genes and transgenic models.
biological features, which enable research aims. Certain of our research models are proprietary rodent models used to research treatments in several therapeutic areas. We are also a premier provider of high quality, purpose bred, SPF large research models to the biomedical research community. While we provide some non-human primates directly to customers who utilize
CHARLES RIVER LABORATORIES INTERNATIONAL, INC.
them primarily for safety testing of new therapies, most of the non-human primates associated with our business are utilized in connection with our customers’ studies conducted by our Safety Assessment business. In both cases - non-human primates we provide directly to customers and non-human primates which are utilized in our Safety Assessment business – these large research models are sourced from Charles River audited and approved suppliers, some of which we have an ownership and/or operational involvement. See Note 2, “Acquisitions and Divestitures”, included in the notes to our consolidated financial statements included elsewhere in this Form 10-K for a description of the recent acquisition of Noveprim Group.
Research Model Services. RMS offers a variety of servicesflexible solutions designed to support our clients' use of research models in basic research and screening non-clinicalpre-clinical drug candidates. These services address the need among pharmaceutical and biotechnology companies to outsource the non-core aspects of their drug discovery activities. Our services include those related to the maintenance and monitoring of research models, and managing research operations for government entities, academic
organizations, and commercial clients. Our expanded service offering provides greater flexibility for our clients’ research and supports increased scientific complexity. We currently have three service offerings in research models services: Insourcing Solutions, Genetically Engineered Models and Services (GEMS), Insourcing Solutions and Research Animal Diagnostic Services (RADS).
Insourcing Solutions. We manage the research operations of government entities, academic organizations and commercial clients (including recruitment, training, staffing and management services) both within our clients’ facilities and utilizing our Charles River Accelerator and Development Lab (CRADL™) offerings, where we provide vivarium space to our clients. Some research institutions prefer to retain certain elements of their research in-house, while outsourcing staffing and management, thus driving demand for our services. We believe that our expertise in early-stage drug research, and in particular research model care, scientific and technical support, facility operations, and discovery and development services, enhances the productivity and quality of our clients’ research programs.
Genetically Engineered Models and Services. We create, breed and maintain research models required by our clients for biomedical research activities. The creation of a genetically engineered model (GEM) is a critical scientific event, but it is only the firstone step in the discovery process, and our scientists can advise clients on how to efficiently create custom models utilizing in-licensed technologies and approaches to modify the genome. Through our phenotyping platforms, we can also design and conduct the relevant studies and tests allowing characterization of the generated models. Productive utilization of GEMs requires significant additional technical expertise in order to properly support basic and early discovery research. We provide breeding expertise and colony expansion, quarantine, health and genetic testing and monitoring, germplasm cryopreservation and rederivation, including assisted reproduction and model creation. Our team of project managers is supported by a proprietary, technologically advanced Internet Colony Management (ICM™) system that allows for real-time data exchange. We provide these services to clients around the world, including pharmaceutical and biotechnology companies, hospitals, universities, and government agencies.
Insourcing Solutions. We manage the research operations of government entities, academic organizations and commercial clients (including recruitment, training, staffing and management services) both within our clients’ facilities and utilizing our Charles River Accelerator and Development Lab (CRADL™) option, in which we lease space to our clients. Some research institutions prefer to retain certain elements of their research in-house, while outsourcing staffing and management, thus driving demand for our services. We believe that our expertise in early-stage drug research, and in particular research model care, scientific and technical support, facility operations, and discovery and development services, enhances the productivity and quality of our clients’ research programs.
Research Animal Diagnostic Services. We monitor and analyze the health profiles of our clients’ research models and research biologics by providingassessing infectious agents and pathology assessment.pathology. We developed this capability internally to address the quality control of our research model business. We can serve as our clients’ sole-source testing laboratory, or as an alternative source supporting our clients’ internal laboratory capabilities. We believe we are the reference laboratory of choice for health assessment of laboratory research models and an industry leader in the field of laboratory animal diagnostics.
Research ProductsCell Solutions. Our Research ProductsCell Solutions business provides human-derivedconsenting human donor-derived cellular materials used in the development ofand production of cell therapies. The business supplies controlled, consistent, customized primary cells and blood components derived from normal and mobilized peripheral blood and bone marrow, and cord blood. Research Productsmarrow. Our Cell Solutions business supports biotechnology and pharmaceutical companies, academic institutions and other research organizations who rely on high-quality, viable and functional human primary cells and blood components for biomedical and drug discovery research and cell therapy development.development, including clinical trials.
In August 2020, we acquired Cellero, a provider of cellular products for cell therapy developers and manufacturers worldwide as part of our Research Products business. The addition of Cellero enhances our unique, comprehensive solutions for the high-growth cell therapy market, strengthening the ability to help accelerate clients’ critical programs from basic research and proof-of-concept to regulatory approval and commercialization.
Discovery and Safety Assessment
Our DSA segment is comprised of two businesses: Discovery Services and Safety Assessment. We currently offer regulated and non-regulated DSA services to support the research, development, and regulatory-required safety testing of potential new drugs, including therapeutic discovery and optimization plus in vitro and in vivo studies, laboratory support services, and strategic non-clinical consulting and program management to support product development.
Discovery Services. Our Discovery Services business operates as a single source of services for discovering and characterizing novel drug candidates for preclinical development. We offer a full spectrum of discovery services from identification and validation of novel targets, chemical compounds and antibodies with actual or potential intellectual property value through to delivery of non-clinicalpreclinical drug and therapeutic candidates ready for safety assessment. Our Discovery Services business includes Early Discovery and In Vivo and In Vitro Discovery businessesservices to streamline and enhance the integrated support we can provide for clients’ drug discovery programs.programs for our clients, including expertise and capabilities in all stages of Discovery and all major modalities including small molecules, antibodies and cell and gene therapies. This seamless discovery organization, along with its broad capabilities allows us to better engage with clients at any stage of their drug discovery programs and support their complex scientific needs. Our discovery servicesDiscovery Services business unit focuses on all of the major therapeutic areas, with a strategic focus on oncology, immunology and neuroscience. We believe there are growing opportunities to assist
CHARLES RIVER LABORATORIES INTERNATIONAL, INC.
our clients in a variety of drug discovery applications and platforms from target discovery to candidate selection and across the full range of modalities, including small molecules and large molecules and cell and gene therapy candidates.modalities.
Early Discovery. We are a global leader in integrated drug discovery services. Our full suite of service offerings, together with our knowledge and expertise, allows us to engage and support our clients at the earliest stagesany stage of their research,discovery or early-stage development programs, including the design and
implementations of their research programs, and to stay with them through the entire drug discovery process. Our Early Discovery service capabilities include:
•target discovery and validation;
•target deconvolution through proteomics;
•hit identification and optimization to deliver candidate molecules across modalities, including computer-aided drug design;
•early nonclinical pharmacokinetic and pharmacodynamic studies, transporter-mediated drug-drug interaction, and in vitro and in vivo assays to assess mechanism, bioavailability and metabolism as required for regulatory approval of new drugs;
•In vivo Discovery Services, which are essential in early stage, non-clinical discovery research, and are directed at the identification, screening, optimization and selection of effective therapeutics agents in pharmacology models. These in vivo activities typically extend anywhere from 1 to 2 years in conventional pharmaceutical R&D timelines; and
•target engagement biomarker development to support non-clinical and potentially downstream clinical studies.
Additionally, we offer ion channel and drug transporter testing for both discovery and non-clinical purposes, as well as genome editing services.
purposes. We also provide these services at our clients’ laboratories with Charles River scientists as part of an insourcing service model. Through strategic partnerships, we also offer a human antibody discovery and development platform, an artificial intelligence drug design platform and a human stem cell model platform.
In Vivo and In Vitro Discovery ServicesThrough comprehensive . Inin vivo and in vitro offerings, Discovery Services are essential in early stage, non-clinical discoveryhelps to reduce the time needed to research, develop, and are directed atassess the identification, screening, optimization and selectionefficacy of effective therapeutic agents in pharmacology models. These in vivo activities typically extend anywhere from 1 to 3 years in conventional pharmaceutical R&D timelines.new therapeutics under development. Our offerings include businesses that provide critical data to advance novel therapeutics, as well as drug transporter assays and kits. We offer R&D expertise, capabilities and services globally to accelerate our clients’ drug discovery pipelines from lead generation to candidate selection. We complement and extend clients’ capabilities and expertise to improve their decision-making, increase their flexibility, and reduce their internal costs and product development timelines. In addition,
Through strategic partnerships, we providealso offer an artificial intelligence drug design platform, a growing portfolio ofhuman stem cell model platform, and 3D in vitro assays in support of lead optimization to candidate selection activities. Examples of this include early pharmacokinetic and pharmacodynamic studies and oncology models.in vitro assays to assess mechanism, bioavailability, metabolism, efficacy, pharmacology and safety.
In December 2020, we acquired Distributed Bio, a next-generation antibody discovery company. The acquisition expands Charles River’s scientific capabilities with an innovative, large-molecule discovery platform. The transaction combines Distributed Bio’s antibody libraries and immuno-engineering platform with our extensive drug discovery and non-clinical development expertise to create an integrated, end-to-end platform for therapeutic antibody and cell and gene therapy discovery and development.
Safety Assessment. We offer a full range of safety assessment studies required for regulatory submission on a global basis across all therapeutic areas in the pharmaceutical, biotechnology, industrial chemical, agrochemicals, consumer products, veterinary medicines and medical devices industries. Our safety assessment business also provides expertise in a variety of therapeutic areas as well as the development of surgically implanted medical devices.and modalities. Our Safety Assessment business is a global leader in both non-regulated and regulated (GLP) outsourced safety assessment services.
Toxicology. We offerprovide a broad specialty toxicology offering from inhalation and infusion to developmental and reproductive toxicology. Our services include a broad offering of in vitro and in vivo capabilities and study types designed to identify possible safety risks as well as a broad offering of in vitro and in vivo studies in support of general toxicology (acute, sub-acute and chronic studies), genetic toxicology, safety pharmacology, off-target screening, receptor identification profiling, reproductive and developmental toxicology, juvenile toxicology, and carcinogenicity bioassays that are required for regulatory submissions supporting “first-in-human” to “first-to-the-market” strategies for potential human therapeutics. Additionally, we support safety studies in numerous specialty areas including abuse and seizure liability, ecotoxicology, environmental risk, musculoskeletal toxicology, neurotoxicology, ocular toxicology, ototoxicology, and phototoxicology. We have expertise in the design and execution of development programs in support of a broad diversity of therapeutic modalities.modalities in numerous laboratory species and test systems. We also support safety studies to test industrial chemical, agrochemicals, consumer products, veterinary medicines and medical devices. For human pharmaceutical candidates, once a lead candidate is selected, toxicology studies are required to support clinical trials in humans and for regulatory approval. These toxicology studies focus on assessing the safety of the potential therapeutic to determine if administration to humans might cause any unintended harmful effects. For new chemicals, industrial chemicals, agrochemicals, veterinary medicines, consumer products and medical devices, safety studies are performed to identify potential hazards to humans and the environment and are required for regulatory registration. Toxicology studies performed for any of these compounds are typically performed using in vitro and in vivo research models to identify any potential adverse effects that a compound has on an organism over a variety of doses and over various time periods of exposure.
Pathology Services. The ability to identify and characterize clinical and anatomic pathologic changes is critical in determining the safety and efficacy of potential new therapeutics, industrial and agricultureagricultural chemicals, veterinary medicines, and medical
CHARLES RIVER LABORATORIES INTERNATIONAL, INC.
devices. Key “go/no-go” decisions regarding continued product development are typically dependent on the identification, characterization and
evaluation of fluid, tissue and cellular changes that our experts identify and interpret for our clients. We employ many highly trained veterinary anatomic and clinical pathologists and other scientists who use state-of-the-art techniques to identify potential test compound-relateditem-related changes. In addition to all standard anatomic and clinical pathology techniques, we provide specialized evaluations such as cytology, platelet function, assay development, immunohistochemistry, in situ hybridization, electron microscopy, image analysis, tissue morphometry and stereologyspatial analysis services.
Safety Pharmacology. Our clients are also required to conduct an assessment of Safety Pharmacology.safety pharmacology. This suite of studies is used to determine any effects on the vital organ systems of the body - cardiovascular, respiratory and CNS.central nervous system (CNS). Along with heart rate and blood pressure measurements, the cardiovascular assessment will also assess if the test article has the potential to alter cardiac ion channel currents and prolong the cardiac QT interval of the electrocardiogram. Additionally, effects on the central nervous system (CNS)CNS and respiratory systems are assessed to complete the battery of studies to evaluate the vital organ systems of the body. Supplemental studies can also be performed to assess the renal, gastrointestinal and autonomic nervous systems, as well as dependency potential. We have in vitro, ex vivo(use of cells, tissues or organs outside of an in vivo system) and in vivo assays and perform the screening prior to the commencementinitiation of first-in-human clinical trials. Our capabilities can also be used to investigate the mode of action behind an adverse effect found in a safety assessment study.
Bioanalysis, Drug Metabolism and Pharmacokinetics. In support of non-clinical drug safety testing and new chemical development, our clients are required to demonstrate appropriate stability in the collected biological sample, pharmacokinetics of their drug or compound in circulation, the presence of metabolites and, in the case of biologics, the presence or absence of anti-drug antibodies. We have scientific expertise in the sophisticated bioanalytical techniques required to satisfy these requirements for many drugs and chemicals. Once analysis is complete, our scientists evaluate the data to provide information on the pharmacokinetics and/or toxicokinetics of the drug or chemical and complete an evaluation of the biologic disposition of the drug or chemical and its potential metabolites. Pharmacokinetics refers to the understanding of what the body does to a drug or compound administered at therapeutic dose levels, including the process by which the drug is absorbed, distributed in the body, metabolized and excreted. Toxicokinetics refers to the same understanding as applied at higher doses that may result in adverse effects. These studies are routinely required for the full non-clinical assessment of the disposition of the drug or chemical and the results are used in the safety evaluation of the compound. After performing sample analysis in support of non-clinical studies, we also support the clinical bioanalysis required in clinical trials for drug development. In addition, our Laboratory Sciences group is able to measure a wide range of nonclinical and clinical biomarkers related to the safety and efficacy of the drugs and/or chemicals being developed.
Our safety assessmentSafety Assessment facilities comply with animal welfare requirements and GLP to the extent required by the FDA, Environmental Protection Agency, USDA,United States Department of Agriculture (USDA), European Medicines Agency, European Chemicals Agency and the Organization for Economic Co-operation and Development (OECD), Canadian Council on Animal Care (CCAC) as well as other international regulatory agencies. Furthermore, our early-stage discovery work, which is not subject to GLP standards,regulations, is typically carried out under a quality management system such as ISO 9100 or similarly constructed internally developed quality systems.system. Our Safety Assessment facilities and Manufacturing facilities are regularly inspected by U.S. and other regulatory compliance monitoring authorities, our clients’ quality assurance departments and our own internal quality assessmentaudit program.
Manufacturing SupportSolutions
Our Manufacturing SupportSolutions segment is comprised of threetwo businesses: Microbial Solutions and Biologics Testing Solutions and Avian Vaccine Services.Solutions.
Microbial Solutions. Our Microbial Solutions business provides operates as a rapid, efficient testing platform for microbial detection and identification of sterile and non-sterile applications. Microbial Solutions is a premier global provider of in vitro methods for conventional and rapid quality control testing.testing, including FDA-mandated lot release testing for sterile biopharmaceutical products. The products and services are provided by our Endosafe®, Celsis® and Accugenix® businesses, which produce, globally distribute and service a comprehensive portfolio of endotoxin testing, microbial detection and identification kits, reagents, instruments, software, accessories, and laboratory services to a broad range of companies manufacturing and releasing products from the pharmaceutical, biotechnology, medical devices and consumer products companies, including the dairy, food and beverage markets through a strategic partnership.companies. Our Endosafe® business provides lot release testing of medical devices and injectable drugs for endotoxin contamination. Our Celsis® business provides rapid microbial detection systems for lot release testing as well as raw materials and in-process for quality control testing in the pharmaceutical, medical device and consumer products industries. Our Accugenix® business provides state-of-the-art microbial identification services and products for manufacturing in the biopharmaceutical, medical device, nutraceutical and consumer care industries. We expect our comprehensive portfolio of offerings and global network of laboratories to drive increased adoption of our quality control testing solutions across both sterile and non-sterile applications.
Endosafe®. We are a market leader in endotoxin testing products and services, which are used for FDA-required quality control testing of injectable drugs and medical devices, their components, and the processes by which they are manufactured. Endotoxin testing is an in vitro process that uses a processed extract from horseshoe crabs, known as limulus amebocyte lysate (LAL). The LAL test is the first and most successful FDA-validated alternative to an in vivo test to date. Generally, the
extraction of the raw materials for LAL does not harm the crabs, which are subsequently returned to their natural ocean environment. We have worked closely with the Department of Natural Resourcesregulatory agencies in states where we collect to protectlimit our impact on the horseshoe crab and, in the regions where those protections are in place, the horseshoe crab population is growing. We are a market leader in endotoxin testing products and services, which are used for FDA-required quality control testing of injectable drugs and medical devices, their components, and the processes by which they are manufactured.population.
One of the primary growth drivers in our Microbial Solutions business is our FDA-approved line of next-generation endotoxin testing products. This line is based on the Endosafe Portable Testing System (Endosafe® -PTS™) technology, which allows rapid endotoxin testing in the central laboratory or manufacturing environment. In recent years, we expanded the PTS product portfolio to include a multiple sample testing system known as the Endosafe®-MCS™ (multi-cartridge system) and the first fully automated robotic system developed specifically for high-volume endotoxin testing, Endosafe®-Nexus, to satisfy the demand of our clients who require higher sample throughput. We have seen expanded use of this rapid endotoxin testing technology as clients transition from traditional methods to our rapid cartridge technology and are seeking to meet data integrity requirements with our automated systems and software solutions. We recently launched Endosafe® Trillium®, our new animal-free recombinant test for endotoxin detection. Endosafe® Trillium® utilizes three biological proteins, which we believe provides superior accuracy and testing outcomes to competitors’ single-protein recombinant alternatives, as well as equivalence to LAL-based testing method. Endosafe® Trillium® represents a next-generation solution to our industry-leading Endosafe® bacterial endotoxin detection portfolio.
Celsis®. The Celsis® reagents and instrument systems are used for in-process and product-release testing to help ensure the safe and efficient manufacture of pharmaceutical and consumer products. Celsis® products utilize adenosine triphosphate bioluminescence technology for the rapid detection of microbial contamination delivering definitive results for some applications as fast as 24 hours. The product range includes reagent kits, instruments, software and services. The Celsis Advance II™, Celsis Accel™, and Celsis Accel™Adapt™ instruments and software automate the process for rapid microbial detection. We recently launchedmaintain a suite of products focused on sterility testing. Sterility testing is required prior to the release of sterile injectable products. The legacy method required a 14-day sample incubation period and was subjective. Using the Celsis® protocol and instrumentation, clients can detect contamination within 6 days and make definitive product release decisions. In 2020, we launched theWe also offer Celsis Complete™ and Celsis Advantage™ services. The Celsis Complete™ services supply both the documentation and testing required as part of a client sterility technology method validation process. This assists customersclients to complete their validation process very quickly without utilizing their own personnel resources. The Celsis Advantage product supplies the required documentation needed for the clients to conduct their own internal validation. The Celsis Adapt™ is an accessory instrument for the Celsis® rapid detection systems, which is used to prepare and concentrate samples and provide a rapid testing solution for advanced therapy medicinal products, cell therapies, gene therapies, and other cell-containing products.
Accugenix®. Our Accugenix® global lab network is the premier provider of ISO17025-accredited contract microbial identification services. Accugenix® is an industry leader in species-level identification and strain typing of bacteria and fungi that are recovered from manufacturing facilities. Utilizing state-of-the-art and proprietary technologies, coupled with scientific expertise and analysis from a network of nineten global labs, Accugenix® excels in providing accurate, timely, and cost-effective microbial identification services and products required to meet internal quality standards and government regulations. Accugenix® also offers an in- house solution with our Axcess® instrument that allows clients to perform identification testing in their own lab with access to our proprietary library.
Biologics Testing Solutions. Our Biologics Solutions (Biologics) business is comprised of our Biologics Testing Services business and CDMO business. Biologics provides clients with analytical testing and related capabilities to support the safe manufacture of their biologic drugs, as well as a suite of manufacturing services to produce our clients’ advanced therapeutics.
Our current Good Manufacturing Practices (cGMP) testing services facilities also grow and store well-characterized early-stage client cell lines and virus seed stocks for later development or manufacture of therapeutic proteins and vaccines for clinical trials. We further design and provide viral clearance programs according to GLP at our German facility and cGMP at our U.S. facility for Phase I, II and III human clinical studies as well as for market authorization.
Biologics Testing Services
Our Biologics Testing Services business encompasses process development and quality-control testing to support the manufacture of biologics. We perform specialized testing of biologics frequently outsourced by pharmaceutical and biotechnology companies globally.globally and are a partner in navigating the complex pathway to biologic effectiveness. Our laboratories in the U.S., Germany, Ireland and France provide timely and regulatory-compliant services in the areas of analytical, molecular biology, virology, cell-based bioassays, bioanalysis, immunochemistry, microbiology, cell biology, in vivo and in vitro studies and related services. We provide analytical characterization, lot release and safety testing support for chemistry, manufacturing and controls and investigational new drug (IND) filings and confirm that biomanufacturing of clinical drug candidates and commercial drugs are consistent, correctly defined, stable and essentially contaminant free. This testing is required by the FDA, EMA and other international regulatory authorities for our clients to obtain new drug approvals, to maintain government-licensed manufacturing facilities and to manufacture and release market-approved therapeutic products for patient treatment.
Our cGMP manufacturing services facilities grow and store well-characterized early-stage client cell lines for later development or manufacture of therapeutic proteins and vaccines for clinical trials. We further design and provide viral clearance programs for Phase I, II and III human clinical studies in our German and U.S. facilities.
CHARLES RIVER LABORATORIES INTERNATIONAL, INC.
To meet growing demand, we are currently expandingcontinue to expand our Biologics Testing Solutions service offerings and facilities in the U.S. and Europe. We have also commissioned a biosafety level 3 (BSL3) facility to provide in vivo and in vitro testing services for BSL3 materials, such as SARS-CoV2.
Avian VaccineCDMO Services. We are
Our CDMO business operates in the global leader forthree major areas of the supply of SPF fertile chicken eggshigh-growth advanced therapy CDMO market: cell therapy, viral vector, and chickens. SPF chicken embryos are used by vaccine producersplasmid DNA production. Our CDMO services include expertise in gene-modified and unmodified cell therapy manufacturing coupled with capabilities in viral vector manufacturing, as self-contained “bioreactors” for the manufacture of live viruses. These viruses are usedwell as plasma DNA. Our CDMO services establish us as a premier scientific partner for cell and gene therapy development, testing, and manufacturing. The full integrated advanced therapeutics portfolio enables us to provide clients with an integrated solution from basic research and discovery through cGMP production; driving efficiency and accelerating clients’ speed-to-market by integrating preclinical CRO activities with manufacturing and testing. This provides our clients with a seamless experience across the value chain with the same advanced therapeutics scientific partner. Our cGMP CDMO facilities have the capability to manufacture and store raw materialmaterials, drug substance, and drug product, which are suitable for human and veterinary vaccine applications. The production of SPF eggs is performed under biosecure conditions, similaruse in many ways to our research model production. We have a worldwide presence, with several SPF egg production facilities in the U.S., and contracted production capabilities in Hungary. We also operate a specialized avian laboratory in the U.S., which provides quality control test reagentsclinical trials as well as for our SPF flocks, offers testing services to vaccine companies and commercial poultry operations and manufactures poultry diagnostics and bulk antigens for poultry vaccines.manufacturing.
Our Strategy
Our objective is to be the preferred strategic globalscientific partner for our clients.of choice to accelerate biomedical research and therapeutic innovation. Our strategy is to deliver a comprehensive and integrated portfolio of drug discovery and non-clinical development products, services and solutions to support our clients’ discovery and early-stage drug research, process development, scale up, manufacturing and manufacturingproduct release efforts, and enable them to bring new and improved therapies to market faster and more cost effectively. Separately, through our various Manufacturing segment businesses, we aim to be the premier provider of products and services that ensure our clients produce and release their products safely.
We believe we have certain competitive advantages in executing this strategy because of our continuing focus on the following:
Integrated Early-Stage Portfolio. We are the onlyOur large, global CRO with a portfolio of products, services and solutions that focuses on drug discovery and early-stage development. We provide research models and associated services, discovery research studies and services and comprehensive safety assessment studies in both regulated and non-regulated environments. As such, we can collaborate with clients from target discovery through development candidate selection. When critical decisions are made regarding which therapeutics will progress from discovery to development, we continue to work alongside our clients as the drug candidates move downstream. Our recognized expertise in early-stage drug research and pharmacology provides us with a competitive advantage and enables our clients to make critical drug development decisions more quickly. We understand our clients’ therapies and the challenges they face during the discovery and development process, including mechanism of action, efficacy, drug metabolism, safety assessment and toxicological testing, which are all critical for making “go/no-go” decisions.
PharmaceuticalComprehensive Biopharmaceutical Manufacturing Support Portfolio. We also offer a portfolio of products, services and solutions that supports the process development, scale up, and quality control and production efforts of the biopharmaceutical industry. We provide products and services that support the development and release of clinical stage and commercialized biologics products.products, including CDMO services to manufacture advanced therapeutics for our clients. In particular, we are an industry leader in the areas of microbial detection and microbial identification to support process development and ongoing commercial production. Our portfolio spans a broad range of traditional and rapid methods, which provide the highest testing quality, enhanceenhanced productivity and reducereduced cycle time.
Deep Scientific Expertise. We provide a breadth and depth of scientific expertise across a broad range of therapeutic areas which may be too costly for our clients to build and/or maintain in-house. We provide essential capabilities, including biomarkers, biologics, medicinal chemistry, antibody engineering, in vitro screening,biology, in vivo pharmacology, pathology, advanced modalities manufacturing, analytical testing for early and late stage products, immunology, pathology,biomarker assessment, biologics process development testing, microbial detection and identification and other specialty service areas that have high infrastructure costs or are cost-prohibitive for clients to maintain independently. We continue to expand our portfolio in key therapeutic and pharmacology areas to align with our clients’ internal drug discovery and development areas of focus. We also continue to enhance our small molecule, biologics, and biologics manufacturing portfolioadvanced modalities portfolios in areas of greatest industry need, where outsourcing provides major benefits for our clients and where we could provide significant benefits given our unique earlyearly-stage development portfolio and global footprint.
Commitment to Animal Welfare. We are committed to being the worldwide leader in the humane care of laboratoryresearch animals and implementation of the “3Rs”“4Rs” initiative (Replacement, Reduction, Refinement, and Refinement)Responsibility). As researchers, we are responsible to our clients, our animals and the public for the health and well-being of the animals in our care. We work closely with the scientific community to understand how living conditions, handling procedures and reduction of stress play an important role in the quality and efficiency of research. We are committed to working with the industry to support development and to provide the best translational models to supplement or replace traditional models. These include in vitro models as well as in silico predictive tools. In the last 4 years, we have
CHARLES RIVER LABORATORIES INTERNATIONAL, INC.
invested approximately $200 million in alternative methodologies, including technologies and digital platforms that reduce/modify animal use via strategic acquisitions, partnerships, and internal investments.
Superior Quality and Client Support. We maintain scientific rigor and high-quality standards through management of key performance indicators and an intense focus on biosecurity and quality. These standards help to reduce research risk and allow clients to access our global portfolio of products and services with the confidence that they will obtain consistent results no matter where they choose to obtain their products or conduct their research.
Flexible and Customized Environment to Provide the Right Solutions. Each of our clients is different, with unique needs and specific requirements. We understand the importance of flexibility, and leverage the expertise embedded in our integrated, early-stagenon-clinical portfolio to provide customized solutions tailored to the specific need or therapeutic area for a particular client. By utilizing our streamlined and efficient facilities, we help clients create a flexible and integrated infrastructure in order to improve their workload and staffing requirements. This allows our clients to reduceoptimize internal capacity and/or staff while ensuring the conduct of effective quality research for their projects. We provide enhanced value to clients who use us as a full-service integrated partner over a longer period of time.
Large, Global Partner. We believe there is an important advantage in being a full service, high-quality provider of research models and associated services, discovery and non-clinical in vivo and in vitro services and manufacturing supportsolutions on a global scale. Many of our clients, especially large biopharmaceutical companies, have decided to limit the number of suppliers with which they work. They frequently chosechoose to partner with large Tier 1 CROs likecompanies similar to Charles River, whothat can offer clients support across the early-stagenon-clinical drug research process as a result of broader portfolios and experience in project management. This includes extensive scientific, technical and therapeutic area expertise, real-time access to data, documentation and data visualization through secure portals, provision of data in sponsor-specific formats for data warehousing needs, accelerated reporting, reduced standard reporting timelines and industry-leading Standard Exchange of Non-Clinical Data (SEND) capabilities, a global footprint, streamlined and simplified processes and communications, including professional project and relationship management. We are focused on leveraging our competitive advantages to ensure we are recognized as the premier preferred provider, thereby enabling us to build broader and deeper long-term strategic relationships with our clients.
Digital Enhancements. We believe the healthcare industry is at a unique inflection point post COVID, where vaccines and treatments were developed in record time, and there is increasing focus on personalized medicine and rare diseases. As the industry evolves, technology is playing an essential role. This technological revolution is not only helping streamline processes and operations, but the effects of this digitization directly impact patients. We are committed in our efforts to reduce the timeline to develop, safe and innovative new treatments for patients who desperately need them. To progress this forward, we strive to understand the true challenges that can slow drug research and development and re-imagine the way we work and collaborate to create digitally native solutions that improve efficiency, accelerate processes and enable automated, data driven outcomes. Our commitment to understanding the problem before finding a solution has enabled us to keep clients—and ultimately patients—at the center of the way we look at problems. By using client-centric design thinking, agile-based test and learn processes in short iterative cycles, and automating existing processes, we optimize client experiences and bring holistic solutions to pressing concerns.
Our clients’ R&D needs continue to evolve. These clients are increasingly emphasizing studies that have greater translation to the clinic so that they can make appropriate decisions regarding the progression of potential therapeutic entities earlier in the development process. The result is a greater focus on discovery services, includingin vitro models and in vivo pharmacology studies consisting of efficacy and non-GLP DMPK (drug metabolism and pharmacokinetics) studies. Second, these clients are choosing to outsource additional discovery and safety assessment services to increase the efficiency and effectiveness of their drug selection processes.
We believe that this changing environment will provide enhanced outsourcing opportunities for us in the future. We remain optimistic that our clients are increasingly receptive to partnering with CROsus as a means of meeting their discovery and non-clinical support needs. We believe that the successful development of new therapies and outsourcing by the pharmaceutical industry will continue to be positive drivers of demand for our products and services.
Global biopharmaceutical companies are continuing to make the decision to outsource more significant tranches of their drug discovery, development and manufacturing processes. OverThe success of our business model is underscored by the past few years,fact that we have entered into strategic commercial relationships with leading global biopharmaceutical companies and expanded existing preferred provider agreements with other leading global biopharmaceutical companies. We also continue to broaden and extend our relationships with other research institutions across the portfolio.
We believe that larger biopharmaceutical companies will increasingly focus on efficiencies and execution. They will continue to reassess their core differentiators from R&D to commercialization, and which aspects of their drug discovery, development
CHARLES RIVER LABORATORIES INTERNATIONAL, INC.
and manufacturing processes they will choose to outsource. We expect they will also continue to be conservative in re-building infrastructure and expertise. This should lead to more opportunities for strategic outsourcing as larger pharmaceutical clients choose to utilize external resources rather than invest in internal infrastructure. By partnering with a CRO like Charles River, theywe believe our clients can take advantage of efficiencies in their early-stage research activities that can result in months or years saved in getting a drug to market. In the aggregate, we believe that the evolving large biopharmaceutical R&D business model along with our focus on data and digitalization will make our essential products and services even more relevant to our clients, and allow them to leverage our integrated offerings and expertise to drive their research, non-clinical development and manufacturing efficiency and cost effectiveness.
We believe it is critical to participate in the strategic commercial partnering process because these relationships are likely to extend for multiple years and drive pull-through across our portfolio. Furthermore, both the client and the CROCharles River invest heavily in the initial phases of the relationship to successfully transfer work streams and establish governance processes. Given this investment, clients are less likely to change CROspartners at the conclusion of the initial relationship. Because of this strategy, we have been successfully renewing the majority of our strategic partnerships.
The evolving biopharmaceutical R&D business model, coupled with solid long-term biopharmaceutical industry fundamentals and a robusthistorically sustained funding environment, have also led to the emergence of a significant numbercontinued creation of new biotechnology companies in recent years that are discoveringfocused on developing innovative new therapies. The biopharmaceutical industry also continues to evolve and become more sophisticated, with research yielding new types of treatments with increasing complexity, and more targeted and individualized therapies. We believe that our portfolio provides flexible solutions and scientific expertise that meet the customized needs for virtual and small biotechnology companies, which have limited or no infrastructure. These clients also value our ability to provide a broad range of services where we work hand in hand with our clients to design, plan and manage integrated projects and programs. This includes classically outsourced services, “insourced” services and hybrid offerings blending resources from both our clients and our staff.
Our strategic imperatives and operational goals are centered around our intense focus on initiatives designed to allow us to drive profitable growth, enhance our operating efficiency and cost structure and better position ourselves to operatefunction successfully in the current and future business environment, which we believe will collectively enable us to maximize value for our shareholders.
We intend to continue to broaden the scope of the products and services that we provide across the drug discovery and early-stagenon-clinical development continuum primarily through internal development, and, as needed, through focused acquisitions and alliances. While the COVID-19 pandemic interfered with the desiredpace of these transactions in 2020, acquisitions,partnerships. Acquisitions, such as our acquisitions of CTL International (Citoxlab)Distributed Bio, Retrogenix, Cognate, and Vigene in fiscal 2019, HemaCare and Cellero2021, Explora BioLabs in fiscal 2020,2022, and Distributed BioSAMDI and Noveprim in fiscal 2021,2023, are an integral part of our growth strategy, both to expand our portfolio and broaden our geographic footprint. We are committed to a disciplined approach that seeks to target businesses that are a sound strategic fit and that offer the prospect of enhancingfit. We aim to consistently deliver shareholder value, typically including the achievement of a hurdle rate for return on invested capital above our weighted average cost of capital.
In addition to conventional mergersMergers, acquisitions, and acquisitions,partnerships remain one of our top, long-term priorities for disciplined capital deployment and enhancing growth strategy with focus on enhancing the breadth of our scientific capabilities, expanding our global scale, and maintaining our leadership position in advanced and emerging therapies. Our long-term strategy also includes growth through establishing relationships and exploring other opportunities and areas that have the potential to strengthen our broad-based portfolio of products and services. In particular, our focus has been to drive differentiation through technologies that enhance the speed to develop a clinical candidate and allow biopharmaceutical companies to make earlier go/no-go decisions. Among other arrangements, these relationships may include entering into license agreements, strategic technology partnerships or joint ventures that will allow us to access innovative capabilities and cutting-edge or nascent technologies with a modest investment component. Our ability to thoroughly assess these nascent technologies and market opportunities may later result in an acquisition.
We also partner with a diverse set of leading venture capital firms around the world primarily investing in life sciences, health care and therapeutics with an emphasis on early-stage companies. Through these partnerships and close relationships, we gain insight into their company and asset portfolios and are thus able to promote our contract research services for discovery, safety assessmenteach of our businesses. We also view these partnerships as an investment in new and biologics testing.emerging sciences and technologies as they allow us to gain insights to
CHARLES RIVER LABORATORIES INTERNATIONAL, INC.
cutting-edge capabilities. Thus, we have the opportunity to establish ourselves as a provider of choice for a unique client group that has emerged as biopharmaceutical companies rationalize and prioritize their development pipelines.
We routinely evaluate strategic fit and fundamental performance of our businesses. As part of this ongoing assessment, we may determine certain capital could be better deployed in other long-term growth opportunities. Most recently, we divested our Avian Vaccine Services business in 2022, and RMS Japan and CDMO Sweden operations in 2021, as we determined these businesses were no longer a strategic fit.
Clients
Our clients consist primarily of all of the major biopharmaceutical companies; many biotechnology, agricultural and industrial chemical, life science, veterinary medicine, medical device, diagnostic and consumer product companies; contract research and contract manufacturing organizations; and other commercial entities, as well as leading hospitals, academic institutions and government agencies. We have stable, long-term relationships with many of our clients. During 2020,2023, no single commercial client accounted for more than 2%3.5% of our total revenue and no single client accounted for more than 10%8% of the revenue of any of our three business segments.
We continue to pursue a goal of expanding our relationships with our large biopharmaceutical clients, and with many of our larger mid-market clients. These relationships take different forms, from preferred provider arrangements to strategic partnerships. The structure of these relationships incentivizes clients to purchase more products and services across our early-stagenon-clinical portfolio. Because of the strength of these relationships, we have better insight into our clients’ planning processes and, therefore, better visibility than in the past. For information regarding revenue attributable to each of our business segments for the last three fiscal years, please see Note 4, “Segment and Geographic Information” included in the Notes to Consolidated Financial Statements included elsewhere in this Form 10-K. For information regarding revenue and long-lived assets attributable to operations in the United States, Europe, Canada, Asia Pacific and other countries for each of the last three fiscal years, please review Note 4, “Segment and Geographic Information” included in the Notes to Consolidated Financial Statements included elsewhere in this Form 10-K.
Sales, Marketing and Customer Support
Our marketing efforts are focused on stimulating demand for further outsourcing across our entire services portfolio. We believe that our ability to provide solutions that address all aspects of early-stage drug research are increasingly attractive to our clients, and we continue to design and market our commercial activities to deliver flexible, customized programs designed by segment to meet our clients’ global and site-specific needs.
Our go-to-market approach employs a number of sales and marketing strategies, including dedicated sales teams for each of our major lines of business.business and global and key account managers who represent the entire portfolio. We also maintain several sales specialists that either have specific technical expertise (often degreed scientists) or cover unique markets.
In addition to our field sales teams and related specialists, we also have a team of alliance managers who are organized by key client within our market segments (global biopharmaceutical, small and mid-sized pharmaceutical and biotechnology companies, and academic and government institutions). This enhances our ability to meet client needs by offering customized, tailored solutions across our entire portfolio. In addition, our clients benefit by additional support from a combination of technical specialists with specific scientific and therapeutic area expertise. We also apply the use of dedicated sales specialists for certain technical product lines, such as in our Manufacturing businesses.
We sell our products and services principally through our direct sales and business development teams who work in North America, Europe and Asia. In addition to interactions with our direct sales force, our primary promotional activities include organizingpresenting scientific symposia to targeted audiences, publishing scientific papers, technical support pieces and white papers, and newsletters, hosting webinars and virtual seminars and making presentations at, and participating in, scientific conferences and trade shows in North America, Europe and Asia. We supplement these scientifically based marketing activities with digital marketing, advertising and direct mail.website content. In certain areas, our direct sales force is supplemented by international distributors and agents.
Our internal marketing/product managementstrategic marketing and marketing operations teams support the field sales and business development teams while developing and implementing programs to build awareness about products and services and create close working relationshipsopportunities for interaction with our clients in the biomedical research industry. We maintain client engagement, lead development support, digital experience, inbound client support, technical assistance,eCommerce, and consulting serviceevent management departments, (in addition to project managers for our service businesses), which address both our clients’ routine and more specialized needs and generallypurposely serve as a scientific support and information resource for them. We frequently assist our clients in solving problems related to animal husbandry, healthresourcing products and genetics, biosecurity,services, research support, non-clinical study design, regulatory consulting, protocol development and other areas in which our expertise is widely recognized as a valuable resource by our clients.
CHARLES RIVER LABORATORIES INTERNATIONAL, INC.
Competition
Our goal is to be a leader in each of the markets in which we participate. We compete in the marketplace on the basis of our therapeutic and scientific expertise in early-stage drug research, quality, reputation, flexibility, responsiveness, pricing, innovation and global capabilities. We are able to offer a unique portfolio of early-stage products and services to support drug discovery and development.
We encounter a broad range of competitors of different sizes and capabilities in each of our three businesses segments. We also face competition from the internal discovery and development resources of our clients.
•For RMS, we have fivefour main competitors of which one is a government funded, not-for-profit entity; one is a public company in the U.S.; one is privately held in EuropeEurope; and three areone is privately held in the U.S.
•For DSA, both our Discovery Services and Safety Assessment businesses have numerous competitors. Discovery Services has hundreds of competitors, but threetwo main competitors: two areone is a public companiescompany in China and one is a public company in Europe. Safety Assessment has dozens of competitors of varying size, but one main competitor that is a division of a large public company in the U.S. Our DSA segment also competes with in-house departments of pharmaceutical and biotechnology companies, universities and teaching hospitals.
•For Manufacturing, each of our underlying businesses has several competitors. Microbial Solutions has four main competitors, of which three are public companies in Europe and one is a private company in the U.S. In addition to many smaller competitors, Biologics Solutions has five main competitors, of which fourthree are public companies in the U.S., one is a public company in Europe, and one is a public company in China. Avian has one main competitor to its SPF eggs business, which is a private company in Europe, and numerous competitors for specialized avian laboratory services.
Industry Support and Animal Welfare
One of our core values is a concern for, and commitment to, animal welfare. LaboratoryResearch animals are an important resource that further our knowledge of living systems and contribute to the discovery of life-saving drugs and procedures. We work hand-in-hand with the scientific community to understand how living conditions, handling procedures and stress play a role in the quality and efficiency of research. As researchers, we are responsible to our clients and the public for the health and well-being of the animals in our care.
We have been in the forefront of animal welfare improvements in our industry, and continue to show our commitment with special recognition programs for employees who demonstrate an extraordinary commitment in this critical aspect of our business. We created our own Humane Care Imperative (HCI), which is directedoverseen by our Global Animal Welfare and Training Group.corporate group. The goal of HCI is to ensure that we continue as a worldwide leader in the humane care of laboratoryresearch animals and implementation of the 3Rs (Replacement, Reduction, and Refinement). In 2023, we added a fourth “R” to the longstanding 3Rs framework - Responsibility.
We are firmly committed to the 3Rs4Rs and to reducing the number of animals usedthat we work with by emphasizing health, research animal behavioral management programs and genetic integrity to decrease study data variability. Whenever possible, we use technological advances such as new in vitro diagnostic tests for screening pathogens in laboratory rodents, microsampling and various in vitro assays. We support a wide variety of organizations and individuals working to further animal welfare and the 3Rs,4Rs, as well as the interests of the biomedical research community. We also partner with clients to develop study designs decreasing the number of animalsanimal models needed and suggesting pilot studies where appropriate. We maintain a quarterly award recognizingprogram that recognizes our
employees’ efforts to continually implement the 3Rs4Rs at our sites globally.
We fundprovide scholarships for training in laboratory animal science, provide financial support to non-profit organizations that educate the public about the benefits of animal research and provide awards and prizes to outstanding leaders in the laboratory animal science field and the supporters of 3Rs.4Rs.
In 2023, we established the management Office for Responsible Animal Usage to oversee responsible animal utilization and reduction practices, and operating standards of care. Our Board of Directors also established a new Responsible Animal Use Committee to assist the Company in improving our impact on responsible animal utilization, including evaluating and advising scientific and technological opportunities which may appropriately reduce the impact of animals in the Company’s operations. Additionally, in 2023 we committed to report to shareholders on an annual basis, beginning in 2024, on the measures the Company takes to reinforce confidence that the NHPs we import are purpose-bred.
Human Capital Resources
Employees
As of December 26, 2020,30, 2023, we had approximately 18,40021,800 employees (including approximately 2,4002,600 science professionals with advanced degrees, including Ph.D.s, D.V.M.s and M.D.s). Approximately 20,000 of our employees are considered full-time
CHARLES RIVER LABORATORIES INTERNATIONAL, INC.
employees, while approximately 1,400 are considered part-time employees. Our workforce was distributed geographically approximately as follows: 63% in North America, 30% in Europe, and 7%4% in Asia, and less than 1%3% in any other region.regions.
Our employees are not unionized in the U.S. Employees at some of our European facilities are represented by works councils, employee representative groups and/or unions, which is consistent with local customs for our industry. We collaborate with the works councils and believe we have good relationships with our employees.
Values
At Charles River, our values of Care, Lead, Own, and Collaborate guide our decisions and actions; they are standards we hold ourselves to each and every day and are critical to success in fulfilling our goals. In addition, our Charles River DNA are the behaviors based on these values that we use to make decisions, grow our future leaders, and pave the way for years ahead.
Talent Management and Engagement
Sustaining our company culture is a vital part of our strategy. Our culture is built on trust, inclusion, accountability, respect, and well-being. Our objective is to enable colleagues to connect with their work in a way that supports each other, our clients, and our communities. We strive to maintain an environment wherein every person has the ability to deliver on business commitments, while having purpose, being energized, continuously learning, and delivering quality outcomes that make a difference. Recently, we developed a unique employer brand that is infused in other aspects of our employee experience and in the past year, we have trained 1,400 managers on our inclusive hiring approach utilizing behavioral based interviewing that is aligned to our Charles River DNA. We pride ourselves on supporting our people both professionally and personally throughout their employee experience with us.
In order to attract, onboard, support, attract and retain such great talent, we provide our employees with opportunities for skill building and career advancement. OurBeginning with our onboarding program, our talent management approach is structured to be highly collaborative, encourages ownership, and provides the opportunity for everyone to contribute and develop through regular performance conversations, annual goal setting, and ongoing coaching and feedback. Furthermore, we have created a global learning strategy that includes technical training, mentoring and coaching programs,approaches, tuition reimbursement, rotational programs,sabbaticals, leadership development programs, and on-the-job training. In fiscal 2020,2023, we hired over 3,700 people and our voluntary turnover for all employees was below 9%approximately 11.5%. Additionally, we conduct regular talent reviews to identify and develop diverse leadership and key talent pipelines to deliver on short-term and long-term business strategy.
Our engagement surveys are in the form of frequent, shorter engagement “Pulse” surveys. These Pulse surveys were issued twice during 2023 and serve as a foundation for more meaningful conversations and actions between our people and people leaders to continue making Charles River a best place to work, learn, and grow.
In addition to growth opportunities, we strive to attract, motivate, and retain top talent by providing competitive compensation programs while rewarding outcomes and behaviors that align with our performance, culture, and values. PayWhile we perform pay equity audits are performed in countries where they are legally required, and we are embarking onalso perform a larger pay equity analysis on a global scale and take corrective action where appropriate as part of our continuing efforts to be competitive in the marketplace. Furthermore, we continue to build on aour global job architecture thatgenerally allows for aligning pay by job role with market rates and serves as a career path tool to encourage a culture of upward mobility.advancement.
Health and Safety
We also promote a healthy and safe workplace for our employees. We maintain a Global Policy on Safety & Sustainability and, as part of our efforts to promote our goals of working safely and sustainably, in early 2020 we implemented a management systems approach to improve our safety performance, which involves both employee and management engagement in and ownership of our site-level environment, health, safety, and sustainability programs globally. At every Charles River site globally, we have health and safety leaders that promote employee health and safety and keep site management engaged in their health and safety programs.
The COVID-19 pandemic has further underscoredWe launched a Safety-First Culture initiative in 2022 to ensure that every person working for usand on behalf of Charles River recognizes the importance of keepingputting safe working practices first. As part of this campaign, all sites were requested to form safety committees comprised of both management and employees, initiate site safety champion recognition programs and all site general managers attended safety culture training as did many of our employees safekey executives. We also launched the first module of our people leader safety culture training and healthy. In response to the pandemic, we have taken actions to protect its workforce so they can more safelyinitiated a formal Environment, Health, Safety and effectively perform their work. Charles River established a global crisis management team, which includes a team of internalSustainability Assessment program with 12 site assessments in 2023.
Diversity, Equity and external experts who have been closely monitoring the COVID-19 outbreak and its impact on employee safety and our business operations. As we navigate the pandemic and focus on keeping people safe, we continue to establish stringent safety protocols at our operating sites. As always, our goal is to provide a safe work environment for our employees, while still meeting our client’s needs for their research solutions. Our global and site business continuity plans are comprehensive, active, and continuously updated as we continue to meet requirements for planned and new projects, including work supporting COVID-19 research efforts.Inclusion
We are also committed to cultivating a welcoming and inclusive environment.environment where every employee can succeed and thrive. Operating in over 100 facilities155 sites and in over 20 countries worldwide (excluding our Insourcing Solutions sites), we believe in treating our employees and prospective talent with dignity, decency, and respect. We recognize that employee diversity contributes to a more innovative workforce and see diversity and inclusivity as a strength for our business. Our commitment to equalityequity spans
CHARLES RIVER LABORATORIES INTERNATIONAL, INC.
across allour employment-related decisions, from hiring and promotions, to transfers andsuccession planning, compensation, performance, training and career development programs. Our goalaim is to continue to build a talented workforce reflective of the global communities in which we live and work, and it is critical that our people feel like valued members of our Company. We believe that we have taken positive steps to promote a sense of belonging for our employees in the workplace by building a Diversity, EqualityEquity & Inclusion team and Chief Executive Officer-chaired Diversity, Equity and Inclusion council; expanding diversitydiverse representation at our Board level; centralizing diversity and inclusion resources for our employees;launching employee resource groups; facilitating senior leadership training on cultural differences, anti-harassment and anti-discrimination,mitigating unconscious bias and micro-inequities;creating inclusion for our people leaders and talent acquisition teams; and rolling out a Diverse Interview Panel initiative.diverse candidate slates and diverse interview panel initiatives. We look forwardhave also set goals to continuingincrease our belonging scores on our engagement surveys and increase participation in our employee resource groups. In addition to make additional progress, including expanding education, allyship,our internally focused efforts, we also actively engage with our clients and integrating diversity and inclusion into our client, supplier, and business strategies.suppliers to share best practices. As of December 26, 2020,30, 2023, women made up approximately 59%60% of our global workforce, 58%59% of our U.S. workforce and 33%42% of our global executive leadership positions, defined as positions carrying the title of Vice President or higher. From our U.S. workforce, 25%32% identified as racial and ethnic minorities.
Our employees are not unionized in the U.S. Employees at some of our European facilities are represented by works councils, employee representative groups and/or unions, which is consistent with local customs for our industry. We collaborate with the works councils and believe we have good relationships with our employees.
Backlog
Our backlog for our RMS, DSA and Manufacturing reportable segments was $167.6approximately $489 million, $1.4$2.5 billion and $79.2$143 million, respectively, as of December 26, 2020,30, 2023, as compared to $128.7$282 million, $1.0$3.1 billion and $65.4$116 million, respectively, as of December 28, 2019.31, 2022. Related services are performed over varying durations, from short to extended periods of time, which may be as long as several years. We maintain an order backlog to track anticipated revenue from studies and projects that either have not started, but are anticipated to begin in the near future, or are in process and have not been completed. We only recognize a study or project in backlog after we have received written evidence of a client’s intention to proceed. Canceled studies or projects are removed from backlog.
We believe our aggregate backlog as of any date is not necessarily a meaningful indicator of our future results for a variety of reasons. First, studies vary in duration (i.e., some studies or projects that are included in December 26, 202030, 2023 backlog may be completed in 2021,2024, while others may be completed in later years). Second, the scope of studies or projects may change, which may either increase or decrease their value. Third, studies or projects included in backlog may be subject to bonus or penalty payments. Fourth, studies or projects may be terminated or delayed at any time by the client or regulatory authorities for a number of reasons, including the failure of a drug to satisfy safety and efficacy requirements, or a sponsor making a strategic decision that a study or service is no longer necessary. Delayed contracts remain in our backlog until a determination of whether to continue, modify or cancel the study has been made. We may not be able to realize all or most of the net revenues included in backlog or estimate the portion to be filled in the current year. Refer to Item 1A, “Risk Factors” and Item 7, “Management’s Discussion and Analysis of Financial Condition and Results of Operations” disclosed herein for our assessment of certain relevant risk factors.
Regulatory Matters
As our business operates in a number ofmany distinct operatingregional environments and in a variety of locations worldwide, we are subject to numerous, and sometimes overlapping, regulatory environments.requirements.
The Animal Welfare Act (AWA) governs the care and use of certain species of animals used for research in the U.S. other than laboratory rats, mice and chickensfish bred for use in research. As a result, most of our U.S. small animal research models activities and our avian vaccine servicesmodel operations are not subject to regulation under the AWA. For regulated species, the AWA and the associated Animal Care regulations require producers and users ofthose working with regulated species to provide veterinary care and to utilizefollow specific husbandry practices such as cage size, shipping conditions, sanitation and environmental enrichment to ensure the welfare of these animals. Separately, facilities using live vertebrate animals in research funded by the U.S. Public Health Service (PHS) must also adhere to the PHS Policy on Humane Care and Use of Laboratory Animals and follow the“The Guide for the Care and Use of Laboratory Animals producedAnimals” published by the Institute for LaboratoryBoard on Animal Health Sciences, Conservation, and Research.
We comply with licensing and registration requirement standards set by the United States Department of Agriculture (USDA)USDA and U.S. Fish and Wildlife Service (USFWS), and similar applicable agencies in other countriesglobal regions such as Canada, Europe China and JapanChina for the care, handling and useoversight of regulated species and birds bred for research. With the exception of one facility acquired as part of the Cellero acquisition, ourspecies. Our DSA and RMS facilities that work with or produce research animals in North America and Europe are either accredited, orwith the exception of new and recently acquired facilities that are in the process of initiatingplanning for accreditation, by AAALAC International, a private, nonprofit international organization that promotes the humane treatment of animals in science and education through voluntary accreditation and assessment programs.
Our import and export of animals and our operations in foreign countries are subject to applicable international agreements and conventions, as well as a variety of national, regional and local laws and regulations, which establish the standards for the humane treatment, care, handling and transport of animals by dealers and research facilities. We only use accredited and experienced transporters for importing and exporting animals who are specialists in their field. We comply with global requirements which are evaluated by import and export authorities at each point of exit and entry. Imported animals are
CHARLES RIVER LABORATORIES INTERNATIONAL, INC.
quarantined in our quarantine facilities as required by government agencies and tested to ensure they meet both the government mandates and our own specifications for pathogens and health of the animals.
We conduct non-clinical safety assessment studies to support the submissions for approval or licensing of our clients’ products throughout the world. Many of these studies must comply with national statutory or regulatory requirements for GLP. GLP regulations describe a quality system for the scientific, operational and quality process and the conditions under which non-clinical studies are planned, performed, monitored, recorded, reported and archived. GLP compliance is required by such regulatory agencies as the FDA, United States Environmental Protection Agency, European Medicines Agency, Medicines and Healthcare Products Regulatory Agency in the United Kingdom (U.K.), Health Products Regulatory Authority in Ireland, Health Canada and other similar monitoring authorities in the countries where we operate. GLP requirements are significantly harmonized throughout the world and our laboratories are capable of conducting studies in compliance with all necessaryapplicable requirements.
Regulatory monitoring authorities such as the FDA, Medicines and Healthcare Products Regulatory Agency and OECD countries have indicated an increased emphasis on the management of electronic records and signatures generated by computerized systems to ensure data integrity under newly issued guidance.integrity. We have established a formal programcorporate data integrity governance to manage regulatory requirements and client expectations regarding data integrityquality within our regulated businesses. Although each business has a different impact on patient safety, all are expected to generate and preserve data with integrity. We recognize the importance of generating quality, reliable, sustainable
data and have instituted several processes and established a global governance team with oversight responsibilities for our Data Integrity Compliance Plans to ensure we are consistent in our approach. To ensure that we have proper regulatory oversight over our electronic records, a dedicated quality function reviews our computerized system practices to ensure that appropriate record controls are in place and that a robust audit strategy confirms requirements are met for compliance.
At a global level, retention of data and controls for electronic systems, proprietary data and quality standards are covered by global policies. We also have controls in place such as quality manuals, policies and procedures, work instructions, document control processes, training, quality assurance and quality control processes and personnel, validated computerized systems and archiving requirements. Within businesses, procedures govern performance of activities to ensure data integrity throughout its life cycle.
Our Manufacturing businesses produce FDA regulated endotoxin test kits at an FDA registered facility. We also manufacture sterility and microbial limits test kits used in FDA Regulated pharmaceutical applications, reagents, cell banks used in research and biopharmaceutical production, clinical trial vaccines and vaccine support products.products as well as an animal-free recombinant cascade reagent (rCR), Endosafe® Trillium®, which is an alternative to the natural LAL product. Additionally, several of our laboratories conduct biosafety and analytical testing such as identity, stability, sterility and potency and viral clearance testing in support of our clients’ manufacturing programs and to fulfill their validation requirements, as applicable. These
Our comprehensive cell and gene therapy manufacturing services include Good Manufacturing Practices (GMP) production of cells from pre-clinical to commercial applications from a variety of starting materials. Many of these activities are subject to regulation and consequently require these businesses to be inspected by the FDA and other national and applicable state regulatory agencies under their respective cGMP regulations. These regulations require that we manufacture our products or perform testing in a prescribed manner with respect to cGMP compliance, and maintain records of our manufacturing, testing and control activities. In addition, the specific activities of some of our businesses require us to hold specialized licenses and registrations for the manufacture, distribution and/or marketing of particular products.products globally.
Our Cell Solutions sites provide the starting material (leukopak) to customers that are typically in cell and gene therapy companies. Leukopaks are collected from eligible donors in compliance with applicable regulatory requirements. Donors consent using consent forms from an Institutional Review Board (IRB). Collections are performed under the supervision of licensed clinical staff and collections are managed in accordance with IRB-approved study protocols.
All of our GMP sites are subject to registration, licensing and regulation, as appropriate under international treaties and conventions, including national, regional and local laws relating to:
•the surface and air transportation of chemicals, biological reagents and laboratory specimens;
•the handling, use, storage and disposal of chemicals (including narcotics and psychotropic drugs), biological reagents, laboratory specimens, hazardous waste and radioactive materials;
•the procurement, handling, use, storage and disposal of human cells, tissues and cellular and tissue-based products for research purposes;
•the safety and health of employees and visitors to our facilities; and
•protection of the environment and general public.
CHARLES RIVER LABORATORIES INTERNATIONAL, INC.
Global regulatory compliance programs are managed by a dedicated group responsible for regulatory affairs and compliance. Our compliance programs are also managed by global quality systems, such as vendor supplier programs, enterprise quality management systems and global computer system validation. Within each regulated business, we have established Quality Assurance Units (QAUs) responsible for risk based internal audit programs to manage regulatory requirements and client expectations. The QAUs operate independently from those individuals that direct and conduct studies, manufacturing or analytical testing. Our Data Integrity Compliance Program ensures that senior management hasand the QAU’s have proper oversight with QAUs of our electronic records, inclusive of quality function reviews of our computerized system practices to ensure that appropriate record controls are in place and that a robust audit strategy confirms requirements for compliance.
While we expect that capital expenditures will be necessary to ensure that our existing sites remain in compliance with governmentall applicable regulations, at this point we do not expect these expenditures to materially differ than our historical experience.
Intellectual Property
We develop and implement scientifically-driven products and procedures, including computer software, and technically derived procedures and products intended to maximize the quality and effectiveness of our services. Although our intellectualofferings. Intellectual property rights, in the form of know-how, trade secrets, patents, trademarks, copyrights, and others are important to us and are valuable to our success, we believe that such factors as the technical expertise, proprietary know-how, ability and experience of our professionals are more important, and that, overall, these technological capabilitiesto provide significant benefits to our clients. Where we consider it appropriate, stepsSteps are taken to protect our know-how throughintellectual property rights and include the execution of confidentiality agreements and registrations.securing registrations in relevant jurisdictions. In addition, we in-licenselicense technology and products from other companies when it enhances our product and services businesses. In the future, in-licensing mayLicensing has recently become a larger company-wide initiative, to enhance our offerings, particularly as we increase our focus on innovative technologies tothat further diversify and enhance our portfolio. With the exception of technology related to our Microbial Solutions testing business, we have no patents, trademarks, licenses, franchises, or concessions that are material and upon which any of our products or services are dependent.
Corporate Governance
We are committed to operating our business with integrity and accountability. We strive to meet or exceed all of the corporate governance standards established by the New York Stock Exchange,NYSE, the SEC and the U.S. Federal government as implemented by the Sarbanes-Oxley Act of 2002, the Dodd-Frank Wall Street Reform and Consumer Protection Act of 2010 and other applicable laws, rules and regulations. Each memberNine of the eleven members of our Board of Directors other than our Chief Executive Officer, isare independent and hashave no significant financial, business or personal ties to us or management. AllOur Audit Committee, Compensation Committee, and Corporate Governance and Nominating Committee of our board committees (except our Executive Committee and Strategic Planning and Capital Allocation Committee)Board of Directors are each composed entirely of independent directors. The Board adheres to our Corporate Governance Guidelines and a Code of Business Conduct and Ethics that has been communicated to employees and posted on our website. We are diligent in complying with established accounting principles and are committed to providing financial information that is transparent, timely and accurate. We have a Related Person Transactions Policy designed to promote the timely identification of such transactions and to ensure we give appropriate consideration to any real or perceived conflicts in our commercial arrangements. We have an established global process through which employees, either directly or anonymously, can notify management (and the Audit Committee of the Board of Directors) of alleged accounting and auditing concerns or violations including fraud. Our internal Disclosure Committee meets regularly and operates pursuant to formal disclosure procedures and guidelines to help ensure that our public disclosures, including our periodic reports filed with the SEC, earnings releases and other written information that we disclose to the investment community are complete, accurate and timely. We continually monitor developments in the law and stock exchange regulations, as well as overall corporate governance trends and intend to adopt new procedures consistent with such developments to the extent applicable to and appropriate for our Company. Copies of our Corporate Governance Guidelines, Code of Business Conduct and Ethics and Related Person Transactions Policy are available on our website at http://ir.criver.com under the “Investor Relations - Corporate Governance” caption.
Information about Our Executive Officers
Below are the names, ages and principal occupations of each of our current executive officers. All such persons have been elected to serve until their successors are elected and qualified or until their earlier resignation or removal.
James C. Foster, age 70,73, joined us in 1976 as General Counsel. During his tenure, Mr. Foster has held various staff and managerial positions, and was named Chief Executive Officer and President in 1992 and our Chairman in 2000.
William D. Barbo, age 60,63, joined us in 1982 as a laboratory technician. Between 1982 and 2005, Mr. Barbo served in a variety of positions of increasing responsibilities. He was named Corporate Vice President of Research Models and Services in 2005, Corporate Senior Vice President of Global Sales and Marketing in 2010, and Corporate Executive Vice President and Chief Commercial Officer in October 2016.
Victoria Creamer, age 51,54, joined us in January 2019 as Senior Vice President, Chief People Officer. In October 2020, Ms. Creamer was promoted to Corporate Executive Vice President. Prior to joining the Company, from 2015 to December 2018, Ms. Creamer served in senior management human resource positions at eachas Senior Vice President, Human Resources and Communications for ITT, Inc., a manufacturing company, where she was responsible for providing vision, leadership and execution of ITTthe company’s people and IBM.communications strategies.
CHARLES RIVER LABORATORIES INTERNATIONAL, INC.
Birgit Girshick, age 51,54, joined us in 1989 and originally held positions of increasing responsibility in our RMS Germany and RMS Avian Vaccine businesses. In 2004, Ms. Girshick was promoted to General Manager of the RMS Avian Vaccine Services business. She was named Executive Director, RMS Process Improvement in 2009, and Corporate Vice President, Global Biopharmaceutical Services in 2010. In 2013, Ms. Girshick was promoted to Corporate Senior Vice President, Research Models and Biologics Testing Solutions. In 2016, Ms. Girshick was tasked with leading the integration of WIL Research into our Safety Assessment business. Also, in 2016, Ms. Girshick assumed the role of Corporate Senior Vice President, Global Discovery Services. In February 2018, Ms. Girshick was appointed Corporate Executive Vice President, Global Discovery and Safety Assessment and in August 2018, additionally took on responsibility for our Biologics Testing Solutions and Avian Vaccine Services business. In 2021, she also assumed responsibility for the company’s Cell and Gene Therapy CDMO business. In November 2021, Ms. Girshick was promoted to Chief Operating Officer of the Company, adding the Research Models and Services and Microbial Solutions businesses as well as the Global Information Technologies group to her responsibilities. Since 2023, Ms. Girshick also has general oversight of the Corporate Sales and Marketing team and our Corporate and External Affairs function.
Joseph W. LaPlume, age 47,50, joined us in 2005 as Senior Corporate Counsel. He became Deputy General Counsel in 2010, Vice President, Corporate Development in 2011, Senior Vice President in 2014 and Corporate Executive Vice President, Corporate Development and Strategy in January 2019. In his current role, he oversees all aspects of strategic planning and corporate development activities across business segments and geographies. Prior to joining us, Mr. LaPlume was a corporate lawyer at GTECH Corporation and in private practice at the law firms of Mintz Levin and Goulston & Storrs.
David R. SmithShannon Parisotto, age 55, has served as our Corporate Executive Vice President and Chief Financial Officer since August 2015. He50, joined us asin 2000 in our Nevada operation. Ms. Parisotto progressed through a number of finance management positions of increasing responsibility, and in 2010, was promoted to Corporate Vice President, DiscoveryPreclinical Services, through our acquisitionFinance. In this role, Ms. Parisotto was responsible for the financial operations of Argentathe global Preclinical Services business. Beginning in 2011, Ms. Parisotto’s role was expanded to include additional business segments, and BioFocus from Galapagos NV in March 20142015, she was promoted to the newly created position of Corporate Senior Vice President & Controller, Global Operations, where she worked collaboratively with Charles River’s business units to develop and implement business strategies. In 2020, Ms. Parisotto was promoted to Corporate Senior Vice President, Global Safety Assessment, where she was responsible for leading the Company’s global Safety Assessment organization, and positioning the business for continued, long-term growth and success. In October 2022, Ms. Parisotto was promoted to Corporate Executive Vice President, and assumed the additional oversight of the Discovery Services business to lead its strategic vision and operational growth, as well as enhance the synergies between the businesses and with clients across the global Discovery and Safety Assessment segment. Ms. Parisotto holds a B.S. in October 2014. At Galapagos, he servedAccounting from the University of Nevada, Reno, an M.B.A. from the University of Phoenix, and is a Certified Public Accountant.
Flavia Pease, age 51, joined us in various capacities, including2022 as ChiefCorporate Executive Officer of its Galapagos Services divisionVice President and as Chief Financial Officer. Mr. SmithPrior to joining Charles River, Ms. Pease served as Vice President and Group Chief Financial Officer of Johnson & Johnson’s global Medical Devices businesses since 2019. During her more than twenty-year tenure at Johnson & Johnson, Ms. Pease served as Vice President, Finance for Cambridge University HospitalsJanssen North America from 20072016 to 2013. Mr.
Smith spent eight years2019; Vice President of the Enterprise Program Management Office from 2014 to 2016; Vice President of Finance for Janssen Supply Chain from 2012 to 2014; and a Vice President of Finance, leading the integration of the Mentor and Acclarent acquisitions from 2009 to 2012. Ms. Pease began her career at PricewaterhouseCoopers prior to joining AstraZenecaJohnson & Johnson in 1997, where he spent1998 with the next nine years in variousLifeScan business and subsequently held finance leadership positions within Mergers and business roles of increasingly greater responsibility.Acquisitions Analysis and Johnson & Johnson Medical Brazil.
Item 1A. Risk Factors
Set forth below, elsewhere in this Form 10-K, and in other documents we file with the SEC are risks and uncertainties that could cause actual results to differ materially from the results contemplated by the forward-looking statements contained in this Form 10-K. We note that factors set forth below, individually or in the aggregate, as well as additional risks and uncertainties either not presently known or that are currently believed to not be material to the business, may cause our actual results to differ materially from expected and historical results. You should understand that it is not possible to predict or identify all such factors. Consequently, you should not consider the following to be a complete discussion of all potential risks or uncertainties and the risks described below should be carefully considered together with the other information set forth in this report and in future documents we file with the SEC.
Risk Factor Summary
As noted above, we are subject to a number of risks that if realized could cause actual results to differ materially from the results contemplated herein. Some of the more significant risks and uncertainties we face include those summarized below. The summary below is not exhaustive and is qualified by reference to the full set of risk factors set forth in this "Risk Factors"
CHARLES RIVER LABORATORIES INTERNATIONAL, INC.
section. Please carefully consider all of the information in this Form 10-K, including the full set of risks set forth in this "Risk Factors" section, and in our other filings with the SEC before making an investment decision regarding Charles River.
Business and Operational Risks
The COVID-19 pandemic is dynamic and expanding. The continuation of this outbreak may have, and the emergence of other epidemic or pandemic crises could have, material adverse effects on our business, results of operations, or financial condition.
On March 11, 2020, the World Health Organization declared the outbreak of a strain of novel coronavirus disease, COVID-19, a global pandemic. The COVID-19 pandemic is dynamic and expanding, and its ultimate scope, duration and effects are uncertain. This pandemic has and continues to result in, and any future epidemic or pandemic crises may potentially result in, direct and indirect adverse effects on our industry and customers, which in turn has (with respect to COVID-19) and may (with respect to future epidemics or crises) impact our business, results of operations and financial condition. Further, the COVID-19 pandemic may also affect our operating and financial results in a manner that is not presently known to us. Effects of the current pandemic have included, or may in the future include, among others:
•deterioration of worldwide, regional or national economic conditions and activity, which adversely affects global demand for our products and services;
•disruptions to our operations as a result of the potential health impact on our employees and crew, and on the workforces of our customers and business partners;
•temporary and/or partial closures of our facilities or the facilities of our customers (including academic institutions, government laboratories and private foundations) and third-party service providers;
•interruption of the operations of global supply chains and those of our suppliers;
•disruptions to our business from, or additional costs related to, new regulations, directives or practices implemented in response to the pandemic, such as travel restrictions, shelter in place/stay in place/work from home orders, increased inspection regimes, hygiene measures (such as quarantining and physical distancing) or increased implementation of remote working arrangements;
•reduced cash flows and financial condition, including potential liquidity constraints;
•reduced access to capital, including the ability to refinance any existing obligations, as a result of any credit tightening generally or due to declines in global financial markets, including to the prices of publicly-traded equity securities of us, our peers and of listed companies generally;
•deterioration in the financial condition and prospects of our customers or attempts by customers, suppliers or service providers to invoke force majeure contractual clauses, or the legal doctrines of impossibility or impracticability (or other similar doctrines) as a result of delays or other disruptions;
•delays in the commencement of, or the suspension or cancellation of, client studies; and
•the effects described elsewhere in these Risk Factors.
The COVID-19 pandemic has caused us to modify our business practices, including but not limited to health management of employees, customers and suppliers, management of production inventory, supply chain risk management, compensation practices and capital expenditure planning. We have formed a tiered structure of designated COVID-19 crisis management teams throughout our organization to identify, implement and monitor such actions as required by the dynamic exigencies arising from the pandemic. Such measures and others may not be sufficient to mitigate all the risks posed by COVID-19, and our ability to perform critical functions could be materially adversely affected.
Although disruption and effects from the COVID-19 pandemic may be temporary, given the dynamic nature of these circumstances and the worldwide nature of our business and operations, the duration of any business disruption and the related financial impact to us cannot be reasonably estimated at this time but could materially affect our business, results of operations and financial condition.
We bear financial risk for contracts that may be terminated or reduced in scope, underpriced, subject to cost overruns or delayed.delays.
Many of our agreements, including those which underlie our strategic relationships with some of our more significant clients, provide for termination or reduction in scope with little or no notice. In addition, we sell our products and services to our competitors, and similarly they sell products and services to us. For instance, we have historically entered into, and currently are party to, contracts with certain of our competitors to distribute specialty research models in locations where our competitors may not have distribution capabilities.
Our counterparties (including our clients who are competitors) may elect to terminate their agreements with us for various reasons including: the invocation of force majeure clauses, or the legal doctrines of impossibility or impracticability (or other similar legal doctrines), as a result of the COVID-19 pandemic; the products being tested fail to satisfy safety requirements; unexpected or undesired study results; production problems resulting in shortages of the drug being tested; a client’s decision to forego or terminate a particular study; our competitors’ establishment of alternative distribution channels; dissatisfaction with our performance under the agreement; the loss of funding for the particular research study; or general convenience/counterparty preference. If a counterparty terminates a contract with us, we are typically entitled under the terms of the contract to receive revenue earned to date as well as certain other costs and, in some cases, termination fees; however, in many cases we are not entitled to any termination fees in the event of a termination. Cancellation of a large contract or proximate delay, cancellation or conclusion of multiple contracts could materially adversely affect our business and, therefore, may adversely affect our operating results.
Furthermore, many of our contracts provide for services on a fixed price or fee-for-service with a cap basis and, accordingly, we bear the financial risk if we initially underprice our contracts or otherwise overrun our cost estimates. Such underpricing or significant cost overruns could have an adverse effect on our business, results of operations, financial condition and cash flows.
•Upgrading and integrating our business systems could result in implementation issues and business disruptions.
In recent years, we have been updating and consolidating systems and automating processes in many parts of our business with a variety of systems, including in connection with the integration of acquired businesses. The expansion and ongoing implementation of the systems may occur at a future date based on value to the business. In general, the process of planning and preparing for these types of integrated, wide-scale implementations is extremely complex and we are required to address a number of challenges, including information security assessment and remediation, data conversion, network and system cutover and user training. Problems in any of these areas could cause operational problems during implementation including delayed shipments, missed sales, billing errors and accounting errors.
•We have in the past experienced and in the future could experience an unauthorized access into our information systems.
We operate large and complex information systems that contain significant amounts of client data. As a routine element of our business, we collect, analyze and retain substantial amounts of data pertaining to the non-clinical studies we conduct for our clients. Unauthorized third parties could attempt to gain entry to such information systems to steal data or disrupt the systems or for financial gain. Like other companies, we have on occasion experienced, and will continue to experience, threats and incursions to our data and systems, including malicious codes and viruses, phishing, business email compromise and social engineering attacks or other cyber-attacks. The number and complexity of these threats continue to increase over time.
While we have taken measures to protect our information systems from intrusion, in March 2019, we detected evidence that an unauthorized third party, who we believe was well resourced and highly sophisticated, accessed certain of our information systems and copied data. We worked with a leading cyber security firm to assist in our investigation and coordinated with law enforcement authorities. Our investigation indicated that the affected information included client information.
In December 2019, we disclosed that we had completed our remediation of the incident identified in March of 2019. While we have implemented additional security safeguards, including:
•remediation of the March 2019 incident;
•cooperation with U.S. Federal authorities’ investigation into the incident and established an ongoing relationship to better understand the ever-changing nature of cybersecurity related threats;
•additional visibility into our network and environment;
•additional monitoring of our environment;
•active threat hunting in our environment;
•enhanced protection for externally facing web applications;
•the addition of Multi-Factor Authentication to ingress points;
•the addition of denial of service attack protection; and
•increased network segmentation,
such efforts may not be successful, in which case we could suffer significant harm.
Further, we are at risk of being targeted, and we have in the past been victim to, business email compromise fraud, which results in payments being made to illegitimate bank accounts. Although these instances have not resulted in our incurring material losses, if similar instances occur in the future, we may incur such losses.
Our contracts with our clients typically contain provisions that require us to keep confidential the information generated from the studies we conduct. In the event the confidentiality of such information is compromised, whether by unauthorized access or other breaches, we could be exposed to significant harm, including termination of customer contracts, damage to our customer relationships, damage to our reputation and potential legal claims from customers, employees and other parties. In addition, we may face investigations by government regulators and agencies as a result of a breach.
If we are not successful in executing our business strategy, including our failure in selecting and integrating the businesses and technologies we acquire, or in managing our current and future divestitures, our business may be adversely impacted.
During the last two decades, we have steadily expanded our business through numerous acquisitions, including our recent acquisitions of HemaCare, Cellero and Distributed Bio and our recently announced planned acquisition of Cognate BioServices, Inc. However, businesses and technologies may not be available on terms and conditions we find acceptable. We risk spending time and money investigating and negotiating with potential acquisition or alliance partners, but not completing transactions.
Acquisitions and alliances involve numerous risks which may include:
•difficulties in achieving business and financial success (including as a result of COVID-19 pandemic and the long-term economic impact of the pandemic);
•difficulties and expenses incurred in assimilating and integrating operations, services, products, information technology platforms, technologies or pre-existing relationships with our clients, distributors and suppliers;
•challenges with developing and operating new businesses, including those that are materially different from our existing businesses and that may require the development or acquisition of new internal capabilities and expertise;
•potential losses resulting from undiscovered liabilities of acquired companies that are not covered by the indemnification we may obtain from the seller or the insurance we acquire in connection with the transaction;
•loss of key employees;
•the presence or absence of adequate internal controls and/or significant fraud in the financial systems of acquired companies;
•diversion of management’s attention from other business concerns;
•a more expansive regulatory environment;
•acquisitions could be dilutive to earnings, or in the event of acquisitions made through the issuance of our common stock to the shareholders of the acquired company, dilutive to the percentage of ownership of our existing shareholders;
•differences in foreign business practices, customs and importation regulations, language and other cultural barriers in connection with the acquisition of foreign companies;
•new technologies and products may be developed that cause businesses or assets we acquire to become less valuable; and
•disagreements or disputes with prior owners of an acquired business, technology, service or product that may result in litigation expenses and diversion of our management’s attention.
If an acquired business, technology or an alliance does not meet our expectations, our results of operations may be adversely affected. Some of the same risks exist when we decide to sell a business, site or product line. In addition, divestitures could involve additional risks, including the following: difficulties in the separation of operations, services, products, and personnel; diversion of management’s attention from other business concerns; and the need to agree to retain or assume certain current or future liabilities in order to complete the divestiture.
We continually evaluate the performance and strategic fit of our businesses (including specific product lines and service offerings) to determine whether any divestitures are appropriate. Any divestitures may result in significant write-offs, including those related to goodwill and other intangible assets and which could have an adverse effect on our results of operations and financial condition. In addition, we may encounter difficulty in finding buyers or alternative exit strategies at acceptable prices and terms, and in a timely manner. We may not be successful in managing these or any other significant risks that we encounter in divesting a business, site or product line or service offering and, as a result, we may not achieve some or all of the expected benefits of the divestiture.
Our business is subject to risks relating to operating internationally, including changes in foreign currency exchange rates.
A significant part of our revenue is derived from operations outside the U.S. We expect that international revenue will continue to account for a significant percentage of our total revenue for the foreseeable future.
Changes in foreign currency exchange rates, could materially adversely impact our results. Foreign currencies we receive for sales and in which we record expenses outside the U.S. could be subject to unfavorable exchange rates with the U.S. dollar, resulting in a reduction in the amount of revenue and cash flow (and an increase in the amount of expenses) that we recognize and causing fluctuations in reported financial results. We also carry foreign currency exposure associated with differences between where we conduct business. For example, certain contracts are frequently denominated in currencies other than the currency in which we incur expenses related to those contracts. Where expenses are incurred in currencies other than those in which contracts are priced, fluctuations in the relative value of those currencies could have a material adverse effect on our results of operations.
Our exposure to currency exchange rate fluctuations results from the currency translation exposure associated with the preparation of our consolidated financial statements, as well as from the exposure associated with transactions of our subsidiaries that are denominated in a currency other than the respective subsidiary’s functional currency. While our financial results are reported in U.S. Dollars, the financial statements of many of our subsidiaries outside the U.S. are prepared using the local currency as the functional currency. During consolidation, these results are translated into U.S. Dollars by applying appropriate exchange rates. As a result, fluctuations in the exchange rate of the U.S. Dollar relative to the local currencies in which our foreign subsidiaries report could cause significant fluctuations in our reported results. Moreover, as exchange rates vary, revenue and other operating results may differ materially from our expectations. Adjustments resulting from financial statement translations are included as a separate component of shareholders’ equity.
Other risks associated with our international business include:
•general economic and political conditions in the markets in which we operate, including implications of Brexit and the COVID-19 pandemic;
•potentially negative consequences from changes in U.S. and/or foreign tax laws, or interpretations and enforcement thereof, notably tax regulations issued and to-be-issued with respect to U.S. Tax Reform and the EU Anti-Tax Avoidance Directives I and II, and the creation of the Joint Chiefs of Global Tax Enforcement;
•potential international conflicts, including terrorist acts;
•exchange controls, adverse tax consequences and legal restrictions on the repatriation of funds into the U.S.;
•difficulties and costs associated with staffing and managing foreign operations, including risks of COVID-19 pandemic related suspensions of operations, work stoppages and/or strikes, as well as violations of local laws or anti-bribery laws such as the U.S. Foreign Corrupt Practices Act (FCPA), the U.K. Bribery Act and the OECD Convention on Combating Bribery of Foreign Public Officials in International Business Transactions;
•unexpected changes in regulatory requirements (including as a result of the COVID-19 pandemic);
•the difficulties of compliance with a wide variety of foreign laws and regulations (including those relating to the COVID-19 pandemic);
•unfavorable labor regulations in foreign jurisdictions (including those relating to the COVID-19 pandemic);
•longer accounts receivable cycles in certain foreign countries (including as a result of the COVID-19 pandemic and the impact of measures intended to reduce the spread of COVID-19); and
•compliance with export controls, import requirements and other trade regulations, including those relating to certain products of which there is limited supply.
These risks, individually or in the aggregate, could have an adverse effect on our results of operations and financial condition. For example, as mentioned above, we are subject to compliance with the FCPA and similar anti-bribery laws, which generally prohibit companies and their third-party intermediaries from making improper payments to foreign government officials for the purpose of obtaining or retaining business. While our employees, distributors and agents are required to comply with these laws, we cannot be sure that our internal policies and procedures will always protect us from violations of these laws despite our commitment to legal compliance and corporate ethics. The occurrence or allegation of these types of risks may adversely affect our business, performance, prospects, value, financial condition and results of operations.
Our operations might be affected by the occurrence of a natural disaster or other catastrophic event, and have been (and will continue to be) affected by the COVID-19 pandemic.event.
We depend on our customers and facilities for the continued operation of our business. While we maintain disaster recovery plans, they might not adequately protect us. Despite any precautions we take for natural disasters or other catastrophic events, these events, including terrorist attack, a pandemic (including the COVID-19 pandemic), epidemic or outbreak of a disease, hurricanes, fire, floods and ice and snow storms, could result in damage to and closure of our or our customers’ facilities or the infrastructure on which such facilities rely. As described herein, the COVID-19 pandemic has already, and will continue to, materially disrupt our operations, though the full extent of such impact remains uncertain. Such disruptions could include significant delays in the shipments of our products, reduce our capacity to provide services, adversely impact unique manufacturing capabilities, result in our customers’ inability to pay for our products or services and, ultimately, result in the loss of revenue and clients. Although we carry business interruption insurance policies and typically have provisions in our contracts that protect us in certain events, our coverage might not be adequate to compensate us for all losses that may occur. Any natural disaster or catastrophic event affecting us or our customers could have a significant negative impact on our operations and financial performance.
•Negative attention from special interest groups may impair our business.
The products and services that we provide our clients are essential to the drug discovery, development and manufacturing processes, and a significant amount are mandated by law. Notwithstanding, certain special interest groups categorically object to the use of animals for valid research purposes. Historically, our core research model activities with rats, mice and other rodents have not been the subject of significant animal rights media attention. However, research activities with animals have been the subject of adverse attention, including shareholder proposals and attempts to disrupt air carriers from transporting research models, impacting the industry. This has included periodic demonstrations near facilities operated by us and at our annual meetings, as well as shareholder proposals we received for some of our past Annual Meetings of Shareholders.
Furthermore, the habitat of certain animals used for research purposes may be located in or near certain environmentally protected areas or conservation areas. Activities conducted by us or any of our agents within these areas may be legally challenged and result in similar negative attention and action from environmental protection activists, including advocacy for the expansion of environmental restrictions applicable to such areas. Any negative attention, threats, acts of vandalism or legal action directed against our animal research or procurement activities, or our third-party service providers, such as our airline carriers or suppliers, or that restrict our or their ability to access protected or conservation areas, could impair our ability to operate our business efficiently.
Industry Risk Factors
A•Several of our product and service offerings, including our non-human primate supply, are dependent on a limited source of supply that, when interrupted, adversely affects our business.
•Demand volatility, risk of credit losses, or a reduction or delay in government funding of R&D may adversely affect our business.
•Changes in government regulation or in practices relating to the pharmaceutical or biotechnology industries, including potential healthcare reform, could decrease the need for the services we provide.
•Contract development and manufacturing services create a risk of liability, including risk that our products will not gain market acceptance and risk of failure to provide quality and timely service to customers.
•Contaminations in our animal populations can damage our inventory, harm our reputation for contaminant-free production, result in decreased sales and cause us to incur additional costs.
•The outsourcing trend in non-clinical stages of drug discovery and development may decrease, which could impair our growth.
•The industries in which we operate are highly competitive.
•New technologies may be developed, validated and increasingly used in biomedical research, which could reduce demand for some of our products and services.
•We may not be able to successfully develop and market new services and products.
•Costs increasing more rapidly than market prices could reduce profitability.
Legal and Regulatory Risk Factors
•Any failure by us to comply with applicable regulations and related guidance could harm our reputation and operating results, and compliance with new regulations and guidance may result in additional costs.
•Failure to comply with applicable data privacy and security laws in various jurisdictions could subject us to denial of the right to conduct business, fines, criminal penalties and/or other enforcement actions that could have a material adverse effect on our business.
•Failure to comply with U.S., state, local or international environmental, health and safety laws and regulations could result in fines and penalties and loss of licensure and have a material adverse effect upon the Company’s business.
•Changes in U.S. and International Tax Law, results of tax audits, or material changes in our stock price could have a material adverse impact on our effective tax rate and financial results.
•Non-clinical contract research services create a risk of liability.
•The failure to successfully obtain, maintain and enforce intellectual property rights and defend against assertions of third-parties to intellectual property rights could adversely affect us.
CHARLES RIVER LABORATORIES INTERNATIONAL, INC.
•Our by-laws designate the state courts located in the State of Delaware as the sole and exclusive forum for certain actions, which could limit a stockholder’s ability to bring a claim in a judicial forum that it finds favorable and may discourage lawsuits with respect to certain claims.
•We are involved in legal proceedings that could adversely affect our business, financial condition, and results of operations.
Labor and Employment Risk Factors
•We depend on key personnel and may not be able to retain these employees, which would harm our business.
•If we are unable to attract, hire or retain key team members or a highly skilled and diverse global workforce, it could have a negative impact on our business, financial condition or results of operations.
•We depend on the availability of, and good relations with, our team members.
Financial and Accounting Risk Factors
•Our debt level could adversely affect our business and growth prospects.
•Impairment of goodwill or other intangible assets may adversely impact future results of operations.
General Risk Factors
•Since we do not expect to pay any cash dividends for the foreseeable future, our shareholders will benefit from an investment in our common stock only if it appreciates in value.
•Our quarterly operating results may vary, which could negatively affect the market price of our common stock.
•Increasing focus on environmental, social and governance matters may impact our business, financial results or stock price.
Risk Factors
Business and Operational Risks
We bear financial risk for contracts that may be terminated or reduced in scope, underpriced, subject to cost overruns or delays.
Many of our agreements, including those which underlie our strategic relationships with some of our more significant clients, allow for termination or reduction in scope with little or no notice. In addition, we sell our products and services to our competitors, and similarly they sell products and services to us. For instance, we have historically entered into, and currently are party to, contracts with certain of our competitors to distribute specialty research models in locations where our competitors may not have distribution capabilities.
Our counterparties (including our clients who are competitors) may elect to terminate their agreements with us for various reasons including: the invocation of force majeure clauses, or the legal doctrines of impossibility or impracticability, or other similar legal doctrines; the products being tested fail to satisfy safety requirements; unexpected or undesired study results; production problems resulting in shortages of the drug being tested; a client’s decision to forego or terminate a particular study; our competitors’ establishment of alternative distribution channels; dissatisfaction with our performance under the agreement; the loss of funding for the particular research study; or general convenience/counterparty preference. If a counterparty terminates a contract with us, we are typically entitled under the terms of the contract to receive revenue earned to date as well as certain other costs and, in some cases, termination fees; however, in many cases we are not entitled to any termination fees in the event of a termination. Cancellation of a large contract or proximate delay, cancellation or conclusion of multiple contracts could materially adversely affect our business and, therefore, may adversely affect our operating results.
Furthermore, many of our contracts provide for services on a fixed price or fee-for-service with a cap basis and, accordingly, we bear the financial risk if we initially underprice our contracts or otherwise overrun our cost estimates. Such underpricing or significant cost overruns could have an adverse effect on our business, results of operations, financial condition and cash flows.
Upgrading and integrating our business systems could result in implementation issues and business disruptions.
In recent years, we have been updating and consolidating platforms and automating processes in many parts of our business with a variety of systems, including in connection with the integration of acquired businesses. The expansion and ongoing implementation of operational systems may occur at a future date based on value to the business. In general, the process of planning and preparing for these types of integrated, wide-scale implementations is extremely complex and we are required to address a number of challenges, including information security assessment and remediation, regulatory requirements, data conversion, associated regulatory compliance, network and system cutover, user training, and integration with existing
CHARLES RIVER LABORATORIES INTERNATIONAL, INC.
processes or systems. As we build out IT infrastructure to support regulatory requirements for applications and data systems, we are doing so utilizing contemporary validation practices. As with all work conducted in our regulatory sites, these too are subject to government inspections. Incongruities in any of these areas could cause operational problems during implementation including inconsistent practices, delayed report and/or data shipments, missed sales, animal management/welfare issues, issues that require re-doing certain studies, personally identifiable information and data privacy issues, billing errors and accounting errors.
We have in the past experienced and in the future could experience unauthorized access into our information systems.
We operate large and complex information systems that contain significant amounts of client data. As a routine element of our business, we collect, analyze and retain substantial amounts of data pertaining to the non-clinical studies we conduct for our clients. Unauthorized third parties could attempt to gain entry to such information systems to steal data or disrupt the systems or for financial gain. Like other companies, we have on occasion experienced, and will continue to experience, threats and incursions to our data and systems, including malicious software and viruses, phishing, business email compromise and social engineering attacks or other cyber-attacks. The number and complexity of these threats continue to increase over time.
In March 2019, we detected evidence that an unauthorized third party, who we believe was well resourced and highly sophisticated, accessed certain of our information systems and copied data. We worked with a leading cyber security firm to assist in our investigation and coordinated with law enforcement authorities. Our investigation indicated that the affected information included client information. By the end of 2019, we disclosed that we had completed our remediation of the identified incident. As of the date of this filing, to our knowledge, we have not experienced an information security breach or material cybersecurity incident since that event. While we have implemented additional security safeguards since that event and continue to enhance existing safeguards, such efforts may not be successful, in which case we could suffer significant harm.
Further, we are at risk of being targeted, and we have in the past been victim to, business email compromise fraud, which results in payments being made to illegitimate bank accounts. Although these instances have not resulted in our incurring material losses, if similar instances occur in the future, we may incur such losses.
Our contracts with our clients typically contain provisions that require us to keep confidential the information generated from the studies we conduct. In the event the confidentiality of such information is compromised, whether by unauthorized access or other breaches, we could be exposed to significant harm, including termination of customer contracts, damage to our customer relationships, damage to our reputation and potential legal claims from customers, employees and other parties. In addition, we may face investigations by government regulators and agencies as a result of a breach.
For information regarding our processes and practices related to information and cybersecurity, please see Section 1C of this report, “Cybersecurity”.
If we are not successful in selecting and integrating the businesses and technologies we acquire or partner with, or in managing our current and future divestitures, our business may be adversely impacted.
During the last two decades, we have steadily expanded our business through numerous acquisitions and partnerships. However, businesses and technologies may not be available on terms and conditions we find acceptable. We risk spending time and money investigating and negotiating with potential acquisition or alliance partners, but not completing transactions.
Acquisitions and alliances involve numerous risks which may include:
•difficulties in achieving business and financial success (due to unplanned events such as the long-term economic impact of the COVID-19 pandemic and ongoing geopolitical conflicts, such as between the Russian Federation and Ukraine, and between Israel and Hamas);
•difficulties and expenses incurred in assimilating and integrating operations, services, products, information technology platforms, technologies or pre-existing relationships with our clients, distributors and suppliers;
•challenges with developing and operating new businesses, including those that are materially different from our existing businesses, which may require the development or acquisition of new internal capabilities and expertise;
•potential losses resulting from operational weaknesses or undiscovered liabilities of acquired companies that are not covered by the indemnifications we may obtain from sellers or any insurance we may acquire in connection with transactions;
•loss of key employees;
•the presence or absence of adequate internal controls and/or significant fraud in the financial systems of acquired companies;
•diversion of management’s attention from other business concerns;
CHARLES RIVER LABORATORIES INTERNATIONAL, INC.
•a more expansive regulatory environment;
•dilution to earnings, or in the event of acquisitions made through the issuance of our common stock to the shareholders of the acquired company, dilution to the percentage of ownership of our existing shareholders;
•differences in foreign business practices, customs and importation regulations, language and other cultural barriers in connection with the acquisition of foreign companies;
•new technologies and products may be developed that cause businesses or assets we acquire to become less valuable; and
•disagreements or disputes with prior owners of an acquired business, technology, service or product that may result in legal settlements, litigation expenses and diversion of our management’s attention.
If an acquired business, technology or an alliance does not meet our expectations, our results of operations may be adversely affected. Some of the same risks exist when we decide to sell a business, site, product line or service offering or decide to close a site. We continually evaluate the performance and strategic fit of our business to determine whether any divestitures are appropriate. Such divestitures could involve additional risks, other than those listed above, including: difficulties in the separation of operations, services, products, and personnel, the need to agree to retain or assume certain current or future liabilities in order to complete the divestitures, and write-offs, including those related to goodwill and other intangible assets and which could have an adverse effect on our results of operations and financial condition. In addition, we may encounter difficulty in finding buyers or alternative exit strategies at acceptable prices and terms, and in a timely manner. We may not be successful in managing these or any other significant risks that we encounter in divesting a business, site or product line or service offering and, as a result, we may not achieve some or all of the expected benefits of the divestitures.
Failure to execute our business strategy could adversely impact our growth and profitability.
Our strategy is to deliver a comprehensive and integrated portfolio of drug discovery and non-clinical development products, services and solutions to support our clients’ discovery and early-stage drug research, process development, scale up and manufacturing efforts, and enable them to bring new and improved therapies to market faster and more cost effectively. Separately, through our various Manufacturing segment businesses, we aim to be the premier provider of products and services that ensure our clients produce and release their products safely. If we are unable to successfully execute on this strategy, this could negatively impact our future results of operations and market capitalization.
Any decline or lower than expected growth in our served markets could diminish demand for our products and services, which would adversely affect our results of operations and financial condition. To address this issue, we typically pursue a number of strategies designed to improve our internal growth, including strengthening our presence in selected geographic markets through organic growth and strategic acquisitions and expanding our service offerings, including our expansion into the CDMO business. We may not be able to successfully implement these strategies, and these strategies may not result in the expected growth of our business.
Furthermore, our strategy assumes a certain degree of capital and capacity growth development. Factors such as insufficient capital, inflation, supply chain interruptions, inadequate forecasting, increases in construction material costs, or labor shortages could interfere with the successful execution of our strategy and our ability to timely build infrastructure to satisfy capacity needs and support business growth. For additional discussion of our business strategy, please see the section above entitled “Our Strategy.”
Our business is subject to risks relating to operating internationally, including changes in foreign currency exchange rates.
A significant part of our revenue is derived from operations outside the U.S. We expect that international revenue will continue to account for a significant percentage of our total revenue for the foreseeable future.
Changes in foreign currency exchange rates could materially adversely impact our results. Foreign currencies we receive for sales and in which we record expenses outside the U.S. could be subject to unfavorable exchange rates with the U.S. dollar, resulting in a reduction in the amount of revenue and cash flow (and an increase in the amount of expenses) that we recognize and causing fluctuations in reported financial results. We also carry foreign currency exposure associated with differences between where we conduct business. For example, certain contracts are frequently denominated in currencies other than the currency in which we incur expenses related to those contracts. Where expenses are incurred in currencies other than those in which contracts are priced, fluctuations in the relative value of those currencies could have a material adverse effect on our results of operations.
Our exposure to currency exchange rate fluctuations results from the currency translation exposure associated with the preparation of our consolidated financial statements, as well as from the exposure associated with transactions of our subsidiaries that are denominated in a currency other than the respective subsidiary’s functional currency. While our financial results are reported in U.S. Dollars, the financial statements of many of our subsidiaries outside the U.S. are prepared using the
CHARLES RIVER LABORATORIES INTERNATIONAL, INC.
local currency as the functional currency. During consolidation, these results are translated into U.S. Dollars by applying appropriate exchange rates. As a result, fluctuations in the exchange rate of the U.S. Dollar relative to the local currencies in which our foreign subsidiaries report could cause significant fluctuations in our reported results. Moreover, as exchange rates vary, revenue and other operating results may differ materially from our expectations. Adjustments resulting from financial statement translations are included as a separate component of shareholders’ equity.
Other risks associated with our international business include:
•general economic and political conditions in the markets in which we operate;
•potentially negative consequences from changes in U.S. and/or foreign laws, including changes that may bar us from engaging in business transactions with certain clients, and changes in tax laws, or interpretations and enforcement thereof, notably tax regulations issued and to-be-issued with respect to the potential adoption of global minimum taxation requirements and potential changes to existing tax law by the current U.S. Presidential administration and Congress;
•ongoing uncertainties as a result of instability or changes in geopolitical conditions, including terrorist acts or military or political conflicts, such as those caused by the ongoing conflicts between Russia and Ukraine or Israel and Hamas (the potential escalation or geographic expansion of which could heighten other risks identified in this report);
•exchange controls, adverse tax consequences and legal restrictions on the repatriation of funds into the U.S.;
•difficulties and costs associated with staffing and managing foreign operations, including risks of work stoppages and/or strikes, as well as violations of local laws or anti-bribery laws such as the U.S. Foreign Corrupt Practices Act (FCPA), the U.K. Bribery Act and the OECD Convention on Combating Bribery of Foreign Public Officials in International Business Transactions;
•unexpected changes in regulatory requirements;
•the difficulties of compliance with a wide variety of foreign laws and regulations;
•unfavorable labor regulations in foreign jurisdictions;
•longer accounts receivable cycles in certain foreign countries;
•potentially reduced protection of our intellectual property rights in certain foreign countries; and
•compliance with export controls, import requirements and other trade regulations, including those relating to certain products of which there is limited supply.
These risks, individually or in the aggregate, could have an adverse effect on our results of operations and financial condition. For example, as mentioned above, we are subject to compliance with the FCPA, which prohibits companies and their third-party intermediaries from offering or making improper payments to foreign government officials for the purpose of obtaining or retaining business. Likewise, we are also subject to other international anti-bribery laws such as the UK Bribery Act which prohibit companies and their third-party intermediaries from offering or making improper payments to commercial parties. While our employees and third-party intermediaries are required to comply with these laws, we cannot be sure that our internal policies and procedures will always protect us from violations of these laws despite our commitment to legal compliance and corporate ethics. The occurrence or allegation of these types of risks may adversely affect our business, performance, prospects, value, financial condition and results of operations.
Our operations might be affected by the occurrence of a natural disaster or other catastrophic event.
We depend on our customers continued demand and solvency at our facilities for the continued operation of our business. While we maintain disaster recovery plans, they might not adequately protect us. Despite any precautions we take for natural disasters or other catastrophic events, these events, including terrorist attack, a pandemic, epidemic or outbreak of a disease, hurricanes, tornadoes, fire, floods and ice and snow storms, could result in damage to and closure of our or our customers’ facilities or the infrastructure on which such facilities rely. Such disruptions could include significant delays in the shipments of our products, reduce our capacity to provide services, adversely impact unique manufacturing capabilities, result in our customers’ inability to pay for our products or services and, ultimately, result in the loss of revenue and clients. Although we carry business interruption insurance policies and typically have provisions in our contracts that protect us in certain events, our coverage might not be adequate to compensate us for all losses that may occur. Any natural disaster or catastrophic event affecting us or our customers could have a significant negative impact on our operations and financial performance.
Negative attention from special interest groups may impair our business.
The products and services that we provide our clients are essential to the drug discovery, development and manufacturing processes, and a significant amount are mandated by law. Notwithstanding, certain special interest groups categorically object
CHARLES RIVER LABORATORIES INTERNATIONAL, INC.
to the use of animals for valid research purposes. Historically, our core research model activities with rats, mice and other rodents have not been the subject of significant animal rights media attention. However, research activities involving animal models have been the subject of adverse attention, including shareholder proposals and attempts to disrupt carriers from transporting large research models and actions aimed at preventing expansion of operations . This has included periodic demonstrations near facilities operated by us and at our annual meetings, as well as shareholder proposals we received for some of our past Annual Meetings of Shareholders. Furthermore, the habitat of certain animals used for research purposes may be located in or near certain environmentally protected areas or conservation areas. Activities conducted by us or any of our agents within these areas may be legally challenged and result in similar negative attention and action from environmental protection activists, including advocacy for the expansion of environmental restrictions applicable to such areas. Any negative attention, threats, acts of vandalism or legal action directed against our animal research or procurement activities, or our third-party service providers, such as our airline carriers or suppliers, or that restrict our or their ability to access protected or conservation areas, could impair our ability to operate our business efficiently.
Industry Risk Factors
Several of our product and service offerings, including our non-human primate supply, are dependent on a limited source of supply that, when interrupted, adversely affects our business.
We depend on a limited international source of supply for certain products, such as large research models, including non-human primates. Disruptions to their continued supply from time to time arise from colony health problems (including as a result of the spread of diseases), export or import laws/restrictions or embargoes, tariffs, inflation, international trade regulations, foreign government or economic instability, severe weather conditions, increased competition among suppliers for models, disruptions to the air travel system, activist campaigns, commercial disputes, supplier insolvency, geopolitical disputes, or other ordinary course or unanticipated events. Any disruption of supply could materially harm our business if we cannot remove the disruption or are unable to secure an alternative or secondary supply source on comparable commercial terms.
As with other industry participants, certain of our activities rely on a sufficient supply of large research models, which has seen increasing demand as compared to supply in recent years due to a variety of factors. First, the surge of research relating to COVID-19 increased short-term demand. Second, China previously supplied a significant portion of certain critical large research models, which have been subject to geographic export restrictions applicable to many animal species since the beginning of the COVID-19 pandemic. And third, in concert with legal matters affecting the Cambodian supply of non-human primates, the non-human primate supply chain globally has recently experienced constriction. More broadly, in November 2022 the U.S. Department of Justice (DOJ) announced that a Cambodia supplier of non-human primates and two Cambodian officials had been criminally charged in connection with illegally importing non-human primates into the United States. While the Company was not named or referenced in the November 2022 proceedings, the Company shortly thereafter announced that Cambodia was the primary country of origin for non-human primates imports to Charles River, and that it had begun to operate under the expectation that for some time period supply of Cambodia-sourced non-human primates (which according to CDC statistics, account for approximately 60% of supply to the United States) would be difficult to obtain in the United States. Subsequent to the Company’s announcement, USFWS denied clearance to certain shipments of non-human primates the Company had received from Cambodia. And as noted in Item 3. “Legal Proceedings” in this Annual Report on Form 10-K, in February 2023 the Company was informed by the DOJ that in conjunction with the U.S. Fish and Wildlife Service (USFWS), they had commenced a grand jury investigation into the Company’s conduct regarding several shipments of non-human primates, which is occurring in parallel to a civil investigation being undertaken by the DOJ and USFWS. In connection with the civil investigation, the Company has voluntarily suspended planned future shipments of Cambodia non-human primates into the United States until such time that the Company and USFWS can agree upon and implement additional procedures to reasonably ensure that non-human primates imported to the United States from Cambodia are purpose-bred. Accordingly, the Company believes that for some undetermined period of time it will not be able to import Cambodia-sourced non-human primates into the United States, and overall supply of non-human primates from Cambodia on a world-wide basis is more limited than previously.
While we continue to take steps to find alternative supply channels (and other global sources) and lock in supply (both for non-human primates and with respect to other limited supply products) with preferred sources through multi-year and/or minimum commitment contracts as well as through acquisitions of suppliers, there are limited sources and such mitigating efforts may not prove successful at ensuring a steady and timely supply or may require (and in the past have required) us to pay significantly higher prices for such products during periods of global shortage or restrictions on the importation or the transportation of models products. Limited global supply or regional restrictions on transportation for certain products may require us to source products from non-preferred vendors, which may not be successful. In addition, reductions in global air transportation routes may result in sourcing alternative transportation at an increased cost. Finally, we may be unable to obtain supplydue to governmental restrictions or limitations, including (as noted above) non-human primates. An inability to obtain a sufficient and timely supply of critical products could adversely affect our business, financial results and results of operations.
CHARLES RIVER LABORATORIES INTERNATIONAL, INC.
Portions of our Cell Solutions business depends on the availability of appropriate donors. Regulations intended to control infectious disease or requirements in cell therapy manufacturing processes could also result in a decreased pool of potential donors or integrity of inventory. Due to any pandemic, epidemic or outbreak in one or more regions in which our Cell Solutions business operates, the portion of the donor pool that typically donates may be unable, or unwilling to donate, thereby significantly reducing the availability of research products upon which we rely. In addition, healthcare concerns among the public may result in a decline in donations. If donor participation declines, we may not be able to reduce costs sufficiently to maintain profitability of the Cell Solutions business.
Our CDMO services establish us as a premier scientific partner for cell and gene therapy development, testing, and manufacturing; enable us to provide clients with an integrated solution from basic research and discovery through cGMP production; enable us to drive efficiency and accelerate clients’ speed-to-market by integrating manufacturing and the required testing; and enable our clients to seamlessly conduct analytical testing, process development, and manufacturing for advanced modalities with the same scientific partner. Furthermore, our CDMO operations require various raw materials supplied primarily by third parties. We or our customers specify the raw materials and other items required to manufacture the applicable product and, in some cases, the customers specify the suppliers from whom we must purchase these raw materials. In certain instances, the raw materials and other items may only be supplied by a limited number of suppliers or in limited quantities. If third-party suppliers do not supply raw materials or other items on a timely basis, it may cause a manufacturing run to be delayed or canceled which could materially adversely affect our results of operations and financial condition.
Furthermore, in general, third-party suppliers may fail to provide us with raw materials and other items that meet the qualifications and specifications required by us or our customers. If third-party suppliers are not able to provide us with raw materials that meet our or our customers’ specifications on a timely basis, we may be unable to manufacture the product for our clients or it could prevent us from delivering products to our customers within required time frames. Any such delay in delivering products to our clients may create liability for us to our customers for breach of contract or cause us to experience order cancellations and loss of customers. In the event that we manufacture products with components or raw materials that do not meet our qualifications and specifications or those of our customers or governmental or regulatory authorities, we may become subject to product liability claims caused by defective raw materials or components from a third-party supplier or from a customer.
Demand volatility and risk of credit losses from clients may adversely affect our business.
Our business could be adversely affected by any significant decrease in drug R&D expenditures by pharmaceutical and biotechnology companies, as well as by academic institutions, government laboratories or private foundations. Similarly, economic factors and industry trends that affect our clients in these industries (including the COVID-19 pandemic and the impact of measures intended to reduce the spread of COVID-19) also affect their R&D budgets and, consequentially, our business as well.
Our clients include researchers at pharmaceutical and biotechnology companies. Our ability to continue to grow and win new business is dependent in large part upon the ability and willingness of the pharmaceutical and biotechnology industries to continue to spend on molecules in the non-clinical phases of R&D (and in particular discovery and safety assessment) and to outsource the products and services we provide. Furthermore, our clients (particularly larger biopharmaceutical companies) continue to search for ways to maximize the return on their investments with a focus on lowering R&D costs per drug candidate. Fluctuations in the expenditure amounts in each phase of the R&D budgets of these researchers and their organizations could have a significant effect on the demand for our products and services. R&D budgets fluctuate due to changes in available resources, mergers of pharmaceutical and biotechnology companies, spending priorities (including available resources of our biotechnology clients, particularly those that are cash-negative, who may be highly focused on rationing their liquid assets in a challenging funding environment), general economic conditions, institutional budgetary policies and the impact of government regulations, including potential drug pricing legislation. Available funding for biotechnology clients in particular may be affected by the capital markets, investment objectives of venture capital investors and priorities of biopharmaceutical industry sponsors.
Additionally, our business is exposed to the risk of credit losses, which arises from our extension of credit to clients. The collectability of accounts receivable may be adversely affected by various factors, including economic downturns, changes in clients’ financial conditions, and industry-specific challenges. A deterioration in the creditworthiness of our clients could result in the need to establish or increase our allowance for credit losses. We regularly assess the creditworthiness of our clients, establish credit limits, and monitor payment patterns. However, our ability to manage credit risk and maintain an adequate allowance for credit losses may be impacted by factors beyond our control, such as unforeseen economic conditions or significant shifts in client payment behavior. Additionally, changes in global or regional economic conditions may affect the overall credit environment and impact our customers' ability to fulfill their payment obligations.
For additional discussion of the factors that we believe have recently been influencing R&D budgets at our clients, please see the sections entitled “Our Strategy” and “Management’s Discussion and Analysis of Financial Condition and Results of Operations” included elsewhere in this Form 10-K.
CHARLES RIVER LABORATORIES INTERNATIONAL, INC.
Additionally, we have business that depends on our Research Productssupply of large research models to clients. Sudden or unexpected changes in demand, market conditions, or the regulatory environment for these models could have an adverse impact on our profitability. Increasing demand could harm relationships with customers if we are unable to alter production capacity, or purchase products from other suppliers, to fill orders adequately. Decreased demand could result in inventory surpluses, which could also significantly impact our results and operations. In particular, if the price of non-human primates increases significantly, or if we are unable to transport the non-human primates in our possession to our clients because of governmental restrictions or limitations, our business may be materially adversely affected. In addition, overall supply constraints with respect to large research models has led to an extremely dynamic pricing environment for non-human primates, which has, and could continue to, make it difficult to predict results, lead to reduced volumes, and require us to adjust operations.
Furthermore, our Cell Solutions operations are structured to produce particularresearch materials, such as blood products based on customers’clients’ existing demand, and perceived potential changes in demand, for these products. Sudden or unexpected changes in demand for these products could have an adverse impact on our profitability. Increasing demand could harm relationships with customersclients if we are unable to alter production capacity, or purchase products from other suppliers, to fill orders adequately. This could result in a decrease in overall revenue and profits. The impact of measures intended to reduce the spread of COVID-19 caused us to temporarily suspend blood donations, which have since resumed, at our Research Products facilities, further limiting our ability to respond to changes in demand. Lack of access to sufficient capital, or lack of adequate time to properly (or the failure to adequately) respond to changes in demand, could result in declining revenue and profits, as customersclients transfer to other suppliers.
We also operate businesses which depend upon the regulatory approval of the products they manufactures for their contract development and manufacturing organization (CDMO) clients. As such, if these clients experience a delay in, or failure to receive, approval for any of their product candidates or fail to maintain regulatory approval of their products that we develop or manufacture, our revenue and profitability could be materially adversely affected. Additionally, if the FDA or a comparable foreign regulatory authority does not approve of our facilities for the manufacture of a client product, observes significant deficiencies or violations at its facilities or withdraws such approval in the future, our clients may choose to identify alternative manufacturing facilities and/or relationships, which could significantly impact our CDMO capacity and capabilities and results of operations therefrom.
A reduction or delay in government funding of R&D may adversely affect our business.
A portion of revenue, predominantly in our RMS segment, is derived from clients at academic institutions and research laboratories whose funding is partially dependent on both the level and timing of funding from government sources such as the U.S. National Institutes of Health (NIH) and similar domestic and international agencies, which can be difficult to forecast. We also sell directly to the NIH and these other agencies. Government funding of R&D is subject to the political process, which is inherently fluid and unpredictable. Our revenue may be adversely affected if our clients delay purchases as a result of uncertainties surrounding the approval of government budget proposals, included reduced allocations to government agencies that fund R&D activities. Government proposals to reduce or eliminate budgetary deficits have sometimes included reduced allocations to the NIH and other government agencies that fund R&D activities, or NIH funding may not be directed towards projects and studies that require the use of our products and services, both of which could adversely affect our business and our financial results. Furthermore,
Changes in government regulation or in practices relating to the pharmaceutical or biotechnology industries, including potential healthcare reform, could decrease the need for the services we provide.
Governmental agencies throughout the world strictly regulate the drug development process. Our business involves helping our customers navigate these regulatory processes. Accordingly, many regulations, and often new regulations, are expected to result in higher regulatory standards and often additional revenues for companies that service these industries. However, some changes in government budgetary prioritiesregulations, such as a resultrelaxation in regulatory requirements or the introduction of streamlined or expedited drug approval procedures, or an increase in regulatory requirements that we have difficulty satisfying or that make our services less competitive, could eliminate or substantially reduce the COVID-19 pandemicdemand for our services.
For example, in December 2022, the FDA Modernization Act 2.0 was passed, which requires the FDA to develop and the impact of measures intendedimplement a strategy to reduce the spreaduse of COVID-19 could reduce government fundinganimals in testing while maintaining the safety and effectiveness of R&D that is unrelatedmedical products and to explore the disease, which could adversely affectuse of non-animal alternatives to animal testing. Eliminating the use of animals in research may have material adverse effects on our business, results of operations, or financial condition. While there have been significant advancements in the development of alternative methods, the complete elimination of animals in research will be a gradual process that may take many years to achieve. While we are committed to working with the industry to support development and to provide the best translational models to supplement or replace traditional models as part of our financial results.4Rs initiative, the use of animals in research is highly regulated and proposed changes to current regulations will need to be carefully evaluated to ensure that they do not compromise the safety and efficacy of new drugs and medical treatments.
Although we believe we are currently in compliance in all material respects with applicable national, regional and local laws, as well as other accepted guidance used by oversight bodies (including the USDA, the standards set by the International Air
Transport Association, the Convention on International Trade in Endangered Species of Wild Fauna and Flora, USFWS, The Centers for Disease Control, the Department of Transportation, the Department of State, the office of Laboratory Animal Welfare of NIH, the Drug Enforcement Agency, as well as numerous other oversight agencies in the jurisdictions in which we operate), failure to comply could subject us to denial of the right to conduct business, fines, criminal penalties and other enforcement actions. For additional discussion of the factors specifically affecting our non-human primates including related oversight trade compliance agencies, please see the sections entitled “Item 1A. Risk Factors – Industry Risk Factors - Several of our product and service offerings, including our non-human primate supply, are dependent on a limited source of supply that, when interrupted, adversely affects our business.business”, and “Item 3. Legal Proceedings” included elsewhere in this Form 10-K. In addition, if regulatory authorities were to mandate a significant reduction in safety assessment procedures that utilize research animals (as has been advocated by certain groups), certain segments of our business could be materially adversely affected.
WeImplementation of healthcare reform legislation may have certain benefits, but also may contain costs that could limit the profits that can be made from the development of new drugs. This could adversely affect R&D expenditures by pharmaceutical and biotechnology companies, which could in turn decrease the business opportunities available to us both in the U.S. and abroad. In addition, new laws or regulations may create a risk of liability, increase our costs or limit our service offerings. Furthermore, if health insurers were to change their practices with respect to reimbursements for pharmaceutical products, our clients may spend less or reduce their growth in spending on R&D.
While it is not possible to predict whether and when any such changes will occur, changes at the local, state or federal level, or in laws and regulations in effect in foreign jurisdictions in which we operate or have business relationships, may significantly impact our domestic and foreign businesses and/or those of our clients. Furthermore, modifications to international trade policy, public company reporting requirements, environmental regulation and antitrust enforcement may have a materially adverse impact on us, our suppliers or our clients.
Our Biologics Solutions business, financial condition and results of operations may be adversely affected if the products we manufacture and/or test for our customers do not gain market acceptance.
If the products we manufacture for our customers do not gain market acceptance or production volumes of key products that we manufacture for our customers decline, the financial condition and results of our operations may be adversely affected. For our CDMO services, we will depend on, a limited international sourceand have no control over, market acceptance for the products that we will manufacture for our customers. Consumer demand for these products could be adversely affected by, among other things, delays in securing regulatory approvals, the emergence of supplycompeting or alternative products, including generic drugs, the emergence of new safety data for certainsuch products, such as large research models. Disruptionsthe loss of patent and other intellectual property rights protection, reductions in private and government payment product subsidies or changing product marketing strategies.
CDMO services are highly complex and failure to their continued supply from timeprovide quality and timely services to time arise from health problems (including as a resultour CDMO customers, could adversely impact our business.
The CDMO services we offer can be highly complex, due in part to strict regulatory requirements and the inherent complexity of the COVID-19 pandemic and the spread of other diseases), export or import laws/restrictions or embargoes, tariffs, international trade regulations, foreign government or economic instability, severe weather conditions, increased competition among suppliers for models, disruptions to the air travel system, activist campaigns, commercial disputes, supplier insolvency, geopolitical disputes, measures intended to slow the spread of COVID-19 or other ordinary course or unanticipated events. Any disruption of supply could materially harm our business if we cannot remove the disruption or are unable to secure an alternative or secondary supply source on comparable commercial terms. For example, as with other industry participants, certainservices provided. A failure of our activities rely on a sufficient supply of large research models, which has seen increasing demand as compared to supplyquality control systems in 2020 and into 2021 due toour facilities could cause problems in connection with facility operations for a variety of reasons, including equipment malfunction, viral contamination, failure to follow specific manufacturing instructions, protocols and standard operating procedures, problems with raw materials or environmental factors. First,Such issues could affect production of a single manufacturing run or manufacturing campaigns, requiring the surgedestruction of research relating to COVID-19 has increased short term demand. Second, China supplies a significant portion of certain critical large research models, which have been subject to geographic export restrictions applicable to many animal species since the beginning of the COVID-19 pandemic. While we continue to take steps to find alternative supply channels and lock in supply with preferred sources through multi-year and/products, or minimum commitment contracts, such mitigating efforts may not prove successful at ensuring a steady and timely supply or may require (and in the past have required) us to pay significantly higher prices for such products during periods of global shortage or restrictions on the transportation of products. Limited global supply or regional restrictions on transportation for certain products may require us to source products from non-preferred vendors, which may not be successful.could halt manufacturing operations altogether. In addition, reductions in global air transportation routesany failure to meet required quality standards may result in sourcing alternative transportation at anour failure to timely deliver products to our customers which, in turn, could damage our reputation for quality and service. Any such incident could, among other things, lead to increased cost. An inabilitycosts, lost revenue, reimbursement to obtain a sufficientcustomers for lost drug substances, damage to and timely supplypossibly termination of critical products could adversely affect our business, financial resultscustomer relationships, time and results of operations.
Further, our Research Products business dependsexpense spent investigating and remediating the cause and, depending on the availability of appropriate donors. As a result of the COVID-19 pandemic and the impact of measures intendedcause, similar losses with respect to reduce the spread of COVID-19, we temporarily suspended blood donations at one of our Research Products facilities. Regulations intended to reduce the risk of introducing infectious diseases in the blood supply (including COVID-19) could also result in a decreased pool of potential donors or integrity of inventory. Due to any pandemic, epidemic or outbreak in one or more regions in which our Research Products business operates, the portion of the donor pool that typically donates may be unable, or unwilling to donate, thereby significantly reducing the availability of research products upon which we rely.other manufacturing runs. In addition, health and healthcare concerns amongsuch issues could subject us to litigation, the public may result in a decline in donations. If donor participation declines, we may notcost of which could be able to reduce costs sufficiently to maintain profitability of the Research Products business.significant.
Contaminations in our animal populations can damage our inventory, harm our reputation for contaminant-free production, result in decreased sales and cause us to incur additional costs.
OurBoth small and large animal research models and fertile chicken eggs must be free of certain infectious agents, such as certain viruses, parasites, and bacteria, because the presence of these contaminants can distort or compromise the quality of research results andand/or could adversely impact human or animal health. The presence of these infectious agents in our animal production facilities and certain service operations could disruptimpact the quality of our contaminant-free research model and fertile egg production as well as our animal services businesses, including GEMS, harm our reputation for contaminant-free production and result in decreased sales. There also exists a risk that contaminations from models that we produce may affect our client’s facilities, with similar impact to them for which we could be liable for damages. In some cases, we may produce or import animals carrying infectious agents capable of causing disease in humans; and in the case of such a contamination or undiagnosed infection, there could be a possible risk of human exposure and infection and liability for damages to infected persons.
We are also subject to similar contamination risks with respect to
CHARLES RIVER LABORATORIES INTERNATIONAL, INC.
When considering our large research models. Whilemodels, while some of these models are owned by us and maintained at our facilities, others are reserved for us and maintained at sites operated by the original provider. Accordingly, risk of contamination may be outside of our control, and we depend on the practices and protocols of third parties to ensure a contamination-free environment. A contamination may require extended CDC or CFIA quarantine with subsequent reduced sales as a result of lost client orders, as well as the potential for complete inventory loss and disinfection of the affected quarantine rooms. Furthermore, while we often negotiate for contractual risk indemnification, the third party may refuse to fulfill its indemnification obligation or may be unable to as a result of insolvency or other impediments.
Contaminations are unanticipated and difficult to predict and could adversely impact our financial results. If they occur, contaminations typically require cleaning up, renovating, disinfecting, retesting and restarting production or services. Such clean-upscontaminations result in inventory loss, clean-up and start-up costs, and reduced sales as a result of lost client orders and potentially credits for prior shipments. In addition to microbiological contaminations, the potential for genetic mix-ups or mis-matingscontaminations also
exists and may require us to restart the applicable animal colonies, and would likely result in inventory loss, additional start-up costs and possibly reduced sales. Contaminations also expose us to risks that clients will request compensation for damages in excess of our contractual indemnification requirements.
Further, many of our operations are comprised of complex mechanical systems that are subject to periodic failure, including aging fatigue. Such failures are unpredictable, and while we have made significant capital expenditures designed to create redundancy within these mechanical systems, strengthen our biosecurity, improve our operating procedures to protect against such contaminations, and replace impaired systems and equipment in advance of such events, failures and/or contaminations may still occur.
The outsourcing trend in non-clinical (discovery and safety assessment) stages of drug discovery and development may decrease, which could impair our growth.
Over the past decade, pharmaceutical and biotechnology companies have generally increased their outsourcing of non-clinical research support activities, such as discovery and safety assessment. While many industry analysts expect the outsourcing trend to continue to increase for the next several years (although with different growth rates for different phases of drug discovery and development), decreases in such outsourcing may result in a diminished growth rate in the sales of any one or more of our service lines and may adversely affect our financial condition and results of operations. For additional discussion of the factors that we believe have recently influenced outsourcing demand from our clients, please see the section entitled “Our Strategy” included in our Form 10-K for the fiscal year ended December 28, 2019, filed with the Commission on February 11, 2020.above.
The industries in which we operate are highly competitive.
The industries in which we operate are highly competitive. We compete for business with other CROsnon-clinical drug development partners and blood product and therapeutic services companies, other CDMOs, as well as internal discovery and development departments within our larger clients, who may have greater resources than ours. We also compete with universities and teaching hospitals for outsourced services. We compete on a variety of factors, including:
•reputation for on-time quality performance;
•reputation for regulatory compliance;
•reputation for responsive client service and support;
•expertise and experience in multiple specialized areas;
•scope and breadth of service and product offerings across the drug discovery and development spectrum;
•scope and breadth of service and product offerings across the manufacturing support spectrum;
•ability to provide flexible and customized solutions to support our clients’ drug discovery, non-clinical development, and manufacturing support needs;
•broad geographic availability (with consistent quality);
•price/value, spend and flexibility;
•technological and scientific expertise and efficient drug development processes;
•quality of facilities;
•financial stability;
•size;
•ability to acquire, process, analyze and report data in an accurate manner;
CHARLES RIVER LABORATORIES INTERNATIONAL, INC.
•ability to place orders through eCommerce channels; and
•accessibility of client data through secure portals.
If we do not compete successfully, our business will suffer. Increased competition might lead to price and other concessions that could adversely affect our operating results. The drug discovery and development services industry has continued to see a trend towards consolidation, particularly among the biotechnology companies, which are targets for each other and for large pharmaceutical companies. If this trend continues, it is likely to produce more competition among the larger companies, and CROs generally, with respect to both clients and acquisition candidates. In addition, small, specialized entities considering
entering the CRO industries will continue to find lower barriers to entry, and private equity firms may determine that there are opportunities to acquire and consolidate these companies, thus further increasing possible competition. Our competition in the CDMO market includes full-service contract manufacturers and large pharmaceutical companies offering third-party manufacturing services to fill their excess capacity. Also, large pharmaceutical companies have been seeking to divest portions of their manufacturing capacity, and any such divested businesses may compete with us in the future. Furthermore, many of our CDMO competitors may have substantially greater financial, marketing, technical or other resources than we do. Moreover, additional competition may emerge, particularly in lower-cost jurisdictions such as India and China, which could, among other things, result in a decrease in the fees paid for our services, which may adversely affect our results of operations and financial condition.
More generally, our competitors or others might develop technologies, services or products that are more effective or commercially attractive than our current or future technologies, services or products, or that render our technologies, services or products less competitive or obsolete. If competitors introduce superior technologies, services or products and we cannot make enhancements to ours to remain competitive, our competitive position, and in turn our business, revenue and financial condition, would be materially and adversely affected. In the aggregate, these competitive pressures may affect the attractiveness of our technologies, services or products and could adversely affect our financial results.
New technologies may be developed, validated and increasingly used in biomedical research, which could reduce demand for some of our products and services.
The scientific and research communities continuecommunity continues to develop cell-based and new alternative model methods to improve cellular(NAMs), which do not involve working with animals models and animal model systems that wouldare designed to increase the translation from findings in early-stage discovery and pre-clinical studies to human studies, and vice-versavice-versa. As these methods continue to advance, they may supplement, and in some cases possibly replace or supplementsupplant methodologies that are currently in use, such as the use of traditional living animals in biomedical research. Some companies have developed techniques in these areas that may have scientific merit to improve translation between species. In addition, technological improvements, to existing or new processes, such as imaging and other translational biomarker technologies, could result in the refinement and utilityimpact demand for the number of animal research models necessary to improve the translation from non-clinical to clinical studies.models. Further, some companies are developing synthetic alternatives tomanufacturers, including Charles River, have recently introduced recombinant versions of LAL, which ishas been historically derived from live animals. It is our strategy to explore new technologies to refine and potentially reduce the use of animal models and animal derived products as new in vitroand in silico methods become validated.available and synthetically-manufactured products become validated with sufficient data to ensure public safety. For information regarding our efforts to support development and to provide the best translational models to supplement or replace traditional models, see “Our Strategy” included elsewhere in this Form 10-K. However, we may not be able to develop new products, inputs or processes effectively or in a timely manner to replace any lost sales. Lastly, other companies or entities may develop research models, inputs or processes with characteristics different than the onesfrom those that we produce, and that may be viewed as more desirable by some of our clients.
We may not be able to successfully develop and market new services and products.
We maycontinue to seek opportunities to develop and market new services and products that complement or expand our existing business or service offerings. We believe our ability to in-licenseinnovate through internal research and development efforts and license or acquire new technologies from third parties will beare both critical to our ability to offer new products and servicescontinue to meet the needs of our clients. Our ability to gain access to such technologies that we need for new products and services depends, in part, on our ability to convince inventors and their agents or assigneesinnovators that we can successfully develop and commercialize their inventions. We cannot guarantee that we will be able to identify new technologies of interest to our clients. Even if we are able to identify new technologies of interest, we may not be able to negotiatethese opportunities, negotiating license agreements on commercially acceptable terms or at all.may prove difficult. In addition, our ongoing internal research and development efforts may not always yield offerings that meet client demand. If we are unable to develop new services and products and/or create demand for those newly developed services and products, our future business, results of operations, financial condition and cash flows could be adversely affected.
Costs increasing more rapidly than market prices in certain of our businesses could reduce profitability.
The cost of collecting, processing and testing blood products has risen significantly in recent years and will likely continue to increase.increase given stringency of demands on raw materials. These cost increases are related to new and improved testing procedures, increased regulatory requirements, related to blood safety, and higher staff and supply costs, related to collecting and processing blood products.including labor inflation. Competition and fixed price contracts may limit our ability to maintain existing operating margins. Some competitors have greater resources than us to
CHARLES RIVER LABORATORIES INTERNATIONAL, INC.
sustain periods of marginally profitable or unprofitable sales. Costs increasing more rapidly than market prices may reduce profitability and may have a material adverse impact on our business and results of operations.
Legal &and Regulatory Risk Factors
Any failure by us to comply with applicable regulations and related guidance could harm our reputation and operating results, and compliance with new regulations and guidance may result in additional costs.
Any failure on our part to comply with applicable regulations could result in the termination of ongoing research or the disqualification of data for submission on behalf of our clients to regulatory authorities. This could harm our reputation, our prospects for future work and our operating results. For example, the issuance of a notice of objectionable observations or a warning letter from the FDA based on a finding of a material violation affecting data integrity by us for GLP or cGMP requirements that are not addressed to the regulatory monitoring authorities’ satisfaction could materially and adversely affect us. If our operations are found to violate any applicable law or other governmental regulations, we might be subject to civil and criminal penalties, damages and fines or the temporary closure of our facilities. Any action against us for violation of these laws or regulations, even if we successfully defend against it, could cause us to incur significant legal expenses, divert our management’s attention from the operation of our business and damage our reputation.
In recent years FDA has issued guidance that now requires submissions to be presented in a format that conforms with the FDA’s SEND (Standardization for Exchange of Nonclinical Data) standards that apply to our clients’ NDA and IND submissions and require us to provide electronic data in specific formats that will allow for more efficient, higher quality regulatory reviews. Accordingly,Where applicable, our clients expect us to timely deliver their nonclinical data compliant with SEND.the FDA’s SEND (Standardization for Exchange of Nonclinical Data) standards. Notwithstanding, some of these standards require additional operating and capital expenses that will impact not only us and our industry competitors, but clients in the biomedical research community. Non-compliance with any of these expectations could lead to official action by a government authority, damage to our reputation and a potential loss of business.
In addition, regulations and guidance worldwide concerning the production and use of laboratoryresearch animals for research purposes continue to evolve. Similarly, guidance has been and continues to be developed for other areas that impact the biomedical research community on both a national and international basis including transportation, mandated contingency planning, euthanasia guidance, import and export requirements of biological materials, health monitoring requirements and the use of disinfectants.
Our Research ProductsCell Solutions business is subject to extensive and complex regulation by federal, state and local governments in the U.S. and in the other countries in which it operates. This business requires us to obtain many licenses, permits, authorizations, accreditations, approvals, and certificates and other types of governmental permissions and to fully comply with variousappropriate regulations in every jurisdiction in which we operate.operate and sell. Federal, state and local regulations do change, often, and new regulations are frequently adopted.requiring prompt adoption to remain in a constant state of compliance. Changes in the regulations could require us to change the way in whichalter how we operate our business, and thepotentially resulting in a significantly increased cost of compliance with new or changed regulations could be significant.compliance.
Our donor collection centers are registered with the FDA and the FDA periodically conducts inspections of those facilities and operations. At the conclusion of each inspection, the FDA provides us with a list of observations of regulatory issues discoveredobjectionable conditions and practices observed during the inspection that could result in additional regulatory action.enforcement actions. Failure to comply with the regulations ofenforced by the FDA could result in sanctions and/or remedies and have a material adverse effect on us.
Changes in government regulation or in practices relating to the pharmaceutical or biotechnology industries, including potential healthcare reform, could decrease the need for the services we provide.
Governmental agencies throughout the world strictly regulate the drug development process. Our business involves helping our customers navigate these regulatory processes. Accordingly, many regulations, and often new regulations, are expected to result in higher regulatory standards and often additional revenues for companies that service these industries. However, some changes in regulations, such as a relaxation in regulatory requirements or the introduction of streamlined or expedited drug approval procedures, or an increase in regulatory requirements that we have difficulty satisfying or that make our services less competitive, could eliminate or substantially reduce the demand for our services.
Although we believe we are currently in compliance in all material respects with applicable national, regional and local laws, as well as other accepted guidance used by oversight bodies (including the USDA, the standards set by the International Air Transport Association, the Convention on International Trade in Endangered Species of Wild Fauna and Flora, U.S. Fish and Wildlife Service, The Centers for Disease Control, the Department of Transportation, the Department of State, the office of Laboratory Animal Welfare of NIH, the Drug Enforcement Agency, as well as numerous other oversight agencies in the jurisdictions in which we operate), failure to comply could subject us to denial of the right to conduct business, fines, criminal penalties and other enforcement actions. In addition, if regulatory authorities were to mandate a significant reduction in safety assessment procedures that utilize laboratory animals (as has been advocated by certain groups), certain segments of our business could be materially adversely affected.
In March 2010, the U.S. Congress enacted healthcare reform legislation, the Patient Protection and Affordable Care Act (ACA), which includes provisions impacting drug manufacturers, such as (1) the expansion of access to health insurance coverage, (2) the expansion of the Medicaid program, (3) the enactment of an industry fee on pharmaceutical companies and (4) the imposition of an excise tax on the sale of medical devices. In addition, the Tax Cuts and Jobs Act, enacted in 2017, repeals the ACA’s individual health insurance mandate, which is considered a key component of the ACA. Since the ACA and its implementation continue to face challenges in Congress and federal courts, and from certain state governments, opposition advocacy groups and some small business organizations, the ultimate effects of this legislation are unclear on our business and are unable to predict what legislative proposals will be adopted in the future.
Implementation of healthcare reform legislation may have certain benefits, but also may contain costs that could limit the profits that can be made from the development of new drugs. This could adversely affect R&D expenditures by pharmaceutical and biotechnology companies, which could in turn decrease the business opportunities available to us both in the U.S. and abroad. In addition, new laws or regulations may create a risk of liability, increase our costs or limit our service offerings.
Furthermore, if health insurers were to change their practices with respect to reimbursements for pharmaceutical products, our clients may spend less or reduce their growth in spending on R&D.
While it is not possible to predict whether and when any such changes will occur, changes at the local, state or federal level, or in laws and regulations in effect in foreign jurisdictions in which we operate or have business relationships, may significantly impact our domestic and foreign businesses and/or those of our clients. Furthermore, modifications to international trade policy, public company reporting requirements, environmental regulation and antitrust enforcement may have a materially adverse impact on us, our suppliers or our clients.
We are required to comply with thestringent, complex and evolving laws, rules, regulations and standards in many jurisdictions, as well as contractual obligations, relating to data privacy and security laws in many jurisdictions. Failuresecurity. Any actual or perceived failure to comply with these laws and regulations could subject us to denial of the right to conduct business, fines, criminal penalties and/or other enforcement actions thatrequirements could have a material adverse effect on our business.
We are required to comply with stringent, complex and frequently evolving laws, rules, regulations and standards in many jurisdictions, as well as contractual obligations, relating to data privacy and security. Ensuring that our collection, use, transfer, storage and other processing of personal information complies with such requirements can increase operating costs, impact the development of new products or services, and reduce operational efficiency.
Internationally, virtually every jurisdiction in which we operate has established its own data privacy and security laws in many jurisdictions.legal framework with which we must comply. For example, we are required to comply with the European Union (EU) General Data Protection Regulation (GDPR), which became effective on May 25, 20182018. The EU GDPR imposes stringent obligations regarding the collection, control, use, sharing, disclosure and imposes heightened obligations and enhanced penalties for noncompliance (including up to four percent (4%) of global revenue). The cost of compliance, and the potential for fines and penalties for non-compliance, with GDPR may have a significant adverse effect on our business and operations. Recentlegal developments in the EU have created complexity and uncertainty regarding transfersother processing of personal data of individuals within the EU and European Economic Area (EEA). EU member states may also impose additional requirements in relation to personal data through their national implementing legislation.
The EU GDPR also imposes specific restrictions on the transfer of personal data to countries outside of the EU and EEA, including the use of appropriate safeguards to enable such transfers, such as Standard Contractual Clauses (SCCs) and the EU-US Data Privacy Framework (DPF). The EU-US DPF was adopted in July 2023 and provides US-based organizations who self-certify with a reliable mechanism for personal data transfers from the EU, United Kingdom, and Switzerland. Although these mechanisms are currently valid for purposes of transferring personal data, they could be subject to the US, including the invalidation of the EU-US Privacy Shield Framework in July 2020legal challenges and proposed updatesthere is no assurance that we could satisfy or rely on these measures to the EU standard contractual clauses in November 2020.lawfully transfer personal data. If we are otherwise unable to transfer personal data between and among countries and regions in which we operate, it could affect the manner in which we
CHARLES RIVER LABORATORIES INTERNATIONAL, INC.
provide our services, the geographical location or segregation of our relevant systems and operations, and could adversely affect our financial results.
While we have implemented controls and procedures to comply with the requirements of the EU GDPR, such procedures and controls may not be effective in ensuring compliance or preventing unauthorized transfers of personal data. Additionally, followingwe are subject to the United Kingdom’s withdrawalprivacy and data protection laws of the UK, including the UK Data Protection Act of 2018 (UK GDPR). Similar to the EU GDPR, the UK GDPR imposes restrictions on the processing of personal data, as well as transfers of personal data from the EU, we will haveUK to other countries. Failure to comply with the EU and/or the UK GDPR can result in significant fines and other liability.
Moreover, China adopted the GDPRPersonal Information Protection Law (PIPL) and Data Security Law (DSL) in 2021, which promulgated national privacy and security requirements relating to the collection, processing, transfer and security of personal information in or from China. Violations of the PIPL or DSL could result in fines and penalties, suspension of data transfers, cancellation of business authorizations, personal liability for responsible company officers, as implementedwell as criminal and civil liability. In the event that the PIPL requires us to store data in China, or limits our ability to transfer data across borders, we may experience increased costs and business inefficiencies. Fines, corrective actions, or other penalties asserted due to alleged noncompliance may impose additional financial or operational costs, limit our ability to attract and retain local talent, or limit our ability to do business in China.
In the United Kingdom. The relationship betweenUS, there are numerous federal and state data privacy and security laws, rules, and regulations governing the United Kingdomcollection, use, disclosure, retention, security, transfer, storage and other processing of personal information, including federal and state data privacy laws, data breach notification laws, and data disposal laws. For example, at the EUfederal level, we are subject the regulations of the Federal Trade Commission, which has the authority to regulate and enforce against unfair or deceptive acts or practices in or affecting commerce, including acts and practices with respect to certain aspectsdata privacy and security. If our public statements about our use, collection, disclosure and other processing of personal information are alleged to be deceptive, unfair or misrepresentative of our actual practices, we may be subject to potential government or legal investigation or action. If we are found to have violated applicable laws or regulations, we may also be subject to penalties, fines, damages, injunctions or other outcomes that may adversely affect our operations and financial results. The United States Congress also has considered, and may in the future consider, various proposals from time to time for comprehensive federal data protection law remains unclear, for example around how data can lawfully be transferred between each jurisdiction,privacy legislation to which exposes uswe may become subject if passed and which may adversely affect our operations and financial results.
At the state level, we are subject to further compliance risk.
Thelaws and regulations like the California Consumer Privacy Act (CCPA) became effective January 1, 2020.and the California Privacy Rights Act (CPRA). The CCPA creates newand CPRA create transparency requirements for companies, and grantsgrant California residents several newvarious rights with regard to their personal information.information, and impose additional data protection obligations on companies doing business in California. Failure to comply with the CCPA and CPRA may result in, among other things, significant civil penalties and injunctive relief, or potential statutory or actual damages. In addition, California voters recently approved the California Privacy Rights Act (CPRA) which modifies theThe CCPA and will impose additionalCPRA also provide a private right of action for data protection obligations on companies doing businessbreaches that result in California, including granting additional privacy rights to consumersthe loss of personal information. The CCPA and creating a new state privacy regulator. While the CPRA will not take effect until January 2023, it may impact our business activities and require compliance costs that adversely affect business, operating results, prospects and financial condition.
We have made changes These state statutes, and other similar state or federal laws that may be enacted in the future may require us to and investments in,modify our businessdata processing practices and will continue to monitor developmentspolicies, incur substantial compliance-related costs and make appropriate changes to help attain compliance with these evolvingexpenses, and complex regulations. otherwise suffer adverse impacts on our business.
Additionally, while collecting research products from donors, we may collect, use, disclose, maintain and transmit donor information in ways that will be subject to many of the numerous state, federal and international laws and regulations governing the collection, use, disclosure, storage, transmission or confidentiality of patient-identifiable health information. Failure
We have made changes to, and investments in, our business practices and will continue to monitor developments and make appropriate changes to help attain compliance with these evolving and complex laws, rules, regulations and standards. Any actual or perceived failure to comply with theseany such laws, andrules, regulations, standards or contractual obligations could subject us to denial of the right to conduct business, significant fines, civil or criminal penalties, and/costly litigation (including class actions), government investigation or inquiries, enforcement actions, claims, proceedings, judgements, awards, penalties, sanctions or other enforcement actionsadverse impacts that could have a material adverse effect on our business.
Failure to comply with U.S., state, local or international environmental, health and safety laws and regulations, including regulations issued by the Occupational Safety and Health Administration, Environmental Protection Agency, Nuclear Regulatory Agency and Department of Transportation, could result in fines and penalties and loss of licensure, and have a material adverse effect upon the Company’s business.
We are subject to licensing and regulation under laws and regulations relating to the protection of the environment and human health and safety, including laws and regulations relating to the handling, transportation and disposal of medical specimens, infectious and hazardous waste and radioactive materials, as well as regulations relating to the safety and health of laboratory employees and protecting employees from the spread of COVID-19. Failure to comply with these laws and regulations could subject us to denial of the right to conduct business, fines, criminal penalties and/or other enforcement actions that could have a material adverse effect on our business. Other environmental laws may have similar consequences to us or our supplier, or
CHARLES RIVER LABORATORIES INTERNATIONAL, INC.
result in liability to us. In addition, compliance with future legislation could impose additional requirements on us that may be costly.
Changes in U.S. and International Tax Law, results of tax audits, or material changes in our stock price could have a material adverse impact on our effective tax rate.rate and financial results.
In 2017, significant U.S.As a global company, we are subject to taxation in numerous countries, states, and other jurisdictions. Changes to governmental laws and regulations, or their interpretations, including the adoption of global minimum taxation requirements and potential changes to existing tax law changes fromby the Tax Cutscurrent U.S. Presidential administration and Jobs Act of 2017 (U.S. Tax Reform) went into effect and reduced the U.S. federal statutory tax rate, broadened the corporate tax base through the elimination or reduction of deductions, exclusions and credits, limited the ability of U.S. corporations to deduct interest expense and allowed for the repatriation of foreign earnings to the U.S. with a 100% federal dividends received deduction prospectively. In addition, U.S. Tax Reform required a one-time transitional tax on foreign cash equivalents and previously unremitted earnings. There remain certain provisions enacted as part of U.S. Tax Reform which still require clarification and guidance from the Internal Revenue Service (IRS) and Treasury Department. These or other changes in US. tax lawsCongress, could impact our profits, effective tax rate and cash flows.
Additionally, the OECD, the European Commission (EC) and individual taxing jurisdictions have recently focused on issues related to the taxation of multinational corporations. The OECD released its comprehensive plan to create an agreed set of rules to address concerns regarding base erosion and profit shifting (BEPS). This initiative resulted in proposed and enacted changes to tax laws in various countries including France, Germany, Luxembourg, Netherlands and the U.K. In addition, the OECD and EC and individual countries are examining how taxing rights should be allocated among countries considering the digital economy. Future changes to tax laws or interpretation of tax laws resulting from enacted laws could increase our effective tax rate, which would affect our profitability.
We receive substantial tax credits and incentives in Canada, from both the Canadian federal and Quebec governments, China, France, the U.K., and the U.K.U.S. Any reduction in the availability or amount of these tax credits or increase to tax rates due to tax law changesand incentives or outcomes of tax controversies associated with these credits, could have a material adverse effect on our profits, cash flows and effective tax rate. Additionally, we are subject to regular audits with respect to various tax returns and processes in the jurisdictions in which we operate. Errors or omissions in tax returns, process failures, increase to tax rates or differences in interpretation of tax laws by tax authorities may lead to litigation, payments of additional taxes, penalties, and interest.
Further,We are subject to regular review and audit by both domestic and foreign tax authorities. As a result, we generallyhave received, and may in the future receive, assessments in multiple jurisdictions, on various tax-related assertions. Any adverse outcome of such a review or audit could harm our financial condition and operating results, require adverse changes to our business practices, or subject us to additional litigation and regulatory inquiries. In addition, the determination of our worldwide provision for income taxes and other tax deduction uponliabilities requires significant judgment and often involves uncertainty. Although we believe our estimates are reasonable, the exercise of non-qualified stock optionsultimate tax outcome may differ from the amounts recorded in our financial statements and may affect our financial results in the period or periods for which such determination is made.
Our tax expense and liabilities are affected by employees, or the vesting of restricted stockcertain factors, such as changes in our business operations, acquisitions, investments, entry into new businesses and performance share units held by employees. Thegeographies, intercompany transactions, changes in foreign currency exchange rates, changes in our stock price, timingchanges to our forecasts of income and amountloss and the mix of the vestingjurisdictions to which they relate, and exercising of share-based compensation could adversely impactchanges in our effective tax rate.assets and liabilities and their valuation.
ContractNon-clinical contract research services create a risk of liability.
As a CRO,global drug development partner, we face a range of potential liabilities, which may include:
•risks associated with errors or omissions in reporting of study detail in non-clinical studies that may lead to inaccurate reports, which may undermine the usefulness of a study or data from the study, or which may potentially advance studies absent the necessary support or inhibit studies from proceeding to the next level of testing;
•risks associated with our possible failure to properly care for our clients’ property, such as research models and samples, study compounds, records, work in progress, other archived materials or goods and materials in transit, while in our possession;
•risks that models in our breeding facilities or in facilities that we manage may be infected with diseases that may be harmful and even lethal to them or humans, despite preventive measures for the quarantine and handling of imported animals;
•risks that we may have errors and omissions and/or product liabilities related to our products designed to conduct lot release testing of medical devices, injectable drugs, food, beverages, and home and beauty products (primarily through our Microbial Solutions business), or in the testing of biologics and other services performed by our Biologics Solutions business, which could result in us or our clients failing to identify unsafe or contaminated materials; and
•risk of transmitting dangerous infectious diseases, as a result of the failure of our screening and testing processes, or new pathogens that may be undetected by such processes.processes; and
•recent acquisitions have expanded our business into the CDMO market, which entails additional risks of liability, including potential product liability claims, errors and omissions claims in connection with our services and potential liability under indemnification agreements between us and our officers and directors.
While we attempt to mitigate these risks through a variety of methods, it is impossible to completely eradicate such risks. In our RMS business, we mitigate these risks to the best of our abilities through our regimen of animal testing, quarantine procedures and veterinary staff vigilance, through which we seek to control the exposure of animal related disease or infections. In our Cell Solutions, DSA, and Manufacturing businesses, we attempt to reduce these risks bythrough the negotiation of contractual risk transfer provisions, entitling us to be indemnified by our clients and subject to a limitationsuch as indemnification provisions, limitations of liability, byand client insurance maintained by our clients and/or by us and by various regulatory requirements we must follow in connection with our business.requirements.
Contractual risk transfer indemnifications generally do not protect us against liability arising from certain of our own actions, such as negligence or misconduct. We could be materially and adversely affected if we are required to pay damages or bear the costs of defending any claim that is outside any contractual indemnification provision, or if a party does not fulfill its indemnification obligations or the damage is beyond the scope or level of insurance coverage. We also often contractually indemnify our clients (subject to a limitation of liability), similar to the way they indemnify us, and we may be materially adversely affected if we have to fulfill our indemnity obligations. Furthermore, either we or a party required to indemnify us may not be able to maintain such insurance coverage (either at all or on terms acceptable to us).
The failure to successfully obtain, maintain and enforce intellectual property rights and defend against challengesassertions of third-parties to our intellectual property rights could adversely affect us.
Many of our services, products and processes rely on intellectual property. In some cases, that intellectual property is owned by another party and licensed to us, sometimes exclusively. To protect our intellectual property rights, we primarily rely upon trade secret, patent, and copyright law, confidentiality agreementsas well as contractual provisions relating to intellectual property ownership and policies, invention assignmentscontrol and other contractual arrangements, along with patent, copyrightconfidentiality. Laws relating to intellectual property rights and trademark laws. Existing laws of certain countries outside of the United States in which we operate offer only limited protection,contracts vary from country to country and these are subject to change at any time. In addition, the agreements upon which we rely to protect our intellectual property might be breached, or might not be fully enforceable. Our intellectual property rights might not prevent our competitors from independently developing intellectual property that is similar to or duplicative of ours. Also, enforcingenforcement of our intellectual property rights mightmay also require substantial investments of time, money, and oversight, and we mightmay not be successfulresult in enforcing our rights.success. If we are unable to obtain orsecure and maintain the proprietary rights to our intellectual property rights, or if we are unable to prevent attemptedmisappropriation or infringement, against our intellectual property, or if we are unable to defend against claims that we are infringing on another party’s intellectual property, webusiness could be adversely affected. These adverse effects could include us having
Furthermore, we respect third-party intellectual property rights, and make efforts to abandon, alter or delay the deployment of products, services or processes that rely on suchavoid violating valid and enforceable intellectual property; havingproperty rights, and seek to procure and pay for licenses from the holders of intellectual property rights that we seek to use;use.In some cases, we are asked to utilize components and havingprocesses that are provided to pay damages, fines, court costs and attorney's fees in connection withus by our clients.
Customers of our CDMO business, for example, may utilize intellectual property litigation.for the production of their products, the manufacture of which has been contracted to us. Failure by us and/or our customers to secure and maintain rights to third-party intellectual property rights could have a material adverse effect, including reduced revenue as a result in a delay or cancellation of the manufacture of products and involvement in judicial and administrative proceedings in which we are named as a party.
Further, the drug discovery, drug development, and developmentdrug manufacturing industry has a history of patent and other intellectual property litigation and these lawsuits will likely continue. Legal proceedings relatingThis may be exacerbated by the increased use of cell-based and new alternative model methods not involving animal models, which may supplement and/or replace or supplant the use of traditional living animal models in biomedical research. Refer to intellectual property are“Risk Factors – New technologies may be developed, validated and increasingly used in biomedical research, which could reduce demand for some of our products and services.” herein for our assessment of certain other relevant risk factors on this topic. Litigation can be expensive, take significant time consuming, and can divert management’s attention from other business concerns, whether we win or lose.concerns. If we do not prevail in an infringement lawsuit brought against us, we may havebe compelled by a court to pay substantial damages, including treble damages, and we could be requiredordered to stop the infringingchallenged activity, or obtain a license to use technology on unnegotiated and/or unfavorable terms.
The decision by British voters to exit the European Union may adversely affect our business.
The first stage of the U.K.’s withdrawal from the European Union (“Brexit”) took place on January 31, 2020, when the U.K. left the European Union and entered a transition phase. During the transition phase, the U.K. engaged in negotiations with the European Union on the terms of its future trading and other relationships with the European Union. The scope and timing of these negotiations created significant uncertainty. The timing of the agreement reached between the U.K. and the European Union at the end of 2020 continues that uncertainty and, given the need to understand the implications of the agreement and the formalities required in respect of the U.K.’s future relationship with the European Union, we have formed a committee (comprised of senior managers across our business functions) to address key risks among four main themes: (1) trade and customs, (2) employees and immigration, (3) strategy and business planning and (4) legislative changes. That committee will continue until the situation is clarified.
Notwithstanding the agreement reached the movement of goods between the U.K. and the remaining member states of the European Union will be subject to additional inspections and documentation checks, leading to possible delays at ports of entry and departure and additional VAT requirements. These changes to the trading relationship between the U.K and European Union would likely result in increased cost of goods imported into and exported from the U.K. and may decrease the profitability of our U.K. and other operations. Additional currency volatility could drive a weaker British pound, which increases the cost of goods imported into our U.K. operations and may decrease the profitability of our U.K. operations. A weaker British pound versus the U.S. dollar also causes local currency results of our U.K. operations to be translated into fewer U.S. dollars during a reporting period. Although we are undertaking efforts to mitigate those risks within our control, a failure to adequately mitigate such risks or other factors outside our control could adversely affect our business, business opportunities, results of operations, financial condition and cash flows.”
Our by-laws designate the state courts located in the State of Delaware as the sole and exclusive forum for certain actions, including derivative actions, which could limit a stockholder’s ability to bring a claim in a judicial forum that it finds
favorable for disputes with the Company and its directors, officers, other employees, or the Company's stockholders and may discourage lawsuits with respect to such claims.
Unless we consent in writing to the selection of an alternative forum, the sole and exclusive forum for (i)(1) any derivative action or proceeding brought on behalf of the Company, (ii)(2) any action asserting a claim of breach of a fiduciary duty owed by any director, officer or other employee of the Company to the Company or the Company’s stockholders, (iii)(3) any action asserting a claim arising pursuant to any provision of the Delaware General Corporation Law or the Company’s certificate of incorporation or the Company’s by-laws (in each case, as they may be amended from time to time), or (iv)(4) any action asserting a claim governed by the internal affairs doctrine shall be a state court located within the state of Delaware (or, if no state court located within the State of Delaware has jurisdiction, the federal district court for the District of Delaware). However, this exclusive forum provision will not apply to suits brought under the federal securities laws for which the federal courts have exclusive jurisdiction. If a court were to find the choice of forum provision contained in our by-laws to be inapplicable or unenforceable in an action, we may incur additional costs associated with resolving such action in other jurisdictions, which could harm our business and financial condition. Furthermore, although we believe the exclusive forum provision benefits us by providing increased consistency in the application of Delaware law for the specified types of actions and proceedings, this provision may limit a stockholder’s ability to bring a claim in a judicial forum that it finds favorable for disputes with the Company and its directors, officers, or other employees and may discourage lawsuits with respect to such claims.
CHARLES RIVER LABORATORIES INTERNATIONAL, INC.
We are involved in legal proceedings that could adversely affect our business, financial condition, and results of operations.
We are involved in legal proceedings related to various matters, including securities litigation, and may become involved in other legal proceedings that arise from time to time in the future. For example, as discussed further in Part I, Item 3, Legal Proceedings, a putative securities class action and derivative securities lawsuit have been filed against the Company, and certain officers and directors, alleging that disclosures about the Company’s practices with respect to the importation of non-human primates were materially false or misleading.
Any claims against us, whether meritorious or not, can be time-consuming, result in costly litigation, be harmful to our reputation, require significant management attention, and divert significant resources. In addition, the expense of litigation and the timing of this expense from period to period are difficult to estimate and subject to change. Litigation and other claims are subject to inherent uncertainties and management’s view of these matters may change in the future. Given the uncertain nature of legal proceedings generally, we are not able in all cases to estimate the amount or range of loss that could result from an unfavorable outcome. We could incur judgments or enter into settlements of claims that could have a material adverse effect on our results of operations in any particular period.
Labor &and Employment Risk Factors
We depend on key personnel and may not be able to retain these employees, which wouldcould harm our business.
Our success depends to a significant extent on the continued services of our senior management and other members of management.management who have skills and industry experience aligned with our strategic objectives. James C. Foster, our Chief Executive Officer and President since 1992 and Chairman since 2000, has held various positions with us for four decades. While we entered into an amended employment agreement with Mr. Foster in 2018,2021, most members of our senior management do not have employment agreements, except in jurisdictions outside of the United States where employment contracts are common for most employees. If Mr. Foster or other members of senior management do not continue in their present positions, our business may be adversely impacted.
If we are unable to attract, hire or retain key team members or a highly skilled and diverse global workforce, it could have a negative impact on our business, financial condition or results of operationsoperations.
Because of the specialized scientific nature of our business, we are highly dependent upon attracting and retaining qualified scientific, technical and managerial personnel. While wepersonnel, while also ensuring an inclusive and diverse culture. We have a strong record of employee retention, and we strive to reduce the impact of the potential loss of existing employees by having an established organizational talent review process that identifies successors and potential talent needs,needs. However, there is still significant competition for qualified personnel in the veterinary, pharmaceutical and biotechnology fields. Therefore, we may not be ableFailure to attract and retain the qualified personnel necessary for the development of our business. The loss of the services of existing personnel as well as the failure toand recruit additional key scientific, technical, and managerial personnel in a timely manner, could harm our business.
We depend on the availability of, and good relations with, our team members.
Our employees are not unionized in the U.S. Employeesand employees at some of our European facilities are represented by works councils, collective bargaining agreements, employee representative groups and/or unions, which is consistent with local customs for our industry. Our operations depend on the availability and relative costs of labor and maintaining good relations with employees.employees, which includes supporting their overall wellbeing. If we fail to maintain good relations with our team members or with the labor organizations, we may experience labor strikes or work stoppages, which could adversely affect our financial results.
We acknowledge a specific risk associated with periodic reductions in our workforce. As part of our strategic and operational management, we, from time to time, undertake workforce reductions to align with evolving business trends, market dynamics, or operational efficiency goals. Such actions result in incremental severance and benefits costs and replacing lost talent in the future may result in higher costs, all of which could adversely affect our financial results.
Financial and Accounting Risk Factors
Our debt level could adversely affect our business and growth prospects.
As of December 26, 2020,30, 2023, we had $2.0$2.6 billion of debt and finance leases (debt). In connection with our intended acquisition of Cognate BioServices, Inc., we anticipate increasing our debt to finance a substantial portion of the purchase price of approximately $875 million in cash. Our debt could have significant adverse effects on our business, including making it more difficult for us to obtain additional financing on favorable terms; requiring us to dedicate a substantial portion of our cash flows from operations to the repayment of debt and the interest on this debt; limiting our ability to capitalize on significant business opportunities; and making us more vulnerable to rising interest rates.rates, and reducing our flexibility to respond to changing business and economic conditions. Disruption in the financial market could also have a material adverse effect on our financial position, results of operations and liquidity. For additional information regarding our debt, please see Note 9, “Long-Term Debt and Finance Lease Obligations”, included in the notes to our consolidated financial statements included elsewhere in this Form 10-K.
The interest rate on our credit facility (Credit Facility), which matures in fiscal year 2023, is linked to LIBOR. As of December 26, 2020, amounts outstanding on our Credit Facility were $146.9 million on our term loan and $814.8 million on our revolving credit facility, for which there is an aggregate available borrowing capacity of $2.05 billion. In 2017, the Financial Conduct
Authority (FCA) in the U.K. announced that it would phase out LIBOR as a benchmark by the end of 2021. It is unclear whether new methods of calculating LIBOR will be established such that it continues to exist after 2021, or whether different benchmark rates used to price indebtedness will develop. If LIBOR ceases to exist, the method and rate used to calculate our interest rates and/or payments on our debt in the future may result in interest rates and/or payments that are higher than, or that do not otherwise correlate over time with, the interest rates and/or payments that would have been applicable to our obligations if LIBOR was available in its current form, which could have a material adverse effect on our financial position, results of operations and liquidity. While we continue to take steps to mitigate the impact of the phase-out or replacement of LIBOR, such efforts may not prove successful. In addition, the overall financial market may be disrupted as a result of the phase-out or replacement of LIBOR. Disruption in the financial market could also have a material adverse effect on our financial position, results of operations and liquidity.
Impairment of long lived tangible assets and intangible assets (such as goodwill orand other intangible assetsassets) may adversely impact future results of operations.
We have intangible assets, including goodwill, on our balance sheet due to our acquisitions of businesses. The initial identification and valuation of these intangible assets and the determination of the estimated useful lives at the time of acquisition involve use of management judgments and estimates. These estimates are based on, among other factors, projections of cash flows that arise from identifiable intangible assets of acquired businesses and discount rates based on an analysis of our weighted average cost of capital, adjusted for specific risks associated with the assets. Disruptions in global financial markets and deterioration of economic conditions (including as a result of the COVID-19 pandemic and the impact of measures intended to reduce the spread of COVID-19) could, among other things, impact the discount rate. Other assumptions used in the valuations and actual cash flows arising from a particular intangible asset could vary from projected cash flows, which could imply different carrying values from those established at the dates of acquisition and which could result in impairment of such assets.
If the future growth and operating results of our business are not as strong as anticipated, overall macroeconomic or industry conditions deteriorate and/or our market capitalization declines, this could impact the assumptions used in establishing the carrying value of goodwill or other intangible assets, as well as long-lived tangible assets, such as property, plant and equipment and operating lease right-of-use assets. Should disruption in the COVID-19 pandemicglobal financial markets and deterioration of economic conditions have a prolonged impact on our industry, triggering events may arise resulting in long-lived tangible asset, intangible asset, or goodwill impairments. To the extent goodwilllong-lived tangible assets, intangible assets, or other intangible assetsgoodwill are impaired, their carrying value will be written down to their implied fair values and a charge will be made to our income from continuing operations.net income. Such an impairment charge could materially and adversely affect our operating results. As of December 26, 2020,30, 2023, the carrying amount of goodwill and other intangibles on our consolidated balance sheet was $2.6 billion.$4.0 billion, property, plant and equipment was $1.6 billion, and operating lease right-of-use assets was $394.0 million.
General Risk Factors
Since we do not expect to pay any cash dividends for the foreseeable future, our shareholders will benefit from an investment in our common stock only if it appreciates in value.
We have not declared or paid any cash dividends on our common stock, and do not anticipate that we will pay any dividends to holders of our common stock for the foreseeable future. Any payment of cash dividends will be at the discretion of our Board of Directors and will depend on our financial condition, capital requirements, legal requirements, earnings and other factors. Consequently, our shareholders should not rely on dividends to receive a return on their investment.
Our quarterly operating results may vary, which could negatively affect the market price of our common stock.
Our results of operations in any quarter may vary from quarter to quarter and are influenced by the risks discussed above, as well as: changes in the general global economy; changes in the mix of our products and services; cyclical buying patterns of our clients; the financial performance of our strategic and venture capital investments; certain acquisition-related adjustments, including change in fair value of contingent payments both receivable from or payable to counterparties; and the occasional extra week (“53rd week”) that we recognize in a fiscal year (and fourth fiscal quarter thereof), including 2022, due to our fiscal year ending on the last Saturday in December. We believe that operating results for any particular
quarter are not necessarily a meaningful indication of future results. Nonetheless, fluctuations in our quarterly operating results could negatively affect the market price of our common stock.
Increasing focus on environmental, social and governance (ESG) matters, including climate-related issues, may impact our business, financial results or stock price.
There has been increasing public focus by investors, clients, environmental activists, the media and governmental and nongovernmental organizations on a variety of ESG matters. If we are not effective in addressing ESG matters affecting our business, or setting and meeting relevant sustainability and climate-related goals, including our approved greenhouse gas emissions reduction targets, which have been approved by the Science Based Targets Initiative, our reputation and financial results may suffer. We may experience increased costs in order to execute upon our sustainability goals and measure achievement of those goals, which could have an adverse impact on our business and financial condition. Heightened stakeholder focus on ESG matters related to our business requires the continuous monitoring of various and evolving laws, regulations, standards and expectations and the associated reporting requirements. A failure to adequately meet stakeholder expectations may result in noncompliance, the loss of business, reputational impacts, diluted market valuation, an inability to attract clients and an inability to attract and retain top talent. A failure to comply with new laws, regulations, or reporting requirements, could negatively impact our reputation and our business. In addition, our adoption of certain standards or mandated compliance to certain requirements could necessitate additional investments that could impact our profitability.
CHARLES RIVER LABORATORIES INTERNATIONAL, INC.
Item 1B. Unresolved Staff Comments
There are no unresolved comments to be reported in response to Item 1B.
Item 1C. Cybersecurity
Cybersecurity Risk Management and Strategy
Charles River places high importance on identifying and eliminating potential cybersecurity threats to its employees, customers, IT infrastructure, proprietary technologies and confidential information.
Our cybersecurity risk management is based on recognized industry governance frameworks, including the International Organization for Standardization (ISO), the National Institute of Standards and Technology (NIST), the Center for Internet Security Controls (CIS), and the Cloud Security Alliance (CSA). We use these frameworks together with information collected from internal and 3rd party assessments to develop policies such as our technology acceptable use policy for information assets, our access requirements for data, systems, or technologies, and policies for the protection and use of personal information of our employees and customers. We protect our IT assets through industry-standard techniques such as multifactor authentication, malware defenses, network and endpoint monitoring, and access review processes. We also work with our business units to leverage and implement foundational cybersecurity principles, such as security by design, defense-in-depth, least privilege, and resilience-focused backups, throughout our organization. We deliver cybersecurity awareness and confidential information protection training to our employees, and we send our employees ethical simulated phishing and spear-phishing emails to test their compliance with our policies.
We engage third parties to conduct annual penetration testing, and we use external risk assessors to measure our program to industry standard frameworks. Our information security management system is certified to the ISO/IEC 27001:2013 standard by the British Standards Institution (BSI); certificate IS 780367. We also collaborate with experts and industry partners to exchange information about threats, best practices, and trends.
Our cybersecurity risk management extends to risks associated with our use of third-party service and technology providers as well as partnerships with third parties we may enter into. For instance, we conduct risk and compliance assessments of third parties that request access to our IT resources and information or who provide technology products to Charles River.
Our cybersecurity risk management is an important part of our comprehensive business continuity program and enterprise risk management. Our global information security team periodically engages with a cross-functional group of Charles River subject-matter experts and leaders to assess and refine Charles River’s cybersecurity risk posture and preparedness. For example, we regularly evaluate and update contingency strategies for our business in the event that a portion of our IT systems were to be unavailable due to a cybersecurity incident. We practice our response to potential cybersecurity incidents through regular tabletop exercises. We also perform threat hunting and red team exercises.
Through these processes, during our fiscal year 2023 and through the date of this filing we did not identify risks from cybersecurity threats, including as a result of any previous cybersecurity incidents, that have materially affected, or are reasonably likely to materially affect, our business strategy, results of operations, or financial condition. However, despite our efforts, we cannot eliminate all risks from cybersecurity threats, or provide assurances that we have not experienced an undetected cybersecurity incident. For more information about these risks, please see the section titled “Item 1A. Risk Factors – Business and Operational Risk Factors - We have in the past experienced and in the future could experience unauthorized access into our information systems.”
Governance of Cybersecurity Risk Management
Our board of directors, as a whole, has oversight responsibility for Charles River’s strategic and operational risks. The Audit Committee of the Board of Directors has been delegated by the Board responsibility by reviewing and discussing Charles River’s risk assessment and risk management practices, including cybersecurity risks, with members of management. The Audit Committee, in turn, periodically discusses its review and assessment with the board of directors.
Our management team is responsible for day-to-day assessment and management of cybersecurity risks. On our management team, our Chief Information Officer has primary oversight of material risks from cybersecurity threats. The Chief Information Officer is Charles River’s Senior Vice President responsible for the Global Technology organization and for information protection at Charles River. The Chief Information Officer has more than 25 years of experience in the field, including serving as the Senior Vice President of Charles River’s Digital Transformation organization, leading the development and implementation of information technology strategies and roadmaps for digital and automation solutions.
Our Chief Information Security Officer reports to our Chief Information Officer. Our Chief Information Security Officer has more than 25 years of experience working in information technology-related roles, of which 10 years has been in information security leadership, and holds degrees in bio-medical engineering and computer science.
CHARLES RIVER LABORATORIES INTERNATIONAL, INC.
Our Chief Information Officer and Chief Information Security Officer assess our cybersecurity readiness through internal assessment tools as well as third-party control tests, vulnerability assessments, audits, and evaluation against industry standards. We have governance and compliance structures that are designed to elevate issues relating to cybersecurity to our Chief Information Officer and Chief Information Security Officer, such as potential threats or vulnerabilities. We also employ various defensive and monitoring techniques based on industry frameworks and cybersecurity standards.
Our Chief Information Officer and our Chief Information Security Officer meet annually with the full Board, and periodically, but generally at least quarterly, with the Chief Executive Officer, Chief Operations Officer, and Audit Committee to review the company’s information technology systems and discuss key cybersecurity risks. Our Chief Information Security Officer has direct access to the Chair of our Audit Committee and keeps the Audit Committee apprised of any developments that may emerge in between regularly scheduled meetings that require its attention. Additionally, our Incident Response Plan includes escalation protocols to raise occurrences that require attention from the Audit Committee or the board of directors as a whole.
Item 2. Properties
WeApproximately 60% of our real estate portfolio (by area) is owned including all facilities over 200,000 square feet. The remaining facilities are owned or covered by either land or facility leases. Within the DSA business, we own or lease the land and buildings where we have facilities. We own large facilities (facilities over(greater than 50,000 square feet) for our DSA businesses in Canada, China, France, Hungary, Netherlands, Scotland and9 countries including the U.S., Canada, Scotland, France, China, Netherlands, and lease large facilities in England and the U.S.Hungary. We own large RMS facilities in Canada, France, Germany, Italy, Japan, England and the U.S with additional large facilities leased in China and the U.S. We lease
Manufacturing is supported in over 10 countries with large, RMS facilities in China. We own large Manufacturing facilitiesowned properties in the U.S., Ireland, and China. We lease large ManufacturingChina which are supplemented by additional leased facilities in the U.S., England, France, and the U.S.Germany. None of our leases is individually material to our business operations.
Many of our leases have an option to renew and we believe that we will be able to successfully renew expiring leases on terms satisfactory to us. We believe that our facilities interms. In each of our reportable segments, we believe that our facilities are adequate for our operations and that suitable additional space will be available when needed. For additional information, see Note 16, “Leases”17. Leases included in Item 8, “Financial Statements and Supplementary Data” in this Form 10-K.
We track room utilization on an ongoing basis and, depending on the needs of our clients at given times, we may need to execute on contingency plans for expansion, which average between sixnine and fifteentwenty-four months to complete.
WeSpecific sites may also expand at specific sites in orderbe expanded to accommodate needsthe business requirements resulting from anya targeted consolidation strategy.plan. We continue to employ a master site planning strategy to proactively evaluate our real estate needs. Sites and leases added to the portfolio by way of acquisition are integrated into our overall real estate strategy. In certain circumstances, we dispose of or consolidate operations, which could result in impairment charges. In situations where the associated real estate is leased, and depending on the resolution of these situations, we may be encumbered with the remaining real estate lease obligations. In certain circumstances, we dispose of or consolidate operations, which could result in impairment charges.
Item 3. Legal Proceedings
On February 16, 2023, the Company was informed by the U.S. Department of Justice (DOJ) that in conjunction with the U.S. Fish and Wildlife Service (USFWS), it had commenced an investigation into the Company’s conduct regarding several shipments of non-human primates from Cambodia. On February 17, 2023 the Company received a grand jury subpoena requesting certain documents related to such investigation. The Company is aware of a parallel civil investigation being undertaken by the DOJ and USFWS. The Company is cooperating with the DOJ and the USFWS and believes that the concerns raised with respect to the Company’s conduct are without merit. The Company maintains a global supplier onboarding and oversight program incorporating risk-based due diligence, auditing, and monitoring practices to help ensure the quality of our supplier relationships and compliance with applicable U.S. and international laws and regulations, and has operated under the belief that all shipments of non-human primates it received satisfied the material requirements, documentation and related processes and procedures of the Convention on International Trade in Endangered Species of Wild Fauna and Flora (CITES) documentation and related processes and procedures, which guides the release of each import by USFWS. Notwithstanding our efforts and good-faith belief, in connection with the civil investigation, the Company has voluntarily suspended future shipments of non-human primates from Cambodia to the United States until such time that the Company and USFWS can agree upon and implement additional procedures to reasonably ensure that non-human primates imported from Cambodia are purpose-bred. The Company continues to care for the Cambodia-sourced non-human primates from certain recent shipments in the United States. The carrying value of the inventory related to these shipments is approximately $27 million as of December 30, 2023, which reflects the value of the shipments in accordance with the Company’s inventory accounting policy. On May 16, 2023, the Company received an inquiry from the Enforcement Division of the U.S. Securities and Exchange Commission (SEC) requesting it to voluntarily provide information, subsequently augmented with a document subpoena, primarily related to the sourcing of non-human primates, and the Company is cooperating with the request. We are not partyable to predict what action, if any, legal proceedingsmight be taken in the future by the DOJ, USFWS, SEC or other governmental authorities as a result of the investigations. None of the DOJ, USFWS or SEC has provided the Company with any specific timeline or indication as to when these investigations or, specific to the DOJ and USFWS, discussions regarding future processes and procedures, will be concluded or
CHARLES RIVER LABORATORIES INTERNATIONAL, INC.
resolved. The Company cannot predict the timing, outcome or possible impact of the investigations, including without limitation any potential fines, penalties or liabilities.
A putative securities class action was filed on May 19, 2023 against the Company and a number of its current/former officersin the United States District Court for the District of Massachusetts. On August 31, 2023, the court appointed the State Teachers Retirement System of Ohio as lead plaintiff. An amended complaint was filed on November 14, 2023 that, are materialamong other things, included only James Foster, the Chief Executive Officer and David R. Smith, the former Chief Financial Officer as defendants along with the Company. The amended complaint asserts claims under §§ 10(b) and 20(a) of the Securities Exchange Act of 1934 (the Exchange Act) on behalf of a putative class of purchasers of Company securities from May 5, 2020 through February 21, 2023, alleging that certain of the Company’s disclosures about its practices with respect to our businessthe importation of non-human primates made during the putative class period were materially false or financial condition.misleading. The Company filed a motion to dismiss. While the Company cannot predict the outcome of this matter, it believes the class action to be without merit and plans to vigorously defend against it. The Company cannot reasonably estimate the maximum potential exposure or the range of possible loss in association with this matter.
On November 8, 2023, a stockholder filed a derivative lawsuit in the U.S. District Court of the District of Delaware asserting claims on the Company’s behalf against the members of the Company’s Board of Directors and certain of the Company’s current/former officers (James Foster, the Chief Executive Officer; David R. Smith, the former Chief Financial Officer; and Flavia Pease, the current Chief Financial Officer). The complaint alleges that the defendants breached their fiduciary duties to the Company and its stockholders because certain of the Company’s disclosures about its practices with respect to the importation of non-human primates were materially false or misleading. The complaint also alleges that the defendants breached their fiduciary duties by causing the Company to fail to maintain adequate internal controls over securities disclosure and compliance with applicable law and by failing to comply with the company’s Code of Business Conduct and Ethics. The Company intends to file a motion to dismiss. While the Company cannot predict the outcome of this matter, it believes the derivative lawsuit to be without merit and plans to vigorously defend against it. The Company cannot reasonably estimate the maximum potential exposure or the range of possible loss in association with this matter.
Item 4. Mine Safety Disclosures
Not applicable.
CHARLES RIVER LABORATORIES INTERNATIONAL, INC.
PART II
Item 5. Market for Registrant’s Common Equity, Related Stockholder Matters and Issuer Purchases of Equity Securities
Our common stock began trading on the New York Stock Exchange on June 23, 2000 under the symbol “CRL.” There were no equity securities that were not registered under the Securities Act of 1933, as amended, sold during fiscal year 2020.2023.
Shareholders
As of January 22, 2021,27, 2024, there were 8467 registered shareholders of the outstanding shares of common stock.
Issuer Purchases of Equity Securities
The following table provides information relating to our purchases of shares of our common stock during the fourth quarter of fiscal 2020:2023: | | | | | | | | | | | | | | | | | | | | | | | |
| Total Number
of Shares
Purchased | | Average
Price Paid
per Share | | Total Number of
Shares Purchased
as Part of Publicly
Announced Plans
or Programs | | Approximate Dollar
Value of Shares
That May Yet Be
Purchased Under the
Plans or Programs |
| | | | | | | (in thousands) |
| October 1, 2023 to October 28, 2023 | 133 | | | $ | 195.40 | | | — | | | $ | 129,105 | |
| October 29, 2023 to November 25, 2023 | 17 | | | 167.72 | | | — | | | 129,105 | |
| November 26, 2023 to December 30, 2023 | 440 | | | 197.08 | | | — | | | 129,105 | |
| Total | 590 | | | | | — | | | |
| | | | | | | | | | | | | | | | | | | | | | | |
| Total Number
of Shares
Purchased | | Average
Price Paid
per Share | | Total Number of
Shares Purchased
as Part of Publicly
Announced Plans
or Programs | | Approximate Dollar
Value of Shares
That May Yet Be
Purchased Under the
Plans or Programs |
| | | | | | | (in thousands) |
| September 27, 2020 to October 24, 2020 | 177 | | | $ | 230.68 | | | — | | | $ | 129,105 | |
| October 25, 2020 to November 21, 2020 | 47 | | | 227.70 | | | — | | | 129,105 | |
| November 22, 2020 to December 26, 2020 | 98 | | | 235.06 | | | — | | | 129,105 | |
| Total | 322 | | | | | — | | | |
In July 2010, ourOur Board of Directors has authorized, in aggregate, a $500.0 million stock repurchase program and subsequently approved increases to the program of $250.0 million in fiscal year 2010, $250.0 million in fiscal year 2013, $150.0 million in fiscal year 2014, and $150.0 million in fiscal year 2017, for an aggregate authorization of $1.3 billion. During the fourth quarter of fiscal year 2020,2023, we did not repurchase any shares of common stock under our stock repurchase program or in open market trading. As of December 26, 2020,30, 2023, we had $129.1 million remaining on the authorized stock repurchase program.
Additionally, our stock-based compensation plans permit the netting of common stock upon vesting of restricted stock, restricted stock units, and performance share units in order to satisfy individual statutory tax withholding requirements.
Comparison of 5-Year Cumulative Total Return
The following stock performance graph compares the annual percentage change in the Company’s cumulative total shareholder return on its Common Stock during a period commencing on December 26, 201529, 2018 and ending on December 26, 202030, 2023 (as measured by dividing (1) the sum of (A) the cumulative amount of dividends for the measurement period, assuming dividend reinvestment, and (B) the difference between the Company’s share price at the end and the beginning of the measurement period; by (2) the share price at the beginning of the measurement period) with the cumulative total return of the S&P 500 Index and the S&P 500 Health Care Index during such period. The Company has not paid any dividends on the Common Stock, and no dividends are included in the representation of the Company’s performance. The stock price performance on the graph below is not necessarily indicative of future price performance. The graph is not “soliciting material,” is not deemed filed with the Securities and Exchange Commission and is not to be incorporated by reference in any filing of the Company under the Securities Act of 1933 or the Securities Exchange Act of 1934 whether made before or after the date hereof and irrespective of any general incorporation language in any such filing. Information used in the graph was obtained from Standards & Poor’s Institutional Market Services, a source believed to be reliable, but the Company is not responsible for any errors or omissions in such information.
CHARLES RIVER LABORATORIES INTERNATIONAL, INC.
COMPARISON OF 5-YEAR CUMULATIVE TOTAL RETURN
Among Charles River Laboratories International, Inc., The S&P 500 Index and
The S&P 500 Health Care Index
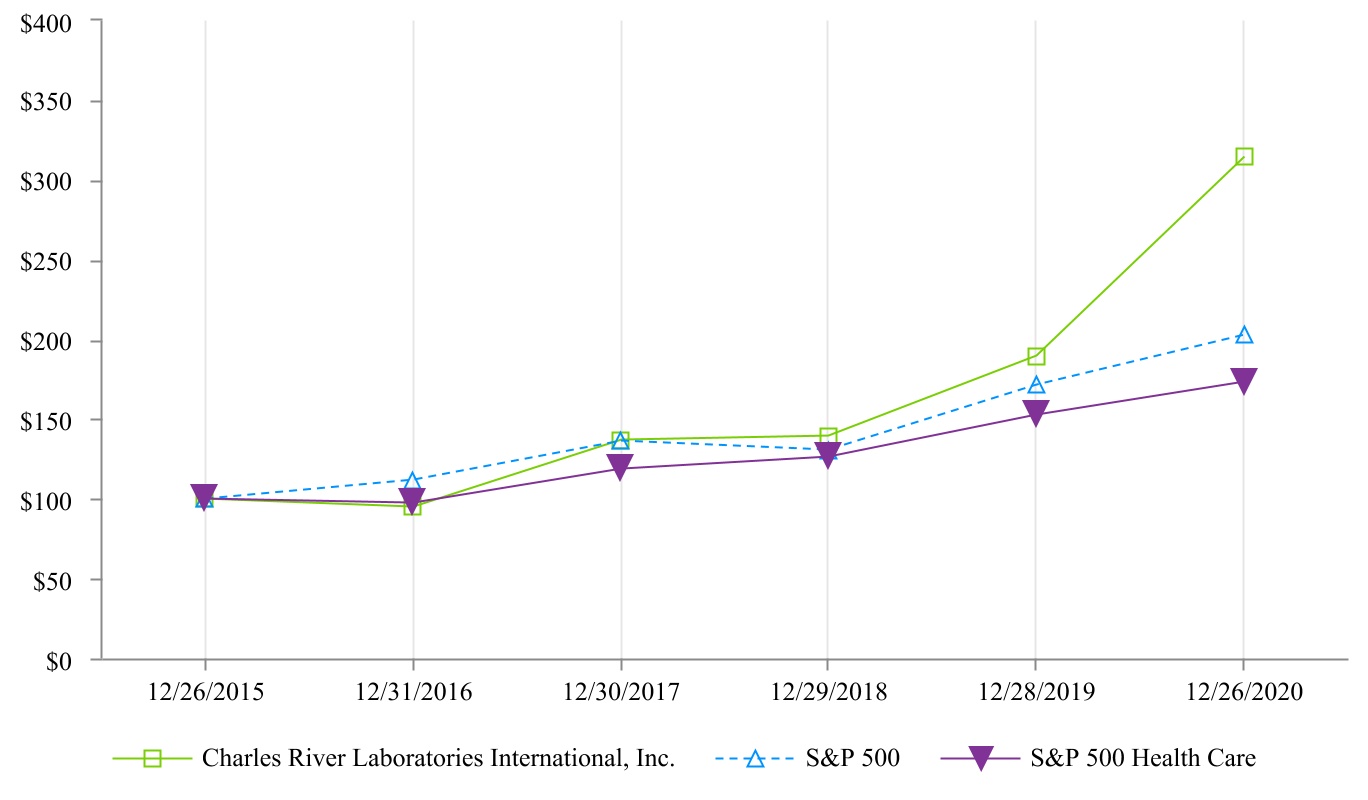

| | | | | | | | | | | | | | | | | | | | | | | | | | | | | | | | | | | |
| Fiscal Year |
| 2018 | | 2019 | | 2020 | | 2021 | | 2022 | | 2023 |
| Charles River Laboratories International, Inc. | $ | 100 | | | $ | 136 | | | $ | 225 | | | $ | 330 | | | $ | 195 | | | $ | 212 | |
| S&P 500 | 100 | | | 131 | | | 156 | | | 200 | | | 164 | | | 207 | |
| S&P 500 Health Care | 100 | | | 121 | | | 137 | | | 173 | | | 170 | | | 173 | |
| | | | | | | | | | | | | | | | | | | | | | | | | | | | | | | | | | | |
| Fiscal Year |
| 2015 | | 2016 | | 2017 | | 2018 | | 2019 | | 2020 |
| Charles River Laboratories International, Inc. | $ | 100 | | | $ | 95 | | | $ | 137 | | | $ | 140 | | | $ | 190 | | | $ | 314 | |
| S&P 500 | 100 | | | 112 | | | 136 | | | 130 | | | 171 | | | 203 | |
| S&P 500 Health Care | 100 | | | 97 | | | 119 | | | 126 | | | 153 | | | 173 | |
Not applicable.
Item 6. Selected Consolidated Financial Data
The selected financial data presented below for the fiscal years ended 2020, 2019, and 2018 and as of the fiscal years ended 2020 and 2019, is derived from our audited consolidated financial statements and should be read in conjunction with “Management’s Discussion and Analysis of Financial Condition and Results of Operations” contained in Item 7 and “Financial Statements and Supplementary Data” contained in Item 8 of this Annual Report on Form 10-K. The selected financial data presented below for the fiscal years ended 2017 and 2016 and as of the fiscal years ended 2018, 2017 and 2016, is derived from our audited consolidated financial statements within previously filed Annual Reports on Form 10-K. Our fiscal year is typically based on 52-weeks, with each quarter composed of 13 weeks ending on the last Saturday on, or closest to, March 31, June 30, September 30, and December 31. A 53rd week was included in the fourth quarter of fiscal year 2016, which is occasionally necessary to align with a December 31 calendar year-end.
| | | | | | | | | | | | | | | | | | | | | | | | | | | | | |
| | Fiscal Year |
| | 2020 | | 2019 | | 2018 | | 2017 | | 2016 |
| | (in thousands, except per share amounts) |
| Statement of Income Data | | | | | | | | | |
| Total revenue | $ | 2,923,933 | | | $ | 2,621,226 | | | $ | 2,266,096 | | | $ | 1,857,601 | | | $ | 1,681,432 | |
| Income from continuing operations, net of income taxes | 365,306 | | | 254,061 | | | 227,218 | | | 125,586 | | | 156,086 | |
| Income (loss) from discontinued operations, net of income taxes | — | | | — | | | 1,506 | | | (137) | | | 280 | |
| Common Share Data | | | | | | | | | |
| Earnings per common share from continuing operations attributable to common shareholders: | | | | | | | | | |
| Basic | $ | 7.35 | | | $ | 5.17 | | | $ | 4.69 | | | $ | 2.60 | | | $ | 3.28 | |
| Diluted | $ | 7.20 | | | $ | 5.07 | | | $ | 4.59 | | | $ | 2.54 | | | $ | 3.22 | |
| Other Data | | | | | | | | | |
| Depreciation and amortization | $ | 234,924 | | | $ | 198,095 | | | $ | 161,779 | | | $ | 131,159 | | | $ | 126,658 | |
| Capital expenditures | 166,560 | | | 140,514 | | | 140,054 | | | 82,431 | | | 55,288 | |
| Balance Sheet Data (as of period end) | | | | | | | | | |
| Cash and cash equivalents | $ | 228,424 | | | $ | 238,014 | | | $ | 195,442 | | | $ | 163,794 | | | $ | 117,626 | |
| Total assets | 5,490,831 | | | 4,692,790 | | | 3,855,879 | | | 2,929,922 | | | 2,711,800 | |
| Long-term debt, net and finance leases | 1,929,571 | | | 1,849,666 | | | 1,636,598 | | | 1,114,105 | | | 1,207,696 | |
| Redeemable noncontrolling interests | 25,499 | | | 28,647 | | | 18,525 | | | 16,609 | | | 14,659 | |
Refer to the following included in Item 8, “Financial Statements and Supplementary Data” in this Annual Report on Form 10-K as well as within previously filed Annual Reports on Form 10-K for additional information:
•Note 2, “Business Combinations” concerning the impact of our recent acquisitions, including revenue, operating income, assets acquired and liabilities assumed, and related acquisition and integration costs;
•Note 9, “Long-Term Debt and Finance Lease Obligations” concerning the impact of debt related activities in connection with our recent acquisitions;
•Note 11, “Income Taxes” concerning the impact of U.S. Tax Reform in fiscal year ended 2017; and
•Note 1, “Description of Business and Summary of Significant Accounting Policies” and Note 16, “Leases” concerning the impact of adopting Accounting Standards Codification 842, “Leases” beginning in fiscal year 2019.
Item 7. Management’s Discussion and Analysis of Financial Condition and Results of Operations
The following discussion should be read in conjunction with our consolidated financial statements and related notes appearing in Item 8, “Financial Statements and Supplementary Data” in this Annual Report on Form 10-K. TheA discussion of our results of operations for the fiscal year ended December 31, 2022 and a comparison of our results for the fiscal years ended December 31, 2022 and December 25, 2021 was included in Item 7. “Management’s Discussion and Analysis of Financial Condition and Results of Operations,” of our Annual Report on Form 10-K for the fiscal year ended December 31, 2022, filed with the SEC on February 22, 2023. In addition to historical consolidated financial information, the following discussion contains forward-looking statements. Actual results may differ significantly from those projected in the forward-looking statements. Factors that might cause future results to differ materially from those projected in the forward-looking statements include, but are not limited to, those discussed in Item 1A, “Risk Factors” and elsewhere in this Annual Report on Form 10-K. Certain percentage changes may not recalculate due to rounding.
Overview
We are a leading, full service, early-stage contract research organization (CRO).non-clinical global drug development partner. For over 7075 years, we have been in the business of providing the research models required in the research and development of new drugs, devices, and therapies. Over this time, we have built upon our original core competency of laboratory animal medicine and science (research model technologies) to develop a diverse portfolio of discovery and safety assessment services, both Good Laboratory Practice (GLP) and non-GLP, that enable us to supportsupports our clients from target identification through non-clinical development. We also provide a suite of products and services to support our clients’ manufacturing activities.activities, including our contract development and manufacturing organization (CDMO) business. Utilizing our broad portfolio of products and services enables our clients to create a more efficient and flexible drug development model, which reduces their costs, enhances their productivity and effectiveness, and increases speed to market.
Our client base includes all major global biopharmaceuticalpharmaceutical companies, many biotechnology companies, CROs,companies; agricultural and industrial chemical, companies, life science, companies, veterinary medicine, companies,medical device, diagnostic and consumer product companies; contract research and contract manufacturing companies, medical device companies, and diagnosticorganizations; and other commercial entities, as well as leading hospitals, academic institutions, and government agencies around the world. We currently operate in over 100 facilities155 sites and in over 20 countries worldwide, which numbers exclude ourcertain Insourcing Solutions (IS) sites.
Segment Reporting
Our three reportable segments are Research Models and Services (RMS), Discovery and Safety Assessment (DSA), and Manufacturing SupportSolutions (Manufacturing).
Our RMS reportable segment includes the Research Models, Research Model Services, and Research ProductsCell Solutions businesses. Research Models includes the commercial production and sale of small research models, as well as the supply of large research models. Research Model Services includes: Genetically Engineered Models and Services (GEMS), which performs contract breeding and other services associated with genetically engineered models; Research Animal Diagnostic Services (RADS), which provides health monitoring and diagnostics services related to research models; and Insourcing Solutions (IS), which provides colony management of our clients’ research operations (including recruitment, training, staffing, and management services). Research Products supplies within our clients’ facilities as well as our own vivarium space, utilizing our Charles River Accelerator and Development Lab (CRADL) option. Cell Solutions provides controlled, consistent, customized primary cells and blood components derived from normal and mobilized peripheral blood and bone marrow, and cord blood. marrow.
Our DSA reportable segment includes services required to take a drug through the early development process including discovery services, which are non-regulated services to assist clients with the identification, screening,is comprised of two businesses: Discovery Services and selection of a lead compound for drug development, andSafety Assessment. We provide regulated and non-regulated (GLPDSA services to support the research, development, and non-GLP)regulatory-required safety assessment services. testing of potential new drugs, including therapeutic discovery and optimization plus in vitro and in vivo studies, laboratory support services, and strategic non-clinical consulting and program management to support product development.
Our Manufacturing reportable segment includes Microbial Solutions, which provides in vitro (non-animal) lot-release testing products, microbial detection products, and species identification services;services and Biologics Testing ServicesSolutions (Biologics), which performs specialized testing of biologics;biologics (Biologics Testing Solutions) as well as contract development and manufacturing products and services (CDMO). In December of 2022, we sold the Avian Vaccine Services (Avian), business, reported in the Manufacturing segment, which suppliessupplied specific-pathogen-free chicken eggs and chickens.
COVID-19
Overview
On March 11, 2020, the World Health Organization declared the outbreak of a strain of novel coronavirus disease, COVID-19, a global pandemic. The COVID-19 pandemic is dynamic and expanding, and its ultimate scope, duration and effects are uncertain. This pandemic has had and may continue to result in direct and indirect adverse effects on our industry and customers, which in turn has impacted our business, results of operations, and financial condition. Further, the COVID-19 pandemic may also affect our operating and financial results in ways that are and are not presently known to us, or that we currently do not expect to present significant risks to our operations or financial results but which may in fact turn out to negatively affect us to a magnitude greater than anticipated. Refer to Item 1A, “Risk Factors”, included herein for risk factors reflecting the impact of the COVID-19 pandemic. Giving consideration to each of these risk factors, the following is our current estimate and belief of the impact of the COVID-19 pandemic during fiscal year 2020 and how it may continue to affect us in subsequent periods.
Business continuity
To date, we generally have not experienced significant challengesFiscal Quarters
Our fiscal year is typically based on 52-weeks, with each quarter composed of 13 weeks ending on the last Saturday on, or closest to, March 31, June 30, September 30, and December 31. A 53rd week in implementing our business continuity plans. Many government agencies have provided guidance permitting “essential” or “critical” business operations to remain open. Asthe fourth quarter of the date of this annual report,fiscal year is occasionally necessary to align with a December 31 calendar year-end, which occurred in fiscal year 2022.
Business Trends
In fiscal year 2023, biopharmaceutical clients reprioritized their drug development programs and were more cautious with their budgetary spending amidst the uncertainty in the geographies where business restrictions have been imposed, we believe all of our business operations have satisfied the requirements to be designated to be “essential” or “critical” according to the guidance provided by government, health and other regulatory agencies with authority over such matters. Asbroader market environment, including a result, all of our operating sites remain open and adequately staffed as of the date of this annual report. For certain operations or sites experiencing logistical delays, we have experienced some inefficiencies as it relates to completing work or fulfilling orders; however, we do not believe material expenditures will be required or material resource constraints will occur. Logistical delays include a small number of sites that have experienced reduced operations (including as a result of increased employee absenteeism) or voluntarily closed,slowdown in biotechnology funding activities, as well as delays in transportation activities.
We have comprehensive business continuity plans in placemacroeconomic challenges, including higher interest rates. The demand and pricing for each site globally and are continuously updating these to address the evolving COVID-19 pandemic situation. We implemented our initial plans in China beginning in January 2020, and have continuously refined our plans for other regions as the virus has spread. We have encouraged and expressed our expectations that employees work remotely whenever possible; and for those employees who need to come into our sites to fulfill their responsibilities, we are adhering to guidelines from government, health, and other regulatory agencies. This includes social distancing, flexible scheduling such as split shifts, restricting visitors, enhanced cleaning, and providing personal protective equipment (PPE), such as masks and gloves, to employees. Due to the nature of our business, many employees already work in biosecure environments that require PPE and adhere to other procedures to safely accomplish their daily responsibilities. Accordingly, to date, we believe we have been able to efficiently implement the additional safety precautions.
Supply chain
We are focused on ensuring that we have adequate inventory and supplies on hand given the potential disruption of the COVID-19 pandemic to our suppliers and their supply chain. Accordingly, we have and expect to continue to increase inventory and supplies in 2021. We proactively engaged with our suppliers beginning in January 2020 to limit any potential disruption to our supply chain. However, notwithstanding generally successful efforts to maintain supply chain continuity, we have experienced increased costs and delays throughout our supply chain during the pandemic.
Financial condition and results of our global operations
We are a global company that operates in over 100 facilities and in over 20 countries worldwide. As we perform business across various borders, we are experiencing a continuum of impacts in each location as the COVID-19 pandemic has impacted the global economy in different phases. We are continuing to see demand for products and services across all of our businesses, although as described below theimpact of the COVID-19 pandemic on the level of demand varies with our different businesses. While there is uncertainty, our clients are stillcontinued to increase in need of the products and services we provide to biomedical research to advance discovery and develop new therapies for the treatment of disease, including the COVID-19 pandemic. Due to certain restrictions in place at the various sites of our clients and suppliers (including client and supplier site closures), there have been challenges relating to timely receiving and shipping products globally in all businesses. Should these restrictions continue, demand/supply issues may persist and could impact revenue growth, operating income (including operating income margins) and cash flows. We have observed some impact due to constraints from internal site restrictions, remote work, resources, and productivity. However, we believe the impact to us has not been as significant as to companies in many other industries because of the nature of our businesses, the classification of our businesses as essential or critical, as the case may be, and our business continuity plans.
Our RMS business was meaningfully impacted by the COVID-19 pandemic during fiscal year 2020. Demand for research models declined due primarily to2023, but at a slower pace than in recent years.
Despite the physical shutdown of our client’s facilities, principally academic institutions. Whilenear-term market pressures, many of our pharmaceutical and biotechnology clients are deemed essential businesses as well, we experienced a slowdown, initiallycontinued to benefit from the long-term value of strategic outsourcing to improve their operating efficiency and to access capabilities that they do not maintain internally. Many of our large biopharmaceutical clients have continued to increase investments in Chinatheir drug discovery and early-stage development efforts and have strengthened their relationships with outsourced partners, like Charles River, and biotechnology companies to assist them in January 2020, and then across Europe and North America laterbringing new drugs to market. While these clients were more cautious with their early-stage R&D spending in fiscal year 2023, these large biopharmaceutical clients were the principal driver of revenue growth. A reduction in the first fiscal quarterbiotechnology funding environment from peak levels in 2021 resulted in a moderation of 2020, as measures were implemented by various governments to slow the spread of the COVID-19 pandemic. This trend of reduced demand for research models continued during the second fiscal quarter of 2020, which negatively impacted revenue, operating income, operating income margins,from small and cash flows. During the third fiscal quarter of 2020, wemid-size biotechnology clients. We have recently experienced an increase in demandour allowance for credit losses, which increased to $25.7 million as of December 30, 2023 from $11.3 million as of December 31, 2022 and may expect this trend to continue if the biotechnology funding environment remains consistent or further softens. Our ability to continue to deliver our leading suite of research and non-clinical development solutions has endeavored our clients reopened impacted sitesto continue to choose to partner with us for our flexible and resumed theirefficient outsourcing solutions, broad scientific capabilities, and global scale.
Revenue for RMS increased, principally driven by pricing. China reported healthy growth rates despite pressure from more cautious spending on biomedical research activity which positively impacted revenue, operating income, operating income margins,from clients within China. Demand for research model services continued to perform well, led by our Insourcing Solutions business, particularly our CRADL™ operations. Clients are increasingly adopting CRADL™’s flexible model to access vivarium space without having to invest in internal infrastructure. To support client demand, we have expanded CRADL™’s footprint both organically and cash flows, which continued through the fourth fiscal quarteracquisition of 2020. ResearchExplora BioLabs in April 2022. We are confident that research models and services specificallywill remain essential tools for our GEMSclients’ drug discovery and Insourcing Solutions businesses, experienced higher revenues duringearly-stage development efforts.
DSA continued to benefit from sustained trends in fiscal year 2020 compared2023. The Safety Assessment revenue growth rate moderated due to our clients’ budgetary spending constraints but continued to report a solid growth rate for the corresponding prior periodfiscal year due to a combination of price increases and were not as adversely impactedstudy volume. Safety Assessment growth was supported by the COVID-19 pandemic.meaningful scale of the backlog for this business, although it has recently decreased. DSA backlog decreased to $2.45 billion as of December 30, 2023 from $3.15 billion as of December 31, 2022.
Our DSA business was not significantly impactedWe believe that our comprehensive scientific capabilities and global scale, as well as the breadth and depth of our scientific expertise, quality, and responsiveness remain key criteria when our clients make the decision to outsource to us. Biotechnology clients continue to move their programs forward and utilize outsourcing to achieve their goal of more efficient and effective drug research to bring innovative new therapies to market. We continued to enhance our Discovery Services capabilities to provide clients with a comprehensive portfolio that enables them to start working with us at the earliest stages of the discovery process. We have accomplished this in recent years through acquisitions and by the COVID-19 pandemic duringadding cutting-edge capabilities to our discovery toolkit through technology partnerships. In fiscal year 2020. Towards the end of the first fiscal quarter of 2020, we experienced some client work shifting towards subsequent quarters of fiscal year 2020 due to the
various actions and restrictions put in place by governments around the world intended to slow the spread of the COVID-19 pandemic. The work performed2023, demand in our Discovery Services business declined, as clients reprioritize their program and Safety Assessmentconserve their early-stage spending, which resulted in lower proposal activity and a longer lead time to commence new projects.
Revenue for our products and services that support our clients’ manufacturing activities increased across most of our Manufacturing Solutions businesses are largely dependentin fiscal year 2023 however, demand in this reportable segment was impacted by clients’ more cautious spending trends in fiscal year 2023, as well as destocking activities and other challenges associated with CDMO and biopharmaceutical clients. Demand for our cell and gene therapy CDMO services improved meaningfully in fiscal year 2023 as the initiatives that we have implemented to improve the performance of our CDMO business gained traction and generated a healthy pipeline of new business opportunities including working on two commercial products. Charles River remains a premier scientific partner for development, testing, and manufacturing of advanced drug modalities and the acquisition of the CDMO businesses in 2021, Cognate and Vigene, further enhanced our internal sites being open. Therefore,presence in the high-growth cell and gene therapy sector.
In response to recent trends described above, we have undertaken restructuring actions within all reportable segments at various locations across North America, Europe and Asia. This includes workforce right-sizing actions, resulting in severance and transition costs; and costs related to the extent that clients require work to be completed, we have been able to continue to meet client demandsconsolidation of facilities, resulting in asset impairment and perform the work so long as our work force at the specific site the work is done is not significantly adversely impacted by the COVID-19 pandemic. This trend is expected to continue as government actions to slow the spread of the COVID-19 pandemic continues to subside, employees return to work, and economies across the world reopen. Costs of supply have and may continue to increase as we procure the materials required to perform our work.accelerated depreciation
Our Manufacturing business was not significantly impacted by the COVID-19 pandemic
CHARLES RIVER LABORATORIES INTERNATIONAL, INC.
charges. Restructuring charges recognized during fiscal year 2020, however, some2023 were approximately $30 million, of our customers experienced disruptions in their manufacturing operations. This resulted in delays in instrument installations in our Microbial Solutions business, which began during the first half of fiscal 2020$18 million related to asset impairment and continued,accelerated depreciation charges and $12 million related to a lesser extent, during the second half of fiscal 2020. Demand for certain Manufacturing products was not significantly impacted, such as Microbial Solutions endotoxin products and Avian products. Our Biologics testing facilities remain open and performing services for our clients. Similar to our other services businesses, our ability to perform work is contingent on our internal facilities and our work force not being significantly adversely impacted by the COVID-19 pandemic.
Liquidity, capital and financial resources
severance charges. We require cash to fund working capital needsexpect that these effectuated actions as well as capital expansion, acquisitions, venture capital and strategic investments, debt obligations, leases, and pension obligations. The principal sourcesother upcoming planned actions will result in approximately $60 million to $70 million of liquidity have been cash flows from operations, supplemented by long-term borrowings. In fiscal year 2019, we issued $500 million Senior Notes, repaid part of our term loan for $500 million, and increased our multi-currency revolving facility by $500 million, from $1.55 billion to $2.1 billion. As of December 26, 2020, we had $2.0 billion of debt and finance leases outstanding, of which $50.2 million is current. Availablecost savings on the revolving line of credit (Revolver) is $1.2 billion, which matures on March 26, 2023 and does not require scheduled payments before that date should additional borrowings occur. The term loan facility matures in 19 quarterly installments with the last installment due March 26, 2023. The Senior Notes become due in 2026 and 2028.
Due to the uncertainty resulting from the COVID-19 pandemic, we borrowed an additional $150 million from the Revolver during the first fiscal quarter of 2020 to protect against any prolonged adverse impacts on liquidity markets. While there remained uncertainty throughout fiscal 2020, we did not need to use these borrowings to fund operations and these funds were repaid during the third fiscal quarter of 2020. We expect to generate cash inflows from our operating activities sufficient to satisfy our working capital needs as well as to service our debt, pension, and venture capital obligations. Due to this higher debt, we incurred immaterially higher interest expense. We did not need to borrow additional funds during 2020. As of December 26, 2020 there is significant capacity on the remaining Revolver. Accordingly, we do not anticipate a material risk of non-compliance with our debt covenants based on our current estimate of future earnings.annualized basis.
To protect against adverse liquidity concerns, there are various mechanisms for us to improve cash flows. During the second fiscal quarter of 2020 we implemented certain cost reduction plans including delaying compensation related increases, implementing hiring restrictions, reducing working hours, reducing all non-essential travel, and reducing certain discretionary spending. Beginning in the third fiscal quarter of 2020, we reinstated certain annual compensation increases, which had previously been delayed from the beginning of the second quarter of 2020. Additionally, we had temporarily slowed our investment activity, including acquisitions and capital projects, but have since resumed certain of those activities, including the acquisitions of Cellero, LLC (Cellero) during the third fiscal quarter of 2020 and Distributed Bio during the first fiscal quarter of 2021.
As of the date these financial statements are issued, based on our current and expected liquidity position, we do not believe there is significant uncertainty in our ability to continue as a going concern.
Recoverability and/or impairment of assets
The COVID-19 pandemic did not, and is not expected to, impact the ability to timely account for assets on our balance sheet. There are judgments involved as it relates to reviewing our allowance for doubtful accounts, valuation of inventory, and valuations/recovery of investments. We believe we have the necessary support for estimates derived for these account balances. We have reviewed the collectability and valuation of the assets through the date of financial statement issuance, noting no significant recoverability concerns or any impairments identified. Gains and losses on certain investments in venture capital funds are recorded on a quarterly lag due to the availability of the funds’ financial information, which is consistent with our venture capital investment accounting policy described in this annual report. We did not identify any triggering events when reviewing impairment indicators for our goodwill and long-lived assets (tangible and intangible) that would indicate an impairment may exist. Should a prolonged disruption occur where there is a material change from our current expectation of future cash flows, we could experience additional write-offs of client receivables or impairments to certain asset balances due to
collectability and valuation issues. Review of impairment indicators and quantifying any impact will continue to be a focus throughout fiscal year 2021.
Internal controls over financial reporting in a remote work environment
Internal controls over financial reporting are a focus for us to ensure they continue to be designed and operating effectively. As of December 26, 2020 and through the issuance of these financial statements, we did not have any material changes to our internal controls over financial reporting. For personnel responsible for internal control activities and working remote, the ability to work effectively enabled us to continue to maintain effective internal control over financial reporting. System and efficiency programs implemented in recent years, as well as those implemented as part of business continuity plans, have enabled us to effectively complete our financial reporting process in a similar way we completed it prior to the COVID-19 pandemic despite a largely remote working environment. Although there is uncertainty over the duration of the COVID-19 pandemic disruption, we do not anticipate any adverse impact to relevant systems or to the operating effectiveness of internal controls over financial reporting.
Recent Acquisitions
Our strategy is to augment internal growth of existing businesses with complementary acquisitions. We continuedcontinue to make strategic acquisitions designed to expand our portfolio of products and services to support the drug discovery and development continuum. Our recent acquisitions are described below.
On February 17, 2021,November 30, 2023, we announced that we signed a definitive agreement to acquire Cognate BioServices, Inc. for approximately $875 million in cash, subject to customary closing adjustments. Cognate BioServices, Inc. is a cell and gene therapy CDMO offering comprehensive manufacturing solutions for cell therapies, as well as for the development and production of plasmid DNA and viral vectors for gene therapies. The plannedcompleted our acquisition of Cognate BioServices, Inc. will create a scientific partner for cell and gene therapy development, testing, and manufacturing, providing clients with an integrated solution from basic research through cGMP production. The proposed transaction is expected to close by the endadditional 41% equity interest of the first quarter of 2021. The proposed acquisition and associated fees are expected to be financed through a combination of available cash and proceeds from our Credit Facility under the multi-currency revolving facility. This business is expected to be reported as part of our Manufacturing reportable segment.
On December 31, 2020 (fiscal year 2021), we acquired Distributed Bio, Inc (Distributed Bio)Noveprim Group (“Noveprim”), a next-generation antibody discovery company with technologies specializingleading provider of non-human primates (“NHPs”) used for biomedical, pharmaceutical and toxicological research purposes, resulting in enhancing the probability of success for delivering high-quality, readily formattable antibody fragments to support antibody and cell and gene therapy candidates to biopharmaceutical clients.a 90% controlling interest. The acquisition of Distributed Bio expandsstrengthens and diversifies the supply chain for our capabilities with an innovative, large-molecule discovery platform,DSA segment. We had previously acquired a 49% equity stake in 2022 for $90.0 million up-front and creates an integrated, end-to-end platform for therapeutic antibody and cell and gene therapy discovery and development. The preliminary purchase price of Distributed Bio was approximately $83 million in cash, with additional future contingent payments of up to $21$5.0 million based on future performance. The acquisition was funded through a combination of available cash and proceeds from our Credit Facility. This business will be reported as part of our DSA reportable segment.
On August 6, 2020, we acquired Cellero, LLC (Cellero), a provider of cellular products for cell therapy developers and manufacturers worldwide. The addition of Cellero enhances our unique, comprehensive solutions for the high-growth cell therapy market, strengthening our ability to help accelerate clients’ critical programs from basic research and proof-of-concept to regulatory approval and commercialization. It also expands our access to high-quality, human-derived biomaterials with Cellero’s donor sites in the United States. Thetotal preliminary purchase price for Cellero was $37.4the Noveprim acquisition is $374.8 million, in cash. The acquisition was funded through available cash. This business is reported as part of our RMS reportable segment.
On January 3, 2020, we acquired HemaCare Corporation (HemaCare), a business specializing in the production of human-derived cellular productswhich includes $144.6 million additional cash paid for the cell therapy market. The acquisition41% equity interest, elimination of HemaCare expands our comprehensive portfoliohistorical activity and intercompany balances of early-stage research and manufacturing support solutions to encompass$198.8 million which includes a remeasurement gain on the production and customization49% equity investment of high-quality, human derived cellular products to better support clients’ cell therapy programs. The$103.2 million, contingent consideration of $33.3 million, deferred purchase price of HemaCare was $379.8$12.0 million in cash.payable from 2024 through 2027, offset by estimated post-closing adjustments for working capital of $13.8 million. The acquisition was funded through a combination of available cash and proceeds from our Credit Facility. This business is reported as part of our DSA reportable segment for NHPs vertically integrated into our Safety Assessment supply chain and the RMS reportable segment.segment for NHPs sold to third party customers.
On April 29, 2019,January 30, 2023, we acquired Citoxlab,SAMDI Tech, Inc., (SAMDI), a non-clinical CRO, specializing in regulated safety assessment services, non-regulatedleading provider of high-quality, label-free high-throughput screening (HTS) solutions for drug discovery services, and medical device testing. With operations in Europe and North America, theresearch. The acquisition of Citoxlab further strengthens our position asSAMDI will provide clients with seamless access to the premier, label-free HTS MS platform and create a leading, global, early-stage CRO by expanding our scientific portfolio and geographic footprint, which enhances our ability to partner with clients across thecomprehensive, library of drug discovery and development continuum.solutions. The purchase price for Citoxlabof SAMDI was $527.1$62.8 million, net of $0.4 million in cash. cash, inclusive of a 20% strategic equity interest previously owned by us of $12.6 million. The acquisition was funded through a combination of available cash and proceeds from our Credit Facility. Citoxlab This business is reported as part of our DSA reportable segment.
On April 3, 2018,5, 2022, we acquired MPI Research,Explora BioLabs Holdings, Inc. (Explora BioLabs), a non-clinical CROprovider of contract vivarium research services, providing comprehensive testingbiopharmaceutical clients with turnkey in vivo vivarium facilities, management and related services to biopharmaceutical and medical device companies worldwide.efficiently conduct their early-stage research activities. The acquisition enhancesof Explora BioLabs complements our position as a leading global early-stage CRO by strengtheningexisting Insourcing Solutions business, specifically our abilityCRADL™ footprint, and offers incremental opportunities to partner with clients across the drug discoveryan emerging client base, many of which are engaged in cell and development continuum.gene therapy development. The purchase price for MPI Researchof Explora BioLabs was $829.7$284.5 million, net of $6.6 million in cash.cash acquired. The acquisition was funded by borrowings onthrough proceeds from our Credit Facility as well as the issuance of $500.0 million of 5.5% Senior Notes due 2026 (2026 Senior Notes) in an unregistered offering. MPI ResearchFacility. This business is reported as part of our DSARMS reportable segment.
Recent Divestiture
We routinely evaluate strategic fit and fundamental performance of our global infrastructure and divest operations that do not meet key business criteria or where capital could be better deployed in other long-term growth opportunities. On December 20, 2022, we completed the sale of our Avian Vaccine Services (Avian) business to a private investor group for a preliminary purchase price of $167 million in cash, subject to certain customary closing adjustments, and future contingent payments up to an additional $30 million. Prior to divestiture, this business was reported in our Manufacturing reportable segment.
Fiscal QuartersU.S. Government Investigations into Non-Human Primate Supply Chain
Our fiscal yearOn February 16, 2023, the Company was informed by the U.S. Department of Justice (DOJ) that in conjunction with the U.S. Fish and Wildlife Service (USFWS), it had commenced an investigation into the Company’s conduct regarding several shipments of non-human primates from Cambodia. On February 17, 2023 the Company received a grand jury subpoena requesting certain documents related to such investigation. The Company is typically based on 52-weeks,aware of a parallel civil investigation being undertaken by the DOJ and USFWS. The Company is cooperating with each quarter composed of 13 weeks ending on the last Saturday on, or closest to, March 31, June 30, September 30,DOJ and December 31. A 53rd week was included in the fourth quarter of fiscal year 2016, which is occasionally necessary to alignUSFWS and believes that the concerns raised with a December 31 calendar year-end.
Business Trends
The global economy faced unprecedented challenges in 2020 duerespect to the COVID-19 pandemic, as did ourCompany’s conduct are without merit. The Company but we believemaintains a global supplier onboarding and oversight program incorporating risk-based due diligence, auditing, and monitoring practices to help ensure the resiliencequality of our business modelsupplier relationships and compliance with applicable U.S. and international laws and regulations, and has enabled us to weather these challenges extremely well. This resilience wasoperated under the resultbelief that all shipments of comprehensive business continuity plans that enabled us to keepnon-human primates it received satisfied the material requirements, documentation and related processes and procedures of the Convention on International Trade in Endangered Species of Wild Fauna and Flora (CITES) documentation and related processes and procedures, which guides the release of each import by USFWS. Notwithstanding our operating sites open and adequately staffed; the global scale, broad scientific capabilities, and flexible outsourcing solutions that we are able to offer clients; and the commitment of our global employees. While several of our businesses experienced a significant, short-term decline in demand associated with COVID-19-related disruptions at our clients’ sites, primarily in the RMS reportable segment and principally in the second quarter of 2020, we also benefited from persistent client demand across many of our businesses, including in our DSA reportable segment, driven by robust biotech funding and continued innovation that is generating scientific breakthroughs across multiple therapeutic areas, including for COVID-19 therapeutics.
Many of our pharmaceutical and biotechnology clients intensified their use of strategic outsourcing during 2020 to overcome challenges at their own sites and move their early-stage research programs forward during the pandemic. Small and mid-size biotechnology clients continued to be the primary driver of revenue growth as these clients benefited from record biotechnology funding levels in fiscal year 2020, from capital markets, partnering with large biopharmaceutical companies, and investment by venture capital, as the COVID-19 pandemic enhanced the global focus on scientific innovation and emphasized greater investment in their preclinical pipelines. Many of our large biopharmaceutical clients have continued to increase investments in their drug discovery and early-stage development efforts and have strengthened their relationships with both CROs, like us, and biotechnology companies to assist themgood-faith belief, in bringing new drugs to market. Clients continue to seek to outsource larger portions of their early-stage drug research programs to us, which is leading to new business opportunities as clients adopt more flexible and efficient research and development models.
The primary result of these trends was robust revenue growth within our DSA reportable segment in fiscal year 2020, which experienced only a limited impact related to COVID-19 and benefited from incremental outsourcing activity from our clients as they sought a reliable CRO partner to help move their programs forward amidst the challenges of COVID-19. Robust Safety Assessment revenue growth in fiscal year 2020 was primarily driven by increased demand and pricing. We believe the acquisitions of Citoxlab (2019), MPI Research (2018), and WIL Research (2016) have solidified our scientific capabilities and global scale, and the breadth and depth of our scientific expertise, quality, and responsiveness remain key criteria when our clients make the decision to outsource to us. As biotechnology funding remains robust and our clients continue to pursue their goal of more efficient and effective drug research to bring innovative new therapies to market, they are evaluating outsourcing more of their research programs, such as discovery services. We continued to enhance our Discovery Services capabilities to provide clients with a comprehensive portfolio that enables them to start working with us at the earliest stages of the discovery process. We have accomplished this through acquisitions, including Distributed Bio in December 2020 (fiscal year 2021), Citoxlab’s discovery services, KWS BioTest in January 2018 and Brains On-Line in August 2017, and through adding cutting-edge capabilities to our discovery toolkit through partnerships, such as BitBio, Cypre, and Fios Genomics. In fiscal year 2020, demand in our Discovery Services business also increased significantly, as our efforts to enhance our scientific capabilities, provide clients with flexible partnering models, and become a trusted scientific partner for our clients’ early-stage programs have been successful.
Overall, demand for our products and services that support our clients’ manufacturing activities was strong in fiscal year 2020. Our Biologics business continued to benefit from increased demand for services associatedconnection with the growing proportioncivil investigation, the Company has voluntarily suspended future shipments of biologic drugs innon-human primates from Cambodia to the pipelineUnited States until such time that the Company and on the market, including cellUSFWS can agree upon and gene therapies, as well as COVID-19 therapeutics. Demand for our Microbial Solutions was affected by delayed instrument installations, as certain client sites were inaccessible dueimplement additional procedures to reasonably ensure that non-human primates imported from Cambodia are
COVID-19 restrictions.purpose-bred. The Company continues to care for the Cambodia-sourced non-human primates from certain recent shipments in the United States. The carrying value of the inventory related to these shipments is approximately $27 million as of December 30, 2023, which reflects the value of the shipments in accordance with our inventory accounting policy. On May 16, 2023, the Company received an inquiry from the Enforcement Division of the U.S. Securities and Exchange Commission (SEC) requesting it to voluntarily provide information, subsequently augmented with a document subpoena, primarily related to the sourcing of non-human primates, and the Company is cooperating with the request. We wereare not able to complete additional instrument installations and the revenue growth rate for Microbial Solutions did improve as the year progressed.
Demand for our Research Models and Services was negatively impacted in fiscal year 2020, particularly during the second quarter. Worldwide demand for research models declined sharply, principallypredict what action, if any, might be taken in the second quarter,future by the DOJ, USFWS, SEC or other governmental authorities as COVID-19-related restrictions, sucha result of the investigations. None of the DOJ, USFWS or SEC has provided the Company with any specific timeline or indication as stay-at-home orders, disrupted our clients’ research activities. Many academic clients closed their research sites temporarily, and there was also a significant reduction in order activity from both large biopharmaceutical and smaller biotechnology clients asto when these clients reduced their on-site activities. Clients began to resume more normalized research activities in the third quarter, and demand for research models began to rebound. Demand for research models services experienced very little impact from COVID-19 in fiscal year 2020, and these businesses performed very well, particularly for our IS and GEMS businesses. We are confident that research models and services will remain essential tools for our clients’ drug discovery and early-stage development efforts. In 2020, we enhanced the RMS business’ growth profile and portfolio of critical research tools that we are able to supply through the acquisitions of HemaCare and Cellero, premier providers of human-derived cellular products used in cell therapies. HemaCare and Cellero together generated revenue of $48.1 million in fiscal year 2020, as robust, underlying client demand in the cell therapy market was partially offset by COVID-19-related disruptions.
Overview of Results of Operations and Liquidity
Revenue for fiscal year 2020 was $2.9 billion compared to $2.6 billion in fiscal year 2019. The 2020 increase as comparedinvestigations or, specific to the corresponding period in 2019 was $302.7 million,DOJ and USFWS, discussions regarding future processes and procedures, will be concluded or 11.5%, and was primarily due to both growth in our DSA and Manufacturing segments, as discussed inresolved. The Company cannot predict the above “Business Trends” section, as well as the recent acquisitions of HemaCare and Cellero in our RMS segment, and by the positive effect of changes in foreign currency exchange rates when compared to the corresponding period in 2019; partially offset by a reduction in RMS product revenue due to thetiming, outcome or possible impact of the COVID-19 pandemic when comparedinvestigations, including without limitation any potential fines, penalties or liabilities. Refer to the corresponding period in 2019.
In fiscal year 2020,Item 1A, “Risk Factors” disclosed herein for our operating income and operating income margin were $432.7 million and 14.8%, respectively, compared with $351.2 million and 13.4%, respectively, in fiscal year 2019. The increases in operating income and operating income margin were primarily due to contributions from our DSA and Manufacturing segments and lower acquisition related costs compared to the corresponding period in 2019, partially offset by lower RMS operating income and operating income margin due to the impactassessment of the COVID-19 pandemic, as well as increased amortization of intangible assets related to our recent acquisitions of HemaCare and Cellero.
Net income attributable to common shareholders increased to $364.3 million in fiscal year 2020, from $252.0 million in the corresponding period of 2019. The increase in net income attributable to common shareholders of $112.3 million was primarily due to higher operating income mentioned above and higher net gains on our venture capital investments compared to the corresponding period in 2019.
During fiscal year 2020, our cash flows from operations was $546.6 million compared with $480.9 million for fiscal year 2019. The increase was driven by higher net income and certain favorable changes in working capital items, including favorable timing of certain government deferrals of payroll tax payments, and compensation related items; partially offset by the timing of vendor and supplier payments and collections of net contract balances from contracts with customers (collectively trade receivables, net; deferred revenue; and customer contract deposits); and certain pension related payments compared to the same period in 2019.risk factors surrounding this matter.
Critical Accounting Policies and Estimates
Our discussion and analysis of our financial condition and results of operations is based upon our consolidated financial statements prepared in accordance with generally accepted accounting principles in the United States (U.S.). The preparation of these financial statements requires us to make certain estimates and assumptions that may affect the reported amounts of assets and liabilities, the reported amounts of revenues and expenses during the reported periods and related disclosures. These estimates and assumptions are monitored and analyzed by us for changes in facts and circumstances, and material changes in these estimates could occur in the future. We base our estimates on our historical experience, trends in the industry, and various other factors that are believed to be reasonable under the circumstances. Actual results may differ from our estimates under different assumptions or conditions.
We believe that the application of our accounting policies, each of which require significant judgments and estimates on the part of management, are the most critical to aid in fully understanding and evaluating our reported financial results. Our significant accounting policies are more fully described in Note 1, “Description of Business and Summary of Significant
Accounting Policies”, to our consolidated financial statements contained in Item 8, “Financial Statements and Supplementary Data” in this Annual Report on Form 10-K.
An accounting policy is deemed to be critical if the nature of the estimates or assumptions is material due to the levels of subjectivity and judgment necessary to account for highly uncertain matters or the susceptibility of such matters to change, and the impact of the estimates and assumptions on our consolidated financial statements is or may be material. We believe the following represent our critical accounting policies and estimates used in the preparation of our financial statements:
Revenue Recognition
Revenue is recognized when, or as, obligations under the terms of a contract are satisfied, which occurs when control of the promised products or services is transferred to customers. Revenue is measured as the amount of consideration we expect to receive in exchange for transferring products or services to a customer (“transaction price”).
To the extent the transaction price includes variable consideration, we estimate the amount of variable consideration that should be included in the transaction price utilizing the amount to which we expect to be entitled. Variable consideration is included in the transaction price if, in our judgment, it is probable that a significant future reversal of cumulative revenue under the contract will not occur. Estimates of variable consideration and determination of whether to include estimated amounts in the transaction price are based largely on an assessment of our anticipated performance and all information (historical, current and forecasted) that is reasonably available. Sales, value add, and other taxes collected on behalf of third parties are excluded from revenue.
When determining the transaction price of a contract, an adjustment is made if payment from a customer occurs either significantly before or significantly after performance, resulting in a significant financing component. Generally, we do not extend payment terms beyond one year. Applying the practical expedient, we do not assess whether a significant financing component exists if the period between when we perform our obligations under the contract and when the customer pays is one year or less. Our contracts do not generally contain significant financing components.
Contracts with customers may contain multiple performance obligations. For such arrangements, the transaction price is allocated to each performance obligation based on the estimated relative standalone selling prices of the promised products or services underlying each performance obligation. We determine standalone selling prices based on the price at which the performance obligation is sold separately. If the standalone selling price is not observable through past transactions, we estimate the standalone selling price taking into account available information such as market conditions and internally approved pricing guidelines related to the performance obligations.
Contracts are often modified to account for changes in contract specifications and requirements. Contract modifications exist when the modification either creates new, or changes existing, enforceable rights and obligations. Generally, when contract modifications create new performance obligations, the modification is considered to be a separate contract and revenue is recognized prospectively. When contract modifications change existing performance obligations, the impact on the existing transaction price and measure of progress for the performance obligation to which it relates is generally recognized as an adjustment to revenue (either as an increase in or a reduction of revenue) on a cumulative catch-up basis.
CHARLES RIVER LABORATORIES INTERNATIONAL, INC.
Product revenue is generally recognized when the customer obtains control of our product, which occurs at a point in time, and may be upon shipment or upon delivery based on the contractual shipping terms of a contract. Service revenue is generally recognized over time as the services are delivered to the customer based on the extent of progress towards completion of the performance obligation. The selection of the method to measure progress towards completion requires judgment and is based on the nature of the products or services to be provided. Depending on which better depicts the transfer of value to the customer, we generally measure our progress using either cost-to-cost (input method) or right-to-invoice (output method). We use the cost-to-cost measure of progress when it best depicts the transfer of value to the customer which occurs as we incur costs on our contract, generally related to fixed fee service contracts. Under the cost-to-cost measure of progress, the extent of progress towards completion is measured based on the ratio of costs incurred to date to the total estimated costs at completion of the performance obligation. The costs calculation includes variables such as labor hours, allocation of overhead costs, research model costs, and subcontractor costs. Revenue is recorded proportionally as costs are incurred. The right-to-invoice measure of progress is generally related to rate per unit contracts, as the extent of progress towards completion is measured based on discrete service or time-based increments, such as samples tested or labor hours incurred. Revenue is recorded in the amount invoiced since that amount corresponds directly to the value of our performance to date. During fiscal year 2020, $1.82023, $2.6 billion, or approximately 60%, of our total revenue recognized ($2.94.1 billion) is DSA service revenue transferred over time.
Intangible Assets (including Goodwill) and certain Biological Assets
We use assumptions and estimates in determining the fair value of assets acquired and liabilities assumed in a business combination. The determination of the fair value of intangible assets (including goodwill) and certain biological assets, which represent a significant portion of the purchase price in certain recent acquisitions, requires the use of significant judgment with regard to (i) the fair value; and (ii) whether such assets are amortizable or non-amortizable and, if the former, the period and the method by which the asset will be amortized. We utilize commonly accepted valuation techniques, such as the income, cost and market approaches, as appropriate, in establishing the fair value of these assets. Typically, key assumptions include projections of cash flows that arise from these assets of acquired businesses as well as discount rates based on an analysis of the weighted average cost of capital, adjusted for specific risks associated with the assets.
In our recent acquisitions, customer relationship intangible assets (also referred to as client relationships) and certain biological assets have been the most significant identifiable assets acquired. To determine the fair value of the acquired client relationships and biological assets, we utilized the multiple period excess earnings model (a commonly accepted valuation technique), which includes the following key assumptions: projections of cash flows from the acquired entities, which included future revenue, cost of revenue, operating income margins, customer attrition rates, productivity rates; as well as discount rates based on a market participant’s weighted average cost of capital. The value of the client relationship acquired was $23 million for fiscal year 2023 and $64 million for fiscal year 2022. The value of the biological assets acquired was $168 million for fiscal year 2023.
We review definite-lived intangible assets for impairment when indication of potential impairment exists, such as a significant reduction in cash flows associated with the assets. Actual cash flows arising from a particular intangible asset could vary from projected cash flows which could imply different carrying values from those established at the dates of acquisition and which could result in impairment of such asset. No significant impairments were recognized during fiscal years 2023 and 2022.
We evaluate goodwill for impairment annually, during the fourth quarter, and when events occur or circumstances change that may reduce the fair value of the asset below its carrying amount. Events or circumstances that might require an interim evaluation include unexpected adverse business conditions, economic factors, unanticipated technological changes or competitive activities, loss of key personnel and acts by governments and courts. Estimates of future cash flows require assumptions related to revenue and operating income growth, asset-related expenditures, working capital levels and other factors. Different assumptions from those made in our analysis could materially affect projected cash flows and our evaluation of goodwill for impairment.
We perform the quantitative impairment test where we compare the fair value of our reporting units to their carrying values. If the carrying values of the net assets assigned to the reporting units exceed the fair values of the reporting units, then we would record an impairment loss equal to the difference. In fiscal years 2023 and 2022 we performed the quantitative goodwill impairment test for our reporting units. Fair value was determined by using a weighted combination of a market-based approach and an income approach, as this combination was deemed to be the most indicative of our fair value in an orderly transaction between market participants. Under the market-based approach, we utilized information about our company as well as publicly available industry information to determine earnings multiples and sales multiples that are used to value our reporting units. Under the income approach, we determined fair value based on the estimated future cash flows of each reporting unit, discounted by an estimated weighted-average cost of capital, which reflects the overall level of inherent risk of the reporting unit and the rate of return an outside investor would expect to earn. Our 2023 and 2022 impairment tests indicated that goodwill was not impaired.
CHARLES RIVER LABORATORIES INTERNATIONAL, INC.
Valuation and Impairment of Long-Lived Assets
Long-lived assets to be held and used, including property, plant, and equipment, are reviewed for impairment whenever events or changes in circumstances indicate that the carrying amount of the assets or asset group may not be recoverable. Factors we consider important that could trigger an impairment review include, but are not limited to, the following:
•significant underperformance relative to expected historical or projected future operating results;
•significant negative industry or economic trends; or
•significant changes or developments in strategy or operations that negatively affect the utilization of our long-lived assets.
Determination of recoverability is based on an estimate of undiscounted future cash flows resulting from the use of the asset, net of any sublease income, if applicable, and its eventual disposition. In the event that such cash flows are not expected to be sufficient to recover the carrying amount of the assets, the assets are written-down to their fair values. We measure any impairment based on a projected discounted cash flow method using a discount rate determined by management to be commensurate with the risk inherent in our current business model. Significant judgments are required to estimate future cash flows, including the selection of appropriate discount rates and other assumptions. We may also estimate fair value based on market prices for similar assets, as appropriate. Changes in these estimates and assumptions could materially affect the determination of fair value for these assets. Long-lived asset impairments of $42 million were recognized during fiscal year 2023 and no significant impairments were recognized during 2022.
Income Taxes
We prepare and file income tax returns based on our interpretation of each jurisdiction’s tax laws and regulations. In preparing our consolidated financial statements, we estimate our income tax liability in each of the jurisdictions in which we operate by estimating our actual current tax expense together with assessing temporary differences resulting from differing treatment of
items for tax and financial reporting purposes. These differences result in deferred tax assets and liabilities, which are included in our consolidated balance sheets. Significant management judgment is required in assessing the realizability of our deferred tax assets. In performing this assessment, we consider whether it is more likely than not that some portion or all of the deferred tax assets will not be realized. The ultimate realization of deferred tax assets is dependent upon the generation of future taxable income during the periods in which those temporary differences become deductible. In making this determination, under the applicable financial accounting standards, we are allowed to consider the scheduled reversal of deferred tax liabilities, projected future taxable income, and the effects of tax planning strategies. Our valuation allowance was $304.2 million as of December 30, 2023. In the event that actual results differ from our estimates, we will adjust our estimates in future periods and we may need to establish a valuation allowance, which could materially impact our financial position and results of operations. Our valuation allowance increased by $24.9 million from $310.0 millionadditional allowances or reversals as of December 28, 2019 to $334.8 million as of December 26, 2020. The increase is primarily a result of foreign exchange impact on net operating losses and corresponding valuation allowances relating to the Company’s 2019 financing structure changes.necessary.
We account for uncertain tax positions using a “more-likely-than-not” threshold for recognizing and resolving uncertain tax positions. We evaluate uncertain tax positions on a quarterly basis and consider various factors, that include, but are not limited to, changes in tax law, the measurement of tax positions taken or expected to be taken in tax returns, the effective settlement of matters subject to audit, information obtained during in process audit activities and changes in facts or circumstances related to a tax position. We adjust the level of the liability to reflect any subsequent changes in the relevant facts surrounding the uncertain positions. Our liabilities for uncertain tax positions can be relieved only if the contingency becomes legally extinguished through either payment to the taxing authority or the expiration of the statute of limitations, the recognition of the benefits associated with the position meet the “more-likely-than-not” threshold or the liability becomes effectively settled through the controversy process. We consider matters to be effectively settled once the taxing authority has completed all of its required or expected examination procedures, including all appeals and administrative reviews; we have no plans to appeal or litigate any aspect of the tax position; and we believe that it is highly unlikely that the taxing authority would re-examine the related tax position. We also accrue for potential interest and penalties related to unrecognized tax benefits in income tax expense.
We generally receive a tax deduction upon the exercise of non-qualified stock options by employees, or the vesting of restricted stock and performance share units held by employees. The stock price, timing, and amount of vesting and exercising of stock-based compensation could materially impact our current tax expense.
In 2017,Our global operations make the effective tax rate sensitive to significant U.S. tax law changeschanges. Several countries have begun to enact legislation to implement the Organization for Economic Cooperation and Development’s (OECD) international tax framework, including the Pillar II global minimum tax regime with effect from the Tax Cuts and Jobs Act of 2017 (U.S. Tax Reform) went into effect and reduced the U.S. federal statutory tax rate, broadened the corporate tax base through the eliminationJanuary 1, 2024 or reduction of deductions, exclusions and credits, limited the ability of U.S. corporationslater. We are currently monitoring these developments, but do not expect there to deduct interest expense and allowed for the repatriation of foreign earnings to the U.S. withbe a 100% federal dividends received deduction prospectively. In addition, U.S. Tax Reform required a one-time transitional tax on foreign cash equivalents and previously unremitted earnings.
Our accounting for the elements of U.S. Tax Reform is complete. We have made an accounting policy election to treat taxes due on the GILTI inclusion as a current period expense.
Goodwill and Intangible Assets
We use assumptions and estimates in determining the fair value of assets acquired and liabilities assumed in a business combination. The determination of the fair value of intangible assets, which represent a significant portion of the purchase price in many of our acquisitions, requires the use of significant judgment with regard to (i) the fair value; and (ii) whether such intangibles are amortizable or non-amortizable and, if the former, the period and the method by which the intangible asset will be amortized. We utilize commonly accepted valuation techniques, such as the income approach and the cost approach, as appropriate, in establishing the fair value of intangible assets. Typically, key assumptions include projections of cash flows that arise from identifiable intangible assets of acquired businesses as well as discount rates based on an analysis of the weighted average cost of capital, adjusted for specific risks associated with the assets.
In our recent acquisitions, customer relationship intangible assets (also referred to as client relationships) have been the most significant identifiable assets acquired. To determine the fair value of the acquired client relationships, we utilized the multiple period excess earnings model (a commonly accepted valuation technique), which includes the following key assumptions: projections of cash flows from the acquired entities, which included future revenue growth rates, operating income margins, and customer attrition rates; as well as discount rates based on an analysis of the acquired entities’ weighted average cost of capital. The value of client relationships acquired were $170.4 million for HemaCare and $14.7 million for Cellero in fiscal year 2020, $134.6 million for Citoxlab in fiscal year 2019 and $264.9 million for MPI Research in fiscal year 2018.material financial impact.
We review definite-lived intangible assets for impairment when indication of potential impairment exists, such as a significant reduction in cash flows associated with the assets. Actual cash flows arising from a particular intangible asset could vary from projected cash flows which could imply different carrying values from those established at the dates of acquisition and which could result in impairment of such asset. No impairments were recognized during 2020, 2019 or 2018.
We evaluate goodwill for impairment annually, during the fourth quarter, and when events occur or circumstances change that may reduce the fair value of the asset below its carrying amount. Events or circumstances that might require an interim evaluation include unexpected adverse business conditions, economic factors, unanticipated technological changes or competitive activities, loss of key personnel and acts by governments and courts. Estimates of future cash flows require assumptions related to revenue and operating income growth, asset-related expenditures, working capital levels and other factors. Different assumptions from those made in our analysis could materially affect projected cash flows and our evaluation of goodwill for impairment.
We perform the quantitative impairment test where we compare the fair value of our reporting units to their carrying values. If the carrying values of the net assets assigned to the reporting units exceed the fair values of the reporting units, then we would record an impairment loss equal to the difference. In fiscal 2020 we adopted ASU 2017-04, “Simplifying the Test for Goodwill Impairment.” The standard simplifies the accounting for goodwill impairment by removing Step 2 of the quantitative goodwill impairment test, which previously required a hypothetical purchase price allocation to determine the amount of a goodwill impairment loss.
In fiscal years 2020, 2019 and 2018, we performed the quantitative goodwill impairment test for our reporting units. Fair value was determined by using a weighted combination of a market-based approach and an income approach, as this combination was deemed to be the most indicative of our fair value in an orderly transaction between market participants. Under the market-based approach, we utilized information about our company as well as publicly available industry information to determine earnings multiples and sales multiples that are used to value our reporting units. Under the income approach, we determined fair value based on the estimated future cash flows of each reporting unit, discounted by an estimated weighted-average cost of capital, which reflects the overall level of inherent risk of the reporting unit and the rate of return an outside investor would expect to earn.
Our 2020, 2019 and 2018 impairment tests indicated that goodwill was not impaired.
Valuation and Impairment of Long-Lived Assets
Long-lived assets to be held and used, including property, plant, and equipment, are reviewed for impairment whenever events or changes in circumstances indicate that the carrying amount of the assets or asset group may not be recoverable. Factors we consider important that could trigger an impairment review include, but are not limited to, the following:
•significant underperformance relative to expected historical or projected future operating results;
•significant negative industry or economic trends; or
•significant changes or developments in strategy or operations that negatively affect the utilization of our long-lived assets.
Determination of recoverability is based on an estimate of undiscounted future cash flows resulting from the use of the asset, net of any sublease income, if applicable, and its eventual disposition. In the event that such cash flows are not expected to be sufficient to recover the carrying amount of the assets, the assets are written-down to their fair values. We measure any impairment based on a projected discounted cash flow method using a discount rate determined by management to be commensurate with the risk inherent in our current business model. Significant judgments are required to estimate future cash flows, including the selection of appropriate discount rates and other assumptions. We may also estimate fair value based on market prices for similar assets, as appropriate. Changes in these estimates and assumptions could materially affect the determination of fair value for these assets.
Pension and Other Post-Retirement Benefit Plans
Several of our U.S. and non-U.S. subsidiaries sponsor defined benefit pension and other post-retirement benefit plans. We recognize the funded status of our defined benefit pension and other postretirement benefit plans as an asset or liability. This amount is defined as the difference between the fair value of plan assets and the benefit obligation. We measure plan assets and benefit obligations as of the date of our fiscal year end.
The cost and obligations of these arrangements are calculated using many assumptions to estimate the benefits that the employee earns while working, the amount of which cannot be completely determined until the benefit payments cease. Major assumptions used in the accounting for these employee benefit plans include the expected return on plan assets, withdrawal and mortality rates, discount rate, and rate of increase in employee compensation levels. Assumptions are determined based on our data and appropriate market indicators, and are evaluated each year as of the plans’ measurement date. Should any of these assumptions change, they would have an effect on net periodic pension costs and the unfunded benefit obligation.
The expected long-term rate of return on plan assets reflects the average rate of earnings expected on the funds invested, or to be invested, to provide for the benefits included in the projected benefit obligations. In determining the expected long-term rate of return on plan assets, we consider the relative weighting of plan assets, the historical performance of total plan assets and individual asset classes and economic and other indicators of future performance.
The discount rate reflects the rate we would have to pay to purchase high-quality investments that would provide cash sufficient to settle our current pension obligations. A 25-basis point change in the discount rate changes the projected benefit obligation by approximately $17 million for all our plans.
The rate of compensation increase reflects the expected annual salary increases for the plan participants based on historical experience and the current employee compensation strategy.
The Charles River Laboratories, Inc. Pension Plan (U.S. Pension Plan) is a qualified, non-contributory defined benefit plan covering certain U.S. employees. The U.S. Pension Plan was amended in 2002 to exclude new participants and in 2008 the accrual of benefits was frozen. In January 2019, we commenced the process to terminate this plan and received regulatory approval in April 2020. In October 2020, we settled all remaining benefits directly with vested participants through either lump sum payouts or the purchase of a group annuity contract from a qualified insurance company to administer all future payments. Prior to the settlement, the U.S. Pension Plan was underfunded with a benefit obligation of approximately $94 million and plan assets of approximately $93 million. In the fourth quarter of fiscal year 2020, we made a contribution of approximately $1 million to fully fund this plan to cover the lump sum payments, purchase the group annuity contract, and settle remaining termination costs. Upon settlement of the pension liability, we recognized a non-cash settlement charge of approximately $10 million related to pension losses, reclassified from accumulated other comprehensive loss to other expense in the consolidated statement of income.
Stock-Based Compensation
We grant stock options, restricted stock, restricted stock units (RSUs), and performance share units (PSUs) to employees, and stock options, restricted stock, and RSUs to non-employee directors under stock-based compensation plans. We make certain assumptions in order to value and record expense associated with awards made under our stock-based compensation arrangements. Changes in these assumptions may lead to variability with respect to the timing and amount of expense we recognize in connection with share-based payments. Stock-based compensation is recognized as an expense in the consolidated statements of income based on the grant date fair value, adjusted for forfeitures when they occur, over the requisite service period.
Determining the appropriate valuation model and related assumptions requires judgment. The fair value of stock options granted is calculated using the Black-Scholes option-pricing model and the fair value of PSUs is estimated using a lattice model with a Monte Carlo simulation, both of which require the use of subjective assumptions including volatility and expected term, among others.
Determining the appropriate amount to expense based on the anticipated achievement of PSU’s performance targets requires judgment, including forecasting the achievement of future financial targets. The estimate of expense is revised periodically based on the probability of achieving the required performance targets. The cumulative impact of any changes to our estimates is reflected in the period of change.
New Accounting Pronouncements
For a discussion of new accounting pronouncements, refer to Note 1, “Description of Business and Summary of Significant Accounting Policies” to our consolidated financial statements contained in Item 8, “Financial Statements and Supplementary Data,” in this Annual Report on Form 10-K.
Results of Operations
Fiscal Year 2020 ComparedConsolidated Results of Operations and Liquidity
Revenue for fiscal year 2023 was $4.1 billion compared to Fiscal Year 2019$4.0 billion in fiscal year 2022. The 2023 increase as compared to the corresponding period in 2022 was $153.3 million, or 3.9%, and was primarily due to increased volume and pricing within our Safety Assessment business and our recent acquisition of Explora BioLabs; partially offset by the divestiture of our Avian business and the effect of changes in foreign currency exchange rates when compared to fiscal year 2022.
In fiscal year 2023, our operating income and operating income margin were $617.3 million and 14.9%, respectively, compared with $651.0 million and 16.4%, respectively, in fiscal year 2022. The decrease in operating income and operating income margins for fiscal year 2023 was primarily due to higher operating costs within our Manufacturing segment, restructuring and asset impairment charges principally in our DSA and Manufacturing segments, and the divestiture of the Avian business; partially offset by contributions of higher revenue described above.
Net income attributable to common shareholders decreased to $474.6 million in fiscal year 2023, from $486.2 million in the corresponding period of 2022. The decrease in net income attributable to common shareholders of $11.6 million was primarily due to lower operating income described above and higher interest expense due to higher interest rates on our variable debt, partially offset by lower income tax expense during fiscal year 2023 compared to the corresponding period of 2022.
During fiscal year 2023, our cash flows from operations was $683.9 million compared with $619.6 million for fiscal year 2022. The increase in net cash provided by operating activities was primarily driven by the amounts and timing of compensation payments and inventory purchases.
Revenue and Operating Income
The following tables present consolidated revenue by type and by reportable segment:
| | Fiscal Year | |
| 2020 | | 2019 | | $ change | | % change |
| (in millions, except percentages) |
| Fiscal Year | |
| 2023 | |
| 2023 | |
| 2023 | | | 2022 | | $ change | | % change |
| (in thousands, except percentages) | | | (in thousands, except percentages) |
| Service revenue | Service revenue | $ | 2,296.1 | | | $ | 2,029.4 | | | $ | 266.7 | | | 13.1 | % | Service revenue | $ | 3,440,019 | | | $ | | $ | 3,216,904 | | | $ | | $ | 223,115 | | | 6.9 | | 6.9 | % |
| Product revenue | Product revenue | 627.8 | | | 591.8 | | | 36.0 | | | 6.1 | % | Product revenue | 689,390 | | | 759,156 | | 759,156 | | | (69,766) | | (69,766) | | | (9.2) | | (9.2) | % |
| Total revenue | $ | 2,923.9 | | | $ | 2,621.2 | | | $ | 302.7 | | | 11.5 | % |
| $ | | | $ | 4,129,409 | | | $ | 3,976,060 | | | $ | 153,349 | | | 3.9 | % |
| | | | | | | | | | | | | | | | | | | | | | | | | | | | | |
| Fiscal Year | | | | | | |
| 2023 | | 2022 | | $ change | | % change | | Impact of FX |
| (in thousands, except percentages) |
| RMS | $ | 792,343 | | | $ | 739,175 | | | $ | 53,168 | | | 7.2 | % | | (0.6) | % |
| DSA | 2,615,623 | | | 2,447,316 | | | 168,307 | | | 6.9 | % | | 0.3 | % |
| Manufacturing | 721,443 | | | 789,569 | | | (68,126) | | | (8.6) | % | | 0.4 | % |
| Total revenue | $ | 4,129,409 | | | $ | 3,976,060 | | | $ | 153,349 | | | 3.9 | % | | 0.2 | % |
| | | | | | | | | | | | | | | | | | | | | | | | | | | | | |
| Fiscal Year | | | | | | |
| 2020 | | 2019 | | $ change | | % change | | Impact of FX |
| (in millions, except percentages) |
| RMS | $ | 571.1 | | | $ | 537.1 | | | $ | 34.0 | | | 6.3 | % | | 0.6 | % |
| DSA | 1,837.4 | | | 1,619.0 | | | 218.4 | | | 13.5 | % | | 0.4 | % |
| Manufacturing | 515.4 | | | 465.1 | | | 50.3 | | | 10.8 | % | | 0.4 | % |
| Total revenue | $ | 2,923.9 | | | $ | 2,621.2 | | | $ | 302.7 | | | 11.5 | % | | 0.4 | % |
The following table presents operating income by reportable segment:
| | | | | | | | | | | | | | | | | | | | | | | |
| Fiscal Year | | | | |
| 2020 | | 2019 | | $ change | | % change |
| (in millions, except percentages) |
| RMS | $ | 102.7 | | | $ | 133.9 | | | $ | (31.2) | | | (23.3) | % |
| DSA | 325.9 | | | 258.9 | | | 67.0 | | | 25.9 | % |
| Manufacturing | 181.5 | | | 145.4 | | | 36.1 | | | 24.8 | % |
| Unallocated corporate | (177.4) | | | (187.0) | | | 9.6 | | | (5.2) | % |
| Total operating income | $ | 432.7 | | | $ | 351.2 | | | $ | 81.5 | | | 23.2 | % |
| Operating income % of revenue | 14.8 | % | | 13.4 | % | | | | 1.4 | % |
| | | | | | | | | | | | | | | | | | | | | | | | | | | | | |
| Fiscal Year | | | | | | |
| 2023 | | 2022 | | $ change | | % change | | Impact of FX |
| (in thousands, except percentages) | | |
| RMS | $ | 154,666 | | | $ | 160,410 | | | $ | (5,744) | | | (3.6) | % | | (1.4) | % |
| DSA | 606,076 | | | 532,889 | | | 73,187 | | | 13.7 | % | | 1.9 | % |
| Manufacturing | 88,329 | | | 167,084 | | | (78,755) | | | (47.1) | % | | 1.3 | % |
| Unallocated corporate | (231,810) | | | (209,408) | | | (22,402) | | | 10.7 | % | | (0.1) | % |
| Total operating income | $ | 617,261 | | | $ | 650,975 | | | $ | (33,714) | | | (5.2) | % | | 1.6 | % |
| Operating income % of revenue | 14.9 | % | | 16.4 | % | | | | (150) bps | | |
The following presents and discusses our consolidated financial results by each of our reportable segments:
CHARLES RIVER LABORATORIES INTERNATIONAL, INC.
RMS
| | Fiscal Year | |
| 2020 | | 2019 | | $ change | | % change | | Impact of FX |
| (in millions, except percentages) |
| Fiscal Year | |
| 2023 | |
| 2023 | |
| 2023 | | | 2022 | | $ change | | % change | | Impact of FX |
| (in thousands, except percentages) | | | (in thousands, except percentages) |
| Revenue | Revenue | $ | 571.1 | | | $ | 537.1 | | | $ | 34.0 | | | 6.3 | % | | 0.6 | % | Revenue | $ | 792,343 | | | $ | | $ | 739,175 | | | $ | | $ | 53,168 | | | 7.2 | | 7.2 | % | | (0.6) | % |
| Cost of revenue (excluding amortization of intangible assets) | Cost of revenue (excluding amortization of intangible assets) | 368.9 | | | 333.7 | | | 35.2 | | | 10.6 | % | |
| Selling, general and administrative | Selling, general and administrative | 84.0 | | | 68.1 | | | 15.9 | | | 23.5 | % | |
| Selling, general and administrative | |
| Selling, general and administrative | |
| Amortization of intangible assets | |
| Amortization of intangible assets | |
| Amortization of intangible assets | Amortization of intangible assets | 15.5 | | | 1.4 | | | 14.1 | | | 1,019.3 | % | |
| Operating income | Operating income | $ | 102.7 | | | $ | 133.9 | | | $ | (31.2) | | | (23.3) | % | |
| Operating income | |
| Operating income | | $ | 154,666 | | | $ | 160,410 | | | $ | (5,744) | | | (3.6) | % | | (1.4) | % |
| Operating income % of revenue | Operating income % of revenue | 18.0 | % | | 24.9 | % | | | | (6.9) | % | |
RMS revenue increased $34.0$53.2 million or 6.3%, due primarily to the recent acquisitions of HemaCare and Cellero, which contributed $43.0 million and $5.1 million, respectively; higher research model services revenue, specifically our GEMS andthe Insourcing Solutions businesses;business, which included the acquisition of Explora BioLabs contributing $15.6 million, higher small research model product revenue in North America and China, and higher large model product revenue due to the acquisition of Noveprim, which contributed $6.1 million; partially offset by the effect of changes in foreign currency exchange rates. Partially offsetting these
increases were lower research model product revenue in North Americarates and Europe due to the impact of the COVID-19 pandemic.53rd week in fiscal year 2022, which had contributed $7.4 million to revenue.
RMS operating income decreased $31.2$5.7 million or 23.3%, compared to the corresponding period in 2019.fiscal year 2022. RMS operating income as a percentage of revenue for fiscal year 20202023 was 18.0%19.5%, a decrease of 6.9%220 bps from 24.9%21.7% for fiscal year 2022. Operating income and operating income as a percentage of revenue decreased due to higher amortization, operating, and staffing costs due to the corresponding periodacquisition of Explora BioLabs; mix of small research models products and services; and the effect of changes in 2019.foreign currency exchange rates.
DSA
| | | | | | | | | | | | | | | | | | | | | | | | | | | | | |
| Fiscal Year | | | | | | |
| 2023 | | 2022 | | $ change | | % change | | Impact of FX |
| (in thousands, except percentages) |
| Revenue | $ | 2,615,623 | | | $ | 2,447,316 | | | $ | 168,307 | | | 6.9 | % | | 0.3 | % |
| Cost of revenue (excluding amortization of intangible assets) | 1,675,472 | | | 1,617,760 | | | 57,712 | | | 3.6 | % | | |
| Selling, general and administrative | 263,770 | | | 213,870 | | | 49,900 | | | 23.3 | % | | |
| Amortization of intangible assets | 70,305 | | | 82,797 | | | (12,492) | | | (15.1) | % | | |
| Operating income | $ | 606,076 | | | $ | 532,889 | | | $ | 73,187 | | | 13.7 | % | | 1.9 | % |
| Operating income % of revenue | 23.2 | % | | 21.8 | % | | | | 140 bps | | |
DSA revenue increased $168.3 million due primarily to service revenue which increased in the Safety Assessment business due to increased demand, principally biopharmaceutical clients, pricing of services, and the acquisition of SAMDI contributing $7.0 million to service revenue; partially offset by decreases in our Discovery Services business and the effect of changes in foreign currency exchange rates and the impact of the 53rd week in fiscal year 2022, which had contributed $37.1 million to revenue.
DSA operating income increased $73.2 million compared to fiscal year 2022. DSA operating income as a percentage of revenue for fiscal year 2023 was 23.2%, an increase of 140 bps from 21.8% for fiscal year 2022. Operating income and operating income as a percentage of revenue increased primarily due to the contribution of higher revenue described above and lower amortization of intangible assets; partially offset by higher legal costs incurred in connection with investigations by the U.S government into the non-human primate supply chain, asset impairment charges related to a Discovery Services site closure and a recently divested site related to our Safety Assessment business, and the absence of certain favorable acquisition-related adjustments to contingent consideration arrangements incurred during 2022 which are recorded in selling, general and administrative costs.
CHARLES RIVER LABORATORIES INTERNATIONAL, INC.
Manufacturing
| | | | | | | | | | | | | | | | | | | | | | | | | | | | | |
| Fiscal Year | | | | | | |
| 2023 | | 2022 | | $ change | | % change | | Impact of FX |
| (in thousands, except percentages) |
| Revenue | $ | 721,443 | | | $ | 789,569 | | | $ | (68,126) | | | (8.6) | % | | 0.4 | % |
| Cost of revenue (excluding amortization of intangible assets) | 441,411 | | | 440,042 | | | 1,369 | | | 0.3 | % | | |
| Selling, general and administrative | 146,311 | | | 139,027 | | | 7,284 | | | 5.2 | % | | |
| Amortization of intangible assets | 45,392 | | | 43,416 | | | 1,976 | | | 4.6 | % | | |
| Operating income | $ | 88,329 | | | $ | 167,084 | | | $ | (78,755) | | | (47.1) | % | | 1.3 | % |
| Operating income % of revenue | 12.2 | % | | 21.2 | % | | | | (900) bps | | |
Manufacturing revenue decreased $68.1 million due primarily to the divestiture of our Avian business, which decreased revenue by $77.3 million, lower services revenue from our Biologics Testing business, and the impact of the 53rd week in fiscal year 2022 which contributed $8.2 million to revenue in the prior year; partially offset by increased CDMO and Microbial Solutions service revenue.
Manufacturing operating income decreased $78.8 million compared to fiscal year 2022. Manufacturing operating income as a percentage of revenue for fiscal year 2023 was 12.2%, a decrease of 900 bps from 21.2% for fiscal year 2022. Operating income and operating income as a percentage of revenue decreased primarily due to the divestiture of our Avian business, higher charges related to restructuring activities, and lower sales volume for research model productsoperating income due to the COVID-19 pandemic as described abovehigher operating costs within our Biologics Solutions business, an asset impairment charge, and due to an increase in amortization of intangible assets associated with the recent acquisitions of HemaCare and Cellero.
DSA
| | | | | | | | | | | | | | | | | | | | | | | | | | | | | |
| Fiscal Year | | | | | | |
| 2020 | | 2019 | | $ change | | % change | | Impact of FX |
| (in millions, except percentages) |
| Revenue | $ | 1,837.4 | | | $ | 1,619.0 | | | $ | 218.4 | | | 13.5 | % | | 0.4 | % |
| Cost of revenue (excluding amortization of intangible assets) | 1,245.2 | | | 1,104.1 | | | 141.1 | | | 12.8 | % | | |
| Selling, general and administrative | 178.6 | | | 176.9 | | | 1.7 | | | 1.0 | % | | |
| Amortization of intangible assets | 87.7 | | | 79.1 | | | 8.6 | | | 10.8 | % | | |
| Operating income | $ | 325.9 | | | $ | 258.9 | | | $ | 67.0 | | | 25.9 | % | | |
| Operating income % of revenue | 17.7 | % | | 16.0 | % | | | | 1.7 | % | | |
DSA revenue increased $218.4 million, or 13.5%, due primarily to service revenue increases in both the Safety Assessment and Discovery Services businesses due to demand from biotechnology clients and increased pricing of services; the acquisition of Citoxlab, which contributed $60.2 million to service revenue growth; and the effect of changes in foreign currency exchange rates. Additionally, DSA revenue was not significantly impacted by the COVID-19 pandemic during fiscal year 2020.
DSA operating income increased $67.0 million, or 25.9%, compared to the corresponding period in 2019. DSA operating income as a percentage of revenue for fiscal year 2020 was 17.7%, an increase of 1.7% from 16.0% for the corresponding period in 2019. These increases were primarily attributable to the higher revenue described above, realizing the benefit from operating efficiency and cost control initiatives, and lower acquisition related costs and severance costs, primarily impacting selling, general and administrative costs. These increases were partially offset by increased costs in both cost of revenue and selling, general, and administrative expenses related to recent site closures, and higher amortization of intangible assets associated with our recent acquisitions.
Manufacturing
| | | | | | | | | | | | | | | | | | | | | | | | | | | | | |
| Fiscal Year | | | | | | |
| 2020 | | 2019 | | $ change | | % change | | Impact of FX |
| (in millions, except percentages) |
| Revenue | $ | 515.4 | | | $ | 465.1 | | | $ | 50.3 | | | 10.8 | % | | 0.4 | % |
| Cost of revenue (excluding amortization of intangible assets) | 236.2 | | | 225.0 | | | 11.2 | | | 5.0 | % | | |
| Selling, general and administrative | 88.9 | | | 85.6 | | | 3.3 | | | 3.8 | % | | |
| Amortization of intangible assets | 8.8 | | | 9.1 | | | (0.3) | | | (3.3) | % | | |
| Operating income | $ | 181.5 | | | $ | 145.4 | | | $ | 36.1 | | | 24.8 | % | | |
| Operating income % of revenue | 35.2 | % | | 31.3 | % | | | | 3.9 | % | | |
Manufacturing revenue increased $50.3 million, or 10.8%, due primarily to higher service revenue in the Biologics business due to our facility in Pennsylvania being fully operational in 2020 compared to 2019 where work continued to be transitioned from a legacy facility; higher demand for products in both our Microbial Solutions’ Endotoxin business and our Avian business; and the effect of changes in foreign currency exchange rates; partially offset by lower product revenue in our Microbial Solutions’ Bioburden business, specifically due to the timing of a large stocking order from a strategic partner in 2019, which did not recur in 2020, and delays in instrument installations caused by the COVID-19 pandemic. Overall, Manufacturing revenue was not significantly impacted by the COVID-19 pandemic during fiscal year 2020.
Manufacturing operating income increased $36.1 million, or 24.8%, compared to the corresponding period in 2019. Manufacturing operating income as a percentage of revenue for fiscal year 2020 was 35.2%, an increase of 3.9% from 31.3%
for the corresponding period in 2019. The increases were due primarily to higher revenue as well as improved production efficiencies, including the absence of duplicative Biologics facilities in 2020 compared to 2019, and thea $19 million impact of operating efficiencies realized during fiscal year 2020 compared to fiscal year 2019.
Unallocated Corporate
| | | | | | | | | | | | | | | | | | | | | | | |
| Fiscal Year | | | | |
| 2020 | | 2019 | | $ change | | % change |
| (in millions, except percentages) |
| Unallocated corporate | $ | 177.4 | | | $ | 187.0 | | | $ | (9.6) | | | (5.2) | % |
| Unallocated corporate % of revenue | 6.1 | % | | 7.1 | % | | | | (1.0) | % |
Unallocated corporate costs consist of selling, general and administrative expenses that are not directly related or allocated to the reportable segments. The decrease in unallocated corporate costs of $9.6 million, or 5.2%, compared to the corresponding period in 2019 is predominantly associated with decreased costs associated with the evaluation and integration of our recent acquisition activity, as we temporarily slowed our acquisition activity during fiscal year 2020 in response to the COVID-19 pandemic. Costs as a percentage of revenue for fiscal year 2020 was 6.1%, a decrease of 1.0%favorable ruling from 7.1% for the corresponding period in 2019.
Interest Income Interest income, which represents earningstax authorities on cash, cash equivalents, and time deposits was $0.8 million and $1.5 million for fiscal years 2020 and 2019, respectively. The decrease of $0.7 million was primarily due to lower interest rates on invested funds in 2020 as compared to 2019.
Interest Expense Interest expense for fiscal year 2020 was $86.4 million, an increase of $25.5 million, or 42.0%, compared to $60.9 million for fiscal year 2019. The increase was due primarily to foreign currency losses recognized in connection with debt-related foreign exchange forward contracts in fiscal year 2020 compared to foreign currency gains recognized in fiscal year 2019.
Other Income, Net Other income, net, was $100.0 million for fiscal year 2020, an increase of $87.7 million, or 713.3%, compared to $12.3 million for fiscal year 2019. The increase was due to net gains on our venture capital and strategic equity investments of $100.9 million in fiscal year 2020 compared to $20.7 million in fiscal year 2019, resulting primarily from increases in fair value from our publicly-held investments, which included initial public offerings of certain portfolio companies; and foreign currency gains recognized in connection with a U.S. dollar denominated loan borrowed by a non-U.S. entity with a different functional currency in fiscal year 2020 as compared to foreign currency losses recognized in fiscal year 2019; partially offset by higher pension related costs recognized during fiscal year 2020, including a settlement loss of $10.3 million for the termination of the U.S. Pension Plan, as compared to fiscal year 2019.
Income Taxes Incomeindirect tax expense was $81.8 million for fiscal year 2020, an increase of $31.8 million, compared to $50.0 million for fiscal year 2019. Our effective tax rate was 18.3% for fiscal year 2020, compared to 16.5% for fiscal year 2019. The increase in our effective tax rate in the 2020 period compared to the 2019 period was primarily due to the recognition of $20.6 million of net operating loss deferred tax assets due to foreign finance structure changes in 2019, partially offset by state tax benefits from amended state tax returns and higher tax benefits from stock-based compensation deductions in 2020 compared to the corresponding period in 2019.
Fiscal Year 2019 Compared to Fiscal Year 2018
Revenue and Operating Income
The following tables present consolidated revenue by type and by reportable segment:
| | | | | | | | | | | | | | | | | | | | | | | |
| Fiscal Year | | | | |
| 2019 | | 2018 | | $ change | | % change |
| (in millions, except percentages) |
| Service revenue | $ | 2,029.4 | | | $ | 1,687.9 | | | $ | 341.5 | | | 20.2 | % |
| Product revenue | 591.8 | | | 578.2 | | | 13.6 | | | 2.4 | % |
| Total revenue | $ | 2,621.2 | | | $ | 2,266.1 | | | $ | 355.1 | | | 15.7 | % |
| | | | | | | | | | | | | | | | | | | | | | | | | | | | | |
| Fiscal Year | | | | | | |
| 2019 | | 2018 | | $ change | | % change | | Impact of FX |
| (in millions, except percentages) |
| RMS | $ | 537.1 | | | $ | 519.7 | | | $ | 17.4 | | | 3.3 | % | | (1.9) | % |
| DSA | 1,619.0 | | | 1,316.9 | | | 302.1 | | | 22.9 | % | | (1.1) | % |
| Manufacturing | 465.1 | | | 429.5 | | | 35.6 | | | 8.3 | % | | (2.7) | % |
| Total revenue | $ | 2,621.2 | | | $ | 2,266.1 | | | $ | 355.1 | | | 15.7 | % | | (1.5) | % |
The following table presents operating income by reportable segment:
| | | | | | | | | | | | | | | | | | | | | | | |
| Fiscal Year | | | | |
| 2019 | | 2018 | | $ change | | % change |
| (in millions, except percentages) |
| RMS | $ | 133.9 | | | $ | 136.5 | | | $ | (2.6) | | | (1.9) | % |
| DSA | 258.9 | | | 227.6 | | | 31.3 | | | 13.8 | % |
| Manufacturing | 145.4 | | | 136.2 | | | 9.2 | | | 6.8 | % |
| Unallocated corporate | (187.0) | | | (168.9) | | | (18.1) | | | 10.8 | % |
| Total operating income | $ | 351.2 | | | $ | 331.4 | | | $ | 19.8 | | | 6.0 | % |
| Operating income % of revenue | 13.4 | % | | 14.6 | % | | | | (1.2) | % |
The following presents and discusses our consolidated results by each of our reportable segments:
RMS
| | | | | | | | | | | | | | | | | | | | | | | | | | | | | |
| Fiscal Year | | | | | | |
| 2019 | | 2018 | | $ change | | % change | | Impact of FX |
| (in millions, except percentages) |
| Revenue | $ | 537.1 | | | $ | 519.7 | | | $ | 17.4 | | | 3.3 | % | | (1.9) | % |
| Cost of revenue (excluding amortization of intangible assets) | 333.7 | | | 319.8 | | | 13.9 | | | 4.3 | % | | |
| Selling, general and administrative | 68.1 | | | 61.8 | | | 6.3 | | | 10.1 | % | | |
| Amortization of intangible assets | 1.4 | | | 1.6 | | | (0.2) | | | (12.9) | % | | |
| Operating income | $ | 133.9 | | | $ | 136.5 | | | $ | (2.6) | | | (1.9) | % | | |
| Operating income % of revenue | 24.9 | % | | 26.3 | % | | | | (1.4) | % | | |
RMS revenue increased $17.4 million, or 3.3%, due primarily to higher research model services revenue and higher research model product revenue in China. Research model services benefited from a large government contract in the IS business and strong client demand in the GEMS business resulting from increased research and development activity conducted across biotechnology and academic institutional clients. Partially offsetting these increases were the effect of changes in foreign currency exchange rates and lower research model product revenue outside of China, particularly from large biopharmaceutical clients.
RMS operating income decreased $2.6 million, or 1.9%, compared to the corresponding period in 2018. RMS operating income as a percentage of revenue for fiscal year 2019 was 24.9%, a decrease of 1.4% from 26.3% for the corresponding period in 2018. Operating income and operating income as a percentage of revenue decreased primarily due to higher cost of revenue and selling, general, and administrative expenses to support the growth of the businesses, which included the following: a $2.2 million chargepositions recorded within selling, general and administrative costsexpense in fiscal year 2019 in connection with the modification of the option to purchase the remaining 8% equity interest in Vital River, increased investments in personnel (staffing levels and hourly wage increases), higher severance charges in connection with certain global restructuring initiatives, and facility expansions (primarily in China). In addition, operating income as a percentage of revenue decreased due to lower operating income margins on the aforementioned large government contract, and lower sales volume for research models outside of China.
DSA
| | | | | | | | | | | | | | | | | | | | | | | | | | | | | |
| Fiscal Year | | | | | | |
| 2019 | | 2018 | | $ change | | % change | | Impact of FX |
| (in millions, except percentages) |
| Revenue | $ | 1,619.0 | | | $ | 1,316.9 | | | $ | 302.1 | | | 22.9 | % | | (1.1) | % |
| Cost of revenue (excluding amortization of intangible assets) | 1,104.1 | | | 903.9 | | | 200.2 | | | 22.2 | % | | |
| Selling, general and administrative | 176.9 | | | 131.2 | | | 45.7 | | | 34.8 | % | | |
| Amortization of intangible assets | 79.1 | | | 54.2 | | | 24.9 | | | 45.9 | % | | |
| Operating income | $ | 258.9 | | | $ | 227.6 | | | $ | 31.3 | | | 13.8 | % | | |
| Operating income % of revenue | 16.0 | % | | 17.3 | % | | | | (1.3) | % | | |
DSA revenue increased $302.1 million, or 22.9%, due primarily to the recent acquisitions of Citoxlab and MPI Research, which contributed $123.7 million and $73.0 million, respectively, to service revenue growth. Additionally, service revenue increased in both the Safety Assessment and Discovery Services businesses due to demand from biotechnology clients and increased pricing of services. These increases were partially offset by the effect of changes in foreign currency exchange rates.
DSA operating income increased $31.3 million, or 13.8%, compared to the corresponding period in 2018. DSA operating income as a percentage of revenue for fiscal year 2019 was 16.0%, a decrease of 1.3% from 17.3% for the corresponding period in 2018. The increase to operating income was primarily attributable to contributions from our recent acquisitions of Citoxlab and MPI Research. This increase was partially offset by increased costs in both cost of revenue and selling, general, and administrative expenses to support the growth of the businesses, which included the following: increased investments in personnel (staffing levels and hourly wage increases); increased investments related to facility expansions; higher severance charges in connection with certain global restructuring initiatives, and higher amortization of intangible assets and acquisition and integration costs associated with our recent acquisitions. These increased costs collectively decreased operating income as a percentage of revenue in 2019 compared to 2018.
Manufacturing
| | | | | | | | | | | | | | | | | | | | | | | | | | | | | |
| Fiscal Year | | | | | | |
| 2019 | | 2018 | | $ change | | % change | | Impact of FX |
| (in millions, except percentages) |
| Revenue | $ | 465.1 | | | $ | 429.5 | | | $ | 35.6 | | | 8.3 | % | | (2.7) | % |
| Cost of revenue (excluding amortization of intangible assets) | 225.0 | | | 202.3 | | | 22.7 | | | 11.2 | % | | |
| Selling, general and administrative | 85.6 | | | 82.0 | | | 3.6 | | | 4.4 | % | | |
| Amortization of intangible assets | 9.1 | | | 9.0 | | | 0.1 | | | 0.3 | % | | |
| Operating income | $ | 145.4 | | | $ | 136.2 | | | $ | 9.2 | | | 6.8 | % | | |
| Operating income % of revenue | 31.3 | % | | 31.7 | % | | | | (0.4) | % | | |
Manufacturing revenue increased $35.6 million, or 8.3%, due primarily to higher demand for endotoxin products, bioburden products and services, and species identification services in the Microbial Solutions business and higher service revenue in the Biologics business; partially offset by the effect of changes in foreign currency exchange rates.
Manufacturing operating income increased $9.2 million, or 6.8%, compared to the corresponding period in 2018. Manufacturing operating income as a percentage of revenue for fiscal year 2019 was 31.3%, a decrease of 0.4% from 31.7% for the corresponding period in 2018. The increase to operating income was due primarily to the increase in revenue. This increase was partially offset by increased costs in both cost of revenue and selling, general, and administrative expenses to support the growth of the businesses, which included the following: increased investments in process improvements to further enhance Microbial Solutions’ operating efficiency; increased investments in personnel (staffing levels and hourly wage increases), and increased investments related to facility expansions (primarily in Biologics), and certain site consolidation costs. These increased costs collectively decreased operating income as a percentage of revenue in 2019 compared to 2018.
Unallocated Corporate
| | Fiscal Year | |
| 2019 | | 2018 | | $ change | | % change |
| (in millions, except percentages) |
| Fiscal Year | |
| 2023 | |
| 2023 | |
| 2023 | | | 2022 | | $ change | | % change |
| (in thousands, except percentages) | | | (in thousands, except percentages) |
| Unallocated corporate | Unallocated corporate | $ | 187.0 | | | $ | 168.9 | | | $ | 18.1 | | | 10.8 | % | Unallocated corporate | $ | 231,810 | | | $ | | $ | 209,408 | | | $ | | $ | 22,402 | | | 10.7 | | 10.7 | % |
| Unallocated corporate % of revenue | Unallocated corporate % of revenue | 7.1 | % | | 7.5 | % | | (0.4) | % | Unallocated corporate % of revenue | 5.6 | % | | 5.3 | % | | | | 30 bps |
Unallocated corporate costs consist of selling, general and administrative expenses that are not directly related or allocated to the reportable segments. The increase in unallocated corporate costs of $18.1$22.4 million, or 10.8%10.7%, compared to the corresponding period in 2018fiscal year 2022 is primarily related to an increase in our digital investments as well as higher variable compensation and benefits and other employee-related expenses; costs associated with the evaluation and integration of our recent acquisition activity; and costs related to the remediation of the unauthorized access into our information systems.expenses. Costs as a percentage of revenue for fiscal year 20192023 was 7.1%5.6%, a decreasean increase of 0.4%30 bps from 7.5% for the corresponding period in 2018.
Interest Income Interest income, which represents earnings on cash, cash equivalents, and time deposits was $1.5 million and $0.8 million5.3% for fiscal years 2019 and 2018, respectively. The increase of $0.7 million was primarily due to higher average cash balances in 2019 as compared to 2018.year 2022.
Other Income (Expense)
Interest Expense | | | | | | | | | | | | | | | | | | | | | | | |
| | | | | |
| | | | | | | |
| |
| | | | | | | |
| | | | | | | |
| | | | | | | |
| | | | | | | |
| | | | | | | |
| | | | | | | |
| Fiscal Year | | | | |
| December 30, 2023 | | December 31, 2022 | | $ change | | % change |
| (in thousands, except percentages) |
| Other income (expense): | | | | | | | |
| Interest income | $ | 5,196 | | | $ | 780 | | | $ | 4,416 | | | 566.2 | % |
| Interest expense | (136,710) | | | (59,291) | | | (77,419) | | | 130.6 | % |
| Other income, net | 95,537 | | | 30,523 | | | 65,014 | | | 213.0 | % |
| Total other expense, net | $ | (35,977) | | | $ | (27,988) | | | $ | (7,989) | | | 28.5 | % |
Interest expense for fiscal year 20192023 was $60.9$136.7 million, a decreasean increase of $2.9$77.4 million, or 4.5%130.6%, compared to $63.8$59.3 million forin fiscal year 2018.2022. The decreaseincrease was due primarily to a foreign currency gainhigher interest rates, and the absence of $49.7 million of gains recognized in connection with a debt-related foreign exchange forward contract and lower debt issuance costs incurred compared toin the corresponding period in 2018; partially offset by higher interest expense from increased debt to fund our recent acquisitions.2022.
Other Income, Net Other income, net for fiscal year 2023 was $12.3$95.5 million, an increase of $65.0 million, or 213.0%, compared to $30.5 million for fiscal year 2019,2022. The increase was due primarily to a decreasegain on acquisition of $1.0 million, or 7.3%, compared to $13.3$98.5 million for fiscal year 2018. The decrease was due to higherNoveprim, the absence of $46.5 million of foreign currency losses recognized in connection with a U.S. dollar denominated loan borrowed by a non-U.S. entity with a different functional currency, compared to the corresponding period in 2018 and higher pension-related costs as compared to the corresponding period in 2018; partially offset by higherlower net gainslosses incurred on our venture capital, other strategic equity investments, and our life insurance policy investments as compared to fiscal year 2022; partially offset by the corresponding periodabsence of a gain on the divestiture of our Avian business of $123.4 million in 2018.fiscal year 2022.
CHARLES RIVER LABORATORIES INTERNATIONAL, INC.
Income Taxes
| | | | | | | | | | | | | | | | | | | | | | | |
| Fiscal Year | | | | |
| 2023 | | 2022 | | $ change | | % change |
| (in thousands, except percentages) |
| Provision for income taxes | $ | 100,914 | | | $ | 130,379 | | | $ | (29,465) | | | (22.6) | % |
| Effective tax rate | 17.4 | % | | 20.9 | % | | | | (350) bps |
Income tax expense for fiscal year 2023 was $50.0$100.9 million, a decrease of $29.5 million compared to $130.4 million for fiscal year 2019, a decrease of $4.5 million, compared to $54.5 million for fiscal year 2018.2022. Our effective tax rate was 16.5%17.4% for fiscal year 2019,2023 compared to 19.3%20.9% for fiscal year 2018.2022. The decrease in our effective tax rate in the 2019 periodfiscal year 2023 compared to the 2018 periodfiscal year 2022 was primarily dueattributable to recognizingthe impact of the non-taxable gain on Noveprim of $98.5 million; partially offset by a $20.6 million deferreddecreased tax asset in fiscal year 2019 for net operating losses expected to be utilized in the future due to changes in our international financing structure.
benefit from stock-based compensation deductions.
Liquidity and Capital Resources
Liquidity and Cash Flows
We currently require cash to fund our working capital needs, capital expansion, acquisitions, and to pay our debt, lease, venture capital investment,and strategic equity investments, and pension obligations. Our principal sources of liquidity have been our cash flows from operations, recent divestitures, supplemented by long-term borrowings. Based on our current business plan, we believe that our existing funds, when combined with cash generated from operations and our access to financing resources, are sufficient to fund our operations for the foreseeable future as previously discussed in our section on the COVID-19 pandemic impacts.future.
The following table presents our cash, cash equivalents and short-term investments:
| | | | | | | | | | | |
| December 26, 2020 | | December 28, 2019 |
| (in millions) |
| Cash and cash equivalents: | | | |
| Held in U.S. entities | $ | 11.8 | | | $ | 56.5 | |
| Held in non-U.S. entities | 216.6 | | | 181.5 | |
| Total cash and cash equivalents | 228.4 | | | 238.0 | |
| Short-term investments: | | | |
| Held in non-U.S. entities | 1.0 | | | 1.0 | |
| Total cash, cash equivalents and short-term investments | $ | 229.4 | | | $ | 239.0 | |
Borrowings
On March 26, 2018, we amended and restated our $1.65 billion credit facility, which extended the maturity date and provided for a $750.0 million term loan and a $1.55 billion multi-currency revolving facility (Credit Facility). The term loan facility matures in 19 quarterly installments with the last installment due March 26, 2023. The revolving facility matures on March 26, 2023, and requires no scheduled payment before that date. On October 23, 2019, we prepaid $500.0 million of the term loan with proceeds from a $500.0 million unregistered private offering (see 2028 Senior Notes below). Additionally, on November 4, 2019, we further amended and restated the Credit Facility to increase the multi-currency revolving facility by $500.0 million, from $1.55 billion to $2.05 billion. Under specified circumstances, we have the ability to increase the term loan and/or revolving facility by up to $1.0 billion in the aggregate.
On April 3, 2018, we entered into an indenture (Base Indenture) with MUFG Union Bank, N.A. to allow for senior notes offerings under supplemental indentures. Concurrently on April 3, 2018, we entered into our first supplemental indenture and raised $500.0 million in aggregate principal amount of 5.5% Senior Notes due in 2026 (2026 Senior Notes) in an unregistered offering. Under the terms of the first supplemental indenture, interest on the 2026 Senior Notes is payable semi-annually on April 1 and October 1, beginning on October 1, 2018. On October 23, 2019, we entered into our second supplemental indenture and raised an additional $500.0 million in aggregate principal amount of 4.25% Senior Notes due in 2028 (2028 Senior Notes) in an unregistered offering. Under the terms of the second supplemental indenture, interest on the 2028 Senior Notes is payable semi-annually on May 1 and November 1, beginning on May 1, 2020.
Amounts outstanding under our credit facilities and both the 2026 Senior Notes and the 2028 Senior Notes were as follows:
| | | | | | | | | | | |
| December 26, 2020 | | December 28, 2019 |
| (in millions) |
| Term loans | $ | 146.9 | | | $ | 193.8 | |
| Revolving facility | 814.8 | | | 676.1 | |
| 2026 Senior Notes | 500.0 | | | 500.0 | |
| 2028 Senior Notes | 500.0 | | | 500.0 | |
| Total | $ | 1,961.7 | | | $ | 1,869.9 | |
The interest rates applicable to the term loan and revolving facility under the Credit Facility are, at our option, equal to either the base rate (which is the higher of (1) the prime rate, (2) the federal funds rate plus 0.50%, or (3) the one-month adjusted LIBOR rate plus 1.0%) or the adjusted LIBOR rate, plus an interest rate margin based upon our leverage ratio.
We entered into foreign exchange forward contracts during fiscal years 2020 and 2019 to limit our foreign currency exposure related to a U.S. dollar denominated loan borrowed by a non-U.S. Euro functional currency entity under the Credit Facility.
The acquisition of HemaCare on January 3, 2020 for $379.8 million in cash was funded through a combination of available cash and proceeds from our Credit Facility under the multi-currency revolving facility.
The acquisition of Distributed Bio on December 31, 2020 (fiscal year 2021) for approximately $83 million in cash was funded through a combination of available cash and proceeds from our Credit Facility under the multi-currency revolving facility.
The intended acquisition of Cognate BioServices, Inc. along with the associated fees are expected to be funded through a combination of available cash and proceeds from our Credit Facility under the multi-currency revolving facility.
Repurchases of Common Stock
During fiscal year 2020, we did not repurchase any shares under our authorized $1.3 billion stock repurchase program. As of December 26, 2020, we had $129.1 million remaining on the authorized stock repurchase program. Our stock-based compensation plans permit the netting of common stock upon vesting of restricted stock, restricted stock units, and performance share units in order to satisfy individual statutory tax withholding requirements. During fiscal year 2020, we acquired 0.1 million shares for $24.0 million through such netting.
Cash Flows | | | | | | | | | | | |
| December 30, 2023 | | December 31, 2022 |
| (in thousands) |
| Cash and cash equivalents: | | | |
| Held in U.S. entities | $ | 2,234 | | | $ | 15,813 | |
| Held in non-U.S. entities | 274,537 | | | 218,099 | |
| Total cash and cash equivalents | 276,771 | | | 233,912 | |
| Short-term investments: | | | |
| Held in non-U.S. entities | 68 | | | 998 | |
| Total cash, cash equivalents and short-term investments | $ | 276,839 | | | $ | 234,910 | |
The following table presents our net cash provided by operating activities:
| | Fiscal Year |
| 2020 | | 2019 | | 2018 |
| (in millions) |
Income from continuing operations, net of income taxes | $ | 365.3 | | | $ | 254.1 | | | $ | 227.2 | |
| Adjustments to reconcile income from continuing operations, net of income taxes, to net cash provided by operating activities | 207.5 | | | 220.7 | | | 199.1 | |
| Fiscal Year | | | Fiscal Year |
| 2023 | | | 2023 | | 2022 |
| (in thousands) | | | (in thousands) |
| Net income | |
| Adjustments to reconcile net income to net cash provided by operating activities | |
| Changes in assets and liabilities | Changes in assets and liabilities | (26.2) | | | 6.1 | | | 14.8 | |
| Net cash provided by operating activities | Net cash provided by operating activities | $ | 546.6 | | | $ | 480.9 | | | $ | 441.1 | |
Net cash provided by cash flows from operating activities represents the cash receipts and disbursements related to all of our activities other than investing and financing activities. Operating cash flow is derived by adjusting our net income from continuing operations for (1) non-cash operating items such as depreciation and amortization, stock-based compensation, loss on debt extinguishment and other financing costs, deferred income taxes, long-lived asset impairment changes, gains and/or losses on venture capital and strategic equity investments, gains and/or losses on divestitures, changes in fair value of contingent consideration, as well as (2) changes in operating assets and liabilities, which reflect timing differences between the receipt and payment of cash associated with transactions and when they are recognized in our results of operations. ForDuring fiscal year 2020,2023, our cash flows from operations was $683.9 million compared towith $619.6 million for fiscal year 2019, the increase in net cash provided by operating activities was driven by higher net income and certain favorable changes in working capital items, including favorable timing of certain government deferrals of payroll tax payments, and compensation related items; partially offset by the timing of vendor and supplier payments and collections of net contract balances from contracts with customers (collectively trade receivables, net; deferred revenue; and customer contract deposits); and certain pension related payments compared to the same period in 2019. For fiscal year 2019, compared to fiscal year 2018, the2022. The increase in net cash provided by operating activities was primarily driven by an increase in income from continuing operations, net of income taxesthe amounts and the favorable timing of vendor and supplier payments compared to the same period in 2018; partially offset by unfavorable changes in working capital items, specifically related to the timing of net contract balances from contracts with customers (collectively trade receivables, net; deferred revenue; and customer contract deposits), increases in inventory levels in response to customer demand, and higher compensation payments compared to the prior year period.and inventory purchases.
The following table presents our net cash used in investing activities:
| | Fiscal Year |
| 2020 | | 2019 | | 2018 |
| (in millions) |
| Fiscal Year | | | Fiscal Year |
| 2023 | | | 2023 | | 2022 |
| (in thousands) | | | (in thousands) |
| Acquisitions of businesses and assets, net of cash acquired | Acquisitions of businesses and assets, net of cash acquired | $ | (418.6) | | | $ | (515.7) | | | $ | (824.9) | |
| Capital expenditures | Capital expenditures | (166.6) | | | (140.5) | | | (140.1) | |
| Proceeds from sale of businesses, net | |
| Investments, net | Investments, net | (15.3) | | | (21.4) | | | 10.7 | |
| Other, net | Other, net | (1.0) | | | (3.9) | | | (0.7) | |
| Net cash used in investing activities | Net cash used in investing activities | $ | (601.5) | | | $ | (681.5) | | | $ | (955.0) | |
The primary use of cash used in investing activities in fiscal year 20202023 related to the acquisitions of HemaCareNoveprim and Cellero,SAMDI, capital expenditures to support the growth of the business, and investments in certain venture capital and strategic equity investments. The primary use of cash used in investing activities in fiscal year 20192022 related to the acquisition of Citoxlab, the acquisition of a supplier,Explora BioLabs, capital expenditures to support the growth of the business, and investments in certain venture capital and strategic equity investments. The primary use of cash in fiscal year 2018 related to our acquisitions of MPI Research and KWS BioTest, and our capital expenditures to support the growth of the business;investments; partially offset by proceeds from net investments, which primarily relate to short-term investments held bythe sale of our U.K. operations.Avian business.
The following table presents our net cash provided bused iny financing activities:
| | Fiscal Year |
| 2020 | | 2019 | | 2018 |
| (in millions) |
| Fiscal Year | | | Fiscal Year |
| 2023 | | | 2023 | | 2022 |
| (in thousands) | | | (in thousands) |
| Proceeds from long-term debt and revolving credit facility | Proceeds from long-term debt and revolving credit facility | $ | 2,231.0 | | | $ | 3,358.5 | | | $ | 2,755.0 | |
| Payments on long-term debt, revolving credit facility, and finance lease obligations | Payments on long-term debt, revolving credit facility, and finance lease obligations | (2,200.4) | | | (3,124.6) | | | (2,201.0) | |
| Proceeds from exercises of stock options | Proceeds from exercises of stock options | 46.6 | | | 34.5 | | | 37.7 | |
| Payments on debt financing costs | — | | | (6.6) | | | (18.3) | |
| Purchase of treasury stock | Purchase of treasury stock | (24.0) | | | (18.1) | | | (13.8) | |
| | Purchases of additional equity interests, net | |
| Purchases of additional equity interests, net | |
| Purchases of additional equity interests, net | |
| Payment of contingent considerations | |
| Other, net | Other, net | (6.0) | | | (11.8) | | | (1.5) | |
| Net cash provided by financing activities | $ | 47.2 | | | $ | 231.9 | | | $ | 558.1 | |
| Net cash used in financing activities | |
For fiscal year 2020,2023, net cash provided byused in financing activities reflected the net proceeds of $30.6 millionwas primarily driven by debt repayments on our long-term debt, revolving credit facility, and finance lease obligations. Included in the net proceeds are the following amounts:
•Proceeds of approximately $415 million from our revolving Credit Facility offset by borrowings to fund ourthe recent acquisitions. Additionally, towards the endacquisition of the first fiscal quarter, we borrowed an additional $150 million from our revolving Credit Facility to secure available cash in response to uncertainties due to the COVID-19 pandemic; partially offset by,Noveprim.
•Payments of approximately $47 million on our term loan and net payments of $476 million to our revolving Credit Facility throughout fiscal year 2020, which included the repayment of the $150 million additional borrowings during the first fiscal quarter of 2020;
•Additionally, we had $1.6 billion of gross payments, partially offset by $1.6 billion of gross proceeds in connection with a non-U.S. Euro functional currency entity repaying Euro loans and replacing the Euro loans with U.S. dollar denominated loans. A series of forward currency contracts were executed to mitigate any foreign currency gains or losses on the U.S. dollar denominated loans. These proceeds and payments are presented as gross financing activities.
Net cash provided byused in financing activities also reflected proceeds from exercises of employee stock options of $46.6 million, partially offset by treasury stock purchases of $24.0$24.2 million made due to the netting of common stock upon vesting of stock-based awards in order to satisfy individual statutory tax withholding requirements.
Forrequirements, $4.8 million payment to purchase the remaining 8% interest in our Vital River subsidiary, $4.0 million of dividends paid to noncontrolling interests, and $2.7 million of contingent consideration payments; partially offset by proceeds from exercises of employee stock options of $25.6 million. We did not pay any dividends on our Common Stock in fiscal year 2019,2023 and have no current plans to do so in the coming fiscal year.
For fiscal year 2022, net cash provided byused in financing activities reflected the net proceeds of $233.9$19.8 million on our long-term debt, revolving credit facility,Credit Facility and finance lease obligations. Included in the net proceeds are the following amounts:
•ProceedsBorrowings under our Credit Facility of $494$300 million, received fromwhich were used primarily for the issuanceacquisition of the 2028 Senior NotesExplora BioLabs;
•Net repayments of $100 million on October 23, 2019, proceeds of approximately $581 million from our revolving credit facility to fund our recent acquisitions; and $98 million of proceeds from our revolving credit facility to fund activities in the normal course of business; partially offset by,Credit Facility throughout fiscal year 2022;
•Payments of $537.5 million on our term loan, which included the $500.0 million prepayment on November 4, 2019, and approximately $151 million of repayments to our revolving credit facility in the normal course of business;
•Additionally, we had $2.4$2.0 billion of gross payments, partially offset by $2.2$1.9 billion of gross proceeds in connection with a non-U.S. Euro functional currency entity repaying Euro loans and replacing the Euro loans with U.S. dollar denominated loans. A series of forward currency contracts were executed to mitigate any foreign currency gains or losses on the U.S. dollar denominated loans. These proceeds and payments are presented as gross financing activities.
Net cash provided byused in financing activities also reflected proceeds from exercises of employee stock options of $34.5 million. Net cash provided by financing activities was partially offset by treasury stock purchases of $18.1$38.7 million made due to the netting of common stock upon vesting of stock-based awards in order to satisfy individual statutory tax withholding requirements, and theapproximately $15 million payment to purchase of an additional 5% equity10% interest in Vital River for $7.9a subsidiary, $15.7 million which is includedpayment to acquire the remaining 2% ownership interest in Other, net.
For fiscal year 2018, net cash provided by financing activities reflected the incremental proceeds from the refinancing of our previous $1.65 Billion Credit Facility to the $2.3 Billion Credit Facility and the proceeds from our $500.0 million 2026 Senior Notes. Subsequent to refinancing our $2.3 Billion Credit Facility, we repaid €300Cognate, $10.4 million of our revolving facility borrowedcontingent consideration payments, and $5.3 million of dividends paid to noncontrolling interests; partially offset by a non-U.S. Euro functional currency entity and replaced the borrowing with a $343 million U.S. dollar denominated loan. A forward currency contract was then executed to mitigate any foreign currency gains or losses on the $343 million U.S. dollar denominated loan. Additionally, proceeds from exercises of employee stock options of $37.7 million; partially offset by payments on debt financing costs of $18.3 million, and treasury stock purchases of $13.8 million made due to the netting of common stock upon vesting of stock-based awards in order to satisfy individual statutory tax withholding requirements.
Contractual Commitments and Obligations
Minimum future payments of our contractual obligations as of December 26, 2020 are as follows:
| | | | | | | | | | | | | | | | | | | | | | | | | | | | | |
| Payments Due by Period |
| Total | | Less than
1 Year | | 1 - 3 Years | | 3 - 5 Years | | More Than
5 Years |
| (in millions) |
Notes payable (1) | $ | 1,965.1 | | | $ | 47.2 | | | $ | 915.2 | | | $ | 0.7 | | | $ | 1,002.0 | |
Operating leases (2) | 345.4 | | | 33.5 | | | 68.0 | | | 66.3 | | | 177.6 | |
| Finance leases | 38.1 | | | 4.2 | | | 7.0 | | | 6.0 | | | 20.9 | |
Redeemable noncontrolling interests (3) | 23.1 | | | 16.3 | | | 6.8 | | | — | | | — | |
Venture capital investment commitments (4) | 44.6 | | | 36.5 | | | 8.1 | | | — | | | — | |
Contingent payments (5) | 2.3 | | | — | | | 2.3 | | | — | | | — | |
Unconditional purchase obligations (6) | 197.4 | | | 166.1 | | | 30.6 | | | 0.7 | | | — | |
| Total contractual cash obligations | $ | 2,616.0 | | | $ | 303.8 | | | $ | 1,038.0 | | | $ | 73.7 | | | $ | 1,200.5 | |
(1)Notes payable includes the principal payments on our debt, which include our $2.3B Credit Facility, our Senior Notes and Other debt.
(2)We lease properties and equipment for use in our operations. In addition to rent, the leases may require us to pay additional amounts for taxes, insurance, maintenance, and other operating expenses. Amounts reflected within the table detail future minimum rental commitments under non-cancellable operating leases, net of income from subleases, for each of the periods presented. Approximately $130 million of contractually committed lease payments are reflected in the table for which leases have not yet commenced, as we do not yet control the underlying assets.
(3)The estimated cash obligation for redeemable noncontrolling interests are based on the amount that would be paid if settlement occurred as of the balance sheet date based on the contractually defined redemption value as of December 26, 2020.
(4)The timing of the remaining capital commitment payments to venture capital funds is subject to the procedures of the limited liability partnerships and limited liability companies; the above table reflects the earliest possible date the payment can be required under the relevant agreements.
(5)In connection with certain business and asset acquisitions, we agreed to make additional payments aggregating to $2.3 million based upon the achievement of certain financial targets in connection with the respective acquisition. The contingent payment obligations included in the table above have not been probability adjusted or discounted.$25.1 million.
(6)Unconditional purchase obligations include agreements to purchase goods or services that are enforceableFinancing and legally binding and that specify all significant terms, including fixed or minimum quantities to be purchased, fixed, minimum or variable price provisions, and the approximate timing of the transaction. Purchase obligations exclude agreements that are cancellable at any time without penalty.
The above table excludes obligations related to our pension and other post-retirement benefit plans. Refer to Item 8, “Financial Statements and Supplementary Data,” in this Annual Report on Form 10-K for more details.
Tax Related Obligations
We excluded liabilities pertaining to uncertain tax positions from our summary of contractual obligations presented above, as we cannot make a reliable estimate of the period of cash settlement with the respective taxing authorities. As of December 26, 2020, we had $25.0 million of liabilities associated with uncertain tax positions.
Additionally, we excluded federal and state income tax liabilities of $48.8 million from our summary of contractual obligations presented above, relating to the one-time Transition Tax on unrepatriated earnings under U.S. Tax Reform. The Transition Tax will be paid, interest free, over an eight-year period through 2026.
Off-Balance Sheet Arrangements
As of December 26, 2020, we did not have any significant off-balance sheet arrangements, as defined in Item 303(a)(4)(ii) of SEC Regulation S-K promulgated under the Exchange Act, except as disclosed below.
Venture Capital Investments
We invest in several venture capital funds that invest in start-up companies, primarily in the life sciences industry. Our total commitment to the funds as of December 26, 2020 was $139.9 million, of which we funded $95.3 million through December 26, 2020. Refer to Note 6, “Venture Capital and Strategic Equity Investments,” to our consolidated financial statements contained in Item 8, “Financial Statements and Supplementary Data,” in this Annual Report on Form 10-K for further details.
Letters of Credit
Our off-balance sheet commitments related to our outstanding letters of credit as of December 26, 2020 were $16.0 million.
Item 7A. Quantitative and Qualitative Disclosures about Market Risk
We are exposed to market risk from changes in interest rates and currency exchange rates, which could affect our future results of operations and financial condition. We manage our exposure to these risks through our regular operating and financing activities.
Interest Rate RiskAmounts outstanding under our Credit Facility and our Senior Notes were as follows:
We are exposed to changes in | | | | | | | | | | | |
| December 30, 2023 | | December 31, 2022 |
| (in thousands) |
| Revolving facility | $ | 1,129,243 | | | $ | 1,197,586 | |
| 4.25% Senior Notes due 2028 | 500,000 | | | 500,000 | |
| 3.75% Senior Notes due 2029 | 500,000 | | | 500,000 | |
| 4.0% Senior Notes due 2031 | 500,000 | | | 500,000 | |
| Total | $ | 2,629,243 | | | $ | 2,697,586 | |
The interest rates while conducting normal business operationsapplicable to the Credit Facility are equal to (A) for revolving loans denominated in U.S. dollars, at the Company’s option, either the base rate (which is the higher of (1) the prime rate, (2) the federal funds rate plus 0.50%, or (3) the one-month adjusted SOFR rate plus 1.0%) or the adjusted SOFR rate, (B) for revolving loans denominated in euros, the adjusted EURIBOR rate and (C) for revolving loans denominated in sterling, the daily simple SONIA rate, in each case, plus an interest rate margin based upon the Company’s leverage ratio. In March 2023 and in conjunction with the Credit Agreement second amendment (Second Amendment) the Company modified the variable rate on the Credit Facility from adjusted LIBOR to adjusted term SOFR. All outstanding U.S. dollar borrowings remained at adjusted LIBOR through their respective interest reset periods in April 2023 and were then set to term SOFR.
Our 2028 Senior Notes have semi annual interest payments due May 1 and November 1. Our 2029 and 2031 Senior Notes have semi annual interest payments due March 15 and September 15.
During the fourth fiscal quarter of 2022, we entered into an interest rate swap with a notional amount of $500 million to manage interest rate fluctuation related to our floating rate borrowings under the Credit Facility, at a fixed rate of 4.70%. In March 2023 and in conjunction with the Second Amendment, we modified the variable rate on our interest rate swap from 1-month LIBOR to 1-month term SOFR. Effective with the modification we will pay a fixed rate of 4.65% on our swap maturing November 2, 2024. The transition did not have an impact on our hedge accounting or a material impact to our consolidated financial statements.
Our off-balance sheet commitments related to our outstanding letters of credit as a result of ongoing financing activities. As of December 26, 2020, our debt portfolio was comprised primarily of floating interest rate borrowings. A 100-basis point increase in interest rates would increase our annual pre-tax interest expense by $9.630, 2023 were $21.6 million.
Foreign Currency Exchange Rate Risk
We operate on a global basis and have exposure to some foreign currency exchange rate fluctuations for our financial position, results of operations, and cash flows.
While the financial results of our global activities are reported in U.S. dollars, our foreign subsidiaries typically conduct their operations in their respective local currency. The principal functional currencies of the Company’sour foreign subsidiaries are the Euro, British Pound, and Canadian Dollar, and Chinese Yuan Renminbi.Dollar. During fiscal year 2020,2023, the most significant drivers of foreign currency translation adjustment the Companywe recorded as part of other comprehensive income (loss) were the Euro, British Pound, Euro, Canadian Dollar, Chinese Yuan Renminbi, Japanese Yen and Brazilian Real.Hungarian Forint.
Fluctuations in the foreign currency exchange rates of the countries in which we do business will affect our financial position, results of operations, and cash flows. As the U.S. dollar strengthens against other currencies, the value of our non-U.S. revenue, expenses, assets, liabilities, and cash flows will generally decline when reported in U.S. dollars. The impact to net income as a result of a U.S. dollar strengthening will be partially mitigated by the value of non-U.S. expenses, which will decline when reported in U.S. dollars. As the U.S. dollar weakens versus other currencies, the valuevalue of the non-U.S. revenue, expenses, assets, liabilities, and cash flows will generally increase when reported in U.S. dollars. For fiscal year 2020,2023, our revenue would
have increaseddecreased by $96.1$126.7 million and our operating income would have increaseddecreased by $0.4$2.8 million, if the U.S. dollar exchange rate had strengthened by 10%10%, with all other variables held constant.
We attempt to minimize this exposure by using certain financial instruments in accordance with our overall risk management and our hedge policy. We do not enter into speculative derivative agreements.
During fiscal years 2020, 2019 and 2018, weWe entered into foreign exchange forward contracts during fiscal year December 31, 2022 to limit our foreign currency exposure related to both intercompany loans and a U.S. dollar denominated loan borrowed by a non-U.S. Euro functional currency entity under ourthe Credit Facility. Refer to Note 14, “Foreign Currency Contracts,11. Debt and Other Financing Arrangements to our consolidated financial statements contained in Item
CHARLES RIVER LABORATORIES INTERNATIONAL, INC.
8, “Financial Statements and Supplementary Data,” in this Annual Report on Form 10-K for further details regarding these types of forward contracts.
Repurchases of Common Stock
During fiscal year 2023, we did not repurchase any shares under our authorized $1.3 billion stock repurchase program. As of December 30, 2023, we had $129.1 million remaining on the authorized stock repurchase program. Our stock-based compensation plans permit the netting of common stock upon vesting of restricted stock, restricted stock units, and performance share units in order to satisfy individual statutory tax withholding requirements. During fiscal year 2023, we acquired 0.1 million shares for $24.2 million through such netting.
Commitments and Other Purchasing Arrangements
We lease properties and equipment for use in our operations. In addition to rent, the leases may require us to pay additional amounts for taxes, insurance, maintenance, and other operating expenses. As of December 30, 2023, we had $757.4 million of operating leases inclusive of future minimum rental commitments under non-cancellable operating leases, net of income from subleases as well as $39.9 million of financing leases. The expected payments of our operating and finance lease liabilities over the next twelve months are $70.6 million and $3.8 million, respectively as of December 30, 2023.
In addition to the obligations on the balance sheet at December 30, 2023, we entered into unconditional purchase obligations in the ordinary course of business. Unconditional purchase obligations include agreements to purchase goods or services that are enforceable and legally binding and that specify all significant terms, including fixed or minimum quantities to be purchased, fixed, minimum or variable price provisions, and the approximate timing of the transaction. Purchase obligations exclude agreements that are cancellable at any time without penalty. As of December 30, 2023, we had approximately $390 million of unconditional purchase obligations, the majority of which are expected to be settled during 2024.
We invest in several venture capital funds that invest in start-up companies, primarily in the life sciences industry. Our total commitment to the funds as of December 30, 2023 was $212.9 million, of which we funded $145.2 million through December 30, 2023.
Refer to Note 8. Venture Capital and Strategic Equity Investments to our consolidated financial statements contained in Item 8, “Financial Statements and Supplementary Data,” in this Annual Report on Form 10-K for further details regarding these typesdetails.
In connection with certain business and asset acquisitions, we agreed to make additional payments based upon the achievement of forward contracts.certain financial targets and other milestones in connection with the respective acquisition. As of December 30, 2023, we had approximately $98 million of gross contingent payments, of which $33 million are expected to be paid.
We have certain federal and state income tax liabilities of $32.4 million relating to the one-time Transition Tax on unrepatriated earnings under the 2017 Tax Act. The Transition Tax will be paid, interest free, over an eight-year period through 2026.
Item 7A. Quantitative and Qualitative Disclosures about Market Risk
The information called for by this item is incorporated herein by reference to “Item 7. Management’s Discussion and Analysis of Results of Operations - Liquidity and Capital Resources” of this Report; and Note 1 “Description of Business and Summary of Significant Accounting Policies - Fair Value” included in Item 8 of this Report.
Item 8. Financial Statements and Supplementary Data
INDEX TO CONSOLIDATED FINANCIAL STATEMENTS
Report of Independent Registered Public Accounting Firm
To the Board of Directors and Shareholders of Charles River Laboratories International, Inc.:
Opinions on the Financial Statements and Internal Control over Financial Reporting
We have audited the accompanying consolidated balance sheets of Charles River Laboratories International, Inc. and its subsidiaries (the “Company”) as of December 26, 202030, 2023 and December 28, 2019,31, 2022, and the related consolidated statements of income, of comprehensive income, of changes in equity and of cash flows for each of the three years in the period ended December 26, 2020,30, 2023, including the related notes (collectively referred to as the “consolidated financial statements”). We also have audited the Company's internal control over financial reporting as of December 26, 2020,30, 2023, based on criteria established in Internal Control - Integrated Framework (2013) issued by the Committee of Sponsoring Organizations of the Treadway Commission (COSO).
In our opinion, the consolidated financial statements referred to above present fairly, in all material respects, the financial position of the Company as of December 26, 202030, 2023 and December 28, 2019,31, 2022, and the results of its operations and its cash flows for each of the three years in the period ended December 26, 202030, 2023 in conformity with accounting principles generally accepted in the United States of America. Also in our opinion, the Company maintained, in all material respects, effective internal control over financial reporting as of December 26, 2020,30, 2023, based on criteria established in Internal Control - Integrated Framework (2013) issued by the COSO.
Change in Accounting Principle
As discussed in Note 1 to the consolidated financial statements, the Company changed the manner in which it accounts for leases in 2019.
Basis for Opinions
The Company's management is responsible for these consolidated financial statements, for maintaining effective internal control over financial reporting, and for its assessment of the effectiveness of internal control over financial reporting, included in Management’s Report on Internal Control Over Financial Reporting appearing under Item 9A. Our responsibility is to express opinions on the Company’s consolidated financial statements and on the Company's internal control over financial reporting based on our audits. We are a public accounting firm registered with the Public Company Accounting Oversight Board (United States) (PCAOB) and are required to be independent with respect to the Company in accordance with the U.S. federal securities laws and the applicable rules and regulations of the Securities and Exchange Commission and the PCAOB.
We conducted our audits in accordance with the standards of the PCAOB. Those standards require that we plan and perform the audits to obtain reasonable assurance about whether the consolidated financial statements are free of material misstatement, whether due to error or fraud, and whether effective internal control over financial reporting was maintained in all material respects.
Our audits of the consolidated financial statements included performing procedures to assess the risks of material misstatement of the consolidated financial statements, whether due to error or fraud, and performing procedures that respond to those risks. Such procedures included examining, on a test basis, evidence regarding the amounts and disclosures in the consolidated financial statements. Our audits also included evaluating the accounting principles used and significant estimates made by management, as well as evaluating the overall presentation of the consolidated financial statements. Our audit of internal control over financial reporting included obtaining an understanding of internal control over financial reporting, assessing the risk that a material weakness exists, and testing and evaluating the design and operating effectiveness of internal control based on the assessed risk. Our audits also included performing such other procedures as we considered necessary in the circumstances. We believe that our audits provide a reasonable basis for our opinions.
As described in Management’s Report on Internal Control Over Financial Reporting, management has excluded HemaCare and CelleroNoveprim Group (“Noveprim”) from its assessment of internal control over financial reporting as of December 26, 202030, 2023, because they wereit was acquired by the Company in a purchase business combinationscombination during 2020.2023. We have also excluded HemaCare and CelleroNoveprim from our audit of internal control over financial reporting. HemaCare and Cellero are wholly-owned subsidiariesNoveprim is a subsidiary whose total assets and total revenues excluded from management’s assessment and our audit of internal control over financial reporting collectively represent 1.0% and 1.6%less than 1%, respectively, of the related consolidated financial statement amounts as of and for the year ended December 26, 2020.
Definition and Limitations of Internal Control over Financial Reporting
A company’s internal control over financial reporting is a process designed to provide reasonable assurance regarding the reliability of financial reporting and the preparation of financial statements for external purposes in accordance with generally accepted accounting principles. A company’s internal control over
CHARLES RIVER LABORATORIES INTERNATIONAL, INC.
financial reporting includes those policies and procedures that (i) pertain to the maintenance of records that, in reasonable detail, accurately and fairly reflect the transactions and dispositions of the assets of the company; (ii) provide reasonable assurance that transactions are recorded as necessary to permit preparation of financial statements in accordance with generally accepted accounting principles, and that receipts and expenditures of the company are being made only in accordance with authorizations of management and directors of the company; and (iii) provide reasonable assurance regarding prevention or timely detection of unauthorized acquisition, use, or disposition of the company’s assets that could have a material effect on the financial statements.
Because of its inherent limitations, internal control over financial reporting may not prevent or detect misstatements. Also, projections of any evaluation of effectiveness to future periods are subject to the risk that controls may become inadequate because of changes in conditions, or that the degree of compliance with the policies or procedures may deteriorate.
Critical Audit Matters
The critical audit matters communicated below are matters arising from the current period audit of the consolidated financial statements that were communicated or required to be communicated to the audit committee and that (i) relate to accounts or disclosures that are material to the consolidated financial statements and (ii) involved our especially challenging, subjective, or complex judgments. The communication of critical audit matters does not alter in any way our opinion on the consolidated financial statements, taken as a whole, and we are not, by communicating the critical audit matters below, providing separate opinions on the critical audit matters or on the accounts or disclosures to which they relate.
Acquisition of HemaCare Corporation -Noveprim – Valuation of Acquired Customer Relationship Intangible AssetBiological Assets
As described in Notes 1 and 2 to the consolidated financial statements, on November 30, 2023, the Company completed the acquisition of HemaCare Corporation on January 3, 2020.Noveprim, resulting in a 90% controlling interest. Of the acquired long-term assets, $167.8 million of biological assets were recorded. The preliminary purchase price allocation included a customer relationship intangible asset (also referred to as client relationships) of $170.4 million. As disclosed by management, the determination of the fair value of the intangible asset, which represents a significant portion of the purchase price,biological assets requires the use of significant judgment by management with regard to (i) the fair value;using management’s best estimates of inputs and (ii) the period and the method by which the intangible asset will be amortized.assumptions that a market participant would use. To determine the fair value, of the acquired client relationships, management utilized the multiple period excess earnings model, (a commonly accepted valuation technique), which includesrelies on the following key assumptions: projections of cash flows from the acquired entity,entities, which includeincludes future revenue, growth rates,cost of revenue, operating income margins, and the customer attrition rate,productivity rates, as well as the discount rate based on an analysis of the acquired entity’smarket participant’s weighted average cost of capital.
The principal considerations for our determination that performing procedures relating to the valuation of biological assets acquired in the acquisition of HemaCare Corporation - valuation of acquired customer relationship intangible assetNoveprim is a critical audit matter are (i) the significant judgment by management when developing the fair value estimate of the biological assets acquired; (ii) a high degree of auditor judgment, subjectivity and subjectivityeffort in applyingperforming procedures relatingand evaluating management’s significant assumptions related to the fair value measurementcost of the customer relationship intangible asset acquired due to the significant amount of judgment and estimation by management when developing the estimate, (ii) significant audit effort was required in evaluating the key assumptions relating to the estimate, such as the future revenue, growthproductivity rates, operating income margins, customer attrition rate, and discount raterate; and (iii) the audit effort involved the use of professionals with specialized skill and knowledge.
Addressing the matter involved performing procedures and evaluating audit evidence in connection with forming our overall opinion on the consolidated financial statements. These procedures included testing the effectiveness of controls relating to the valuation of acquired customer relationship intangible asset,acquisition accounting, including controls over the reviewmanagement’s valuation of the valuation methodology, the key assumptions underlying the valuation, and the useful lives of the acquired customer relationship intangible asset.biological assets acquired. These procedures also included, among others (i) reading the purchase agreement andagreement; (ii) testing management’s process for estimatingdeveloping the fair value estimate of customer relationship intangible asset. Testing management’s process includedthe biological assets acquired; (iii) evaluating the appropriateness of the valuation model,multiple period excess earnings model; (iv) testing the completeness and accuracy of the underlying data providedused in the multiple period excess earnings model; and (v) evaluating the reasonableness of the significant assumptions used by management related to the cost of revenue, productivity rates, and evaluating reasonableness of significantdiscount rate. Evaluating management’s assumptions related to the estimated futurecost of revenue growthand productivity rates operating income margins, customer attrition rate, and discount rate. Evaluating the reasonableness of the estimated future revenue growth rates, operating income margins, customer attrition rate, and discount rate assumptions involved considering their consistency with data from external sources,(i) the past performance of Noveprim; (ii) the acquired business,consistency with external research data; and (iii) whether the assumptions were consistent with evidence obtained in other areas of the audit. Professionals with specialized skill and knowledge were used to assist in evaluating (i) the evaluationappropriateness of the Company’s valuationmultiple period excess earnings model and management significant assumptions related to customer attrition and(ii) the reasonableness of the discount rate.
Discovery and Safety Assessment Service Revenue Recognized Over Time Using the Input Method
As described in Notes 1 and 3 to the consolidated financial statements, the Company recognized revenue of $1,837.4 million in its Discovery and Safety Assessment (DSA) segment in 2020,revenue from services and products transferred over time of $2,611.6 million for the year-ended December 30, 2023, of which $1,836.5 million was recognized over time asthe majority relates to services that are delivered to the customer based on the extent of progress towards completion of the performance obligation that management
CHARLES RIVER LABORATORIES INTERNATIONAL, INC.
measures using either the cost-to-cost (input method) or right to invoice (output method) measures of progress. The selection of the method to measure progress towards completion requires judgment and is based on the nature of the products or services to be provided.. Management uses the cost-to-costinput method measure of progress when it best depicts the transfer of value to the customer, which occurs as the Company incurs costs on its contract, generally related to fixed fee service contracts. Under the cost-to-costinput method measure of progress, the extent of progress towards completion is measured based on the ratio of costs incurred to date to the total estimated costs at completion of the performance obligation. The costscost calculation includes variables such as labor hours, allocation of overhead costs, research model costs, and subcontractor costs. Revenue is recorded proportionally as costs are incurred. The right-to-invoice measure of progress is generally related to rate per unit contracts, as the extent of progress towards completion is measured based on discrete service or time-based increments, such as samples tested or labor hours incurred. Revenue is recorded in the amount invoiced since that amount corresponds directly to the value of the Company’s performance to date.
The principal considerations for our determination that performing procedures relating to DSA service revenue recognized over time using the input method is a critical audit matter are thea high degree of auditor judgment, subjectivity and effort in performing procedures and in evaluating the audit evidence obtained related to the extentratio of progress towards completion, actual costs incurred and management’s assumptions used in determiningto date to the total estimated costs at completion related to labor hours, allocation of overhead costs, research model costs, and subcontractor costs.the performance obligation.
Addressing the matter involved performing procedures and evaluating audit evidence in connection with forming our overall opinion on the consolidated financial statements. These procedures included testing the effectiveness of controls relating to DSA service revenue recognized over time using the input method, including controls over the extentratio of progress towards completion, actual costs incurred and determination ofto date to the total estimated costs at completion of the performance obligation, review of agreements, reviewcontracts, testing of budget versus actual costs incurred, and reviewtesting of revenue recognition. These procedures also included, among others (i) reading agreementscontracts and reports describing the results of services provided for a sample of DSA service contracts,contracts; (ii) evaluating and testing management’s process for determining the amount of DSA service revenue recognized over time for a sample of DSA service contracts, which includedcontracts; (iii) evaluating the appropriateness of the input method used by management; (iv) evaluating the reasonableness of the estimatesratio of costs and management’s assumptions relatedincurred to labor hours, allocationdate to the total estimated costs at completion of overhead costs, research model costs, and subcontractor coststhe performance obligations through performing a retrospective comparison of actual current year project costs incurred to historical management cost estimatesestimated costs for completed service contracts,contracts; and (iii)(v) testing actual costs incurred for a sample of in-processin-progress service contracts by examining evidence of costs incurred, including invoices, time cards, human resources documents, and the completeness and accuracy of overhead allocations.
/s/ PricewaterhouseCoopers LLP
Boston, Massachusetts
February 17, 202114, 2024
We have served as the Company’s auditor since 1999.
CHARLES RIVER LABORATORIES INTERNATIONAL, INC.
CONSOLIDATED STATEMENTS OF INCOME
(in thousands, except per share amounts)
| | | | Fiscal Year | | Fiscal Year |
| | | 2020 | | 2019 | | 2018 | | 2023 | | 2022 | | 2021 |
| Service revenue | Service revenue | $ | 2,296,156 | | | $ | 2,029,371 | | | $ | 1,687,941 | |
| Product revenue | Product revenue | 627,777 | | | 591,855 | | | 578,155 | |
| Total revenue | Total revenue | 2,923,933 | | | 2,621,226 | | | 2,266,096 | |
| Costs and expenses: | Costs and expenses: | | | | | | Costs and expenses: | | | |
| Cost of services provided (excluding amortization of intangible assets) | Cost of services provided (excluding amortization of intangible assets) | 1,533,230 | | | 1,371,699 | | | 1,150,371 | |
| Cost of products sold (excluding amortization of intangible assets) | Cost of products sold (excluding amortization of intangible assets) | 317,162 | | | 291,216 | | | 275,658 | |
| Selling, general and administrative | Selling, general and administrative | 528,935 | | | 517,622 | | | 443,854 | |
| Amortization of intangible assets | Amortization of intangible assets | 111,877 | | | 89,538 | | | 64,830 | |
| Operating income | Operating income | 432,729 | | | 351,151 | | | 331,383 | |
| Other income (expense): | Other income (expense): | | | | | | Other income (expense): | | | |
| Interest income | Interest income | 834 | | | 1,522 | | | 812 | |
| Interest expense | Interest expense | (86,433) | | | (60,882) | | | (63,772) | |
| Other income, net | 99,984 | | | 12,293 | | | 13,258 | |
| Income from continuing operations, before income taxes | 447,114 | | | 304,084 | | | 281,681 | |
| Other income (expense), net | |
| Income before income taxes | |
| Provision for income taxes | Provision for income taxes | 81,808 | | | 50,023 | | | 54,463 | |
| Income from continuing operations, net of income taxes | 365,306 | | | 254,061 | | | 227,218 | |
| Income from discontinued operations, net of income taxes | 0 | | | 0 | | | 1,506 | |
| Net income | Net income | 365,306 | | | 254,061 | | | 228,724 | |
| Less: Net income attributable to noncontrolling interests | Less: Net income attributable to noncontrolling interests | 1,002 | | | 2,042 | | | 2,351 | |
| Net income attributable to common shareholders | Net income attributable to common shareholders | $ | 364,304 | | | $ | 252,019 | | | $ | 226,373 | |
| | Earnings per common share | Earnings per common share | | | | | |
| Basic: | | | | | |
| Continuing operations attributable to common shareholders | $ | 7.35 | | | $ | 5.17 | | | $ | 4.69 | |
| Discontinued operations | $ | 0 | | | $ | 0 | | | $ | 0.03 | |
| Net income attributable to common shareholders | $ | 7.35 | | | $ | 5.17 | | | $ | 4.72 | |
| Diluted: | | | | | |
| Continuing operations attributable to common shareholders | $ | 7.20 | | | $ | 5.07 | | | $ | 4.59 | |
| Discontinued operations | $ | 0 | | | $ | 0 | | | $ | 0.03 | |
| Net income attributable to common shareholders | $ | 7.20 | | | $ | 5.07 | | | $ | 4.62 | |
| Earnings per common share | |
| Earnings per common share | | | | |
| Net income attributable to common shareholders: | | Net income attributable to common shareholders: | | | |
| Basic | |
| Diluted | |
| | Weighted-average number of common shares outstanding: | Weighted-average number of common shares outstanding: | |
| Weighted-average number of common shares outstanding: | |
| Weighted-average number of common shares outstanding: | |
| Basic | |
| Basic | |
| Basic | Basic | 49,550 | | | 48,730 | | | 47,947 | |
| Diluted | Diluted | 50,611 | | | 49,693 | | | 49,018 | |
| See Notes to Consolidated Financial Statements. | | | See Notes to Consolidated Financial Statements. | |
| | See Notes to Consolidated Financial Statements. | |
CHARLES RIVER LABORATORIES INTERNATIONAL, INC.
CONSOLIDATED STATEMENTS OF COMPREHENSIVE INCOME
(in thousands)
| | Fiscal Year |
| 2020 | | 2019 | | 2018 |
| Fiscal Year | | | Fiscal Year |
| 2023 | | | 2023 | | 2022 | | 2021 |
| Net income | Net income | $ | 365,306 | | | $ | 254,061 | | | $ | 228,724 | |
| Other comprehensive income (loss): | Other comprehensive income (loss): | |
| Foreign currency translation adjustment and other | 22,345 | | | 14,224 | | | (28,305) | |
| Pension and other post-retirement benefit plans (Note 12): | |
| Prior service cost and gains (losses) arising during the period | 15,747 | | | (25,165) | | | (1,659) | |
| Foreign currency translation adjustment | |
| Foreign currency translation adjustment | |
| Foreign currency translation adjustment | |
| Pension and other post-retirement benefit plans (Note 14): | |
| Prior service cost and (losses) gains arising during the period | |
| Prior service cost and (losses) gains arising during the period | |
| Prior service cost and (losses) gains arising during the period | |
| Amortization of net loss, settlement losses, and prior service benefit included in total cost for pension and other post-retirement benefit plans | Amortization of net loss, settlement losses, and prior service benefit included in total cost for pension and other post-retirement benefit plans | 17,861 | | | 1,772 | | | 2,477 | |
| Comprehensive income, before income taxes | 421,259 | | | 244,892 | | | 201,237 | |
Less: Income tax expense (benefit) related to items of other comprehensive income
(Note 10) | 15,372 | | | (3,633) | | | (1,892) | |
| Unrealized gains (losses) on hedging instruments | |
| Other comprehensive income (loss), before income taxes | |
| Less: Income tax (benefit) expense related to items of other comprehensive income (Note 12) | |
| Comprehensive income, net of income taxes | Comprehensive income, net of income taxes | 405,887 | | | 248,525 | | | 203,129 | |
| Less: Comprehensive income related to noncontrolling interests, net of income taxes | Less: Comprehensive income related to noncontrolling interests, net of income taxes | 2,438 | | | 1,822 | | | 1,398 | |
| Comprehensive income attributable to common shareholders, net of income taxes | Comprehensive income attributable to common shareholders, net of income taxes | $ | 403,449 | | | $ | 246,703 | | | $ | 201,731 | |
| | | See Notes to Consolidated Financial Statements. | |
| | See Notes to Consolidated Financial Statements. | | | See Notes to Consolidated Financial Statements. | |
CHARLES RIVER LABORATORIES INTERNATIONAL, INC.
CONSOLIDATED BALANCE SHEETS
(in thousands, except per share amounts)
| | | | | | | | | | | |
| December 26, 2020 | | December 28, 2019 |
| Assets | | | |
| Current assets: | | | |
| Cash and cash equivalents | $ | 228,424 | | | $ | 238,014 | |
| Trade receivables, net of allowances for doubtful accounts of $6,702 and $3,664, respectively | 617,740 | | | 514,033 | |
| Inventories | 185,695 | | | 160,660 | |
| Prepaid assets | 96,712 | | | 52,588 | |
| Other current assets | 72,560 | | | 56,030 | |
| Total current assets | 1,201,131 | | | 1,021,325 | |
| Property, plant and equipment, net | 1,124,358 | | | 1,044,128 | |
| Operating lease right-of-use assets, net | 178,220 | | | 140,085 | |
| Goodwill | 1,809,168 | | | 1,540,565 | |
| Client relationships, net | 721,505 | | | 613,573 | |
| Other intangible assets, net | 66,094 | | | 75,840 | |
| Deferred tax assets | 37,729 | | | 44,659 | |
| Other assets | 352,626 | | | 212,615 | |
| Total assets | $ | 5,490,831 | | | $ | 4,692,790 | |
| Liabilities, Redeemable Noncontrolling Interests and Equity | | | |
| Current liabilities: | | | |
| Current portion of long-term debt and finance leases | $ | 50,214 | | | $ | 38,545 | |
| Accounts payable | 122,475 | | | 111,498 | |
| Accrued compensation | 206,823 | | | 158,617 | |
| Deferred revenue | 207,942 | | | 171,805 | |
| Accrued liabilities | 149,820 | | | 139,118 | |
| Other current liabilities | 102,477 | | | 90,598 | |
| Total current liabilities | 839,751 | | | 710,181 | |
| Long-term debt, net and finance leases | 1,929,571 | | | 1,849,666 | |
| Operating lease right-of-use liabilities | 155,595 | | | 116,252 | |
| Deferred tax liabilities | 217,031 | | | 167,283 | |
| Other long-term liabilities | 205,215 | | | 182,933 | |
| Total liabilities | 3,347,163 | | | 3,026,315 | |
| Commitments and contingencies (Notes 2, 9, 11, 12, 16 and 17) | 0 | | 0 |
| Redeemable noncontrolling interests | 25,499 | | | 28,647 | |
| Equity: | | | |
| Preferred stock, $0.01 par value; 20,000 shares authorized; 0 shares issued and outstanding | 0 | | | 0 | |
| Common stock, $0.01 par value; 120,000 shares authorized; 49,767 shares issued and outstanding as of December 26, 2020 and 48,936 shares issued and outstanding as of December 28, 2019 | 498 | | | 489 | |
| Additional paid-in capital | 1,627,564 | | | 1,531,785 | |
| Retained earnings | 625,414 | | | 280,329 | |
| Treasury stock, at cost, 0 shares as of December 26, 2020 and December 28, 2019 | 0 | | | 0 | |
| Accumulated other comprehensive loss | (138,874) | | | (178,019) | |
| Total equity attributable to common shareholders | 2,114,602 | | | 1,634,584 | |
| Noncontrolling interest | 3,567 | | | 3,244 | |
| Total equity | 2,118,169 | | | 1,637,828 | |
| Total liabilities, redeemable noncontrolling interests and equity | $ | 5,490,831 | | | $ | 4,692,790 | |
| See Notes to Consolidated Financial Statements. |
| | | | | | | | | | | |
| December 30, 2023 | | December 31, 2022 |
| Assets | | | |
| Current assets: | | | |
| Cash and cash equivalents | $ | 276,771 | | | $ | 233,912 | |
| Trade receivables and contract assets, net of allowances for credit losses of $25,722 and $11,278, respectively | 780,375 | | | 752,390 | |
| Inventories | 380,259 | | | 255,809 | |
| Prepaid assets | 87,879 | | | 89,341 | |
| Other current assets | 83,378 | | | 107,580 | |
| Total current assets | 1,608,662 | | | 1,439,032 | |
| Property, plant and equipment, net | 1,639,741 | | | 1,465,655 | |
| Venture capital and strategic equity investments | 243,811 | | | 311,602 | |
| Operating lease right-of-use assets, net | 394,029 | | | 391,762 | |
| Goodwill | 3,095,045 | | | 2,849,903 | |
| Intangible assets, net | 864,051 | | | 955,275 | |
| Deferred tax assets | 40,279 | | | 41,262 | |
| Other assets | 309,383 | | | 148,279 | |
| Total assets | $ | 8,195,001 | | | $ | 7,602,770 | |
| Liabilities, Redeemable Noncontrolling Interests and Equity | | | |
| Current liabilities: | | | |
| Accounts payable | $ | 168,937 | | | $ | 205,915 | |
| Accrued compensation | 213,290 | | | 197,078 | |
| Deferred revenue | 241,820 | | | 264,259 | |
| Accrued liabilities | 227,825 | | | 219,758 | |
| Other current liabilities | 203,210 | | | 204,575 | |
| Total current liabilities | 1,055,082 | | | 1,091,585 | |
| Long-term debt, net and finance leases | 2,647,147 | | | 2,707,531 | |
| Operating lease right-of-use liabilities | 419,234 | | | 389,745 | |
| Deferred tax liabilities | 191,349 | | | 215,582 | |
| Other long-term liabilities | 223,191 | | | 174,822 | |
| Total liabilities | 4,536,003 | | | 4,579,265 | |
| Commitments and contingencies (Notes 2, 11, 13, 14 and 18) | | | |
| Redeemable noncontrolling interest | 56,722 | | | 42,427 | |
| Equity: | | | |
| Preferred stock, $0.01 par value; 20,000 shares authorized; no shares issued and outstanding | — | | | — | |
| Common stock, $0.01 par value; 120,000 shares authorized; 51,338 shares issued and outstanding as of December 30, 2023 and 50,944 shares issued and outstanding as of December 31, 2022 | 513 | | | 509 | |
| Additional paid-in capital | 1,905,578 | | | 1,804,940 | |
| Retained earnings | 1,887,218 | | | 1,432,901 | |
| Treasury stock, at cost, zero shares as of December 30, 2023 and December 31, 2022 | — | | | — | |
| Accumulated other comprehensive loss | (196,427) | | | (262,057) | |
| Total equity attributable to common shareholders | 3,596,882 | | | 2,976,293 | |
| Noncontrolling interests (nonredeemable) | 5,394 | | | 4,785 | |
| Total equity | 3,602,276 | | | 2,981,078 | |
| Total liabilities, redeemable noncontrolling interests and equity | $ | 8,195,001 | | | $ | 7,602,770 | |
| See Notes to Consolidated Financial Statements. |
CHARLES RIVER LABORATORIES INTERNATIONAL, INC.
CONSOLIDATED STATEMENTS OF CASH FLOWS
(in thousands)
| | | | | | | | | | | | | | | | | |
| | Fiscal Year |
| | 2020 | | 2019 | | 2018 |
| Cash flows relating to operating activities | | | | | |
| Net income | $ | 365,306 | | | $ | 254,061 | | | $ | 228,724 | |
| Less: Income from discontinued operations, net of income taxes | 0 | | | 0 | | | 1,506 | |
| Income from continuing operations, net of income taxes | 365,306 | | | 254,061 | | | 227,218 | |
| Adjustments to reconcile net income from continuing operations to net cash provided by operating activities: | | | | | |
| Depreciation and amortization | 234,924 | | | 198,095 | | | 161,779 | |
| Stock-based compensation | 56,341 | | | 57,271 | | | 47,346 | |
| Deferred income taxes | (133) | | | (21,895) | | | (9,702) | |
| Gain on venture capital and strategic equity investments, net | (100,861) | | | (20,706) | | | (15,928) | |
| Other, net | 17,273 | | | 7,931 | | | 15,613 | |
| Changes in assets and liabilities: | | | | | |
| Trade receivables, net | (85,627) | | | (8,323) | | | (21,196) | |
| Inventories | (18,379) | | | (21,399) | | | (13,338) | |
| Accounts payable | 748 | | | 29,775 | | | (12,732) | |
| Accrued compensation | 40,481 | | | 3,394 | | | 31,616 | |
| Deferred revenue | 28,647 | | | (3,620) | | | 36,072 | |
| Customer contract deposits | 8,955 | | | (10,898) | | | 28,115 | |
| Other assets and liabilities, net | (1,100) | | | 17,250 | | | (33,723) | |
| Net cash provided by operating activities | 546,575 | | | 480,936 | | | 441,140 | |
| Cash flows relating to investing activities | | | | | |
| Acquisition of businesses and assets, net of cash acquired | (418,628) | | | (515,701) | | | (824,868) | |
| Capital expenditures | (166,560) | | | (140,514) | | | (140,054) | |
| Purchases of investments and contributions to venture capital investments | (26,692) | | | (22,341) | | | (25,125) | |
| Proceeds from sale of investments | 11,401 | | | 942 | | | 35,849 | |
| Other, net | (1,065) | | | (3,888) | | | (805) | |
| Net cash used in investing activities | (601,544) | | | (681,502) | | | (955,003) | |
| Cash flows relating to financing activities | | | | | |
| Proceeds from long-term debt and revolving credit facility | 2,230,988 | | | 3,358,461 | | | 2,755,028 | |
| Proceeds from exercises of stock options | 46,586 | | | 34,546 | | | 37,657 | |
| Payments on long-term debt, revolving credit facility, and finance lease obligations | (2,200,400) | | | (3,124,588) | | | (2,201,003) | |
| Payments on debt financing costs | 0 | | | (6,593) | | | (18,337) | |
| Purchase of treasury stock | (23,979) | | | (18,087) | | | (13,846) | |
| Other, net | (5,947) | | | (11,802) | | | (1,440) | |
| Net cash provided by financing activities | 47,248 | | | 231,937 | | | 558,059 | |
| Discontinued operations | | | | | |
| Net cash used in operating activities from discontinued operations | 0 | | | 0 | | | (3,735) | |
| Effect of exchange rate changes on cash, cash equivalents, and restricted cash | 794 | | | 11,357 | | | (9,474) | |
| Net change in cash, cash equivalents, and restricted cash | (6,927) | | | 42,728 | | | 30,987 | |
| Cash, cash equivalents, and restricted cash, beginning of period | 240,046 | | | 197,318 | | | 166,331 | |
| Cash, cash equivalents, and restricted cash, end of period | $ | 233,119 | | | $ | 240,046 | | | $ | 197,318 | |
| | | | | |
| | | | | |
| See Notes to Consolidated Financial Statements. |
| | | | | | | | | | | | | | | | | |
| | Fiscal Year |
| | 2023 | | 2022 | | 2021 |
| Cash flows relating to operating activities | | | | | |
| Net income | $ | 480,370 | | | $ | 492,608 | | | $ | 398,837 | |
| Adjustments to reconcile net income to net cash provided by operating activities: | | | | | |
| Depreciation and amortization | 314,124 | | | 303,870 | | | 265,540 | |
| Stock-based compensation | 72,048 | | | 73,617 | | | 71,474 | |
| Loss on debt extinguishment and amortization of other financing costs | 3,967 | | | 4,118 | | | 29,964 | |
| Deferred income taxes | (50,903) | | | (35,884) | | | (24,006) | |
| Long-lived asset impairment charges | 41,911 | | | 5,816 | | | 733 | |
| (Gain) loss on venture capital and strategic equity investments, net | (97,827) | | | 26,775 | | | 30,420 | |
| Provision for credit losses | 18,225 | | | 6,706 | | | 1,657 | |
| Loss (gain) on divestitures, net | 961 | | | (123,405) | | | (25,026) | |
| Changes in fair value of contingent consideration arrangements | 1,810 | | | (3,753) | | | (34,303) | |
| Other, net | 1,592 | | | 21,726 | | | 2,567 | |
| Changes in assets and liabilities: | | | | | |
| Trade receivables and contract assets, net | (33,434) | | | (150,570) | | | (26,633) | |
| Inventories | (62,301) | | | (78,523) | | | (25,159) | |
| Accounts payable | (20,427) | | | (2,652) | | | 44,901 | |
| Accrued compensation | 12,447 | | | (42,164) | | | 44,304 | |
| Deferred revenue | (21,743) | | | 57,658 | | | (13,402) | |
| Customer contract deposits | (15,564) | | | 30,457 | | | 16,925 | |
| Other assets and liabilities, net | 38,642 | | | 33,240 | | | 2,006 | |
| Net cash provided by operating activities | 683,898 | | | 619,640 | | | 760,799 | |
| Cash flows relating to investing activities | | | | | |
| Acquisition of businesses and assets, net of cash acquired | (194,785) | | | (283,392) | | | (1,293,095) | |
| Capital expenditures | (318,528) | | | (324,733) | | | (228,772) | |
| Purchases of investments and contributions to venture capital investments | (54,215) | | | (158,274) | | | (45,555) | |
| Proceeds from sale of investments | 6,667 | | | 4,549 | | | 6,532 | |
| Proceeds from sale of businesses, net | — | | | 163,275 | | | 122,694 | |
| Other, net | (2,294) | | | (9,347) | | | 264 | |
| Net cash used in investing activities | (563,155) | | | (607,922) | | | (1,437,932) | |
| Cash flows relating to financing activities | | | | | |
| Proceeds from long-term debt and revolving credit facility | 776,353 | | | 2,952,430 | | | 6,951,113 | |
| Proceeds from exercises of stock options | 25,597 | | | 25,110 | | | 45,652 | |
| Payments on long-term debt, revolving credit facility, and finance lease obligations | (851,676) | | | (2,932,636) | | | (6,242,877) | |
| Purchase of treasury stock | (24,155) | | | (38,651) | | | (40,707) | |
| Payment of debt extinguishment and financing costs | — | | | — | | | (38,255) | |
| Payments of contingent consideration | (2,711) | | | (10,356) | | | (2,328) | |
| Purchases of additional equity interests, net | (4,784) | | | (30,533) | | | — | |
| Other, net | (4,145) | | | (7,761) | | | — | |
| Net cash (used in) provided by financing activities | (85,521) | | | (42,397) | | | 672,598 | |
| Effect of exchange rate changes on cash, cash equivalents, and restricted cash | 8,044 | | | 25,579 | | | 17,730 | |
| Net change in cash, cash equivalents, and restricted cash | 43,266 | | | (5,100) | | | 13,195 | |
| Cash, cash equivalents, and restricted cash, beginning of period | 241,214 | | | 246,314 | | | 233,119 | |
| Cash, cash equivalents, and restricted cash, end of period | $ | 284,480 | | | $ | 241,214 | | | $ | 246,314 | |
| | | | | |
| See Notes to Consolidated Financial Statements. |
CHARLES RIVER LABORATORIES INTERNATIONAL, INC.
CONSOLIDATED STATEMENTS OF CASH FLOWS (continued)
(in thousands)
| | | | | | | | | | | | | | | | | |
| | Fiscal Year |
| | 2020 | | 2019 | | 2018 |
| Supplemental cash flow information: | | | | | |
| Cash and cash equivalents | $ | 228,424 | | | $ | 238,014 | | | $ | 195,442 | |
| Restricted cash included in Other current assets | 3,074 | | | 431 | | | 465 | |
| Restricted cash included in Other assets | 1,621 | | | 1,601 | | | 1,411 | |
| Cash, cash equivalents, and restricted cash, end of period | $ | 233,119 | | | $ | 240,046 | | | $ | 197,318 | |
| | | | | |
| Cash paid for income taxes | $ | 60,059 | | | $ | 54,060 | | | $ | 67,600 | |
| Cash paid for interest | $ | 72,461 | | | $ | 67,813 | | | $ | 47,540 | |
| Non-cash investing and financing activities: | | | | | |
| Additions to property, plant and equipment, net | $ | 25,614 | | | $ | 21,447 | | | $ | 18,212 | |
| Assets acquired under finance leases | $ | 1,571 | | | $ | 4,819 | | | $ | 1,473 | |
| | | | | |
| | | | | |
| | | | | |
| | | | | |
| | | | | |
| | | | | |
| | | | | |
| | | | | |
| | | | | |
| | | | | |
| | | | | |
| | | | | |
| | | | | |
| | | | | |
| | | | | |
| | | | | |
| | | | | |
| | | | | |
| | | | | |
| | | | | |
| | | | | |
| | | | | |
| | | | | |
| | | | | |
| | | | | |
| | | | | |
| | | | | |
| | | | | |
| See Notes to Consolidated Financial Statements. |
CHARLES RIVER LABORATORIES INTERNATIONAL, INC.
CONSOLIDATED STATEMENTS OF CHANGES IN EQUITY
(in thousands)
| | Common stock | | | Common stock | | Additional Paid-In Capital | | Retained Earnings | | Accumulated Other Comprehensive Income (Loss) | | Treasury Stock | | Total Equity
Attributable
to Common
Shareholders | | Noncontrolling
Interest | | Total
Equity |
| | December 26, 2020 | |
| December 26, 2020 | |
| December 26, 2020 | |
| Net income | |
| Other comprehensive (loss) | |
| Dividends declared to noncontrolling interest | |
| | Common stock | | Additional Paid-In Capital | | Retained Earnings | | Accumulated Other Comprehensive Income (Loss) | | Treasury Stock | | Total Equity
Attributable
to Common
Shareholders | | Noncontrolling
Interest | | Total
Equity |
| Shares | | Amount | | Shares | | Amount | |
| December 30, 2017 | 87,495 | | | $ | 875 | | | $ | 2,560,192 | | | $ | 288,658 | | | $ | (144,731) | | | 40,093 | | | $ | (1,659,914) | | | $ | 1,045,080 | | | $ | 2,327 | | | $ | 1,047,407 | |
| Adjustment to noncontrolling interest fair value | |
| Adjustment to noncontrolling interest fair value | |
| Adjustment to noncontrolling interest fair value | |
| Issuance of stock under employee compensation plans | |
| Purchase of treasury shares | |
| Retirement of treasury shares | |
| Stock-based compensation | |
| December 25, 2021 | |
| Net income | Net income | — | | | — | | | — | | | 226,373 | | | — | | | — | | | — | | | 226,373 | | | 1,550 | | | 227,923 | |
| Other comprehensive loss | — | | | — | | | — | | | — | | | (24,642) | | | — | | | — | | | (24,642) | | | — | | | (24,642) | |
Reclassification due to adoption of ASU 2018-02 | — | | | — | | | — | | | 3,330 | | | (3,330) | | | — | | | — | | | — | | | — | | | 0 | |
Adjustment due to adoption of ASU 2016-01 | — | | | — | | | — | | | 1,424 | | | — | | | — | | | — | | | 1,424 | | | — | | | 1,424 | |
| Other comprehensive (loss) | |
| Dividends declared to noncontrolling interest | Dividends declared to noncontrolling interest | — | | | — | | | — | | | — | | | — | | | — | | | — | | | — | | | (1,431) | | | (1,431) | |
| Adjustment of redeemable noncontrolling interest to redemption value | Adjustment of redeemable noncontrolling interest to redemption value | — | | | — | | | (2,069) | | | — | | | — | | | — | | | — | | | (2,069) | | | — | | | (2,069) | |
| | Issuance of stock under employee compensation plans | Issuance of stock under employee compensation plans | 936 | | | 9 | | | 37,657 | | | — | | | — | | | — | | | — | | | 37,666 | | | — | | | 37,666 | |
| Acquisition of treasury shares | — | | | — | | | — | | | — | | | — | | | 129 | | | (13,846) | | | (13,846) | | | — | | | (13,846) | |
| Issuance of stock under employee compensation plans | |
| Issuance of stock under employee compensation plans | |
| Purchase of treasury shares | |
| Retirement of treasury shares | Retirement of treasury shares | (40,221) | | | (402) | | | (1,195,614) | | | (477,689) | | | — | | | (40,221) | | | 1,673,705 | | | — | | | — | | | 0 | |
| Stock-based compensation | Stock-based compensation | — | | | — | | | 47,346 | | | — | | | — | | | — | | | — | | | 47,346 | | | — | | | 47,346 | |
| December 29, 2018 | 48,210 | | | 482 | | | 1,447,512 | | | 42,096 | | | (172,703) | | | 1 | | | (55) | | | 1,317,332 | | | 2,446 | | | 1,319,778 | |
| Net income | — | | | — | | | — | | | 252,019 | | | — | | | — | | | — | | | 252,019 | | | 2,084 | | | 254,103 | |
| Other comprehensive loss | — | | | — | | | — | | | — | | | (5,316) | | | — | | | — | | | (5,316) | | | — | | | (5,316) | |
| Dividends declared to noncontrolling interest | — | | | — | | | — | | | — | | | — | | | — | | | — | | | — | | | (1,286) | | | (1,286) | |
| Adjustment of redeemable noncontrolling interest to redemption value | — | | | — | | | (1,451) | | | — | | | — | | | — | | | — | | | (1,451) | | | — | | | (1,451) | |
| Purchase of additional equity interest in and modification of Vital River redeemable noncontrolling interest | — | | | — | | | (1,870) | | | — | | | — | | | — | | | — | | | (1,870) | | | — | | | (1,870) | |
| Issuance of stock under employee compensation plans | 866 | | | 8 | | | 34,678 | | | — | | | — | | | — | | | — | | | 34,686 | | | — | | | 34,686 | |
| Acquisition of treasury shares | — | | | — | | | — | | | — | | | — | | | 139 | | | (18,087) | | | (18,087) | | | — | | | (18,087) | |
| Retirement of treasury shares | (140) | | | (1) | | | (4,355) | | | (13,786) | | | — | | | (140) | | | 18,142 | | | — | | | — | | | 0 | |
| Stock-based compensation | — | | | — | | | 57,271 | | | — | | | — | | | — | | | — | | | 57,271 | | | — | | | 57,271 | |
| December 28, 2019 | 48,936 | | | 489 | | | 1,531,785 | | | 280,329 | | | (178,019) | | | 0 | | | 0 | | | 1,634,584 | | | 3,244 | | | 1,637,828 | |
| December 31, 2022 | |
| Net income | Net income | — | | | — | | | — | | | 364,304 | | | — | | | — | | | — | | | 364,304 | | | 1,852 | | | 366,156 | |
| Other comprehensive income | Other comprehensive income | — | | | — | | | — | | | — | | | 39,145 | | | — | | | — | | | 39,145 | | | — | | | 39,145 | |
| Dividends declared to noncontrolling interest | Dividends declared to noncontrolling interest | — | | | — | | | — | | | — | | | — | | | — | | | — | | | — | | | (1,529) | | | (1,529) | |
| Purchase of a 10% redeemable noncontrolling interest and recognition of related contingent consideration | — | | | — | | | (2,379) | | | — | | | — | | | — | | | — | | | (2,379) | | | — | | | (2,379) | |
| Adjustment of redeemable noncontrolling interest to redemption value | |
| Gain on purchase of remaining equity interest of Vital River redeemable noncontrolling interest | |
| Issuance of stock under employee compensation plans | Issuance of stock under employee compensation plans | 977 | | | 10 | | | 46,576 | | | — | | | — | | | — | | | — | | | 46,586 | | | — | | | 46,586 | |
| Acquisition of treasury shares | — | | | — | | | — | | | — | | | — | | | 146 | | | (23,979) | | | (23,979) | | | — | | | (23,979) | |
| Purchase of treasury shares | |
| Retirement of treasury shares | Retirement of treasury shares | (146) | | | (1) | | | (4,759) | | | (19,219) | | | — | | | (146) | | | 23,979 | | | — | | | — | | | 0 | |
| Stock-based compensation | Stock-based compensation | — | | | — | | | 56,341 | | | — | | | — | | | — | | | — | | | 56,341 | | | — | | | 56,341 | |
| December 26, 2020 | 49,767 | | | $ | 498 | | | $ | 1,627,564 | | | $ | 625,414 | | | $ | (138,874) | | | 0 | | | $ | 0 | | | $ | 2,114,602 | | | $ | 3,567 | | | $ | 2,118,169 | |
| December 30, 2023 | |
| See Notes to Consolidated Financial Statements. | See Notes to Consolidated Financial Statements. | See Notes to Consolidated Financial Statements. |
CHARLES RIVER LABORATORIES INTERNATIONAL, INC.
NOTES TO CONSOLIDATED FINANCIAL STATEMENTS
1. DESCRIPTION OF BUSINESS AND SUMMARY OF SIGNIFICANT ACCOUNTING POLICIES
Description of Business
Charles River Laboratories International, Inc. (the Company), together with its subsidiaries, is a full service, early-stage contract research organization (CRO).non-clinical global drug development partner. The Company has built upon its core competency of laboratory animal medicine and science (research model technologies) to develop a diverse portfolio of discovery and safety assessment services, both Good Laboratory Practice (GLP) and non-GLP, that enable the Company to support its clients from target identification through non-clinical development. The Company also provides a suite of products and services to support its clients’ manufacturing activities.
Principles of Consolidation
The Company’s consolidated financial statements reflect its financial statements and those of its subsidiaries in which the Company holds a controlling financial interest. For consolidated entities in which the Company owns or is exposed to less than 100% of the economics, the Company records net income (loss) attributable to noncontrolling interests in its consolidated statements of income equal to the percentage of the economic or ownership interest retained in such entities by the respective noncontrolling parties. Redeemable noncontrolling interests, where the noncontrolling interest holders have the ability to require the Company to purchase the remaining interests, are classified in the mezzanine section of the consolidated balance sheets, which is presented above the equity section and below liabilities. Intercompany balances and transactions are eliminated in consolidation.
The Company’s fiscal year is typically based on 52-weeks, with each quarter composed of 13 weeks ending on the last Saturday on, or closest to, March 31, June 30, September 30, and December 31. A 53rd week in the fourth quarter of the fiscal year is occasionally necessary to align with a December 31 calendar year-end, which occurred in fiscal year 2022.
Segment Reporting
The Company reports its results in 3three reportable segments: Research Models and Services (RMS), Discovery and Safety Assessment (DSA), and Manufacturing SupportSolutions (Manufacturing). The Company’s RMS reportable segment includes the Research Models, Research Model Services, and Research ProductsCell Solutions businesses.
Research Models includes the commercial production and sale of small research models, as well as the supply of large research models. Research Model Services includes: Genetically Engineered Models and Services (GEMS), which performs contract breeding and other services associated with genetically engineered models; Research Animal Diagnostic Services (RADS), which provides health monitoring and diagnostics services related to research models; Insourcing Solutions (IS), which provides colony management of its clients’ research operations (including recruitment, training, staffing, and management services); within our clients’ facilities and utilizing our Charles River Accelerator and Development Lab (CRADL™) offering, which provides vivarium space to clients, Genetically Engineered Models and Services (GEMS), which performs contract breeding and other services associated with genetically engineered models, and Research Products,Animal Diagnostic Services (RADS), which provides health monitoring and diagnostics services related to research models; and Cell Solutions, which supplies controlled, consistent, customized primary cells and blood components derived from normal and mobilized peripheral blood and bone marrow, and cord blood. marrow.
The Company’s DSA reportable segment includes services required to take a drug through the early development process including discovery services, which are non-regulated services to assist clients with the identification, screening,two businesses: Discovery Services and selection of a lead compound for drug development, andSafety Assessment. The Company provides regulated and non-regulated (GLPDSA services to support the research, development, and non-GLP)regulatory-required safety assessment services. testing of potential new drugs, including therapeutic discovery and optimization plus in vitro and in vivo studies, laboratory support services, and strategic non-clinical consulting and program management to support product development.
The Company’s Manufacturing reportable segment includes Microbial Solutions, which provides in vitro (non-animal) lot-release testing products, microbial detection products, and species identification services;services and Biologics Testing ServicesSolutions (Biologics), which performs specialized testing of biologics;biologics (Biologics Testing Solutions) as well as contract development and manufacturing products and services (CDMO). In December of 2022, the Company sold the Avian Vaccine Services business (Avian), reported in the Manufacturing segment, which suppliessupplied specific-pathogen-free chicken eggs and chickens.
Use of Estimates
The preparation of consolidated financial statements in accordance with generally accepted accounting principles in the United States (U.S. GAAP) requires that the Company make estimates and judgments that may affect the reported amounts of assets, liabilities, revenues, expenses and related disclosure of contingent assets and liabilities. On an on-going basis, the Company evaluates its estimates, judgments, and methodologies. The Company bases its estimates on historical experience and on various other assumptions that are believed to be reasonable, the results of which form the basis for making judgments about the carrying values of assets and liabilities. Actual results may differ from these estimates under different assumptions or conditions. Changes in estimates are reflected in reported results in the period in which they become known.
CHARLES RIVER LABORATORIES INTERNATIONAL, INC.
NOTES TO CONSOLIDATED FINANCIAL STATEMENTS (Continued)
On March 11, 2020, the World Health Organization declared the outbreak of a strain of novel coronavirus disease, COVID-19, a global pandemic. The COVID-19 pandemic is dynamic and expanding, and its ultimate scope, duration and effects are uncertain. This pandemic has and continues to result in, and any future epidemic or pandemic crises may potentially result in, direct and indirect adverse effects on the Company’s industry and customers, which in turn has (with respect to COVID-19) and may (with respect to future epidemics or crises) impact the Company’s business, results of operations and financial condition. Further, the COVID-19 pandemic may also affect the Company’s operating and financial results in a manner that is not presently known to the Company or that the Company currently does not expect to present significant risks to its operations or financial results. As of the date of issuance of these consolidated financial statements, the Company is not aware of any specific event or circumstance that would require the Company to update estimates, judgments or revise the carrying value of any assets or liabilities. These estimates may change, as new events occur and additional information is obtained, and are recognized in the consolidated financial statements as soon as they become known. Actual results could differ from those estimates and any such differences may be material to the Company’s consolidated financial statements.
Newly Adopted Accounting Pronouncements
In September 2022, the FASB issued ASU 2022-04, “Liabilities – Supplier Finance Programs (Subtopic 405-50): Disclosure of Supplier Finance Program Obligations.” ASU 2022-04 requires quantitative and qualitative disclosures about the use of supplier finance programs. The ASU is effective for fiscal years beginning after December 15, 2022, except for the amendment on rollforward information, which is effective for fiscal years beginning after December 15, 2023, including interim periods within those fiscal years for selected disclosures, and will be applied on a prospective basis. The Company participates in certain supplier finance programs that are immaterial to the consolidated financial statements and related disclosures.
Newly Issued Accounting Pronouncements
In November 2023, the FASB issued ASU 2023-07, “Improvements to Reportable Segment Disclosures (Topic 280)”. ASU 2023-07 modifies reportable segment disclosure requirements, primarily through enhanced disclosures about segment expenses categorized as significant or regularly provided to the Chief Operating Decision Maker (CODM). In addition, the amendments enhance interim disclosure requirements, clarify circumstances in which an entity can disclose multiple segment measures of profit or loss, and contain other disclosure requirements. The purpose of the amendments is to enable investors to better understand an entity’s overall performance and assess potential future cash flows. This ASU is effective for annual periods beginning after December 15, 2023, and interim periods within annual periods beginning after December 15, 2024, with early adoption permitted. The Company is currently evaluating the impact this new standard will have on the related disclosures in the consolidated financial statements, but does not believe there will be a material impact.
In December 2023, the FASB issued ASU 2023-09, “Improvements to Income Tax Disclosures (Topic 740)”. ASU 2023-09 requires enhanced disclosures on income taxes paid, adds disaggregation of continuing operations before income taxes between foreign and domestic earnings and defines specific categories for the reconciliation of jurisdictional tax rate to effective tax rate. This ASU is effective for fiscal years beginning after December 15, 2024, and can be applied on a prospective basis. The Company is currently evaluating the impact this new standard will have on the related disclosures in the consolidated financial statements.
Cash, Cash Equivalents, and Investments
Cash equivalents include money market funds, time deposits and other investments with remaining maturities at the purchase date of three months or less. Time deposits with original maturities of greater than three months are reported as short-term investments.
Trade Receivables and Contract Assets, Net
The Company records trade receivables and contract assets, net of an allowance for doubtful accounts.credit losses. An allowance for doubtful accountscredit losses is established based on historical collection information, a review of major client accounts receivable balances, current economic conditions in the geographies in which it operates, and the Company’s expectations of future economic conditions that may affect the collectability of the recorded amounts. Amounts determined to be uncollectible are charged or written off against the allowance.
Concentrations of Credit Risk
Financial instruments that potentially subject the Company to concentrations of credit risk consist primarily of cash and cash equivalents, investments, trade receivables and trade receivables.contract assets. The Company places cash and cash equivalents and investments in various financial institutions with high credit rating and limits the amount of credit exposure to any one financial institution. Trade receivables and contract assets are primarily from clients in the pharmaceutical and biotechnology industries, as well as academic and government institutions. Concentrations of credit risk with respect to trade receivables and contract assets, which are typically unsecured, are limited due to the wide variety of customers using the Company’s products and services as well as their dispersion across many geographic areas. No single client accounted for more than 5%3.5% of revenue in fiscal years 2020, 2019,2023, 2022, or 20182021 or trade receivables as of December 26, 202030, 2023 or December 28, 2019.31, 2022.
Fair Value Measurements
The accounting standard for fair value measurements defines fair value, establishes a framework for measuring fair value in accordance with U.S. GAAP, and requires certain disclosures about fair value measurements. Under this standard, fair value is the price that would be received to sell an asset or paid to transfer a liability in an orderly transaction between market
CHARLES RIVER LABORATORIES INTERNATIONAL, INC.
NOTES TO CONSOLIDATED FINANCIAL STATEMENTS (Continued)
participants at the measurement date. The Company has certain financial assets and liabilities recorded at fair value, which have been classified as Level 1, 2 or 3 within the fair value hierarchy:
•Level 1 - Fair values are determined utilizing prices (unadjusted) in active markets for identical assets or liabilities that the Company has the ability to access,
•Level 2 - Fair values are determined by utilizing quoted prices for identical or similar assets and liabilities in active markets or other market observable inputs such as interest rates,rate yield curves and foreign currency spot rates,
•Level 3 - Prices or valuations that require inputs that are both significant to the fair value measurement and unobservable.
The fair value hierarchy level is determined by asset and class based on the lowest level of significant input. The observability of inputs may change for certain assets or liabilities. This condition could cause an asset or liability to be reclassified between levels. The Company recognizes transfers between levels within the fair value hierarchy, if any, at the end of each quarter.
Valuation methodologies used for assets and liabilities measured or disclosed at fair value are as follows:
•Cash equivalents - Valued at market prices determined through third-party pricing services;
•Foreign currency forward contracts - Valued using market observable inputs, such as forward foreign exchange points and foreign exchanges rates;
CHARLES RIVER LABORATORIES INTERNATIONAL, INC.
NOTES TO CONSOLIDATED FINANCIAL STATEMENTS (Continued)
•Interest rate swap contracts - Valued using market observable inputs, such as interest rate yield curves;•Life insurance policies - Valued at cash surrender value based on the fair value of underlying investments;
•Debt instruments - The book value of the Company’s term and revolving loans, which are variable rate loans carried at amortized cost, approximates the fair value based on current market pricing of similar debt. The book valuevalues of the Company’s 5.5% Senior Notes, due in 2026 and the 4.25% Senior Notes due in 2028 (Senior Notes), which are fixed rate debt, are carried at amortized cost. Fair valuevalues of the Senior Notes isare based on quoted market prices and on borrowing rates available to the Company; and
•Contingent consideration - Valued based on a probability weighting of the future cash flows associated with the potential outcomes.outcomes and certain option pricing models.
Inventories
The Company’s inventories consist of raw materials, work in process and finished product related primarily to small models, large models, cell supply,solutions, microbial solutions, products, and avian related eggs and flocks.CDMO products. Inventories are stated at the lower of cost or net realizable value. Inventory value is generally based on the standard cost method for all businesses except for the Avian business, which is based on an average cost.businesses. Standard costs are trued-up to reflect actual cost. For small models inventory, costs include direct materials such as feed and bedding, costs of personnel directly involved in the care of the models, and an allocation of facility overhead. For the large models inventory, costs are primarily the external cost paid to acquire the model.model along with certain direct materials, costs of personnel directly involved in the care of the models, and allocation of facility overhead costs. For cell supplysolutions inventory, costs include direct materials, costs of personnel directly involved in the processing of products sold, and an allocation of facility overhead. For the microbial solutions and CDMO inventory, costs include direct materials, cost of personnel directly involved in the manufacturing and assembly of products sold, and an allocation of facility overhead. For the avian related inventory, costs include direct materials, such as animal feed, cost of personnel directly involved with the care of the eggs and flocks, and an allocation of facility overhead. Inventory costs are charged to cost of revenue in the period the products are sold to an external party. The Company analyzes its inventory levels on a quarterly basis and writes down inventory that is determined to be damaged, obsolete or otherwise unmarketable, with a corresponding charge to cost of products sold.
Property, Plant and Equipment, Net
Property, plant and equipment, net, including improvements that significantly add to productive capacity or extend useful life, are carried at cost and are subject to review for impairment whenever events or changes in circumstances indicate that the carrying amount of the asset or asset group may not be recoverable. The cost of normal, recurring, or periodic repairs and maintenance activities related to property, plant and equipment is expensed as incurred. In addition, the Company capitalizes certain internal use computer software development costs. Costs incurred during the preliminary project stage are expensed as incurred, while costs incurred during the application development stage are capitalized and amortized over the estimated useful life of the software. The Company also capitalizes costs related to specific upgrades and enhancements when it is probable the expenditures will result in additional functionality. Maintenance and training costs related to software obtained for internal use are expensed as incurred.
Interest costs incurred during the construction of major capital projects are capitalized until the underlying asset is ready for its intended use, at which point the interest costs are amortized as depreciation expense over the life of the underlying asset.
CHARLES RIVER LABORATORIES INTERNATIONAL, INC.
NOTES TO CONSOLIDATED FINANCIAL STATEMENTS (Continued)
The Company generally depreciates the cost of its property, plant and equipment using the straight-line method over the estimated useful lives of the respective assets as follow:
| | | | | |
| Estimated
Useful Lives |
| (in years) |
| Land | Indefinite |
| Buildings and building improvements | 2010 - 40 |
| Machinery and equipment | 3 - 20 |
| Furniture and fixtures | 5 - 10 |
| Computer hardware and software | 3 - 8 |
| Vehicles | 3 - 5 |
Leasehold improvements are amortized over the shorter of the estimated useful life of the asset or the lease term. Finance lease assets are amortized over the lease term, however, if ownership is transferred by the end of the finance lease, or there is a
CHARLES RIVER LABORATORIES INTERNATIONAL, INC.
NOTES TO CONSOLIDATED FINANCIAL STATEMENTS (Continued)
bargain purchase option, such finance lease assets are amortized over the useful life that would be assigned if such assets were owned.
When the Company disposes of property, plant and equipment, it removes the associated cost and accumulated depreciation from the related accounts on its consolidated balance sheet and includes any resulting gain or loss recorded in itsOther (expense) income, net in the accompanying consolidated statementstatements of income.
Business Combinations
The Company accounts for business combinations under the acquisition method of accounting. The Company allocates the amounts that it pays for each acquisition to the assets it acquires and liabilities it assumes based on their fair values at the dates of acquisition, including identifiable intangible assets and certain biological assets, which typically representscan represent a significant portion of the purchase price. The determination of the fair value of intangible and certain biological assets requires the use of significant judgment using management’s best estimates of inputs and assumptions that a market participant would use. Significant judgments include (i) the fair value; and (ii) whether such intangible assets are amortizable or non-amortizable and, if the former, the period and the method by which the intangible asset will be amortized. The Company utilizes commonly accepted valuation techniques, such as the income, approachcost, and the cost approach,market approaches as appropriate, in establishing the fair value of intangible assets. Typically, key assumptions include projections of cash flows that arise from identifiable intangible assets of acquired businesses as well as discount rates based on an analysis of the weighted average cost of capital, adjusted for specific risks associated with the assets.
In recent acquisitions, customer relationship intangible assets (also referred to as client relationships) and certain biological assets are the most significant identifiable asset acquired. To determine the fair value of thethese acquired client relationships,assets, the Company typically utilizes the multiple period excess earnings model (a commonly accepted valuation technique), which relies on the following key assumptions: projections of cash flows from the acquired entities, which includes future revenue, growth rates,cost of revenue, operating income margins, and customer attrition rates, and productivity rates; as well as discount rates based on an analysis of the acquired entities’a market participant’s weighted average cost of capital.
Contingent Consideration
The consideration for the Company’s acquisitions may include future payments that are contingent upon the occurrence of a particular event. The Company records an obligation for such contingent payments at fair value on the acquisition date. The Company estimates the fair value of contingent consideration obligations through valuation models, such as probability-weighted and option pricing models, that incorporate probability adjusted assumptions and simulations related to the achievement of the milestones and the likelihood of making related payments. The Company revalues these contingent consideration obligations each reporting period. Changes in the fair value of the contingent consideration obligations are recognized in the Company’s consolidated statements of income as a component of selling, general and administrative expenses. Changes in the fair value of the contingent consideration obligations can result from changes to one or multiple inputs, including adjustments to the discount rates and changes in the assumed probabilities of successful achievement of certain financial targets.
Discount rates in the Company’s valuation models represent a measure of the credit risk associated with settling the liability. The period over which the Company discounts its contingent obligations is typically based on when the contingent payments would be triggered. These fair value measurements are based on significant inputs not observable in the market.
Divestitures
The Company records divestitures at fair value less cost to sell with any related gain or loss from sale recorded within Other income (expense) on the Company’s consolidated statements of income. If the sale price includes contingent payments, these
CHARLES RIVER LABORATORIES INTERNATIONAL, INC.
NOTES TO CONSOLIDATED FINANCIAL STATEMENTS (Continued)
are fair valued using a probability weighted model. If the business divested is part of a reporting unit, goodwill from the reporting unit is reallocated based on the fair value of the divested business compared to the fair value of the reporting unit.
Goodwill and Intangible Assets
Goodwill represents the difference between the purchase price and the fair value of assets acquired and liabilities assumed when accounted for using the acquisition method of accounting. Goodwill is not amortized, but reviewed for impairment on an annual basis, during the fourth quarter, or more frequently if an event occurs or circumstances change that would more-likely-than-not reduce the fair value of the Company's reporting units below their carrying amounts.
The Company has the option to first assess qualitative factors to determine whether it is necessary to perform the quantitative impairment test. If the Company elects this option and believes, as a result of the qualitative assessment, that it is more-likely-than-not that the carrying value of goodwill is not recoverable, the quantitative impairment test is required; otherwise, no further testing is required. Alternatively, the Company may elect to not first assess qualitative factors and immediately perform the quantitative impairment test. In the quantitative test, the Company compares the fair value of its reporting units to their carrying values. If the carrying values of the net assets assigned to the reporting units exceed the fair values of the reporting units an impairment loss equal to the difference would be recorded.
Definite-lived intangible assets, including client relationships, are amortized over the pattern in which the economic benefits of the intangible assets are utilized and reviewed for impairment whenever events or changes in circumstances indicate that the
CHARLES RIVER LABORATORIES INTERNATIONAL, INC.
NOTES TO CONSOLIDATED FINANCIAL STATEMENTS (Continued)
carrying amount of the assets or asset group may not be recoverable. Determination of recoverability is based on an estimate of undiscounted future cash flows resulting from the use of the asset which requires the use of customer attribution rates and other assumptions.or asset group. In the event that such cash flows are not expected to be sufficient to recover the carrying amount of the definite-lived intangible assets, the definite-lived intangible assets are written-down to their fair values.
Valuation and Impairment of Long-Lived Assets
Long-lived assets to be held and used are reviewed for impairment whenever events or changes in circumstances indicate that the carrying amount of the assets or asset group may not be recoverable.
Determination of recoverability is based on an estimate of undiscounted future cash flows resulting from the use of the asset and its eventual disposition. In the event that such cash flows are not expected to be sufficient to recover the carrying amount of the assets, the assets are written-down to their fair values.
Long-lived assets to be disposed of are carried at fair value less costs to sell.
Venture Capital Investments
The Company invests in several venture capital funds that invest in start-up companies, primarily in the life sciences industry. The Company’s ownership interest in these funds ranges from less than 1% to approximately 12%. The Company accounts for the investments in limited partnerships (LPs), which are variable interest entities, under the equity method of accounting. For publicly-held investments in the LPs, the Company adjusts for changes in fair market value based on reported share holdings at the end of each fiscal quarter. The Company is not the primary beneficiary because it has no power to direct the activities that most significantly affect the LPs’ economic performance. The Company accounts for the investments in limited liability companies, which are not variable interest entities, under the equity method of accounting.
Under the equity method of accounting, the Company’s portion of the investment gains and losses, as reported in the fund’s financial statements on a quarterly lag each reporting period, is recorded in otherOther (expense) income, net in the accompanying consolidated statements of income. In addition, the Company adjusts the carrying value of these investments to reflect its estimate of changes to fair value since the fund’s financial statements are based on information from the fund’s management team, market prices of known public holdings of the fund, and other information.
Strategic Equity Investments
The Company periodically invests, with minority positions, directly in minority equity positions of predominantly privately-held companies that are reported either at fair value or under the equity method of accounting, as appropriate. Equity investments accounted for at fair value that do not have readily determinable fair values are generally recorded at cost minus impairment, if any, plus or minus changes resulting from observable price changes in orderly transactions for the identical or a similar investment of the same investee. Gains and losses from strategic equity investments are recorded in Other (expense) income, net in the accompanying consolidated statements of income.
CHARLES RIVER LABORATORIES INTERNATIONAL, INC.
NOTES TO CONSOLIDATED FINANCIAL STATEMENTS (Continued)
Derivative Contracts
The Company is exposed to certain risks relating to its ongoing business operations including changes to interest rates and currency exchange rates. The company uses derivative instruments primarily to manage currency exchange and interest rate risks. The Company recognizes derivative instruments as either assets or liabilities and measures those instruments at fair value. If a derivative is a hedge, depending on the nature of the hedge, changes in the fair value of the derivative are either offset against the change in fair value of the hedged item through earnings or recognized in other comprehensive items until the hedged item is recognized in earnings. Derivatives that are not designated as hedges are recorded at fair value through earnings.
For derivative instruments that are designated and qualify as a cash flow hedge, the gain or loss on the derivative is reported as a component of other comprehensive items and reclassified into earnings in the same period or periods during which the hedged transaction affects earnings and is presented in the same income statement line item as the earnings effect of the hedged item. The Company uses an interest rate swap to manage interest rate fluctuation related to floating rate borrowings under the Credit Facility.
The Company uses short-term forward currency exchange contracts primarily to hedge certain balance sheet and operational exposures resulting from changes in currency exchange rates, predominantly intercompany loans. The currency-exchange contracts principally hedge transactions denominated in Canadian dollars and euros. The Company does not hold or engage in transactions involving derivative instruments for purposes other than risk management.
Life Insurance Contracts
Investments in life insurance contracts are recorded at cash surrender value. The initial investment at the transaction price is recognized and remeasured based on fair value of underlying investments or contractual value each reporting period.Gains and losses from life insurance contracts are recorded in Other income (expense), net in the accompanying consolidated statements of income. Investments in and redemptions of these life insurance contracts are reported as cash flows from investing activities in the consolidated statement of cash flows. The Company held 44 contracts at both December 26, 2020 and December 28, 2019,30, 2023 with a face value of $79.1$82.4 million and $72.744 contracts with a face value of $74.5 million respectively.at December 31, 2022, which are recorded in Other assets.
Leases
The Company adopted Accounting Standards Codification Topic 842, “Leases” on December 30, 2018 using the modified retrospective method for all leases that had commenced as of the effective date, along with certain available practical expedients. Upon adoption the Company derecognized $26 million of property, plant and equipment, net and corresponding other debt associated with certain build-to-suit lease arrangements. The Company recorded operating lease right-of-use assets, net of $134 million, inclusive of opening adjustments impacting prepaid assets and other assets, primarily related to prepaid rent existing at transition, and $127 million of operating lease right-of-use liabilities, within our consolidated balance sheet upon adoption. There was no cumulative-effect adjustment to the opening balance of retained earnings in the period of adoption.
At inception of a contract, the Company determines if a contract meets the definition of a lease. A lease is a contract, or part of a contract, that conveys the right to control the use of identified property, plant, or equipment (an identified asset) for a period of time in exchange for consideration. The Company determines if the contract conveys the right to control the use of an identified asset for a period of time. The Company assesses throughout the period of use whether the Company has both of the following: (1) the right to obtain substantially all of the economic benefits from use of the identified asset, and (2) the right to
CHARLES RIVER LABORATORIES INTERNATIONAL, INC.
NOTES TO CONSOLIDATED FINANCIAL STATEMENTS (Continued)
direct the use of the identified asset. This determination is reassessed if the terms of the contract are changed. Leases are classified as operating or finance leases based on the terms of the lease agreement and certain characteristics of the identified asset. Right-of-use assets and lease liabilities are recognized at lease commencement date based on the present value of the minimum future lease payments.
The Company leases laboratory, production, and office space (real estate), as well as land, vehicles and certain equipment under non-cancellable operating and finance leases. The carrying value of the Company’s right-of-use lease assets is substantially concentrated in its real estate leases, while the volume of lease agreements is primarily concentrated in vehicles and equipment leases. The Company’s policy is to not record leases with an original term of twelve months or less on the consolidated balance sheets. The Company recognizes lease expense for these short-term leases on a straight-line basis over the lease term.
Certain lease agreements include rental payments that are adjusted periodically for inflation or other variables. In addition to rent, the leases may require the Company to pay additional amounts for taxes, insurance, maintenance and other expenses, which are generally referred to as non-lease components. Such adjustments to rental payments and variable non-lease components are treated as variable lease payments and recognized in the period in which the obligation for these payments was incurred. Variable lease components and variable non-lease components are not measured as part of the right-of-use asset and liability. Only when lease components and their associated non-lease components are fixed are they accounted for as a single lease component and are recognized as part of a right-of-use asset and liability. Total contract consideration is allocated to the combined fixed lease and non-lease component. This policy election applies consistently to all asset classes under lease agreements.
Most real estate leases contain clauses for renewal at the Company’s option with renewal terms that generally extend the lease term from 1 to 5 years. Certain lease agreements contain options to purchase the leased property and options to terminate the lease. Payments to be made in option periods are recognized as part of the right-of-use lease assets and lease liabilities when it is reasonably certain that the option to extend the lease will be exercised or the option to terminate the lease will not be exercised, or is not at the Company’s option. The Company determines whether the reasonably certain threshold is met by considering contract-, asset-, market-, and entity-based factors.
CHARLES RIVER LABORATORIES INTERNATIONAL, INC.
NOTES TO CONSOLIDATED FINANCIAL STATEMENTS (Continued)
A portfolio approach is applied to certain lease contracts with similar characteristics. The Company’s lease agreements do not contain any significant residual value guarantees or material restrictive covenants imposed by the leases.
The Company subleases a limited number of lease arrangements. Sublease activity is not material to the consolidated financial statements.
Stock-Based Compensation
The Company may grantgrants stock options, restricted stock, restricted stock units (RSUs), and performance share units (PSUs) to employees and stock options, restricted stock, and RSUs to non-employee directors under stock-based compensation plans. Stock-based compensation is recognized as an expense in the consolidated statements of income based on the grant date fair value, adjusted for forfeitures when they occur, over the requisite service period.
For stock options restricted stock and RSUs that vest based on service conditions, the Company uses the straight-line method to allocate compensation expense to reporting periods. Where awards are made with non-substantive vesting periods and a portion of the award continues to vest after the employee’s eligible retirement, the Company recognizes expense based on the period from the grant date to the date on which the employee is retirement eligible. The Company records the expense for PSU grants subject to performance and/or market conditions using the accelerated attribution method over the remaining service period when management determines that achievement of the performance-based milestone is probable.
The fair value of stock options granted is calculated using the Black-Scholes option-pricing model and the fair value of PSUs is estimated using a lattice model with a Monte Carlo simulation, both of which require the use of subjective assumptions including volatility and expected term, among others. The expected volatility assumption is typically determined using the historical volatility of the Company’s common stock over the expected life of the stock-based award. The expected term is determined using historical option exercise activity. The fair value of restricted stock and RSUs is based on the market value of the Company’s common stock on the date of grant.
Revenue Recognition
Revenue is recognized when, or as, obligations under the terms of a contract are satisfied, which occurs when control of the promised products or services is transferred to customers. Revenue is measured as the amount of consideration the Company expects to receive in exchange for transferring products or services to a customer (“transaction price”).
CHARLES RIVER LABORATORIES INTERNATIONAL, INC.
NOTES TO CONSOLIDATED FINANCIAL STATEMENTS (Continued)
To the extent the transaction price includes variable consideration, the Company estimates the amount of variable consideration that should be included in the transaction price utilizing the amount to which the Company expects to be entitled. Variable consideration is included in the transaction price if, in the Company’s judgment, it is probable that a significant future reversal of cumulative revenue under the contract will not occur. Estimates of variable consideration and determination of whether to include estimated amounts in the transaction price are based largely on an assessment of the Company’s anticipated performance and all information (historical, current and forecasted) that is reasonably available. Sales, value add, and other taxes collected on behalf of third parties are excluded from revenue.
When determining the transaction price of a contract, an adjustment is made if payment from a customer occurs either significantly before or significantly after performance, resulting in a significant financing component. Generally, the Company does not extend payment terms beyond one year. Applying the practical expedient, the Company does not assess whether a significant financing component exists if the period between when the Company performs its obligations under the contract and when the customer pays is one year or less. The Company’s contracts do not generally contain significant financing components.
Contracts with customers may contain multiple performance obligations. For such arrangements, the transaction price is allocated to each performance obligation based on the estimated relative standalone selling prices of the promised products or services underlying each performance obligation. The Company determines standalone selling prices based on the price at which the performance obligation is sold separately. If the standalone selling price is not observable through past transactions, the Company estimates the standalone selling price taking into account available information such as market conditions and internally approved pricing guidelines related to the performance obligations.
As part of the Company’s service offerings, the Company has identified performance obligations related to leasing Company owned assets. In certain arrangements, customers obtain substantially all of the economic benefits of the identified assets, which may include manufacturing suites and related equipment, and have the right to direct the assets’ use over the term of the contract. The associated revenue is recognized on a straight-line basis over the term of the lease, which is generally less than one year, and recorded within service revenue. Due to the nature of these arrangements and timing of the contractual lease term, the remaining revenue to be recognized related to these lease performance obligations is not material to the consolidated financial statements.
CHARLES RIVER LABORATORIES INTERNATIONAL, INC.
NOTES TO CONSOLIDATED FINANCIAL STATEMENTS (Continued)
Contracts are often modified to account for changes in contract specifications and requirements. Contract modifications exist when the modification either creates new, or changes existing, enforceable rights and obligations. Generally, when contract modifications create new performance obligations, the modification is considered to be a separate contract and revenue is recognized prospectively. When contract modifications change existing performance obligations, the impact on the existing transaction price and measure of progress for the performance obligation to which it relates is generally recognized as an adjustment to revenue (either as an increase in or a reduction of revenue) on a cumulative catch-up basis.
Product revenue is generally recognized when the customer obtains control of the Company’s product, which occurs at a point in time, and may be upon shipment or upon delivery based on the contractual shipping terms of a contract. Service revenue is generally recognized over time as the services are delivered to the customer based on the extent of progress towards completion of the performance obligation. The selection of the method to measure progress towards completion requires judgment and is based on the nature of the products or services to be provided. Depending on which better depicts the transfer of value to the customer, the Company generally measures its progress using either cost-to-cost (input method) or right-to-invoice (output method). The Company uses the cost-to-cost measure of progress when it best depicts the transfer of value to the customer which occurs as the Company incurs costs on its contract, generally related to fixed fee service contracts. Under the cost-to-cost measure of progress, the extent of progress towards completion is measured based on the ratio of costs incurred to date to the total estimated costs at completion of the performance obligation. The costs calculation includes variables such as labor hours, allocation of overhead costs, research model costs, and subcontractor costs. Revenue is recorded proportionally as costs are incurred. The right-to-invoice measure of progress is generally related to rate per unit contracts, as the extent of progress towards completion is measured based on discrete service or time-based increments, such as samples tested or labor hours incurred. Revenue is recorded in the amount invoiced since that amount corresponds directly to the value of the Company’s performance to date.
The timing of revenue recognition, billings and cash collections results in billed receivables (client receivables), contract assets (unbilled revenue), and contract liabilities (current and long-term deferred revenue and customer contract deposits) on the consolidated balance sheets. The Company’s payment terms are generally 30 days in the United States and consistent with prevailing practice in international markets. A contract asset is recorded when a right to consideration in exchange for goods or services transferred to a customer is conditioned other than the passage of time. Client receivables are recorded separately from contract assets since only the passage of time is required before consideration is due. A contract liability is recorded when consideration is received, or such consideration is unconditionally due, from a customer prior to transferring goods or services to the customer under the terms of a contract. Contract liabilities are recognized as revenue after control of the products or services is transferred to the customer and all revenue recognition criteria have been met. Cumulative catch-up adjustments to revenue are periodically recorded that affect the corresponding contract asset or contract liability, including adjustments arising from a change in the measure of progress, a change in an estimate of the transaction price (including any changes in the assessment of whether an estimate of variable consideration), or a contract modification.
Income Taxes
The provision for income taxes includes federal, state, local and foreign taxes. Income taxes are accounted for under the liability method. Deferred tax assets and liabilities are recognized for the expected future tax consequences of temporary differences between the financial statements carrying amounts and their respective tax basis. The Company measures deferred tax assets and liabilities using the enacted tax rates in effect when the temporary differences are expected to be settled. The Company evaluates the realizability of its deferred tax assets and establishes a valuation allowance when it is more likely than not that all or a portion of deferred tax assets will not be realized.
The Company accounts for uncertain tax positions using a “more-likely-than-not” threshold for recognizing and resolving uncertain tax positions. The Company evaluates uncertain tax positions on a quarterly basis and considers various factors, including, but not limited to, changes in tax law, the measurement of tax positions taken or expected to be taken in tax returns, the effective settlement of matters subject to audit, information obtained during in-process audit activities and changes in facts
CHARLES RIVER LABORATORIES INTERNATIONAL, INC.
NOTES TO CONSOLIDATED FINANCIAL STATEMENTS (Continued)
or circumstances related to a tax position. The Company also accrues for potential interest and penalties related to unrecognized tax benefits in income tax expense.
Foreign Currency Contracts
Foreign currency contracts are recorded at fair value in the Company’s consolidated balance sheets and are not designated as hedging instruments. Any gains or losses on forward contracts associated with intercompany loans are recognized immediately in Other (expense) income, net and are largely offset by the remeasurement of the underlying intercompany loan. Any gains or losses on forward contracts associated with the Company’s U.S. dollar denominated loan borrowed by a non-U.S. entity under the Company’s Credit Facility are recognized immediately in Interest expense. Gains or losses incurred on the remeasurement of the Company’s U.S. dollar denominated loan borrowed by a non-U.S. entity with a different functional currency is recorded in Other (expense) income, net.
CHARLES RIVER LABORATORIES INTERNATIONAL, INC.
NOTES TO CONSOLIDATED FINANCIAL STATEMENTS (Continued)
Translation of Foreign Currencies
For the Company’s subsidiaries that transact in a functional currency other than the U.S. dollar, assets and liabilities are translated at current rates of exchange as of the balance sheet date. Income and expense items are translated at the average foreign exchange rates for the period. Adjustments resulting from the translation of the financial statements of the Company’s foreign operations into U.S. dollars are excluded from the determination of net income and are recorded in accumulated other comprehensive loss, a separate component of equity.
Pension and Other Post-Retirement Benefit Plans
The Company recognizes the funded status of its defined benefit pension and other post-retirement benefit plans as an asset or liability. This amount is defined as the difference between the fair value of plan assets and the benefit obligation. The Company measures plan assets and benefit obligations as of its fiscal year end.
The key assumptions used to calculate benefit obligations and related pension costs include expected long-term rate of return on plan assets, withdrawal and mortality rates, expected rate of increase in employee compensation levels and a discount rate. Assumptions are determined based on the Company’s data and appropriate market indicators, and evaluated each year as of the plan’s measurement date.
The expected long-term rate of return on plan assets reflects the average rate of earnings expected on the funds invested, or to be invested, to provide for the benefits included in the projected benefit obligations. In determining the expected long-term rate of return on plan assets, the Company considers the relative weighting of plan assets, the historical performance of total plan assets and individual asset classes and economic and other indicators of future performance.
The rate of compensation increase reflects the expected annual salary increases for the plan participants based on historical experience and the current employee compensation strategy.
The Company is required to recognize as a component of otherOther comprehensive income, net of tax, the actuarial gains or losses and prior service costs or credits that arise but were not previously required to be recognized as components of net periodic benefit cost. Other comprehensive income is adjusted as these amounts are later recognized in income as components of net periodic benefit cost.
The Company records the service cost component of the net periodic benefit cost within Cost of services provided and Selling, general, and administrative expenses and all other components of net periodic benefit cost within Other (expense) income, net in the consolidated statements of income.
The Company recognizes pension settlement gains or losses in the period when all of the following settlement criteria are met: there is an irrevocable action, the Company is relieved of primary responsibility for a benefit obligation, and significant risks related to the obligation and the assets used to effect the settlement are eliminated.
Earnings Per Share
Basic earnings per share is calculated by dividing net income attributable to common shareholders by the weighted-average number of common shares outstanding during the period. Except where the result would be anti-dilutive to income from continuing operations, diluted earnings per share is computed using the treasury stock method, assuming the exercise of stock options and the vesting of restricted stock awards, RSUs, or evaluating the performance conditions for PSUs to assess whether the conditions have been met, as well as their related income tax effects.
Treasury Shares
CHARLES RIVER LABORATORIES INTERNATIONAL, INC.
NOTES TO CONSOLIDATED FINANCIAL STATEMENTS (Continued)
The Company periodically retires treasury shares acquired through share repurchases and returns those shares to the status of authorized but unissued. The Company accounts for treasury stock transactions under the cost method. For each reacquisition of common stock, the number of shares and the acquisition price for those shares is added to the existing treasury stock count and total value. Thus, the average cost per share is re-averaged each time shares are acquired. When treasury shares are retired, the Company allocates the excess of the repurchase price over the par value of shares acquired to both retained earnings and additional paid-in-capital. The portion allocated to additional paid-in-capital is determined by applying a percentage, determined by dividing the number of shares to be retired by the number of shares issued, to the balance of additional paid-in-capital as of the retirement date.
Newly Adopted Accounting Pronouncements
In August 2018,2. ACQUISITIONS AND DIVESTITURES
Fiscal 2023 Acquisition
Noveprim Group
On November 30, 2023, the Financial Accounting Standards Board (FASB) issued ASU 2018-15, “Intangibles - Goodwill and Other - Internal-Use Software (Subtopic 350-40): Customer’s Accounting for Implementation Costs IncurredCompany completed the acquisition of an additional 41% equity interest of Noveprim Group (Noveprim), a leading supplier of non-human primates (NHPs) located in Mauritius, resulting in a Cloud Computer Arrangement that is a Service Contract.” ASU 2018-15 aligns the requirements for capitalizing implementation costs incurred in a hosting arrangement that is a service contract with the requirements for capitalizing implementation costs incurred to develop or obtain internal-use software (and hosting arrangements that include an internal-use software license).90% controlling interest. The Company’s adoption of this standard in fiscal year 2020 did not have a significant impact on the consolidated financial statements and related disclosures.
In August 2018, the FASB issued ASU 2018-13, “Fair Value Measurement (Topic 820) - Disclosure Framework - Changes to the Disclosure Requirements for Fair Value Measurement.” ASU 2018-13 removes the disclosure requirement for the amount and reasons for transfers between Level 1 and Level 2 fair value measurements as well as the process for Level 3 fair value measurements. In addition, the ASU adds the disclosure requirements for changes in unrealized gains and losses included in Other comprehensive income (loss) for recurring Level 3 fair value measurements held at the end of the reporting period as well as the range and weighted average of significant unobservable inputs used to develop Level 3 fair value measurements. The Company’s adoption of this standard in fiscal year 2020 did not have a significant impact on the consolidated financial statements and related disclosures.
In August 2018, the FASB issued ASU 2018-14, “Compensation Retirement Benefits - Defined Benefit Plans -General (Subtopic 715-20).” ASU 2018-14 removes the requirements to disclose the amounts in Accumulated other comprehensive income (loss) expected to be recognized as components of net periodic benefit cost over the next fiscal year and the related party disclosures about the amount of future annual benefits covered by insurance contracts. In addition, the ASU adds the requirement to disclose an explanation for any significant gains and losses related to changes in the benefit obligation for the period. The Company’s adoption of this standard in fiscal year 2020 did not have a significant impact on the consolidated financial statements and related disclosures.
In January 2017, the FASB issued ASU 2017-04, “Simplifying the Test for Goodwill Impairment.” The standard simplifies the accounting for goodwill impairment by removing Step 2 of the goodwill impairment test, which requires a hypothetical purchase price allocation. The Company’s adoption of this standard in fiscal year 2020 did not have a significant impact on the consolidated financial statements and related disclosures.
In June 2016, the FASB issued ASU 2016-13, “Financial Instruments - Credit Losses”. The standard, including subsequently issued amendments, requires a financial asset measured at amortized cost basis, such as trade and notes receivables, to be presented at the net amount expected to be collected based on relevant information about past events, including historical experience, current conditions, and reasonable and supportable forecasts that affect the collectability of the reported amount. The Company’s adoption of this standard in fiscal year 2020 did not have a significant impact on the consolidated financial statements and related disclosures.
Newly Issued Accounting Pronouncements
In March 2020, the FASB issued ASU 2020-04, “Reference Rate Reform (Topic 848): Facilitation of the Effects of Reference Rate Reform on Financial Reporting.” The ASU, including subsequently issued updates, offers temporary optional expedients and exceptions for applying U.S. GAAP to modifications to agreements such as loans, debt securities, derivatives, and borrowings which reference LIBOR or another reference rate that is expected to be discontinued by December 31, 2021. The expedients and exceptions provided by the standard do not apply to modifications made and hedging relationships entered into or evaluated after December 31, 2022, except for hedging relationships existing as of December 31, 2022 that an entity has elected certain optional expedients for and are retained through the end of the hedging relationship. The ASU is effective until December 31, 2022 when the replacement for LIBOR is expected to be completed. The interest rate on the Company’s senior credit facility, which matures in fiscal year 2023, is linked to LIBOR. The Company is in the process of evaluating options for
CHARLES RIVER LABORATORIES INTERNATIONAL, INC.
NOTES TO CONSOLIDATED FINANCIAL STATEMENTS (Continued)
transitioning awayCompany had previously acquired a 49% equity interest in 2022 for $90.0 million plus additional contingent payments up to $5.0 million based on future performance. The total consideration allocable to the Noveprim acquisition is $374.8 million, which includes $144.6 million additional cash paid for the 41% equity interest, elimination of historical activity and intercompany balances of $198.8 million which includes a remeasurement gain on the 49% equity investment of $103.2 million, contingent consideration of $33.3 million, deferred purchase price of $12.0 million payable from 2024 through 2027, offset by estimated post-closing adjustments for working capital of $13.8 million. The contingent consideration fair value is estimated using a Monte Carlo Simulation model and the maximum contingent contractual payments are up to $55.0 million based on future performance and milestone achievements from in fiscal years 2023 through 2025. The Company has the call option right to purchase the remaining 10% equity interest up until one month after the sixth anniversary of closing the 41% equity interest. On the first anniversary of the expiration of the call option, a 12-month put option will be triggered giving the seller the right to require the Company to acquire the remaining shares of the seller. The redemption price for the call/put is fixed and ranges from $47.0 million to $54.0 million depending on when exercised. The noncontrolling interest is classified as a redeemable noncontrolling interest in the mezzanine section of the consolidated balance sheet. The acquisition was funded through a combination of available cash and proceeds from the senior credit facility’s useCompany’s Credit Facility. This business is reported as part of LIBORthe Company’s DSA reportable segment for NHPs vertically integrated into the DSA supply chain and expectsthe RMS reportable segment for those NHPs sold to be completedthird party customers.
SAMDI Tech, Inc.
On January 27, 2023, the Company acquired SAMDI Tech, Inc., (SAMDI), a leading provider of high-quality, label-free high-throughput screening (HTS) solutions for drug discovery research. The acquisition of SAMDI will provide clients with seamless access to the premier, label-free HTS MS platform and create a comprehensive, library of drug discovery solutions. The purchase price of SAMDI was $62.8 million, net of $0.4 million in cash, inclusive of a 20% strategic equity interest previously owned by the time LIBORCompany of $12.6 million. The acquisition was funded through a combination of available cash and proceeds from the Company’s Credit Facility. This business is phased out. The Company did not elect to apply anyreported as part of the expedients or exceptions asCompany’s DSA reportable segment.
Fiscal 2022 Acquisition
Explora BioLabs Holdings, Inc.
On April 5, 2022, the Company acquired Explora BioLabs Holdings, Inc. (Explora BioLabs), a provider of and for the fiscal year ended December 26, 2020 and is currently evaluating the impact this new standard will have on the consolidated financial statementscontract vivarium research services, providing biopharmaceutical clients with turnkey in vivo vivarium facilities, management and related disclosures.
In January 2020,services to efficiently conduct their early-stage research activities. The acquisition of Explora BioLabs complements the FASB issued ASU 2020-01, “Investments-Equity Securities (Topic 321), Investments-Equity MethodCompany’s existing Insourcing Solutions business, specifically the CRADL™ (Charles River Accelerator and Joint Ventures (Topic 323),Development Lab) footprint, and Derivativesoffers incremental opportunities to partner with an emerging client base, many of which are engaged in cell and Hedging (Topic 815).” ASU 2020-01 states any equity security transitioninggene therapy development. The purchase price of Explora BioLabs was $284.5 million, net of $6.6 million in cash. The acquisition was funded through proceeds from the alternative methodCompany’s Credit Facility. This business is reported as part of accounting under Topic 321the Company’s RMS reportable segment.
Fiscal 2021 Acquisitions
Vigene Biosciences, Inc.
On June 28, 2021, the Company acquired Vigene Biosciences, Inc. (Vigene), a gene therapy CDMO, providing viral vector-based gene delivery solutions. The acquisition enables clients to seamlessly conduct analytical testing, process development, and manufacturing for advanced modalities with the equity method, or vice versa, duesame scientific partner. The purchase price of Vigene was $323.9 million, net of $2.7 million in cash. Included in the purchase price are contingent payments fair valued at $34.5 million, which was estimated using a Monte Carlo Simulation model (the maximum contingent contractual payments are up to an observable transaction will be remeasured immediately before the transition. In addition,$57.5 million based on future performance). The acquisition was funded through a combination of available cash and proceeds from the ASU clarifiesCompany’s Credit Facility. This business is reported as part of the accounting for certain non-derivative forward contracts or purchased call options to acquire equity securities stating such instruments will be measured usingCompany’s Manufacturing reportable segment. As of December 30, 2023 and December 31, 2022 the fair value principles of Topic 321 before settlement or exercise. The ASU is effective for fiscal years beginning after December 15, 2020,the contingent consideration was zero as certain financial targets have not and will be applied on a prospective basis. Early adoption is permitted. The adoption of this standard isare not expected to have a material impact onbe achieved.
Retrogenix Limited
On March 30, 2021, the Company acquired Retrogenix Limited (Retrogenix), an outsourced discovery services provider specializing in bioanalytical services utilizing its proprietary cell microarray technology. The acquisition of Retrogenix enhances the Company’s consolidated financial statements and related disclosures.
In December 2019,scientific expertise with additional large molecule and cell therapy discovery capabilities. The purchase price of Retrogenix was $53.9 million, net of $8.5 million in cash. Included in the FASB issued ASU 2019-12, “Income Taxes (Topic 740): Simplifying the Accounting for Income Taxes.” ASU 2019-12 simplifies the accounting for income taxes by removing exceptions within the general principles of Topic 740 regarding the calculation of deferred tax liabilities, the incremental approach for intraperiod tax allocation, and calculating income taxes in an interim period. In addition, the ASU adds clarifications to the accounting for franchise tax (or similar tax),purchase price are contingent payments fair valued at $6.9 million, which is partiallythe maximum potential payout, and was based on income, evaluating tax basisa probability-weighted approach. The acquisition was funded through a combination of goodwill recognizedavailable cash and proceeds from the Company’s Credit Facility. This business is reported as part of the Company’s DSA reportable segment.
CHARLES RIVER LABORATORIES INTERNATIONAL, INC.
NOTES TO CONSOLIDATED FINANCIAL STATEMENTS (Continued)
Cognate BioServices, Inc.
On March 29, 2021, the Company acquired Cognate BioServices, Inc. (Cognate), a business combination,cell and reflectinggene therapy CDMO offering comprehensive manufacturing solutions for cell therapies, as well as for the effectproduction of any enacted changes in tax laws or ratesplasmid DNA and other inputs in the annual effective tax rate computationCDMO value chain. The acquisition of Cognate establishes the Company as a scientific partner for cell and gene therapy development, testing, and manufacturing, providing clients with an integrated solution from basic research and discovery through cGMP production. The purchase price of Cognate was $877.9 million, net of $70.5 million in cash and includes $15.7 million of consideration for an approximate 2% ownership interest not initially acquired, but redeemed in April 2022 with the interim period that includes the enactment date.ultimate payout tied to performance in 2021. The ASU is effective for fiscal years beginning after December 15, 2020,acquisition was funded through a combination of available cash and will be applied either retrospectively or prospectively based upon the applicable amendments. Early adoption is permitted. The adoption of this standard is not expected to have a material impact onproceeds from the Company’s consolidated financial statements and related disclosures.
2. BUSINESS COMBINATIONSCredit Facility and senior notes (Senior Notes) issued in fiscal 2021. This business is reported as part of the Company’s Manufacturing reportable segment.
Distributed Bio, Inc.
On December 31, 2020, (fiscal year 2021), the Company acquired Distributed Bio, IncInc. (Distributed Bio), a next-generation antibody discovery company with technologies specializing in enhancing the probability of success for delivering high-quality, readily formattable antibody fragments to support antibody and cell and gene therapy candidates to biopharmaceutical clients. The acquisition of Distributed Bio expands the Company’s capabilities with an innovative, large-molecule discovery platform, and creates an integrated, end-to-end platform for therapeutic antibody and cell and gene therapy discovery and development. The preliminary purchase price of Distributed Bio was approximately $83$97.0 million, net of $0.8 million in cash. The total consideration includes $80.8 million cash with additionalpaid, settlement of $3.0 million in convertible promissory notes previously issued by the Company during prior fiscal years, and $14.1 million of contingent consideration, which was estimated using a Monte Carlo Simulation model (the maximum contingent contractual payments ofare up to $21$21.0 million based on future performance. The acquisition was funded throughperformance and milestone achievements over a combination of available cash and proceeds from the Company’s Credit Facility. This business will be reported as part of the Company’s DSA reportable segment. Due to the limited time between the acquisition date and the filing of this Annual Report on Form 10-K, it is not practicable for the Company to disclose the preliminary allocation of the purchase price to assets acquired and liabilities assumed. The Company incurred transaction and integration costs in connection with the acquisition of $1.2 million during fiscal year 2020, which were included in Selling, general and administrative expenses within the consolidated statements of income.
Cellero, LLC
On August 6, 2020, the Company acquired Cellero, LLC (Cellero), a provider of cellular products for cell therapy developers and manufacturers worldwide. The addition of Cellero enhances the Company’s unique, comprehensive solutions for the high-growth cell therapy market, strengthening the ability to help accelerate clients’ critical programs from basic research and proof-of-concept to regulatory approval and commercialization. It also expands the Company’s access to high-quality, human-derived biomaterials with Cellero’s donor sites in the United States. The purchase price for Cellero was $37.4 million in cash. The acquisition was funded through available cash. This business is reported as part of the Company’s RMS reportable segment.
The preliminary purchase price allocation of $36.9 million, net of $0.5 million of cash acquired was as follows:
CHARLES RIVER LABORATORIES INTERNATIONAL, INC.
NOTES TO CONSOLIDATED FINANCIAL STATEMENTS (Continued)
| | | | | |
| August 6, 2020 |
| (in thousands) |
Trade receivables | $ | 1,500 | |
Inventories | 551 | |
Other current assets (excluding cash) | 182 | |
Property, plant and equipment | 1,648 | |
Goodwill | 19,457 | |
Definite-lived intangible assets | 16,230 | |
Other long-term assets | 849 | |
Current liabilities | (1,360) | |
Deferred tax liabilities | (1,467) | |
Other long-term liabilities | (740) | |
Total purchase price allocation | $ | 36,850 | |
The preliminary purchase price allocation is subject to change as additional information becomes available concerning the fair value and tax basis of the assets acquired and liabilities assumed, including certain contracts and obligations. From the date of the acquisition through December 26, 2020, the Company recorded measurement-period adjustments related to the acquisition that resulted in an immaterial change to the purchase price allocation on a consolidated basis. Any additional adjustments to the purchase price allocation will be made as soon as practicable but no later than one year from the date of acquisition.
The breakout of definite-lived intangible assets acquired was as follows:
| | | | | | | | | | | |
| Definite-Lived Intangible Assets | | Weighted Average Amortization Life |
| (in thousands) | | (in years) |
| Client relationships | $ | 14,740 | | | 13 |
| Other intangible assets | 1,490 | | | 3 |
| Total definite-lived intangible assets | $ | 16,230 | | | 12 |
The goodwill resulting from the transaction, $10.8 million of which is deductible for tax purposes due to a prior asset acquisition, is primarily attributable to the potential growth of the Company’s RMS business from customers introduced through Cellero and the assembled workforce of the acquired business.
The Company incurred transaction and integration costs in connection with the acquisition of $2.7 million during fiscal year 2020, which were primarily included in Selling, general and administrative expenses within the consolidated statements of income.
Pro forma financial information as well as the disclosure of actual revenue and operating income (loss) have not been included because Cellero's financial results are not significant when compared to the Company’s consolidated financial results.
HemaCare Corporation
On January 3, 2020, the Company acquired HemaCare Corporation (HemaCare), a business specializing in the production of human-derived cellular products for the cell therapy market. The acquisition of HemaCare expands the Company’s comprehensive portfolio of early-stage research and manufacturing support solutions to encompass the production and customization of high-quality, human derived cellular products to better support clients’ cell therapy programs. The purchase price of HemaCare was $379.8 million in cash. The acquisition was funded through a combination of available cash and proceeds from the Company’s Credit Facility. This business is reported as part of the Company’s RMS reportable segment.
CHARLES RIVER LABORATORIES INTERNATIONAL, INC.
NOTES TO CONSOLIDATED FINANCIAL STATEMENTS (Continued)
Thepurchase price allocation of $376.7 million, net of $3.1 million of cash acquired was as follows:
| | | | | |
| January 3, 2020 |
| (in thousands) |
Trade receivables | $ | 6,451 | |
Inventories | 8,468 | |
Other current assets (excluding cash) | 3,494 | |
Property, plant and equipment | 10,033 | |
Goodwill | 210,196 | |
Definite-lived intangible assets | 183,540 | |
Other long-term assets | 5,920 | |
Current liabilities | (5,188) | |
Deferred tax liabilities | (38,529) | |
Other long-term liabilities | (7,664) | |
Total purchase price allocation | $ | 376,721 | |
From the date of the acquisition through December 26, 2020, the Company recorded measurement-period adjustments related to the acquisition that resulted in an immaterial change to the purchase price allocation on a consolidated basis. No further adjustments will be made to the purchase price allocation.
The breakout of definite-lived intangible assets acquired was as follows:
| | | | | | | | | | | |
| Definite-Lived Intangible Assets | | Weighted Average Amortization Life |
| (in thousands) | | (in years) |
| Client relationships | $ | 170,390 | | | 19 |
| Trade name | 7,330 | | | 10 |
| Other intangible assets | 5,820 | | | 3 |
| Total definite-lived intangible assets | $ | 183,540 | | | 18 |
The goodwill resulting from the transaction is primarily attributable to the potential growth of the Company’s RMS business from customers introduced through HemaCare and the assembled workforce of the acquired business. The goodwill attributable to HemaCare is not deductible for tax purposes.
The Company incurred transaction and integration costs in connection with the acquisition of $6.1 million and $3.3 million during fiscal years 2020 and 2019, respectively, which were primarily included in Selling, general and administrative expenses within the consolidated statements of income.
Beginning on January 3, 2020, HemaCare has been included in the operating results of the Company. HemaCare revenue and operating loss during fiscal year 2020 was $43.0 million and $8.1 million, respectively.
The following selected unaudited pro forma consolidated results of operations are presented as if the HemaCare acquisition had occurred as of the beginning of the period immediately preceding the period of acquisition, which is December 30, 2018, after giving effect to certain adjustments. For fiscal year 2020, these adjustments included additional amortization of intangible assets and depreciation of fixed assets of $1.2 million, elimination of intercompany activity and other one-time costs, and the tax impacts of these adjustments. For fiscal year 2019, these adjustments included additional amortization of intangible assets and depreciation of fixed assets of $12.8 million, additional interest expense on borrowings of $10.8 million, elimination of intercompany activity and other one-time costs, and the tax impacts of these adjustments.
| | | | | | | | | | | |
| Fiscal Year |
| 2020 | | 2019 |
| (in thousands) |
| (unaudited) |
| Revenue | $ | 2,923,951 | | | $ | 2,661,565 | |
| Net income attributable to common shareholders | 368,800 | | | 245,423 | |
CHARLES RIVER LABORATORIES INTERNATIONAL, INC.
NOTES TO CONSOLIDATED FINANCIAL STATEMENTS (Continued)
These unaudited pro forma results of operations have been prepared for comparative purposes only, and they do not purport to be indicative of the results of operations that actually would have resulted had the acquisition occurred on the dates indicated or that may result in the future. No effect has been given for synergies, if any, that may be realized through the acquisition.
Citoxlab
On April 29, 2019, the Company acquired Citoxlab, a non-clinical CRO, specializing in regulated safety assessment services, non-regulated discovery services, and medical device testing. With operations in Europe and North America, the acquisition of Citoxlab further strengthens the Company’s position as a leading, global, early-stage CRO by expanding its scientific portfolio and geographic footprint, which enhances the Company’s ability to partner with clients across the drug discovery and development continuum. The purchase price for Citoxlab was $527.1 million in cash.one-year period). The acquisition was funded through a combination of available cash and proceeds from the Company’s Credit Facility. This business is reported as part of the Company’s DSA reportable segment. During fiscal year 2022, $7.0 million of contingent consideration was paid as certain operational milestones were achieved. As of December 30, 2023, other financial targets associated with the contingent consideration were not met and the fair value of the remaining contingent consideration is zero.
Other Acquisition
On March 3, 2021, the Company acquired certain assets from a distributor that supports the Company’s DSA reportable segment. The purchase price allocation of $490.4was $35.4 million, net of $36.7which includes $19.5 million ofin cash acquired was as follows:
| | | | | |
| April 29, 2019 |
| (in thousands) |
Trade receivables | $ | 35,405 | |
Inventories | 5,282 | |
Other current assets (excluding cash) | 13,917 | |
Property, plant and equipment | 88,605 | |
Goodwill | 280,161 | |
Definite-lived intangible assets | 162,400 | |
Other long-term assets | 20,063 | |
Deferred revenue | (15,278) | |
Current liabilities | (46,081) | |
Deferred tax liabilities | (27,458) | |
Other long-term liabilities | (22,624) | |
Redeemable noncontrolling interest | (4,035) | |
Total purchase price allocation | $ | 490,357 | |
From the date of the acquisition through March 28, 2020, the Company recorded measurement-period adjustments related to the acquisition that resulted in an immaterial change to the purchase price allocation on a consolidated basis. No further adjustments will be made to the purchase price allocation.
The breakout of definite-lived intangible assets acquired was as follows:
| | | | | | | | | | | |
| Definite-Lived Intangible Assets | | Weighted Average Amortization Life |
| (in thousands) | | (in years) |
| Client relationships | $ | 134,600 | | | 13 |
| Developed technology | 19,900 | | | 3 |
| Backlog | 7,900 | | | 1 |
| Total definite-lived intangible assets | $ | 162,400 | | | 12 |
The goodwill resulting from the transaction, $7.2paid ($5.5 million of which was paid in fiscal 2020), and $15.9 million of contingent consideration, which was estimated using a Monte Carlo Simulation model (the maximum contingent contractual payments are up to $17.5 million based on future performance over a three-year period). The fair value of the net assets acquired included $17.3 million of goodwill, $15.2 million attributed to supplier relationships (to be amortized over a 4-year period), and $3.0 million of property, plant, and equipment. The business is deductible for tax purposes due to a prior asset acquisition, is primarily attributable to the potential growthreported as part of the Company’s DSA business from customers introduced through Citoxlab andreportable segment. As of December 30, 2023, the assembled workforcefair value of the acquired business.contingent consideration was zero as certain operational targets were not achieved.
The Company incurred transaction and integration costs in connection with the acquisition of
$4.1 million and $20.7 million during fiscal years 2020 and 2019, respectively, which were primarily included in Selling, general and administrative expenses within the consolidated statements of income.
The following selected unaudited pro forma consolidated results of operations are presented as if the Citoxlab acquisition had occurred as of the beginning of the period immediately preceding the period of acquisition, which is December 31, 2017, after giving effect to certain adjustments. For fiscal year 2019, these adjustments included additional amortization of intangible
CHARLES RIVER LABORATORIES INTERNATIONAL, INC.
NOTES TO CONSOLIDATED FINANCIAL STATEMENTS (Continued)
assets and depreciation of fixed assets of $5.7 million, additional interest expense on borrowings of $1.2 million, elimination of intercompany activity and other one-time costs, and the tax impacts of these adjustments. For fiscal year 2018, these adjustments included additional amortization of intangible assets and depreciation of fixed assets of $9.4 million, additional interest expense on borrowings of $4.1 million, elimination of intercompany activity and other one-time costs, and the tax impacts of these adjustments.
| | | | | | | | | | | |
| Fiscal Year |
| 2019 | | 2018 |
| (in thousands) |
| (unaudited) |
| Revenue | $ | 2,683,610 | | | $ | 2,442,283 | |
| Net income attributable to common shareholders | 268,995 | | | 233,288 | |
These unaudited pro forma results of operations have been prepared for comparative purposes only, and they do not purport to be indicative of the results of operations that actually would have resulted had the acquisition occurred on the dates indicated or that may result in the future. No effect has been given for synergies, if any, that may be realized through the acquisition.
MPI Research
On April 3, 2018, the Company acquired MPI Research, a non-clinical CRO providing comprehensive testing services to biopharmaceutical and medical device companies worldwide. The acquisition enhances the Company’s position as a leading global early-stage CRO by strengthening its ability to partner with clients across the drug discovery and development continuum. The purchasePurchase price for MPI Research was $829.7 million in cash. The acquisition was funded by borrowings on the Credit Facility as well as the issuance of the Company’s 2026 Senior Notes. This business is reported as part of the Company’s DSA reportable segment.information
The purchase price allocation of $800.8 million, net of $27.7 million of cash acquiredfor acquisitions during fiscal years 2023 and a final net working capital adjustment of $1.2 million,2022 was as follows:
| | | | | |
| April 3, 2018 |
| (in thousands) |
Trade receivables | $ | 35,073 | |
Inventories | 4,463 | |
Other current assets (excluding cash) | 5,893 | |
Property, plant and equipment | 128,403 | |
Goodwill | 441,656 | |
Definite-lived intangible assets | 309,200 | |
Other long-term assets | 1,081 | |
Deferred revenue | (23,926) | |
Current liabilities | (32,885) | |
Deferred tax liabilities | (65,945) | |
Other long-term liabilities | (2,213) | |
Total purchase price allocation | $ | 800,800 | |
From the date of the acquisition through March 30, 2019, the Company recorded measurement-period adjustments related to the acquisition that resulted in an immaterial change to the purchase price allocation on a consolidated basis. No further adjustments will be made to the purchase price allocation.
The breakout of definite-lived intangible assets acquired was as follows: | | | | | | | | | | | | | | | | | |
| Noveprim Group(1) | | SAMDI Tech, Inc. | | Explora BioLabs |
| November 30, 2023 | | January 27, 2023 | | April 5, 2022 |
| (in thousands) |
| Trade receivables | $ | 1,308 | | | $ | 513 | | | $ | 7,679 | |
| Inventories | 66,500 | | | — | | | — | |
| Other current assets (excluding cash) | 3,965 | | | 75 | | | 1,067 | |
| Property, plant and equipment | 35,831 | | | 593 | | | 37,369 | |
| Operating lease right-of-use asset, net | 104 | | | — | | | 48,613 | |
Goodwill (2) | 172,349 | | | 37,129 | | | 215,752 | |
| Definite-lived intangible assets | 9,500 | | | 33,070 | | | 70,100 | |
Other long-term assets (3) | 167,907 | | | 6 | | | 556 | |
| Deferred revenue | — | | | (43) | | | (3,507) | |
| Other current liabilities | (16,378) | | | (351) | | | (15,507) | |
| Operating lease right-of-use liabilities (Long-term) | (97) | | | — | | | (57,193) | |
| Deferred tax liabilities | (12,984) | | | (8,191) | | | (18,601) | |
| Other long-term liabilities | (7,797) | | | — | | | (1,807) | |
Redeemable noncontrolling interest (4) | (45,374) | | | — | | | — | |
| Total purchase price allocation | $ | 374,834 | | | $ | 62,801 | | | $ | 284,521 | |
| | | | | |
(1) Purchase price allocation is preliminary and subject to change as additional information becomes available concerning the fair value and tax basis of the assets acquired and liabilities assumed, including certain contracts, obligations, and finalization of any working capital adjustments. Any additional adjustments to the purchase price allocation will be made as soon as practicable but no later than one year from the date of acquisition. |
(2) The goodwill resulting from these transactions is primarily attributable to the potential growth of the Company’s segments from new customers introduced to the acquired businesses or synergies to be realized from acquiring an internal supplier servicing the DSA business and the assembled workforce of the acquirees, thus is not deductible for tax purposes. Explora BioLabs had $5.0 million of goodwill due to a prior asset acquisition that is deductible for tax purposes. |
(3) Other long-term assets acquired from the Noveprim acquisition include $167.8 million of biological assets, which will be amortized over an estimated eight year useful life. |
(4) Refer to Note 12. Equity and Noncontrolling Interests for further a description of the 10% noncontrolling interest fair value. |
CHARLES RIVER LABORATORIES INTERNATIONAL, INC.
NOTES TO CONSOLIDATED FINANCIAL STATEMENTS (Continued)
| | | | | | | | | | | |
| Definite-Lived Intangible Assets | | Weighted Average Amortization Life |
| (in thousands) | | (in years) |
| Client relationships | $ | 264,900 | | | 13 |
| Developed technology | 23,400 | | | 3 |
| Backlog | 20,900 | | | 1 |
| Total definite-lived intangible assets | $ | 309,200 | | | 12 |
| | | | | | | | | | | | | | | | | | | | | | | |
| Vigene | | Retrogenix | | Cognate | | Distributed Bio |
| June 28, 2021 | | March 30, 2021 | | March 29, 2021 | | December 31, 2020 |
| (in thousands) |
| Trade receivables | $ | 3,548 | | | $ | 2,266 | | | $ | 18,566 | | | $ | 2,722 | |
| Other current assets (excluding cash) | 1,657 | | | 209 | | | 14,128 | | | 221 | |
| Property, plant and equipment | 7,649 | | | 400 | | | 52,082 | | | 2,382 | |
| Operating lease right-of-use asset, net | 22,507 | | | 1,385 | | | 34,349 | | | 1,586 | |
Goodwill (1) | 239,681 | | | 34,489 | | | 611,555 | | | 71,585 | |
| Definite-lived intangible assets | 93,900 | | | 22,126 | | | 270,900 | | | 24,540 | |
| Other long-term assets | 694 | | | — | | | 6,098 | | | 469 | |
| Deferred revenue | (4,260) | | | (434) | | | (20,539) | | | (1,319) | |
Other current liabilities (2) | (6,319) | | | (1,141) | | | (45,388) | | | (1,504) | |
| Operating lease right-of-use liabilities (Long-term) | (21,220) | | | (1,205) | | | (31,383) | | | (1,123) | |
| Deferred tax liabilities | (13,958) | | | (4,174) | | | (32,503) | | | (2,529) | |
| | | | | | | |
| Total purchase price allocation | $ | 323,879 | | | $ | 53,921 | | | $ | 877,865 | | | $ | 97,030 | |
| | | | | | | |
(1) The goodwill resulting from these transactions is primarily attributable to the potential growth of the Company’s segments from new customers introduced to the acquired businesses and the assembled workforce of the acquirees, thus is not deductible for tax purposes. |
(2) In connection with its acquisitions of businesses, the Company routinely records liabilities related to indirect state and local taxes for preacquisition periods when such liabilities are estimable and deemed probable. The Company may or may not be indemnified for such indirect tax liabilities under terms of the acquisitions. As these indirect tax contingencies are resolved, actual obligations, and any indemnifications, may differ from the recorded amounts and any differences are reflected in reported results in the period in which these are resolved. Specifically for Cognate, as of March 29, 2021, the Company recorded an estimated liability of $17 million pertaining to indirect state sales taxes. During fiscal year 2022, the Company received a favorable ruling from the applicable state in which the indirect state sales tax liability arose and, accordingly, this liability was reduced in full, resulting in a gain recorded through selling, general and administrative expenses in the period. |
The goodwill resulting from the transaction, $4.1 million of which is deductible for tax purposes due to a prior asset acquisition, is primarily attributable to the potential growth of the Company’s DSA business from customers introduced through MPI Researchdefinite-lived intangible assets acquired during fiscal years 2023 and the assembled workforce of the acquired business.2022 were as follows:
| | | | | | | | | | | | | | | | | |
| Noveprim Group | | SAMDI Tech, Inc. | | Explore BioLabs |
| Definite-Lived Intangible Assets | (in thousands) |
| Client relationships | $ | — | | | $ | 23,400 | | | $ | 64,000 | |
| Other intangible assets | 9,500 | | | 9,670 | | | 6,100 | |
| Total definite-lived intangible assets | $ | 9,500 | | | $ | 33,070 | | | $ | 70,100 | |
| | | | | |
| Weighted Average Amortization Life | (in years) |
| Client relationships | — | | | 15 | | 13 |
| Other intangible assets | 7 | | 7 | | 4 |
| Total definite-lived intangible assets | 7 | | 12 | | 12 |
The Company incurreddefinite-lived intangible assets acquired during fiscal years 2021 were as follows:
| | | | | | | | | | | | | | | | | | | | | | | |
| Vigene | | Retrogenix | | Cognate | | Distributed Bio |
| Definite-Lived Intangible Assets | (in thousands) |
| Client relationships | $ | 87,500 | | | $ | 17,340 | | | $ | 257,200 | | | $ | 16,080 | |
| Other intangible assets | 6,400 | | | 4,786 | | | 13,700 | | | 8,460 | |
| Total definite-lived intangible assets | $ | 93,900 | | | $ | 22,126 | | | $ | 270,900 | | | $ | 24,540 | |
| | | | | | | |
| Weighted Average Amortization Life | (in years) |
| Client relationships | 12 | | 13 | | 13 | | 9 |
| Other intangible assets | 2 | | 3 | | 2 | | 4 |
| Total definite-lived intangible assets | 11 | | 11 | | 13 | | 7 |
CHARLES RIVER LABORATORIES INTERNATIONAL, INC.
NOTES TO CONSOLIDATED FINANCIAL STATEMENTS (Continued)
The transaction and integration costs incurred for fiscal years 2023, 2022 and 2021 were as follows:
| | | | | | | | | | | | | | | | | |
| 2023 | | 2022 | | 2021 |
| (in thousands) |
| Transaction and Integration Costs | | | | | |
| Selling, general and administrative expenses | $ | 12,379 | | | $ | 8,470 | | | $ | 39,099 | |
| | | | | |
Divestitures
The Company routinely evaluates the strategic fit and fundamental performance of its global businesses, divesting operations that do not meet key business criteria. As part of this ongoing assessment, the Company determined that certain capital could be better deployed in connectionother long-term growth opportunities.
Avian Vaccine Services
On December 20, 2022, the Company sold its Avian Vaccine Services business (Avian) to a private investor group for a purchase price of $167.3 million in cash, subject to certain customary closing adjustments. The Company may also earn up to $30.0 million of contingent payments, which are tied to certain annual results of the Avian business from January 2024 through December 2027. The contingent payments have been fair valued at $10.3 million using a discounted probability weighted model. The Avian business was reported in the Company’s Manufacturing reportable segment. During the fiscal year 2022, the Company recorded a gain on the divestiture of Avian of $123.4 million within Other income (expense) on the Company’s consolidated statements of income.
RMS Japan
On October 12, 2021, the Company sold its RMS Japan operations to The Jackson Laboratory for a purchase price of $70.9 million, which included $7.9 million in cash, $3.8 million pension over funding, and certain post-closing adjustments. During the three months ended December 25, 2021, the Company recorded a gain on the divestiture of the RMS Japan business of $20.0 million, net of costs to sell, a currency translation adjustment, and other adjustments related to certain ongoing arrangements with the acquisition of $16.5 million during fiscal year 2018,buyer, which were primarilywas included in Selling, general and administrative expensesOther income (expense), net within the Company’s consolidated statements of income. NaN significant integration costs were incurred in connection with the acquisition for fiscal years 2020 or 2019.
MPI Research revenue and operating income from April 3, 2018 through December 29, 2018The RMS Japan business was $209.5 million and $33.4 million, respectively. Beginning on April 3, 2018, MPI Research has been includedreported in the operating results of the Company.Company’s RMS reportable segment.
The following selected unaudited pro forma consolidated results of operations are presented as if the MPI Research acquisition had occurred as of the beginning of the period immediately preceding the period of acquisition, which is January 1, 2017, after giving effect to certain adjustments. For fiscal year 2018, these adjustments included additional amortization of intangible assets and depreciation of fixed assets of $14.1 million, additional interest expense on borrowings of $2.8 million, elimination of intercompany activity and other one-time costs, and the tax impacts of these adjustments.
| | | | | |
| Fiscal Year |
| 2018 |
| (in thousands) |
| (unaudited) |
Revenue | $ | 2,328,213 | |
Net income attributable to common shareholders | 225,550 | |
These unaudited pro forma results of operations have been prepared for comparative purposes only, and they do not purport to be indicative of the results of operations that actually would have resulted had the acquisition occurred on the dates indicated or that may result in the future. No effect has been given for synergies, if any, that may be realized through the acquisition.
Other AcquisitionsCDMO Sweden
On August 28, 2019,October 12, 2021, the Company acquired an 80% ownership interestsold its gene therapy CDMO site in Sweden to a supplier that supports the Company’s DSA reportable segment. Theprivate investor group for a purchase price paid was approximately $23of $59.6 million, net of $0.2 million in cash and other post-closing adjustments that may impact the purchase price. Included in the purchase price are contingent payments fair valued at $15.3 million, which were estimated using a $4probability weighted model (the maximum contingent contractual payments are up to $25.0 million pre-existing relationship. Thebased on future performance), as well as a purchase obligation of approximately $10.0 million between the parties. During fiscal year 2022 the fair value of the net assetscontingent payments receivable was reduced from $15.3 million to $7.5 million, which was the balance as of December 30, 2023, as certain financial targets are not expected to be achieved. CDMO Sweden was acquired included $13 million of goodwill, $12 million of other long-term assets, and $9 million for a 20% redeemable noncontrolling interest. The business is reportedin March 2021 as part of the acquisition of Cognate and was reported in the Company’s DSAManufacturing reportable segment. Pro forma information and acquisition expenses have not been presented because such information is not material to the financial statements.
On January 11, 2018, the Company acquired KWS BioTest Limited (KWS BioTest).
CHARLES RIVER LABORATORIES INTERNATIONAL, INC.
NOTES TO CONSOLIDATED FINANCIAL STATEMENTS (Continued)
The acquisition enhances the Company’s discovery expertise, with complementary offerings that provide the Company’s customers with additional tools in the active therapeutic research areas of oncology and immunology. The purchase price paid was approximately $20 million. The fair valuecarrying amounts of the netmajor classes of assets acquired included $18 million of goodwill and $4 million of client relationships, which had a weighted average life of 12 years. The business is reportedliabilities associated with these divestitures were as part of the Company’s DSA reportable segment. Pro forma information and acquisition expenses have not been presented because such information is not material to the financial statements.follows:
| | | | | | | | | | | | | | | | | |
| December 19, 2022 | | October 12, 2021 |
| Avian | | RMS Japan | | CDMO Sweden |
| (in thousands) |
| Assets | | | | | |
| Current assets | $ | 30,545 | | | $ | 26,524 | | | $ | 8,187 | |
| Property, plant, and equipment, net | 24,602 | | | 17,379 | | | 14,339 | |
| Operating lease right-of-use assets, net | 611 | | | — | | | 19,733 | |
| Goodwill | 3,168 | | | 4,129 | | | 27,764 | |
| Client relationships, net | 1,629 | | | — | | | 14,089 | |
| Other assets | 10 | | | 3,695 | | | — | |
| Total assets | $ | 60,565 | | | $ | 51,727 | | | $ | 84,112 | |
| | | | | |
| Liabilities | | | | | |
| Current liabilities | $ | 8,139 | | | $ | 8,705 | | | $ | 6,386 | |
| Operating lease right-of-use liabilities | 331 | | | — | | | 18,221 | |
| Long-term liabilities | — | | | 94 | | | — | |
| Total liabilities | $ | 8,470 | | | $ | 8,799 | | | $ | 24,607 | |
3. REVENUE FROM CONTRACTS WITH CUSTOMERS
Disaggregation of Revenue
The following table disaggregates the Company’s revenue by major business line and timing of transfer of products or services: | | | | | | | | | | | | | | | | | |
| Timing of Revenue Recognition: | 2023 | | 2022 | | 2021 |
| (in thousands) |
| RMS | | | | | |
| Services and products transferred over time | $ | 377,947 | | | $ | 340,708 | | | $ | 263,659 | |
| Services and products transferred at a point in time | 414,396 | | | 398,467 | | | 426,778 | |
| Total RMS revenue | 792,343 | | | 739,175 | | | 690,437 | |
| DSA | | | | | |
| Services and products transferred over time | 2,611,564 | | | 2,440,646 | | | 2,103,415 | |
| Services and products transferred at a point in time | 4,059 | | | 6,670 | | | 3,816 | |
| Total DSA revenue | 2,615,623 | | | 2,447,316 | | | 2,107,231 | |
| Manufacturing | | | | | |
| Services and products transferred over time | 381,942 | | | 371,500 | | | 335,745 | |
| Services and products transferred at a point in time | 339,501 | | | 418,069 | | | 406,747 | |
| Total Manufacturing revenue | 721,443 | | | 789,569 | | | 742,492 | |
| Total revenue | $ | 4,129,409 | | | $ | 3,976,060 | | | $ | 3,540,160 | |
CHARLES RIVER LABORATORIES INTERNATIONAL, INC.
NOTES TO CONSOLIDATED FINANCIAL STATEMENTS (Continued)
| | | | | | | | | | | | | | | | | |
| Timing of Revenue Recognition of Major Product/Services Lines: | 2020 | | 2019 | | 2018 |
| (in thousands) |
| RMS | | | | | |
| Services and products transferred over time | $ | 240,480 | | | $ | 227,872 | | | $ | 202,872 | |
| Services and products transferred at a point in time | 330,672 | | | 309,217 | | | 316,810 | |
| Total RMS revenue | 571,152 | | | 537,089 | | | 519,682 | |
| DSA | | | | | |
| Services and products transferred over time | 1,836,519 | | | 1,618,281 | | | 1,316,005 | |
| Services and products transferred at a point in time | 909 | | | 714 | | | 849 | |
| Total DSA revenue | 1,837,428 | | | 1,618,995 | | | 1,316,854 | |
| Manufacturing | | | | | |
| Services and products transferred over time | 174,254 | | | 142,896 | | | 128,287 | |
| Services and products transferred at a point in time | 341,099 | | | 322,246 | | | 301,273 | |
| Total Manufacturing revenue | 515,353 | | | 465,142 | | | 429,560 | |
| Total revenue | $ | 2,923,933 | | | $ | 2,621,226 | | | $ | 2,266,096 | |
RMS
The RMS business generates revenue through the commercial production and sale of research models, research products, and the provision of services related to the maintenance and monitoring of research models and management of clients’ research operations. Revenue from the sale of research models and products is recognized at a point in time when the customer obtains control of the product, which may be upon shipment or upon delivery based on the shipping terms of a contract. Revenue generated from research models services is recognized over time and is typically based on a right-to-invoice measure of progress (output method) as invoiced amounts correspond directly to the value of the Company’s performance to date.
DSA
The Discovery and Safety Assessment business provides a full suite of integrated drug discovery services directed at the identification, screening and selection of a lead compound for drug development and offers a full range of safety assessment services including bioanalysis, drug metabolism, pharmacokinetics, toxicology and pathology. Discovery and Safety Assessment services revenue is generally recognized over time using the cost-to-cost or right to invoice measures of progress, primarily representing fixed fee service contracts and per unit service contracts, respectively.
Manufacturing
The Manufacturing business includes Microbial Solutions, which provides invitro (non-animal) lot-release testing products, microbial detection products, and species identification services; Biologics Testing Services (Biologics), which performs specialized testing of biologics; and Avian Vaccine Services (Avian), which supplies specific-pathogen-free chicken eggs and chickens. Species identification service revenue is generally recognized at a point in time as identifications are completed by the Company. Biologics service revenue is generally recognized over time using the cost-to-cost measure of progress. Microbial Solutions and Avian product sales are generally recognized at a point in time when the customer obtains control of the product, which may be upon shipment or upon delivery based on the contractual shipping terms of a contract.
Transaction Price Allocated to Future Performance Obligations
The Company discloses the aggregate amount of transaction price that is allocated to performance obligations that have not yet been satisfied as of December 26, 2020. Excluded from the disclosure is the value of unsatisfied performance obligations for (i) contracts with an original expected length of one year or less and (ii) contracts for which revenue is recognized at the amount to which the Company has the right to invoice for services performed. The Company has assessed future performance obligations with respect to the COVID-19 pandemic uncertainties and believes there is an insignificant impact on the ability to meet future performance obligations and the amount of revenue to be recognized.
The following table includes estimated revenue expected to be recognized in the future related to performance obligations that are unsatisfied (or partially satisfied) as of December 26, 2020:
CHARLES RIVER LABORATORIES INTERNATIONAL, INC.
NOTES TO CONSOLIDATED FINANCIAL STATEMENTS (Continued)
| | | | | | | | | | | | | | | | | | | | | | | | |
| Revenue Expected to be Recognized in Future Periods | |
| Less than 1 Year | | 1 to 3 Years | | 4 to 5 Years | | Total | |
| (in thousands) | |
| DSA | $ | 216,099 | | | $ | 128,005 | | | $ | 4,429 | | | $ | 348,533 | | |
| Manufacturing | 8,491 | | | 6,212 | | | 0 | | | 14,703 | | |
| Total | $ | 224,590 | | | $ | 134,217 | | | $ | 4,429 | | | $ | 363,236 | | |
Contract Balances from Contracts with Customers
The timing of revenue recognition, billings and cash collections results in billed receivables (client receivables), contract assets (unbilled revenue), and contract liabilities (current and long-term deferred revenue and customer contract deposits) on the consolidated balance sheets. The Company’s payment terms are generally 30 days in the United States and consistent with prevailing practice in international markets. A contract asset is recorded when a right to consideration in exchange for goods or services transferred to a customer is conditioned other than the passage of time. Client receivables are recorded separately from contract assets since only the passage of time is required before consideration is due. A contract liability is recorded when consideration is received, or such consideration is unconditionally due, from a customer prior to transferring goods or services to the customer under the terms of a contract. Contract liabilities are recognized as revenue after control of the products or services is transferred to the customer and all revenue recognition criteria have been met. The following table provides information about client receivables, contract assets, and contract liabilities from contracts with customers:
| | | | | | | | | | | |
| December 26, 2020 | | December 28, 2019 |
| (in thousands) |
| Balances from contracts with customers: | | | |
| Client receivables | $ | 489,042 | | | $ | 395,740 | |
| Contract assets (unbilled revenue) | 135,400 | | | 121,957 | |
| Contract liabilities (current and long-term deferred revenue) | 227,417 | | | 192,788 | |
| Contract liabilities (customer contract deposits) | 42,244 | | | 33,080 | |
| | | | | | | | | | | |
| December 30, 2023 | | December 31, 2022 |
| (in thousands) |
| Assets from contracts with customers | | | |
| Client receivables | $ | 578,077 | | | $ | 559,410 | |
| Unbilled revenue | 228,020 | | | 204,258 | |
| Total | 806,097 | | | 763,668 | |
| Less: Allowance for credit losses | (25,722) | | | (11,278) | |
| Trade receivables and contract assets, net | $ | 780,375 | | | $ | 752,390 | |
| | | |
| Liabilities from contracts with customers | | | |
| Current deferred revenue | $ | 241,820 | | | $ | 264,259 | |
| Long term deferred revenue (included in Other long-term liabilities) | 30,919 | | | 25,795 | |
| Customer contract deposits (included in Other current-liabilities) | 85,554 | | | 91,640 | |
The Company recognized substantially all of the current contract assets and liabilities balances at December 31, 2022 and December 25, 2021in revenues during fiscal years 2023 and 2022, respectively.
When the Company does not have the unconditional right to advanced billings, both advanced client payments and unpaid advanced client billings are excluded from deferred revenue, with the advanced billings also being excluded from client receivables. The Company excluded approximately $16$41 million and $27$54 million of unpaid advanced client billings from both client receivables and deferred revenue in the accompanying consolidated balance sheets as of December 26, 202030, 2023 and December 28, 2019,31, 2022, respectively. Advanced client payments of approximately $42Net provisions were $18.2 million, $6.7 million, and $33$1.7 million in fiscal years 2023, 2022, and 2021, respectively.
Transaction Price Allocated to Future Performance Obligations
The Company discloses the aggregate amount of transaction price that is allocated to performance obligations that have not yet been presented as customer contract deposits within other current liabilities in the accompanying consolidated balance sheetssatisfied as of December 26, 202030, 2023. Excluded from the disclosure is the value of unsatisfied performance obligations for contracts with an original expected length of one year or less, contracts for which revenue is recognized at the amount to which the Company has the right to invoice for services performed and service revenue recognized in accordance with ASC 842, “Leases”.The aggregate amount of transaction price allocated to the remaining performance obligations for all open customer contracts as of December 28, 2019, respectively.
30, 2023Other changes in was $986.0 million. The Company will recognize revenues for these performance obligations as they are satisfied, approximately 50% of which is expected to occur within the contract assetnext twelve months and the contract liability balancesremainder recognized thereafter during fiscal years 2020 and 2019 were as follows:the remaining contract term.
(i) Changes due to business combinations:Other Performance Obligations
See Note 2. “Business Combinations” for the HemaCare acquisition on January 3, 2020, the Cellero acquisition on August 6, 2020, and the Citoxlab acquisition on April 29, 2019.
(ii) Cumulative catch-up adjustments to revenue that affect the corresponding contract asset or contract liability, including adjustments arising from a change in the measure of progress, a change in an estimateAs part of the transaction price (including any changes inCompany’s service offerings, the assessmentCompany has identified performance obligations related to leasing Company owned assets. In certain arrangements, customers obtain substantially all of whether an estimatethe economic benefits of variable consideration is constrained), or a contract modification:
During fiscal years 2020the identified assets, which may include manufacturing suites and 2019, an immaterial cumulative catch-up adjustment to revenue was recorded.
(iii) A change inrelated equipment, and have the time frame for a right to consideration to become unconditional (thatdirect the assets’ use over the term of the contract. The associated revenue is forrecognized on a contract asset to be recorded as a client receivable):straight-line basis over the term of the lease, which is generally less than one year.
Approximately 90% of unbilled revenue as of December 28, 2019 was billed during fiscal year 2020. Approximately 95% of unbilled revenue as of December 29, 2018 of $105 million was billed during fiscal year 2019.
(iv) A change in the time frame for a performance obligation to be satisfied (that is, for the recognition of revenue arising from a contract liability): | | | | | | | | | | | | | | | | | | | | | | | | | | |
| | 2023 | | 2022 | | 2021 | | |
| | (in thousands) | | Affected Line Item in the Consolidated Statements of Income |
| Lease revenue | | $ | 93,103 | | | $ | 60,118 | | | $ | 18,118 | | | Service revenue |
CHARLES RIVER LABORATORIES INTERNATIONAL, INC.
NOTES TO CONSOLIDATED FINANCIAL STATEMENTS (Continued)
Approximately 90% of contract liabilities as of December 28, 2019 were recognized as revenue during fiscal year 2020. Approximately 85% of contract liabilities as of December 29, 2018 of $180 million were recognized as revenue during fiscal year 2019.
4. SEGMENT AND GEOGRAPHIC INFORMATION
The Company’s 3three reportable segments are Research ModelsRMS, DSA, and Services (RMS), Discovery and Safety Assessment (DSA), and Manufacturing Support (Manufacturing).Manufacturing. Asset information on a reportable segment basis is not disclosed as this information is not separately identified and internally reported to the Company’s Chief Operating Decision Maker.
The following table presents revenue and other financial information by reportable segment:
| | | | | | | | | | | | | | | | | |
| 2020 | | 2019 | | 2018 |
| (in thousands) |
| RMS | | | | | |
| Revenue | $ | 571,152 | | | $ | 537,089 | | | $ | 519,682 | |
| Operating income | 102,706 | | | 133,912 | | | 136,468 | |
| Depreciation and amortization | 37,080 | | | 19,197 | | | 19,469 | |
| Capital expenditures | 29,487 | | | 26,989 | | | 35,172 | |
| DSA | | | | | |
| Revenue | $ | 1,837,428 | | | $ | 1,618,995 | | | $ | 1,316,854 | |
| Operating income | 325,959 | | | 258,903 | | | 227,577 | |
| Depreciation and amortization | 168,922 | | | 151,139 | | | 112,976 | |
| Capital expenditures | 105,653 | | | 86,843 | | | 73,425 | |
| Manufacturing | | | | | |
| Revenue | $ | 515,353 | | | $ | 465,142 | | | $ | 429,560 | |
| Operating income | 181,494 | | | 145,420 | | | 136,212 | |
| Depreciation and amortization | 25,904 | | | 23,584 | | | 22,529 | |
| Capital expenditures | 26,287 | | | 23,617 | | | 23,323 | |
The following tables present reconciliations of segment operating income, depreciation and amortization, and capital expenditures to the respective consolidated amounts:
| | | | | | | | | | | | | | | | | | | | | | | | | | | | | | | | | | | |
| Operating Income | | Depreciation and Amortization |
| 2020 | | 2019 | | 2018 | | 2020 | | 2019 | | 2018 |
| (in thousands) |
| Total reportable segments | $ | 610,159 | | | $ | 538,235 | | | $ | 500,257 | | | $ | 231,906 | | | $ | 193,920 | | | $ | 154,974 | |
| Unallocated corporate | (177,430) | | | (187,084) | | | (168,874) | | | 3,018 | | | 4,175 | | | 6,805 | |
| Total consolidated | $ | 432,729 | | | $ | 351,151 | | | $ | 331,383 | | | $ | 234,924 | | | $ | 198,095 | | | $ | 161,779 | |
| | | | | | | | | | | | | | | | | |
| Capital Expenditures |
| 2020 | | 2019 | | 2018 |
| (in thousands) |
| Total reportable segments | $ | 161,427 | | | $ | 137,449 | | | $ | 131,920 | |
| Unallocated corporate | 5,133 | | | 3,065 | | | 8,134 | |
| Total consolidated | $ | 166,560 | | | $ | 140,514 | | | $ | 140,054 | |
Revenue for each significant product or service offering is as follows:
CHARLES RIVER LABORATORIES INTERNATIONAL, INC.
NOTES TO CONSOLIDATED FINANCIAL STATEMENTS (Continued)
| | | | | | | | | | | | | | | | | |
| 2020 | | 2019 | | 2018 |
| (in thousands) |
| RMS | $ | 571,152 | | | $ | 537,089 | | | $ | 519,682 | |
| DSA | 1,837,428 | | | 1,618,995 | | | 1,316,854 | |
| Manufacturing | 515,353 | | | 465,142 | | | 429,560 | |
| Total revenue | $ | 2,923,933 | | | $ | 2,621,226 | | | $ | 2,266,096 | |
A summary of unallocated corporate expense consists of the following:
| | | | | | | | | | | | | | | | | |
| 2020 | | 2019 | | 2018 |
| (in thousands) |
| Stock-based compensation | $ | 34,111 | | | $ | 37,855 | | | $ | 32,068 | |
| Compensation, benefits, and other employee-related expenses | 73,814 | | | 73,893 | | | 69,191 | |
| External consulting and other service expenses | 26,561 | | | 16,639 | | | 18,652 | |
| Information technology | 18,912 | | | 16,080 | | | 12,463 | |
| Depreciation | 3,018 | | | 4,175 | | | 6,805 | |
| Acquisition and integration | 13,995 | | | 26,877 | | | 16,295 | |
| Other general unallocated corporate | 7,019 | | | 11,565 | | | 13,400 | |
| Total unallocated corporate expense | $ | 177,430 | | | $ | 187,084 | | | $ | 168,874 | |
Other general unallocated corporate expense consists of costs associated with departments such as senior executives, corporate accounting, legal, tax, human resources, treasury, and investor relations. | | | | | | | | | | | | | | | | | |
| 2023 | | 2022 | | 2021 |
| (in thousands) |
| RMS | | | | | |
| Revenue | $ | 792,343 | | | $ | 739,175 | | | $ | 690,437 | |
| Operating income | 154,666 | | | 160,410 | | | 166,814 | |
| Depreciation and amortization | 55,570 | | | 49,274 | | | 39,123 | |
| Capital expenditures | 52,819 | | | 44,136 | | | 61,188 | |
| DSA | | | | | |
| Revenue | $ | 2,615,623 | | | $ | 2,447,316 | | | $ | 2,107,231 | |
| Operating income | 606,076 | | | 532,889 | | | 406,978 | |
| Depreciation and amortization | 174,719 | | | 179,465 | | | 177,254 | |
| Capital expenditures | 204,891 | | | 189,563 | | | 101,477 | |
| Manufacturing | | | | | |
| Revenue | $ | 721,443 | | | $ | 789,569 | | | $ | 742,492 | |
| Operating income | 88,329 | | | 167,084 | | | 246,390 | |
| Depreciation and amortization | 79,982 | | | 72,950 | | | 46,195 | |
| Capital expenditures | 58,134 | | | 87,084 | | | 58,877 | |
| Unallocated corporate | | | | | |
Operating income (1) | $ | (231,810) | | | $ | (209,408) | | | $ | (230,320) | |
| Depreciation and amortization | 3,853 | | | 2,181 | | | 2,968 | |
| Capital expenditures | 2,684 | | | 3,950 | | | 7,230 | |
| Consolidated | | | | | |
| Revenue | $ | 4,129,409 | | | $ | 3,976,060 | | | $ | 3,540,160 | |
| Operating income | 617,261 | | | 650,975 | | | 589,862 | |
| Depreciation and amortization | 314,124 | | | 303,870 | | | 265,540 | |
| Capital expenditures | 318,528 | | | 324,733 | | | 228,772 | |
| | | | | |
(1) Operating income for unallocated corporate consists of costs associated with departments such as senior executives, corporate accounting, legal, tax, human resources, treasury, and investor relations. |
Revenue and long-lived assets by geographic area are as follows:
| | U.S. | | Europe | | Canada | | Asia Pacific | | Other | | Consolidated |
| (in thousands) |
| 2020 | |
| U.S. | | | U.S. | | Europe | | Canada | | Asia Pacific | | Other | | Consolidated |
| (in thousands) | | | (in thousands) |
| 2023 | |
| Revenue | |
| Revenue | |
| Revenue | Revenue | $ | 1,627,149 | | | $ | 829,312 | | | $ | 306,259 | | | $ | 155,086 | | | $ | 6,127 | | | $ | 2,923,933 | |
| Long-lived assets | Long-lived assets | 627,871 | | | 286,229 | | | 145,410 | | | 62,931 | | | 1,917 | | | 1,124,358 | |
| 2019 | | | | | | | | | | | |
| 2022 | | 2022 | | | |
| Revenue | Revenue | $ | 1,471,097 | | | $ | 726,421 | | | $ | 271,987 | | | $ | 146,218 | | | $ | 5,503 | | | $ | 2,621,226 | |
| Long-lived assets | Long-lived assets | 602,654 | | | 253,665 | | | 127,495 | | | 60,213 | | | 101 | | | 1,044,128 | |
| 2018 | | | | | | | | | | |
| 2021 | |
| Revenue | |
| Revenue | |
| Revenue | Revenue | $ | 1,267,620 | | | $ | 643,957 | | | $ | 206,382 | | | $ | 142,495 | | | $ | 5,642 | | | $ | 2,266,096 | |
| Long-lived assets | Long-lived assets | 597,223 | | | 205,185 | | | 74,051 | | | 56,262 | | | 156 | | | 932,877 | |
Included in the Other category above are operations located in Brazil, Israel, and Israel.Mauritius. Revenue represents sales originating in entities physically located in the identified geographic area. Long-lived assets consist of property, plant, and equipment, net.
5. SUPPLEMENTAL BALANCE SHEET INFORMATION
The composition of trade receivables, net is as follows:
| | | | | | | | | | | |
| December 26, 2020 | | December 28, 2019 |
| (in thousands) |
| Client receivables | $ | 489,042 | | | $ | 395,740 | |
| Unbilled revenue | 135,400 | | | 121,957 | |
| Total | 624,442 | | | 517,697 | |
| Less: Allowance for doubtful accounts | (6,702) | | | (3,664) | |
| Trade receivables, net | $ | 617,740 | | | $ | 514,033 | |
Net provisions of $6.4 million, $3.0 million, and $2.1 million were recorded to the allowance for doubtful accounts in fiscal years 2020, 2019, and 2018, respectively.
CHARLES RIVER LABORATORIES INTERNATIONAL, INC.
NOTES TO CONSOLIDATED FINANCIAL STATEMENTS (Continued)
The composition of inventories is as follows:
| | | | | | | | | | | |
| December 26, 2020 | | December 28, 2019 |
| (in thousands) |
| Raw materials and supplies | $ | 28,317 | | | $ | 24,613 | |
| Work in process | 36,755 | | | 35,852 | |
| Finished products | 120,623 | | | 100,195 | |
| Inventories | $ | 185,695 | | | $ | 160,660 | |
The composition of other current assets is as follows:
| | | | | | | | | | | |
| December 26, 2020 | | December 28, 2019 |
| (in thousands) |
| Prepaid income tax | $ | 68,462 | | | $ | 54,358 | |
| Short-term investments | 1,024 | | | 941 | |
| Restricted cash | 3,074 | | | 431 | |
| Other | 0 | | | 300 | |
| Other current assets | $ | 72,560 | | | $ | 56,030 | |
The composition of property, plant and equipment, net is as follows:
| | | | | | | | | | | |
| December 26, 2020 | | December 28, 2019 |
| (in thousands) |
| Land | $ | 61,031 | | | $ | 63,077 | |
Buildings (1) | 1,059,641 | | | 1,006,357 | |
Machinery and equipment (1) | 661,124 | | | 585,965 | |
| Leasehold improvements | 104,967 | | | 84,630 | |
| Furniture and fixtures | 31,489 | | | 28,304 | |
Computer hardware and software (1) | 193,622 | | | 179,865 | |
Vehicles (1) | 6,152 | | | 5,561 | |
| Construction in progress | 92,325 | | | 67,939 | |
| Total | 2,210,351 | | | 2,021,698 | |
| Less: Accumulated depreciation | (1,085,993) | | | (977,570) | |
| Property, plant and equipment, net | $ | 1,124,358 | | | $ | 1,044,128 | |
(1) These balances include assets under finance leases. See Note 16, “Leases.”
Depreciation expense in fiscal years 2020, 2019 and 2018 was $123.0 million, $108.6 million and $96.9 million, respectively.
The composition of other assets is as follows:
| | | | | | | | | | | |
| December 26, 2020 | | December 28, 2019 |
| (in thousands) |
| Venture capital investments | $ | 197,100 | | | $ | 108,983 | |
| Strategic equity investments | 24,704 | | | 13,996 | |
| Life insurance policies | 43,827 | | | 38,207 | |
| Other long-term income tax assets | 23,485 | | | 20,570 | |
| Restricted cash | 1,621 | | | 1,601 | |
| Long-term pension assets | 31,915 | | | 1,741 | |
| Other | 29,974 | | | 27,517 | |
| Other assets | $ | 352,626 | | | $ | 212,615 | |
CHARLES RIVER LABORATORIES INTERNATIONAL, INC.
NOTES TO CONSOLIDATED FINANCIAL STATEMENTS (Continued)
The composition of other current liabilities is as follows:
| | | | | | | | | | | |
| December 26, 2020 | | December 28, 2019 |
| (in thousands) |
| Current portion of operating lease right-of-use liabilities | $ | 24,674 | | | $ | 20,357 | |
| Accrued income taxes | 24,884 | | | 26,066 | |
| Customer contract deposits | 42,244 | | | 33,080 | |
| Other | 10,675 | | | 11,095 | |
| Other current liabilities | $ | 102,477 | | | $ | 90,598 | |
The composition of other long-term liabilities is as follows:
| | | | | | | | | | | |
| December 26, 2020 | | December 28, 2019 |
| (in thousands) |
| U.S. Transition Tax | $ | 48,781 | | | $ | 52,066 | |
| Long-term pension liability, accrued executive supplemental life insurance retirement plan and deferred compensation plan | 74,233 | | | 80,833 | |
| Long-term deferred revenue | 19,475 | | | 20,983 | |
| Other | 62,726 | | | 29,051 | |
| Other long-term liabilities | $ | 205,215 | | | $ | 182,933 | |
6. VENTURE CAPITAL AND STRATEGIC EQUITY INVESTMENTS
Venture capital investments were $197.1 million and $109.0 million as of December 26, 2020 and December 28, 2019, respectively. The Company’s total commitment to the venture capital funds as of December 26, 2020 was $139.9 million, of which the Company funded $95.3 million through that date. During fiscal years 2020, 2019, and 2018, the Company received distributions totaling $27.6 million, $11.4 million, and $18.2 million, respectively. During fiscal years 2020, 2019, and 2018, the Company recognized gains related to the venture capital investments of $100.4 million, $20.7 million and $15.9 million, respectively. Gains in fiscal year 2020 predominantly resulted from increases in fair value from publicly-held investments, which included initial public offerings of certain portfolio companies. As of December 26, 2020 and December 28, 2019, the Company’s consolidated retained earnings included $76.8 million and $20.6 million, respectively, of the undistributed earnings related to these investments, net of tax.
The Company also invests, with minority positions, directly in equity of predominantly privately-held companies. Strategic equity investments were $24.7 million and $14.0 million as of December 26, 2020 and December 28, 2019, respectively. The Company recognized insignificant gains and losses related to these investments for fiscal years 2020 and 2019.
CHARLES RIVER LABORATORIES INTERNATIONAL, INC.
NOTES TO CONSOLIDATED FINANCIAL STATEMENTS (Continued)
5. SUPPLEMENTAL CASH FLOW INFORMATION
| | | | | | | | | | | | | | | | | |
| Fiscal Year |
| 2023 | | 2022 | | 2021 |
| (in thousands) |
| Cash paid for income taxes | $ | 90,374 | | | $ | 75,909 | | | $ | 75,441 | |
| Cash paid for interest | 132,101 | | | 100,754 | | | 70,775 | |
| Non-cash investing and financing activities: | | | | | |
| Purchases of Property, plant and equipment included in Accounts payable and Accrued liabilities | $ | 69,139 | | | $ | 88,612 | | | $ | 72,043 | |
| Assets acquired under finance leases | — | | | 8,179 | | | 1,567 | |
Cash, cash equivalents and restricted cash is included in the accompanying balance sheet as follows:
| | | | | | | | | | | |
| December 30, 2023 | | December 31, 2022 |
| (in thousands) |
| Supplemental cash flow information: | | | |
| Cash and cash equivalents | $ | 276,771 | | | $ | 233,912 | |
| | | |
| Restricted cash included in Other current assets | 5,803 | | | 6,192 | |
| Restricted cash included in Other assets | 1,906 | | | 1,110 | |
| Cash, cash equivalents, and restricted cash, end of period | $ | 284,480 | | | $ | 241,214 | |
6. INVENTORY
The composition of inventories is as follows:
| | | | | | | | | | | |
| December 30, 2023 | | December 31, 2022 |
| (in thousands) |
| Raw materials and supplies | $ | 42,296 | | | $ | 38,892 | |
| Work in process | 59,727 | | | 48,367 | |
| Finished products | 278,236 | | | 168,550 | |
| Inventories | $ | 380,259 | | | $ | 255,809 | |
7. PROPERTY, PLANT AND EQUIPMENT, NET
The composition of property, plant and equipment, net is as follows:
| | | | | | | | | | | |
| December 30, 2023 | | December 31, 2022 |
| (in thousands) |
| Land | $ | 79,546 | | | $ | 58,192 | |
Buildings (1) | 1,053,915 | | | 963,717 | |
Machinery and equipment (1) | 984,867 | | | 850,353 | |
| Leasehold improvements | 366,556 | | | 294,275 | |
| Furniture and fixtures | 31,284 | | | 27,317 | |
Computer hardware and software (1) | 254,413 | | | 227,797 | |
Vehicles (1) | 6,746 | | | 5,421 | |
| Construction in progress | 197,723 | | | 199,713 | |
| Total | 2,975,050 | | | 2,626,785 | |
| Less: Accumulated depreciation | (1,335,309) | | | (1,161,130) | |
| Property, plant and equipment, net | $ | 1,639,741 | | | $ | 1,465,655 | |
| | | |
(1) These balances include assets under finance leases. See Note 17. Leases. |
Depreciation expense in fiscal years 2023, 2022 and 2021 was $176.7 million, $157.3 million and $140.7 million, respectively.
CHARLES RIVER LABORATORIES INTERNATIONAL, INC.
NOTES TO CONSOLIDATED FINANCIAL STATEMENTS (Continued)
8. VENTURE CAPITAL AND STRATEGIC EQUITY INVESTMENTS
Venture capital investments are summarized below:
| | | | | | | | | | | | | | | | | |
| December 30, 2023 | | December 31, 2022 | | December 25, 2021 |
| (in thousands) |
| Beginning balance | $ | 129,012 | | | $ | 149,640 | | | $ | 197,100 | |
| Capital contributions | 17,410 | | | 14,485 | | | 18,023 | |
| Distributions | (15,685) | | | (9,861) | | | (40,205) | |
| Gain (loss) | (10,263) | | | (24,398) | | | (23,201) | |
| Foreign currency translation | 684 | | | (854) | | | (2,077) | |
| | | | | |
| Ending balance | $ | 121,158 | | | $ | 129,012 | | | $ | 149,640 | |
The Company also invests, with minority positions, directly in equity of predominantly privately-held companies. Strategic investments are summarized below:
| | | | | | | | | | | | | | | | | |
| December 30, 2023 | | December 31, 2022 | | December 25, 2021 |
| (in thousands) |
| Beginning balance | $ | 182,590 | | | $ | 51,712 | | | $ | 24,704 | |
| Purchase of investments | 34,028 | | | 142,477 | | | 35,540 | |
| Distributions | (9,381) | | | (2,732) | | | (789) | |
Gain (loss) (1) | 108,090 | | | (2,377) | | | (7,219) | |
Reduction for acquisition of entities (1) | (197,753) | | | — | | | — | |
| Foreign currency translation | 5,079 | | | (6,490) | | | (524) | |
| Ending balance | $ | 122,653 | | | $ | 182,590 | | | $ | 51,712 | |
(1) Refer to Note 2. Acquisitions for further discussion on the Noveprim and SAMDI acquisitions |
9. FAIR VALUE
Assets and liabilities measured at fair value on a recurring basis are summarized below:
| | | | December 26, 2020 | | December 30, 2023 |
| | | Level 1 | | Level 2 | | Level 3 | | Total | | Level 1 | | Level 2 | | Level 3 | | Total |
| Current assets measured at fair value: | Current assets measured at fair value: | (in thousands) | Current assets measured at fair value: | (in thousands) |
| Cash equivalents | Cash equivalents | $ | 0 | | | $ | 2,273 | | | $ | 0 | | | $ | 2,273 | |
| Other assets: | Other assets: | |
| Life insurance policies | Life insurance policies | 0 | | | 35,770 | | | 0 | | | 35,770 | |
| Life insurance policies | |
| Life insurance policies | |
| Interest rate swap | |
| Total assets measured at fair value | Total assets measured at fair value | $ | 0 | | | $ | 38,043 | | | $ | 0 | | | $ | 38,043 | |
| | Other liabilities measured at fair value: | |
| | Other long-term liabilities measured at fair value: | |
| | Other long-term liabilities measured at fair value: | |
| | Other long-term liabilities measured at fair value: | |
| Contingent consideration | Contingent consideration | 0 | | | 0 | | | 2,328 | | | 2,328 | |
| | Contingent consideration | |
| Contingent consideration | |
| Interest rate swap | |
| Total liabilities measured at fair value | Total liabilities measured at fair value | $ | 0 | | | $ | 0 | | | $ | 2,328 | | | $ | 2,328 | |
CHARLES RIVER LABORATORIES INTERNATIONAL, INC.
| | | | | | | | | | | | | | | | | | | | | | | |
| | December 28, 2019 |
| | Level 1 | | Level 2 | | Level 3 | | Total |
| Current assets measured at fair value: | (in thousands) |
| Cash equivalents | $ | 0 | | | $ | 55,278 | | | $ | 0 | | | $ | 55,278 | |
| Other assets: | | | | | | | |
| Life insurance policies | 0 | | | 30,454 | | | 0 | | | 30,454 | |
| Total assets measured at fair value | $ | 0 | | | $ | 85,732 | | | $ | 0 | | | $ | 85,732 | |
| | | | | | | |
| Other current liabilities measured at fair value: | | | | | | | |
| Contingent consideration | $ | 0 | | | $ | 0 | | | $ | 712 | | | $ | 712 | |
| Foreign currency forward contract | 0 | | | 876 | | | 0 | | | 876 | |
| Total liabilities measured at fair value | $ | 0 | | | $ | 876 | | | $ | 712 | | | $ | 1,588 | |
| | | | | | | | | | | | | | | | | | | | | | | |
| | December 31, 2022 |
| | Level 1 | | Level 2 | | Level 3 | | Total |
| Current assets measured at fair value: | (in thousands) |
| Cash equivalents | $ | — | | | $ | 78 | | | $ | — | | | $ | 78 | |
| Other assets: | | | | | | | |
| Life insurance policies | — | | | 34,527 | | | — | | | 34,527 | |
| Total assets measured at fair value | $ | — | | | $ | 34,605 | | | $ | — | | | $ | 34,605 | |
| | | | | | | |
| Accrued liabilities measured at fair value: | | | | | | | |
| Contingent consideration | $ | — | | | $ | — | | | $ | 13,431 | | | $ | 13,431 | |
| Other long-term liabilities measured at fair value: | | | | | | | |
| Contingent consideration | — | | | — | | | — | | | — | |
| Interest rate swap | — | | | 1,523 | | | — | | | 1,523 | |
| Total liabilities measured at fair value | $ | — | | | $ | 1,523 | | | $ | 13,431 | | | $ | 14,954 | |
During fiscal years 20202023 and 2019,2022, there were no transfers between fair value levels.
Contingent Consideration
The following table provides a rollforward of the contingent consideration related to the Company’s business combinations.acquisitions.
| | Fiscal Year |
| 2020 | | 2019 |
| (in thousands) |
| Fiscal Year | | | Fiscal Year |
| 2023 | | | 2023 | | 2022 | | 2021 |
| (in thousands) | | | (in thousands) |
| Beginning balance | Beginning balance | $ | 712 | | | $ | 3,033 | |
| Additions | Additions | 2,131 | | | 2,869 | |
| Payments | Payments | (230) | | | (5,252) | |
| Total gains or losses (realized/unrealized): | Total gains or losses (realized/unrealized): | |
| Adjustment of previously recorded contingent liability | |
| Adjustment of previously recorded contingent liability | |
| Adjustment of previously recorded contingent liability | |
| Foreign currency translation | Foreign currency translation | 183 | | | 62 | |
| Reversal of previously recorded contingent liability and change in fair value | (468) | | | 0 | |
| Ending balance | Ending balance | $ | 2,328 | | | $ | 712 | |
The Company estimates the fair value of contingent consideration obligations through valuation models, such as probability-weighted and option pricing models, that incorporate probability adjusted assumptions and simulations related to the achievement of the milestones and the likelihood of making related payments. The unobservable inputs used in the fair value measurement of the Company’s contingent consideration aremeasurements include the probabilities of successful achievement of certain financial targets, forecasted results or targets, volatility, and discount rates. The remaining maximum potential payments are approximately $98 million, of which the value accrued as of December 30, 2023 is approximately $33 million. The weighted average probability of achieving the maximum target is approximately 34%. The average volatility and weighted average cost of capital are approximately 30% and 12%, respectively.
Cash Flow Hedge
The Company is exposed to market fluctuations in interest rates as well as variability in foreign exchange rates. In November 2022, the Company entered into an interest rate swap with a discount rate.notional amount of Increases or decreases$500 million to manage interest rate fluctuation related to floating rate borrowings under the Credit Facility, at a fixed rate of 4.700%.
In March 2023 and in anyconjunction with an amendment of the probabilitiesCredit Agreement (Second Amendment), the Company modified the variable rate on its interest rate swap from 1-month LIBOR to 1-month adjusted term SOFR. Effective with the modification, the Company will pay a fixed rate of success would4.65% on its swap maturing November 2, 2024. The Company elected to apply the optional expedient in ASC 848, Reference Rate Reform, in connection with modifying its interest rate swap from LIBOR to SOFR that enabled it to consider the modification a continuation of the existing contract. As a result, inthe transition did not have an impact on the Company’s hedge accounting or a higher or lower fair value measurement, respectively. Increases or decreases inmaterial impact to the discount rate would result in a lower or higher fair value measurement, respectively.Company’s financial statements.
Debt Instruments
CHARLES RIVER LABORATORIES INTERNATIONAL, INC.
NOTES TO CONSOLIDATED FINANCIAL STATEMENTS (Continued)
The book value of the Company’s term and revolving loans, which are variable rate loans carried at amortized cost, approximates the fair value based on current market pricing of similar debt. As the fair value is based on significant other
CHARLES RIVER LABORATORIES INTERNATIONAL, INC.
NOTES TO CONSOLIDATED FINANCIAL STATEMENTS (Continued)
observable inputs, including current interest and foreign currency exchange rates, it is deemed to be Level 2 within the fair value hierarchy.
The book value of the Company’s 2026 and 2028 Senior Notes is aare fixed rate obligationobligations carried at amortized cost. Fair value is based on quoted market prices as well as borrowing rates available to the Company. As the fair value is based on significant other observable outputs, it is deemed to be Level 2 within the fair value hierarchy. The book value and fair value of the Company’s 2026 and 2028 Senior Notes is summarized below:
| | | | | | | | | | | | | | | | | | | | | | | |
| December 26, 2020 | | December 28, 2019 |
| Book Value | | Fair Value | | Book Value | | Fair Value |
| 2026 Senior Notes | $ | 500,000 | | | $ | 523,100 | | | $ | 500,000 | | | $ | 537,500 | |
| 2028 Senior Notes | 500,000 | | | 523,750 | | | 500,000 | | | 510,000 | |
| | | | | | | | | | | | | | | | | | | | | | | |
| December 30, 2023 | | December 31, 2022 |
| Book Value | | Fair Value | | Book Value | | Fair Value |
| (in thousands) |
| 4.25% Senior Notes due 2028 | $ | 500,000 | | | $ | 478,100 | | | $ | 500,000 | | | $ | 460,450 | |
| 3.75% Senior Notes due 2029 | 500,000 | | | 458,100 | | | 500,000 | | | 442,200 | |
| 4.00% Senior Notes due 2031 | 500,000 | | | 449,350 | | | 500,000 | | | 432,500 | |
8.10. GOODWILL AND INTANGIBLE ASSETS
Goodwill
The following table provides a rollforward of the changes in the carrying amount of the Company’s goodwill:
| | | | | | | | | | | | | | | | | | | | | | | | | | | | | | | | | | | | | | | | | |
| | | Adjustments to Goodwill | | | | Adjustments to Goodwill | | |
| December 29, 2018 | | Acquisitions | | Foreign Exchange | | December 28, 2019 | | Acquisitions | | Foreign Exchange | | December 26, 2020 |
| (in thousands) |
| RMS | $ | 56,968 | | | $ | 0 | | | $ | (382) | | | $ | 56,586 | | | $ | 229,654 | | | $ | 1,519 | | | $ | 287,759 | |
| DSA | 2,056,470 | | | 293,380 | | | 373 | | | 2,350,223 | | | (629) | | | 33,536 | | | 2,383,130 | |
| Manufacturing | 138,695 | | | 0 | | | 61 | | | 138,756 | | | 0 | | | 4,523 | | | 143,279 | |
| Gross carrying amount | 2,252,133 | | | 293,380 | | | 52 | | | 2,545,565 | | | 229,025 | | | 39,578 | | | 2,814,168 | |
| Accumulated impairment loss - DSA | (1,005,000) | | | — | | | — | | | (1,005,000) | | | — | | | — | | | (1,005,000) | |
| Goodwill | $ | 1,247,133 | | | | | | | $ | 1,540,565 | | | | | | | $ | 1,809,168 | |
| | | | | | | | | | | | | | | | | | | | | | | |
| RMS | | DSA(1) | | Manufacturing | | Total |
| (in thousands) |
| December 25, 2021 | $ | 283,524 | | | $ | 1,472,506 | | | $ | 955,851 | | | $ | 2,711,881 | |
| Acquisitions | 215,752 | | | — | | | (592) | | | 215,160 | |
| Divestitures | — | | | — | | | (3,168) | | | (3,168) | |
| Foreign exchange | (1,566) | | | (38,905) | | | (33,499) | | | (73,970) | |
| December 31, 2022 | 497,710 | | | 1,433,601 | | | 918,592 | | | 2,849,903 | |
| Acquisitions | — | | | 209,478 | | | — | | | 209,478 | |
| Divestitures | — | | | — | | | — | | | — | |
| Foreign exchange | (236) | | | 19,355 | | | 16,545 | | | 35,664 | |
| December 30, 2023 | $ | 497,474 | | | $ | 1,662,434 | | | $ | 935,137 | | | $ | 3,095,045 | |
(1) DSA includes accumulated impairment losses of $1 billion, which were recognized in fiscal years 2008 and 2010. |
Based on the Company’s quantitative goodwill impairment test, which was performed in the fourth quarter for each of the fiscal years 2020, 20192023, 2022 and 2018,2021, the fair value of each reporting unit exceeded the reporting unit’s book value and, therefore, goodwill was 0tnot impaired. After completing the quantitative testing for fiscal year 2023, all reporting units exceeded the carrying value by a significant amount except for the Biologics Solutions reporting unit which had a fair value that exceeded its carrying value by approximately 20%.
The increase in goodwill during fiscal year 20202023 related primarily to the acquisitions of HemaCareNoveprim and CelleroSAMDI in the RMSDSA reportable segment. The increase in goodwill during fiscal year 20192022 related primarily to the acquisition of CitoxlabExplora in the DSARMS reportable segment.
Intangible Assets, Net
The following table displays intangible assets, netsegment, partially offset by major class:
| | | | | | | | | | | | | | | | | | | | | | | | | | | | | | | | | | | |
| | December 26, 2020 | | December 28, 2019 |
| Gross | | Accumulated
Amortization | | Net | | Gross | | Accumulated
Amortization | | Net |
| (in thousands) |
| Backlog | $ | 29,233 | | | $ | (29,233) | | | $ | 0 | | | $ | 28,865 | | | $ | (26,895) | | | $ | 1,970 | |
| Technology | 130,907 | | | (81,305) | | | 49,602 | | | 122,106 | | | (57,737) | | | 64,369 | |
| Trademarks and trade names | 15,870 | | | (5,648) | | | 10,222 | | | 8,430 | | | (4,901) | | | 3,529 | |
| Other | 20,903 | | | (14,633) | | | 6,270 | | | 18,279 | | | (12,307) | | | 5,972 | |
| Other intangible assets | 196,913 | | | (130,819) | | | 66,094 | | | 177,680 | | | (101,840) | | | 75,840 | |
| Client relationships | 1,137,331 | | | (415,826) | | | 721,505 | | | 934,668 | | | (321,095) | | | 613,573 | |
| Intangible assets | $ | 1,334,244 | | | $ | (546,645) | | | $ | 787,599 | | | $ | 1,112,348 | | | $ | (422,935) | | | $ | 689,413 | |
The increase in intangible assets, net during fiscal year 2020 related primarilya decrease due to the acquisitions of HemaCare and Cellero.Avian divestiture impacting the Manufacturing reportable segment.
CHARLES RIVER LABORATORIES INTERNATIONAL, INC.
NOTES TO CONSOLIDATED FINANCIAL STATEMENTS (Continued)
Intangible Assets, Net
The following table displays intangible assets, net by major class:
| | | | | | | | | | | | | | | | | | | | | | | | | | | | | | | | | | | |
| | December 30, 2023 | | December 31, 2022 |
| Gross | | Accumulated
Amortization | | Net | | Gross | | Accumulated
Amortization | | Net |
| (in thousands) |
| Client relationships | $ | 1,528,780 | | | $ | (721,322) | | | $ | 807,458 | | | $ | 1,491,926 | | | $ | (591,417) | | | $ | 900,509 | |
| Technology | 142,190 | | | (111,764) | | | 30,426 | | | 129,626 | | | (101,655) | | | 27,971 | |
| Backlog | $ | 3,100 | | | $ | (2,177) | | | $ | 923 | | | $ | 15,236 | | | $ | (12,512) | | | $ | 2,724 | |
| Trademarks and trade names | 11,878 | | | (4,568) | | | 7,310 | | | 12,617 | | | (4,410) | | | 8,207 | |
| Other | 43,611 | | | (25,677) | | | 17,934 | | | 37,985 | | | (22,121) | | | 15,864 | |
| Intangible assets | $ | 1,729,559 | | | $ | (865,508) | | | $ | 864,051 | | | $ | 1,687,390 | | | $ | (732,115) | | | $ | 955,275 | |
The decrease in intangible assets, net during fiscal year 2023 related primarily to normal amortization over the useful lives, partially offset by the acquisitions of Noveprim and SAMDI.
Amortization expense of definite-lived intangible assets, including client relationships, for fiscal years 2020, 20192023, 2022 and 20182021 was $111.9$137.4 million, $89.5$146.6 million and $64.8$124.9 million, respectively. As of December 26, 2020,30, 2023, estimated amortization expense for intangible assets for each of the next five fiscal years is expected to be as follows:
| | | | | | | | |
| Fiscal Year | | Amortization Expense |
| | (in thousands) |
| 2021 | | $ | 104,272 | |
| 2022 | | 91,877 | |
| 2023 | | 83,651 | |
| 2024 | | 76,291 | |
| 2025 | | 71,915 | |
| | | | | | | | |
| Fiscal Year | | Amortization Expense |
| | (in thousands) |
| 2024 | | $ | 129,153 | |
| 2025 | | $ | 120,995 | |
| 2026 | | $ | 115,757 | |
| 2027 | | $ | 103,164 | |
| 2028 | | $ | 91,315 | |
9. LONG-TERM11. DEBT AND FINANCE LEASE OBLIGATIONSOTHER FINANCING ARRANGEMENTS
Long-term debt, net and finance leases consists of the following:
| | | | | | | | | | | |
| December 26, 2020 | | December 28, 2019 |
| (in thousands) |
| Term loans | $ | 146,875 | | | $ | 193,750 | |
| Revolving facility | 814,752 | | | 676,134 | |
| 2026 Senior Notes | 500,000 | | | 500,000 | |
| 2028 Senior Notes | 500,000 | | | 500,000 | |
| Other debt | 3,457 | | | 5,781 | |
| Finance leases (Note 16) | 29,047 | | | 30,527 | |
| Total debt and finance leases | 1,994,131 | | | 1,906,192 | |
| Less: | | | |
| Current portion of long-term debt | 47,196 | | | 35,548 | |
| Current portion of finance leases (Note 16) | 3,018 | | | 2,997 | |
| Current portion of long-term debt and finance leases | 50,214 | | | 38,545 | |
| Long-term debt and finance leases | 1,943,917 | | | 1,867,647 | |
| Debt discount and debt issuance costs | (14,346) | | | (17,981) | |
| Long-term debt, net and finance leases | $ | 1,929,571 | | | $ | 1,849,666 | |
The acquisition of Distributed Bio on December 31, 2020 for approximately $83 million was funded through a combination of available cash and proceeds from the Company’s Credit Facility under the multi-currency revolving facility. The increased borrowings occurred subsequent to December 26, 2020 and are not reflected in the table above. | | | | | | | | | | | |
| December 30, 2023 | | December 31, 2022 |
| (in thousands) |
| | | |
| Revolving facility | $ | 1,129,243 | | | $ | 1,197,586 | |
| 4.25% Senior Notes due 2028 | 500,000 | | | 500,000 | |
| 3.75% Senior Notes due 2029 | 500,000 | | | 500,000 | |
| 4.00% Senior Notes due 2031 | 500,000 | | | 500,000 | |
| Other debt | 9,575 | | | 1,594 | |
| Finance leases | 28,550 | | | 30,646 | |
| Total debt and finance leases | 2,667,368 | | | 2,729,826 | |
| Less: | | | |
| Current portion of long-term debt | 3,172 | | | 1,347 | |
| Current portion of finance leases | 2,398 | | | 2,330 | |
| Current portion of long-term debt and finance leases | 5,570 | | | 3,677 | |
| Long-term debt and finance leases | 2,661,798 | | | 2,726,149 | |
| Debt discount and debt issuance costs | (14,651) | | | (18,618) | |
| Long-term debt, net and finance leases | $ | 2,647,147 | | | $ | 2,707,531 | |
As of December 26, 202030, 2023 and December 28, 2019,31, 2022, the weighted average interest rate on the Company’s debt was 3.11%4.93% and 3.46%4.58%, respectively.
Term Loans and Revolving Facility
On March 26, 2018, In fiscal year 2021, the Company amendedprepaid $500 million of Senior Notes due in 2026 along with $21 million of related debt extinguishment costs and restated its $1.65 billion credit facility creating a $2.3 billion credit facility (Credit Facility).$13 million of accrued interest using proceeds from additional senior notes issued on the same day. The amendment extendedpayment of the maturity date and provided for a $750 million term loan and a $1.55 billion multi-currency revolving facility. The amendment2026 Senior Notes was accounted for as a debt modification. In connection with the transaction, the Company expensed $1.0extinguishment. Approximately $21 million of debt issuance costs recorded within Interest expense in the accompanying consolidated statements of income for the year ended 2018. The term loan facility matures in 19 quarterly installments with the last installment due March 26, 2023. The revolving facility matures on March 26, 2023, and requires no scheduled payment before that date. On September 25, 2019, the Company amended and restated the Credit Facility for certain administrative matters.
On October 23, 2019, the Company prepaid $500.0 million of the term loan with proceeds from a $500.0 million unregistered private offering (see 2028 Senior Notes Offering below) which was treated as a debt modification. Additionally, on November 4, 2019, the Company amended and restated the Credit Facility to increase the multi-currency revolving facility by $500.0 million, from $1.55 billion to $2.05 billion. In connection with these transactions, the Company capitalized $0.5
CHARLES RIVER LABORATORIES INTERNATIONAL, INC.
NOTES TO CONSOLIDATED FINANCIAL STATEMENTS (Continued)
million within Long-termof debt netextinguishment costs and finance leases in the accompanying consolidated balance sheets and expensed $1.6$5 million of debt issuancedeferred financing costs write-offs were recorded withinin Interest expense in the accompanying consolidated statements of income for theduring fiscal year ended 2019. Under specified circumstances, the2021.
Revolving facility (Credit Facility)
The Company has the ability to increase the term loan and/ora revolving credit facility by“Credit Facility” that provides for up to $1.0$3.0 billion in the aggregate.
of multi-currency revolving credit. The Credit Facility has a maturity date of April 2026, with no required scheduled payment before that date. The interest rates applicable to the term loan and revolving facility under the Credit Facility are equal to (A) for revolving loans denominated in U.S. dollars, at the Company’s option, equal to either the base rate (which is the higher of (1) the prime rate, (2) the federal funds rate plus 0.50%, or (3) the one-month adjusted LIBORSOFR rate plus 1.0%) or the adjusted LIBORSOFR rate, (B) for revolving loans denominated in euros, the adjusted EURIBOR rate and (C) for revolving loans denominated in sterling, the daily simple SONIA rate, in each case, plus an interest rate margin based upon the Company’s leverage ratio. In March 2023 and in conjunction with the Second Amendment the Company modified the variable rate on the Credit Facility from adjusted LIBOR to adjusted term SOFR. All outstanding U.S. dollar borrowings remained at adjusted LIBOR through their respective interest reset periods in April 2023 and were then set to term SOFR.
The Credit Facility includes certain customary representations and warranties, events of default, notices of material adverse changes to the Company’s business and negative and affirmative covenants. These covenants include (1) maintenance of a ratio of consolidated earnings before interest, taxes, depreciation and amortization (EBITDA) less capital expenditures to consolidated cash interest expense, for any period of four consecutive fiscal quarters, of no less than 3.50 to 1.0 as well as (2) maintenance of a ratio of consolidated indebtedness to consolidated EBITDA for any period of four consecutive fiscal quarters, of no more than 4.004.25 to 1.0. As of December 26, 2020,30, 2023 and December 31, 2022, the Company was compliant with all covenants.
financial covenants under the Credit Facility. The obligations of the Company under the Credit Facility are collateralized by substantially all of the assets of the Company.
2028 Senior Notes
In fiscal year 2019, the Company issued $500 million of 4.25% Senior Notes due in 2028 (2028 Senior Notes) in an unregistered offering. Interest on the 2028 Senior Notes is payable semi-annually on May 1 and November 1.
2029 Senior Notes and 2031 Senior Notes
In fiscal year 2021, the Company issued $1 billion of debt split between $500 million of 3.75% Senior Notes due in 2029 (2029 Senior Notes), and $500 million of 4.00% Senior Notes due in 2031 (2031 Senior Notes), in an unregistered offering. Interest on the 2029 and 2031 Senior Notes is payable semi-annually on March 15 and September 15. Approximately $10 million of deferred financing costs were capitalized as part of this debt issuance. Proceeds from the 2029 and 2031 Senior Notes were used as follows: prepay the $500 million 2026 Senior Notes, $21 million of debt extinguishment costs, and $13 million of accrued interest; prepay the $146.9 million remaining term loan; pay down $135 million of the revolving facility; and pay for a portion of the Cognate acquisition, which occurred on March 29, 2021.
Foreign currency transactions
During fiscal years 20202022 and 2019,2021, the Company had multiple U.S. dollar denominated loans borrowed by a non-U.S. Euro functional currency entity under the Company’s Credit Facility, which ranged from $300were between $250 million toand $400 million each. This resulted inTo limit this foreign currency gains of $11.9 million during fiscal 2020 and foreign currency losses of $9.6 million during fiscal year 2019 related toexposure, the remeasurement of the underlying debt, which were recognized in Other income, net. The Company entered into foreign exchange forward contracts, to limit its foreign currency exposures related towhich are not designated as hedging instruments. The gains and losses incurred on these borrowings and recognized losses of $9.3 million and gains of $18.7 million during fiscal years 2020 and 2019, respectively, within Interest expense. As of December 26, 2020, thetransactions were as follows:
| | | | | | | | | | | | | | | | | | | | | | |
| | | | December 31, 2022 | | December 25, 2021 | | Affected Line Item in the Consolidated Statements of Income |
| | | | (in thousands) | | (in thousands) | | |
| Gain (loss) on foreign exchange forward contract | | | | $ | 49,712 | | | $ | 34,131 | | | Interest expense |
| Gain (loss) on foreign debt remeasurement | | | | (46,529) | | | (31,830) | | | Other income (expense) |
The Company did not have any outstanding borrowings inU.S. dollar denominated loans borrowed by a non-U.S. Euro functional currency different than its respective functional currency. See Note 14, “Foreign Currency Contracts”, for further discussion.
Base Indenture for Senior Notes Offerings
On April 3, 2018,entity under the Company entered into an indenture (Base Indenture) with MUFG Union Bank, N.A., (Trustee). The purpose of the Indenture was to allow the Company the ability to issue senior notes. The Company has entered into two supplemental indentures in connection with two unregistered offerings, described below.
The Indenture contains certain covenants including, but not limited to, limitations and restrictions on the ability of the Company and its U.S. subsidiaries to (i) create certain liens, (ii) enter into any Sale and Leaseback Transaction (as defined in the Indenture) with respect to any property, and (iii) merge, consolidate, sell or otherwise dispose of all or substantially all of their assets. These covenants are subject to a number of conditions, qualifications, exceptions and limitations. Any event of default, as defined, could result in the acceleration of the repayment of the obligations.
2026 Senior Notes Offering
On April 3, 2018, the Company entered into the first supplemental indenture (First Supplemental Indenture) with the Trustee in connection with an offering of $500 million in aggregate principal amount of the Company’s 5.5% Senior Notes (2026 Senior Notes), due in 2026, in an unregistered offering. Under the terms of the First Supplemental Indenture, interest on the Senior Notes is payable semi-annually on April 1 and October 1, beginning on October 1, 2018. The 2026 Senior Notes are guaranteed fully and unconditionally, jointly and severally on a senior unsecured basis by the Company and certain of its U.S. subsidiaries.
The Company may redeem all or part of the 2026 Senior Notes at any time prior to April 1, 2021, at its option, at a redemption price equal to 100.0% of the principal amount of such Senior Notes plus the Applicable Premium (as defined in the First Supplemental Indenture). The Company may also redeem up to 40.0% of the Senior Notes with the proceeds of certain equity offerings completed before April 1, 2021, at a redemption price equal to 105.5% of the principal amount of such 2026 Senior Notes. On or after April 1, 2021, the Company may on any one or more occasions redeem all or a part of the 2026 Senior Notes, at the redemption prices specified in the Indenture based on the applicable date of redemption. Upon the occurrence of a Change of Control Triggering Event (as defined in the Indenture), the Company will be required to offer to repurchase the 2026 Senior Notes at a purchase price equal to 101.0% of the aggregate principal amount of such 2026 Senior Notes. Any redemption of the 2026 Senior Notes would also require settlement of accrued and unpaid interest, if any, up to but excluding the redemption date.Credit Facility during fiscal year 2023.
CHARLES RIVER LABORATORIES INTERNATIONAL, INC.
NOTES TO CONSOLIDATED FINANCIAL STATEMENTS (Continued)
Net proceeds from the 2026 Senior Notes of $493.8 million were used to partially repay the outstanding revolving credit facility on April 3, 2018 as well as fund the acquisition of MPI Research.
2028 Senior Notes Offering
On October 23, 2019, the Company entered into a second supplemental indenture (Second Supplemental Indenture) with the Trustee in connection with the offering of $500 million in aggregate principal amount of the Company’s 4.25% Senior Notes (2028 Senior Notes), due in 2028, in an unregistered offering. Under the terms of the Second Supplemental Indenture, interest on the 2028 Senior Notes is payable semi-annually on May 1 and November 1, beginning on May 1, 2020. The 2028 Senior Notes are guaranteed fully and unconditionally, jointly and severally on a senior unsecured basis by the Company and certain of its U.S. subsidiaries. In connection with the transaction, the Company incurred approximately $6 million of debt issuance costs, which were capitalized upon the 2028 Senior Notes issuance on October 23, 2019, and was recorded within Long-term debt, net and finance leases in the accompanying consolidated balance sheets.
The Company may redeem all or part of the 2028 Senior Notes at any time prior to May 1, 2023, at its option, at a redemption price equal to 100% of the principal amount of such 2028 Senior Notes plus the Applicable Premium (as defined in the Indenture). The Company may also redeem up to 40% of the 2028 Senior Notes with the proceeds of certain equity offerings completed before May 1, 2023, at a redemption price equal to 104.25% of the principal amount of such 2028 Senior Notes. On or after May 1, 2023, the Company may on any one or more occasions redeem all or a part of the 2028 Senior Notes, at the redemption prices specified in the Indenture based on the applicable date of redemption. Upon the occurrence of a Change of Control Triggering Event (as defined in the Indenture), the Company will be required to offer to repurchase the Senior Notes at a purchase price equal to 101% of the aggregate principal amount of such Senior Notes. Any redemption of the Senior Notes would also require settlement of accrued and unpaid interest, if any, up to but excluding the redemption date.
Net proceeds from the 2028 Senior Notes of approximately $494 million and available cash were used to prepay a portion of the term loan on October 23, 2019.
Principal Maturities
Principal maturities of existing debt for the periods set forth in the table below, are as follows:
| | Principal |
| (in thousands) |
| 2021 | $ | 47,196 | |
| 2022 | 93,963 | |
| 2023 | 821,221 | |
| Principal | | | Principal |
| (in thousands) | | | (in thousands) |
| 2024 | 2024 | 487 | |
| 2025 | 2025 | 233 | |
| 2026 | |
| 2027 | |
| 2028 | |
| Thereafter | Thereafter | 1,001,984 | |
| Total | Total | $ | 1,965,084 | |
Letters of Credit
As of December 26, 202030, 2023 and December 28, 2019,31, 2022, the Company had $16.0$21.6 million and $7.5$18.6 million, respectively, in outstanding letters of credit.
CHARLES RIVER LABORATORIES INTERNATIONAL, INC.
NOTES TO CONSOLIDATED FINANCIAL STATEMENTS (Continued)
10.12. EQUITY AND NONCONTROLLING INTERESTS
Earnings Per Share
The following table reconciles the numerator and denominator in the computations of basic and diluted earnings per share:
| | | | | | | | | | | | | | | | | |
| Fiscal Year |
| 2020 | | 2019 | | 2018 |
| (in thousands) |
| Numerator: | | | | | |
| Income from continuing operations, net of income taxes | $ | 365,306 | | | $ | 254,061 | | | $ | 227,218 | |
| Income from discontinued operations, net of income taxes | 0 | | | 0 | | | 1,506 | |
| Less: Net income attributable to noncontrolling interests | 1,002 | | | 2,042 | | | 2,351 | |
| Net income attributable to common shareholders | $ | 364,304 | | | $ | 252,019 | | | $ | 226,373 | |
| | | | | |
| Denominator: | | | | | |
| Weighted-average shares outstanding—Basic | 49,550 | | | 48,730 | | | 47,947 | |
| Effect of dilutive securities: | | | | | |
| Stock options, restricted stock, restricted stock units and performance share units | 1,061 | | | 963 | | | 1,071 | |
| Weighted-average shares outstanding—Diluted | 50,611 | | | 49,693 | | | 49,018 | |
Options to purchase 0.2 million shares, 0.4 million shares, and 0.5 million shares for fiscal years 2020, 2019, and 2018, respectively, as well as a non-significant number of restricted stock, RSUs, and performance share units (PSUs), were not included in computing diluted earnings per share because their inclusion would have been anti-dilutive. Basic weighted-average shares outstanding for fiscal years 2020, 2019, and 2018 excluded the impact of 0.9 million shares, 1.0 million shares and 1.0 million shares, respectively, of non-vested restricted stock, RSUs and PSUs. | | | | | | | | | | | | | | | | | |
| Fiscal Year |
| 2023 | | 2022 | | 2021 |
| (in thousands) |
| Numerator: | | | | | |
| Net income | $ | 480,370 | | | $ | 492,608 | | | $ | 398,837 | |
| Less: Net income attributable to noncontrolling interests | 5,746 | | | 6,382 | | | 7,855 | |
| Net income attributable to common shareholders | $ | 474,624 | | | $ | 486,226 | | | $ | 390,982 | |
| | | | | |
| Denominator: | | | | | |
| Weighted-average shares outstanding—Basic | 51,227 | | | 50,812 | | | 50,293 | |
| Effect of dilutive securities: | | | | | |
| Stock options, restricted stock units and performance share units | 224 | | | 489 | | | 1,132 | |
| Weighted-average shares outstanding—Diluted | 51,451 | | | 51,301 | | | 51,425 | |
| | | | | |
Anti-dilutive common stock equivalents(1) | 652 | | | 560 | | | 152 | |
| | | | | |
(1) These common stock equivalents were outstanding for the periods presented, but were not included in the computation of diluted EPS for those periods because their inclusion would have had an anti-dilutive effect. |
Treasury Shares
The Company’s Board of Directors has authorized a $1.3 billion stock repurchase program. Under its authorized stock repurchase program, the Company did 0t repurchase any shares in fiscal years 2020, 2019, and 2018. As of December 26, 2020,30, 2023, the Company had $129.1 million remaining on the authorized stock repurchase program.
The Company’s stock-based compensation plans permit the netting of common stock upon vesting of restricted stock, RSUs and PSUs in order to satisfy individual statutory tax withholding requirements. The Company acquired 0.1 million shares for $24.0 million,of 0.1 million shares for $18.1 million, and 0.1 million shares for $13.8 million in fiscal years 2020, 2019,2023 and 2018,2022, for $24.2 million and $38.7 million, respectively, from such netting.
InPrior to the end of fiscal years 20202023, 2022 and 2019,2021, the Company’s Board of Directors approved the cancellation and return to the Company’s authorized and unissued capital stock, of 0.1 million treasury shares totaling $24.0 million and 0.1 million treasury shares totaling $18.1 million, respectively, reducing treasury stock on the Company’s consolidated balance sheet. The Company allocated the excess of the repurchase price over the par value of shares acquired to reduce both retained earnings and additional paid-in capital for $19.2 million and $4.8 million, respectively, in fiscal year 2020 and $13.8 million and $4.3 million, respectively, in fiscal year 2019..
CHARLES RIVER LABORATORIES INTERNATIONAL, INC.
NOTES TO CONSOLIDATED FINANCIAL STATEMENTS (Continued)
Accumulated Other Comprehensive Income (Loss)
Changes to each component of accumulated other comprehensive income (loss), net of income taxes, are as follows:
| | | | | | | | | | | | | | | | | |
| Foreign Currency Translation Adjustment and Other | | Pension and Other Post-Retirement Benefit Plans | | Total |
| (in thousands) |
| December 29, 2018 | $ | (102,199) | | | $ | (70,504) | | | $ | (172,703) | |
Other comprehensive income (loss) before reclassifications (1) | 14,444 | | | (25,165) | | | (10,721) | |
| Amounts reclassified from accumulated other comprehensive income | 0 | | | 1,772 | | | 1,772 | |
| Net current period other comprehensive income (loss) | 14,444 | | | (23,393) | | | (8,949) | |
| Income tax (benefit) | (177) | | | (3,456) | | | (3,633) | |
| December 28, 2019 | (87,578) | | | (90,441) | | | (178,019) | |
Other comprehensive income before reclassifications (1) | 20,909 | | | 15,747 | | | 36,656 | |
| Amounts reclassified from accumulated other comprehensive income | 0 | | | 17,861 | | | 17,861 | |
| Net current period other comprehensive income | 20,909 | | | 33,608 | | | 54,517 | |
| Income tax expense | 7,215 | | | 8,157 | | | 15,372 | |
| December 26, 2020 | $ | (73,884) | | | $ | (64,990) | | | $ | (138,874) | |
(1) The impact of the foreign currency translation adjustment to other comprehensive income (loss) before reclassifications was primarily due to the effect of changes in foreign currency exchange rates of the Euro, British Pound, Canadian Dollar, and Chinese Yuan Renminbi and to a lesser extent due to the impact of changes in the Japanese Yen and Brazilian Real. |
| | | | | | | | | | | | | | | | | | | | | | | |
| Foreign Currency Translation Adjustment and Other | | Pension and Other Post-Retirement Benefit Plans | | Net Unrealized Gain (Loss) on Cash Flow Hedge | | Total |
| (in thousands) |
| December 26, 2020 | $ | (73,884) | | | $ | (64,990) | | | $ | — | | | $ | (138,874) | |
Other comprehensive income before reclassifications (1) | (30,316) | | | (1,193) | | | — | | | (31,509) | |
| Amounts reclassified from accumulated other comprehensive income | — | | | 1,678 | | | — | | | 1,678 | |
| Net current period other comprehensive (loss) income | (30,316) | | | 485 | | | — | | | (29,831) | |
| Income tax (benefit) expense | (6,027) | | | 2,062 | | | — | | | (3,965) | |
| December 25, 2021 | (98,173) | | | (66,567) | | | — | | | (164,740) | |
Other comprehensive income before reclassifications (1) | (125,507) | | | 24,471 | | | (1,523) | | | (102,559) | |
| Amounts reclassified from accumulated other comprehensive income | — | | | 3,337 | | | — | | | 3,337 | |
| Net current period other comprehensive (loss) income | (125,507) | | | 27,808 | | | (1,523) | | | (99,222) | |
| Income tax (benefit) expense | (5,895) | | | 4,355 | | | (365) | | | (1,905) | |
| December 31, 2022 | (217,785) | | | (43,114) | | | (1,158) | | | (262,057) | |
Other comprehensive (loss) income before reclassifications (1) | 71,851 | | | (5,376) | | | 2,490 | | | 68,965 | |
| Amounts reclassified from accumulated other comprehensive income | — | | | 736 | | | — | | | 736 | |
| Net current period other comprehensive (loss) income | 71,851 | | | (4,640) | | | 2,490 | | | 69,701 | |
| Income tax (benefit) expense | 4,065 | | | (587) | | | 593 | | | 4,071 | |
| December 30, 2023 | $ | (149,999) | | | $ | (47,167) | | | $ | 739 | | | $ | (196,427) | |
(1) The impact of the foreign currency translation adjustment to other comprehensive income (loss) before reclassifications was primarily due to the effect of changes in foreign currency exchange rates of the Japanese Yen, Euro, British Pound, Canadian Dollar, Chinese Yuan Renminbi, and Hungarian Forint and to a lesser extent due to the impact of changes in the Brazilian Real. |
Nonredeemable Noncontrolling Interest
The Company has an investment in an entity whose financial results are consolidated in the Company’s financial statements, as it has the ability to exercise control over this entity. The interest of the noncontrolling party in this entity has been recorded as noncontrolling interest within Equity in the accompanying consolidated balance sheets. The activity within the nonredeemable noncontrolling interest (net income less dividends declared) during fiscal years 2020, 2019,2023, 2022, and 20182021 was not significant.
Redeemable Noncontrolling Interests
The Company holds a 92%90% ownership interest in Vital River, a commercial provider of research models and related services in China as of December 26, 2020. In 2019, the Company purchased an additional 5% equity interest in Vital River for $7.9 million.Noveprim. The Company recorded a $0.8 million gain in equity equal to the excess fair value of the 5% equity interest over the purchase price. Concurrent with the transaction, the pre-existing agreement was further amended to provide the Company withhas the right to purchase, and the noncontrolling interest holders withhave the right to sell, the remaining 8%10% equity interest (redeemable noncontrolling interest) at a contractually definedfixed redemption value subjectthat ranges from $47.0 million to a redemption floor,$54.0 million depending on when exercised, which represents a derivative embedded within the equity instrument. These rights are exercisable beginning in 2022 and are accelerated in certain events. In 2019,The Company has the call option right to purchase the remaining 10% equity up until one month after the sixth anniversary of closing the 41% equity stake (December 2029). On the first anniversary of the expiration of the call option (December 2030), a 12-month put option will be triggered giving the seller the right to require the Company recordedto acquire the remaining shares of the seller for $54.0 million. Additionally, the 10% noncontrolling interest holders may receive a charge of $2.2 million in Selling, general and administrative expenses within the consolidated statements of income, equaldividend disproportionate to the excesstheir equity ownership, which has an approximate fair value of the hybrid instrument (equity interest with embedded derivative) over the fair value of the 8% equity interest.$8 million. The redeemable noncontrolling interest is measured at the greater of the amount that would be paid if settlement occurred as of the balance sheet date based on the contractually definedaccreted redemption value ($16.3 million as of December 26, 2020)using the interest method and the carrying amount adjusted for net income (loss) attributable to the noncontrolling interest. As the noncontrolling interest holders have the ability to require the Company to purchase the remaining 8%10% interest, the noncontrolling interest is classified in the mezzanine section of the consolidated balance sheets, which is presented above the equity section and below liabilities.
CHARLES RIVER LABORATORIES INTERNATIONAL, INC.
NOTES TO CONSOLIDATED FINANCIAL STATEMENTS (Continued)
The Company held a 92% ownership interest in Vital River, a commercial provider of research models and related services in China as of December 31, 2022. The Company had the right to purchase, and the noncontrolling interest holders had the right to sell, the remaining 8% equity interest at a contractually defined redemption value, subject to a redemption floor, which represents a derivative embedded within the equity instrument. The redeemable noncontrolling interest was measured at the greater of the amount that would be paid if settlement occurred as of the balance sheet date based on the contractually defined redemption value and the carrying amount adjusted for net income (loss) attributable to the noncontrolling interest. The amount that the Company could be required to pay to purchase the remaining 8% equity interest iswas not limited.
CHARLES RIVER LABORATORIES INTERNATIONAL, INC.
NOTES TO CONSOLIDATED FINANCIAL STATEMENTS (Continued)
As part During the fourth quarter of the Citoxlab acquisition in 2019,fiscal 2023, the Company acquired an approximate 90% equity interest in a subsidiary that was fully consolidated under the voting interest model, which included an approximate 10% redeemable noncontrolling interest. In February 2020, the Company purchased the remaining approximate 10% noncontrolling interest for approximately $48% and as of December 2023, has paid $4.8 million of the total $24.4 million due. The remaining purchase price payable has been reclassified from the mezzanine section to Accrued liabilities on the consolidated balance sheet and assumption of a contingent consideration liability of approximately $2 million payableis expected to the former shareholders. See Note 7. “Fair Value”.be paid during fiscal year 2024.
In 2019,2020, the Company acquired an 80% equity interest that is fully consolidated under the voting interest model,in a subsidiary, which included a 20% redeemable noncontrolling interest. TheIn June 2022, the Company purchased an additional 10% interest in the subsidiary for $15.0 million, resulting in a remaining noncontrolling interest of 10%. Beginning in 2024, the Company has the right to purchase, and the noncontrolling interest holders have the right to sell, the remaining 20%10% equity interest at its appraised value. These rights are exercisable beginning in 2022. The redeemable noncontrolling interest is measured at the greater of the amount that would be paid if settlement occurred as of the balance sheet date based on the appraised value and the carrying amount adjusted for net income (loss) attributable to the noncontrolling interest ($11.0 million as of December 30, 2023) or a predetermined floor, value. As the noncontrolling interest holders have the ability to require the Company to purchase the remaining 20% interest, the noncontrolling interest is classified in the mezzanine section of the consolidated balance sheets, which is presented aboverepresents a derivative embedded within the equity section and below liabilities.instrument. The amount that the Company could be required to pay to purchase the remaining 20%10% equity interest is not limited.
The following table provides a rollforward of the activity related to the Company’s redeemable noncontrolling interests:
| | | | | | | | | | | |
| Fiscal Year |
| 2020 | | 2019 |
| (in thousands) |
| Beginning balance | $ | 28,647 | | | $ | 18,525 | |
| Purchase of a 10% redeemable noncontrolling interest | (3,732) | | | 0 | |
| Adjustment to Vital River redemption value | 0 | | | 1,451 | |
| Purchase of Vital River 5% equity interest | 0 | | | (8,745) | |
| Change in fair value of Vital River 8% equity interest, included in additional paid-in capital | 0 | | | 2,708 | |
| Modification of Vital River 8% purchase option | 0 | | | 2,196 | |
| Acquisition of an approximate 10% noncontrolling interest through acquiring Citoxlab | 0 | | | 4,035 | |
| Acquisition of a 20% noncontrolling interest | 0 | | | 8,740 | |
| Net loss attributable to noncontrolling interests | (852) | | | (42) | |
| Foreign currency translation | 1,436 | | | (221) | |
| Ending balance | $ | 25,499 | | | $ | 28,647 | |
| | | | | | | | | | | | | | | | | |
| Fiscal Year |
| 2023 | | 2022 | | 2021 |
| (in thousands) |
| Beginning balance | $ | 42,427 | | | $ | 53,010 | | | $ | 25,499 | |
| Acquisition resulting in a 10% noncontrolling interest | 45,374 | | | — | | | — | |
| Additional purchases reducing noncontrolling interest percentage | (24,148) | | | (15,000) | | | — | |
| Adjustments to redemption value | (5,694) | | | 7,506 | | | 21,312 | |
| Net income | 3,492 | | | 4,020 | | | 5,375 | |
| Dividends | (2,378) | | | (3,525) | | | — | |
| Foreign currency translation | (1,200) | | | (3,584) | | | 824 | |
| Other | (1,151) | | | — | | | — | |
| Ending balance | $ | 56,722 | | | $ | 42,427 | | | $ | 53,010 | |
CHARLES RIVER LABORATORIES INTERNATIONAL, INC.
NOTES TO CONSOLIDATED FINANCIAL STATEMENTS (Continued)
11.13. INCOME TAXES
The components of income from continuing operations before income taxes and the related provision for income taxes are presented below:
| | | | | | | | | | | | | | | | | |
| | Fiscal Year |
| | 2020 | | 2019 | | 2018 |
| (in thousands) |
| Income from continuing operations before income taxes: | | | | | |
| U.S. | $ | 226,935 | | | $ | 108,326 | | | $ | 95,062 | |
| Non-U.S. | 220,179 | | | 195,758 | | | 186,619 | |
| Total income from continuing operations, before income taxes | $ | 447,114 | | | $ | 304,084 | | | $ | 281,681 | |
| Income tax provision (benefit): | | | | | |
| Current: | | | | | |
| Federal | $ | 38,192 | | | $ | 18,101 | | | $ | 17,390 | |
| Foreign | 35,410 | | | 43,489 | | | 38,557 | |
| State | 6,623 | | | 9,915 | | | 8,837 | |
| Total current | 80,225 | | | 71,505 | | | 64,784 | |
| Deferred: | | | | | |
| Federal | 386 | | | (3,226) | | | (7,145) | |
| Foreign | 5,583 | | | (17,111) | | | (4,104) | |
| State | (4,386) | | | (1,145) | | | 928 | |
| Total deferred | 1,583 | | | (21,482) | | | (10,321) | |
| Total provision for income taxes | $ | 81,808 | | | $ | 50,023 | | | $ | 54,463 | |
Included in the fiscal year 2019 income tax expense of $50.0 million is a $20.6 million tax benefit for the recognition of $315.5 million of historical foreign net operating loss deferred tax assets, partially offset by a $294.9 million valuation allowance. Prior to 2019, these deferred tax assets were not recognized as the Company believed the ability to utilize the net operating losses was remote. As a result of both U.S. Tax Reform and European tax legislation, the Company made changes in 2019 to its financing structure, resulting in the ability to utilize a portion of the net operating losses previously considered remote in nature. | | | | | | | | | | | | | | | | | |
| | Fiscal Year |
| | 2023 | | 2022 | | 2021 |
| (in thousands) |
| Income before income taxes: | | | | | |
| U.S. | $ | 185,667 | | | $ | 280,075 | | | $ | 129,598 | |
| Non-U.S. | 395,617 | | | 342,912 | | | 351,112 | |
| Total income before income taxes | $ | 581,284 | | | $ | 622,987 | | | $ | 480,710 | |
| Income tax provision (benefit): | | | | | |
| Current: | | | | | |
| Federal | $ | 49,090 | | | $ | 75,052 | | | $ | 32,728 | |
| Foreign | 85,356 | | | 68,644 | | | 60,197 | |
| State | 17,817 | | | 19,790 | | | 9,257 | |
| Total current | 152,263 | | | 163,486 | | | 102,182 | |
| Deferred: | | | | | |
| Federal | (42,987) | | | (27,230) | | | (27,486) | |
| Foreign | 779 | | | (1,134) | | | 13,891 | |
| State | (9,141) | | | (4,743) | | | (6,714) | |
| Total deferred | (51,349) | | | (33,107) | | | (20,309) | |
| Total provision for income taxes | $ | 100,914 | | | $ | 130,379 | | | $ | 81,873 | |
Reconciliations of the statutory U.S. federal income tax rate to effective tax rates are as follows:
| | | | | | | | | | | | | | | | | |
| Fiscal Year |
| 2020 | | 2019 | | 2018 |
| U.S. statutory income tax rate | 21.0 | % | | 21.0 | % | | 21.0 | % |
| Foreign tax rate differences | 1.2 | | | 2.7 | | | 0.5 | |
| State income taxes, net of federal tax benefit | 0.4 | | | 2.6 | | | 2.4 | |
| Non-deductible compensation | 1.0 | | | 1.7 | | | 1.0 | |
| Research tax credits and enhanced deductions | (3.4) | | | (4.4) | | | (2.9) | |
| Stock-based compensation | (2.7) | | | (2.2) | | | (2.1) | |
| Impact of tax uncertainties | (0.2) | | | (2.6) | | | (1.1) | |
| Tax on unremitted earnings | 1.3 | | | 1.7 | | | 1.2 | |
| Impact of acquisitions and restructuring | 0.5 | | | 2.7 | | | 0.3 | |
| Net operating loss deferred tax asset recognition, net of valuation allowance (NOL DTA) | (0.1) | | | (6.8) | | | 0 | |
| Other | (0.7) | | | 0.1 | | | (1.0) | |
| Effective income tax rate | 18.3 | % | | 16.5 | % | | 19.3 | % |
The components of deferred tax assets and liabilities are as follows: | | | | | | | | | | | | | | | | | |
| Fiscal Year |
| 2023 | | 2022 | | 2021 |
| U.S. statutory income tax rate | 21.0 | % | | 21.0 | % | | 21.0 | % |
| Foreign tax rate differences | 1.5 | | | 0.4 | | | 0.1 | |
| State income taxes, net of federal tax benefit | 1.7 | | | 2.3 | | | 0.8 | |
| Non-deductible compensation | 0.8 | | | 0.9 | | | 1.2 | |
| Research tax credits and enhanced deductions | (5.0) | | | (3.8) | | | (5.0) | |
| Stock-based compensation | (0.1) | | | (1.4) | | | (4.3) | |
| Enacted tax rate changes | (0.1) | | | 0.4 | | | 3.0 | |
| Tax on unremitted earnings | 1.7 | | | 1.6 | | | 1.8 | |
| Impact of tax uncertainties | (0.3) | | | (1.3) | | | 0.7 | |
| Impact of acquisitions and restructuring | (4.2) | | | 2.0 | | | (1.6) | |
| Net operating loss deferred tax asset recognition, net of valuation allowance (NOL DTA) | 0.2 | | | (0.8) | | | — | |
| Global intangible low-taxed income | 1.5 | | | 0.8 | | | 1.3 | |
| Foreign-derived intangible income | (1.4) | | | (1.4) | | | (1.2) | |
| Other | 0.1 | | | 0.2 | | | (0.8) | |
| Effective income tax rate | 17.4 | % | | 20.9 | % | | 17.0 | % |
CHARLES RIVER LABORATORIES INTERNATIONAL, INC.
NOTES TO CONSOLIDATED FINANCIAL STATEMENTS (Continued)
| | | | | | | | | | | |
| December 26, 2020 | | December 28, 2019 |
| (in thousands) |
| Deferred tax assets: | | | |
| Compensation | $ | 32,118 | | | $ | 40,582 | |
| Accruals and reserves | 17,970 | | | 13,687 | |
| Net operating loss and credit carryforwards | 406,085 | | | 367,269 | |
| Operating lease liability | 43,646 | | | 33,785 | |
| Other | 4,253 | | | 7,181 | |
| Valuation allowance | (334,845) | | | (309,962) | |
| Total deferred tax assets | 169,227 | | | 152,542 | |
| Deferred tax liabilities: | | | |
| Goodwill and other intangibles | (202,430) | | | (174,847) | |
| Depreciation related | (33,277) | | | (29,317) | |
| Venture capital investments | (32,848) | | | (12,806) | |
| Tax on unremitted earnings | (27,707) | | | (17,282) | |
| Right-of-use assets | (43,557) | | | (34,953) | |
| Other | (8,710) | | | (5,961) | |
| Total deferred tax liabilities | (348,529) | | | (275,166) | |
| Net deferred taxes | $ | (179,302) | | | $ | (122,624) | |
The valuation allowance increased by $24.9 million from $310.0 million ascomponents of December 28, 2019 to $334.8 million as of December 26, 2020. The increase is primarily a result of foreign exchange impact on net operating losses and corresponding valuation allowances relating to the Company’s 2019 financing structure changes. The valuation allowance increased by $300.2 million from $9.8 million as of December 29, 2018 to $310.0 million as of December 28, 2019. The increase is primarily related to the recognition of $315.5 million of net operating loss deferred tax assets due to changes inand liabilities are as follows:
| | | | | | | | | | | |
| December 30, 2023 | | December 31, 2022 |
| (in thousands) |
| Deferred tax assets: | | | |
| Compensation | $ | 30,167 | | | $ | 26,341 | |
| Accruals and reserves | 19,121 | | | 16,938 | |
| Net operating loss and credit carryforwards | 379,959 | | | 382,932 | |
| Operating lease liability | 117,449 | | | 100,156 | |
| Capitalized R&D Expenditures | 35,673 | | | 18,616 | |
| Other | 12,190 | | | 8,516 | |
| Valuation allowance | (304,248) | | | (294,753) | |
| Total deferred tax assets | 290,311 | | | 258,746 | |
| Deferred tax liabilities: | | | |
| Goodwill and other intangibles | (231,020) | | | (256,234) | |
| Depreciation related | (57,791) | | | (48,965) | |
| Venture capital investments | (8,350) | | | (12,007) | |
| Tax on unremitted earnings | (25,080) | | | (16,407) | |
| Right-of-use assets | (102,620) | | | (91,716) | |
| | | |
| Other | (16,520) | | | (7,737) | |
| Total deferred tax liabilities | (441,381) | | | (433,066) | |
| Net deferred taxes | $ | (151,070) | | | $ | (174,320) | |
The Company has recognized its deferred tax assets on the Company’s financing structure, $294.9 million of which the Company does not believebelief that it is more likely than not that they will be realized. Exceptions primarily relate to be utilized. The other changes recorded todeferred tax assets for net operating losses in Luxembourg, Sweden, state research and development tax credits, certain capital losses, and fixed assets in the U.K.
A reconciliation of the Company’s beginning and ending valuation allowance were immaterial in the fiscal years 2020, 2019, and 2018.are as follows:
| | | | | | | | | | | | | | | | | |
| Fiscal Year |
| 2023 | | 2022 | | 2021 |
| Beginning balance | $ | 294,753 | | | $ | 315,645 | | | $ | 334,845 | |
| Additions (reductions) charged to income tax provision, net | 963 | | | 1,929 | | | 1,023 | |
| Additions due to acquisitions | — | | | — | | | 7,747 | |
| Reductions due to divestitures, restructuring | — | | | (5,337) | | | (4,706) | |
| Currency translation and other | 8,532 | | | (17,484) | | | (23,264) | |
| Ending balance | $ | 304,248 | | | $ | 294,753 | | | $ | 315,645 | |
As of December 26, 2020,30, 2023, the Company had tax-effected deferred tax assets for net operating loss carryforwards of $369.0$336.0 million, as compared to $337.3$336.6 million as of December 28, 2019.31, 2022. Of this amount, $27.7$25.9 million are definite-lived and begin to expire in 2021,2027, and the remainder of $341.3$310.1 million can be carried forward indefinitely. The Company has deferred tax assets for tax credit carryforwards of $37.1$41.5 million. The entire $41.5 million which willare definite-lived and begin to expire after 2035 and beyond.2039. Additionally, the Company records a benefit to operating income for research and development and other credits in Quebec, France, the Netherlands, and the U.K. related to its DSA facilities.
The Company has recognized its deferred tax assets on the belief that it is more likely than not that they will be realized. The only exceptions relate to deferred tax assets primarily for net operating losses in Hong Kong, Luxembourg, Denmark, certain capital losses, and fixed assets in the U.K.
CHARLES RIVER LABORATORIES INTERNATIONAL, INC.
NOTES TO CONSOLIDATED FINANCIAL STATEMENTS (Continued)
A reconciliation of the Company’s beginning and ending unrecognized income tax benefits is as follows:
| | Fiscal Year |
| 2020 | | 2019 | | 2018 |
| (in thousands) |
| Fiscal Year | | | Fiscal Year |
| 2023 | | | 2023 | | 2022 | | 2021 |
| (in thousands) | | | (in thousands) |
| Beginning balance | Beginning balance | $ | 19,665 | | | $ | 18,827 | | | $ | 24,710 | |
| Additions to tax positions for current year | Additions to tax positions for current year | 7,044 | | | 3,691 | | | 2,477 | |
| | Additions to tax positions for prior years | |
| Additions to tax positions for prior years | |
| Additions to tax positions for prior years | Additions to tax positions for prior years | 4,589 | | | 5,234 | | | 0 | |
| Reductions to tax positions for prior years | Reductions to tax positions for prior years | (127) | | | (1,033) | | | (4,543) | |
| Settlements | Settlements | (5,859) | | | (274) | | | (3,380) | |
| Expiration of statute of limitations | Expiration of statute of limitations | (342) | | | (6,780) | | | (437) | |
| Ending balance | Ending balance | $ | 24,970 | | | $ | 19,665 | | | $ | 18,827 | |
The $5.3$0.5 million increasedecrease in unrecognized income tax benefits during fiscal year 20202023 as compared to the corresponding period in 20192022 is primarily attributable to amended U.S. state tax returns from prior years and an additional year ofreductions to Canadian Scientific Research and Experimental Development (SR&ED) credit,credits, partially offset by audit settlements.
CHARLES RIVER LABORATORIES INTERNATIONAL, INC.
NOTES TO CONSOLIDATED FINANCIAL STATEMENTS (Continued)
an additional year of SR&ED credit additions. The amount of unrecognized income tax benefits that, if recognized, would favorably impact the effective tax rate was $22.6$20.3 million as of December 26, 202030, 2023 and $17.0$20.3 million as of December 28, 2019. The $5.6 million increase is primarily due to the same items noted above.31, 2022. It is reasonably possible as of December 26, 202030, 2023 that the liability for unrecognized tax benefits for the uncertain tax position will decrease by approximately $2$5.2 million over the next twelve-month period. The Company continues to recognize interest and penalties related to unrecognized income tax benefits in income tax expense. The total amount of cumulative accrued interest related to unrecognized income tax benefits as of December 26, 202030, 2023 and December 28, 201931, 2022 was $2.4$1.3 million and $2.3$1.4 million, respectively. Interest expense recorded as a component of income taxes was immaterial for all periods. There were 0no accrued penalties related to unrecognized income tax benefits as of December 26, 202030, 2023 or as of December 28, 2019.31, 2022.
The Company conducts business in a number of tax jurisdictions. As a result,result, it is subject to tax audits on a regular basis including, but not limited to, such major jurisdictions as the U.S., the U.K., China, France, Germany, and Canada. With few exceptions, the Company is no longer subject to U.S. and international income tax examinations for years before 2017.2019.
The Company and certain of its subsidiaries have ongoing tax controversies in the U.S., Canada, Germany,France, and France.India. The Company does not anticipate resolution of these audits will have a material impact on its consolidated financial statements.
Prepaid income tax of $59.7 million and $88.6 million has been presented within Other current assets in the accompanying consolidated balance sheets as of December 30, 2023 and December 31, 2022, respectively. Accrued income taxes of $38.8 million and $39.9 million have been presented within Other current liabilities in the accompanying consolidated balance sheets as of December 30, 2023 and December 31, 2022, respectively.
12.
14. EMPLOYEE BENEFIT PLANS
Pension Plans
The Charles River Laboratories, Inc. Pension Plan (U.S. Pension Plan) is a qualified, non-contributory defined benefit plan covering certain U.S. employees. Effective 2002, the U.S. Pension Plan was amended to exclude new participants from joining and in 2008 the accrual of benefits was frozen. In January 2019, the Company commenced the process to terminate this plan and received regulatory approval in April 2020. In October 2020, the Company settled all remaining benefits directly with vested participants through either lump sum payouts or the purchase of a group annuity contract from a qualified insurance company to administer all future payments. Prior to the settlement, the U.S. Pension Plan was underfunded with a benefit obligation of $93.8 million and plan assets of $93.0 million. In the fourth quarter of fiscal year 2020, the Company made a contribution of $0.8 million to fully fund this plan to cover the lump sum payments, purchase the group annuity contract, and settle remaining termination costs. Upon settlement of the pension liability, the Company recognized a non-cash settlement charge of $10.3 million related to pension losses, reclassified from accumulated other comprehensive loss on the consolidated balance sheet, to other expense in the consolidated statements of income.
The Charles River Pension Plan (U.K. Pension Plan) is a defined contribution and defined benefit pension plan covering certain U.K. employees. Benefits are based on participants’ final pensionable salary and years of service. Participants’ rights vest immediately. Effective December 31, 2002, theThe plan was previously amended to exclude new participants from joining the defined benefit section of the plan and a defined contribution section was established for new entrants. Contributions under the defined contribution plan are determined as a percentage of gross salary. In the fourth quarter of 2015,Additionally, the U.K. Pension Plan was amended such that the members of the defined benefit section of the plan ceased to accrue additional benefits; however, their benefits continue to be adjusted for changes in their final pensionable salary or a specified inflation index, as applicable. During fiscal 2020,2023, the Company made no contributions of $23.0 million to the U.K. Pension Plan. As of fiscal 20202023 year-end, this plan was in a funded status of $28.9$35.7 million.
During 2022, the Company terminated a non-contributory defined benefit plan that covered certain employees in Canada (Canada Pension Plan). Upon settlement of the pension liability in fiscal year 2022, the Company recognized a $1.0 million loss related to the net periodic benefit cost recorded in Other expense in the consolidated statements of income.
In addition, the Company has several defined benefit plans in certain other countries in which it maintains an operating presence, including Canada, France, Germany, Japan, Italy, Mauritius, Netherlands, and the Netherlands.Japan.
The net periodic benefit cost (income) associated with these plans for fiscal years 2020, 20192023, 2022 and 20182021 totaled $1.6$2.8 million, $1.5$0.1 million and $(1.5)$0.5 million, respectively.
CHARLES RIVER LABORATORIES INTERNATIONAL, INC.
NOTES TO CONSOLIDATED FINANCIAL STATEMENTS (Continued)
Charles River Laboratories Deferred Compensation Plan and Executive Supplemental Life Insurance Retirement Plan
The Company maintains a non-qualified deferred compensation plan, known as the Charles River Laboratories Deferred Compensation Plan (DCP), which allows a select group of eligible employees to defer a portion of their compensation. At the present time, no contributions are credited to the DCP, except as set forth below. Participants must specify the distribution date for deferred amounts at the time of deferral, in accordance with applicable IRS regulations. Generally, amounts may be paid in lump sum or installments upon retirement or termination of employment, or later if the employee terminates employment after age 55 and before age 65. Amounts may also be distributed during employment, subject to a minimum deferral requirement of three years.
The Company provides certain active employees an annual contribution into their DCP account of 10% of the employee’s base salary plus the lesser of their target annual bonus or actual annual bonus.
CHARLES RIVER LABORATORIES INTERNATIONAL, INC.
NOTES TO CONSOLIDATED FINANCIAL STATEMENTS (Continued)
In addition to the DCP, certain officers and key employees also participate, or in the past participated, in the Company’s Executive Supplemental Life Insurance Retirement Plan (ESLIRP), which is a non-funded, non-qualified arrangement. Annual benefits under this plan will equal a percentage of the highest five consecutive years of compensation, offset by amounts payable under the U.S. Pension Plan and Social Security. In connection with the establishment of the DCP, certain active ESLIRP participants, who agreed to convert their accrued ESLIRP benefit to a comparable deferred compensation benefit, discontinued their direct participation in the ESLIRP. Instead, the present values of the accrued benefits of ESLIRP participants were credited to their DCP accounts, and future accruals are converted to present values and credited to their DCP accounts annually. In fiscal year 2020, one executive officer, who converted their ESLIRP benefit into the DCP, retired resulting in lump sum payment of $8.1 million. Upon settlement of this pension liability, the Company recognized a non-cash settlement charge of $2.1 million related to pension losses, reclassified from accumulated other comprehensive loss on the consolidated balance sheet, to other expense in the consolidated statements of income.
The net periodic benefit cost associated with these plans for fiscal years 2020, 20192023, 2022 and 20182021 totaled $5.7$2.8 million, $2.5$4.3 million and $2.9$4.3 million, respectively.
The Company has invested in several corporate-owned key-person life insurance policies with the intention of using these investments to fund the ESLIRP and the DCP. Participants have no interest in any such investments. As of December 26, 202030, 2023 and December 28, 2019,31, 2022, the cash surrender value of these life insurance policies were $43.8$48.4 million and $41.9 million$38.2 million,, respectively.
CHARLES RIVER LABORATORIES INTERNATIONAL, INC.
NOTES TO CONSOLIDATED FINANCIAL STATEMENTS (Continued)
The following table provides a reconciliation of benefit obligations and plan assets of the Company’s pension, DCP and ESLIRP plans:
| | | | December 26, 2020 | | December 28, 2019 | | December 30, 2023 | | December 31, 2022 |
| (in thousands) |
| (in thousands) | | | (in thousands) |
| Change in projected benefit obligations: | Change in projected benefit obligations: | | | | Change in projected benefit obligations: | | | |
| Benefit obligation at beginning of year | Benefit obligation at beginning of year | $ | 447,409 | | | $ | 362,805 | |
| Service cost | Service cost | 3,609 | | | 2,833 | |
| Interest cost | Interest cost | 8,849 | | | 11,583 | |
| Other | 429 | | | 850 | |
| | Benefit payments | Benefit payments | (8,913) | | | (11,062) | |
| Benefit payments | |
| Benefit payments | |
| Curtailment | |
| Settlements | Settlements | (101,979) | | | (74) | |
| Special/Contractual Termination Benefits | 0 | | | 166 | |
| Transfer in from acquisition | 0 | | | 6,818 | |
| Actuarial loss | 9,816 | | | 66,432 | |
| Administrative expenses paid | (808) | | | (470) | |
| | Transfer in due to acquisition | |
| Transfer in due to acquisition | |
| Transfer in due to acquisition | |
| Actuarial (gain) loss | |
| | Effect of foreign exchange | |
| Effect of foreign exchange | |
| Effect of foreign exchange | Effect of foreign exchange | 9,056 | | | 7,528 | |
| Benefit obligation at end of year | Benefit obligation at end of year | $ | 367,468 | | | $ | 447,409 | |
| Change in fair value of plan assets: | Change in fair value of plan assets: | | | |
| Fair value of plan assets at beginning of year | Fair value of plan assets at beginning of year | $ | 357,181 | | | $ | 305,709 | |
| Fair value of plan assets at beginning of year | |
| Fair value of plan assets at beginning of year | |
| Actual return on plan assets | Actual return on plan assets | 36,551 | | | 53,741 | |
| Employer contributions | Employer contributions | 34,092 | | | 2,105 | |
| Settlements | Settlements | (101,979) | | | (74) | |
| Transfer in from acquisition | 0 | | | 119 | |
| Transfer in due to acquisition | |
| Benefit payments | Benefit payments | (8,913) | | | (11,062) | |
| Administrative expenses paid | (808) | | | (470) | |
| | Effect of foreign exchange | |
| Effect of foreign exchange | |
| Effect of foreign exchange | Effect of foreign exchange | 8,628 | | | 7,113 | |
| Fair value of plan assets at end of year | Fair value of plan assets at end of year | $ | 324,752 | | | $ | 357,181 | |
| | Net balance sheet liability | Net balance sheet liability | $ | 42,716 | | | $ | 90,228 | |
| Net balance sheet liability | |
| Net balance sheet liability | |
| | Amounts recognized in balance sheet: | Amounts recognized in balance sheet: | |
| Amounts recognized in balance sheet: | |
| Amounts recognized in balance sheet: | |
| Noncurrent assets | |
| Noncurrent assets | |
| Noncurrent assets | Noncurrent assets | $ | 31,916 | | | $ | 1,742 | |
| Current liabilities | Current liabilities | 1,713 | | | 12,788 | |
| Noncurrent liabilities | Noncurrent liabilities | 72,919 | | | 79,182 | |
Actuarial gains and losses are driven mainly by liability losses as a result of changes in economic assumptions, in particular lowerprincipally discount rates, offset by liability gains due to changes in the mortality assumptions and plan experience.
rates. Amounts recognized in accumulated other comprehensive loss related to the Company’s pension, DCP and ESLIRP plans are as follows:
| | | | | | | | | | | |
| Fiscal Year |
| | 2020 | | 2019 |
| (in thousands) |
| Net actuarial loss | $ | 82,914 | | | $ | 116,930 | |
| Net prior service cost (credit) | (1,593) | | | (2,096) | |
| Net amount recognized | $ | 81,321 | | | $ | 114,834 | |
CHARLES RIVER LABORATORIES INTERNATIONAL, INC.
NOTES TO CONSOLIDATED FINANCIAL STATEMENTS (Continued)
| | | | | | | | | | | |
| Fiscal Year |
| | 2023 | | 2022 |
| (in thousands) |
| Net actuarial loss | $ | 58,855 | | | $ | 54,509 | |
| Net prior service cost (credit) | (121) | | | (585) | |
| Net amount recognized | $ | 58,734 | | | $ | 53,924 | |
The accumulated benefit obligation and fair value of plan assets for the Company’s pension, DCP and ESLIRP plans with accumulated benefit obligations in excess of plan assets are as follows:
| | | | December 26, 2020 | | December 28, 2019 | | December 30, 2023 | | December 31, 2022 |
| (in thousands) |
| (in thousands) | | | (in thousands) |
| Accumulated benefit obligation | Accumulated benefit obligation | $ | 72,940 | | | $ | 410,243 | |
| Fair value of plan assets | Fair value of plan assets | 11,543 | | | 337,344 | |
CHARLES RIVER LABORATORIES INTERNATIONAL, INC.
NOTES TO CONSOLIDATED FINANCIAL STATEMENTS (Continued)
The projected benefit obligation and fair value of plan assets for the Company’s pension, DCP and ESLIRP plans with projected benefit obligations in excess of plan assets are as follows:
| | | | December 26, 2020 | | December 28, 2019 | | December 30, 2023 | | December 31, 2022 |
| (in thousands) |
| (in thousands) | | | (in thousands) |
| Projected benefit obligation | Projected benefit obligation | $ | 93,192 | | | $ | 435,638 | |
| Fair value of plan assets | Fair value of plan assets | 18,560 | | | 343,688 | |
Components of total benefit cost for the Company’s pension, DCP and ESLIRP plans are as follows:
| | Fiscal Year | | | Fiscal Year |
| | Fiscal Year | | 2023 | | 2022 | | 2021 |
| | 2020 | | 2019 | | 2018 |
| (in thousands) |
| (in thousands) | | | (in thousands) |
| Service cost | Service cost | $ | 3,609 | | | $ | 2,833 | | | $ | 2,612 | |
| Interest cost | Interest cost | 8,849 | | | 11,583 | | | 10,850 | |
| Expected return on plan assets | Expected return on plan assets | (11,348) | | | (13,005) | | | (15,516) | |
| Amortization of prior service credit | Amortization of prior service credit | (489) | | | (489) | | | (514) | |
| Amortization of net loss | Amortization of net loss | 6,239 | | | 2,250 | | | 2,990 | |
| Other | 417 | | | 850 | | | 910 | |
| | Net periodic benefit cost | |
| Net periodic benefit cost | |
| Net periodic benefit cost | Net periodic benefit cost | $ | 7,277 | | | $ | 4,022 | | | $ | 1,332 | |
| Settlement | Settlement | 12,385 | | | 0 | | | 0 | |
| Total benefit cost | Total benefit cost | $ | 19,662 | | | $ | 4,022 | | | $ | 1,332 | |
|
Assumptions
Weighted-average assumptions used to determine projected benefit obligations are as follows:
| | | | December 26, 2020 | | December 28, 2019 | | December 30, 2023 | | December 31, 2022 |
| Discount rate | Discount rate | 1.48 | % | | 2.14 | % | Discount rate | 4.7 | % | | 4.8 | % |
| Rate of compensation increase | Rate of compensation increase | 2.98 | % | | 2.99 | % | Rate of compensation increase | 3.2 | % | | 3.2 | % |
The discount rate reflects the rate the Company would have to pay to purchase high-quality investments that would provide cash sufficient to settle its current pension obligations. Specifically for the termination of the U.S. Pension Plan in fiscal 2020, estimated costs of lump sum payments and annuity purchases were reflected in the discount rate for fiscal 2019. A 25-basis point change across all discount rates changes the projected benefit obligation by approximately $17 million for all Company plans.
Weighted-average assumptions used to determine net periodic benefit cost are as follows:
| | | | | | | | | | | | | | | | | |
| | December 26, 2020 | | December 28, 2019 | | December 29, 2018 |
| Discount rate | 2.14 | % | | 3.21 | % | | 2.82 | % |
| Expected long-term return on plan assets | 3.35 | % | | 4.28 | % | | 5.18 | % |
| Rate of compensation increase | 2.99 | % | | 3.23 | % | | 3.16 | % |
A 0.5% decrease in the expected rate of return would increase annual pension expense by $1.6 million.
CHARLES RIVER LABORATORIES INTERNATIONAL, INC.
NOTES TO CONSOLIDATED FINANCIAL STATEMENTS (Continued)
| | | | | | | | | | | | | | | | | |
| | December 30, 2023 | | December 31, 2022 | | December 25, 2021 |
| Discount rate | 4.8 | % | | 1.8 | % | | 1.5 | % |
| Expected long-term return on plan assets | 3.9 | % | | 2.4 | % | | 2.5 | % |
| Rate of compensation increase | 3.2 | % | | 3.7 | % | | 3.0 | % |
In fiscal years 20202023 and 2019,2022, new mortality improvement scales were issued in the U.S. and the United Kingdom (U.K.) reflecting a decline in longevity projection from previous releases the Company adopted, which decreased the Company’s benefit obligations by $7.8$3.5 million and $0.2 million and $2.8 million as of December 26, 202030, 2023 and December 28, 2019,31, 2022, respectively.
Plan Assets
The Company invests its pension assets with the objective of achieving a total long-term rate of return sufficient to fund future pension obligations and to minimize future pension contributions. The Company is willing to tolerate a commensurate level of risk to achieve this objective. The Company controls its risk by maintaining a diversified portfolio of asset classes. Plan assets did not include any of the Company’s common stock as of December 26, 202030, 2023 or December 28, 2019.31, 2022. The weighted-average target asset allocations are 22.1%7.0% to equity securities, 15.3%84.1% to fixed income securities and 62.6%8.9% to other securities.
CHARLES RIVER LABORATORIES INTERNATIONAL, INC.
NOTES TO CONSOLIDATED FINANCIAL STATEMENTS (Continued)
The fair value of the Company’sCompany’s pension plan assets by asset category are as follows:
| | | | December 26, 2020 | | December 28, 2019 | | December 30, 2023 | | December 31, 2022 |
| Level 1 | | Level 2 | | Level 3 | | Total | | Level 1 | | Level 2 | | Level 3 | | Total |
| (in thousands) |
| Level 1 | | | Level 1 | | Level 2 | | Level 3 | | Total | | Level 1 | | Level 2 | | Level 3 | | Total |
| (in thousands) | | | (in thousands) |
| Cash and cash equivalents | Cash and cash equivalents | $ | 20,163 | | | $ | 1,466 | | | $ | 0 | | | $ | 21,629 | | | $ | 2,388 | | | $ | 1,022 | | | $ | 0 | | | $ | 3,410 | |
Equity securities (1) | Equity securities (1) | 8,633 | | | 54,832 | | | 0 | | | 63,465 | | | 7,621 | | | 84,377 | | | 0 | | | 91,998 | |
Debt securities (2) | Debt securities (2) | 0 | | | 99,188 | | | 0 | | | 99,188 | | | 40,281 | | | 89,684 | | | 0 | | | 129,965 | |
Mutual funds (3) | Mutual funds (3) | 7,018 | | | 65,189 | | | 0 | | | 72,207 | | | 6,324 | | | 68,632 | | | 0 | | | 74,956 | |
Other (4) | Other (4) | 508 | | | 66,439 | | | 1,316 | | | 68,263 | | | 551 | | | 54,787 | | | 1,514 | | | 56,852 | |
| Total | Total | $ | 36,322 | | | $ | 287,114 | | | $ | 1,316 | | | $ | 324,752 | | | $ | 57,165 | | | $ | 298,502 | | | $ | 1,514 | | | $ | 357,181 | |
(1) This category comprises equity investments and securities held by non-U.S. pension plans valued at the quoted closing price and translated into U.S. dollars using a foreign currency exchange rate at year end. | (1) This category comprises equity investments and securities held by non-U.S. pension plans valued at the quoted closing price and translated into U.S. dollars using a foreign currency exchange rate at year end. | (1) This category comprises equity investments and securities held by non-U.S. pension plans valued at the quoted closing price and translated into U.S. dollars using a foreign currency exchange rate at year end. |
(2) This category comprises debt investments and securities held by non-U.S. pension plans valued at the quoted closing price and translated into U.S. dollars using a foreign currency exchange rate at year end. Holdings primarily include investment-grade corporate bonds and treasuries at various durations. | (2) This category comprises debt investments and securities held by non-U.S. pension plans valued at the quoted closing price and translated into U.S. dollars using a foreign currency exchange rate at year end. Holdings primarily include investment-grade corporate bonds and treasuries at various durations. | (2) This category comprises debt investments and securities held by non-U.S. pension plans valued at the quoted closing price and translated into U.S. dollars using a foreign currency exchange rate at year end. Holdings primarily include investment-grade corporate bonds and treasuries at various durations. |
(3) This category comprises mutual funds valued at the net asset value of shares held by non-U.S. pension plans at year end and translated into U.S. dollars using a foreign currency exchange rate at year end. | (3) This category comprises mutual funds valued at the net asset value of shares held by non-U.S. pension plans at year end and translated into U.S. dollars using a foreign currency exchange rate at year end. | (3) This category comprises mutual funds valued at the net asset value of shares held by non-U.S. pension plans at year end and translated into U.S. dollars using a foreign currency exchange rate at year end. |
(4) This category mainly comprises fixed income securities tied to various U.K. government bond yields held by non-US pension plans valued at the net asset value of shares held at year-end and translated into U.S. dollars using a foreign currency exchange rate at year end. | (4) This category mainly comprises fixed income securities tied to various U.K. government bond yields held by non-US pension plans valued at the net asset value of shares held at year-end and translated into U.S. dollars using a foreign currency exchange rate at year end. | (4) This category mainly comprises fixed income securities tied to various U.K. government bond yields held by non-US pension plans valued at the net asset value of shares held at year-end and translated into U.S. dollars using a foreign currency exchange rate at year end. |
The activity within the Level 3 pension plan assets was not significant during the periods presented.
During fiscal year 2020,2023, the Company contributed $24.6 milliondid not contribute to the pension plans and expects to contribute approximately $0.9make $2.0 million in contributions in fiscal year 2021.2024. During fiscal year 2020,2023, the Company paid $9.5$1.7 million directly to certain participants outside of plan assets.
Expected benefit payments are estimated using the same assumptions used in determining the Company’s benefit obligation as of December 26, 2020.2023. Benefit payments will depend on future employment and compensation levels, among other factors, and changes in any of these factors could significantly affect these estimated future benefit payments. Estimated future benefit payments during the next five years and in the aggregate for fiscal years 20262029 through 2030,2033, are as follows.
| | | | | | | | |
| Fiscal Year | | Pension Plans |
| | (in thousands) |
| 2021 | | $ | 6,457 | |
| 2022 | | 6,890 | |
| 2023 | | 41,395 | |
| 2024 | | 7,595 | |
| 2025 | | 7,847 | |
| 2026-2030 | | 42,617 | |
| | | | | | | | |
| Fiscal Year | | Pension Plans |
| | (in thousands) |
| 2024 | | $ | 6,558 | |
| 2025 | | 6,703 | |
| 2026 | | 46,898 | |
| 2027 | | 7,633 | |
| 2028 | | 8,843 | |
| 2029-2033 | | 55,416 | |
CHARLES RIVER LABORATORIES INTERNATIONAL, INC.
NOTES TO CONSOLIDATED FINANCIAL STATEMENTS (Continued)
Post-Retirement Health and Life Insurance Plans
The Company’s Canadian location offers post-retirement life insurance benefits to its employees and post-retirement medical and dental insurance coverage to certain executives. The plan is non-contributory and unfunded. As of December 26, 2020 and December 28, 2019, the accumulated benefit obligation related to the plan was $1.3 million and $1.1 million, respectively. The amounts included in other accumulated comprehensive income as well as expenses related to the plan were not significant for fiscal years 2020, 2019 and 2018.
Charles River Laboratories Employee Savings Plan
The Charles River Laboratories Employee Savings Plan is a defined contribution plan in the form of a qualified 401(k) plan in which substantially all U.S. employees are eligible to participate upon employment. The plan contains a provision whereby the Company matches a percentage of employee contributions. During fiscal years 2020, 20192023, 2022 and 2018,2021, the costs associated with this defined contribution plan totaled $14.6$31.6 million,, $19.1 $28.8 million and $13.4$24.0 million, respectively.
13.15. STOCK-BASED COMPENSATION
The Company has stock-based compensation plans under which employees and non-employee directors may beare granted stock-based awards such as stock options, restricted stock, restricted stock units (RSUs),RSUs, and performance share units (PSUs).PSUs.
During fiscal years 2020, 20192023, 2022 and 2018,2021, the primary share-based awards and their general terms and conditions are as follows:
•Stock options, which entitle the holder to purchase a specified number of shares of common stock at an exercise price equal to the closing market price of common stock on the date of grant; typically vest over 4 years; and typically expire 5 or 10 years from date of grant.
CHARLES RIVER LABORATORIES INTERNATIONAL, INC.
NOTES TO CONSOLIDATED FINANCIAL STATEMENTS (Continued)
•RSUs, which represent an unsecured promise to grant at no cost a set number of shares of common stock upon the completion of the vesting schedule, and typicallyprincipally vest over 2 to 4 years. With respect to RSUs, recipients are not entitled to cash dividends and have no voting rights on the stock during the vesting period.
•PSUs, which entitle the holder to receive at no cost, a specified number of shares of common stock within a range of shares from 0zero to a specified maximum and typically vest over 3 years. Payout of this award is contingent upon achievement of certain performance and market conditions.
In May 2007, the Company’s shareholders approved the 2007 Incentive Plan, which was amended in 2009, 2011, 2013 and 2015 (2007 Plan). The 2007 Plan provided no further awards to be granted under preexisting stock option and incentive plans; provided, however, that any shares that have been forfeited or canceled in accordance with the terms of the applicable award under a preexisting plan may be subsequently awarded in accordance with the terms of the preexisting plan. The 2007 Plan allows a maximum of 18.7 million shares to be awarded, of which restricted stock grants, RSUs, and performance-based stock awards count as 2.3 shares and stock options count as 1.0 share. Any stock options and other share-based awards that were granted under prior plans and were outstanding in May 2007 continue in accordance with the terms of the respective plans.
In May 2016, the Company’s shareholders approved the 2016 Incentive Plan (2016 Plan). The 2016 Plan provided no further awards to be granted under preexisting stock option and incentive plans; provided, however, that any shares that have been forfeited or canceled in accordance with the terms of the applicable award under a preexisting plan may be subsequently awarded in accordance with the terms of the preexisting plan. The 2016 Plan allows a maximum of 6.1 million shares to be awarded, of which restricted stock grants, RSUs, and performance-based stock awards count as 2.3 shares and stock options count as 1.0 share. Any stock options and other share-based awards that were granted under prior plans and were outstanding in May 2016 continue in accordance with the terms of the respective plans.
In May 2018, the Company’s shareholders approved the 2018 Incentive Plan, which was amended in 2020 (2018 Plan). The 2018 Plan provided no further awards to be granted under preexisting stock option and incentive plans; provided, however, that any shares that have been forfeited or canceled in accordance with the terms of the applicable award under a preexisting plan may be subsequently awarded in accordance with the terms of the preexisting plan. The 2018 Plan allows a maximum of 8.9 million shares to be awarded, of which restricted stock grants, RSUs, and performance-based stock awards count as 2.3 shares and stock options count as 1.0 share. Any stock options and other share-based awards that were granted under prior plans and were outstanding in May 2018 continue in accordance with the terms of the respective plans.
As of December 26, 2020,30, 2023, approximately 6.74.1 million shares were authorized for future grants under the Company’s share-based compensation plans. The Company settles employee share-based compensation awards with newly issued shares. The following table provides stock-based compensation by the financial statement line item in which it is reflected:
CHARLES RIVER LABORATORIES INTERNATIONAL, INC. | | | | | | | | | | | | | | | | | |
| Fiscal Year |
| 2023 | | 2022 | | 2021 |
| (in thousands) |
| Cost of revenue | $ | 15,052 | | | $ | 14,853 | | | $ | 13,087 | |
| Selling, general and administrative | 56,996 | | | 58,764 | | | 58,387 | |
| Stock-based compensation, before income taxes | 72,048 | | | 73,617 | | | 71,474 | |
| Provision for income taxes | (10,907) | | | (10,969) | | | (10,299) | |
| Stock-based compensation, net of income taxes | $ | 61,141 | | | $ | 62,648 | | | $ | 61,175 | |
NOTES TO CONSOLIDATED FINANCIAL STATEMENTS (Continued)
| | | | | | | | | | | | | | | | | |
| Fiscal Year |
| 2020 | | 2019 | | 2018 |
| (in thousands) |
| Cost of revenue | $ | 10,636 | | | $ | 9,038 | | | $ | 6,285 | |
| Selling, general and administrative | 45,705 | | | 48,233 | | | 41,061 | |
| Stock-based compensation, before income taxes | 56,341 | | | 57,271 | | | 47,346 | |
| Provision for income taxes | (8,130) | | | (9,465) | | | (9,188) | |
| Stock-based compensation, net of income taxes | $ | 48,211 | | | $ | 47,806 | | | $ | 38,158 | |
NaNNo stock-based compensation related costs were capitalized in fiscal years 2020, 20192023, 2022 and 2018.2021.
Stock Options
The following table summarizes stock option activity under the Company’s stock-based compensation plans:
| | | | | | | | | | | | | | | | | | | | | | | |
| Number of shares | | Weighted Average
Exercise Price | | Weighted Average
Remaining
Contractual Life | | Aggregate
Intrinsic
Value |
| (in thousands) | | | | (in years) | | (in thousands) |
| Options outstanding as of December 28, 2019 | 1,507 | | | $ | 105.19 | | | | | |
| Options granted | 292 | | | $ | 178.79 | | | | | |
| Options exercised | (533) | | | $ | 87.45 | | | | | |
| Options canceled | (50) | | | $ | 134.02 | | | | | |
| Options outstanding as of December 26, 2020 | 1,216 | | | $ | 129.34 | | | 3.8 | | $ | 148,795 | |
| Options exercisable as of December 26, 2020 | 308 | | | $ | 98.34 | | | 1.5 | | $ | 47,163 | |
| Options expected to vest as of December 26, 2020 | 908 | | | $ | 139.84 | | | 4.6 | | $ | 101,632 | |
| | | | | | | | | | | | | | | | | | | | | | | |
| Number of shares | | Weighted Average
Exercise Price | | Weighted Average
Remaining
Contractual Life | | Aggregate
Intrinsic
Value |
| (in thousands) | | | | (in years) | | (in thousands) |
| Options outstanding as of December 31, 2022 | 882 | | | $ | 204.41 | | | | | |
| Options granted | 130 | | | $ | 194.27 | | | | | |
| Options exercised | (195) | | | $ | 130.91 | | | | | |
| Options canceled | (28) | | | $ | 259.63 | | | | | |
| Options outstanding as of December 30, 2023 | 789 | | | $ | 218.97 | | | 6.5 | | $ | 28,935 | |
| Options exercisable as of December 30, 2023 | 408 | | | $ | 205.50 | | | 4.8 | | $ | 20,521 | |
| Options expected to vest as of December 30, 2023 | 381 | | | $ | 233.37 | | | 8.3 | | $ | 8,414 | |
The fair value of stock options granted was estimated using the Black-Scholes option-pricing model with the following weighted-average assumptions:
| | Fiscal Year |
| 2020 | | 2019 | | 2018 |
| Fiscal Year | | | Fiscal Year |
| 2023 | | | 2023 | | 2022 | | 2021 |
| Expected life (in years) | Expected life (in years) | 6.0 | | 3.6 | | 3.7 | Expected life (in years) | 6.0 | | 6.0 |
| Expected volatility | Expected volatility | 30 | % | | 27 | % | | 25 | % | Expected volatility | 36 | % | | 33 | % | | 32 | % |
| Risk-free interest rate | Risk-free interest rate | 0.4 | % | | 2.4 | % | | 2.4 | % | Risk-free interest rate | 3.8 | % | | 2.7 | % | | 1.0 | % |
| Expected dividend yield | Expected dividend yield | 0 | % | | 0 | % | | 0 | % | Expected dividend yield | 0 | % | | 0 | % | | 0 | % |
The weighted-average grant date fair value of stock options granted was $53.37, $33.97$80.98, $90.05 and $24.80$108.61 for fiscal years 2020, 20192023, 2022 and 2018,2021, respectively.
As of December 26, 2020,30, 2023, the unrecognized compensation cost related to unvested stock options expected to vest was $19.2$18.5 million. This unrecognized compensation will be recognized over an estimated weighted-average amortization period of 2.32.4 years.
The total intrinsic value of options exercised during fiscal years 2020, 20192023, 2022 and 20182021 was $48.6$18.2 million, $27.0$33.2 million and $29.0$94.4 million, respectively, with intrinsic value defined as the difference between the market price on the date of exercise and the exercise price.
CHARLES RIVER LABORATORIES INTERNATIONAL, INC.
NOTES TO CONSOLIDATED FINANCIAL STATEMENTS (Continued)
Restricted Stock Units
The following table summarizes the restricted stock units activity for fiscal year 2020:2023:
| | Restricted Stock Units | | Weighted Average Grant Date Fair Value |
| (in thousands) | | |
| December 28, 2019 | 496 | | | $ | 116.07 | |
| Restricted Stock Units | | | Restricted Stock Units | | Weighted Average Grant Date Fair Value |
| (in thousands) | |
| December 31, 2022 | |
| December 31, 2022 | |
| December 31, 2022 | |
| Granted | Granted | 178 | | | $ | 182.10 | |
| Vested | Vested | (187) | | | $ | 106.94 | |
| Canceled | Canceled | (21) | | | $ | 136.15 | |
| December 26, 2020 | 466 | | | $ | 144.03 | |
| December 30, 2023 | |
As of December 26, 2020,30, 2023, the unrecognized compensation cost related to shares of unvested RSUs expected to vest was $39.9$65.8 million, which is expected to be recognized over an estimated weighted-average amortization period of 2.52.8 years. The total fairfair value of RSU grants that vested during fiscal years 2020, 20192023, 2022 and 20182021 was $20.0$28.4 million, $16.5$24.8 million and $15.5$22.8 million, respectively.
Performance Based Stock Award Program
The Company issues PSUs to certain corporate officers. The number of shares of common stock issued for each PSU is adjusted based on a performance condition linked to the Company’s financial performance. Certain awards are further adjusted based on a market condition, which is calculated based on the Company’s stock performance relative to a peer group over the three-year vesting period. The fair value of the market condition is reflected in the fair value of the award at grant date.
The Company utilizes a Monte Carlo simulation valuation model to value these awards. Information pertaining to the Company’s PSUs and the related estimated weighted-average assumptions used to calculate their fair value were as follows:
| | Fiscal Year |
| 2020 | | 2019 | | 2018 |
| (shares in thousands) |
| Fiscal Year | | | Fiscal Year |
| 2023 | | | 2023 | | 2022 | | 2021 |
| (shares in thousands) | | | (shares in thousands) |
| PSUs granted | PSUs granted | 98 | | | 160 | | | 200 | |
| Weighted average grant date fair value | Weighted average grant date fair value | $ | 209.67 | | | $ | 164.47 | | | $ | 117.89 | |
| Key assumptions: | Key assumptions: | |
| Expected volatility | Expected volatility | 35 | % | | 25 | % | | 26 | % |
| Expected volatility | |
| Expected volatility | | 37 | % | | 39 | % | | 37 | % |
| Risk-free interest rate | Risk-free interest rate | 0.2 | % | | 2.4 | % | | 2.4 | % | Risk-free interest rate | 4.2 | % | | 2.6 | % | | 0.2 | % |
| Expected dividend yield | Expected dividend yield | 0 | % | | 0 | % | | 0 | % | Expected dividend yield | 0 | % | | 0 | % | | 0 | % |
| Total shareholder return of 20-trading day average stock price on grant date | Total shareholder return of 20-trading day average stock price on grant date | 21.7 | % | | 17.7 | % | | 2.9 | % | Total shareholder return of 20-trading day average stock price on grant date | (9.8) | % | | (32.7) | % | | 39.9 | % |
The maximum number of common shares to be issued upon vesting of PSUs is 0.20.3 million. For fiscal years 2020, 20192023, 2022 and 2018,2021, the Company recognized stock-based compensation related to PSUs of $22.7$28.1 million, $25.3$31.2 million and $20.4$31.8 million, respectively. The total fair value of PSUs that vested during fiscal years 2020, 20192023, 2022 and 20182021 was $20.9$34.4 million, $20.2$31.0 million and $18.3$26.0 million, respectively.
In fiscal years 2020, 2019 and 2018,year 2021, the Company also issued approximately 9,000, 15,000 and 17,0005,000 PSUs using a weighted-average grant date fair value per share of $179.66, $144.67 and $109.34, respectively.$477.52. These PSUs vest upon the achievement of financial targets and other performance measures.
CHARLES RIVER LABORATORIES INTERNATIONAL, INC.
NOTES TO CONSOLIDATED FINANCIAL STATEMENTS (Continued)
14. FOREIGN CURRENCY CONTRACTS
Cross currency loans
The Company periodically entered into foreign exchange forward contracts during fiscal 2020 and 2019 to limit its foreign currency exposure related U.S. dollar denominated loans borrowed by a non-U.S. Euro functional currency entity under the Company’s Credit Facility. These contracts are not designated as hedging instruments. Any gains or losses on these forward contracts are recognized immediately within Interest expense in the consolidated statements of income. The Company had no such open forward contracts as of December 26, 2020 or December 28, 2019.
The following table summarizes the effect of the foreign exchange forward contracts entered into to limit the Company’s foreign currency exposure related to U.S. dollar denominated loans borrowed by a non-U.S. Euro functional currency entity under the Credit Facility on the Company’s consolidated statements of income:
| | | | | | | | | | | | | | | | | | | | | | | | | | | | | | | | | | | | | | |
| | Fiscal Year |
| | 2020 | 2019 | | 2018 |
| Location of gain (loss) | | Financial statement caption amount | | Amount of gain (loss) | | Financial statement caption amount | | Amount of gain (loss) | | Financial statement caption amount | | Amount of gain (loss) |
| | (in thousands) |
| Interest expense | | $ | 86,433 | | | $ | (9,325) | | | $ | 60,882 | | | $ | 18,672 | | | $ | 63,772 | | | $ | 1,486 | |
Intercompany loans
The Company periodically enters into foreign exchange forward contracts to limit its foreign currency exposure related to certain intercompany loans. These contracts are not designated as hedging instruments. Any gains or losses on forward contracts associated with intercompany loans are recognized immediately in Other income, net and are largely offset by the remeasurement of the underlying intercompany loans.
The Company entered into foreign currency forward contracts during fiscal years 2020 and 2019. The Company did 0t have any such open contracts as of December 26, 2020 and 1 contract remained open at December 28, 2019, which had a duration of less than one month and was recorded at fair value in the Company’s accompanying consolidated balance sheet. The notional amount and fair value of the open contract is summarized as follows:
| | | | | | | | | | | | | | |
| December 28, 2019 |
| Notional Amount | | Fair Value | | Balance Sheet Location |
| (in thousands) | | |
| $ | 115,038 | | | $ | (876) | | | Other current liabilities |
The following table summarizes the effect of the foreign exchange forward contracts in connection with certain intercompany loans on the Company’s consolidated statements of income:
| | | | | | | | | | | | | | | | | | | | | | | | | | |
| | Fiscal Year |
| | 2020 | | 2019 |
| Location of gain (loss) | | Financial statement caption amount | | Amount of gain (loss) | | Financial statement caption amount | | Amount of gain (loss) |
| | (in thousands) |
| Other income, net | | $ | 99,984 | | | $ | (892) | | | $ | 12,293 | | | $ | (121) | |
15.16. RESTRUCTURING AND ASSET IMPAIRMENTS
Global Restructuring Initiatives
In recent fiscal years, theThe Company has undertaken productivity improvement initiatives within allrestructuring actions impacting the reportable segments at various locations across the U.S., Canada,North America, Europe China, and Japan.Asia. This includes workforce right-sizing and scalability initiatives,actions resulting in severance and transition costs; and costcosts related to the consolidation of facilities resulting in asset impairment and accelerated depreciation charges. The Company does not have any significant remaining lease obligations for facilities associated with restructuring activities.
CHARLES RIVER LABORATORIES INTERNATIONAL, INC.
NOTES TO CONSOLIDATED FINANCIAL STATEMENTS (Continued)
The following table presents a summary of restructuring costs related to these initiatives by classification within the consolidated statements of income:reportable segment:
| | | | | | | | | | | | | | | | | |
| Severance and Transition Costs | | Asset Impairments and Other Costs | | Total |
| (in thousands) |
| December 26, 2020 | | | | | |
| Cost of services provided and products sold (excluding amortization of intangible assets) | $ | 4,453 | | | $ | 920 | | | $ | 5,373 | |
| Selling, general and administrative | 3,137 | | | 4,084 | | | 7,221 | |
| Total | $ | 7,590 | | | $ | 5,004 | | | $ | 12,594 | |
| December 28, 2019 | | | | | |
| Cost of services provided and products sold (excluding amortization of intangible assets) | $ | 4,348 | | | $ | 2,367 | | | $ | 6,715 | |
| Selling, general and administrative | 7,106 | | | 18 | | | 7,124 | |
| Total | $ | 11,454 | | | $ | 2,385 | | | $ | 13,839 | |
| December 29, 2018 | | | | | |
| Cost of services provided and products sold (excluding amortization of intangible assets) | $ | 1,770 | | | $ | 849 | | | $ | 2,619 | |
| Selling, general and administrative | 6,911 | | | 21 | | | 6,932 | |
| Total | $ | 8,681 | | | $ | 870 | | | $ | 9,551 | |
| | | | | | | | | | | | | | | | | |
| Fiscal Year |
| 2023 | | 2022 | | 2021 |
| (in thousands) |
| RMS | $ | 3,479 | | | $ | 1,007 | | | $ | 7 | |
| DSA | 16,176 | | | 851 | | | 3,114 | |
| Manufacturing | 9,138 | | | 5,126 | | | 3,663 | |
| Unallocated corporate | 889 | | | 1,229 | | | 72 | |
| Total | $ | 29,682 | | | $ | 8,213 | | | $ | 6,856 | |
The following table presents restructuring costs by reportable segmentas included within the Company’s consolidated statements of income for these productivity improvement initiatives:fiscal years 2023, 2022 and 2021:
| | | | | | | | | | | | | | | | | |
| Fiscal Year |
| 2020 | | 2019 | | 2018 |
| (in thousands) |
| RMS | $ | 845 | | | $ | 3,110 | | | $ | 1,983 | |
| DSA | 8,605 | | | 7,307 | | | 1,063 | |
| Manufacturing | 2,733 | | | 3,032 | | | 1,227 | |
| Unallocated corporate | 411 | | | 390 | | | 5,278 | |
| Total | $ | 12,594 | | | $ | 13,839 | | | $ | 9,551 | |
| | | | | | | | | | | | | | | | | |
| Fiscal Year |
| 2023 |
| Severance and Transition Costs | | Asset Impairments and Other Costs | | Total |
| (in thousands) |
| Twelve Months Ended | | | | | |
| Cost of services provided (excluding amortization of intangible assets) | $ | 7,408 | | | $ | 14,812 | | | $ | 22,220 | |
| Cost of products sold (excluding amortization of intangible assets) | 1,146 | | | 3,262 | | | 4,408 | |
| Selling, general and administrative | 3,054 | | | — | | | 3,054 | |
| Total restructuring costs | $ | 11,608 | | | $ | 18,074 | | | $ | 29,682 | |
| | | | | | | | | | | | | | | | | |
| Fiscal Year |
| 2022 |
| Severance and Transition Costs | | Asset Impairments and Other Costs | | Total |
| (in thousands) |
| Twelve Months Ended | | | | | |
| Cost of services provided (excluding amortization of intangible assets) | $ | 928 | | | $ | 1,784 | | | $ | 2,712 | |
| Cost of products sold (excluding amortization of intangible assets) | 532 | | | 1,765 | | | 2,297 | |
| Selling, general and administrative | 2,441 | | | 763 | | | 3,204 | |
| Total restructuring costs | $ | 3,901 | | | $ | 4,312 | | | $ | 8,213 | |
| | | | | | | | | | | | | | | | | |
| Fiscal Year |
| 2021 |
| Severance and Transition Costs | | Asset Impairments and Other Costs | | Total |
| (in thousands) |
| Twelve Months Ended | | | | | |
| Cost of services provided (excluding amortization of intangible assets) | $ | 1,898 | | | $ | 934 | | | $ | 2,832 | |
| Cost of products sold (excluding amortization of intangible assets) | — | | | — | | | — | |
| Selling, general and administrative | 2,819 | | | 1,205 | | | 4,024 | |
| Total restructuring costs | $ | 4,717 | | | $ | 2,139 | | | $ | 6,856 | |
CHARLES RIVER LABORATORIES INTERNATIONAL, INC.
NOTES TO CONSOLIDATED FINANCIAL STATEMENTS (Continued)
Rollforward of restructuring activitiesRestructuring Activities
The following table provides a rollforward for all of the Company’s severance and transition costs related to all restructuring activities:
| | Fiscal Year |
| 2020 | | 2019 | | 2018 |
| (in thousands) |
| Fiscal Year | | | Fiscal Year |
| 2023 | | | 2023 | | 2022 | | 2021 |
| (in thousands) | | | (in thousands) |
| Beginning balance | Beginning balance | $ | 6,406 | | | $ | 2,921 | | | $ | 6,856 | |
| Expense (excluding non-cash charges) | Expense (excluding non-cash charges) | 9,284 | | | 12,674 | | | 8,681 | |
| Payments / utilization | Payments / utilization | (9,918) | | | (9,206) | | | (12,341) | |
| Other non-cash adjustments | |
| Foreign currency adjustments | Foreign currency adjustments | 46 | | | 17 | | | (275) | |
| Ending balance | Ending balance | $ | 5,818 | | | $ | 6,406 | | | $ | 2,921 | |
As of December 26, 202030, 2023 and December 28, 2019, $5.831, 2022, $5.1 million and $6.3$1.3 million, respectively, of severance and other personnel related costs liabilities and lease obligation liabilities were included in accrued compensation and accrued liabilities within the Company’s consolidated balance sheets. As of December 28, 2019, $0.1 million, respectively, were included in other long-term liabilities within the Company's consolidated balance sheets.
16.17. LEASES
CHARLES RIVER LABORATORIES INTERNATIONAL, INC.
NOTES TO CONSOLIDATED FINANCIAL STATEMENTS (Continued)
Operating and Finance Leases
Right-of-use lease assets and lease liabilities are reported in the Company’s consolidated balance sheets as follows:
| | Fiscal Year |
| December 26, 2020 | | December 28, 2019 |
| (in thousands) |
| December 30, 2023 | |
| December 30, 2023 | |
| December 30, 2023 | |
| (in thousands) | |
| (in thousands) | |
| (in thousands) | |
| Operating leases | Operating leases | |
| Operating leases | |
| Operating leases | |
| Operating lease right-of-use assets, net | |
| Operating lease right-of-use assets, net | |
| Operating lease right-of-use assets, net | Operating lease right-of-use assets, net | $ | 178,220 | | | $ | 140,085 | |
| | Other current liabilities | Other current liabilities | $ | 24,674 | | | $ | 20,357 | |
| | Other current liabilities | |
| | Other current liabilities | |
| Operating lease right-of-use liabilities | Operating lease right-of-use liabilities | 155,595 | | | 116,252 | |
| Operating lease right-of-use liabilities | |
| Operating lease right-of-use liabilities | |
| Total operating lease liabilities | |
| Total operating lease liabilities | |
| Total operating lease liabilities | Total operating lease liabilities | $ | 180,269 | | | $ | 136,609 | |
| | Finance leases | Finance leases | |
| | Finance leases | |
| | Finance leases | |
| Property, plant and equipment, net | |
| Property, plant and equipment, net | |
| Property, plant and equipment, net | Property, plant and equipment, net | $ | 31,614 | | | $ | 32,519 | |
| | Current portion of long-term debt and finance leases | Current portion of long-term debt and finance leases | $ | 3,018 | | | $ | 2,997 | |
| | Current portion of long-term debt and finance leases | |
| | Current portion of long-term debt and finance leases | |
| Long-term debt, net and finance leases | |
| Long-term debt, net and finance leases | |
| Long-term debt, net and finance leases | Long-term debt, net and finance leases | 26,029 | | | 27,530 | |
| Total finance lease liabilities | Total finance lease liabilities | $ | 29,047 | | | $ | 30,527 | |
| Total finance lease liabilities | |
| Total finance lease liabilities | |
The following table presents the components of operating and finance lease costs were as follows:within the Company’s consolidated statements of income for fiscal years 2023, 2022 and 2021:
| | | | | | | | | | | |
| Fiscal Year |
| December 26, 2020 | | December 28, 2019 |
| (in thousands) |
| Operating lease costs | $ | 32,965 | | | $ | 30,885 | |
| Finance lease costs: | | | |
| Amortization of right-of-use assets | 3,723 | | | 4,007 | |
| Interest on lease liabilities | 1,306 | | | 1,349 | |
| Short-term lease costs | 2,349 | | | 1,056 | |
| Variable lease costs | 5,122 | | | 3,161 | |
| Sublease income | (1,673) | | | (994) | |
| Total lease costs | $ | 43,792 | | | $ | 39,464 | |
Other information related to leases was as follows:
Supplemental cash flow information
| | | | | | | | | | | |
| Fiscal Year |
| December 26, 2020 | | December 28, 2019 |
| (in thousands) |
| Cash flows included in the measurement of lease liabilities: | | | |
| Operating cash flows from operating leases | $ | 29,961 | | | $ | 27,153 | |
| Operating cash flows from finance leases | 1,306 | | | 1,406 | |
| Finance cash flows from finance leases | 4,350 | | | 3,766 | |
| | | |
| Non-cash leases activity: | | | |
| Right-of-use lease assets obtained in exchange for new operating lease liabilities | $ | 63,499 | | | $ | 24,382 | |
| Right-of-use lease assets obtained in exchange for new finance lease liabilities | 1,571 | | | 4,819 | |
Lease term and discount rate | | | | | | | | | | | | | | | | | | | | | |
| | | | | Fiscal Year |
| | | | | 2023 | | 2022 | | 2021 |
| | | | | (in thousands) |
| Operating lease costs | | | | | $ | 65,380 | | | $ | 59,671 | | | $ | 45,728 | |
| Finance lease costs: | | | | | | | | | |
| Amortization of right-of-use assets | | | | | 2,745 | | | 3,035 | | | 3,337 | |
| Interest on lease liabilities | | | | | 1,477 | | | 1,441 | | | 1,280 | |
| Short-term lease costs | | | | | 3,581 | | | 2,954 | | | 2,441 | |
| Variable lease costs | | | | | 22,159 | | | 13,965 | | | 4,623 | |
| Sublease income | | | | | (2,067) | | | (1,912) | | | (2,008) | |
| Total lease costs | | | | | $ | 93,275 | | | $ | 79,154 | | | $ | 55,401 | |
CHARLES RIVER LABORATORIES INTERNATIONAL, INC.
NOTES TO CONSOLIDATED FINANCIAL STATEMENTS (Continued)
| | | | | | | | |
| As of | As of |
| December 26, 2020 | December 28, 2019 |
| Weighted-average remaining lease term (in years) | | |
| Operating lease | 8.5 | 8.2 |
| Finance lease | 12.4 | 13.0 |
| Weighted-average discount rate | | |
| Operating lease | 4.5 | % | 4.4 | % |
| Finance lease | 4.1 | % | 4.6 | % |
Supplemental cash flow information
| | | | | | | | | | | | | | | | | |
| Fiscal Year |
| 2023 | | 2022 | | 2021 |
| (in thousands) |
| Cash flows included in the measurement of lease liabilities: | | | | | |
| Operating cash flows from operating leases | $ | 60,239 | | | $ | 48,360 | | | $ | 42,576 | |
| Operating cash flows from finance leases | 1,476 | | | 1,442 | | | 1,282 | |
| Finance cash flows from finance leases | 2,297 | | | 2,257 | | | 3,202 | |
| | | | | |
| Non-cash leases activity: | | | | | |
| Right-of-use lease assets obtained in exchange for new operating lease liabilities | $ | 75,987 | | | $ | 189,134 | | | $ | 142,764 | |
| Right-of-use lease assets obtained in exchange for new finance lease liabilities | — | | | 8,179 | | | 1,567 | |
Lease term and discount rate
| | | | | | | | | | | | | | | | | | | | |
| | | | | | |
| | December 30, 2023 | | December 31, 2022 | | December 25, 2021 |
| Weighted-average remaining lease term (in years) | | | | | | |
| Operating lease | | 9.6 | | 9.8 | | 9.0 |
| Finance lease | | 12.7 | | 13.6 | | 11.7 |
| Weighted-average discount rate | | | | | | |
| Operating lease | | 4.7 | % | | 4.3 | % | | 3.6 | % |
| Finance lease | | 5.3 | % | | 5.3 | % | | 4.4 | % |
At the lease commencement date, the discount rate implicit in the lease is used to discount the lease liability if readily determinable. If not readily determinable or leases do not contain an implicit rate, the Company’s incremental borrowing rate is used as the discount rate, which is based on the information available at the lease commencement date and represents a rate that would be incurred to borrow, on a collateralized basis, over a similar term, an amount equal to the lease payments in a similar economic environment.
As of December 26, 2020,30, 2023, maturities of operating and finance lease liabilities for each of the following five years and a total thereafter were as follows:
| | Operating Leases | | Finance Leases |
| (in thousands) |
| 2021 | $ | 31,326 | | | $ | 4,242 | |
| 2022 | 27,803 | | | 3,673 | |
| 2023 | 25,014 | | | 3,348 | |
| | Operating Leases | | | | Operating Leases | | Finance Leases |
| | (in thousands) | | | | (in thousands) |
| 2024 | 2024 | 24,244 | | | 3,118 | |
| 2025 | 2025 | 21,792 | | | 2,841 | |
| 2026 | |
| 2027 | |
| 2028 | |
| Thereafter | Thereafter | 85,249 | | | 20,906 | |
| Total minimum future lease payments | Total minimum future lease payments | 215,428 | | | 38,128 | |
| Less: Imputed interest | Less: Imputed interest | 35,159 | | | 9,081 | |
| Total lease liabilities | Total lease liabilities | $ | 180,269 | | | $ | 29,047 | |
Total minimum future lease payments (predominantly operating leases) of approximately $130$161 million for leases that have not commenced as of December 26, 2020,30, 2023, as the Company does not yet control the underlying assets, are not included in the consolidated financial statements. These leases are expected to commence between fiscal years 20212024 and 20242025 with lease terms of approximately 85 to 15 years.
17.
CHARLES RIVER LABORATORIES INTERNATIONAL, INC.
NOTES TO CONSOLIDATED FINANCIAL STATEMENTS (Continued)
18. COMMITMENTS AND CONTINGENCIES
Insurance
The Company maintains certain insurance policies that maintain large deductibles up to approximately $1.5$2 million, some with or without stop-loss limits, depending on market availability. Insurance policies at certain locations are based on a percentage of the insured assets, for which deductibles for certain property may exceed $5.0$22.0 million in the event of a catastrophic event. In addition, the Company purchased representation and warranty insurance in support of some acquisitions, in which deductibles could reach $8.0$4.0 million.
Litigation
Various lawsuits, claimsOn February 16, 2023, the Company was informed by the U.S. Department of Justice (DOJ) that in conjunction with the U.S. Fish and proceedingsWildlife Service (USFWS), it had commenced an investigation into the Company’s conduct regarding several shipments of non-human primates from Cambodia. On February 17, 2023 the Company received a grand jury subpoena requesting certain documents related to such investigation. The Company is aware of a nature considered normalparallel civil investigation being undertaken by the DOJ and USFWS. The Company is cooperating with the DOJ and the USFWS and believes that the concerns raised with respect to the Company’s conduct are without merit. The Company maintains a global supplier onboarding and oversight program incorporating risk-based due diligence, auditing, and monitoring practices to help ensure the quality of our supplier relationships and compliance with applicable U.S. and international laws and regulations, and has operated under the belief that all shipments of non-human primates it received satisfied the material requirements, documentation and related processes and procedures of the Convention on International Trade in Endangered Species of Wild Fauna and Flora (CITES) documentation and related processes and procedures, which guides the release of each import by USFWS. Notwithstanding our efforts and good-faith belief, in connection with the civil investigation, the Company has voluntarily suspended future shipments of non-human primates from Cambodia to the United States until such time that the Company and USFWS can agree upon and implement additional procedures to reasonably ensure that non-human primates imported from Cambodia are purpose-bred. The Company continues to care for the Cambodia-sourced non-human primates from certain recent shipments in the United States. The carrying value of the inventory related to these shipments is approximately $27 million as of December 30, 2023, which reflects the value of the shipments in accordance with the Company’s inventory accounting policy. On May 16, 2023, the Company received an inquiry from the Enforcement Division of the U.S. Securities and Exchange Commission (SEC) requesting it to voluntarily provide information, subsequently augmented with a document subpoena, primarily related to the sourcing of non-human primates, and the Company is cooperating with the request. We are not able to predict what action, if any, might be taken in the future by the DOJ, USFWS, SEC or other governmental authorities as a result of the investigations. None of the DOJ, USFWS or SEC has provided the Company with any specific timeline or indication as to when these investigations or, specific to the DOJ and USFWS, discussions regarding future processes and procedures, will be concluded or resolved. The Company cannot predict the timing, outcome or possible impact of the investigations, including without limitation any potential fines, penalties or liabilities.
A putative securities class action was filed on May 19, 2023 against the Company and a number of its businesscurrent/former officersin the United States District Court for the District of Massachusetts. On August 31, 2023, the court appointed the State Teachers Retirement System of Ohio as lead plaintiff. An amended complaint was filed on November 14, 2023 that, among other things, included only James Foster, the Chief Executive Officer and David R. Smith, the former Chief Financial Officer as defendants along with the Company. The amended complaint asserts claims under §§ 10(b) and 20(a) of the Securities Exchange Act of 1934 (the Exchange Act) on behalf of a putative class of purchasers of Company securities from May 5, 2020 through February 21, 2023, alleging that certain of the Company’s disclosures about its practices with respect to the importation of non-human primates made during the putative class period were materially false or misleading. The Company filed a motion to dismiss. While the Company cannot predict the outcome of this matter, it believes the class action to be without merit and plans to vigorously defend against it. The Company cannot reasonably estimate the maximum potential exposure or the range of possible loss in association with this matter.
On November 8, 2023, a stockholder filed a derivative lawsuit in the U.S. District Court of the District of Delaware asserting claims on the Company’s behalf against the members of the Company’s Board of Directors and certain of the Company’s current/former officers (James Foster, the Chief Executive Officer; David R. Smith, the former Chief Financial Officer; and Flavia Pease, the current Chief Financial Officer). The complaint alleges that the defendants breached their fiduciary duties to the Company and its stockholders because certain of the Company’s disclosures about its practices with respect to the importation of non-human primates were materially false or misleading. The complaint also alleges that the defendants breached their fiduciary duties by causing the Company to fail to maintain adequate internal controls over securities disclosure and compliance with applicable law and by failing to comply with the company’s Code of Business Conduct and Ethics. The Company intends to file a motion to dismiss. While the Company cannot predict the outcome of this matter, it believes the derivative lawsuit to be without merit and plans to vigorously defend against it. The Company cannot reasonably estimate the maximum potential exposure or the range of possible loss in association with this matter.
CHARLES RIVER LABORATORIES INTERNATIONAL, INC.
NOTES TO CONSOLIDATED FINANCIAL STATEMENTS (Continued)
Aside from the matter above, the Company believes there are no other matters pending against the Company. While the outcome of any of these proceedings cannot be accurately predicted, the Company does not believe the ultimate resolution of any of these existing matters wouldthat could have a material adverse effectimpact on the Company’s business, financial condition, or financial condition.results of operations.
Guarantees
The Company enters into certain agreements with other parties in the ordinary course of business that contain indemnification provisions. These typically include agreements with directors and officers, business partners, contractors, landlords, and customers. Under these provisions, the Company generally indemnifies and holds harmless the indemnified party for losses suffered or incurred by the indemnified party as a result of the Company’s activities. These indemnification provisions generally survive termination of the underlying agreement. The maximum potential amount of future payments the Company
CHARLES RIVER LABORATORIES INTERNATIONAL, INC.
NOTES TO CONSOLIDATED FINANCIAL STATEMENTS (Continued)
could be required to make under these indemnification provisions is unlimited. However, to date the Company has not incurred material costs to defend lawsuits or settle claims related to these indemnification provisions. As a result, the estimated fair value of these obligations is minimal.
Purchase Obligations
The Company enters into unconditional purchase obligations, in the ordinary course of business, that include agreements to purchase goods or services that are enforceable and legally binding and that specify all significant terms including: fixed or minimum quantities to be purchased; fixed, minimum or variable price provisions; and the approximate timing of the transaction. PurchaseThese unconditional purchase obligations exclude agreements that are cancellable at any time without penalty. The aggregate amount of the Company’s unconditional purchase obligations totaled $197.4approximately $390 million as of December 26, 202030, 2023 and isthe majority of these obligations are expected to be paid as follows:
| | | | | | | | | | | | | | | | | | | | | | | |
| Payments Due by Period |
| Less than
1 Year | | 1 - 3 Years | | 3 - 5 Years | | Total |
| (in thousands) |
Unconditional purchase obligations | $ | 166,078 | | | $ | 30,617 | | | $ | 673 | | | $ | 197,368 | |
18. SELECTED QUARTERLY FINANCIAL DATA (unaudited)
The following table contains quarterly financial information for fiscal years 2020 and 2019. The operating results for any quarter are not necessarily indicative of future period results.
| | | | | | | | | | | | | | | | | | | | | | | |
| First
Quarter | | Second
Quarter | | Third
Quarter | | Fourth
Quarter |
| (in thousands, except per share amounts) |
| Fiscal Year 2020 | |
| Total revenue | $ | 707,059 | | | $ | 682,584 | | | $ | 743,300 | | | $ | 790,990 | |
Gross profit (1) | 252,061 | | | 232,238 | | | 289,274 | | | 299,968 | |
| Operating income | 94,281 | | | 76,768 | | | 132,753 | | | 128,927 | |
| Net income attributable to common shareholders | 50,769 | | | 67,435 | | | 102,909 | | | 143,191 | |
| | | | | | | |
| Earnings per common share | | | | | | | |
| Net income attributable to common shareholders: | | | | | | | |
| Basic | $ | 1.03 | | | $ | 1.36 | | | $ | 2.07 | | | $ | 2.88 | |
| Diluted | $ | 1.02 | | | $ | 1.34 | | | $ | 2.03 | | | $ | 2.81 | |
| | | | | | | |
| Fiscal Year 2019 | | | | | | | |
| Total revenue | $ | 604,569 | | | $ | 657,568 | | | $ | 667,951 | | | $ | 691,138 | |
Gross profit (1) | 211,777 | | | 238,104 | | | 246,116 | | | 262,314 | |
| Operating income | 69,792 | | | 79,768 | | | 92,802 | | | 108,789 | |
| Net income attributable to common shareholders | 55,133 | | | 43,728 | | | 72,810 | | | 80,348 | |
| | | | | | | |
| Earnings per common share | | | | | | | |
| Net income attributable to common shareholders: | | | | | | | |
| Basic | $ | 1.14 | | | $ | 0.90 | | | $ | 1.49 | | | $ | 1.64 | |
| Diluted | $ | 1.11 | | | $ | 0.88 | | | $ | 1.46 | | | $ | 1.61 | |
(1) Gross profit is calculated as total revenue minus cost of revenue (excluding amortization of intangible assets). |
Full-year amounts may not sum due to rounding.settled during 2024.
CHARLES RIVER LABORATORIES INTERNATIONAL, INC.
NOTES TO CONSOLIDATED FINANCIAL STATEMENTS (Continued)
19. SUBSEQUENT EVENT
On February 17, 2021, the Company announced that it has signed a definitive agreement to acquire Cognate BioServices, Inc. for approximately $875 million in cash, subject to customary closing adjustments. Cognate BioServices, Inc. is a cell and gene therapy CDMO offering comprehensive manufacturing solutions for cell therapies, as well as for the development and production of plasmid DNA and viral vectors for gene therapies. The planned acquisition of Cognate BioServices, Inc. will create a scientific partner for cell and gene therapy development, testing, and manufacturing, providing clients with an integrated solution from basic research through cGMP production. The proposed transaction is expected to close by the end of the first quarter of 2021. The proposed acquisition and associated fees are expected to be financed through a combination of available cash and proceeds from the Company’s Credit Facility under the multi-currency revolving facility. This business is expected to be reported as part of the Company’s Manufacturing reportable segment.
Item 9. Changes in and Disagreements with Accountants on Accounting and Financial Disclosure
None.
Item 9A. Controls and Procedures
(a) Evaluation of Disclosure Controls and Procedures
Based on their evaluation, required by paragraph (b) of Rules 13a-15 or 15d-15, promulgated by the Securities Exchange Act of 1934, as amended (Exchange Act), the Company’s principal executive officer and principal financial officer have concluded that the Company’s disclosure controls and procedures, as defined in Rules 13a-15(e) and 15d-15(e) of the Exchange Act, are effective, at a reasonable assurance level, as of December 26, 2020,30, 2023, to ensure that information required to be disclosed by the Company in reports that it files or submits under the Exchange Act is recorded, processed, summarized, and reported within the time periods specified in Securities and Exchange Commission rules and forms. Disclosure controls and procedures include, without limitation, controls and procedures designed to ensure that information required to be disclosed by the Company in the reports that it files or submits under the Exchange Act is accumulated and communicated to the Company’s management, including its principal executive and principal financial officers, or persons performing similar functions, as appropriate to allow timely decisions regarding required disclosure. In designing and evaluating the disclosure controls and procedures, our management recognizes that any controls and procedures, no matter how well designed and operated, can provide only reasonable assurances of achieving the desired control objectives, and management necessarily was required to apply its judgment in designing and evaluating the controls and procedures.
(b) Management’s Report on Internal Control Over Financial Reporting
Our management is responsible for establishing and maintaining adequate internal control over financial reporting (as defined in Rules 13a-15(f) and 15d-15(f) under the Securities Exchange Act of 1934, as amended). Our internal control over financial reporting is a process designed to provide reasonable assurance regarding the reliability of financial reporting and the preparation of financial statements for external purposes in accordance with generally accepted accounting principles. Because of its inherent limitations, internal control over financial reporting may not prevent or detect misstatements. Also, projections of any evaluation of effectiveness to future periods are subject to the risk that controls may become inadequate because of changes in conditions, or that the degree of compliance with the policies or procedures may deteriorate.
Under the supervision and with the participation of our management, including our CEO and CFO, we conducted an evaluation of the effectiveness of our internal control over financial reporting based on the framework in Internal Control-Integrated Framework (2013) issued by the Committee of Sponsoring Organizations of the Treadway Commission. Based on our assessment and those criteria, management concluded that the Company maintained effective internal control over financial reporting as of December 26, 2020.30, 2023.
We have excluded the business acquisitions completed during fiscal year 2020, including HemaCare and Cellero, from theOur assessment of the effectiveness of our internal control over financial reporting as of December 26, 2020. Total30, 2023 excluded Noveprim, which was acquired by the Company in 2023. Noveprim, whose total assets and total revenue ofrevenues were excluded from the acquired businesses collectively represent 1.0% and 1.6%Company’s assessment, represented approximately less than 1%, respectively, of the related consolidated financial statement amounts as of and for the fiscal year ended December 26, 2020.30, 2023.
The effectiveness of our internal control over financial reporting as of December 26, 2020,30, 2023, has been audited by PricewaterhouseCoopers LLP, an Independent Registered Public Accounting Firm, as stated in their report which appears in Item 8, “Financial Statements and Supplementary Data” in this Annual Report on Form 10-K.
(c) Changes in Internal Controls Over Financial Reporting
During fiscal year 2020, the Company continued to execute a plan to centralize certain accounting transaction processing functions to internal shared service centers. There2023, there were no other material changes in the Company’s internal control over financial reporting identified in connection with the evaluation required by paragraph (d) of the Exchange Act Rules 13a-15 or 15d-15 that occurred during the fourth quarter of 20202023 that materially affected, or were reasonably likely to materially affect, the Company’s internal control over financial reporting.
Item 9B. Other Information
None.
CHARLES RIVER LABORATORIES INTERNATIONAL, INC.
Item 9B. Other Information
During the quarter ended December 30, 2023, none of our officers or directors adopted or terminated any contract, instruction, or written plan for the purchase or sale of our securities that was intended to satisfy the affirmative defense conditions of Rule 10b5-1(c) under the Exchange Act or any “non-Rule 10b5-1 trading arrangement” as defined in Item 408(c) of Regulation S-K., except as follows:
•On November 14, 2023, James Foster, our Chair, President, and Chief Executive Officer, terminated a Rule 10b5-1 trading arrangement, dated February 23, 2023 for the sale of up to 112,341 shares of common stock. Mr. Foster did not sell any shares pursuant to such plan, which, absent such termination, would have expired on March 1, 2025.
•On November 15, 2023, Birgit Girshick, our Corporate Executive Vice President & Chief Operating Officer, terminated a Rule 10b5-1 trading arrangement, dated February 24, 2023 for the sale of up to 25,320 shares of common stock. Ms. Girshick did not sell any shares pursuant to such plan, which, absent such termination, would have expired on February 28, 2024.
•On November 22, 2023, Ms. Girshick entered into a Rule 10b5-1 trading arrangement for the sale of up to 22,362 shares of common stock, subject to certain conditions. The arrangement’s expiration date is February 28, 2025.
During the quarter ended December 30, 2023, the Company did not adopt or terminate any “Rule 10b5-1 trading arrangement” as defined in Item 408(a) of Regulation S-K.
Item 9C. Disclosure Regarding Foreign Jurisdictions that Prevent Inspections
Not applicable.
CHARLES RIVER LABORATORIES INTERNATIONAL, INC.
PART III
Item 10. Directors, Executive Officers and Corporate Governance
A. Directors and Compliance with Section 16(a) of the Exchange Act
Any information required by this Item regarding our directors and compliance with Section 16(a) of the Exchange Act by our officers and directors will be included in the 20212024 Proxy Statement under the sections captioned “Nominees for Directors” and “Delinquent Section 16(a) Reports” and is incorporated herein by reference thereto. The information required by this Item regarding our corporate governance will be included in the 20212024 Proxy Statement under the section captioned “Corporate Governance” and is incorporated herein by reference thereto.
B. Our Executive Officers
The information required by this Item regarding our executive officers is reported in Part I of this Form 10-K under the heading “Item 1. Business”
C. Audit Committee Financial Expert
The information required by this Item regarding the audit committee of the Board of Directors and financial experts will be included in the 20212024 Proxy Statement under the section captioned “The Board of Directors and its Committees-Audit Committee and Financial Experts” and is incorporated herein by reference thereto.
D. Insider Trading Policy
We have adopted an Insider Trading Policy governing the purchase, sale, and/or other dispositions of our securities by directors, officers, and employees of the Company. The Insider Trading Policy is designed to promote compliance with insider trading laws, rules, and regulations and any applicable listing standards. Our Insider Trading Policy is posted on our website and can be accessed by selecting the “Corporate Governance” link at http://ir.criver.com.
E. Code of Ethics
We have adopted a Code of Business Conduct and Ethics that applies to all of our employees and directors, including our principal executive officer, principal financial officer, principal accounting officer, controller, or persons performing similar functions. Our Code of Business Conduct and Ethics is posted on our website and can be accessed by selecting the “Corporate Governance” link at http://ir.criver.com. We will provide to any person, without charge, a copy of our Code of Business Conduct and Ethics. To obtain a copy, please mail a request to the Corporate Secretary, Charles River Laboratories International, Inc., 251 Ballardvale Street, Wilmington, MA 01887. Information on our website is not incorporated by reference in this annual report.
E.F. Changes to Board Nomination Procedures
SinceIn December 2008, there have been no material changes2021, we amended our By-laws to include a proxy access by-law. Under our proxy access by-law, if a stockholder (or a group of up to 20 stockholders) who has owned at least 3% of our shares for at least three years and has complied with the other requirements set forth in our By-laws wants us to include director nominees (up to the procedures by which security holders may recommendgreater of two nominees or 20% of the Board) in our proxy statement for an upcoming Annual Meeting, the nominations must be received in a timely manner, between 120 and 150 days prior to the anniversary of the date our Board of Directors.proxy statement was first sent to stockholders in connection with the prior year’ annual meeting.
Item 11. Executive Compensation
A. Policies and Practices for Granting Certain Equity Awards.
The Compensation Committee of the Board of Directors is responsible for the review and approval of our policies and practices with respect to granting equity awards. The Compensation Committee typically targets the second quarter of our fiscal year, shortly after our annual meeting of shareholders and the release of our first quarter financial results, for granting annual stock awards to eligible recipients, absent an extraordinary event. The Compensation Committee believes this aligns timing of equity grants with the planning of annual salary increases (also in the second quarter of our fiscal year), allowing our managers to take a holistic view of total compensation.
The Compensation Committee seeks to structure equity grants so that they are awarded during an open window period as designated by our Insider Trading Policy, or, if Compensation Committee approval is provided during a non-window period, are typically made effective on the first business day following our press release with respect to financial results for the prior quarter. This policy is intended to ensure that options are awarded at a time when the exercise price fully reflects all recently disclosed information. In the case of new hires eligible to receive equity grants, grants are generally made on the first business day of the month following the date the individual commences employment.
CHARLES RIVER LABORATORIES INTERNATIONAL, INC.
All grants to executive officers are made by the Compensation Committee itself and not pursuant to any delegated authority.
We have never had any programs, policies, or practices which are intended to time stock option grants with the release of material, non-public information in a manner that would provide advantageous option exercise prices to grant recipients. Option exercise prices are, in all cases, equal to the closing price of our common stock on the date of grant.
B. Actions to Recover Erroneously Awarded Compensation
At no point during or after the last completed fiscal year did we prepare an accounting statement that required the recovery of erroneously awarded compensation pursuant to the company’s clawback policy, nor was there an outstanding balance as of the end of the last completed fiscal year of erroneously awarded compensation to be recovered from the application of the policy to a prior restatement.
The remainder of the information required by this Item will be included in the 20212024 Proxy Statement under the sections captioned “2020“2023 Director Compensation,” “Compensation Discussion and Analysis,” “Executive Compensation and Related Information,” “Compensation Committee Interlocks and Insider Participation” and “Report of Compensation Committee,” and is incorporated herein by reference thereto.
Item 12. Security Ownership of Certain Beneficial Owners and Management and Related Stockholder Matters
The information required by this Item will be included in the 20212024 Proxy Statement under the sections captioned “Beneficial Ownership of Securities” and “Equity Compensation Plan Information” and is incorporated herein by reference thereto.
Item 13. Certain Relationships and Related Transactions, and Director Independence
The information required by this Item will be included in the 20212024 Proxy Statement under the sections captioned “Related Person Transaction Policy” and “Corporate Governance-Director Qualification Standards; Director Independence” and is incorporated herein by reference thereto.
Item 14. Principal Accountant Fees and Services
The information required by this Item will be included in the 20212024 Proxy Statement under the section captioned “Statement of Fees Paid to Independent Registered Public Accounting Firm” and is incorporated herein by reference thereto.
CHARLES RIVER LABORATORIES INTERNATIONAL, INC.
PART IV
Item 15. Exhibits and Financial Statement Schedules
Item 15(a)(1) and (2) Financial Statements and Schedules
See "Index to Consolidated Financial Statements and Financial Statements Schedules" at Item 8 to this Annual Report on Form 10-K. Other financial statement schedules have not been included because they are not applicable or the information is included in the financial statements or notes thereto.
Item 15(a)(3) and Item 15(b) Exhibits
The exhibits filed as part of this Annual Report on Form 10-K are listed in the Exhibit Index immediately preceding the exhibits. We have identified in the Exhibit Indexbelow each management contract and compensation plan filed as an exhibit to this Annual Report on Form 10-K in response to Item 15(c) of Form 10-K.
| | | | | | | | | | | | | | | | | |
| Exhibit No. | Description | Filed with this Form 10-K | Incorporation by Reference |
| Form | Filing Date | Exhibit No. |
| 3.1 | | | S-1/A | June 23, 2000 | 3.1 |
| 3.2 | | | 8-K | December 15, 2021 | 3.1 |
| 4.1 | | | S-1/A | June 23, 2000 | 4.1 |
| 4.2 | | | 10-K | February 11, 2020 | 4.2 |
| 4.3 | | | 10-Q | August 5, 2020 | 10.3 |
| 4.4 | | | 8-K | April 3, 2018 | 4.1 |
| 4.5 | | | 8-K | October 23, 2019 | 4.1 |
| 4.6 | | | 8-K | October 23, 2019 | 4.2 |
| 4.7 | | | 8-K | March 23, 2021 | 4.1 |
| 4.8 | | | 8-K | March 23, 2021 | 4.2 |
| 4.9 | | | 8-K | March 23, 2021 | 4.3 |
| 4.10 | | | 8-K | March 23, 2021 | 4.4 |
| 4.11 | | | S-3 | May 4, 2021 | 4.1 |
| 4.12 | | | S-3 | May 4, 2021 | 4.2 |
| 10.1* | | | 10-Q | August 3, 2016 | 10.1 |
| 10.2* | | X | | | |
| 10.3* | | | 10-K | February 14, 2017 | 10.4 |
| 10.4* | | | 10-K | February 14, 2017 | 10.7 |
| 10.5* | | | 10-Q | August 5, 2020 | 10.1 |
| 10.6* | | X | | | |
| 10.7* | | | 10-Q | August 3, 2010 | 10.1 |
| 10.8* | | | 10-K | February 23, 2009 | 10.7 |
CHARLES RIVER LABORATORIES INTERNATIONAL, INC.
| | | | | | | | | | | | | | | | | |
| Exhibit No. | Description | Filed with this Form 10-K | Incorporation by Reference |
| Form | Filing Date | Exhibit No. |
| 10.9* | | | 10-Q | May 4, 2016 | 10.1 |
| 10.10* | | | 10-K | March 9, 2005 | 10.23 |
| 10.11* | | | 8-K | May 18, 2021 | 99.1 |
| 10.12* | | | 10-Q | May 4, 2021 | 10.2 |
| 10.13* | | | 10-Q | May 4, 2021 | 10.3 |
| 10.14 | Ninth Amended and Restated Credit Agreement, dated as of April 21, 2021, among Charles River Laboratories International, Inc., the Subsidiary Borrowers party thereto, the lenders party thereto, JPMorgan Chase Bank, N.A., as administrative agent, and the other agents party thereto | | 8-K | April 23, 2021 | 10.1 |
| 10.15* | | | 8-K | December 27, 2021 | 10.1 |
| 10.16* | | | 8-K | December 27, 2021 | 10.2 |
| 10.17*† | | | 10-Q | May 4, 2022 | 10.1 |
| 19 | | X | | | |
| 21.1 | | X | | | |
| 23.1 | | X | | | |
| 31.1 | | X | | | |
| 31.2 | | X | | | |
| 32.1 | | X | | | |
| 97 | | X | | | |
| 101.INS | eXtensible Business Reporting Language (XBRL) Instance Document | X | | | |
| 101.SCH | Inline XBRL Taxonomy Extension Schema | X | | | |
| 101.CAL | Inline XBRL Taxonomy Extension Calculation Linkbase | X | | | |
| 101.DEF | Inline XBRL Taxonomy Extension Definition Linkbase | X | | | |
| 101.LAB | Inline XBRL Taxonomy Extension Labels Linkbase | X | | | |
| 101.PRE | Inline XBRL Taxonomy Extension Presentation Linkbase | X | | | |
| 104 | Cover Page Interactive Data File (embedded within the Inline XBRL document) | | | | |
| * Management contract or compensatory plan, contract or arrangement. |
| † Certain information in this exhibit was omitted by means of redacting a portion of the text and replacing it with [***] |
Item 16. Form 10-K Summary
None.
SIGNATURES
Pursuant to the requirements of Section 13 or 15(d) of the Securities Exchange Act of 1934, the registrant has duly caused this report to be signed on its behalf by the undersigned, thereunto duly authorized.
| | | | | | | | |
| | CHARLES RIVER LABORATORIES INTERNATIONAL, INC. |
February 17, 202114, 2024 | By: | /s/ DAVID R. SMITHFLAVIA H. PEASE |
| David R. SmithFlavia H. Pease |
| Corporate Executive Vice President and Chief Financial Officer |
Pursuant to the requirements of the Securities Exchange Act of 1934, this report has been signed by the following persons on behalf of the registrant and in the capacities indicated below and on the dates indicated.
| | | | | | | | | | | |
| Signatures | Title | Date |
| By: | /s/ JAMES C. FOSTER | Chairman, President and Chief Executive Officer | February 17, 202114, 2024 |
| James C. Foster | | |
| | | |
| By: | /s/ DAVID R. SMITHFLAVIA H. PEASE | Corporate Executive Vice President and | February 17, 202114, 2024 |
| David R. SmithFlavia H. Pease | Chief Financial Officer | |
| | | |
| By: | /s/ MICHAEL G. KNELL | Corporate Senior Vice President and | February 17, 202114, 2024 |
| Michael G. Knell | Chief Accounting Officer | |
| | | |
| By: | /s/ NANCY C. ANDREWS | Director | February 17, 202114, 2024 |
| Nancy C. Andrews | | |
| | | |
| By: | /s/ ROBERT J. BERTOLINI | Director | February 17, 202114, 2024 |
| Robert J. Bertolini | | |
| | | |
| By: | /s/ STEPHEN D. CHUBBRESHEMA KEMPS-POLANCO | Director | February 17, 202114, 2024 |
| Reshema Kemps-Polanco | | Stephen D. Chubb | |
| | | |
| By: | /s/ DEBORAH T. KOCHEVAR | Director | February 17, 202114, 2024 |
| Deborah T. Kochevar | | |
| | | |
| By: | /s/ GEORGE LLADO | Director | February 17, 202114, 2024 |
| George Llado | | |
| | | |
| By: | /s/ MARTIN MACKAY | Director | February 17, 202114, 2024 |
| Martin Mackay | | |
| | | |
| By: | /s/ GEORGE E. MASSARO | Director | February 17, 202114, 2024 |
| George E. Massaro | | |
| | | |
By: | /s/ GEORGE M. MILNE, JR. | Director | February 17, 2021 |
| George M. Milne, Jr. | | |
| | | |
| By: | /s/ C. RICHARD REESE | Director | February 17, 202114, 2024 |
| C. Richard Reese | | |
| | | |
| By: | /s/ CRAIG B. THOMPSON | Director | February 14, 2024 |
| Craig B. Thompson | | |
| | | |
| By: | /s/ RICHARD F. WALLMAN | Director | February 17, 202114, 2024 |
| Richard F. Wallman | | |
| | | |
| By: | /s/ VIRGINIA M. WILSON | Director | February 17, 202114, 2024 |
| Virginia M. Wilson | | |
EXHIBIT INDEX
| | | | | | | | | | | | | | | | | |
| Exhibit No. | Description | Filed with this Form 10-K | Incorporation by Reference |
| Form | Filing Date | Exhibit No. |
| 2.1 | | | 8-K | February 17, 2021 | 2.1 |
| 3.1 | | | S-1/A | June 23, 2000 | 3.1 |
| 3.2 | | | 8-K | May 16, 2016 | 3.2 |
| 4.1 | | | S-1/A | June 23, 2000 | 4.1 |
| 4.2 | | | 10-K | February 11, 2020 | 4.2 |
| 4.3* | | | 10-K | February 27, 2013 | 4.4 |
| 4.4* | | | 10-K | February 14, 2017 | 4.3 |
| 4.5* | | | 10-Q | August 5, 2020 | 10.3 |
| 4.6 | | | 8-K | April 3, 2018 | 4.1 |
| 4.7 | | | 8-K | April 3, 2018 | 4.2 |
| 4.8 | | | 8-K | April 3, 2018 | 4.3 |
| 4.9 | | | 8-K | October 23, 2019 | 4.1 |
| 4.10 | | | 8-K | October 23, 2019 | 4.2 |
| 10.1* | | | 10-K | February 17, 2015 | 10.13 |
| 10.2* | | | 10-Q | August 3, 2016 | 10.1 |
| 10.3* | | | 10-Q | May 7, 2020 | 10.1 |
| 10.4* | | | 10-K | February 20, 2008 | 10.17 |
| 10.5* | | | 10-K | February 14, 2017 | 10.4 |
| 10.6* | | | 10-K | February 20, 2008 | 10.18 |
| 10.7* | | | 10-K | February 14, 2017 | 10.6 |
| 10.8* | | | 10-K | February 14, 2017 | 10.7 |
| 10.9* | | | 10-Q | August 5, 2020 | 10.1 |
| 10.10* | | | 10-Q | August 5, 2020 | 10.2 |
| 10.11* | | | 10-Q | August 3, 2010 | 10.1 |
| 10.12* | | | 10-K | February 23, 2009 | 10.7 |
| 10.13* | | | 10-K | February 12, 2016 | 10.4 |
| | | | | | | | | | | | | | | | | |
| Exhibit No. | Description | Filed with this Form 10-K | Incorporation by Reference |
| Form | Filing Date | Exhibit No. |
| 10.14* | | | 10-Q | May 4, 2016 | 10.1 |
| 10.15* | | | 10-K | March 9, 2005 | 10.23 |
| 10.16* | | | 10-K | February 27, 2012 | 10.11 |
| 10.17* | | | 10-Q | August 7, 2012 | 10.1 |
| 10.18* | | | 8-K | February 13, 2018 | 99.2 |
| 10.19* | | | 10-Q | October 29, 2020 | 10.1 |
| 10.20 | | | 8-K | March 26, 2018 | 10.1 |
| 10.21 | | | 10-Q | November 6, 2019 | 10.2 |
| 10.22 | | | 10-Q | November 6, 2019 | 10.3 |
| 10.23* | | | 10-Q | November 6, 2019 | 10.1 |
| 10.24 | | | 8-K | May 1, 2019 | 2.1 |
| 21.1 | | X | | | |
| 23.1 | | X | | | |
| 31.1 | | X | | | |
| 31.2 | | X | | | |
| 32.1 | | X | | | |
| 101.INS | eXtensible Business Reporting Language (XBRL) Instance Document | X | | | |
| 101.SCH | XBRL Taxonomy Extension Schema | X | | | |
| 101.CAL | XBRL Taxonomy Extension Calculation Linkbase | X | | | |
| 101.DEF | XBRL Taxonomy Extension Definition Linkbase | X | | | |
| 101.LAB | XBRL Taxonomy Extension Labels Linkbase | X | | | |
| 101.PRE | XBRL Taxonomy Extension Presentation Linkbase | X | | | |
| * Management contract or compensatory plan, contract or arrangement. |
| | | | | |
