SECURITIES AND EXCHANGE COMMISSION
WASHINGTON, D. C. 20549
FORM 10-K
|
| | |
| þ | | ANNUAL REPORT PURSUANT TO SECTION 13 OR 15(d) OF THE SECURITIES EXCHANGE ACT OF 1934 |
| | | For The Fiscal Year Ended October 1, 2016September 29, 2018 |
| o | | TRANSITION REPORT PURSUANT TO SECTION 13 OR 15(d) OF THE SECURITIES EXCHANGE ACT OF 1934 |
Commission File No. 1-15583
DELTA APPAREL, INC.
(Exact name of registrant as specified in its charter)
|
| | |
Georgia (State or other jurisdiction of incorporation or organization) | | 58-2508794 (I.R.S. Employer Identification No.) |
322 South Main Street
Greenville, SC 29601
(Address of principal executive offices) (zip code)
Registrant’s telephone number, including area code: (864) 232-5200
Securities registered pursuant to Section 12(b) of the Act:
|
| | |
| Title of Each Class | | Name of Each Exchange on Which Registered |
| Common Stock, par value $0.01 | | NYSE MKTAmerican LLC |
Securities registered pursuant to Section 12(g) of the Act:
None
Indicate by check mark if the registrant is a well-known seasoned filer, as defined in Rule 405 of the Securities Act. Yes o No þ.
Indicate by check mark if the registrant is not required to file reports pursuant to Section 13 or Section 15(d) of the Act. Yes o No þ.
Indicate by check mark whether the registrant (1) has filed all reports required to be filed by Section 13 or 15(d) of the Securities Exchange Act of 1934 during the preceding 12 months (or for such shorter period that the registrant was required to file such reports), and (2) has been subject to such filing requirements for the past 90 days. Yes þ No o
Indicate by check mark whether the registrant has submitted electronically and posted on its corporate Web site, if any, every Interactive Data File required to be submitted and posted pursuant to Rule 405 of Regulation S-T during the preceding 12 months (or for such shorter period that the registrant was required to submit and post such files). Yes þ No o.
Indicate by check mark if disclosure of delinquent filers pursuant to Item 405 of Regulation S-K is not contained herein, and will not be contained, to the best of registrant’s knowledge, in definitive proxy or information statements incorporated by reference in Part III of this Form 10-K or any amendment to this Form 10-K. þ
Indicate by check mark whether the registrant is a large accelerated filer, an accelerated filer, a non-accelerated filer, or a smaller reporting company. See the definitions of “large accelerated filer,” “accelerated filer” and “smaller reporting company” in Rule 12b-2 of the Exchange Act. (Check one):
|
| | | | | | |
Large accelerated filer o | | Accelerated filer þ | | Non-accelerated filer o | | Smaller reporting company oþ |
| | | | | (Do not check if a smaller reporting company) | | |
Indicate by check mark whether the registrant is a shell company (as defined in Rule 12b-2 of the Act). Yes o No þ.
As of April 2, 2016March 31, 2018, the aggregate market share of the registrant’s voting stock held by non-affiliates of the registrant (based on the last sale price for such shares as quoted by the NYSE MKTAmerican) was approximately $136.2$116.4 million.
The number of outstanding shares of the registrant’s Common Stock as of November 15, 20166, 2018, was 7,579,2556,858,697.
DOCUMENTS INCORPORATED BY REFERENCE
Certain information required in Part III of this Form 10-K shall be incorporated from the registrant’s definitive Proxy Statement to be filed pursuant to Regulation 14A for the registrant’s 2016 Annual Meeting of Shareholders currently scheduled to be held on February 9, 2017.7, 2019.
TABLE OF CONTENTS
|
| |
| |
| |
| |
| |
| |
| |
| |
| |
| |
| |
| |
| |
| |
| |
| |
| |
| |
| |
| |
| |
| |
| |
| |
| |
| |
| |
| |
EX-23.2 | |
EX-31.1 | |
EX-31.2 | |
EX-32.1 | |
| |
Cautionary Note Regarding Forward LookingForward-Looking Statements
The Private Securities Litigation Reform Act of 1995 provides a safe harbor for forward-looking statements made by or on behalf of the Company. We may from time to time make written or oral statements that are “forward-looking,” including statements contained in this report and other filings with the Securities and Exchange Commission (the “SEC”),SEC, in our press releases, and in other reports to our shareholders. All statements, other than statements of historical fact, which address activities, events or developments that we expect or anticipate will or may occur in the future are forward-looking statements. The words “estimate”, “project”, “forecast”, “anticipate”, “expect”, “intend”, “believe”“plan," “estimate,” “project,” “forecast,” “anticipate,” “expect,” “intend,” “seek," “believe,” “may,” “should” and similar expressions, and discussions of strategy or intentions, are intended to identify forward-looking statements.
The forward-lookingForward-looking statements in this Annual Reportare neither historical facts nor assurances of future performance. Instead, they are based on our current expectations and are necessarily dependent upon assumptions, estimates and data that we believe are reasonable and accurate but may be incorrect, incomplete or imprecise. Forward-looking statements are also subject to a number of business risks and inherent uncertainties, any of which could cause actual results to differ materially from those set forth in or implied by the forward-looking statements. The risksTherefore, you should not rely on any of these forward-looking statements. Important factors that could cause our actual results and uncertaintiesfinancial condition to differ materially from those indicated in forward-looking statements include, among others:others, the following:
the volatility and uncertainty of cotton and other raw material prices;
the general U.S. and international economic conditions;
the competitive conditions in the apparel industry;
restrictions on our ability to borrow capital or service our indebtedness;
the inability to successfully implement or achieve the expected cost savings associated withcertain strategic initiatives;
deterioration in the financial condition of our customers and suppliers and changes in the operations and strategies of our customers and suppliers;
our ability to predict or react to changing consumer preferences or trends;
pricing pressuresour ability to successfully open and the implementation of cost reduction strategies;operate new retail stores in a timely and cost-effective manner;
changes in economic, political or social stability at our offshore locations;
significant interruptions or disruptions within our manufacturing or distribution facilities or other operations;
our ability to attract and retain key management;
the effect of unseasonable weather conditions on purchases of our products;
significant changes in our effective tax rate;
interest rate fluctuations increasing our obligations under our variable rate indebtedness;
the ability to raise additional capital;
the ability to grow, achieve synergies and realize the expected profitability of acquisitions;
the volatility and uncertainty of energy, fuel and fuel prices;related costs;
material disruptions in our information systems related to our business operations;
compromises of our data security or privacy breaches;
significant interruptions within our manufacturing or distribution operations;
changes in or our ability to comply with safety, health and environmental regulations;security;
significant litigation in either domestic or international jurisdictions:jurisdictions;
recalls, claims and negative publicity associated with product liability issues;
the ability to protect our trademarks and other intellectual property;
the ability to obtain and renew our significant license agreements;
the impairment of acquired intangible assets;
changes in ecommerce laws andinternational trade regulations;
changes in internationalour ability to comply with trade regulations;
changes in employment laws or regulations or our relationship with employees;
cost increases and reduction in future profitability due to recent healthcare legislation;
foreign currency exchange rate fluctuations;
violations of manufacturing standards or labor laws or unethical business practices by our suppliers and independent contractors;
the illiquidity of our shares; and
price volatility in our shares and the general volatility of the stock market; andmarket.
the costs required to comply with the regulatory landscape regarding public company governance and disclosure.
A detailed discussion of significant risk factors that have the potential to cause actual results to differ materially from our expectations is describedset forth in Part 1 under the heading of “Risk Factors.”subheading "Risk Factors". Any forward-looking statements in this Annual Report on Form 10-K do not purport to be predictions of future events or circumstances and may not be realized. Further, any forward-looking statements are made only as of the date of this Annual Report on Form 10-K and we do not undertake to publicly to update or revise the forward-looking statements, even if it becomes clear that any such statements or any projected results will not be realized or that any contemplated strategic initiatives will not be implemented.except as required by the federal securities laws.
PART I
“Delta Apparel”, the “Company”, “we”, “us” and “our” are used interchangeably to refer to Delta Apparel, Inc. together with our domestic wholly-owned subsidiaries, including M.J. Soffe, LLC (“Soffe”), Junkfood Clothing CompanyDTG2Go, LLC, f/k/a Art Gun, LLC (“Junkfood”DTG2Go”), Salt Life, LLC (f/k/a To The Game, LLC) (“Salt Life”), Art Gun, LLCCulver City Clothing Company (f/k/a Junkfood Clothing Company) (“Art Gun”Junkfood”), and our other domestic and international subsidiaries, as appropriate to the context. On March 31, 2017, we sold our Junkfood business to JMJD Ventures, LLC. See Note 4—Divestitures for further information on this transaction.
We were incorporated in Georgia in 1999 and our headquarters is located at 322 South Main Street, Greenville, South Carolina 29601 (telephone number: 864-232-5200). Our common stock trades on the NYSE MKTAmerican under the symbol “DLA”.
We operate on a 52-53 week fiscal year ending on the Saturday closest to September 30. The 20162018 and 20142017 fiscal years were 52-week years that ended on October 1, 2016,September 29, 2018, and September 27, 2014,30, 2017, respectively. The 2015 We are filing as a smaller reporting company for our 2018 fiscal year end as our public float was a 53-week year that endedless than the $250 million threshold on October 3, 2015.the last day of our second quarter.
OVERVIEW
Delta Apparel, Inc. is an international apparel design, marketing, manufacturing and sourcing company that features a diverse portfolio of lifestyle basics and branded activewear apparel, headwear and related accessory products. We specialize in selling casual and athletic products through a variety of distribution channels and distribution tiers, including specialty stores, boutiques, department stores, mid and mass channels, e-retailers, sporting goods and outdoor retailers, independent and specialty stores, and the U.S. military. Our products are also made available direct-to-consumer on our websites and in our branded retail stores. We believe this diversified distribution allows us to capitalize on our strengths to provide casual activewear to consumers purchasing from most types of retailers.a broad and evolving customer base whose shopping preferences may span multiple retail channels.
WeAs a vertically-integrated manufacturer, we design and internally manufacture the majority of our products, which allows us to offer a high degree of consistency and quality, controls as well as leverage scale efficiencies.efficiencies, and react quickly to changes in trends within the marketplace. One of our strengths is the speed with which we can reach the market from design to delivery. We have manufacturing operations located in the United States, El Salvador, Honduras and Mexico, and use domestic and foreign contractors as additional sources of production. Our distribution facilities are strategically located throughout the United States to better serve our customers with same-day shipping on our catalog products and weekly replenishments to retailers.
We became a diversified branded apparel company through acquisitions that added well-recognized brands and licensed properties to our portfolio, expanded our product offerings, and broadened our distribution channels and customer base.
On August 30, 2016, we purchased substantially all of the assets of COAST Apparel ("Coast"). The Coast acquisition continuesreach, and benefited from our strategy of building lifestyle brands that take advantage of our creative capabilities, direct-to-consumer infrastructure, vertical manufacturing platformplatform. We continue to monitor and sourcing competencies.evaluate our portfolio, making strategic acquisitions or exiting markets to support our long-term growth and profitability goals.
BUSINESS SEGMENTS
We operateDuring fiscal year 2018, we made a strategic decision to re-align our business in two distinct segments: basicsinto segments that better reflect our operating model and branded. Althoughallow us to better leverage and more efficiently manage our cost structure as we plan future growth. With this realignment, we changed and renamed our reportable segments to reflect how our Chief Operating Decision maker and management currently make financial decisions and allocate resources. We are now reporting our results under the two segments are similar in their production processes and regulatory environments, they are distinct in their economic characteristics, products, marketing and distribution methods.
The basics segment is comprised of our business units primarily focused on garment styles characterized by low fashion risk, and includesDelta Group, comprising our Delta Activewear, (which includes Delta CatalogDTG2Go and FunTees) and Art Gun business units. We market, distribute and manufacture unembellished knit apparel under the main brands of Delta Pro Weight® and Delta Magnum Weight® for sale to a diversified audience ranging from large licensed screen printers to small independent businesses. We also manufacture private label products for major branded sportswear companies, trendy regional brands, retailers, and sports licensed apparel marketers. Typically our private label products are sold with value-added services such as hangtags, ticketing, hangers, and embellishment so that they are fully ready for retail. Using digital print equipment and its proprietary technology, Art Gun embellishes garments to create private label, custom decorated apparel servicing the fast-growing e-retailer channels.
The branded segment is comprised of ourSoffe business units, which are focused on specialized apparel garments and headwear to meet consumer preferences and fashion trends, and includesthe Salt Life Group, comprising our Salt Life Junkfood, Soffe, and Coast business units as well as The Game business unit prior to its disposition on March 2, 2015. These branded embellished and unembellished products are sold through specialty and boutique shops, upscale and traditional department stores, mid-tier retailers, sporting goods stores, e-retailers and the U.S. military. Products in this segment are marketed under our lifestyle brands of Salt Life®, Junk Food®, Soffe®, and COAST®, as well as other labels. The results of the Coast business have beenunits. Junkfood was included in the brandedSalt Life Group segment since acquisition on Augustuntil its divestiture in March, 2017. We have recast the segment information for the fiscal year ended September 30, 2016.2017, to conform to the current presentation.
See Note 14 of the Notes to Consolidated Financial Statements for financial information regarding segment reporting, which information is incorporated herein by reference.
PRODUCTS
We specialize in the design, manufacturing, merchandising, sales, and marketingsale of a variety of casual and athletic products for men, women, juniors, youth and children at a wide range of price points through most distribution channels. We market fashion apparel garments headwear
and accessories under our primary brands of Salt Life®, Junk Food®, Soffe® and COAST®, as well as other labels. Weand we market our basiccore activewear apparel garments under our Delta and Soffe® brands.
Delta has built upon its strength in the market as a core basic tee company to becomea "go to" fashion provider for the masses. After decades of being the source for casual and sports basics, we have continued to expand our brand. Our Delta Platinum collection is a cut above the rest providing a fresh, fashionable edge to Delta's historic quality. Our tri-blend garments add a touch of rayon for an even silkier hand plus a deep heathering effect. Our CVC garments offer the soft, breathable benefit of a mostly cotton blend along with refreshing affordability. In the upcoming year we will be introducing an amazing new cotton slub fabric to our Delta Platinum offering.
Our Delta Pro Weight® line and Magnum Weight® products are a huge part of our heritage. These lines offer a diverse selection of mid-weight and heavier-weight, 100% cotton fabrications. We also continue to provide innovative products like our Delta Soft, Ringspun garments, Fleece and Delta Dri performance lines.
FunTees is a leading private label apparel manufacturer. FunTees' long-standing, trusted relationships with top-tier global sportswear and lifestyle brands are supported by a commitment to innovation and service and its diverse capabilities in design, textiles, cut & sew, embellishment, and retail packaging have made it a go-to source for worldwide and regional brands.
DTG2Go is a market leader in the direct-to-garment digital print and fulfillment marketplace that leverages one of the most highly-automated factory processes for delivering on-demand, digitally printed apparel. With four production facilities throughout the United States, DTG2Go utilizes Kornit printing technology to provide quick delivery and superior print quality to its customers through a robust back-end digital supply chain. DTG2Go services traditional and web retailers, screen printers, and the ad specialty and promotional products markets, reducing our customer’s risk levels while simultaneously increasing the span of customization opportunities and overall breadths of their assortments. Orders ship from DTG2Go within 24 to 48 hours to consumers in the United States and to over 100 countries worldwide.
Soffe, founded in 1946, is a heritage brand that designs and produces high quality activewear at a great value. Widely known for the "cheer short", with its signature roll down waist band, Soffe also offers team and spirit wear to its core demographic of cheerleaders, gymnasts and dancers around the world. Layered within Soffe’s female presentation are styles that seamlessly transition from studio to street-wear for all day comfort along with graphics anchored in today’s trends. Soffe’s early beginnings were in the military and it continues to be a proud supplier to United States military personnel, both active duty and veterans, worldwide. The men’s assortment features the tagline “anchored in the military, grounded in training” and offers everything from physical training gear certified by the respective branches of the military, classic base layers that include the favored 3-pack tees, and the iconic “ranger panty.” Lastly, Intensity by Soffe leads the way in female fit, fashion-forward, team uniforms and features the first female fit fast pitch pant, and now includes practice gear and accessories. Soffe has broad distribution channels which include all military branches, big box sporting goods retailers, department stores, team dealers, school uniforms, screen printers, and a direct-to-consumer platform inclusive of a branded web store and brick and mortar retail locations.
Salt Life is an authentic, aspirational and lifestyle apparel brand that embraces those who love the ocean and everything associated with it.living the “Salt Life.” The Salt Life brand has widespread appeal with ocean enthusiasts worldwide. From fishing, diving and surfing, to beach fun and sun-soaked relaxation, the Salt Life brand says, "I“I live the Salt Life". Products consist of tee shirts, board shorts, technical fishing apparel, rash guards and performance clothing featuring our own trademarked UVAPOR fabrics.Life.” From its first merchandise offerings in 2006, Salt Life'sLife has grown distribution includesto include surf shops, specialty stores, department stores sporting goods and outdoor retailers, and direct-to-consumer through retail doors and ecommerce.
Junk Food emerged in 1998 as the original vintage t-shirt brand. Known for its soft, comfortable fabrics and witty art, the Junk Food brand is a celebrity favorite carried in the top stores throughout the world, including branded collaborations with Nordstrom, Gap Inc. and other notable retailers. Also a licensing powerhouse, Junkfood has distribution rights to numerous pop-culture properties across multiple categories, including rock & roll, fictional characters, movies, sports, and foods and beverages. The Junk Food brand continues to expand beyond its iconic tee shirt collections with new apparel categories, accessories, and headwear, showcased in its flagship retail store on Abbot Kinney in Venice, California. Junkfood's diversified business model includes both private and branded labels, with a portfolio that includes Junk Food®, Junk Food Art House, Wknd, Stray Heart®, K38®, Paint and Cloth®, Worn Rite®, Love + Art®, and True Vintage®.
Soffe is a lifestyle activewear brand that designs, produces, and markets products for men, women, juniors, and children. Soffe’s “The Strength Is In Us” marketing campaign is targeted toward core consumers who lead active lifestyles and understand that, together, we can accomplish more than by ourselves. The women's product offerings are grounded in the brand's heritage in the cheerleading market and include a newly introduced performance segment that features technical fabrics as well as fun-fashion design influences. As a supplier to the military since 1946, the Soffe men's products are rooted in this military heritage. Core items include performance garments issued directly to enlisted soldiers which also have broad appeal to young men who lead an active lifestyle. By incorporating trend-leading fits and an overall fashion-on-the-field sensibility, Intensity by Soffe creates performance uniforms, practice gear, and accessories. Soffe has a diverse distribution network that includes all military branches, big-box sporting goods retailers department stores, independent sporting goods retailers, team dealers, screen printers, schools and direct-to-consumer outlets.expanded its product assortment outside of apparel to include swimwear, sunglasses, bags and accessories, and most recently, craft beer with the launch of Salt Life Lager. Salt Life products are available direct-to-consumers at www.saltlife.com and at Salt Life’s various branded retail stores. The Salt Life brand is committed to supporting conservation efforts by contributing to various organizations through Salt Life Gives Back. Learn more at https://www.saltlife.com/salt-life-gives-back.
Coastintegrates the coastal experience of weekends and summers at the beach with everyday life throughout the year. Beginning with just a men’s polo shirt, Coast Apparel has since expanded into is a full line of traditional, sports-casual attire, headwearpremium casual apparel that is as much a testament to good times and accessories.carefree afternoons as it is to superior quality, custom fit and maximum comfort. It has inspired us to create an apparel line for others who understand and celebrate the relaxed, yet sophisticated coastal lifestyle and wish to stay connected with it, and COAST, each and every day. Coast Apparel primarily markets direct-to-consumer through two retail stores located in Greenville, South Carolina, and Pawley’s Island, South Carolina, and via its ecommerce site at www.coastapparel.com andwww.coastapparel.com. Coast Apparel products can also be found at select independent retailers.
Delta offers a wide assortment of basic, high-quality apparel garments for the entire family under its primary brand names Delta Pro Weight® and Delta Magnum Weight®. Delta products are offered in a broad range of colors available in six-month infant to adult sizes up to 5X. The Pro Weight® line represents a diverse selection of mid-weight, 100% cotton silhouettes in a large color palette. The Magnum Weight® line is designed to give our customers a variety of silhouettes in a heavier-weight, 100% cotton fabric. In 2016, we broadened our fashion basics line with a snow heather french terry hoodie and zip hoodie. Our fleece and french terry products help Delta meet the seasonal demands of our diversified customer base. New for 2017, with the success of our Delta Dri brand, we are now expanding into a ladies line to accompany the existing mens and boys. In addition, we are adding a line of pepper heathers and tri-blends to further extend the fashion basics component of our line.
FunTees designs, markets and manufactures private label custom knit t-shirts primarily to major branded sportswear and lifestyle companies. The majority of this merchandise is manufactured, embellished and sold to our customers with a wide variety of packaging services so that products are shipped store-ready.
Art Gun is a leader in direct-to-garment printing, with one of the most highly-automated factory processes for delivering on-demand, direct-to-garment, digitally printed garments of all types. Art Gun prints individual, custom items and ships products to consumers in over 40 countries worldwide.
A key to the success of our businesses is our ability to anticipate and quickly respond to changing consumer preferences. Our art team reviews trend reports, concepts and color trends to keep our products and designs in style. This information is used by our in-house designers and merchandisers, along with our sales and marketing personnel, who review market trends, sales results and the popularity of our latest products to design new merchandise to meet the expected future demands of our consumers.
TRADEMARKS AND LICENSE AGREEMENTS
We own several well-recognized trademarks that are important to our business. Salt Life® is an authentic, aspirational lifestyle brand that embraces those who love the ocean and everything associated with living the "Salt Life". Soffe® has stood for quality and value in the athletic and activewear market for more than sixty years and Junk Food® has been known as a leading vintage t-shirt brand since 1998.years. Our other registered trademarks include COAST®, Intensity Athletics®, Kudzu®, Pro Weight®, Magnum Weight®, and the Delta Design. Our trademarks are valuable assets that differentiate the marketing of our products. We vigorously protect our trademarks and other intellectual property rights against infringement.
We have distribution rights to other trademarks through license agreements. The Soffe business unit is an official licensee for major colleges and universities. Junkfood has rights to distribute trademarked apparel across athletics (includingbranches of the NFL and NBA), music, entertainment, foods and beverages, and numerous other pop-culture categories.United States military. We also have license agreements for motorsports properties, (including NASCAR), golf and various resort properties.including NASCAR. Our license agreements are typically non-exclusive in nature and have terms that range from one to three years. Historically we have been able to renew our license agreements; however, the loss of certain license agreements could have a material adverse effect on our results of operations. Although weWe are not dependent on any single license and our license agreements collectively are of significant value to our brandedDelta Group segment.
SALES & MARKETING
Our sales and marketing function consistsfunctions consist of both employed and independent sales representatives and agencies located throughout the country. In our branded segment,Our sales teams service specialty and boutique shops, upscale and traditional department store,stores, mid-tier retailers, sporting goods stores, e-retailers and outdoor retailer, and military customer bases. We also have an international presence with our Junk Food® products in Canada, Europe, Asia, and Dubai.the U.S. military. Our brands leverage both in-house and outsourced marketing communications professionals to amplify their lifestyle statements. In
The majority of our basics segment, we sell our knit apparel products primarily directare produced based on forecasts to large and small screen printers and into the promotional products markets. Ourpermit quick shipments to our customers; however, our private label productsprograms are sold primarilygenerally made only to major branded sportswear companies and regional, trendy brands.
order. During fiscal year 20162018, we shipped our products to approximately 11,0009,000 customers, many of whom have numerous retail "doors". No single customer accounted for more than 10% of our sales in fiscal years 2016, 20152018 or 2014,2017, and our strategy is to not become dependent on any single customer. Revenues attributable to sales of our products in foreign countries, as a percentage of our consolidated net sales, represented approximately 2%1% in both fiscal years 2016, 20152018 and 2014.2017.
The majority of our apparel products are produced based on forecasts to permit quick shipments to our customers. Private label programs are generally made only to order or based on customer forecasts, and our headwear products are primarily sourced based on customer orders. We aggressively explore new ways to leverage our strengths and efficiencies to meet the quick-turn needs of our customers.
We have distribution facilities strategically located throughout the United States that carry in-stock inventory for shipment to customers, with most shipments made via third party carriers. To better serve customers, we allow products to be ordered by the piece, dozen, or full case quantity.quantity and we aggressively explore new ways to leverage our strengths and efficiencies to meet the quick-turn needs of our customers. Because a significant portion of our business consists of at-once replenishment, and direct catalog orders, we believe that backlog order levels do not provide a general indication of future sales.
COMPETITION
WeAs a vertically-integrated apparel company, we have numerous competitors with respect to the manufacturing and sale of apparel and headwear products in both domestic and international markets, many of which are larger and have more brand recognition and greater financial resourcesmarketing budgets than we do. Some of these competitors may benefit from lower production costs that can result from greater operational scale, a differing supply chain footprint, or trade-related agreements and other macroeconomic factors that may enable them to compete more effectively.
We believe that competition within our brandedSalt Life Group segment is based primarily upon brand recognition, design, and consumer preference. We focus on sustaining the strong reputation of our lifestyle brands by adapting our product offerings to changes in fashion trends and consumer preferences. We aim to keep our merchandise offerings fresh with unique artwork and new designs, and support the integrated lifestyle statement of our products through effective consumer marketing. We believe that our favorable competitive position stems from strong consumer recognition and brand loyalty, the high quality of our products, and our flexibility and process control, which drive product consistency. We believe that our ability to remain competitive in the areas of quality, price, design, marketing, product development, manufacturing, technology and distribution will, in large part, determine our future success.
Competition in our basicsDelta Group segment is generally based upon price, service, delivery time and quality, with the relative importance of each factor depending upon the needs of the particular customerscustomer and the specific product offering. These businesses are highly price competitive and competitor actions can greatly influence pricing and demand for our products. While price is still important in the private label market, quality and service are generally more important factors for customer choice. Our ability to consistently service the needs of our private label customers greatly impacts future business with these customers. We believe our Western Hemisphere-centered manufacturing platform enables us to compete with our competitors by providing an outlet for customers to diversify their sourcing footprints and reduce time to market. Furthermore, as an integrated entity with design, manufacturing, sourcing, and marketing capabilities, we believe the interdependencies within our portfolio provide cost, quality, and speed to market advantages that enable us to be more competitive.
SEASONALITY
Although our various product lines are sold on a year-round basis, the demand for specific products or styles reflects some seasonality, with sales in our June fiscal quarter typically being the highest and sales in our December fiscal quarter typically being the lowest. As we continue to expand our product offerings, the seasonality in our business has become less pronounced. The percentage of net sales by quarter for the year ended October 1, 2016,September 29, 2018, was 21%23%, 25%, 27%29% and 27%23% for the first, second, third, and fourth fiscal quarters, respectively. Consumer demand for apparel is cyclical and dependent upon the overall level of demand for soft goods, which may or may not coincide with the overall level of discretionary consumer spending. These levels of demand change as regional, domestic and international economic conditions change. Therefore, the distribution of sales by quarter in fiscal year 20162018 may not be indicative of the distribution in future years.
MANUFACTURING
We have a vertically integrated manufacturing platform that supports both our basicsthe Delta Group and branded segments.Salt Life Group. Our manufacturing operations begin with the purchase of yarn and other raw materials from third-party suppliers. We manufacture fabrics in our leased textile facility located near San Pedro Sula, Honduras, and purchase fabric domestically and internationally to supplement our internal production. The manufacturing process continues at one of our six apparel manufacturing facilities where the products are ultimately sewn into finished garments. We either own these facilities or lease and operate them. These facilities are located domestically (two in North Carolina) and internationally (two in Honduras, one in El Salvador and one in Mexico). Our garments may also be embellished and prepared for retail sale (with any combination of services, including ticketing, hang tags, and hangers). The facilities that perform these operations are located domestically (one in Florida and oneour facility in North Carolina) and internationallyCarolina or our international plants (one in El Salvador and one in Mexico). In addition, we offer digital print and fulfillment services through our four domestic facilities (two in Florida, one in North Carolina and one in Nevada). In fiscal years 2016, 20152018 and 2014,2017, approximately 81%90%, 84% and 81%91%, respectively, of our manufactured products were sewn in company-operated locations. The remaining products were sewn by outside contractors located primarily in the Caribbean Basin.
At our 2016, 20152018 and 20142017 fiscal year-ends, our long-lived assets in Honduras, El Salvador and Mexico collectively comprised approximately 58%, 44%41%, and 44%54%, respectively, of our total net property, plant and equipment, with our long-lived assets in Honduras comprising 45%, 33%, 35%32% and 43% of the total, respectively. See Item 1A. Risk Factors for a description of risks associated with our operations located outside of the United States.
To supplement our internal manufacturing platform, we purchase fabric, undecorated products and full-package products from independent sources throughout the world. In fiscal years 2016, 20152018 and 2014,2017, we sourced approximately 15%, 16%,10% and 19%8%, respectively, of our products from third parties.
RAW MATERIALS
We have a supply agreement with Parkdale Mills, Inc. and Parkdale America, LLC (collectively "Parkdale") to supply our yarn requirements until December 31, 2018. Under the supply agreement, we purchase from Parkdale all of our yarn requirements for use in our manufacturing operations from Parkdale, excluding yarns that Parkdale does not manufacture or cannot manufacture due to temporary capacity constraints. The purchase price of yarn is based upon the cost of cotton plus a fixed conversion cost. If Parkdale’s operations are disrupted and it is not able to provide us with our yarn requirements, we may need to obtain yarn from alternative sources. Although alternative sources are presently available, we may not be able to enter into short-term arrangements with substitute suppliers on terms as favorable as our current terms with Parkdale. In addition, the cotton futures we have fixed with Parkdale may not be transferable to alternative yarn suppliers. Because there can be no assurance that we would be able to pass along the higher cost of yarn to our customers, this could have a material adverse effect on our results of operations. Moreover, while we expect to negotiate an extension to the agreement with Parkdale, the terms of the new agreement may not be as favorable as the current agreement.
We also purchase specialized fabrics that we currently do not have the capacity or capability to produce and may purchase other fabrics when it is cost-effective to do so. While these fabrics typically are available from various suppliers, there are times when certain yarns become limited in quantity, causing some fabrics to be difficult to source. This can result in higher prices or the inability to provide products to customers, which could negatively impact our results of operations. Dyes and chemicals are also purchased from several third party suppliers. While historically we have not had difficulty obtaining sufficient quantities of dyes and chemicals for manufacturing, the availability of products can change, which could require us to adjust dye and chemical formulations. In certain instances, these adjustments can increase manufacturing costs, negatively impacting our results of operations.
EMPLOYEES AND SOCIAL RESPONSIBILITY
As of October 1, 2016,September 29, 2018, we employed approximately 7,700 full time employees, of whom approximately 1,0001,100 were employed in the United States. Approximately 1,220A total of approximately 3,000 employees at onetwo of our facilities in San Pedro Sula, Honduras, are party to a three-yearmulti-year collective bargaining agreement and approximately 1,700 employees at a separate facility in San Pedro Sula, Honduras are party to a different three-year collective bargaining agreement.agreements. We have historically conducted our operations without significant labor disruptions and believe that our relations with our employees are good. We have invested significant time and resources in attempting to causehave the working conditions in all of our facilities to meet or exceed the standards imposed by governing laws and regulations. We have obtained WRAP (Worldwide Responsible Accredited Production) certification for allAll of our manufacturing facilities that we operate in Honduras, El Salvador and Mexico.Mexico are Worldwide Responsible Accredited Production (WRAP) certified. Delta Apparel, Inc. is a participating company ofCategory C affiliate with the FLA (FairFair Labor Association). This affiliation with FLAAssociation (FLA), which further enhances human rights compliance monitoring for our plants and our third party contractors. In addition, we have proactive programs to promote workplace safety, personal health and employee wellness. We also support educational institutions andand/or charitable organizations in the communities where we operate.
ENVIRONMENTAL AND REGULATORY MATTERS
We are subject to various federal, state and local environmental laws and regulations concerning, among other things, wastewater discharges, storm water flows, air emissions and solid waste disposal. Our plants generate small quantities of hazardous waste, which are either recycled or disposed of off-site. Several of our plants are required to possess one or more environmental permits, and we believe that we are currently in compliance with the requirements of these permits.
The environmental regulations applicable to our business are becoming increasingly stringent and we incur capital and other expenditures annually to achieve compliance with environmental standards. We currently do not expect that the amount of expenditures required to comply with these environmental standards will have a material adverse effect on our operations, financial condition or liquidity. There can be no assurance, however, that future changes in federal, state, or local regulations, interpretations of existing regulations or the discovery of currently unknown problems or conditions will not require substantial additional expenditures. Similarly, while we believe that we are currently in compliance with all applicable environmental requirements, the extent of our liability, if any, for past failures to comply with laws, regulations and permits applicable to our operations cannot be determined and could have a material adverse effect on our operations, financial condition and liquidity.
RESEARCH & DEVELOPMENT
Although we continually seek new products and brands to take to market via our diverse distribution network and customer base, there were no material amounts expendedspent on research and development in the fiscal years ended October 1, 2016September 29, 2018, October 3, 2015, and September 27, 2014.30, 2017.
AVAILABLE INFORMATION
Our corporate internet address is www.deltaapparelinc.com. We make available free of charge on our website our SEC reports, including our Annual Reports on Form 10-K, Quarterly Reports on Form 10-Q, Current Reports on Form 8-K, Section 16 filings and any amendments
to those reports, as soon as reasonably practicable after we electronically file such material with, or furnish it to, the SEC. The information found on our website is not part of this, or any other, report that we file with or furnish to the SEC.
In addition, we will provide upon request, at no cost, paper or electronic copies of our reports and other filings made with the SEC. Requests should be directed to: Investor Relations Department, Delta Apparel, Inc., 322 South Main Street, Greenville, South Carolina 29601. Requests can also be made by telephone to 864-232-5200 extension 6621, or via email at investor.relations@deltaapparel.com.
We operate in a rapidly changing, highly competitive business environment that involves substantial risks and uncertainties, including, but not limited to, the risks identified below. The following risks, as well as risks described elsewhere in this report or in our other filings with the SEC, could materially affect our business, financial condition or operating results and the value of Company securities held by investors and should be carefully considered in evaluating our Company and the forward-looking statements contained in this report or future reports. The risks described below are not the only risks facing Delta Apparel. Additional risks not presently known to us or that we currently do not view as material may become material and may impair our business operations. Any of these risks could cause, or contribute to causing, our actual results to differ materially from expectations. We expressly disclaim any obligation to publicly update or revise any risk factors, whether as a result of new information, future events or otherwise, except as required by law.
The price and availability of purchased yarn and other raw materials is prone to significant fluctuations and volatility.volatility. Cotton is the primary raw material used in the manufacture of our apparel products. As is the case with other commodities, the price of cotton fluctuates and is affected by weather, consumer demand, speculation on the commodities market, and other factors that are generally unpredictable and beyond our control. As described under the heading “Raw“Business–Raw Materials”, the price of yarn purchased from Parkdale, our key supplier, is based upon the cost of cotton plus a fixed conversion cost. We set future cotton prices with purchase commitments as a component of the purchase price of yarn in advance of the shipment of finished yarn from Parkdale. Prices are set according to prevailing prices, as reported by the New York Cotton Exchange, at the time we enter into the commitments. Thus, we are subject to the commodity risk of cotton prices and cotton price movements, which could result in unfavorable yarn pricing for us. TheIn the past, the Company, and the apparel industry as a whole, has experienced unprecedented increases in cotton prices and price volatility in 2011 and 2012. Wethat we were unable to pass through to our customers, with the higher cost of cotton thereby negatively impacting the gross margins in our basics segmentActivewear and other businesses by $16.2 million in our 2012 fiscal year.significant amounts.
In addition, if Parkdale’s operations are disrupted and Parkdale is not able to provide us with our yarn requirements, we may need to obtain yarn from alternative sources. We may not be able to enter into short-term arrangements with substitute suppliers on terms as favorable as our current terms with Parkdale, which could negatively affect our business.
Current economicEconomic conditions may adversely impact demand for our products.products. The apparel industry is cyclical and dependent upon the overall level of demand for soft goods, which may or may not coincide with the overall level of discretionary consumer spending. These levels of demand change as regional, domestic and international economic conditions change. These economic conditions include, but are not limited to, employment levels, energy costs, interest rates, tax rates, inflation, personal debt levels, and uncertainty about the future, with many of these factors outside of our control. Overall, consumer purchases of discretionary items tend to decline during recessionary periods when disposable income is lower. As such, deterioration in general economic conditions that creates uncertainty or alters discretionary consumer spending habits could reduce our sales. Sometimes, however, the timing of increases or decreases in consumer purchases of soft goods can differ from the timing of increases or decreases in the overall level of economic activity. Weakening sales may require us to reduce manufacturing operations to match our output to demand or expected demand. Reductions in our
manufacturing operations may increase unit costs and lower our gross margins, causing a material adverse effect on our results of operations.
The apparel industry is highly competitive, and we face significant competitive threats to our businessbusines.s. The market for athletic and activewear apparel and headwearthe related accessory and other items we provide is highly competitive and includes many new competitors as well as increased competition from established companies, some of which are larger or more diversified and may have greater financial resources than we do. Many of our competitors have competitive advantages, including larger sales forces, betterstronger brand recognition among consumers, largerbigger advertising budgets, and greater economies of scale. We compete with these companies primarily on the basis of price, quality, service and brand recognition, all of which are important competitive factors in the apparel industry. Our ability to maintain our competitive edge depends upon these factors, as well as our ability to deliver new products at the best value for the customer, maintain positive brand recognition, and obtain sufficient retail floor space and effective product presentation at retail. If we are unable to compete successfully with our competitors, our business and results of operations will be adversely affected.
We may be restricted in our ability to borrow under our revolving credit facility or service our indebtedness.indebtedness. Significant operating losses or significant uses of cash in our operations could cause us to default on our asset-based revolving credit facility. We rely on our credit facility, as well as on cash generated by our operations, to fund our working capital and capital expenditure needs, to make acquisitions, to fund share repurchases under our Stock Repurchase Programshare repurchase program and to pay dividends should we choose to do so in the future. Our working capital needs are generally greater in advance of the spring and summer selling seasons. Availability under our credit facility is primarily a function of the levels of our accounts receivable and inventory, as well as the uses of cash in our operations. A significant
deterioration in our accounts receivable or inventory levels could restrict our ability to borrow additional funds or service our indebtedness. Moreover, our credit facility includes a financial covenant that if the availability under our credit facility falls below the amounts specified in our credit agreement, our Fixed Charge Coverage Ratio (“FCCR”) (as defined in our credit agreement) for the preceding 12-month period must not be less than 1.1 to 1.0. Although our availability at October 1, 2016,September 29, 2018, was above the minimum thresholds specified in our credit agreement, a significant deterioration in our business could cause our availability to fall below such thresholds, thereby requiring us to maintain the minimum FCCR specified in our credit agreement. Our credit facility also includes customary conditions to funding, representations and warranties, covenants, and events of default. The covenants include, among other things, limitations on asset sales, consolidations, mergers, liens, indebtedness, loans, investments, guaranties, acquisitions, dividends, stock repurchases, and transactions with affiliates. If an event of default under our credit facility occurred or became imminent, we may request our credit agreement lenders to provide a waiver. If we were unsuccessful in that endeavor, we could explore alternative sources of capital, whether debt or equity, which would likely be more expensive than the costs we incur under our credit facility. If we were unable to cure an un-waived event of default under our credit facility, we would be unable to borrow additional amounts under the facility, we could be unable to make acquisitions as well as fund share repurchases and pay dividends, and our lenders thereunder could accelerate our obligations under the agreement and foreclose on our assets subject to the liens in their favor. This circumstance would have a material adverse effect on our financial position and results of operations.
The inability to successfully implement or achieve the expected cost savings associated with certain strategic initiatives could adversely affect our financial position and results of operations. In response to our financial performance and results of operations during our 2014 fiscal year, as well as our near-term view of apparel market conditions at the time, we initiated a reorganization of our administrative structure at all levels to streamline decision-making and information flow as well as reduce duplicative and excess fixed costs. Moreover, in 2016 we completed a large-scale expansion and realignment effort across both our domestic and international manufacturing platforms that is intended to maximize production at our lower-cost facilities, eliminate additional duplicative fixed costs, and leverage the latest dyeing and finishing technology. In conjunction with this, we shuttered and sold our Maiden, North Carolina textile facility and began sourcing in-country fabric for use in our Mexico sew and screen-print facilities. We continue to evaluate other strategic initiatives focused on improving net profitability. The failure or inability to carry out any of these initiatives, any unexpected increases in the costs to carry out any of these initiatives, or the failure to achieve the cost savings or other financial or performance benefits expected from any of these initiatives could have a material adverse effect on our financial position or results of operations.
Deterioration in the financial condition of our customers or suppliers and changes in the operations and strategies of our customers or suppliers could adversely affect our financial position and results of operations.operations. We extend credit to our customers, generally without requiring collateral. The extension of credit involves considerable judgment and is based on an evaluation of each customer’s financial condition and payment history. We monitor credit risk exposure by periodically obtaining credit reports and updated financial statements on our customers. Deterioration in the economy, declines in consumer purchases of apparel, or disruption in the abilityapparel retail environment, or the inability of our customers to access liquidity could have an adverse effect on the financial condition of our customers. During the past several years, various retailers and other customers have experienced significant difficulties, including consolidations, restructurings, bankruptcies and liquidations. The inability of these retailers and other customers to overcome these difficulties may continue or even increase due to the current economic and retail market conditions. We maintain an allowance for doubtful accounts for potential credit losses based upon current conditions, historical trends, estimates and other available information. The size of this allowance is the result of our makinginformation, which involves judgments and determinations in the context of imperfect information,uncertainties, and, in retrospect, the allowance may turn out to have been insufficient. The inability to collect on sales to significant customers or a group of customers could have a material adverse effect on our financial condition and results of operations. Significant changes in the financial condition of any of our suppliers or other parties with which we do business could result in disruption to our business and have a material adverse effect on our financial condition and results of operations.
In addition, significant changes in the retail, merchandising and/or operational strategies employed by our customers may result in decreased sales of our products to such customers and could have a material adverse effect on our financial condition and results of operations. Likewise, significant changes in the operations of any of our suppliers or other
parties with which we do business could result in disruption to our business and have a material adverse effect on our financial condition and results of operations.
Our success depends, in part, on our ability to predict or effectively react to changing consumer preferences and trends.trends. The success of our businesses depends on our ability to anticipate and respond quickly to changing consumer demand and preferences in apparel and headwear.the related accessory and other items we provide. We believe that our brands are recognized by consumers across many demographics.demographics and geographies. The popularity, supply and demand for particular products can change significantly from year to yearyear-to-year based on prevailing fashion trends (particularly in our branded business)businesses) and on other factors and, accordingly, our ability to adapt to fashion trends in designing products is important to the success of our brands. If we are unable to quickly adapt to changes in consumer preferences in the design of products, our results of operations could be adversely affected. Moreover, because we and our customers project demand for our products based on estimated sales and fashion trends, the actual demand for our products sometimes falls short of what was projected. This can lead to higher inventory levels than desired. Excess inventory levels increase our working capital needs, and sometimes excess inventory must be sold at discounted prices, all of which could have an adverse impact on our business, financial condition and results of operations.
Our basics segment is subjectstrategy to significant pricing pressures which may decreasegrow our gross profit margins ifdirect-to-consumer business depends upon our ability to successfully open and operate new stores in a timely and cost-effective manner. Our strategy to grow our “brick and mortar” retail footprint depends on many factors including, among others, our ability to: identify desirable store locations; negotiate acceptable lease terms; hire, train and retain a growing workforce of store managers, sales associates and other personnel; successfully integrate new stores into our existing control structure and operations, including our information technology systems; and coordinate well with our ecommerce platforms and retail customers to minimize the competition within our sales channels.
If we expand into new geographic areas, we will need to successfully identify and satisfy the consumer preferences in these areas. In addition, we will need to address competitive, merchandising, marketing, distribution and other challenges encountered in connection with any expansion. Finally, we cannot ensure that any newly-opened stores will be received as well as, or achieve net sales or profitability levels comparable to those of, our existing stores in our estimated time periods, or at all. If our stores fail to achieve, or are unable to implement or achieve the expected cost savingssustain, acceptable net sales and profitability levels, our business overall may be materially harmed and we may incur significant costs associated with certain of our cost reduction strategies. We operate our basics segment in a highly competitive, price sensitive industry. Our strategy in this market environment is to be a low-cost producer and to differentiate ourselves by providing quality products and value-added services to our customers. In fiscal year 2012, we moved several functions within our private label business to our El Salvador facility to better serve customers through an enhanced and efficient product development process. In conjunction with this, we began a modernization of our decoration equipment to expand capabilities and lower costs. In addition, we announced in 2013 the consolidation of our domestic screen print operations as part of our continued focus on more efficient manufacturing and distribution strategies. This consolidation resulted in the closing of the Wendell, North Carolina decoration facility operated by our Soffe business unit and the consolidation of those operations within Soffe's Fayetteville, North Carolina facility. Further, in June 2014, we announced plans to consolidate some domestic fabric production for our basic, blank t-shirt products into our Ceiba Textiles facility in Honduras and subsequently made investments intended to modernize and provide more flexibility within that manufacturing platform. In fiscal 2016, we further realigned our manufacturing operations by expanding production at our offshore facilities and closing our Maiden, North Carolina textile facility. These initiatives, along with continual improvements in our production and delivery of products, are expected to lower our product costs and improve our results of operations. However, any unexpected increases in the costs to carry out these initiatives or the failure to achieve the cost savings expected from these initiatives could have a material adverse effect on our results of operations.relocating stores.
Our operations are subject to political, social, economic, and climate risks in Honduras, El Salvador and Mexico.Mexico. The majority of our products are manufactured in Honduras, El Salvador and Mexico, with a concentrationconcentrations in Honduras.Honduras and El Salvador. These countries from time to time experience political, social and economic instability, and we cannot be certain of their future stability. Instability in a country can lead to protests, riots and labor unrest. New government leaders canGovernments have changed, and may continue to change, and employment, wage and other laws and regulations may change, thereby increasing our costs to operate in that country.those countries. In addition, fire or natural disasters such as hurricanes, earthquakes, or floods can occur in these countries. Any of these political, social, economic or climatic events or conditions could disrupt our supply chain or increase our costs, adversely affecting our financial position and results of operations. In fiscal year 2018, our operations in and around San Pedro Sula, Honduras, were partially disrupted by the protests, unrest and government action associated with the November 2017 presidential elections in Honduras. The disruptions temporarily restricted the ability of our employees and suppliers to access our manufacturing facilities as well as our ability to ship products from our facilities, and negatively impacted our operations from a cost standpoint.
If we experience disruptions or interruptions within any of our facilities, operations, or distribution networks, we may be unable to deliver our products to the market and may lose sales and customers. We own or lease manufacturing facilities in the United States, Honduras, Mexico and El Salvador. We also own or lease distribution facilities located throughout the United States and maintain inventory at third-party distribution facilities in the United States. Any casualty or other circumstance that damages or destroys any of these material facilities or significantly limits their ability to function could have a material adverse effect on our business. Similarly, any significant interruption in the operation of any of these facilities or our related sourcing and transportation logistics functions, whether within or outside of our control, may delay shipment of merchandise to our customers, potentially damaging our reputation and customer relationships and causing a loss of revenue. Moreover, in the event of a regional disruption where we manufacture our products, we may not be able to shift our operations to a different geographic region, and we may have to cease or curtail our operations in a selected area. This may cause us to lose sales and customers. The types of disruptions that may occur include foreign trade disruptions, import restrictions, labor disruptions, embargoes, government intervention, natural disasters, regional pandemics and political disruptions such as those referenced in the immediately-preceding risk section. In addition, if we are unable to successfully coordinate the planning of inventory across these facilities and the related distribution activities, it could have a material adverse effect on our business, financial condition and results of operations.
Our success depends upon theThe talents and continued contributions of our key management. management are important to our success.We believe our future success depends on our ability to retain and motivate our key management, our ability to attract and integrate new members of management into our operations, and the ability of all personnel to work together effectively as a team. Our success is dependent in significant part on our ability to retain existing,team and attract additional, qualified personnel to execute our business strategy.
Our business is influenced by weather patterns. Our business is susceptibleinability to unseasonable weather conditions. For example, extended periodsaccomplish any of unusually warm temperatures during the winter season or cooler weather during the spring and summer seasonsthese goals could render portions ofhave a material adverse effect on our inventory incompatible with weather conditions and influence consumers to alter their apparel purchasing habits. Reduced sales volumes from extreme or prolonged unseasonable weather conditions could adversely affect our business and results of operations.
We currently pay income taxes at lower than statutory rates andChanges in U.S. or other tax laws or regulations may cause us to incur additional tax liabilityliability. .We are subject to income tax in the United States and in foreign jurisdictions in whichwhere we generate net operating profits. We benefit from a lower overall effective income tax rate due to the majority of our manufacturing operations being located in foreign tax-free locations.jurisdictions or foreign jurisdictions with tax rates that are lower than those in the United States. Our U.S. legal entity contracts with our foreign subsidiaries to manufacture products on its behalf, with the intercompany prices paid for the manufacturing services and manufactured products based on an arms-length standard and supported by an economic study. We have concluded that the profits earned in the tax-free locations will beare considered permanently reinvested. Thus, no U.S. deferred tax liability is recorded on these profits, causing our effective tax rate to be significantly below U.S. statutory rates. Our effective tax rate could be adversely affected by changes in the mix of earnings between the U.S. and tax-free or lower-tax foreign jurisdictions.
In addition, further changes to U.S. tax laws impacting how U.S. multinational corporations are taxed on foreign earnings or a need or requirement for us to remit tax-free earnings back to the U.S. could also have a material adverse effect on our tax expense and cash flow.
The December 22, 2017, Tax Cuts and Jobs Act of 2017 (the “New Tax Legislation”) significantly revised the U.S. corporate income tax code by, among other things, lowering federal corporate income tax rates, implementing a modified territorial tax system and imposing a repatriation tax on deemed repatriated cumulative earnings of foreign subsidiaries and also created a new requirement that certain income earned by controlled foreign corporations (“CFCs”) must be included currently in the gross income of the CFCs’ U.S. shareholder. During fiscal year 2018, we recognized provisional tax expense of $10.7 million in connection with the New Tax Legislation. The impacts of the New Tax Legislation may differ from our provisional or other estimates, possibly materially, due to, among other things, changes in interpretations and assumptions, guidance that may be issued and actions we may take as a result of the New Tax Legislation and may adversely affect our tax rate.
Our variable rate debt subjects us to interest rate risk that could cause our debt service obligations to increase significantly. The debt we incur under our asset-based revolving credit facility is at variable rates of interest, which exposes us to interest rate risk. If interest rates increase, our obligations on this variable rate indebtedness would increase even though the amount borrowed remained the same, and there would be a corresponding decrease in our net income and cash flows, including cash available for servicing our debt.
We may need to raise additional capital to grow our business.business. The rate of our growth, especially through acquisitions, depends, in part, on the availability of debt and equity capital. We may not be able to raise capital on terms acceptable to us or at all. If new sources of financing are required, but are insufficient or unavailable, we may be required to modify our growth and operating plans based on available funding, which could adversely affect our ability to grow the business.
We have expanded our business through acquisitions that could result in diversion of resources, an inability to integrate acquired operations and extra expenses.expenses. A part of our growth strategy has involved acquiring businesses that complement our existing business.
The negotiation of potential acquisitions and integration of acquired businesses could divert our management’s attention from our existing businesses, which could negatively impact our results of operations. In addition, if the integration of an acquired business is not successful or takes significantly longer than expected, or if we are unable to realize the expected benefits from an acquired business, it could adversely affect our financial condition and results of operations.
The price of energyEnergy, fuel and fuelrelated costs are prone to significant fluctuations and volatility, which could adversely affect our results of operationsoperations. .Our manufacturing operations require high inputs of energy, and therefore changes in energy prices directly impact our gross profits. In addition, we incur significant freight costs to transport goods between our offshore facilities and the United States, along with transportation expenses to ship products to our customers. The cost of energy and fuel fluctuates due to a number of factors outside of our control, including government policy and regulation and weather conditions. We continue to focus on methods that will reduce the amount of energy used in the manufacture of products to mitigate risks of fluctuations in the cost of energy. However, significant increases in energy and fuel prices may make us less competitive compared to others in the industry, which may have a material adverse effect on our financial position and results of operations.
Our business operations rely on our information systems and any material disruption or slowdown of our systems could cause operational delays,. reputational harm, or loss of revenue. We depend on information systems to, among other things, manage our inventory, process transactions, operate our websites, respond to customer inquiries, purchase, sell and ship goods on a timely basis, and maintain cost-effective operations. Management uses information systems to support decision-making and to monitor business performance. If we experience any disruptions or slowdowns with our information systems, we may fail to generate accurate and complete financial and operational reports essential for making decisions at various levels of management, which could lead to decisions being made that have adverse results. We have invested significant capital and expect future capital expenditures associated with the integration of our information technology systems across our businesses. This process involves the replacement and consolidation of technology platforms so that our businesses are served by fewer platforms, resulting in operational efficiencies and reduced costs. Our inability to effectively convert our operations to the new systems could cause delays in product fulfillment and reduced efficiency in our operations. Further, if changes in technology cause our information systems to become obsolete, or if our information systems are inadequate to handle our growth, we could lose customers. We are also subject to risks and uncertainties associated with the internet, including changes in required technology interfaces, website downtime and other technical failures. Our failure to successfully respond to these risks and uncertainties could reduce sales, increase costs and damage the reputation of our brands. In addition, we interact with many of our customers through our websites. Customers increasingly utilize our online platforms to purchase our merchandise. If we are unable to continue to provide consumers a user-friendly experience and evolve our platforms to satisfy consumer preferences, the growth of our ecommerce business and our sales may be negatively impacted. If our websites contain errors or other vulnerabilities which impede or halt service, it could result in damage to our brands’ images and a loss of revenue. In addition, we may experience operational problems with our information systems as a result of system failures, "cyber attack","cyber-attacks," computer viruses, security breaches, disasters or other causes. Any material disruption or slowdown of our information systems could cause operational delays and increased costs that could have a material adverse effect on our business and results of operations.
DataCompromises of our data security and privacy breaches could lead to liability and reputational damage.Our In the ordinary course of our business, involves the regular collectionwe often collect, retain, transmit, and use of sensitive and confidential information regarding customers and employees. These activitiesemployees and we process customer payment card and check information. There can be no assurance that we will not suffer a data compromise, that unauthorized parties will not gain access to personal information, or that any such data compromise or access will be discovered in a timely manner. Further, the systems currently used for transmission and approval of payment card transactions, and the technology utilized in payment cards themselves, all of which can put payment card data at risk, are subjectdetermined and controlled by the payment card industry, not by us. Computer hackers may attempt to contractual requirementspenetrate our computer system and, are highly regulated. Privacyif successful, misappropriate personal information, payment card or check information or confidential business information of our company. In addition, there may be non-technical issues, such as our employees, contractors or third parties with whom we do business or to whom we outsource business operations may attempt to circumvent our security measures in order to misappropriate such information, and information security laws are complex and constantly changing. Compliance with these laws and regulations may result in additional costs due to new systems and processes, and our non-compliance could lead to legal liability. Further, thepurposefully or inadvertently cause a breach involving such information. The methods used by third parties to obtain unauthorized access change frequently and may not be anticipated or immediately detected. Thus, despite the security measures we may have in place, an actual or perceived information security breach, whether due to "cyber attack","cyber-attack," computer viruses or other malicious software code, or human error or malfeasance, could occur. SuchActual or anticipated attacks may cause us to incur significant costs, including costs to deploy additional personnel and protection technologies, train employees and engage third-party experts and consultants. The collection, retention, transmission, and use of personal information is subject to contractual requirements and is highly regulated by a breachmultitude of state, federal, and foreign laws. Privacy and information security laws are complex and constantly changing. Compliance with these laws and regulations may result in additional costs due to new systems and processes, and our non-compliance could lead to legal liability. Any compromise of our customer, employee or company data, failure to prevent or mitigate the loss of personal or business information, or delay in detecting or providing prompt notice of any such compromise could attract media attention, damage our customer or other business relationships and reputation, result in lost sales, fines, lawsuitssignificant litigation or other costs and involve the loss of confidential company information, any or all of which could have a material adverse effect on our business, financial condition and results of operations.
Our business could be harmed if we are unable to deliver our products to the market due to casualty or other problems with our manufacturing operations or distribution network. We own or lease manufacturing facilities in the United States, Honduras, Mexico and El Salvador. We also own or lease distribution facilities located throughout the United States and maintain inventory at third-party distribution facilities in the United States. Any casualty or other circumstance that damages or destroys any of these material facilities or significantly limits their ability to function could materially affect our business in an adverse way. Similarly, any significant interruption in the operation of any of these facilities or our related sourcing and transportation logistics functions, whether within or outside of our control, may delay shipment of merchandise to our customers, potentially damaging our reputation and customer relationships and causing a loss of revenue. In addition, if we are unable to successfully coordinate the planning of inventory across these facilities and the related distribution activities, it could have a material adverse effect on our business, financial condition and results of operations.
Failure of our operations to comply with safety, health and environmental regulations could have a material adverse effect on our financial position and results of operations. Our operations must meet extensive federal, state and local regulatory standards in
the areas of safety, health and environmental pollution controls. There can be no assurance that interpretations of existing regulations, future changes in existing laws, or the enactment of new laws and regulations will not require substantial additional expenditures. Although we believe that we are in compliance in all material respects with existing regulatory requirements in these areas, the extent of our liability, if any, for the discovery of currently unknown problems or conditions, or past failures to comply with laws, regulations and permits applicable to our operations, cannot be determined and could have a material adverse effect on our financial position and results of operations.
We are subject to periodic litigation in both domestic and international jurisdictions that may adversely affect our financial position and results of operationsoperations. .From time to time we may be involved in legal or regulatory actions regarding product liability, employment practices, intellectual property infringement, bankruptcies and other litigation.litigation or enforcement matters. Due to the inherent
uncertainties of litigation in both domestic and foreign jurisdictions, we cannot accurately predict the ultimate outcome of any such proceedings. These proceedings could cause us to incur costs and may require us to devote resources to defend against these claims and could ultimately result in a loss or other remedies such as product recalls, which could adversely affect our financial position and results of operations. For a description of current material legal proceedings, see Part I, Item 3, Legal Proceedings.
Product liability issues could lead to recalls, claims and negative publicity, and adversely affect our results of operations. Our operations are subject to certain product liability risks common to most brands and manufacturers and our ability to maintain consumer confidence in the safety and quality of our products is vital to our success. We have implemented product safety and quality programs and standards that we follow and we expect our supplier partners to strictly adhere to applicable requirements and best practices. In addition to selling apparel and accessory products, we recently entered into a joint venture involving the sale of a branded alcoholic beverage and we also license one of our brands for use in connection with restaurant, food and beverage services. Selling products intended for human consumption carries inherent risks and uncertainties. If we or our supplier or license partners fail to comply with applicable product safety and quality standards and our products or those otherwise associated with our brands are, or become, unsafe, non-compliant, contaminated or adulterated, we may be required to recall our products and encounter product liability claims and negative publicity. Any of these events could adversely affect our reputation, business or results of operations.
We rely on the strength of our trademarks and could incur significant costs to protect these trademarks and our other intellectual property.property. Our trademarks, including Salt Life®Life®, Soffe®Soffe®, Junk Food®, Coast®Coast®, Intensity Athletics®Athletics®, Kudzu®Kudzu®, Pro Weight®Weight®, Magnum Weight®Weight®, and the Delta Design, among others, are important to our marketing efforts and have substantial value. We aggressively protect these trademarks and have incurred legal costs in the past to establish and protect these trademarks. We may in the future be required to expend significant additional resources to protect these trademarks and our other intellectual property. The loss or limitation ofIntellectual property litigation may be costly and may divert management's attention from the exclusive right to use our trademarks or other intellectual property could adversely affect our sales and results of operations.
A significant portionoperation of our business relies upon license agreements. We rely on licensed products for a significant partbusiness. Adverse determinations in any litigation may result in the loss of our sales. We believe that our license agreements in the aggregate areproprietary rights, subject us to significant liabilities or require us to seek licenses from third parties, which may not be available on commercially reasonable terms, if at all. Any of significant value to our business. The loss of or failure to obtain, renew or extend license agreements on favorable terms could adversely affect our sales andthese outcomes may have a material adverse effect on our financial condition, and results of operations.operations or cash flows.
We may be subject to the impairment of acquired intangible assetsassets. .When we acquire a business, a portion of the purchase price of the acquisition may be allocated to goodwill and other identifiable intangible assets. The amount of the purchase price that is allocated to goodwill is determined by the excess of the purchase price over the net identifiable assets acquired. At October 1, 2016,September 29, 2018, and October 3, 2015,September 30, 2017, our goodwill and other intangible assets were approximately $57.7$53.7 million and $58.9$36.1 million, respectively. We conduct an annual review, and more frequent reviews if events or circumstances dictate, to determine whether goodwill is impaired. We also determine whether impairment indicators are present related to our identifiable intangible assets. If we determine that goodwill or intangible assets are impaired, we would be required to write down the value of these assets. We completed our annual impairment test of goodwill on the first day of our 20162018 third fiscal quarter. Based on the valuation, we concluded there was no impairment on the goodwill recorded on our financial statements. We also concluded that there are no additional indicators of impairment related to our intangible assets. There can, however, be no assurance that we will not be required to take an impairment charge in the future, which could have a material adverse effect on our results of operations.
Changes in the regulations and laws regarding ecommerce could reduce the growth and lower the profitability of our internet sales. The ecommerce industry has undergone, and continues to undergo, rapid development and change. There have been continuing efforts to increase the legal and regulatory obligations of and restrictions on companies conducting commerce through the internet, primarily in the areas of taxation, consumer privacy and protection of consumer personal information. These laws and regulations could increase the costs and liabilities associated with our ecommerce activities, thereby negatively impacting our results of operations.
Significant changes to international trade regulations could adversely affect our results of operations.operations. The majority of our products are manufactured in Honduras, El Salvador and Mexico. We therefore benefit from current free trade agreements and other duty preference programs, including the North American Free Trade Agreement (“NAFTA”) and its anticipated successor agreement, the U.S.-Mexico-Canada Agreement (“USMCA”), as well as the Central America Free Trade Agreement (“CAFTA”). Our claims for duty free or reduced duty treatment under CAFTA, NAFTANAFTA/USMCA and other available programs are largely conditioned on our ability to produce or obtain accurate records (some of which are provided to us by third parties) about production processes and sources of raw materials. Fairly recent changes in the United States federal government have caused uncertainty about the future of trade partnerships and treaties, as the current administration has expressed its desire to specifically modify existing trade agreements and has imposed increased tariffs on goods imported into the United States and raised the possibility of imposing further increases to such tariffs. These tariffs have increased our costs to source certain products imported from other countries. Subsequent repeal or further modification of NAFTANAFTA/USMCA or CAFTA, further increases to tariffs on goods imported into the United States, or the inadequacy or unavailability of supporting records, could have a material adverse effect on our results of operations.
In addition, our products are subject to foreign competition, which in the past has been faced with significant U.S. government import restrictions. The extent of import protection afforded to domestic apparel producers has been, and is likely to remain, subject to political considerations. The elimination of import protections for domestic apparel producers could significantly increase global competition, which could adversely affect our business and results of operations.
Our failure to comply with trade and other regulations could lead to investigations or actions by government regulators and negative publicity. The labeling, distribution, importation, marketing, and sale of our products are subject to extensive regulation by various federal agencies, including the Federal Trade Commission, Consumer Product Safety Commission and state attorneys general in the United States. Any failure to comply with international tradesuch regulations could cause us to become subject to investigation and enforcement actions resulting in significant penalties or claims or in our inability to conduct business, adversely affecting our results of operations. A complaint was filed in March 2012
Our international operations are also subject to compliance with the U.S. Department of Labor's Office of Trade & Labor AffairsForeign Corrupt Practices Act (the “FCPA”) and other anti-bribery laws applicable to our operations. In many foreign countries, particularly in those with developing economies, it may be a local custom that businesses operating in such countries engage in business practices that are prohibited by the AFL-CIOFCPA or other U.S. and various Honduran union federations alleging thatforeign laws and regulations applicable to us. Although we have implemented procedures designed to ensure compliance with the Honduran government failedFCPA and similar laws, some of our agents or other channel partners, as well as those companies to enforce its labor lawswhich we outsource certain of our business operations, could take actions in violation of the provisions of CAFTA. The complaint contains
various and sundry allegations of Honduran labor law violations by U.S.-based companies with Honduran operations, including our Ceiba Textiles operations. We contend that the allegations against Ceiba Textiles have no merit. The U.S. Department of Labor has initiated an investigation of the allegations in the complaint. We believe that the legal action, if any, that may result from this investigation would be an action by the U.S. government against Honduras under CAFTA, not a legal action against us related to the specific allegations contained in the complaint. However, an action against Honduras could result in sanctions or other penalties against Honduras under CAFTA or in other governmental action thatpolicies. Any such violation could have a material negativeand adverse effect on our ability to conduct business there.
business.
Changes in domestic or foreign employment regulations or changes in our relationship with our employees could adversely affect our results of operations.As of October 1, 2016,September 29, 2018, we employed approximately 7,700 employees worldwide, with approximately 6,7006,600 of these employees beinglocated in Honduras, El Salvador and Mexico. Changes in domestic and foreign laws governing our relationships with our employees, including wage and human resources laws and regulations, labor standards, overtime pay, unemployment tax rates, workers' compensation rates and payroll taxes, would likely have a direct impact on our operating costs. A significant increaseIncreases in wage rates in the countries in which we operate have occurred, and any further significant increases in wage rates in those countries could have a material adverse impact on our operating results. Approximately 1,220A total of approximately 3,000 employees at onetwo of our facilities in San Pedro Sula, Honduras, are party to a three-yearmulti-year collective bargaining agreement and approximately 1,700 employees at a separate facility in San Pedro Sula, Honduras are party to a three-year collective bargaining agreement.agreements. We have historically conducted our operations without significant labor disruptions and believe that our relations with our employees are generally good. However, ifa change in labor relations were to change, it could adversely affect the productivity and ultimate cost of our manufacturing operations.
Recent healthcare legislation may continue to increase our costs and reduce our future profitability. To attract and retain employees in our operations in the United States, we maintain a competitive health insurance program for those employees and their dependents. The Patient Protection and Affordable Care Act, signed into law in 2010, has increased our annual employee healthcare cost obligations and is expected to continue to increase our annual employee healthcare cost obligations going forward. We cannot predict the effect that this legislation, or any future state or federal healthcare legislation or regulation, will ultimately have on our business. However, these rising healthcare costs and universal healthcare coverage in the United States could result in significant long-term costs to us, which could adversely affect our future profitability and financial condition. Also, rising healthcare costs could force us to make changes to our benefits program, which could negatively impact our ability to attract and retain employees.
We are subject to foreign currency exchange rate fluctuations. We manufacture the majority of our products outside of the United States, exposing us to currency exchange rate fluctuations. In addition, movements in foreign exchange rates can affect transaction costs because we source products from various countries. We may seek to mitigate our exposure to currency exchange rate fluctuations but our efforts may not be successful. Accordingly, changes in the relative strength of the United States dollar against other currencies could adversely affect our business.
The value of our brands, sales of our products and our licensing relationships could be impacted by negative publicity resulting from violations of manufacturing or employee safety standards or labor laws, or unethical business practices, by our suppliers and independent contractors.We are committed to ensuring that all of our manufacturing facilities comply with our strict internal code of conduct, applicable laws and regulations, and the codes and principles to which we subscribe, including those of Worldwide Responsible Accredited Production (WRAP) and the Fair Labor Association (FLA).subscribe. In addition, we require our suppliers and independent contractors to operate their businesses in compliance with the laws and regulations that apply to them. However, we do not control these suppliers and independent contractors. A violation of our policies, applicable manufacturing or employee safety standards and codes of conduct, labor laws or other laws or regulations by our suppliers or independent contractors could interrupt or otherwise disrupt our operations. Negative publicity regarding the production or operating methods of any of our suppliers or independent contractors or their failure to comply with our policies, applicable manufacturing or employee safety standards and codes of conduct, labor laws or other laws or regulations could adversely affect our reputation, brands, sales and licensing relationships, which could adversely affect our business and results of operations.
The market price of our shares is affected by the illiquidity of our shares, which could lead to our shares trading at prices that are significantly lower than expected.expected. Various investment banking firms have informed us that public companies with relatively small market capitalizations have difficulty generating institutional interest, research coverage or trading volume. This illiquidity can translate into price discounts as compared to industry peers or to the shares’ inherent value. We believe that the market perceives us to have a relatively small market capitalization. This has led and could continue to lead to our shares trading at prices that are significantly lower than our estimate of their inherent value.
As of November 15, 2016,6, 2018, we had 7,579,2556,858,697 shares of common stock outstanding. We believe that approximately 67%57% of our stock is beneficially owned by entities and individuals who each own more than 5% of the outstanding shares of our common stock. Included in the 67%57% are institutional investors that beneficially own more than 5% of the outstanding shares. These institutional investors own approximately 54%41% of the outstanding shares of our common stock. Sales of substantial amounts of our common stock in the public market by any of these large holders could adversely affect the market price of our common stock.
The market price of our shares may be highly volatile, and the stock market in general can be highly volatile.Fluctuations in our stock price may be influenced by, among other things, general economic and market conditions, conditions or trends in our industry, changes in the market valuations of other apparel companies, announcements by us or our competitors of significant acquisitions, strategic partnerships or other strategic initiatives, and trading volumes. Many of these factors are beyond our control, but may cause the market price of our common stock to decline, regardless of our operating performance.
Efforts to comply with the evolving regulatory landscape regarding public company governance and disclosure could result in significant additional costs. We are committed to maintaining high standards for internal controls over financial reporting, corporate governance and public disclosure. However, evolving laws, regulations and standards relating to these issues such as the Dodd-Frank Wall Street Reform and Consumer Protection Act, the Sarbanes-Oxley Act, and similar regulations have created significant additional compliance requirements for companies like us. We have devoted and will continue to devote significant resources, and our management team has devoted and will continue to devote substantial time, to comply with these standards. This may lead to increases in our cost structure, divert the attention of our management team from revenue generating activities to compliance efforts, and could have a material adverse effect on our business, financial condition and results of operations.
| |
| ITEM 1B. | UNRESOLVED STAFF COMMENTS |
None.
Our principal executive office is located in a leased facility in Greenville, South Carolina. We own and lease properties supporting our administrative, manufacturing, distribution and direct retail activities. The majority of our products are manufactured through a combination of facilities that we either own, or lease and operate. As of October 1, 2016September 29, 2018, we owned or leased nineeleven manufacturing
facilities (located in the United States, Honduras, El Salvador and Mexico) and nineowned, leased or operated through third parties twelve distribution facilities (all within the United States). In addition, as of September 29, 2018, we operate three leased factory-direct stores, five flagshipoperated 13 branded retail stores and a leased showroom.
Our primary manufacturing and distribution facilities are as follows:
|
| | | | |
| Location | | Utilization | | Segment |
| Ceiba Textiles, Honduras* | | Knit/dye/finish/cut | | Basics and brandedDelta Group/Salt Life Group |
| Honduras Plant, San Pedro Sula, Honduras* | | Sew | | Basics and brandedDelta Group/Salt Life Group |
| Cortes Plant, San Pedro Sula, Honduras* | | Sew | | Basics and brandedDelta Group/Salt Life Group |
| Mexico Plant, Campeche, Mexico* | | Cut/sew | | Basics and brandedDelta Group/Salt Life Group |
| Textiles LaPaz, La Paz, El Salvador* | | Cut/sew/decoration | | Basics and brandedDelta Group/Salt Life Group |
| Campeche Sportswear, Campeche, Mexico* | | Decoration | | Basics and brandedDelta Group/Salt Life Group |
| Fayetteville Plant, Fayetteville, NC | | Sew/Cut/sew/decoration | | BrandedDelta Group/Salt Life Group |
| Rowland Plant, Rowland, NC | | Sew | | Basics and brandedDelta Group |
Art Gun, Miami,DTG2Go, Clearwater, FL* | | Decoration/distribution | | BasicsDelta Group |
| DTG2Go, Sparks, NV* | | Decoration/distribution | | Delta Group |
| Soffe Distribution Center, Fayetteville, NC | | Distribution | | BrandedDelta Group |
| Salt Life Distribution Center, Fayetteville, NC | | Distribution | | Salt Life Group |
| Distribution Center, Clinton, TN | | Distribution | | BasicsDelta Group |
| Distribution Center, Santa Fe Springs, CA* | | Distribution | | Basics and brandedDelta Group |
| Distribution Center, Miami, FL* | | DistributionDecoration/distribution | | Basics and brandedDelta Group |
| Distribution Center, Cranbury, NJ* | | Distribution | | Basics and brandedDelta Group |
| Distribution Center, Dallas, TX** | | Distribution | | BasicsDelta Group |
Distribution Center, Chicago, IL*** | | Distribution | | BasicsDelta Group |
| DC Annex, Fayetteville, NC* | | Distribution | | BrandedDelta Group |
| Distribution Center, Opelika, AL** | | Distribution | | Delta Group |
|
| |
| * | Denotes leased location |
| ** | Denotes third party-operated distribution facility |
*** | Denotes third party-operated distribution facility opened in September, 2016 |
We believe that all of our facilities are suitable for the purposes for which they are designed and are generally adequate to allow us to remain competitive. We continue to maintain a sharp focus on improving our supply chain, lowering our product costs and reducing the operating capital required in our business. We will continue to take the necessary actions to balance capacities with demand as needed. Substantially all of our assets are subject to liens in favor of our lenders under our U.S. asset-based secured credit facility and our Honduran credit facility.
U.S. Consumer Product Safety Commission
We previously received an inquiry from the U.S. Consumer Product Safety Commission (“Commission”) regarding a children's drawstring hoodie product sourced, distributed and sold by Junkfood, and its compliance with applicable product safety standards. The Commission subsequently investigated the matter, including whether Junkfood complied with the reporting requirements of the Consumer Product Safety Act (“CPSA”), and the garments in question were ultimately recalled. Junkfood subsequently received notification from the Commission staff alleging that Junkfood knowingly violated CPSA Section 15(b) and that the staff will recommend to the Commission a $900,000 civil penalty. We disputed the Commission's allegations and subsequently responded to the Commission staff regarding its recommended penalty, setting forth a number of defenses and mitigating factors that could have resulted in a much lower penalty, if any, ultimately imposed by a court had the matter proceeded to litigation.
We believe that any claims brought by the Commission seeking enforcement of the recommended penalty would be time-barred under any reasonable interpretation of the applicable civil statute of limitations. Accordingly, we consider this matter to be resolved, and during the quarter ended October 1, 2016, we reversed the liability previously recorded in connection with this matter.
California Wage and Hour Litigation
We were served with a complaint in the Superior Court of the State of California, County of Los Angeles, on or about March 13, 2013, by a former employee of our Delta Activewear business unit at our Santa Fe Springs, California distribution facility alleging violations of California wage and hour laws and unfair business practices with respect to meal and rest periods, compensation and wage statements, and related claims (the "Complaint"). The Complaint was brought as a class action and sought to include all of our Delta Activewear business unit's current and certain former employees within California who are or were non-exempt under applicable wage and hour laws. The Complaint also named as defendants Junkfood, Soffe, an independent contractor of Soffe, and a former employee, and sought to include all current and certain former employees of Junkfood, Soffe and the Soffe independent contractor within California who are or were non-exempt under applicable wage and hour laws. The Complaint sought injunctive and declaratory relief, monetary damages and compensation, penalties, attorneys' fees and costs, and pre-judgment interest.
On or about August 22, 2014, we were served with an additional complaint in the Superior Court of the State of California, County of Los Angeles, by a former employee of Junkfood and two former employees of Soffe at our Santa Fe Springs, California distribution facility alleging violations of California wage and hour laws and unfair business practices the same or substantially similar to those alleged in the Complaint and seeking the same or substantially similar relief as sought in the Complaint. This complaint was brought as a class action and sought to include all current and certain former employees of Junkfood, Soffe, our Delta Activewear business unit, the Soffe independent contractor named in the Complaint and an individual employee of such contractor within California who are or were non-exempt under applicable wage and hour laws.
On September 17, 2015, an agreement in principle was reached between all parties to settle the above-referenced wage and hour matters, with the defendants in the matters agreeing to pay an aggregate amount of $300,000 in exchange for a comprehensive release of all claims at issue in the matters. Delta Apparel, Inc., Soffe and Junkfood collectively agreed to contribute $200,000 towards the aggregate settlement amount, and we have this amount included in our accrued expenses as of October 1, 2016, and October 3, 2015. The settlement agreement was approved by the applicable court and these matters have been finally resolved, with the agreed amounts funded subsequent to the 2016 fiscal year-end.
The Sports Authority Bankruptcy Litigation
Soffe is involved in several related litigation matters stemming from The Sports Authority's ("TSA") March 2, 2016, filing of a voluntary petition(s) for relief under Chapter 11 of the United States Bankruptcy Code (the "TSA Bankruptcy"). Prior to such filing, Soffe provided TSA with products to be sold on a consignment basis pursuant to a "pay by scan" agreement and the litigation matters relate to Soffe's interest in the products it provided TSA on a consignment basis (the "Products") and the proceeds derived from the sale of such products (the "Proceeds").
TSA Stores, Inc. and related entities TSA Ponce, Inc. and TSA Caribe, Inc. filed an action against Soffe on March 16, 2016, in the United States Bankruptcy Court for the District of Delaware (the "TSA Action") essentially seeking a declaratory judgment that: (i) Soffe does not own the Products but rather has a security interest that is not perfected or senior and is avoidable; (ii) Soffe only has an unsecured claim against TSA; (iii) TSA and TSA's secured creditors have valid, unavoidable and senior rights in the Products and the Products are the property of TSA’s estate; (iv) Soffe does not have a perfected purchase money security interest in the Products; (v) Soffe is not entitled to a return of the Products; and (vi) TSA can continue to sell the Products and Soffe is not entitled to any proceeds from such sales other than as an unsecured creditor. The TSA Action also contains claims seeking to avoid Soffe's filing of a financing statement related to the Products as a preference and recover the value of that transfer as well as to disallow Soffe's claims until it has returned preferential transfers or their associated value. TSA also brings a claim for a permanent injunction barring Soffe from taking certain actions. We
believe that many of the claims in the TSA Action, including TSA’s claim for injunction, are now moot as a result of Soffe’s agreement to permit TSA to continue selling the Products in TSA’s going-out-of-business sale.
On May 16, 2016, TSA lender Wilmington Savings Fund Society, FSB, as Successor Administrative and Collateral Agent ("WSFS"), intervened in the TSA Action seeking a declaratory judgment that: (i) WSFS has a perfected interest in the Products and Proceeds that is
senior to Soffe's interest; and (ii) the Proceeds paid to Soffe must be disgorged pursuant to an order previously issued by the court. WSFS's intervening complaint also contains a separate claim seeking the disgorgement of all Proceeds paid to Soffe along with accrued and unpaid interest.
Soffe has asserted counterclaims against WSFS in the TSA Action essentially seeking a declaratory judgment that: (i) WSFS is not perfected in the Products; and (ii) WSFS's interest in the Products is subordinate to Soffe's interest.
On May 24, 2016, Soffe joined an appeal filed by a number of TSA consignment vendors in the United States District Court for the District of Delaware challenging an order issued in the TSA Bankruptcy that, should WSFS or TSA succeed in the TSA Action, granted TSA and/or WSFS a lien on all Proceeds received by Soffe and requiring the automatic disgorgement of such Proceeds. As of November 14, 2016, Soffe and another entity are the remaining consignment vendors pursuing this appeal.
Although we will continue to vigorously defend against the TSA Action and pursue the above-referenced counterclaims and appeal, should TSA and/or WSFS ultimately prevail on their claims, we could be forced to disgorge all Proceeds received and forfeit our ownership rights in any Products that remain in TSA's possession. We believe the range of possible loss in this matter is currently $0 to $3.3 million; however, it is too early to determine the probable outcome and, therefore, no amount has been accrued related to this matter.
ITEM 4. MINE SAFETY DISCLOSURES
Not applicable.
PART II
| |
| ITEM 5. | MARKET FOR REGISTRANT’S COMMON EQUITY, RELATED STOCKHOLDER MATTERS AND ISSUER PURCHASES OF EQUITY SECURITIES. |
Market Information for Common Stock: The common stock of Delta Apparel, Inc. is listed and traded on the NYSE MKTAmerican under the symbol “DLA”. As of November 15, 2016,6, 2018, there were approximately 868812 record holders of our common stock.
The following table sets forth, for each of the periods indicated below, the high and low sales prices per share of our common stock as reported on the NYSE MKTAmerican.
| | | | | High | | Low | | High | | Low |
| | | Sale Price | | Sale Price | | Sale Price | | Sale Price |
| Fiscal Year 2016: | | |
| Fiscal Year 2018: | | |
| September Quarter | | $25.52 | | $15.31 | | $19.49 | | $16.30 |
| June Quarter | | $22.93 | | $17.01 | | $20.30 | | $16.90 |
| March Quarter | | $19.93 | | $11.61 | | $22.10 | | $17.04 |
| December Quarter | | $18.10 | | $13.70 | | $22.00 | | $19.60 |
| | | |
| Fiscal Year 2015: | | |
| Fiscal Year 2017: | | |
| September Quarter | | $19.44 | | $11.54 | | $22.88 | | $18.00 |
| June Quarter | | $15.35 | | $11.91 | | $23.47 | | $16.95 |
| March Quarter | | $12.45 | | $8.50 | | $21.84 | | $15.55 |
| December Quarter | | $11.35 | | $8.35 | | $21.93 | | $14.85 |
Dividends: Our Board of Directors did not declare, nor were any dividends paid, during fiscal years 20162018 and 2015.2017. Subject to the provisions of any outstanding blank check preferred stock (none of which is currently outstanding), the holders of our common stock are entitled to receive whatever dividends, if any, that may be declared from time to time by our Board of Directors in its discretion from funds legally available for that purpose. Pursuant to the terms of our credit facility, we are allowed to make cash dividends and stock repurchases if (i) as of the date of the payment or repurchase and after giving effect to the payment or repurchase, we have availability on that date of not less than 15% of the lesser of the borrowing base or the commitment, and average availability for the 30-day period immediately preceding that date of not less than 15% of the lesser of the borrowing base or the commitment; and (ii) the aggregate amount of dividends and stock repurchases after May 10, 2016, does not exceed $10 million plus 50% of our cumulative net income (as defined in the Amended Credit Agreement) from the first day of the third quarter of fiscal year 2016 to the date of determination. At October 1, 2016,September 29, 2018, and October 3, 2015,September 30, 2017, there was $10.7$14.7 million and $7.3$7.7 million, respectively, of retained earnings free of restrictions to make cash dividends or stock repurchases.
Any future cash dividend payments will depend upon our earnings, financial condition, capital requirements, compliance with loan covenants and other relevant factors.
Purchases of our Own Shares of Common Stock: See Note 15 - Repurchase of Common Stock and Note 9 - Debt, in Item 15, which is incorporated herein by reference.
Securities Authorized for Issuance Under Equity Compensation Plans: The information required by Item 201(d) of Regulation S-K is set forth under “Item 12. Security Ownership of Certain Beneficial Owners and Management and Related Stockholder Matters” of this Annual Report, which information is incorporated herein by reference.
Comparison of Total Return Among Delta Apparel, Inc., CRSP NYSE MKT Index (US), and CRSP NYSE MKT Wholesale & Retail Trade Index: Our common stock began trading on the NYSE MKT (previously the NYSE Amex) on June 30, 2000, the last trading day of our fiscal year 2000. Prior to that date, no securities of Delta Apparel were publicly traded. Set forth below is a line graph comparing the yearly change in the cumulative total stockholder return, assuming dividend reinvestment, of our common stock with (1) the CRSP NYSE MKT Index (US) and (2) the CRSP NYSE MKT Wholesale and Retail Trade Index, which is comprised of all NYSE MKT companies with SIC codes from 5000 through 5999. This performance graph assumes that $100 was invested in the common stock of Delta Apparel and comparison groups on July 2, 2011, and that all dividends have been reinvested.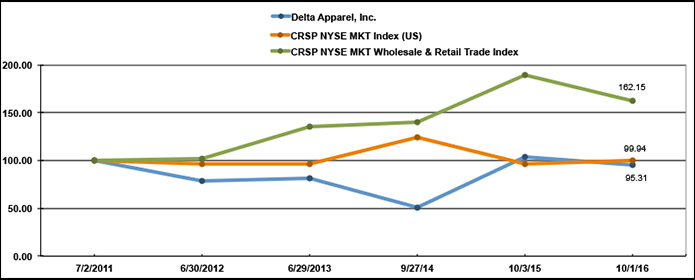
|
| | | | | | | | | | | | | | | | | | | | | | | | |
| | | 2011 | | 2012 | | 2013 | | 2014 | | 2015 | | 2016 |
| Delta Apparel, Inc. | | $ | 100.00 |
| | $ | 79.10 |
| | $ | 81.64 |
| | $ | 50.96 |
| | $ | 103.94 |
| | $ | 95.31 |
|
| CRSP NYSE MKT Index (US) | | $ | 100.00 |
| | $ | 96.51 |
| | $ | 96.55 |
| | $ | 124.48 |
| | $ | 96.63 |
| | $ | 99.94 |
|
| CRSP NYSE MKT Wholesale & Retail Trade Index | | $ | 100.00 |
| | $ | 102.05 |
| | $ | 135.46 |
| | $ | 140.57 |
| | $ | 189.86 |
| | $ | 162.15 |
|
| |
| ITEM 6. | SELECTED FINANCIAL DATA |
The selected financial data includes the financial position and results of operations of acquired businesses beginning on the date of acquisition. On August 30, 2016, we acquired Coast Apparel, and on August 27, 2013, we purchased substantially all
We are a smaller reporting company as defined by Rule 12b-2 of the assetsSecurities Exchange Act of Salt Life Holdings, LLC, including all of its domestic and international trademark rights in the Salt Life brand. Prior to the acquisition of Salt Life, we sold Salt Life-branded products under exclusive license agreements which began in January 2011. The consolidated statements of operations data for the years ended June 30, 2012, June 29, 2013, and the transition period ended September 28, 2013 and the consolidated balance sheet data as of June 30, 2012, June 29, 2013, September 28, 2013, and September 27, 2014, are derived from,1934 and are qualified by referencenot required to our audited consolidated financial statements not included inprovide the information under this document. The consolidated statement of operations data for the years ended September 27, 2014, October 3, 2015, and October 1, 2016, and the consolidated balance sheet data as of October 3, 2015, and October 1, 2016, are derived from, and are qualified by reference to, our audited consolidated financial statements included elsewhere in this document. We operate on a 52-53 week fiscal year ending on the Saturday closest to September 30. All fiscal years shown were 52-week years with the exception of fiscal year 2015, which was a 53-week year, and the 13-week transition period ended September 28, 2013. Historical results are not necessarily indicative of results to be expected in the future. The selected financial data should be read in conjunction with the Consolidated Financial Statements and the related notes as indexed on page F-1 and “Management’s Discussion and Analysis of Financial Condition and Results of Operations” in Item 7.
|
| | | | | | | | | | | | | | | | | | | | | | | |
| | Period Ended |
| | October 1,
2016 | | October 3,
2015 | | September 27,
2014 | | September 28, 2013* | | June 29,
2013 | | June 30,
2012 |
| | (In thousands, except per share amounts) |
| Statement of Operations Data: | | | | | | | | | | | |
| Net sales | $ | 425,249 |
| | $ | 449,142 |
| | $ | 452,901 |
| | $ | 122,559 |
| | $ | 490,523 |
| | $ | 489,923 |
|
| Cost of goods sold | (331,750 | ) | | (360,823 | ) | | (367,160 | ) | | (95,439 | ) | | (381,014 | ) | | (406,200 | ) |
| Selling, general and administrative expenses | (76,578 | ) | | (81,086 | ) | | (86,275 | ) | | (26,588 | ) | | (94,944 | ) | | (89,973 | ) |
| Restructuring costs | (1,741 | ) | | — |
| | — |
| | — |
| | — |
| | — |
|
| Change in fair value of contingent consideration | 600 |
| | 500 |
| | (200 | ) | | — |
| | — |
| | — |
|
| Gain on sale of business | — |
| | 7,704 |
| | — |
| | — |
| | — |
| | — |
|
| Other income (expense), net | 552 |
| | 682 |
| | (927 | ) | | 24 |
| | (662 | ) | | 28 |
|
| Operating income (loss) | 16,332 |
| | 16,119 |
| | (1,661 | ) | | 556 |
| | 13,903 |
| | (6,222 | ) |
| Interest expense, net | 5,287 |
| | 6,021 |
| | 5,792 |
| | 1,033 |
| | 3,997 |
| | 4,132 |
|
| Earnings (loss) before income taxes | 11,045 |
| | 10,098 |
| | (7,453 | ) | | (477 | ) | | 9,906 |
| | (10,354 | ) |
| Provision for (benefit from) income taxes | 2,081 |
| | 2,005 |
| | (6,493 | ) | | (1,045 | ) | | 722 |
| | (7,907 | ) |
| Net earnings (loss) | $ | 8,964 |
| | $ | 8,093 |
| | $ | (960 | ) | | $ | 568 |
| | $ | 9,184 |
| | $ | (2,447 | ) |
| | | | | | | | | | | | |
| Basic earnings (loss) per common share: | $ | 1.16 |
| | $ | 1.03 |
| | $ | (0.12 | ) | | $ | 0.07 |
| | $ | 1.12 |
| | $ | (0.29 | ) |
| | | | | | | | | | | | |
| Diluted earnings (loss) per common share: | $ | 1.12 |
| | $ | 1.00 |
| | $ | (0.12 | ) | | $ | 0.07 |
| | $ | 1.08 |
| | $ | (0.29 | ) |
| | | | | | | | | | | | |
| Dividends declared per common share | $ | — |
| | $ | — |
| | $ | — |
| | $ | — |
| | $ | — |
| | $ | — |
|
| | | | | | | | | | | | |
| Balance Sheet Data (at year end): | | | | | | | | | | | |
| Working capital | $ | 150,191 |
| | $ | 131,485 |
| | $ | 156,258 |
| | $ | 171,681 |
| | $ | 173,435 |
| | $ | 187,029 |
|
| Total assets | 344,652 |
| | 324,903 |
| | 354,578 |
| | 351,762 |
| | 311,910 |
| | 320,394 |
|
| Total long-term debt, less current maturities | 106,603 |
| | 93,872 |
| | 114,469 |
| | 131,030 |
| | 94,763 |
| | 110,949 |
|
| Shareholders’ equity | 152,015 |
| | 144,499 |
| | 138,207 |
| | 138,872 |
| | 141,066 |
| | 138,967 |
|
*Period ended September 28, 2013 was a 13-week transition perioditem.
| |
| ITEM 7. | MANAGEMENT’S DISCUSSION AND ANALYSIS OF FINANCIAL CONDITION AND RESULTS OF OPERATIONS |
BUSINESS OUTLOOK
Fiscal year 2018 was a pivotal year for Delta Apparel had solid operating results inand we were pleased with our team’s ability to follow through on various strategic initiatives, navigate the inflationary cost environment , and deliver sales and earnings growth for the year. The cost-reduction improvements within our manufacturing platform and other areas continue to enhance our profitability. Moreover, the new product development, sales channel expansion, and customer diversification efforts ongoing across our business have us well-positioned to compete and win market share as we move into our new fiscal year.
The DTG2Go and Activewear businesses within our Delta Group segment served as valuable growth drivers throughout fiscal year 2016 despite continuing sluggishness in the apparel retail environment. During the year, we completed a large-scale expansion and realignment effort across both our domestic and international manufacturing platforms that allows us to maximize production at our lower-cost facilities, eliminate duplicative fixed costs, and leverage the latest dyeing and finishing technology. We began increasing fabric production in our more efficient Honduran textile facility in June 2016, have successfully increased output in that facility on schedule, and should be at full production levels by the end of calendar year 2016. We also completed the sale of our Maiden, North Carolina textile facility in September 2016, and are efficiently sourcing domestic fabric for our made-in-the-USA programs and sourcing in-country fabric to use in our Mexico sew and screen print facilities, which now serve as a quick-turn operation to support continued growth in our full-package catalog programs. This realignment effort is expected to improve gross margins and ultimately boost operating earnings by an estimated $8 million annually, or approximately $0.70 per diluted share.
During fiscal year 2016, we also continued to invest in our brands, with expanded sales and marketing programs, in-store shops and point-of-sale displays. Our social media and other digital outreach programs continued to build consumer awareness of our brands, resulting in record e-commerce sales. Our acquisition of Coast Apparel adds to our brand portfolio. Coast’s full line of traditional, sports-casual attire, headwear and accessories are primarily marketed direct-to-consumer through two retail stores, with a third retail store expected to be opened in early calendar 2017.
We are working to improve our top-line growth by focusing on the business units with the highest immediate potential. Salt Life continued its strong growth trend in fiscal year 2016, including robust increases in direct-to-consumer sales. Sales increased 69% over the prior year on our ecommerce site, www.saltlife.com. The Salt Life flagship store in Jacksonville, Florida, in operation for five years now, continues to increase its sales, with growth of nearly 20% in fiscal year 2016 over the prior year. Our Salt Life store in San Clemente opened in September and should help drive consumer enthusiasm on the West Coast. We plan on continuing to broaden our geographic reach by opening a few stores each year for the next several years to expand our consumer engagement. We are also planning to further leverage cross-selling opportunities with the Art Gun business unit. Art Gun, which has2018. DTG2Go solidified its leadership position in the digital printing marketplace, realized strong net saleson-demand, direct-to-garment market through both strategic acquisitions and organic growth, in the 2016 fiscal year, and we expect Art Gunbelieve it is poised for additional expansion moving forward. DTG2Go’s digital print and fulfillment capabilities, nationwide and international service offerings, and direct access to continueour Activewear business’s low-cost, vertical manufacturing platform ideally position it to capitalize on the revolutionary virtual inventory trends occurring at retail. We believe our DTG2Go business will maintain its double-digithigh-growth sales trend and reach $100 million in sales over the next several years.
Our Activewear business should also be positioned for more growth in fiscal year 2017.
2019. The Delta Platinum line and other pieces of the Catalog division’s fashion basics collection are exceeding expectations and both are attracting new customers and facilitating more substantial relationships with existing customers. We anticipate gross margin expansion inlook for the fiscal year 2017 driven bysignificant growth of these products to continue as they become a more profitablelarger part of Catalog’s overall sales mix and lower product costs. Margins should also be enhancedwe transition more of them onto our internal manufacturing platform to shorten lead times and allow for faster customer replenishments. The FunTees private label business continues to benefit from a broadening and more diverse customer base as well as favorable market dynamics that are causing brands to gravitate toward western hemisphere supply chain solutions such as our platform to improve speed-to-market and customer service levels. We look forward to leveraging this momentum and FunTees’ stronger, more flexible business model as we continue our direct-to-consumer focus across our business units. We expect themove forward.
Our Soffe brand continues to see solid momentum with strategic initiatives implemented in the past two years, coupledsporting goods and e-retailers, as well as with the positive momentumUnited States military. Its ecommerce sites and branded retail stores throughout key North Carolina markets also present opportunities for significant growth moving forward. Soffe continues to improve its cost structure and operating efficiencies, and we are experiencing, to point us toward continued successbelieve the brand is positioned for improved performance in fiscal year 2017.2019.
The brands comprising our Salt Life Group continue to expand their lifestyle positioning and extend their consumer reach. Salt Life is strengthening brand awareness both within and outside of its traditional markets through its flourishing partnerships with key national retailers. Growth with regional and independent accounts and in target international markets should also continue to drive expansion at Salt Life. The recent introduction of several new product categories, including the brand’s new craft beer, Salt Life Lager, provide additional visibility and should catalyze growth going forward. Salt Life Lager has now expanded throughout the Florida market with plans to move into other key Southeastern markets in the next fiscal year. Salt Life’s branded retail footprint also recently expanded with a new location in Tampa, Florida, and we have approximately 12 new stores planned over the next several years. Our consumer website, www.saltlife.com, has maintained its double-digit sales growth trend and we expect this to continue in the upcoming year.
The strategic actions that we took in fiscal 2018 should put us in solid position to win market share and profitably grow our business in fiscal 2019 and beyond. While the retail environment continues to have its share of challenges and the rising cost environment is expected to continue, we are off to a solid start to fiscal 2019 and are looking forward to what lies ahead for Delta Apparel.
RESULTS OF OPERATIONS
Our financial results have been presented on a GAAP basis. Inbasis and, in certain limited instances, we have presented our financial results on a GAAP and non-GAAP (“adjusted”) basis, which is further described and reconciled in the sectionsections entitled “Non-GAAP Financial Measures.”
Overview
Net sales for the fiscal year ended October 1, 2016,September 29, 2018, were $425.2$395.5 million compared with prior year sales of $449.1$385.1 million. Sales declined 0.5%increased by 7% from the prior year sales which were $369.4 million when adjusted netto exclude sales with basics segment salesin the since-divested Junkfood business. Gross margins were relatively flat withcompared to the prior year and branded segments sales down 1.5%.
Gross margins were 22.0% in fiscal year 2016, a 230 basis point improvement from 19.7% in the prior year. Adjusted gross margins improved 250 basis points from the prior year driven primarily by the basics segment, resulting from a more profitable sales mix and lower productdespite inflationary costs.
Our selling, general and administrative costs decreased $4.5 million to 18.0% of sales, from 18.1% of sales in the prior year. We continue to invest in marketing efforts across our business units to build consumer awareness and market our products. During fiscal year 2016, we improved our distribution efficiency to better service our customers and reduce our expenses. This, coupled with continued reduction in discretionary spending, drove the improvement in our selling, general and administrative costs in fiscal year 2016.
We recorded a $0.6 million gain during fiscal year 2016 as we lowered the contingent consideration expected to be paid associated with Salt Life based on the inputs to the valuation model, including the time remaining as we move closer to the 2019 measurement date.
Net income in fiscal year 20162018 was $9.0$1.3 million, or $1.12$0.18 per diluted share, compared with a net income in the prior year of $8.1$10.5 million, or $1.00 per diluted share. Adjusted earnings$1.33 per diluted share, were $1.41, a 147.4% increasewhich includes the benefit of $0.11 per diluted share from the prior year’s $0.57 adjusted earningsgain on the sale of our Junkfood business. Adjusting for the $10.7 million impact of the new tax legislation in the current year, our fiscal year 2018 net income was $11.4 million, or $1.62 per diluted share.
Branded Segment
Net sales in the branded segment were $148.1 million in fiscal year 2016 compared to $166.7 million in the prior year. Sales in the branded segment declined $2.3 million, or 1.5%, when excluding the $16.3 million in sales related to since-divested The Game business and the since-discontinued Kentucky Derby license and the additional week of sales in 2015. Salt Life continued its sales growth, up nearly 27% for the year on a comparable 52-week basis, driven from its new product lines and expanded distribution. The Salt Life sales growth was offset by sales declines in our other branded business units. Operating income for the segment increased year-over-year to $7.0 million, when excluding the prior year $5.6 million gain, including related expenses, from the sale of The Game business.
BasicsGroup Segment
Net sales in our basicsSalt Life Group segment were $277.1$39.4 million in fiscal year 20162018 compared to $58.5 million in the prior year, with $282.5 millionthe declines due to the since-divested Junkfood business and other strategic shifts in the non-core business. Salt Life sales grew 2.4% from the prior year with strong direct-to-consumer sales and growth in national retailers, being partially offset by independent store sales, which have been significantly impacted by recent hurricanes. Gross margins in the Salt Life Group segment improved to 46.6% in fiscal year 2015. 2018. Operating income in the Salt Life Group segment was flat in fiscal year 2018 to prior year at $4.8 million, when adjusted for the since-divested Junkfood business.
Delta Group Segment
Net sales were flatin our Delta Group segment increased by 9.0% to $356.0 million from prior year sales of $326.6 million. Strong retail license and private label growth drove the increase, with our FunTees business having record revenue in that business exceeding $100 million for the second consecutive year. Gross margins in the Delta Group segment improved 10 basis points from the prior year adjusted netdue primarily to sales after reducing for the additional week of sales in fiscal 2015. Excluding the expenses associated with the manufacturing initiative, gross margins as a percent of saleshigher margin fashion basics products offset by inflationary costs. Operating income increased by 480 basis points$2.8 million to 16.5%$26.1million, or 7.3% of sales, compared to 11.7% of sales for the prior fiscal year. Operating income increased by $9.2 million, to 8.0% of sales, compared to $13.1$23.3 million, or 4.6%7.1% of sales in fiscal year 2015. Adjusted for the $2.8 million of manufacturing realignment expenses, adjusted operating income for fiscal year 2016 was $25.1 million, or 9.1% of sales.
Quarterly Financial Data
For information regarding quarterly financial data, refer to Note 17 - Quarterly Financial Information (Unaudited) to the Consolidated Financial Statements, which information is incorporated herein by reference.prior year.
Fiscal Year 20162018 Versus Fiscal Year 20152017
Net sales for fiscal year 20162018 were $425.2$395.5 million compared with prior year sales of $449.1$385.1 million. Sales declined 0.5% fromWhen adjusted to exclude sales in the since-divested Junkfood business, prior year adjusted net sales.sales were $369.4 million in fiscal year 2017, an improvement of 7.0% over fiscal year 2017. Our direct-to-consumer and ecommerce sales represented 5.3%7.6% of total revenues for the 20162018 fiscal year a 90 basis point increase over the prior year period, during which direct-to-consumer and ecommerce sales were 4.4% of total revenues.
Gross margins were 22.0% in fiscal year 2016 compared to 19.7%6.8% of revenues in the prior year. Adjusted
Overall gross margins improved 250 basis points from thewere relatively flat to prior year at 20.7% driven primarily from a more profitable salesby improved selling prices and favorable product mix offsetting the impact of higher raw material prices and lower product costs in the basics segment, coupled with higher direct-to-consumer sales in the branded segment.other inflationary cost increases. Our gross margins may not be comparable to those of other companies because some companies include costs related to their distribution network in cost of goods sold and we exclude them from gross profit and include them in selling, general and administrative expenses.
Fiscal year 20162018 selling, general and administrative expenses were $76.6$67.0 million, or 18.0%16.9% of sales, compared to $81.1$67.4 million, or 18.1%17.5% of sales, in fiscal year 2015.2017. The decrease in selling, general and administrative expenses is primarily due to lower selling costs and efficiency improvements in our distribution facilities,the Junkfood divestiture partially offset by higher incentive compensationdistribution costs resultingrelated primarily to investments made to expand facilities to improve service to our customers.
Other income includes valuation changes in our continent consideration, gains or losses on the sale of businesses and other assets, and profits related to our Honduran equity method investment. We realized a $1.3 million pre-tax gain from the sale of the Junkfood business, which was completed in our improved operating results inMarch quarter of fiscal year 2016 from the prior year.
2017. See Note 4-Divestitures for more information on this transaction. The change in fair value of contingent consideration isresulted from the remeasurement of the contingent consideration related to Salt Life.Life and DTG2Go. Based upon the current operating results and future projections, we recorded a $0.6net $0.2 million reductionincrease in contingent consideration was recorded,in fiscal year 2018 compared to a $0.9 million decrease in fiscal year 2017. The remainder of other income is principally from the reduced remaining time in the measurement period.
Other income includes our incomerelated to profits from our Honduran joint venture, along with sublease income. Otherequity method investment.
Operating income decreased slightlyfor fiscal year 2018 increased by $1.3 million from the prior year to $0.6 million$17.5 million. Operating income in fiscal year 2016 from $0.72018 was comprised of $26.1 million in the Delta Group segment and $4.7 million in the Salt Life Group segment offset by unallocated general corporate costs of $13.3 million. This compares to fiscal year 2015.
Fiscal year 2016 operating income was $16.3 million compared to $16.1 million in fiscal year 2015. Fiscal year 2016 adjusted operating income was $19.2 million, or 4.5% of sales, an $8.6 million, or 81.9%, increase over the prior year adjusted2017 operating income of $10.5$23.3 million in the Delta Group segment and $4.9 million in the Salt Life Group segment offset by unallocated general corporate costs of $12.0 million.
Interest expense for fiscal year 2016 decreased2018 increased $0.7 million to $5.3$5.7 million, compared to $6.0$5.0 million in fiscal year 2015.2017. The decreaseincrease is due primarily to the lowerhigher average interest rates along with higher average debt levels in fiscal year 20162018 compared to the prior year, coupled with slightly lower interest rates on our U.S. credit facility.year.
Our fiscal year 20162018 effective income tax rate, excluding the effect of the $10.7 million amount related to new tax law legislation, was 18.8% compareda benefit of 1.7%. This compares to 19.9%5.9% in the prior fiscal year. See Note 10—Income taxes for more information. We benefit from
having income in foreign jurisdictions that are either exempt from income taxes or have tax rates that are lower than those in the United States.
Net income in fiscal year 20162018 was $9.0$1.3 million, or $1.12$0.18 per diluted share, compared with a net income in the prior year of $8.1$10.5 million, or $1.00$1.33 per diluted share. AdjustedAdjusting for the $1.44 per share impact of new tax legislation in fiscal year 2018, and the prior year benefit of $0.11 per share from the sale of Junkfood, our diluted earnings were $1.62 per diluted share, were $1.41, a 147.4% increase33% improvement from the prior year’s $0.57 adjustedyear earnings of $1.22 per diluted share.
Non-GAAP Financial Measures
We provide all information required in accordance with generally accepted accounting principles (“GAAP”), but we believe that evaluating our ongoing operating results may be difficult if limited to reviewing only GAAP financial measures. In an effort to provide investors with additional information regarding the Company's results, as determined by GAAP, the Companywe also providesprovide non-GAAP information
that management believes is useful to investors. The Company discussesWe discuss adjusted net sales, adjusted gross margins, adjusted operating income, and adjusted earningsearning per diluted share as performance measures because management uses these measures in evaluating the Company's underlying performance on a consistent basis across periods. ManagementWe also believesbelieve these measures are frequently used by securities analysts, investors and other interested parties in the evaluation of the Company's ongoing performance. These non-GAAP measures have limitations as analytical tools, and securities analysts, investors and other interested parties should not consider any of these non-GAAP measuresmeasure in isolation or as a substitute for analysis of the Company's results as reported under GAAP. TheseThe non-GAAP measuresmeasure may not be comparable to similarly titled measures used by other companies. The table below reconciles net sales gross margins, operating income and earnings per diluted share to the adjusted net sales, adjusted gross margins, adjusted operating income, and adjusted earnings per diluted share (in thousands, except per share amounts)thousands):
|
| | | | | | | | | | | |
| | Year Ended |
| | October 1, 2016 | October 3, 2015 |
| Net sales | | $ | 425,249 | | $ | 449,142 |
|
| Adjustment for: | | | |
| 53 weeks versus 52 weeks in fiscal year | | — | | (8,585 | ) |
Sales from the since-divested The Game business | | — | | (10,207 | ) |
| Sales from the since-discontinued Kentucky Derby business | | — | | (2,889 | ) |
| Adjusted net sales | | $ | 425,249 | | $ | 427,461 | |
| | | | |
| Gross profit | | $ | 93,499 | | $ | 88,319 | |
| Adjustment for manufacturing realignment expenses | | 1,096 | | — | |
| Adjusted gross profit | | $ | 94,595 | | $ | 88,319 | |
| | | | |
| Gross margins | | 22.0% | | 19.7 | % |
| Adjustment for manufacturing realignment expenses | | 0.2% | | — | |
| Adjusted gross margins | | 22.2% | | 19.7 | % |
| | | | |
| Operating income | | $ | 16,332 | | $ | 16,119 | |
| Adjustment for manufacturing realignment expenses included in gross profit | | 1,096 | | — | |
| Adjustment for manufacturing realignment expenses included in restructuring costs | | 1,741 | | — | |
Adjustment for gain, including related expenses, from the sale of The Game business | | — | | (5,582 | ) |
| Adjusted operating income | | $ | 19,169 | | $ | 10,537 | |
| | | | |
| Earnings per diluted share | | $ | 1.12 | | $ | 1.00 | |
| Adjustment for manufacturing realignment expenses | | 0.29 | | — | |
Adjustment for gain on the sale of The Game business | | — | | (0.43 | ) |
| Adjusted earnings per diluted share | | $ | 1.41 | | $ | 0.57 | |
| | | | |
Fiscal Year 2015 Versus Fiscal Year 2014
Net sales for fiscal year 2015 grew 2.5% compared with the prior year after adjusting for the sale of The Game business in March 2015. Our direct-to-consumer and ecommerce sales represented 4.4% of total revenues for the 2015 fiscal year, a 150 basis point increase over the prior year period, during which direct-to-consumer and ecommerce sales were 2.9% of total revenues.
Gross margins increased in fiscal 2015 by 80 basis points from fiscal 2014, to 19.7% of sales compared to 18.9% in fiscal 2014. Increases occurred in both the branded and basics segments, and across all operating units with the exception of Soffe. Gross margins improved due to customer and product mix along with improved manufacturing efficiencies and lower costs. Our gross margins may not be comparable to other companies, because some companies include costs related to their distribution network in cost of goods sold and we exclude them from gross profit and include them in selling, general and administrative expenses.
Fiscal year 2015 selling, general and administrative expenses were $81.1 million, or 18.1% of sales, compared to $86.3 million, or 19.0% of sales, in fiscal year 2014. The decrease in selling, general and administrative expenses is primarily due to lower fixed compensation and benefit costs, along with a decrease in variable selling costs and lower legal costs. Fiscal 2014 included $2.2 million of severance related expenses associated with our strategic initiatives during the fourth quarter of fiscal year 2014.
The change in fair value of contingent consideration is the remeasurement of the fair value of the contingent consideration related to the Salt Life Acquisition. Based upon the current operating results and future projections, a $0.5 million reduction in contingent consideration was recorded.
Our gain on sale of business was $7.7 million for fiscal year 2015. The gain on sale of business in fiscal year 2015 includes the $14.9 million in proceeds from the sale of The Game business less the assets sold, the direct liabilities resulting from, and the selling costs related to this transaction. Associated with the disposition of The Game, $2.1 million of indirect expenses were also recorded, resulting in a net gain, including indirect expenses, of $5.6 million. See Note 3 - Sale of The Game, for more information on this transaction.
Other income increased to $0.7 million in fiscal year 2015 from $0.9 million of expense in fiscal year 2014. This increase was due to an increase in income from our Honduran joint venture of $0.3 million, as well as a $0.1 million increase in sublease income.
Fiscal year 2015 operating income was $16.1 million, or 3.6% of sales, compared to an operating loss of $1.7 million, or 0.4% of sales, in fiscal year 2014. Operating income was $9.7 million in the basics segment and $6.4 million in the branded segment.
Interest expense for fiscal year 2015 was $6.0 million compared to $5.8 million in fiscal year 2014. The increase is due primarily to the higher interest rate on our U.S. credit facility compared to the imputed interest on the Salt Life promissory note related to the $9.0 million Salt Life payment made at the beginning of the fiscal year, along with higher debt levels in the first half of the fiscal year.
Our fiscal year 2015 effective income tax rate was 19.9% compared to an effective tax rate of 87.1% in the prior fiscal year. The prior year rate was driven from a small overall loss encompassing foreign profits in non-tax jurisdictions and losses in the United States. We benefit from having income in foreign jurisdictions that are either exempt from income taxes or have tax rates lower than the United States.
Net income for fiscal year 2015 was $8.1 million, or $1.00 per diluted share, compared with a net loss in the prior fiscal year of $1.0 million or $0.12 per diluted share. |
| | | | | | | |
| | Year Ended |
| | September 29, 2018 | | September 30, 2017 |
| Net sales | $ | 395,450 |
| | $ | 385,082 |
|
| Adjustment for: | | | |
Sales from the since-divested Junkfood business | — |
| | (15,648 | ) |
| Adjusted net sales | $ | 395,450 |
| | $ | 369,434 |
|
| | | | |
| Net earnings attributable to shareholders | $ | 1,337 |
| | $ | 10,511 |
|
| Adjustment for tax legislation impact | 10,664 |
| | — |
|
Adjustment for gain on sale of Junkfood business | — |
| | (838 | ) |
| Adjusted earnings attributable to shareholders | $ | 12,001 |
| | $ | 9,673 |
|
| Weighted average number of shares assuming dilution | 7,425 |
| | 7,882 |
|
| Adjusted earnings per diluted share | $1.62 | | $1.22 |
LIQUIDITY AND CAPITAL RESOURCES
Credit Facility and Other Financial Obligations
On May 10, 2016, we amended our U.S. revolving credit facility and entered into a Fifth Amended and Restated Credit Agreement (the "Amended“Amended Credit Agreement"Agreement”) with Wells Fargo Bank, National Association ("(“Wells Fargo"Fargo”), as Administrative Agent, the Sole Lead Arranger and the Sole Book Runner, and the financial institutions named therein as Lenders, which are Wells Fargo, PNC Bank, National Association and Regions Bank. Our subsidiaries M.J. Soffe, LLC, Culver City Clothing Company (f/k/a Junkfood Clothing Company,Company), Salt Life, LLC, and DTG2Go, LLC (f/k/a Art Gun, LLC (together withLLC) (collectively, the Company, the "Companies""Borrowers"), are co-borrowers under the Amended Credit Agreement.
On November 27, 2017, the Borrowers entered into a First Amendment to the Fifth Amended and Restated Credit Agreement with Wells Fargo and the other lenders set forth therein (the “First Amendment”).
The First Amendment amends the definition of Fixed Charge Coverage Ratio within the Amended Credit Agreement to permit up to $10 million of the proceeds received from the March 31, 2017, sale of certain assets of the Junkfood business to be used towards share repurchases for up to one year from the date of that transaction. In addition, the definition of Permitted Purchase Money Indebtedness is amended to extend the time period within which the Borrowers may enter into capital leases and to increase the aggregate principal amount of such leases into which the Borrowers may enter to up to $15 million. The definition of Permitted Investments is also amended to permit the Borrowers to make investments in entities that are not a party to the Amended Credit Agreement in an aggregate amount of up to $2 million. The First Amendment also allows the change in the name of our Junkfood Clothing Company subsidiary to Culver City Clothing Company. There were no changes to the Amended Credit Agreement related to interest rate, borrowing capacity, or maturity.
On March 9, 2018, the Borrowers entered into a Consent and Second Amendment to the Fifth Amended and Restated Credit Agreement with Wells Fargo and the other lenders set forth therein (the “Second Amendment”).
Pursuant to the Second Amendment, Wells Fargo and the other lenders set forth therein consented to Art Gun, LLC’s acquisition of substantially all of the assets of TeeShirt Ink Inc. d/b/a DTG2Go. The Second Amendment also: (i) revises certain provisions in the Amended Credit Agreement relating to our ability to pay cash dividends or distributions to shareholders or to repurchase shares of our common stock so that the effects of the Tax Cuts and Jobs Act of 2017 do not negatively impact our ability to make such dividends or distributions or to repurchase shares of our common stock during our 2018 fiscal year; (ii) amends the definition of Permitted Investments in the Amended Credit Agreement to allow investments in the Honduras partnership (as defined in the Amended Credit Agreement) in an aggregate original principal amount not to exceed $6 million; (iii) amends the definition of Permitted Purchase Money Indebtedness in the Amended Credit Agreement to increase the aggregate principal amount of capital leases into which we may enter to up to $25 million; (iv) permits the name change of Art Gun, LLC to DTG2Go, LLC; and (v) adds new definitions relating to the DTG2Go acquisition. There were no changes to the Amended Credit Agreement related to interest rate, borrowing capacity, or maturity.
The Amended Credit Agreement was subsequently amended on October 8, 2018. See Note 17—Subsequent Events to the Consolidated Financial Statements for further information.
The Amended Credit Agreement allows us to borrow up to $145 million (subject to borrowing base limitations), including a maximum of $25 million in letters of credit. Provided that no event of default exists, we have the option to increase the maximum credit to $200 million (subject to borrowing base limitations), conditioned upon the Administrative Agent's ability to secure additional commitments and customary closing conditions. The credit facility matures on May 10, 2021. We paid $1.0 million in financing costs associated with the Amended Credit Agreement. At October 1, 2016,September 29, 2018, we had $92.1$85.7 million outstanding under our U.S. revolving credit facility at an average interest rate of 2.7%4.1%, and had the ability to borrow an additional $32.8$25.9 million.
For further information regarding our U.S. asset-based secured credit facility, refer to Note 9 - Long-Term Debt to the Consolidated Financial Statements, which information is incorporated herein by reference.
In August 2013, we acquired Salt Life and issued two promissory notes in the aggregate principal amount of $22.0 million, which included a one-time installment of $9.0 million that was due and paid as required on September 30, 2014, and quarterly installments commencing on March 31, 2015, with the final installment due on June 30, 2019. The promissory notes are zero-interest notes and state that interest will be imputed as required under Section 1274 of the Internal Revenue Code. We have imputed interest at 1.92% and 3.62% on the promissory notes that maturematured on June 30, 2016, and will mature on June 30, 2019, respectively. At October 1, 2016,September 29, 2018, the discounted value of the promissory note was $8.1$2.5 million. Refer to Note 9 - Long Term Debt to the Consolidated Financial Statements for further information on these promissory notes.
We have loan agreements with Banco Ficohsa, a Honduran bank. This credit facility is secured by a first-priority lien on the assets of our Honduran operations and the loans are not guaranteed by our U.S. entities. As of October 1, 2016,September 29, 2018, we had a total of $15.5$10.4 million outstanding on these loans. For further information regarding our Honduran loans, refer to Note 9 - Long-Term Debt to the Consolidated Financial Statements, which information is incorporated herein by reference.
Our primary cash needs are for working capital and capital expenditures, as well as to fund share repurchases under our Stock Repurchase Program. In addition, in the future we may use cash to pay dividends.dividends in the future.
We consider the earnings of our foreign subsidiaries as of September 29, 2018, to be indefinitely reinvested. We have not, nor do we anticipate the need to, repatriate funds to the United States to satisfy domestic liquidity needs arising in the ordinary course of business, including liquidity needs associated with our domestic debt service requirements.
Derivative Instruments
From time to time we may use derivative instruments to manage our exposure to interest rates. These financial instruments are not used for trading or speculation purposes. When we enter into a derivative instrument, we determine whether hedge accounting can be applied. Where hedge accounting can be applied, a hedge relationship is designated as either a fair value hedge or cash flow hedge. The hedge is documented at inception, detailing the particular risk objective and strategy considered for undertaking the hedge. The documentation identifies the specific asset or liability being hedged, the risk being hedged, the type of derivative used and how effectiveness of the hedge will be assessed.
During fiscal years 2016, 2015,2018 and 2014, the2017, these interest rate swap agreements had minimal ineffectiveness and were considered highly-effectivehighly effective hedges.
We may use derivatives, including cotton option contracts, to manage our exposure to movements in commodity prices. We do not designate our options as hedge instruments upon inception. Accordingly, we mark to market changes in the fair market value of the options in cost of sales in the Consolidated Statements of Operations. We did not own any significant cotton options contracts on September 29, 2018, or September 30, 2017.
Changes in the derivatives’ fair values are deferred and are recorded as a component of accumulated other comprehensive income (“AOCI”), net of income taxes, until the underlying transaction is recorded. When the hedged item affects income, gains or losses are reclassified from AOCI to the Consolidated Statements of Operations as interest income/expense. Any ineffectiveness in our hedging relationships is recognized immediately in the Consolidated Statement of Operations. The changes in fair value of the interest rate swap agreements resulted in an AOCI gain, net of taxes, of $0.3 million for the year ended October 1, 2016, an AOCI loss,gains, net of taxes, of $0.2 million for the year ended October 3, 2015, an AOCI gain, net of taxes of $0.3and $0.1 million for the yearyears ended September 27, 2014.29, 2018, and September 30, 2017, respectively.
Operating Cash Flows
Cash provided by operating activities in fiscal year 20162018 was $2.221.2 million compared to $22.3$13.9 million for fiscal year 2015.2017. The decreaseimprovement in cash provided by operating activities from the prior year is primarily due to increasingresulted from stronger operating income and leveraging our inventory positions in order to better serviceterms with our customers with immediate shipping in our basics segment and weekly replenishments to retailers.suppliers.
Investing Cash Flows
Cash used in investing activities in fiscal year 20162018 was $10.814.9 million compared to $7.6 millioncash provided by investing activities of $18.9 million in fiscal year 2015.2017. Capital expenditures during fiscal year 20162018 were $12.3$13.3 million and includedprimarily related to digital print and other machinery and equipment, along with investments in our direct-to-consumer initiatives and information technology systems. There was $1.5 million of unpaid capital expenditures for the expansionas of our textile operations that should decrease reliance on purchased fabric and reduce costs by leveraging internal operations.September 29, 2018. During fiscal year 2015,2018, investing cash flows also included the $14.9$1.9 million in proceeds received from the sale of The Game assets.our Junkfood business, while fiscal year 2017 included $26.0 million. See Note 3 - Sale of The Game,4—Divestitures, for further information on this transaction. In
Current year investing activities included $5.8 million of proceeds from the sale of fixed assets. Property, plant, and equipment of $5.0 million was acquired as part of the DTG2Go acquisition. See Note 3—Acquisitions for more information on this transaction. Subsequently, a capital lease arrangement was entered into to finance the purchase of this equipment. Additional capital leases were entered into fiscal year 2015, we used2018 related to $7.8 million in cash primarily related to the expansion of our textile operations.digital print and other machinery and equipment.
We expect to spend approximately $10 million in capital expenditures in fiscal year 2017,2019, primarily on manufacturing equipment along with information technology and direct-to-consumer investments.
Financing Activities
Cash provided byused in financing activities was $8.76.4 million in fiscal year 20162018 compared to $30.2$32.7 million used in financing activities in fiscal year 2015.2017. The cash used in our financing activities during fiscal year 2018 was used to fund our operating activities and repurchase our stock. In fiscal year 2016, we utilized2017, the cash proceedsreceived from the sale of our credit facilityJunkfood business was used to reduce debt as well as a new $5 million Honduran loan to fund the expansion of our offshore operations, as well as the repurchase offor stock repurchases throughout the year.
Future Liquidity and Capital Resources
Based on our current expectations, we believe that our credit facility should be sufficient to satisfy our foreseeable working capital needs, and that the cash flow generated by our operations and funds available under our credit facility should be sufficient to service our debt payment requirements, to satisfy our day-to-day working capital needs and to fund our planned capital expenditures. Any material deterioration in our results of operations, however, may result in our losingloss of the ability to borrow under our revolving credit facility and to issue letters of credit to suppliers, or may cause the borrowing availability under our facility to be insufficient for our needs. Availability under our credit facility is primarily a function of the levels of our accounts receivable and inventory, as well as the uses of cash in our operations. A significant deterioration in our accounts receivable or inventory levels could restrict our ability to borrow additional funds or service our indebtedness. Moreover, our credit facility includes a financial covenant that if the availability under our credit facility falls below the amounts specified in our credit agreement, our Fixed Charge Coverage Ratio (“FCCR”) (as defined in our credit agreement) for the preceding 12-month period must not be less than 1.1 to 1.0. Although our availability at October 1, 2016,September 29, 2018, was above the minimum thresholds specified in our credit agreement, a significant deterioration in our business could cause our availability to fall below such thresholds, thereby requiring us to maintain the minimum FCCR specified in our credit agreement. As of October 1, 2016,September 29, 2018, our FCCR was above the minimum threshold specified in our credit agreement.
The following table summarizes our contractual cash obligations, as of October 1, 2016, by future period.
|
| | | | | | | | | | | | | | | | | | | |
| | Payments Due by Period (in thousands) |
| | Total | | Less than 1 year | | 1 - 3 years | | 3 – 5 years | | After 5 years |
| Contractual Obligations: | | | | | | | | | |
| Long-term debt (a) | $ | 115,795 |
| | $ | 9,192 |
| | $ | 18,790 |
| | $ | 87,618 |
| | $ | 195 |
|
| Operating leases | 39,935 |
| | 7,177 |
| | 12,832 |
| | 9,530 |
| | 10,396 |
|
| Capital leases | 1,599 |
| | 410 |
| | 886 |
| | 303 |
| | — |
|
| Minimum royalty payments | 1,310 |
| | 1,132 |
| | 178 |
| | — |
| | — |
|
| Purchase obligations | 42,905 |
| | 42,905 |
| | — |
| | — |
| | — |
|
| Total (b) | $ | 201,544 |
| | $ | 60,816 |
| | $ | 32,686 |
| | $ | 97,451 |
| | $ | 10,591 |
|
______________________
| |
(a) | We include interest on our fixed rate debt as a component of our future obligations. However, we exclude interest payments on our revolving credit facility since the cash outlay for the interest is unknown and cannot be reliably estimated. Interest payments will be determined based upon the daily outstanding balance of the revolving credit facility and the prevailing interest rate during that time. |
| |
(b) | We excluded deferred income tax liabilities of $10.5 million from the contractual cash obligations table because we believe inclusion would not be meaningful. Refer to Note 10 - Income Taxes to our Consolidated Financial Statements for more information on our deferred income tax liabilities. Deferred income tax liabilities are calculated based on temporary differences between tax bases of assets and liabilities and their respective book bases, which will result in taxable amounts in future years when the liabilities are settled at their reported financial statement amounts. The results of these calculations do not have a direct connection with the amount of cash taxes to be paid in any future periods and therefore would not relate to liquidity needs. As a result, including deferred income tax liabilities as payments due by period in the schedule could be misleading. |
Off-Balance Sheet Arrangements
As of October 1, 2016September 29, 2018, we did not have any off-balance sheet arrangements that were material to our financial condition, results of operations or cash flows as defined by Item 303(a)(4) of Regulation S-K promulgated by the SEC other than the letters of credit, operating leases, and purchase obligations described in the table above.obligations. We have entered into derivative interest rate contracts as describeddisclosed operating lease commitments in Note 11—Leases, and included belowletters of credit and purchase obligations in “QuantitativeNote 16—Commitments and Qualitative Disclosures about Market Risk” in Item 7A of this report.Contingencies.
Dividends and Purchases of our Own Shares
Pursuant to the terms of our credit facility, we are allowed to make cash dividends and stock repurchases if (i) as of the date of the payment or repurchase and after giving effect to the payment or repurchase, we have availability on that date of not less than 15% of the lesser of the borrowing base or the commitment, and average availability for the 30-day period immediately preceding that date of not less than 15% of the lesser of the borrowing base or the commitment; and (ii) the aggregate amount of dividends and stock repurchases after May 10, 2016, does not exceed $10 million plus 50% of our cumulative net income (as defined in the Amended Credit Agreement) from the first day of the third quarter of fiscal year 2016 to the date of determination. At October 1, 2016,September 29, 2018, and October 3, 2015,September 30, 2017, there was $10.7$14.7 million and $7.3$7.7 million, respectively, of retained earnings free of restrictions to make cash dividends or stock repurchases.
Our Board of Directors did not declare, nor were any dividends paid, during fiscal years 20162018 and 2015.2017. Any future cash dividend payments will depend upon our earnings, financial condition, capital requirements, compliance with loan covenants and other relevant factors.
As of October 1, 2016,September 29, 2018, our Board of Directors had authorized management to use up to $40.0$60.0 million to repurchase stock in open market transactions under our Stock Repurchase Program. During fiscal years 2016, 20152018 and 2014,2017, we purchased 217,568463,974 shares 140,336 shares, 78,674and 413,337 shares, respectively, of our common stock for a total cost of $3.5$9.0 million $2.1 million, $1.2and $7.8 million, respectively. As of October 1, 2016,September 29, 2018, we have purchased 2,480,1503,357,461 shares of common stock for an aggregate of $30.9$47.7 million since the inception of the Stock Repurchase Program. All purchases were made at the discretion of management and pursuant to the safe harbor provisions of SEC Rule 10b-18. As of October 1, 2016, $9.1September 29, 2018, $12.3 million remained available for future purchases under our Stock Repurchase Program, which does not have an expiration date.
CRITICAL ACCOUNTING POLICIES
The discussion and analysis of our financial condition and results of operations are based upon our Consolidated Financial Statements, which were prepared in accordance with U.S. generally accepted accounting principles (“GAAP”).GAAP. The preparation of our Consolidated Financial Statements requires us to make estimates and judgments that affect the reported amounts of assets and liabilities and disclosure of contingent liabilities at the date of the financial statements and the reported amounts of revenues and expenses during the reporting periods. We base our estimates and judgments on historical experience and various other factors that we believe to be reasonable under the circumstances, the results of which form the basis for making judgments about the carrying values of assets and liabilities that are
not readily apparent from other sources. Actual results may differ from these estimates under different assumptions or conditions. We have no reason to believe that our past estimates have not been accurate. Our most critical accounting estimates, discussed below, pertain to revenue recognition, accounts receivable and related reserves, inventory and related reserves, the carrying value of goodwill, and the accounting for income taxes.
Note 2 to our Consolidated Financial Statements includes a summary of the significant accounting policies or methods used in the preparation of our Consolidated Financial Statements.
Revenue Recognition
Revenues from product sales are recognized when ownership is transferred to the customer, which includes not only the passage of title, but also the transfer of the risk of loss related to the product. At this point, the sales price is fixed and determinable, and we are reasonably assured of the collectibility of the sale.accounts receivable. The majority of our sales are shipped FOB or Ex Works shipping point and revenue is therefore recognized when the goods are shipped to the customer. For sales that are shipped FOB or Ex Works destination point, we do not recognize the revenue until the goods are received by the customer. Shipping and handling charges billed to our customers are included in net revenue and the related costs are included in cost of goods sold. Revenues are reported on a net sales basis, which is computed by deducting product returns, discounts and estimated returns and allowances. We estimate returns and allowances on an ongoing basis by considering historical and current trends.
Accounts Receivable and Related Reserves
In the normal course of business, we extend credit to our customers based upon defined credit criteria. Accounts receivable, as shown on our Consolidated Balance Sheets, are net of related reserves. We estimate the net collectibility of our accounts receivable and establish an allowance for doubtful accounts based upon this assessment. In situations where we are aware of a specific customer’s inability to meet its financial obligation, such as in the case of a bankruptcy filing, a specific reserve for bad debts is recorded against amounts due to reduce the net recognized receivable to the amount reasonably expected to be collected. For all other customers, reserves are determined through analysis of the aging of accounts receivable balances, historical bad debts, customer concentrations, customer credit-worthiness, current economic trends and changes in customer payment terms. In addition, reserves are established for other concessions that have been extended to customers, including advertising, markdowns and other accommodations, net of historical recoveries. These reserves are determined based upon historical deduction trends and evaluation of current market conditions. Significant changes in customer concentration or payment terms, deterioration of customer credit-worthiness or further weakening in economic trends could have a significant impact on the collectibility of receivables and our operating results.
Inventories and Related Reserves
We state inventories at the lower of cost or marketand net realizable value using the first-in, first-out method. Inventory cost includes materials, labor and manufacturing overhead on manufactured inventory, and all direct and associated costs, including inbound freight, to acquire sourced products. See Note 2(y) for further information regarding yarn procurements. We regularly review inventory quantities on hand and record reserves for obsolescence, excess quantities, irregulars and slow movingslow-moving inventory based on historical selling prices, current market conditions, and forecasted product demand to reduce inventory to its net realizable value. If actual selling prices are less favorable than those projected, or if sell-through of the inventory is more difficult than anticipated, additional inventory reserves may be required.
Goodwill
Goodwill and definite-lived intangibles were recorded in conjunction with our acquisitions of Salt Life, Junkfood, DTG2Go, and Art Gun.Coast. We did not record any separately identifiable indefinite-lived intangibles associated with any of these acquisitions. On March 31, 2017, we sold our Junkfood business to JMJD Ventures, LLC. See Note 4—Divestitures for further information on this transaction. Goodwill represents the excess of the purchase price and related costs over the value assigned to net tangible and identifiable intangible assets of
businesses acquired. Goodwill must be tested for impairment at least annually or more frequently if events or changes in circumstances indicate that the carrying amount may be impaired, and is required to be written down when impaired. The goodwill impairment testing process involves the use of significant assumptions, estimates and judgments with respect to a variety of factors, including sales, gross margins, selling, general and administrative expenses, capital expenditures, cash flows and the selection of an appropriate discount rate, all of which are subject to inherent uncertainties and subjectivity. When we perform goodwill impairment testing, our assumptions are based on annual business plans and other forecasted results, which we believe represent those of a market participant. We select a discount rate, which is used to reflect market-based estimates of the risks associated with the projected cash flows, based on the best information available as of the date of the impairment assessment.
Given the current macro-economic environment and the uncertainties regarding its potential impact on our business, there can be no assurance that our estimates and assumptions used in our impairment tests will prove to be accurate predictions of the future. If our assumptions regarding forecasted cash flows are not achieved, it is possible that an impairment review may be triggered and goodwill may be impaired.
Income Taxes
We account for income taxes under the liability method. Deferred tax assets and liabilities are recognized for the future tax consequences attributable to differences between the financial statement carrying amounts of existing assets and liabilities and their respective tax bases, and operating loss and tax credit carryforwards. Deferred tax assets and liabilities are measured using enacted tax rates expected to apply to taxable income in the years in which those temporary differences are expected to be recovered or settled. As of October 1, 2016, we have a federal net operating loss carryforward of $18.3 million, which is classified in deferred tax assets, as there is no carryback opportunity and the entire loss must be carried forward for utilization against future taxable income. We determined that noA valuation allowance is required to reduce the carrying value of deferred tax assets to the amount that is more-likely-than-not to be recorded againstrealized. In making this final determination, we follow the federal net operating loss carryforward under Financial Accounting Standards Board ("FASB") Codification No. 740, Income Taxes ("ASC 740"). These federal net loss carryforwards expire at various intervals from 2033, and look to 2035.taxable income in prior carryback years, reversals of existing temporary book/tax differences, tax planning strategies and future taxable income exclusive of reversals of existing temporary differences. By its very nature, future taxable income requires estimates and judgments about future events that may be predictable, but are far less certain than past events that can be objectively measured.
We established a valuation allowance related to certain of our state operating loss carryforward amounts in accordance with the provisions of ASC 740. We continually review the adequacy of the valuation allowance and recognize the benefits of deferred tax assets if reassessment indicates that it is more likely than not that the deferred tax assets will be realized based on earnings forecasts in the respective state tax jurisdictions. WeAs of September 29, 2018, we had state net operating loss carryforwards (“NOLs”) as of October 1, 2016,NOLs of approximately $48.7 million. We had$42.7 million, with deferred tax assets of $1.9 million as of October 1, 2016, related to these state NOLs, withand related valuation allowances against them of approximately $0.1$0.5 million. These state net loss carryforwards expire at various intervals from 2019 through 2036.
A valuation allowance is required to reduce the carrying value of deferred tax assets to the amount that is more-likely-than-not to be realized. In making this final determination, the Company follows ASC 740 and looks to taxable income in prior carryback years, reversals of existing temporary book/tax differences, tax planning strategies and future taxable income exclusive of reversals of existing temporary differences. By its very nature, future taxable income requires estimates and judgments about future events that may be predictable, but are far less certain than past events that can be objectively measured. Based on current analysis and assessments, the Company concluded that no valuation allowance is required on existing deferred tax assets resulting from temporary deductible differences or on federal net operating losses as these are both expected to be fully utilized with future earnings. However, based upon the analysis of the sources of taxable income, we did determine a valuation allowance was required on the deferred tax asset resulting from certain state net operating loss carryforwards. The amount of the valuation allowance recorded was calculated after considering all four sources mentioned above.
RECENT ACCOUNTING STANDARDS
For information regarding recently issued accounting standards, refer to Note 2(aa)2(ad) and Note 2(ab)2(ae) to our Consolidated Financial Statements.
| |
| ITEM 7A. | QUANTITATIVE AND QUALITATIVE DISCLOSURES ABOUT MARKET RISK |
Commodity Risk Sensitivity
We haveare a supply agreement with Parkdale to supply our yarn requirements until December 31, 2018. Under the supply agreement, we purchase from Parkdale all of our yarn requirements for use in our manufacturing operations, excluding yarns that Parkdale does not manufacture or cannot manufacture due to temporary capacity constraints. The purchase price of yarn is based upon the cost of cotton plus a fixed conversion cost. Thus, we are subject to the commodity risk of cotton prices and cotton price movements, which could result in unfavorable yarn pricing for us. We fix the cotton pricessmaller reporting company as a componentdefined by Rule 12b-2 of the purchase priceSecurities Exchange Act of yarn, pursuant to the supply agreement, in advance of the shipment of finished yarn from Parkdale. Prices1934 and are set according to prevailing prices, as reported by the New York Cotton Exchange, at the time we elect to fix specific cotton prices.
Yarn with respect to which we have fixed cotton prices at October 1, 2016, was valued at $12.3 million, and is scheduled for delivery between October 2016 and December 2016. At October 1, 2016, a 10% decline in the market price of the cotton covered by our fixed price yarn would have had a negative impact of approximately $0.9 million on the value of the yarn. This compares to what would have been a negative impact of $2.9 million at our 2015 fiscal year end based on the yarn with fixed cotton prices at October 3, 2015.
We may use derivatives, including cotton option contracts, to manage our exposure to movements in commodity prices. We do not designate our options as hedge instruments upon inception. Accordingly, we mark to market changes in the fair market value of the options in cost of sales in the Consolidated Statements of Operations. We did not own any significant cotton options contracts on October 1, 2016, or October 3, 2015.
If Parkdale’s operations are disrupted and it is not ablerequired to provide us with our yarn requirements, we may need to obtain yarn from alternative sources. Although alternative sources are presently available, we may not be able to enter into short-term arrangements with substitute suppliers on terms as favorable as our current terms with Parkdale. In addition, the cotton futures we have fixed with Parkdale may not be transferable to alternative yarn suppliers. Because there can be no assurance that we would be able to pass along the higher cost of yarn to our customers,information under this could have a material adverse effect on our results of operations.
Interest Rate Sensitivity
Our U.S. revolving credit facility provides that the outstanding amounts owed shall bear interest at variable rates. If the amount of outstanding floating rate indebtedness at October 1, 2016, under the U.S. revolving credit facility had been outstanding during the entire year and the interest rate on this outstanding indebtedness was increased by 100 basis points, our expense would have increased by approximately $0.3 million, or 6.1%, for the fiscal year. This compares to an increase of $0.2 million, or 3.2%, for the 2015 fiscal year based on the outstanding floating rate indebtedness at October 3, 2015. The effect of a 100 basis point increase in interest rates would have had a higher dollar impact for the year ended October 1, 2016, compared to the year ended October 3, 2015, from the higher floating rate debt outstanding on October 1, 2016. The percentage increase is more significant for fiscal year 2016 than for fiscal year 2015 because our total interest expense for fiscal year 2016 was lower than our total interest expense for fiscal year 2015. The actual increase in interest expense resulting from a change in interest rates would depend on the magnitude of the increase in rates and the average principal balance outstanding.
Derivatives
From time to time, we may use interest rate swaps or other instruments to manage our interest rate exposure and reduce the impact of future interest rate changes. See Note 2(z) and Note 16(d) to the Consolidated Financial Statements for more information on our derivatives.item.
| |
| ITEM 8. | FINANCIAL STATEMENTS AND SUPPLEMENTARY DATA |
Our Consolidated Financial Statements for each of our fiscal years ended October 1, 2016, October 3, 2015,September 29, 2018, and September 27, 2014,30, 2017, together with the Reports of Independent Registered Public Accounting Firms thereon, are included in this report commencing on page F-1 and are listed under Part IV, Item 15 in this report.
| |
| ITEM 9. | CHANGES IN AND DISAGREEMENTS WITH ACCOUNTANTS ON ACCOUNTING AND FINANCIAL DISCLOSURE |
Not applicable.
| |
| ITEM 9A. | CONTROLS AND PROCEDURES |
Evaluation of Disclosure Controls and Procedures
Our management, with the participation of our Chief Executive Officer and Chief Financial Officer, has evaluated the effectiveness of our disclosure controls and procedures as of October 1, 2016,September 29, 2018, and, based on their evaluation, our Chief Executive Officer and Chief Financial Officer have concluded that these controls and procedures were effective at the evaluation date.
Disclosure controls and procedures are controls and other procedures that are designed to reasonably assure that information required to be disclosed in the reports that we file or submit under the Exchange Act is recorded, processed, summarized and reported within the time periods specified in the Securities and Exchange Commission’s rules and forms. Disclosure controls and procedures include, without limitation, controls and procedures designed to ensure that information that we are required to disclose in the reports that we file or submit under the Exchange Act is accumulated and communicated to our management, including our Chief Executive Officer and Chief Financial Officer, as appropriate to allow timely decisions regarding required disclosure.
Management’s Annual Report on Internal Control over Financial Reporting
Management of Delta Apparel, Inc. is responsible for establishing and maintaining effective internal control over financial reporting as defined in Rules 13a-15(f) under the Securities Exchange Act of 1934. Our internal control over financial reporting is designed to provide reasonable assurance regarding the preparation and fair presentation of published financial statements. Because of its inherent limitations, internal control over financial reporting may not prevent or detect misstatements. Therefore, even those systems determined to be effective can provide only reasonable assurance with respect to financial statement preparation and presentation.
Under the supervision and with the participation of our management, including our Chief Executive Officer and Chief Financial Officer, we conducted an evaluation of the effectiveness of our internal control over financial reporting as of October 1, 2016.September 29, 2018. In this evaluation, management used the criteria set forth by the Committee of Sponsoring Organizations of the Treadway Commission (2013 Framework) ("COSO") in Internal Control – Integrated Framework. The scope of our efforts to comply with the internal requirements of Section 404 of the Sarbanes-Oxley Act of 2002 with respect to fiscal year 20162018 included all of our operations. Based on our evaluation, our management has concluded that, as of October 1, 2016,September 29, 2018, our internal control over financial reporting is effective.
The effectiveness of our internal control over financial reporting as of October 1, 2016,September 29, 2018, has been audited by Ernst & Young, LLP ("EY"), our independent registered public accounting firm, who also audited our Consolidated Financial Statements. EY’s attestation report on our internal controls over financial reporting is included herein.
Changes in Internal Control over Financial Reporting
There was no change in our internal control over financial reporting during the fourth quarter of fiscal year 20162018 that has materially affected, or is reasonably likely to materially affect, our internal control over financial reporting.
Report of Independent Registered Public Accounting Firm
TheTo the Shareholders and the Board of Directors and Stockholders of Delta Apparel, Inc. and subsidiaries
Opinion on Internal Control over Financial Reporting
We have audited Delta Apparel, Inc. and subsidiaries'subsidiaries’ internal control over financial reporting as of October 1, 2016,September 29, 2018, based on criteria established in Internal Control-IntegratedControl-Integrated Framework issued by the Committee of Sponsoring Organizations of the Treadway Commission (2013 framework) (the COSO criteria). In our opinion, Delta Apparel, Inc. and subsidiaries’subsidiaries (the Company) maintained, in all material respects, effective internal control over financial reporting as of September 29, 2018, based onthe COSO criteria.
We also have audited, in accordance with the standards of the Public Company Accounting Oversight Board (United States) (PCAOB), the consolidated balance sheets of the Company as of September 29, 2018, and September 30, 2017, and the related consolidated statements of operations, comprehensive income (loss), shareholder’s equity and cash flows for each of the two years in the period ended September 29, 2018, and the related notes and our report dated November 19, 2018, expressed an unqualified opinion thereon.
Basis for Opinion
The Company’s management is responsible for maintaining effective internal control over financial reporting, and for its assessment of the effectiveness of internal control over financial reporting included in the accompanying Management’s Report on Internal Control over Financial Reporting. Our responsibility is to express an opinion on the company’sCompany’s internal control over financial reporting based on our audit. We are a public accounting firm registered with the PCAOB and are required to be independent with respect to the Company in accordance with the U.S. federal securities laws and the applicable rules and regulations of the Securities and Exchange Commission and the PCAOB.
We conducted our audit in accordance with the standards of the Public Company Accounting Oversight Board (United States).PCAOB. Those standards require that we plan and perform the audit to obtain reasonable assurance about whether effective internal control over financial reporting was maintained in all material respects.
Our audit included obtaining an understanding of internal control over financial reporting, assessing the risk that a material weakness exists, testing and evaluating the design and operating effectiveness of internal control based on the assessed risk, and performing such other procedures as we considered necessary in the circumstances. We believe that our audit provides a reasonable basis for our opinion.
Definition and Limitations of Internal Control Over Financial Reporting
A company’s internal control over financial reporting is a process designed to provide reasonable assurance regarding the reliability of financial reporting and the preparation of financial statements for external purposes in accordance with generally accepted accounting principles. A company’s internal control over financial reporting includes those policies and procedures that (1) pertain to the maintenance of records that, in reasonable detail, accurately and fairly reflect the transactions and dispositions of the assets of the company; (2) provide reasonable assurance that transactions are recorded as necessary to permit preparation of financial statements in accordance with generally accepted accounting principles, and that receipts and expenditures of the company are being made only in accordance with authorizations of management and directors of the company; and (3) provide reasonable assurance regarding prevention or timely detection of unauthorized acquisition, use or disposition of the company’s assets that could have a material effect on the financial statements.
Because of its inherent limitations, internal control over financial reporting may not prevent or detect misstatements. Also, projections of any evaluation of effectiveness to future periods are subject to the risk that controls may become inadequate because of changes in conditions or that the degree of compliance with the policies or procedures may deteriorate.
In our opinion, Delta Apparel, Inc. and subsidiaries maintained, in all material respects, effective internal control over financial reporting as of October 1, 2016, based on the COSO criteria.
We also have audited, in accordance with the standards of the Public Company Accounting Oversight Board (United States), the consolidated balance sheet of Delta Apparel, Inc. and subsidiaries as of October 1, 2016, and the related consolidated statements of operations, comprehensive income, equity and cash flows for the year ended October 1, 2016, of Delta Apparel, Inc. and subsidiaries, and our report dated November 29, 2016, expressed an unqualified opinion thereon.
/s/ Ernst & Young LLP
Atlanta, GA
November 29, 201619, 2018
ITEM 9B. OTHER INFORMATION
Not Applicable
PART III
| |
| ITEM 10. | DIRECTORS, EXECUTIVE OFFICERS AND CORPORATE GOVERNANCE |
The information required by this Item is incorporated herein by reference from the portions of the definitive Proxy Statement to be filed with the Securities and Exchange Commission within 120 days following the end of our 20162018 fiscal year under the headings "Proposal No. 1: Election of Directors", “Corporate Governance”, “Executive Officers” and “Section 16(a) Beneficial Ownership Reporting Compliance.”
All of our employees, including our Chief Executive Officer and Chief Financial Officer (who is also our principal accounting officer), are required to abide by our business conduct policies so that our business is conducted in a consistently legal and ethical manner. We have adopted a code of business conduct and ethics known as our Ethics Policy Statement. The Ethics Policy Statement is available without charge on our website. In the event that we amend or waive any of the provisions of the Ethics Policy Statement applicable to our Chief Executive Officer or Chief Financial Officer, we intend to disclose the same on our website at www.deltaapparelinc.com.
| |
| ITEM 11. | EXECUTIVE COMPENSATION |
The information required by this Item is incorporated herein by reference from the portions of the definitive Proxy Statement to be filed with the Securities and Exchange Commission within 120 days following the end of our 20162018 fiscal year under the headings “Compensation Discussion and Analysis”, “Compensation Tables,” “Compensation Committee Interlocks and Insider Participation”“Executive Compensation” and “Compensation Committee Report.Tables.”
| |
| ITEM 12. | SECURITY OWNERSHIP OF CERTAIN BENEFICIAL OWNERS AND MANAGEMENT AND RELATED STOCKHOLDER MATTERS |
The information relating to security ownership by certain beneficial owners and management is incorporated herein by reference from the portion of the definitive Proxy Statement to be filed with the Securities and Exchange Commission within 120 days following the end of our 20162018 fiscal year under the heading “Stock Ownership of Management and Principal Shareholders."
On February 4, 2015, our shareholders re-approved the Delta Apparel, Inc. 2010 Stock Plan ("2010 Stock Plan") that was originally approved by our shareholders on November 11, 2010. The re-approval of the 2010 Stock Plan, including the material terms of the performance goals included in the 2010 Stock Plan, enablesenabled us to continue to grant equity incentive compensation awards that are structured in a manner intended to qualify as tax deductible, performance-based compensation under Section 162(m) of the Internal Revenue Code of 1986.1986, as applicable. Since November 2010, no additional awards have been or will be granted under either the Delta Apparel Stock Option Plan ("Option Plan") or the Delta Apparel Incentive Stock Award Plan ("Award Plan"); instead, all stock awards have been and will continue to be granted under the 2010 Stock Plan. The aggregate number of shares of common stock that may be delivered under the 2010 Stock Plan is 500,000 plus any shares of common stock subject to outstanding awards under the Option Plan or Award Plan that are subsequently forfeited or terminated for any reason before being exercised. The 2010 Stock Plan limits the number of shares that may be covered by awards to any participant in a given calendar year and also limits the aggregate awards of restricted stock, restricted stock units and performance stock granted in any given calendar year.
Set forth in the table below is certain information about securities issuable under our equity compensation plans as of October 1, 2016.September 29, 2018.
| | | Plan Category | | Number of securities to
be issued upon exercise of outstanding options, warrants and rights | | Weighted-average
exercise price of
outstanding options, warrants and rights | | Number of securities
remaining available for
future issuance under equity
compensation plans (excluding securities reflected in column (a)) | | Number of securities to
be issued upon exercise of outstanding options, warrants and rights | | Weighted-average
exercise price of
outstanding options, warrants and rights | | Number of securities
remaining available for
future issuance under equity
compensation plans (excluding securities reflected in column (a)) |
| | | (a) | | (b) | | (c) | | (a) | | (b) | | (c) |
| Equity compensation plans approved by security holders | | 595,638 |
| | $ | 11.57 |
| | 156,667 |
| | 532,500 |
| | $ | 16.12 |
| | 440,664 |
|
| Equity compensation plans not approved by security holders | | 86,000 |
| | $ | 8.30 |
| | — |
| | — |
| | $ | — |
| | — |
|
| Total | | 681,638 |
| | $ | 11.15 |
| | 156,667 |
| | 532,500 |
| | $ | 16.12 |
| | 440,664 |
|
For additional information on our stock-based compensation plans, see Note 13 - Stock-Based Compensation to the Consolidated Financial Statements.
| |
| ITEM 13. | CERTAIN RELATIONSHIPS AND RELATED TRANSACTIONS, AND DIRECTOR INDEPENDENCE |
The information required by this Item is incorporated herein by reference from the portion of the definitive Proxy Statement to be filed with the Securities and Exchange Commission within 120 days following the end of our 20162018 fiscal year under the headings “Related Party Transactions” andheading "Corporate Governance".
| |
| ITEM 14. | PRINCIPAL ACCOUNTANT FEES AND SERVICES |
The information required by this Item is incorporated herein by reference from the portion of the definitive Proxy Statement to be filed with the Securities and Exchange Commission within 120 days following the end of our 20162018 fiscal year under the heading “Proposal No. 4:3: Ratification of Appointment of Independent Registered Public Accounting Firm”.
PART IV
| |
| ITEM 15. | EXHIBITS AND FINANCIAL STATEMENT SCHEDULES |
Financial Statements:
Reports of Independent Registered Public Accounting Firms.
Consolidated Balance Sheets as of October 1, 2016September 29, 2018, and October 3, 2015.September 30, 2017.
Consolidated Statements of Operations for the years ended October 1, 2016September 29, 2018, October 3, 2015, and September 27, 2014.30, 2017.
Consolidated Statements of Comprehensive Income (Loss) for the years ended October 1, 2016September 29, 2018, October 3, 2015, and September 27, 2014.30, 2017.
Consolidated Statements of Shareholders’ Equity for the years ended October 1, 2016September 29, 2018, October 3, 2015, and September 27, 2014.30, 2017.
Consolidated Statements of Cash Flows for the years ended October 1, 2016September 29, 2018, October 3, 2015, and September 27, 2014.30, 2017.
Notes to Consolidated Financial Statements.
Financial Statements Schedules:
The following consolidated financial statement schedule of Delta Apparel, Inc. and subsidiaries is included in Item 15(c):
Schedule II — Consolidated Valuation and Qualifying Accounts
All other schedules for which provision is made in the applicable accounting regulation of the Securities and Exchange Commission are not required under the related instructions or are inapplicable, and therefore have been omitted. Columns omitted from schedules filed have been omitted because the information is not applicable.
(a)(3) Listing of Exhibits*
| |
2.1 | Amended and Restated Stock Purchase Agreement dated as of October 3, 2003, among Delta Apparel, Inc., MJS Acquisition Company, M. J. Soffe Co., James F. Soffe, John D. Soffe, and Anthony M. Cimaglia (excluding schedules and exhibits): Incorporated by reference to Exhibit 2.1 to the Company’s Form 8-K/A filed on October 17, 2003. |
| |
2.1.1 | First Amendment to Amended and Restated Stock Purchase Agreement dated as of November 10, 2004, among Delta Apparel, Inc., M. J. Soffe Co., James F. Soffe, John D. Soffe, and Anthony M. Cimaglia: Incorporated by reference to Exhibit 2.2.1 to the Company’s Form 10-Q filed on February 9, 2005. |
| |
2.2 | Asset Purchase Agreement dated as of August 22, 2005, among Delta Apparel, Inc., Junkfood Clothing Company, Liquid Blaino Designs, Inc. d/b/a Junkfood Clothing, Natalie Grof, and Blaine Halvorson (excluding schedules and exhibits): Incorporated by reference to Exhibit 2.1 to the Company’s Form 8-K filed on August 26, 2005. |
| |
2.3 | Asset Purchase Agreement dated as of August 17, 2006, among Delta Apparel, Inc., Fun-Tees, Inc., Henry T. Howe, James C. Poag, Jr., Beverly H. Poag, Lewis G. Reid, Jr., Kurt R. Rawald, Larry L. Martin, Jr., Julius D. Cline and Marcus F. Weibel: Incorporated by reference to Exhibit 2.1 to the Company’s Form 8-K filed on August 21, 2006. |
| |
2.4 | Asset Purchase Agreement dated as of November 18, 2004, among Delta Apparel, Inc. and Parkdale America LLC: Incorporated by reference to Exhibit 2.3 to the Company's Form 10-Q filed on February 9, 2005. |
| |
2.4.1 | First Amendment to Asset Purchase Agreement dated as of December 31, 2004, among Delta Apparel, Inc. and Parkdale America LLC: Incorporated by reference to Exhibit 2.3.1 to the Company's Form 10-Q filed on February 9, 2005. |
| |
2.5 | Asset Purchase Agreement dated as of August 27, 2013, among To The Game, LLC, Salt Life Holdings, LLC, Roger L. Combs, Sr., Donald R. Combs, Richard Thompson, and Michael T. Hutto (excluding schedules and exhibits): Incorporated by reference to Exhibit 2.1 to the Company’s Form 8-K filed on August 29, 2013. |
2.3 Asset Purchase Agreement dated as of August 17, 2006, among Delta Apparel, Inc., Fun-Tees, Inc., Henry T. Howe, James C. Poag, Jr., Beverly H. Poag, Lewis G. Reid, Jr., Kurt R. Rawald, Larry L. Martin, Jr., Julius D. Cline and Marcus F. Weibel: Incorporated by reference to Exhibit 2.1 to the Company’s Form 8-K filed on August 21, 2006. 2.5 Asset Purchase Agreement dated as of August 27, 2013, among To The Game, LLC, Salt Life Holdings, LLC, Roger L. Combs, Sr., Donald R. Combs, Richard Thompson, and Michael T. Hutto (excluding schedules and exhibits): Incorporated by reference to Exhibit 2.1 to the Company’s Form 8-K filed on August 29, 2013. | |
| 3.1.1 | Articles of Incorporation of the Company: Incorporated by reference to Exhibit 3.1 to the Company’s Form 10-12B filed on December 30, 1999. |
| |
3.2.6 | Amendment to Bylaws dated August 12, 2009: Incorporated by reference to Exhibit 3.2.6 to the Company’s Form 10-K filed on August 28, 2009. |
| |
| 4.1 | See Exhibits 3.1.1, 3.1.2, 3.1.3, 3.1.4, 3.2.1, 3.2.2, 3.2.3, 3.2.4, 3.2.5, and 3.2.6. |
| |
| 4.2 | Specimen certificate for common stock, par value $0.01 per share, of the Company: Incorporated by reference to Exhibit 4.2 to the Company’s Form 10-12 B/A filed on May 3, 2000. |
| |
| 10.1 | See Exhibits 2.1, 2.1.1, 2.2, 2.3, 2.4, 2.4.1 and 2.5. |
| |
10.2 | Fourth Amended and Restated Loan and Security Agreement, dated May 27, 2011, among Delta Apparel, Inc., M.J. Soffe, LLC (successor by merger to TCX, LLC), Junkfood Clothing Company, To The Game, LLC, and Art Gun, LLC, the financial institutions named therein as Lenders, Wells Fargo Bank, National Association, as Administrative Agent, Bank of America, N.A., as Syndication Agent, Wells Fargo Capital Finance, LLC, as Sole Lead Arranger, and Wells Fargo Capital Finance, LLC and Merrill Lynch, Pierce, Fenner & Smith Incorporated, as Joint Bookrunners: Incorporated by reference to Exhibit 10.1 to the Company’s Form 8-K filed on June 3, 2011. |
| |
10.2.1 | Consent and First Amendment to Fourth Amended and Restated Loan and Security Agreement, dated August 27, 2013, among Delta Apparel, Inc., M.J. Soffe, LLC (successor by merger to TCX, LLC), Junkfood Clothing Company, To The Game, LLC, and Art Gun, LLC, the financial institutions named therein as Lenders, Wells Fargo Bank, National Association, as Administrative Agent, Bank of America, N.A., as Syndication Agent, Wells Fargo Capital Finance, LLC, as Sole Lead Arranger, and Wells Fargo Capital Finance, LLC and Merrill Lynch, Pierce, Fenner & Smith Incorporated, as Joint Bookrunners: Incorporated by reference to Exhibit 10.1 to the Company’s Form 8-K filed on August 29, 2013. |
| |
10.2.2 | Third Amendment to Fourth Amended and Restated Loan and Security Agreement, dated September 26, 2014, among Delta Apparel, Inc., M.J. Soffe, LLC (successor by merger to TCX, LLC), Junkfood Clothing Company, To The Game, LLC, and Art Gun, LLC, the financial institutions named therein as Lenders, Wells Fargo Bank, National Association, as Administrative Agent, Bank of America, N.A., as Syndication Agent, Wells Fargo Capital Finance, LLC, as Sole Lead Arranger, and Wells Fargo Capital Finance, LLC and Merrill Lynch, Pierce, Fenner & Smith Incorporated, as Joint Bookrunners: Incorporated by reference to Exhibit 10.1 to the Company’s Form 8-K filed on October 1, 2014. |
10.2 Fourth Amended and Restated Loan and Security Agreement, dated May 27, 2011, among Delta Apparel, Inc., M.J. Soffe, LLC (successor by merger to TCX, LLC), Junkfood Clothing Company, To The Game, LLC, and Art Gun, LLC, the financial institutions named therein as Lenders, Wells Fargo Bank, National Association, as Administrative Agent, Bank of America, N.A., as Syndication Agent, Wells Fargo Capital Finance, LLC, as Sole Lead Arranger, and Wells Fargo Capital Finance, LLC and Merrill Lynch, Pierce, Fenner & Smith Incorporated, as Joint Bookrunners: Incorporated by reference to Exhibit 10.1 to the Company’s Form 8-K filed on June 3, 2011. 10.2.1 Consent and First Amendment to Fourth Amended and Restated Loan and Security Agreement, dated August 27, 2013, among Delta Apparel, Inc., M.J. Soffe, LLC (successor by merger to TCX, LLC), Junkfood Clothing Company, To The Game, LLC, and Art Gun, LLC, the financial institutions named therein as Lenders, Wells Fargo Bank, National Association, as Administrative Agent, Bank of America, N.A., as Syndication Agent, Wells Fargo Capital Finance, LLC, as Sole Lead Arranger, and Wells Fargo Capital Finance, LLC and Merrill Lynch, Pierce, Fenner & Smith Incorporated, as Joint Bookrunners: Incorporated by reference to Exhibit 10.1 to the Company’s Form 8-K filed on August 29, 2013. 10.2.2 Third Amendment to Fourth Amended and Restated Loan and Security Agreement, dated September 26, 2014, among Delta Apparel, Inc., M.J. Soffe, LLC (successor by merger to TCX, LLC), Junkfood Clothing Company, To The Game, LLC, and Art Gun, LLC, the financial institutions named therein as Lenders, Wells Fargo Bank, National Association, as Administrative Agent, Bank of America, N.A., as Syndication Agent, Wells Fargo Capital Finance, LLC, as Sole Lead Arranger, and Wells Fargo Capital Finance, LLC and Merrill Lynch, Pierce, Fenner & Smith Incorporated, as Joint Bookrunners: Incorporated by reference to Exhibit 10.1 to the Company’s Form 8-K filed on October 1, 2014. 10.2.3 Fourth Amendment to Fourth Amended and Restated Loan and Security Agreement, dated February 27, 2015, among Delta Apparel, Inc., M.J. Soffe, LLC (successor by merger to TCX, LLC), Junkfood Clothing Company, To The Game, LLC, and Art Gun, LLC, the financial institutions named therein as Lenders, Wells Fargo Bank, National Association, as Administrative Agent, Bank of America, N.A., as Syndication Agent, Wells Fargo Capital Finance, LLC, as Sole Lead Arranger, and Wells Fargo Capital Finance, LLC and Merrill Lynch, Pierce, Fenner & Smith Incorporated, as Joint Bookrunners: Incorporated by reference to Exhibit 10.1 to the Company’s Form 8-K filed on March 4, 2015. 10.2.4 Fifth Amended and Restated Credit Agreement, dated May 10, 2016, among Delta Apparel, Inc., M.J. Soffe, LLC, Junkfood Clothing Company, Salt Life, LLC (f/k/a To The Game, LLC), and Art Gun, LLC, the financial institutions named therein as
| |
10.2.3 | Fourth Amendment to Fourth Amended and Restated Loan and Security Agreement, dated February 27, 2015, among Delta Apparel, Inc., M.J. Soffe, LLC (successor by merger to TCX, LLC), Junkfood Clothing Company, To The Game, LLC, and Art Gun, LLC, the financial institutions named therein as Lenders, Wells Fargo Bank, National Association, as Administrative Agent, Bank of America, N.A., as Syndication Agent, Wells Fargo Capital Finance, LLC, as Sole Lead Arranger, and Wells Fargo Capital Finance, LLC and Merrill Lynch, Pierce, Fenner & Smith Incorporated, as Joint Bookrunners: Incorporated by reference to Exhibit 10.1 to the Company’s Form 8-K filed on March 4, 2015. |
| |
10.2.4 | Fifth Amended and Restated Credit Agreement, dated May 10, 2016, among Delta Apparel, Inc., M.J. Soffe, LLC, Junkfood Clothing Company, Salt Life, LLC (f/k/a To The Game, LLC), and Art Gun, LLC, the financial institutions named therein as Lenders, and Wells Fargo Bank, National Association, as Administrative Agent, Sole Lead Arranger, and Sole Book Runner: Incorporated by reference to Exhibit 10.1 to the Company’s Quarterly Report on Form 10-Q filed on May 12, 2016. |
10.2.5 First Amendment to Fifth Amended and Restated Credit Agreement, dated November 27, 2017, among Delta Apparel, Inc., M.J. Soffe, LLC, Junkfood Clothing Company, Salt Life, LLC, and Art Gun, LLC, the financial institutions named therein as Lenders, and Wells Fargo Bank, National Association, as Administrative Agent, Sole Lead Arranger, and Sole Book Runner: Incorporated by reference to Exhibit 10.2.5 to the Company’s Annual Report on Form 10-K filed on November 28, 2017. 10.2.6 Consent and Second Amendment to Fifth Amended and Restated Credit Agreement, dated March 9, 2018, among Delta Apparel, Inc., M.J. Soffe, LLC, Culver City Clothing Company, Salt Life, LLC, and Art Gun, LLC, the financial institutions named therein as Lenders, and Wells Fargo Bank, National Association, as Administrative Agent, Sole Lead Arranger, and Sole Book Runner: Incorporated by reference to Exhibit 10.1 to the Company’s Current Report on Form 8-K filed on March 13, 2018. 10.2.7 Consent and Third Amendment to Fifth Amended and Restated Credit Agreement, dated October 8, 2018, among Delta Apparel, Inc., M.J. Soffe, LLC, Culver City Clothing Company, Salt Life, LLC, and DTG2Go, LLC, the financial institutions named therein as Lenders, and Wells Fargo Bank, National Association, as Administrative Agent, Sole Lead Arranger, and Sole Book Runner: Incorporated by reference to Exhibit 10.1 to the Company’s Current Report on Form 8-K filed on October 9, 2018. | |
| 10.3 | Delta Apparel, Inc. 2000 Stock Option Plan, Effective as of February 15, 2000, Amended & Restated March 15, 2000: Incorporated by reference to Exhibit 10.4 to the Company’s Form 10-12B/A filed on March 31, 2000.*** |
| |
| 10.4 | Delta Apparel, Inc. Incentive Stock Award Plan, Effective February 15, 2000, Amended & Restated March 15, 2000: Incorporated by reference to Exhibit 10.5 to the Company’s Form 10-12B/A filed on March 31, 2000.*** |
| |
10.5 | Delta Apparel, Inc. 2010 Stock Plan: Incorporated by reference to Exhibit 99.2 to the Company’s Form 8-K filed on November 4, 2010, and Exhibit 1 to the Company's Proxy Statement filed on December 19, 2014.*** |
| |
10.6 | Yarn Supply Agreement dated as of January 5, 2005, between Delta Apparel, Inc. and Parkdale Mills, LLC and Parkdale America, LLC: Incorporated by reference to Exhibit 10.29 to the Company’s Form 10-Q filed on February 9, 2005.** |
| |
10.6.1 | First Amendment to Yarn Supply Agreement dated as of June 26, 2009 between Delta Apparel, Inc. and Parkdale Mills, LLC, and Parkdale America, LLC: Incorporated by reference to Exhibit 10.7.1 to the Company’s Form 10-K filed on August 28, 2009.** |
| |
10.6.2 | Second Amendment to Yarn Supply Agreement dated as of October 21, 2011 between Delta Apparel, Inc. and Parkdale Mills, LLC, and Parkdale America, LLC: Incorporated by reference to Exhibit 10.1 to the Company’s Form 8-K filed on October 25, 2011.** |
| |
10.6.3 | Third Amendment to Yarn Supply Agreement dated as of March 11, 2013, between Delta Apparel, Inc. and Parkdale Mills, LLC, and Parkdale America, LLC: Incorporated by reference to Exhibit 10.1 to the Company’s Form 8-K filed on March 14, 2013.** |
| |
10.6.4 | Fourth Amendment to Yarn Supply Agreement dated as of December 11, 2015, between Delta Apparel, Inc. and Parkdale Mills, LLC, and Parkdale America, LLC: Incorporated by reference to Exhibit 10.6.4 to the Company’s Annual Report on Form 10-K filed on December 15, 2015.** |
| |
10.7 | Employment Agreement between Delta Apparel, Inc. and Deborah H. Merrill dated December 31, 2015: Incorporated by reference to Exhibit 10.1 to the Company’s Form 8-K filed on January 7, 2016.*** |
| |
10.8 | Employment Agreement between Delta Apparel, Inc. and Martha M. Watson dated December 31, 2015: Incorporated by reference to Exhibit 10.2 to the Company’s Form 8-K filed on January 7, 2016.*** |
| |
10.9 | Employment Agreement between Delta Apparel, Inc. and Steven E. Cochran dated December 31, 2012: Incorporated by reference to Exhibit 10.2 to the Company's Form 8-K filed on January 3, 2013.*** |
| |
10.9.1 | Amendment to Employment Agreement between Delta Apparel, Inc. and Steven E. Cochran dated January 28, 2013: Incorporated by reference to Exhibit 10.1 to the Company’s Form 8-K filed on January 29, 2013.*** |
| |
10.11 | Employment Agreement between Delta Apparel, Inc. and Robert W. Humphreys dated June 10, 2009: Incorporated by reference to Exhibit 10.11 to the Company’s Form 10-K filed on August 28, 2009.*** |
| |
10.11.1 | First Amendment to Employment Agreement between Delta Apparel, Inc. and Robert W. Humphreys dated August 17, 2011: Incorporated by reference to Exhibit 10.1 to the Company’s Form 8-K filed on August 19, 2011.*** |
| |
10.11.2 | Second Amendment to Employment Agreement between Delta Apparel, Inc. and Robert W. Humphreys dated June 6, 2012: Incorporated by reference to Exhibit 10.1 to the Company’s Form 8-K filed on June 8, 2012.*** |
| |
10.11.3 | Third Amendment to Employment Agreement between Delta Apparel, Inc. and Robert W. Humphreys dated December 5, 2014: Incorporated by reference to Exhibit 10.1 to the Company’s Form 8-K filed on December 8, 2014.*** |
| |
10.12 | Employment Agreement between Delta Apparel, Inc. and Andrew R. DuVall dated January 18, 2016: Incorporated by reference to Exhibit 10.1 to the Company’s Form 8-K filed on January 19, 2016.*** |
| |
10.13 | Employment Agreement between Delta Apparel, Inc. and Justin M. Grow dated December 31, 2015.*** |
| |
10.14 | Form of Restricted Stock Unit and Performance Unit Award Agreement: Incorporated by reference to Exhibit 10.1 to the Company's Form 10-Q filed on November 3, 2011.*** |
| |
10.15 | Delta Apparel Short-Term Incentive Compensation Plan: Incorporated by reference to Exhibit A to the Company's Proxy Statement filed on September 28, 2011, and Exhibit 1 to the Company's Proxy Statement filed on December 29, 2015.*** |
| |
10.16 | Form of Restricted Stock Unit and Performance Unit Award Agreement: Incorporated by reference to Exhibit 10.14 to the Company's Form 10-K filed on August 29, 2013.*** |
| |
10.17 | Agreement between Delta Apparel, Inc. and IMG Worldwide, Inc. dated December 6, 2013: Incorporated by reference to Exhibit 10.1 to the Company's Form 8-K filed on December 6, 2013. |
| |
10.18 | Form of Restricted Stock Unit Award Agreement: Incorporated by reference to Exhibit 10.16 to the Company's Form 10-K filed on December 10, 2014.*** |
| |
10.19 | Form of Performance Unit Award Agreement: Incorporated by reference to Exhibit 10.17 to the Company's Form 10-K filed on December 10, 2014.*** |
| |
10.20 | Form of Restricted Stock Unit and Performance Unit Award Agreement: Incorporated by reference to Exhibit 10.1 to the Company's Quarterly Report on Form 10-Q filed on February 9, 2016.*** |
| |
10.21 | Form of Restricted Stock Unit Award Agreement: Incorporated by reference to Exhibit 10.2 to the Company's Quarterly Report on Form 10-Q filed on February 9, 2016.*** |
| |
16.1 | February 13, 2014, Correspondence from Ernst & Young LLP to SEC: Incorporated by reference to Exhibit 16.1 to the Company's Form 8-K filed on February 13, 2014. |
| |
16.2 | March 8, 2016, Correspondence from KPMG LLP to SEC: Incorporated by reference to Exhibit 16.1 to the Company's Form 8-K filed on March 9, 2016. |
| |
21 | Subsidiaries of the Company. |
| |
23.1 | Consent of Independent Registered Public Accounting Firm. |
| |
23.2 | Consent of Independent Registered Public Accounting Firm. |
| |
31.1 | Certification of the Chief Executive Officer pursuant to Rule 13a-14(a) under the Securities Exchange Act of 1934, as amended, as adopted pursuant to Section 302 of the Sarbanes-Oxley Act of 2002. |
| |
31.2 | Certification of the Chief Financial Officer pursuant to Rule 13a-14(a) under the Securities Exchange Act of 1934, as amended, as adopted pursuant to Section 302 of the Sarbanes-Oxley Act of 2002. |
| |
32.1 | Certification of the Chief Executive Officer pursuant to 18 U.S.C. Section 1350, as adopted pursuant to Section 906 of the Sarbanes-Oxley Act of 2002. |
| |
32.2 | Certification of the Chief Financial Officer pursuant to 18 U.S.C. Section 1350, as adopted pursuant to Section 906 of the Sarbanes-Oxley Act of 2002. |
______________________
|
| | |
| * | | All reports previously filed by the Company with the Commission pursuant to the Securities Exchange Act, and the rules and regulations promulgated thereunder, exhibits of which are incorporated to this Report by reference thereto, were filed under Commission File Number 1-15583. |
| ** | | Portions of this exhibit have been omitted pursuant to a request for confidential treatment and have been filed separately with the Securities and Exchange Commission. |
| *** | | This is a management contract or compensatory plan or arrangement. |
The registrant agrees to furnish supplementally to the Securities and Exchange Commission a copy of any omitted schedule or exhibit to any of the above filed exhibits upon request of the Commission.
(b) Exhibits
See Item 15(a)(3) above.
(c) Schedules
See information under (a)(1) and (2) of Item 15.
SIGNATURES
Pursuant to the requirements of Section 13 or 15(d) of the Securities Exchange Act of 1934, the registrant has duly caused this report to be signed on its behalf by the undersigned, thereunto duly authorized.
|
| | |
| | | DELTA APPAREL, INC. |
| | | (Registrant) |
| | | |
November 29, 201619, 2018 | | By: /s/ Deborah H. Merrill |
| Date | | Deborah H. Merrill |
| | | Chief Financial Officer and President, Delta BasicsGroup |
| | | (principal financial and accounting officer) |
Pursuant to the requirements of the Securities Exchange Act of 1934, this report has been signed below by the following persons on behalf of the registrant and in the capacities and as of the dates indicated.
|
| | | | |
| | | | | |
| | | | | |
/s/ J. Bradley CampbellAnita D. Britt | 11/29/201619/2018 | | /s/ Robert W. Humphreys | 11/29/201619/2018 |
James B. CampbellAnita D. Britt | Date | | Robert W. Humphreys | Date |
| Director | | | Chairman and Chief Executive Officer | |
| | | | | |
/s/ Sam P. CortezJ. Bradley Campbell | 11/29/201619/2018 | | /s/ Deborah H. Merrill | 11/29/201619/2018 |
Sam P. CortezJ. Bradley Campbell | Date | | Deborah H. Merrill | Date |
| Director | | | Chief Financial Officer and President, Delta BasicsGroup | |
| | | | (principal financial and accounting officer) |
| | | | | |
/s/ Elizabeth J. GatewoodSam P. Cortez | 11/29/201619/2018 | | /s/ Suzanne B. RudyDavid G. Whalen | 11/29/201619/2018 |
Elizabeth J. GatewoodSam P. Cortez | Date | | Suzanne B. RudyDavid G. Whalen | Date |
| Director | | | Director | |
| | | | | |
/s/ G. Jay GogueElizabeth J. Gatewood | 11/29/201619/2018 | | /s/ Robert E. Staton, Sr. | 11/29/201619/2018 |
G. Jay GogueElizabeth J. Gatewood | Date | | Robert E. Staton, Sr. | Date |
| Director | | | Director | |
| | | | | |
| /s/ G. Jay Gogue | 11/19/2018 | | /s/ A. Alexander Taylor, II | 11/29/201619/2018 |
| G. Jay Gogue | Date | | A. Alexander Taylor, II | Date |
| Director | | | Director | |
Delta Apparel, Inc. and Subsidiaries
Index to Consolidated Financial Statements
Report of Independent Registered Public Accounting Firm
TheTo the Shareholders and the Board of Directors and Stockholders of Delta Apparel, Inc. and subsidiaries
Opinion on the Financial Statements
We have audited the accompanying consolidated balance sheetsheets of Delta Apparel, Inc. and subsidiaries (the Company) as of October 1, 2016,September 29, 2018 and September 30, 2017, the related consolidated statements of operations, comprehensive income (loss), shareholder’s equity, and cash flows for each of the yeartwo years in the period ended October 1, 2016. Our audit also includedSeptember 29, 2018, and the related notes (collectively referred to as the “consolidated financial statements”). In our opinion, the consolidated financial statements present fairly, in all material respects, the financial statement schedule listedposition of the Company as of September 29, 2018 and September 30, 2017, and the results of its operations and its cash flows for each of the two years in the Index at Item 15(a). period ended September 29, 2018, in conformity with U.S. generally accepted accounting principles.
We also have audited, in accordance with the standards of the Public Company Accounting Oversight Board (United States) (PCAOB), the Company’s internal control over financial reporting as of September 29, 2018, based on criteria established in Internal Control-Integrated Framework issued by the Committee of Sponsoring Organizations of the Treadway Commission (2013 framework) and our report dated November 19, 2018, expressed an unqualified opinion thereon.
Basis for Opinion
These financial statements and schedule are the responsibility of the Company's management. Our responsibility is to express an opinion on these financial statements and schedule based on our audit.audits. We are a public accounting firm registered with the PCAOB and are required to be independent with respect to the Company in accordance with the U.S. federal securities laws and the applicable rules and regulations of the Securities and Exchange Commission and the PCAOB.
We conducted our auditaudits in accordance with the standards of the Public Company Accounting Oversight Board (United States).PCAOB. Those standards require that we plan and perform the audit to obtain reasonable assurance about whether the financial statements are free of material misstatement. An audit includesmisstatement, whether due to error or fraud. Our audits included performing procedures to assess the risks of material misstatement of the financial statements, whether due to error or fraud, and performing procedures that respond to those risks. Such procedures included examining, on a test basis, evidence supportingregarding the amounts and disclosures in the financial statements. An auditOur audits also includes assessingincluded evaluating the accounting principles used and significant estimates made by management, as well as evaluating the overall financial statement presentation. We believe that our audit provides a reasonable basis for our opinion.
In our opinion,presentation of the financial statements referred to above present fairly, in all material respects, the consolidated financial position of Delta Apparel, Inc. and subsidiaries at October 1, 2016, and the consolidated results of its operations and its cash flows for the year ended October 1, 2016, in conformity with U.S. generally accepted accounting principles. Also, in our opinion, the related financial statement schedule, when considered in relation to the basic financial statements taken as a whole, presents fairly in all material respects the information set forth therein.
We also have audited, in accordance with the standards of the Public Company Accounting Oversight Board (United States), Delta Apparel, Inc. and subsidiaries' internal control over financial reporting as of October 1, 2016, based on criteria established in Internal Control—Integrated Framework issued by the Committee of Sponsoring Organizations of the Treadway Commission (2013 framework) and our report dated November 29, 2016 expressed an unqualified opinion thereon.
/s/ Ernst & Young LLP
Atlanta, GA
November 29, 2016
Report of Independent Registered Public Accounting Firm
The Board of Directors and Shareholders
Delta Apparel, Inc.:
We have audited the accompanying consolidated balance sheet of Delta Apparel, Inc. and subsidiaries as of October 3, 2015, and the related consolidated statements of operations, comprehensive income (loss), shareholders’ equity, and cash flows for each of the years in the two-year period ended October 3, 2015.In connection with our audits of the consolidated financial statements, we also have audited financial statement schedule II listed in Section 15 (a) (2). These consolidated financial statements and the financial statement schedule are the responsibility of the Company’s management. Our responsibility is to express an opinion on these consolidated financial statements and the financial statement schedule based on our audits.
We conducted our audits in accordance with the standards of the Public Company Accounting Oversight Board (United States). Those standards require that we plan and perform the audit to obtain reasonable assurance about whether the financial statements are free of material misstatement. An audit includes examining, on a test basis, evidence supporting the amounts and disclosures in the financial statements. An audit also includes assessing the accounting principles used and significant estimates made by management, as well as evaluating the overall financial statement presentation. We believe that our audits provide a reasonable basis for our opinion.
In our opinion,
/s/ Ernst & Young LLP
We have served as the consolidated financial statements referred to above present fairly, in all material respects, the financial position of Delta Apparel, Inc. and subsidiaries as of October 3, 2015, and the results of their operations and their cash flows for each of the years in the two-year period ended October 3, 2015, in conformity with U.S. generally accepted accounting principles. Also in our opinion, the related financial statement schedule, when considered in relation to the basic consolidated financial statements taken as a whole, presents fairly, in all material respects, the information set forth therein.
/s/ KPMG LLP
Greenville, South Carolina
December 15, 2015, except for the last paragraph of Note 2(a), Note 2(aa) and Note 14, as to which the date is November 29, 2016Company’s auditor since 2016.
Atlanta, GA
November 19, 2018
Delta Apparel, Inc. and Subsidiaries
Consolidated Balance Sheets
(Amounts in thousands, except share amounts and per share data)
| | | | October 1, 2016 | | October 3, 2015 | September 29, 2018 | | September 30, 2017 |
| Assets | | | | | | |
| Cash and cash equivalents | $ | 397 |
| | $ | 300 |
| $ | 460 |
| | $ | 572 |
|
| Accounts receivable, net | 63,013 |
| | 61,921 |
| |
| Accounts receivable, less allowances of $1,475 and $1,433, respectively | | 45,605 |
| | 47,304 |
|
| Other receivables | 596 |
| | 820 |
| 1,274 |
| | 253 |
|
| Income tax receivable | 86 |
| | — |
| 38 |
| | 352 |
|
| Inventories, net | 164,247 |
| | 148,372 |
| 174,983 |
| | 174,551 |
|
| Note receivable | | 100 |
| | 2,016 |
|
| Prepaid expenses and other current assets | 4,145 |
| | 2,844 |
| 2,962 |
| | 2,646 |
|
| Total current assets | 232,484 |
| | 214,257 |
| 225,422 |
| | 227,694 |
|
| | | | | | | |
| Property, plant and equipment, net | 43,503 |
| | 39,653 |
| 52,114 |
| | 42,706 |
|
| Goodwill | 36,729 |
| | 36,729 |
| 33,217 |
| | 19,917 |
|
| Intangible assets, net | 20,922 |
| | 22,162 |
| 20,498 |
| | 16,151 |
|
| Deferred income taxes | 5,246 |
| | 7,294 |
| 1,374 |
| | 5,002 |
|
| Equity method investment | | 8,980 |
| | 4,140 |
|
| Other assets | 5,768 |
| | 4,808 |
| 2,004 |
| | 2,192 |
|
| Total assets | $ | 344,652 |
| | $ | 324,903 |
| $ | 343,609 |
| | $ | 317,802 |
|
| | | | | | | |
| Liabilities and Shareholders’ Equity | | | | |
| Liabilities and Equity | | | | |
| Liabilities: | | | | | | |
| Accounts payable | $ | 51,395 |
| | $ | 53,349 |
| $ | 48,008 |
| | $ | 46,335 |
|
| Accrued expenses | 21,706 |
| | 20,996 |
| 16,742 |
| | 17,704 |
|
| Income taxes payable | — |
| | 87 |
| |
| Current portion of contingent consideration | | 638 |
| | — |
|
| Current portion of capital lease financing | | 3,846 |
| | 848 |
|
| Current portion of long-term debt | 9,192 |
| | 8,340 |
| 6,577 |
| | 7,548 |
|
| Total current liabilities | 82,293 |
| | 82,772 |
| 75,811 |
| | 72,435 |
|
| | | | | | | |
| Long-term income taxes payable | | 4,259 |
| | — |
|
| Long-term capital lease financing, less current maturities | | 9,302 |
| | 2,519 |
|
| Long-term debt, less current maturities | 106,603 |
| | 93,872 |
| 92,083 |
| | 85,306 |
|
| Deferred income taxes | | 2,132 |
| | — |
|
| Other liabilities | 1,241 |
| | 660 |
| — |
| | 55 |
|
| Contingent consideration | 2,500 |
| | 3,100 |
| |
| Long-term contingent consideration | | 9,904 |
| | 1,600 |
|
| Total liabilities | $ | 192,637 |
| | $ | 180,404 |
| $ | 193,491 |
| | $ | 161,915 |
|
| | | | | |
| Commitments and contingencies |
| |
| |
| | | | | |
| Shareholders’ equity: | | | | | | |
| Preferred stock—$0.01 par value, 2,000,000 shares authorized, none issued and outstanding | — |
| | — |
| — |
| | — |
|
| Common stock —$0.01 par value, 15,000,000 shares authorized, 9,646,972 shares issued, and 7,609,727 and 7,797,166 shares outstanding as of October 1, 2016 and October 3, 2015, respectively | 96 |
| | 96 |
| |
| Common stock —$0.01 par value, 15,000,000 shares authorized, 9,646,972 shares issued, and 6,909,446 and 7,300,297 shares outstanding as of September 29, 2018, and September 30, 2017, respectively | | 96 |
| | 96 |
|
| Additional paid-in capital | 60,847 |
| | 59,399 |
| 61,979 |
| | 61,065 |
|
| Retained earnings | 116,679 |
| | 107,715 |
| 128,695 |
| | 127,358 |
|
| Accumulated other comprehensive loss | (112 | ) | | (429 | ) | |
| Treasury stock —2,037,245 and 1,849,806 shares as of October 1, 2016 and October 3, 2015, respectively | (25,495 | ) | | (22,282 | ) | |
| Total shareholders’ equity | 152,015 |
| | 144,499 |
| |
| Total liabilities and shareholders’ equity | $ | 344,652 |
| | $ | 324,903 |
| |
| Accumulated other comprehensive income (loss) | | 136 |
| | (35 | ) |
| Treasury stock —2,737,526 and 2,346,675 shares as of September 29, 2018, and September 30, 2017, respectively | | (40,881 | ) | | (32,597 | ) |
| Equity attributable to Delta Apparel, Inc. | | 150,025 |
| | 155,887 |
|
| Equity attributable to non–controlling interest | | 93 |
| | — |
|
| Total equity | | 150,118 |
| | 155,887 |
|
| Total liabilities and equity | | $ | 343,609 |
| | $ | 317,802 |
|
See accompanying Notes to Consolidated Financial Statements.
Delta Apparel, Inc. and Subsidiaries
Consolidated Statements of Operations
(Amounts in thousands, except per share data)
|
| | | | | | | | | | | |
| | Fiscal Year Ended |
| | October 1, 2016 | | October 3, 2015 | | September 27, 2014 |
| Net sales | $ | 425,249 |
| | $ | 449,142 |
| | $ | 452,901 |
|
| Cost of goods sold | 331,750 |
| | 360,823 |
| | 367,160 |
|
| Gross profit | 93,499 |
| | 88,319 |
| | 85,741 |
|
| | | | | | |
| Selling, general and administrative expenses | 76,578 |
| | 81,086 |
| | 86,275 |
|
| Change in fair value of contingent consideration | (600 | ) | | (500 | ) | | 200 |
|
| Gain on sale of business | — |
| | (7,704 | ) | | — |
|
| Other (income) expense, net | (552 | ) | | (682 | ) | | 927 |
|
| Restructuring costs | 1,741 |
| | — |
| | — |
|
| Operating income (loss) | 16,332 |
| | 16,119 |
| | (1,661 | ) |
| | | | | | |
| Interest expense | 5,287 |
| | 6,021 |
| | 5,792 |
|
| Earnings (loss) before provision for (benefit from) income taxes | 11,045 |
| | 10,098 |
| | (7,453 | ) |
| Provision for (benefit from) income taxes | 2,081 |
| | 2,005 |
| | (6,493 | ) |
| Net earnings (loss) | $ | 8,964 |
| | $ | 8,093 |
| | $ | (960 | ) |
| | | | | | |
| Basic earnings (loss) per share | $ | 1.16 |
| | $ | 1.03 |
| | $ | (0.12 | ) |
| Diluted earnings (loss) per share | $ | 1.12 |
| | $ | 1.00 |
| | $ | (0.12 | ) |
| | | | | | |
| Weighted average number of shares outstanding | 7,726 |
| | 7,874 |
| | 7,901 |
|
| Dilutive effect of stock options and awards | 253 |
| | 206 |
| | — |
|
| Weighted average number of shares assuming dilution | 7,979 |
| | 8,080 |
| | 7,901 |
|
|
| | | | | | | |
| | Fiscal Year Ended |
| | September 29, 2018 | | September 30, 2017 |
| Net sales | $ | 395,450 |
| | $ | 385,082 |
|
| Cost of goods sold | 313,429 |
| | 304,360 |
|
| Gross profit | 82,021 |
| | 80,722 |
|
| | | | |
| Selling, general and administrative expenses | 66,969 |
| | 67,408 |
|
| Other, net | (2,351 | ) | | (2,865 | ) |
| Operating income | 17,403 |
| | 16,179 |
|
| | | | |
| Interest expense | 5,713 |
| | 5,011 |
|
| Earnings before provision for income taxes | 11,690 |
| | 11,168 |
|
| Provision for income taxes | 10,460 |
| | 657 |
|
| Consolidated net earnings | $ | 1,230 |
| | $ | 10,511 |
|
| Less: Net loss attributable to non-controlling interest | (107 | ) | | — |
|
| Net earnings attributable to shareholders | 1,337 |
| | 10,511 |
|
| | | | |
| Basic earnings per share | $ | 0.19 |
| | $ | 1.40 |
|
| Diluted earnings per share | $ | 0.18 |
| | $ | 1.33 |
|
| | | | |
| Weighted average number of shares outstanding | 7,149 |
| | 7,531 |
|
| Dilutive effect of stock options and awards | 276 |
| | 351 |
|
| Weighted average number of shares assuming dilution | 7,425 |
| | 7,882 |
|
See accompanying Notes to Consolidated Financial Statements.
Delta Apparel, Inc. and Subsidiaries
Consolidated Statements of Comprehensive Income (Loss)
(Amounts in thousands)
|
| | | | | | | | | | | |
| | Fiscal Year Ended |
| | October 1, 2016 | | October 3, 2015 | | September 27, 2014 |
| Net earnings (loss) | $ | 8,964 |
| | $ | 8,093 |
| | $ | (960 | ) |
| Other comprehensive income (loss) related to unrealized gain (loss) on derivatives, net of income tax | 317 |
| | (160 | ) | | 288 |
|
| Comprehensive income (loss) | $ | 9,281 |
| | $ | 7,933 |
| | $ | (672 | ) |
|
| | | | | | | |
| | Fiscal Year Ended |
| | September 29, 2018 | | September 30, 2017 |
| Net earnings attributable to shareholders | $ | 1,337 |
| | $ | 10,511 |
|
| Other comprehensive income related to unrealized gain on derivatives, net of income tax | 171 |
| | 77 |
|
| Consolidated comprehensive income | $ | 1,508 |
| | $ | 10,588 |
|
See accompanying Notes to Consolidated Financial Statements.
Delta Apparel, Inc. and Subsidiaries
Consolidated Statements of Shareholders’ Equity
(Amounts in thousands, except share amounts)
| | | | | | | | | | | | Accumulated | | | | | | | | | | | | | Accumulated | | | | | | |
| | | | | | Additional | | | | Other | | | | | | | | | Additional | | | | Other | | | | Non- | | |
| | Common Stock | | Paid-In | | Retained | | Comprehensive | | Treasury Stock | | | Common Stock | | Paid-In | | Retained | | Comprehensive | | Treasury Stock | | Controlling | | |
| | Shares | | Amount | | Capital | | Earnings | | Income (Loss) | | Shares | | Amount | | Total | Shares | | Amount | | Capital | | Earnings | | Income (Loss) | | Shares | | Amount | | Interest | | Total |
| Balance at September 28, 2013 | 9,646,972 |
| | $ | 96 |
| | $ | 59,425 |
| | $ | 100,582 |
| | $ | (557 | ) | | 1,773,124 |
| | $ | (20,674 | ) | | $ | 138,872 |
| |
| Balance at October 1, 2016 | | 9,646,972 |
| | $ | 96 |
| | $ | 60,847 |
| | $ | 116,679 |
| | $ | (112 | ) | | 2,037,245 |
| | $ | (25,495 | ) | | — |
| | $ | 152,015 |
|
| | | | | | | | | | | | | | | | | | | | | | | | | | | | | | | | | |
| Net loss and other comprehensive income | — |
| | — |
| | — |
| | (960 | ) | | 288 |
| | — |
| | — |
| | (672 | ) | |
| Net earnings | | — |
| | — |
| | — |
| | 10,511 |
| | — |
| | — |
| | — |
| | — |
| | 10,511 |
|
| Other comprehensive income | | — |
| | — |
| | — |
| | — |
| | 77 |
| | — |
| | — |
| | — |
| | 77 |
|
| Stock grant | — |
| | — |
| | — |
| | — |
| | — |
| | — |
| | — |
| | — |
| — |
| | — |
| | (1,476 | ) | | — |
| | — |
| | (72,991 | ) | | 639 |
| | — |
| | (837 | ) |
| Stock options exercised | — |
| | — |
| | (32 | ) | | — |
| | — |
| | (82,500 | ) | | 963 |
| | 931 |
| — |
| | — |
| | (385 | ) | | — |
| | — |
| | (30,916 | ) | | 54 |
| | — |
| | (331 | ) |
| Excess tax benefits from option exercises | — |
| | — |
| | 27 |
| | — |
| | — |
| | — |
| | — |
| | 27 |
| |
| Purchase of common stock | — |
| | — |
| | — |
| | — |
| | — |
| | 78,674 |
| | (1,180 | ) | | (1,180 | ) | |
| Stock based compensation | — |
| | — |
| | 229 |
| | — |
| | — |
| | — |
| | — |
| | 229 |
| |
| Balance at September 27, 2014 | 9,646,972 |
| | 96 |
| | 59,649 |
| | 99,622 |
| | (269 | ) | | 1,769,298 |
| | (20,891 | ) | | 138,207 |
| |
| | | | | | | | | | | | | | | | | |
| Net earnings and other comprehensive loss | — |
| | — |
| | — |
| | 8,093 |
| | (160 | ) | | — |
| | — |
| | 7,933 |
| |
| Stock grant | — |
| | — |
| | (663 | ) | | — |
| | — |
| | (42,244 | ) | | 208 |
| | (455 | ) | |
| Stock options exercised | — |
| | — |
| | (304 | ) | | — |
| | — |
| | (17,584 | ) | | 502 |
| | 198 |
| |
| Reduction of tax benefits recognized from stock options | — |
| | — |
| | (673 | ) | | — |
| | — |
| | — |
| | — |
| | (673 | ) | |
| Purchase of common stock | — |
| | — |
| | — |
| | — |
| | — |
| | 140,336 |
| | (2,101 | ) | | (2,101 | ) | |
| Stock based compensation | — |
| | — |
| | 1,390 |
| | — |
| | — |
| | — |
| | — |
| | 1,390 |
| |
| Balance at October 3, 2015 | 9,646,972 |
| | 96 |
| | 59,399 |
| | 107,715 |
| | (429 | ) | | 1,849,806 |
| | (22,282 | ) | | 144,499 |
| |
| | | | | | | | | | | | | | | | | |
| Net earnings and other comprehensive income | — |
| | — |
| | — |
| | 8,964 |
| | 317 |
| | — |
| | — |
| | 9,281 |
| |
| Stock grant | — |
| | — |
| | (493 | ) | | — |
| | — |
| | (30,129 | ) | | 330 |
| | (163 | ) | |
| Excess tax benefits from stock awards | — |
| | — |
| | 89 |
| | — |
| | — |
| | — |
| | — |
| | 89 |
| — |
| | — |
| | (89 | ) | | 168 |
| | — |
| | — |
| | — |
| | — |
| | 79 |
|
| Purchase of common stock | — |
| | — |
| | — |
| | — |
| | — |
| | 217,568 |
| | (3,543 | ) | | (3,543 | ) | — |
| | — |
| | — |
| | — |
| | — |
| | 413,337 |
| | (7,795 | ) | | — |
| | (7,795 | ) |
| Stock based compensation | — |
| | — |
| | 1,852 |
| | — |
| | — |
| | — |
| | — |
| | 1,852 |
| — |
| | — |
| | 2,168 |
| | — |
| | — |
| | — |
| | — |
| | — |
| | 2,168 |
|
| Balance at October 1, 2016 | 9,646,972 |
| | $ | 96 |
| | $ | 60,847 |
| | $ | 116,679 |
| | $ | (112 | ) | | 2,037,245 |
| | $ | (25,495 | ) | | $ | 152,015 |
| |
| Balance at September 30, 2017 | | 9,646,972 |
| | 96 |
| | 61,065 |
| | 127,358 |
| | (35 | ) | | 2,346,675 |
| | (32,597 | ) | | — |
| | 155,887 |
|
| | | | | | | | | | | | | | | | | | | |
| Net earnings | | — |
| | — |
| | — |
| | 1,337 |
| | — |
| | — |
| | — |
| | — |
| | 1,337 |
|
| Other comprehensive income | | — |
| | — |
| | — |
| | — |
| | 171 |
| | — |
| | — |
| | — |
| | 171 |
|
| Net loss attributable to non-controlling interest | | — |
| | — |
| | — |
| | — |
| | — |
| | — |
| | — |
| | (107 | ) | | (107 | ) |
| Stock grant | | — |
| | — |
| | (1,661 | ) | | — |
| | — |
| | (73,123 | ) | | 716 |
| | — |
| | (945 | ) |
| Stock options exercised | | — |
| | — |
| | — |
| | — |
| | — |
| | — |
| | — |
| | — |
| | — |
|
| Purchase of common stock | | — |
| | — |
| | — |
| | — |
| | — |
| | 463,974 |
| | (9,000 | ) | | — |
| | (9,000 | ) |
| Stock based compensation | | — |
| | — |
| | 2,575 |
| | — |
| | — |
| | — |
| | — |
| | — |
| | 2,575 |
|
| Capital contributions by non-controlling interest | | — |
| | — |
| | — |
| | — |
| | — |
| | — |
| | — |
| | 200 |
| | 200 |
|
| Balance at September 29, 2018 | | 9,646,972 |
| | $ | 96 |
| | $ | 61,979 |
| | $ | 128,695 |
| | $ | 136 |
| | 2,737,526 |
| | $ | (40,881 | ) | | $ | 93 |
| | $ | 150,118 |
|
See accompanying Notes to Consolidated Financial Statements.
Delta Apparel, Inc. and Subsidiaries
Consolidated Statements of Cash Flows
(Amounts in thousands)
| | | | Fiscal Year Ended | Fiscal Year Ended |
| | October 1, 2016 | | October 3, 2015 | | September 27, 2014 | September 29, 2018 | | September 30, 2017 |
| Operating activities: | | | | | | | | |
| Net earnings (loss) | $ | 8,964 |
| | $ | 8,093 |
| | $ | (960 | ) | |
| Adjustments to reconcile net earnings (loss) to net cash provided by operating activities: | | | | | | |
| Consolidated net earnings | | $ | 1,230 |
| | $ | 10,511 |
|
| Adjustments to consolidated net earnings attributable to net cash provided by operating activities: | | | | |
| Depreciation | 8,295 |
| | 8,204 |
| | 8,156 |
| 8,736 |
| | 8,489 |
|
| Amortization of intangibles | 1,330 |
| | 1,338 |
| | 1,337 |
| 1,253 |
| | 1,120 |
|
| Amortization of deferred financing fees | 413 |
| | 517 |
| | 362 |
| 306 |
| | 323 |
|
| Excess tax benefits from stock awards and option exercises | (89 | ) | | (2 | ) | | (27 | ) | — |
| | 89 |
|
| Provision for (benefit from) deferred income taxes | 2,048 |
| | 786 |
| | (6,382 | ) | |
| (Benefit from) provision for allowances on accounts receivable, net | (1,007 | ) | | (175 | ) | | 201 |
| |
| Provision for deferred income taxes | | 5,760 |
| | 322 |
|
| Change in reserves for allowances on accounts receivable, net | | 42 |
| | (544 | ) |
| Non-cash stock compensation | 1,852 |
| | 1,390 |
| | 229 |
| 2,575 |
| | 1,872 |
|
| Change in the fair value of contingent consideration | (600 | ) | | (500 | ) | | 200 |
| |
| Loss on disposal of equipment | 108 |
| | 29 |
| | 126 |
| 130 |
| | 65 |
|
| Fixed asset impairment charge | 607 |
| | — |
| | 913 |
| |
| Gain on sale of The Game assets before transaction costs | — |
| | (8,114 | ) | | — |
| |
| Other, net | | (2,398 | ) | | (2,195 | ) |
| Changes in operating assets and liabilities, net of effect of acquisitions: | | | | | | | | |
| Accounts receivable | 140 |
| | 6,236 |
| | (296 | ) | 1,424 |
| | 16,596 |
|
| Inventories, net | (15,662 | ) | | 7,730 |
| | 3,002 |
| 715 |
| | (13,782 | ) |
| Prepaid expenses and other current assets | (1,302 | ) | | 376 |
| | (747 | ) | (208 | ) | | 863 |
|
| Other non-current assets | (346 | ) | | (308 | ) | | 198 |
| 53 |
| | (894 | ) |
| Accounts payable | (2,217 | ) | | (4,370 | ) | | 4,698 |
| (1,904 | ) | | (4,201 | ) |
| Accrued expenses | (420 | ) | | 158 |
| | 2,503 |
| (994 | ) | | (4,451 | ) |
| Income taxes | (84 | ) | | 1,447 |
| | (101 | ) | 4,573 |
| | (355 | ) |
| Other liabilities | 170 |
| | (528 | ) | | 561 |
| (55 | ) | | 110 |
|
| Net cash provided by operating activities | 2,200 |
| | 22,307 |
| | 13,973 |
| 21,238 |
| | 13,938 |
|
| | | | | | | | | |
| Investing activities: | | | | | | | | |
| Purchases of property and equipment | (12,315 | ) | | (7,773 | ) | | (8,894 | ) | (5,769 | ) | | (7,085 | ) |
| Proceeds from sale of property and equipment | 1,861 |
| | 470 |
| | 71 |
| 5,779 |
| | 1 |
|
| Proceeds from sale of The Game assets | — |
| | 14,913 |
| | — |
| |
| Cash paid for businesses, net of cash acquired | (313 | ) | | — |
| | — |
| |
| Proceeds from sale of Junkfood assets | | 1,946 |
| | 26,000 |
|
| Investment in capital stock | | (500 | ) | | — |
|
| Investment by non-controlling member | | 200 |
| | — |
|
| Cash paid for business | | (16,602 | ) | | — |
|
| Net cash (used in) provided by investing activities | (10,767 | ) | | 7,610 |
| | (8,823 | ) | (14,946 | ) | | 18,916 |
|
| | | | | | | | | |
| Financing activities: | | | | | | | | |
| Proceeds from long-term debt | 488,093 |
| | 497,364 |
| | 493,360 |
| 459,385 |
| | 453,860 |
|
| Repayment of long-term debt | (474,510 | ) | | (525,125 | ) | | (498,121 | ) | (453,579 | ) | | (476,801 | ) |
| Payment of capital financing | (350 | ) | | (150 | ) | | — |
| (2,325 | ) | | (633 | ) |
| Payment of financing fees | (1,018 | ) | | (42 | ) | | (384 | ) | |
| Repurchase of common stock | (3,477 | ) | | (2,023 | ) | | (1,180 | ) | (8,940 | ) | | (7,938 | ) |
| Proceeds from exercise of stock options | — |
| | 59 |
| | 931 |
| |
| Payment of withholding taxes on stock awards and option exercises | (163 | ) | | (314 | ) | | — |
| (945 | ) | | (1,167 | ) |
Excess tax benefits from stock awards and option exercises
| 89 |
| | 2 |
| | 27 |
| |
| Net cash provided by (used in) financing activities | 8,664 |
| | (30,229 | ) | | (5,367 | ) | |
| Net increase (decrease) in cash and cash equivalents | 97 |
| | (312 | ) | | (217 | ) | |
| Net cash used in financing activities | | (6,404 | ) | | (32,679 | ) |
| Net (decrease) increase in cash and cash equivalents | | (112 | ) | | 175 |
|
| Cash and cash equivalents at beginning of period | 300 |
| | 612 |
| | 829 |
| 572 |
| | 397 |
|
| Cash and cash equivalents at end of period | $ | 397 |
| | $ | 300 |
| | $ | 612 |
| $ | 460 |
| | $ | 572 |
|
| | | | | | | | | |
| Supplemental cash flow information: | | | | | | | | |
| Cash paid during the period for interest | $ | 4,273 |
| | $ | 4,803 |
| | $ | 4,698 |
| $ | 5,052 |
| | $ | 4,372 |
|
| Cash paid (received) during the period for income taxes, net of refunds received | $ | 308 |
| | $ | (328 | ) | | $ | 255 |
| |
| Non-cash financing activity—shortfall to excess tax benefit pool | $ | — |
| | $ | 673 |
| | $ | — |
| |
| Cash paid during the period for income taxes, net of refunds received | | $ | 260 |
| | $ | 506 |
|
| Non-cash financing activity—capital lease agreement | $ | 781 |
| | $ | — |
| | $ | 778 |
| $ | 6,840 |
| | $ | 2,347 |
|
| Accrued capital expenditures | $ | 1,615 |
| | $ | — |
| | $ | — |
| $ | 1,242 |
| | $ | — |
|
Delta Apparel, Inc. and Subsidiaries
Notes to Consolidated Financial Statements
October 1, 2016September 29, 2018
NOTE 1—THE COMPANY
Delta Apparel, Inc. is an international apparel design, marketing, manufacturing and sourcing company that features a diverse portfolio of lifestyle basics and branded activewear apparel, and headwear and accessories.related accessory products. We specialize in selling casual and athletic products through a variety of distribution channels and distribution tiers, including specialty stores, boutiques, department stores, mid and mass channels, e-retailers, sporting goods and outdoor retailers, independent and specialty stores, and the U.S. military. Our products are also made available direct-to-consumer on our websites and in our branded retail stores. We believe this diversified distribution allows us to capitalize on our strengths to provide casual activewear to a broad and evolving customer base whose shopping preferences may span multiple retail channels.
WeAs a vertically-integrated manufacturer, we design and internally manufacture the majority of our products, which allows us to offer a high degree of consistency and quality, controls as well as leverage scale efficiencies.efficiencies, and react quickly to changes in trends within the marketplace. We have manufacturing operations located in the United States, El Salvador, Honduras and Mexico, and use domestic and foreign contractors as additional sources of production. Our distribution facilities are strategically located throughout the United States to better serve our customers with same-day shipping on our catalog products and weekly replenishments to retailers.
NOTE 2—SIGNIFICANT ACCOUNTING POLICIES
(a) Basis of Presentation: Our consolidated financial statements are prepared in conformity with accounting principles generally accepted in the United States of America and include the accounts of Delta Apparel and its wholly-owned domestic and foreign subsidiaries.subsidiaries, as well as its newly-formed majority-owned subsidiary. All significant intercompany accounts and transactions have been eliminated in consolidation. In January 2018, Delta Apparel, Inc. established Salt Life Beverage, of which Delta Apparel, through its subsidiary, holds a 60% ownership interest. Salt Life Beverage, was formed to manufacture, market and sell Salt Life-branded alcoholic beverages and related products. We apply the equity method of accounting for investments in companies wherehave concluded we have a controlling financial interest in Salt Life Beverage in accordance with ASC-810, less than a 50%Consolidations, ownershipand ASU 2015-02, Consolidation (Topic 810); Amendments to Consolidations. The non–controlling interest and over which we exert significant influence. We do not exercise control over these companies and do not have substantive participating rights. As such, these entities are not considered variable interest entities.represents the 40% proportionate share of the results of Salt Life Beverage.
We operate our business in two distinct segments: basicsDelta Group and brandedSalt Life Group. Although the two segments are similar in their production processes and regulatory environments, they are distinct in their economic characteristics, products, marketing, and distribution methods.
Revisions
Certain We have reclassified certain amounts have been corrected in the October 3, 2015, balance sheet and related footnotesprior-period financial statements to conform to the classification of those balances as of October 1, 2016. These include the revision of deposits from Prepaid expenses and other current assets to Other assets in the amount of $1.3 million and the revision of the current portion of interest rate swaps from Other liabilities to Accrued liabilities in the amount of$0.3 million.period’s presentation.
(b) Fiscal Year: We operate on a 52-53 week fiscal year ending on the Saturday closest to September 30. The 20162018 and 20142017 fiscal years were 52-week years that ended on October 1, 2016,September 29, 2018, and September 27, 2014,30, 2017, respectively. The 2015 fiscal year was a 53-week year that ended on October 3, 2015.
(c) Use of Estimates: The preparation of financial statements in conformity with U.S. generally accepted accounting principles requires management to make certain estimates and assumptions that affect the reported amounts and disclosures of assets and liabilities at the date of the financial statements and the reported amounts of revenues and expenses during the reporting period. Estimates are adjusted to reflect actual experience when necessary. Significant estimates and assumptions affect many items in our financial statements,statements; for example: allowance for doubtful tradeaccount receivables, sales returns and allowances, inventory obsolescence, the carrying value of goodwill, and income tax assets and related valuation allowance. Our actual results may differ from our estimates.
(d) Cash and Cash Equivalents: Cash and cash equivalents consists of cash and temporary investments with original maturities of three months or less.
(e) Accounts Receivable: Accounts receivable consists primarily of receivables from our customers arising from the sale of our products, and we generally do not require collateral from our customers. We actively monitor our exposure to credit risk through the use of credit approvals and credit limits. Accounts receivable is presented net of reserves for allowances which include allowance for doubtful accounts, returns and allowances. The reserves for allowances were $2.0 million and $3.0 million, as of October 1, 2016, and October 3, 2015, respectively.
We estimate the net collectibility of our accounts receivable and establish an allowance for doubtful accounts based upon this assessment. In situations where we are aware of a specific customer’s inability to meet its financial obligation, such as in the case of a bankruptcy filing, a specific reserve for bad debts is recorded against amounts due to reduce the net recognized receivable to the amount reasonably expected to be collected. For all other customers, reserves are determined through analysis of the aging of accounts receivable balances, historical bad debts, customer concentrations, customer credit-worthiness, current economic trends and changes in customer payment terms. In addition, reserves are established for other concessions that have been extended to customers, including advertising, markdowns and other accommodations, net of historical recoveries. These reserves are determined based upon historical deduction trends and evaluation of current market conditions. Bad debt expense was less than 1% of net sales in each of fiscal years 2016, 2015,2018 and 2014.
2017.
(f) Inventories: We state inventories at the lower of cost or marketand net realizable value using the first-in, first-out method. Inventory cost includes materials, labor and manufacturing overhead on manufactured inventory, and all direct and associated costs, including inbound freight, to acquire sourced products. See Note 2(y) for further information regarding yarn procurements. We regularly review inventory
quantities on hand and record reserves for obsolescence, excess quantities, irregulars and slow movingslow-moving inventory based on historical selling prices, current market conditions, and forecasted product demand to reduce inventory to its net realizable value.
(g) Property, Plant and Equipment: Property, plant and equipment are stated at cost. We depreciate and amortize our assets on a straight-line method over the estimated useful lives of the assets, which range from three to twenty-five years. Leasehold improvements are amortized over the shorter of the lease term or the estimated useful life of the improvements. Assets that we acquire under non-cancelable leases that meet the criteria of capital leases are capitalized in property, plant and equipment and amortized over the useful lives of the related assets. When we retire or dispose of assets, the costs and accumulated depreciation or amortization are removed from the respective accounts, and we recognize any related gain or loss. Repairs and maintenance costs are charged to expense when incurred. Major replacements that substantially extend the useful life of an asset are capitalized and depreciated.
(h) Internally Developed Software Costs. We account for internally developed software in accordance with FASB Codification No. 350-40, Intangibles-Goodwill and Other, Internal-Use Software. After technical feasibility has been established, we capitalize the cost of our software development process, including payroll and payroll benefits, by tracking the software development hours invested in the software projects. We amortize our software development costs in accordance with the estimated economic life of the software, which is generally three to ten years.
(i) Impairment of Long-Lived Assets (Including Amortizable Intangible Assets): In accordance with FASB Codification No. 360, Property, Plant, and Equipment, our long-lived assets are reviewed for impairment whenever events or changes in circumstances indicate that the carrying amount of the assets may not be recoverable. When evaluating assets for potential impairment, we compare the carrying amount of the asset to the undiscounted future net cash flows expected to be generated by the asset. If impairment is indicated, the asset is permanently written down to its estimated fair market value (based upon future discounted cash flows) and an impairment loss is recognized.
(j) Goodwill and Intangible Assets: We recorded goodwill and intangible assets with definite lives, including trade names and trademarks, customer relationships, technology, and non-compete agreements, in conjunction with the acquisitions of Salt Life, DTG2Go, and Coast. On March 31, 2017, we sold the Junkfood and Art Gun.business to JMJD Ventures, LLC. See Note 4 — Divestitures for further information on this transaction. Intangible assets are amortized based on their estimated economic lives, ranging from four to twenty years. Goodwill represents the excess of the purchase price over the fair value of net identified tangible and intangible assets and liabilities acquired, and is not amortized. The total amount of goodwill is expected to be deductible for tax purposes. See Note 7 — Goodwill and Intangible Assets for further details.
(k) Impairment of Goodwill: We evaluate the carrying value of goodwill annually or more frequently if events or circumstances indicate that an impairment loss may have occurred. Such circumstances could include, but are not limited to, a significant adverse change in business climate, increased competition or other economic conditions.
We complete our annual impairment test of goodwill on the first day of our third fiscal quarter. We estimate fair value of the applicable reporting unit or units using a discounted cash flow methodology. This methodology represents a level 3 fair value measurement as defined under ASC 820, Fair Value Measurements and Disclosures, since the inputs are not readily observable in the marketplace. The goodwill impairment testing process involves the use of significant assumptions, estimates and judgments with respect to a variety of factors, including sales, gross margins, selling, general and administrative expenses, capital expenditures, cash flows and the selection of an appropriate discount rate, all of which are subject to inherent uncertainties and subjectivity. When we perform goodwill impairment testing, our assumptions are based on annual business plans and other forecasted results, which we believe represent those of a market participant. We select a discount rate, which is used to reflect market-based estimates of the risks associated with the projected cash flows, based on the best information available as of the date of the impairment assessment. Based on the annual impairment analysis, there is not an impairment on the goodwill associated with Junkfood and Salt Life the only goodwilland DTG2Go recorded onin our financial statements.
Given the current macro-economic environment and the uncertainties regarding its potential impact on our business, there can be no assurance that our estimates and assumptions used in our impairment tests will prove to be accurate predictions of the future. If our assumptions regarding forecasted cash flows are not achieved, it is possible that an impairment review may be triggered and goodwill may be impaired.
(l) Contingent Consideration: At the end of each reporting period, we are required to remeasure the fair value of the contingent consideration related to the Salt Life and Art GunDTG2Go acquisitions in accordance with FASB Codification No. 805, Business Combinations (“ASC 805”). Based on the operating results and projections, we analyzed the fair value of the contingent consideration for bothrelated to the Salt Life and Art GunDTG2Go acquisitions as of October 1, 2016.September 29, 2018. The estimated fair value of the contingent consideration for Salt Life was $2.5$1.3 million and $3.1$1.6 million at October 1, 2016,September 29, 2018, and October 3, 2015,September 30, 2017, respectively. NoThe DTG2Go contingent consideration is expected to be paid under the terms of the Art Gun arrangement.was valued at $9.2 million at September 29, 2018.
(m) Self-Insurance Reserves: Prior to January 1, 2015, our medical, prescription and dental care benefits were primarily self-insured. Effective January 1, 2015, our medical and prescription benefits became fully insured, but our dental insurance remained self-insured. Our prior self-insurance accruals were based on claims filed and estimates of claims incurred but not reported. We developed estimates
of claims incurred but not reported based upon the historical time it takes for a claim to be reported and paid, and historical claim amounts. Self-insurance reserves were less than $0.1 million as of October 1, 2016, and October 3, 2015.
(n) Revenue Recognition: Revenues from product sales are recognized when ownership is transferred to the customer, which includes not only the passage of title, but also the transfer of the risk of loss related to the product. At this point, the sales price is fixed and determinable, and we are reasonably assured of the collectibility of the sale.accounts receivable. The majority of our sales are shipped FOB or Ex Works shipping point and revenue is therefore recognized when the goods are shipped to the customer. For sales that are shipped FOB or Ex Works destination point, we do not recognize the revenue until the goods are received by the customer. Shipping and handling charges billed to our customers are included in net revenue and the related costs are included in cost of goods sold. Revenues are reported
on a net sales basis, which is computed by deducting product returns, discounts and estimated returns and allowances. We estimate returns and allowances on an ongoing basis by considering historical and current trends.
Royalty revenue is primarily derived from royalties paid to us by licensees of our intellectual property rights, which include, among other things, trademarks and copyrights. We execute license agreements with our licensees detailing the terms of the licensing arrangement. Royalties are generally recognized upon receipt of the licensees'licensee's royalty report in accordance with the terms of the executed license agreement and when all other revenue recognition criteria have been met.
(o)(n) Sales Tax: Sales tax collected from customers and remitted to various government agencies are presented on a net basis (excluded from revenues) in the Consolidated Statements of Operations.
(p)(o) Cost of Goods Sold: We include in cost of goods sold all manufacturing and sourcing costs incurred prior to the receipt of finished goods at our distribution facilities.facilities in cost of goods sold. The cost of goods sold principally includes product cost, purchasing costs, inbound freight charges, insurance, inventory write-downs, and depreciation and amortization expense associated with our manufacturing and sourcing operations. Our gross margins may not be comparable to other companies, since some entities include costs related to their distribution network in cost of goods sold and we exclude them from gross margin, including them instead in selling, general and administrative expenses.
(q)(p) Selling, General and Administrative Expense: We include in selling, general and administrative expenses costs incurred subsequent to the receipt of finished goods at our distribution facilities, such as the cost of stocking, warehousing, picking and packing, and shipping goods for delivery to our customers. Distribution costs included in selling, general and administrative expenses totaled $15.1 million, $16.8$16.9 million and $16.9$14.6 million in fiscal years 2016, 20152018 and 2014,2017, respectively. In addition, selling, general and administrative expenses include costs related to sales associates, administrative personnel cost, advertising and marketing expenses, royalty payments on licensed products, and other general and administrative expenses.
(r)(q) Advertising Costs: All costs associated with advertising and promoting our products are expensed during the year in which they are incurred and are included in selling, general and administrative expenses in the Consolidated Statements of Operations. We participate in cooperative advertising programs with our customers. Depending on the customer, our defined cooperative programs allow the customer to use from 2% to 5% of its net purchases from us towards advertisements of our products. Because our products are being specifically advertised, we are receiving an identifiable benefit resulting from the consideration for cooperative advertising. Therefore, pursuant to FASB Codification No. 605-50, Revenue Recognition, Customers Payments and Incentives, we record cooperative advertising costs as a selling expense and the related cooperative advertising reserve as an accrued liability. Advertising costs totaled $4.4 million, $4.7$4.0 million and $3.6$4.6 million in fiscal years 2016, 20152018 and 2014,2017, respectively. Included in these costs were $1.1$0.7 million in each of fiscal years 2016, 20152018 and 20142017 related to our cooperative advertising programs.
(s)(r) Stock-Based Compensation: Stock-based compensation cost is accounted for under the provisions of FASB Codification No. 718, Compensation – Stock Compensation (“ASC 718”), the Securities and Exchange Commission Staff Accounting Bulletin No. 107 ("SAB 107"), and the Securities and Exchange Commission Staff Accounting Bulletin No. 110 ("SAB 110"). ASC 718 requires all stock-based payments to employees, including grants of employee stock options, to be recognized as expense over the vesting period using a fair value method. We estimate the fair value of stock options using the Black-Scholes options pricing model. The fair value of our restricted stock awards is the quoted market value of our stock on the grant date. For performance-based stock awards, in the event we determine it is no longer probable that we will achieve the minimum performance criteria specified in the award, we reverse all of the previously recognized compensation expense in the period such a determination is made. We recognize the fair value, net of estimated forfeitures, as a component of selling, general and administrative expense in the Consolidated Statements of Operations over the vesting period.
(t)We early-adopted ASU No. 2016-09, Improvements to Employee Share-Based Payment Accounting, (ASU 2016-09). ASU 2016-09 simplifies various aspects of accounting for share-based payment transactions. The most significant change from this update amends the presentation of excess tax benefits and deficiencies in the financial statements by eliminating tax pools and requiring these benefits and deficiencies to be reflected in the income statement. It also allows employer withholding on share based compensation up to the maximum statutory rate without the possibility of triggering liability accounting and allows companies to make a policy election as it relates to forfeitures. Additionally, the ASU provides definitive guidance related to presentation of income tax benefit/deficiencies as an operating activity and payment of taxes for employee withholding from stock compensation as a financing activity within the Consolidated Statements of Cash Flows. ASU 2016-09 was adopted in our fiscal year beginning October 2, 2016, and we have elected to continue our policy of estimating forfeitures.
(s) Income Taxes: We account for income taxes under the liability method. Deferred tax assets and liabilities are recognized for the future tax consequences attributable to differences between the financial statement carrying amounts of existing assets and liabilities and their respective tax bases, and operating loss and tax credit carryforwards. Deferred tax assets and liabilities are measured using enacted tax rates expected to apply to taxable income in the years in which those temporary differences are expected to be recovered or settled. The effect on deferred tax assets and liabilities of a change in tax rates is recognized in income in the period that includes the enactment date.
(u)(t) Earnings per Share: We compute basic earnings per share ("EPS") by dividing net income by the weighted average number of common shares outstanding during the year pursuant to FASB Codification No. 260, Earnings Per Share (“ASC 260”). Basic EPS includes no dilution. Diluted EPS is calculated, as set forth in ASC 260, by dividing net income by the weighted average number of common shares outstanding adjusted for the issuance of potentially dilutive shares. Potential dilutive shares consist of common stock issuable
under the assumed exercise of outstanding stock options and awards using the treasury stock method. This method, as required by ASC
718, assumes that the potential common shares are issued and the proceeds from the exercise, along with the amount of compensation expense attributable to future services, are used to purchase common stock at the exercise date. The difference between the number of potential shares issued and the number of shares purchased is added as incremental shares to the actual number of shares outstanding to compute diluted EPS. Outstanding stock options and awards that result in lower potential shares issued than shares purchased under the treasury stock method are not included in the computation of diluted EPS since their inclusion would have an anti-dilutive effect on EPS.
(v)(u) Foreign Currency Translation: Our functional currency for our foreign operated manufacturing facilities is the United States dollar. We remeasure those assets and liabilities denominated in foreign currencies using exchange rates in effect at each balance sheet date. Property, plant and equipment and the related accumulated depreciation or amortization are recorded at the exchange rates in effect on the date we acquired the assets. Revenues and expenses denominated in foreign currencies are remeasured using average exchange rates for all periods presented.during the period transacted. We recognize the resulting foreign exchange gains and losses as a component of other income and expense in the Consolidated Statements of Operations. These gains and losses are immaterial for all periods presented.
(w)(v) Fair Value of Financial Instruments: We use financial instruments in the normal course of our business. The carrying values approximate fair values for financial instruments that are short-term in nature, such as cash, accounts receivable and accounts payable. We estimate that the carrying value of our long-term fixed rate debt approximates fair value based on the current rates offered to us for debt of the same remaining maturities.
(x)(w) Other Comprehensive Income (Loss):Income: Other Comprehensive Income (Loss) consists of net earnings (loss) and unrealized gains (losses) from cash flow hedges, net of tax. Accumulated other comprehensive lossincome (loss) contained in the shareholders’ equity section of the Consolidated Balance Sheets was $0.1 million and $0.4 million as of October 1, 2016,September 29, 2018, and October 3, 2015, respectively,($35 thousand) as of September 30, 2017, and was related to interest rate swap agreements.
(y)(x) Yarn and Cotton Procurements: We have a supply agreement with Parkdale to supply our yarn requirements until December 31, 2018. Under the supply agreement, we purchase from Parkdale all of our yarn requirements for use in our manufacturing operations, excluding yarns that Parkdale does not manufacture or cannot manufacture due to temporary capacity constraints. The purchase price of yarn is based upon the cost of cotton plus a fixed conversion cost. Thus, we are subject to the commodity risk of cotton prices and cotton price movements, which could result in unfavorable yarn pricing for us. We fix the cotton prices as a component of the purchase price of yarn, pursuant to the supply agreement, in advance of the shipment of finished yarn from Parkdale. Prices are set according to prevailing prices, as reported by the New York Cotton Exchange, at the time we elect to fix specific cotton prices.
(z)(y) Derivatives: From time to time we enter into forward contracts, option agreements or other instruments to limit our exposure to fluctuations in interest rates and raw material prices with respect to long-term debt and cotton purchases, respectively. We determine at inception whether the derivative instruments will be accounted for as hedges.
We account for derivatives and hedging activities in accordance with FASB Codification No. 815, Derivatives and Hedging (“ASC 815”), as amended. ASC 815 establishes accounting and reporting standards for derivative instruments, including certain derivative instruments embedded in other contracts and hedging activities. It requires the recognition of all derivative instruments as either assets or liabilities in the Consolidated Balance Sheets and measurement of those instruments at fair value. The accounting treatment of changes in fair value depends upon whether or not a derivative instrument is designated as a hedge and, if so, the type of hedge. We include all derivative instruments at fair value in our Consolidated Balance Sheets. For derivative financial instruments related to the production of our products that are not designated as a hedge, we recognize the changes in fair value in cost of sales. For derivatives designated as cash flow hedges, to the extent effective, we recognize the changes in fair value in accumulated other comprehensive income (loss) until the hedged item is recognized in income. Any ineffectiveness in the hedge is recognized immediately in income in the line item that is consistent with the nature of the hedged risk. We formally document all relationships between hedging instruments and hedged items, as well as risk management objectives and strategies for undertaking various hedge transactions, at the inception of the transactions.
We are exposed to counterparty credit risks on all derivatives. Because these amounts are recorded at fair value, the full amount of our exposure is the carrying value of these instruments. We only enter into derivative transactions with well establishedwell-established institutions and therefore we believe the counterparty credit risk is minimal.
From time to time, we may purchase cotton option contracts to economically hedge the risk related to market fluctuations in the cost of cotton used in our operations. During fiscal year 2016 we entered into various cotton option contracts to economically hedge the risk related to market fluctuations in the cost of cotton used in our operations. We do not receive hedge accounting treatment for these derivatives. As such, the realized gains and losses associated with them were recorded within cost of goods sold on the Consolidated Statement of Operations. There were no significant raw material option agreements that were purchased during fiscal years 2016, 20152018 or 2014.2017.
In September 2013, we entered into fourThe table below indicates information on our outstanding interest rate swap agreements as follows:during fiscal years 2018 and 2017:
|
| | | | | | | | |
| | Effective Date | | Notational Amount | | LIBOR Rate | | Maturity Date |
| Interest Rate Swap | September 9, 2013 | | $15 million | | 1.1700 | % | | September 9, 2016 |
Interest Rate Swap | September 9, 2013 | | $15 million | | 1.6480 | %1.6480% | | September 11, 2017 |
| Interest Rate Swap | September 19, 2013 | | $15 million | | 1.0030 | % | | September 19, 2016 |
Interest Rate Swap | September 19, 2013 | | $15 million | | 1.4490 | %1.4490% | | September 19, 2017 |
| Interest Rate Swap | July 19, 2017 | | $10 million | | 1.7400% | | July 19, 2019 |
| Interest Rate Swap | July 19, 2017 | | $10 million | | 1.9900% | | May 10, 2021 |
| Interest Rate Swap | July 25, 2018 | | $20 million | | 3.1800% | | July 25, 2023 |
During fiscal years 2016, 2015,2018 and 2014, the2017, these interest rate swap agreements had minimal ineffectiveness and were considered highly-effectivehighly effective hedges.
The changes in fair value of the interest rate swap agreements resulted in an AOCI gain, net of taxes, of $0.3 million for the year ended October 1, 2016, an AOCI loss,gains, net of taxes, of $0.2 million for the year ended October 3, 2015, an AOCI gain, net of taxes of $0.3and $0.1 million for the yearyears ended September 27, 2014.29, 2018, and September 30, 2017, respectively. See Note 16(d) - Derivatives for further details.
(z) Equity Method Accounting: We apply the equity method of accounting for investments in companies where we have less than a 50% ownership interest and over which we exert significant influence. We do not exercise control over these companies and do not have substantive participating rights. As such, these entities are not considered variable interest entities. As of September 29, 2018, we own 31% of the outstanding capital stock in our Honduran equity method investment.
(aa) Net Income Attributable to Non-Controlling Interest: The net income attributable to non-controlling interest represents the share of net income allocated to members of our consolidated affiliates.
(ab) Business Combinations: Business combinations completed by Delta Apparel have been accounted for under the acquisition method of accounting. The acquisition method requires the assets acquired and liabilities, including contingencies, to be recorded at the fair value determined at the acquisition date and changes thereafter recorded in income. For significant acquisitions, we obtain independent third-party valuation studies for certain assets acquired and liabilities assumed to assist us in determining the fair value. Goodwill represents the purchase price over the fair value of tangible and intangible assets acquired and liabilities assumed. The results of acquired businesses are included in our results of operations from the date of acquisition.
(ac) Capital Leases: We classify leases as capital or operating leases in accordance with ASC 840 Leases. We account for a lease that transfers substantially all of the benefits and risks incidental to ownership of property as a capital lease. At the inception of a capital lease, we record an asset and payment obligation at an amount equal to the lesser of the present value of the minimum lease payments and the property's fair market value. All other leases are accounted for as operating leases and the related lease payments are charged to expenses as incurred.
(ad) Recently Adopted Accounting Pronouncements:
In NovemberJuly 2015, the FASBFinancial Accounting Standards Board ("FASB") issued ASUAccounting Standards Update ("ASU") No. 2015-17,2015-11, Income Taxes (Topic 740): Balance Sheet ClassificationSimplifying the Measurement of Deferred TaxesInventory, ("ASU 2015-17"2015-11"). This new guidance requires businessesan entity to classify deferred tax liabilitiesmeasure inventory at the lower of cost and assets on their balance sheets as noncurrent. Under existing accounting standards, anet realizable value. Previously, entities measured inventory at the lower of cost or market. ASU 2015-11 replaces market with net realizable value. Net realizable value is the estimated selling price in the ordinary course of business, must separate deferred income tax liabilitiesless reasonably predictable costs of completion, disposal, and assets into current and noncurrent.transportation. Subsequent measurement is unchanged for inventory measured under last-in, first-out or the retail inventory method. ASU 2015-17 was issued as a way to simplify the way businesses classify deferred tax liabilities and assets on their balance sheets. Public companies must apply ASU 2015-17 to2015-11 requires prospective adoption for inventory measurements for fiscal years beginning after December 15, 2016. Companies must follow the requirements for2016, and interim periods within those fiscal years but early adoption at the beginning of an interim or annual periodfor public business entities. Early application is allowed for all entities.permitted. ASU 2015-172015-11 was adopted in our fiscal year beginning October 4, 2015.1, 2017. The implementationadoption of this standard did not have a material impact on our Consolidated Financial Statements.
In September 2015, the FASB issued ASU 2015-172015-16, Business Combinations (Topic 805): Simplifying the Accounting for Measurement-Period Adjustments. ASU 2015-16 eliminates the requirement that an acquirer in a business combination account for measurement-period adjustments retrospectively. Instead, an acquirer will recognize a measurement-period adjustment during the period in which it determines the amount of the adjustment. The guidance is effective for public business entities for fiscal years beginning after December 15, 2015, and interim periods within those fiscal years. ASU 2015-16 was applied retroactivelyadopted in the interim period beginning April 1, 2018 (the first interim period in which we would have recorded measurement-period adjustments, if necessary, since the ASU became effective). The adoption of this standard did not have an impact on our Consolidated Financial Statements.
In March 2018, the FASB issued ASU 2018-05, Income Taxes (Topic 740), Amendment to SEC Paragraphs Pursuant to SEC Staff Accounting Bulletin No. 118 (SEC Update), ("ASU-2015-05"). ASU 2018-05 amends certain Securities and Exchange Commission (“SEC”) guidance under Topic 740 related to the October 3, 2015, Consolidated Balance Sheet included in this Form 10-K. As a resultTax Cuts and Jobs Act of this retroactive application, current deferred2017. It also adds guidance to the FASB Accounting Standards Codification that answers questions regarding how certain income tax assetseffects from the Tax Cuts and Jobs Act of $7.3 million2017 should be applied to companies’ financial statements. The guidance lists which financial statement disclosures are required under a measurement period approach. ASU 2018-05 was effective immediately and we have been netted with noncurrent deferred income tax liabilities of $7 thousand and reclassified to noncurrent deferred income tax assetsmade the disclosures required by ASU 2018-05 in the October 3, 2015, Consolidated Balance Sheet.Note 10—Income Taxes.
(ab)(ae) Recently Issued Accounting Pronouncements Not Yet Adopted:
In May 2014, the FASB issued ASU No. 2014-09, Revenue from Contracts with Customers, ("ASU 2014-09"). This new guidance requires an entity to recognize the amount of revenue to which it expects to be entitled for the transfer of promised goods or services to customers. ASU 2014-09 will replace most existing revenue recognition guidance in U.S. GAAP when it becomes effective. ASU 2014-09 is effective for annual periods beginning after December 15, 2017, for public business entities and permits the use of either the retrospective or cumulative effect transition method. Early application is permitted only for annual reporting periods beginning after December 15, 2016. ASU 2014-09 will therefore be effective in our fiscal year beginning September 30, 2018. We are evaluatinghave evaluated the effectnew standard against our existing accounting policies and practices, including reviewing standard purchase orders, invoices, shipping terms, and reviewing contracts with customers. We expect that ASU 2014-09revenue for our primary revenue streams will be recognized at the point in time which is similar to how we it is currently. We have not identified any information that would indicate that the new guidance will have a material impact on our Consolidated Financial Statements and related disclosures.
In July 2015,Statements. While we are substantially complete with the FASB issued ASU No. 2015-11, Simplifyingprocess of evaluating the Measurement of Inventory, ("ASU 2015-11"). Thisimpacts that will result from the new guidance, requires an entityour assessment will be finalized during our first quarter of fiscal year 2019. We expect to measurehave enhanced disclosures related to disaggregation of revenue sources and accounting policies beginning fiscal year 2019. Additionally, we will have changes to our Consolidated Balance Sheets that will include presentation of allowances for sales incentive programs, discounts, markdowns, chargebacks, and returns as accrued liabilities rather than as a reduction to accounts receivable, and the presentation of estimated cost of inventory atassociated with the lowerallowance for sales returns within other current assets rather than as a component of cost and net realizable value. Currently, entities measure inventory atinventory. We will adopt the lower of cost or market. ASU 2015-11 replaces market with net realizable value. Net realizable value is the estimated selling pricenew standard in the ordinary coursefirst quarter of business, less reasonably predictable costs of completion, disposal, and transportation. Subsequent measurement is unchanged for inventory measured under last-in, first-out or2019 using the retail inventorymodified retrospective transition method. ASU 2015-11 requires prospective adoption for inventory measurements for fiscal years beginning after December 15, 2016, and interim periods within those years for public business entities. Early application is permitted. ASU 2015-11 will therefore be effective in our fiscal year beginning October 1, 2017. We are evaluating the effect that ASU 2015-11 will have on our Consolidated Financial Statements and related disclosures.
In February 2016, the FASB issued ASU No. 2016-02, Leases, ("ASU 2016-02)2016-02"). ASU 2016-02 requires lessees to recognize assets and liabilities for most leases. All leases will be required to be recorded on the balance sheet with the exception of short-term leases. Early application is permitted. The guidance must be adopted using a modified retrospective approach for leases that exist or are entered into after the beginning of the earliest comparative period in the financial statements. ASU 2016-02 is effective for financial statements issued for annual periods beginning after December 15, 2018, and interim periods within those annual periods. ASU 2016-02 will therefore be effective in our fiscal year beginning September 29, 2019. We are evaluating the effect that ASU 2016-02 will have on our Consolidated Financial Statements and related disclosures. The Company has not yet selected a transition method.
In March 2016,January 2017, the FASB issued ASU No. 2016-09,2017-04, ImprovementsIntangibles - Goodwill and other (Topic 350), Simplifying the Test for Goodwill Impairment, ("ASU 2017-04"). To simplify the subsequent measurement of goodwill, ASU 2017-04 eliminates Step 2 from the goodwill impairment test. In computing the implied fair value of goodwill under Step 2, an entity had to Employee Share-Based Payment Accounting, (perform procedures to determine the fair value at the impairment testing date of its assets and liabilities (including unrecognized assets and liabilities) following the procedure that would be required in determining the fair value of assets acquired and liabilities assumed in a business combination. Instead, under the amendments in ASU 2016-09). ASU 2016-09 simplifies several aspects2017-04, an entity should perform its annual, or interim, goodwill impairment test by comparing the fair value of a reporting unit with its carrying amount. An entity should recognize an impairment charge for the amount by which the carrying amount exceeds the reporting unit’s fair value; however, the loss recognized should not exceed the total amount of goodwill allocated to that reporting unit. Additionally, an entity should consider income tax effects from any tax deductible goodwill on the carrying amount of the accountingreporting unit when measuring the goodwill impairment loss, if applicable. ASU 2017-04 also eliminates the requirements for share-based payment transactions, includingany reporting unit with a zero or negative carrying amount to perform a qualitative assessment and, if it fails that qualitative test, to perform Step 2 of the income tax consequences, classificationgoodwill impairment test. Therefore, the same impairment assessment applies to all reporting units. An entity is required to disclose the amount of awards as either equitygoodwill allocated to each reporting unit with a zero or liabilities, and classification onnegative carrying amount of net assets. An entity still has the statement of cash flows.option to perform the qualitative assessment for a reporting unit to determine if the quantitative impairment test is necessary. ASU 2016-092017-04 is effective for financial statements issued for annual and interim periods beginning after December 15, 2016, and interim periods within those annual periods.2019. ASU 2016-092017-04 will therefore be effective in our fiscal year beginning October 1, 2017.September 29, 2019. We are evaluating the effect that ASU 2016-092017-04 will have on our Consolidated Financial Statements and related disclosures.
In August 2017, the FASB issued ASU No. 2017-12, Derivatives and Hedging (Topic 815): Targeted Improvements to Accounting for Hedging Activities, ("ASU 2017-12"). The amendments in ASU 2017-12 apply to any entity that elects to apply hedge accounting in accordance with U.S. GAAP. ASU 2017-12 permits more flexibility in hedging interest rate risk for both variable rate and fixed rate financial instruments, and the ability to hedge risk components for nonfinancial hedges. In addition, this ASU requires an entity to present the earnings effect of hedging the instrument in the same income statement line in which the earnings effect of the hedge item is reported. In addition, companies no longer need to separately measure and report hedge ineffectiveness and can use an amortization approach or continue with mark-to-market accounting. ASU 2016-02 is effective for financial statements issued for fiscal years beginning after December 15, 2018, and interim periods within those annual periods. ASU 2016-02 will therefore be effective in our fiscal year beginning September 30, 2018. We are evaluating the effect that ASU 2017-12 will have on our Consolidated Financial Statements and related disclosures and do not believe it will have a material impact.
NOTE 3—ACQUISITIONS
On March 9, 2018, our Art Gun, LLC subsidiary purchased substantially all of the assets of Teeshirt Ink, Inc. d/b/a DTG2Go, a premium provider of direct-to-garment digital printed products. In connection with the transaction, we changed the name of Art Gun, LLC to DTG2Go, LLC and now market the consolidated digital print business under the DTG2Go name. We believe the DTG2Go acquisition
makes us a clear leader in the direct-to-garment digital print and fulfillment marketplace and the acquisition accelerated our geographic expansion plans for this business. Following the acquisition, the integrated business operated from two locations in Florida and a location in Nevada serving the western United States. In addition, in May we opened a digital print facility at our Soffe campus in North Carolina to service the northeastern region. With this acquisition, DTG2Go nearly doubled its revenue and capacity, broadened its product line into posters and stickers, and further enhanced service levels with quicker delivery capabilities in the United States and to over 100 countries worldwide.
We have included the financial results of the acquired entity since the date of the acquisition in our Delta Group segment. It is not practicable to disclose the revenue and income of the recent acquisition since the acquisition date, as we have integrated the DTG2Go and Art Gun businesses together during the current period.
The DTG2Go acquisition purchase price consisted of $16.6 million in cash and additional payments valued at $8.7 million contingent on the combined business’s achievement of certain performance targets related to sales and earnings before interest, taxes, depreciation and amortization ("EBITDA") for the period from April 1, 2018, through September 29, 2018, as well as for our fiscal years 2019, 2020, 2021 and 2022. The cash portion of the purchase price included: (i) a payment at closing of $11.4 million, less the amount of any indebtedness of the sellers with respect to any assets included in the transaction, and (ii) two additional payments of $2.5 million, with the first payment subject to post-closing net working capital adjustments, paid on July 1, 2018, and the second paid on September 9, 2018. As of September 29, 2018, all payments have been made in accordance with the acquisition agreement. The below table represents the consideration paid:
|
| | | |
| Cash | $ | 11,350 |
|
| Deferred consideration | 5,000 |
|
| Contingent consideration | 8,700 |
|
| Working capital adjustment | 252 |
|
| Total consideration | $ | 25,302 |
|
During the fourth quarter, we completed the accounting for the acquisition. During the fiscal fourth quarter, we recorded measurement-period adjustments of $2.8 million to contingent consideration and goodwill. The final allocation of consideration to the assets and liabilities are noted in the table below, which includes measurement-period adjustments recorded in our third and fourth quarters of fiscal year 2018. The total amount of goodwill is expected to be deductible for tax purposes.
|
| | | | | | | | | | | |
| | Allocation as of March 31, 2018 | | Measurement Period Adjustments | | Allocation as of September 29, 2018 |
| Accounts receivable | $ | 822 |
| | $ | (34 | ) | | $ | 788 |
|
| Other assets | — |
| | 102 |
| | 102 |
|
| Inventory | 1,159 |
| | (13 | ) | | 1,146 |
|
| Fixed assets | — |
| | 150 |
| | 150 |
|
| Assets held for sale | 5,000 |
| | | | 5,000 |
|
| Goodwill | 9,800 |
| | 3,500 |
| | 13,300 |
|
| Intangible assets | 5,200 |
| | 400 |
| | 5,600 |
|
| Accounts payable | (5,981 | ) | | 5,210 |
| | (771 | ) |
| Other liabilities | — |
| | (13 | ) | | (13 | ) |
| Contingent consideration | (4,650 | ) | | (4,050 | ) | | (8,700 | ) |
| Consideration paid | $ | 11,350 |
| | $ | 5,252 |
| | $ | 16,602 |
|
We accounted for the DTG2Go acquisition pursuant to ASC 805, Business Combinations, with the purchase price allocated based upon fair value. The methods used to determine the fair value assigned to the fixed and intangible assets in the table above fall into Level 3 inputs as defined by FASB Codification No. 820, Fair Value Measurements and Disclosures. The fair value of the fixed assets acquired were determined using the market approach, based on analysis of sales and offerings for assets that are considered similar to the acquired assets. The fair value of the acquired customer relationships intangible assets was valued using discounted cash flows in the multi-period excess earnings method. Assets held for sale include property, plant, and equipment of $5.0 million that were acquired as part of the DTG2Go acquisition. Subsequently, a capital lease arrangement was entered into to finance the purchase of the equipment. The capital lease is for $5.0 million and the lease term is thirty-six months. No gain or loss was recorded in conjunction with this lease transaction.
NOTE 3—SALE OF THE GAME4—DIVESTITURES
Junkfood Divestiture
On March 2, 2015,31, 2017, we completed the sale of our The Game branded collegiate headwear and apparelJunkfood business to David Peyser Sportswear, Inc., owner of MV Sport, Inc.,JMJD Ventures, LLC for $14.9$27.9 million. The business sold consisted of vintage-inspired The GameJunk Food branded and private label products sold nationally in college bookstoresthe United States and through team dealers. This transaction further strengthened our balance sheetinternationally. We received cash at closing of $25.0 million and enabled usrecorded a $2.9 million note receivable with payments due between June 30, 2017, and March 30, 2018. The note receivable was amended on June 29, 2017, to focus on areasrevise the repayment schedule for payments to be made between September 29, 2017, and March 30, 2018. As of our business that are more strategicSeptember 29, 2018, all payments related to our long-term goals. Our Salt Life business and corporate business, Kudzu, previously operated within To The Game, LLC (now Salt Life, LLC) were not included in the sale of the collegiate part of the business.our Junkfood business have been received.
The sale included finished goods inventory of $6.0We realized a $1.3 million $0.4 million in fixed assets, and $0.1 million in other assets, along with the requirement that we indemnify up to $0.3 million of legal costs associated with a particular litigation matter which was subsequently settled. The transaction did not include accounts receivable which we subsequently collected in the normal course of business, and certain undecorated apparel inventory. We incurred $0.4 million in direct selling expenses associated with the transaction. In addition, we incurred certain indirect costs associated with the transaction, including a $0.8 million devaluation of the inventory not included in the sale and $1.4 million in indirect incentive-based expenses.
The pre-tax gain on the sale of The Game assets, inclusive of the direct and indirect expenses, was $5.6 million. The transaction and associated indirect expenses were recorded in our Consolidated Statements of Operations inJunkfood business resulting from the year ended October 3, 2015, as follows: (i) proceeds of $14.9$27.9 million less the costs of assets sold and other expenses, and less direct selling costs resulting in aassociated with the transaction. The pre-tax gain of $7.7 million recorded as a gain on sale of business; (ii) $1.4 million in indirect expenseswas recorded in our selling, generalthe Condensed Consolidated Statement of Operations and administrative expense; and (iii) $0.8 million of indirect expenses recordedis included in our cost of goods sold.
NOTE 4—RESTRUCTURING PLAN
On May 10, 2016, in connection with our ongoing strategic manufacturing initiatives, we announced plans to restructure our manufacturing operations with the closing of our textile manufacturing facility in Maiden, North Carolina, the consolidation of sew facilities in Mexico, and the expansion of production at our lower-cost Ceiba Textiles facility in Honduras. In September, 2016, we sold the real estate and certain machinery, equipment and supply parts used in the Maiden facility for approximately $1.7 million. As part of the closing of the Maiden facility and the expansion of operations at our offshore facilities, we incurred the following costs (in thousands):
|
| | | | |
| | | Fiscal Year Ended |
| | | October 1, 2016 |
| Excess manufacturing costs related to the shutdown and start-up operations | | $ | 1,096 |
|
| Total expenses included in cost of goods sold | | 1,096 |
|
| | | |
| Employee termination costs | | 597 |
|
| Fixed asset impairment | | 607 |
|
| Inventory and supply part impairment | | 144 |
|
| Other costs to exit facility | | 393 |
|
| Total restructuring costs | | 1,741 |
|
| Total manufacturing realignment expenses | | $ | 2,837 |
|
All of these expenses were recorded in our basics segment. We do not expect to incur any significant additional costs related to the manufacturing initiative in fiscal year 2017. At the end of 2016, we had paid $0.4 million in employee termination benefits and had $0.2 million accrued.Other income, net.
NOTE 5—INVENTORIES
Inventories, net of reserves of $8.810.5 million and $8.4$9.8 million as of October 1, 2016,September 29, 2018, and October 3, 2015,September 30, 2017, respectively, consist of the following (in thousands):
| | | | October 1,
2016 | | October 3,
2015 | September 29, 2018 | | September 30, 2017 |
| Raw materials | $ | 11,442 |
| | $ | 11,412 |
| $ | 9,641 |
| | $ | 8,973 |
|
| Work in process | 18,158 |
| | 19,071 |
| 18,327 |
| | 18,543 |
|
| Finished goods | 134,647 |
| | 117,889 |
| 147,015 |
| | 147,035 |
|
| | $ | 164,247 |
| | $ | 148,372 |
| $ | 174,983 |
| | $ | 174,551 |
|
Raw materials include finished yarn and direct materials for the basics segment,Delta Group, undecorated garments for the Art Gun and Junkfood businessesDTG2Go business and direct embellishment materials for the branded segment.Salt Life Group.
NOTE 6—PROPERTY, PLANT AND EQUIPMENT
Property, plant and equipment consist of the following (in thousands, except economic life data):
| | | | Estimated Useful Life | | October 1,
2016 | | October 3,
2015 | Estimated Useful Life | | September 29, 2018 | | September 30, 2017 |
| Land and land improvements | 25 years | | $ | 572 |
| | $ | 996 |
| 25 years | | $ | 569 |
| | $ | 572 |
|
| Buildings | 20 years | | 3,369 |
| | 8,706 |
| 20 years | | 3,096 |
| | 2,989 |
|
| Machinery and equipment | 10 years | | 72,068 |
| | 80,843 |
| 10 years | | 90,565 |
| | 75,838 |
|
| Computers and software | 3-10 years | | 20,889 |
| | 20,635 |
| 3-10 years | | 20,724 |
| | 20,128 |
|
| Furniture and fixtures | 7 years | | 1,977 |
| | 3,126 |
| 7 years | | 3,073 |
| | 2,251 |
|
| Leasehold improvements | 3-10 years | | 3,686 |
| | 2,645 |
| 3-10 years | | 5,702 |
| | 5,275 |
|
| Vehicles and related equipment | 5 years | | 808 |
| | 821 |
| 5 years | | 754 |
| | 791 |
|
| Construction in progress | N/A | | 3,719 |
| | 3,256 |
| N/A | | 1,649 |
| | 3,035 |
|
| | | | 107,088 |
| | 121,028 |
| | | 126,132 |
| | 110,879 |
|
| Less accumulated depreciation and amortization | | | (63,585 | ) | | (81,375 | ) | | | (74,018 | ) | | (68,173 | ) |
| | | | $ | 43,503 |
| | $ | 39,653 |
| | | $ | 52,114 |
| | $ | 42,706 |
|
The acquisition cost of machinery and equipment acquired under capital leases were $16.6 million and $2.5 million as of September 29, 2018, and September 30, 2017, respectively.
NOTE 7—GOODWILL AND INTANGIBLE ASSETS
Goodwill and components of intangible assets consist of the following (in thousands, except economic life data)thousands):
| | | | October 1, 2016 | | October 3, 2015 | | September 29, 2018 | | September 30, 2017 | |
| | Cost | Accumulated Amortization | Net Value | | Cost | Accumulated Amortization | Net Value | | Economic Life | Cost | Accumulated Amortization | Net Value | | Cost | Accumulated Amortization | Net Value | Economic Life |
| | | | | | | | | |
| Goodwill | $ | 36,729 |
| $ | — |
| $ | 36,729 |
| | $ | 36,729 |
| $ | — |
| $ | 36,729 |
| | N/A | $ | 33,217 |
| $ | — |
| $ | 33,217 |
| | $ | 19,917 |
| $ | — |
| $ | 19,917 |
| N/A |
| | | | | | | | | |
| Intangibles: | | | | | | | | | | | | | |
| Tradename/trademarks | $ | 17,620 |
| $ | (2,514 | ) | $ | 15,106 |
| | $ | 17,530 |
| $ | (1,896 | ) | $ | 15,634 |
| | 20 - 30 yrs | $ | 16,090 |
| $ | (2,736 | ) | $ | 13,354 |
| | $ | 16,090 |
| $ | (2,193 | ) | $ | 13,897 |
| 20 - 30 yrs |
| Customer relationships | 7,220 |
| (4,016 | ) | 3,204 |
| | 7,220 |
| (3,664 | ) | 3,556 |
| | 20 yrs | 4,500 |
| (253 | ) | 4,247 |
| | — |
| — |
| — |
| 20 yrs |
| Technology | 1,220 |
| (826 | ) | 394 |
| | 1,220 |
| (703 | ) | 517 |
| | 10 yrs | 1,720 |
| (1,105 | ) | 615 |
| | 1,220 |
| (947 | ) | 273 |
| 10 yrs |
| License Agreements | 2,100 |
| (320 | ) | 1,780 |
| | 2,100 |
| (216 | ) | 1,884 |
| | 15 - 30 yrs | 2,100 |
| (527 | ) | 1,573 |
| | 2,100 |
| (423 | ) | 1,677 |
| 15 - 30 yrs |
| Non-compete agreements | 1,287 |
| (849 | ) | 438 |
| | 1,287 |
| (716 | ) | 571 |
| | 4 – 8.5 yrs | 1,637 |
| (928 | ) | 709 |
| | 1,037 |
| (733 | ) | 304 |
| 4 – 8.5 yrs |
| Total intangibles | $ | 29,447 |
| $ | (8,525 | ) | $ | 20,922 |
| | $ | 29,357 |
| $ | (7,195 | ) | $ | 22,162 |
| | | $ | 26,047 |
| $ | (5,549 | ) | $ | 20,498 |
| | $ | 20,447 |
| $ | (4,296 | ) | $ | 16,151 |
| |
Goodwill represents the acquired goodwill net of the cumulative impairment losses recorded in fiscal year 2011 of $0.6$0.6 million. The goodwill recorded on our financial statements is included in both the Delta Group and Salt Life Group segments. The Delta Group segment includes $13.3 million. In August 2016, of goodwill, and the Salt Life Group segment includes $19.9 million.
On March 9, 2018, we acquired Coast Apparel for $313 thousand, which resulted in additionalsubstantially all of the assets of Teeshirt Ink, Inc. d/b/a DTG2Go. See Note 3—Acquisitions. We have identified certain intangible assets associated with the acquisition, including technology, customer relationships, non-compete agreements and goodwill. During the fourth quarter, we completed the accounting for the acquisition. We recorded measurement period adjustments to increase the residual value of $90 thousand.goodwill by $3.5 million and the fair value of intangible assets by $0.4 million. After recording these measurement period adjustments, the residual value of goodwill associated with DTG2Go was $13.3 million, and the fair value of technology, customer relationships, and non-compete agreements at $5.6 million.
Depending on the type of intangible assets, amortization is recorded under Cost of Goods Sold or SG&A expenses. Amortization expense for intangible assets was $1.3$1.3 million for the yearsyear ended October 1, 2016, October 3, 2015,September 29, 2018, and $1.1 million for the year ended September 27, 2014.30, 2017. Amortization expense is estimated to be approximately $1.3$1.5 million for fiscal years 2017, 2018 andyear 2019, approximately $1.2$1.4 million for fiscal year 2020, and approximately $1.1$1.3 million for each of fiscal year 2021.years 2021 and 2022.
NOTE 8—ACCRUED EXPENSES
Accrued expenses consist of the following (in thousands):
| | | | October 1,
2016 | | October 3,
2015 | September 29, 2018 | | September 30, 2017 |
| Accrued employee compensation and benefits | $ | 12,899 |
| | $ | 10,704 |
| $ | 11,138 |
| | $ | 12,683 |
|
| Taxes accrued and withheld | 1,003 |
| | 1,455 |
| 882 |
| | 931 |
|
| Accrued insurance | 263 |
| | 349 |
| 162 |
| | 126 |
|
| Accrued advertising | 256 |
| | 363 |
| 286 |
| | 524 |
|
| Accrued royalties | 1,653 |
| | 2,173 |
| 16 |
| | 113 |
|
| Accrued commissions | 460 |
| | 512 |
| 484 |
| | 327 |
|
| Accrued freight | 1,105 |
| | 1,501 |
| 1,023 |
| | 1,060 |
|
| Other | 4,067 |
| | 3,939 |
| 2,751 |
| | 1,940 |
|
| | $ | 21,706 |
| | $ | 20,996 |
| $ | 16,742 |
| | $ | 17,704 |
|
During the fourth quarter of fiscal year 2014, we implemented certain initiatives to improve our results of operations and financial position. As a result of these initiatives, approximately $4.0 million in expenses were recognized during the fourth quarter of fiscal year 2014, consisting of $2.2 million in severance expense, $0.9 million in expense related to reduced manufacturing production, and $1.0 million in fixed asset impairments.
These expenses were reported in our Consolidated Statement of Operations as follows (in thousands):
|
| | | |
| | September 27,
2014 |
| Cost of goods sold | $ | 868 |
|
| Selling, general and administrative expenses | 2,169 |
|
| Other expense | 984 |
|
| | $ | 4,021 |
|
During fiscal years 2016 and 2015, no additional expenses were incurred in association with these 2014 strategic initiatives. As of October 3, 2015, $0.5 million of these expenses were accrued and reported on our Consolidated Balance Sheet. No expenses remained accrued as of October 1, 2016.
NOTE 9—LONG-TERM DEBT
Long-term debt consists of the following (in thousands):
|
| | | | | | | |
| | October 1,
2016 | | October 3,
2015 |
| Revolving U.S. credit facility, interest at base rate or adjusted LIBOR rate plus an applicable margin (interest at 2.7% on October 1, 2016) due May 2021 | $ | 92,137 |
| | $ | — |
|
| Revolving credit facility, interest at base rate or adjusted LIBOR rate plus an applicable margin (interest at 2.7% on October 3, 2015) due May 2017 | — |
| | 79,550 |
|
| Revolving credit facility with Banco Ficohsa, a Honduran bank, interest at 8% due March 2019 (denominated in U.S. dollars) | 5,000 |
| | 4,390 |
|
| Term loan with Banco Ficohsa, a Honduran bank, interest at 7%, monthly installments beginning March, 2011 through March 2018 (denominated in U.S. dollars) | 1,459 |
| | 2,432 |
|
| Term loan with Banco Ficohsa, a Honduran bank, interest at 7.5%, monthly installments beginning November 2014 through December 2020 (denominated in U.S. dollars) | 2,600 |
| | 3,150 |
|
| Term loan with Banco Ficohsa, a Honduran bank, interest at 8%, monthly installments beginning June 2016 through April 2022 (denominated in U.S. dollars) | 1,650 |
| | 1,881 |
|
| Term loan with Banco Ficohsa, a Honduran bank, interest at 8%, monthly installments beginning June 2016 through July 2017 (denominated in U.S. dollars) | 4,833 |
| | — |
|
| Salt Life acquisition promissory note, imputed interest at 1.92%, one-time installment due September 30, 2014, quarterly installments beginning April 2015 through June 2016 | — |
| | 2,979 |
|
| Salt Life acquisition promissory note, imputed interest at 3.62%, quarterly payments beginning September 2016 through June 2019 | 8,116 |
| | 7,830 |
|
| | 115,795 |
| | 102,212 |
|
| Less current installments | (9,192 | ) | | (8,340 | ) |
| Long-term debt, excluding current installments | $ | 106,603 |
| | $ | 93,872 |
|
|
| | | | | | | |
| | September 29,
2018 | | September 30,
2017 |
| Revolving U.S. credit facility, interest at base rate or adjusted LIBOR rate plus an applicable margin (interest at 4.1% on September 29, 2018) due May 2021 | $ | 85,746 |
| | $ | 74,608 |
|
| Revolving credit facility with Banco Ficohsa, a Honduran bank, interest at 7.4% due August 2020 (denominated in U.S. dollars) | 4,958 |
| | 4,975 |
|
| Term loan with Banco Ficohsa, a Honduran bank, interest at 7%, monthly installments beginning March, 2011 through March 2018 (denominated in U.S. dollars) | — |
| | 486 |
|
| Term loan with Banco Ficohsa, a Honduran bank, interest at 6.0%, monthly installments beginning November 2014 through December 2020 (denominated in U.S. dollars) | 1,400 |
| | 2,000 |
|
| Term loan with Banco Ficohsa, a Honduran bank, interest at 6.0%, monthly installments beginning June 2016 through April 2022 (denominated in U.S. dollars) | 1,067 |
| | 1,358 |
|
| Term loan with Banco Ficohsa, a Honduran bank, interest at 6.0%, monthly installments beginning October 2017 through September 2021 (denominated in U.S. dollars) | 3,018 |
| | 4,083 |
|
| Salt Life acquisition promissory note, imputed interest at 3.62%, quarterly payments beginning September 2016 through June 2019 | 2,471 |
| | 5,344 |
|
| | 98,660 |
| | 92,854 |
|
| Less current installments | (6,577 | ) | | (7,548 | ) |
| Long-term debt, excluding current installments | $ | 92,083 |
| | $ | 85,306 |
|
On May 10, 2016, we amended our U.S. revolving credit facility and entered into a Fifth Amended and Restated Credit Agreement (the "Amended“Amended Credit Agreement"Agreement”) with Wells Fargo Bank, National Association ("(“Wells Fargo"Fargo”), as Administrative Agent, the Sole Lead Arranger and the Sole Book Runner, and the financial institutions named therein as Lenders, which are Wells Fargo, PNC Bank, National Association and Regions Bank. Our subsidiaries M.J. Soffe, LLC, Culver City Clothing Company (f/k/a Junkfood Clothing Company,Company), Salt Life, LLC, and DTG2Go, LLC (f/k/a Art Gun, LLC (together withLLC) (collectively, the Company, the "Companies""Borrowers"), are co-borrowers under the Amended Credit Agreement. On November 27, 2017, the Borrowers entered into a First Amendment to the Fifth Amended and Restated Credit Agreement with Wells Fargo and the other lenders set forth therein (the “First Amendment”).
The First Amendment amends the definition of Fixed Charge Coverage Ratio within the Amended Credit Agreement amendsto permit up to $10 million of the proceeds received from the March 31, 2017, sale of certain assets of the Junkfood business to be used towards share repurchases for up to one year from the date of that transaction. In addition, the definition of Permitted Purchase Money Indebtedness is amended to extend the time period within which the Borrowers may enter into capital leases and restatesto increase the aggregate principal amount of such leases into which the Borrowers may enter to up to $15 million. The definition of Permitted Investments is also amended to permit the Borrowers to make investments in entities that are not a party to the Amended Credit Agreement in an aggregate amount of up to $2 million. The First Amendment also allows the change in the name of our FourthJunkfood Clothing Company subsidiary to Culver City Clothing Company. There were no changes to the Amended Credit Agreement related to interest rate, borrowing capacity, or maturity.
On March 9, 2018, the Borrowers entered into a Consent and Second Amendment to the Fifth Amended and Restated LoanCredit Agreement with Wells Fargo and Security Agreement dated May 27, 2011, which was amended on four occasionsthe other lenders set forth therein (the “Second Amendment”).
Pursuant to the Second Amendment, Wells Fargo and had the other lenders set forth therein consented to Art Gun, LLC’s acquisition of substantially all of the assets of TeeShirt Ink Inc. d/b/a maturity date of May 27, 2017. Bank of America, N.A. departed the syndicate of Lenders and Regions Bank joined the syndicate of Lenders forDTG2Go. The Second Amendment also: (i) revises certain provisions in the Amended Credit Agreement. BankAgreement relating to our ability to pay cash dividends or distributions to shareholders or to repurchase shares of America, N.A. also ceasedour common stock so that the effects of the Tax Cuts and Jobs Act of 2017 do not negatively impact our ability to serve asmake such dividends or distributions or to repurchase shares of our common stock during our 2018 fiscal year; (ii) amends the syndication agent fordefinition of Permitted Investments in the facility,Amended Credit Agreement to allow investments in the Honduras partnership (as defined in the Amended Credit Agreement) in an aggregate original principal amount not to exceed $6 million; (iii) amends the definition of Permitted Purchase Money Indebtedness in the Amended Credit Agreement to increase the aggregate principal amount of capital leases into which we may enter to up to $25 million; (iv) permits the name change of Art Gun, LLC to DTG2Go, LLC; and Merrill Lynch, Pierce, Fenner and Smith Incorporated is(v) adds new definitions relating to the DTG2Go acquisition. There were no longer a joint book runner with Wells Fargo.
changes to the Amended Credit Agreement related to interest rate, borrowing capacity, or maturity.
The Amended Credit Agreement allows us to borrow up to $145 million (subject to borrowing base limitations), including a maximum of $25 million in letters of credit. Provided that no event of default exists, we have the option to increase the maximum credit to $200 million (subject to borrowing base limitations), conditioned upon the Administrative Agent's ability to secure additional commitments and customary closing conditions. The credit facility matures on May 10, 2021. We paid $1.0 million in financing costs associated with the Amended Credit Agreement.
Our U.S. revolving credit facility is secured by a first-priority lien on substantially all of the real and personal property of Delta Apparel, Junkfood, Soffe, Salt Life, and Art Gun. All loans bear interest at rates, at the Company's option, based on either (a) an adjusted LIBOR rate plus an applicable margin or (b) a base rate plus an applicable margin, with the base rate equal to the greatestgreater of (i) the federal funds rate plus 0.5%, (ii) the LIBOR rate plus 1.0%, or (iii) the prime rate announced by Wells Fargo, National Association. The facility requires monthly installment payments of approximately $0.2 million in connection with fixed asset amortizations, and these amounts reduce the amount of availability under the facility. Annual facility fees are 0.25% or 0.375% (subject to average excess availability) of the amount by which $145 million exceeds the average daily principal balance of the outstanding loans and letters of credit accommodations. The annual facility fees are charged monthly based on the principal balances during the immediately preceding month.
At October 1, 2016,September 29, 2018, we had $92.1$85.7 million outstanding under our U.S. revolving credit facility at an average interest rate of 2.7%4.1%, and had the ability to borrow an additional $32.8$25.9 million. This credit facility includes the financial covenant that if the amount of availability falls below the threshold amounts set forth in the Amended Credit Agreement, our Fixed Charge Coverage Ratio (“FCCR”) (as defined in the Amended Credit Agreement) for the preceding 12-month period must not be less than 1.1 to 1.0. We were not subject to the FCCR covenant as of October 1, 2016,September 29, 2018, because our availability was above the minimum required under the Amended Credit Agreement. At October 1, 2016,September 29, 2018, our FCCR was above the required 1.1 to 1.0 ratio and, therefore, we would have satisfied our financial covenant had we been subject to it. In addition, the credit facility includes customary conditions to funding, representations and warranties, covenants, and events of default. The covenants include, among other things, limitations on asset sales, consolidations, mergers, liens, indebtedness, loans, investments, guaranties, acquisitions, dividends, stock repurchases, and transactions with affiliates.
Proceeds of the loans made pursuant to the Amended Credit Agreement may be used for permitted acquisitions (as defined in the Amended Credit Agreement), general operating expenses, working capital, other corporate purposes, and to finance credit facility fees and expenses. Pursuant to the terms of our credit facility, we are allowed to make cash dividends and stock repurchases if (i) as of the date of the payment or repurchase and after giving effect to the payment or repurchase, we have availability on that date of not less than 15% of the lesser of the borrowing base or the commitment, and average availability for the 30-day period immediately preceding that date of not less than 15% of the lesser of the borrowing base or the commitment; and (ii) the aggregate amount of dividends and stock repurchases after May 10, 2016, does not exceed $10 million plus 50% of our cumulative net income (as defined in the Amended Credit Agreement) from the first day of the third quarter of fiscal year 2016 to the date of determination. At October 1, 2016,September 29, 2018, and October 3, 2015,September 30, 2017, there was $10.7$14.7 million and $7.3$7.7 million, respectively, of retained earnings free of restrictions to make cash dividends or stock repurchases.
The Amended Credit Agreement contains a subjective acceleration clause and a “springing” lockbox arrangement (as defined in FASB Codification No. 470, Debt ("ASC 470")), whereby remittances from customers will be forwarded to our general bank account and will not reduce the outstanding debt until and unless a specified event or an event of default occurs. Pursuant to ASC 470, we classify borrowings under the facility as long-term debt.
In August 2013, we acquired Salt Life and issued two promissory notes in the aggregate principal amount of $22.0 million, which included a one-time installment of $9.0 million that was due and paid as required on September 30, 2014, and quarterly installments commencing on March 31, 2015, with the final installment due on June 30, 2019. The promissory notes are zero-interest notes and state that interest will be imputed as required under Section 1274 of the Internal Revenue Code. We have imputed interest at 1.92% and 3.62% on the promissory notes that maturematured on June 30, 2016, and will mature on June 30, 2019, respectively. At October 1, 2016,September 29, 2018, the discounted value of the promissory note was $8.1$2.5 million.
On December 6, 2013, we entered into an agreement (the "IMG Agreement") with IMG Worldwide, Inc. ("IMG") that provided for the termination of the Salt Life brand license agreements entered into between Delta and IMG (as agent on behalf of Salt Life Holdings) prior to the acquisition of Salt Life as well as the agency agreement entered into between Salt Life Holdings and IMG prior to the acquisition of Salt Life. In addition, the IMG Agreement provides that Delta and Salt Life Holdings are released from all obligations and liabilities under those agreements or relating to the acquisition of Salt Life. Pursuant to the IMG Agreement, Salt Life and IMG entered into a separate, multi-year agency agreement, which has since been terminated, whereby IMG represented Salt Life with respect to the licensing of the Salt Life brand in connection with certain product and service categories. Salt Life agreed to pay IMG installments totaling $3,500,000 to terminate the existing arrangements. There was a $3,000,000 indemnification asset that was recorded as part of the purchase of Salt Life that was released from escrow during the quarter ended December 28, 2013, and applied towards these payment obligations, along with additional amounts previously accrued for royalty obligations under the above-referenced Salt Life brand license agreements. During the year ended October 3, 2015, we made payments of $0.8 million in accordance with the terms of the agreement. As of October 3, 2015 there were 3 quarterly installments of $195 thousand remaining, and we had recorded the fair value of the liability as of October 3, 2015, in our financials with $0.6 million in accrued expenses. During the year ended October 1, 2016, we made the final payments of $0.6 million in accordance with the terms of the agreement and no amounts remain accrued in our financials as of October 1, 2016.
Since March 2011, we have entered into loans and a revolving credit facility with Banco Ficohsa, a Honduran bank, in order to finance both the operations and capital expansion of our Honduran facilities. Each of these loans areis secured by a first-priority lien on the assets of our Honduran operations, and areis not guaranteed by our U.S. entities. These loans are denominated in U.S. dollars and the carrying value of the debt approximates the fair value. The revolving credit facility requires minimum payments during each six-month period of the 18-month term; however, the loan agreement permits additional drawdowns to the extent payments are made and certain objective covenants are met. The current revolving Honduran debt, by its nature, is not long-term, as it requires scheduled payments each six months. However, as the loan permits us to re-borrow funds up to the amount repaid, subject to certain covenants, and we intend to re-borrow funds, subject to the objective covenants, the amounts have been classified as long-term debt. Information about these loans and the outstanding balance as of October 1, 2016,September 29, 2018, is listed as part of the long-term debt schedule above.
The aggregate maturities of debt at October 1, 2016,September 29, 2018, are as follows (in thousands):
| | | Fiscal Year | Amount |
| Amount |
|
| 2017 | $ | 9,192 |
| |
| 2018 | 7,955 |
| |
| 2019 | 10,835 |
| $ | 6,577 |
|
| 2020 | 4,469 |
| 9,064 |
|
| 2021 | 83,149 |
| 3,529 |
|
| 2022 | | 79,490 |
|
| 2023 | | — |
|
| Thereafter | 195 |
| — |
|
| | $ | 115,795 |
| $ | 98,660 |
|
NOTE 10—INCOME TAXES
On December 22, 2017, the Tax Cuts and Jobs Act of 2017 (the “New Tax Legislation”) was enacted. The New Tax Legislation significantly revised the U.S. corporate income tax code by, among other things, lowering federal corporate income tax rates, implementing a modified territorial tax system and imposing a repatriation tax on deemed repatriated cumulative earnings of foreign subsidiaries. The New Tax Legislation creates a new requirement that certain income earned by controlled foreign corporations (“CFCs”) must be included currently in the gross income of the CFCs’ U.S. shareholder.
Global intangible low-taxed income (“GILTI”) is the excess of the shareholder’s net CFC-tested income over the net deemed tangible income return. We are continuing to evaluate the GILTI provision of the New Tax Legislation and the application of ASC 740, as it is not applicable until our 2019 fiscal year. Therefore, we have not made any adjustments related to potential GILTI tax in our financial statements.
In the quarter ended December 30, 2017, when the New Tax Legislation was enacted, we made reasonable estimates of the effects on our existing deferred tax balances and the one-time transition tax, recording $10.6 million of tax expense based on an estimate of our total earnings and profits (E&P) from our foreign subsidiaries which were previously deferred from U.S. taxes. During the quarter ended September 29, 2018, the provisional amount was adjusted by $0.1 million to record $10.7 million based on our E&P study. The $10.7 million of transition tax remains provisional as we continue to refine our calculations during the measurement period. We do not expect the changes to the amount recorded to be material. This will be paid over eight years. We intend to reinvest all of our unremitted earnings of our foreign subsidiaries and therefore, outside of the transition tax mentioned previously, we have provided no provision for income taxes which may result from withholding taxes and/or other outside basis differences. We believe that the determination of such income taxes is impracticable. We anticipate that the benefit resulting from the reduction of the federal tax rate from 34% to 21% will offset the future payments of the transition tax, resulting in minimal cash flow impact. Excluding the effect of this discrete item, the effective tax rate on operations for the fiscal year ended September 29, 2018, was a benefit of 1.7%. This compares to an effective income tax rate of 5.9% for the fiscal year ended September 30, 2017.
The provision for income taxes consists of the following (in thousands):
| | | | Period ended | Period ended |
| | October 1, 2016 | | October 3, 2015 | | September 27, 2014 | September 29, 2018 | | September 30, 2017 |
| Current: | | | | | | | | |
| Federal | $ | 36 |
| | $ | — |
| | $ | — |
| $ | 4,629 |
| | $ | 215 |
|
| State | 78 |
| | 60 |
| | 79 |
| 16 |
| | 47 |
|
| Foreign | 179 |
| | 186 |
| | 158 |
| 121 |
| | 127 |
|
| Total current | $ | 293 |
| | $ | 246 |
| | $ | 237 |
| $ | 4,766 |
| | $ | 389 |
|
| Deferred: | | | | | | | | |
| Federal | $ | 1,462 |
| | $ | 1,320 |
| | $ | (5,807 | ) | $ | 5,927 |
| | $ | (112 | ) |
| State | 326 |
| | 439 |
| | (923 | ) | (233 | ) | | 380 |
|
| Total deferred | 1,788 |
| | 1,759 |
| | (6,730 | ) | 5,694 |
| | 268 |
|
| Provision for (benefit from) income taxes | $ | 2,081 |
| | $ | 2,005 |
| | $ | (6,493 | ) | |
| Provision for income taxes | | $ | 10,460 |
| | $ | 657 |
|
For financial reporting purposes our income (loss) before provision for (benefit from) income taxes includes the following components (in thousands):
| | | | Period ended | Period ended |
| | October 1, 2016 | | October 3, 2015 | | September 27, 2014 | September 29, 2018 | | September 30, 2017 |
| United States | $ | 3,966 |
| | $ | 3,434 |
| | $ | (16,832 | ) | |
| United States, net of loss attributable to non-controlling interest | | $ | 156 |
| | $ | 1,767 |
|
| Foreign | 7,079 |
| | 6,664 |
| | 9,379 |
| 11,534 |
| | 9,401 |
|
| | $ | 11,045 |
| | $ | 10,098 |
| | $ | (7,453 | ) | $ | 11,690 |
| | $ | 11,168 |
|
The change in the federal statutory rate from 34% to 21% as a result of the New Tax Legislation is effective as of December 22, 2017, in our fiscal year 2018. As such, the blended federal statutory tax rate for the fiscal year was 24%. We remeasured our deferred tax assets and liabilities based on an estimated scheduling of when we anticipate these amounts will reverse and by applying estimated rates based on the period in which we believe they will reverse. The amount of expense related to the remeasurement of our deferred tax balance was approximately $0.6 million.
We benefit from having income in foreign jurisdictions that are either exempt from income taxes or have tax rates that are lower than those in the United States. Our annual income tax rate for the fiscal year ending September 29, 2018, excluding the discrete tax expense associated with the New Tax Legislation, was a benefit of 1.7%. However, changes in the mix of U.S. taxable income compared to profits
in tax-free or lower-tax jurisdictions can have a significant impact on our overall effective tax rate. In addition, the impact of the New Tax Legislation may differ from our initial provisional estimates, possibly materially, due to, among other things, changes in interpretations and assumptions made regarding the New Tax Legislation, guidance that may be issued and actions we may take as a result of the New Tax Legislation.
A reconciliation between actual provision for (benefit from) income taxes and the provision for income taxes computed using the federal statutory income tax rate of 34.0%24.25% for fiscal year 2018 and 34.0% for fiscal year 2017 is as follows (in thousands):
|
| | | | | | | | | | | |
| | Period ended |
| | October 1, 2016 | | October 3, 2015 | | September 27, 2014 |
| Income tax expense at the statutory rate | $ | 3,755 |
| | $ | 3,433 |
| | $ | (2,533 | ) |
| State income tax expense, net of federal income tax effect | 447 |
| | 374 |
| | (893 | ) |
| Impact of state rate changes | 116 |
| | — |
| | — |
|
| Rate difference and nondeductible items in foreign jurisdictions | 54 |
| | (30 | ) | | (55 | ) |
| Impact of foreign earnings in tax-free zone | (2,319 | ) | | (2,168 | ) | | (3,098 | ) |
| Valuation allowance adjustments | (71 | ) | | — |
| | 4 |
|
| Nondeductible compensation | — |
| | 335 |
| | — |
|
| Nondeductible amortization and other permanent differences | 96 |
| | 81 |
| | 76 |
|
| Other | 3 |
| | (20 | ) | | 6 |
|
| Provision for (benefit from) income taxes | $ | 2,081 |
| | $ | 2,005 |
| | $ | (6,493 | ) |
Deferred income taxes reflect the net tax effect of temporary differences between the carrying amounts of assets and liabilities for financial reporting purposes and amounts used for income tax purposes. We have not provided deferred taxes on the $66.3 million of undistributed earnings of our foreign subsidiaries where the earnings are considered to be permanently reinvested. The undistributed earnings would become taxable in the United States if we decided to repatriate earnings for business, tax or foreign exchange reasons. If we made that decision, U.S. income taxes would be provided for net of foreign taxes already paid. The determination of the unrecognized deferred tax liability associated with these unremitted earnings is not practical at this time. |
| | | | | | | |
| | Period ended |
| | September 29, 2018 | | September 30, 2017 |
| Income tax expense at the statutory rate of 24.25% and 34.0% | $ | 2,861 |
| | $ | 3,797 |
|
| State income tax benefit, net of federal income tax effect | 16 |
| | (80 | ) |
| Impact of Federal rate change | 624 |
| | — |
|
| Federal transition tax | 10,039 |
| | — |
|
| Impact of state rate changes | (236 | ) | | 115 |
|
| Rate difference and nondeductible items in foreign jurisdictions | — |
| | 33 |
|
| Impact of foreign earnings in tax-free zone | (2,676 | ) | | (3,052 | ) |
| Valuation allowance adjustments | — |
| | 362 |
|
| Nondeductible compensation | — |
| | — |
|
| Nondeductible amortization and other permanent differences | (163 | ) | | (496 | ) |
| Other | (5 | ) | | (22 | ) |
| Provision for income taxes | $ | 10,460 |
| | $ | 657 |
|
Significant components of our deferred tax assets and liabilities are as follows (in thousands):
| | | | October 1,
2016 | | October 3,
2015 | | September 29, 2018 | | September 30, 2017 |
| Deferred tax assets: | | | | | | | |
| Federal net operating loss carryforwards | $ | 6,256 |
| | $ | 7,842 |
| | $ | — |
| | $ | 2,902 |
|
| State net operating loss carryforwards | 1,784 |
| | 2,362 |
| | 1,870 |
| | 1,573 |
|
| Charitable donation carryforward | — |
| | 28 |
| | |
| Derivative — interest rate contracts | 70 |
| | 268 |
| | — |
| | 21 |
|
| Alternative minimum tax credit carryforward | 135 |
| | 99 |
| | 397 |
| | 404 |
|
| Currently nondeductible accruals | 7,613 |
| | 6,029 |
| | |
| Inventories and reserves | | 3,277 |
| | 3,681 |
|
| Accrued compensation and benefits | | 1,881 |
| | 3,139 |
|
| Receivable allowances and reserves | | 371 |
| | 543 |
|
| Other | | 67 |
| | 98 |
|
| Gross deferred tax assets | 15,858 |
| | 16,628 |
| | 7,863 |
| | 12,361 |
|
| Less valuation allowance — state net operating loss | (131 | ) | | (202 | ) | | (493 | ) | | (493 | ) |
| Net deferred tax assets | 15,727 |
| | 16,426 |
| | 7,370 |
| | 11,868 |
|
| | | | | | | | |
| Deferred tax liabilities: | | | | | | | |
| Depreciation | (2,868 | ) | | (2,941 | ) | | (5,459 | ) | | (3,501 | ) |
| Goodwill and intangibles | (7,463 | ) | | (6,024 | ) | | (2,529 | ) | | (3,319 | ) |
| Derivative — interest rate contracts | | (46 | ) | | — |
|
| Other | (150 | ) | | (167 | ) | | (94 | ) | | (46 | ) |
| Gross deferred tax liabilities | (10,481 | ) | | (9,132 | ) | | (8,128 | ) | | (6,866 | ) |
| Net deferred tax asset | 5,246 |
| | 7,294 |
| | |
| Net deferred tax (liability) asset | | (758 | ) | | 5,002 |
|
As of October 1, 2016, and October 3, 2015,September 30, 2017, we had federal net operating loss carryforwards of approximately $18.3 million and $23.1 million, respectively.$8.5 million. The deferred tax assetassets resulting from federal net operating losses for October 1, 2016, and October 3, 2015,September 30, 2017, was $2.9 million. As of September 29, 2018, there were $6.3 million and $7.8 million, respectively. There is no carryback opportunity forfederal net operating loss carryforwards, as these losses andwere utilized in connection with settling the carryforwards expire at various intervals from 2033 to 2035. We determined that no valuation allowance is required, as we expect that all such carryforwards more likely than not will be realized within statutory periods of carryover and utilization.transition tax.
As of October 1, 2016,September 29, 2018, and October 3, 2015,September 30, 2017, we had state net operating loss carryforwards of approximately $45.4$42.7 million and $58.5$41.6 million, respectively. These carryforwards expire at various intervals from 2019 through 2036. Our deferred tax asset related to
state net operating loss carryforwards is reduced by a valuation allowance to result in deferred tax assets we consider more likely than not to be realized.
For both federal and state purposes, the ultimate realization of deferred tax assets depends upon the generation of future taxable income or tax planning strategies during the periods in which those temporary differences become deductible or when the carryforwards are available.
FASB Codification No. 740, Income Taxes (“ASC 740”) requires that a position taken or expected to be taken in a tax return be recognized in the financial statements when it is more likely than not (i.e., a likelihood of more than fifty percent) that the position would be sustained upon examination by tax authorities. A recognized tax position is then measured at the largest amount of benefit that is greater than fifty percent50% likely of being realized upon ultimate settlement. Accrued interest and penalties related to unrecognized tax benefits would also be recorded. We did not have any material unrecognized tax benefits as of October 1, 2016September 29, 2018, or October 3, 2015.September 30, 2017.
TheWe file income tax returns in the U.S. federal jurisdiction and various state, local and foreign jurisdictions. Tax years 2012 to 2014, 2015 and 2016, according to statute and with few exceptions, remain open to examination by various federal, state, local and foreign jurisdictions.
NOTE 11—LEASES
We have several non-cancelable operating leases primarily related to buildings, machinery, office equipment and computer systems. Certain land and building leases have renewal options generally for periods ranging from 5 to 10 years.
Future minimum lease payments under non-cancelable operating leases as of October 1, 2016September 29, 2018, were as follows (in thousands):
| | | Fiscal Year | Amount |
| Amount |
|
| 2017 | $ | 7,177 |
| |
| 2018 | 6,595 |
| |
| 2019 | 6,237 |
| $ | 13,209 |
|
| 2020 | 5,897 |
| 11,795 |
|
| 2021 | 3,633 |
| 8,637 |
|
| 2022 | | 6,264 |
|
| 2023 | | 4,929 |
|
| Thereafter | 10,396 |
| 12,852 |
|
| | $ | 39,935 |
| $ | 57,686 |
|
Rent expense for all operating leases was $9.3 million, $9.49.9 million and $9.8$8.8 million for fiscal years 2016, 2015,2018 and 2014,2017, respectively.
NOTE 12—EMPLOYEE BENEFIT PLANS
We sponsor and maintain a 401(k) retirement savings plan (the “401(k) Plan”) for our employees who meet certain requirements. The 401(k) Plan permits participants to make pre-tax contributions by salary reduction pursuant to Section 401(k) of the Internal Revenue Code, as well as a Roth Plan that allows for after tax contributions. The 401(k) Plan provides for us to make a guaranteed match of a defined portion of the employee’s contributions. During each of fiscal years 2016, 2015,2018 and 20142017 we contributed approximately $1.1$0.9 million $1.1 million, and $1.3 million, respectively, to the 401(k) Plan.
We provide post-retirement life insurance benefits for certain retired employees. The plan is noncontributory and is unfunded, and therefore, benefits and expenses are paid from our general assets as they are incurred. All of the employees in the plan are fully vested and the plan was closed to new employees in 1990. The discount rate used in determining the liability was 6.0% for fiscal years 20162018 and 2015.2017. The following table presents the benefit obligation, for these benefits, which is included in accrued expenses in the accompanying balance sheets (in thousands).
| | | | October 1,
2016 | | October 3,
2015 | September 29, 2018 | | September 30, 2017 |
| Balance at beginning of year | $ | 412 |
| | $ | 443 |
| $ | 343 |
| | $ | 344 |
|
| Interest expense | 6 |
| | 1 |
| 3 |
| | 5 |
|
| Benefits paid | (81 | ) | | (32 | ) | (34 | ) | | (6 | ) |
| Adjustment | 7 |
| | — |
| 1 |
| | — |
|
| Balance at end of year | $ | 344 |
| | $ | 412 |
| $ | 313 |
| | $ | 343 |
|
NOTE 13—STOCK-BASED COMPENSATION
On February 4, 2015, our shareholders re-approved the Delta Apparel, Inc. 2010 Stock Plan ("2010 Stock Plan") that was originally approved by our shareholders on November 11, 2010. The re-approval of the 2010 Stock Plan, including the material terms of the performance goals included in the 2010 Stock Plan, enablesenabled us to continue to grant equity incentive compensation awards that are structured in a manner intended to qualify as tax deductible, performance-based compensation under Section 162(m) of the Internal
Revenue Code of 1986. 1986, as applicable. The New Tax Legislation changed several conclusions under Section 162(m), including that there will no longer be a performance-based compensation exemption, and the Chief Financial Officer position is now included in the applicable calculation along with the next three highest-paid officers. This reform impacts our 2018 tax year.
Since November 2010, no additional awards have been or will be granted under either the Delta Apparel Stock Option Plan
(" ("Option Plan") or the Delta Apparel Incentive Stock Award Plan ("Award Plan"); instead, all stock awards have been and will continue to be granted under the 2010 Stock Plan.
We account for these plans pursuant to ASC 718, SAB 107 and SAB 110. Shares are generally issued from treasury stock upon exercise of the options or the vesting of the restricted stock units and performance units. ASC 718 requires that cash flows from tax benefits attributable to tax deductionsWe early adopted ASU 2016-09 in excess of the compensation cost recognizedour fiscal year beginning October 2, 2016. See Note 2—Significant Accounting Policies (r) Stock-Based Compensation for those options (excess tax benefits) be classified as financing cash flows. further detail.
Compensation expense is recorded on the selling, general and administrative expense line item in our Consolidated Statements of Operations over the vesting periods. Total employee stock-based compensation expense for fiscal years 20162018 and 20152017 was $2.0$2.6 million and $1.9$2.3 million, respectively. During the 2014 fiscal year, we reduced this expense by $90 thousand in connection with our outstanding awards due to adjustments to the expected vesting of certain performance units granted and known forfeitures of certain restricted stock units granted.
Associated with the compensation cost are income tax benefits recognized of $0.8$0.1 million and $0.7$0.9 million in fiscal years 20162018 and 2015,2017, respectively. Tax expense of $35 thousand, associated with the reduction of expense, was recognized in fiscal year 2014.
2010 Stock Plan
Under the 2010 Stock Plan, the Compensation Committee of our Board of Directors has the authority to determine the employees and directors to whom awards may be granted and the size and type of each award and manner in which such awards will vest. The awards available consist of stock options, stock appreciation rights, restricted stock, restricted stock units, performance stock, performance units, and other stock and cash awards. The aggregate number of shares of common stock that may be delivered under the 2010 Stock Plan is 500,000 plus any shares of common stock subject to outstanding awards under the Option Plan or Award Plan that are subsequently forfeited or terminated for any reason before being exercised. The 2010 Stock Plan limits the number of shares that may be covered by awards to any participant in a given calendar year and also limits the aggregate awards of restricted stock, restricted stock units and performance stock granted in any given calendar year. If a participant dies or becomes disabled (as defined in the 2010 Stock Plan) while employed by or serving as a director, all unvested awards become fully vested. The Compensation Committee is authorized to establish the terms and conditions of awards granted under the 2010 Stock Plan, to establish, amend and rescind any rules and regulations relating to the 2010 Stock Plan, and to make any other determinations that it deems necessary.
Stock Options
No stock options were granted during fiscal year 2016.2018. All remaining outstanding options granted byexpired during the Company have vestedquarter ended March 31, 2018, and are exercisable.accordingly were forfeited.
A summary of the stock option activity during the periods ended October 1, 2016, October 3, 2015,September 29, 2018, and September 27, 201430, 2017, is as follows:
|
| | | | | | | | | | | | | | | | | |
| | Fiscal Year Ended |
| | October 1, 2016 | | October 3, 2015 | | September 27, 2014 |
| | Shares | Weighted Average Exercise Price | | Shares | Weighted Average Exercise Price | | Shares | Weighted Average Exercise Price |
| Stock options outstanding, beginning of period | 10,000 |
| $ | 13.07 |
| | 50,000 |
| $ | 13.47 |
| | 50,000 |
| $ | 13.47 |
|
| Stock options granted | — |
| — |
| | — |
| — |
| | — |
| — |
|
| Stock options exercised | — |
| — |
| | — |
| — |
| | — |
| — |
|
| Stock options forfeited | — |
| — |
| | (40,000 | ) | 13.56 |
| | — |
| — |
|
| Stock options outstanding, end of period | 10,000 |
| $ | 13.07 |
| | 10,000 |
| $ | 13.07 |
| | 50,000 |
| $ | 13.47 |
|
| Stock options outstanding and exercisable, end of period | 10,000 |
| $ | 13.07 |
| | 10,000 |
| $ | 13.07 |
| | 50,000 |
| $ | 13.47 |
|
The following table summarizes information about our stock options outstanding, all of which are vested and exercisable as of October 1, 2016:
|
| | | | | | | | | |
| Date of Option Grant | Number of Options Outstanding and Exercisable | Exercise Price | Grant-Date Fair Value | Expiration Date |
| February 2, 2011 | 10,000 |
| $ | 13.07 |
| $ | 6.35 |
| February 18, 2018 |
| | 10,000 |
| | | |
|
| | | | | | | | | | | |
| | Fiscal Year Ended |
| | September 29, 2018 | | September 30, 2017 |
| | Shares | Weighted Average Exercise Price | | Shares | Weighted Average Exercise Price |
| Stock options outstanding, beginning of period | 10,000 |
| $ | 13.07 |
| | 10,000 |
| $ | 13.07 |
|
| Stock options granted | — |
| — |
| | — |
| — |
|
| Stock options exercised | — |
| — |
| | — |
| — |
|
| Stock options forfeited | (10,000 | ) | 13.07 |
| | — |
| — |
|
| Stock options outstanding, end of period | — |
| $ | — |
| | 10,000 |
| $ | 13.07 |
|
| Stock options outstanding and exercisable, end of period | — |
| $ | — |
| | 10,000 |
| $ | 13.07 |
|
Restricted Stock Units and Performance Units
The following table summarizes the restricted stock unit and performance unit award activity during the periods ending October 1, 2016, October 3, 2015,ended September 29, 2018, and September 27, 2014:30, 2017:
| | | | Fiscal Year Ended | Fiscal Year Ended |
| | October 1, 2016 | | October 3, 2015 | | September 27, 2014 | September 29, 2018 | | September 30, 2017 |
| | Number of Units | Weighted average grant date fair value | | Number of Units | Weighted average grant date fair value | | Number of Units | Weighted average grant date fair value | Number of Units | Weighted average grant date fair value | | Number of Units | Weighted average grant date fair value |
| Units outstanding, beginning of fiscal period | 518,800 |
| $ | 10.80 |
| | 215,352 |
| $ | 14.31 |
| | 348,852 |
| $ | 14.25 |
| 512,856 |
| $ | 13.09 |
| | 585,638 |
| $ | 11.54 |
|
| Units granted | 159,138 |
| $ | 14.03 |
| | 524,000 |
| $ | 10.81 |
| | — |
| $ | — |
| 205,500 |
| $ | 20.57 |
| | 126,000 |
| $ | 17.97 |
|
| Units issued | (49,529 | ) | $ | 12.32 |
| | (69,657 | ) | $ | 14.31 |
| | — |
| $ | — |
| (146,781 | ) | $ | 12.89 |
| | (64,846 | ) | $ | 11.14 |
|
| Units forfeited | (42,771 | ) | $ | 10.87 |
| | (150,895 | ) | $ | 14.26 |
| | (133,500 | ) | $ | 14.16 |
| (39,075 | ) | $ | 11.88 |
| | (133,936 | ) | $ | 12.02 |
|
| Units outstanding, end of fiscal period | 585,638 |
| $ | 11.54 |
| | 518,800 |
| $ | 10.80 |
| | 215,352 |
| $ | 14.31 |
| 532,500 |
| $ | 16.12 |
| | 512,856 |
| $ | 13.09 |
|
During fiscal year 2016,2018, restricted stock units representing 83,788and performance units, each consisting of 57,750 shares of our common stock, were granted. These restricted stock units are service-based and 8,438 units are eligible to vest upon the filing of our Annual Report on Form 10-K for the year ended October 1, 2016. The remaining 75,350 units are eligible to vest upon the filing of our Annual Report on Form 10-K for the year ending September 30, 2017. Upon vesting, one-half of these awards are payable in the common stock of Delta Apparel, Inc. and are accounted for under the equity method pursuant to ASC 718 and one-half are payable in cash and are accounted for under the liability method pursuant to ASC 718.
During fiscal year 2016, performance units representing 75,350 shares of our common stock were granted. These performance units are based on the achievement of certain performance criteria for the fiscal years ended October 1, 2016, and ending September 30, 2017,granted and are eligible to vest upon the filing of our Annual Report on Form 10-K for the fiscal year ending September 30, 2017. Upon vesting,28, 2019. One-half of the restricted stock units and one-half of these awardsthe performance units are payable in the common stock of Delta Apparel, Inc. and are accounted for under the equity method pursuant to ASC 718 and one-half are payable in cash and are accounted for under the liability method pursuant to ASC 718.cash.
During fiscal year 2016, previously issued performance2018, restricted stock units representing 49,52990,000 shares of our common stock were granted and are eligible to vest upon the filing of our Annual Report on Form 10-K for the fiscal year ending October 3, 2020. These restricted stock units are payable in common stock.
During fiscal year 2018, restricted stock units and performance units representing 54,602 and 92,068 shares of our common stock, respectively, vested upon the filing of our Annual Report on Form 10-K for the fiscal year ended September 30, 2017, and were issued in accordance with their respective agreements. One-half of the restricted stock units were paid in common stock and one-half in cash. Of the performance units, 72,138 were paid in common stock and 19,930 were paid in cash. In addition, restricted stock units and performance units representing 2,000 shares of our common stock vested and were issued in accordance with their agreement. One-half of the restricted stock units and one-half of the performance units were paid in common stock and one-half were paid in cash.
During fiscal year 2017, performance stock units representing 126,000 shares of our common stock were granted. Of these units, and subject to satisfaction of the applicable performance criteria at target levels, 42,000 will vest with the filing of our Annual Report on Form 10-K for our fiscal year ended September, 29, 2018, 42,000 will vest with the filing of our Annual Report on Form 10-K for our fiscal year ending September, 28, 2019, and 42,000 will vest with the filing of our Annual Report on Form 10-K for our fiscal year ending October 3, 2020. Based upon the performance achieved for fiscal year 2018, 42,000 shares will vest with the filing of our Annual Report on Form 10-K for our fiscal year ended September 29, 2018.
During fiscal year 2017, restricted stock units and performance units representing 8,438 and 53,248 shares of our common stock, respectively, vested upon the filing of our Annual Report on Form 10-K for the fiscal year ended October 3, 2015. Of these performance1, 2016, and were issued in accordance with their respective agreements. One-half of the restricted stock units one-half were payable in common stock and one-half were payable in cashcash. All of the performance units were payable in common stock.
During fiscal year 2017, in association with the sale of our Junkfood business (see Note 4—Divestitures), restricted stock units and performance units representing 45,000 and 5,000 shares of our common stock, respectively, vested on an accelerated basis as a result of the sale of the Junkfood business and were issued in accordance with their respective agreement.
During fiscal year 2015, restricted stock units representing 355,000 sharesagreements. One-half of our common stock were granted. These restricted stock units are serviced-based and vest upon the filing of our Annual Report on Form 10-K for the period ending September 29, 2018. Upon the filing of such Annual Report on Form 10-K, these units are payable in the common stock of Delta Apparel, Inc. and are therefore accounted for under the equity method pursuant to ASC 718.
During fiscal year 2015, performance units representing 169,000 shares of our common stock were granted. Of these performance units, 65,000 were based on the achievement of certain performance criteria for the fiscal year ended October 3, 2015, and were eligible to vest upon the filing of our Annual Report on Form 10-K. Of these units, one-half were payable in the common stock of Delta Apparel, Inc. and were therefore accounted for under the equity method pursuant to ASC 718 and one-half were payable in cash and were therefore accounted for under the liability method pursuant to ASC 718.cash. Of the remaining units, 52,000 were based on the achievement of certain performance criteria for the fiscal year ended October 1, 2016, and 52,000 units are based on the achievement of certain performance criteria for the fiscal year ending September 30, 2017. These units vest upon the filing of our Annual Report on Form 10-K for the periods ended October 1, 2016, and ending September 30, 2017, respectively. Upon the filing of each Annual Report on Form 10-K, these units are payable in the common stock of Delta Apparel, Inc. and are therefore accounted for under the equity method pursuant to ASC 718. Based upon the performance achieved for fiscal year 2015, 49,529 units were issued upon the filing our Annual Report on Form 10-K for fiscal year 2015 and 5,200 units were forfeited on October 3, 2015.
During fiscal year 2015, previously issued restricted stock units, representing 69,657 shares of our42,500 were payable in common stock vested upon the filing of our Quarterly Report on Form 10-Q for the period ended June 27, 2015, and 2,500 were issuedpayable in accordance with their agreement, either in shares of common stock or cash. The total fair value of vested restricted stock units was $1.0$0.3 million in fiscal year 2015. No restricted stock units vested during fiscal years 2014 or 2013. In addition, during fiscal year 2015, previously issued restricted stock units representing 12,019 shares of our common stock were forfeited. During fiscal year 2015, previously issued performance shares representing 133,676 shares of our common stock were forfeited dueexpense related to the failure to achieveaccelerated vesting of equity awards in connection with the performance criteria specifiedsale of the Junkfood business was recorded in the award agreement.Gain on sale of business line item in our Condensed Consolidated Statements of Operations.
As of October 1, 2016September 29, 2018, there was $2.9$3.3 million of total unrecognized compensation cost related to non-vestedunvested restricted stock units and performance units under the 2010 Stock Plan. This cost is expected to be recognized over a period of 2.2 years years.
The following table summarizes information about the unvested restricted stock units and performance units as of October 1, 2016September 29, 2018. |
| | | | | |
| Restricted Stock Units/Performance Units | Number of Units | Average Market Price on Date of Grant | Vesting Date |
| Fiscal year 2015 Restricted Stock Units | 95,000 |
| | $10.52 | December 2018 |
| Fiscal year 2015 Restricted Stock Units | 230,000 |
| | $10.73 | December 2018 |
| Fiscal year 2015 Performance Units | 52,000 |
| | $10.52 | December 2016 |
| Fiscal year 2015 Performance Units | 52,000 |
| | $10.52 | December 2017 |
| Fiscal year 2016 Restricted Stock Units | 8,438 |
| | $14.04 | December 2016 |
| Fiscal year 2016 Restricted Stock Units | 74,100 |
| | $14.03 | December 2017 |
| Fiscal year 2016 Performance Units | 74,100 |
| | $14.03 | December 2017 |
| | 585,638 |
| | | |
|
| | | | | |
| Restricted Stock Units/Performance Units | Number of Units | Average Market Price on Date of Grant | Vesting Date* |
| Fiscal Year 2015 Restricted Stock Units | 95,000 |
| | $10.52 | November 2018 |
| Fiscal Year 2015 Restricted Stock Units | 110,000 |
| | $10.73 | November 2018 |
| Fiscal Year 2017 Performance Units | 42,000 |
| | $17.97 | November 2018 |
| Fiscal Year 2017 Performance Units | 42,000 |
| | $17.97 | November 2019 |
| Fiscal Year 2017 Performance Units | 42,000 |
| | $17.97 | November 2020 |
| Fiscal Year 2018 Restricted Stock Units | 53,750 |
| | $21.51 | November 2019 |
| Fiscal Year 2018 Performance Units | 53,750 |
| | $21.51 | November 2019 |
| Fiscal Year 2018 Restricted Stock Units | 2,000 |
| | $17.97 | November 2019 |
| Fiscal Year 2018 Performance Units | 2,000 |
| | $17.97 | November 2019 |
| Fiscal Year 2018 Restricted Stock Units | 90,000 |
| | $19.52 | November 2020 |
| | 532,500 |
| | | |
* These awards are eligible to vest upon the filing of our Annual Report on Form 10-K for the applicable fiscal year, which is anticipated to be during the month and year indicated in this column.
Option Plan
Prior to expiration of the Option Plan, the Compensation Committee of our Board of Directors had the discretion to grant options for up to 2,000,000 shares of common stock to officers and key and middle-level executives for the purchase of our stock at prices not less than fifty percent of the fair market value of the shares on the dates of grant, with an exercise term (as determined by the Compensation Committee) not to exceed 10 years. The Compensation Committee determined the vesting period for the stock options, which generally became exercisable over three to four years. Certain option awards in the Option Plan provided for accelerated vesting upon meeting specific retirement, death or disability criteria.
Compensation expense was recorded on the selling, general and administrative expense line item in our Consolidated Statements of Operations on a straight-line basis over the vesting periods.
A summary of our stock option activity during the periods ended October 1, 2016, October 3, 2015,September 29, 2018, and September 27, 2014,30, 2017, is as follows:
| | | | Fiscal Year Ended | Fiscal Year Ended |
| | October 1, 2016 | | October 3, 2015 | | September 27, 2014 | September 29, 2018 | | September 30, 2017 |
| | Shares | Weighted Average Exercise Price | | Shares | Weighted Average Exercise Price | | Shares | Weighted Average Exercise Price | Shares | Weighted Average Exercise Price | | Shares | Weighted Average Exercise Price |
| Stock options outstanding, beginning of period | 86,000 |
| $ | 8.30 |
| | 502,000 |
| $ | 12.27 |
| | 584,500 |
| $ | 12.13 |
| 6,000 |
| $ | 8.30 |
| | 86,000 |
| $ | 8.30 |
|
| Stock options exercised | — |
| $ | — |
| | (350,000 | ) | $ | 13.12 |
| | (82,500 | ) | $ | 11.28 |
| — |
| $ | — |
| | (80,000 | ) | $ | 8.30 |
|
| Stock options forfeited | — |
| $ | — |
| | (66,000 | ) | $ | 12.94 |
| | — |
| $ | — |
| (6,000 | ) | $ | 8.30 |
| | — |
| $ | — |
|
| Stock options outstanding, end of period | 86,000 |
| $ | 8.30 |
| | 86,000 |
| $ | 8.30 |
| | 502,000 |
| $ | 12.27 |
| — |
| $ | — |
| | 6,000 |
| $ | 8.30 |
|
| Stock options outstanding and exercisable, end of period | 86,000 |
| $ | 8.30 |
| | 86,000 |
| $ | 8.30 |
| | 502,000 |
| $ | 12.27 |
| — |
| $ | — |
| | 6,000 |
| $ | 8.30 |
|
No stockAll remaining outstanding options were exercisedexpired during fiscal year 2016.2018, and accordingly were forfeited. The total intrinsic value of options exercised during fiscal year 2015 and 20142017 was $0.3 million and$0, respectively.$1.0 million. During fiscal year 2015,2017, stock option exercises resulted in a reduction of deferred excess tax benefits by $0.7$0.1 million. During fiscal year 2014, stock option exercises resulted in an excess tax benefit of $27 thousand.
The following table summarizes information about our stock options outstanding, all of which are vested and exercisable as of October 3, 2015:
|
| | | | | | | | | |
| Date of Option Grant | Number of Options Outstanding and Exercisable | Exercise Price | Grant-Date Fair Value | Expiration Date |
| February 8, 2008 | 86,000 |
| $ | 8.30 |
| $ | 2.95 |
| February 8, 2018 |
| | 86,000 |
| | | |
NOTE 14—BUSINESS SEGMENTS
We operateDuring fiscal year 2018, we made a strategic decision to re-align our business in two distinct segments: basicsinto segments that better reflect our operating model and brandedAlthough the twoallow us to better leverage and more efficiently manage our cost structure as we plan future growth. With this realignment, we changed and renamed our reportable segments are similar in their production processes and regulatory environments, they are distinct in their economic characteristics, products, marketing and distribution methods.
In the second quarter of 2016, in connection with the ongoing evaluation of our current and future strategic initiatives, Robert W. Humphreys,to reflect how our Chief Operating Decision Maker, began reviewingmaker and management currently make financial decisions and allocate resources. We are now reporting our results under the performance ofDelta Group, comprising our Delta Activewear, DTG2Go and Soffe business units, and the basicsSalt Life Group, comprising our Salt Life and branded segments excluding general
corporate expenses. Therefore, we report our financial performance onCoast business units. Junkfood was included in the two reportable segments, basics and branded, with corporate activities stated separately. Our financial statements reflect this reporting with prior periods adjusted accordingly.Salt Life Group segment until its divestiture in March, 2017. We have recast the segment information for the fiscal year ended September 30, 2017, to conform to the current presentation.
The basics segmentDelta Group is comprised of our business units primarily focused on garmentcore activewear styles, characterized by low fashion risk, and includes our Delta Activewear (which includes Delta Catalog and FunTees), Soffe, and Art GunDTG2Go business units. We market, distribute and manufacture unembellished knit apparel under the main brands of Soffe®, Delta Platinum, Delta Pro Weight®, and Delta Magnum Weight® for sale to a diversified audience ranging from large licensed screen printers to small independent businesses. We also manufacture private label products for major branded sportswear companies, trendy regional brands, retailers, and sports licensed apparel marketers. Typically, our private label products are sold with value-added services such as hangtags, ticketing, hangers, and embellishment so that they are fully ready for retail. Using digital print equipment and its proprietary technology, Art GunDTG2Go embellishes garments to create private label, custom decorated apparel servicing the fast-growing e-retailer channels.channels, as well as the ad specialty, promotional products and retail marketplaces.
The branded segmentSalt Life Group is comprised of our business units which arelifestyle brands focused on specializeda broad range of apparel garments, headwear and headwearrelated accessories to meet consumer preferences and fashion trends, and includes our Salt Life Junkfood, Soffe, and Coast business units as well as The Game business unit prior to its disposition on March 2, 2015.units. These branded embellished and unembellished products are sold through specialty and boutique shops, upscale and traditional department stores, mid-tierand outdoor retailers, sporting goods stores, e-retailersas well as direct-to-consumer through branded ecommerce sites and the U.S. military.branded retail stores. Products in this segment are marketed under our lifestyle brands of Salt Life®, Junk Food®, Soffe®, and COAST®, as well as other labels. The results of the Coast business have been Junkfood was included in the brandedthis segment since acquisition on August 30, 2016.until its divestiture in March, 2017.
Our Chief Operating Decision Maker and management evaluate performance and allocate resources based on profit or loss from operations before interest, income taxes and special charges ("segment operating earnings (loss)"earnings"). Our segment operating earnings (loss) may not be comparable to similarly titled measures used by other companies. The accounting policies of our reportable segments are the same as those described in Note 2. Intercompany transfers between operating segments are transacted at cost and have been eliminated within the segment amounts shown in the following table (in thousands).
| | | | Fiscal Year Ended | Fiscal Year Ended |
| | October 1, 2016 | | October 3, 2015 | | September 27, 2014 | September 29, 2018 | | September 30, 2017 |
| Segment net sales: | | | | | | | | |
| Basics | $ | 277,146 |
| | $ | 282,467 |
| | $ | 265,882 |
| |
| Branded | 148,103 |
| | 166,675 |
| | 187,019 |
| |
| Delta Group | | $ | 356,009 |
| | $ | 326,575 |
|
| Salt Life Group | | 39,441 |
| | 58,507 |
|
| Total net sales | 425,249 |
| | 449,142 |
| | 452,901 |
| 395,450 |
| | 385,082 |
|
| | | | | | | | | |
| Segment operating income: | | | | | | | | |
| Basics | 22,307 |
| | 13,060 |
| | 6,785 |
| |
| Branded | 6,950 |
| | 12,379 |
| | 3,070 |
| |
| Delta Group | | 26,091 |
| | 23,251 |
|
| Salt Life Group | | 4,747 |
| | 4,880 |
|
| Total segment operating income | 29,257 |
| | 25,439 |
| | 9,855 |
| 30,838 |
| | 28,131 |
|
| | | | | | | | | |
| Purchases of property, plant and equipment: | | | | | | | | |
| Basics | 10,734 |
| | 6,037 |
| | 6,436 |
| |
| Branded | 1,501 |
| | 689 |
| | 1,458 |
| |
| Delta Group | | 4,341 |
| | 5,619 |
|
| Salt Life Group | | 917 |
| | 1,281 |
|
| Corporate | 80 |
| | 1,047 |
| | 1,000 |
| 511 |
| | 185 |
|
| Total purchases of property, plant and equipment | 12,315 |
| | 7,773 |
| | 8,894 |
| 5,769 |
| | 7,085 |
|
| | | | | | | | | |
| Depreciation and amortization: | | | | | | | | |
| Basics | 6,437 |
| | 6,208 |
| | 6,096 |
| |
| Branded | 2,772 |
| | 2,902 |
| | 2,948 |
| |
| Delta Group | | 8,090 |
| | 7,632 |
|
| Salt Life Group | | 1,456 |
| | 1,568 |
|
| Corporate | 416 |
| | 432 |
| | 449 |
| 442 |
| | 409 |
|
| Total depreciation and amortization | 9,625 |
| | 9,542 |
| | 9,493 |
| 9,988 |
| | 9,609 |
|
The following reconciles the segment operating income to the consolidated income (loss) before provision for (benefit from) income taxes (in thousands):
| | | | Fiscal Year Ended | Fiscal Year Ended |
| | October 1, 2016 | | October 3, 2015 | | September 27, 2014 | September 29, 2018 | | September 30, 2017 |
| Segment operating income | $ | 29,257 |
| | $ | 25,439 |
| | $ | 9,855 |
| $ | 30,838 |
| | $ | 28,131 |
|
| Loss attributable to non-controlling interest | | 107 |
| | — |
|
| Unallocated corporate expenses | 12,925 |
| | 9,320 |
| | 11,516 |
| 13,328 |
| | 11,952 |
|
| Unallocated interest expense | 5,287 |
| | 6,021 |
| | 5,792 |
| 5,713 |
| | 5,011 |
|
| Consolidated income (loss) before provision for (benefit from) income taxes | $ | 11,045 |
| | $ | 10,098 |
| | $ | (7,453 | ) | |
| Consolidated income before provision for income taxes | | $ | 11,690 |
| | $ | 11,168 |
|
Our revenues include sales to domestic and foreign customers. Foreign customers are composed of companies whose headquarters are located outside of the United States. Supplemental information regarding our revenues by geographic area based on the location of the customer is as follows (in thousands):
| | | | Fiscal Year Ended | Fiscal Year Ended |
| | October 1, 2016 | | October 3, 2015 | | September 27, 2014 | September 29, 2018 | | September 30, 2017 |
| United States | $ | 418,627 |
| | $ | 442,207 |
| | $ | 442,062 |
| $ | 394,252 |
| | $ | 383,672 |
|
| Foreign | 6,622 |
| | 6,935 |
| | 10,839 |
| 1,198 |
| | 1,410 |
|
| Total net sales | $ | 425,249 |
| | $ | 449,142 |
| | $ | 452,901 |
| $ | 395,450 |
| | $ | 385,082 |
|
Our total assets and equity investment by segment are as follows (in thousands):
| | | | As of | As of |
| | October 1, 2016 | | October 3, 2015 | September 29, 2018 | | September 30, 2017 |
| Total assets by segment: | | | | | | |
| Basics | 178,347 |
| | 160,902 |
| |
| Branded | 156,119 |
| | 152,210 |
| |
| Delta Group | | 283,811 |
| | 247,910 |
|
| Salt Life Group | | 55,032 |
| | 61,108 |
|
| Corporate | 10,186 |
| | 11,791 |
| 4,766 |
| | 8,784 |
|
| Total assets | 344,652 |
| | 324,903 |
| 343,609 |
| | 317,802 |
|
| | | | | | | |
| Equity investment in joint venture: | | | | | | |
| Basics | 3,593 |
| | 3,195 |
| |
| Branded | — |
| | — |
| |
| Delta Group | | 8,980 |
| | 4,140 |
|
| Salt Life Group | | — |
| | — |
|
| Total equity investment in joint venture | 3,593 |
| | 3,195 |
| 8,980 |
| | 4,140 |
|
Our long-lived assets, excluding goodwill and intangible assets, consist of property, plant and equipment for all locations. We attribute our property, plant and equipment to a particular country based on the location of the long-lived assets. Summarized financial information by geographic area is as follows (in thousands):
| | | | As of | As of |
| | October 1, 2016 | | October 3, 2015 | September 29, 2018 | | September 30, 2017 |
| | | | | | | |
| United States | $ | 18,523 |
| | $ | 22,302 |
| $ | 30,768 |
| | $ | 19,587 |
|
| | | | | | | |
| Honduras | 19,650 |
| | 13,072 |
| 16,823 |
| | 18,151 |
|
| El Salvador | 4,215 |
| | 3,276 |
| 3,476 |
| | 3,853 |
|
| Mexico | 1,115 |
| | 1,003 |
| 1,047 |
| | 1,115 |
|
| All foreign countries | 24,980 |
| | 17,351 |
| 21,346 |
| | 23,119 |
|
| | | | | | | |
| Total long-lived assets, excluding goodwill and intangibles | $ | 43,503 |
| | $ | 39,653 |
| $ | 52,114 |
| | $ | 42,706 |
|
NOTE 15—REPURCHASE OF COMMON STOCK
As of October 1, 2016,September 29, 2018, our Board of Directors had authorized management to use up to $40.0$60.0 million to repurchase stock in open market transactions under our Stock Repurchase Program. During the September 2018 quarter, our Board of Directors approved management to repurchase an additional $10 million of the Company’s outstanding common stock, bringing the total amount authorized under the program to the above-referenced $60 million.
During fiscal years 2016, 20152018 and 2014,2017, we purchased 217,568463,974 shares 140,336 shares, 78,674and 413,337 shares, respectively, of our common stock for a total cost of $3.5$9.0 million $2.1 million, $1.2and $7.8 million, respectively. As of October 1, 2016,September 29, 2018, we have purchased 2,480,1503,357,461 shares of common stock for an aggregate of $30.9$47.7 million since the inception of the Stock Repurchase Program. All purchases were made at the discretion of management and pursuant to the safe harbor provisions of SEC Rule 10b-18. As of October 1, 2016, $9.1September 29, 2018, $12.3 million remained available for future purchases under our Stock Repurchase Program, which does not have an expiration date. The following table summarizes the purchases of our common stock for the quarter ended October 1, 2016:September 29, 2018:
|
| | | | | | | | | | | | | | |
| Period | | Total Number of Shares Purchased | | Average Price Paid per Share | | Total Number of Shares Purchased as Part of Publicly Announced Plans | | Dollar Value of Shares that May Yet Be Purchased Under the Plans |
| July 3 to August 6, 2016 | | — |
| | $ | — |
| | — |
| |
| $10.8 | million |
| August 7 to September 3, 2016 | | 16,093 |
| | $ | 18.43 |
| | 16,093 |
| |
| $10.5 | million |
| September 4 to October 1, 2016 | | 87,685 |
| | $ | 16.30 |
| | 87,685 |
| |
| $9.1 | million |
| Total | | 103,778 |
| | $ | 16.63 |
| | 103,778 |
| |
| $9.1 | million |
|
| | | | | | | | | | | | | | |
| Period | | Total Number of Shares Purchased | | Average Price Paid per Share | | Total Number of Shares Purchased as Part of Publicly Announced Plans | | Dollar Value of Shares that May Yet Be Purchased Under the Plans |
| July 1 to August 4, 2018 | | 12,925 |
| | $ | 18.20 |
| | 12,925 |
| |
| $5.4 | million |
| August 5 to September 1, 2018 | | 124,232 |
| | $ | 18.48 |
| | 124,332 |
| |
| $3.1 | million |
| September 2 to September 29, 2018 | | 43,459 |
| | $ | 18.31 |
| | 43,459 |
| |
| $12.3 | million |
| Total | | 180,616 |
| | $ | 18.42 |
| | 180,716 |
| |
| $12.3 | million |
NOTE 16—COMMITMENTS AND CONTINGENCIES
(a) Litigation
U.S. Consumer Product Safety Commission
We previously received an inquiry from the U.S. Consumer Product Safety Commission (“Commission”) regarding a children's drawstring hoodie product sourced, distributed and sold by Junkfood, and its compliance with applicable product safety standards. The Commission subsequently investigated the matter, including whether Junkfood complied with the reporting requirements of the Consumer Product Safety Act (“CPSA”), and the garments in question were ultimately recalled. Junkfood subsequently received notification from the Commission staff alleging that Junkfood knowingly violated CPSA Section 15(b) and that the staff will recommend to the Commission a $900,000 civil penalty. We disputed the Commission's allegations and subsequently responded to the Commission staff regarding its recommended penalty, setting forth a number of defenses and mitigating factors that could have resulted in a much lower penalty, if any, ultimately imposed by a court had the matter proceeded to litigation.
We believe that any claims brought by the Commission seeking enforcement of the recommended penalty would be time-barred under any reasonable interpretation of the applicable civil statute of limitations. Accordingly, we consider this matter to be resolved and during the quarter ended October 1, 2016, we reversed the liability previously recorded in connection with this matter.
California Wage and Hour Litigation
We were served with a complaint in the Superior Court of the State of California, County of Los Angeles, on or about March 13, 2013, by a former employee of our Delta Activewear business unit at our Santa Fe Springs, California distribution facility alleging violations of California wage and hour laws and unfair business practices with respect to meal and rest periods, compensation and wage statements, and related claims (the "Complaint"). The Complaint was brought as a class action and sought to include all of our Delta Activewear business unit's current and certain former employees within California who are or were non-exempt under applicable wage and hour laws. The Complaint also named as defendants Junkfood, Soffe, an independent contractor of Soffe, and a former employee, and sought to include all current and certain former employees of Junkfood, Soffe and the Soffe independent contractor within California who are or were non-exempt under applicable wage and hour laws. The Complaint sought injunctive and declaratory relief, monetary damages and compensation, penalties, attorneys' fees and costs, and pre-judgment interest.
On or about August 22, 2014, we were served with an additional complaint in the Superior Court of the State of California, County of Los Angeles, by a former employee of Junkfood and two former employees of Soffe at our Santa Fe Springs, California distribution facility alleging violations of California wage and hour laws and unfair business practices the same or substantially similar to those alleged in the Complaint and seeking the same or substantially similar relief as sought in the Complaint. This complaint was brought as a class action and sought to include all current and certain former employees of Junkfood, Soffe, our Delta Activewear business unit, the Soffe independent contractor named in the Complaint and an individual employee of such contractor within California who are or were non-exempt under applicable wage and hour laws.
On September 17, 2015, an agreement in principle was reached between all parties to settle the above-referenced wage and hour matters, with the defendants in the matters agreeing to pay an aggregate amount of $300,000 in exchange for a comprehensive release of all claims at issue in the matters. Delta Apparel, Inc., Soffe and Junkfood collectively agreed to contribute$200,000 towards the aggregate settlement
amount, and we have this amount included in our accrued expenses as of October 1, 2016, and October 3, 2015. The settlement agreement has been approved by the applicable court and these matters have been finally resolved, with the agreed amounts funded subsequent to the 2016 fiscal year-end.
The Sports Authority Bankruptcy Litigation
Soffe is involved in several related litigation matters stemming from The Sports Authority's ("TSA") March 2, 2016, filing of a voluntary petition(s) for relief under Chapter 11 of the United States Bankruptcy Code (the "TSA Bankruptcy"). Prior to such filing, Soffe provided TSA with products to be sold on a consignment basis pursuant to a "pay by scan" agreement and the litigation matters relate to Soffe's interest in the products it provided TSA on a consignment basis (the "Products") and the proceeds derived from the sale of such products (the "Proceeds").
TSA Stores, Inc. and related entities TSA Ponce, Inc. and TSA Caribe, Inc. filed an action against Soffe on March 16, 2016, in the United States Bankruptcy Court for the District of Delaware (the "TSA Action") essentially seeking a declaratory judgment that: (i) Soffe does not own the Products but rather has a security interest that is not perfected or senior and is avoidable; (ii) Soffe only has an unsecured claim against TSA; (iii) TSA and TSA's secured creditors have valid, unavoidable and senior rights in the Products and the Products are the property of TSA’s estate; (iv) Soffe does not have a perfected purchase money security interest in the Products; (v) Soffe is not entitled to a return of the Products; and (vi) TSA can continue to sell the Products and Soffe is not entitled to any proceeds from such sales other than as an unsecured creditor. The TSA Action also contains claims seeking to avoid Soffe's filing of a financing statement related to the Products as a preference and recover the value of that transfer as well as to disallow Soffe's claims until it has returned preferential transfers or their associated value. TSA also brings a claim for a permanent injunction barring Soffe from taking certain actions. We believe that many of the claims in the TSA Action, including TSA’s claim for injunction, are now moot as a result of Soffe’s agreement to permit TSA to continue selling the Products in TSA’s going-out-of-business sale.
On May 16, 2016, TSA lender Wilmington Savings Fund Society, FSB, as Successor Administrative and Collateral Agent ("WSFS"), intervened in the TSA Action seeking a declaratory judgment that: (i) WSFS has a perfected interest in the Products and Proceeds that is senior to Soffe's interest; and (ii) the Proceeds paid to Soffe must be disgorged pursuant to an order previously issued by the court. WSFS's intervening complaint also contains a separate claim seeking the disgorgement of all Proceeds paid to Soffe along with accrued and unpaid interest.
Soffe has asserted counterclaims against WSFS in the TSA Action essentially seeking a declaratory judgment that: (i) WSFS is not perfected in the Products; and (ii) WSFS's interest in the Products is subordinate to Soffe's interest.
On May 24, 2016, Soffe joined an appeal filed by a number of TSA consignment vendors in the United States District Court for the District of Delaware challenging an order issued in the TSA Bankruptcy that, should WSFS or TSA succeed in the TSA Action, granted TSA and/or WSFS a lien on all Proceeds received by Soffe and requiring the automatic disgorgement of such Proceeds. As of November 14, 2016, Soffe and another entity are the remaining consignment vendors pursuing this appeal.
Although we will continue to vigorously defend against the TSA Action and pursue the above-referenced counterclaims and appeal, should TSA and/or WSFS ultimately prevail on their claims, we could be forced to disgorge all Proceeds received and forfeit our ownership
rights in any Products that remain in TSA's possession. We believe the range of possible loss in this matter is currently $0 to$3.3currently$0 to $3.3 million; however, it is too early to determine the probable outcome and, therefore, no amount has been accrued related to this matter.
In addition, at times we are party to various legal claims, actions and complaints. We believe that, as a result of legal defenses, insurance arrangements, and indemnification provisions with parties believed to be financially capable, such actions should not have a material effect on our operations, financial condition, or liquidity.
(b) Purchase Contracts
We have entered into agreements, and have fixed prices, to purchase yarn, natural gas, finished fabric, and finished apparel and headwear products. At October 1, 2016,September 29, 2018, minimum payments under these contracts were as follows (in thousands):
| | | Yarn | $ | 13,823 |
| $ | 43,273 |
|
| Finished fabric | 6,952 |
| 4,577 |
|
| Finished products | 22,130 |
| 25,770 |
|
| | $ | 42,905 |
| $ | 73,620 |
|
(c) Letters of Credit
As of October 1, 2016,September 29, 2018, we had outstanding standby letters of credit totaling $0.4 million.
(d) Derivatives and Contingent Consideration
From time to time we may use interest rate swaps or other instruments to manage our interest rate exposure and reduce the impact of future interest rate changes. These financial instruments are not used for trading or speculative purposes. The following financial instruments were outstanding as of October 1, 2016:September 29, 2018:
|
| | | | | | | | |
| | Effective Date | | Notational Amount | | LIBOR Rate | | Maturity Date |
| Interest Rate Swap | September 9, 2013July 19, 2017 | | $1510 million | | 1.6480 | %1.74% | | September 11, 2017July 19, 2019 |
| Interest Rate Swap | SeptemberJuly 19, 20132017 | | $1510 million | | 1.4490 | %1.99% | | September 19, 2017May 10, 2021 |
| Interest Rate Swap | July 25, 2018 | | $20 million | | 3.18% | | July 25, 2023 |
From time to time, we may purchase cotton option contracts to economically hedge the risk related to market fluctuations in the cost of cotton used in our operations. We do not receive hedge accounting treatment for these derivatives. As such, the realized and unrealized gains and losses associated with them are recorded within cost of goods sold on the Consolidated Statement of Operations.
FASB Codification No. 820, Fair Value Measurements and Disclosures (“ASC 820”), defines fair value, establishes a framework for measuring fair value and expands disclosures about fair value measurements. Assets and liabilities measured at fair value are grouped in three levels. The levels prioritize the inputs used to measure the fair value of the assets or liabilities. These levels are:
| |
| ◦ | Level 1 – Quoted prices (unadjusted) in active markets for identical assets or liabilities. |
| |
| ◦ | Level 2 – Inputs other than quoted prices that are observable for assets and liabilities, either directly or indirectly. These inputs include quoted prices for similar assets or liabilities in active markets and quoted prices for identical or similar assets or liabilities in market that are less active. |
| |
| ◦ | Level 3 – Unobservable inputs that are supported by little or no market activity for assets or liabilities and includes certain pricing models, discounted cash flow methodologies and similar techniques. |
The following financial liabilities are measured at fair value on a recurring basis (in thousands):
|
| | | | | | | | | | | | | | |
| | Fair Value Measurements Using |
| Period Ended | Total | | Quoted Prices in Active Markets for Identical Assets (Level 1) | | Significant Other Observable Inputs (Level 2) | | Significant Unobservable Inputs (Level 3) |
| Interest Rate Swap | | | | | | | |
| October 1, 2016 | $ | (182 | ) | | — |
| | $ | (182 | ) | | — |
|
| October 3, 2015 | $ | (697 | ) | | — |
| | $ | (697 | ) | | — |
|
| September 27, 2014 | $ | (438 | ) | | — |
| | $ | (438 | ) | | — |
|
| | | | | | | | |
| Contingent Consideration | | | | | | | |
| October 1, 2016 | $ | (2,500 | ) | | — |
| | — |
| | $ | (2,500 | ) |
| October 3, 2015 | $ | (3,100 | ) | | — |
| | — |
| | $ | (3,100 | ) |
| September 27, 2014 | $ | (3,600 | ) | | — |
| | — |
| | $ | (3,600 | ) |
|
| | | | | | | | | | | | | | |
| | Fair Value Measurements Using |
| Period Ended | Total | | Quoted Prices in Active Markets for Identical Assets (Level 1) | | Significant Other Observable Inputs (Level 2) | | Significant Unobservable Inputs (Level 3) |
| Interest Rate Swap | | | | | | | |
| September 29, 2018 | $ | 183 |
| | — |
| | $ | 183 |
| | — |
|
| September 30, 2017 | $ | (56 | ) | | — |
| | $ | (56 | ) | | — |
|
| | | | | | | | |
| Cotton Options | | | | | | | |
| September 29, 2018 | $ | (110 | ) | | (110 | ) | | — |
| | $ | — |
|
| September 30, 2017 | $ | (125 | ) | | (125 | ) | | — |
| | $ | — |
|
| | | | | | | | |
| Contingent Consideration | | | | | | | |
| September 29, 2018 | $ | (10,542 | ) | | — |
| | — |
| | $ | (10,542 | ) |
| September 30, 2017 | $ | (1,600 | ) | | — |
| | — |
| | $ | (1,600 | ) |
The fair value of the interest rate swap agreements were derived from discounted cash flow analysis based on the terms of the contract and the forward interest rate curves adjusted for our credit risk, which fall in Level 2 of the fair value hierarchy. Fair values for debt are based on quoted market prices for the same or similar issues or on the current rates offered to us for debt of the same remaining maturities (a Level 2 fair value measurement).
In August 2013, we acquired Salt Life and issued contingent consideration payable in cash after the end of calendar year 2019 if financial performance targets involving the sale of Salt Life-branded products are met during the 2019 calendar year. We used a Monte Carlo model which used the historical results and projected cash flows based on the contractually defined terms, discounted as necessary, to estimate the fair value of the contingent consideration for Salt Life at acquisition, as well as to remeasure the contingent consideration related to the acquisition of Salt Life at each reporting period. Accordingly, the fair value measurement for contingent consideration falls in Level 3 of the fair value hierarchy.
At October 1, 2016,September 29, 2018, we had $2.5$1.3 million accrued in contingent consideration related to the acquisition of Salt Life, Acquisition, a $0.6$0.3 million reduction from the accrual at October 3, 2015.September 30, 2017. The reduction in the fair value of contingent consideration is based on the inputs into the Monte Carlo model, including the time remaining in the measurement period. We still expectThe sales inexpectations for calendar year 2019 to approximatehave been reduced from the sales expectations for calendar 2019 sales used in the valuation of contingent consideration at acquisition. Noacquisition due to overall softness in the retail environment.
The DTG2Go acquisition (See Note 3—Acquisitions for further detail) purchase price consisted of additional payments contingent on the combined business’s achievement of certain performance targets related to sales and earnings before interest, taxes, depreciation and amortization ("EBITDA") for the period from April 1, 2018, through September 29, 2018, as well as for our fiscal years 2019, 2020, 2021 and 2022. The valuation of the fair value of the contingent consideration is expectedbased upon inputs into the Monte Carlo model, including projected results, which then are discounted to be paid undera present value to derive the terms of our acquisitionfair value. The fair value of the Art Gun business.
contingent consideration is sensitive to changes in our projected results. At September 29, 2018, we had $9.2 million accrued as contingent consideration.
The following table summarizes the fair value and presentation in the Consolidated Balance Sheets for derivatives as of October 1, 2016,September 29, 2018, and October 3, 2015.September 30, 2017.
|
| | | | | | | | |
| | October 1,
2016 | | October 3,
2015 | |
| Accrued expenses | $ | (182 | ) | | $ | (519 | ) | |
| Deferred tax liabilities | 70 |
| | 269 |
| |
| Other liabilities | — |
| | (179 | ) | |
| Accumulated other comprehensive loss | $ | (112 | ) | | $ | (429 | ) | |
(e) License Agreements
We have entered into license agreements that provide for royalty payments of net sales of licensed products as set forth in the agreements. These license agreements are within our branded segment. We have incurred royalty expense (included in selling, general and administrative expenses) of approximately $8.2 million, $10.1 million and $11.1 million during fiscal years 2016, 2015, and 2014, respectively.
At October 1, 2016, based on minimum sales requirements, future minimum royalty payments required under these license agreements were as follows (in thousands): |
| | | |
| Fiscal Year | Amount |
|
| 2017 | $ | 1,132 |
|
| 2018 | 178 |
|
| 2019 | — |
|
| 2020 | — |
|
| 2021 and thereafter | — |
|
| | $ | 1,310 |
|
|
| | | | | | | |
| | September 29, 2018 | | September 30, 2017 |
| Other assets | $ | 182 |
| | $ | — |
|
| Deferred tax liabilities | (46 | ) | | 21 |
|
| Other liabilities | — |
| | (56 | ) |
| Accumulated other comprehensive loss | $ | 136 |
| | $ | (35 | ) |
NOTE 17—QUARTERLY FINANCIAL INFORMATION (UNAUDITED)SUBSEQUENT EVENTS
Presented belowOn October 8, 2018, DTG2Go acquired substantially all of the assets of Silk Screen Ink, Ltd. d/b/a SSI Digital Print Services, a leading provider of digital print services, for $12.0 million. The acquisition of Silk Screen Ink, Ltd. further increases DTG2Go's digital capacity as well as enhancing DTG2Go's strategic footprint. It is a summarynot practicable to estimate the financial impact of our unaudited consolidated quarterly financial informationthe acquisition and the initial accounting for the fiscal years ended October 1, 2016,business combination is incomplete as of the date the financial statements were issued.
In conjunction with the acquisition of the Silk Screen Ink, Ltd. assets, Delta Apparel, Inc. and October 3, 2015 (in thousands, except per share amounts):
|
| | | | | | | | | | | | | | | | | | | | | | | | | | | | | | | |
| | 2016 Quarter Ended | | 2015 Quarter Ended |
| | January 2,
2016 | | April 2,
2016 | | July 2,
2016 | | October 1,
2016 | | December 27,
2014 | | March 28,
2015 | | June 27,
2015 | | October 3,
2015 |
| Net sales | $ | 90,171 |
| | $ | 109,160 |
| | $ | 111,552 |
| | $ | 114,366 |
| | $ | 93,381 |
| | $ | 115,042 |
| | $ | 120,525 |
| | $ | 120,194 |
|
| Gross profit | 18,879 |
| | 25,726 |
| | 24,986 |
| | 23,908 |
| | 15,326 |
| | 21,235 |
| | 25,484 |
| | 26,274 |
|
| Operating income (loss) | 2,227 |
| | 5,931 |
| | 4,227 |
| | 3,947 |
| | (3,217 | ) | | 7,328 |
| | 6,897 |
| | 5,111 |
|
| Net earnings (loss) | 681 |
| | 3,436 |
| | 2,542 |
| | 2,305 |
| | (4,211 | ) | | 3,646 |
| | 4,418 |
| | 4,240 |
|
| | | |
|
| |
|
| |
|
| | | | | | | | |
| Basic EPS | $ | 0.09 |
| | $ | 0.44 |
| | $ | 0.33 |
| | $ | 0.30 |
| | $ | (0.53 | ) | | $ | 0.46 |
| | $ | 0.56 |
| | $ | 0.54 |
|
| Diluted EPS | $ | 0.09 |
| | $ | 0.43 |
| | $ | 0.32 |
| | $ | 0.29 |
| | $ | (0.53 | ) | | $ | 0.46 |
| | $ | 0.55 |
| | $ | 0.53 |
|
As discussed in Note 4, gross profitits wholly owned subsidiaries entered into a Consent and operating income in the quarters ended July 2, 2016,Third Amendment to Fifth Amended and October 1, 2016, included restructuring expenses relatedRestated Credit Agreement with Wells Fargo Bank, National Association (the "Third Amendment"). Pursuant to the manufacturing realignment,Third Amendment, the Lenders consented to DTG2Go's acquisition of substantially all of the assets of Silk Screen Ink, Ltd. The Third Amendment also: (i) amends the existing loan agreement, including various definitions therein, to add a first-in last-out "FILO" borrowing component; and as discussed in Note 3, operating income for(ii) amends the quarter ended March 28, 2015, included a gain fromexisting loan agreement, including various definitions therein, to address the salepotential unavailability or discontinuance of The Game.
the use of LIBOR rates and update certain provisions regarding compliance with denied party, sanctioned entity, anti-corruption and anti-money laundering and related laws and regulations and other items.
Section 15 (a)(2) SCHEDULE II — CONSOLIDATED VALUATION AND QUALIFYING ACCOUNTS
DELTA APPAREL, INC. AND SUBSIDIARIES
(In thousands)
ALLOWANCE FOR DOUBTFUL ACCOUNTS
|
| | | | | | | | | | | | | | | |
| | Beginning Balance | | Expense | | Write-Offs/ Credits Issued | | Ending Balance |
| 2016 | $ | 1,470 |
| | $ | 195 |
| | $ | (1,096 | ) | | $ | 569 |
|
| 2015 | 1,047 |
| | 771 |
| | (348 | ) | | 1,470 |
|
| 2014 | 851 |
| | 467 |
| | (271 | ) | | 1,047 |
|
|
| | | | | | | | | | | | | | | |
| | Beginning Balance | | Expense | | Write-Offs/ Credits Issued | | Ending Balance |
| 2016 | $ | 1,515 |
| | $ | 7,822 |
| | $ | (7,928 | ) | | $ | 1,409 |
|
| 2015 | 2,113 |
| | 12,173 |
| | (12,771 | ) | | 1,515 |
|
| 2014 | 2,108 |
| | 12,425 |
| | (12,420 | ) | | 2,113 |
|
TOTAL RESERVES FOR ALLOWANCES |
| | | | | | | | | | | | | | | |
| | Beginning Balance | | Expense | | Write-Offs/ Credits Issued | | Ending Balance |
| 2016 | $ | 2,985 |
| | $ | 8,017 |
| | $ | (9,024 | ) | | $ | 1,978 |
|
| 2015 | 3,160 |
| | 12,944 |
| | (13,119 | ) | | 2,985 |
|
| 2014 | 2,959 |
| | 12,892 |
| | (12,691 | ) | | 3,160 |
|