UNITED STATES
SECURITIES AND EXCHANGE COMMISSION
Washington, D. C. 20549
FORM 10-K
(Mark one)
(Mark one)
| x | ANNUAL REPORT PURSUANT TO SECTION 13 OR 15(d) OF THE SECURITIES EXCHANGE ACT OF 1934 |
|
For the period ended December 31, 2008
or
| ¨ | | For the fiscal year ended March 31, 2005
|
| |
|
| o
| TRANSITION REPORT PURSUANT TO SECTION 13 OR 15(d) OF THE SECURITIES EXCHANGE ACT OF 1934 |
Commission File Number: 1-8182
PIONEER DRILLING COMPANY
(Exact name of registrant as specified in its charter)
TEXAS
|
| 74-2088619
|
TEXAS | | 74-2088619 |
(State or other jurisdiction of
of incorporation or organization) | | | (I.R.S. Employer
Identification Number) |
|
|
|
9310 Broadway, Bldg. I
1250 N.E. Loop 410, Suite 1000
San Antonio, Texas |
| 7821778209
|
(Address of principal executive offices) | | (Zip Code) |
Registrant’s telephone number, including area code: (210) 828-7689
Securities registered pursuant to Section 12(b) of the Act:
| | |
Title of each class |
| Name of each exchange on which registered |
Common Stock, $0.10 par value | | American Stock Exchange (NYSE Alternext US) |
Securities registered pursuant to Section 12(g) of the Act: None
Indicate by check mark if the registrant is a well-known seasoned issuer, as defined in Rule 405 of the Securities Act. Yes ¨ No x
Indicate by check mark if the registrant is not required to file reports pursuant to Section 13 or Section 15(d) of the Exchange Act. Yes ¨ No x
Indicate by check mark whether the Registrant: (1) has filed all reports required to be filed by Section 13 or 15(d) of the Securities Act of 1934 during the preceding 12 months (or for such shorter period that the registrant was required to file such reports), and (2) has been subject to such filing requirements for the past 90 days. Yes ýx No o¨
Indicate by check mark if disclosure of delinquent filers pursuant to Item 405 of Regulation S-K is not contained herein, and will not be contained, to the best of registrant’s knowledge, in definitive proxy or information statements incorporated by reference in Part III of this Form 10-K or any amendment to this Form 10-K. ¨ý
Indicate by check mark whether the registrant is a large accelerated filer, an accelerated filer, a non-accelerated filer, or a smaller reporting company. See definitions of “large accelerated filer,” “accelerated filer,” “non-accelerated filer,” and “smaller reporting company” in Rule 12b-2 of the Exchange Act. (Check one):
| | | | |
Large accelerated filer x | | | | Accelerated filer ¨ |
Non-accelerated filer ¨ | | (Do not check if a smaller reporting company) | | Smaller reporting company ¨ |
Indicate by check mark whether the registrant is an accelerated filera shell company (as defined in Rule 12b-2 of the Securities Exchange Act of 1934)Act). Yes ý¨ No ox
The aggregate market value of the registrant’s voting and nonvoting common equitystock held by non-affiliatesnonaffiliates of the registrant as ofon the last business day of the registrant’s most recently completed second fiscal quarter (September 30, 2004) was $189,796,564, based(based on the lastclosing sales price of the registrant’s common stock reported on the American Stock Exchange (NYSE Alternext US) on that date.
June 30, 2008) was approximately $932.0 million.
As of May 20, 2005,February 6, 2009, there were 45,931,64649,997,578 shares of common stock, par value $0.10 per share, of the registrant issued and outstanding.
DOCUMENTS INCORPORATED BY REFERENCE
Portions of the proxy statement related to the registrant’s 20052009 Annual Meeting of Shareholders are incorporated by reference into Part III of this report.
PART I
StatementsINTRODUCTORY NOTE
SPECIAL NOTE REGARDING FORWARD-LOOKING STATEMENTS
From time to time, our management or persons acting on our behalf make forward-looking statements to inform existing and potential security holders about our company. These statements may include projections and estimates concerning the timing and success of specific projects and our future backlog, revenues, income and capital spending. Forward-looking statements are generally accompanied by words such as “estimate,” “project,” “predict,” “believe,” “expect,” “anticipate,” “plan,” “intend,” “seek,” “will,” “should,” “goal” or other words that convey the uncertainty of future events or outcomes. These forward-looking statements speak only as of the date on which they are first made, which in the case of forward-looking statements made in this report is the date of this report. Sometimes we make inwill specifically describe a statement as being a forward-looking statement and refer to this cautionary statement.
In addition, various statements that this Annual Report on Form 10-K contains, including those that express a belief, expectation or intention, as well as those that are not statements of historical fact, are forward-looking statements under the Private Securities Litigation Reform Act of 1995. Thesestatements. Those forward-looking statements are subject to various risks, uncertaintiesappear in Item 1—“Business” and assumptions, including those to which we refer under the heading ‘‘Cautionary Statement Concerning Forward-Looking Statements and Risk Factors’’ following Items 1 and 2 ofItem 3—“Legal Proceedings” in Part I of this report; in Item 5—“Market for Registrant’s Common Equity, Related Shareholder Matters and Issuer Purchases of Equity Securities,” Item 7—“Management’s Discussion and Analysis of Financial Condition and Results of Operations,” Item 7A—“Quantitative and Qualitative Disclosures About Market Risk” and in the Notes to Consolidated Financial Statements we have included in Item 8 of Part II of this report; and elsewhere in this report. These forward-looking statements speak only as of the date of this report. We disclaim any obligation to update these statements, and we caution you not to rely on them unduly. We have based these forward-looking statements on our current expectations and assumptions about future events. While our management considers these expectations and assumptions to be reasonable, they are inherently subject to significant business, economic, competitive, regulatory and other risks, contingencies and uncertainties, most of which are difficult to predict and many of which are beyond our control. These risks, contingencies and uncertainties relate to, among other matters, the following:
consolidation in the industry is continuing, the industry is still highly fragmentedOverview of Our Segments and remains very competitive. For a discussion of market conditions in our industry, see “Management’s Discussion and Analysis of Financial Condition and Results of Operations – Market Conditions in Our Industry” in Item 7 of Part II of this report.
Services
Our Strategy
Our goal is to continue to build on our strong market position and reputation as a quality contract drilling company in a way that enhances shareholder value. We intend to accomplish this goal by:
•continuing to own and operate a high-quality fleet of land drilling rigs, primarily in active natural gas drilling markets;
•acquiring high-quality rigs capable of generating our targeted returns on investment;
•positioning ourselves to maximize rig utilization and dayrates;
•training and maintaining high-quality, experienced crews; and
•maintaining the recent improvements in our safety record.
Drilling EquipmentServices Division
General
A land drilling rig consists of engines, a hoisting system, a rotating system, pumps and related equipment to circulate drilling fluid, blowout preventers and related equipment.
Diesel or gas engines are typically the main power sources for a drilling rig. Power requirements for drilling jobs may vary considerably, but most land drilling rigs employ two or more engines to generate between 500 and 2,000 horsepower, depending on well depth and rig design. Most drilling rigs capable of drilling in deep formations, involving depths greater than 15,000 feet, use diesel-electric power units to generate and deliver electric current through cables to electrical switch gears, then to direct-current electric motors attached to the equipment in the hoisting, rotating and circulating systems.
Drilling rigs use long strings of drill pipe and drill collars to drill wells. Drilling rigs are also used to set heavy strings of large-diameter pipe, or casing, inside the borehole. Because the total weight of the drill string and the casing can exceed 500,000 pounds, drilling rigs require significant hoisting and braking capacities. Generally, a drilling rig’s hoisting system is made up of a mast, or derrick, a traveling block and hook assembly that attaches to the rotating system, a mechanism known as the drawworks, a drilling line and ancillary equipment. The drawworks mechanism consists of a revolving drum, around which the drilling line is wound, and a series of shafts, clutches and chain and gear drives for generating speed changes and reverse motion. The drawworks also houses the main brake, which has the capacity to stop and sustain the weights used in the drilling process. When heavy loads are being lowered, a hydraulic or electric auxiliary brake assists the main brake to absorb the great amount of energy developed by the mass of the traveling block, hook assembly, drill pipe, drill collars and drill bit or casing being lowered into the well.
The rotating equipment from top to bottom consists of a top drive or a swivel, the kelly, and kelly bushing, the kelly, the rotary table, drill pipe, drill collars and the drill bit. We refer to the equipment between the top drive or swivel and the drill bit as the drill stem. In a top drive system, the top drive hangs from a hook at the bottom of the traveling block. The top drive has a passageway for drilling mud to get into the drill pipe, and it has a heavy-duty electric motor connected to a threaded drive shaft which connects to and rotates the drill pipe. In a kelly drive system, The swivel assembly sustains the weight of the drill stem, permits its rotation and affords a rotating pressure seal and passageway for circulating drilling fluid into the top of the drill string. The swivel also has a large handle that fits inside the hook assembly at the bottom of the traveling block. Drilling fluid enters the drill stem through a hose, called the rotary hose, attached to the side of the swivel. The kelly is a triangular, square or hexagonal piece of pipe, usually 40 feet long, that transmits torque from the rotary table to the drill stem and permits its vertical movement as it is lowered into the hole. The bottom end of the kelly fits inside a corresponding triangular, square or hexagonal opening in a device called the kelly bushing. The kelly bushing, in turn, fits into a part of the rotary table called the master bushing. As the master bushing rotates, the kelly bushing also rotates, turning the kelly, which rotates the drill pipe and thus the drill bit. Drilling fluid is pumped through the kelly on its way to the bottom. The rotary table, equipped with its master bushing and kelly bushing, supplies the necessary torque to turn the drill stem. The drill pipe and drill collars are both steel tubes through which drilling fluid can be pumped. Drill pipe, sometimes called drill string, comes in 30-foot sections, or joints, with threaded sections on each end. Drill collars are heavier than drill pipe and are also threaded on the ends. Collars are used on the bottom of the drill stem to apply weight to the drilling bit. At the end of the drill stem is the bit, which chews up the formation rock and dislodges it so that drilling fluid can circulate the fragmented material back up to the surface where the circulating system filters it out of the fluid.
Drilling fluid, often called mud, is a mixture of clays, chemicals and water or oil, which is carefully formulated for the particular well being drilled. Drilling mud accounts for a major portion of the cost incurred and equipment and cost ofused in drilling a well. Bulk storage of drilling fluid materials,
2
the pumps and the mud-mixing equipment are placed at the start of the circulating system. Working mud pits and reserve storage are at the other end of the system. Between these two points, the circulating system includes auxiliary equipment for drilling fluid maintenance and equipment for well pressure control. Within the system, the drilling mud is typically
routed from the mud pits to the mud pump and from the mud pump through a standpipe and the rotary hose to the drill stem. The drilling mud travels down the drill stem to the bit, up the annular space between the drill stem and the borehole and through the blowout preventer stack to the return flow line. It then travels to a shale shaker for removal of rock cuttings, and then back to the mud pits, which are usually steel tanks. The reserve pits, usually one or two fairly shallow excavations, are used for waste material and excess water around the location.
In a continuing effort to improve our rig fleet, we have installed top drives in 10 rigs, iron roughnecks in 37 rigs, walking systems in one rig (with three other systems available for installation) and automatic catwalks in two rigs.
There are numerous factors that differentiate land drilling rigs, including their power generation systems and their drilling depth capabilities. The actual drilling depth capability of a rig may be less than or more than its rated depth capability due to numerous factors, including the size, weight and amount of the drill pipe on the rig. The intended well depth and the drill site conditions determine the amount of drill pipe and other equipment needed to drill a well. Generally, land rigs operate with crews of five to six persons.
Our Fleet of Drilling Rigs
As of May 26, 2005, ourdrilling rig fleet consists of 5070 rigs. Not included in our 70 drilling rigs.rig count is a 1500 horsepower rig that we expect to be completed and available for operation in our North Dakota drilling division under a contract with a three year term beginning March 2009. We own all the rigs in our fleet. The following table sets forth information regarding utilizationWith the recent decline in demand for drilling services, as of February 23, 2009, we have 36 drilling rigs operating, 29 drilling rigs are idle and five drilling rigs located in our fleetOklahoma division have been placed in storage or “cold stacked” due to low demand for drilling rigs in this region. We are actively marketing all our idle drilling rigs and we are earning revenues on two of these rigs through early termination fees on these drilling rigs:
| | Years Ended March 31, | |
| | 2005 | | 2004 | | 2003 | | 2002 | | 2001 | | 2000 | |
Average number of rigs for the period | | 40.1 | | 27.3 | | 22.3 | | 18.0 | | 10.5 | | 6.6 | |
Average utilization rate | | 96 | % | 88 | % | 79 | % | 82 | % | 91 | % | 66 | % |
contracts with terms expiring in March 2009 and May 2009.
The following table sets forth historical information regarding utilization for our drilling rig fleet:
Rig
Number | | Rig Design | | Approximate
Drilling Depth
Capability
(feet) | | Current Location | | Type | | Horsepower | |
| | | | | | | | | | | |
1 | | Cabot 750E | | 9,500 | | South Texas | | Electric | | 750 | |
2 | | Cabot 750E | | 9,500 | | South Texas | | Electric | | 750 | |
3 | | National 110 UE | | 18,000 | | South Texas | | Electric | | 1,500 | |
4 | | RMI 1000 E | | 15,000 | | South Texas | | Electric | | 1,000 | |
5 | | Brewster N-46 | | 12,000 | | North Texas | | Mechanical | | 1,000 | |
6 | | Brewster DH-4610 | | 13,000 | | East Texas | | Mechanical | | 750 | |
7 | | National 110 UE | | 18,000 | | South Texas | | Electric | | 1,500 | |
8 | | National 110 UE | | 18,000 | | East Texas | | Electric | | 1,500 | |
9 | | Gardner-denver 500 | | 11,000 | | East Texas | | Mechanical | | 700 | |
10 | | Brewster N-46 | | 12,000 | | East Texas | | Mechanical | | 1,000 | |
11 | | Brewster N-46 | | 12,000 | | South Texas | | Mechanical | | 1,000 | |
12 | | IRI Cabot 900 | | 10,500 | | South Texas | | Mechanical | | 900 | |
14 | | Brewster N-46 | | 12,000 | | South Texas | | Mechanical | | 1,000 | |
15 | | Cabot 750 | | 9,500 | | South Texas | | Mechanical | | 750 | |
16 | | Cabot 750 | | 9,500 | | South Texas | | Mechanical | | 750 | |
17 | | Ideco 725 | | 12,000 | | East Texas | | Mechanical | | 800 | |
18 | | Brewster N-75 | | 12,000 | | East Texas | | Mechanical | | 1,000 | |
19 | | Brewster N-75 | | 12,000 | | East Texas | | Mechanical | | 1,000 | |
20 | | BDW 800 | | 13,500 | | East Texas | | Mechanical | | 1,000 | |
21 | | National 110 UE | | 18,000 | | South Texas | | Electric | | 1,500 | |
22 | | Ideco 725 | | 12,000 | | East Texas | | Mechanical | | 800 | |
23 | | Ideco 725 | | 12,000 | | North Texas | | Mechanical | | 800 | |
24 | | National 110 UE | | 18,000 | | South Texas | | Electric | | 1,500 | |
25 | | National 110 UE | | 18,000 | | East Texas | | Electric | | 1,500 | |
26 | | Oilwell 840 E | | 18,000 | | South Texas | | Electric | | 1,500 | |
27 | | IRI Cabot 1200 M | | 13,500 | | South Texas | | Mechanical | | 1,300 | |
28 | | Oilwell 760 E | | 15,000 | | South Texas | | Electric | | 1,000 | |
29 | | Brewster N-46 | | 12,000 | | North Texas | | Mechanical | | 1,000 | |
30 | | Mid Cont U36A | | 11,000 | | North Texas | | Mechanical | | 750 | |
3
Rig
Number | | Rig Design | | Approximate
Drilling Depth
Capability
(feet) | | Current Location | | Type | | Horsepower | |
| | | | | | | | | | | |
31 | | Brewster N-7 | | 11,500 | | East Texas | | Mechanical | | 750 | |
32 | | Brewster N-75 | | 13,500 | | East Texas | | Mechanical | | 1,000 | |
33 | | Brewster N-95 | | 13,500 | | East Texas | | Mechanical | | 1,200 | |
34 | | All-Rig 900 | | 12,000 | | East Texas | | Mechanical | | 900 | |
35 | | RMI 1000 | | 13,500 | | East Texas | | Mechanical | | 1,000 | |
36 | | Brewster N-7 | | 11,500 | | East Texas | | Mechanical | | 750 | |
37 | | Brewster N-95 | | 13,500 | | East Texas | | Mechanical | | 1,200 | |
38 | | Ideco H-1000 E | | 11,000 | | Utah | | Electric | | 1,000 | |
39 | | National 370 | | 7,500 | | North Dakota | | Mechanical | | 550 | |
40 | | National 370 | | 8,500 | | North Dakota | | Mechanical | | 550 | |
41 | | National 610 | | 11,000 | | Utah | | Mechanical | | 750 | |
42 | | Brewster N-46 | | 12,500 | | North Dakota | | Mechanical | | 1,000 | |
43 | | National 610 | | 11,000 | | North Dakota | | Mechanical | | 750 | |
44 | | National 80B | | 15,000 | | North Dakota | | Mechanical | | 1,000 | |
45 | | Brewster N-4 | | 7,500 | | North Dakota | | Mechanical | | 500 | |
46 | | RMI 550 | | 9,000 | | Oklahoma | | Mechanical | | 550 | |
47 | | Ideco 525 | | 8,000 | | Oklahoma | | Mechanical | | 600 | |
48 | | National 370 | | 8,500 | | Oklahoma | | Mechanical | | 550 | |
49 | | Ideco 525 | | 9,000 | | Oklahoma | | Mechanical | | 600 | |
50 | | Ideco 725 | | 11,000 | | Oklahoma | | Mechanical | | 800 | |
54 | | RMI 1000 | | 14,000 | | Utah | | Mechanical | | 1,000 | |
As of May 20, 2005, we owned a fleet of 58 trucks and related transportation equipment that we use to transport our drilling rigs to and from drilling sites. By owning our own trucks, we reduce the cost of rig moves and reduce downtime between rig moves.
| | | | | | | | | | | | | | | | | | |
| | | Year
Ended
December 31, | | | Nine
Months
Ended
December 31, | | | Years ended March 31, | |
| | | 2008 | | | 2007 | | | 2007 | | | 2006 | | | 2005 | | | 2004 | |
Average number of operating rigs for the period | | 67.4 | | | 66.7 | | | 60.8 | | | 52.3 | | | 40.1 | | | 27.3 | |
Average utilization rate | | 89 | % | | 89 | % | | 95 | % | | 95 | % | | 96 | % | | 88 | % |
We believe that our drilling rigs and other related equipment are in good operating condition. Our employees perform periodic maintenance and minor repair work on our drilling rigs. We rely on various oilfield service companies for major repair work and overhaul of our drilling equipment when needed. We also engage in periodic improvement of our drilling equipment. In the event of major breakdowns or mechanical problems, our rigs could be subject to significant idle time and a resulting loss of revenue if the necessary repair services are not immediately available.
Drilling Contracts
As of February 6, 2009, we owned a fleet of 80 trucks and related transportation equipment that we use to transport our drilling rigs to and from drilling sites. By owning our own trucks, we reduce the cost of rig moves and reduce downtime between rig moves.
As a provider of contract land drilling services, our business and the profitability of our operations depend on the level of drilling activity by oil and gas exploration and production companies operating in the geographic markets where we operate. The oil and gas exploration and production industry is a historically cyclical industry characterized by significant changes in the levels of exploration and development activities. During periods of lower levels ofreduced drilling activity or excess rig capacity, price competition tends to increase and results in decreases in the profitability of daywork contracts.contracts tends to decrease. In this lower level drilling activity and competitive price environment, we may be more inclined to enter into turnkey and footage contracts that expose us to greater risk of loss without commensurate increases in potential contract profitability.
We obtain our contracts for drilling oil and gas wells either through competitive bidding or through direct negotiations with customers. Our drilling contracts generally provide for compensation on either a daywork, turnkey or footage basis. The contract terms we offer generally depend on the complexity and risk of operations, the on-site drilling conditions, the type of equipment used and the anticipated duration of the work to be performed. Generally, our contracts provide for the drilling of a single well and typically permit the customer to terminate on short notice, usually on paymentnotice. However, we have entered into more longer-term drilling contracts during periods of an agreed fee.
4
high rig demand. In addition, we generally construct new drilling rigs once we have entered into longer-term drilling contracts for such rigs. As of February 6, 2009, we had 27 contracts with terms of six months to three years in duration, of which 18 will expire by August 6, 2009, six have a remaining term of six to 12 months, one has a remaining term of 12 to 18 months and two have a remaining term in excess of 18 months.
The following table presents, by type of contract, information about the total number of wells we completed for our customers during each of the last three fiscal years.
| | Year Ended March 31, | | | | | | | |
| | 2005 | | 2004 | | 2003 | | |
Type of Contract | | | Year
Ended
December 31,
2008 | | Nine
Months
Ended
December 31,
2007 | | Year
Ended
March 31,
2007 |
Daywork | | 264 | | 205 | | 119 | | | 828 | | 606 | | 742 |
Turnkey | | 134 | | 92 | | 78 | | | 10 | | 5 | | 2 |
Footage | | 48 | | 13 | | 5 | | | 71 | | 66 | | 60 |
| | | | | | | |
Total number of wells | | 446 | | 310 | | 202 | | | 909 | | 677 | | 804 |
| | | | | | | |
Daywork Contracts. Under daywork drilling contracts, we provide a drilling rig withand required personnel to our customer who supervises the drilling of the well. We are paid based on a negotiated fixed rate per day while the rig is used. Daywork drilling contracts specify the equipment to be used, the size of the hole and the depth of the well. Under a daywork drilling contract, the customer bears a large portion of the out-of-pocket drilling costs and we generally bear no part of the usual risks associated with drilling, such as time delays and unanticipated costs.
Turnkey Contracts.Under a turnkey contract, we agree to drill a well for our customer to a specified depth and under specified conditions for a fixed price, regardless of the time required or the problems encountered in drilling the well. We provide technical expertise and engineering services, as well as most of the equipment and drilling supplies required to drill the well. We often subcontract for related services, such as the provision of casing crews, cementing and well logging. Under typical turnkey drilling arrangements, we do not receive progress payments and are paid by our customer only after we have performed the terms of the drilling contract in full.
The risks to us under a turnkey contract are substantially greater than on a well drilled on a daywork basis. This is primarily because under a turnkey contract we assume most of the risks associated with drilling operations generally assumed by the operator in a daywork contract, including the risk of blowout, loss of hole, stuck drill pipe, machinery breakdowns, abnormal drilling conditions and risks associated with subcontractors’ services, supplies, cost escalations and personnel. We employ or contract for engineering expertise to analyze seismic, geologic and drilling data to identify and reduce some of the drilling risks we assume. We use the results of this analysis to evaluate the risks of a proposed contract and seek to account for such risks in our bid preparation. We believe that our operating experience, qualified drilling personnel, risk management program, internal engineering expertise and access to proficient third-party engineering contractors have allowed us to reduce some of the risks inherent in turnkey drilling operations. We also maintain insurance coverage against some, but not all, drilling hazards. However, the occurrence of uninsured or under-insured losses or operating cost overruns on our turnkey jobs could have a material adverse effect on our financial position and results of operations.
Footage Contracts. Under footage contracts, we are paid a fixed amount for each foot drilled, regardless of the time required or the problems encountered in drilling the well. We typically pay more of the out-of-pocket costs associated with footage contracts as compared to daywork contracts. Similar to a turnkey contract, the risks to us on a footage contract are greater because we assume most of the risks associated with drilling operations generally assumed by the operator in a daywork contract, including the risk of blowout, loss of hole, stuck drill pipe, machinery breakdowns, abnormal drilling conditions and risks associated with subcontractors’ services, supplies, cost escalation and personnel. As with turnkey contracts, we manage this additional risk through the use of engineering expertise and bid the footage contracts accordingly, and we maintain insurance coverage against some, but not all, drilling hazards.accordingly. However, the occurrence of uninsured or under-insured losses or operating cost overruns on our footage jobs could have a material adverse effect on our financial position and results of operations.
Production Services Division
5
Well Services. We provide rig-based well services, including maintenance of existing wells, workover of existing wells, completion of newly-drilled wells, and plugging and abandonment of wells at the end of their useful lives.
CustomersRegular maintenance is generally required throughout the life of a well to sustain optimal levels of oil and Marketinggas production. We believe regular maintenance comprises the largest portion of our work in this business segment. Common maintenance services include repairing inoperable pumping equipment in an oil well and replacing defective tubing in a gas well. Our maintenance services involve relatively low-cost, short-duration jobs which are part of normal well operating costs. The need for maintenance does not directly depend on the level of drilling activity, although it is somewhat impacted by short-term fluctuations in oil and gas prices. Accordingly, maintenance services generally experience relatively stable demand; however, when oil or gas prices are too low to justify additional expenditures, operating companies may choose to temporarily shut in producing wells rather than incur additional maintenance costs.
In addition to periodic maintenance, producing oil and gas wells occasionally require major repairs or modifications called workovers, which are typically more complex and more time consuming than maintenance operations. Workover services include extensions of existing wells to drain new formations either through perforating the well casing to expose additional productive zones not previously produced, deepening well bores to new zones or the drilling of lateral well bores to improve reservoir drainage patterns. Our workover rigs are also used to convert former producing wells to injection wells through which water or carbon dioxide is then pumped into the formation for enhanced oil recovery operations. Workovers also include major subsurface repairs such as repair or replacement of well casing, recovery or replacement of tubing and removal of foreign objects from the well bore. These extensive workover operations are normally performed by a workover rig with additional specialized auxiliary equipment, which may include rotary drilling equipment, mud pumps, mud tanks and fishing tools, depending upon the particular type of workover operation. All of our well servicing rigs are designed to perform complex workover operations. A workover may require a few days to several weeks and generally requires additional auxiliary equipment. The demand for workover services is sensitive to oil and gas producers’ intermediate and long-term expectations for oil and gas prices.
We market our rigs to a numberCompletion services involve the preparation of customers. In fiscal 2005, wenewly drilled wells for 102 differentproduction. The completion process may involve selectively perforating the well casing in the productive zones to allow oil or gas to flow into the well bore, stimulating and testing these zones and installing the production string and other downhole equipment. We provide well service rigs to assist in this completion process. Newly drilled wells are frequently completed by well servicing rigs to minimize the use of higher cost drilling rigs in the completion process. The completion process typically requires a few days to several weeks, depending on the nature and type of the completion, and generally requires additional auxiliary equipment. Accordingly, completion services require less well-to-well mobilization of equipment and generally provide higher operating margins than regular maintenance work. The demand for completion services is directly related to drilling activity levels, which are sensitive to changes in oil and gas prices.
Well servicing rigs are also used in the process of permanently closing oil and gas wells no longer capable of producing in economic quantities. Many well operators bid this work on a “turnkey” basis, requiring the service company to perform the entire job, including the sale or disposal of equipment salvaged from the well as part of the compensation received, and complying with state regulatory requirements. Plugging and abandonment work can provide favorable operating margins and is less sensitive to oil and gas pricing than drilling and workover activity since well operators must plug a well in accordance with state regulations when it is no longer productive. We perform plugging and abandonment work throughout our core areas of operation in conjunction with equipment provided by other service companies.
When we provide well services, we typically bill customers comparedon an hourly basis during the period that the rig providing services is actively working. As of December 31, 2008, our fleet of well service rigs totaled 74 rigs. These rigs are located mostly in Texas, serving the Gulf Coast and ArkLaTex regions, though we also have five rigs in Louisiana and four rigs in North Dakota. We estimate that approximately 20% of our rigs are located in predominantly oil regions while 80% of our rigs are located in predominantly natural gas regions. Our fleet is one of the youngest in the industry, consisting primarily of premium, 550 HP rigs capable of working at depths of 20,000 feet.
Wireline Services. We provide both open and cased-hole wireline services with our fleet of 59 wireline trucks. We provide these services in Texas, Kansas, Colorado, Utah, Montana, and North Dakota. Wireline services typically utilize a single truck equipped with a spool of wireline that is used to 83lower and raise a variety of specialized tools in and out of the wellbore. These tools can be used to measure pressures and temperatures as well as the condition of the casing and the cement that holds the casing in place. Other applications for wireline tools include placing equipment in or retrieving equipment from the wellbore, or perforating the casing and cutting off pipe that is stuck in the well so that the free section can be recovered. Electric wireline contains a conduit that allows signals to be transmitted to or from tools located in the well. Wireline trucks are often used in place of a well servicing rig when there is no requirement to remove tubulars from the well in order to make repairs. Wireline trucks, like well servicing rigs, are utilized throughout the life of a well.
Fishing and Rental Services. Our rental and fishing tool business provides a range of specialized services and equipment that are utilized on a non-routine basis for both drilling and well servicing operations. Drilling and well servicing rigs are equipped with a complement of tools to complete routine operations under normal conditions for most projects in the geographic area where they are employed. When downhole problems develop with drilling or servicing operations, or conditions require non-routine equipment, our customers will usually rely on a provider of rental and fishing tools to augment equipment that is provided with a typical drilling or well servicing rig package. The important rental tools that we offer include air drilling equipment, foam units, power swivels, and blowout preventers.
The term “fishing” applies to a wide variety of downhole operations designed to correct a problem that has developed when drilling or servicing a well. Often, the problem involves equipment that has become lodged in fiscal 2004the well and 64cannot be removed without special equipment. Our customers employ our technicians and our tools that are specifically suited to retrieve the trapped equipment, or “fish,” in fiscal 2003.order for operations to resume.
Our Production Services operations are impacted by seasonal factors. Our business can be negatively impacted during the winter months due to inclement weather, fewer daylight hours, and holidays. Because our well service rigs and wireline units are mobile, during periods of heavy snow, ice or rain, we may not be able to move our equipment between locations.
Customers
We provide drilling services and production services to numerous major and independent oil and gas companies that are active in the geographic areas in which we operate. The following table shows our three largest customers as a percentage of our total contract drilling revenue for each of our last three fiscal years.
Customer
|
| Total
Contract
Drilling
Revenue
Percentage
|
|
Fiscal 2005Customer
| | Total
Revenue
Percentage | |
Chinn ExplorationFiscal Year Ended December 31, 2008:
| | 7
| %
|
Goodrich Petroleum Corp.EOG Resources, Inc.
| | 5
10.0 | % |
Medicine Bow EnergyEcopetrol
| | 7.4 | % |
Anadarko Petroleum Corporation | | 5
6.4 | % |
| |
Nine Months Ended December 31, 2007: | | | |
Fiscal 2004EOG Resources, Inc.
| | 13.1 | % |
Chinn ExplorationAnadarko Petroleum Corporation
| | 11
8.8 | % |
DaleChesapeake Operating CompanyInc.
| | 6
7.7 | % |
| |
Medicine Bow EnergyFiscal Year Ended March 31, 2007:
| | | |
EOG Resources, Inc. | | 9.7 | % |
Chesapeake Operating Inc. | | 9.1 | % |
Anadarko Petroleum Corporation | | 5
6.1 | % |
| | | |
Fiscal 2003
| | | |
Gulf Coast Energy Associates
| | 11
| %
|
Apache Corporation
| | 7
| %
|
Suemaur Exploration & Production, L.L.C.
| | 5
| %
|
Competition
We primarily market our drilling rigs through employee marketing representatives. These marketing representatives use personal contacts and industry periodicals and publications to determine which operators are planning to drill oil and gas wells in the near future in our market areas. Once we have been placed on the “bid list” for an operator, we will typically be given the opportunity to bid on most future wells for that operator in the areas in which we operate. Our rigs are typically contracted on a well-by-well basis.
From time to time we also enter into informal, nonbinding commitments with our customers to provide drilling rigs for future periods at specified rates plus fuel and mobilization charges, if applicable, and escalation provisions. This practice is customary in the contract land drilling services business during times of tightening rig supply. We currently have thirteen contracts of six months to two years in duration, including the contracts for the two rigs currently under construction.
CompetitionDrilling Services Division
We encounter substantial competition from other drilling contractors. Our primary market areas are highly fragmented and competitive. The fact that drilling rigs are mobile and can be moved from one market to another in response to market conditions heightens the competition in the industry.
The drilling contracts we compete for are usually awarded on the basis of competitive bids. Our principal competitors are Grey Wolf, Inc., Helmerich & Payne, Inc., Precision Drilling Trust, Patterson-UTI Energy, Inc. and Nabors Industries, Inc. and Patterson-UTI Energy, Inc. We believeIn addition to pricing and rig availability, are the primary factors our potential customers consider in determining which drilling contractor to select. In addition, we believe the following factors are also important:important to our customers in determining which drilling contractors to select:
•the type and condition of each of the competing drilling rigs;
•the mobility and efficiency of the rigs;
•the quality of service and experience of the rig crews;
•the safety records of the rigs;
•the offering of ancillary services; and
•the ability to provide drilling equipment adaptable to, and personnel familiar with, new technologies and drilling techniques.
6
While we must be competitive in our pricing, our competitive strategy generally emphasizes the quality of our equipment, the safety record of our rigs and the experience of our rig crews to differentiate us from our competitors.
Contract drilling companies compete primarily on a regional basis, and the intensity of competition may vary significantly from region to region at any particular time. If demand for drilling services improves in a region where we operate, our competitors might respond by moving in suitable rigs from other regions. An influx of rigs from other regions could rapidly intensify competition and make any improvement in demand for drilling rigs in a particular region short-lived.
Many of our competitors have greater financial, technical and other resources than we do. Their greater capabilities in these areas may enable them to:
•better withstand industry downturns;
•compete more effectively on the basis of price and technology;
•better retain skilled rig personnel; and
•build new rigs or acquire and refurbish existing rigs so as to be able to place rigs into service more quickly than us in periods of high drilling demand.
Production Services Division
The market for production services is highly competitive. Competition is influenced by such factors as price, capacity, availability of work crews, type and condition of equipment and reputation and experience of the service provider. We believe that an important competitive factor in establishing and maintaining long-term customer relationships is having an experienced, skilled and well-trained work force. In recent years, many of our larger customers have placed increased emphasis on the safety performance and quality of the crews, equipment and services provided by their contractors. We have devoted, and will continue to devote, substantial resources toward employee safety and training programs. Although we believe customers consider all of these factors, price is generally the primary factor in determining which service provider is awarded the work. However, we believe that most customers are willing to pay a slight premium for the quality and efficient service we provide.
The largest well service providers that we compete with are Key Energy Services, Basic Energy Services, Nabors Industries, Complete Production Services and CC Forbes. In addition, there are numerous smaller companies that compete in our well service markets.
The wireline market is dominated by Schlumberger Ltd. and Halliburton Company. These companies have a substantially larger asset base than Pioneer and operate in all major U.S. oil and natural gas producing basins. Other competitors include Weatherford International, Baker Atlas, Superior Energy Services, Basic Energy Services, and Key Energy Services. The market for wireline services is very competitive, but historically we have competed effectively with our competitors based on performance and strong customer service.
The fishing and rental tools market is fragmented compared to our other product lines. Companies which provide fishing services generally compete based on the reputation of their fishing tool operators and their relationships with customers. Competition for rental tools is sometimes based on price; however, in most cases, when a customer chooses a specific fishing tool operator for a particular job, then the necessary rental equipment will be part of that job as well. Our primary competitors include: Baker Oil Tools, Weatherford International, Basic Energy Services, Key Energy Services, Quail Tools (owned by Parker Drilling) and Knight Oil Tools.
The need for well servicing, wireline, and fishing and rental services fluctuates, primarily, in relation to the price (or anticipated price) of oil and natural gas, which, in turn, is driven by the supply of and demand for oil and natural gas. Generally, as supply of those commodities decreases and demand increases, service and maintenance requirements increase as oil and natural gas producers attempt to maximize the productivity of their wells in a higher priced environment.
The level of our revenues, earnings and cash flows are substantially dependent upon, and affected by, the level of domestic and international oil and gas exploration and development activity, as well as the equipment capacity in any particular region. For a more detailed discussion, see Item 7. “Management’s Discussion and Analysis of Financial Condition and Results of Operations.”
Raw Materials
The materials and supplies we use in our drilling and production services operations include fuels to operate our drilling and well service equipment, drilling mud, drill pipe, drill collars, drill bits and cement. We do not rely on a single source of supply for any of these items. While we are not currently experiencing any shortages, from time to time there have been shortages of drilling equipment and supplies during periods of high demand. Shortages could result in increased prices for drilling equipment or supplies that we may be unable to pass on to customers. In addition, during periods of shortages, the delivery times for equipment and supplies can be substantially longer. Any significant delays in our obtaining drilling equipment or supplies could limit drilling operations and jeopardize our relations with customers. In addition, shortages of drilling equipment or supplies could delay and adversely affect our ability to obtain new contracts for our rigs, which could have a material adverse effect on our financial condition and results of operations.
Operating Risks and Insurance
Our operations are subject to the many hazards inherent in the contract land drilling business, including the risks of:
•collapse of the borehole;
•lost or stuck drill strings; and
•damage or loss from natural disasters.
Any of these hazards can result in substantial liabilities or losses to us from, among other things:
•suspension of drilling operations;
•damage to, or destruction of, our property and equipment and that of others;
•personal injury and loss of life;
•damage to producing or potentially productive oil and gas formations through which we drill; and
We seek to protect ourselves from some but not all operating hazards through insurance coverage. However, some risks are either not insurable or insurance is available only at rates that we consider uneconomical. Those risks include pollution liability in excess of relatively low limits. Depending on competitive conditions and other factors, we attempt to obtain contractual protection against uninsured operating risks from our customers. However, customers who provide contractual indemnification protection may not in all cases maintain adequate insurance to support their indemnification obligations. We can offer no assurance that our insurance or indemnification arrangements will adequately protect us against liability or loss from all the hazards of our operations. The occurrence of a significant event that we have not fully insured or indemnified against or the failure of a customer to meet its indemnification obligations to us could materially
7
and adversely affect our results of operations and financial condition. Furthermore, we may not be able to maintain adequate insurance in the future at rates we consider reasonable.
Our current insurance coverage includes property insurance on our rigs, drilling equipment and real property. Our insurance coverage for property damage to our rigs and to our drilling equipment is based on our estimate, as of October 2005,estimates of the cost of comparable used equipment to replace the insured property. The policy provides for a deductible on rigs of $100,000$250,000 per occurrence.occurrence ($500,000 deductible for rigs with an insured value greater than $10 million). Our third-party liability insurance coverage is $26$51 million per occurrence and in the aggregate, with a deductible of $260,000 per occurrence. We believe that we are adequately insured for public liability and property damage to others with respect to our operations. However, such insurance may not be sufficient to protect us against liability for all consequences of well disasters, extensive fire damage or damage to the environment.
In addition, we generally carry insurance coverage to protect against certain hazards inherent in our turnkey and footage contract drilling operations. This insurance covers “control-of-well,” including blowouts above and below the surface, redrilling, seepage and pollution. This policy provides coverage of $3 million, $5 million, $10 million, $15 million or $10$20 million depending on the area in which the well is drilled and its target depth.depth, subject to a deductible of the greater of 15% of the well’s anticipated dry hole cost or $150,000. This policy also provides care, custody and control insurance, with a limit of $250,000.$1 million, subject to a $100,000 deductible.
Employees
We currently have approximately 1,3701,952 employees. Approximately 186247 of these employees are salaried administrative or supervisory employees. The rest of our employees are hourly employees who operate or maintainworking in operations for our drilling rigsDrilling Services Division and rig-hauling trucks.Production Services Division. The number of hourly employees fluctuates depending on the numberutilization of our drilling projects we are engaged inrigs, workover rigs and wireline units at any particular time. None of our employment arrangements are subject to collective bargaining arrangements.
Our operations require the services of employees having the technical training and experience necessary to obtain the proper operational results.standards. As a result, our operations depend, to a considerable extent, on the continuing availability of such personnel. Although we have not encountered material difficulty in hiring and retaining qualified rig crews,employees in our operations, shortages of qualified personnel are occurringhave occurred in our industry. If we should suffer any material loss of personnel to competitors or be unable to employ additional or replacement personnel with the requisite level of training and experience to adequately operate our equipment, our operations could be materially and adversely affected. While we believe our wage rates are competitive and our relationships with our employees are satisfactory, a significant increase in the wages paid by other employers could result in a reduction in our workforce, increases in wage rates, or both. The occurrence of either of these events for a significant period of time could have a material and adverse effect on our financial condition and results of operations.
Facilities
8
Facilities
We own our headquarters building inOur corporate office facilities are located at 1250 N.E. Loop 410, Suite 1000 San Antonio, Texas 78209 and are leased with costs escalating from $26,809 per month to $29,316 per month with a non-cancelable lease term expiring in December 2013. We conduct our office buildingbusiness operations through 40 real estate locations in Kenmare,the United States (Texas, Oklahoma, Colorado, Utah, North Dakota. We also own:
•a 15-acreDakota and Kansas) and internationally in Colombia. These real estate locations are primarily used for division office, rigoffices and storage and maintenance yard in Corpus Christi, Texas;
•a six-acre division office, storageyards. We own 10 of these real estate locations and maintenance yard in Henderson, Texas;
•a 4-acre trucking department office, storage and maintenance yard in Kilgore, Texas;
•a 17-acre rig storage and maintenance yard in Woodward, Oklahoma; and
•a 4.7-acre division rig storage and maintenance yard in Kenmare, North Dakota.
We lease:
•a 43-acre division office and storage yard in Decatur, Texas, at a cost of $800the remaining 30 real estate locations are leased with costs ranging from $175 per month pursuant to a lease extending through September 2006;
•a trucking department office, storage and maintenance yard in Alice, Texas, at a cost of $4,500$8,917 per month pursuant to awith non-cancelable lease extendingterms expiring through July 2006;April 2013.
•a division office in Denver, Colorado, at a cost of $1,210 per month, pursuant to a lease extending through June 2005;
•a yard office in Kenmare, North Dakota, at a cost of $700 per month, pursuant to a lease extending through March 31, 2006; and
•part of a 2.2-acre division office and storage yard in Vernal, Utah, at a cost of $2,000 per month, pursuant to a lease extending through October 2005.
In four to six months, we will take over the entire division office and storage yard in Vernal, Utah and will enter into a two year lease at a cost of $6,000 per month.
In July 2005, we will be moving our corporate headquarters to new office space in San Antonio, Texas. We have entered into a 102-month lease with monthly payments of approximately $12,300 for the first two years increasing to an average of approximately $20,000 per month thereafter. We plan to sell our current corporate headquarters building in San Antonio, Texas.
Governmental Regulation
Our operations are subject to stringent laws and regulations relating to containment, disposal and controlling the discharge of hazardous oilfield waste and other non-hazardous waste material into the environment, requiring removal and cleanup under certain circumstances, or otherwise relating to the protection of the environment. In addition, our operations are often conducted in or near ecologically sensitive areas, such as wetlands, which are
subject to special protective measures and which may expose us to additional operating costs and liabilities for accidental discharges of oil, natural gas, drilling fluids or contaminated water, or for noncompliance with other aspects of applicable laws. We are also subject to the requirements of the federal Occupational Safety and Health Act (“OSHA”) and comparable state statutes. The OSHA hazard communication standard, the Environmental Protection Agency “community right-to-know” regulations under Title III of the Federal Superfund Amendment and Reauthorization Act and comparable state statutes require us to organize and report information about the hazardous materials we use in our operations to employees, state and local government authorities and local citizens.
Environmental laws and regulations are complex and subject to frequent change. In some cases, they can impose liability for the entire cost of cleanup on any responsible party, without regard to negligence or fault, and can impose liability on us for the conduct of others or conditions others have caused, or for our acts that complied with all applicable requirements when we performed them. We may also be exposed to environmental or other liabilities originating from businesses and assets that we purchased from others. Compliance with applicable environmental laws and regulations has not, to date, materially affected our capital expenditures, earnings or competitive position, although compliance measures have added to our costs of operating drilling equipment in some instances. We do not expect to incur material capital expenditures in our next fiscal year in order to comply with current environment control regulations. However, our compliance with amended, new or more stringent requirements, stricter interpretations of existing requirements or the future discovery of contamination may require us to make material expenditures or subject us to liabilities that we currently do not anticipate.
9
In addition, our business depends on the demand for land drilling services from the oil and gas industry and, therefore, is affected by tax, environmental and other laws relating to the oil and gas industry generally, by changes in those laws and by changes in related administrative regulations. It is possible that these laws and regulations may in the future add significantly to our operating costs or those of our customers, or otherwise directly or indirectly affect our operations.
Our wireline operations involve the use of radioactive isotopes along with other nuclear, electrical, acoustic, and mechanical devices. Our activities involving the use of isotopes are regulated by the U.S. Nuclear Regulatory Commission and specified agencies of certain states. Additionally, we use high explosive charges for perforating casing and formations, and we use various explosive cutters to assist in wellbore cleanout. Such operations are regulated by the U.S. Department of Justice, Bureau of Alcohol, Tobacco, Firearms, and Explosives and require us to obtain licenses or other approvals for the use of densitometers as well as explosive charges. We have obtained these licenses and approvals when necessary and believe that we are in substantial compliance with these federal requirements.
Among the services we provide, we operate as a motor carrier and therefore are subject to regulation by the U.S. Department of Transportation and by various state agencies. These regulatory authorities exercise broad powers, governing activities such as the authorization to engage in motor carrier operations and regulatory safety. There are additional regulations specifically relating to the trucking industry, including testing and specification of equipment and product handling requirements. The trucking industry is subject to possible regulatory and legislative changes that may affect the economics of the industry by requiring changes in operating practices or by changing the demand for common or contract carrier services or the cost of providing truckload services. Some of these possible changes include increasingly stringent environmental regulations, changes in the hours of service regulations which govern the amount of time a driver may drive in any specific period, onboard black box recorder devices or limits on vehicle weight and size.
Interstate motor carrier operations are subject to safety requirements prescribed by the U.S. Department of Transportation. To a large degree, intrastate motor carrier operations are subject to state safety regulations that mirror federal regulations. Such matters as weight and dimension of equipment are also subject to federal and state regulations.
From time to time, various legislative proposals are introduced, including proposals to increase federal, state, or local taxes, including taxes on motor fuels, which may increase our costs or adversely impact the recruitment of drivers. We cannot predict whether, or in what form, any increase in such taxes applicable to us will be enacted.
Available Information
Our websiteWeb site address is www.pioneerdrlg.com. We make available on this website under “Investor Relations-SEC Filings,” free of charge, ourwww.pioneerdrlg.com. Our annual reports on Form 10-K, quarterly reports on Form 10-Q, current reports on Form 8-K and amendments to those reports, are available free of charge through our Website as soon as reasonably practicable after we electronically file those materials with, or furnish those materials to, the SEC.Securities and Exchange Commission. The public may read and copy these materials at the Securities and Exchange Commission’s Public Reference Room at 100 F Street, N.E., Washington, DC 20549. For additional information on the Securities and Exchange Commission’s Public Reference Room, please call 1-800-SEC-0330. In addition, the Securities and Exchange Commission maintains an Internet site atwww.sec.gov that contains reports, proxy and information statements and other information regarding issuers that file electronically. We have also posted on our Web site our: Charters for the Audit, Compensation, and Nominating and Corporate Governance Committees of our Board; Code of Conduct and Ethics; Rules of Conduct; and Company Contact Information.
CAUTIONARY STATEMENT CONCERNING FORWARD-LOOKING STATEMENTS AND RISK FACTORS
We are includingThe information set forth in this Item 1A should be read in conjunction with the following discussion to inform our existing and potential security holders generally of somerest of the risks and uncertainties that can affect our company and to take advantage of the “safe harbor” protection for forward-looking statements that applicable federal securities law affords.
From time to time, our management or persons acting on our behalf make forward-looking statements to inform existing and potential security holders about our company. These statements may include projections and estimates concerning the timing and success of specific projects and our future backlog, revenues, income and capital spending. Forward-looking statements are generally accompanied by words such as “estimate,” “project,” “predict,” “believe,” “expect,” “anticipate,” “plan,” “intend,” “seek,” “will,” “should,” “goal” or other words that convey the uncertainty of future events or outcomes. These forward-looking statements speak only as of the date on which they are first made, which in the case of forward-looking statements madeinformation included in this report, is the date of this report. Sometimes we will specifically describe a statement as being a forward-looking statement and refer to this cautionary statement.
In addition, various statements that this Annual Report on Form 10-K contains, including those that express a belief, expectation or intention, as well as those that are not statements of historical fact, are forward-looking statements. Those forward-looking statements appear in Items 1 and 2 – “Business and Properties” and Item 3 – “Legal Proceedings” in Part I of this report and in Item 5 – “Market for Registrant’s Common Equity, Related Stockholder Matters and Issuer Purchases of Equity Securities,” and in Item 7 – “Management’s Discussion and Analysis of Financial Condition and Results of Operations,” Item 7A – “Quantitative and Qualitative Disclosures About Market Risk” and in the Notes to Consolidated Financial Statements we have includedOperations” in Item 8 of Part II of7 the historical financial statements and related notes this report contains. While we attempt to identify, manage and elsewhere in this report. These forward-looking statements speak only as of the date of this report. We disclaim any obligation to update these statements, and we caution you not to rely on them unduly. We have based these forward-looking statements on our current expectations and assumptions about future events. While our management considers these expectations and assumptions to be reasonable, they are inherently subject to significant business, economic, competitive, regulatory and othermitigate risks contingencies and uncertainties mostassociated with our business to the extent practical under the circumstances, some level of which are difficult to predictrisk and many of which are beyond our control. Theseuncertainty will always be present. Additional risks contingencies and uncertainties relatenot presently known to among other matters, the following:us or that we currently believe are immaterial also may negatively impact our business, financial condition or operating results.
•general economicSet forth below are various risks and business conditions and industry trends;
•the continued strength of the contract land drilling industry in the geographic areas where we operate;
•levels and volatility of oil and gas prices;
•decisions about onshore exploration and development projects to be made by oil and gas companies;
•the highly competitive nature of our business;
•the success or failure of our acquisition strategy, including our ability to finance acquisitions and manage growth;
•our future financial performance, including availability, terms and deployment of capital;
•the continued availability of qualified personnel; and
•changes in, or our failure or inability to comply with, governmental regulations, including those relating to the environment.
We believe the items we have outlined above are important factorsuncertainties that could causeadversely impact our actual results to differ materially from those expressed in a forward-looking statement contained in this report or elsewhere. We have discussed many of these factors in more detail elsewhere in this report. These factors are not necessarily all the important factors that could affect us. Unpredictable or unknown factors we have not discussed in this report could also have material adverse effects on actualbusiness, financial condition, results of matters that are the subject of our forward-looking statements. We do not intend to update our description of important factors each time a potential important factor arises. We advise our security holders that they should (1) be aware that important factors not referred to above could affect theoperations and cash flows.
10
accuracy of our forward-looking statements and (2) use caution and common sense when considering our forward-looking statements. Also, please read the risk factors set forth below.
Risks Relating to the Oil and Gas Industry
We derive all our revenues from companies in the oil and gas exploration and production industry, a historically cyclical industry with levels of activity that are significantly affected by the levels and volatility of oil and gas prices.
As a provider of contract land drilling services and oil and gas production services, our business depends on the level of drillingexploration and production activity by oil and gas exploration and production companies operating in the geographic markets where we operate. The oil and gas exploration and production industry is a historically cyclical industry characterized by significant changes in the levels of exploration and development activities. Oil and gas prices, and market expectations of potential changes in those prices, significantly affect the levels of those activities. Worldwide political, economic, and military events as well as natural disasters have contributed to oil and gas price volatility and are likely to continue to do so in the future. Any prolonged reduction in the overall level of exploration and development activities, whether resulting from changes in oil and gas prices or otherwise, cancould materially and adversely affect us in many ways by negatively impacting:
•our revenues, cash flows and profitability;
•the fair market value of our drilling rig fleet;fleet and production service assets;
•our ability to maintain or increase our borrowing capacity;
•our ability to obtain additional capital to finance our business and make acquisitions, and the cost of that capital; and
•our ability to retain skilled rig personnel whom we would need in the event of an upturn in the demand for our services.
Depending on the market prices of oil and gas, oil and gas exploration and production companies may cancel or curtail their drilling programs and may lower production spending on existing wells, thereby reducing demand for our services. Oil and gas prices have been volatile historically and, we believe, will continue to be so in the future. Many factors beyond our control affect oil and gas prices, including:
•weather conditions in the United Statescost of exploring for, producing and elsewhere;delivering oil and gas;
•the discovery rate of new oil and gas reserves;
the rate of decline of existing and new oil and gas reserves;
available pipeline and other oil and gas transportation capacity;
the ability of oil and gas companies to raise capital;
economic conditions in the United States and elsewhere;
•actions by OPEC, the Organization of Petroleum Exporting Countries;
•political instability in the Middle East and other major oil and gas producing regions;
•governmental regulations, both domestic and foreign;
•domestic and foreign tax policy;
•weather conditions in the United States and elsewhere;
the pace adopted by foreign governments for the exploration, development and production of their national reserves;
•the price of foreign imports of oil and gas; and
•the cost of exploring for, producing and delivering oil and gas;
•the discovery rate of new oil and gas reserves;
•the rate of decline of existing and new oil and gas reserves;
•available pipeline and other oil and gas transportation capacity;
•the ability of oil and gas companies to raise capital; and
•the overall supply and demand for oil and gas.
As a result of recent declines in oil and natural gas prices and substantial uncertainty in the capital markets due to the deteriorating global economic environment, our customers have reduced spending on exploration and production and this has resulted in a decrease in demand for our services. We are unable to determine whether customers and/or vendors and suppliers will be able to access financing necessary to sustain their current level of operations, fulfill their commitments and/or fund future operations and obligations. The deteriorating global economic environment may impact industry fundamentals, and the potential resulting decrease in demand for drilling and production services could adversely affect our business.
Oil and natural gas prices, and market expectations of potential changes in these prices, significantly impact the level of worldwide drilling and production services activities. Oil and natural gas prices have declined significantly during recent months in a deteriorating global economic environment. This decline in oil and natural gas prices, as well as the current crisis in the global credit markets, have caused exploration and production companies to reduce their overall level of drilling and production services activity and spending. When drilling and production activity and spending declines, both day rates and utilization have historically declined. As a result, the recent declines in oil and natural gas prices and the global economic crisis could materially and adversely affect our business and financial results.
Moreover, the deteriorating global economic environment may impact fundamentals that are critical to our industry, such as the global demand for, and consumption of, oil and natural gas. Reduced demand for oil and natural gas generally results in lower prices for these commodities and may impact the economics of planned drilling projects and ongoing production projects, resulting in the curtailment, reduction, delay or postponement of such projects for an indeterminate period of time. Companies that planned to finance exploration, development or production projects through the capital markets may be forced to curtail, reduce, postpone or delay drilling or production services activities, and also may experience inability to pay suppliers. The deteriorating global economic environment could also impact our vendors and suppliers’ ability to meet obligations to provide materials and services in general. If any of the foregoing were to occur, it could have a material adverse effect on our business and financial results.
Risks Relating to Our Business
Reduced demand for or excess capacity of drilling services or production services could adversely affect our profitability.
We have a history of losses and may experience losses in the future.
We have a history of losses. We incurred net losses of $1.8 million, $5.1 million and $0.4 million in the fiscal years ended March 31, 2004, 2003 and 2000, respectively. Our profitability in the future will depend on many factors, but largely on pricing and utilization rates and dayrates for our drilling rigs. Our currentand production services. A reduction in the demand for drilling rigs or an increase in the supply of drilling rigs, whether through new construction or refurbishment, could decrease the dayrates and utilization rates and dayrates may decline and we may experience losses in the future.
11
Our acquisition strategy involves various risks.
As a key component offor our business strategy, we have pursued and intend to continue to pursue acquisitions of complementary assets and businesses. For example, since March 31, 2003, our rig fleet has increased from 24 to 50 drilling rigs, primarily as a result of acquisitions. Certain risks are inherent in an acquisition strategy, such as increasing leverage and debt service requirements and combining disparate company cultures and facilities,services, which couldwould adversely affect our operating results. The successrevenues and profitability. An increase in supply of any completed acquisition will dependwell service rigs, wireline units and fishing and rental tools equipment, without a corresponding increase in part on our ability to integrate effectivelydemand, could similarly decrease the acquired business into our operations. The process of integrating an acquired business may involve unforeseen difficultiespricing and may require a disproportionate amount of management attention and financial and other resources. Possible future acquisitions may be for purchase prices significantly higher than those we paid for recent acquisitions. We may be unable to continue to identify additional suitable acquisition opportunities, negotiate acceptable terms, obtain financing for acquisitions on satisfactory terms or successfully acquire identified targets. Our failure to achieve consolidation savings, to incorporate the acquired businesses and assets into our existing operations successfully or to minimize any unforeseen operational difficulties could have a material adverse effect on our financial condition and results of operations.
In addition, we may not have sufficient capital resources to complete additional acquisitions. Historically, we have funded the growthutilization rates of our rig fleet through a combination of debtproduction services, which would adversely affect our revenues and equity financing. We may incur substantial additional indebtedness to finance future acquisitions and also may issue equity securities or convertible securities in connection with such acquisitions. Debt service requirements could represent a significant burden on our results of operations and financial condition and the issuance of additional equity could be dilutive to our existing stockholders. Furthermore, we may not be able to obtain additional financing on satisfactory terms.profitability.
We operate in a highly competitive, fragmented industry in which price competition is intense.could reduce our profitability.
We encounter substantial competition from other drilling contractors.contractors and other oilfield service companies. Our primary market areas of are highly fragmented and competitive. The fact that drilling, workover and well-servicing rigs are mobile and can be moved from one market to another in response to market conditions heightens the competition in the industry.
The drilling contracts we compete for are usually awarded on the basis of competitive bids. We believe pricingindustry and rig availability are the primary factors our potential customers considermay result in determining which drilling contractor to select. In addition, we believe the following factors are also important:
•the type and condition of each of the competing drilling rigs;
•the mobility and efficiency of the rigs;
•the quality of service and experience of the rig crews;
•the safety records of the rigs;
•the offering of ancillary services; and
•the ability to provide drilling equipment adaptable to, and personnel familiar with, new technologies and drilling techniques.
While we must be competitive in our pricing, our competitive strategy generally emphasizes the quality of our equipment, the safety record of our rigs and the quality of service and experience of our rig crews to differentiate us from our competitors. This strategy is less effective as lower demand for drilling services intensifies price competition and makes it more difficult for us to compete on the basis of factors other than price. In all of the markets in which we compete, an over-supplyoversupply of rigs can cause greater price competition.
in an area. Contract drilling companies and other oilfield service companies compete primarily on a regional basis, and the intensity of competition may vary significantly from region to region at any particular time. If demand for drilling or production services improves in a region where we operate, our competitors might respond by moving in suitable rigs from other regions. An influx of rigs from other regions could rapidly intensify competition, and reduce profitability and make any improvement in demand for drilling rigsor production services short-lived.
Most drilling services contracts and production services contracts are awarded on the basis of competitive bids, which also results in price competition. In addition to pricing and rig availability, we believe the following factors are also important to our customers in determining which drilling services or production services provider to select:
the type and condition of each of the competing drilling, workover and well-servicing rigs;
the mobility and efficiency of the rigs;
the quality of service and experience of the rig crews;
the safety records of the rigs;
the offering of ancillary services; and
the ability to provide drilling and production equipment adaptable to, and personnel familiar with, new technologies and drilling and production techniques.
While we must be competitive in our pricing, our competitive strategy generally emphasizes the quality of our equipment, the safety record of our rigs, our ability to offer ancillary services and the quality of service and experience of our rig crews to differentiate us from our competitors. This strategy is less effective as lower demand for drilling and production services or an oversupply of drilling, workover and well-servicing rigs intensifies price competition and makes it more difficult for us to compete on the basis of factors other than price. In all of the markets in which we compete, an oversupply of rigs can cause greater price competition, which can reduce our profitability.
We face competition from many competitors with greater resources.
Many of our competitors have greater financial, technical and other resources than we do. Their greater capabilities in these areas may enable them to:
•better withstand industry downturns;
•compete more effectively on the basis of price and technology;
•retain skilled rig personnel; and
12
•build new rigs or acquire and refurbish existing rigs so as to be able to place rigs into service more quickly than us in periods of high drilling demand.
Unexpected cost overruns on our turnkey drilling jobs and our footage contracts could adversely affect our financial position and our results of operation.operations.
We have historically derived a significant portion of our revenues from turnkey drilling contracts, and we expect that they willturnkey contracts may represent a significant component of our future revenues. The occurrence of uninsured or under-insured losses or operating cost overruns on our turnkey jobs could have a material adverse effect on our financial position and
results of operations. Under a typical turnkey drilling contract, we agree to drill a well for our customer to a specified depth and under specified conditions for a fixed price. We provide technical expertise and engineering services, as well as most of the equipment and drilling supplies required to drill the well. We often subcontract for related services, such as the provision of casing crews, cementing and well logging. Underlogging.Under typical turnkey drilling arrangements, we do not receive progress payments and are paid by our customer only after we have performed the terms of the drilling contract in full. For these reasons, the risk to us under a turnkey drilling contract is substantially greater than for a well drilled on a daywork basis because we must assume most of the risks associated with drilling operations that the operator generally assumes under a daywork contract, including the risks of blowout, loss of hole, stuck drill pipe, machinery breakdowns, abnormal drilling conditions and risks associated with subcontractors’ services, supplies, cost escalations and personnel. Similar to our turnkey contracts, under a footage contract we assume most of the risks associated with drilling operations that the operator generally assumes under a daywork contract.
Although we attempt to obtain insurance coverage to reduce certain of the risks inherent in our turnkey and footage drilling operations, adequate coverage may be unavailable in the future and we might have to bear the full cost of such risks, which could have an adverse effect on our financial condition and results of operation.operations.
Our operations involve operating hazards, which, if not insured or indemnified against, could adversely affect our results of operations and financial condition.
Our operations are subject to the many hazards inherent in the contract land drilling, business,workover and well-servicing industries, including the risks of:
•collapse of the borehole;
•damaged or lost or stuck drill strings;drilling equipment; and
•damage or loss from natural disasters.
Any of these hazards can result in substantial liabilities or losses to us from, among other things:
•suspension of drilling operations;
•damage to, or destruction of, our property and equipment and that of others;
•personal injury and loss of life;
•damage to producing or potentially productive oil and gas formations through which we drill; and
We seek to protect ourselves from some but not all operating hazards through insurance coverage. However, some risks are either not insurable or insurance is available only at rates that we consider uneconomical. Those risks include pollution liability in excess of relatively low limits. Depending on competitive conditions and other factors, we attempt to obtain contractual protection against uninsured operating risks from our customers. However, customers who provide contractual indemnification protection may not in all cases maintain adequate insurance to support their indemnification obligations. Our insurance or indemnification arrangements may not adequately protect us against liability or loss from all the hazards of our operations. The occurrence of a significant event that we have not fully insured or indemnified against or the failure of a customer to meet its indemnification obligations to us could materially and adversely affect our results of operations and financial condition. Furthermore, we may be unable to maintain adequate insurance in the future at rates we consider reasonable.
13
We face increased exposure to operating difficulties because we primarily focus on providing drilling and production services for natural gas.
Most of our drilling and production contracts are with exploration and production companies in search of natural gas. Drilling on land for natural gas generally occurs at deeper drilling depths than drilling for oil. Although deep-depth drilling exposesand production services expose us to riskrisks similar to risks encountered in shallow-depth drilling and production services, the magnitude of the risk for deep-depth drilling and production services is greater because of the higher costs and greater complexities involved in providing drilling and production services for deep wells. We generally do not insure risks related to operating difficulties other than blowouts. If we do not adequately insure the increased risk from blowouts or if our contractual indemnification rights are insufficient or unfulfilled, our profitability and other results of operationoperations and our financial condition could be adversely affected in the event we encounter blowouts or other significant operating difficulties while providing drilling or production services at deeper depths.
Our current primary focus on drilling for customers in search of natural gas could place us at a competitive disadvantage if we changedwere to change our primary focus to drilling for customers in search of oil.
Our drilling rig fleet consists of rigs capable of drilling on land at drilling depths of 6,000 to 18,000 feet because most of our contracts are with customers drilling in search of natural gas, which generally occurs at deeper drilling depths than drilling in search of oil, which often occurs at drilling depths less than 6,000 feet. Generally, larger drilling rigs capable of deep drilling generally incur higher mobilization costs than smaller drilling rigs drilling at shallower depths. If our primary focus shifts from drilling for customers in search of natural gas to drilling for customers in search of oil, the majority of our rig fleet would be disadvantaged in competing for new oil drilling projects as compared to competitors that primarily use shallower drilling depth rigs when drilling in search of oil.
Our operations are subject to various laws and governmental regulations that could restrict our future operations and increase our operating costs.
Many aspects of our operations are subject to various federal, state and local laws and governmental regulations, including laws and regulations governing:
•environmental quality;
•pollution control;
•remediation of contamination;
•preservation of natural resources; and
•worker safety.
Our operations are subject to stringent laws and regulations relating to containment, disposal and controlling the discharge of hazardous oilfield waste and other nonhazardous waste material into the environment, requiring removal and cleanup under certain circumstances, or otherwise relating to the protection of the environment. In addition, our operations are often conducted in or near ecologically sensitive areas, such as wetlands, which are subject to special protective measures and which may expose us to additional operating costs and liabilities for accidental discharges of oil, gas, drilling fluids or contaminated water or for noncompliance with other aspects of applicable laws. We are also subject to the requirements of OSHA and comparable state statutes. The OSHA hazard communication standard, the Environmental Protection Agency “community right-to-know” regulations under Title III of the Federal Superfund Amendment and Reauthorization Act and comparable state statutes require us to organize and report information about the hazardous materials we use in our operations to employees, state and local government authorities and local citizens.
Environmental laws and regulations are complex and subject to frequent change. In some cases, they can impose liability for the entire cost of cleanup on any responsible party without regard to negligence or fault and can impose liability on us for the conduct of others or conditions others have caused, or for our acts that complied with all applicable requirements when we performed them. We may also be exposed to environmental or other liabilities originating from businesses and assets which we purchased from others. Our compliance with amended, new or more stringent requirements, stricter interpretations of existing requirements or the future discovery of contamination may require us to make material expenditures or subject us to liabilities that we currently do not anticipate.
In addition, our business depends on the demand for land drilling services from the oil and gas industry and, therefore, is affected by tax, environmental and other laws relating to the oil and gas industry generally, by changes in those laws and by changes in related administrative regulations. It is also possible that these laws and regulations may in the future add significantly to our operating costs or those of our customers or otherwise directly or indirectly affect our operations.
We could be adversely affected if shortages of equipment, supplies or personnel occur.
From time to time there have been shortages of drilling and production services equipment and supplies during periods of high demand which we believe could reoccur.recur. Shortages could result in increased prices for drilling and production services equipment or supplies that we may be unable to pass on to customers. In
14
addition, during periods of shortages, the delivery times for equipment and supplies can be substantially longer. Any significant delays in our obtaining drilling and production services equipment or supplies could limit drilling and production services operations and jeopardize our relations with customers. In addition, shortages of drilling and production services equipment or supplies could delay and adversely affect our ability to obtain new contracts for our rigs, which could have a material adverse effect on our financial condition and results of operations.
Our strategy of constructing drilling rigs during periods of peak demand requires that we maintain an adequate supply of drilling rig components to complete our rig building program. Our suppliers may be unable to continue providing us the needed drilling rig components if their manufacturing sources are unable to fulfill their commitments.
Our operations require the services of employees having the technical training and experience necessary to obtain the proper operational results. As a result, our operations depend, to a considerable extent, on the continuing availability of such personnel. Shortages of qualified personnel are occurring in our industry. If we should suffer any material loss of personnel to competitors or be unable to employ additional or replacement personnel with the requisite level of training and experience to adequately operate our equipment, our operations could be materially and adversely affected. A significant increase in the wages paid by other employers could result in a reduction in our workforce, increases in wage rates, or both. The occurrence of either of these events for a significant period of time could have a material and adverse effect on our financial condition and results of operations.
Our acquisition strategy exposes us to various risks, including those relating to difficulties in identifying suitable acquisition opportunities and integrating businesses, assets and personnel, as well as difficulties in obtaining financing for targeted acquisitions and the potential for increased leverage or debt service requirements.
As a key component of our business strategy, we have pursued and intend to continue to pursue acquisitions of complementary assets and businesses. For example, since March 31, 2003, our drilling rig fleet has increased from 24 to 70 drilling rigs, as a result of acquisitions and rig construction. In addition, during the first quarter of 2008, we completed the acquisition of the production services businesses of WEDGE and Competition.
Our acquisition strategy in general, and our recent acquisitions in particular, involve numerous inherent risks, including:
unanticipated costs and assumption of liabilities and exposure to unforeseen liabilities of acquired businesses, including environmental liabilities;
difficulties in integrating the operations and assets of the acquired business and the acquired personnel;
limitations on our ability to properly assess and maintain an effective internal control environment over an acquired business in order to comply with applicable periodic reporting requirements;
potential losses of key employees and customers of the acquired businesses;
risks of entering markets in which we have limited prior experience; and
increases in our expenses and working capital requirements.
The process of integrating an acquired business may involve unforeseen costs and delays or other operational, technical and financial difficulties that may require a disproportionate amount of management attention and financial and other resources. Possible future acquisitions may be for purchase prices significantly higher than those we paid for previous acquisitions. Our failure to achieve consolidation savings, to incorporate the acquired businesses and assets into our existing operations successfully or to minimize any unforeseen operational difficulties could have a material adverse effect on our financial condition and results of operations.
In addition, we may not have sufficient capital resources to complete additional acquisitions. Historically, we have funded the growth of our rig fleet through a combination of debt and equity financing. We may incur substantial additional indebtedness to finance future acquisitions and also may issue equity securities or convertible securities in connection with such acquisitions. Debt service requirements could represent a significant burden on our results of operations and financial condition and the issuance of additional equity or convertible securities could be dilutive to our existing shareholders. Furthermore, we may not be able to obtain additional financing on satisfactory terms.
Even if we have access to the necessary capital, we may be unable to continue to identify additional suitable acquisition opportunities, negotiate acceptable terms or successfully acquire identified targets.
Our indebtedness could restrict our operations and make us more vulnerable to adverse economic conditions.
For several years we have had little or no long-term debt. In connection with the acquisition of the production services businesses of WEDGE and Competition, we entered into a new $400 million, five-year, senior secured revolving credit facility. As of December 31, 2008, our total debt was approximately $272.5 million.
Our current and future indebtedness could have important consequences, including:
impairing our ability to make investments and obtain additional financing for working capital, capital expenditures, acquisitions or other general corporate purposes;
limiting our ability to use operating cash flow in other areas of our business because we must dedicate a substantial portion of these funds to make principal and interest payments on our indebtedness;
making us more vulnerable to a downturn in our business, our industry or the economy in general as a substantial portion of our operating cash flow could be required to make principal and interest payments on our indebtedness, making it more difficult to react to changes in our business and in industry and market conditions;
limiting our ability to obtain additional financing that may be necessary to operate or expand our business;
putting us at a competitive disadvantage to competitors that have less debt; and
increasing our vulnerability to rising interest rates.
We anticipate that our cash generated by operations and our ability to borrow under the currently unused portion of our senior secured revolving credit facility should allow us to meet our routine financial obligations for the foreseeable future. However, our ability to make payments on our indebtedness, and to fund planned capital expenditures, will depend on our ability to generate cash in the future. This, to a certain extent, is subject to conditions in the oil and gas industry, general economic and financial conditions, competition in the markets where we operate, the impact of legislative and regulatory actions on how we conduct our business and other factors, all of which are beyond our control. If our business does not generate sufficient cash flow from operations to service our outstanding indebtedness, we may have to undertake alternative financing plans, such as:
refinancing or restructuring our debt;
reducing or delaying acquisitions or capital investments, such as refurbishments of our rigs and related equipment; or
seeking to raise additional capital.
However, we may be unable to implement alternative financing plans, if necessary, on commercially reasonable terms or at all, and any such alternative financing plans might be insufficient to allow us to meet our debt obligations. If we are unable to generate sufficient cash flow or are otherwise unable to obtain the funds required to make principal and interest payments on our indebtedness, or if we otherwise fail to comply with the various covenants in our senior secured revolving credit facility or other instruments governing any future indebtedness, we could be in default under the terms of our senior secured revolving credit facility or such instruments. In the event of a default, the Lenders under our senior secured revolving credit facility could elect to declare all the loans made under such facility to be due and payable together with accrued and unpaid interest and terminate their commitments thereunder and we or one or more of our subsidiaries could be forced into bankruptcy or liquidation. Any of the foregoing consequences could materially and adversely affect our business, financial condition, results of operations and prospects.
Our senior secured revolving credit facility imposes restrictions on us that may affect our ability to successfully operate our business.
Our senior secured revolving credit facility limits our ability to take various actions, such as:
limitations on the incurrence of additional indebtedness;
restrictions on investments, mergers or consolidations, asset dispositions, acquisitions, transactions with affiliates and other transactions without the lenders’ consent; and
limitation on dividends and distributions.
In addition, our senior secured revolving credit facility requires us to maintain certain financial ratios and to satisfy certain financial conditions, which may require us to reduce our debt or take some other action in order to comply with them. The failure to comply with any of these financial conditions, such as financial ratios or
covenants, would cause an event of default under our senior secured revolving credit facility. An event of default, if not waived, could result in acceleration of the outstanding indebtedness under our senior secured revolving credit facility, in which case the debt would become immediately due and payable. If this occurs, we may not be able to pay our debt or borrow sufficient funds to refinance it. Even if new financing is available, it may not be available on terms that are acceptable to us. These restrictions could also limit our ability to obtain future financings, make needed capital expenditures, withstand a downturn in our business or the economy in general, or otherwise conduct necessary corporate activities. We also may be prevented from taking advantage of business opportunities that arise because of the limitations imposed on us by the restrictive covenants under our senior secured revolving credit facility.
Our international operations are subject to political, economic and other uncertainties not encountered in our domestic operations.
As we continue to implement our strategy of expanding into areas outside the United States, our international operations will be subject to political, economic and other uncertainties not generally encountered in our U.S. operations. These will include, among potential others:
risks of war, terrorism, civil unrest and kidnapping of employees;
expropriation, confiscation or nationalization of our assets;
renegotiation or nullification of contracts;
the inability to repatriate earnings or capital due to laws limiting the right and ability of foreign subsidiaries to pay dividends and remit earnings to affiliated companies;
changing political conditions and changing laws and policies affecting trade and investment;
regional economic downturns;
the overlap of different tax structures;
the burden of complying with multiple and potentially conflicting laws;
the risks associated with the assertion of foreign sovereignty over areas in which our operations are conducted;
difficulty in collecting international accounts receivable; and
potentially longer payment cycles.
Our international operations may also face the additional risks of fluctuating currency values, hard currency shortages and controls of foreign currency exchange. Additionally, in some jurisdictions, we may be subject to foreign governmental regulations favoring or requiring the awarding of contracts to local contractors or requiring foreign contractors to employ citizens of, or purchase supplies from, a particular jurisdiction. These regulations could adversely affect our ability to compete.
Our operations are subject to various laws and governmental regulations that could restrict our future operations and increase our operating costs.
Many aspects of our operations are subject to various federal, state and local laws and governmental regulations, including laws and regulations governing:
remediation of contamination;
preservation of natural resources;
Our operations are subject to stringent federal, state and local laws, rules and regulations governing the protection of the environment and human health and safety. Some of those laws, rules and regulations relate to the disposal of hazardous substances, oilfield waste and other waste materials and restrict the types, quantities and concentrations of those substances that can be released into the environment. Several of those laws also require removal and remedial action and other cleanup under certain circumstances, commonly regardless of fault. Our operations routinely involve the handling of significant amounts of waste materials, some of which are classified as hazardous substances. Planning, implementation and maintenance of protective measures are required to prevent accidental discharges. Spills of oil, natural gas liquids, drilling fluids and other substances may subject us to penalties and cleanup requirements. Handling, storage and disposal of both hazardous and non-hazardous wastes are also subject to these regulatory requirements. In addition, our operations are often conducted in or near ecologically sensitive areas, such as wetlands, which are subject to special protective measures and which may expose us to additional operating costs and liabilities for accidental discharges of oil, gas, drilling fluids, contaminated water or other substances, or for noncompliance with other aspects of applicable laws and regulations.
The federal Clean Water Act, as amended by the Oil Pollution Act, the federal Clean Air Act, the federal Resource Conservation and Recovery Act, the federal Comprehensive Environmental Response, Compensation, and Liability Act, or CERCLA, the Safe Drinking Water Act, the Occupational Safety and Health Act, or OSHA, and their state counterparts and similar statutes are the primary statutes that impose the requirements described above and provide for civil, criminal and administrative penalties and other sanctions for violation of their requirements. The OSHA hazard communication standard, the Environmental Protection Agency “community right-to-know” regulations under Title III of the federal Superfund Amendment and Reauthorization Act and comparable state statutes require us to organize and report information about the hazardous materials we use in our operations to employees, state and local government authorities and local citizens. In addition, CERCLA, also known as the “Superfund” law, and similar state statutes impose strict liability, without regard to fault or the legality of the original conduct, on certain classes of persons who are considered responsible for the release or threatened release of hazardous substances into the environment. These persons include the current owner or operator of a facility where a release has occurred, the owner or operator of a facility at the time a release occurred, and companies that disposed of or arranged for the disposal of hazardous substances found at a particular site. This liability may be joint and several. Such liability, which may be imposed for the conduct of others and for conditions others have caused, includes the cost of removal and remedial action as well as damages to natural resources. Few defenses exist to the liability imposed by environmental laws and regulations. It is also common for third parties to file claims for personal injury and property damage caused by substances released into the environment.
Environmental laws and regulations are complex and subject to frequent change. Failure to comply with governmental requirements or inadequate cooperation with governmental authorities could subject a responsible party to administrative, civil or criminal action. We may also be exposed to environmental or other liabilities originating from businesses and assets which we acquired from others. Our compliance with amended, new or more stringent requirements, stricter interpretations of existing requirements or the future discovery of contamination or regulatory noncompliance may require us to make material expenditures or subject us to liabilities that we currently do not anticipate.
In addition, our business depends on the demand for land drilling and production services from the oil and gas industry and, therefore, is affected by tax, environmental and other laws relating to the oil and gas industry generally, by changes in those laws and by changes in related administrative regulations. It is possible that these laws and regulations may in the future add significantly to our operating costs or those of our customers, or otherwise directly or indirectly affect our operations.
Among the services we provide, we operate as a motor carrier and therefore are subject to regulation by the U.S. Department of Transportation and by various state agencies. These regulatory authorities exercise broad powers, governing activities such as the authorization to engage in motor carrier operations and regulatory safety. There are additional regulations specifically relating to the trucking industry, including testing and specification of equipment and product handling requirements. The trucking industry is subject to possible regulatory and legislative changes that may affect the economics of the industry by requiring changes in operating practices or by changing the demand for common or contract carrier services or the cost of providing truckload services. Some of these possible changes include increasingly stringent environmental regulations, changes in the hours of service regulations which govern the amount of time a driver may drive in any specific period, onboard black box recorder devices or limits on vehicle weight and size.
Interstate motor carrier operations are subject to safety requirements prescribed by the U.S. Department of Transportation. To a large degree, intrastate motor carrier operations are subject to state safety regulations that mirror federal regulations. Such matters as weight and dimension of equipment are also subject to federal and state regulations.
From time to time, various legislative proposals are introduced, including proposals to increase federal, state, or local taxes, including taxes on motor fuels, which may increase our costs or adversely impact the recruitment of drivers. We cannot predict whether, or in what form, any increase in such taxes applicable to us will be enacted.
Our combined operating history may not be sufficient for investors to evaluate our business and prospects.
The acquisition of the production services businesses of WEDGE and Competition significantly expanded our operations and assets. Our historical combined financial statements include financial information based on the separate production services businesses of WEDGE and Competition. As a result, the historical and pro forma information presented may not provide an accurate indication of what our actual results would have been if the acquisition of the production services businesses of WEDGE and Competition had been completed at the beginning of the periods presented or of what our future results of operations are likely to be. Our future results will depend on our ability to efficiently manage our combined operations and execute our business strategy.
Risk Relating to Our Capitalization and Organizational Documents
Our largest shareholder and our management control approximately 20% ofWe do not intend to pay dividends on our common stock in the foreseeable future, and their interests may conflict with thosetherefore only appreciation of our other shareholders.
As of May 20, 2005, our largest shareholder, Chesapeake Energy Corporation, beneficially owned 16.78% of our outstanding common stock, and together with our officers and directors as a group beneficially owned a total of 20.46% of our outstanding common stock. For each shareholder or group of shareholders, beneficial ownership includes shares of our common stock issuable on exercise of outstanding stock options held by that shareholder or group of shareholders. In some circumstances, if these shareholders were to act in concert, they would be able to exercise substantial control over our affairs. The interests of Chesapeake and these other persons with respect to matters potentially or actually involving or affecting us, such as future acquisitions, financings and other corporate opportunities and attempts to acquire us, may conflict with the interests of our other shareholders.
Limited trading volume of our common stock may contribute to its price volatility.
Our common stock is traded on the American Stock Exchange. During the period from January 1, 2005 through May 20, 2005, the average daily trading volume of our common stock as reported by the American Stock Exchange was366,154 shares. There can be no assurance that a more active trading market in our common stock will develop. As a result, relatively small trades may have a significant impact on the price of our common stock and, therefore, may contributewill provide a return to the price volatility of our common stock. As a result, our common stock may be subject to greater price volatility than the stock market as a whole and comparable securities of other contract drilling service providers.shareholders.
The market price of our common stock has been, and may continue to be, volatile. For example, during our 2005 fiscal year, the trading price of our common stock ranged from $5.60 to $14.21 per share.
Because of the limited trading market of our common stock and the price volatility of our common stock, you may be unable to sell shares of common stock when you desire or at a price you desire. The inability to sell your shares in a declining market because of such illiquidity or at a price you desire may substantially increase your risk of loss.
Under our existing dividend policy, we do not pay dividends on our common stock.
We have not paid or declared any dividends on our common stock and currently intend to retain any earnings to fund our working capital needs and growth opportunities. Any future dividends will be at the discretion of our board of directors after taking into account various factors it deems relevant, including our financial condition and performance, cash needs, income tax consequences and the restrictions imposed by the Texas Business Corporation Act and other applicable laws and by our credit facilities. Our debt arrangements include provisions that generally prohibit us from paying dividends on our capital stock, including our common stock.
We may issue preferred stock whose terms could adversely affect the voting power or value of our common stock.
Our articles of incorporation authorize us to issue, without the approval of our shareholders, one or more classes or series of preferred stock having such designations, preferences, limitations and relative rights, including preferences over our common stock respecting dividends and distributions, as our board of directors may determine. The terms of one or more classes or series of preferred stock could adversely impact the voting power or value of our common stock. For example, we might grant holders of preferred stock the right to elect some number of our directors in all events or on the happening of specified events or the right to veto specified transactions. Similarly, the repurchase or redemption rights or liquidation preferences we might assign to holders of preferred stock could affect the residual value of the common stock.
15
Provisions in our organizational documents could delay or prevent a change in control of our company even if that change would be beneficial to our shareholders.
The existence of some provisions in our organizational documents could delay or prevent a change in control of our company even if that change would be beneficial to our shareholders. Our articles of incorporation and bylaws contain provisions that may make acquiring control of our company difficult, including:
•provisions regulating the ability of our shareholders to nominate candidates for election as directors or to bring matters for action at annual meetings of our shareholders;
•limitations on the ability of our shareholders to call a special meeting and act by written consent;
•provisions dividing our board of directors into three classes elected for staggered terms; and
•the authorization given to our board of directors to issue and set the terms of preferred stock.
We may continue to experience market conditions that could adversely affect the liquidity of our auction rate preferred security investment.
At December 31, 2008, we held $15.9 million (par value) of investments comprised of tax exempt, auction rate preferred securities (“ARPSs”), which are variable-rate preferred securities and have a long-term maturity with the interest rate being reset through “Dutch auctions” that are held every 7 days. The ARPSs have historically traded at par because of the frequent interest rate resets and because they are callable at par at the option of the issuer. Interest is paid at the end of each auction period. Our ARPSs are AAA/Aaa rated securities, collateralized by municipal bonds and backed by assets that are equal to or greater than 200% of the liquidation preference. Until February 2008, the auction rate securities market was highly liquid. Beginning mid-February 2008, we experienced several “failed” auctions, meaning that there was not enough demand to sell all of the securities that holders desired to sell at auction. The immediate effect of a failed auction is that such holders cannot sell the securities at auction and the interest rate on the security resets to a maximum auction rate. We have continued to receive interest payments on our ARPSs in accordance with their terms. Unless a future auction is successful or the issuer calls the security pursuant to redemption prior to maturity, we may not be able to access the funds we invested in our ARPSs without a loss of principal. We have no reason to believe that any of the underlying municipal securities that collateralize our ARPSs are presently at risk of default. We believe we will ultimately be able to liquidate our investments without material loss primarily due to the collateral securing the ARPSs. We do not currently intend to attempt to sell our ARPSs at a discount since our liquidity needs are expected to be met with cash flows from operating activities and our senior secured revolving credit facility. Our ARPSs are designated as available-for-sale and are reported at fair market value with the related unrealized gains or losses, included in accumulated other comprehensive income (loss), net of tax, a component of shareholders’ equity. The estimated fair value of our ARPSs at December 31, 2008 was $13.9 million compared with a par value of $15.9 million. The $2.0 million difference represents a fair value discount due to the current lack of liquidity which is considered temporary and is recorded as an unrealized loss. We would recognize an impairment charge if the fair value of our investments falls below the cost basis and is judged to be other-than-temporary. Our ARPSs are classified with other long-term assets on our consolidated balance sheet as of December 31, 2008 because of our inability to the determine recovery period of our investments.
| Item 1B. | Unresolved Staff Comments |
Not applicable.
For a description of our significant properties, see “Business—Overview of Our Segments and Services” and “Business—Facilities” in Item 3. Legal Proceedings
1 of this report. We consider each of our significant properties to be suitable for its intended use.Due to the nature of our business, we are, from time to time, involved in routine litigation or subject to disputes or claims related to our business activities, including workers’ compensation claims and employment-related disputes. In the opinion of our management, none of the pending litigation, disputes or claims against us will have a material adverse effect on our financial condition or results of operations.
Item 4. Submission of Matters to a Vote of Security Holders
| Item 4. | Submission of Matters to a Vote of Security Holders |
We did not submit any matter to a vote of our security holdersshareholders during the fourth quarter of fiscal 2005.ended December 31, 2008.
PART II
PART II
Item 5.Market for Registrant’s Common Equity, Related Stockholder Matters and Issuer Purchases of Equity Securities
| Item 5. | Market for Registrant’s Common Equity, Related Shareholder Matters and Issuer Purchases of Equity Securities |
As of May 20, 2005,45,931,646February 6, 2009, 49,997,578 shares of our common stock were outstanding, held by approximately561560 shareholders of record. The number of record holders does not necessarily bear any relationship to the number of beneficial owners of our common stock.
Our common stock trades on the American Stock Exchange (NYSE Alternext US) under the symbol “PDC.” The following table sets forth, for each of the periods indicated, the high and low sales prices per share on the American Stock Exchange:Exchange (NYSE Alternext US):
| | Low | | High | |
Fiscal Year Ended March 31, 2005: | | | | | |
First Quarter | | $ | 5.60 | | $ | 7.99 | |
Second Quarter | | 6.75 | | 8.90 | |
Third Quarter | | 7.63 | | 10.50 | |
Fourth Quarter | | 9.05 | | 14.21 | |
| | | | | |
Fiscal Year Ended March 31, 2004: | | | | | |
First Quarter | | $ | 3.57 | | $ | 5.24 | |
Second Quarter | | 3.65 | | 4.99 | |
Third Quarter | | 3.30 | | 5.20 | |
Fourth Quarter | | 4.75 | | 7.35 | |
| | | | | | |
| | | Low | | High |
Fiscal Year Ended December 31, 2008: | | | | | | |
First Quarter | | $ | 10.59 | | $ | 16.70 |
Second Quarter | | | 15.29 | | | 20.64 |
Third Quarter | | | 12.49 | | | 18.82 |
Fourth Quarter | | | 4.85 | | | 13.09 |
| | |
Nine Months Ended December 31, 2007: | | | | | | |
First Quarter | | $ | 12.69 | | $ | 16.00 |
Second Quarter | | | 11.81 | | | 14.88 |
Third Quarter | | | 11.49 | | | 12.49 |
| | |
Fiscal Year Ended March 31, 2007: | | | | | | |
First Quarter | | $ | 12.60 | | $ | 18.00 |
Second Quarter | | | 10.79 | | | 15.70 |
Third Quarter | | | 11.57 | | | 14.65 |
Fourth Quarter | | | 11.46 | | | 13.47 |
The last reported sales price for our common stock on the American Stock Exchange (NYSE Alternext US) on May 27, 2005February 6, 2009 was $14.00$5.08 per share.
We have not paid or declared any dividends on our common stock and currently intend to retain earnings to fund our working capital needs and growth opportunities. Any future dividends will be at the discretion of our board of directors after taking into account various factors it deems relevant, including our financial condition and performance, cash needs, income tax consequences and the restrictions Texas and other applicable laws and our credit facilities then impose. Our debt arrangements include provisions that generally prohibit us from paying dividends, other than dividends on our preferred stock. We currently have no preferred stock outstanding.
No shares of our common stock were purchased by or on behalf of our company or any affiliated purchaser during the fiscal year ended December 31, 2008.
16
Performance Graph
The following graph compares, for the periods from December 31, 2003 to December 31, 2008, the cumulative total shareholder return on our common stock with the (1) cumulative total return on the companies that comprise the AMEX Composite Index, (2) an old peer group index that includes the five companies that primarily provide contract drilling services, and (3) a new peer group index that includes five companies that provide contract drilling services and / or production services. With the acquisition of WEDGE and Competition on March 1, 2008, we expanded our operations beyond providing only contract drilling services and began providing production services. We believe the companies included in the new peer group index better reflect our peers with similar service offerings. The comparison assumes that $100 was invested on December 31, 2003 in our common stock, the companies that compose the AMEX Composite Index and the companies that compose the old and new peer group indexes, and further assumes all dividends were reinvested.
The companies that comprise the old peer group index are Helmerich & Payne, Inc., Grey Wolf, Inc., Patterson-UTI Energy, Inc., Nabors Industries Ltd. and Unit Corp. The companies that comprise the new peer group index are Patterson-UTI Energy, Inc., Nabors Industries Ltd., Bronco Drilling Company, Precision Drilling Trust and Key Energy Services.
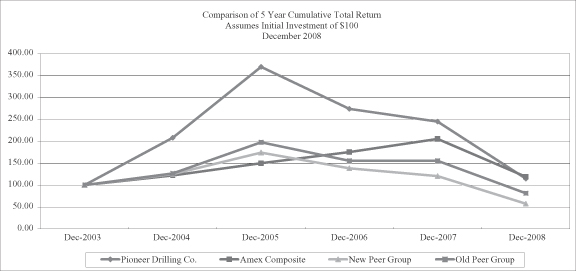
Equity Compensation Plan Information
The following table provides information on our equity compensation plans as of MarchDecember 31, 2005:2008:
| Plan category | | Number of securities to be
issued upon exercise of
outstanding options,
warrants and rights | | Weighted-average
exercise price per share
of outstanding options,
warrants and rights | | Number of securities
remaining available for
future issuance under equity
compensation plans
(excluding securities
reflected in column (a)) | | | Number of securities to be
issued upon exercise of
outstanding options,
warrants and rights | | Weighted-average
exercise price per share
of outstanding options,
warrants and rights | | Number of securities
remaining available for
future issuance under
equity compensation plans
(1) |
Equity compensation plans approved by security holders | | | 3,769,695 | | $ | 12.85 | | 2,035,073 |
Equity compensation plans not approved by security holders | | | — | | | — | | — |
| | (a) | | (b) | | (c) | | | | | | | |
Equity compensation plans approved by security holders | | 2,005,000 | | $ | 5.30 | | 1,906,413 | | |
Total | | | 3,769,695 | | $ | 12.85 | | 2,035,073 |
| | | | | | | | | | | | | |
Equity compensation plans not approved by security holders | | — | | — | | — | | |
Total | | 2,005,000 | | $ | 5.30 | | 1,906,413 | | |
Recent Sales of Unregistered Securities
On August 11, 2004, the entire $28,000,000 in aggregate principal amount of our 6.75% convertible subordinated debentures held by WEDGE Energy Services, L.L.C. and William H. White was converted in accordance with the terms of those debentures into 6,496,519 shares of our common stock. We issued those shares without registration under the Securities Act of 1933 in reliance on the exemption that Section 4(2) of that Act provides for transactions not involving any public offering.
| (1) | Includes 822,489 shares that may be issued in the form of restricted stock or restricted stock units under the Amended and Restated Pioneer Drilling Company 2007 Incentive Plan. |
Item 6. Selected Financial Data
| Item 6. | Selected Financial Data |
The following information derives from our audited financial statements. You should review this information in conjunction with “Management’s Discussion and Analysis of Financial Condition and Results of Operations” in Item 7 of this report and the historical financial statements and related notes this report contains.
| | Years Ended March 31, | |
| | 2005 | | 2004 | | 2003 | | 2002 | | 2001 | |
| | (In thousands, except per share amounts) | |
| | | | | | | | | | | |
Contract drilling revenues | | $ | 185,246 | | $ | 107,876 | | $ | 80,183 | | $ | 68,627 | | $ | 50,345 | |
Income (loss) from operations | | 18,774 | | 438 | | (4,943 | ) | 11,201 | | 3,803 | |
Income (loss) before income taxes | | 17,161 | | (2,216 | ) | (7,305 | ) | 9,737 | | 3,838 | |
Preferred dividends | | — | | — | | — | | 93 | | 275 | |
Net earnings (loss) applicable to common stockholders | | 10,812 | | (1,790 | ) | (5,086 | ) | 6,225 | | 2,428 | |
Earnings (loss) per common share-basic | | 0.31 | | (0.08 | ) | (0.31 | ) | 0.41 | | 0.22 | |
Earnings (loss) per common share-diluted | | 0.30 | | (0.08 | ) | (0.31 | ) | 0.35 | | 0.19 | |
Long-term debt and capital lease obligations, excluding current installments | | 13,445 | | 44,892 | | 45,855 | | 26,119 | | 10,056 | |
Shareholders' equity | | 221,615 | | 70,836 | | 47,672 | | 33,343 | | 17,827 | |
Total assets | | 276,009 | | 143,731 | | 119,694 | | 83,450 | | 56,493 | |
Capital expenditures | | 80,388 | | 44,845 | | 33,589 | | 27,597 | | 41,628 | |
| | | | | | | | | | | | | | | | |
| | | | | | | | | | | | | | | | | | | | |
| | | Year Ended
December 31,
2008 (1)(2) | | | Nine months
Ended
December 31,
2007 | | | Years Ended March 31, | |
| | | | 2007 | | | 2006 | | | 2005 | |
| | | (In thousands, except per share amounts) | |
Statement of Operations Data: | | | | | | | | | | | | | | | | | | | | |
Revenues | | $ | 610,884 | | | $ | 313,884 | | | $ | 416,178 | | | $ | 284,148 | | | $ | 185,246 | |
(Loss) income from operations | | | (43,954 | ) | | | 55,260 | | | | 126,976 | | | | 77,909 | | | | 18,774 | |
(Loss) income before income taxes | | | (56,688 | ) | | | 57,774 | | | | 130,789 | | | | 79,813 | | | | 17,161 | |
Net (loss) earnings applicable to common stockholders | | | (62,745 | ) | | | 39,645 | | | | 84,180 | | | | 50,567 | | | | 10,812 | |
(Loss) earnings per common share-basic | | $ | (1.26 | ) | | $ | 0.80 | | | $ | 1.70 | | | $ | 1.08 | | | $ | 0.31 | |
(Loss) earnings per common share-diluted | | $ | (1.26 | ) | | $ | 0.79 | | | $ | 1.68 | | | $ | 1.06 | | | $ | 0.30 | |
| | | | | |
Other Financial Data: | | | | | | | | | | | | | | | | | | | | |
Net cash provided by operating activities | | $ | 186,391 | | | $ | 115,455 | | | $ | 131,530 | | | $ | 97,084 | | | $ | 33,665 | |
Net cash used in investing activities | | | (505,615 | ) | | | (123,858 | ) | | | (137,960 | ) | | | (125,217 | ) | | | (75,320 | ) |
Net cash provided by financing activities | | | 269,342 | | | | 161 | | | | 201 | | | | 49,634 | | | | 109,513 | |
Capital expenditures | | | 148,096 | | | | 128,038 | | | | 147,230 | | | | 128,871 | | | | 80,388 | |
Refer to Note 2 of the consolidated financial statements for information on acquisitions.
| | | | | | | | | | | | | | | |
| | | As of December 31, | | As of March 31, |
| | | 2008 (1) | | 2007 | | 2007 | | 2006 | | 2005 |
| | | (In thousands) |
Balance Sheet Data: | | | | | | | | | | | | | | | |
Working capital | | $ | 64,372 | | $ | 99,807 | | $ | 124,089 | | $ | 106,904 | | $ | 76,327 |
Property and equipment, net | | | 627,562 | | | 417,022 | | | 342,901 | | | 260,783 | | | 170,566 |
Long-term debt and capital lease obligations, excluding current installments | | | 262,115 | | | — | | | — | | | — | | | 13,445 |
Shareholders’ equity | | | 414,118 | | | 471,072 | | | 428,109 | | | 340,676 | | | 221,615 |
Total assets | | | 824,479 | | | 560,212 | | | 501,495 | | | 400,678 | | | 276,009 |
17
| (1) | The statement of operations data and other financial data for the year ended December 31, 2008 and the balance sheet data as of December 31, 2008 includes the impact of the acquisitions of WEDGE and Competition, both of which occurred on March 1, 2008. See Note 2 to Consolidated Financial Statements, included in Part II, Item 8, Financial Statements and Supplementary Data, of this Annual Report on Form 10-K. |
| (2) | The statement of operations data and other financial data for the year ended December 31, 2008 reflect the impact of a goodwill impairment charge of $118.6 million and an intangible asset impairment charge of $52.8 million. See Note 1 to Consolidated Financial Statements, included in Part II, Item 8, Financial Statements and Supplementary Data, of this Annual Report on Form 10-K. |
| Item 7. | Management’s Discussion and Analysis of Financial Condition and Results of Operations |
Item 7.Management’s Discussion and Analysis of Financial Condition and Results of OperationsStatements we make in the following discussion that express a belief, expectation or intention, as well as those whichthat are not historical fact, are forward-looking statements that are subject to risks, uncertainties and assumptions. Our actual results, performance or achievements, or industry results, could differ materially from those we express in the following discussion as a result of a variety of factors, including general economic and business conditions and industry trends, the continued strength or weakness of the contract land drilling industry in the geographic areas in which we operate, decisions about onshore exploration and development projects to be made by oil and gas companies, the highly competitive nature of our business, our future financial performance, includingthe availability, terms and deployment of capital, the continued availability of qualified personnel, and changes in, or our failure or inability to comply with, government regulations, including those relating to the environment. We have discussed many of these factors in more detail elsewhere in this report, including under the headings “Special Note Regarding Forward-Looking Statements” in the Introductory Note to Part I and “Risk Factors” in Item 1A. These factors are not necessarily all the important factors that could affect us. Unpredictable or unknown factors we have not discussed in this report or could also have material adverse effect on actual results of matters that are the subject of our forward-looking statements. All forward-looking statements speak only as the date on which they are made and we undertake no duty to update or revise any forward-looking statements. We advise our shareholders that they should (1) be aware that important factors not referred to above could affect the accuracy of our forward-looking statements and (2) use caution and common sense when considering our forward-looking statements.
Company Overview
Pioneer Drilling Company provides contract land drilling services and production services to independent and major oil and gas exploration and production companies.companies throughout the United States and internationally in Colombia. Our company was incorporated in 1979 as the successor to a business that had been operating since 1968. Over the years, our business has grown through acquisitions and through organic growth. Since September 1999, we have significantly expanded our drilling rig fleet by adding 42 rigs through acquisitions and by adding 27 rigs through the construction of rigs from new and used components. On March 1, 2008, we significantly expanded our service offerings when we acquired the production services businesses of WEDGE Group Incorporated (“WEDGE”) for $314.7 million and Prairie Investors d/b/a Competition Wireline (“Competition”) for $30.0 million which provide well services, wireline services and fishing and rental services. We funded the WEDGE acquisition primarily with $311.5 million of borrowings under our $400 million senior secured revolving credit facility. As of February 23, 2009, the senior secured revolving credit facility had an outstanding balance of $257.5 million, all of which matures in February 2013. Drilling services and production services are fundamental to establishing and maintaining the flow of oil and natural gas throughout the productive life at a well site and enable us to meet multiple needs of our customers.
Business Segments
We currently conduct our operations through two operating segments: our Drilling Services Division and our Production Services Division. The following is a description of these two operating segments. Financial information about our operating segments is included in Note 11,Segment Information, of the Notes to Consolidated Financial Statements, included in Part II, Item 8,Financial Statements and Supplementary Data,of this Annual Report on Form 10-K.
| • | | Drilling Services Division—Our Drilling Services Division provides contract land drilling services with its fleet of 70 drilling rigs in the following locations: |
| | |
Drilling Division Locations | | Rig Count |
South Texas | | 17 |
East Texas | | 22 |
North Texas | | 9 |
Utah | | 6 |
North Dakota | | 6 |
Oklahoma | | 5 |
Colombia | | 5 |
As of February 23, 2009, 36 drilling rigs are operating, 29 drilling rigs are idle and five drilling rigs located in our Oklahoma drilling division have been placed in storage or “cold stacked” due to low demand for drilling rigs in this region. We are actively marketing all our idle drilling rigs and we are earning revenue on two of these rigs through early termination fees on their drilling contracts with a term expiring in March 2009 and May 2009. We are constructing a 1500 horsepower drilling rig that we expect to be completed and available for operation in the in our North Dakota drilling division under a contract with a three year term beginning March 2009. In addition, to our drilling rigs, we provide the drilling crews and most of the ancillary equipment needed to operate our drilling rigs. We have focused our operations in selected oil and natural gas production regions in the United States. Our company was incorporated in 1979 as the successor to a business that had been operating since 1968. We conduct our operations through our principal operating subsidiary, Pioneer Drilling Services, Ltd. We are an oil and gas services company. We do not invest in oil and natural gas properties. The drilling activity of our customers is highly dependent on the current price of oil and natural gas.
Our business strategy is to own and operate a high-quality fleet of land drilling rigs in active drilling markets, and position ourselves to maximize rig utilization and dayrates and to enhance shareholder value. We intend to continue making additions to our drilling fleet, either through acquisitions of businesses or selected assets or through the construction of new or refurbished drilling rigs.
Since September 1999, we have significantly expanded our fleet of drilling rigs through acquisitions and the construction of new and refurbished rigs. As of March 31, 2005 our rig fleet consisted of 50 land drilling rigs that drill in depth ranges between 6,000 and 18,000 feet. Fifteen of our rigs are operating in South Texas, 17 in East Texas, four in North Texas, five in western Oklahoma and nine in the Rocky Mountains. We actively market all of these rigs. We completed construction of our 50th rig in late March 2005 and began moving it to its first drilling location. We anticipate continued growth of our rig fleet in fiscal year 2006. We are currently constructing two 1000 horsepower electric rigs from new and used components.
We earn our revenues by drilling oil and gas wells for our customers. We obtain our contracts for drilling oil and natural gas wells either through competitive bidding or through direct negotiations with customers. Our drilling contracts generally provide for compensation on either a daywork, turnkey or footage basis. Contract terms generally depend on the complexity and risk of operations, the on-site drilling conditions, the type of equipment used and the anticipated duration of the work to be performed. Generally, our contracts provide for the drilling of a single well and typically permit the customer to terminate on short notice. However, we currently have thirteen contracts with terms of six months to two years in duration, including the contracts for the two rigs currently under construction.
| • | | Production Services Division—Our Production Services Division provides a broad range of well services to oil and gas drilling and producing companies, including workover services, wireline services, and fishing and rental services. Our production services operations are managed regionally and are concentrated in the major United States onshore oil and gas producing regions in the Gulf Coast, Mid-Continent, and Rocky Mountain states. We provide our services to a diverse group of oil and gas companies. The primary productions services we offer are the following: |
A significant performance measurement
Well Services. Existing and newly-drilled wells require a range of services to establish and maintain production over their useful lives. We use our fleet of 74 workover rigs in seven division locations to provide these required services, including maintenance of existing wells, workover of existing wells, completion of newly-drilled wells, and plugging and abandonment of wells at the end of their useful lives. We have a premium workover rig fleet consisting of sixty-nine 550 horseposewer rigs, four 600 horsepower rigs, and one 400 horsepower rig. The average age of this fleet is 1.4 years as of December 31, 2008. As of February 23, 2009, 62 workover rigs are operating and 12 workover rigs are idle with no crews assigned.
Wireline Services. In order for oil and gas companies to better understand the reservoirs they are drilling or producing, they require logging services to accurately characterize reservoir rocks and fluids. When a producing well is completed, they also must perforate the production casing to establish a flow path between the reservoir and the wellbore. We use our industry is rig utilization.fleet of 59 truck mounted wireline units in 15 division locations to provide these important logging and perforating services.
| We provide both open and cased-hole logging services, including the latest pulsed-neutron technology. In addition, we provide services which allow oil and gas companies to evaluate the integrity of wellbore casing, recover pipe, or install bridge plugs. Our truck mounted wireline units have an average age of 3.7 years as of December 31, 2008. |
Fishing and Rental Services. During drilling operations, oil and gas companies are often required to rent unique equipment such as power swivels, foam air units, blow-out preventers, air drilling equipment, pumps, tanks, pipe, tubing, and fishing tools. We compute rig utilization rates by dividing revenue days by total available days during a period. Total available days are the numberhave approximately $15 million worth of calendar days during the periodfishing and rental tools that we have owned the rig. Revenue days for each rig are days when the rig is earning revenues under a contract, which is usually a period from the date the rig begins moving to the drilling location until the rig is released from the contract.
For the three years ended March 31, 2005, our rig utilization, revenue daysprovide out of four locations in Texas and number of rigs were as follows:Oklahoma.
| | Years Ended March 31, | |
| | 2005 | | 2004 | | 2003 | |
Utilization Rates | | 96 | % | 88 | % | 79 | % |
Revenue Days | | 13,894 | | 8,764 | | 6,419 | |
Number of rigs | | 50 | | 35 | | 24 | |
The reasons for the increase in the number of revenue days in 2005 over 2004 and 2003 are the increase in size of our rig fleet and the improvement in our overall rig utilization rate due to improved market conditions. For 2006, we anticipate continued growth in revenue days and utilization rates comparable to 2005.
In addition to high commodity prices, we attribute our relatively high utilization rates to a strong sales effort, quality equipment, good field and operations personnel, a disciplined safety approach, and our generally successful performance of turnkey operations. Turnkey contracts currently account for approximately 12% of our contracts. Turnkey contracts provide us with the opportunity to keep our rigs working in periods of lower demand and improve our profitability, but at an increased risk. During periods of reduced demand for drilling
18
rigs, turnkey operating profit per revenue day has been greater than daywork operating profit; however, occasionally, a turnkey contract will be unprofitable if the contract cannot be completed successfully without unanticipated complications.
We devote substantial resources to maintaining and upgrading our rig fleet. During fiscal 2004, we removed three rigs from service for approximately three weeks each, to perform upgrades. In the short term, these actions resulted in fewer revenue days and slightly lower utilization; however, in the long term, we believe the upgrades will help the marketability of the rigs and improve their operating performance. We are currently performing or have recently performed, between contracts or as necessary, safety and equipment upgrades to the eight rigs we acquired in March 2004 and the 12 rigs we acquired in November and December 2004.
Market Conditions in Our Industry
In recent months, there has been substantial volatility and a decline in oil and natural gas prices due to the deteriorating global economic environment. In addition, there has been substantial uncertainty in the capital markets and access to financing is uncertain. These conditions have adversely affected our business environment. Our customers have curtailed their drilling programs and reduced their production activities, which has resulted in a decrease in demand for drilling and production services and a reduction in day rates and utilization. In addition, certain of our customers could experience an inability to pay suppliers in the event they are unable to access the capital markets to fund their business operations.
The United States contract land drillingDemand for oilfield services offered by our industry is highly cyclical. Volatilitya function of our customers’ willingness to make operating and capital expenditures to explore for, develop and produce hydrocarbons, which in turn is affected by current and expected levels of oil and natural gas prices. For three years before the end of 2008, domestic exploration and production spending increased as oil and natural gas prices increased. Oil and natural gas prices declined significantly at the end of 2008 and in recent months in a deteriorating global economic environment, and exploration and production companies have announced cuts in their exploration budgets for 2009. We expect these reductions in oil and gas prices can produce wide swingsexploration budgets to result in a reduction in our rig utilization and revenue rates in 2009. In addition, we may experience a shift to more turnkey and footage drilling contracts from daywork drilling contracts. For additional information concerning the levelseffects of overall drilling activity in the markets we serve and affect the demand for our drilling services and the dayrates we can charge for our rigs. The availability of financing sources, past trendsvolatility in oil and gas prices and the outlook for future oil and gas prices strongly influence the numberuncertainty in capital markets, see Item 1A—“Risk Factors” in Part I of wells oil and gas exploration and production companies decide to drill.this Annual Report on Form 10-K.
For the three months ended March 31, 2005, the average weekly spot price for West Texas Intermediate crude oil was $49.87, the average weekly spot price for Henry Hub natural gas was $6.39 and the average weekly Baker Hughes land rig count was 1,153. On May 20, 2005,February 6, 2009 the spot price for West Texas Intermediate crude oil was $46.80,$40.17, the spot price for Henry Hub natural gas was $6.36$4.67 and the Baker Hughes land rig count was 1,202,1,330, a 14% increase21% decrease from 1,0561,677 on May 21, 2004.
February 8, 2008. The average weekly spot prices of West Texas Intermediate crude oil and Henry Hub natural gas, and the average weekly domestic land rig count per the Baker Hughes land rig count, and the average monthly domestic workover rig count for the year ended December 31, 2008, the nine months ended December 31, 2007 and each of the previous sixfive years ended March 31 2005 were:
| | Years Ended March 31, | | | | | | | | | | | | | |
| | 2005 | | 2004 | | 2003 | | 2002 | | 2001 | | 2000 | | | Year Ended
December 31,
2008 | | Nine Months
Ended
December 31,
2007 | | Years Ended March 31, |
Oil (West Texas Intermediate) | | $ | 45.04 | | $ | 31.47 | | $ | 29.27 | | $ | 24.31 | | $ | 30.40 | | $ | 23.23 | | |
| | | | Year Ended
December 31,
2008 | | Nine Months
Ended
December 31,
2007 | | 2007 | | 2006 | | 2005 | | 2004 |
| | | | | | | | |
Intermediate) | | | $ | 99.86 | | $ | 77.42 | | $ | 64.96 | | $ | 59.94 | | $ | 45.04 | | $ | 31.47 |
Natural Gas (Henry Hub) | | $ | 5.99 | | $ | 5.27 | | $ | 4.24 | | $ | 2.96 | | $ | 5.27 | | $ | 2.46 | | | $ | 8.81 | | $ | 6.82 | | $ | 6.53 | | $ | 9.10 | | $ | 5.99 | | $ | 5.27 |
U.S. Land Rig Count | | 1,110 | | 964 | | 723 | | 912 | | 841 | | 550 | | | | 1,792 | | | 1,684 | | | 1,589 | | | 1,329 | | | 1,110 | | | 964 |
U.S. Workover Rig Count | | | | 2,514 | | | 2,394 | | | 2,376 | | | 2,271 | | | 2,087 | | | 1,996 |
Increased expenditures for exploration and production activities generally leads to increased demand for our drilling services and production services. Over the past several years, rising oil and natural gas prices and the corresponding increase in onshore oil and natural gas exploration and production spending led to expanded drilling and well service activity as reflected by the increases in the U.S. land rig counts and U.S. workover rig counts over the previous five years.
During fiscal 2005, 2004
With the recent decline in oil and 2003,natural gas prices due to the deteriorating global economic environment and the expected reductions in our rig utilization and revenue rates in 2009, our near-term strategy is to maintain a strong balance sheet and ample liquidity. Management has initiated certain cost reduction measures including workforce and wage rate reductions that will reduce operating expenses during the downturn in the industry cycle. Budgeted capital expenditures for 2009 represent routine capital expenditures necessary to keep our equipment in safe and efficient working order and limited discretionary capital expenditures of new equipment or upgrades of existing equipment. In addition, our marketing initiatives are focused on identifying regional opportunities and evaluating more turnkey drilling contract opportunities. We believe this near-term strategy will position us to take advantage of business opportunities and continue our long-term growth strategy.
Exploration and production spending is generally categorized as either a capital expenditure or an operating expenditure. Activities designed to add hydrocarbon reserves are classified as capital expenditures, while those associated with maintaining or accelerating production are categorized as operating expenditures.
Capital expenditures by oil and gas companies tend to be relatively sensitive to volatility in oil or natural gas prices because project decisions are tied to a return on investment spanning a number of years. As such, capital expenditure economics often require the use of commodity price forecasts which may prove inaccurate in the amount of time required to plan and execute a capital expenditure project (such as the drilling of a deep well). When commodity prices are depressed for even a short period of time, capital expenditure projects are routinely deferred until prices return to an acceptable level.
In contrast, both mandatory and discretionary operating expenditures are more stable than capital expenditures for exploration. Mandatory operating expenditure projects involve activities that cannot be avoided in the short term, such as regulatory compliance, safety, contractual obligations and projects to maintain the well and related infrastructure in operating condition. Discretionary operating expenditure projects may not be critical to the short-term viability of a lease or field, but these projects are less sensitive to commodity price volatility as compared to capital expenditures for exploration. Discretionary operating expenditure work is evaluated according to a simple short-term payout criterion which is far less dependent on commodity price forecasts.
Our business is influenced substantially by both operating and capital expenditures by exploration and production companies. Because existing oil and natural gas wells require ongoing spending to maintain production, expenditures by exploration and production companies for the maintenance of existing wells are relatively stable and predictable. In contrast, capital expenditures by exploration and production companies for exploration and drilling are more directly influenced by current and expected oil and natural gas prices and generally reflect the volatility of commodity prices.
Liquidity and Capital Resources
Sources of Capital Resources
Our principal sources of liquidity consist of: (i) cash and cash equivalents (which equaled $26.8 million as of December 31, 2008); (ii) cash generated from operations; and (iii) the unused portion of our senior secured revolving credit facility which has borrowing availability of $133.2 million as of February 23, 2009. There are no limitations on our ability to access the full borrowing availability under the senior secured revolving credit facility other than maintaining compliance with the covenants in the credit agreement. Our principal liquidity requirements have been for working capital needs, capital expenditures and acquisitions.
On February 29, 2008, we entered into a credit agreement with Wells Fargo Bank, N.A. and a syndicate of lenders (collectively the “Lenders”). The credit agreement provides for a senior secured revolving credit facility, with sub-limits for letters of credit and a swing-line facility of up to an aggregate principal amount of $400 million, all of which mature on February 28, 2013. The senior secured revolving credit facility and the obligations thereunder are secured by substantially all our domestic assets and are guaranteed by certain of our domestic subsidiaries. Borrowings under the wellssenior secured revolving credit facility bear interest, at our option, at
the bank prime rate or at the LIBOR rate, plus an applicable per annum margin in each case. The applicable per annum margin is determined based upon our leverage ratio in accordance with a pricing grid in the credit agreement. The per annum margin for LIBOR rate borrowings ranges from 1.50% to 2.50% and for bank prime rate borrowings ranges from 0.50% to 1.50%. Based on the terms in the credit agreement, the LIBOR margin and bank prime rate margin in effect until delivery of our financial statements and the compliance certificate for December 31, 2008 were 2.25% and 1.25%, respectively. A commitment fee is due quarterly based on the average daily unused amount of the commitments of the Lenders under the senior secured revolving credit facility. In addition, a fronting fee is due for each letter of credit issued and a quarterly letter of credit fee is due based on the average undrawn amount of letter of credit outstanding during such period. We may repay the senior secured revolving credit facility balance outstanding in whole or in part at any time without premium or penalty. The senior secured revolving credit facility replaced the $20.0 million credit facility we drilledpreviously had with Frost National Bank. Borrowings under the senior secured revolving credit facility were used to fund the WEDGE acquisition and are available for future acquisitions, working capital and other general corporate purposes.
At February 23, 2009, we had $257.5 million outstanding under the revolving portion of the senior secured revolving credit facility and $9.3 million in committed letters of credit. Under the terms of the credit agreement, committed letters of credit are applied against our customers were drilledborrowing capacity under the senior secured revolving credit facility. The borrowing availability under the senior secured revolving credit facility was $133.2 million at February 23, 2009. Principal payments of $15.0 million made after December 31, 2008 are classified in searchthe current portion of natural gaslong-term debt as of December 31, 2008. The outstanding balance under our senior secured credit facility is not due until maturity on February 28, 2013. However, when cash and working capital is sufficient, we may make principal payments to reduce the outstanding debt balance prior to maturity.
At December 31, 2008, we held $15.9 million (par value) of investments comprised of tax exempt, auction rate preferred securities (“ARPSs”), which are variable-rate preferred securities and have a long-term maturity with the interest rate being reset through “Dutch auctions” that are held every 7 days. The ARPSs have historically traded at par because of the depth capacityfrequent interest rate resets and because they are callable at par at the option of the issuer. Interest is paid at the end of each auction period. Our ARPSs are AAA/Aaa rated securities, collateralized by municipal bonds and backed by assets that are equal to or greater than 200% of the liquidation preference. Until February 2008, the auction rate securities market was highly liquid. Beginning mid-February 2008, we experienced several “failed” auctions, meaning that there was not enough demand to sell all of the securities that holders desired to sell at auction. The immediate effect of a failed auction is that such holders cannot sell the securities at auction and the interest rate on the security resets to a maximum auction rate. We have continued to receive interest payments on our ARPSs in accordance with their terms. Unless a future auction is successful or the issuer calls the security pursuant to redemption prior to maturity, we may not be able to access the funds we invested in our ARPSs without a loss of principal. We have no reason to believe that any of the underlying municipal securities that collateralize our ARPSs are presently at risk of default. We believe we will ultimately be able to liquidate our investments without material loss primarily due to the collateral securing the ARPSs. We do not currently intend to attempt to sell our ARPSs at a discount since our liquidity needs are expected to be met with cash flows from operating activities and our senior secured revolving credit facility. Our ARPSs are designated as available-for-sale and are reported at fair market value with the related unrealized gains or losses, included in accumulated other comprehensive income (loss), net of tax, a component of shareholders’ equity. The estimated fair value of our ARPSs at December 31, 2008 was $13.9 million compared with a par value of $15.9 million. The $2.0 million difference represents a fair value discount due to the current lack of liquidity which is considered temporary and is recorded as an unrealized loss. We would recognize an impairment charge if the fair value of our investments falls below the cost basis and is judged to be other-than-temporary. Our ARPSs are classified with other long-term assets on our consolidated balance sheet as of December 31, 2008 because of our inability to determine the recovery period of our investments.
Uses of Capital Resources
On March 1, 2008, we acquired the production services business of WEDGE which provided well services, wireline services and fishing and rental services with a fleet of 62 workover rigs, 45 wireline units and approximately $13 million of fishing and rental tools equipment through facilities in Texas, Kansas, North Dakota, Colorado, Montana, Utah and Oklahoma. The aggregate purchase price for the acquisition was approximately $314.7 million, which consisted of assets acquired of $340.8 million and liabilities assumed of $26.1 million. The aggregate purchase price included $3.4 million of costs incurred to acquire the production services business from WEDGE. We financed the acquisition with approximately $3.2 million of cash on hand and $311.5 million of debt incurred under our new $400 million senior secured revolving credit facility.
On March 1, 2008, immediately following the acquisition of the production services business from WEDGE, we acquired the production services business from Competition which provided wireline services with a fleet of 6 wireline units through its facilities in Montana. The aggregate purchase price for the Competition acquisition was approximately $30.0 million, which consisted of assets acquired of $30.1 million and liabilities assumed of $0.1 million. The aggregate purchase price includes $0.4 million of costs incurred to acquire the production services business from Competition. We financed the acquisition with $26.7 million cash on hand and a note payable due to the prior owner for $3.3 million.
On August 29, 2008, we acquired the wireline services business from Paltec. The aggregate purchase price was $7.8 million which we financed with $6.5 million in cash and a sellers note of $1.3 million. Intangible and other assets of $4.3 million and goodwill of $0.1 million were recorded in connection with the acquisition.
On October 1, 2008, we acquired the well services business from Pettus Well Service. The aggregated purchase price was $3.0 million which we financed with $2.8 million in cash and a sellers note of $0.2 million. Intangible and other assets of $1.2 million and goodwill of $0.1 million were recorded in connection with the acquisition.
For the year ended December 31, 2008 and the nine months ended December 31, 2007, the additions to our property and equipment consisted of the following (amounts in thousands):
| | | | | | |
| | | Year ended
December 31,
2008 | | Nine months ended
December 31,
2007 |
Drilling Services Division: | | | | | | |
Routine rigs | | $ | 17,860 | | $ | 16,029 |
Discretionary | | | 61,034 | | | 52,292 |
New-builds and acquisitions | | | 30,281 | | | 59,717 |
| | | | | | |
Total Drilling Services Division | | | 109,175 | | | 128,038 |
| | | | | | |
Production Services Division: | | | | | | |
Routine | | | 4,740 | | | — |
Discretionary | | | 1,175 | | | — |
New-builds and acquisitions | | | 33,006 | | | — |
| | | | | | |
Total Production Services Division | | | 38,921 | | | — |
| | | | | | |
| | $ | 148,096 | | $ | 128,038 |
| | | | | | |
We capitalized $0.3 million of interest costs in property and equipment for the year ended December 31, 2008 and no capitalized interest cost for the nine months ended December 31, 2007.
We constructed a 1500 horsepower drilling rig that was completed and placed into service in December 2008. As of December 31, 2008, we were constructing another 1500-horsepower drilling rig that we expect to complete and place in service in March 2009. Our Drilling Services Division incurred $28.4 million of rig
construction costs for these two 1500 horsepower drilling rigs during the year ended December 31, 2008. In addition, our Production Services Division incurred $20.2 million acquiring 14 workover rigs and $5.0 million acquiring 10 wireline units during the natural gas rich areasyear ended December 31, 2008. During the nine months ended December 31, 2007, we incurred $56.2 million to purchase and upgrade the 3 drilling rigs acquired for expansion into international markets.
For the fiscal year ending December 31, 2009, we project capital expenditures of approximately $84.5 million, comprised of newly approved capital expenditures of approximately $50.2 million for our Drilling Services Division and approximately $15.0 million for our Production Services Division and previously approved capital expenditures from 2008 of approximately $19.3 million that will be carried over and incurred in 2009. We expect to fund these capital expenditures primarily from operating cash flow in excess of our working capital and other normal cash flow requirements.
Working Capital
Our working capital was $64.4 million at December 31, 2008, compared to $99.8 million at December 31, 2007. Our current ratio, which we operate. Althoughcalculate by dividing our current assets by our current liabilities, was 1.8 at December 31, 2008 compared to 3.4 at December 31, 2007.
Our operations have historically generated cash flows sufficient to at least meet our requirements for debt service and normal capital expenditures. However, during periods when higher percentages of our drilling contracts are turnkey and footage contracts, our short-term working capital needs could increase.
The changes in the components of our working capital were as follows (amounts in thousands):
| | | | | | | | | | |
| | | December 31,
2008 | | December 31,
2007 | | Change | |
Cash and cash equivalents | | $ | 26,821 | | $ | 76,703 | | $ | (49,882 | ) |
Receivables, net | | | 87,161 | | | 47,370 | | | 39,791 | |
Unbilled receivables | | | 12,262 | | | 7,861 | | | 4,401 | |
Deferred income taxes | | | 6,270 | | | 3,670 | | | 2,600 | |
Inventory | | | 3,874 | | | 1,180 | | | 2,694 | |
Prepaid expenses and other current | | | 8,902 | | | 5,073 | | | 3,829 | |
| | | | | | | | | | |
Current assets | | | 145,290 | | | 141,857 | | | 3,433 | |
| | | | | | | | | | |
Accounts payable | | | 21,830 | | | 21,424 | | | 406 | |
Current portion of long-term debt | | | 17,298 | | | — | | | 17,298 | |
Prepaid drilling contracts | | | 1,171 | | | 1,933 | | | (762 | ) |
Accrued expenses—payroll and related employee costs | | | 13,592 | | | 5,172 | | | 8,420 | |
Accrued expenses—insurance premiums and deductibles | | | 17,520 | | | 9,548 | | | 7,972 | |
Accrued expenses—other | | | 9,507 | | | 3,973 | | | 5,534 | |
| | | | | | | | | | |
Current liabilities | | | 80,918 | | | 42,050 | | | 38,868 | |
| | | | | | | | | | |
Working capital | | $ | 64,372 | | $ | 99,807 | | $ | (35,435 | ) |
| | | | | | | | | | |
The decrease in cash and cash equivalents was primarily due to our use of $147.5 million for certain property and equipment expenditures, debt payments of $87.8 million and $39.2 million of cash to fund the WEDGE, Competition, Paltec, Inc. and Pettus Well Service acquisitions. These uses of cash and cash equivalents were partially offset by $186.4 million of cash provided by operating activities and borrowings under the credit line of $47.9 million.
The increase in our receivables at December 31, 2008 as compared to December 31, 2007 was due to receivables of $20.7 million at December 31, 2008 that relate to our new Production Services Division that was formed when we have recently diversifiedacquired the production services businesses of WEDGE and Competition on March 1, 2008, an
increase in receivables of $14.7 million for our Drilling Services Division and an increase of $4.4 million for federal income tax refunds. The increase in receivables for our Drilling Services Division is primarily due to a $2,774 per day increase in average revenue rates and a 3.5% increase in the number of revenue days for the quarter ended December 31, 2008, compared to the quarter ended December 31, 2007.
The increase in unbilled receivables at December 31, 2008 as compared to December 31, 2007 was primarily due to an increase in unbilled receivables of $4.5 million that relate to our drilling contracts in Colombia.
The increase in inventory at December 31, 2008 as compared to December 31, 2007 was primarily due to the addition of inventory of $1.6 million for our new Production Services Division and an increase of $1.1 million of inventory primarily related to our third, fourth and fifth drilling rigs that began operating in Colombia in February 2008, August 2008 and November 2008, respectively. We maintain inventories of replacement parts and supplies for our drilling rigs operating in Colombia to ensure efficient operations somewhatin geographically remote areas.
The increase in prepaid expenses and other current assets at December 31, 2008 as compared to December 31, 2007 is primarily due to $2.2 million in prepaid expenses and other current assets of our new Production Services Division. The increase also relates to additional prepaid insurance and deferred mobilization costs for the third, fourth and fifth drilling rigs that began operating in Colombia in 2008. In addition, prepaid expenses and other current assets increased by $0.9 million relating to funds held in a trust account that will be distributed to our former Chief Financial Officer on March 2, 2009 in accordance with the November 2004terms of the severance agreement and $0.7 million relating to funds held in escrow that will be paid to the former owner of Competition.
The increase in accounts payable was primarily due to $4.6 million for our new Production Services Division and an increase of $1.5 million in accounts payable for our expanded operations in Colombia during 2008. The overall increase in accounts payable was partially offset by a decrease in drilling equipment purchases that were accrued at December 31, 2008 as compared to December 31, 2007.
The increase in the current portion of long-term debt at December 31, 2008 is primarily due to principal payments that were made after December 31, 2008 to reduce the outstanding balance of our senior secured revolving credit facility and the current portion of our subordinated notes payable. The outstanding balance under our senior secured credit facility is not due until maturity on February 28, 2013. However, when cash and working capital is sufficient, we may make principal payments to reduce the outstanding debt balance prior to maturity.
The increase in accrued payroll and related employee costs was due to an increase in the number of employees primarily due to our new Production Services Division and an increase in the number of days represented in the payroll accrual at December 31, 2008 as compared to December 31, 2007. In addition, accrued payroll and related employee costs increased due to the payment obligation of $0.9 million to our former Chief Financial Officer.
The increase in accrued insurance premiums and deductibles was primarily due to increases in costs incurred for the self-insurance portion of our health and workers compensation insurance and other insurance costs during the year ended December 31, 2008 as compared to December 31, 2007.
The increase in other accrued expenses at December 31, 2008 as compared to December 31, 2007 is primarily due to $1.8 million in accrued expenses of our new Production Services Division and an increase of $1.5 million relating to our expanded operations in Colombia during 2008. In addition, accrued expenses increased due to a payment obligation of $0.7 million to the former owner of Competition, as noted in the prepaid and other current asset description above.
Long-term Debt
Long-term debt as of December 31, 2008 consists of the following (amounts in thousands):
| | | | |
Senior secured credit facility | | $ | 272,500 | |
Subordinated notes payable | | | 6,534 | |
Other | | | 379 | |
| | | | |
| | | 279,413 | |
Less current portion | | | (17,298 | ) |
| | | | |
| | $ | 262,115 | |
| | | | |
Contractual Obligations
The following table includes all our contractual obligations of the types specified below at December 31, 2008 (amounts in thousands):
| | | | | | | | | | | | | | | |
| | | Payments Due by Period |
Contractual Obligations | | Total | | Less than 1
year | | 2-3 years | | 4-5 years | | More than 5
years |
Long-term debt | | $ | 279,413 | | $ | 17,298 | | $ | 3,314 | | $ | 258,801 | | $ | — |
Interest on long term debt | | | 29,097 | | | 7,181 | | | 13,973 | | | 7,943 | | | — |
Purchase commitments | | | 35,876 | | | 30,754 | | | 5,122 | | | — | | | — |
Operating leases | | | 4,803 | | | 1,566 | | | 2,228 | | | 1,009 | | | — |
Restricted cash obligation | | | 4,140 | | | 1,540 | | | 1,300 | | | 1,300 | | | — |
Other | | | 100 | | | 100 | | | — | | | — | | | — |
| | | | | | | | | | | | | | | |
Total | | $ | 353,429 | | $ | 58,439 | | $ | 25,937 | | $ | 269,053 | | $ | — |
| | | | | | | | | | | | | | | |
Long-term debt consists of $272.5 million outstanding under our senior secured credit facility, $6.5 million outstanding under subordinated notes payable to certain employees that are former shareholders of previously acquired production services businesses and other debt of $0.4 million. The outstanding balance under our senior secured credit facility is not due until maturity on February 28, 2013, but principal payments of $15.0 million made after December 31, 2008 are classified in the current portion of long-term debt as of December 31, 2008. We may make principal payments to reduce the outstanding debt balance prior to maturity when cash and working capital is sufficient.
Interest payment obligations on our senior secured credit facility are estimated based on (1) interest rates that are in effect on February 6, 2009, (2) $15.0 million of principal payments that have been made after December 31, 2008 to reduce the outstanding principal balance, and (3) the remaining principal balance of $257.5 million to be paid at maturity in February 2013. Interest payment obligations on our subordinated notes payable are based on interest rates ranging from 5.44% to 14%, with quarterly payments of principal and interest and final maturity dates ranging from January 2009 to March 2013.
Purchase obligations primarily relate to drilling rig and workover rig upgrades, acquisitions or new construction.
Operating leases consist of lease agreements with terms in excess of one year for office space, operating facilities, equipment and personal property.
As of December 31, 2008, we had restricted cash in the amount of $3.3 million held in an escrow account to be used for future payments in connection with the acquisition of seven drilling rigsCompetition. The former owner of Competition will receive annual installments of $0.7 million payable over a five year term from Wolverine Drilling, with six of those rigs employed in search of oilthe escrow account. In addition, we had restricted cash in the Williston Basinamount of $0.9 million in a trust account that will be distributed to our former Chief Financial Officer on March 2, 2009 in accordance with the terms of the Rocky Mountains,severance agreement.
Debt Requirements
Effective June 11, 2008, we entered into a Waiver Agreement with the Lenders to waive the requirement to provide certain financial statements in conjunction with our customers remain primarily focusedcompliance certificate within the time period required by the credit agreement. The Waiver Agreement required us to provide the financial statements and our compliance certificate on drillingor before August 13, 2008. Until we provided these financial statements and our compliance certificate, the aggregate principal amount outstanding under the credit agreement could not exceed $350 million at any time (provided, however, that the commitment fee would continue to be calculated based on the total commitment of $400 million), and the per annum margin applicable to all amounts outstanding under the credit agreement would increase from the current rate of 2.25% for natural gas. Natural gas reserves are typically foundLIBOR rate borrowings and 1.25% for bank prime rate borrowings to 2.50% for LIBOR rate borrowings and 1.50% for bank prime rate borrowings. The required financial statements and our compliance certificate were delivered concurrently with the filing of the Quarterly Report on Form 10-Q for the quarterly period ended March 31, 2008 which occurred on August 5, 2008.
At December 31, 2008, we were in deeper geological formations and generally require premium equipment and quality crews to drillcompliance with the wells.restrictive covenants contained in the credit agreement which include the following:
We must have a maximum consolidated leverage ratio no greater than 3.00 to 1.00 for any fiscal quarter through March 31, 2009, 2.75 to 1.00 for any fiscal quarter ending June 30, 2009 through March 31, 2010, and 2.50 to 1.00 for any fiscal quarter ending June 30, 2010 through maturity in February 2013;
If our maximum consolidated leverage ratio is greater than 2.25 to 1.00 at the end of any fiscal quarter, then we must have a minimum asset coverage ratio no less than 1.25 to 1.00; and
We must have a minimum interest coverage ratio no less than 3.00 to 1.00.
At December 31, 2008, our consolidated leverage ratio was 1.28 to 1.00 and our interest coverage ratio was 17.15 to 1.00. The credit agreement has additional restrictive covenants that, among other things, limit the incurrence of additional debt to a maximum of $15 million (other than debt under the senior secured revolving credit facility), investments, liens, dividends, acquisitions, redemptions of capital stock, prepayments of indebtedness, asset dispositions, mergers and consolidations, transactions with affiliates, capital expenditures, hedging contracts, sale leasebacks and other matters customarily restricted in such agreements. In addition, the credit agreement contains customary events of default, including without limitation, payment defaults, breaches of representations and warranties, covenant defaults, cross-defaults to certain other material indebtedness in excess of specified amounts, certain events of bankruptcy and insolvency, judgment defaults in excess of specified amounts, failure of any guaranty or security document supporting the credit agreement and change of control. Non-compliance with restrictive covenants or other events of default under the credit agreement could trigger an early repayment requirement and terminate the senior secured revolving credit facility.
Critical Accounting Policies and Estimates
Revenue and cost recognition– We earn our
Our Drilling Services Division earns revenues by drilling oil and gas wells for our customers under daywork, turnkey or footage contracts, which usually provide for the drilling of a single well. We recognize revenues on daywork contracts for the days completed based on the dayrate each contract specifies. We recognize revenues from our turnkey and footage contracts on the percentage-of-completion method based on our estimate of the number of days to complete each contract. Contract drilling in progress represents revenues we have recognized in excess of amounts billed on contracts in progress. Individual contracts are usually completed in less than 60 days. The risks to us under a turnkey contract and, to a lesser extent, under footage contracts, are substantially greater than on a contract drilled on a daywork basis. Under a turnkey contract, we assume most of the risks associated with drilling operations that are generally assumed by the operator in a daywork contract, including the risks of blowout, loss of hole, stuck drill pipe, machinery breakdowns and abnormal drilling conditions, as well as risks associated with subcontractors’ services, supplies, cost escalations and personnel operations.
Our management has determined that it is appropriate to use the percentage-of-completion method, as defined in SOPthe American Institute of Certified Public Accountants’ Statement of Position 81-1, to recognize revenue on our turnkey and footage contracts. Although our turnkey and footage contracts do not have express terms that provide us with rights to receive payment for the work that we perform prior to drilling wells to the agreed-on depth, we use this method because, as provided in applicable accounting literature, we believe we achieve a continuous sale for our work-in-progress and believe, under applicable state law, we ultimately could recover the fair value of our work-in-progress even in the event we were unable to drill to the agreed-on depth in breach of the applicable contract. However, in the event we were unable to drill to the agreed onagreed-on depth in breach of the contract, ultimate recovery of that value would be subject to negotiations with the customer and the possibility of litigation.
If a customer defaults on its payment obligation to us under a turnkey or footage contract, we would need to rely on applicable law to enforce our lien rights, because our turnkey and footage contracts do not expressly grant to us a security interest in the work we have completed under the contract and we have no ownership rights in the work-in-progress or completed drilling work, except any rights arising
19
under the applicable lien statute on foreclosure. If we were unable to drill to the agreed onagreed-on depth in breach of the contract, we also would need to rely on equitable remedies outside of the contract, including quantum meruit,, available in applicable courts to recover the fair value of our work-in-progress under a turnkey or footage contract.
We accrue estimated contract costs on turnkey and footage contracts for each day of work completed based on our estimate of the total costs to complete the contract divided by our estimate of the number of days to complete the contract. Contract costs include labor, materials, supplies, repairs and maintenance, operating overhead allocations and allocations of depreciation and amortization expense. In addition, the occurrence of uninsured or under-insured losses or operating cost overruns on our turnkey and footage contracts could have a material adverse effect on our financial position and results of operations.Therefore, our actual results for a contract could differ significantly if our cost estimates for that contract are later revised from our original cost estimates for contractsa contract in progress at the end of a reporting period which werewas not completed prior to the release of our financial statements.
With most drilling contracts, we receive payments contractually designated for the mobilization of rigs and other equipment. Payments received, and costs incurred for the mobilization services are deferred and recognized on a straight line basis over the contract term of certain drilling contracts. Costs incurred to relocate rigs and other drilling equipment to areas in which a contract has not been secured are expensed as incurred. Reimbursements that we receive for out-of-pocket expenses are recorded as revenue and the out-of-pocket expenses for which they relate are recorded as operating costs.
The asset “unbilled receivables” represents revenues we have recognized in excess of amounts billed on drilling contracts and production services in progress. The asset “prepaid expenses and other” includes deferred mobilization costs for certain drilling contracts. The liability “prepaid drilling contracts” represents deferred mobilization revenues for certain drilling contracts and amounts collected on contracts in excess of revenues recognized.
Our Production Services Division earns revenues for well services, wireline services and fishing and rental services pursuant to master services agreements based on purchase orders, contracts or other persuasive evidence of an arrangement with the customer that include fixed or determinable prices. Production service revenue is recognized when the service has been rendered and collectibility is reasonably assured.
Long-lived Assets and Intangible Assets
We evaluate for potential impairment of long-lived assets and intangible assets subject to amortization when indicators of impairment are present, as defined in SFAS No. 144,Accounting for the Impairment or Disposal of Long-Lived Assets. Circumstances that could indicate a potential impairment include significant adverse changes in industry trends, economic climate, legal factors, and an adverse action or assessment by a regulator. More
Asset impairments – We assess
specifically, significant adverse changes in industry trends include significant declines in revenue rates, utilization rates, oil and natural gas market prices and industry rig counts for drilling rigs and workover rigs. In performing the impairment evaluation, we estimate the future undiscounted net cash flows relating to long-lived assets and intangible assets grouped at the lowest level that cash flows can be identified. For our Production Services Division, our long-lived assets and intangible assets are grouped at the reporting unit level which is one level below the operating segment level. For our Drilling Services Division, we perform an impairment evaluation and estimate future undiscounted cash flows for individual drilling rig assets. If the sum of the estimated future undiscounted net cash flows is less than the carrying amount of the long-lived assets and intangible assets for these asset grouping levels, then we would recognize an impairment charge. The amount of an impairment charge would be measured as the difference between the carrying amount and the fair value of these assets. The assumptions used in the impairment evaluation for long-lived assets and intangible assets are inherently uncertain and require management judgment.
We performed an impairment analysis of our long-lived assets and intangible assets at December 31, 2008, due to significant adverse changes in the economic and business climate that resulted in decreases in estimated revenues, margins and cash flows. Essentially all our intangible assets were recorded in connection with the acquisitions of the production services businesses from WEDGE, Competition, Pettus and Paltec when revenues, margins and cash flows were at historically high levels earlier in 2008. We determined that the sum of the estimated future undiscounted net cash flows is less than the carrying amount of the long-lived assets and intangible assets in each reporting unit at December 31, 2008. Our long-lived asset and intangible asset impairment analysis for the reporting units in our Production Services Division resulted in no impairment charge to property and equipment wheneverand a non-cash impairment charge of $52.8 million to the carrying value of our intangible assets for customers relationships for the year ended December 31, 2008. For our Drilling Services Division, we have not recorded an impairment charge on any long-lived assets for the year ended December 31, 2008. The assumptions used in the impairment evaluation for long-lived assets and intangible assets are inherently uncertain and require management judgment. This impairment charge is not expected to have an impact on our liquidity or debt covenants; however, it is a reflection of the overall downturn in our industry and decline in our projected cash flows.
Goodwill
Goodwill results from business acquisitions and represents the excess of acquisition costs over the fair value of the net assets acquired. We account for goodwill and other intangible assets under the provisions of SFAS No. 142,Goodwill and Other Intangible Assets. Goodwill is tested for impairment annually as of December 31 or more frequently if events or changes in circumstances indicate that the asset might be impaired. Circumstances that could indicate a potential impairment include a significant adverse change in the economic or business climate, a significant adverse change in legal factors, an adverse action or assessment by a regulator, unanticipated competition, loss of key personnel and the likelihood that a reporting unit or significant portion of a reporting unit will be sold or otherwise disposed of. These circumstances could lead to our net book value exceeding our market capitalization which is another indicator of a potential impairment in goodwill. SFAS No. 142 requires a two-step process for testing impairment. First, the fair value of each reporting unit is compared to its carrying value may not be recoverable. Factorsto determine whether an indication of impairment exists. All our goodwill is related to our Production Services Division operating segment and is allocated to its three reporting units which are well services, wireline services and fishing and rental services. Second, if impairment is indicated, then the fair value of the reporting unit’s goodwill is determined by allocating the unit’s fair value to its assets and liabilities (including any unrecognized intangible assets) as if the reporting unit had been acquired in a business combination on the impairment test date. The amount of impairment for goodwill is measured as the excess of the carrying value of the reporting unit over its fair value.
When estimating fair values of a reporting unit for our goodwill impairment test, we use a combination of an income approach and a market approach which incorporates both management’s views and those of the market. The income approach provides an estimated fair value based on each reporting unit’s anticipated cash
flows that we consider importantare discounted using a weighted average cost of capital rate. The market approach provides an estimated fair value based on our market capitalization that is computed using the 30-day average market price of our common stock and which could trigger anthe number of shares outstanding as of the impairment review would be our customers’ financial conditiontest date. The estimated fair values computed using the income approach and any significant negative industry or economic trends. More specifically, among other things, we consider our contract revenue rates, our rig utilizations rates,the market approach are then equally weighted and combined into a single fair value. The primary assumptions used in the income approach are estimated cash flows and weighted average cost of capital. Estimated cash flows are primarily based on projected revenues, operating costs and capital expenditures and are discounted based on comparable industry average rates for weighted average cost of capital. We utilized discount rates based on weighted average cost of capital ranging from our drilling rigs, current oil and gas prices, industry analysts’ outlook for the industry and their view15.8% to 16.7% when we estimated fair values of our customers’ accessreporting units as of December 31, 2008. The primary assumptions used in the market approach is the allocation of total market capitalization to debt or equity, discussions with majoreach reporting unit, which is based on projected EBITDA percentages for each reporting unit, and control premiums, which are based on comparable industry suppliers, discussions with officersaverages. We utilized a 30% control premium when we estimated fair values of our primary lender regarding their experiences and expectations for oil and gas operators in our areasreporting units as of operations andDecember 31, 2008. To ensure the trends inreasonableness of the price of used drilling equipment observed by our management. If a reviewestimated fair values of our drilling rigs indicates that our carrying value exceeds the estimated undiscounted future net cash flows,reporting units, we are required under applicable accounting standards to write down the drilling equipment to its fair market value. A one percent write-down in the costperform a reconciliation of our drilling equipment,total market capitalization to the total estimated fair value of all our reporting units. The assumptions used in estimating fair values of reporting units and performing the goodwill impairment test are inherently uncertain and require management judgment.
Our common stock price per share declined in market value from $13.30 at MarchSeptember 30, 2008, to $5.57 at December 31, 2005, would have2008, which resulted in a corresponding decrease in our net earningsbook value exceeding our market capitalization during most of approximately $1,427,000 forthis time period. We believe the decline in the market price of our fiscalcommon stock resulted from a significant adverse change in the economic and business climate as financial markets reacted to the credit crisis facing major lending institutions and worsening conditions in the overall economy during the fourth quarter of the year ended December 31, 2008. During the same time, there were significant declines in oil and natural gas prices which lead to declines in production service revenues, margins and cash flows. We considered the impact of these significant adverse changes in the economic and business climate as we performed our annual impairment assessment of goodwill as of December 31, 2008. The estimated fair values of our reporting units were negatively impacted by significant reductions in estimated cash flows for the income approach component and a significant reduction in our market capitalization for the market approach component of our fair value estimation process. Our goodwill was initially recorded in connection with the acquisitions of the production services businesses from WEDGE, Competition, Pettus and Paltec, all of which occurred between March 1, 2008 and October 1, 2008, when production service revenues, margins and cash flows and our market capitalization were at historically high levels.
Our goodwill impairment analysis lead us to conclude that there would be no remaining implied value attributable to our goodwill and accordingly, we recorded a non-cash charge of $118.6 million to our operating results for the year ended December 31, 2005.2008, for the full impairment of our goodwill. Our goodwill impairment analysis would have lead to the same full impairment conclusion if we increased or decreased our discount rates or control premiums by 10% when estimating the fair values of our reporting units. This impairment charge is not expected to have an impact on our liquidity or debt covenants; however, it is a reflection of the overall downturn in our industry and decline in our projected cash flows.
Deferred taxes–
We provide deferred taxes for net operating loss carryforwards and for the basis differencedifferences in our property and equipment between financial reporting and tax reporting purposes and other costs such as compensation, foreign net operating loss carryforwards, employee benefit and other accrued liabilities which are deducted in different periods for financial reporting and tax reporting purposes. For property and equipment, basis differences arise from differences in depreciation periods and methods and the value of assets acquired in a business acquisition where we acquire an entity rather than just its assets. For financial reporting purposes, we depreciate the various components of our drilling rigs, workover rigs and wireline units over eight2 to 1525 years and refurbishments over three3 to 5 years, while federal income tax rules require that we depreciate drilling rigs, workover rigs, wireline units and refurbishments over five5 years. Therefore, in the first five5 years of our ownership of a drilling rig, workover rig or wireline unit, our
tax depreciation exceeds our financial reporting depreciation, resulting in our providing deferred taxes on this depreciation difference. After five5 years, financial reporting depreciation exceeds tax depreciation, and the deferred tax liability begins to reverse.
Accounting estimates –
We consider the recognition of revenues and costs on turnkey and footage contracts to be critical accounting estimates. On these types of contracts, we are required to estimate the number of days it will requireneeded for us to complete the contract and our total cost to complete the contract. Our actual costs could substantially exceed our estimated costs if we encounter problems such as lost circulation, stuck drill pipe or an underground blowout on contracts still in progress subsequent to the release of the financial statements.
We receive payment under turnkey and footage contracts when we deliver to our customer a well completed to the depth specified in the contract, unless the customer authorizes us to drill to a shallowermore shallow depth. Since 1995, when current management joined our company, we have completed all our turnkey or footage contracts. Although our initial cost estimates for turnkey and footage contracts do not include cost estimates for risks such as stuck drill pipe or loss of circulation, we believe that our experienced management team, our knowledge of geologic formations in our areas of operations, the condition of our drilling equipment and our experienced crews enablehave previously enabled us to make reasonably dependablereasonable cost estimates and complete contracts according to our drilling plan. While we do bear the risk of loss for cost overruns and other events that are not specifically provided for in our initial cost estimates, our pricing of turnkey and footage contracts takes such risks into consideration. When we encounter, during the course of our drilling operations, conditions unforeseen in the preparation of our original cost estimate, we immediately increase our cost estimate to complete the contracts.contract. If we anticipate a loss on a contract in progress at the end of a reporting period due to a change in our cost estimate, we immediately accrue the entire amount of the estimated loss, including all costs that are included in our revised estimated cost to complete that contract, in our consolidated statement of operations for that reporting period. During fiscalthe year 2005,ended December 31, 2008, we experienced losses on 17six of the 18281 turnkey and footage contracts completed, with losses exceedinga loss of less than $25,000 each on tenthree of these contracts and losses exceeding $100,000a loss of less than $130,000 each on fourthe remaining three contracts. We are more likely to encounter losses on turnkey and footage contracts in yearsperiods in which revenue rates are lower for all types of contracts. During periods of reduced demand for drilling rigs, our overall profitability on turnkey and footage contracts has historically exceeded our profitability on daywork contracts.
Revenues and costs during a reporting period could be affected for contracts in progress at the end of a reporting period which have not been completed before our financial statements for that period are released. All of ourWe did not have any turnkey or footage contracts in progress at MarchDecember 31, 2005 were completed prior to the release2008. Our unbilled receivables of the financial statements included in this report. At March$12.3 million at December 31, 2005 our contract drilling in progress totaled approximately $5,365,000. Of that amount accrued, turnkey and footage contract revenues were approximately $2,344,000. The remaining balance of approximately $3,021,000 relates to the revenue recognized but2008 did not yet billed on daywork contracts in progress at March 31, 2005. At March 31, 2004, drilling in progress totaled $9,131,000 of which $7,683,000include any amounts related to turnkey contracts and $1,488,000 related to dayworkor footage contracts.
20
We estimate an allowance for doubtful accounts based on the creditworthiness of our customers as well as general economic conditions. We evaluate the creditworthiness of our customers based on commercial credit reports, trade references, bank references, financial information, obtained from major industry suppliers, current prices of oil and gasproduction information and any past experience we have with the customer. Consequently, an adverseany change in those factors could affect our estimate of our allowance for doubtful accounts. In some instances, we require new customers to establish escrow accounts or make prepayments. We typically invoice our customers at 15-day intervals during the performance of daywork contracts and upon completion of the daywork contract. Turnkey and footage contracts are invoiced upon completion of the contract. Our typical contract provides for payment of invoices in 10 to 30 days. We generally do not extend payment terms beyond 30 days and have not extended payment terms beyond 6090 days for any of our contracts in the last three fiscal years. We establishedhad an allowance for doubtful accounts of $352,000$1.6 million at MarchDecember 31, 2005, an increase of $242,000 from $110,0002008 and no allowance for doubtful accounts at MarchDecember 31, 2004.2007.
Another critical estimate is ourOur determination of the useful lives of our depreciable assets, which directly affects our determination of depreciation expense and deferred taxes.taxes is also a critical accounting estimate. A decrease in the useful life of our drillingproperty and equipment would increase depreciation expense and reduce deferred taxes. We provide for depreciation of our drilling, production, transportation and other equipment on a straight-line method over useful lives that we have estimated and that range from three2 to 1525 years. We record the same depreciation expense whether
a drilling rig, workover rig or wireline unit is idle or working. Our estimates of the useful lives of our drilling, production, transportation and other equipment are based on our more than 35 years of experience in the drillingoilfield services industry with similar equipment. Effective January 1, 2008, we reassessed the estimated useful lives assigned to a group of 19 drilling rigs that were recently constructed. These drilling rigs were constructed with new components that have longer estimated useful lives when compared to other drilling rigs that are equipped with older components. As a result, we increased the estimated useful lives for this group of recently constructed drilling rigs from an average useful life of 9 years to 12 years. This change in the estimated useful lives of this group of 19 drilling rigs resulted in a $3.8 million decrease in depreciation and amortization expense for the year ended December 31, 2008.
As of December 31, 2008, we had foreign deferred tax assets consisting of foreign net operating losses and other tax benefits available to reduce future taxable income in a foreign jurisdiction. In assessing the realizability of our foreign deferred tax assets, we only recognize a tax benefit to the extent of taxable income that we expect to earn in the foreign jurisdiction in future periods. Due to recent declines in oil and natural gas prices and the downturn in our industry, we anticipate reductions in drilling rig utilization and revenue rates in 2009. Consequently, we have a valuation allowance of $5.4 million that fully offsets our foreign deferred tax assets. The foreign net operating loss has an indefinite carryforward period. The foreign net operating loss is primarily due to the special income tax benefits permitted by the Colombian government that allows us to recover 140% of the cost of certain imported assets. We exported a 1500 horsepower drilling rig to Colombia in October 2008. To obtain this special income tax benefit, our U.S operating company sold this drilling rig in October 2008 to Stayton Asset Group, a variable interest entity established for this transaction for which we are the primary beneficiary. Stayton Asset Group immediately sold this drilling rig to our operating entity in Colombia.
Our other accrued expensesinsurance premiums and deductibles as of MarchDecember 31, 20052008 include an accrual of approximately $1,334,000accruals for costs incurred under the self-insurance portion of our health insurance of approximately $1.1 million and under our workers’ compensation, insurance.general liability and auto liability insurance of approximately $9.6 million. We have a deductible of (1) $100,000$125,000 per covered individual per year under the health insurance and (2) $250,000insurance. We have a deductible of $500,000 per occurrence under our workers’ compensation insurance, except in North Dakota, where the deductible is $100,000.we do not have a deductible. We have deductibles of $250,000 and $100,000 per occurrence under our general liability insurance and auto liability insurance, respectively. We accrue for these costs as claims are incurred based on historical claim development data, and we accrue the costs of administrative services associated with claims processing. We also evaluate our workers’ compensation claim cost estimates established for each claimbased on estimates provided by a professional actuary.
Results of Operations
Effective March 1, 2008, we acquired the insurance companies providingproduction services businesses of WEDGE and Competition which provide well services, wireline services and fishing and rental services. These acquisitions resulted in the administrative services for processingformation of our new operating segment, the claims, including an estimate for incurred but not reported claims, estimates for claims paid directly by us,Production Services Division. We consolidated the results of these acquisitions from the day they were acquired. These acquisitions affect the comparability from period to period of our estimate of the administrative costs associated with these claimshistorical results, and our historical experience with these types of claims. Management evaluates these cost estimates by the insurance companies based on historical claim information and adjusts the accrued claim costs if deemed necessary.
Liquidity and Capital Resources
Sources of Capital Resources
Our rig fleet has grown from eight rigs in August 2000 to 50 rigs as of March 31, 2005. We have financed this growth with a combination of debt and equity financing. We have raised additional equity or used equity for growth eight times since January 2000 and have increased our long-term debt from approximately $3,909,000 at June 30, 2000 to approximately $18,200,000 at March 31, 2005. We plan to continue to grow our rig fleet. At March 31, 2005, our total debt to total capital was approximately 7.6%. Due to the volatility in our industry, we are reluctant to take on substantial additional debt in excess of the $20,000,000 of remaining availability under our acquisition credit facility. However, our ability to continue funding our growth through the issuance of sharesresults may not be indicative of our common stock is uncertain, as our common stock is not heavily traded and the market price for our common stock has been volatile in recent periods.future results.
On February 20, 2004, we sold 4,400,000 shares of our common stock at $5.40 per share in a private placement to accredited investors for $23,760,000 in proceeds, before related offering expenses.
On August 11, 2004, the entire $28,000,000 in aggregate principal amount of our 6.75% convertible subordinated debentures held by WEDGE Energy Services, L.L.C. and William H. White was converted in accordance with the terms of those debentures into 6,496,519 shares of our common stock.
On August 11, 2004, we also sold 4,000,000 shares of our common stock at approximately $6.61 per share, net of underwriters’ commissions, pursuant to a public offering we registered with the SEC. On August 31, 2004, we sold 600,000 additional shares of our common stock at approximately $6.61 per share, net of underwriters’ commissions, pursuant to the underwriters’ exercise of an over-allotment option granted in connection with that public offering.
On March 22, 2005, we sold 6,945,000 shares of our common stock, including shares we sold pursuant to the underwriters’ exercise of an over-allotment option, at approximately $11.78 per share, net of underwriters’ commissions, pursuant to a public offering we registered with the SEC.
On October 29, 2004, we entered into a $47,000,000 credit facility with a group of lenders consisting of a $7,000,000 revolving line and letter of credit facility and a $40,000,000 acquisition facility for the acquisition of drilling rigs, rig transportation equipment and associated equipment. Frost National Bank is the administrative agent and lead arranger under the new credit facility, and the lenders include Frost National Bank, the Bank of Scotland and Zions First National Bank. Borrowings under the new credit facility bear interest at a rate equal to Frost National Bank’s prime rate (5.75% at March 31, 2005) and are secured by most of our assets, including all our drilling rigs, associated equipment and receivables. As described below, we borrowed the entire $40,000,000 available under the acquisition facility and we have used approximately $2,825,000 of availability under the revolving line and letter of credit facility through the issuance of letters of credit in the ordinary course of
21
business. On March 29, 2005, we repaid $20,000,000 of the borrowings under the acquisition facility. On May 11, 2005, the lenders agreed to an amendment to the acquisition facility to provide us with the ability to draw an additional $20,000,000 for future acquisitions. The remaining approximately $20,0000,000 and $4,175,000 of availability under the acquisition facility and the revolving line and letter of credit facility, respectively, should remain available to us until those facilities mature in October 2006 and October 2005, respectively.
Uses of Capital Resources
In late May 2004 and late December 2004, we completed constructing, primarily from used components, two 1000 horsepower electric drilling rigs, at a cost of approximately $5,000,000 and $6,500,000, respectively. In late March 2005, we completed the construction, primarily from used components, of a 1000 horsepower mechanical rig, at a cost of approximately $5,700,000.
In November 2004, we acquired a fleet of seven drilling rigs and related equipment from Wolverine Drilling, obtained noncompetition agreements from the two stockholders of Wolverine Drilling and purchased a 4.7-acre rig storage and maintenance yard in Kenmare, North Dakota for total consideration of $28,000,000 in cash. In December 2004, we acquired a fleet of five drilling rigs and related equipment and a 17-acre rig storage and maintenance yard located in Woodward, Oklahoma from Allen Drilling for total consideration of $7,200,000 in cash. We also obtained a noncompetition agreement from the President of Allen Drilling for additional consideration to be paid over the next five years. We funded the purchase price for each of these acquisitions with borrowings under our new credit facility aggregating $35,200,000.
We have also begun constructing, from new and used components, two 1000 horsepower electric rigs at an estimated cost of $6,500,000 each. We expect to place one of these rigs in service in June 2005 and the second in August 2005. As of March 31, 2005, we have incurred approximately $3,300,000 of construction costs on these rigs.
For fiscal year 2006, we project regular rig capital expenditures to be approximately $20,200,000, rig upgrade expenditures to be approximately $9,000,000, transportation equipment capital expenditures of approximately $2,900,000 and other capital expenditures of approximately $1,400,000. These capital expenditures are expected to be funded primarily from operating cash flow in excess of cash flow necessary to meet routine contractual obligations.
For the years ended March 31, 2005 and 2004, the additions to our property and equipment consisted of the following:
| | Years Ended March 31, | |
| | 2005 | | 2004 | |
| | | | | |
Drilling rigs (1) | | $ | 53,341,420 | | $ | 34,961,004 | |
Other drilling equipment | | 22,674,774 | | 7,642,968 | |
Transportation equipment | | 2,717,181 | | 2,160,838 | |
Other | | 1,655,108 | | 79,935 | |
| | $ | 80,388,483 | | $ | 44,844,745 | |
(1) Includes capitalized interest costs of $86,819 in 2005 and $106,395 in 2004.
Working Capital
Our working capital increased to $76,326,669 at March 31, 2005 from $6,028,018 at March 31, 2004. Our current ratio, which we calculate by dividing our current assets by our current liabilities, was 3.70 at March 31, 2005 compared to 1.27 at March 31, 2004. The principal reason for the increase in our working capital at March 31, 2005 was the approximately $61,300,000 in proceeds, after the payment of $20,000,000 of long-term debt, from the shares of common stock we sold in a public offering on March 22, 2005. Approximately $13,000,000 of the proceeds from that offering will be used for the construction of the two rigs described above. We anticipate that the remaining proceeds will be used for future rig and equipment acquisitions.
Our operations have historically generated sufficient cash flow to meet our requirements for debt service and equipment expenditures (excluding rig and other major equipment acquisitions). However, during periods when a higher percentage of our contracts are turnkey and footage contracts, our short-term working capital needs could increase. The significant improvement in operating cash flow for the year ended March 31, 2005 over March 31, 2004 is due primarily to the approximately $12,600,000 overall improvement in net earnings, components of which are discussed in “Results of Operations.” That improvement was net of approximately $6,900,000 in noncash depreciation and amortization expense. If necessary, we can defer rig upgrades to improve our cash position. We believe our cash generated by operations and our ability to borrow the currently unused portion of our line of credit and letter of credit facility of approximately $4,175,000, which takes into account reductions for approximately $2,825,000 of outstanding letters of credit as of March 31, 2005, should allow us to meet our routine financial obligations for the foreseeable future.
22
The changes in the components of our working capital were as follows:
| | March 31, | |
| | 2005 | | 2004 | | Change | |
Cash and cash equivalents | | $ | 69,673,279 | | $ | 1,815,759 | | $ | 67,857,520 | |
Marketable securities | | 1,000,000 | | 4,550,000 | | (3,550,000 | ) |
Receivables | | 26,108,291 | | 10,901,991 | | 15,206,300 | |
Contract drilling | | 5,364,529 | | 9,130,794 | | (3,766,265 | ) |
Deferred tax receivable | | 569,548 | | 285,384 | | 284,164 | |
Prepaid expenses | | 1,876,843 | | 1,336,337 | | 540,506 | |
Current assets | | 104,592,490 | | 28,020,265 | | 76,572,225 | |
| | | | | | | |
Current debt | | 5,415,001 | | 4,423,306 | | 991,695 | |
Accounts payable | | 15,621,647 | | 13,270,989 | | 2,350,658 | |
Accrued payroll | | 2,706,623 | | 1,499,151 | | 1,207,472 | |
Income tax payable | | 195,949 | | — | | 195,949 | |
Prepaid drilling contracts | | 172,750 | | �� | | 172,750 | |
Accrued expenses | | 4,153,851 | | 2,798,801 | | 1,355,050 | |
| | 28,265,821 | | 21,992,247 | | 6,273,574 | |
| | | | | | | |
Working capital | | $ | 76,326,669 | | $ | 6,028,018 | | $ | 70,298,651 | |
The large cash balance at March 31, 2005 was due to our sale of shares of common stock on March 22, 2005 for net proceeds of approximately $81,300,000, of which $20,000,000 was used to reduce long-term debt and $61,300,000 was in the March 31, 2005 cash balance.
The increase in our receivables at March 31, 2005 from March 31, 2004 was due to our operating 15 additional rigs in the quarter ended March 31, 2005, and an improvement in utilization and revenue rates in the fourth quarter of fiscal year 2005 over fiscal year 2004.
Substantially all our prepaid expenses at March 31, 2005 consisted of prepaid insurance. The increase in prepaid insurance was primarily due to the increase in the size of our drilling rig fleet from 35 rigs at March 31, 2004 to 50 rigs at March 31, 2005.
The increase in payables at March 31, 2005 from March 31, 2004 was primarily due to the increase in the size of our drilling rig fleet.
The increase in accrued payroll was primarily due to the approximately 49% increase in our number of employees and the increase in the number of payroll days included in the accrual from nine days at March 31, 2004 to ten days at March 31, 2005.
The total increase in accrued expenses at March 31, 2005 from March 31, 2004 was due to an increase of approximately $685,000 in the accrual for our insurance deductibles and additional insurance premiums, an increase in bonus accruals of approximately $525,000, an increase in vacation pay accruals of approximately $101,000 and an increase in accrued property taxes of approximately $171,000 due to increases in rig valuations and the size of our rig fleet. These increases were offset by a decrease of approximately $127,000 in other accrued expense items.
Although, we have not been required to make income tax payments for the last three years, it is likely we will be in a current taxable position during fiscal year 2006 due to improving market conditions and the reversal of deferred tax liabilities.
23
Long-term Debt
Our long-term debt at March 31, 2005 and 2004 consisted of the following:
| | 2005 | | 2004 | |
| | | | | |
Indebtedness incurred under $47,000,000 credit facility, secured by drilling equipment, due in monthly payments of $388,889 plus interest at prime (5.75% at March 31, 2005), with final maturity on December 1, 2007 | | $ | 18,077,778 | | $ | — | |
| | | | | |
Convertible subordinated debentures due July 2007 at 6.75% (1) | | — | | 28,000,000 | |
| | | | | |
Note payable to Merrill Lynch Capital, secured by drilling equipment, due in monthly payments of $172,619 plus interest at a floating rate equal to the three month LIBOR rate plus 385 basis points, due December 2007 (2) | | — | | 13,119,048 | |
| | | | | |
Note payable to Frost National Bank, secured by drilling equipment, due in monthly payments of $107,143 plus interest at prime plus 1.00%, due August 2007 (2) | | — | | 4,392,174 | |
| | | | | |
Note payable to Frost National Bank, secured by drilling equipment, due in monthly payments of $42,401, including interest at prime plus 1.0%, beginning April 15, 2004, due March 15, 2007 (2) | | — | | 3,000,000 | |
| | 18,077,778 | | 48,511,222 | |
| | | | | |
Less current installments | | (4,666,667 | ) | (3,724,302 | ) |
| | $ | 13,411,111 | | $ | 44,786,920 | |
(1) Wedge Energy Services, LLC (“WEDGE”) held $27,000,000 of the convertible subordinated debentures and William H. White, a former director of our company, held $1,000,000 of the convertible subordinated debentures. The convertible subordinate debentures were converted into 6,496,519 shares of our common stock on August 11, 2004.
(2) These notes were repaid in August and September 2004 with proceeds from our August 2004 common stock offering.
Contractual Obligations
We do not have any routine purchase obligations. However, as of March 31, 2005, we were in the process of constructing two drilling rigs, as described above. The following table excludes interest payments on long-term debt and capital lease obligations. The following table includes all of our contractual obligations of the type specified below at March 31, 2005:
| | Payments Due by Period | |
Contractual
Obligations | | Total | | Less than 1
year | | 1-3 years | | 4-5
years | | More than 5
years | |
| | | | | | | | | | | |
Long-Term Debt Obligations | | $ | 18,077,778 | | $ | 4,666,667 | | $ | 13,411,111 | | $ | — | | $ | — | |
Capital Lease Obligations | | 100,265 | | 66,359 | | 33,906 | | — | | — | |
Operating Lease Obligations | | 1,991,934 | | 224,873 | | 391,427 | | 472,196 | | 903,438 | |
Total | | $ | 20,169,977 | | $ | 4,957,899 | | $ | 13,836,444 | | $ | 472,196 | | $ | 903,438 | |
24
Debt Requirements
The $18,077,778 amount of indebtedness outstanding under the acquisition facility portion of our new credit facility is due in monthly installments of $388,889 plus interest, based on a 72-month amortization schedule, with all remaining unpaid principal being due on December 1, 2007. All the indebtedness under the acquisition facility bears interest at Frost National Bank’s prime rate (5.75% as of March 31, 2005).
The sum of (1) the draws under and (2) the amount of all outstanding letters of credit issued for our account under the revolving line and letter of credit facility portion of our new credit facility are limited to 75% of our eligible accounts receivable, not to exceed $7,000,000. Therefore, if 75% of our eligible accounts receivable was less than $7,000,000, our ability to draw under this line would be reduced. At March 31, 2005, we had no outstanding advances under this line of credit, outstanding letters of credit were $2,825,000 and 75% of our eligible accounts receivable was approximately $19,084,000. The letters of credit are issued to three workers’ compensation insurance companies to secure possible future claims under the deductibles on these policies. It is our practice to pay any amounts due under these deductibles as they are incurred. Therefore, we do not anticipate that the lenders will be required to fund any draws under these letters of credit. The termination date of the revolving line and letter of credit facility portion of our new credit facility is October 28, 2005.
Our new credit facility contains various covenants pertaining to a debt to total capitalization ratio, operating leverage ratio and fixed charge coverage ratio and restricts us from paying dividends. We determine compliance with the ratios on a quarterly basis, based on the previous four quarters. Events of default, which could trigger an early repayment requirement, include, among others:
•our failure to make required payments;
•any sale of assets by us not permitted by the credit facility;
•our failure to comply with financial covenants related to a debt to total capitalization ratio not to exceed 0.3 to 1, an operating leverage ratio not to exceed 3 to 1, and a fixed charge coverage ratio of not less than 1.5 to 1;
•our incurrence of additional indebtedness in excess of $3,000,000 not already allowed by the credit facility;
•any event which results in a change in the ownership of at least 40% of all classes of our outstanding capital stock; and
•any payment of cash dividends on our common stock.
The limitation on additional indebtedness described above has not affected our operations or liquidity and we do not expect it to affect our future operations or liquidity, as we expect to continue to generate adequate cash flow from operations to fund our anticipated working capital and other normal cash flow requirements.
Results of Operations
Our operations consist of drilling oil and gas wells for our customers under daywork, turnkey, or footage contracts usually on a well-to-well basis. Daywork contracts are the least complex for us to perform and involve the least risk. Turnkey contracts are the most difficult to perform and involve much greater risk but provide the opportunity for higher operating profits.
Daywork Contracts. Under daywork drilling contracts, we provide a drilling rig with required personnel to our customer, who supervises the drilling of the well. We are paid based on a negotiated fixed rate per day while the rig is used. During the mobilization period we typically earn a fixed amount of revenue based on the mobilization rate stated in the contract. We attempt to set the mobilization rate at an amount equal to our external costs for the move plus our internal costs during the mobilization period. We begin earning our contracted daywork rate when we begin drilling the well. Occasionally, in periods of increased demand, some of our contracts will provide for the trucking costs to be paid by the customer and we will receive a reduced dayrate during the mobilization period.
Turnkey Contracts.Under a turnkey contract, we agree to drill a well for our customer to a specified depth and under specified conditions for a fixed price, regardless of the time required or the problems encountered in drilling the well. We provide technical expertise and engineering services, as well as most of the equipment and drilling supplies required to drill the well. We often subcontract for related services, such as the provision of casing crews, cementing and well logging. Under typical turnkey drilling arrangements, we do not receive progress payments and are entitled to be paid by our customer only after we have performed the terms of the drilling contract in full. The risks under a turnkey contract are greater than those under a daywork contract, because under a turnkey contract we assume most of the risks associated with drilling operations that the operator generally assumes under a daywork contract.
25
Footage Contracts. Under footage contracts, we are paid a fixed amount for each foot drilled, regardless of the time required or the problems encountered in drilling the well. We typically pay more of the out-of-pocket costs associated with footage contracts as compared to daywork contracts. Similar to turnkey contracts, under a footage contract we assume most of the risks associated with drilling operations that the operator generally assumes under a daywork contract.
We have a history of losses. We incurred net losses of approximately $1,800,000, $5,100,000 and $400,000 in the fiscal years ended March 31, 2004, 2003 and 2000, respectively. Our profitability in the future will depend on many factors, but largely on utilization rates and dayrates for our drilling rigs.
The current demand for drilling rigs greatly influences the types of contracts we are able to obtain. As the demand for rigs increases, daywork rates move up and we are able to switch primarily to daywork contracts.
For the years ended March 31, 2005, 2004 and 2003, the percentages of our drilling revenues by type of contract were as follows:
| | Years Ended March 31, | |
| | 2005 | | 2004 | | 2003 | |
Daywork Contracts | | 52 | % | 47 | % | 41 | % |
Turnkey Contracts | | 43 | % | 50 | % | 58 | % |
Footage Contracts | | 5 | % | 3 | % | 1 | % |
While demand for drilling rigs has been increasing, we continue to bid on turnkey contracts in an effort to meet our customer demand and maintain rig utilization. With the improvements in daywork contract rates, we anticipate a gradual decline in the number of turnkey contracts. We had 6 turnkey contracts in progress at March 31, 2005 compared to 16 turnkey contracts in progress at March 31, 2004. We also had 6 footage contracts in progress at March 31, 2005 compared to none in progress at March 31, 2004.
In our years ended March 31, 2005 and 2004, we recognized revenues of approximately $4,885,000 and $924,000, respectively, and recorded contract drilling costs of approximately $3,263,000 and $745,000, respectively, excluding depreciation, on contracts with Chesapeake Energy Corporation. At March 31, 2005, Chesapeake owned 16.78% of our outstanding common stock.
26
Statements of Operations AnalysisAnalysis—Year Ended December 31, 2008 Compared with the Year Ended December 31, 2007
The following table provides information about our operations for the years ended MarchDecember 31, 2005, March2008 and December 31, 2004, and March 31, 2003.2007.
| | Years Ended March 31, | |
| | 2005 | | 2004 | | 2003 | |
Contract drilling revenues: | | | | | | | |
Daywork contracts | | $ | 95,997,451 | | $ | 50,144,773 | | $ | 33,203,385 | |
Turnkey contracts | | 80,210,813 | | 54,234,756 | | 45,889,585 | |
Footage contracts | | 9,038,184 | | 3,496,004 | | 1,090,516 | |
Total contract drilling revenues | | $ | 185,246,448 | | $ | 107,875,533 | | $ | 80,183,486 | |
Contract drilling costs: | | | | | | | |
Daywork contracts | | $ | 68,415,608 | | $ | 42,903,525 | | $ | 29,289,493 | |
Turnkey contracts | | 63,421,106 | | 42,761,928 | | 40,482,547 | |
Footage contracts | | 6,646,045 | | 2,838,649 | | 1,051,270 | |
Total contract drilling costs | | $ | 138,482,759 | | $ | 88,504,102 | | $ | 70,823,310 | |
| | | | | | | |
Depreciation and amortization | | $ | 23,090,909 | | $ | 16,160,494 | | $ | 11,960,387 | |
General and administrative expense | | $ | 4,657,013 | | $ | 2,772,730 | | $ | 2,232,390 | |
Revenue days by type of contract: | | | | | | | |
Daywork contracts | | 8,685 | | 5,626 | | 3,681 | |
Turnkey contracts | | 4,471 | | 2,827 | | 2,619 | |
Footage contracts | | 738 | | 311 | | 119 | |
Total Revenue days | | 13,894 | | 8,764 | | 6,419 | |
| | | | | | | |
Contract drilling revenue per revenue day | | $ | 13,333 | | $ | 12,309 | | $ | 12,492 | |
Contract drilling cost per revenue day | | $ | 9,967 | | $ | 10,099 | | $ | 11,033 | |
Rig utilization rates | | 96 | % | 88 | % | 79 | % |
Average number of rigs during the period | | 40.1 | | 27.3 | | 22.3 | |
| | | | | | | |
| | | | | | | | |
| | | Years ended
December 31, | |
| | | 2008 | | | 2007 | |
| | | (amounts in thousands) | |
Drilling Services Division: | | | | | | | | |
Revenues | | $ | 456,890 | | | $ | 417,231 | |
Operating costs | | | 269,846 | | | | 250,564 | |
| | | | | | | | |
Drilling Services Division margin | | $ | 187,044 | | | $ | 166,667 | |
| | | | | | | | |
Average number of drilling rigs | | | 67.4 | | | | 66.1 | |
Utilization rate | | | 89 | % | | | 89 | % |
Revenue days | | | 22,057 | | | | 21,492 | |
| | |
Average revenues per day | | $ | 20,714 | | | $ | 19,413 | |
Average operating costs per day | | | 12,234 | | | | 11,658 | |
| | | | | | | | |
Drilling Services Division margin per day | | $ | 8,480 | | | $ | 7,755 | |
| | | | | | | | |
Production Services Division: | | | | | | | | |
Revenues | | $ | 153,994 | | | $ | — | |
Operating costs | | | 80,097 | | | | — | |
| | | | | | | | |
Production Services Division margin | | $ | 73,897 | | | $ | — | |
| | | | | | | | |
Combined: | | | | | | | | |
Revenues | | $ | 610,884 | | | $ | 417,231 | |
Operating costs | | | 349,943 | | | | 250,564 | |
| | | | | | | | |
Combined margin | | $ | 260,941 | | | $ | 166,667 | |
| | | | | | | | |
EBITDA | | $ | 214,766 | | | $ | 144,583 | |
| | | | | | | | |
We present Drilling Services Division margin, Production Services Division margin, combined margin and earnings before interest, taxes, depreciation, amortization and impairments (EBITDA) information because we believe it provides investors and our management additional information to assist them in assessing our business and performance in comparison to other companies in our industry. Since Drilling Services Division margin, Production Services Division margin, combined margin and EBITDA are “non-GAAP” financial measure under the rules and regulations of the SEC, we are providing the following reconciliation of combined margin and EBITDA to net (loss) earnings, which is the nearest comparable GAAP financial measure.
| | | | | | | | |
| | | Year ended
December 31, | |
| | | 2008 | | | 2007 | |
| | | (amounts in thousands) | |
Reconciliation of combined margin and
EBITDA to net (loss) earnings: | | | | | | | | |
Combined margin | | | 260,941 | | | | 166,667 | |
Selling, general and administrative | | | (44,834 | ) | | | (19,608 | ) |
Bad debt expense | | | (423 | ) | | | (2,612 | ) |
Other income (expense) | | | (918 | ) | | | 136 | |
| | | | | | | | |
EBITDA | | | 214,766 | | | | 144,583 | |
Depreciation and amortization | | | (88,145 | ) | | | (63,588 | ) |
Impairment of goodwill | | | (118,646 | ) | | | — | |
Impairment of intangible assets | | | (52,847 | ) | | | — | |
Interest income (expense), net | | | (11,816 | ) | | | 3,266 | |
Income tax expense | | | (6,057 | ) | | | (27,398 | ) |
| | | | | | | | |
Net (loss) earnings | | $ | (62,745 | ) | | $ | 56,863 | |
| | | | | | | | |
Our Drilling Services Division’s revenues increased by $39.7 million, or 10%, for the year ended December 31, 2008, as compared to the year ended December 31, 2007, due to an increase in average contract drilling revenues of $1,301 per day, or 7%, that resulted from an increased demand for drilling rigs and higher revenues per day earned by our Colombian operations that expanded significantly during 2008. The increase in Drilling Services Divisions revenues is also due to a 3% increase in revenue days that resulted from a slightly higher average number of drilling rigs.
Our Drilling Services Division’s operating costs grew by $19.3 million, or 8%, for the year ended December 31, 2008, as compared to the year ended December 31, 2007, due to an increase in average contract drilling operating costs of $576 per day, or 5%, that resulted primarily from higher operating costs per day for our Colombian operations which has higher labor and fuel costs when compared to drilling operations in the United States. This increase in our Drilling Services Division’s operating costs is also due to a 3% increase in revenue days that resulted from a slightly higher average number of drilling rigs.
Our Production Services Division’s revenue of $154.0 million and operating costs of $80.1 million for the year ended December 31, 2008 are based on the operating results for this new operating segment which was created on March 1, 2008 when we acquired the production services businesses of WEDGE and Competition.
Our selling, general and administrative expense for the year ended December 31, 2008 increased by approximately $25.2 million, or 129%, compared to the year ended December 31, 2007. The increase resulted from $4.4 million in additional compensation-related expenses incurred for existing and new employees in our corporate office which includes $0.9 million paid to our former Chief Financial Officer pursuant to a severance agreement. Professional and consulting expenses increased $5.2 million during the year ended December 31, 2008 which includes approximately $3.1 million due to an investigation conducted by the special subcommittee of our Board of Directors. In addition, we incurred $15.1 million and $0.7 million of additional selling, general and administrative expenses relating to our Production Service Division and our Colombian operations, respectively.
Our bad debt expense decreased by $2.2 million for the year ended December 31, 2008, as compared to the year ended December 31, 2007, primarily due to a write-off of a trade receivable during the year ended December 31, 2007 for a former customer in bankruptcy.
Our other income for the year ended December 31, 2008 decreased by $1.0 million as compared to the year ended December 31, 2007, primarily due to foreign currency translation losses relating to our operations in Colombia.
Our depreciation and amortization expenses increased by $24.6 million, or 39%, for the year ended December 31, 2008, as compared to December 31, 2007. The increase resulted primarily from additional depreciation and amortization expense of $21.8 million for our Production Services Division acquisitions, which includes an increase in amortization expense of intangible assets of $8.3 million. The increase is also due to the increases in the average size of our drilling rig fleet, which consisted of newly constructed rigs. Partially offsetting the increase in depreciation and amortization expense was a decrease of $3.8 million for the year ended December 31, 2008, resulting from the change in the estimated useful lives of a group of 19 drilling rigs from an average useful life of 9 years to 12 years.
We recorded goodwill of $118.6 million in our Production Services Division operating segment in connection with the acquisitions of the production services businesses from WEDGE, Competition, Pettus and Paltec, all of which occurred during the year ended December 31, 2008. On December 31, 2008, we performed an impairment analysis that lead us to conclude that there would be no remaining implied value attributable to our goodwill, and, accordingly, we recorded a non-cash charge of $118.6 million for the full impairment of our goodwill. In addition, we performed an intangible asset impairment analysis on December 31, 2008, which resulted in a reduction to our intangible asset carrying value of customers’ relationships and a non-cash impairment charge of $52.8 million. These impairment charges are not expected to have an impact on our liquidity or debt covenants; however, they are a reflection of the overall downturn in our industry and decline in our projected cash flows.
Interest expense for the year ended December 31, 2008 is primarily related to interest due on the amounts outstanding under our senior secured revolving credit facility which was primarily used to fund the acquisitions of the production services businesses of WEDGE and Competition on March 1, 2008.
Our income tax expense is $6.1 million for the year ended December 31, 2008, as compared to an expected income tax benefit of $19.8 million, which is based on the federal statutory rate of 35%, primarily due to the permanent differences between GAAP requirements and United States income tax regulations. Certain types of goodwill are not amortizable for income tax purposes. A significant portion of the goodwill impairment charge recorded for GAAP purposes during the year ended December 31, 2008, is not deductible for income tax purposes in the current year or in future years. Therefore, our results of operations reflect a pretax loss for GAAP purposes, but our results of operations will reflect pretax income for tax purposes. The increase in income tax expense was partially offset by tax benefits in foreign jurisdictions and other permanent differences.
Statements of Operations Analysis—Nine Months Ended December 31, 2007 Compared with the Nine Months Ended December 31, 2006
The following table provides information about our operations for the nine months ended December 31, 2007 and December 31, 2006.
| | | | | | | | |
| | | Nine Months Ended
December 31, | |
| | | 2007 | | | 2006 | |
| | | (In thousands) | |
Contract drilling revenues: | | | | | | | | |
Daywork contracts | | $ | 292,617 | | | $ | 302,272 | |
Turnkey contracts | | | 4,979 | | | | — | |
Footage contracts | | | 16,288 | | | | 10,559 | |
| | | | | | | | |
Total contract drilling revenues | | $ | 313,884 | | | $ | 312,831 | |
| | | | | | | | |
Contract drilling costs: | | | | | | | | |
Daywork contracts | | $ | 175,299 | | | $ | 152,625 | |
Turnkey contracts | | | 3,168 | | | | — | |
Footage contracts | | | 12,907 | | | | 7,538 | |
| | | | | | | | |
Total contract drilling costs | | $ | 191,374 | | | $ | 160,163 | |
| | | | | | | | |
Drilling margin: | | | | | | | | |
Daywork contracts | | $ | 117,318 | | | $ | 149,647 | |
Turnkey contracts | | | 1,811 | | | | — | |
Footage contracts | | | 3,381 | | | | 3,021 | |
| | | | | | | | |
Total drilling margin | | $ | 122,510 | | | $ | 152,668 | |
| | | | | | | | |
Revenue days by type of contract: | | | | | | | | |
Daywork contracts | | | 15,203 | | | | 15,084 | |
Turnkey contracts | | | 118 | | | | — | |
Footage contracts | | | 968 | | | | 643 | |
| | | | | | | | |
Total revenue days | | | 16,289 | | | | 15,727 | |
| | | | | | | | |
EBITDA | | $ | 104,241 | | | $ | 139,548 | |
| | | | | | | | |
Contract drilling revenue per revenue day | | $ | 19,270 | | | $ | 19,891 | |
Contract drilling costs per revenue day | | $ | 11,749 | | | $ | 10,184 | |
Drilling margin per revenue day | | $ | 7,521 | | | $ | 9,707 | |
Rig utilization rates | | | 89 | % | | | 97 | % |
Average number of rigs during the period | | | 66.7 | | | | 59.6 | |
We present drilling margin and earnings before interest, taxes, depreciation and amortization (EBITDA) information because we believe it provides investors and our management additional information to assist them in assessing our business and performance in comparison to other companies in our industry. Since drilling margin and EBITDA are “non-GAAP” financial measure under the rules and regulations of the SEC, we are providing the following reconciliation of drilling margin and EBITDA to net earnings, which is the nearest comparable GAAP financial measure.
| | | | | | | | |
| | | Nine Months Ended
December 31, | |
| | | 2007 | | | 2006 | |
| | | (In thousands) | |
Reconciliation of drilling margin and | | | | | | | | |
EBITDA to net earnings: | | | | | | | | |
Drilling margin | | $ | 122,510 | | | $ | 152,668 | |
General and administrative expense | | | (15,786 | ) | | | (12,370 | ) |
Bad debt expense | | | (2,612 | ) | | | (800 | ) |
Other income | | | 129 | | | | 50 | |
| | | | | | | | |
EBITDA | | | 104,241 | | | | 139,548 | |
| | | | | | | | |
Income tax expense | | | (18,129 | ) | | | (37,341 | ) |
Interest income (expense), net | | | 2,385 | | | | 2,874 | |
Depreciation and amortization | | | (48,852 | ) | | | (38,120 | ) |
| | | | | | | | |
Net earnings | | $ | 39,645 | | | $ | 66,961 | |
| | | | | | | | |
Our contract drilling revenues grew by approximately $77,000,000,$1.1 million, or 72%.3%, in fiscal year 2005for the nine months ended December 31, 2007 from fiscal year 2004, primarilythe nine months ended December 31, 2006, due to the 59%a 4% increase in revenue days (approximately $63,000,000) and the approximately $1,000due to an increase in revenue per revenue day (approximately $14,000,000), which was attributable to improving market conditions in our industry.
Our contract drilling revenues grew by approximately $28,000,000, or 35%, in fiscal year 2004 from fiscal year 2003, primarily due to a 37% increase in revenue days, which was mostly attributable to the 22% increase in the average number of rigs in our rig fleet, andfleet. The overall increase was partially offset by a 9% increasedecrease in rig utilization. The $183contract drilling revenues of $621 per day, decrease in averageor 3%, resulting from a reduced demand for drilling rigs.
Our contract drilling revenue iscosts grew by $31.2 million, or 19.5%, during the nine months ended December 31, 2007 from the corresponding period in 2006, primarily due to the decreaseincrease in the number of revenue days resulting from the increase in the number of rigs in our fleet. Our contract drilling costs per revenue day increased by $1,565, or 15%, during the nine months ended December 31, 2007 from the corresponding period in 2006, primarily due to higher payroll and higher repairs and maintenance expenses. Contract drilling costs also increased due to a shift to more turnkey and footage revenue days as a percentage of total revenue days.
Our contract drilling costs in fiscal year 2005 grew by approximately $50,000,000, or 56%, primarily due to the increases in 2005 in revenue days and rig utilization referred to above. The $132 decrease in average cost per revenue day was primarily due to the greater increase in daywork revenue days (3,059 days) in fiscal 2005 over the increase in turnkey Turnkey and footage revenue days (2,071).represented 7% of total revenue days during the nine months ended December 31, 2007, compared to 4% during the nine months ended December 31, 2006. Under dayworkturnkey and footage contracts, our customer provideswe provide supplies and materials such as fuel, drill bits, casing and drilling fluids, which we are requiredsignificantly add to provide under turnkey contracts.
Our contract drilling costs grew by approximately $18,000,000, or 25%,when compared to daywork contracts. These costs are also included in fiscal year 2004 from fiscal year 2003 due to the increase in revenue days and rig utilization. The increase in daywork revenue days by 1,945 revenue days in fiscal year 2004 resulted in a $934 decrease in contract drilling costs per revenue day because costs associated with the drilling of daywork contracts is less than costs associated withrevenues we recognize for turnkey and footage contracts, resulting in higher revenue rates per day for turnkey and footage contracts compared to daywork contracts which onlydo not include such costs.
Our general and administrative expense for the nine months ended December 31, 2007 increased by 400 revenue days$3.4 million, or 28%, compared to the corresponding period in fiscal year 2004.
2006. The increase resulted from $1.1 million in additional compensation-related expenses for salaries, bonuses, relocation benefits and stock options incurred for existing and new employees in our corporate office. Professional and consulting expenses increased $1.1 million during the nine months ended December 31, 2007. In addition, we incurred $.3 million of additional general and administrative expenses during the nine months ended December 31, 2007 relating to the commencement of our Colombian operations.
Our depreciation and amortization expense in 2005expenses for the nine months ended December 31, 2007 increased by approximately $7,000,000,$10.7 million, or 43%28%, from 2004. Depreciation and amortization expensecompared to the corresponding period in 2004 increased approximately $4,000,000, or 35%, from 2003. The2006. These increase in 20052007 over 20042006 resulted primarily from our addition of 15 drilling rigs and related equipment in 2005. The increase in 2004 over 2003 resulted from our addition of 11 drilling rigs and related equipment during 2004.
Our general and administrative expenses increased by approximately $1,900,000, or 68%, in fiscal year 2005 from fiscal year 2004. The increase resulted from increased payroll costs, professional and consulting costs, insurance costs and director fees. Payroll related costs
27
increased by approximately $894,000 due to pay increases, staff additions and an approximately $610,000 increase in bonus costs. Professional and consulting costs increased approximately $587,000, with much of this increase due to the implementation of Sarbanes-Oxley compliance procedures. Director fees increased approximately $142,000. Insurance costs increased approximately $89,000, due to an increase in the costaverage size of directorour rig fleet, which increases consisted entirely of newly
constructed rigs. The higher costs of our new rigs increased our average depreciation costs per revenue day by $575 to $2,999 from $2,424 during the nine months ended December 31, 2007, compared to the corresponding period in 2006.
Interest income for the nine months ended December 31, 2007 decreased by $.5 million, or 16%, compared to the corresponding period in 2006 due to lower average cash and officer liability insurance coverage.
cash equivalents balances during the nine months ended December 31, 2007 as compared to the corresponding period in 2006. Average cash and cash equivalents balances were $74.2 million and $85.8 million during the nine months ended 2007 and 2006, respectively.
Our generaleffective income tax rates of 31.4% and administrative expenses increased by approximately $541,000, or 24%, in fiscal year 200435.8% for the nine months ended December 31, 2007 and 2006, respectively, differ from fiscal year 2003. The increase resulted from increased payroll costs, employment fees, loan fees, insurance costs and director fees. In 2004, payroll costs increased by approximately $310,000the federal statutory rate of 35% due to pay raisestax benefits in foreign jurisdictions, tax benefits recognized for a previously unrecognized tax position, permanent differences and the increase from 12 to 17 employees in our corporate office. Employment and loan fees increased by $61,000 due to the employee additions and fees associated with the Merrill Lynch Capital loan. In addition, our directors’ and officers’ liability and employment practices insurance increased by approximately $60,000 and directors’ fees increased by approximately $93,000.
state income taxes.
Our contract land drilling operations are subject to various federal and state laws and regulations designed to protect the environment. Maintaining compliance with these regulations is part of our day-to-day operating procedures. We monitor each of our yard facilities and each of our rig locations on a day-to-day basis for potential environmental spill risks. In addition, we maintain a spill prevention control and countermeasures plan for each yard facility and each rig location. The costs of these procedures represent only a small portion of our routine employee training, equipment maintenance and job site maintenance costs. We estimate the annual compliance costs for this program isto be approximately $212,000.$.4 million. We are not aware of any potential environmental clean-up obligations that would have a material adverse effect on our financial condition or results of operations.
Inflation
Our effective income taxDue to the increased rig count in each of our market areas over the past several years, availability of personnel to operate our rigs is limited. In April 2005, January 2006, May 2006 and September 2008, we raised wage rates for our drilling rig personnel by an average of 37.0%6%, 19.2%6%, 14% and 30.4%6%, respectively. We were able to pass these wage rate increases on to our customers based on contract terms. In February 2009, we reduced wage rates for 2005, 2004drilling rig personnel to offset the wage rate increases from September 2008. We do not expect wage rate increases during the fiscal year ending December 31, 2009.
We are experiencing increases in costs for rig repairs and 2003, respectively, differ from the federal statutory ratemaintenance and costs of 34%rig upgrades and new rig construction, due to permanent differences. Permanent differences arethe increased industry-wide demand for equipment, supplies and service. We estimate these costs included in results of operations in the accompanying financial statements which are not fully deductible for federal income tax purposes. At March 31, 2005, we had a net operating loss carryforwards for income tax purposes of approximately $16,500,000, of which approximately $6,600,000 will expire in 2023 and $9,900,000 in 2024. We feel that it is more likely than not that we will realize the benefits of these deductible differences. Therefore, we have established a deferred tax asset applicableincreased by 10% to these net operating loss carryforwards of approximately $4,300,000.
Inflation
As a result of the relatively low levels of inflation15% during the past twofiscal years inflation didended December 31, 2007 and 2008. We do not significantly affect our results of operations in any ofexpect similar cost increases during the periods reported.fiscal year ending December 31, 2009.
Off BalanceOff-Balance Sheet Arrangements
We do not currently have any off balanceoff-balance sheet arrangements.
Recently Issued Accounting Standards
In December 2004,September 2006, the FASB issued SFAS No. 123 (revised 2004), 157,Share-Based Payment.Fair Value Measurements. SFAS No. 123R is157 defines fair value, establishes a revisionframework for measuring fair value and expands disclosure of fair value measurements. SFAS No. 157 applies under other accounting pronouncements that require or permit fair value measurements and, accordingly, does not require any new fair value measurements. SFAS No. 157, as issued, was effective for financial statement issued for fiscal years beginning after November 15, 2007, and interim periods within those fiscal years. However, on February 12, 2008, the FASB issued FSP FAS No. 157-2,Effective Dates of FASB SFASStatement No. 123, Accounting for Stock-Based Compensation 157,and supersedes APB Opinion No. 25, Accounting for Stock Issued to Employees, and its related implementation guidance. SFAS No. 123R established standards for the accounting for transactions in which an entity exchanges its equity instruments for goods or services. It also addresses transactions in which an entity incurs liabilities in exchange for goods or services that are based on the fair value of the entity’s equity instruments or that may be settled by the issuance of those equity instruments. SFAS No. 123R focuses primarily on accounting for transactions in which an entity obtains employee services in share-based payment transactions. SFAS No. 123R requires a public entity to measure the cost of employee services received in exchange for an award of equity instruments based on the grant-date fair value of the award (with limited exceptions). That cost will be recognized over the period during which an employee is required to provide service in exchange for the award. The provisions of SFAS No. 123R are effective for public entities that do not file as small business issuers as of the beginning of the first annual reporting period that begins after June 15, 2005. We are currently evaluating the negative impact SFAS No. 123R will have on our financial position and results of operations in fiscal year 2007. The negative impact will be created due to the fact that we previously issued employee stock options for which no expense has been recognized, as these options will not be fully vested as ofdelays the effective date of SFAS No. 123R.157 for fiscal years beginning after November 15, 2008 for all nonfinancial assets and nonfinancial liabilities, except those that are recognized or disclosed at fair value in the financial statements on a recurring basis. The adoption of SFAS No. 157 did not have a material impact on our financial position or results of operations.
In February 2007, the FASB issued SFAS No. 159,The Fair Value Option for Financial Assets and Financial Liabilities—Including an amendment of FASB Statement No. 115. This statement permits entities to choose to measure many financial instruments and certain other items at fair value that are not currently required to be measured at fair value and establishes presentation and disclosure requirements designed to facilitate comparisons between entities that choose different measurement attributes for similar types of assets and liabilities. SFAS No. 159 is effective for fiscal years beginning after November 15, 2007. The adoption of SFAS No. 159 did not have a material impact on our financial position or results of operations.
In December 2007, the FASB issued SFAS No. 160,Noncontrolling interests in Consolidated Financial Statements—an Amendment of ARB No. 51. This statement establishes accounting and reporting standards for the non-controlling interest in a subsidiary and for the deconsolidation of a subsidiary. SFAS No. 160 clarifies that a non-controlling interest in a subsidiary, which is sometimes referred to as minority interest, is an ownership interest in the consolidated entity that should be reported as a component of equity in the consolidated financial statements. Among other requirements, SFAS No. 160 requires consolidated net income to be reported at amounts that include the amounts attributable to both the parent and the non-controlling interest. It also requires disclosure, on the face of the consolidated income statement, of the amounts of consolidated net income attributable to the parent and to the non-controlling interest. SFAS No.160 is effective for fiscal years beginning on or after December 15, 2008. We do not expect the adoption to have a material impact on our financial position or results of operations.
In December 2007, the FASB issued SFAS No. 141R (revised 2007) which replaces SFAS No. 141,Business Combinations(“SFAS No. 141R”). SFAS No. 141R applies to all transactions and other events in which one entity obtains control over one or more other businesses. SFAS No. 141R requires an acquirer, upon initially obtaining control of another entity, to recognize the assets, liabilities and any non-controlling interest in the acquiree at fair value as of the acquisition date. Contingent consideration is required to be recognized and measured at fair value on the date of acquisition rather than at a later date when the amount of that consideration may be determinable beyond a reasonable doubt. This fair value approach replaces the cost-allocation process required under SFAS No. 141 whereby the cost of an acquisition was allocated to the individual assets acquired and liabilities assumed based on their estimated fair value. SFAS No. 141R requires acquirers to expense acquisition-related costs as incurred rather than allocating such costs to the assets acquired and liabilities assumed, as was previously the case under SFAS No. 141. Under SFAS No.141R, the requirements of SFAS No. 146,Accounting for Costs Associated with Exit or Disposal Activities, would have to be met in order to accrue for a restructuring plan in purchase accounting. Pre-acquisition contingencies are to be recognized at fair value, unless it is a non-contractual contingency that is not likely to materialize, in which case, nothing should be recognized in purchase accounting and, instead, that contingency would be subject to the recognition criteria of SFAS No. 5,Accounting for Contingencies. SFAS No.141R is expected to have a significant impact on our accounting for business combinations closing on or after January 1, 2009.
In March 2008, the FASB issued SFAS No. 161, Disclosures about Derivative Instruments and Hedging Activities—an amendment of FASB Statement No. 133(“SFAS No. 161”). SFAS No. 161 changes the disclosure requirements for derivative instruments and hedging activities. Entities are required to provide enhanced disclosures about (a) how and why an entity uses derivative instruments, (b) how derivative instruments and related hedged items are accounted for under Statement 133 and its related interpretations, and (c) how derivative instruments and related hedged items affect an entity’s financial position, financial performance, and cash flows. The guidance in SFAS No. 161 is effective for financial statements issued for fiscal years and interim periods beginning after November 15, 2008, with early application encouraged. This Statement encourages, but does not require, comparative disclosures for earlier periods at initial adoption. We do not have any derivative instruments and expect the adoption of SFAS No. 161 to have no impact on our financial position or results of operations.
In April 2008, the FASB issued FSP SFAS 142-3,Determination of the Useful Life of Intangible Assets. This guidance is intended to improve the consistency between the useful life of a recognized intangible asset under SFAS 142, Goodwill and Other Intangible Assets, and the period of expected cash flows used to measure the fair value of the asset under SFAS 141R when the underlying arrangement includes renewal or extension of
terms that would require substantial costs or result in a material modification to the asset upon renewal or extension. Companies estimating the useful life of a recognized intangible asset must now consider their historical experience in renewing or extending similar arrangements or, in the absence of historical experience, must consider assumptions that market participants would use about renewal or extension as adjusted for SFAS No. 142’s entity-specific factors. FSP 142-3 is effective for periods beginning on or after January 1, 2009. We do not expect the adoption to have a material impact on our financial position or results of operations.
In May 2008, the FASB issued SFAS No. 162,The Hierarchy of Generally Accepted Accounting Principles (“SFAS No. 162”). SFAS No. 162 identifies the sources of accounting principles and the framework for selecting the principles used in the preparation of financial statements that are presented in conformity with generally accepted accounting principles. SFAS No. 162 is effective 60 days following approval by the Securities and Exchange Commission of the Public Company Accounting Oversight Board’s amendments to AU Section 411,The Meaning of Present Fairly in Conformity with Generally Accepted Accounting Principles. The adoption of SFAS No. 162 did not have a material impact on our financial position or results of operations.
In June 2008, the FASB issued FSP No. EITF 03-6-1,Determining Whether Instruments Granted in Share-Based Payment Transactions are Participating Securities. This FSP provides that unvested share-based payment awards that contain nonforfeitable rights to dividends are participating securities and shall be included in the computation of earnings per share pursuant to the two class method. This FSP is effective for financial statements issued for fiscal years beginning after December 15, 2008 and interim periods within those years. We do not expect the adoption of this FSP to have a material impact on our financial position or results of operations.
| Item 7A. | Quantitative and Qualitative Disclosures About Market Risk |
Item 7A.Interest Rate RiskQuantitative and Qualitative Disclosures About Market Risk
We are subject to interest rate market risk exposure relatedon our variable rate debt. As of December 31, 2008, we had $272.5 million outstanding under our senior secured revolving credit facility subject to changesvariable interest rate risk. The impact of a 1% increase in interest rates on mostthis amount of debt would result in increased interest expense of approximately $2.7 million and a decrease in net income of approximately $1.8 million during an annual period.
At December 31, 2008, we held $15.9 million (par value) of investments comprised of tax exempt, auction rate preferred securities (“ARPSs”), which are variable-rate preferred securities and have a long-term maturity with the interest rate being reset through “Dutch auctions” that are held every 7 days. The ARPSs have historically traded at par because of the frequent interest rate resets and because they are callable at par at the option of the issuer. Interest is paid at the end of each auction period. Our ARPSs are AAA/Aaa rated securities, collateralized by municipal bonds and backed by assets that are equal to or greater than 200% of the liquidation preference. Until February 2008, the auction rate securities market was highly liquid. Beginning mid-February 2008, we experienced several “failed” auctions, meaning that there was not enough demand to sell all of the securities that holders desired to sell at auction. The immediate effect of a failed auction is that such holders cannot sell the securities at auction and the interest rate on the security resets to a maximum auction rate. We have continued to receive interest payments on our ARPSs in accordance with their terms. Unless a future auction is successful or the issuer calls the security pursuant to redemption prior to maturity, we may not be able to access the funds we invested in our ARPSs without a loss of principal. We have no reason to believe that any of the underlying municipal securities that collateralize our ARPSs are presently at risk of default. We believe we will ultimately be able to liquidate our investments without material loss primarily due to the collateral securing the ARPSs. We do not currently intend to attempt to sell our ARPSs at a discount since our liquidity needs are expected to be met with cash flows from operating activities and our senior secured revolving credit facility. Our ARPSs are designated as available-for-sale and are reported at fair market value with the related unrealized gains or losses, included in accumulated other comprehensive income (loss), net of tax, a component of shareholders’ equity. The estimated fair value of our outstanding debt. At MarchARPSs at December 31, 2005,2008 was $13.9 million compared with a par value of $15.9 million. The $2.0 million difference represents a fair value discount due to the current lack of
liquidity which is considered temporary and is recorded as an unrealized loss. We would recognize an impairment charge if the fair value of our investments falls below the cost basis and is judged to be other-than-temporary. Our ARPSs are classified with other long-term assets on our consolidated balance sheet as of December 31, 2008 because of our inability to determine the recovery period of our investments.
Foreign Currency Risk
While the U.S. dollar is the functional currency for reporting purposes for our Colombian operations, we had outstanding debt of approximately $18,078,000 that was subject to variable interest rates, based on Frost National Bank’s prime interest rate. An increase or decrease of 1% in that interest rate would have a corresponding decrease or increase in our net income (loss) of approximately $120,000 annually. We did not enter into transactions denominated in Colombian pesos. Nonmonetary assets and liabilities are translated at historical rates and monetary assets and liabilities are translated at exchange rates in effect at the end of the period. Income statement accounts are translated at average rates for the period. As a result, Colombian Peso denominated transactions are affected by changes in exchange rates. We generally accept the exposure to exchange rate movements without using derivative financial instruments to manage this debt arrangementrisk. Therefore, both positive and negative movements in the Colombian Peso currency exchange rate against the U.S. dollar has and will continue to affect the reported amount of revenues, expenses, profit, and assets and liabilities in the Company’s consolidated financial statements.
The impact of currency rate changes on our Colombian Peso denominated transactions and balances resulted in foreign currency losses of $1.4 million for trading purposes.the year ended December 31, 2008.
| Item 8. | Financial Statements and Supplementary Data |
28
Item 8.Financial Statements and Supplementary Data
PIONEER DRILLING COMPANY
INDEX TO CONSOLIDATED FINANCIAL STATEMENTS
| | |
| | Page |
Reports of Independent Registered Public Accounting Firm | | 56 |
| |
Consolidated Balance Sheets as of MarchDecember 31, 20052008 and 2004December 31, 2007 | | 58 |
| |
Consolidated Statements of Operations for the YearsYear Ended December 31, 2008, the Nine Months Ended December 31, 2007 and the Year Ended March 31, 2005, 2004 and 20032007. | | 59 |
| |
Consolidated Statements of Shareholders’ Equity and Comprehensive Income for the YearsYear Ended December 31, 2008, the Nine Months Ended December 31, 2007 and the Year Ended March 31, 2005, 2004 and 20032007. | | 60 |
| |
Consolidated Statements of Cash Flows for the YearsYear Ended December 31, 2008, the Nine Months Ended December 31, 2007 and the Year Ended March 31, 2005, 2004 and 20032007. | | 61 |
| |
Notes to Consolidated Financial Statements | | 62 |
29
REPORT OF INDEPENDENT REGISTERED PUBLIC ACCOUNTING FIRMReport of Independent Registered Public Accounting Firm
To the Board of Directors and Shareholders
Pioneer Drilling Company:
We have audited the accompanying consolidated balance sheets of Pioneer Drilling Company and subsidiaries as of MarchDecember 31, 20052008 and 2004,2007, and the related consolidated statements of operations, stockholders’shareholders’ equity and comprehensive income, and cash flows for each of the years inyear ended December 31, 2008, the three-year periodnine months ended December 31, 2007 and the year ended March 31, 2005. In connection with our audits of the consolidated financial statements, we also have audited the financial statement schedule II.2007. These consolidated financial statements and financial statement schedule are the responsibility of the Company’s management. Our responsibility is to express an opinion on these consolidated financial statements and financial statement schedule based on our audits.
We conducted our audits in accordance with the standards of the Public Company Accounting Oversight Board (United States). Those standards require that we plan and perform the audit to obtain reasonable assurance about whether the financial statements are free of material misstatement. An audit includes examining, on a test basis, evidence supporting the amounts and disclosures in the financial statements. An audit also includes assessing the accounting principles used and significant estimates made by management, as well as evaluating the overall financial statement presentation. We believe that our audits provide a reasonable basis for our opinion.
In our opinion, the consolidated financial statements referred to above present fairly, in all material respects, the financial position of Pioneer Drilling Company and subsidiaries as of MarchDecember 31, 20052008 and 2004,2007, and the results of their operations and their cash flows for each of the years inyear ended December 31, 2008, the three-year periodnine months ended December 31, 2007 and the year ended March 31, 2005,2007, in conformity with U.S. generally accepted accounting principles. Also in our opinion, the related financial statement schedule, when considered in relation to the basic consolidated financial statements taken as a whole, present fairly, in all material respects, the information set forth therein.
We also have audited, in accordance with the standards of the Public Company Accounting Oversight Board (United States), the effectiveness of Pioneer Drilling Company’s internal control over financial reporting as of MarchDecember 31, 2005,2008, based on criteria established in Internal Control—Integrated Framework issued by the Committee of Sponsoring Organizations of the Treadway Commission (COSO), and our report dated May 27, 2005February 25, 2009 expressed an unqualified opinion on management’s assessmentthe effectiveness of and the effective operation of,Company’s internal control over financial reporting.
/s/ KPMG LLP
San Antonio, Texas
May 27, 2005
February 25, 2009
30
Report of Independent Registered Public Accounting Firm
REPORT OF INDEPENDENT REGISTERED PUBLIC ACCOUNTING FIRM
The Board of Directors and Stockholders
Pioneer Drilling Company:
We have audited management’s assessment, included in Management’s Report on Internal Control over Financial Reporting in Item 9A of Pioneer Drilling Company’s Annual Report on Form 10-K for the year ended March 31, 2005, that Pioneer Drilling Company and subsidiaries maintained effective internal control over financial reporting as of MarchDecember 31, 2005,2008, based oncriteria established in Internal Control—Integrated Framework issued by the Committee of Sponsoring Organizations of the Treadway Commission (COSO). Pioneer Drilling Company’s management is responsible for maintaining effective internal control over financial reporting and for its assessment of the effectiveness of internal control over financial reporting.reporting included in the accompanying Management’s Report on Internal Control Over Financial Reporting. Our responsibility is to express an opinion on management’s assessment and an opinion on the effectiveness of the Company’s internal control over financial reporting based on our audit.
We conducted our audit in accordance with the standards of the Public Company Accounting Oversight Board (United States). Those standards require that we plan and perform the audit to obtain reasonable assurance about whether effective internal control over financial reporting was maintained in all material respects. Our audit included obtaining an understanding of the Company’s internal control over financial reporting, evaluating management’s assessment,assessing the risk that a material weakness exists, and testing and evaluating the design and operating effectiveness of the Company’s internal control over financial reporting, andbased on the assessed risk. Our audit also included performing such other procedures as we considered necessary in the circumstances. We believe that our audit provides a reasonable basis for our opinion.
A company’s internal control over financial reporting is a process designed to provide reasonable assurance regarding the reliability of financial reporting and the preparation of financial statements for external purposes in accordance with generally accepted accounting principles. A company’s internal control over financial reporting includes those policies and procedures that (1) pertain to the maintenance of records that, in reasonable detail, accurately and fairly reflect the transactions and dispositions of the assets of the company; (2) provide reasonable assurance that transactions are recorded as necessary to permit preparation of financial statements in accordance with generally accepted accounting principles, and that receipts and expenditures of the company are being made only in accordance with authorizations of management and directors of the company; and (3) provide reasonable assurance regarding prevention or timely detection of unauthorized acquisition, use, or disposition of the company’s assets that could have a material effect on the financial statements.
Because of its inherent limitations, internal control over financial reporting may not prevent or detect misstatements. Also, projections of any evaluation of effectiveness to future periods are subject to the risk that controls may become inadequate because of changes in conditions, or that the degree of compliance with the policies or procedures may deteriorate.
In our opinion, management’s assessment that Pioneer Drilling Company maintained, in all material respects, effective internal control over financial reporting as of MarchDecember 31, 2005, is fairly stated, in all material respects,2008, based on criteria established in Internal Control—Integrated Framework issued by the Committee of Sponsoring Organizations of the Treadway Commission (COSO). Also, in our opinion, Commission.
Pioneer Drilling Company maintained, in all material respects, effectiveacquired the production services businesses of WEDGE Group Incorporated, Prairie Investors d/b/a Competition Wireline, Paltec, Inc. and Pettus Well Service (acquired companies) during 2008, and management excluded from its assessment of the effectiveness of Pioneer Drilling Company’s internal control over financial reporting as of MarchDecember 31, 2005, based on criteria established2008, the acquired companies’ internal control over financial reporting associated with total assets of $232.1 million and total revenues of $154.0 million included in Internal Control—Integrated Framework issued by the Committeeconsolidated financial statement amounts of Sponsoring OrganizationsPioneer Drilling Company as of and for the year ended December 31, 2008. Our audit of internal control over financial reporting of Pioneer Drilling Company also excluded an evaluation of the Treadway Commission (COSO).internal control over financial reporting of the acquired companies.
We also have audited, in accordance with the standards of the Public Company Accounting Oversight Board (United States), the consolidated balance sheets of Pioneer Drilling Company and subsidiaries as of MarchDecember 31, 20052008 and 2004,2007, and the related consolidated statements of operations, stockholders’shareholders’ equity and comprehensive income, and cash flows for each of the years inyear ended December 31, 2008, the three-year periodnine months ended December 31, 2007 and the year ended March 31, 2005,2007, and our report dated May 27, 2005February 25, 2009 expressed an unqualified opinion on those consolidated financial statements.statements.
/s/ KPMG LLP
KPMG LLP
|
|
|
San Antonio, Texas |
May 27, 2005
|
31February 25, 2009
PIONEER DRILLING COMPANY AND SUBSIDIARIES
CONSOLIDATED BALANCE SHEETSSHEET
| | | | | December 31,
2008 | | | December 31,
2007 |
| March 31, | | | |
| | 2005 | | 2004 | | | (In thousands, except share data) |
ASSETS | | | | | | | | | |
Current assets: | | | | | | | | | |
Cash and cash equivalents | | $ | 69,673,279 | | $ | 1,815,759 | | | $ | 26,821 | | | $ | 76,703 |
Marketable securities | | 1,000,000 | | 4,550,000 | | |
Receivables: | | | | | | |
Trade, net | | 26,108,291 | | 10,901,991 | | |
Contract drilling in progress | | 5,364,529 | | 9,130,794 | | |
Current deferred income taxes | | 569,548 | | 285,384 | | |
Prepaid expenses | | 1,876,843 | | 1,336,337 | | |
Receivables, net of allowance for doubtful accounts | | | | 87,161 | | | | 47,370 |
Unbilled receivables | | | | 12,262 | | | | 7,861 |
Deferred income taxes | | | | 6,270 | | | | 3,670 |
Inventory | | | | 3,874 | | | | 1,180 |
Prepaid expenses and other current assets | | | | 8,902 | | | | 5,073 |
| | | | | | |
Total current assets | | 104,592,490 | | 28,020,265 | | | | 145,290 | | | | 141,857 |
Property and equipment, at cost: | | | | | | |
Drilling rigs and equipment | | 216,286,747 | | 145,758,913 | | |
Transportation equipment | | 6,469,519 | | 4,282,349 | | |
Land, buildings and other | | 2,691,673 | | 1,145,288 | | |
| | 225,447,939 | | 151,186,550 | | | | | | |
Property and equipment, at cost | | | | 858,491 | | | | 578,697 |
Less accumulated depreciation and amortization | | 54,881,488 | | 35,844,938 | | | | 230,929 | | | | 161,675 |
| | | | | | |
Net property and equipment | | 170,566,451 | | 115,341,612 | | | | 627,562 | | | | 417,022 |
Intangible and other assets | | 850,381 | | 369,278 | | |
Deferred income taxes | | | | — | | | | 573 |
Intangible assets, net of amortization | | | | 29,913 | | | | 57 |
Other long-term assets | | | | 21,714 | | | | 703 |
| | | | | | |
Total assets | | $ | 276,009,322 | | $ | 143,731,155 | | | $ | 824,479 | | | $ | 560,212 |
| | | | | | |
| | | | | | | |
LIABILITIES AND SHAREHOLDERS’ EQUITY | | | | | | | | | |
Current liabilities: | | | | | | | | | |
Notes payable | | $ | 681,975 | | $ | 558,070 | | |
Current installments of long-term debt | | 4,666,667 | | 3,724,302 | | |
Current installments of capital lease obligations | | 66,359 | | 140,934 | | |
Accounts payable | | 15,621,647 | | 13,270,989 | | | $ | 21,830 | | | $ | 21,424 |
Income tax payable | | 195,949 | | — | | |
Current portion of long-term debt | | | | 17,298 | | | | — |
Prepaid drilling contracts | | 172,750 | | — | | | | 1,171 | | | | 1,933 |
Accrued expenses: | | | | | | | | | |
Payroll and payroll taxes | | 2,706,623 | | 1,499,151 | | |
Payroll and related employee costs | | | | 13,592 | | | | 5,172 |
Insurance premiums and deductibles | | | | 17,520 | | | | 9,548 |
Other | | 4,153,851 | | 2,798,801 | | | | 9,507 | | | | 3,973 |
| | | | | | |
Total current liabilities | | 28,265,821 | | 21,992,247 | | | | 80,918 | | | | 42,050 |
Long-term debt, less current installments | | 13,411,111 | | 44,786,920 | | |
Capital lease obligations, less current installments | | 33,906 | | 104,754 | | |
Non-current liability | | 400,000 | | — | | |
Long-term debt, less current portion | | | | 262,115 | | | | — |
Other long-term liabilities | | | | 6,413 | | | | 254 |
Deferred income taxes | | 12,283,070 | | 6,010,916 | | | | 60,915 | | | | 46,836 |
| | | | | | |
Total liabilities | | 54,393,908 | | 72,894,837 | | | | 410,361 | | | | 89,140 |
| | | | | | |
Commitments and contingencies | | — | | — | | | | | |
Shareholders’ equity: | | | | | | | | | |
Preferred stock, 10,000,000 shares authorized; none issued and outstanding | | — | | — | | | | — | | | | — |
Common stock $.10 par value; 100,000,000 shares authorized; 45,893,311 shares and 27,300,126 shares issued and outstanding at March 31, 2005 and March 31, 2004, respectively | | 4,589,331 | | 2,730,012 | | |
Common stock $.10 par value; 100,000,000 shares authorized; 49,997,578 shares and 49,650,978 shares issued and outstanding at December 31, 2008 and December 31, 2007, respectively | | | | 5,000 | | | | 4,965 |
Additional paid-in capital | | 220,232,520 | | 82,124,368 | | | | 301,923 | | | | 294,922 |
Accumulated deficit | | (3,206,437 | ) | (14,018,062 | ) | |
Accumulated earnings | | | | 108,440 | | | | 171,185 |
Accumulated other comprehensive loss | | | | (1,245 | ) | | | — |
| | | | | | |
Total shareholders’ equity | | 221,615,414 | | 70,836,318 | | | | 414,118 | | | | 471,072 |
| | | | | | |
Total liabilities and shareholders’ equity | | $ | 276,009,322 | | $ | 143,731,155 | | | $ | 824,479 | | | $ | 560,212 |
| | | | | | |
See accompanying notes to consolidated financial statements.
32
PIONEER DRILLING COMPANY AND SUBSIDIARIES
CONSOLIDATED STATEMENTS OF OPERATIONS
| | Years Ended March 31, | |
| | 2005 | | 2004 | | 2003 | |
| | | | | | | |
Contract drilling revenues | | $ | 185,246,448 | | $ | 107,875,533 | | $ | 80,183,486 | |
| | | | | | | |
Costs and expenses: | | | | | | | |
Contract drilling | | 138,482,759 | | 88,504,102 | | 70,823,310 | |
Depreciation and amortization | | 23,090,909 | | 16,160,494 | | 11,960,387 | |
General and administrative | | 4,657,013 | | 2,772,730 | | 2,232,390 | |
Bad debt expense | | 242,000 | | — | | 110,000 | |
| | | | | | | |
Total operating costs and expenses | | 166,472,681 | | 107,437,326 | | 85,126,087 | |
Income (loss) from operations | | 18,773,767 | | 438,207 | | (4,942,601 | ) |
| | | | | | | |
Other income (expense): | | | | | | | |
Interest expense | | (1,722,393 | ) | (2,807,822 | ) | (2,698,529 | ) |
Interest income | | 173,318 | | 101,584 | | 94,235 | |
Other | | 37,267 | | 51,675 | | 37,614 | |
Loss from early extinguishment of debt | | (100,833 | ) | — | | 203,887 | |
Total other income (expense) | | (1,612,641 | ) | (2,654,563 | ) | (2,362,793 | ) |
| | | | | | | |
Income (loss) before income taxes | | 17,161,126 | | (2,216,356 | ) | (7,305,394 | ) |
Income tax (expense) benefit | | (6,349,501 | ) | 426,299 | | 2,219,776 | |
| | | | | | | |
Net earnings (loss) | | $ | 10,811,625 | | $ | (1,790,057 | ) | $ | (5,085,618 | ) |
| | | | | | | |
Earnings (loss) per common share - Basic | | $ | 0.31 | | $ | (0.08 | ) | $ | (0.31 | ) |
| | | | | | | |
Earnings (loss) per common share - Diluted | | $ | 0.30 | | $ | (0.08 | ) | $ | (0.31 | ) |
| | | | | | | |
Weighted average number of shares outstanding - Basic | | 34,543,695 | | 22,585,612 | | 16,163,098 | |
| | | | | | | |
Weighted average number of shares outstanding - Diluted | | 37,577,927 | | 22,585,612 | | 16,163,098 | |
| | | | | | | | | | | | |
| | | Year Ended
December 31, 2008 | | | Nine Months
Ended
December 31, 2007 | | | Year Ended
March 31, 2007 | |
| | | (In thousands, except per share data) | |
Revenues: | | | | | | | | | | | | |
Drilling services | | $ | 456,890 | | | $ | 313,884 | | | $ | 416,178 | |
Production services | | | 153,994 | | | | — | | | | — | |
| | | | | | | | | | | | |
Total revenue | | | 610,884 | | | | 313,884 | | | | 416,178 | |
| | | | | | | | | | | | |
Costs and expenses: | | | | | | | | | | | | |
Drilling services | | | 269,846 | | | | 191,374 | | | | 219,353 | |
Production services | | | 80,097 | | | | — | | | | — | |
Depreciation and amortization | | | 88,145 | | | | 48,852 | | | | 52,856 | |
Selling, general and administrative | | | 44,834 | | | | 15,786 | | | | 16,193 | |
Bad debt expense | | | 423 | | | | 2,612 | | | | 800 | |
Impairment of goodwill | | | 118,646 | | | | — | | | | — | |
Impairment of intangible assets | | | 52,847 | | | | — | | | | — | |
| | | | | | | | | | | | |
Total operating costs and expenses | | | 654,838 | | | | 258,624 | | | | 289,202 | |
| | | | | | | | | | | | |
(Loss) income from operations | | | (43,954 | ) | | | 55,260 | | | | 126,976 | |
| | | | | | | | | | | | |
Other (expense) income: | | | | | | | | | | | | |
Interest expense | | | (13,072 | ) | | | (16 | ) | | | (73 | ) |
Interest income | | | 1,256 | | | | 2,401 | | | | 3,828 | |
Other | | | (918 | ) | | | 129 | | | | 58 | |
| | | | | | | | | | | | |
Total other (expense) income | | | (12,734 | ) | | | 2,514 | | | | 3,813 | |
| | | | | | | | | | | | |
(Loss) income before income taxes | | | (56,688 | ) | | | 57,774 | | | | 130,789 | |
Income tax expense | | | (6,057 | ) | | | (18,129 | ) | | | (46,609 | ) |
| | | | | | | | | | | | |
Net (loss) earnings | | $ | (62,745 | ) | | $ | 39,645 | | | $ | 84,180 | |
| | | | | | | | | | | | |
(Loss) earnings per common share—Basic | | $ | (1.26 | ) | | $ | 0.80 | | | $ | 1.70 | |
| | | | | | | | | | | | |
(Loss) earnings per common share—Diluted | | $ | (1.26 | ) | | $ | 0.79 | | | $ | 1.68 | |
| | | | | | | | | | | | |
Weighted average number of shares outstanding—Basic | | | 49,789 | | | | 49,645 | | | | 49,603 | |
| | | | | | | | | | | | |
Weighted average number of shares outstanding—Diluted | | | 49,789 | | | | 50,201 | | | | 50,132 | |
| | | | | | | | | | | | |
See accompanying notes to consolidated financial statements.
33
PIONEER DRILLING COMPANY AND SUBSIDIARIES
CONSOLIDATED STATEMENTS OF SHAREHOLDERS’SHAREHOLDERS’ EQUITY AND COMPREHENSIVE INCOME
| | | | | | | | | | Accumulated | | | |
| | | | | | Additional | | | | Other | | Total | |
| | Shares | | Amount | | Paid In | | Accumulated | | Comprehensive | | Shareholders’ | |
| | Common | | Common | | Capital | | Deficit | | Income | | Equity | |
| | | | | | | | | | | | | |
Balance as of March 31, 2002 | | 15,922,459 | | $ | 1,592,245 | | $ | 38,783,731 | | $ | (7,142,387 | ) | $ | 109,416 | | $ | 33,343,005 | |
Comprehensive income: | | | | | | | | | | | | | |
Net loss | | — | | — | | — | | (5,085,618 | ) | — | | (5,085,618 | ) |
Net unrealized change in securites available for sale, net of tax of $56,366 | | — | | — | | — | | — | | (109,416 | ) | (109,416 | ) |
Total comprehensive loss | | — | | — | | — | | — | | — | | (5,195,034 | ) |
Issuance of common stock for: | | | | | | | | | | | | | |
Sale, net of related expenses of $657,499 | | 5,333,333 | | 533,334 | | 18,809,167 | | — | | — | | 19,342,501 | |
Exercise of options and related tax benefits of $2,720 | | 445,000 | | 44,500 | | 137,290 | | — | | — | | 181,790 | |
Preferred stock dividend | | — | | — | | — | | — | | — | | — | |
Balance as of March 31, 2003 | | 21,700,792 | | 2,170,079 | | 57,730,188 | | (12,228,005 | ) | — | | 47,672,262 | |
Comprehensive income: | | | | | | | | | | | | | |
Net loss | | — | | — | | — | | (1,790,057 | ) | — | | (1,790,057 | ) |
Total comprehensive loss | | — | | — | | — | | — | | — | | (1,790,057 | ) |
Issuance of common stock for: | | | | | | | | | | | | | |
Sale, net of related expenses of $1,654,753 | | 4,400,000 | | 440,000 | | 21,665,247 | | — | | — | | 22,105,247 | |
Equipment acquisitions | | 477,000 | | 47,700 | | 2,074,950 | | — | | — | | 2,122,650 | |
Exercise of options and related income tax benefits of $52,423 | | 722,334 | | 72,233 | | 653,983 | | — | | — | | 726,216 | |
Balance as of March 31, 2004 | | 27,300,126 | | 2,730,012 | | 82,124,368 | | (14,018,062 | ) | — | | 70,836,318 | |
Comprehensive income: | | | | | | | | | | | | | |
Net earnings | | — | | — | | — | | 10,811,625 | | — | | 10,811,625 | |
Total comprehensive income | | — | | — | | — | | — | | — | | 10,811,625 | |
Issuance of common stock for: | | | | | | | | | | | | | |
Sale, net of related expenses of $5,807,193 | | 11,545,000 | | 1,154,500 | | 109,854,558 | | — | | — | | 111,009,058 | |
Debenture conversion | | 6,496,519 | | 649,652 | | 27,350,348 | | — | | — | | 28,000,000 | |
Exercise of options and related income tax benefits of $204,964 | | 551,666 | | 55,167 | | 903,246 | | — | | — | | 958,413 | |
Balance as of March 31, 2005 | | 45,893,311 | | $ | 4,589,331 | | $ | 220,232,520 | | $ | (3,206,437 | ) | $ | — | | $ | 221,615,414 | |
| | | | | | | | | | | | | | | | | | | | | |
| | | Shares
Common | | Amount
Common | | Additional
Paid In
Capital | | | Accumulated
Earnings | | | Accumulated
Other
Comprehensive
Loss | | | Total
Shareholders’
Equity | |
| | | (In thousands) | |
Balance as of March 31, 2006 | | 49,592 | | $ | 4,959 | | $ | 288,356 | | | $ | 47,361 | | | $ | — | | | $ | 340,676 | |
Comprehensive income: | | | | | | | | | | | | | | | | | | | | | |
Net earnings | | — | | | — | | | — | | | | 84,179 | | | | — | | | | 84,179 | |
| | | | | | | | | | | | | | | | | | | | | |
Total comprehensive income | | — | | | — | | | — | | | | — | | | | — | | | | 84,179 | |
| | | | | | | | | | | | | | | | | | | | | |
Issuance of common stock for: | | | | | | | | | | | | | | | | | | | | | |
Exercise of options and related income tax benefits of $24 | | 37 | | | 4 | | | 190 | | | | — | | | | — | | | | 194 | |
Stock-based compensation expense | | — | | | — | | | 3,061 | | | | — | | | | — | | | | 3,061 | |
| | | | | | | | | | | | | | | | | | | | | |
Balance as of March 31, 2007 | | 49,629 | | | 4,963 | | | 291,607 | | | | 131,540 | | | | — | | | | 428,110 | |
Comprehensive income: | | | | | | | | | | | | | | | | | | | | | |
Net earnings | | — | | | — | | | — | | | | 39,645 | | | | — | | | | 39,645 | |
| | | | | | | | | | | | | | | | | | | | | |
Total comprehensive income | | — | | | — | | | — | | | | — | | | | — | | | | 39,645 | |
| | | | | | | | | | | | | | | | | | | | | |
Issuance of common stock for: | | | | | | | | | | | | | | | | | | | | | |
Exercise of options and related income tax benefits of $54 | | 22 | | | 2 | | | 158 | | | | — | | | | — | | | | 160 | |
Stock-based compensation expense | | — | | | — | | | 3,157 | | | | — | | | | — | | | | 3,157 | |
| | | | | | | | | | | | | | | | | | | | | |
Balance as of December 31, 2007 | | 49,651 | | $ | 4,965 | | $ | 294,922 | | | $ | 171,185 | | | $ | — | | | $ | 471,072 | |
Comprehensive loss: | | | | | | | | | | | | | | | | | | | | | |
Net loss | | — | | | — | | | — | | | | (62,745 | ) | | | — | | | | (62,745 | ) |
Unrealized loss on securities | | — | | | — | | | — | | | | — | | | | (1,245 | ) | | | (1,245 | ) |
| | | | | | | | | | | | | | | | | | | | | |
Total comprehensive loss | | | | | | | | | | | | | | | | | | | | (63,990 | ) |
| | | | | | | | | | | | | | | | | | | | | |
Exercise of options and related income tax benefits of $244 | | 170 | | | 17 | | | 1,011 | | | | — | | | | — | | | | 1,028 | |
Issuance of restricted stock | | 177 | | | 18 | | | (34 | ) | | | — | | | | — | | | | (16 | ) |
Stock-based compensation expense | | — | | | — | | | 6,024 | | | | — | | | | — | | | | 6,024 | |
| | | | | | | | | | | | | | | | | | | | | |
Balance as of December 31, 2008 | | 49,998 | | $ | 5,000 | | $ | 301,923 | | | $ | 108,440 | | | $ | (1,245 | ) | | $ | 414,118 | |
| | | | | | | | | | | | | | | | | | | | | |
See accompanying notes to consolidated financial statements.
34
PIONEER DRILLING COMPANY AND SUBSIDIARIES
CONSOLIDATEDCONSOLIDATED STATEMENTS OF CASH FLOWS
| | | Years Ended March 31, | | | Year Ended
December 31, 2008 | | Nine Months
Ended
December 31, 2007 | | Year Ended
March 31, 2007 | |
| | 2005 | | 2004 | | 2003 | | | (In thousands) | |
Cash flows from operating activities: | | | | | | | | | | | | | |
Net earnings (loss) | | $ | 10,811,627 | | $ | (1,790,057 | ) | $ | (5,085,618 | ) | |
Adjustments to reconcile net earnings (loss) to net cash provided by operating activities: | | | | | | | | |
Net (loss) earnings | | | $ | (62,745 | ) | | $ | 39,645 | | | $ | 84,180 | |
Adjustments to reconcile net (loss) earnings to net cash provided by operating activities: | | | | | | | |
Depreciation and amortization | | 23,090,909 | | 16,160,494 | | 11,960,387 | | | | 88,145 | | | | 48,852 | | | | 52,856 | |
Allowance for doubtful accounts | | 242,000 | | — | | 110,000 | | | | 1,591 | | | | 2,612 | | | | 800 | |
Gain on sale of securities | | — | | — | | (203,887 | ) | |
Loss on dispositions of property and equipment | | 696,345 | | 816,104 | | 279,054 | | |
Change in deferred income taxes | | 5,987,991 | | 119,038 | | (1,511,744 | ) | |
(Gain) loss on dispositions of property and equipment | | | | (805 | ) | | | 2,809 | | | | 5,760 | |
Stock-based compensation expense | | | | 4,597 | | | | 3,157 | | | | 3,061 | |
Impairment of goodwill and intangibles assets | | | | 171,493 | | | | — | | | | — | |
Deferred income taxes | | | | (2,310 | ) | | | 5,947 | | | | 10,653 | |
Change in other assets | | | | 265 | | | | (519 | ) | | | 20 | |
Change in non-current liabilities | | | | (621 | ) | | | (92 | ) | | | (41 | ) |
Changes in current assets and liabilities: | | | | | | | | | | | | | |
Receivables | | (11,682,035 | ) | (11,103,862 | ) | 242,126 | | | | (24,867 | ) | | | 9,692 | | | | (23,170 | ) |
Prepaid expenses | | (540,507 | ) | (422,150 | ) | (279,440 | ) | |
Inventory | | | | (927 | ) | | | (1,180 | ) | | | — | |
Prepaid expenses & other current assets | | | | (2,390 | ) | | | (1,420 | ) | | | (1,445 | ) |
Accounts payable | | 2,350,658 | | (935,597 | ) | 7,699,417 | | | | (2,610 | ) | | | 919 | | | | (137 | ) |
Income tax payable | | 195,949 | | — | | — | | | | 409 | | | | — | | | | (6,843 | ) |
Prepaid drilling contracts | | 172,750 | | — | | — | | | | (762 | ) | | | 1,933 | | | | (140 | ) |
Federal income taxes | | — | | 444,900 | | 435,168 | | |
Accrued expenses | | 2,462,523 | | 1,576,096 | | 743,814 | | | | 17,928 | | | | 3,100 | | | | 5,976 | |
| | | | | | | | | | |
Net cash provided by operating activities | | 33,788,210 | | 4,864,966 | | 14,389,277 | | | | 186,391 | | | | 115,455 | | | | 131,530 | |
| | | | | | | | | | | | | | | | |
Cash flows from investing activities: | | | | | | | |
Acquisition of production services business of WEDGE | | | | (313,621 | ) | | | — | | | | — | |
Acquisition of production services business of Competition | | | | (26,772 | ) | | | — | | | | — | |
Acquisition of other production services businesses | | | | (9,301 | ) | | | — | | | | — | |
Purchases of property and equipment | | | | (147,455 | ) | | | (126,158 | ) | | | (144,507 | ) |
Purchase of auction rate securities, net | | | | (15,900 | ) | | | — | | | | — | |
Proceeds from sale of property and equipment | | | | 4,008 | | | | 2,300 | | | | 6,547 | |
Proceeds from insurance recoveries | | | | 3,426 | | | | — | | | | — | |
| | | | | | | | | | |
Net cash used in investing activities | | | | (505,615 | ) | | | (123,858 | ) | | | (137,960 | ) |
| | | | | | | | | | |
Cash flows from financing activities: | | | | | | | | | | | | | |
Proceeds from notes payable | | 41,354,367 | | 4,110,019 | | 23,573,501 | | |
Proceeds from subordinated debenture | | — | | — | | 10,000,000 | | |
Increase in other assets | | (123,263 | ) | (40,000 | ) | (253,698 | ) | |
Payments of debt | | | | (87,767 | ) | | | — | | | | — | |
Proceeds from issuance of debt | | | | 359,400 | | | | — | | | | — | |
Debt issuance costs | | | | (3,319 | ) | | | — | | | | — | |
Proceeds from exercise of options | | 958,412 | | 673,794 | | 181,790 | | | | 784 | | | | 107 | | | | 174 | |
Proceeds from common stock, net of offering cost of $5,807,193 in 2005, of $1,654,753 in 2004 and $657,499 in 2003 | | 111,009,058 | | 22,105,247 | | 19,342,501 | | |
Payments of debt | | (43,809,329 | ) | (4,048,744 | ) | (18,714,311 | ) | |
Excess tax benefit of stock option exercises | | | | 244 | | | | 54 | | | | 27 | |
| | | | | | | | | | |
Net cash provided by financing activities | | 109,389,245 | | 22,800,316 | | 34,129,783 | | | | 269,342 | | | | 161 | | | | 201 | |
Cash flows from investing activities: | | | | | | | | |
Business acquisitions | | (35,200,000 | ) | (14,500,000 | ) | — | | |
Purchases of property and equipment | | (45,188,484 | ) | (28,222,094 | ) | (33,588,972 | ) | |
Purchase of marketable securities, net | | (17,525,000 | ) | (25,400,000 | ) | (19,925,000 | ) | |
Proceeds from sale of marketable securities | | 21,075,000 | | 23,500,000 | | 21,500,414 | | |
Proceeds from sale of property and equipment | | 1,518,549 | | 419,658 | | 314,366 | | |
Net cash used in investing activities | | (75,319,935 | ) | (44,202,436 | ) | (31,699,192 | ) | |
Net increase (decrease) in cash and cash equivalents | | 67,857,520 | | (16,537,154 | ) | 16,819,868 | | |
| | | | | | | | | | |
Net decrease in cash and cash equivalents | | | | (49,882 | ) | | | (8,242 | ) | | | (6,229 | ) |
Beginning cash and cash equivalents | | 1,815,759 | | 18,352,913 | | 1,533,045 | | | | 76,703 | | | | 84,945 | | | | 91,174 | |
| | | | | | | | | | |
Ending cash and cash equivalents | | $ | 69,673,279 | | $ | 1,815,759 | | $ | 18,352,913 | | | $ | 26,821 | | | $ | 76,703 | | | $ | 84,945 | |
| | | | | | | | | | |
Supplementary disclosure: | | | | | | | | | | | | | |
Interest paid | | $ | 2,407,193 | | $ | 2,821,041 | | $ | 2,785,177 | | | $ | 12,468 | | | $ | 15 | | | $ | 104 | |
Income tax refunded | | (30,000 | ) | (990,237 | ) | (1,143,200 | ) | |
Debenture conversion - common stock issued | | 28,000,000 | | — | | — | | |
Acquisition - common stock issued | | — | | 2,122,650 | | — | | |
Tax benefit from exercise of nonqualified options | | 204,964 | | 52,423 | | 2,720 | | |
Income tax paid | | | $ | 11,166 | | | $ | 9,473 | | | $ | 46,258 | |
See accompanying notes to consolidated financial statements.
35
PIONEER DRILLING COMPANY AND SUBSIDIARIES
NOTES TO CONSOLIDATED FINANCIAL STATEMENTS
| 1. | Organization and Summary of Significant Accounting Policies |
1. Organization and Summary of Significant Accounting Policies
Business and Principles of Consolidation
Pioneer Drilling Company provides contract landand subsidiaries provide drilling and production services to our customers in select oil and natural gas exploration and production regions in the United States. We conduct our operations through our principal operating subsidiary, PioneerStates and Colombia. Our Drilling Services Ltd. Division provides contract land drilling services with its fleet of 70 drilling rigs in the following locations:
| | |
Drilling Division Locations | | Rig Count |
South Texas | | 17 |
East Texas | | 22 |
North Texas | | 9 |
Utah | | 6 |
North Dakota | | 6 |
Oklahoma | | 5 |
Colombia | | 5 |
As of February 23, 2009, 36 drilling rigs are operating, 29 drilling rigs are idle and five drilling rigs located in our Oklahoma drilling division have been placed in storage or “cold stacked” due to low demand for drilling rigs in this region. We are actively marketing all our idle drilling rigs and we are earning revenue on two of these rigs through early termination fees on their drilling contracts with terms expiring in March 2009 and May 2009. We are constructing a 1500 horsepower drilling rig that we expect to be completed and available for operation in the in our North Dakota drilling division under a contract with a three year term beginning March 2009.
Our Production Services Division provides a broad range of well services to oil and gas drilling and producing companies, including workover services, wireline services, and fishing and rental services. Our production services operations are managed regionally and are concentrated in the major United States onshore oil and gas producing regions in the Gulf Coast, Mid-Continent, and Rocky Mountain states. We have a premium fleet of 74 workover rigs consisting of sixty-nine 550 horseposewer rigs, four 600 horsepower rigs, and one 400 horsepower rig. As of February 23, 2009, 62 workover rigs are operating and 12 workover rigs are idle with no crews assigned. We provide wireline services with a fleet of 59 wireline units and rental services with approximately $15 million of fishing and rental tools.
The accompanying consolidated financial statements include our accounts and the accounts of Pioneer Drilling Company and our wholly owned subsidiaries. We have eliminated allAll intercompany accountsbalances and transactions have been eliminated in consolidation. In December 2007, our Board of Directors approved a change in our fiscal year end from March 31st to December 31st. The fiscal year end change was effective December 31, 2007 and resulted in a nine month reporting period from April 1, 2007 to December 31, 2007. We implemented the fiscal year end change to align our United States reporting period with the required Colombian statutory reporting period as well as the reporting periods of peer companies in the industry.
We have prepared theThe accompanying consolidated financial statements have been prepared in accordance with accounting principles generally accepted in the United States of America. In preparing the accompanying consolidated financial statements, we make various estimates and assumptions that affect the amounts of assets and liabilities we report as of the dates of the balance sheets and income and expenses we report for the periods shown in the income statements and statements of cash flows. Our actual results could differ significantly from those estimates. Material estimates that are particularly susceptible to significant changes in the near term relate to our recognition of revenues and costs for turnkey contracts, our estimate of the allowance for doubtful accounts, our estimate of the self-insurance portion of our health and workers’ compensation insurance, our estimate of asset impairments, our estimate of deferred taxes and our determination of depreciation and amortization expense.
Income TaxesDrilling Contracts
Our drilling contracts generally provide for compensation on either a daywork, turnkey or footage basis. Contract terms generally depend on the complexity and risk of operations, the on-site drilling conditions, the type of equipment used and the anticipated duration of the work to be performed. Generally, our contracts provide for the drilling of a single well and typically permit the customer to terminate on short notice. However, we have entered into more longer-term drilling contracts during periods of high rig demand. In addition, we have entered into longer-term drilling contracts for our newly constructed rigs. As of February 6, 2009, we had 27 contracts with terms of six months to three years in duration, of which 18 will expire by August 6, 2009, six have a remaining term of six to 12 months, one has a remaining term of 12 to 18 months and two have a remaining term in excess of 18 months.
Pursuant to Statement of Financial Accounting Standards (“SFAS”) No. 109, “AccountingForeign Currencies
Our functional currency for Income Taxes,” we followour foreign subsidiary in Colombia is the asset and liability method of accounting for income taxes, under which we recognize deferred taxU.S. dollar. Nonmonetary assets and liabilities for the future tax consequences attributable to differences between the financial statement carrying amounts of existingare translated at historical rates and monetary assets and liabilities and their respective tax basis. We measure our deferred tax assets and liabilities by usingare translated at exchange rates in effect at the enacted tax rates we expect to apply to taxable income in the years in which we expect to recover or settle those temporary differences. Under SFAS No. 109, we reflect in income the effect of a change in tax rates on deferred tax assets and liabilities in the period during which the change occurs.
Earnings (Loss) Per Common Share
We compute and present earnings (loss) per common share in accordance with SFAS No. 128 “Earnings per Share.” This standard requires dual presentation of basic and diluted earnings (loss) per share on the face of our statement of operations. For fiscal years 2004 and 2003, we did not include the effects of convertible subordinated debt and stock options on loss per common share because they were antidilutive.
36
Stock-based Compensation
We have adopted SFAS No. 123, “Accounting for Stock-Based Compensation.” SFAS No. 123 allows a company to adopt a fair value based method of accounting for a stock-based employee compensation plan or to continue to use the intrinsic value based method of accounting prescribed by Accounting Principles Board (“APB”) Opinion No. 25, “Accounting for Stock Issued to Employees.” We have elected to continue accounting for stock-based compensation under the intrinsic value method. Under this method, we record no compensation expense for stock option grants when the exercise priceend of the options granted is equal toperiod. Income statement accounts are translated at average rates for the fair market valueperiod. Gains and losses from remeasurement of our common stock on the date of grant. If we had elected to recognize compensation cost based on the fair value of the options we granted at their respective grant dates as SFAS No. 123 prescribes, our net earnings (loss)foreign currency financial statements into U.S. dollars and net earnings (loss) per share would have been reduced to the pro forma amounts the table below indicates:from foreign currency transactions are included in other income or expense.
| | Years Ended March 31, | |
| | 2005 | | 2004 | | 2003 | |
| | | | | | | |
Net earnings (loss)-as reported | | $ | 10,811,625 | | $ | (1,790,057 | ) | $ | (5,085,618 | ) |
Deduct: Total stock-based employee compensation expense determined under fair value based method for all awards net of related tax effect | | (1,175,191 | ) | (662,933 | ) | (385,671 | ) |
Net earnings (loss)-pro forma | | $ | 9,636,434 | | $ | (2,452,990 | ) | $ | (5,471,289 | ) |
Net earnings (loss) per share-as reported-basic | | $ | 0.31 | | $ | (0.08 | ) | $ | (0.31 | ) |
Net earnings (loss) per share-as reported-diluted | | $ | 0.30 | | $ | (0.08 | ) | $ | (0.31 | ) |
Net earnings (loss) per share-pro forma-basic | | $ | 0.28 | | $ | (0.11 | ) | $ | (0.34 | ) |
Net earnings (loss) per share-pro forma-diluted | | $ | 0.27 | | $ | (0.11 | ) | $ | (0.34 | ) |
Weighted-average fair value of options granted during the year | | $ | 8.85 | | $ | 4.46 | | $ | 3.50 | |
| | 2005 | | 2004 | | 2003 | |
Expected volatility | | 86% | | 94% | | 69% | |
Weighted-average risk-free interest rates | | 3.7% | | 3.3% | | 3.2% | |
Expected life in years | | 5 | | 5 | | 5 | |
Options granted | | 510,000 | | 1,000,000 | | 65,000 | |
As we have not declared dividends since we became a public company, we did not use a dividend yield. In each case, the actual value that will be realized, if any, will depend on the future performance of our common stock and overall stock market conditions. There is no assurance the value an optionee actually realizes will be at or near the value we have estimated using the Black-Scholes model.
Revenue and Cost Recognition
Drilling Services—We earn revenues by drilling oil and natural gas wells for our contract drilling revenuescustomers under daywork, turnkey andor footage contracts.contracts, which usually provide for the drilling of a single well. We recognize revenues on daywork contracts for the days completed based on the dayrate each contract specifies. We recognize revenues from our turnkey and footage contracts on the percentage-of-completion method based on our estimate of the number of days to complete each well. Individual wellscontract. With most drilling contracts, we receive payments contractually designated for the mobilization of rigs and other equipment. Payments received, and costs incurred for the mobilization services are usually completeddeferred and recognized on a straight line basis over the contract term of certain drilling contracts. Costs incurred to relocate rigs and other drilling equipment to areas in less than 60 days.
which a contract has not been secured are expensed as incurred. Reimbursements that we receive for out-of-pocket expenses are recorded as revenue and the out-of-pocket expenses for which they relate are recorded as operating costs.
Our management has determined that it is appropriate to use the percentage-of-completion method, as defined in SOP 81-1tothe American Institute of Certified Public Accountants’ Statement of Position 81-1, to recognize revenue on our turnkey and footage contracts. Although our turnkey and footage contracts do not have express terms that provide us with rights to receive payment for the work that we perform prior to drilling wells to the agreed onagreed-on depth, we use this method because, as provided in applicable accounting literature, we believe we achieve a continuous sale for our work-in-progress and we believe, under applicable state law, we ultimately could recover the fair value of our work-in-progress even in the event we were unable to drill to the agreed onagreed-on depth in breach of the applicable contract. However, ultimate recovery of that value, in the event we were unable to drill to the agreed onagreed-on depth in breach of the contract, ultimate recovery of that value would be subject to negotiations with the customer and the possibility of litigation.
If a customer defaults on its payment obligation to us under a turnkey or footage contract, we would need to rely on applicable law to enforce our lien rights, because our turnkey and footage contracts do not expressly grant to us a security interest in the work we have completed under the contract and we have no ownership rights in the work-in-progress or completed drilling work, except any rights arising under the applicable lien statute on foreclosure. If we were unable to drill to the agreed onagreed-on depth in breach of the contract, we also would need to rely on equitable remedies outside of the contract, includingquantum meruit, available in applicable courts to recover the fair value of our work-in-progress under a turnkey or footage contract.
37
We accrue estimated contract costs on turnkey and footage contracts for each day of work completed based on our estimate of the total costcosts to complete the contract divided by our estimate of the number of days to
complete the contract. Contract costs include labor, materials, supplies, repairs and maintenance, operating overhead allocations and allocations of depreciation and amortization expense. We charge general and administrative expenses to expense as we incur them. Changes in job performance, job conditions and estimated profitability on uncompleted contracts may result in revisions to costs and income. When we encounter, during the course of our drilling operations, conditions unforeseen in the preparation of our original cost estimate, we immediately increase our cost estimate for the additional costs to complete the contract. If we anticipate a loss on a contract in progress at the end of a reporting period due to a change in our cost estimate, we immediately accrue the entire amount of the estimated loss including all costs that are included in our revised estimated cost to complete that contract in our consolidated statement of operations for that reporting period. We had no turnkey or footage contracts in progress as of December 31, 2008.
Production Services—We earn revenues for well services, wireline services and fishing and rental services based on purchase orders, contracts or other persuasive evidence of an arrangement with the customer, such as master service agreements, that include fixed or determinable prices. These production services revenues are recognized when the services have been rendered and collectibility is reasonably assured.
The asset “contract drilling in progress”“unbilled receivables” represents revenues we have recognized in excess of amounts billed on drilling contracts and production services in progress. The asset “prepaid expenses and other current assets” includes deferred mobilization costs for certain drilling contracts. The liability “prepaid drilling contracts” represents deferred mobilization revenues for certain drilling contracts and amounts collected on contracts in excess of revenues recognized.recognized
Prepaid Expenses
Prepaid expenses include items such as insurance, rent deposits and fees. We routinely expense these items in the normal course of business over the periods these expenses benefit.
Property and Equipment
We provide for depreciation of our drilling, transportation and other equipment using the straight-line method over useful lives that we have estimated and that range from three to 15 years. We record the same depreciation expense whether a rig is idle or working.
We charge our expenses for maintenance and repairs to operations. We charge our expenses for renewals and betterments to the appropriate property and equipment accounts. Our gains and losses on the sale of our property and equipment are recorded in drilling costs. During fiscal 2005 and 2004, we capitalized $86,819 and $106,395, respectively, of interest costs incurred during the construction periods of certain drilling equipment. At March 31, 2005 and 2004, costs incurred on rigs under construction were approximately $3,300,000 and $2,800,000, respectively.
We review our long-lived assets and intangible assets for impairment whenever events or circumstances provide evidence that suggests that we may not recover the carrying amounts of any of these assets. In performing the review for recoverability, we estimate the future net cash flows we expect to obtain from the use of each asset and its eventual disposition. If the sum of these estimated future undiscounted net cash flows is less than the carrying amount of the asset, we recognize an impairment loss.
Cash and Cash Equivalents
We maintain cash accounts at several financial institutions. These account balances are insured by the Federal Deposit Insurance Corporation up to $100,000. At March 31, 2005, we had cash account balances of approximately $1,200,000 exceeding the $100,000 insurance threshold.
For purposes of the statements of cash flows, we consider all highly liquid debt instruments purchased with a maturity of three months or less to be cash equivalents. Cash equivalents consist of investments in corporate and government money market accounts. Cash equivalents at MarchDecember 31, 20052008 and 20042007 were $65,046,000$26.8 million and $1,568,000,$76.7 million, respectively.
Restricted Cash
As of December 31, 2008, we had restricted cash in the amount of $3.3 million held in an escrow account to be used for future payments in connection with the acquisition of Prairie Investors d/b/a Competition Wireline (“Competition”). The former owner of Competition will receive annual installments of $0.7 million payable over a five year term from the escrow account. Restricted cash of $0.7 million and $2.6 million is recorded in other current assets and other-long term assets, respectively. The associated obligation of $0.7 million and $2.6 million is recorded in other accrued expenses and other long-term liabilities, respectively.
On August 28, 2008, we deposited $0.9 million into a trust account in accordance with the terms of the severance agreement in connection with the resignation of our former Chief Financial Officer. The trust account balance of $0.9 million plus net earnings will be distributed to our former Chief Financial Officer on March 2, 2009. As of December 31, 2008, this trust account had a balance of $0.9 million and is recorded in other current assets with the associated obligation recorded in accrued expenses.
Marketable Securities
Marketable securities consist of auction rate seven-day preferred securities whose market value is equal to their cost. The objective of investing in these securities is to improve our yield on short-term investments of cash. There were no realized or unrealized gains or losses relating to marketable securities during the years ended March 31, 2005 and 2004.
Trade Accounts Receivable
We record trade accounts receivable at the amount we invoice our customers. These accounts do not bear interest. The allowance for doubtful accounts is our best estimate of the amount of probable credit losses in our accounts receivable as of the balance sheet date. We determine the allowance based on the credit worthiness of our customers and general economic conditions. Consequently, an adverse change in those factors could affect our estimate of our allowance for doubtful accounts. We determine the allowance based on the credit worthiness of our customers and general economic conditions. Consequently, an adverse change in those factors could affect our estimate of our allowance for doubtful accounts. We review our allowance for doubtful accounts monthly.on a
monthly basis. Balances more than 90 days past due are reviewed individually for collectibility. We charge off account balances against the allowance after we have exhausted all reasonable means of collection and determined that the potential for recovery is remote. We do not have any off-balance sheet credit exposure related to our customers. At March 31, 2005 and 2004
The changes in our allowance for doubtful accounts was $352,000 and $110,000.consist of the following (amounts in thousands):
| | | | | | | | | | | |
| | | Year Ended
December 31, 2008 | | | Nine
Months Ended
December 31, 2007 | | | Year Ended
March 31, 2007 |
Balance at beginning of year | | $ | — | | | $ | 1,000 | | | $ | 200 |
Increase in allowance charged to expense | | | 1,591 | | | | 2,612 | | | | 800 |
Accounts charged against the allowance, net of recoveries | | | (17 | ) | | | (3,612 | ) | | | — |
| | | | | | | | | | | |
Balance at end of year | | $ | 1,574 | | | $ | — | | | $ | 1,000 |
| | | | | | | | | | | |
38
IntangiblePrepaid Expenses and Other Current Assets
Prepaid expenses and other current assets include items such as insurance, rent deposits and fees, and restricted cash. We routinely expense these items in the normal course of business over the periods these expenses benefit. Prepaid expenses and other current assets also include deferred mobilization costs for certain drilling contracts that are recognized on a straight line basis over the contract term.
Investments
Other long-term assets include investments in tax exempt, auction rate preferred securities (“ARPS”). Our ARPSs are classified with other long-term assets on our consolidated balance sheet as of December 31, 2008 because of our inability to determine the recovery period of our investments.
At December 31, 2008, we held $15.9 million (par value) of ARPSs, which are variable-rate preferred securities and have a long-term maturity with the interest rate being reset through “Dutch auctions” that are held every 7 days. The ARPSs have historically traded at par because of the frequent interest rate resets and because they are callable at par at the option of the issuer. Interest is paid at the end of each auction period. Our ARPSs are AAA/Aaa rated securities, collateralized by municipal bonds and backed by assets that are equal to or greater than 200% of the liquidation preference. Until February 2008, the auction rate securities market was highly liquid. Beginning mid-February 2008, we experienced several “failed” auctions, meaning that there was not enough demand to sell all of the securities that holders desired to sell at auction. The immediate effect of a failed auction is that such holders cannot sell the securities at auction and the interest rate on the security resets to a maximum auction rate. We have continued to receive interest payments on our ARPSs in accordance with their terms. We may not be able to access the funds we invested in our ARPSs without a loss of principal, unless a future auction is successful or the issuer calls the security pursuant to redemption prior to maturity. We have no reason to believe that any of the underlying municipal securities that collateralize our ARPSs are presently at risk of default. We believe we will ultimately be able to liquidate our investments without material loss primarily due to the collateral securing the ARPSs. We do not currently intend to attempt to sell our ARPSs since our liquidity needs are expected to be met with cash flows from operating activities and our senior secured revolving credit facility.
Our ARPSs are reported at amounts that reflect our estimate of fair value. Statement of Financial Accounting Standards (“SFAS”) No. 157, Fair Value Measurement, provides a hierarchal framework associated with the level of subjectivity used in measuring assets and liabilities at fair value. To estimate the fair values of our ARPSs, we used inputs defined by SFAS 157 as level 3 inputs which are unobservable for the asset or liability and are developed based on the best information available in the circumstances. We estimate the fair value of our ARPSs based on discounted cash flow models and secondary market comparisons of similar securities.
Our ARPSs are designated as available-for-sale and are reported at fair market value with the related unrealized gains or losses, included in accumulated other comprehensive income (loss), net of tax, a component of shareholders’ equity. The estimated fair value of our ARPSs at December 31, 2008 was $13.9 million compared with a par value of $15.9 million. The $2.0 million difference represents a fair value discount due to the current lack of liquidity which is considered temporary and is recorded as an unrealized loss, net of tax, in accumulated other comprehensive income (loss). We would recognize an impairment charge in our statement of operations if the fair value of our investments falls below the cost basis and is judged to be other-than- temporary.
Inventories
Inventories primarily consist of drilling rig replacement parts and supplies held for use by our Drilling Services Division’s operations and supplies held for use by our Production Services Division’s operations. Inventories are valued at the lower of cost (first in, first out or actual) or market value.
Property and Equipment
Property and equipment are carried at cost less accumulated depreciation. Depreciation is provided for our assets over the estimated useful lives of the assets using the straight-line method. We record the same depreciation expense whether a rig is idle or working. We charge our expenses for maintenance and repairs to operating costs. We charge our expenses for renewals and betterments to the appropriate property and equipment accounts.
We recorded gains (losses) on disposition of our property and equipment in contract drilling costs of $0.8 million, ($2.8) million and ($5.8) million for the year ended December 31, 2008, the nine months ended December 31, 2007 and the year ended March 31, 2007, respectively. During the year ended December 31, 2008, we capitalized $0.3 million of interest costs incurred during the construction periods of certain drilling equipment. We did not capitalize any interest costs during the nine months ended December 31, 2007 or during the year ended March 31, 2007. We incurred $10.2 million of costs on one drilling rig that was under construction at December 31, 2008. We had no rigs under construction at December 31, 2007, and we incurred approximately $8.6 million of costs for rigs under construction at March 31, 2007.
We evaluate for potential impairment of long-lived assets and intangible assets subject to amortization when indicators of impairment are present, as defined in SFAS No. 144,Accounting for the Impairment or Disposal of Long-Lived Assets. Circumstances that could indicate a potential impairment include significant adverse changes in industry trends, economic climate, legal factors, and an adverse action or assessment by a regulator. More specifically, significant adverse changes in industry trends include significant declines in revenue rates, utilization rates, oil and natural gas market prices and industry rig counts for drilling rigs and workover rigs. In performing an impairment evaluation, we estimate the future undiscounted net cash flows from the use and eventual disposition of long-lived assets and intangible assets grouped at the lowest level that cash flows can be identified. For our Production Services Division, our long-lived assets and intangible assets are grouped at the reporting unit level which is one level below the operating segment level. For our Drilling Services Division, we perform an impairment evaluation and estimate future undiscounted cash flows for individual drilling rig assets. If the sum of the estimated future undiscounted net cash flows is less than the carrying amount of the long-lived assets and intangible assets for these asset grouping levels, then we would recognize an impairment charge. The amount of an impairment charge would be measured as the difference between the carrying amount and the fair value of these assets. As described in theIntangible Asset section of Note 1, our long-lived asset and intangible asset impairment analysis for the reporting units in our Production Services Division resulted in no impairment charge to property and equipment and a non-cash impairment charge of $52.8 million to the carrying value of our intangible assets for customers relationships for the year ended December 31, 2008. This impairment charge is not expected to have an impact on our liquidity or debt covenants; however, it is a reflection of the overall downturn in our industry and decline in our projected cash flows. For our Drilling Services Division, we have not
recorded an impairment charge on any long-lived assets for the year ended December 31, 2008. The assumptions used in the impairment evaluation for long-lived assets and intangible assets are inherently uncertain and require management judgment.
Effective January 1, 2008, management reassessed the estimated useful lives assigned to a group of 19 drilling rigs that were recently constructed. These drilling rigs were constructed with new components that have longer estimated useful lives when compared to other drilling rigs that are equipped with older components. As a result, we increased the estimated useful lives for this group of recently constructed drilling rigs from an average useful life of 9 years to 12 years. The following table provides the impact of this change in depreciation and amortization expense for the year ended December 31, 2008 (amounts in thousands):
| | | | |
| | | Year Ended
December 31, 2008 | |
Depreciation and amortization expense using prior useful lives | | $ | 91,921 | |
Impact of change in estimated useful lives | | | (3,776 | ) |
| | | | |
Depreciation and amortization expense, as reported | | $ | 88,145 | |
| | | | |
Diluted (loss) earnings per common share using prior useful lives | | $ | (1.31 | ) |
Impact of change in estimated useful lives | | | 0.05 | |
| | | | |
Diluted (loss) earnings per common share, as reported | | $ | (1.26 | ) |
| | | | |
IntangibleAs of December 31, 2008, the estimated useful lives of our asset classes are as follows:
| | |
| | Lives |
Drilling rigs and equipment | | 3 - 25 |
Workover rigs and equipment | | 5 -20 |
Wireline units and equipment | | 2 - 10 |
Fishing and rental tools equipment | | 7 |
Vehicles | | 3 - 10 |
Office equipment | | 3 - 5 |
Buildings and improvements | | 3 - 40 |
Goodwill
Goodwill results from business acquisitions and represents the excess of acquisition costs over the fair value of the net assets acquired. We account for goodwill and other intangible assets under the provisions of SFAS No. 142,Goodwill and Other Intangible Assets. Goodwill is tested for impairment annually as of December 31 or more frequently if events or changes in circumstances indicate that the asset might be impaired. Circumstances that could indicate a potential impairment include a significant adverse change in the economic or business climate, a significant adverse change in legal factors, an adverse action or assessment by a regulator, unanticipated competition, loss of key personnel and the likelihood that a reporting unit or significant portion of a reporting unit will be sold or otherwise disposed of. These circumstances could lead to our net book value exceeding our market capitalization which is another indicator of a potential impairment in goodwill. SFAS No. 142 requires a two-step process for testing impairment. First, the fair value of each reporting unit is compared to its carrying value to determine whether an indication of impairment exists. All our goodwill is related to our Production Services Division operating segment and is allocated to its three reporting units which are well services, wireline services and fishing and rental services. Second, if impairment is indicated, then the fair value of the reporting unit’s goodwill is determined by allocating the unit’s fair value to its assets and liabilities (including any unrecognized intangible assets) as if the reporting unit had been acquired in a business combination on the impairment test date. The amount of impairment for goodwill is measured as the excess of the carrying value of the reporting unit over its fair value.
When estimating fair values of a reporting unit for our goodwill impairment test, we use a combination of an income approach and a market approach which incorporates both management’s views and those of the market. The income approach provides an estimated fair value based on each reporting unit’s anticipated cash flows that are discounted using a weighted average cost of capital rate. The market approach provides an estimated fair value based on our market capitalization that is computed using the prior 30-day average market price of our common stock and the number of shares outstanding as of the impairment test date. The estimated fair values computed using the income approach and the market approach are then equally weighted and combined into a single fair value. The primary assumptions used in the income approach are estimated cash flows and weighted average cost of capital. Estimated cash flows are primarily based on projected revenues, operating costs and capital expenditures and are discounted based on comparable industry average rates for weighted average cost of capital. We utilized discount rates based on weighted average cost of capital ranging from 15.8% to 16.7% when we estimated fair values of our reporting units as of December 31, 2008. The primary assumptions used in the market approach is the allocation of total market capitalization to each reporting unit, which is based on projected EBITDA percentages for each reporting unit, and control premiums, which are based on comparable industry averages. We utilized a 30% control premium when we estimated fair values of our reporting units as of December 31, 2008. To ensure the reasonableness of the estimated fair values of our reporting units, we perform a reconciliation of our total market capitalization to the total estimated fair value of all our reporting units. The assumptions used in estimating fair values of reporting units and performing the goodwill impairment test are inherently uncertain and require management judgment.
Our common stock price per share declined in market value from $13.30 at September 30, 2008, to $5.57 at December 31, 2008, which resulted in our net book value exceeding our market capitalization during most of this time period. We believe the decline in the market price of our common stock resulted from a significant adverse change in the economic and business climate as financial markets reacted to the credit crisis facing major lending institutions and worsening conditions in the overall economy during the fourth quarter of the year ended December 31, 2008. During the same time, there were significant declines in oil and natural gas prices which lead to declines in production service revenues, margins and cash flows. We considered the impact of these significant adverse changes in the economic and business climate as we performed our annual impairment assessment of goodwill as of December 31, 2008. The estimated fair values of our reporting units were negatively impacted by significant reductions in estimated cash flows for the income approach component and a significant reduction in our market capitalization for the market approach component of our fair value estimation process. Our goodwill was initially recorded in connection with the acquisitions of the production services businesses from WEDGE, Competition, Pettus and Paltec, all of which occurred between March 1, 2008 and October 1, 2008, when production service revenues, margins and cash flows and our market capitalization were at historically high levels.
Our goodwill impairment analysis lead us to conclude that there would be no remaining implied fair value attributable to our goodwill and accordingly, we recorded a non-cash charge of $118.6 million to our operating results for the year ended December 31, 2008, for the full impairment of our goodwill. Our goodwill impairment analysis would have lead to the same full impairment conclusion if we increased or decreased our discount rates or control premiums by 10% when estimating the fair values of our reporting units. This impairment charge is not expected to have an impact on our liquidity or debt covenants; however, it is a reflection of the overall downturn in our industry and decline in our projected cash flows.
Changes in the carrying amount of goodwill by operating segment are as follows (amounts in thousands):
| | | | | | | | | | | |
| | | Drilling
Services
Division | | Production
Services
Division | | | Total | |
Goodwill balance at January 1, 2008 | | $ | — | | $ | — | | | $ | — | |
Goodwill relating to acquisitions | | | — | | | 118,646 | | | | 118,646 | |
Impairment | | | — | | | (118,646 | ) | | | (118,646 | ) |
| | | | | | | | | | | |
Goodwill balance at December 31, 2008 | | $ | — | | $ | — | | | $ | — | |
| | | | | | | | | | | |
Intangible Assets
All our intangible assets are subject to amortization and consist of customers relationships, non-compete agreements and trade names. Essentially all of our intangible assets were recorded in connection with the acquisitions of the production services businesses from WEDGE, Competition, Pettus and Paltec, all of which occurred between March 1, 2008 and October 1, 2008 as described in Note 2. Intangible assets consist of the following components (amounts in thousands):
| | | | | | | | |
| | | December 31,
2008 | | | December 31,
2007 | |
Cost: | | | | | | | | |
Customer Relationships | | $ | 87,316 | | | $ | — | |
Non-compete | | | 2,304 | | | | 150 | |
Trade marks | | | 1,600 | | | | — | |
Accumulated amortization: | | | | | | | | |
Customer Relationships | | | (6,069 | ) | | | — | |
Non-compete | | | (791 | ) | | | (93 | ) |
Trade marks | | | (1,600 | ) | | | — | |
Impairment: | | | | | | | | |
Customer Relationships | | | (52,847 | ) | | | — | |
| | | | | | | | |
| | $ | 29,913 | | | $ | 57 | |
| | | | | | | | |
We evaluate for potential impairment of long-lived assets and intangible assets subject to amortization when indicators of impairment are present, as defined in SFAS No. 144,Accounting for the Impairment or Disposal of Long-Lived Assets. Circumstances that could indicate a potential impairment include significant adverse changes in industry trends, economic climate, legal factors, and an adverse action or assessment by a regulator. More specifically, significant adverse changes in industry trends include significant declines in revenue rates, utilization rates, oil and natural gas market prices and industry rig counts for drilling rigs and workover rigs. In performing the impairment evaluation, we estimate the future undiscounted net cash flows relating to long-lived assets and intangible assets grouped at the lowest level that cash flows can be identified. Our long-lived assets and intangible assets for our Production Services Division are grouped one level below the operating segment in the three reporting units which are well services, wireline services and fishing and rental services. If the sum of the estimated future undiscounted net cash flows is less than the carrying amount of the long-lived assets and intangible assets in each reporting unit, then we would recognize an impairment charge. The amount of an impairment charge would be measured as the difference between the carrying amount and the fair value of these assets. The assumptions used in the impairment evaluation for long-lived assets and intangible assets are inherently uncertain and require management judgment.
We performed an impairment analysis of our long-lived assets and intangible assets at December 31, 2008, due to significant adverse changes in the economic and business climate that resulted in decreases in estimated revenues, margins and cash flows. Essentially all our intangible assets were recorded in connection with the acquisitions of the production services businesses from WEDGE, Competition, Pettus and Paltec when revenues, margins and cash flows were at historically high levels earlier in 2008. We determined that the sum of the estimated future undiscounted net cash flows is less than the carrying amount of the long-lived assets and intangible assets in each reporting unit at December 31, 2008. Our impairment analysis resulted in a reduction to our intangible asset carrying value of customers relationships and a non-cash impairment charge of $52.8 million recorded to our operating results for the year ended December 31, 2008.
Amortization expense for our customer relationships are calculated using the straight-line method over their respective estimated economic useful lives which range from four to nine years. Amortization expense for our non-compete agreements are calculated using the straight-line method over the period of the agreements which range from one to five years. Amortization expense was $8.4 million for the year ended December 31, 2008, $34,000 for the nine month period ended December 31, 2007 and $47,000 for the year ended March 31, 2007.
Amortization expense is estimated to be approximately $4.5 million, $4.3 million, $3.8 million, $3.7 million and $3.7 million for the years ending December 31, 2009, 2010, 2011, 2012 and 2013, respectively. These future amortization amounts are estimates and reflect the impact of the $52.8 million impairment charge to intangible assets. Actual amortization amounts may be different due to future acquisitions, impairments, changes in amortization periods, or other factors.
Other Long-Term Assets
Other long-term assets consist of our investment in ARPSs, restricted cash held in an escrow account, cash deposits related to the deductibles on our workersworkers’ compensation insurance policies and loan fees, net of amortization and intangibles related to acquisitions, net of amortization. Loan fees are being amortized over the three-yearfive-year term of the related debt. Customer lists are amortized oversenior secured revolver credit facility described in Note 3.
Income Taxes
Pursuant to Statement of Financial Accounting Standards (“SFAS”) No. 109, “Accounting for Income Taxes,” we follow the asset and liability method of accounting for income taxes, under which we recognize deferred tax assets and liabilities for the future tax consequences attributable to differences between the financial statement carrying amounts of existing assets and liabilities and their estimated benefit periodsrespective tax basis. We measure our deferred tax assets and liabilities by using the enacted tax rates we expect to apply to taxable income in the years in which we expect to recover or settle those temporary differences. Under SFAS No. 109, we reflect in income the effect of up to 18 months. Intangibles related to non-compete agreements are amortized overa change in tax rates on deferred tax assets and liabilities in the period during which the change occurs.
Comprehensive (Loss) Income
Comprehensive (loss) income is comprised of net (loss) income and other comprehensive loss. Other comprehensive loss includes the non-compete agreementschange in the fair value of three to five years. Depreciation and amortization expense includes amortizationour ARPSs, net of intangibles of $142,157, $39,341 and $82,141 duringtax, for the yearsyear ended December 31, 2008. We had no other comprehensive income (loss) for the year ended December 31, 2008, the nine months ended December 31, 2007 or the year ended March 31, 2005, 2004 and 2003 respectively. Amortization2007. The following table sets forth the components of intangibles is not expected to exceed $150,000 per year over the next five years. Total cost and accumulated amortization of intangibles at March 31, 2005 was $480,284 and $59,831, respectively, and $162,500 and $43,222, respectively at March 31, 2004.comprehensive (loss) income:
| | | | | | | | | | |
| | | Year Ended
December 31,
2008 | | | Nine Months
Ended
December 31,
2007 | | Year Ended
March 31,
2007 |
| | | (amounts in thousands) |
Net (loss) income | | $ | (62,745 | ) | | $ | 39,645 | | $ | 84,180 |
Other comprehensive loss—unrealized loss on securities | | | (1,245 | ) | | | — | | | — |
| | | | | | | | | | |
Comprehensive (loss) income | | $ | (63,990 | ) | | $ | 39,645 | | $ | 84,180 |
| | | | | | | | | | |
Derivative Instruments and Hedging ActivitiesEarnings Per Common Share
We do not have any free standing derivative instrumentscompute and we do not engagepresent earnings per common share in hedging activities.
Related Party Transactions
On August 11, 2004accordance with SFAS No. 128, “Earnings per Share.” This standard requires dual presentation of basic and August 31, 2004, Chesapeake Energy Corporation (“Chesapeake”) purchased 631,133 shares and 94,670 sharesdiluted earnings per share on the face of our common stock, respectively, at $6.90 per share pursuant to the preemptive rightsstatement of operations.
Stock-based Compensation
Effective April 1, 2006, we granted to Chesapeake in the stock purchase agreement we entered into in March 2003 when we sold shares of common stock to Chesapeake in a private placement transaction. On March 29, 2005, we sold Chesapeake an additional 1,165,769 shares pursuant to the preemptive rights agreement. At March 31, 2005, Chesapeake owned 16.78% of our outstanding common stock, and its preemptive rights have expired. During the years ended March 31, 2005 and 2004, we recognized revenues of approximately $4,885,000 and $924,000, respectively, and recorded contract drilling costs of approximately $3,263,000 and $745,000, respectively, excluding depreciation, on contracts with Chesapeake. Our accounts receivable at March 31, 2005 and 2004 include $2,939,000 and $532,000, respectively, due from Chesapeake.
We purchased services from R&B Answering Service and Frontier Service, Inc. during 2005, 2004 and 2003. These companies are more than 5% owned by our Chief Operating Officer and an immediate family member of our Vice President, South Texas Division, respectively. The following summarizes the transactions with these companies in each period.
| | 2005 | | 2004 | | 2003 | |
R&B Answering Service | | | | | | | |
Purchases | | $ | 18,218 | | $ | 13,526 | | $ | 10,465 | |
Payments | | $ | 17,112 | | $ | 12,544 | | $ | 9,678 | |
Frontier Services, Inc. | | | | | | | |
Purchases | | $ | 81,254 | | $ | 118,660 | | $ | 130,513 | |
Payments | | $ | 93,709 | | $ | 136,818 | | $ | 107,719 | |
| | | | | | | | | | | | | |
Recently Issued Accounting Standards
In December 2004, the FASB issuedadopted SFAS No. 123 (revised 2004)(Revised),Share-Based Payment.Payment(“SFAS No.123R”),utilizing the modified prospective approach. Prior to the adoption of SFAS 123R, is a revision of FASB SFAS No. 123, we accounted for stock option grants in accordance with the intrinsic-value-based method prescribed by Accounting for Stock-Based Compensation and supersedes APBPrinciples Board Opinion No. 25,Accounting for Stock Issued to Employees(“APB 25”),and its related implementation guidance.interpretations, as permitted by SFAS No. 123R established standards123,Accounting for Stock-Based Compensation(“SFAS 123”). Accordingly, we recognized no
compensation expense for stock options granted, as all stock options were granted at an exercise price equal to the accounting for transactions in which an entity exchanges its equity instruments for goods or services. It also addresses transactions in which an entity incurs liabilities in exchange for goods or services that are based on the fairclosing market value of the entity’s equity instruments or that may be settled byunderlying common stock on the issuancedate of those equity instruments. SFAS No. 123R focuses primarily on accountinggrant. Under the modified prospective approach, compensation cost for transactions in which an entity obtains employee services in share-based payment transactions. SFAS No. 123R requires a public entitythe fiscal year ended December 31, 2008 includes compensation cost for all stock options granted prior to, measure the costbut not yet vested as of, employee services received in exchange for an award of equity instrumentsApril 1, 2006, based on the grant-date fair value estimated in accordance with SFAS 123, and compensation cost for all stock options granted subsequent to April 1, 2006, based on the grant-date fair value estimated in accordance with SFAS 123R. We use the graded vesting method for recognizing compensation costs for stock options.
Compensation costs of approximately $3.1 million and $0.9 million for stock options were recognized in selling, general and administrative expense and operating costs, respectively, for the year ended December 31, 2008, of which $0.1 million relate to stock options granted to outside directors. Compensation costs of approximately $2.5 million and $0.7 million for stock options were recognized in selling, general and administrative and operating costs, respectively, for the nine months ended December 31, 2007. Approximately $0.4 million of the award (with limited exceptions). That cost will becompensation costs included in selling, general and administrative expense relate to stock options granted to outside directors that vested immediately upon grant pursuant to our stock option plans. Compensation costs of approximately $2.5 million and $0.5 million for stock options were recognized in selling, general and administrative expense and operating costs, respectively, for the fiscal year ended March 31, 2007. Approximately $0.3 million of the compensation costs included in selling, general and administrative expense relate to stock options granted to outside directors that vested immediately upon grant pursuant to our stock option plans.
We receive a tax deduction for certain stock option exercises during the period the options are exercised, generally for the excess of the market price of our common stock on the exercise date over the periodexercise price of the stock options. In accordance with SFAS 123R, we reported all excess tax benefits resulting from the exercise of stock options as financing cash flows in our consolidated statement of cash flows. There were 170,054 stock options exercised during which an employeethe year ended December 31, 2008 and 22,500 stock options exercised during the nine months ended December 31, 2007.
Restricted stock awards consist of our common stock that vest over a 3 year period. The fair value of restricted stock is requiredbased on the closing price of our common stock on the date of the grant. We amortize the fair value of the restricted stock awards to provide servicecompensation expense using the graded vesting method. For the year ended December 31, 2008, 178,261 restricted stock awards were granted with a weighted-average grant date price of $17.07. Compensation costs of approximately $0.5 million and $0.1 for restricted stock awards were recognized in exchangeselling, general and administrative expense and operating costs, respectively, for the award. The provisionsyear ended December 31, 2008.
Related-Party Transactions
Our Chief Executive Officer, President of Drilling Services Division, Senior Vice President of Drilling Services Division—Marketing, and a Vice President of Drilling Services Division—Operations occasionally acquire at fair value a 1% to 5% minority working interest in oil and natural gas wells that we drill for one of our customers. Our President of Drilling Services Division acquired a minority working interest in two wells that we drilled for this customer during the year ended December 31, 2008. These individuals acquired minority working interests in four and three wells that we drilled for this customer during the nine months ended December 31, 2007 and the year ended March 31, 2007, respectively. We recognized drilling services revenues of $2.0 million, $1.6 million and $1.9 million on these wells during the year ended December 31, 2008, the nine months ended December 31, 2007 and the year ended March 31, 2007, respectively.
In connection with the acquisitions of the production services businesses from WEDGE Group Incorporated (“WEDGE”) and Competition on March 1, 2008, we have leases for various operating and office facilities with entities that are owned by former WEDGE employees and Competition employees that are now employees of our company. Rent expense for the year ended December 31, 2008 was approximately $479,000 for these related party leases. In addition, we have non-compete agreements with several former WEDGE employees that are now
employees of our company. These non-compete agreements are recorded as intangible assets with a cost, net of accumulated amortization, of $1.4 million at December 31, 2008. See note 2 for further information regarding the acquisitions.
We purchased goods and services during the year ended December 31, 2008 from eight vendors that are owned by employees of our company. For the year ended December 31, 2008, we purchased $330,000 of well servicing equipment from one of these related party vendors and purchases from the remaining seven related party vendors were $232,000.
Recently Issued Accounting Standards
In September 2006, the FASB issued SFAS No. 123R are157,Fair Value Measurements. SFAS No. 157 defines fair value, establishes a framework for measuring fair value and expands disclosure of fair value measurements. SFAS No. 157 applies under other accounting pronouncements that require or permit fair value measurements and, accordingly, does not require any new fair value measurements. SFAS No. 157, as issued, was effective for public entities that do not file as small business issuers asfinancial statement issued for fiscal years beginning after November 15, 2007, and interim periods within those fiscal years. However, on February 12, 2008, the FASB issued FSP FAS No. 157-2,Effective Dates of the beginning of the first annual reporting period that begins after June 15, 2005. We are currently evaluating the negative impact SFASFASB Statement No. 123R will have on our financial position and results of operations in fiscal year 2007. The negative impact will be created due to the fact that we previously issued employee stock options for 157,which no expense has been recognized, as those options will not be fully vested as ofdelays the effective date of SFAS No. 123R.157 for fiscal years beginning after November 15, 2008 for all nonfinancial assets and nonfinancial liabilities, except those that are recognized or disclosed at fair value in the financial statements on a recurring basis. The adoption of SFAS No. 157 did not have a material impact on our financial position or results of operations.
In February 2007, the FASB issued SFAS No. 159,The Fair Value Option for Financial Assets and Financial Liabilities—Including an amendment of FASB Statement No. 115. This statement permits entities to choose to measure many financial instruments and certain other items at fair value that are not currently required to be measured at fair value and establishes presentation and disclosure requirements designed to facilitate comparisons between entities that choose different measurement attributes for similar types of assets and liabilities. SFAS No. 159 is effective for fiscal years beginning after November 15, 2007. The adoption of SFAS No. 159 did not have a material impact on our financial position or results of operations.
In December 2007, the FASB issued SFAS No. 160,ReclassificationsNoncontrolling interests in Consolidated Financial Statements—an Amendment of ARB No. 51. This statement establishes accounting and reporting standards for the non-controlling interest in a subsidiary and for the deconsolidation of a subsidiary. SFAS No. 160 clarifies that a non-controlling interest in a subsidiary, which is sometimes referred to as minority interest, is an ownership interest in the consolidated entity that should be reported as a component of equity in the consolidated financial statements. Among other requirements, SFAS No. 160 requires consolidated net income to be reported at amounts that include the amounts attributable to both the parent and the non-controlling interest. It also requires disclosure, on the face of the consolidated income statement, of the amounts of consolidated net income attributable to the parent and to the non-controlling interest. SFAS No.160 is effective for fiscal years beginning on or after December 15, 2008. We do not expect the adoption to have a material impact on our financial position or results of operations.
In December 2007, the FASB issued SFAS No. 141R (revised 2007) which replaces SFAS No. 141,Business Combinations(“SFAS No. 141R”). SFAS No. 141R applies to all transactions and other events in which one entity obtains control over one or more other businesses. SFAS No. 141R requires an acquirer, upon initially obtaining control of another entity, to recognize the assets, liabilities and any non-controlling interest in the acquiree at fair value as of the acquisition date. Contingent consideration is required to be recognized and measured at fair value on the date of acquisition rather than at a later date when the amount of that consideration may be determinable beyond a reasonable doubt. This fair value approach replaces the cost-allocation process required under SFAS No. 141 whereby the cost of an acquisition was allocated to the individual assets acquired and liabilities assumed based on their estimated fair value. SFAS No. 141R requires acquirers to expense acquisition-related costs as incurred rather than allocating such costs to the assets acquired and liabilities
assumed, as was previously the case under SFAS No. 141. Under SFAS No.141R, the requirements of SFAS No. 146,Accounting for Costs Associated with Exit or Disposal Activities, would have to be met in order to accrue for a restructuring plan in purchase accounting. Pre-acquisition contingencies are to be recognized at fair value, unless it is a non-contractual contingency that is not likely to materialize, in which case, nothing should be recognized in purchase accounting and, instead, that contingency would be subject to the recognition criteria of SFAS No. 5,Accounting for Contingencies. SFAS No.141R is expected to have a significant impact on our accounting for business combinations closing on or after January 1, 2009.
In March 2008, the FASB issued SFAS No. 161, Disclosures about Derivative Instruments and Hedging Activities—an amendment of FASB Statement No. 133(“SFAS No. 161”). SFAS No. 161 changes the disclosure requirements for derivative instruments and hedging activities. Entities are required to provide enhanced disclosures about (a) how and why an entity uses derivative instruments, (b) how derivative instruments and related hedged items are accounted for under Statement 133 and its related interpretations, and (c) how derivative instruments and related hedged items affect an entity’s financial position, financial performance, and cash flows. The guidance in SFAS No. 161 is effective for financial statements issued for fiscal years and interim periods beginning after November 15, 2008, with early application encouraged. This Statement encourages, but does not require, comparative disclosures for earlier periods at initial adoption. We do not have any derivative instruments and expect the adoption of SFAS No. 161 to have no impact on our financial position or results of operations.
In April 2008, the FASB issued FSP SFAS 142-3,Determination of the Useful Life of Intangible Assets. This guidance is intended to improve the consistency between the useful life of a recognized intangible asset under SFAS 142, Goodwill and Other Intangible Assets, and the period of expected cash flows used to measure the fair value of the asset under SFAS 141R when the underlying arrangement includes renewal or extension of terms that would require substantial costs or result in a material modification to the asset upon renewal or extension. Companies estimating the useful life of a recognized intangible asset must now consider their historical experience in renewing or extending similar arrangements or, in the absence of historical experience, must consider assumptions that market participants would use about renewal or extension as adjusted for SFAS No. 142’s entity-specific factors. FSP 142-3 is effective for periods beginning on or after January 1, 2009. We do not expect the adoption to have a material impact on our financial position or results of operations.
In May 2008, the FASB issued SFAS No. 162,The Hierarchy of Generally Accepted Accounting Principles (“SFAS No. 162”). SFAS No. 162 identifies the sources of accounting principles and the framework for selecting the principles used in the preparation of financial statements that are presented in conformity with generally accepted accounting principles. SFAS No. 162 is effective 60 days following approval by the Securities and Exchange Commission of the Public Company Accounting Oversight Board’s amendments to AU Section 411,The Meaning of Present Fairly in Conformity with Generally Accepted Accounting Principles. The adoption of SFAS No. 162 did not have a material impact on our financial position or results of operations.
In June 2008, the FASB issued FSP No. EITF 03-6-1,Determining Whether Instruments Granted in Share-Based Payment Transactions are Participating Securities. This FSP provides that unvested share-based payment awards that contain nonforfeitable rights to dividends are participating securities and shall be included in the computation of earnings per share pursuant to the two class method. This FSP is effective for financial statements issued for fiscal years beginning after December 15, 2008 and interim periods within those years. We do not expect the adoption of this FSP to have a material impact on our financial position or results of operations.
Reclassifications
Certain amounts in the financial statements for the prior years have been reclassified to conform to the current year’s presentation.
39
On November 30, 2004,March 1, 2008, we acquired all the contract drillingproduction services business from WEDGE which provided well services, wireline services and fishing and rental services with a fleet of 62 workover rigs, 45 wireline units and approximately $13 million of fishing and rental equipment through its facilities in Texas, Kansas, North Dakota, Colorado, Utah and Oklahoma. The aggregate purchase price for the acquisition was approximately $314.7 million, which consisted of assets acquired of $340.8 million and a 4.7-acre rig storage and maintenance yardliabilities assumed of Wolverine Drilling, Inc., a land drilling contractor based in Kenmare, North Dakota.$26.1 million. The equipment included seven mechanical land drilling rigs and related assets, including trucks, trailers, vehicles, spare drill pipe and yard equipment.aggregate purchase price includes $3.4 million of costs incurred to acquire the production services business from WEDGE. We paid $28,000,000 in cash for these assets and non-competition agreements withfinanced the two owners of Wolverine. We funded this acquisition with $28,000,000approximately $3.2 million of bankcash on hand and $311.5 million of debt incurred under our senior secured revolving credit facility described in noteNote 3. This purchase was accounted for as an acquisition of a business, and we have included the results of operation of the acquired business in our statement of operations since the date of acquisition. We allocated the purchase price to property and equipment and related assets, including the non-competition agreements and other intangibles, based on their relative fair values at the date of acquisition.
On December 15, 2004, we acquired all the contract drilling assets and a 17-acre rig storage and maintenance yard of Allen Drilling Company, a land drilling contractor based in Woodward, Oklahoma. The equipment included five mechanical drilling rigs and related assets, including trucks, trailers, vehicles, spare drill pipe and yard equipment. We paid $7, 200,000 in cash for these assets. We also entered into a non-competition agreement with the President of Allen Drilling which provides for the payment of $500,000 due in annual installments of $100,000 each beginning December 15, 2005. We funded this acquisition with $7,200,000 of bank debt described in note 3. This purchase was accounted for as an acquisition of a business, and we have included the results of operations of the acquired business in our statement of operations since the date of acquisition. We allocated the purchase price to property and equipment and related assets, including the non-competition agreements and other intangibles, based on their relative fair values at the date of acquisition.
The following table summarizes the allocation of the purchase price and related acquisition costs to property and equipment and otherthe estimated fair value of the assets acquired and liabilities assumed as of the date of acquisition (amounts in the Wolverine and Allen Drilling acquisitions:thousands):
| | Wolverine | | Allen | | Total | |
Assets acquired: | | | | | | | |
Drilling equipment | | $ | 27,620,214 | | $ | 7,057,500 | | $ | 34,677,714 | |
Vehicles | | 214,786 | | 230,000 | | 444,786 | |
Buildings | | 30,000 | | 260,000 | | 290,000 | |
Land | | 20,000 | | 40,000 | | 60,000 | |
Intangibles, primarily non-compete agreements | | 115,000 | | 112,500 | | 227,500 | |
| | $ | 28,000,000 | | $ | 7,700,000 | | $ | 35,700,000 | |
Less non-compete obilgation | | — | | (500,000 | ) | (500,000 | ) |
| | $ | 28,000,000 | | $ | 7,200,000 | | $ | 35,200,000 | |
| | | |
Cash acquired | | $ | 1,168 |
Other current assets | | | 22,102 |
Property and equipment | | | 138,493 |
Intangibles and other assets | | | 66,118 |
Goodwill | | | 112,869 |
| | | |
Total assets acquired | | $ | 340,750 |
| | | |
Current liabilities | | $ | 10,655 |
Long-term debt | | | 1,462 |
Other long term liabilities | | | 13,949 |
| | | |
Total liabilities assumed | | $ | 26,066 |
| | | |
Net assets acquired | | $ | 314,684 |
| | | |
The following unaudited pro forma consolidated summary financial information gives effect toof the Wolverine and Allen Drilling acquisitionsacquisition of the production services business from WEDGE as though they wereit was effective as of the beginning of each of the fiscal year for each period presented.years ended December 31, 2008 and 2007. Pro forma adjustments primarily relate to additional depreciation, amortization and interest costs. The pro forma information reflects our company’s historical data and historical data from thesethe acquired businessesproduction services business from WEDGE for the periods indicated. The pro forma data may not be indicative of the results we would have achieved had we completed these acquisitionsthe acquisition on AprilJanuary 1, 20032007 or 2004,2008, or thatwhat we may achieve in the future. The pro forma financial informationfuture and should be read in conjunction with the accompanying historical financial statements.
| | | | | Pro Forma |
| | Pro Forma
Years Ended March 31, | | | Years Ended
December 31,
2008 | | Nine Months
Ended
December 31,
2007 |
| | 2005 | | 2004 | | | (in thousands) |
Total revenues | | $ | 208,394,551 | | $ | 132,287,140 | | | $ | 634,535 | | | $ | 401,461 |
Net earnings (loss) | | $ | 11,943,137 | | $ | (2,100,116 | ) | |
Earnings (loss) per common share: | | | | | | |
Net (loss) earnings | | | $ | (62,514 | ) | | $ | 44,504 |
(Loss) earnings per common share | | | | | |
Basic | | $ | 0.35 | | $ | (0.09 | ) | | $ | (1.26 | ) | | $ | 0.90 |
Diluted | | $ | 0.33 | | $ | (0.09 | ) | | $ | (1.26 | ) | | $ | 0.89 |
On March 1, 2008, immediately following the acquisition of the production services business from WEDGE, we acquired the production services business from Competition which provided wireline services with a fleet of 6 wireline units through its facilities in Montana. The aggregate purchase price for the Competition acquisition was approximately $30.0 million, which consisted of assets acquired of $30.1 million and liabilities
assumed of $0.1 million. The aggregate purchase price includes $0.4 million of costs incurred to acquire the production services business from Competition. We financed the acquisition with $26.7 million cash on hand and a note payable due to the prior owner for $3.3 million. Goodwill of $5.3 million and intangible assets and other assets of $18.0 million were recorded in connection with the acquisition.
On May 28, 2002,August 29, 2008, we acquired all the land contract drillingwireline services business from Paltec, Inc. The aggregate purchase price was $7.8 million which we financed with $6.5 million in cash and a sellers note of $1.3 million. Intangible and other assets of United Drilling Company$4.3 million and U-D Holdings, L.P.goodwill of $0.1 million were recorded in connection with the acquisition.
On October 1, 2008, we acquired the well services business from Pettus Well Service. The assets included two land drilling rigs, associated spare parts and equipment and vehicles. We paid $7,000,000aggregated purchase price was $3.0 million which we financed with $2.8 million in cash for these assets. and a sellers note of $0.2 million. Intangible and other assets of $1.2 million and goodwill of $0.1 million were recorded in connection with the acquisition.
The purchase wasacquisitions of the production services businesses from WEDGE, Competition, Paltec and Pettus were accounted for as an acquisitionacquisitions of assets,businesses. The purchase price allocations for these production services businesses have been finalized as of December 31, 2008. Goodwill was recognized as part of the WEDGE, Competition, Paltec and Pettus acquisitions since the purchase price was allocatedexceeded the estimated fair value of the assets acquired and liabilities assumed. We believe that the goodwill is related to drilling equipmentthe acquired workforces, future synergies between our existing Drilling Services Division and our new Production Services Division and the ability to expand our service offerings. These acquisitions occurred between March 1, 2008 and October 1, 2008, when production service revenues, margins and cash flows and our market capitalization were at historically high levels. As described in note 1, our goodwill impairment analysis performed at December 31, 2008 led us to conclude that there would be no remaining implied value attributable to our goodwill and accordingly, we recorded a non-cash charge of $118.6 million for a full impairment of goodwill relating to these acquisitions. We also performed an impairment analysis which resulted in an impairment charge of $52.8 million and reduction in the intangible asset carrying value of customer relationships relating to these acquisitions. These impairment charges were primarily related assets based on their relative fair values atto significant adverse changes in the dateeconomic and business climate that occurred during the fourth quarter of acquisition.the year ended December 31, 2008.
| 3. | On August 1, 2003, we purchased two land drilling rigs, associated spare parts and equipment and vehicles from Texas Interstate Drilling Company, L. P. for $2,500,000 in cash and the issuance of 477,000 shares of our common stock at $4.45 per share. The purchase was accounted for as an acquisition of a business, and we have included the results of operations of these assets in our statement of operations since the date of acquisition. We allocated the purchase price to drilling equipment and related assets, including intangibles, based on their relative fair values at the date of acquisition.
40
On December 15, 2003, we acquired for approximately $3,770,000 a rig we had previously been leasing from International Drilling Services, Inc. This purchase was accounted for as an acquisition of assets.
On March 2, 2004, we acquired 23 used rig hauling trucks and associated trailers and equipment from A & R Trejo Trucking for $1,200,000. This purchase was accounted for as an acquisition of assets, and the purchase price was allocated to the trucks and related assets based on their relative fair values at the date of acquisition.
On March 4, 2004, we acquired a seven-rig drilling fleet from Sawyer Drilling & Services, Inc. for $12,000,000. This purchase was accounted for as an acquisition of a business, and we have included the results of operations of these assets in our statement of operations since the date of acquisition. We allocated the purchase price to drilling equipment and related assets, including intangibles, based on their relative fair values at the date of acquisition.
On March 12, 2004, we acquired one drilling rig from SEDCO Drilling Co., Ltd. for $2,015,000. This purchase was accounted for as an acquisition of assets, and we have included the results of operations of these assets in our statement of operations since the date of acquisition. We allocated the purchase price to drilling equipment and related assets, including intangibles, based on their relative fair values at the date of acquisition.
3.Long-term Debt, Subordinated Debt and Note Payable
Our long-term debt is described below:
| | March 31, | | | | 2005 | | 2004 | | Indebtedness under $47,000,000 credit facility, secured by drilling equipment, due in monthly payments of $388,889 plus interest at prime (5.75% at March 31, 2005), with final maturity on December 1, 2007 | | $ | 18,077,778 | | $ | — | | | | | | | | Convertible subordinated debentures due July 2007 at 6.75% (1) | | — | | 28,000,000 | | | | | | | | Note payable to Merrill Lynch Capital, secured by drilling equipment, due in monthly payments of $172,619 plus interest at a floating rate equal to the 3-month LIBOR rate plus 385 basis points, remaining balance due December 2007 (2) | | — | | 13,119,048 | | | | | | | | Note payable to Frost National Bank, secured by drilling equipment, due in monthly payments of $107,143 plus interest at prime plus 1.0%, due August 2007 (2) | | — | | 4,392,174 | | | | | | | | Note payable to Frost National Bank, secured by drilling equipment, due in monthly payments of $42,401, including interest at prime plus 1.0%, beginning April 15, 2004, due March 15, 2007 (2) | | — | | 3,000,000 | | | | 18,077,778 | | 48,511,222 | | | | | | | | Less current installments | | (4,666,667 | ) | (3,724,302 | ) | | | $ | 13,411,111 | | $ | 44,786,920 | |
(1) WEDGE Energy Services, LLC (“WEDGE”) held $27,000,000 of the convertible subordinated debentures and William H. White, a former director of our company, held $1,000,000 of the convertible subordinated debentures. The convertible subordinate debentures were converted into 6,496,519 shares of our common stock on August 11, 2004.
(2) These notes were repaid in August and September 2004 with proceeds from our August 2004 common stock offering.
41
|
Long-term debt maturing each year subsequent to Marchas of December 31, 2005 is as follows:2008 consists of the following (amounts in thousands):
Year Ended
March 31, | | | |
2006 | | $ | 4,666,667 | |
2007 | | 4,666,667 | |
2008 | | 8,744,444 | |
2009 | | — | |
2010 | | — | |
2010 and thereafter | | — | |
| | | | |
| | | | |
Senior secured credit facility | | $ | 272,500 | |
Subordinated notes payable | | | 6,534 | |
Other | | | 379 | |
| | | | |
| | | 279,413 | |
Less current portion | | | (17,298 | ) |
| | | | |
| | $ | 262,115 | |
| | | | |
Senior Secured Revolving Credit Facility
On October 9, 2001, we issued a 6.75% five-year $18,000,000 convertible subordinated debenture, Series A, to WEDGE Energy Services, L.L.C. (“WEDGE”). The debenture was convertible into 4,500,000 shares of common stock at $4.00 per share. We used approximately $9,000,000 of the proceeds to complete the construction of two drilling rigs. Approximately $6,000,000 was used to reduce a $12,000,000 credit facility. The balance of the proceeds was used for drilling equipment and working capital. On July 3, 2002, we issued an additional $10,000,000 of 6.75% convertible subordinated debt to WEDGE with an effective conversion rate of $5.00 per share. The transaction was effected by an agreement between Pioneer and WEDGE under which WEDGE agreed to provide the additional $10,000,000 in financing and to cancel the previously issued debenture in the principal amount of $18,000,000 in exchange for $28,000,000 in new 6.75% convertible subordinated debentures. The new debentures was convertible into 6,496,519 shares of common stock at $4.31 per share, which resulted from a pro rata blending of the $5.00 conversion rate of the new $10,000,000 financing and the $4.00 conversion rate of the $18,000,000 debenture being cancelled. WEDGE funded $7,000,000 of the $10,000,000 on July 3, 2002 and $2,000,000 on JulyFebruary 29, 2002. William H. White, a former Director of our Company and the former President of WEDGE, purchased the remaining $1,000,000 on July 29, 2002. Unlike the cancelled debenture, which was not redeemable by Pioneer, the new debentures were redeemable at a scheduled premium. We used $7,000,000 of the proceeds to pay down bank debt and $3,000,000 for the purchase of drilling equipment. On August 11, 2004, these debentures were converted in accordance with their terms into 6,496,519 shares of our common stock.
On October 29, 2004,2008, we entered into a $47,000,000credit agreement with Wells Fargo Bank, N.A. and a syndicate of lenders (collectively the “Lenders”). The credit agreement provides for a senior secured revolving credit facility, with a group of lenders consisting of a $7,000,000 revolving line and lettersub-limits for letters of credit facility and a $40,000,000 acquisitionswing-line facility for the acquisition of drilling rigs, drilling rig transportation equipment and associated equipment. Frost National Bank is the administrative agent and lead arranger under the newup to an aggregate principal amount of $400 million, all of which mature on February 28, 2013. The senior secured revolving credit facility and the lenders includeobligations thereunder are secured by substantially all our domestic assets and are guaranteed by certain of our domestic subsidiaries. Borrowings under the senior secured revolving credit facility bear interest, at our option, at the bank prime rate or at the LIBOR rate, plus an applicable per annum margin in each case. The applicable per annum margin is determined based upon our leverage ratio in accordance with a pricing grid in the credit agreement. The per annum margin for LIBOR rate borrowings ranges from 1.50% to 2.50% and for bank prime
rate borrowings ranges from 0.50% to 1.50%. Based on the terms in the credit agreement, the LIBOR margin and bank prime rate margin in effect until delivery of our financial statements and the compliance certificate for December 31, 2008 are 2.25% and 1.25%, respectively. A commitment fee is due quarterly based on the average daily unused amount of the commitments of the Lenders under the senior secured revolving credit facility. In addition, a fronting fee is due for each letter of credit issued and a quarterly letter of credit fee is due based on the average undrawn amount of letters of credit outstanding during such period. We may repay the senior secured revolving credit facility balance outstanding in whole or in part at any time without premium or penalty. The senior secured revolving credit facility replaced the $20.0 million credit facility we previously had with Frost National Bank, the Bank of Scotland and Zions First National Bank. Borrowings under the newsenior secured revolving credit facility bear interest at a rate equalwere used to Frost National Bank’s prime rate (5.75% at March 31, 2005)fund the WEDGE acquisition and are secured by most of our assets, including all our drilling rigsavailable for future acquisitions, working capital and associated equipment and receivables. We borrowed the entire $40,000,000 available under the acquisition facility andother general corporate purposes.
At February 23, 2009, we have used approximately $2,825,000 of availabilityhad $257.5 million outstanding under the revolving line and letterportion of the senior secured revolving credit facility through the issuance ofand $9.3 million in committed letters of credit incredit. Under the ordinary course of business. On March 29, 2005, we repaid $20,000,000terms of the borrowings under the acquisition facility. On May 11, 2005, the lenders amended the acquisition facility to provide us with the ability to again draw the $20,000,000 for future acquisitions. The remaining approximately $20,0000,000 and $4,175,000 of availability under the acquisition facility and the revolving line and letter of credit facility, respectively, should remain available to us until those facilities mature in October 2006 and October 2005, respectively.
The sum of (1) the draws under and (2) the amount of all outstanding letters of credit issued for our account under the revolving line and letter of credit facility portion of our new credit facility are limited to 75% of our eligible accounts receivable, not to exceed $7,000,000. Therefore, if 75% of our eligible accounts receivable was less than $7,000,000, our ability to draw under this line would be reduced. At March 31, 2005, we had no outstanding advances under this line of credit, outstanding letters of credit were $2,825,000 and 75% of our eligible accounts receivable was approximately $19,084,000. Theagreement, committed letters of credit are issued to three workers’ compensation insurance companies to secure possible future claimsapplied against our borrowing capacity under the deductibles on these policies. It is our practice to pay any amounts duesenior secured revolving credit facility. The borrowing availability under these deductibles as they are incurred. Therefore, we do not anticipate that the lenders will be required to fund any draws under these letters of credit. The termination date of thesenior secured revolving line and letter of credit facility was $133.2 million at February 23, 2009. There are no limitations on our ability to access the full borrowing availability under the senior secured revolving credit facility other than maintaining compliance with the covenants in the credit agreement. Principal payments of $15.0 million made after December 31, 2008 are classified in the current portion of long-term debt as of December 31, 2008. The outstanding balance under our newsenior secured credit facility is Octobernot due until maturity on February 28, 2005.2013. However, when cash and working capital is sufficient, we may make principal payments to reduce the outstanding debt balance prior to maturity.
Effective June 11, 2008, we entered into a Waiver Agreement with the Lenders to waive the requirement to provide certain financial statements in conjunction with our compliance certificate within the time period required by the credit agreement. The Waiver Agreement required us to provide the financial statements and our compliance certificate on or before August 13, 2008. Until we provided these financial statements and our compliance certificate, the aggregate principal amount outstanding under the credit agreement could not exceed $350 million at any time (provided, however, that the commitment fee would continue to be calculated based on the total commitment of $400 million), and the per annum margin applicable to all amounts outstanding under the credit agreement would increase from the current rate of 2.25% for LIBOR rate borrowings and 1.25% for bank prime rate borrowings to 2.50% for LIBOR rate borrowings and 1.50% for bank prime rate borrowings. The required financial statements and our compliance certificate were delivered concurrently with the filing of the Quarterly Report on Form 10-Q for the quarterly period ended March 31, 2008 which occurred on August 5, 2008.
At MarchDecember 31, 2005,2008, we were in compliance with allthe restrictive covenants applicable to our outstanding debt. Those covenantscontained in the credit agreement which include among others,the following:
We must have a debt to total capitalizationmaximum consolidated leverage ratio of notno greater than ..33.00 to 1,1.00 for any fiscal quarter through March 31, 2009, 2.75 to 1.00 for any fiscal quarter ending June 30, 2009 through March 31, 2010, and 2.50 to 1.00 for any fiscal quarter ending June 30, 2010 through maturity in February 2013;
If our maximum consolidated leverage ratio is greater than 2.25 to 1.00 at the end of any fiscal quarter, then we must have a fixed chargedminimum asset coverage ratio of notno less than 1.51.25 to 1, an operating1.00; and
We must have a minimum interest coverage ratio no less than 3.00 to 1.00.
At December 31, 2008, our consolidated leverage ratio of less than 3was 1.28 to 1, restrict us from paying dividends, restrict us from the sale of assets not permitted by the1.00 and our interest coverage ratio was 17.15 to 1.00. The credit facility and restrict us fromagreement has additional restrictive covenants that, among other things, limit the incurrence of additional debt to a maximum of $15 million (other than debt under the senior secured revolving credit facility), investments, liens, dividends, acquisitions, redemptions of capital stock, prepayments of indebtedness, asset dispositions, mergers and consolidations, transactions with affiliates, capital expenditures, hedging contracts, sale leasebacks and other matters customarily restricted in such agreements. In addition, the credit agreement contains customary events of default, including without limitation, payment defaults, breaches
of representations and warranties, covenant defaults, cross-defaults to certain other material indebtedness in excess of $3,000,000 not already allowed byspecified amounts, certain events of bankruptcy and insolvency, judgment defaults in excess of specified amounts, failure of any guaranty or security document supporting the credit agreement and change of control. Non-compliance with restrictive covenants or other events of default under the credit agreement could trigger an early repayment requirement and terminate the senior secured revolving credit facility.
Subordinated Notes Payable and Other
In addition to amounts outstanding under the senior secured revolving credit facility, long-term debt includes subordinated notes payable to certain employees that are former shareholders of the production services businesses that were acquired by WEDGE prior to our acquisition of WEDGE on March 1, 2008, a subordinated note payable to an employee that is a former shareholder of Competition, two subordinated notes payable to certain employees that are former shareholders of Paltec, Inc. and Pettus Well Service. These subordinated notes payable have interest rates ranging from 5.44% to 14%, require quarterly payments of principal and interest and have final maturity dates ranging from January 2009 to March 2013. The aggregate outstanding balance of these subordinated notes payable was $6.5 million as of December 31, 2008.
Other debt represents financing arrangements for computer software with an outstanding balance of $0.4 million at December 31, 2008.
| 4. | Notes payable at March 31, 2005 consists of a $681,975 insurance premium note due in monthly installments of $137,400, including interest, through August 26, 2005, which bears interest at the rate of 3.15% per year.
42
4.Leases
We are obligated under capital leases covering several trucks that expire at various dates through January 2007. At March 31, 2005 and 2004, the gross amount of transportation equipment and related amortization recorded under capital leases were as follows:
| | March 31, | | | | 2005 | | 2004 | | Transportation equipment | | $ | 405,320 | | $ | 665,195 | | Less accumulated amortization | | 299,861 | | 413,797 | | | | $ | 105,459 | | $ | 251,398 | |
Amortization of assets held under capital leases is included with depreciation expense.
|
We lease variousour corporate office facilities in San Antonio, Texas at a cost escalating from $26,809 per month to $29,316 per month pursuant to a lease extending through December 2013. We recognize rent expense on a straight line basis for our corporate office lease. In addition, we lease real estate at 30 other locations under non-cancelable operating leases at costs ranging from $175 per month to $8,917 per month, pursuant to leases expiring through April 2013. These real estate locations are used primarily for division offices and storage and maintenance yards. We also lease office equipment under non-cancelable operating leases expiring through May 2012.
Future lease obligations required under non-cancelable operating leases as of December 31, 2008 and real estatewere as follows:follows (amounts in thousands):
• a 43-acre division office and storage yard in Decatur, Texas, at a cost of $800 per month, pursuant to a lease extending through September 2006;
• a trucking department office, storage and maintenance yard in Alice, Texas, at a cost of $4,500 per month, pursuant to a lease extending through July 2006;
• a division office in Denver, Colorado, at a cost of $1,210 per month, pursuant to a lease extending through June 2005;
• a yard office in Kenmare, North Dakota, at a cost of $700 per month, pursuant to a lease extending through March 31, 2006; and
• part of a 2.2-acre division office and storage yard in Vernal, Utah at a cost of $2,000 per month pursuant to a lease extending through October 2005.
In August 2004, we purchased the real estate we had previously been leasing in Henderson, Texas.
| | | |
Years Ended December 31, | | |
2009 | | $ | 1,566 |
2010 | | | 1,279 |
2011 | | | 949 |
2012 | | | 607 |
2013 | | | 402 |
Thereafter | | | — |
| | | |
| | $ | 4,803 |
| | | |
Rent expense under these operating leases for the yearsyear ended December 31, 2008 was $1.4 million and $0.3 million for the nine months ended December 31, 2007 and the year ended March 31, 2005, 2004 and 2003 was $102,077, $278,746 and $344,752, respectively.2007.
The jurisdictional components of (loss) income before income taxes consist of the following (amounts in thousands):
| | | | | | | | | | |
| | | Year Ended
December 31,
2008 | | | Nine Months Ended
December 31,
2007 | | Year Ended
March 31,
2007 |
Domestic | | $ | (62,388 | ) | | $ | 55,752 | | $ | 130,789 |
Foreign | | | 5,700 | | | | 2,022 | | | — |
| | | | | | | | | | |
(Loss) income before income tax | | $ | (56,688 | ) | | $ | 57,774 | | $ | 130,789 |
| | | | | | | | | | |
In four to six months we will take overThe components of our income tax expense (benefit) consist of the entire division office and storage yardfollowing (amounts in Vernal, Utah and will enter into a two year lease at a cost of $6,000 per month.thousands):
| | | | | | | | | | | |
| | | Year Ended
December 31,
2008 | | | Nine Months Ended
December 31,
2007 | | | Year Ended
March 31,
2007 |
Current tax: | | | | | | | | | | | |
Federal | | $ | 3,777 | | | $ | 10,587 | | | $ | 34,252 |
State | | | 1,181 | | | | 1,593 | | | | 1,704 |
Foreign | | | 348 | | | | — | | | | — |
| | | | | | | | | | | |
| | | 5,306 | | | | 12,180 | | | | 35,956 |
| | | | | | | | | | | |
Deferred taxes: | | | | | | | | | | | |
Federal | | | 476 | | | | 6,533 | | | | 9,195 |
State | | | (211 | ) | | | (100 | ) | | | 1,458 |
Foreign | | | 486 | | | | (484 | ) | | | — |
| | | | | | | | | | | |
| | | 751 | | | | 5,949 | | | | 10,653 |
| | | | | | | | | | | |
Income tax expense | | $ | 6,057 | | | $ | 18,129 | | | $ | 46,609 |
| | | | | | | | | | | |
In June 2005, we are moving our corporate headquarters to new office space in San Antonio, Texas. We have entered into a 102 month lease, beginning upon occupancy, with monthly payments of approximately $12,300 forThe difference between the first two years increasing to an average of approximately $20,000 per month thereafter. The lease grants two options to renewincome tax expense and the lease for a renewal term of five years each. We plan to sell our current corporate headquarters building in San Antonio, Texas.
43
Future lease obligations, including our new corporate headquarters, and minimum capital lease payments as of March 31, 2005 were as follows:
Year Ended | | Operating | | Capital | |
March 31, | | Leases | | Leases | |
| 2006 | | $ | 224,873 | | $ | 70,446 | |
| 2007 | | 173,935 | | 34,106 | |
| 2008 | | 217,492 | | — | |
| 2009 | | 234,291 | | — | |
| 2010 | | 237,905 | | — | |
| Thereafter | | 903,438 | | — | |
Total minimum lease payments | | $ | 1,991,934 | | $ | 104,552 | |
| | | | | |
Less amounts representing interest (at rates ranging from 5.7% to 8.4%) | | | | (4,287 | ) |
Present value of net minimum capital lease payments | | | | 100,265 | |
Less current installments of capital lease obligations | | | | (66,359 | ) |
Capital lease obligations, excluding current installments | | | | $ | 33,906 | |
5.Income Taxes
Our provision for income taxes consists of the following:
| | Years Ended March 31, | |
| | 2005 | | 2004 | | 2003 | |
| | | | | | | |
Current tax - state | | $ | 56,400 | | $ | — | | $ | — | |
Current tax - federal | | 335,109 | | — | | (708,032 | ) |
Deferred tax - state | | 55,164 | | — | | — | |
Deferred tax - federal | | 5,902,828 | | (426,299 | ) | (1,511,744 | ) |
Income tax expense (benefit) | | $ | 6,349,501 | | $ | (426,299 | ) | $ | (2,219,776 | ) |
In fiscal years 2005, 2004 and 2003, our expected tax, which we computeamount computed by applying the federal statutory income tax rate of 34%35% to (loss) income (loss) before income taxes differs from our incomeconsist of the following (amounts in thousands):
| | | | | | | | | | | | |
| | | Year Ended
December 31,
2008 | | | Nine Months Ended
December 31,
2007 | | | Year Ended
March 31,
2007 | |
Expected tax (benefit) expense | | $ | (19,840 | ) | | $ | 20,221 | | | $ | 45,776 | |
State income taxes | | | 556 | | | | 971 | | | | 2,417 | |
Incentive stock options | | | 508 | | | | 538 | | | | 547 | |
Goodwill impairment | | | 26,752 | | | | — | | | | — | |
Tax benefits in foreign jurisdictions | | | (1,377 | ) | | | (1,191 | ) | | | — | |
Domestic production activities deduction | | | (457 | ) | | | (729 | ) | | | (1,388 | ) |
Tax-exempt interest income | | | (219 | ) | | | (475 | ) | | | (422 | ) |
Non deductible items for tax purposes | | | 247 | | | | 61 | | | | 48 | |
Uncertain tax positions | | | — | | | | (717 | ) | | | (372 | ) |
Other, net | | | (113 | ) | | | (550 | ) | | | 3 | |
| | | | | | | | | | | | |
| | $ | 6,057 | | | $ | 18,129 | | | $ | 46,609 | |
| | | | | | | | | | | | |
Income tax expense (benefit) was allocated as follows:follows (amounts in thousands):
| | Years Ended March 31, | |
| | 2005 | | 2004 | | 2003 | |
| | | | | | | |
Expected tax expense (benefit) | | $ | 5,834,783 | | $ | (753,561 | ) | $ | (2,483,834 | ) |
Non taxable interest income | | — | | — | | (10,400 | ) |
Club dues, meals and entertainment | | 24,050 | | 13,941 | | 10,443 | |
State income taxes | | 92,388 | | — | | — | |
Reimbursement of food costs for rig employees | | 396,968 | | 314,622 | | 275,338 | |
Other | | 1,312 | | (1,301 | ) | (11,323 | ) |
| | $ | 6,349,501 | | $ | (426,299 | ) | $ | (2,219,776 | ) |
44
| | | | | | | | | | | | |
| | | Year Ended
December 31,
2008 | | | Nine Months Ended
December 31,
2007 | | | Year Ended
March 31,
2007 | |
Results of operations | | $ | 6,057 | | | $ | 18,129 | | | $ | 46,609 | |
Stockholders’ equity | | | (963 | ) | | | (54 | ) | | | (24 | ) |
| | | | | | | | | | | | |
| | $ | 5,094 | | | $ | 18,075 | | | $ | 46,585 | |
| | | | | | | | | | | | |
Deferred income taxes arise from temporary differences between the tax basisbases of assets and liabilities and their reported amounts in the consolidated financial statements. The components of our deferred income tax assets and liabilities were as follows:follows (amounts in thousands):
| | March 31, | |
| | 2005 | | 2004 | |
| | | | | |
Deferred tax assets: | | | | | |
Vacation expense accruals | | $ | 71,446 | | $ | 37,233 | |
Workers compensation and health insurance accruals | | 378,423 | | 187,752 | |
Bad debt expense | | 119,680 | | 37,400 | |
Net operating loss carryforwards | | 4,329,933 | | 7,825,126 | |
Alternative minimum tax credit | | 311,915 | | 181,770 | |
Loss accrual on turnkey contracts | | — | | 23,000 | |
Total deferred tax assets | | 5,211,397 | | 8,292,281 | |
Deferred tax liabilities: | | | | | |
Property and equipment, principally due to differences in depreciation | | 16,924,919 | | 14,017,813 | |
Total deferred tax liabilities | | 16,924,919 | | 14,017,813 | |
Net deferred tax liabilities | | $ | 11,713,522 | | $ | 5,725,532 | |
| | | | | | | | |
| | | December 31,
2008 | | | December 31,
2007 | |
Deferred tax assets: | | | | | | | | |
Auction rate preferred securities | | $ | 719 | | | $ | — | |
Intangibles | | | 23,207 | | | | — | |
Employee benefits and insurance claims accruals | | | 4,963 | | | | 3,292 | |
Accounts receivable reserve | | | 600 | | | | — | |
Employee stock based compensation | | | 2,222 | | | | 1,095 | |
Accrued expenses not deductible for tax purposes | | | 1,730 | | | | 498 | |
Accrued revenue not income for book purposes | | | 1,784 | | | | 613 | |
Foreign net operating loss carryforward | | | 4,705 | | | | 3,637 | |
| | | | | | | | |
| | | 39,930 | | | | 9,135 | |
Valuation allowance | | | (5,382 | ) | | | (3,997 | ) |
| | | | | | | | |
Total deferred tax assets | | | 34,548 | | | | 5,138 | |
| | | | | | | | |
Deferred tax liabilities: | | | | | | | | |
Property and equipment | | | 89,193 | | | | 47,731 | |
| | | | | | | | |
Total deferred tax liabilities | | | 89,193 | | | | 47,731 | |
| | | | | | | | |
Net deferred tax liabilities | | $ | 54,645 | | | $ | 42,593 | |
| | | | | | | | |
In assessing our ability to realizethe realizability of deferred tax assets, we consider whether it is more likely than not that some portion or all of the deferred tax assets will not be realized. Our ultimate realization of deferred tax assets dependsBased on the generationexpectation of future taxable income duringand that the periods in which thosedeductible temporary differences become deductible. We consider the scheduled reversal of deferred tax liabilities, projected futurewill offset existing taxable income, and tax planning strategies in making this assessment. Based on the level of historical taxable income and projections for future taxable income over the periods during which the deferred tax assets are deductible,temporary differences, we believe it is more likely than not that we will realize the benefits of these deductible temporary differences, net of the existing valuation allowance at December 31, 2008.
At MarchAs of December 31, 2005,2008, we had foreign deferred tax assets consisting of foreign net operating losses and other tax benefits available to reduce future taxable income in a foreign jurisdiction. In assessing the realizability of our foreign deferred tax assets, we only recognize a tax benefit to the extent of taxable income that we expect to earn in the foreign jurisdiction in future periods. Due to recent declines in oil and natural gas prices and the downturn in our industry, we anticipate reductions in drilling rig utilization and revenue rates in 2009. Consequently, we have a valuation allowance of $5.4 million that fully offsets our foreign deferred tax assets. The foreign net operating loss carryforwardshas an indefinite carryforward period.
Deferred income taxes have not been provided on the future tax consequences attributable to difference between the financial statements carrying amounts of existing assets and liabilities and the respective tax bases of our foreign subsidiary based on the determination that such differences are essentially permanent in duration in that the earnings of the subsidiary is expected to be indefinitely reinvested in foreign operations. As of
December 31, 2008, the cumulative undistributed earnings of the subsidiary was approximately $1.9 million. If those earnings were not considered indefinitely reinvested, deferred income taxes would have been recorded after consideration of foreign tax credits. It is not practicable to estimate the amount of additional tax that might be payable on those earnings, if distributed.
We have no unrecognized tax benefits relating to FIN No. 48 and no unrecognized tax benefit activity during the year ended December 31, 2008.
We adopted a policy to record interest and penalty expense related to income taxes as interest and other expense, respectively. At December 31, 2008, no interest or penalties have been or are required to be accrued. Our open tax years for our federal income tax purposes of approximately $16,500,000, which will expire if not utilized as ofreturns are for the end of our fiscal years ending as follows:ended March 31, 2007 and December 31, 2007.
Year | | Amount | |
2023 | | $ | 6,600,000 | |
2024 | | 9,900,000 | |
| | | | |
| 6. | 6.Fair Value of Financial Instruments
Cash and cash equivalents, trade receivables and payables and short-term debt:
|
The carrying amounts of our cash and cash equivalents, trade receivables payables and short-term debtpayables approximate their fair values.
| 7. | Long-term debt:
The carrying amount of our long-term debt approximates its fair value, as supported by the recent issuance of the debt and because the rates and terms currently available to us approximate the rates and terms on the existing debt.
45
7.�� Earnings (Loss) earnings Per Common Share
|
The following table presents a reconciliation of the numerators and denominators of the basic EPS(loss) earnings per share and diluted EPS(loss) earnings per share comparisons as required by SFAS No. 128:128 (amounts in thousands, except per share data):
| | Years Ended March 31, | |
| | 2005 | | 2004 | | 2003 | |
| | | | | | | |
Basic | | | | | | | |
Net earnings (loss) | | $ | 10,811,625 | | $ | (1,790,057 | ) | $ | (5,085,618 | ) |
| | | | | | | |
Weighted average shares | | 34,543,695 | | 22,585,612 | | 16,163,098 | |
| | | | | | | |
Earning (loss) per share | | $ | 0.31 | | $ | (0.08 | ) | $ | (0.31 | ) |
| | | | | | | |
Diluted | | | | | | | |
Earnings (loss) applicable to common shareholders | | $ | 10,811,625 | | $ | (1,790,057 | ) | $ | (5,085,618 | ) |
Effect of dilutive securities - Convertible subordinated debenture | | 459,483 | | — | | — | |
Earnings (loss) available to common shareholders and assumed conversion | | $ | 11,271,108 | | $ | (1,790,057 | ) | $ | (5,085,618 | ) |
Weighted average shares: | | | | | | | |
Outstanding | | 34,543,695 | | 22,585,612 | | 16,163,098 | |
Options | | 684,806 | | — | | — | |
Convertible subordinated debenture | | 2,349,426 | | — | | — | |
| | 37,577,927 | | 22,585,612 | | 16,163,098 | |
Earnings (loss) per share | | $ | 0.30 | | $ | (0.08 | ) | $ | (0.31 | ) |
| | | | | | | | | | |
| | | Year Ended
December 31,
2008 | | | Nine Months Ended
December 31,
2007 | | Year Ended
March 31,
2007 |
Basic | | | | | | | | | | |
Net (loss) earnings | | $ | (62,745 | ) | | $ | 39,645 | | $ | 84,180 |
| | | | | | | | | | |
Weighted average shares | | | 49,789 | | | | 49,645 | | | 49,603 |
| | | | | | | | | | |
(Loss) earnings per share | | $ | (1.26 | ) | | $ | 0.80 | | $ | 1.70 |
| | | | | | | | | | |
Diluted | | | | | | | | | | |
Net (loss) earnings | | $ | (62,745 | ) | | $ | 39,645 | | $ | 84,180 |
Effect of dilutive securities | | | — | | | | — | | | — |
| | | | | | | | | | |
Net (loss) earnings available to common shareholders after assumed conversion | | $ | (62,745 | ) | | $ | 39,645 | | $ | 84,180 |
| | | | | | | | | | |
Weighted average shares: | | | | | | | | | | |
Outstanding | | | 49,789 | | | | 49,645 | | | 49,603 |
Options | | | — | | | | 556 | | | 529 |
| | | | | | | | | | |
| | | 49,789 | | | | 50,201 | | | 50,132 |
| | | | | | | | | | |
(Loss) earnings per share | | $ | (1.26 | ) | | $ | 0.79 | | $ | 1.68 |
| | | | | | | | | | |
The weighted average number ofAll outstanding stock options were excluded from the diluted shares in 2004 and 2003 excludes 7,612,924 and 7,185,995, respectively, of shares for options and convertible debt due to their antidilutive effects.
8.Equity Transactions
On March 31, 2003, we sold 5,333,333 shares of our common stock to Chesapeake Energy Corporation for $20,000,000 ($3.75 per share), before related offering expenses. In connection with that sale, we granted Chesapeake Energy a preemptive right to acquire equity securities we may issue in the future, under specified circumstances, in order to permit Chesapeake Energy to maintain its proportionate ownership of our outstanding shares of common stock. We also granted Chesapeake Energy a right, under certain circumstances, to request registration of the acquired shares under the Securities Act of 1933. At March 31, 2005, Chesapeake Energy owned 16.78% of our outstanding common stock and its preemptive rights have expired.
On February 20, 2004, we sold 4,400,000 shares of our common stock at $5.40loss per share in a private placementcalculation for $23,760,000 in proceeds, before related offering expenses. We issued those shares without registration under the Securities Actyear ended December 31, 2008 because the effect of 1933 in reliance ontheir inclusion would be antidilutive, or would decrease the exemption that Section 4(2) of that Act provides for transactions not involving any public offering. We subsequently filed a registration statement on Form S-3 to register the resales of those shares. The registration statement became effective on June 22, 2004.reported loss per share.
On August 11, 2004, the entire $28,000,000 in aggregate principal amount of our 6.75% convertible subordinated debentures held by WEDGE Energy Services, L.L.C. and William H. White was converted in accordance with the terms of those debentures into 6,496,519 shares of our common stock.
On August 11, 2004, we sold 4,000,000 shares of our common stock at approximately $6.61 per share, net of underwriters’ commissions, pursuant to a public offering we registered with the SEC under a registration statement filed on Form S-1. On August 31, 2004, we sold 600,000 additional shares of our common stock at approximately $6.61 per share, net of underwriters’ commissions, pursuant to the underwriters’ exercise of an over-allotment option granted in connection with that public offering.
46
On March 22, 2005, we sold 6,945,000 shares of our common stock, including shares we sold pursuant to the underwriters’ exercise of an over-allotment option, at approximately $11.78 per share, net of underwriters’ commissions, pursuant to a public offering we registered with the SEC.
Directors and employeesEmployees exercised stock options for the purchase of 551,666170,054 shares of common stock at prices ranging from $.375$3.67 to $6.44$10.31 per share during the fiscal year ended MarchDecember 31, 2005, 722,3342008. Employees exercised stock options for the purchase of 22,500 shares of common stock at prices ranging from $.625$4.52 to $3.20$4.77 per share during the fiscal yearnine months ended MarchDecember 31, 2004 and 445,0002007. Employees exercised stock options for the purchase of 36,500 shares of common stock at prices ranging from $0.375$3.20 to $2.50$4.77 per share during the fiscal year ended March 31, 2003.2007.
Employees and directors were awarded 178,261 shares of restricted stock that vest over a three year period with a weighted-average grant date price of $17.07 during the year ended December 31, 2008.
| 9. | Stock Option and Restricted Stock Plans |
9.Stock Options, WarrantsWe have stock based award plans that are administered by the Compensation Committee of our Board of Directors, which selects persons eligible to receive awards and Stock Option Plan
Under ourdetermines the number of stock options or restricted stock subject to each award and the terms, conditions and other provisions of the awards. Employee stock option plans, employee stock optionsawards generally become exercisable over three- to five-year periods, and all options generally expire 10 years after the date of grant. Stock option awards granted to outside directors vest immediately and expire five years after the date of grant. Our plans provide that all stock options must have an exercise price not less than the fair market value of our common stock on the date of grant. Accordingly, asRestricted stock awards consist of our common stock that vest over a three year period. Total shares available for future stock option grants and restricted stock grants to employees and directors under existing plans were 2,035,073 at December 31, 2008. Of the total shares available, no more than 822,489 shares may be granted in the form of restricted stock.
We estimate the fair value of each stock option grant on the date of grant using a Black-Scholes options-pricing model. The following table summarizes the assumptions used in the Black-Scholes option-pricing model for the year ended December 31, 2008, for the nine months ended December 31, 2007 and for the year ended March 31, 2007:
| | | | | | | | | | | | |
| | | Year Ended
December 31,
2008 | | | Nine Months
Ended
December 31,
2007 | | | Year Ended
March 31,
2007 | |
Expected volatility | | | 44 | % | | | 46 | % | | | 49 | % |
Weighted-average risk-free interest rates | | | 2.7 | % | | | 4.7 | % | | | 5.0 | % |
Weighted-average expected life in years | | | 3.72 | | | | 4.00 | | | | 2.86 | |
Weighted-average grant-date fair value | | $ | 5.66 | | | $ | 5.84 | | | $ | 5.36 | |
The assumptions above are based on multiple factors, including historical exercise patterns of homogeneous groups with respect to exercise and post-vesting employment termination behaviors, expected future exercising patterns for these same homogeneous groups and volatility of our stock price. As we discussed in Note 1,have not declared dividends since we dobecame a public company, we did not recognizeuse a dividend yield. In each case, the actual value that will be realized, if any, will depend on the future performance of our common stock and overall stock market conditions. There is no assurance the value an optionee actually realizes will be at or near the value we have estimated using the Black-Scholes options-pricing model.
At December 31, 2008, there was $5.7 million of unrecognized compensation expensecost relating to thesestock options in our resultswhich are expected to be recognized over a weighted-average period of operations.2.06 years.
The following table provides information relating to our outstandingrepresents stock option activity from March 31, 2007 through December 31, 2008:
| | | | | | | | |
| | | Number of
Shares | | | Weighted-Average
Exercise Price | | Weighted-Average
Remaining
Contract Life |
Outstanding stock options as of March 31, 2007 | | 1,946,500 | | | $ | 9.29 | | |
Granted | | 931,500 | | | | 14.06 | | |
Exercised | | (22,500 | ) | | | 4.74 | | |
Canceled | | — | | | | — | | |
Forfeited | | (55,001 | ) | | | 11.73 | | |
| | | | | | | | |
Outstanding stock options as of December 31, 2007 | | 2,800,499 | | | $ | 10.87 | | |
| | | | | | | | |
Granted | | 1,460,764 | | | $ | 15.89 | | |
Exercised | | (170,054 | ) | | | 4.61 | | |
Canceled | | — | | | | — | | |
Forfeited | | (321,514 | ) | | | 13.74 | | |
| | | | | | | | |
Outstanding stock options as of December 31, 2008 | | 3,769,695 | | | $ | 12.85 | | 7.70 |
| | | | | | | | |
Stock options exercisable as of December 31, 2008 | | 1,741,932 | | | $ | 10.30 | | 6.20 |
| | | | | | | | |
At December 31, 2008, the aggregate intrinsic value of stock options at Marchoutstanding was $0.9 million and the aggregate intrinsic value of stock options exercisable was $0.9 million. Intrinsic value is the difference between the exercise price of a stock option and the closing market price of our common stock, which was $5.57 on December 31, 2005, 2004 and 2003:
| | 2005 | | 2004 | | 2003 | |
| | Shares
Issuable on
Exercise of
Options | | Weighted
Average
Price | | Shares
Issuable on
Exercise of
Options | | Weighted
Average
Price | | Shares
Issuable on
Exercise of
Options | | Weighted
Average
Price | |
Balance Outstanding Beginning of year | | 2,056,666 | | $ | 3.24 | | 1,825,000 | | $ | 1.63 | | 2,320,000 | | $ | 1.47 | |
Granted | | 510,000 | | $ | 8.85 | | 1,000,000 | | $ | 4.46 | | 65,000 | | $ | 1.72 | |
Exercised | | (551,666 | ) | $ | 1.37 | | (722,334 | ) | $ | 0.93 | | (445,000 | ) | $ | 0.40 | |
Canceled | | (10,000 | ) | $ | 4.52 | | (46,000 | ) | $ | 2.25 | | (115,000 | ) | $ | 4.29 | |
Balance Outstanding End of year | | 2,005,000 | | $ | 5.30 | | 2,056,666 | | $ | 3.24 | | 1,825,000 | | $ | 1.63 | |
Options Exercisable End of year | | 798,002 | | $ | 3.58 | | 884,001 | | $ | 1.95 | | 1,437,334 | | $ | 1.28 | |
As of March 31, 2005, there were no outstanding warrants.
2008.
The following table summarizes information about our employeenonvested stock options outstanding and exercisable atoption activity from March 31, 2005:2007 through December 31, 2008:
| | Options Outstanding | | Options Exercisable | |
Range of
Exercise Prices | | Number
Outstanding | | Weighted
Average
Remaining
Contractual
Life | | Weighted
Average
Exercise
Price | | Number
Exercisable | | Weighted
Average
Exercise
Price | |
| | | | | | | | | | | |
$2.25 - $4.65 | | 1,065,000 | | 7.45 | | $ | 3.60 | | 681,002 | | $ | 3.32 | |
| | | | | | | | | | | |
$4.77 - $10.31 | | 940,000 | | 9.11 | | $ | 7.22 | | 117,000 | | $ | 5.05 | |
| | | | | | | | | | | |
| | 2,005,000 | | 8.23 | | $ | 5.30 | | 798,002 | | $ | 3.58 | |
| | | | | | |
| | | Number of
Shares | | | Weighted-Average
Grant-Date
Fair Value |
Nonvested stock options as of March 31, 2007 | | 880,666 | | | $ | 5.48 |
Granted | | 931,500 | | | | 5.84 |
Vested | | (253,324 | ) | | | 5.49 |
Forfeited | | (55,001 | ) | | | 5.89 |
| | | | | | |
Nonvested stock options as of December 31, 2007 | | 1,503,841 | | | $ | 5.64 |
Granted | | 1,460,764 | | | | 5.67 |
Vested | | (627,993 | ) | | | 5.63 |
Forfeited | | (308,849 | ) | | | 5.17 |
| | | | | | |
Nonvested stock options as of December 31, 2008 | | 2,027,763 | | | $ | 5.74 |
| | | | | | |
10.Employee BenefitPlans and Insurance
The following table summarizes our restricted stock activity from December 31, 2007 through December 31, 2008:
| | | | | | |
| | | Number
of Shares | | | Weighted-Average
Grant-Date Fair
Value per Share |
Nonvested restricted stock as of December 31, 2007 | | — | | | $ | — |
Granted | | 178,261 | | | | 17.07 |
Vested | | (3,645 | ) | | | 17.07 |
Forfeited | | (750 | ) | | | 17.07 |
| | | | | | |
Nonvested restricted stock as of December 31, 2008 | | 173,866 | | | $ | 17.07 |
| | | | | | |
The 178,261 restricted stock awards granted during the year ended December 31, 2008 were the first restricted stock awards granted under our stock based award plans. At December 31, 2008, there was $2.2 million of unrecognized compensation cost relating to restricted stock awards which are expected to be recognized over a weighted-average period of 2.65 years.
| 10. | Employee Benefit Plans and Insurance |
We maintain a 401(k) retirement plan for our eligible employees. Under this plan, we may contribute,make a matching contribution, on a discretionary basis, equal to a percentage of aneach eligible employee’s annual contribution, which we determine annually. Our matching contributions for fiscal 2005, 2004the year ended December 31, 2008, the nine months ended December 31, 2007 and 2003the year ended March 31, 2007 were approximately $399,000, $76,000$1.8 million, $0.8 million and $92,000,$1.0 million, respectively.
47
We maintain a self-insurance program, for major medical, hospitalization and dental coverage for employees and their dependents, which is partially funded by employee payroll deductions. We have provided for both reported and incurred but not reported medical costs in the accompanying consolidated balance sheets. We have a maximum liability of $100,000$125,000 per employee/dependent per year.year except for individuals employed by our Production Services Division where we had no deductible during the period ended December 31, 2008. Amounts in excess of the stated maximum are covered under a separate policy provided by an insurance company. Accrued expensesexpenses—payroll and employee related costs at MarchDecember 31, 20052008 and December 31, 2007 include approximately $489,000$1.1 million and $0.8 million, respectively, for our estimate of incurred but unpaid costs related to the self-insurance portion of our health insurance.
We are self-insured for up to $250,000$500,000 per incident for all workers’ compensation claims submitted by employees for on-the-job injuries, except in North Dakota where thethere is no deductible. Our deductible is $100,000.under workers’ compensation insurance increased from $250,000 in October 2007. We have provided for both reporteddeductibles of $250,000 and incurred but not reported costs of$100,000 per occurrence under our general liability insurance and auto liability insurance, respectively. We accrue our workers’ compensation coverage inclaim cost estimates based on historical claims development data and we accrue the accompanying consolidated balance sheets.cost of administrative services associated with claims processing. Accrued expensesexpenses—insurance premiums and deductibles at MarchDecember 31, 20052008 and December 31, 2007 include approximately $845,000$9.6 million and $8.6 million, respectively, for our estimate of incurred but unpaid costs relatedrelative to the self-insured portion of our workers’ compensation, claims.general liability and auto liability insurance. Based upon our past experience, management believes that we have adequately provided for potential losses. However, future multiple occurrences of serious injuries to employees could have a material adverse effect on our financial position and results of operations.
11.Business SegmentsAt December 31, 2008, we had two operating segments referred to as the Drilling Services Division and Concentrationsthe Production Services Division which is the basis management uses for making operating decisions and assessing performance. Prior to our acquisitions of the production services businesses from WEDGE and Competition on
SubstantiallyMarch 1, 2008, all our operations relaterelated to contract drilling of oilthe Drilling Services Division and gas wells. Accordingly, we classify all ourreported these operations in a single operating segment. The acquisitions of the production services businesses from WEDGE and Competition resulted in the formation of our Production Services Division. See Note 2.
Drilling Services Division—Our Drilling Services Division provides contract land drilling services with its fleet of 70 drilling rigs in the following locations:
| | |
Drilling Division Locations | | Rig Count |
South Texas | | 17 |
East Texas | | 22 |
North Texas | | 9 |
Utah | | 6 |
North Dakota | | 6 |
Oklahoma | | 5 |
Colombia | | 5 |
DuringProduction Services Division—Our Production Services Division provides a broad range of well services to oil and gas drilling and producing companies, including workover services, wireline services, and fishing and rental services. Our production services operations are managed regionally and are concentrated in the fiscalmajor United States onshore oil and gas producing regions in the Gulf Coast, Mid-Continent, and Rocky Mountain states. We have a premium fleet of 74 workover rigs consisting of sixty-nine 550 horseposewer rigs, four 600 horsepower rigs, and one 400 horsepower rig. We provide wireline services with a fleet of 59 wireline units and rental services with approximately $15 million of fishing and rental tools.
The following tables set forth certain financial information for our two operating segments and corporate as of and for the year ended MarchDecember 31, 2005, our three largest customers accounted for 6.5%, 5.0% and 4.6%, respectively, of our total contract drilling revenue. All three of these customers were customers of ours2008 (amounts in 2004. In fiscal 2004, our three largest customers accounted for 10.5%, 6.4% and 4.9%, of our total contract drilling revenue. Two of these customers were customers of ours in fiscal 2003. In fiscal 2003, our three largest customers accounted for 10.8%, 6.5% and 5.4% of our total contract drilling revenue.thousands):
| | | | | | | | | | | | |
| | | As of and for the Year Ended December 31, 2008 |
| | | Drilling
Services
Division | | Production
Services
Division | | Corporate | | Total |
Identifiable assets | | $ | 567,956 | | $ | 232,063 | | $ | 24,460 | | $ | 824,479 |
| | | | | | | | | | | | |
Revenues | | $ | 456,890 | | $ | 153,994 | | $ | — | | $ | 610,884 |
Operating costs | | | 269,846 | | | 80,097 | | | — | | | 349,943 |
| | | | | | | | | | | | |
Segment margin | | $ | 187,044 | | $ | 73,897 | | $ | — | | $ | 260,941 |
| | | | | | | | | | | | |
Depreciation and amortization | | $ | 66,270 | | $ | 21,441 | | $ | 434 | | $ | 88,145 |
Capital expenditures | | $ | 107,344 | | $ | 38,921 | | $ | 1,831 | | $ | 148,096 |
12.Commitments and ContingenciesThe following table reconciles the segment profits reported above to income from operations as reported on the condensed consolidated statements of operations for the year ended December 31, 2008 (amounts in thousands):
| | | | |
| | | Year Ended
December 31, 2008 | |
Segment margin | | $ | 260,941 | |
Depreciation and amortization | | | (88,145 | ) |
Selling, general and administrative | | | (44,834 | ) |
Bad debt (expense) recovery | | | (423 | ) |
Impairment of goodwill | | | (118,646 | ) |
Impairment of intangible assets | | | (52,847 | ) |
| | | | |
Loss from operations | | $ | (43,954 | ) |
| | | | |
We are
The following table sets forth certain financial information for our international operations in Colombia as of and for the process of constructing, primarily from new and used components, two 1000 horsepower electric rigs at an estimated cost of $6,500,000 each. We expect to place one of these rigsyear ended December 31, 2008 which is included in serviceour Drilling Services Division (amounts in June 2005 and the second in August 2005. As of March 31, 2005, we have incurred approximately $3,300,000 of construction cost on these rigs.thousands):
| | | |
| | | As of and for the
Year Ended
December 31, 2008 |
Identifiable assets | | $ | 107,927 |
| | | |
Revenues | | $ | 51,414 |
| | | |
| 12. | Commitments and Contingencies |
In connection with our expansion into international markets, our foreign subsidiaries have obtained bonds for bidding on drilling contracts, performing under drilling contracts, and remitting customs and importation duties. We have guaranteed payments of $36.2 million relating to our performance under these bonds.
In addition, due to the nature of our business, we are, from time to time, involved in routine litigation or subject to disputes or claims related to our business activities, including workers’ compensation claims and employment-related disputes. Legal costs relating to these matters are expensed as incurred. In the opinion of our management, none of the pending litigation, disputes or claims against us will have a material adverse effect on our financial condition, results of operations or cash flow from operations and there is only a remote possibility that any such matter will require any additional loss accrual.
| 13. | 48
13.Quarterly Results of Operations (unaudited)
|
The following table summarizes quarterly financial data for our fiscal yearsthe year ended MarchDecember 31, 20052008 and 2004the nine months ended December 31, 2007 (in thousands, except per share data):
| | First
Quarter | | Second
Quarter | | Third
Quarter | | Fourth
Quarter | | Total | | | | | | | | | | | |
2005 | | | | | | | | | | | | |
Year Ended December 31, 2008 (1) (2) | | | First
Quarter | | Second
Quarter | | Third
Quarter | | Fourth
Quarter | | Total | |
Revenues | | | $ | 113,397 | | | $ | 152,547 | | | $ | 174,245 | | | $ | 170,695 | | | $ | 610,884 | |
Income (loss) from operations | | | | 17,995 | | | | 33,716 | | | | 42,073 | | | | (137,738 | ) | | | (43,954 | ) |
Income tax (expense) benefit | | | | (6,250 | ) | | | (9,609 | ) | | | (12,760 | ) | | | 22,562 | | | | (6,057 | ) |
Net earnings (loss) | | | | 11,848 | | | | 19,117 | | | | 24,194 | | | | (117,904 | ) | | | (62,745 | ) |
Earnings (loss) per share: | | | | | | | | | | | |
Basic | | | $ | 0.24 | | | $ | 0.38 | | | $ | 0.49 | | | $ | (2.37 | ) | | $ | (1.26 | ) |
Diluted (3) | | | $ | 0.24 | | | $ | 0.38 | | | $ | 0.48 | | | $ | (2.37 | ) | | $ | (1.26 | ) |
| Nine Months Ended December 31, 2007 | | | | | | | | | | | | |
Revenues | | $ | 40,719 | | $ | 42,783 | | $ | 46,387 | | $ | 55,357 | | $ | 185,246 | | | $ | 102,779 | | | $ | 106,516 | | | $ | 104,589 | | | $ | — | | | $ | 313,884 | |
Income from operations | | 1,046 | | 1,960 | | 6,704 | | 9,064 | | 18,774 | | | | 19,569 | | | | 17,307 | | | | 18,384 | | | | — | | | | 55,260 | |
Income tax expense | | (139 | ) | (590 | ) | (2,428 | ) | (3,192 | ) | (6,349 | ) | | | (7,362 | ) | | | (6,255 | ) | | | (4,512 | ) | | | — | | | | (18,129 | ) |
Net earnings | | 216 | | 923 | | 4,179 | | 5,494 | | 10,812 | | | | 13,088 | | | | 11,780 | | | | 14,777 | | | | — | | | | 39,645 | |
Earnings per share: | | | | | | | | | | | | | | | | | | | | | |
Basic | | .01 | | .03 | | .11 | | .14 | | .31 | | | $ | 0.26 | | | $ | 0.24 | | | $ | 0.30 | | | $ | — | | | $ | 0.80 | |
Diluted | | .01 | | .03 | | .11 | | .14 | | .30 | | |
2004 | | | | | | | | | | | | |
Revenues | | $ | 23,850 | | $ | 24,244 | | $ | 26,414 | | $ | 33,368 | | $ | 107,876 | | |
Income (loss) from operations | | (789 | ) | (166 | ) | 9 | | 1,384 | | 438 | | |
Income tax expense (benefit) | | 409 | | 185 | | 118 | | (286 | ) | 426 | | |
Net earnings (loss) | | (1,056 | ) | (621 | ) | (522 | ) | 409 | | (1,790 | ) | |
Earnings (loss) per share: | | | | | | | | | | | | |
Basic | | (.05 | ) | (.03 | ) | (.02 | ) | .02 | | (.08 | ) | |
Diluted | | (.05 | ) | (.03 | ) | (.02 | ) | .02 | | (.08 | ) | |
Diluted (3) | | | $ | 0.26 | | | $ | 0.23 | | | $ | 0.29 | | | $ | — | | | $ | 0.79 | |
The sum of the quarterly earnings per share amounts do not necessarily agree with the year end amounts due to the dilutive effects of convertible instruments.
| (1) | Our quarterly results of operations for the year ended December 31, 2008 include the results of operations relating to acquisitions of WEDGE and Competition, both of which occurred on March 1, 2008. See note 2. |
49
| (2) | Our quarterly results of operations for the fourth quarter of the year ended December 31, 2008 reflect the impact of a goodwill impairment charge of $118.6 million and an intangible asset impairment charge of $52.8 million. See note 1. |
Item 9.Changes in and Disagreements With Accountants on Accounting and Financial Disclosure
| (3) | Due to the effects of rounding, the sum of quarterly earnings per share does not equal total earnings per share for the fiscal year. |
| Item 9. | Changes in and Disagreements With Accountants on Accounting and Financial Disclosure |
Not applicable.
Item 9A.Controls and Procedures
| Item 9A. | Controls and Procedures |
In accordance with Exchange Act Rules 13a-15 and 15d-15, we carried out an evaluation, under the supervision and with the participation of management, including our Chief Executive Officer and Chief Financial Officer, of the effectiveness of our disclosure controls and procedures as of the end of the period covered by this report. Based upon that evaluation, our Chief Executive Officer and Chief Financial Officer concluded that our disclosure controls and procedures were effective as of MarchDecember 31, 20052008 to provide reasonable assurance that information required to be disclosed in our reports filed or submitted under the Exchange Act is recorded, processed, summarized and reported within the time periods specified in the Securities and Exchange Commission’s rules and forms.
There has been no change in our internal controlscontrol over financial reporting that occurred during the three months ended MarchDecember 31, 20052008 that has materially affected, or is reasonably likely to materially affect, our internal control over financial reporting.
We completed the acquisitions of the production services businesses of WEDGE, Competition, Paltec and Pettus during 2008. We are in the process of transferring accounting processes for the new acquisition to our headquarters and into our existing internal control processes. The integration will lead to changes in these internal controls in future fiscal periods, but we do not expect these changes to materially affect our internal controls over financial reporting. Consistent with published guidance of the SEC, our management excluded from its assessment of the effectiveness of Pioneer Drilling Company’s internal control over financial reporting as of December 31, 2008, the internal control over financial reporting for WEDGE, Competition, Paltec and Pettus associated with total assets of $232.1 million and total revenues of $154.0 million included in the consolidated financial statement amounts of Pioneer Drilling Company as of and for the year ended December 31, 2008. We will include these acquired companies in the scope of our assessment of internal control over financial reporting for the year ending December 31, 2009.
Investigation by the Special Subcommittee of the Board of Directors
On May 12, 2008, the Company announced a delay in filing its Form 10-Q for the quarter ended March 31, 2008 (the “Quarterly Report”), as a result of certain questions raised with respect to the effectiveness of the Company’s internal control over financial reporting. On May 15, 2008, the Board of Directors formed a special subcommittee of the Board (the “Special Committee”) to investigate the questions raised regarding the Company’s internal control over financial reporting and to determine whether such weaknesses, if any, have materially affected the Company’s financial statements The Special Committee engaged Bracewell & Giuliani LLP (“Bracewell”), as independent legal counsel, and Deloitte & Touche LLP (“Deloitte”), as independent forensic accountants, to assist in the investigation.
In July 2008, after an extensive document review and interviewing relevant current and former employees and vendors, Bracewell presented their report to the Special Committee. After consideration of the report, the Special Committee then met with the Board of Directors, at which meeting Bracewell also presented its report to the Board of Directors, to discuss the report and present the Special Committee’s recommendations.
After reviewing the report, the Special Committee and the Board of Directors concluded that they were not aware of any facts that caused them to believe that there was any material misstatement of the Company’s historical financial statements or in the financial statements proposed to be included in the Quarterly Report.
Furthermore, based on the Bracewell report, the Special Committee and the Board do not believe that the questions raised constituted a material weakness in the Company’s internal control over financial reporting. The Bracewell report, however, did identify certain control deficiencies and made recommendations, that have been adopted by the Board of Directors, to enhance the Company’s governance and control environment.
The Bracewell report noted some deficiencies in the Company’s manual process to record purchases and process expenditures, for both expense and capital expenditures. While there were certain compensating controls that mitigated the financial reporting risks associated with these deficiencies, the Bracewell report recommended that the Company implement a more effective systematic purchase order application integrated with the general ledger. Consistent with the recommendation in the Bracewell report, the Company intends to enhance its current process by expanding, upgrading, better systematizing and making prospective its current purchase order system.
The Bracewell report and the Special Committee’s review also noted the desirability to improve communications and more clearly delineate roles and responsibilities within the Company. As recommended in the Bracewell report, the Company has hired a general counsel and chief compliance officer, and intends to further define roles and responsibilities within the Company, and to undertake a series of training initiatives.
The Bracewell report also reviewed certain matters related to the Company’s Colombian operations. In light of the recent commencement of these operations and cultural and other issues involved in integrating them into the Company and its systems, including documentation procedures, the Bracewell report recommended, and the Board has already begun to focus on, additional oversight of these operations as the Company continues the intended expansion in this market.
Finally, the Board has directed management to consider and report back to the Board with respect to the implementation of additional controls and procedures. These include a disclosure committee comprised of representatives from operations, compliance and finance and accounting and a quarterly subcertification and management representation process with signoff by segment and service line operating executives and controllers, corporate accounting managers and other personnel involved in the financial reporting process. These processes should enhance internal accountability for our financial statements.
Management’s Report on Internal Control overOver Financial Reporting
The management of Pioneer Drilling Company is responsible for establishing and maintaining adequate internal control over financial reporting. Pioneer Drilling Company’s internal control over financial reporting is a process designed to provide reasonable assurance regarding the reliability of financial reporting and the preparation of financial statements for external purposes in accordance with generally accepted accounting principles. Pioneer Drilling Company’s internal control over financial reporting is a process designed to provide reasonable assurance regarding the reliability of financial reporting and the preparation of financial statements for external purposes in accordance with generally accepted accounting principles. A company’s internal control over financial reporting includes those policies and procedures thatthat: (1) pertain to the maintenance of records that, in reasonable detail, accurately and fairly reflect the transactions and dispositions of the assets of the company; (2) provide reasonable assurance that transactions are recorded as necessary to permit preparation of financial statements in accordance with generally accepted accounting principles, and that receipts and expenditures of the company are being made only in accordance with authorizations of management and directors of the company; and (3) provide reasonable assurance regarding prevention or timely detection of unauthorized acquisition, use, or disposition of the company’s assets that could have a material effect on the financial statements. Because of its inherent limitations, internal control over financial reporting may not prevent or detect misstatements. Also, projections of any evaluation of effectiveness to future periods are subject to the risk that controls may become inadequate because of changes in conditions, or that the degree of compliance with the policies or procedures may deteriorate.
Pioneer Drilling Company’s management assessed the effectiveness of thePioneer Drilling Company’s internal control over financial reporting as of MarchDecember 31, 2005.2008. In making this assessment, it used the criteria set forth by the Committee of Sponsoring Organizations of the Treadway Commission (COSO) in Internal Control-Integrated Framework. Based on our assessment we have concluded that, as of MarchDecember 31, 2005,2008, Pioneer Drilling Company’s internal control over financial reporting was effective based on those criteria.
Pioneer Drilling Company’sKPMG LLP, the independent registered public accounting firm that audited the consolidated financial statements of Pioneer Drilling Company included in this Annual Report on Form 10-K, has audited management’s assessment ofissued an attestation report on the effectiveness of Pioneer Drilling Company’s internal control over financial reporting as of MarchDecember 31, 2005, as stated in their report which appears herein. That2008. This report appears on page 31.57.
| Item 9B. | Other Information |
Not applicable.
PART III
In Items 10, 11, 12, 13 and 14 below, we are incorporating by reference the information we refer to in those Items from the definitive proxy statement for our 20052009 Annual Meeting of Shareholders. We intend to file that definitive proxy statement with the SEC by July 15, 2005.April 10, 2009.
Item 10.Directors and Executive Officers of the Registrant
| Item 10. | Directors, Executive Officers and Corporate Governance |
Please see the information appearing under the headings “Proposal No. 1—Election of Directors”Directors,” “Executive Officers,” “Information Concerning Meetings and “ExecutivesCommittees of the Board of Directors,” “Code of Conduct and Executive Compensation”Ethics” and “Section16(a) Beneficial Ownership Reporting Compliance” in the definitive proxy statement for our 20052009 Annual Meeting of Shareholders for the information this Item 10 requires.
Item 11.Executive Compensation
| Item 11. | Executive Compensation |
Please see the information appearing under the heading “Executivesheadings “Compensation Discussion and Analysis,” “Compensation of Directors,” “Compensation of Executive Compensation”Officers,” “Compensation Committee Interlocks and Insider Participation” and “Compensation Committee Report” in the definitive proxy statement for our 20052009 Annual Meeting of Shareholders for the information this Item 11 requires.
50
Item 12.Security Ownership of Certain Beneficial Owners and Management and Related Stockholder Matters
| Item 12. | Security Ownership of Certain Beneficial Owners and Management and Related Shareholder Matters |
Please see the information appearing (1) under the heading “Equity Compensation Plan Information” in Item 5 of Part II of this report and (2) under the heading “Security Ownership of Certain Beneficial Owners and Management” in the definitive proxy statement for our 20052009 Annual Meeting of Shareholders for the information this Item 12 requires.
Item 13.Certain Relationships and Related Transactions
| Item 13. | Certain Relationships and Related Transactions, and Director Independence |
Please see the information appearing under the headingheadings “Proposal 1—Election of Directors” and “Certain Relationships and Related Transactions” in the definitive proxy statement for our 20052009 Annual Meeting of Shareholders for the information this Item 13 requires.
Item 14.Principal Accountant Fees and Services
| Item 14. | Principal Accountant Fees and Services |
Please see the information appearing under the heading “Ratification“Proposal 2—Ratification of Appointment of Independent Auditors” in the definitive proxy statement for our 20052009 Annual Meeting of Shareholders for the information this Item 14 requires.
PART IV
| Item 15. | Exhibits and Financial Statement Schedules |
PART IV
Item 15.Exhibits,(1) Financial Statement Schedules and Reports on Form 8-KStatements.
(1)Financial Statements.
See Index to Consolidated Financial Statements on page 29.55.
(2)Financial Statement Schedules:Schedules.
No financial statement schedules are submitted because either they are inapplicable or because the required information is included in the consolidated financial statements or notes thereto.
Schedule II
| | Valuation and Qualifying Accounts | |
| | Balance
at
Beginning
of Year | | Charged
to Costs
and
Expenses | | Deductions
from
Accounts | | Balance
at
Year End | |
| | | | | | | | | |
Year ended March 31, 2003
Allowance for doubtful receivables | | $ | — | | $ | 110,000 | | $ | — | | $ | 110,000 | |
| | | | | | | | | |
Year ended March 31, 2004
Allowance for doubtful receivables | | $ | 110,000 | | $ | — | | $ | — | | $ | 110,000 | |
| | | | | | | | | |
Year ended March 31, 2005
Allowance for doubtful receivables | | $ | 110,000 | | $ | 242,000 | | $ | — | | $ | 342,000 | |
51
(3)Exhibits. The following exhibits are filed as part of this report:
| | | | |
Exhibit
Number |
| | |
|
| Description |
2.1* | | - | |
|
|
|
|
2.1
| | -
| | AssetSecurities Purchase Agreement, dated November 11, 2004 between Wolverine Drilling, Inc.January 31, 2008, by and Robert Mau, Robert S. Blackford andamong Pioneer Drilling Company, WEDGE Group Incorporated, WEDGE Energy Holdings, L.L.C., WEDGE Oil & Gas Services, Ltd.L.L.C., Timothy Daley, John Patterson and Patrick Grissom (Form 8-K dated November 11, 2004February 1, 2008 (File No. 1-8182, Exhibit 2.1)).
|
| | | | |
2.2
2.2* | | - | | | -
| | AssetLetter Agreement, dated February 29, 2008, amending the Securities Purchase Agreement, dated November 29,2004,January 31, 2008, by and among AllenPioneer Drilling Company, the Earl Allen Family Trust dated April 1, 1079, the sole shareholder of Allen Drilling Company, Dixon Allen, Paula K. HoisingtonWEDGE Group Incorporated, WEDGE Energy Holdings, L.L.C., WEDGE Oil & Gas Services, L.L.C., Timothy Daley, John Patterson and Lisa D. Johonnesson, all of the beneficiaries of the Trust, and Pioneer Drilling Services, Ltd.Patrick Grissom (Form 8-K dated November 30, 2004March 3, 2008 (File No. 1-8182m1-8182, Exhibit 2.1)).
|
| | | | |
3.1*
3.1 | | - | | | -
| | Restated Articles of Incorporation of Pioneer Drilling Company, as amended (Form 10-K for the year ended March 31, 2001 (File No. 1-8182, Exhibit 3.1)).Company. |
| | | | |
3.2* | | - | | Articles of Amendment to the Articles of Incorporation of Pioneer Drilling Company (Form 10-Q for the quarter ended September 30, 2001 (File No. 1-8182, Exhibit 3.1)).
|
| | | | |
3.3*
| | -
| | Amended and Restated Bylaws of Pioneer Drilling Company (Form 10-Q for the quarter ended8-K dated December 200315, 2008 (File No. 1-8182, Exhibit 3.3)3.1)). |
| | | | |
4.1* | | - | | Form of Certificate representing Common Stock of Pioneer Drilling Company (Form s-8S-8 filed November 18, 2003 (Reg. No. 333-110569, Exhibit 4.3)). |
| | | | |
4.2* | | - | | Form of Purchase Agreement dated February 13, 2004 between Pioneer Drilling Company and the several purchasers (Form s-3 filed February 24, 3004 (Reg. No. 333-113036, Exhibit 4.1)).
|
| | | | |
4.3*
| | -
| | Credit Agreement between Pioneer Drilling Services, Ltd. and Frost National Bank, as Administrative Agent, Agent, Lead Arranger and Lender dated October 29, 2004 (Form 8-K dated October 29,November 2, 2004 (File No. 1-8182, Exhibit 4.1)). |
| | | | |
10.1+*
4.3* | | - | | | -
| | Executive Employment AgreementSecond Amendment, dated May 1, 199511, 2005, to Credit Agreement between Pioneer Drilling Services, Ltd. and Frost National Bank, as Administrative Agent, Lead Arranger and Lender dated October 29, 2004 (Form 8-K dated May 13, 2005 (File No. 1-8182, Exhibit 4.1)).
|
| | |
| 4.4* | | - | | Third Amendment, dated October 25, 2005, to Credit Agreement between Pioneer Drilling Services, Ltd. and Frost National Bank, as Administrative Agent, Lead Arranger and Lender dated October 29, 2004 (Form 8-K dated October 28, 2005 (File No. 1-8182, Exhibit 4.1)). |
| | |
| 4.5* | | - | | Fourth Amendment, dated December 15, 2005, to Credit Agreement between Pioneer Drilling Services, Ltd. and Frost National Bank, as Administrative Agent, Lead Arranger and Lender dated October 29, 2004 (Form 8-K dated December 16, 2005 (File No. 1-8182, Exhibit 4.1)). |
| | |
| 4.6* | | - | | Fifth Amendment, dated October 30, 2006, to Credit Agreement between Pioneer Drilling Services, Ltd. and Frost National Bank, as Administrative Agent, Lead Arranger and Lender dated October 29, 2004 (Form 8-K dated October 31, 2006 (File No. 1-8182, Exhibit 4.1)). |
| | |
| 10.1+* | | - | | Pioneer Drilling Services, Ltd. Annual Incentive Compensation Plan dated August 5, 2005 (Form 8-K dated August 5, 2005 (File No. 1-8182, Exhibit 10.1)). |
| | |
| 10.2+* | | - | | Pioneer Drilling Company Amended and Wm. Stacy LockeRestated Key Executive Severance Plan dated December 10, 2007 (Form 10-K10-Q for the yearquarter ended March 31, 20012008 (File No. 1-8182, Exhibit 10.1+)10.4)). |
| | | | |
10.2+10.3+*
| | - | | | -
| | Second Amendment to Executive Employment Agreement dated August 21, 2000 between Pioneer Drilling Company and Wm. Stacy Locke (Form 10-K for the year ended March 31, 2001 (File No. 1-8182, Exhibit 10.4+)).
|
| | | | |
10.3+*
| | -
| | Pioneer Drilling Company’s 1995 Stock Plan and form of Stock Option Agreement (Form 10-K for the year ended March 31, 2001 (File No. 1-8182, Exhibit 10.5+)10.5)). |
| | | | |
10.4+* | | - | | | -
| | Pioneer Drilling Company’s 1999 Stock Plan and form of Stock Option Agreement (Form 10-K for the year ended March 31, 2001 (File No. 1-8182, Exhibit 10.7+)10.7)). |
| | | | |
10.5*
10.5+* | | - | | Pioneer Drilling Company 2003 Stock Plan (Form S-8 filed November 18, 2003 (File No. 333-110569, Exhibit 4.4)). |
| | | | |
10.6
10.6+* | | - | | | -
| | Termination Agreement dated May 26, 2005 between Michael E. Little, Wm. Stacy Locke,Amended and Restated Pioneer Drilling Company and WEDGE Energy Services, L.L.C.2007 Incentive Plan adopted May 16, 2008 (Form 10-Q for the quarter ended March 31, 2008 (File No. 1-8182, Exhibit 10.5)).
|
52
| | | | |
21.1Exhibit
Number
| | | | Description |
| 10.7+* | | - | | Joyce M. Schuldt Employment Letter, dated July 17, 2007 (Form 8-K dated July 18, 2007 (File No. 1-8182, Exhibit 10.1)). |
| | |
| 10.8+* | | - | | William D. Hibbetts Reassignment Letter, dated July 17, 2007 (Form 8-K dated July 18, 2007 (File No. 1-8182, Exhibit 10.2)). |
| | |
| 10.9+* | | - | | Pioneer Drilling Company Form of Indemnification Agreement (Form 8-K dated August 8, 2007 (File No. 1-8182, Exhibit 10.1)). |
| | |
| 10.10+* | | - | | Pioneer Drilling Company Employee Relocation Policy Executive Officers—Package A (Form 8-K dated August 8, 2007 (File No. 1-8182, Exhibit 10.3)). |
| | |
| 10.11* | | | | Credit Agreement, dated February 29, 2008, among Pioneer Drilling Company, as Borrower, and Wells Fargo Bank, N.A., as administrative agent, issuing lender, swing line lender and co-lead arranger, Fortis Bank SA/NV, New York Branch, as co-lead arranger, and each of the other parties listed therein (Form 8-K dated March 3, 2008 (File No. 1-8182, Exhibit 10.1)). |
| | |
| 10.12* | | | | Waiver Agreement, dated as of June 9, 2008, among Pioneer Drilling Company, the guarantors party thereto, Wells Fargo Bank, N.A., as administrative agent, issuing lender and swing line lender, and each of the other financial institutions party thereto (Form 8-K dated June 11, 2008 (File No. 1-8182, Exhibit 10.1)). |
| | |
| 10.13+* | | | | Employment Letter, effective March 1, 2008, from Pioneer Drilling Company to Joseph B. Eustace (Form 8-K dated March 5, 2008 (File No. 1-8182, Exhibit 10.1)). |
| | |
| 10.14+* | | | | Confidentiality and Non-Competition Agreement, dated February 29, 2008, by and between Pioneer Drilling Company, Pioneer Production Services, Inc. and Joe Eustace (Form 8-K dated March 5, 2008 (File No. 1-8182, Exhibit 10.2)). |
| | |
| 10.15+* | | | | Agreement between Joyce M. Schuldt and Pioneer Drilling Company, dated August 20, 2008 (Form 8-K dated August 21, 2008 (File No. 1-8182, Exhibit 10.1)). |
| | |
| 10.16* | | | | Pioneer Drilling Company 2007 Incentive Plan Form of Stock Option Agreement (Form 8-K dated September 4, 2008 (File No. 1-8182, Exhibit 10.1)). |
| | |
| 10.17* | | | | Pioneer Drilling Company 2007 Incentive Plan Form of Employee Restricted Stock Award Agreement (Form 8-K dated September 4, 2008 (File No. 1-8182, Exhibit 10.2)). |
| | |
| 10.18* | | | | Pioneer Drilling Company 2007 Incentive Plan Form of Non-Employee Director Restricted Stock Award Agreement (Form 8-K dated September 4, 2008 (File No. 1-8182, Exhibit 10.3)). |
| | |
| 10.19+* | | | | Employment Letter Agreement, effective January 7, 2009, from Pioneer Drilling Company to Lorne E. Phillips (Form 8-K dated January 14, 2009 (File No. 1-8182, Exhibit 10.1)). |
| | |
| 21.1 | | - | | Subsidiaries of Pioneer Drilling Company. |
| | | | |
23.1 | | - | | Consent of KPMG LLP.Independent Registered Public Accounting Firm. |
| | | | |
31.1 | | - | | Certification by Wm. Stacy Locke, President and Chief Executive Officer, pursuant to Rule 13a-14(a) or Rule 15d-14(a) under the Securities Exchange Act of 1934. |
| | | | |
31.2 | | - | | Certification by William D. Hibbetts, SeniorLorne E. Phillips, Executive Vice President and Chief Financial Officer, pursuant to Rule 13a-14(a) or Rule 15d-14(a) under the Securities Exchange Act of 1934. |
| | | | |
32.1 | | - | | Certification by Wm. Stacy Locke, President and Chief Executive Officer, pursuant to Section 906 of the Sarbanes-Oxley Act of 2002 (Subsections (a) and (b) of Section 1350, Chapter 63 of Title 18, United States Code). |
| | | ��
| |
32.2 | | - | | Certification by William D. Hibbetts, SeniorLorne E. Phillips, Executive Vice President and Chief Financial Officer, pursuant to Section 906 of the Sarbanes-Oxley Act of 2002 (Subsections (a) and (b) of Section 1350, Chapter 63 of Title 18, United States Code). |
| * | *Incorporated by reference to the filing indicated.
|
| + | Management contract or compensatory plan or arrangement. |
+SIGNATURES Management contract or compensatory plan or arrangement.
53
SIGNATURES
Pursuant to the requirements of Section 13 or 15(d) of the Securities Exchange Act of 1934, the registrant has duly caused this report to be signed on its behalf by the undersigned, thereunto duly authorized.
| | |
| | PIONEER DRILLING COMPANY |
| |
February 25, 2009 | | By: /s/ WM. STACY LOCKE |
June 1, 2005
| | By:
| /s/ Wm. Stacy Locke
| |
| | Wm. Stacy Locke
|
| | Chief Executive Officer and President |
Pursuant to the requirements of the Securities Exchange Act of 1934, this report has been signed below by the following persons on behalf of the registrant and in the capacities and on the dates indicated.
| | | | |
Signature | | Title | Title
|
| Date |
|
/s/ DEAN A. BURKHARDT | | | | | |
/s/ Michael E. Little
| | | | | | |
Michael E. Little
| | | Chairman | | June 1, 2005
February 25, 2009 |
| Dean A. Burkhardt | | |
| | |
/s/ WM. STACY LOCKE | | | | | | |
/s/ Wm. Stacy Locke
| | | | | | |
Wm. Stacy Locke
| | | President, Chief Executive Officer and
Director (Principal Executive Officer) | | June 1, 2005
February 25, 2009 |
| Wm. Stacy Locke | | |
| | |
/s/ LORNE E. PHILLIPS | | Executive Vice President and Chief Financial Officer | | February 25, 2009 |
| Lorne E. Phillips | | |
| | |
/s/ William D. HibbettsC. JOHN THOMPSON | | | | | | |
William D. Hibbetts
| | | Senior Vice President, Chief Financial
Officer and Secretary (Principal Financial
and Accounting Officer)
| | June 1, 2005
| |
| | | | | | |
| | | | | | |
C. John Thompson
| | | Director | | June 1, 2005
February 25, 2009 |
| C. John Thompson | | |
| | |
/s/ JOHN MICHAEL RAUH | | | | | | |
| | | | | | |
/s/ James M. Tidwell
| | | | | | |
James M. Tidwell
| | | Director | | June 1, 2005
February 25, 2009 |
| John Michael Rauh | | |
| | |
/s/ SCOTT D. URBAN | | | | | | |
| | | | | | |
/s/ C. Robert Bunch
| | | | | | |
C. Robert Bunch
| | | Director | | February 25, 2009 |
| Scott D. Urban | | |
| | | | |
Exhibit
Number | June 1, 2005
| | | Description |
| 2.1* | | - | | | | | | | |
| | | | | | |
/s/ Dean A. Burkhardt
| | | | | | |
Dean A. Burkhardt
| | | Director
| | June 1, 2005
| |
| | | | | | |
| | | | | | |
/s/ Michael F. Harness
| | | | | | |
Michael F. Harness
| | | Director
| | June 1, 2005
| |
54
Index To Exhibits
2.1
| | -
| | AssetSecurities Purchase Agreement, dated November 11, 2004 between Wolverine Drilling, Inc.January 31, 2008, by and Robert Mau, Robert S. Blackford andamong Pioneer Drilling Company, WEDGE Group Incorporated, WEDGE Energy Holdings, L.L.C., WEDGE Oil & Gas Services, Ltd.L.L.C., Timothy Daley, John Patterson and Patrick Grissom (Form 8-K dated November 11, 2004February 1, 2008 (File No. 1-8182, Exhibit 2.1)).
|
| | | | |
2.2
2.2* | | - | | | -
| | AssetLetter Agreement, dated February 29, 2008, amending the Securities Purchase Agreement, dated November 29,2004,January 31, 2008, by and among AllenPioneer Drilling Company, the Earl Allen Family Trust dated April 1, 1079, the sole shareholder of Allen Drilling Company, Dixon Allen, Paula K. HoisingtonWEDGE Group Incorporated, WEDGE Energy Holdings, L.L.C., WEDGE Oil & Gas Services, L.L.C., Timothy Daley, John Patterson and Lisa D. Johonnesson, all of the beneficiaries of the Trust, and Pioneer Drilling Services, Ltd.Patrick Grissom (Form 8-K dated November 30, 2004March 3, 2008 (File No. 1-8182m1-8182, Exhibit 2.1)).
|
| | | | |
3.1*
3.1 | | - | | | -
| | Restated Articles of Incorporation of Pioneer Drilling Company, as amended (Form 10-K for the year ended March 31, 2001 (File No. 1-8182, Exhibit 3.1)).Company. |
| | | | |
3.2* | | - | | Articles of Amendment to the Articles of Incorporation of Pioneer Drilling Company (Form 10-Q for the quarter ended September 30, 2001 (File No. 1-8182, Exhibit 3.1)).
|
| | | | |
3.3*
| | -
| | Amended and Restated Bylaws of Pioneer Drilling Company (Form 10-Q for the quarter ended8-K dated December 200315, 2008 (File No. 1-8182, Exhibit 3.3)3.1)). |
| | | | |
4.1* | | - | | Form of Certificate representing Common Stock of Pioneer Drilling Company (Form S-8 filed November 18, 2003 (Reg. No. 333-110569, Exhibit 4.3)). |
| | | | |
4.2* | | - | | Form of Purchase Agreement dated February 13, 2004 between Pioneer Drilling Company and the several purchasers (Form S-3 filed February 24, 2004 (Reg. No. 333-113036, Exhibit 4.1)).
|
| | | | |
4.3
| | -
| | Credit Agreement between Pioneer Drilling Services, Ltd. and Frost National Bank, as Administrative Agent, Agent, Lead Arranger and Lender dated October 29, 2004 (Form 8-K dated October 29,November 2, 2004 (File No. 1-8182, Exhibit 4.1)). |
| | | | |
10.1+*
4.3* | | - | | | -
| | Executive Employment AgreementSecond Amendment, dated May 1, 199511, 2005, to Credit Agreement between Pioneer Drilling Services, Ltd. and Frost National Bank, as Administrative Agent, Lead Arranger and Lender dated October 29, 2004 (Form 8-K dated May 13, 2005 (File No. 1-8182, Exhibit 4.1)).
|
| | |
| 4.4* | | - | | Third Amendment, dated October 25, 2005, to Credit Agreement between Pioneer Drilling Services, Ltd. and Frost National Bank, as Administrative Agent, Lead Arranger and Lender dated October 29, 2004 (Form 8-K dated October 28, 2005 (File No. 1-8182, Exhibit 4.1)). |
| | |
| 4.5* | | - | | Fourth Amendment, dated December 15, 2005, to Credit Agreement between Pioneer Drilling Services, Ltd. and Frost National Bank, as Administrative Agent, Lead Arranger and Lender dated October 29, 2004 (Form 8-K dated December 16, 2005 (File No. 1-8182, Exhibit 4.1)). |
| | |
| 4.6* | | - | | Fifth Amendment, dated October 30, 2006, to Credit Agreement between Pioneer Drilling Services, Ltd. and Frost National Bank, as Administrative Agent, Lead Arranger and Lender dated October 29, 2004 (Form 8-K dated October 31, 2006 (File No. 1-8182, Exhibit 4.1)). |
| | |
| 10.1+* | | - | | Pioneer Drilling Services, Ltd. Annual Incentive Compensation Plan dated August 5, 2005 (Form 8-K dated August 5, 2005 (File No. 1-8182, Exhibit 10.1)). |
| | |
| 10.2+* | | - | | Pioneer Drilling Company Amended and Wm. Stacy LockeRestated Key Executive Severance Plan dated December 10, 2007 (Form 10-K10-Q for the yearquarter ended March 31, 20012008 (File No. 1-8182, Exhibit 10.1+)10.4)). |
| | | | |
10.2+10.3+*
| | - | | | -
| | Second Amendment to Executive Employment Agreement dated August 21, 2000 between Pioneer Drilling Company and Wm. Stacy Locke (Form 10-K for the year ended March 31, 2001 (File No. 1-8182, Exhibit 10.4+)).
|
| | | | |
10.3+*
| | -
| | Pioneer Drilling Company’s 1995 Stock Plan and form of Stock Option Agreement (Form 10-K for the year ended March 31, 2001 (File No. 1-8182, Exhibit 10.5+)10.5)). |
| | | | |
10.4+* | | - | | | -
| | Pioneer Drilling Company’s 1999 Stock Plan and form of Stock Option Agreement (Form 10-K for the year ended March 31, 2001 (File No. 1-8182, Exhibit 10.7+)10.7)). |
| | | | |
10.5*
10.5+* | | - | | Pioneer Drilling Company 2003 Stock Plan (Form S-8 filed November 18, 2003 (File No. 333-110569, Exhibit 4.4)). |
| | | | |
10.6
10.6+* | | - | | | -
| | Termination Agreement date May 26, 2005 between Michael E. Little, Wm. Stacy Locke,Amended and Restated Pioneer Drilling Company and WEDGE Energy Services, L.L.C.2007 Incentive Plan adopted May 16, 2008 (Form 10-Q for the quarter ended March 31, 2008 (File No. 1-8182, Exhibit 10.5)).
|
| | |
| 10.7+* | | - | | Joyce M. Schuldt Employment Letter, dated July 17, 2007 (Form 8-K dated July 18, 2007 (File No. 1-8182, Exhibit 10.1)). |
| | | | |
Exhibit
Number | | | | | | Description |
21.1
10.8+* | | - | | William D. Hibbetts Reassignment Letter, dated July 17, 2007 (Form 8-K dated July 18, 2007 (File No. 1-8182, Exhibit 10.2)). |
| | |
| 10.9+* | | - | | Pioneer Drilling Company Form of Indemnification Agreement (Form 8-K dated August 8, 2007 (File No. 1-8182, Exhibit 10.1)). |
| | |
| 10.10+* | | - | | Pioneer Drilling Company Employee Relocation Policy Executive Officers – Package A (Form 8-K dated August 8, 2007 (File No. 1-8182, Exhibit 10.3)). |
| | |
| 10.11* | | | | Credit Agreement, dated February 29, 2008, among Pioneer Drilling Company, as Borrower, and Wells Fargo Bank, N.A., as administrative agent, issuing lender, swing line lender and co-lead arranger, Fortis Bank SA/NV, New York Branch, as co-lead arranger, and each of the other parties listed therein (Form 8-K dated March 3, 2008 (File No. 1-8182, Exhibit 10.1)). |
| | |
| 10.12* | | | | Waiver Agreement, dated as of June 9, 2008, among Pioneer Drilling Company, the guarantors party thereto, Wells Fargo Bank, N.A., as administrative agent, issuing lender and swing line lender, and each of the other financial institutions party thereto (Form 8-K dated June 11, 2008 (File No. 1-8182, Exhibit 10.1)). |
| | |
| 10.13+* | | | | Employment Letter, effective March 1, 2008, from Pioneer Drilling Company to Joseph B. Eustace (Form 8-K dated March 5, 2008 (File No. 1-8182, Exhibit 10.1)). |
| | |
| 10.14+* | | | | Confidentiality and Non-Competition Agreement, dated February 29, 2008, by and between Pioneer Drilling Company, Pioneer Production Services, Inc. and Joe Eustace (Form 8-K dated March 5, 2008 (File No. 1-8182, Exhibit 10.2)). |
| | |
| 10.15+* | | | | Agreement between Joyce M. Schuldt and Pioneer Drilling Company, dated August 20, 2008 (Form 8-K dated August 21, 2008 (File No. 1-8182, Exhibit 10.1)). |
| | |
| 10.16* | | | | Pioneer Drilling Company 2007 Incentive Plan Form of Stock Option Agreement (Form 8-K dated September 4, 2008 (File No. 1-8182, Exhibit 10.1)). |
| | |
| 10.17* | | | | Pioneer Drilling Company 2007 Incentive Plan Form of Employee Restricted Stock Award Agreement (Form 8-K dated September 4, 2008 (File No. 1-8182, Exhibit 10.2)). |
| | |
| 10.18* | | | | Pioneer Drilling Company 2007 Incentive Plan Form of Non-Employee Director Restricted Stock Award Agreement (Form 8-K dated September 4, 2008 (File No. 1-8182, Exhibit 10.3)). |
| | |
| 10.19+* | | | | Employment Letter Agreement, effective January 7, 2009, from Pioneer Drilling Company to Lorne E. Phillips (Form 8-K dated January 14, 2009 (File No. 1-8182, Exhibit 10.1)). |
| | |
| 21.1 | | - | | Subsidiaries of Pioneer Drilling Company. |
| | | | |
23.1 | | - | | Consent of KPMG LLP.Independent Registered Public Accounting Firm. |
55
31.1
| | -
|
| 31.1 | | - | | Certification by Wm. Stacy Locke, President and Chief Executive Officer, pursuant to Rule 13a-14(a) or Rule 15d-14(a) under the Securities Exchange Act of 1934. |
| | | | |
31.2 | | - | | Certification by William D. Hibbetts, SeniorLorne E. Phillips, Executive Vice President and Chief Financial Officer, pursuant to Rule 13a-14(a) or Rule 15d-14(a) under the Securities Exchange Act of 1934. |
| | | | |
32.1 | | - | | Certification by Wm. Stacy Locke, President and Chief Executive Officer, pursuant to Section 906 of the Sarbanes-Oxley Act of 2002 (Subsections (a) and (b) of Section 1350, Chapter 63 of Title 18, United States Code). |
| | | | |
32.2 | | - | | Certification by William D. Hibbetts, SeniorLorne E. Phillips, Executive Vice President and Chief Financial Officer, pursuant to Section 906 of the Sarbanes-Oxley Act of 2002 (Subsections (a) and (b) of Section 1350, Chapter 63 of Title 18, United States Code). |
| * | *Incorporated by reference to the filing indicated.
|
| + | Management contract or compensatory plan or arrangement. |
+ Management contract or compensatory plan or arrangement.94
56