QuickLinks-- Click here to rapidly navigate through this document
UNITED STATES
SECURITIES AND EXCHANGE COMMISSION
Washington, D.C. 20549
FORM 10-K
x
ý | | ANNUAL REPORT PURSUANT TO SECTION 13 OR 15(d) OF THE SECURITIES EXCHANGE ACT OF 1934 |
| |
For the fiscal year ended December 31, 20052007
|
Or
| | or
|
o
| |
TRANSITION REPORT PURSUANT TO SECTION 13 OR 15(d) OF THE SECURITIES EXCHANGE ACT OF 1934
|
Commission file number 001-11499
WATTS WATER TECHNOLOGIES, INC.
(Exact name of registrant as specified in its charter)
Delaware | | 04-2916536
|
(State or Other Jurisdiction of
| | (I.R.S. Employer
|
Incorporation or Organization)
| | 04-2916536
(I.R.S. Employer
Identification No.) |
815 Chestnut Street, North Andover, MA
| | 01845
|
(Address of Principal Executive Offices)
|
|
01845
(Zip Code)
|
Registrant's telephone number, including area code:(978) 688-1811 |
Securities registered pursuant to Section 12(b) of the Act: |
Title of Each Class
|
|
Name of Each Exchange on Which Registered
|
| Class A Common Stock, par value $0.10 per share | | New York Stock Exchange |
Registrant’s telephone number, including area code: (978) 688-1811
Securities registered pursuant to Section 12(b) of the Act:
Class A Common Stock, par value $.10 per share
Name of exchange on which registered: New York Stock Exchange
Securities registered pursuant to Section 12(g) of the Act:None
Indicate by check mark if the registrant is a well-known seasoned issuer, as defined in Rule 405 of the Securities Act. Yes ýx No o
Indicate by check mark if the registrant is not required to file reports pursuant to Section 13 or Section 15(d) of the Exchange Act. Yes o No ýx
Indicate by check mark whether the Registrantregistrant (1) has filed all reports required to be filed by Section 13 or 15(d) of the Securities Exchange Act of 1934 during the preceding 12 months (or for such shorter period that the Registrantregistrant was required to file such reports), and (2) has been subject to such filing requirements for the past 90 days. Yes ýx No o
Indicate by check mark if disclosure of delinquent filers pursuant to Item 405 of Regulation S-K is not contained herein, and will not be contained, to the best of Registrant’sregistrant's knowledge, in definitive proxy or information statements incorporated by reference in Part III of this Form 10-K or any amendment to this Form 10-K. o
Indicate by check mark whether the registrant is a large accelerated filer, an accelerated filer, a non-accelerated filer, or a non-accelerated filer.smaller reporting company. See definitionthe definitions of “accelerated"large accelerated filer," "accelerated filer" and large accelerated filer”"smaller reporting company" in Rule 12b-2 of the Exchange Act. (Check one):
| Large accelerated filerý | | Accelerated filero |
Non-accelerated filero |
|
Smaller reporting companyo |
(Do not check if a smaller reporting company) |
Large Accelerated filer x Accelerated filer o Non-accelerated filer o
Indicate by check mark whether the registrant is a shell company (as defined in Rule 12b-2 of the Exchange Act). Yes o No ýx
As of July 1, 2005,June 29, 2007, the aggregate market value of the registrant’sregistrant's common stock held by non-affiliates of the registrant was $841,377,634approximately $1,170,291,367 based on the closing sale price as reported on the New York Stock Exchange.
Indicate the number of shares outstanding of each of the issuer’sissuer's classes of common stock, as of the latest practicable date.
Class
| | Outstanding at February 22, 20062008
|
Class A Common Stock, $0.10 par value per share | | 25,270,70029,272,927 shares
|
Class B Common Stock, $0.10 par value per share | | 7,343,8807,293,880 shares
|
DOCUMENTS INCOPORATED BY REFERENCE
Portions of the Registrant’sRegistrant's Proxy Statement for its Annual Meeting of Stockholders to be held on May 4, 2006,14, 2008, are incorporated by reference into Part III of this Annual Report on Form 10-K.
PART I
Item 1.BUSINESSBUSINESS..
This annual report on Form 10-K contains statements which are not historical facts and are considered forward-looking within the meaning of the Private Securities Litigation Reform Act of 1995. These forward-looking statements contain projections of our future results of operations or our financial position or state other forward-looking information. In some cases you can identify these statements by forward-looking words such as “anticipate,” “believe,” “could,” “estimate,” “expect,” “intend,” “may,” “should,” “will”"anticipate," "believe," "could," "estimate," "expect," "intend," "may," "should," "will" and “would”"would" or similar words. You should not rely on forward-looking statements, because they involve known and unknown risks, uncertainties and other factors, some of which are beyond our control. These risks, uncertainties and other factors may cause our actual results, performance or achievements to differ materially from the anticipated future results, performance or achievements expressed or implied by the forward-looking statements. Some of the factors that might cause these differences are described under Item 1A—“"Risk Factors.”" You should carefully review all of these factors, and you should be aware that there may be other factors that could cause these differences. These forward-looking statements were based on information, plans and estimates at the date of this report, and, except as required by law, we undertake no obligation to update any forward-looking statements to reflect changes in underlying assumptions or factors, new information, future events or other changes.
In this annual report on Form 10-K, references to “the"the Company,” “Watts,” “we,” “us”" "Watts," "we," "us" or “our”"our" refer to Watts Water Technologies, Inc. and its consolidated subsidiaries.
Overview
Watts Regulator Co. was founded by Joseph E. Watts in 1874 in Lawrence, Massachusetts. Watts Regulator Co. started as a small machine shop supplying parts to the New England textile mills of the 19th century and grew into a global manufacturer of products and systems focused on the control, conservation and quality of water and the comfort and safety of the people using it. Watts Water Technologies, Inc. was incorporated in Delaware in 1985 and became the parent Company of Watts Regulator Co.
Our “Water"Water by Watts”Watts" strategy is to be the leading provider of water quality, water conservation, water safety and water flow control products for the residential and commercial markets in North America and Europe.Europe with an emerging presence in China. Our primary objective is to grow earnings by increasing sales within existing markets, expanding into new markets, leveraging our distribution channels and customer base, making selected acquisitions, and reducing manufacturing costs.costs and advocating for the development and enforcement of industry standards.
We intend to continue to introduce products in existing markets by enhancing our preferred brands, developing new complementary products, promoting plumbing code development to drive sales of safety and water quality products and continuouslycontinually improving merchandising in both the wholesaledo-it-yourself (DIY) and do-it-yourself (DIY)wholesale distribution channels. We alsocontinually target selected new product and geographic markets based on growth potential, and intendincluding our ability to continue to introduceleverage our existing distribution channels. Additionally, we continually leverage our distribution channels through the introduction of new products, appropriate for these new markets.as well as the integration of products of our acquired companies.
We intend to continue to generate additional growth throughby targeting selected acquisitions, both in our core markets as well as in new complementary markets. For example,We have completed 31 acquisitions since divesting our recently acquired subsidiary, Dormont Manufacturing Company, provides flexible stainless steel connectors for naturalindustrial and liquid propaneoil and gas business in 1999, including one acquisition in 2007 and fluid conveyance applications tofive acquisitions in 2006. Our acquisition strategy focuses on businesses that manufacture preferred brand name products that address our themes of water quality, water safety, water conservation, water flow control and related complementary markets. We target businesses that will provide us with one or more of the following: an entry into new markets, an increase in shelf space with existing customers, instrong brand names, a new or improved technology or an expansion of the commercial foodservice, residential, and appliance original equipment manufacturers (OEMs) markets. Lastly, webreadth of our Water by Watts offering.
We are committed to reducing our manufacturing costs through a combination of expanding manufacturing in lower costlower-cost countries and consolidating our diverse manufacturing operations in North America and Europe. We have acquired a number of manufacturing facilities in lower-cost regions such as China, Bulgaria and Tunisia. In 2007, we announced a global restructuring plan to reduce our manufacturing footprint in order to reduce our costs and to realize additional operating efficiencies.
Our products are sold to wholesale distributors, major DIY chains and OEMs.original equipment manufacturers (OEMs). Most of our sales are for products that have been approved under regulatory standards incorporated into state and municipal plumbing, heating, building and fire protection codes in North America and Europe. We have consistently advocate foradvocated the development and enforcement of plumbing codes and are committed to providing products to meet these standards, particularly for safety and control valve products. We maintain quality control and testing
procedures at each of our manufacturing facilitiesThese codes serve as a competitive barrier to entry by requiring that products sold in order to manufacture products in compliance with code requirements.select states meet stringent criteria.
Additionally, a majority of our manufacturing facilities are ISO 9000, 9001 or 9002 certified by the International Organization for Standardization.
Our business is reported in three geographic segments: North America, Europe and China. The contributions of each segment to net sales, operating income and the presentation of certain other financial information by segment are reported in Note 17 of the Notes to Consolidated Financial Statements and in Management’sManagement's Discussion and Analysis included elsewhere in this report.
Recent Acquisitions
On December 28, 2005,November 9, 2007, we acquired 100%the assets and business of the stock of Dormont Manufacturing Company (Dormont)Topway Global Inc. (Topway) located in Export, Pennsylvania,Brea, California for approximately $94.9$18.4 million, net of cash acquiredwhich $0.3 million of approximately $1.5 million.transaction costs remain to be paid. The preliminary allocations for goodwill and intangible assets are approximately $43.2$7.6 million and $35.9$8.2 million, respectively. The amount recorded as intangible assets is primarily for customer relationships with an estimated useful life of 10 years and trade names with indefinite lives. Topway manufactures a wide variety of water softeners, point of entry filter units, and point of use drinking water systems for residential, commercial and industrial applications. The purchase price allocation for Topway is preliminary pending the final determination of the fair values of certain assumed assets and liabilities.
On August 14, 2006, we acquired 100% of the outstanding stock of Black Teknigas, Limited (Teknigas) located in St. Neots, United Kingdom for approximately $8.7 million, which is net of cash acquired of approximately $0.3 million. The allocations for goodwill and intangible assets are approximately $3.6 million and $4.5 million, respectively. The amount recorded as intangible assets is primarily for technology and customer relationships that have estimated useful lives ranging from 6 to 9 years and trade names with indefinite lives. Teknigas designs, develops and manufactures a range of gas control products and systems for combustion, industrial, medical, laboratory and specialty gas.
On June 7, 2006, we acquired 100% of the outstanding stock of Kim Olofsson Safe Corporation AB (KimSafe) located in Almhult, Sweden for approximately $5.8 million, which is net of cash acquired of approximately $2.9 million. The allocations for goodwill and intangible assets are approximately $1.2 million and $4.1 million, respectively. The amount recorded as intangible assets is primarily for customer relationships that have estimated 13-yearuseful lives of 5 years and trade names with indefinite lives. Dormont provides flexible stainless steel connectors KimSafe manufactures electronic controls for naturalheat pump, solar and liquid propane gas. Dormont works with appliance OEM’spellet heaters, which provide the ability to provide internal component assemblies and private label gas connectors, which are sold under the OEM brand with the appliance in multiple leading retail chains. Dormont also supplies residential gas connectors through multiple trade channels and home improvement retailers. Dormont provides a core-plumbing product which is complimentary to our existingheat water product lines.using renewable energy.
On DecemberJune 2, 2005, we acquired 100% of the stock of Core Industries Inc. (Core) from SPX Corporation for approximately $45.0 million in cash. Core consists of FEBCO, Mueller Steam Specialty and Polyjet Valves product lines. The preliminary allocations for goodwill and intangible assets are approximately $11.3 million and $14.5 million, respectively. The amount recorded as intangible assets is primarily for trade names with indefinite lives and customer relationships that have estimated 12-year lives. FEBCO is a manufacturer of backflow prevention valves and has a strong presence in both residential and commercial landscape irrigation. Mueller Steam Specialty allows us to expand into large diameter commercial strainers and check valves. Polyjet Valves offers a customized sleeve valve, which is used in severe service applications to provide precise flow and pressure control. We expect that this acquisition will allow us to offer a broader product line, improve operating efficiencies and provide better customer service.
On November 4, 2005,2006, we acquired the assets and business of Flexflow Tubing LLP (Flexflow),Calflex Manufacturing, Inc. (Calflex) located in Langley, British Columbia, CanadaVernon, California and the stock of Ningo Best Metal & Plastic Manufacturing, Ltd (Ningbo) located in Ningbo, China for an aggregate of approximately $6.2$6.3 million. The purchase agreement contains an earn-out provision to be calculated over a five-year period ending December 31, 2010. Earn-out payments under the purchase agreement, if any, will not exceed $4.3 million and will be treated as additional purchase price. Flexflow manufactures pex tubingallocation for potable and non-potable applications. The preliminary allocations for goodwill and intangible assets areis approximately $3.2 million and $0.9 million, respectively.$2.1 million. The amount recorded as intangible assets is primarily for customer relationships that have estimated 12-yearuseful lives of 12 years and trade names with indefinite lives. The acquisition of Flexflow is consistent with our strategy to increase our presence in the under floor radiant heatingCalflex and potableNingbo distribute and manufacture water markets. This acquisition allows us to expand our presence in the market for flexible pex pipes for hot and cold-water transport.connectors.
On July 8, 2005,May 19, 2006, we acquired the water connector business100% of the Donald E. Savard Company (Savard)outstanding stock of ATS Expansion Group (ATS) located in an asset purchase transactionSorgues, Grenoble and Hautvillers, France for approximately $3.7$62.1 million, which is net of cash acquired of approximately $5.7 million plus assumed debt of approximately $14.1 million. The allocations for goodwill and intangible assets are approximately $1.4$33.6 million and $1.8 million, respectively. The amount recorded as intangible assets is primarily for trade names with indefinite lives and customer relationships that have 14-year lives. The acquisition of the water connector business of Savard is consistent with our theme of
water safety and control. This acquisition allows us to expand our presence in one of our leading product lines with a brand name that is well known to the plumbing wholesale market.
On July 5, 2005, we acquired 100% of the outstanding stock of Microflex N.V. (Microflex) located in Rotselaar, Belgium for approximately $14.9 million net of cash acquired of approximately $0.9 million. The allocations for goodwill and intangible assets are approximately $6.5 million and $5.3$25.6 million, respectively. The amount recorded as intangible assets is primarily for customer relationships that have 7-yearwith estimated useful lives of 6 years, patents with estimated useful lives from 6 to 12 years and trade names that havewith indefinite lives. Microflex produces and distributes flexible, pre-insulated, pex pipes for hot and cold-water transport, as well asATS' products include a broad range of accessory products including couplings, caps,fittings, valves and insulation kits in the HVACmanifolds for water, gas and water protection markets.heating applications and stainless steel flexible hoses.
On June 20, 2005,April 26, 2006, we acquired the water softenerassets and business of Alamo Water Refiners, Inc. (Alamo)Changsha Valve Works (Changsha) located in San Antonio, Texas in an asset purchase transactionChangsha, China for approximately $5.1 million. The allocation for intangible assets is approximately $0.3 million and is primarily for the trade name with an indefinite life. There was no allocation to goodwill. The water softener products of Alamo are consistent with our theme of water quality and provide many synergistic opportunities when utilized in conjunction with our existing water filtration and water quality businesses. The acquisition of Alamo also expands our distribution presence into the southwestern U.S. markets.
On May 11, 2005, we acquired 100% of the outstanding stock of Electro Controls Ltd. (Electro Controls) located in Hounslow, United Kingdom for approximately $11.7 million net of cash acquired of approximately $5.0$9.2 million. The allocations for goodwill and intangible assets are approximately $5.8$5.7 million and $0.3$3.7 million, respectively. The amount recorded as intangible assets is primarily for trade namesnon-compete agreements that have indefinite lives. Electro Controls designsestimated useful lives of 10 years and assemblescustomer order backlog with an estimated useful life of 1 year. Changsha is a rangeleading manufacturer of electrical controlslarge diameter hydraulic-actuated butterfly valves for the HVAC market, with sales primarilythermo-power and hydro-power plants, water distribution projects and water works projects in the United Kingdom.China.
On January 5, 2005, we acquired 100% of the outstanding stock of HF Scientific, Inc. (HF) located in Fort Myers, Florida for approximately $7.3 million in cash plus $0.8 million in assumed debt. The allocations for goodwill and intangible assets are approximately $4.2 million and $2.7 million, respectively. The amount recorded as intangible assets is primarily for customer relationships that have 15-year lives and trade names that have indefinite lives. HF manufactures and distributes a line of instrumentation equipment, test kits and chemical reagents used for monitoring water quality in a variety of applications.Products
On January 4, 2005, we acquired substantially all of the assets of Sea Tech, Inc. (Sea Tech) located in Wilmington, North Carolina for approximately $10.1 million in cash. The purchase agreement contains an earn-out provision to be calculated on a cumulative basis over a three-year period ending December 31, 2007. Payments under the agreement, if any, will not exceed $5,000,000 and will be treated as additional purchase price. The allocations for goodwill and intangible assets are approximately $6.5 million and $3.0 million, respectively. The amount recorded as intangible assets is primarily for customer relationships that have 15-year lives and trade names that have indefinite lives. Sea Tech provides cost-effective solutions for fluidic connection needs. Sea Tech offers a wide range of standard and custom quick connect fittings, valves and manifolds and pex tubing designed to address specific customer requirements.
Products
We believe that we have the broadest range of products in terms of design distinction, size and configuration withinin a majority of theour principal product lines we manufacture and market.lines. In 2007, water quality products accounted for approximately 18% of our total sales. Our principal product lines include:
·
- •
- water quality products, including backflow preventers and check valves for preventing
contamination of potable water caused by reverse flow within water supply lines and fire protection systems;·systems and point-of-use water filtration and reverse osmosis systems for both commercial and residential applications;
- •
- a wide range of water pressure regulators for both commercial and residential applications;
·
- •
- water supply and drainage products for commercial and residential applications;
·
- •
- temperature and pressure relief valves for water heaters, boilers and associated systems;
· point-of-use water filtration and reverse osmosis systems for both commercial and residential applications;
·
- •
- thermostatic mixing valves for tempering water in commercial and residential applications;
·
- •
- systems for under-floor radiant applications and hydraulic pump groups for gas boiler
manufacturers;manufacturers and· renewable energy applications, including solar and heat pump control packages;
- •
- flexible stainless steel connectors for natural and liquid propane gas in commercial food service and residential
applications.applications; and
- •
- large diameter butterfly valves for use in China's water infrastructure.
Customers and Markets
We sell our products to plumbing, heating and mechanical wholesale distributors, major DIY chains and OEMs.
Wholesalers.Approximately 64% and 63%65% of our sales in 2005both 2007 and 2004, respectively,2006 were to wholesale distributors for both commercial and residential applications. We rely on commissioned manufacturers’manufacturers' representatives, some of which maintain a consigned inventory of our products, to market our product lines.
DIY.Approximately 18%15% and 16% of our sales in both 20052007 and 20042006, respectively, were to DIY customers in North America.customers. Our DIY customers demand less technical products, but are highly receptive to innovative designs and new product ideas. Our DIY sales over the past several years have increased as a result of our development of unique new products and successful merchandising efforts and the expansion of the market with the large national chains.
OEMs.Approximately 18%20% and 19% of our sales in 20052007 and 2004,2006, respectively, were to OEMs in both North America and Europe.OEMs. In North America, our typical OEM customers are water heater manufacturers, equipment manufacturers needing flow control devices and water systems manufacturers needing backflow preventers. Our sales to OEMs in Europe are primarily to boiler manufacturers and radiant systems manufacturers. Our sales to OEMs in China are primarily to boiler and bath manufacturers, which include manufacturers of faucet and shower products.
In 2007, no customer accounted for more than 10% of our total net sales. Our largest customer, The Home Depot, Inc. and its subsidiaries,top ten customers accounted for approximately $98.5$304.3 million, or 10.7%22%, of our total net sales in 20052007 and $84.5$282.3 million, or 10.3 %, of our total net sales in 2004. Our top ten customers accounted for approximately $238.1 million, or 25.8%23%, of our total net sales in 2005 and $201.7 million, or 24.5%, of our total net sales in 2004.2006. Thousands of other customers constituted the remaining 74.2%78% of our net sales in 20052007 and 75.5%77% of our net sales in 2004.2006.
Marketing and Sales
We rely primarily on commissioned manufacturers’manufacturers' representatives, some of which maintain a consigned inventory of our products. These representatives sell primarily to plumbing and heating wholesalers or service DIY store locations in North America. We also sell products for the residential construction and home repair and remodeling industries through DIY plumbing retailers, national catalog distribution companies, hardware stores, building material outlets and retail home center chains and through plumbing and heating wholesalers. In addition, we sell products directly to certain large OEMs and private label accounts.
Manufacturing
We have integrated and automated manufacturing capabilities, including bronze and iron foundries, machining, plastic injection molding and assembly operations. Our foundry operations include metal pouring systems, automatic core making, yellow brass forging and brass and bronze die-castings. Our machining operations feature computer-controlled machine tools, high-speed chucking machines with robotics and automatic screw machines for machining bronze, brass and steel components. We have invested heavily in recent years to expand our manufacturing base and to ensure the availability of the most efficient and productive equipment. We are committed to maintaining our manufacturing equipment at a level consistent with current technology in order to maintain high levels of quality and manufacturing efficiencies.
Capital expenditures and depreciation for each of the last three years were as follows:
| | Years Ended December 31, | | | Years Ended December 31,
|
|---|
| | 2005 | | 2004 | | 2003 | | | 2007
| | 2006
| | 2005
|
|---|
| | (in millions) | | | (in millions)
|
|---|
Capital expenditures | | $ | 18.6 | | $ | 21.0 | | $ | 20.0 | | | $ | 37.8 | | $ | 44.7 | | $ | 18.6 |
Depreciation | | $ | 23.5 | | $ | 26.3 | | $ | 20.5 | | | $ | 28.9 | | $ | 26.7 | | $ | 23.5 |
The Company's 2006 capital expenditures included approximately $18.0 million related to the purchase and subsequent sale-leaseback of a building in Italy.
Raw Materials
We require substantial amounts of raw materials to produce our products, including bronze, brass, cast iron, steel and plastic, and substantially all of the raw materials we require are purchased from outside sources. We have experienced increases in the costs of certain raw materials, particularly copper. Bronze and brass are copper-based alloys. During 2005, theThe spot price of copper cost increased approximately 46.9%. Additionally, due41% from December 31, 2005 to increased costs in crude oil, the costs of certain plastic resins we use increased between 9.8% and 19.0% during 2005.December 31, 2007. In response, we have implemented price increases for some of theour products whichthat have become more expensive to manufacture due to the increases in raw material costs. In 2005,During 2007 and 2006, cost increases in raw materials were not completely recovered by increased selling prices or other product cost reductions. We are not able to predict whether or for how
long these cost increases will continue. If these cost increases continue and we are not able to reduce or eliminate the effect of the cost increases by reducing production costs or implementing price increases, our profit margins could decrease.
Code Compliance
Products representing a majority of our sales are subject to regulatory standards and code enforcement which typically require that these products meet stringent performance criteria. Standards are established by such industry test and certification organizations as the American Society of Mechanical Engineers (A.S.M.E.), the Canadian Standards Association (C.S.A.), the American Society of Sanitary Engineers (A.S.S.E.), the University of Southern California Foundation for Cross-Connection Control (USC FCC), the International Association of Plumbing and Mechanical Officials (I.A.P.M.O.), Factory Mutual (F.M.), the National Sanitation Foundation (N.S.F.) and Underwriters Laboratory (U.L.). TheseMany of these standards are incorporated into state and municipal plumbing and heating, building and fire protection codes.
National regulatory standards in Europe vary by country. The major standards and/or guidelines which our products must meet are AFNOR (France), DVGW (Germany), UNI/ICIN (Italy), KIWA (Netherlands), SVGW (Switzerland), SITAC (Sweden) and WRAS (United Kingdom). Further, there are local regulatory standards requiring compliance as well.
Together with our commissioned manufacturers’manufacturers' representatives, we have consistently advocated for the development and enforcement of plumbing codes. We maintain stringent quality control and testing procedures at each of our manufacturing facilities in order to manufacture products in compliance with
code requirements.
We believe that product-testing capability and investment in plant and equipment is needed to manufacture products in compliance with code requirements. Additionally, a majority of our manufacturing facilities are ISO 9000, 9001 or 9002 certified by the International Organization for Standardization.
Product Development and Engineering
We maintain our own product development staff, design teams, and testing laboratories in North America, Europe and China that continuously work to enhance our existing products and develop new products. We maintain sophisticated product development and testing laboratories. Our efforts in this area have been particularly successful in the DIY market, which values innovation in product design. Research and development costs included in selling, general, and administrative expense amounted to $11.6$15.1 million, $9.9$12.7 million and $9.2$11.6 million for the years ended December 31, 2005, 20042007, 2006 and 2003,2005, respectively.
Competition
The domestic and international markets for water safety and flow control devices are intensely competitive and require us to compete against some companies possessing greater financial, marketing and other resources than ours. Due to the breadth of our product offerings, the number and identities of our competitors vary by product line and market. We consider brand preference, engineering specifications, plumbing code requirements, price, technological expertise, delivery times and breadth of product offerings to be the primary competitive factors. We believe that new product development and product engineering are also important to success in the water industry and that our position in the industry is attributable in part to our ability to develop new and innovative products quickly and to adapt and enhance existing products. We continue to develop new and innovative products to enhance market position and are continuing to implement manufacturing and design programs to reduce costs. We cannot be certain that our efforts to develop new products will be successful or that our customers will accept our new products. Although we own certain patents and trademarks that we consider to be of importance, we do not believe that our business and competitiveness as a whole are dependent on any one of our patents or trademarks or on patent or trademark protection generally.
Backlog
Backlog was $68.1approximately $119.1 million at February 20, 2006 compared to $46.915, 2008 and also was approximately $114.0 million at February 18, 2005.16, 2007. We do not believe that our backlog at any point in time is indicative of future operating results.
Employees
As of December 31, 2005,2007, our wholly-owned and majority-owned domestic and foreign operations employed approximately 7,3007,800 people. None of our employees in North America or China are covered by collective bargaining agreements. In some European countries our employees are subject to the traditional national collective bargaining agreements. We believe that our employee relations are good.
Available Information
We maintain a website with the addresswww.wattswater.com www.wattswater.com. The information contained on our website is not included as a part of, or incorporated by reference into, this Annual Report on Form 10-K. Other than an investor’sinvestor's own internet access charges, we make available free of charge through our website our Annual Report on Form 10-K, quarterly reports on Form 10-Q and current reports on Form 8-K, and amendments to these reports, as soon as reasonably practicable after we have electronically filed such material with, or furnished such material to, the Securities and Exchange Commission.
Certifications
Our chief executive officerChief Executive Officer and chief financial officerChief Financial Officer have provided the certifications required by rule 13a-14(a) under the Securities and Exchange Act of 1934, copies of which are filed as exhibits to this Annual Report on Form 10-K. In addition, an annual chief executive officer certification was submitted by our chief executive officer to the New York Stock Exchange on May 9, 20052007 in accordance with the New York Stock Exchange listing requirements.
Executive Officers and Directors
Set forth below are the names of our executive officers and directors, their respective ages and positions with our Company and a brief summary of their business experience for at least the past five years:
| Name
|
|
|
|
| | Age |
|
| | Position |
|
|---|
Patrick S. O’Keefe O'Keefe | | 53
55 | | Chief Executive Officer, President and Director | |
William D. Martino
| | 59
| | Chief Operating Officer and President of North American and Asian Operations
| |
William C. McCartney
|
| 51
53 |
|
Chief Financial Officer and Treasurer
| |
J. Dennis Cawte
|
| 55
57 |
|
Group Managing Director, Europe
| |
Ernest E. Elliott
|
| 54
56 |
|
Executive Vice President of Marketing
| |
Paul A. Lacourciere
Michael P. Flanders |
| 50
49 |
|
Executive Vice President of Manufacturing
| Operations, North America and Asia |
Lynn A. McVay
Josh C. Fu |
| 38
51 |
|
President, Asia
|
Gregory J. Michaud |
|
46 |
|
Executive Vice President of Sales andHuman Resources |
Taylor K. Robinson |
|
44 |
|
Executive Vice President of the Retail Division | Supply Chain Management |
Lester J. Taufen
|
| 62
64 |
|
General Counsel,Vice President of Legal Affairs and Secretary
| |
Douglas T. White
|
| 61
63 |
|
Group Vice President
| |
Robert L. Ayers(1)(3)
|
|
62 |
|
Director |
Richard J Carthcart(1)(3) |
|
63 |
|
Director |
Timothy P. Horne |
| 67
69 |
|
Director
| |
Ralph E. Jackson Jr.(1)(2)(3)
|
| 64
66 |
|
Director
| |
Kenneth J. McAvoy
McAvoy(1)(3) |
| 65
67 |
|
Director
| |
John K. McGillicuddy(1)(2)(3)
|
| 62
64 |
|
Director
| |
Gordon W. Moran(1)(2)Moran(2)(3)
|
| 67
69 |
|
Non-Executive Chairman of the Board and Director
| |
Daniel J. Murphy, III(1)(2)(3)
III(2) |
| 64
66 |
|
Director
| |
- (1)
Member of the Audit Committee
(2)Member of the Compensation Committee
(3)Member of the Nominating and Corporate Governance CommitteePatrick S. O’KeefeO'Keefe joined our Company in 2002. Prior to joining our Company, he served as President, Chief Executive Officer and Director of Industrial Distribution Group, a supplier of maintenance, repair, operating and production products, from 1999 to 2001. He was Chief Executive Officer of Zep Manufacturing, a unit of National Service Industries and a manufacturer of specialty chemicals throughout North America, Europe and Australia, from 1997 to 1999. He also held various senior management positions with Crane Co. from 1994 to 1997.
William D. Martino joined our Company in October 2005. Prior to joining our Company, he served as President of the Cooper Power Systems Division of Cooper Industries, a manufacturer of electrical enclosures, lighting and wiring devices used in hazardous locations, from 1994 through December 2004. He was Vice President, Operations of the Crouse Hinds Division of Cooper Industries from 1989 until 1994. He also served as president of the McEvoy-Willis Division of Smith International from 1981 to 1989 and held various positions with General Electric Company from 1972 to 1981.
William C. McCartneyjoined our Company in 1985 as Controller. He was appointed our Vice President of Finance in 1994 and served as our Corporate Controller from 1988 to 1999. He was appointed Chief Financial Officer and Treasurer in 2000. He served as Secretary of the Company from January 2000 to November 2005.
J. Dennis Cawtejoined our Company in 2001 and was appointed Group Managing Director Europe. Prior to joining our Company, he was European President of PCC Valve and Controls, a
division of Precision Castparts Corp., a manufacturer of components and castings to the aeronautical industry, from 1999 to 2001. He had also worked for approximately 20 years for Keystone Valve International, a manufacturer and distributor of industrial valves, where his most recent position was the Managing Director Northern Europe, Middle East, Africa and India.
Ernest E. Elliottjoined our Company in 1986 and has served in a variety of sales and marketing roles. He was appointed Vice President of Sales in 1991, served as Executive Vice President of Wholesale Sales and Marketing from 1996 to March 2003, Executive Vice President of Wholesale Marketing from March 2003 to February 2006 and as Executive Vice President of Marketing since February 2006. Mr. Elliott temporarily assumed responsibilities of our former Chief Operating Officer and President of North American and Asian Operations in September 2007. Prior to joining our Company, he was Vice President of BTR Inc.’s's Valve Group, a diversified manufacturer of industrial and commercial valve products.
Paul A. Lacourciere Michael P. Flandersjoined our Company in 1986. He became Vice President of New Hampshire operations in 1989. He also served our wholly-owned subsidiary Watts Regulator Co.October 2007 as Vice President of Manufacturing from 1991 to 1993, Executive Vice President from 1993 to 1995 and President from 1995 to 1997. He was appointed Corporate Vice President of Manufacturing of our Company in 1997 and Executive Vice President of Manufacturing in February 2006.Operations, North America and Asia. From August 2005 to July 2007, he served as President and Chief Operating Officer of Aavid Thermalloy, LLC, an international manufacturing company providing thermal management solutions to the computer and electronics industries. From July 2003 to April 2005, he was Vice President and General Manager of Waukesha Bearings Corporation, a manufacturer of hydrodynamic and active magnetic bearings and a subsidiary of Dover Corporation. From November 1998 to July 2003, he was General Manager of the LCN Division of Ingersoll-Rand Company Limited, which manufactured mechanical and electronic door control products.
Lynn A. McVay Josh C. Fujoined our Company in MarchJanuary 2008 as President, Asia. From January 2007 to December 2007, he served as President and Chief Executive Officer of Reradiant International Co. Ltd., a consulting firm focused on the energy and industrial goods industries. From August 2004 to December 2006, he served as President of the China operations of Flowserve Corporation, a global manufacturer of flow control equipment, including valves, pumps, and seals. From July 2003 to August 2004, he was Executive Vice President, Product Development and Merchandise Sourcing for Intercon Merchandise Sourcing, an importer of consumer goods from China. From 2000 to 2003, he held various senior management positions with the China operations of BP p.l.c., a worldwide petroleum and petrochemicals company.
Gregory J. Michaud joined our Company in April 2006 as Executive Vice President of Wholesale Sales. In October 2005, he was appointed President of the Retail Division and in February 2006 became Executive Vice President of Sales and President of the Retail Division.Human Resources. Prior to joining our Company, he wasserved as Vice President, Human Resources of the Compact Equipment division of Ingersoll-Rand Company Limited, a diversified industrial company, from June 2003 through March 2006. He served as Vice President, Human Resources of the Productivity Solutions division of Ingersoll-Rand from January 2003 to June 2003 and as Director, Human Resources & Corporate Organizational Planning of Ingersoll-Rand from June 2000 to December 2002.
Taylor K. Robinson joined our Company in September 2007 as Executive Vice President of SalesSupply Chain Management. From January 2007 to August 2007, he owned and Marketingoperated a consulting company named Global Supply Chain Solutions, which provided advice to international clients to improve their global supply chain methods and operations. From February 2004 to April 2006, he was Chief Procurement Officer for Little Giant PumpH.J. Heinz Company, an international manufacturer and marketer of processed foods. From January 1999 to January 2004, he served in various positions for Honeywell International Inc., a water pumpdiversified technology and manufacturing company, including Global Supply Chain Director, Aviation Aftermarket Services, Director of Global Sourcing, Aerospace Electronic Systems and a wholly-owned subsidiaryCorporate Director of Tecumseh Products Company, from 1997 to 2003.Global Commodity Management—Electronics.
Lester J. Taufenjoined our Company in 1999 as Associate Corporate Counsel. He was appointed General Counsel, Vice President of Legal Affairs and Assistant Secretary in January 2000. He was appointed Secretary in November 2005. Prior to joining our Company, he was employed for 13 years at Elf Atochem North America, a chemical manufacturing company, serving as Senior Counsel.
Douglas T. Whitejoined our Company in 2001 as Group Vice President. Prior to joining our Company he was employed by Honeywell International, Inc., a diversified technology and manufacturing company, as Vice President of Marketing—Consumer Products Group from 1998 to 2001.
Robert L. Ayers has served as a director of our Company since October 2006. He was Senior Vice President of ITT Industries and President of ITT Industries' Fluid Technology from October 1999 until September 2005. Mr. Ayers continued to be employed by ITT Industries from September 2005 until his retirement in September 2006, during which time he focused on special projects for the company. Mr. Ayers originally joined ITT Industries in 1998 as President of ITT Industries' Industrial Pump Group. Before joining ITT Industries, he was President of Sulzer Industrial USA and Chief Executive Officer of Sulzer Bingham, a pump manufacturer. He is a director of T-3 Energy Services, Inc.
Richard J. Cathcart has served as a director of our Company since October 2007. He was Vice Chairman and a member of the Board of Directors of Pentair, Inc. from February 2005 until his retirement in September 2007. Pentair is a diversified manufacturing company consisting of two operating segments: Water Technologies and Technical Products. He was appointed President and Chief Operating Officer of Pentair's Water Technologies Group in January 2001 and served in that capacity until his appointment as Vice Chairman in February 2005. He began his career at Pentair in March 1995 as Executive Vice President, Corporate Development, where he identified water as a strategic area of growth. In February 1996, he was named Executive Vice President and President of Pentair's Water Technologies Group. Prior to joining Pentair, he held several management and business development positions during his 20-year career with Honeywell International Inc. He is a director of Fluidra S.A.
Timothy P. Hornehas served as a director of our Company since 1962. He became an employee of our Company in 1959 and served as our President from 1976 to 1978, from 1994 to 1997 and from 1999 to 2002. He served as our Chief Executive Officer from 1978 to 2002, and he served as Chairman of our Board of Directors from 1986 to 2002. He retired as an employee of our Company on December 31, 2002. Since his retirement, Mr. Hornehe has continued to serve our Company as a consultant.
Ralph E. Jackson, Jr.has served as a director of our Company since 2004. He was employed byworked for Cooper Industries, Inc., a manufacturer of electrical products, from 1985 until his retirement in December 2003. Prior to joining Cooper Industries, he worked for the Bussmann and Air Comfort divisions of McGraw-Edison from 1976 until McGraw-Edison was acquired by Cooper Industries in 1985. While with Cooper Industries, he served as Chief Operating Officer from 2000 to December 2003, Executive Vice President, Electrical Operations from 1992 to 2000, and President, Bussmann Division from the time McGraw-Edison was acquired by Cooper Industries to 1992. He served as a member of the Board of Directors of Cooper Industries from 2000 to 2003, is currently a member of the Board of Trustees of Hope College and is a past Chairman of the National Electrical Manufacturers Association.December 2003.
Kenneth J. McAvoyhas served as a director of our Company since 1994. He was Controller of our Company from 1981 to 19861985 and Chief Financial Officer and Treasurer from 1986 to 1999. He also served the offices ofas Vice President of Finance from 1984 to 1994; Executive Vice President of European Operations from 1994 to 1996; and Secretary from 1985 to 1999. He retired from our Company on December 31, 1999.
John K. McGillicuddyhas served as a director of our Company since 2003. He was employed by KPMG LLP, a public accounting firm, from 1965 until his retirement in 2000. He was elected into the Partnership at KPMG LLP in June 1975 where he served as Audit Partner, SEC Reviewing Partner, Partner-in-Charge of Professional Practice, Partner-in-Charge of College Recruiting and Partner-in-Charge of Staff Scheduling. He is a director of Brooks Automation, Inc.
Gordon W. Moranhas served as a director of our Company since 1990. He has been the Chairman of Hollingsworth & Vose Company, a paper manufacturer, since 1997, and served as its President and Chief Executive Officer from 1983 to 1998.
Daniel J. Murphy, IIIhas served as a director of our Company since 1986. He has been the Chairman of Northmark Bank, a commercial bank he founded, since 1987. Prior to forming Northmark
Bank in 1987, he was a Managing Director of Knightsbridge Partners, a venture capital firm, from January to August 1987, and President and a director of Arltru Bancorporation, a bank holding company, and its wholly-owned subsidiary, Arlington Trust Company, from 1980 to 1986.
Product Liability, Environmental and Other Litigation Matters
We are subject to a variety of potential liabilities connected with our business operations, including potential liabilities and expenses associated with possible product defects or failures and compliance with environmental laws. We maintain product liability and other insurance coverage, which we believe to be generally in accordance with industry practices. Nonetheless, such insurance coverage may not be adequate to protect us fully against substantial damage claims.
Contingencies
James Jones Litigation
As previously disclosed, on On June 25, 1997, Nora Armenta (the Relator) filed a civil action in the California Superior Court for Los Angeles County (the Armenta case) against James Jones Company (James Jones), Mueller Co., Tyco International (U.S.), and the Company. We formerly owned James Jones. The Relator filed under the qui tam provision of the California state False Claims Act, Cal. Govt. Code § 12650 et seq. (California False Claims Act) and generally alleged that James Jones and the other defendants violated this statute by delivering some “defective”"defective" or “non-conforming”"non-conforming" waterworks parts to thirty-four municipal water systems in the State of California. The Relator filed a First Amended Complaint in November 1998 and a Second Amended Complaint in December 2000, which brought the total number of plaintiffs to 161. In June, 2002, the trial court excluded 47 cities from this total of 161, and
the Relator was not able to obtain appellate modification of this order, which can still be appealed at the end of the case. To date, 11 of the named cities have intervened, and attempts by four other named cities to intervene have been denied.
In June 2002, the trial court excluded 47 cities from this December 2000 total of 161, but this exclusion was reversed by an August 30, 2006 California Court of Appeal ruling that is now final. This August 30, 2006 Court of Appeal ruling also reversed dismissals of Tyco International and Mueller Co., and this allowed the Relator to make a successful motion that removed the Armenta Case litigation from Judge Lichtman's court to the court of Judge Chaney, another complex litigation judge.
One of the allegations in the Second Amended Complaint and the Complaints-in-Intervention is that purchased non-conforming James Jones waterworks parts may leach into public drinking water elevated amounts of lead that may create a public health risk because they were made out of ‘81'81 bronze alloy (UNS No. C8440) and contain more lead than the specified and advertised ‘85'85 bronze alloy (UNS No. C83600). This contention is based on the average difference of about 2% lead content between ‘81'81 bronze (6% to 8% lead) and ‘85'85 bronze (4% to 6% lead) and the assumption that this would mean increased consumable lead in public drinking water that could cause a public health concern. We believe the evidence and discovery available to date indicates that this is not the case.
In addition, ‘81'81 bronze is used extensively in municipal and home plumbing systems and is approved by municipal, local and national codes. The Federal Environmental Protection Agency also defines metal for pipe fittings with no more than 8% lead as “lead free”"lead free" under Section 1417 of the Federal Safe Drinking Water Act.
In this case, the Relator seeks three times an unspecified amount of actual damages and alleges that the municipalities have suffered hundreds of millions of dollars in damages. She also seeks civil penalties of $10,000 for each false claim and alleges that defendants are responsible for tens of thousands of false claims. Finally, the Relator requests an award of costs of this action, including attorneys’attorneys' fees.
In December 1998, the Los Angeles Department of Water and Power (LADWP) intervened in this case and filed a complaint. We settled with the city of Los Angeles, by far the most significant city, for $7.3 million plus attorneys’attorneys' fees. Co-defendants contributed $2.0 million toward this settlement.
In August 2003, an additional settlement payment was made for $13$13.0 million ($1111.0 million from us and $2$2.0 million from James Jones), which settled the claims of the three Phase I cities (Santa Monica, San Francisco and East Bay Municipal Utility District) chosen by the Relator as having the strongest claims to be tried first. This settlement payment included the Relator’sRelator's statutory share, and the claims of these three cities have been dismissed. In addition to this $13$13.0 million payment, we are obligated to pay the Relator’s attorney’sRelator's attorney's fees.
After the Phase I settlement, the Court permitted the defendants to select five additional cities to serve as the plaintiffs in a second trial phase of the case. Contra Costa, Corona, Santa Ana, Santa Cruz and Vallejo were chosen. The Company and James Jones then reached an agreement to settle the claims of the City of Santa Ana for a total of $45,000, an amount which approximates Santa Ana’sAna's purchases of James Jones products during the relevant period. The Santa Ana settlement was approved by the Court and then completed.
On June 22, 2005, the Court dismissed the claims of the remaining Phase II cities (Contra Costa, Corona, Santa Cruz and Vallejo). The Court ruled that the Relator and these cities were required to show that the cities had received out of spec parts which were related to specific invoices and that this showing had not been made. Although each city’scity's claim is unique, this ruling is significant for the claims of the remaining cities, and the Relator appealed. On June 29, 2007, the appellate court dismissed this appeal. However, this judgment can be appealed again at the conclusion of the entire case. The trial court has appealed.scheduled a trial on March 17, 2009 for six Phase III cities with three cities to be selected by each side. Litigation is inherently uncertain, and we are unable to predict the outcome of this appeal.case.
On September 15, 2004, the Relator’sRelator's attorneys filed a new common law fraud lawsuit in the California Superior Court for the City of Banning and forty-fiveforty-six other cities and water districts against James Jones, Watts and Mueller Co. based on the same transactions alleged in the Armenta case. About thirty-fourforty-two of the plaintiffs in this new lawsuit are also plaintiffs in the Armenta case. On January 4, 2006,The statute of limitations threshold issue is in the Court denied muchprocess of the defendants’ demurrer, which had been filed on claim-splitting and statute of
limitations grounds.being resolved for these plaintiffs. Litigation is inherently uncertain, and we are unable to predict the outcome of this new lawsuit.case.
We have a reserve of approximately $21.0$28.0 million with respect to the James Jones Litigation in our consolidated balance sheet as of December 31, 2005.2007. We believe, on the basis of all available information, that this reserve is adequate to cover the probable and reasonably estimable losses resulting from the Armenta case and the insurance coverage litigation with Zurich American Insurance Company (Zurich) discussed below. We are currently unable to make an estimate of the range of any additional losses.
On February 14, 2001, after our insurers had denied coverage for the claims in the Armenta case, we filed a complaint for coverage against our insurers in the California Superior Court (the coverage case). James Jones filed a similar complaint, the cases were consolidated, and the trial court made summary adjudication rulings that Zurich must pay all reasonable defense costs incurred by us and James Jones in the Armenta case since April 23, 1998 as well as such future defense costs in the future until the end of the Armenta case. In JulyAugust 2004, the California Court of Appeal affirmed these rulings, and, on December 1, 2004, the California Supreme Court denied Zurich’sZurich's appeal of this decision. This denial permanently established Zurich’sZurich's obligation to pay Armenta defense costs for both us (approximately $16.9$16.6 million plus future costs) and James Jones (which we estimate to be $17.3$17.0 million plus future costs), and Zurich is currently making payments of incurred Armenta defense costs. However, as noted below, Zurich asserts that the defense costs paid by it are subject to reimbursement.
In On November 22, 2002, the trial court madeentered a summary adjudication rulingorder that Zurich must indemnify and pay us and James Jones for amounts paid to settle with the City of Los Angeles. Zurich’sZurich's attempt to obtain appellate review of this order was denied, but Zurich will still be able to appeal this order at the end of the coverage case. InOn August 6, 2004, the trial court made another summary adjudication ruling that Zurich must indemnify and pay us and James Jones for the $13$13.0 million paid to settle the claims of the Phase I cities described above. Zurich’sZurich's attempt to obtain
appellate review of this ruling was denied on December 3, 2004 by the California Court of Appeal, but Zurich will still be able to appeal this order at the end of the coverage case. Although Zurich has now made mostall of the payments required by these indemnity orders, weorders.
On February 8, 2006, Zurich filed a motion to set aside as void the November 22, 2002 and August 6, 2004 summary adjudication indemnity payment orders. After this motion was denied, Zurich's appeal was also denied and the California Supreme Court denied Zurich's petition for review. We are currently unable to predict the finality of these indemnity payment orders since Zurich can also appeal them at the end of the coverage case. We have recorded reimbursed indemnity settlement amounts (but not reimbursed defense costs) as a liability pending court resolution of the indemnification matter as it relates to Zurich.
Zurich has asserted that all amounts (which we estimate to be $51$56.0 million for both defense costs and indemnity amounts paid for settlements) paid by it to us and James Jones are subject to reimbursement under Deductible Agreements related to the insurance policies between Zurich and Watts. If Zurich were to prevail on this argument, James Jones would have a possible indemnity claim against us for its exposure from the Armenta case. We believe the Armenta case should be viewed as one occurrence and the deductible amount should be $0.5 million per occurrence.
These reimbursement claims are subject to arbitration under the Watts/Zurich Deductible Agreements. Zurich claims its reimbursement right for defense costs paid arises under six Deductible Agreements, and we contend that only two Deductible Agreements apply. We further contend that a final decision in California supports our position on the number of Deductible Agreements that should apply to defense costs. On January 31, 2006, the federal district court in Chicago, Illinois determined that there are disputes under all Deductible Agreements in effect during the period in which Zurich issued primary policies and that the arbitrator could decide which agreements would control reimbursement claims. We have appealed this ruling. ManagementOn October 20, 2006, the United States Court of Appeals for the Seventh Circuit affirmed that an arbitration panel could decide which deductible agreements between Zurich and counsel anticipate thatus would control Zurich's reimbursement claim for defense costs paid in the James Jones case. As a result of this development, we will ultimately prevail on this reimbursement issue with Zurich.recorded a pre-tax charge of $5.0 million to discontinued operations in 2006.
Based on management’smanagement's assessment, we do not believe that the ultimate outcome of the James Jones Litigation will have a material adverse effect on our liquidity, financial condition or results of operations. While this assessment is based on all available information, litigation is inherently uncertain, the actual
liability to us to resolve this litigation fully cannot be predicted with any certainty and there exists a reasonable possibility that we may ultimately incur losses in the James Jones Litigation in excess of the amount accrued. We intend to continue to contest vigorously all aspects of the James Jones Litigation.
Environmental Remediation
We have been named as a potentially responsible party (PRP) with respect to a limited number of identified contaminated sites. The levels of contamination vary significantly from site to site as do the related levels of remediation efforts. Environmental liabilities are recorded based on the most probable cost, if known, or on the estimated minimum cost of remediation. We accrue estimated environmental liabilities based on assumptions, which are subject to a number of factors and uncertainties. Circumstances which can affect the reliability and precision of these estimates include identification of additional sites, environmental regulations, level of cleanup required, technologies available, number and financial condition of other contributors to remediation and the time period over which remediation may occur. We recognize changes in estimates as new remediation requirements are defined or as new information becomes available. WeAt December 31, 2007, we have a reserve of approximately $1.5$1.4 million (environmental accrual), which we estimate will likely be paid for environmental remediation liabilities over the next five to ten years. Based on the facts currently known to us, we do not believe that the ultimate outcome of these matters will have a material adverse effect on our liquidity, financial condition or results of operations. Some of our environmental matters are inherently uncertain and there exists a possibility that we may ultimately incur losses from these matters in excess of the amount accrued. However, we cannot currently estimate the amount of any such additional losses.
Asbestos Litigation
We are defending approximately 121100 cases filed primarily, but not exclusively, in Mississippi and New Jersey state courts alleging injury or death as a result of exposure to asbestos. These filings typically name multiple defendants and are filed on behalf of many plaintiffs. They do not identify any particular Watts products as a source of asbestos exposure. To date, we have been dismissed from each case when the scheduled trial date comes near or when discovery fails to yield any evidence of exposure to any of our products. Based on the facts currently known to us, we do not believe that the ultimate outcome of these claims will have a material adverse effect on our liquidity, financial condition or results of operations.
Other Litigation
On or about March 26, 2003, a class action complaint was filed against us by North Carolina Hospitality Group, Inc. in the Circuit Court of Maryland, Prince George’s County. It alleges that certain commercial valve models contain a design defect that causes them to fail prematurely. On June 7, 2004, the trial court issued an opinion and order that denied the plaintiff’s request for class certification. This ruling was appealed at the end of 2004, and on January 17, 2006, this ruling was affirmed by the Maryland Court of Special Appeals. Based on the facts currently known to us, we do not believe that the ultimate outcome of this matter will have a material adverse effect on our liquidity, financial condition or results of operations.
Other lawsuits and proceedings or claims, arising from the ordinary course of operations, are also pending or threatened against us. Based on the facts currently known to us, we do not believe that the ultimate outcome of these other litigation matters will have a material adverse effect on our liquidity, financial condition or results of operations.
13
Item 1A.RISK FACTORS.
We face intense competition and, if we are not able to respond to competition in our markets, our revenues may decrease.
Competitive pressures in our markets could adversely affect our competitive position, leading to a possible loss of market share or a decrease in prices, either of which could result in decreased revenues and profits. We encounter intense competition in all areas of our business. Additionally, customers for our products are attempting to reduce the number of vendors from which they purchase in order to reduce the size and diversity of their inventories and their transaction costs. To remain competitive, we will need to invest continuouslycontinually in manufacturing, marketing, customer service and support and our distribution networks. We may not have sufficient resources to continue to make such investments and we may be unable to maintain our competitive position. In addition, we anticipate that we may have to reduce the prices of some of our products to stay competitive, potentially resulting in a reduction in the profit margin for, and inventory valuation of, these products. Some of our competitors are based in foreign countries and have cost structures and prices in foreign currencies. Accordingly, currency fluctuations could cause our U.S. dollar-priced products to be less competitive than our competitors’competitors' products which are priced in other currencies.
Reductions or interruptions in the supply of raw materials and increases in the costs of raw materials could reduce our profit margins and adversely affect our ability to meet our customer delivery commitments.
We require substantial amounts of raw materials, including bronze, brass, cast iron, steel and plastic and substantially all of the raw materials we require are purchased from outside sources. The availability and costs of raw materials may be subject to curtailment or change due to, among other things, new laws or regulations, suppliers’suppliers' allocations to other purchasers, interruptions in production by suppliers and changes in exchange rates and worldwide price and demand levels. We aretypically do not currently party to anyenter into long-term supply agreements. Our inability to obtain adequate supplies of raw materials for our products at favorable costs, or at all, could have a material adverse effect on our business, financial condition or results of operations by decreasing our profit margins and by hindering our ability to deliver products to our customers on a timely basis. TheDuring 2006 and continuing through 2007, the costs of many of these raw materials arewere at the highest levels that they have been in many years. We may continue to experience further cost increases of these materials. In 2005,2006 and 2007, cost increases in raw materials were not completely recovered by increased selling prices or other product cost reductions. If we are not able to reduce or eliminate the effect of these cost increases through lowering other costs of production or successfully implementing price increases to our customers, such cost increases from our vendors could continue to have a negative effect on our financial results. Additionally, we continue to purchase increased levels of finished product from international sources. If
there is an interruption in delivering these finished products to our domestic warehouses, this could have a negative effect on our financial results.
Down economic cycles, particularly reduced levels of residential and non-residential starts and remodeling, could have an adverse effect on our revenues and operating results.
We have experienced and expect to continue to experience fluctuations in revenues and operating results due to economic and business cycles. The businesses of most of our customers, particularly plumbing and heating wholesalers and home improvement retailers, are cyclical. Therefore, the level of our business activity has been cyclical, fluctuating with economic cycles. We also believe our level of business activity is influenced by residential and non-residential starts and renovation and remodeling, which are, in turn, heavily influenced by interest rates, consumer debt levels, changes in disposable income, employment growth and consumer confidence. The current conditions in the housing and debt markets have caused a reduction in residential and non-residential starts and renovation and remodeling. If these conditions continue or worsen in the future, our revenues and profits could decrease and could result in a material adverse effect on our financial condition and results of operations.
Implementation of our acquisition strategy may not be successful, which could affect our ability to increase our revenues or our profitability.
One of our strategies is to increase our revenues and profitability and expand our markets through acquisitions that will provide us with complementary water-related products and increase market share for our existing product lines. We cannot be certain that we will be able to identify, acquire or profitably manage additional companies or successfully integrate such additional companies without substantial costs, delays or other problems. Also, companies acquired recently and in the future may not achieve revenues, profitability or cash flows that justify our investment in them. We expect to spend significant time and effort in expanding our existing businesses and identifying, completing and integrating acquisitions. In particular, we expect that management will need to devote a significant amount of time and effort over the next twelve months to improve the operational results of our recently acquired subsidiary, Core Industries
Inc., including improvements in its profitability, customer satisfaction and revenue growth rate. If we are not successful in implementing these improvements, our financial results may be negatively affected. We have faced increasing competition for acquisition candidates which have resulted in significant increases in the purchase prices of many acquisition candidates. This competition, and the resulting purchase price increases, may limit the number of acquisition opportunities available to us, possibly leading to a decrease in the rate of growth of our revenues and profitability. In addition, acquisitions may involve a number of special risks, including, but not limited to:
·
- •
- inadequate internal controls over financial reporting and our ability to bring such controls into compliance with the requirements of Section 404 of the Sarbanes-Oxley Act of 2002 in a timely manner;
- •
- adverse short-term effects on our reported operating results;
·
- •
- diversion of
management’smanagement's attention;·
- •
- investigations of, or challenges to, acquisitions by competition authorities;
·
- •
- loss of key personnel at acquired companies; and
·
- •
- unanticipated management or operational problems or legal liabilities.
We are subject to risks related to product defects, which could result in product recalls and could subject us to warranty claims in excess of our warranty provisions or which are greater than anticipated due to the unenforceability of liability limitations.
We maintain strict quality controls and procedures, including the testing of raw materials and safety testing of selected finished products. However, we cannot be certain that our testing will reveal latent defects in our products or the materials from which they are made, which may not become apparent until after the products have been sold into the market. We also cannot be certain that our suppliers will always eliminate latent defects in products we purchase from them. Accordingly, there is a risk that product defects will occur, which could require a product recall. Product recalls can be
expensive to implement and, if a product recall occurs during the product’sproduct's warranty period, we may be required to replace the defective product. In addition, a product recall may damage our relationship with our customers and we may lose market share with our customers. Our insurance policies may not cover the costs of a product recall.
Our standard warranties contain limits on damages and exclusions of liability for consequential damages and for misuse, improper installation, alteration, accident or mishandling while in the possession of someone other than us. We record an accrual for estimated warranty costs at the time revenue is recognized. We may incur additional operating expenses if our warranty provision does not reflect the actual cost of resolving issues related to defects in our products. If these additional expenses are significant, it could adversely affect our business, financial condition and results of operations.
Down economic cycles, particularly reduced levels of residential and non-residential starts and remodeling, could have an adverse effect on our revenues and operating results.
We have experienced and expect to continue to experience fluctuations in revenues and operating results due to economic and business cycles. The businesses of most of our customers, particularly plumbing and heating wholesalers and home improvement retailers, are cyclical. Therefore, the level of our business activity has been cyclical, fluctuating with economic cycles. We also believe our level of business activity is influenced by residential and non-residential starts and renovation and remodeling, which are, in turn, heavily influenced by interest rates, consumer debt levels, changes in disposable income, employment growth and consumer confidence. Prime interest rates have increased by 38.1% since December 31, 2004. If these and other factors cause a material reduction in residential and non-residential and remodeling starts, our revenues and profits would decrease and result in a material adverse effect on our financial condition and results of operations.
Economic and other risks associated with international sales and operations could adversely affect our business and future operating results.
Since we sell and manufacture our products worldwide, our business is subject to risks associated with doing business internationally. Our business and future operating results could be harmed by a variety of factors, including:
· trade protection measures and import or export licensing requirements, which could increase our costs of doing business internationally;
· potentially negative consequences from changes in tax laws, which could have an adverse impact on our profits;
· difficulty in staffing and managing widespread operations, which could reduce our productivity;
· costs of compliance with differing labor regulations, especially in connection with restructuring our overseas operations;
· natural disasters and public health emergencies;
· laws of some foreign countries, which may not protect our intellectual property rights to the same extent as the laws of the United States; and
· unexpected changes in regulatory requirements, which may be costly and require time to implement.
Fluctuations in foreign exchange rates could materially affect our reported results.
We are exposed to fluctuations in foreign currencies, as a portion of our sales and certain portions of our costs, assets and liabilities are denominated in currencies other than U.S. dollars. Approximately 37.0% of our sales during the year ended December 31, 2005 were from sales outside of the U.S. compared to 38.5% for the year ended December 31, 2004. For the year ended December 31, 2005, the depreciation of the euro against the U.S. dollar had a negative impact on sales of approximately $2.9 million. For the years ended December 31, 2004 and 2003, the appreciation of the euro against the U.S. dollar had a positive impact on sales of approximately $20.9 million and $31.1 million, respectively. Additionally, our Canadian operations require significant amounts of U.S. purchases for their operations. Instead of buying or manufacturing domestically, we currently have a favorable cost structure for goods we source from our joint venture, our wholly owned subsidiaries in China and our outside vendors. In 2005, China revalued its currency higher against the U.S. dollar and stated it would no longer tie the yuan to a fixed rate against the U.S. currency. The yuan was revalued to 8.11 yuan per dollar from 8.28, or 2.1%. At December 31, 2005, the yuan was valued at 8.07. China also stated it will now peg the yuan against numerous currencies, although it will keep the yuan in a tight band rather than letting it trade freely. If our share of revenue in non-dollar denominated currencies continues to increase in future periods, exchange rate fluctuations will likely have a greater impact on our results of operations and financial condition.
There are risks in expanding our manufacturing operations and acquiring companies in China.
As part of our strategy, we are shifting a portion of our manufacturing operations to China to reduce our production costs and to sell product into the Chinese market. This shift will subject a greater portion of our operations to the risks of doing business in China. The increased production levels in China require increased levels of working capital as we are rapidly increasing headcount and manufacturing equipment. If we are unable to quickly train these new employees we may experience product quality issues. The Chinese central and local government authorities have a higher degree of control over our businesses in China than is customary in many of the countries in which we operate and makes the process of obtaining necessary regulatory approval in China inherently unpredictable. In addition, the protection accorded our
proprietary technology and know-how under the Chinese legal system is not as strong as in the United States and, as a result, we may lose valuable trade secrets and competitive advantage. We expect to increase our participation in the Chinese water and power infrastructure markets with the consummation of our acquisition of Changsha Valve Works (Changsha), which we signed an agreement to acquire in October 2005. The acquisition of Changsha remains subject to the satisfaction of certain closing conditions by Changsha. Changsha sells exclusively into the domestic Chinese marketplace and deals in long-term contracts.
If we cannot continue operating our manufacturing facilities at current or higher utilization levels, our results of operations could be adversely affected.
The equipment and management systems necessary for the operation of our manufacturing facilities may break-down, perform poorly or fail, resulting in fluctuations in our ability to manufacture our products and to achieve manufacturing efficiencies. We operate a number of manufacturing facilities, all of which are subject to this risk, and such fluctuations at any of these facilities could cause an increase in our production costs and a corresponding decrease in our profitability. We also have a vertically-integrated manufacturing process. Each segment is dependent upon the prior process and any breakdown in one segment will adversely affect all later components. Fluctuations in our production process may affect our ability to deliver products to our customers on a timely basis. Our inability to meet our delivery obligations could result in a loss of our customers and negatively affect our business, financial condition and results of operations.
In addition, we have an ongoing manufacturing restructuring program to reduce our manufacturing costs. As we transition more of our operations overseas as a result of the manufacturing restructuring plan, we are transferring capacity utilization. If our planned manufacturing plant consolidations in the United States and Europe and our production capability expansion in China are not successful, our results of operations and financial condition could be materially adversely affected.
If we experience delays in introducing new products or if our existing or new products do not achieve or maintain market acceptance and regulatory approvals, our revenues and our profitability may decrease.
Our failure to develop new and innovative products or to custom design existing products could result in the loss of existing customers to competitors or the inability to attract new business, either of which may adversely affect our revenues. Our industry is characterized by:
· intense competition;
· changes in specifications required by our customers, plumbing codes and/or regulatory agencies;
· technically complex products; and
· constant improvement to existing products and introductions of new products.
We believe our future success will depend, in part, on our ability to anticipate or adapt to these factors and to offer, on a timely basis, products that meet customer demands and the requirements of plumbing codes and/or regulatory agencies. The development of new or enhanced products is a complex and uncertain process requiring the anticipation of technological and market trends. We may experience design, manufacturing, marketing or other difficulties, such as an inability to attract a sufficient number of experienced engineers, that could delay or prevent our development, introduction, approval or marketing of new products or enhancements and result in unexpected expenses. Such difficulties could cause us to lose business from our customers and could adversely affect our competitive position; in addition, added expenses could decrease the profitability associated with those products that do not gain market acceptance.
Environmental compliance costs and liabilities could increase our expenses or reduce our profitability.
Our operations and properties are subject to extensive and increasingly stringent laws and regulations relating to environmental protection, including laws and regulations governing air emissions, water discharges, waste management and disposal and workplace safety. Such laws and regulations can impose substantial fines and sanctions for violations and require the installation of costly pollution control equipment or operational changes to limit pollution emissions and/or decrease the likelihood of accidental hazardous substance releases. We could be required to halt one or more portions of our operations until a violation is cured. We could also be liable for the costs of property damage or personal injury to others. Although we attempt to operate in compliance with these environmental laws, we may not succeed in this effort at all times. The costs of curing violations or resolving enforcement actions that might be initiated by government authorities could be substantial.
Under certain environmental laws, the current and past owners or operators of real property may be liable for the costs of cleaning up contamination, even if they did not know of or were not responsible for such contamination. These laws also impose liability on any person who arranges for the disposal or treatment of hazardous waste at any site. Therefore, our ownership and operation of real property and our disposal of waste could lead to liabilities under these laws.
We have incurred, and expect to continue to incur, costs relating to these environmental matters. In addition, new laws and regulations, stricter enforcement of existing laws and regulations, the discovery of previously unknown contamination or the imposition of new clean up requirements could require us to incur additional costs or become the basis for new or increased liabilities that could be significant. Environmental litigation, enforcement and compliance are inherently uncertain and we may experience significant costs in connection with environmental matters. For more information, see Part I, Item 1, “Business—Product Liability, Environmental, and Other Litigation Matters.”
Third parties may infringe our intellectual property and we may expend resources enforcing our rights or suffer competitive injury.
We rely on a combination of patents, copyrights, trademarks, trade secrets, confidentiality provisions and licensing arrangements to establish and protect our proprietary rights. We may be required to spend resources to monitor and police our intellectual property rights. If we fail to successfully enforce our intellectual property rights, our competitive position could suffer, which could harm our operating results. We have been limited from selling products from time-to-time because of existing patents.
We face risks from product liability and other lawsuits, which may adversely affect our business.
We have been and mayexpect to continue to be subject to various product liability claims or other lawsuits, including, among others, that our products include inadequate or improper instructions for use or installation, or inadequate warnings concerning the effects of the failure of our products. In the event that we do not have adequate insurance or contractual indemnification, damages from these claims would have to be paid from our assets and could have a material adverse effect on our results of operations, liquidity and financial condition. We, like other manufacturers and distributors of products designed to control and regulate fluids and gases, face an inherent risk of exposure to product liability claims and other lawsuits in the event that the use of our products results in personal injury, property damage or business interruption to our customers. Although we maintain strict quality controls and procedures, including the testing of raw materials and safety testing of selected finished products, we cannot be certain that our products will be completely free from defect. In addition, in certain cases, we rely on third-party manufacturers for our products or components of our products. Although we have product liability and general insurance coverage, we cannot be certain that this insurance coverage will continue to be available to us at a
reasonable cost, or, if available, will be adequate to cover any such liabilities. For more information, see Part I, Item 1, “Business—"Item 1. Business—Product Liability, Environmental and Other Litigation Matters.”"
Economic and other risks associated with international sales and operations could adversely affect our business and future operating results.
Since we sell and manufacture our products worldwide, our business is subject to risks associated with doing business internationally. Our business and future operating results could be harmed by a variety of factors, including:
- •
- trade protection measures and import or export licensing requirements, which could increase our costs of doing business internationally;
- •
- potentially negative consequences from changes in tax laws, which could have an adverse impact on our profits;
- •
- difficulty in staffing and managing widespread operations, which could reduce our productivity;
- •
- costs of compliance with differing labor regulations, especially in connection with restructuring our overseas operations;
- •
- natural disasters and public health emergencies;
- •
- laws of some foreign countries, which may not protect our intellectual property rights to the same extent as the laws of the United States; and
- •
- unexpected changes in regulatory requirements, which may be costly and require time to implement.
Fluctuations in foreign exchange rates could materially affect our reported results.
We are exposed to fluctuations in foreign currencies, as a portion of our sales and certain portions of our costs, assets and liabilities are denominated in currencies other than U.S. dollars. Approximately 41.7% of our sales during the year ended December 31, 2007 were from sales outside of the U.S. compared to 38.0% for the year ended December 31, 2006. For the years ended December 31, 2007 and 2006, the appreciation of the euro against the U.S. dollar had a positive impact on sales of approximately $34.1 million and $7.1 million, respectively. Additionally, our Canadian operations require significant amounts of U.S. purchases for their operations. Instead of buying or manufacturing domestically, we currently have a favorable cost structure for goods we source from our joint venture, our wholly-owned subsidiaries in China and our outside vendors. In 2005, China revalued its currency higher against the U.S. dollar and stated it would no longer tie the yuan to a fixed rate against the U.S. currency. The yuan was valued at 7.3 and 7.8 at December 31, 2007 and 2006, respectively. China also stated it will peg the yuan against numerous currencies, although it will keep the yuan in a tight band rather than letting it trade freely. The spot rate of the euro, Canadian dollar and yuan increased in value from December 31, 2006 to December 31, 2007 by approximately 12%, 16% and 6% respectively, against the U.S. dollar. If our share of revenue and purchases in non-dollar denominated currencies continues to increase in future periods, exchange rate fluctuations will likely have a greater impact on our results of operations and financial condition.
There are risks in expanding our manufacturing operations and acquiring companies in China.
As part of our strategy, we have shifted a portion of our manufacturing operations to China to reduce our production costs and to sell products into the Chinese market. This shift has subjected a greater portion of our operations to the risks of doing business in China. In addition, we have increased our participation in the Chinese water and power infrastructure markets with our acquisition of Changsha Valve Works. Changsha sells exclusively into the domestic Chinese marketplace. The increased production levels in China require increased levels of working capital and manufacturing equipment. If we are unable to quickly train these new employees we may experience product quality issues. The Chinese central and local government authorities have a higher degree of control over our businesses in China than is customary in many of the countries in which we operate, and this makes the process of obtaining necessary regulatory approval in China inherently unpredictable. For instance, as announced in 2006, the local Chinese authorities in Tianjin, China informed us that property occupied by our TWT joint venture will be taken over by eminent domain by the end of the second quarter of 2008, and we have incurred significant costs in connection with the relocation of our operations there. In addition, the protection accorded our proprietary technology and know-how under the Chinese legal system is not as strong as in the United States and, as a result, we may lose valuable trade secrets and competitive advantage.
If we cannot continue operating our manufacturing facilities at current or higher utilization levels, our results of operations could be adversely affected.
The equipment and management systems necessary for the operation of our manufacturing facilities may break down, perform poorly or fail, resulting in fluctuations in our ability to manufacture our products and to achieve manufacturing efficiencies. We operate a number of manufacturing facilities, all of which are subject to this risk, and such fluctuations at any of these facilities could cause an increase in our production costs and a corresponding decrease in our profitability. We also have a vertically-integrated manufacturing process. Each segment is dependent upon the prior process and any breakdown in one segment will adversely affect all later components. Fluctuations in our production process may affect our ability to deliver products to our customers on a timely basis. Our inability to meet our delivery obligations could result in a loss of our customers and negatively affect our business, financial condition and results of operations.
In addition, we have an ongoing manufacturing restructuring program to reduce our manufacturing costs. If our planned manufacturing plant consolidations in the United States and Europe and our plant
relocations in China are not successful, our results of operations and financial condition could be materially adversely affected.
If we experience delays in introducing new products or if our existing or new products do not achieve or maintain market acceptance and regulatory approvals, our revenues and our profitability may decrease.
Our failure to develop new and innovative products or to custom design existing products could result in the loss of existing customers to competitors or the inability to attract new business, either of which may adversely affect our revenues. Our industry is characterized by:
- •
- intense competition;
- •
- changes in specifications required by our customers, plumbing codes and/or regulatory agencies;
- •
- technically complex products; and
- •
- constant improvement to existing products and introductions of new products.
We believe our future success will depend, in part, on our ability to anticipate or adapt to these factors and to offer, on a timely basis, products that meet customer demands and the requirements of plumbing codes and/or regulatory agencies. The development of new or enhanced products is a complex and uncertain process requiring the anticipation of technological and market trends. We may experience design, manufacturing, marketing or other difficulties, such as an inability to attract a sufficient number of experienced engineers, that could delay or prevent our development, introduction, approval or marketing of new products or enhancements and result in unexpected expenses. Such difficulties could cause us to lose business from our customers and could adversely affect our competitive position; in addition, added expenses could decrease the profitability associated with those products that do not gain market acceptance.
Environmental compliance costs and liabilities could increase our expenses or reduce our profitability.
Our operations and properties are subject to extensive and increasingly stringent laws and regulations relating to environmental protection, including laws and regulations governing air emissions, water discharges, waste management and disposal and workplace safety. Such laws and regulations can impose substantial fines and sanctions for violations and require the installation of costly pollution control equipment or operational changes to limit pollution emissions and/or decrease the likelihood of accidental hazardous substance releases. We could be required to halt one or more portions of our operations until a violation is cured. We could also be liable for the costs of property damage or personal injury to others. Although we attempt to operate in compliance with these environmental laws, we may not succeed in this effort at all times. The costs of curing violations or resolving enforcement actions that might be initiated by government authorities could be substantial.
Under certain environmental laws, the current and past owners or operators of real property may be liable for the costs of cleaning up contamination, even if they did not know of or were not responsible for such contamination. These laws also impose liability on any person who arranges for the disposal or treatment of hazardous waste at any site. We have been named as a potentially responsible party or are otherwise conducting remedial activities with respect to a limited number of identified contaminated sites, including sites we currently own or operate. There can be no assurances that our ownership and operation of real property and our disposal of waste will not lead to other liabilities under these laws.
We have incurred, and expect to continue to incur, costs relating to environmental matters. In addition, new laws and regulations, stricter enforcement of existing laws and regulations, the discovery of previously unknown contamination or the imposition of new clean-up requirements could require us to incur additional costs or become the basis for new or increased liabilities that could be significant. Environmental litigation, enforcement and compliance are inherently uncertain and we may experience significant costs in connection with environmental matters. For more information, see "Item 1. Business—Product Liability, Environmental and Other Litigation Matters."
Third parties may infringe our intellectual property and we may expend resources enforcing our rights or suffer competitive injury.
We rely on a combination of patents, copyrights, trademarks, trade secrets, confidentiality provisions and licensing arrangements to establish and protect our proprietary rights. We may be required to spend resources to monitor and police our intellectual property rights. If we fail to successfully enforce our intellectual property rights, our competitive position could suffer, which could harm our operating results. We have been limited from selling products from time-to-time because of existing patents.
The requirements of Financial Accounting Standards Board Statement No. 142, “Goodwill"Goodwill and Other Intangible Assets”Assets" (FAS 142) may result in a write-off of all or a portion of our goodwill and non-amortizable intangible assets, which would negatively affect our operating results and financial condition.
As of December 31, 2005,2007, we recorded goodwill and non-amortizable intangible assets of $296.6$385.8 million and $40.6$52.2 million, respectively. If we are required to take an impairment charge to our goodwill or intangible assets in connection with the requirements of FAS 142, our operating results may decrease and our financial condition may be harmed. Under FAS 142, goodwill and identifiable intangible assets that have indefinite useful lives are no longer amortized. In lieu of amortization, we are required to perform an annual impairment review of both goodwill and non-amortizable intangible assets. We have concluded that no impairment existed at October 30, 2005,28, 2007, the time of our latest annual review. We perform our annual test for indications of goodwill and non-amortizable intangible assets impairment in the fourth quarter of our fiscal year or sooner if indicators of impairment exist.
The loss of a major customer could have an adverse effect on our results of operations.
Our largest customer, The Home Depot Inc. and its wholly ownedwholly-owned subsidiaries, accounted for approximately $98.5$100.2 million, or 10.7%7%, of our total net sales for the year ended December 31, 2005,2007 and $84.5$122.7 million, or 10.3%10%, of our total net sales for year ended December 31, 2004.2006. Our customers generally are not obligated to purchase any minimum volume of products from us and are able to terminate their relationships with us at any time. In addition, increases in the prices of our products could result in a reduction in orders for our products from the Home Depot Inc and other customers. A significant reduction in orders from, or change in terms of contracts with, The Home Depot Inc. or other significant customers could have a material adverse effect on our future results of operations.
Certain indebtedness may limit our ability to pay dividends, incur additional debt and make acquisitions and other investments.
Our revolving credit facility and other senior indebtedness contain operational and financial covenants that restrict our ability to make distributions to stockholders, incur additional debt and make acquisitions and other investments unless we satisfy certain financial tests and comply with various financial ratios. If we do not maintain compliance with these covenants, our creditors could declare a default under our revolving credit facility or senior notes and our indebtedness could be declared immediately due and payable. Our ability to comply with the provisions of our indebtedness may be affected by changes in economic or business conditions beyond our control.
Investments in auction rate certificates are subject to risks which may cause losses and affect the liquidity of these investments.
At December 31, 2007, we had $39.0 million in investment securities. We have historically invested these amounts in auction rate certificates whose underlying investments are AAA rated municipal bonds. Our auction rate certificates are bought and sold at auction with reset dates of up to 35 days. Through February 25, 2008, we liquidated approximately $22.0 million of our auction rate certificates at par value and invested the proceeds into money market accounts. At February 25, 2008, we held approximately $17.0 million of auction rate certificates whose underlying investments are AAA rated municipal bonds.
We have no current indications that the securities we hold may be impaired. However, volatility in the credit markets could affect our ability to liquidate these investments or cause the fair value of the securities to be impaired. If liquidity of the securities becomes prohibitive, we may be forced to hold the securities until maturity or until conditions improve, which could be as long as 33 years. Subsequent to December 31, 2007 through February 25, 2008, we experienced failed auctions on $6.6 million of our auction rate certificates. We do not have a present need to access these funds for operational purposes. The amounts associated with failed auctions will not be accessible until a successful auction occurs, a buyer is found outside of the auction process or the underlying securities have matured. As a result, we have classified the $17.0 million of auction rate certificates held as of February 25, 2008 as long-term assets in the our December 31, 2007 consolidated balance sheet. If the fair value of the securities deteriorates, we would be required to adjust the carrying value of the securities. The market risks associated with our auction rate certificates could adversely affect our results of operations, liquidity and financial condition.
One of our stockholders can exercise substantial influence over our company.Company.
As of February 1, 2006,2008, Timothy P. Horne, a member of our board of directors, beneficially owned approximately 22.6%19.6% of our outstanding shares of Class A Common Stock (assuming conversion of all shares of Class B Common Stock beneficially owned by Mr. Horne into Class A Common Stock) and approximately 99.0% of our outstanding shares of Class B Common Stock, which represents approximately 73.8%70.4% of the total outstanding voting power. As long as Mr. Horne controls shares representing at least a majority of the total voting power of our outstanding stock, Mr. Horne will be able to unilaterally determine the outcome of allmost stockholder votes, and other stockholders will not be able to affect the outcome of any stockholder vote.such votes.
Conversion and sale of a significant number of shares of our Class B Common Stock could adversely affect the market price of our Class A Common Stock.
As of February 1, 2006,2008, there were outstanding 25,205,21029,680,122 shares of our Class A Common Stock and 7,343,8807,293,880 shares of our Class B Common Stock. Shares of our Class B Common Stock may be converted into Class A Common Stock at any time on a one for one basis. All of the shares of Class A Common Stock are freely transferable without restriction or further registration under the federal securities laws, except for any shares held by our affiliates, sales of which will be limited by Rule 144 under the Securities Act. In addition, underUnder the terms of a registration rights agreement with respect to outstanding shares of our Class B Common Stock, the holders of our Class B Common Stock have rights with respect to the registration of the underlying Class A Common Stock. Under these registration rights, the holders of Class B Common Stock may require, on up to two occasions, that we register their shares for public resale. If we are eligible to use Form S-3 or a similar short-form registration statement, the holders of Class B Common Stock may require that we register their shares for public resale up to two times per year. If we elect to register any shares of Class A Common Stock for any public offering, the holders of Class B Common Stock are entitled to include shares of Class A Common Stock into which such shares of Class B Common Stock may be converted in such registration. However, we may reduce the number of shares proposed to be registered in view of market conditions. We will pay all expenses in connection with any registration, other than underwriting discounts and commissions. If all of the available registered shares are sold into the public market the trading price of our Class A Common Stock could decline.
Our Class A Common Stock has insignificant voting power.
Our Class B Common Stock entitles its holders to ten votes for each share and our Class A Common Stock entitles its holders to one vote per share. As of February 1, 2006,2008, our Class B Common Stock constituted 22.6%19.7% of our total outstanding common stock and 74.5%71.1% of the total outstanding voting power and thus is able to exercise a controlling influence over our business.
Item 1B.UNRESOLVED STAFF COMMENTS.
None.
20
Item 2.PROPERTIES.
As of December 31, 2005,2007, we maintained approximately 7578 facilities worldwide, including our corporate headquarters located in North Andover, Massachusetts. The remaining facilities consist of foundries, manufacturing facilities, warehouses, sales offices and distribution centers. The principal properties in each of our three geographic segments and their location, principal use and ownership status are set forth below:
North America:
| Location
|
|
|
|
| | Principal Use |
|
| | Owned/Leased
|
|---|
North Andover, MA | | Corporate Headquarters | | Owned |
Export, PA | | Manufacturing | | Owned |
Franklin, NH | | Manufacturing
Manufacturing/Distribution | | Owned |
Burlington, ON, Canada | | Manufacturing | | Owned |
Kansas City, KS | | Manufacturing | | Owned |
Fort Myers, FL | | Manufacturing | | Owned |
St. Pauls, NC | | Manufacturing | | Owned |
Spindale, NC | | Manufacturing
Manufacturing/Distribution | | Owned |
Chesnee, SC | | Manufacturing | | Owned |
Palmdale, CA | | Manufacturing | | Owned |
Dunnellon, FL | | Warehouse | | Owned |
San Antonio, TX | | Warehouse | | Owned |
Springfield, MO | | Manufacturing
Manufacturing/Distribution | | Leased |
Langley, BC, Canada | | Manufacturing | | Leased |
Santa Ana, CA | | Manufacturing | | Leased |
Woodland, CA | | Manufacturing | | Leased |
Houston, TX | | Manufacturing | | Leased |
Wilmington, NC | | Manufacturing | | Leased |
Phoenix, AZ
Brea, CA | | Warehouse
Manufacturing | | Leased |
Dallas, TX
Phoenix, AZ | | Distribution Center
Warehouse | | Leased |
Chicago, IL | | Distribution Center | | Leased |
Reno, NV | | Distribution Center | | Leased |
Vernon, CA | | Distribution Center | | Leased |
| Calgary, AB, Canada | | Distribution Center | | Leased |
Europe:
Location
| | Principal Use
| | Owned/Leased
|
|---|
| Eerbeek, Netherlands | | European Headquarters/Manufacturing | | Owned |
| Biassono, Italy | | Manufacturing | | Owned |
| Brescia, Italy | | Manufacturing | | Owned |
| Landau, Germany | | Manufacturing | | Owned |
| Fresseneville, France | | Manufacturing | | Owned |
| Hautvillers, France | | Manufacturing | | Owned |
| Plovdiv, Bulgaria | | Manufacturing | | Owned |
| Ammanford, United Kingdom | | Manufacturing | | Owned |
| Rosières, France | | Manufacturing | | Leased |
| Monastir, Tunisia | | Manufacturing | | Leased |
| Gardolo, Italy | | Manufacturing | | Leased |
| Sorgues, France | | Manufacturing | | Leased |
| Grenoble, France | | Manufacturing | | Leased |
Europe:China:
| Location
|
|
|
|
| | Principal Use |
|
| | Owned/Leased
|
|---|
| Tianjin Tanggu District, THMT, China | | Manufacturing | | Owned |
Eerbeek, Netherlands
Taizhou, Yuhuan, China | | European Headquarters
Manufacturing | | Owned |
Biassono, Italy
Hunan, Changsha, China | | Manufacturing | | Owned |
Caldero, Italy
Ningbo, Beilun, China | | Manufacturing | | Owned |
Brescia, Italy
| | Manufacturing
| | Owned
|
Lavis, Italy
| | Manufacturing
| | Owned
|
Landau, Germany
| | Manufacturing
| | Owned
|
Fresseneville, France
| | Manufacturing
| | Owned
|
Plovdiv, Bulgaria
| | Manufacturing
| | Owned
|
South Wales, United Kingdom
| | Manufacturing
| | Owned
|
Rosières, France
| | Manufacturing
| | Leased
|
Monastir, Tunisia
| | Manufacturing
| | Leased
|
China:
Location
|
|
|
| Principal Use
|
| Owned/Leased
|
Tianjin Tanggu District, China | | Manufacturing | | Owned
Leased |
Tazhou, Yuhuan,Ningbo, Beilun Port, China
| | Manufacturing
Distribution Center | | Owned
|
Tianjin Tanggu District, China
| | Manufacturing
| | Leased |
Certain of our facilities are subject to mortgages and collateral assignments under loan agreements with long-term lenders. In general, we believe that our properties, including machinery, tools and equipment, are in good condition, well maintained and adequate and suitable for their intended uses. We believe that our manufacturing facilities are currently operating at a level that our management considers normal capacity, except for our two expanded plants in China,St. Pauls, North Carolina, Langley, BC, Canada and Gardolo, Italy, which are under-utilized. Management believes capacity utilization will continue to increase in 20062008 at these plants, subject to unexpected changes in our sales volume.
Item 3.LEGAL PROCEEDINGS.
We are from time to time involved in various legal and administrative procedures. See Part I, Item 1, “Business—"Business—Product Liability, Environmental and Other Litigation Matters,”" which is incorporated herein by reference
Item 4.SUBMISSION OF MATTERS TO A VOTE OF SECURITY HOLDERS.
There were no matters submitted during the fourth quarter of the fiscal year covered by this Annual Report to a vote of security holders through solicitation of proxies or otherwise.
PART II
Item 5.MARKET FOR REGISTRANT’SREGISTRANT'S COMMON EQUITY, RELATED STOCKHOLDER MATTERS AND ISSUER PURCHASES OF EQUITY SECURITIES.
The following table sets forth the high and low sales prices of our Class A Common Stock on the New York Stock Exchange during 20052007 and 20042006 and cash dividends paid per share.
| | 2005 | | 2004 | | | 2007
| | 2006
|
|---|
| | High | | Low | | Dividend | | High | | Low | | Dividend | | | High
| | Low
| | Dividend
| | High
| | Low
| | Dividend
|
|---|
First Quarter | | $ | 34.87 | | $ | 29.00 | | | $ | 0.08 | | | $ | 24.56 | | $ | 21.36 | | | $ | 0.07 | | | | $ | 46.71 | | $ | 35.05 | | $ | .10 | | $ | 37.00 | | $ | 29.55 | | $ | .09 |
Second Quarter | | 36.22 | | 29.70 | | | 0.08 | | | 27.11 | | 22.39 | | | 0.07 | | | | 41.34 | | 36.10 | | .10 | | 40.03 | | 29.00 | | .09 |
Third Quarter | | 37.55 | | 27.46 | | | 0.08 | | | 27.99 | | 24.51 | | | 0.07 | | | | 39.96 | | 30.40 | | .10 | | 36.24 | | 28.08 | | .09 |
Fourth Quarter | | 31.72 | | 25.80 | | | 0.08 | | | 32.59 | | 24.96 | | | 0.07 | | | | 33.09 | | 25.40 | | .10 | | 45.43 | | 30.71 | | .09 |
|
There is no established public trading market for our Class B Common Stock, which is held exclusively by members of the Horne family. The principal holders of such stock are subject to restrictions on transfer with respect to their shares. Each share of our Class B Common Stock (10 votes per share) is convertible into one share of Class A Common Stock (1 vote per share).
Aggregate common stock dividend payments for 20052007 and 20042006 were $10.5$15.6 million and $9.1$12.4 million, respectively. While we presently intend to continue to pay cash dividends, the payment of future cash dividends depends upon the Board of Directors’Directors' assessment of our earnings, financial condition, capital requirements and other factors.
The number of record holders of our Class A Common Stock as of February 22, 20062008 was 134.172. The number of record holders of our Class B Common Stock as of February 22, 20062008 was 8.7.
23 Beginning in the second quarter of 2007, the Company satisfies the minimum withholding tax obligation due upon the vesting of shares of restricted stock and the conversion of restricted stock units into shares of Class A Common Stock by automatically withholding from the shares being issued a number of shares with an aggregate fair market value on the date of such vesting or conversion that would satisfy the withholding amount due.
The following table includes information with respect to shares of the Company's Class A Common Stock withheld to satisfy withholding tax obligations during the quarter ended December 31, 2007.
| | Issuer Purchases of Equity Securities
| |
|
|---|
| | (d) Maximum Number (or
Approximate Dollar
Value) of Shares (or
Units) that May Yet Be
Purchased Under the
Plans or Programs
|
|---|
Period
| | (a) Total
Number of
Shares (or
Units)
Purchased
| | (b) Average
Price Paid per
Share (or Unit)
| | (c) Total Number of
Shares (or Units)
Purchased as Part of
Publicly Announced
Plans or Programs
|
|---|
| October 1, 2007 - October 28, 2007 | | 70 | | $ | 32.42 | | — | | — |
| October 29, 2007 - November 25, 2007 | | — | | | — | | — | | — |
| November 26, 2007 - December 31, 2007 | | — | | | — | | — | | — |
| | |
| |
| |
| |
|
| Total | | 70 | | $ | 32.42 | | — | | — |
| | |
| |
| |
| |
|
The following table includes information with respect to repurchases we made of our Class A Common Stock during the quarter ended December 31, 2007.
Period
| | (a) Total
Number of
Shares (or
Units)
Purchased(1)
| | (b) Average
Price Paid per
Share (or Unit)
| | (c) Total Number of
Shares (or Units)
Purchased as Part of
Publicly Announced
Plans or Programs(1)
| | (d) Maximum Number (or
Approximate Dollar
Value) of Shares (or
Units) that May Yet Be
Purchased Under the
Plans or Programs(1)
|
|---|
| October 1, 2007 - October 28, 2007 | | — | | | — | | — | | — |
| October 29, 2007 - November 25, 2007 | | 176,330 | | $ | 27.94 | | 176,330 | | 2,823,670 |
| November 26, 2007 - December 31, 2007 | | 691,121 | | $ | 29.00 | | 691,121 | | 2,132,549 |
| | |
| |
| |
| |
|
| Total | | 867,451 | | $ | 28.78 | | 867,451 | | 2,132,549 |
| | |
| |
| |
| |
|
- (1)
- On November 9, 2007, we announced that our Board of Directors had authorized a stock repurchase program. Under the program, we may repurchase up to an aggregate of 3.0 million shares of our Class A Common Stock in open market purchases or in privately negotiated transactions.
Performance Graph
Set forth below is a line graph comparing the cumulative total shareholder return on our Class A Common Stock for the last five years with the cumulative return of companies on the Standard & Poor's 500 Stock Index and the Russell 2000 Index. We chose the Russell 2000 Index because it represents companies with a market capitalization similar to that of Watts. The graph assumes that the value of the investment in our Class A Common Stock and each index was $100 at December 31, 2002 and that all dividends were reinvested.
COMPARISON OF 5 YEAR CUMULATIVE TOTAL RETURN*
Among Watts Water Technologies, Inc., The S&P 500 Index
and The Russell 2000 Index
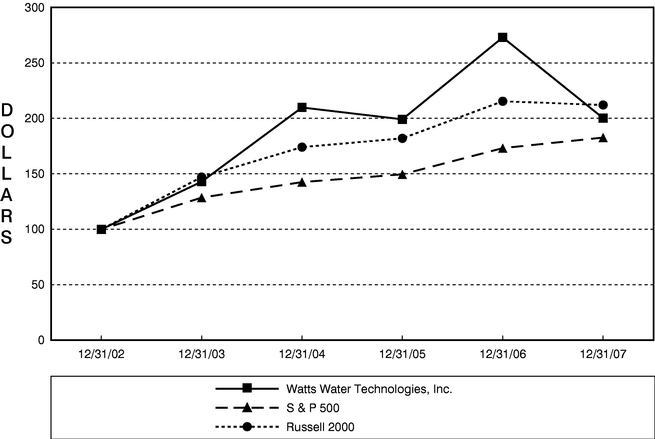
- *
- $100 invested on December 31, 2002 in stock or index, including reinvestment of dividends. Fiscal year ending December 31.
Cumulative Total Return
| | 12/31/02
| | 12/31/03
| | 12/31/04
| | 12/31/05
| | 12/31/06
| | 12/31/07
|
|---|
| Watts Water Technologies, Inc | | 100.00 | | 143.05 | | 210.02 | | 199.34 | | 273.27 | | 200.42 |
| S & P 500 | | 100.00 | | 128.68 | | 142.69 | | 149.70 | | 173.34 | | 182.87 |
| Russell 2000 | | 100.00 | | 147.25 | | 174.24 | | 182.18 | | 215.64 | | 212.26 |
The above Performance Chart and related information shall not be deemed "soliciting material" or to be "filed" with the Securities and Exchange Commission, nor shall such information be incorporated by reference into any future filing under the Securities Act of 1933 or Securities Exchange Act of 1934, each as amended, except to the extent that we specifically incorporate it by reference into such filing.
Item 6.SELECTED FINANCIAL DATADATA..
The selected financial data set forth below should be read in conjunction with our consolidated financial statements, related Notes thereto and “Management’s"Management's Discussion and Analysis of Financial Condition and Results of Operations”Operations" included herein.
FIVE-YEAR FINANCIAL SUMMARY
(Amounts in thousands,millions, except per share and cash dividend information)
| | Year Ended
12/31/05(1)(2)(5) | | Year Ended
12/31/04(3)(4)(5) | | Year Ended
12/31/03(5)(6) | | Year Ended
12/31/02(7) | | Year Ended
12/31/01(8)(9) | | | Year Ended
12/31/07(1)(7)
| | Year Ended
12/31/06(2)(7)
| | Year Ended
12/31/05(3)(4)(7)
| | Year Ended
12/31/04(5)(6)(7)
| | Year Ended
12/31/03(7)(8)
| |
|---|
Statement of operations data: | | | | | | | | | | | | | | | | | | | | | | | | | | | | | | | | | | | | | |
Net sales | | | $ | 924,346 | | | | $ | 824,558 | | | | $ | 701,859 | | | | $ | 615,526 | | | | $ | 548,940 | | | | $ | 1,382.3 | | $ | 1,230.8 | | $ | 924.3 | | $ | 824.6 | | $ | 701.9 | |
Income from continuing operations | | | 55,020 | | | | 48,738 | | | | 36,419 | | | | 32,622 | | | | 26,556 | | | | | 77.6 | | | 77.1 | | | 55.0 | | | 48.7 | | | 36.4 | |
Loss from discontinued operations, net of taxes | | | (421 | ) | | | (1,918 | ) | | | (3,057 | ) | | | — | | | | — | | | | | (.2 | ) | | (3.4 | ) | | (.4 | ) | | (1.9 | ) | | (3.1 | ) |
Net income | | | 54,599 | | | | 46,820 | | | | 33,362 | | | | 32,622 | | | | 26,556 | | | | | 77.4 | | | 73.7 | | | 54.6 | | | 46.8 | | | 33.4 | |
Income per share from continuing operations—diluted | | | 1.67 | | | | 1.49 | | | | 1.32 | | | | 1.21 | | | | 0.99 | | | | | 1.99 | | | 2.29 | | | 1.67 | | | 1.49 | | | 1.32 | |
Income (loss) per share from discontinued operations—diluted | | | (0.01 | ) | | | (0.06 | ) | | | (0.11 | ) | | | — | | | | — | | | |
| Loss per share from discontinued operations—diluted | | | | (.01 | ) | | (.10 | ) | | (.01 | ) | | (.06 | ) | | (.11 | ) |
Net income per share—diluted | | | 1.66 | | | | 1.43 | | | | 1.21 | | | | 1.21 | | | | 0.99 | | | | | 1.99 | | | 2.19 | | | 1.66 | | | 1.43 | | | 1.21 | |
Cash dividends declared per common share | | | $ | 0.32 | | | | $ | 0.28 | | | | $ | 0.25 | | | | $ | 0.24 | | | | $ | 0.24 | | | | $ | .40 | | $ | .36 | | $ | .32 | | $ | .28 | | $ | .25 | |
Balance Sheet Data (at year end): | | | | | | | | | | | | | | | | | | | | | | | | | | | | | | | | | | | | | |
Total assets | | | $ | 1,100,970 | | | | $ | 922,680 | | | | $ | 840,918 | | | | $ | 635,472 | | | | $ | 520,470 | | | | $ | 1,729.3 | | $ | 1,660.9 | | $ | 1,101.0 | | $ | 922.7 | | $ | 840.9 | |
Long-term debt, net of current portion | | | $ | 293,350 | | | | $ | 180,562 | | | | $ | 179,061 | | | | $ | 56,276 | | | | $ | 123,212 | | | | $ | 432.2 | | $ | 441.7 | | $ | 293.4 | | $ | 180.6 | | $ | 179.1 | |
- (1)
For the year ended December 31, 2007, net income includes the following net pre-tax costs: change in estimate of workers compensation costs of $2.9 million, severance and product line discontinuance costs in North America of $0.4 million and $3.1 million, respectively; accelerated depreciation and asset write-downs, product line discontinuance costs and severance costs in China of $2.9 million, $0.7 million and $0.4 million, respectively, and minority interest income of $0.9 million. The after-tax cost of these items was $6.9 million.
(2)For the year ended December 31, 2006, net income includes the following net pre-tax gain: gain on sales of buildings of $8.2 million, restructuring costs consisting primarily of European severance of $2.2 million and amortization of $0.4 million, other costs consisting of accelerated depreciation and severance in our Chinese joint venture of $4.7 million and minority interest income of $1.5 million. The after-tax gain of these items was $1.5 million.
(3)For the year ended December 31, 2005, net income includes the following pre-tax costs: restructuring of $729,000$0.7 million and other costs consisting of accelerated depreciation and asset write downswrite-downs of $1,816,000.$1.8 million. The after taxafter-tax cost of these items was $1,633,000.(2)$1.6 million.
(4)For the year ended December 31, 2005, net income includes a net after-tax charge of $933,000$0.9 million for a selling, general and administrative expense charge of $1,505,000$1.5 million related to a contingent earn-out agreement.(3)
(5)For the year ended December 31, 2004, net income includes a net after-tax charge of $2,289,000$2.3 million for certain accrued expense adjustments, which includesare included in selling, general and administrative expense after-tax charges of $3,475,000$3.5 million related to a contingent earn-out agreement and $724,000$0.7 million for various accrual adjustments and $462,000$0.5 million recorded as an income tax benefit.(4)
- (6)
- For the year ended December 31, 2004, net income includes the following pre-tax costs: restructuring of
$95,000$0.1 million and other costs consisting of accelerated depreciation of $2,873,000.$2.9 million. The after taxafter-tax cost of these items was $1,825,000.(5)$1.8 million.
- (7)
- In December 2004, we decided to divest our interest in our
minority ownedminority-owned subsidiary, Jameco International, LLC (Jameco LLC). We recorded in discontinued operation a net of tax impairment charge of $739,000$0.7 million for the year ended December 31, 2004. Also included in discontinued operations is the net of tax operating results of Jameco LLC of $54,000$0.1 million of loss and $54,000$0.1 million of income for the year ended December 31, 2004 and 2003, respectively. In September 1996, we divested our Municipal Water Group of businesses, which included Henry Pratt, James Jones Company and Edward Barber and Company Ltd. Costs and expenses related to the Municipal Water Group, for 2007, 2006, 2005, 2004 and
2003 relate to legal and settlement costs associated with the James Jones Litigation. The loss, net of taxes, consists of $421,000, $1,125,000$0.2 million, $3.4 million, $0.4 million, $1.1 million and $3,111,000$3.1 million for the years ended December 31, 2007, 2006, 2005, 2004 and 2003, respectively.
(6)
- (8)
- For the year ended December 31, 2003, net income includes the following pre-tax costs: restructuring of
$426,000;$0.4 million; other costs consist of: inventory and other asset write-downs and accelerated depreciation of $479,000;$0.5 million; and $750,000 of other related charges. The after tax cost of these items was $1,084,000.(7) For the year ended December 31, 2002, net income includes the following pre-tax costs: restructuring of $638,000; other costs consist of: inventory and other asset write-downs and accelerated depreciation of $2,491,000; and $960,000$0.8 million of other related charges. The after-tax cost of these items was $2,552,000.
(8) For the year ended December 31, 2001, net income includes the following pre-tax costs: restructuring of $1,454,000; other costs consist of: inventory and other asset write-downs and accelerated depreciation of $4,300,000; and $77,000 of other related charges. The after-tax cost of these items was $3,593,000.
(9) For the year ended December 31, 2001, net income includes an after-tax charge for goodwill amortization expense of $3,220,000 as recorded prior to adoption of FAS 142.
$1.1 million.
Item 7.MANAGEMENT’SMANAGEMENT'S DISCUSSION AND ANALYSIS OF FINANCIAL CONDITION AND RESULTS OF OPERATIONS.
Overview
We are a leading supplier of products for use in the water quality, water safety, water flow control and water conservation markets in both North America and Europe.Europe with an emerging presence in China. For over 130 years, we have designed and manufactured products that promote the comfort and safety of people and the quality and conservation of water used in commercial residential and light industrialresidential applications. We earn revenue and income almost exclusively from the sale of our products. Our principal product lines include:include:
·
- •
- water quality products, including backflow preventers and check valves for preventing
contamination of potable water caused by reverse flow within water supply lines and fire protection systems;·systems and point-of-use water filtration and reverse osmosis systems for both commercial and residential applications;
- •
- a wide range of water pressure regulators for both commercial and residential applications;
·
- •
- water supply and drainage products for commercial and residential applications;
·
- •
- temperature and pressure relief valves for water heaters, boilers and associated systems;
· point-of-use water filtration and reverse osmosis systems for both commercial and residential applications;
·
- •
- thermostatic mixing valves for tempering water in commercial and residential applications;
·
- •
- systems for under-floor radiant applications and hydraulic pump groups for gas boiler
manufacturers;manufacturers and· renewable energy applications, including solar and heat pump control packages;
- •
- flexible stainless steel connectors for natural and liquid propane gas in commercial food service and residential
applications.applications; and
- •
- large diameter butterfly valves for use in China's water infrastructure.
Our business is reported in three geographic segments, North America, Europe and China. We distribute our products through three primary distribution channels, wholesale, do-it-yourself (DIY) and original equipment manufacturers (OEMs). Interest rates have an indirect effect on the demand for our products due to the effect such rates have on the number of new residential and commercial construction starts and remodeling projects. Residential and commercial construction startsAll three of these activities have an impact on our levels of sales and earnings. In 2005, organic segment sales in our North American wholesale and DIY markets combined increased by approximately 9.5% over the prior year. Also in 2005, organic segment sales in Europe increased by approximately 2.2% over the prior year despite a weak European economy. An additional factor that has had an effect on our sales is fluctuation in foreign currencies, as a portion of our sales and certain portions of our costs, assets and liabilities are denominated in currencies other than the U.S. dollar.
We believe that the factors relating to our future growth include our ability to continue to make selective acquisitions, both in our core markets as well as in new complementary markets, regulatory requirements relating to the quality and conservation of water, increased demand for clean water andwith continued enforcement of plumbing and building codes and a healthy economic environment. We have completed twenty-five31 acquisitions since divesting our industrial and oil and gas business in 1999. Our acquisition strategy focuses on businesses that manufacture preferred brand name products that address our themes of water quality, water conservation, water safety water conservation,and water flow control and related complimentarycomplementary markets. We target businesses that will provide us with one or more of the following: an entry into new markets, an increase in shelf space with existing customers, a new or improved technology or an expansion of the breadth of our water quality, water conservation, water safety and water flow control products for the residential and commercial markets. In 2005,2007 and 2006, sales from acquisitions contributed approximately 4.9%3.9% and 20.9%, to our total sales growth over the prior period.year.
Products representing a majority of our sales are subject to regulatory standards and code enforcement, which typically require that these products meet stringent performance criteria. Together with our commissioned manufacturers’manufacturers' representatives, we have consistently advocated for the development and enforcement of such plumbing codes. We are focused on maintaining stringent quality
control and testing procedures at each of our manufacturing facilities in order to manufacture products in compliance with code requirements and take advantage of the resulting demand for compliant products. We believe that the product development, product testing capability and investment in plant and equipment is needed to manufacture products in compliance with code requirements, which representsrepresent a barrier to entry for competitors. We believe there is an increasing demand among consumers for products to ensure water quality, which creates growth opportunities for our products.
We require substantial amounts of raw materials to produce our products, including bronze, brass, cast iron, steel and plastic, and substantially all of the raw materials we require are purchased from outside sources. We have experienced increases in the costs of certain raw materials, particularly copper. Bronze and brass are copper-based alloys. During 2005,The spot price of copper cost increased approximately 46.9%. Additionally, due41% from December 31, 2005 to increases in the cost of crude oil, the costs of certain plastic resins we use increased approximately between 9.8% and 19.0% during 2005.December 31, 2007.
A risk we face is our ability to deal effectively with increases in raw material costs. We manage this risk by monitoring related market prices, working with our suppliers to achieve the maximum level of stability in their costs and related pricing, seeking alternative supply sources when necessary, implementing cost reduction programs and passing increases in costs to our customers,customers. Additionally from time to the maximum extent possible, when they occur. Additionally,time we may use commodity futures contracts on a limited basis we use commodity futures contracts to manage this risk, although we do not currently have any such contracts. In response to recent cost increases, we have implemented price increases for some of the products which have become more expensive to manufacture due to the increases in raw material costs. In 2005, cost increases in raw materials were not completely recovered by increased selling prices or other product cost reductions.risk. We are not able to predict whether or for how long these cost increases will continue. If these cost increases continue and we are not able to reduce or eliminate the effect of the cost increases by reducing production costs or implementing price increases, our profit margins could decrease.
Another risk we face in all areas of our business is competition. We consider brand preference, engineering specifications, code requirements, price, technological expertise, delivery times and breadth of product offerings to be the primary competitive factors. As mentioned previously, we believe that the product development, product testing capability and investment in plant and equipment is needed to manufacture products in compliance with code requirements, which representsrepresent a barrier to entry for competitors. We are committed to maintaining our capital equipment at a level consistent with current technologies, and thus we spent approximately $18.6$37.8 million in 20052007 and $21.0$44.7 million in 2004. We are committed2006 (including approximately $18.0 million related to expanding our manufacturing capacitythe purchase and subsequent sale-leaseback of a building in lower cost countries such as China, Tunisia and Bulgaria. These manufacturing plant relocations and consolidations are an important part of our ongoing commitment to reduce production costs.Italy).
Recent Developments
On February 7, 2006,5, 2008, we declared a quarterly dividend of nineeleven cents ($0.09)0.11) per share on the Company’seach outstanding share of Class A Common Stock and Class B Common Stock. This is an increase of $0.01 per share compared to the dividend paid for the comparable period last year.
27 On December 3, 2007, we entered into an Equity Transfer Agreement (the "Agreement") with our joint venture partners to purchase the remaining 40% of the outstanding ownership interest in Tianjin Tanggu Watts Valve Company Limited ("TWT") that we did not already own. The purchase price will be approximately $5.2 million, payable after certain closing conditions are met, including the approval of the Agreement by the local Chinese authorities, which we expect will occur by the end of the second quarter of 2008. We expect to record approximately $3.7 million in goodwill for this acquisition.
As part of this Agreement, the joint venture partners are obligated to reimburse approximately $2.0 million to TWT at the closing for relocation costs including lost land use rights. These costs were previously guaranteed by the joint venture partners as part of the original joint venture contract. TWT lost the future use of these land use rights when the local Chinese government decreed that the land where TWT's facility is located would be taken over by eminent domain. Since 2006, TWT has accelerated the amortization of the land use rights assets to coincide with the expected move. Further TWT has incurred and will incur relocation costs to move its operations. TWT had not previously recorded a receivable for this reimbursement amount, as collectibility of the amount under the original joint venture contract was not certain. The $2.0 million reimbursement will be recorded when the Agreement is finalized as an equity infusion by the joint venture partners. The cost to move TWT's operations was included in the restructuring program announced in October 2007.
On November 9, 2007, we acquired the assets and business of Topway Global, Inc. (Topway) located in Brea, California for approximately $18.4 million, of which $0.3 million of transaction costs remain to be paid. Topway manufactures a wide variety of water softeners, point of entry filter units, and point of use drinking water systems for residential, commercial and industrial applications.
On November 9, 2007, we announced that our Board of Directors had authorized the repurchase of up to 3.0 million shares of our Class A Common Stock. As of February 22, 2008, we have repurchased 2.2 million shares of stock for a total cost of $63.2 million.
Results of Operations
Year Ended December 31, 20052007 Compared to Year Ended December 31, 20042006
Net Sales.Our business is reported in three geographic segments: North America, Europe and China. Our net sales in each of these segments for the years ended December 31, 20052007 and 20042006 were as follows:
| | Year Ended
December 31, 2005 | | Year Ended
December 31, 2004 | | | | Change to
Consolidated | | | Year Ended
December 31, 2007
| | Year Ended
December 31, 2006
| |
| |
| |
|---|
| | Net Sales | | % Sales | | Net Sales | | % Sales | | Change | | Net Sales | | | Net Sales
| | % Sales
| | Net Sales
| | % Sales
| | Change
| | Change to
Consolidated
Net Sales
| |
|---|
| | (Dollars in thousands) | | | (Dollars in millions)
| |
|---|
North America | | $ | 629,937 | | | 68.2 | % | | $ | 545,139 | | | 66.1 | % | | $ | 84,798 | | | 10.3 | % | | | $ | 871.0 | | 63.0 | % | $ | 821.3 | | 66.7 | % | $ | 49.7 | | 4.0 | % |
Europe | | 266,346 | | | 28.8 | | | 253,234 | | | 30.7 | | | 13,112 | | | 1.6 | | | | 452.6 | | 32.7 | | 367.5 | | 29.9 | | 85.1 | | 6.9 | |
China | | 28,063 | | | 3.0 | | | 26,185 | | | 3.2 | | | 1,878 | | | 0.2 | | | | 58.7 | | 4.3 | | 42.0 | | 3.4 | | 16.7 | | 1.4 | |
| | | |
| |
| |
| |
| |
| |
| |
Total | | $ | 924,346 | | | 100 | % | | $ | 824,558 | | | 100 | % | | $ | 99,788 | | | 12.1 | % | | | $ | 1,382.3 | | 100.0 | % | $ | 1,230.8 | | 100.0 | % | $ | 151.5 | | 12.3 | % |
| | | |
| |
| |
| |
| |
| |
| |
The increase in net sales is attributable to the following:
|
|
|
|
|
|
|
|
|
| Change
As a % of Consolidated Net Sales
|
| Change
As a % of Segment Net Sales
|
|
|
| North
America
|
| Europe
|
| China
|
| Total
|
| North
America
|
| Europe
|
| China
|
| Total
|
| North
America
|
| Europe
|
| China
|
|
|
| (Dollars in thousands)
|
|
| | | | | | | | | | | | | | | | | | | | | | | |
Internal growth | | | $ | 51,796 | | | $ | 5,533 | | $ | 1,529 | | $ | 58,858 | | | 6.3 | % | | | 0.7 | % | | | 0.2 | % | | | 7.1 | % | | | 9.5 | % | | | 2.2 | % | | | 5.9 | % | | |
| | |
| |
| |
| |
| | Change
As a % of Consolidated
Net Sales
| | Change
As a % of Segment
Net Sales
| |
|---|
| | | North America
| | Europe
| | China
| | Total
| | North America
| | Europe
| | China
| | Total
| | North America
| | Europe
| | China
| |
|---|
| | | (Dollars in millions)
| |
|---|
| Organic growth | | | $ | 41.0 | | $ | 13.7 | | $ | 8.5 | | $ | 63.2 | | 3.3 | % | 1.1 | % | .7 | % | 5.1 | % | 5.0 | % | 3.7 | % | 20.3 | % |
Foreign exchange | | | 3,112 | | | (2,857 | ) | 349 | | 604 | | | 0.4 | | | | (0.4 | ) | | | — | | | | 0.1 | | | | 0.6 | | | | (1.1 | ) | | | 1.3 | | | | | 3.9 | | | 34.1 | | | 2.4 | | | 40.4 | | .3 | | 2.8 | | .2 | | 3.3 | | .5 | | 9.3 | | 5.8 | |
Acquisitions | | | 29,890 | | | 10,436 | | — | | 40,326 | | | 3.6 | | | | 1.3 | | | | — | | | | 4.9 | | | | 5.5 | | | | 4.1 | | | | — | | | | | 4.8 | | | 37.3 | | | 5.8 | | | 47.9 | | .4 | | 3.0 | | .5 | | 3.9 | | .6 | | 10.2 | | 13.8 | |
| | | |
| |
| |
| |
| |
| |
| |
| |
| |
| |
| |
| |
Total | | | $ | 84,798 | | | $ | 13,112 | | $ | 1,878 | | $ | 99,788 | | | 10.3 | % | | | 1.6 | % | | | 0.2 | % | | | 12.1 | % | | | 15.6 | % | | | 5.2 | % | | | 7.2 | % | | | $ | 49.7 | | $ | 85.1 | | $ | 16.7 | | $ | 151.5 | | 4.0 | % | 6.9 | % | 1.4 | % | 12.3 | % | 6.1 | % | 23.2 | % | 39.9 | % |
| | | |
| |
| |
| |
| |
| |
| |
| |
| |
| |
| |
| |
The internalorganic growth in net sales in North America was broad-based in both ourprimarily due to increased unit selling prices and increased unit sales of certain product lines into the wholesale and DIY markets.market. Our sales into the wholesale market for 2005,in 2007, excluding the sales from acquisitions,the acquisition of Calflex and Topway, grew by 8.5%7.7% compared to 2004,2006. This was primarily due to increased sales of our backflow preventor units, as well as increased under-floor radiant heating product lines and increased unit selling prices in most of our product lines.products. Our sales into the North American DIY market for 2005 increased organicallyin 2007 decreased by 12.3%4.4% compared to 20042006 primarily due our discontinuing certain lower margin product lines, partially offset by price increases and new product rollouts.
The acquired growth in net sales in North America was due to the inclusion of net sales of Calflex, acquired on June 2, 2006, and Topway, acquired on November 9, 2007.
The organic sales growth in Europe was broad-based, especially in Eastern Europe and in the OEM market, which was partially offset by a weak German market. Our sales into the wholesale and OEM markets in 2007, excluding the sales from the acquisitions of ATS, Kimsafe and Teknigas, grew by 3.1% and 4.4%, respectively, compared to 2006.
The acquired growth in net sales in Europe was due to the inclusion of the net sales of ATS, acquired on May 19, 2006, Kimsafe, acquired on June 7, 2006, and Teknigas, acquired on August 14, 2006.
The organic sales growth in China was primarily due to increased export sales to Europe, increased sales into the domestic Chinese markets and the elimination of the one-month reporting lag in two of our Chinese entities.
The acquired growth in net sales in China was due to the inclusion of net sales of fittings and supply lines and under-floor radiant heating products.Changsha, acquired on April 26, 2006.
The increaseincreases in net sales due to foreign exchange in North America, isEurope and China were primarily due to the appreciation of the Canadian dollar, appreciatingeuro and yuan, respectively, against the U.S. dollar. We cannot predict whether the Canadian dollarthese currencies will continue to appreciate against the U.S. dollar in future periods or whether future foreign exchange rate fluctuations will have a positive or negative impact on our net sales.
Acquired growth in net sales in North America is due to the inclusion Gross Profit. Gross profit and gross profit as a percent of net sales of Dormont, acquired on December 28, 2005, Core, acquired on December 2, 2005, Flexflow, acquired on November 4, 2005, Savard, acquired on July 8, 2005, Alamo, acquired on June 20, 2005, HF, acquired on January 5, 2005, Sea Tech, acquired on January 4, 2005,(gross margin) for 2007 and Orion, acquired on May 21, 2004.2006 were as follows:
| | Year Ended
December 31,
| |
| |
|---|
| | Point Change
| |
|---|
| | 2007
| | 2006
| |
|---|
| | (dollars in millions)
| |
| |
|---|
| Gross profit | | $ | 461.6 | | $ | 425.0 | | | |
| Gross margin | | | 33.4 | % | | 34.5 | % | (1.1 | %) |
Internal growth Gross margin decreased in Europe net sales results from increased sales into the wholesale market as a result of gaining market share, particularly in Germany. Sales into the European OEM market were primarily flat2007 compared to last year.
Net sales were negatively impacted by foreign exchange in Europe primarily from the depreciation of the euro against the U.S. dollar. We cannot predict whether the euro will continue to depreciate against the U.S. dollar in future periods or whether future foreign exchange rate fluctuations will have a positive or negative impact on our net sales.
Acquired growth in Europe net sales is due to the inclusion of the net sales of Microflex, which we acquired on July 5, 2005, Electro Controls, which we acquired on May 11, 2005, and TEAM, acquired on April 16, 2004.
The increase in net sales in China is primarily attributable to increased sales in both the Chinese domestic and export markets.
Gross Profit.Gross profit for 2005 increased $34,141,000, or 11.7%, compared to 2004. The increase in gross profit is attributable to the following:
| | (in thousands) | | % Change | |
Internal growth | | | $ | 16,079 | | | | 5.5 | % | |
Foreign exchange | | | 699 | | | | 0.2 | | |
Acquisitions | | | 16,306 | | | | 5.6 | | |
Other | | | 1,057 | | | | 0.4 | | |
Total | | | $ | 34,141 | | | | 11.7 | % | |
Internal margin growth was $6,891,000, $2,569,000 and $3,646,000 in North America, Europe and China, respectively. Internal growth resulted from increased sales volume in all regions. However, commodity costs, especially for copper-based products and oil, and a sales mix shift in North America and Europe, dampened margin growth. In 2005, we experienced raw material cost increases, which we were not able to fully recover through price increases on some of our products. North America experienced higher growth in lower-margin retail sales partially offset by a reclassification of product liability costs from cost of sales to selling, general and administrative expense. Europe’s OEM business was flat with an increase in lower margin wholesale product sales. Both regions benefited from completed manufacturing restructuring efforts. The China segment increased gross margin2006 primarily due to increased material costs, the write-off of inventory related to the discontinuance of certain product lines and an increase in our workers compensation reserve primarily due to a change in estimate. The North American margin for 2007 was affected by a charge related to our discontinuance of certain product lines and for cost increases for copper-based alloys and stainless steel products, which exceeded realized sales volumeprice increases for most of the year. The European margin remained relatively flat primarily due to higher margins contributed by price increases that were offset by increased material costs and a shift in sales to lower margin products primarily in the domestic marketplace. The increase inOEM market. Our China segment's gross margin from foreign exchange isdecreased primarily due to higher material costs, underutilized capacity in certain locations primarily due to the appreciationrelocation of our joint venture facility, a charge related to our discontinuance of certain product lines, value added tax increases and a shift in product mix.
In 2007, we undertook a review of certain product lines and our overall manufacturing capacity. Based on that review, we initiated a global restructuring program that was approved by our Board of Directors on October 30, 2007. We also discontinued certain product lines. This program is expected to include the shutdown of five manufacturing facilities and the rightsizing of a sixth facility, including the relocation of our joint venture facility in China that was previously disclosed. The restructuring program and charges for certain product line discontinuances will include pre-tax charges totaling approximately $12.9 million. Charges are primarily for severance ($4.3 million), relocation costs ($2.8 million) and other asset write-downs and expected net losses on asset disposals ($2.0 million) and will result in the elimination of approximately 330 positions worldwide. The pre-tax charge in 2007 of $4.3 million relates primarily to product line discontinuances ($3.8 million). Total net after-tax charges for this program are expected to be approximately $9.4 million ($4.4 million non-cash), with costs being incurred through early 2010. We expect to spend approximately $13.4 million in capital expenditures to consolidate operations and will fund approximately $8.0 million of this amount through proceeds from the sale of buildings and other assets being disposed of as part of the Canadian dollarrestructuring program. Annual cash savings, net of tax, are estimated to be $4.5 million, which will be fully realized by the second half of 2009.
The following table presents the total estimated pre-tax charges to be incurred for the global restructuring program and the yuan against the U.S. dollar partially offsetproduct line discontinuances initiated in 2007 by a depreciation of the euro against the U.S. dollar. The increase in gross margin from acquisitions is due to the inclusion of gross profit from Dormont, Core, Flexflow, Savard, Microflex, Alamo, Electro Controls, HF, Sea Tech, Orion and TEAM.our reportable segments:
Additionally, the increase in gross profit was due to decreased manufacturing restructuring and other costs. For 2005 we charged $1,816,000 of accelerated depreciation and other costs to cost of sales compared to $2,873,000 of accelerated depreciation and other costs for 2004. We anticipate recording a total of approximately $3,000,000 of manufacturing restructuring and other costs for 2006 in the North American and Europe segment.
Reportable Segment
| | (in millions)
|
|---|
| North America | | $ | 5.7 |
| Europe | | | 3.9 |
| China | | | 3.3 |
| | |
|
| Total | | $ | 12.9 |
| | |
|
Selling, General and Administrative Expenses.Selling, general and administrative expenses, or SG&A expenses, for 20052007 increased $22,552,000,$32.5 million, or 10.9%10.8%, compared to 2004.2006. The increase in SG&A expenses is attributable to the following:
| | (in thousands) | | % Change | | | (in millions)
| | % Change
| |
|---|
Internal growth | | | $ | 14,151 | | | | 6.8 | % | | |
| Organic growth | | | $ | 13.1 | | 4.4 | % |
Foreign exchange | | | 391 | | | | 0.2 | | | | 7.9 | | 2.6 | |
Acquisitions | | | 10,464 | | | | 5.1 | | | | 11.5 | | 3.8 | |
Other | | | (2,454 | ) | | | (1.2 | ) | | |
| | | |
| |
| |
Total | | | $ | 22,552 | | | | 10.9 | % | | | $ | 32.5 | | 10.8 | % |
| | | |
| |
| |
InternalThe organic increase in SG&A expenses was primarily due to increased primarily from higherproduct liability costs, increased stock-based compensation costs and increased variable selling expenses caused bydue to increased sales volumes in North America and China, from due-diligence related charges, and from increased bad debt reserves. These cost increases were partially offset by lower costs for complying with
Section 404 of the Sarbanes-Oxley Act of 2002 (SOX). Additionally, we recorded $1,000,000 in reserve reductions in 2004 related to a favorable ruling in a legal matter.decreased incentive compensation costs. The increase in SG&A expenses from foreign exchange iswas primarily due to the appreciation of the euro, Canadian dollar and the yuan against the U.S. dollar partially offset by the depreciation of the euro against the U.S. dollar. The increase in SG&A expenses from acquisitions iswas due to the inclusion of Dormont, Core, Savard, Microflex, Alamo, Electro Controls, HF, Sea Tech, OrionChangsha, ATS, Calflex, Ningbo, Kimsafe, Teknigas and TEAM. Other includes costsTopway. Total SG&A expenses, as a percentage of $2,454,000 for prior period corrections including an earn-out arrangement from a prior period acquisition thatsales, was accounted for as compensation expense. The earn-out arrangement was completed on August 31, 2005.24.1% in 2007 compared to 24.4% 2006.
Restructuring and Other (Income) Charges. In 2007, we recorded $3.2 million for asset write-downs, accelerated depreciation and severance in North America and China. In 2006, we recorded income of $5.7 million primarily due to a gain of approximately $8.2 million related to the sale of two buildings in Italy partially offset by a charge of $2.5 million primarily for severance costs related to our European restructuring programs.
Operating Income.Operating income by geographic segment for 20052007 and 2004 were2006 was as follows:
| | | | | | | | % Change to | | |
| | Years Ended | | | | Consolidated | | | Years Ended
| |
| |
| |
|---|
| | December 31, | | December 31, | | | | Operating | | |
| | % Change to
Consolidated
Operating
Income
| |
|---|
| | 2005 | | 2004 | | Change | | Income | | | December 31,
2007
| | December 31,
2006
| | Change
| |
|---|
| | (Dollars in thousands) | | | (Dollars in millions)
| |
|---|
North America | | | $ | 76,757 | | | | $ | 68,558 | | | $ | 8,199 | | | 9.8 | % | | | $ | 93.3 | | $ | 98.5 | | $ | (5.2 | ) | (4.0 | )% |
Europe | | | 31,528 | | | | 31,597 | | | (69 | ) | | (0.1 | ) | | | 53.6 | | 50.0 | | 3.6 | | 2.8 | |
China | | | 3,533 | | | | 1,857 | | | 1,676 | | | 2.0 | | | | 7.9 | | 7.2 | | .7 | | .5 | |
Corporate | | | (17,263 | ) | | | (18,412 | ) | | 1,149 | | | 1.4 | | | | (29.1 | ) | | (25.2 | ) | | (3.9 | ) | (3.0 | ) |
| | | |
| |
| |
| |
| |
Total | | | $ | 94,555 | | | | $ | 83,600 | | | $ | 10,955 | | | 13.1 | % | | | $ | 125.7 | | $ | 130.5 | | $ | (4.8 | ) | (3.7 | )% |
| | | |
| |
| |
| |
| |
The increasechange in operating income is attributable to the following:
|
|
|
|
|
|
|
|
|
|
|
| Change
|
| Change
|
|
|
|
|
|
|
|
|
|
|
|
|
| As a % of Consolidated Operating Income
|
| As a % of Segment Operating Income
|
|
|
| North
|
|
|
|
|
|
|
|
|
| North
|
|
|
|
|
|
|
|
|
| North
|
|
|
|
|
|
|
|
|
| America
|
| Europe
|
| China
|
| Corp.
|
| Total
|
| America
|
| Europe
|
| China
|
| Corp.
|
| Total
|
| America
|
| Europe
|
| China
|
| Corp.
|
|
|
| (Dollars in thousands)
|
|
Internal growth | | | $ | (467 | ) | | | $ | (1,100 | ) | | $ | 1,622 | | $ | 1,873 | | $ | 1,928 | | | (0.6 | )% | | | (1.3 | )% | | | 1.9 | % | | | 2.3 | % | | | 2.3 | % | | | (0.7 | )% | | | (3.5 | )% | | | 87.4 | % | | | (10.2 | )% | | |
| | |
| |
| |
| |
| |
| | Change
As a % of Consolidated
Operating Income
| | Change
As a % of Segment
Operating Income
| |
|---|
| | | North
America
| | Europe
| | China
| | Corp.
| | Total
| | North
America
| | Europe
| | China
| | Corp.
| | Total
| | North
America
| | Europe
| | China
| | Corp.
| |
|---|
| | | (Dollars in millions)
| |
|---|
| Organic growth | | | $ | (1.3 | ) | $ | .9 | | $ | (1.5 | ) | $ | (3.9 | ) | $ | (5.8 | ) | (1.0 | )% | .7 | % | (1.3 | )% | (3.0 | )% | (4.6 | )% | (1.4 | )% | 1.8 | % | (20.8 | )% | (15.5 | )% |
Foreign exchange | | | 658 | | | | (404 | ) | | 54 | | — | | 308 | | | 0.8 | | | | (0.5 | ) | | | 0.1 | | | | — | | | | .4 | | | | 1.0 | | | | (1.3 | ) | | | 2.9 | | | | — | | | | | .9 | | | 4.0 | | | .4 | | | — | | | 5.3 | | .7 | | 3.1 | | .3 | | — | | 4.1 | | .9 | | 8.0 | | 5.5 | | — | |
Acquisitions | | | 2,867 | | | | 2,975 | | | — | | — | | 5,842 | | | 3.4 | | | | 3.6 | | | | — | | | | — | | | | 7.0 | | | | 4.2 | | | | 9.4 | | | | — | | | | — | | | | | (1.3 | ) | | 4.8 | | | .8 | | | — | | | 4.3 | | (1.0 | ) | 3.6 | | .7 | | — | | 3.3 | | (1.3 | ) | 9.6 | | 11.1 | | — | |
Other | | | 3,178 | | | | — | | | — | | (724 | ) | 2,454 | | | 3.8 | | | | — | | | | — | | | | (0.9 | ) | | | 2.9 | | | | 4.6 | | | | — | | | | — | | | | 4.0 | | | |
Other—Restructuring | | | 1,963 | | | | (1,540 | ) | | — | | — | | 423 | | | 2.4 | | | | (1.9 | ) | | | — | | | | — | | | | .5 | | | | 2.9 | | | | (4.9 | ) | | | — | | | | — | | | |
| Restructuring/other | | | | (3.5 | ) | | (6.1 | ) | | 1.0 | | | — | | | (8.6 | ) | (2.7 | ) | (4.6 | ) | .8 | | — | | (6.5 | ) | (3.5 | ) | (12.2 | ) | 13.9 | | — | |
| | | |
| |
| |
| |
| |
| |
| |
| |
| |
| |
| |
| |
| |
| |
| |
Total | | | $ | 8,199 | | | | $ | (69 | ) | | $ | 1,676 | | $ | 1,149 | | $ | 10,955 | | | 9.8 | % | | | (0.1 | )% | | | 2.0 | % | | | 1.4 | % | | | 13.1 | % | | | 12.0 | % | | | (0.3 | )% | | | 90.3 | % | | | (6.2 | )% | | | $ | (5.2 | ) | $ | 3.6 | | $ | .7 | | $ | (3.9 | ) | $ | (4.8 | ) | (4.0 | )% | 2.8 | % | .5 | % | (3.0 | )% | (3.7 | )% | (5.3 | )% | 7.2 | % | 9.7 | % | (15.5 | )% |
| | | |
| |
| |
| |
| |
| |
| |
| |
| |
| |
| |
| |
| |
| |
| |
Internally our North American segment experienced aThe decrease in organic operating income primarily from increased commodity costs and increased SG&A expenses, partially offset by benefits resulting from our completed manufacturing restructuring projects and outsourcing. In 2005, we experienced raw material cost increases, which we were not able to fully recover through price increases on some of our products. For 2005, we recorded $1,005,000 for net costs associated with our manufacturing restructuring plan compared to $2,968,000 for 2004. The acquired growth is due to the inclusion of operating income from Dormont, Core, Savard, Alamo, HF, Sea Tech and Orion. Other represents costs accrued for an earn-out arrangement from a prior period acquisition. This earn-out arrangement was completed on August 31, 2005.
The increase in operating income due to foreign exchange in North America is due to the Canadian dollar appreciating against the U.S. dollar. We cannot predict whether the Canadian dollar will continue to appreciate against the U.S. dollar in future periods or whether future foreign exchange rate fluctuations will have a positive or negative impact on our net sales.
Internally our European segment also experienced decrease in operating income. This was primarily due to increased material costs partially offset by unit price increases, a soft European economy, increased salesnet increase in lower margin wholesale productsour workers compensation reserve primarily due to a change in estimate and increased SG&A expenses,product liability costs, partially offset by benefits resulting from our completed manufacturing restructuring projects and outsourcing. For 2005,decreased incentive compensation costs. In 2007, we recorded $1,540,000a charge of $3.1 million related to our discontinuance of certain product lines and $0.4 million for primarily for severance costs related to our global restructuring program.
The acquired decrease is primarily due to the amortization of certain costs associated with the acquisition of Topway.
Europe's organic growth in operating income is due to our manufacturing restructuring planability to leverage SG&A expenses, increased selling prices partially offset by increased material costs and a shift in sales to lower margin products primarily in the OEM market. In 2007, we did not record any costs associated with restructuring compared to a gain of $6.0 million for 2004.
The decreasethe same period in Europe’s operating income from foreign exchange is primarily due to2006. We recorded a gain of $8.2 million for the depreciation of the euro against the U.S. dollar. We cannot predict whether the euro will continue to depreciate against the U.S. dollarbuilding sales in future periods or whether future foreign exchange rate fluctuations will have a positive or negative impact on our operating income.
The increase in internal growth in China of $1,622,000 is primarily attributable to increased capacity utilization and low cost sourcing to our domestic facilities offset by increased SG&A expenses primarily related to increased variable selling expenses due to increased sales volumes and increased bad debt reserves.
The increase in internal operating income in Corporate of $1,149,000 is primarily attributable to reductions in SOX and audit expensesItaly partially offset by a $1,000,000 reserve reduction in the first quarter$2.2 million of 2004 due to a favorable ruling in a legal matter. Other consists of $724,000 of adjustments made in the fourth quarter of 2004 to correct errors for accrued expenses.
Interest Expense.Interest expense decreased $211,000, or 2.0%, for 2005 compared to 2004, primarily due to reduced debt levels in Europe. Debt levels increased in the U.S., but not until December 2005, as a result of the fourth quarter acquisition activity.
Effective July 1, 2005, we entered into a three-year interest rate swap with a counter party for a notional amount of €25,000,000, which is outstanding under our Revolving Credit Facility. We swapped the three-month EURIBOR plus 0.6% for a fixed rate of 3.02%. The impact of the swap was immaterial to the overall interest expense.
We had previously entered into an interest rate swap for a notional amount of €25,000,000 outstanding on our prior revolving credit facility. We swapped the three-month EURIBOR plus 0.7%, for a fixed rate of 2.3%. The swap was terminated at June 30, 2005. The impact of the swap was immaterial to the overall interest expense.
Income Taxes.Our effective tax rate for continuing operations for 2005 increased to 35.9% from 32.9% for 2004. The increase is primarily due to the benefits realized in 2004 of approximately $800,000 for previously unrecognized deferred tax assets in China. In addition in 2004 we recorded multi-year refund claims relating to state tax credits; in 2005 those tax credits were realized for the current year only. This increase was partially offset by a decrease in our European tax rate for 2005 compared to 2004 due to earnings mix in Europe.
Income From Continuing Operations.Income from continuing operations for 2005 increased $6,282,000, or 12.9%, to $55,020,000, or $1.67 per common share, from $48,738,000, or $1.49 per common share, for 2004, in each case, on a diluted basis. Income from continuing operations for 2005 and 2004 includes net costs incurred for our manufacturing restructuring plan of $1,633,000, or ($0.05) per share and $1,825,000, or ($0.06) per share, respectively. Also included in income from continuing operations for 2004 is the net charge of $2,289,000, or ($0.07) per share for accounting corrections relating to certain accrued expenses.
Loss From Discontinued Operations We recorded a charge net of tax to discontinued operations for 2005 of $421,000, or ($0.01) per common share, and $1,918,000, or ($0.06) per common share, for 2004, in each case, on a diluted basis. Included in loss from discontinued operations for 2005 and 2004 are charges attributable to legal fees associated with the James Jones litigation and obligations to the former shareholders of the James Jones Company of $421,000, or ($0.01) per share and $1,125,000, or ($0.04) per share, respectively. See Part I, Item 1, “Business—Product Liability, Environmental and Other Litigation Matters.” Additionally, losses from discontinued operations for 2004 include an impairment charge and an operating loss totaling $793,000 or ($0.02) per share for the divesture of our interest in Jameco LLC.
31
Year Ended December 31, 2004 Compared to Year Ended December 31, 2003
During the fourth quarter of 2004, we identified and corrected errors related to certain accrued expenses. The after tax adjustments, which affected selling, general and administrative and tax expense, necessary to correct these errors amounted to $2,289,000, or ($0.07) per share. The portions of these adjustments that related to the year ended December 31, 2004 and the fourth quarter of 2004 were $1,520,000, or ($0.05) per share, and $411,000, or ($0.01) per share, respectively. The impact of the amount that related to prior periods was not material to any of the financial statements of prior periods, thus the amount related to prior periods was also recorded in the fourth quarter of 2004.
The following table illustrates the effects of the adjustments on earnings per share from continuing operations:severance costs.
| | Fourth Quarter Ended | | Year Ended | |
| | December 31, 2004 | | December 31, 2004 | |
Adjustments: | | | | | | | | | |
Related to 2004 | | | $ | (0.01 | ) | | | $ | (0.05 | ) | |
Related to earlier periods | | | (0.06 | ) | | | (0.02 | ) | |
| | | $ | (0.07 | ) | | | $ | (0.07 | ) | |
Net Sales.Our business is reported in three geographic segments: North America, Europe and China. Our net sales in each of these segments for the years ended December 31, 2004 and 2003 were as follows:
| | Year Ended
December 31, 2004 | | Year Ended
December 31, 2003 | | | | % Change to
Consolidated | |
| | Net Sales | | % Sales | | Net Sales | | % Sales | | Change | | Net Sales | |
| | (Dollars in thousands) | |
North America | | $ | 545,139 | | | 66.1 | % | | $ | 472,518 | | | 67.3 | % | | $ | 72,621 | | | 10.3 | % | |
Europe | | 253,234 | | | 30.7 | | | 210,614 | | | 30.0 | | | 42,620 | | | 6.1 | | |
China | | 26,185 | | | 3.2 | | | 18,727 | | | 2.7 | | | 7,458 | | | 1.1 | | |
Total | | $ | 824,558 | | | 100 | % | | $ | 701,859 | | | 100 | % | | $ | 122,699 | | | 17.5 | % | |
The increase in net sales is attributable to the following:
| | | | | | | | | | Change
As a % of Consolidated Net Sales | | Change
As a % of Segment Net Sales | |
| | North
America | | Europe | | China | | Total | | North
America | | Europe | | China | | Total | | North
America | | Europe | | China | |
| | (Dollars in thousands) | |
Internal growth | | $ | 45,041 | | $ | 8,822 | | $ | 7,458 | | $ | 61,321 | | | 6.4 | % | | | 1.3 | % | | | 1.1 | % | | | 8.8 | % | | | 9.6 | % | | | 4.2 | % | | | 39.8 | % | |
Foreign exchange | | 2,463 | | 20,935 | | — | | 23,398 | | | 0.4 | | | | 3.0 | | | | — | | | | 3.4 | | | | 0.5 | | | | 9.9 | | | | — | | |
Acquisitions | | 25,117 | | 12,863 | | — | | 37,980 | | | 3.5 | | | | 1.8 | | | | — | | | | 5.3 | | | | 5.3 | | | | 6.1 | | | | — | | |
Total | | $ | 72,621 | | $ | 42,620 | | $ | 7,458 | | $ | 122,699 | | | 10.3 | % | | | 6.1 | % | | | 1.1 | % | | | 17.5 | % | | | 15.4 | % | | | 20.2 | % | | | 39.8 | % | |
The internal growth in net sales in North America is due to increased price and unit sales into both the wholesale and DIY markets. Our sales into the wholesale market for 2004, excluding sales from acquisitions, grew by 10% compared to 2003, primarily due to increased sales of backflow preventor units, as well as in our plumbing and under-floor radiant heating product lines. Our sales into the North American DIY market for 2004 increased by 10% compared to 2003 primarily due to increased sales of our brass and tubular products.
The increase in net sales due to foreign exchange in North America is due to the Canadian dollar appreciating against the U.S. dollar. We cannot predict whether the Canadian dollar will continue to
appreciate against the U.S. dollar in future periods or whether future foreign exchange rate fluctuations will have a positive or negative impact on our net sales.
The acquired growth in net sales in North America is due to the inclusion of net sales of Flowmatic, acquired on January 5, 2004 and Orion, acquired on May 21, 2004.
The internal growth in net sales in Europe is primarily due to increased sales into the European OEM market and market share gains in the European wholesale markets.
The increase in net sales due to foreign exchange in Europe is primarily due to the appreciation of the euro against the U.S. dollar. We cannot predict whether the euro will continue to appreciate against the U.S. dollar in future periods or whether future foreign exchange rate fluctuations will have a positive or negative impact on our net sales.
The acquired growth in net sales in Europe is due to the inclusion of the net sales of Martin Orgee, acquired on April 18, 2003, Anello, acquired on July 30, 2003,operating income from ATS, Kimsafe and TEAM, acquired on April 16, 2004.Teknigas.
The increasedecrease in net salesorganic operating income in China iswas primarily attributable to downward adjustments made in 2003 for previously recorded sales and increased sales rebates and returns recorded at our TWT joint venture located in Tianjin, China that did not repeat in 2004, and to internal growth primarily due to increased domestic shipments from our wholly-owned subsidiary located in Taizhou, China.
Gross Profit.Gross profit for 2004 increased $50,696,000, or 21.1%, compared to 2003. The increase in gross profit is attributable to the following:
| | (in thousands) | | % Change | |
Internal growth | | | $ | 31,628 | | | | 13.2 | % | |
Foreign exchange | | | 7,415 | | | | 3.1 | | |
Acquisitions | | | 13,722 | | | | 5.7 | | |
Other | | | (2,069 | ) | | | (0.9 | ) | |
Total | | | $ | 50,696 | | | | 21.1 | % | |
The internal growth is primarily due to a $21,449,000 increase in internal gross profit in the North American segment. This increase is primarily due to improved sales mix due to increased sales volume in the North American wholesale market, which typically generates higher gross margins than the North American retail market, and to benefits resulting from our completed manufacturing restructuring projects and outsourcing. The European segment increased internal gross profit by $3,972,000, primarily due to sales growth with European OEM and wholesale customers and to benefits resulting from our completed manufacturing restructuring projects. The China segment increased gross profit by $7,076,000, primarily due to inventory write-downs, increased sales rebates and returns and other net adjustments recorded in 2003 that did not repeat in 2004, and to increased sales volumes at WPT (formerly referred to as Shida) and improved manufacturing efficienciesdecreased production levels at our wholly owned manufacturing plantplants. The acquired growth in TianjinChina was due to the inclusion of the operating income of Changsha and Ningbo. In 2007, we recorded $3.3 million for asset write-downs, accelerated depreciation and severance related to our global restructuring program and $0.7 million related to our discontinuance of certain product lines. The elimination of a one-month reporting lag in 2004.two of our Chinese entities did not have a material impact on China's operating income.
The decrease in organic operating income in Corporate was primarily attributable to increased stock-based compensation costs and legal costs, partially offset by decreased incentive compensation costs.
The net increase in gross profitoperating income from foreign exchange iswas primarily due to the appreciation of the euro, and Canadian dollar against the U.S. dollar. The increase in gross profit from acquisitions is due to the inclusion of gross profit from Orion, TEAM, Flowmatic, Martin Orgee and Anello. These factors contributed to an increased consolidated gross profit percent of 35.2% for 2004 compared to 34.2% in 2003.
The increase in gross profit was partially offset by increased manufacturing restructuring and other costs. For 2004 we charged $2,873,000 of accelerated depreciation to cost of sales compared to $804,000 of accelerated depreciation and other costs for 2003.
Selling, General and Administrative Expenses.SG&A expenses for 2004 increased $37,428,000, or 22.1%, compared to 2003. The increase in SG&A expenses is attributable to the following:
| | (in thousands) | | % Change | |
Internal growth | | | $ | 20,118 | | | | 11.9 | % | |
Foreign exchange | | | 4,573 | | | | 2.7 | | |
Acquisitions | | | 7,811 | | | | 4.6 | | |
Other | | | 4,926 | | | | 2.9 | | |
Total | | | $ | 37,428 | | | | 22.1 | % | |
The internal increase in SG&A expenses is primarily due to increased variable selling expense due to increased sales volume and costs incurred to comply with the requirements of SOX partially offset by a reserve reduction due to a favorable ruling in one of our legal cases. For 2004, commission expense and selling expense were approximately 4.2% and 11.5%, respectively, of sales. These expense percentages are consistent with 2003. For 2004, we recorded approximately $5,900,000 for SOX-related expenses.
As discussed previously, during the fourth quarter of 2004, we identified and corrected errors related to certain accrued expenses. The adjustments to net income necessary to correct these errors included a pre-tax charge to SG&A expenses of $4,926,000.
Our SG&A expenses as a percentage of sales for 2004 increased to 25.1% compared to 24.1% for 2003 primarily from SOX costs and the fourth quarter accrual adjustments.
Operating Income.Operating income by geographic segment for 2004 and 2003 were as follows:
| | | | | | | | % Change to | |
| | Years Ended | | | | Consolidated | |
| | December 31, | | December 31, | | | | Operating | |
| | 2004 | | 2003 | | Change | | Income | |
| | (Dollars in thousands) | |
North America | | | $ | 68,558 | | | | $ | 64,375 | | | $ | 4,183 | | | 6.0 | % | |
Europe | | | 31,597 | | | | 22,592 | | | 9,005 | | | 12.9 | | |
China | | | 1,857 | | | | (3,834 | ) | | 5,691 | | | 8.1 | | |
Corporate | | | (18,412 | ) | | | (13,132 | ) | | (5,280 | ) | | (7.6 | ) | |
Total | | | $ | 83,600 | | | | $ | 70,001 | | | $ | 13,599 | | | 19.4 | % | |
The increase in operating income is attributable to the following:
|
|
|
|
|
|
|
|
|
|
|
| Change
|
| Change
|
|
|
|
|
|
|
|
|
|
|
|
|
| As a % of Consolidated Operating Income
|
| As a % of Segment Operating Income
|
|
|
| North
America
|
| Europe
|
| China
|
| Corp.
|
| Total
|
| North
America
|
| Europe
|
| China
|
| Corp.
|
| Total
|
| North
America
|
| Europe
|
| China
|
| Corp.
|
|
|
| Dollars in thousands)
|
|
| | | | | | | | | | | | | | | | | | | | | | | | | | | | | |
Internal growth | | $ | 9,920 | | $ | 2,065 | | $ | 5,529 | | $ | (6,004 | ) | $ | 11,510 | | | 14.2 | % | | | 3.0 | % | | | 7.9 | % | | | (8.6 | )% | | | 16.5 | % | | | 15.4 | % | | | 9.1 | % | | | 144.2 | % | | (45.7 | )% |
Foreign exchange | | 434 | | 2,408 | | — | | — | | 2,842 | | | 0.6 | | | | 3.4 | | | | — | | | | — | | | | 4.1 | | | | 0.7 | | | | 10.7 | | | | — | | | — | |
Acquisitions | | 2,285 | | 3,626 | | — | | — | | 5,911 | | | 3.3 | | | | 5.2 | | | | — | | | | — | | | | 8.4 | | | | 3.6 | | | | 16.1 | | | | — | | | — | |
Other | | (5,650 | ) | — | | — | | 724 | | (4,926 | ) | | (8.1 | ) | | | — | | | | — | | | | 1.0 | | | | (7.1 | ) | | | (8.8 | ) | | | — | | | | — | | | 5.5 | |
Other—Restructuring | | (2,806 | ) | 906 | | 162 | | — | | (1,738 | ) | | (4.0 | ) | | | 1.3 | | | | 0.2 | | | | — | | | | (2.5 | ) | | | (4.4 | ) | | | 4.0 | | | | 4.2 | | | — | |
Total | | $ | 4,183 | | $ | 9,005 | | $ | 5,691 | | $ | (5,280 | ) | $ | 13,599 | | | 6.0 | % | | | 12.9 | % | | | 8.1 | % | | | (7.6 | )% | | | 19.4 | % | | | 6.5 | % | | | 39.9 | % | | | 148.4 | % | | (40.2 | )% |
The internal growth in North America is primarily due to our increased gross profit in the wholesale market, benefits resulting from our completed manufacturing restructuring projects and outsourcing, partially offset by increased net SG&A expenses. In 2004, we experienced raw material cost increases, which we were able to recover by implementing price increases on some of our products. For 2004, we recorded $2,968,000 for costs associated with our manufacturing restructuring plan compared to $162,000 for 2003. We expect to record an additional $750,000 in the first half of 2005 for approved costs associated with our manufacturing restructuring plan. The acquired growth is due to the inclusion of operating income from Orion and Flowmatic. Other of $5,650,000 relates to compensation expense regarding the accrual adjustment.
The internal growth in Europe is primarily due to increased gross profit from the increased sales volume in the OEM and wholesale markets and to benefits resulting from our previous manufacturing restructuring projects, partially offset by increased SG&A expenses. For 2004, we did not record any costs associated with our manufacturing restructuring plan compared to $906,000 for 2003. The increase in operating income from foreign exchange is primarily due to the appreciation of the euroyuan against the U.S. dollar. We cannot predict whether the eurothese currencies will continue to appreciate against the U.S. dollar in future periods or whether future foreign exchange rate fluctuations will have a positive or negative impact on our operating income. The acquired growth includes operating
Interest Income. Interest income from TEAM, Martin Orgee and Anello.
The increaseincreased $9.5 million, or 190.0%, in internal growth in China of $5,529,000 is attributable2007 compared to inventory write-downs and other net adjustments recorded in 2003 that did not repeat in 2004, and to internal growth2006, primarily due to increased sales volumes and improved manufacturing efficiencies associated withthe investment of the net proceeds of approximately $219.0 million from the public offering of 5.75 million shares of our manufacturing plantClass A Common Stock in Tianjin, which in 2003 was in a start-up phase.
The decrease in operating income in Corporate of $5,280,000 is primarily attributable to costs incurred for compliance with SOX. Other of $724,000 includes the adjustments to correct errors for accrued expenses.November 2006.
Interest Expense.Interest expense decreased $1,544,000,increased $4.8 million, or 12.8%21.7%, for 2004in 2007 compared to 2003,2006, primarily due to overlapping interest chargesour April 27, 2006 issuance of $225.0 million 5.85% senior notes due in 2016 and an increase in the average variable rates charged on three separate senior note issues that were outstanding in 2003, while only two senior note issues remain outstanding in 2004,the revolving credit facility partially offset by the elimination of favorable amortization from our interest rate swap, increased indebtedness on our $125,000,000 senior notes and decreased indebtedness under our U.S. revolving credit facility. On September 1, 2001, we entered into an interest rate swap with respect to our $75,000,000 8.375% notes due December 2003. The swap converted the interest from fixed to floating. On August 5, 2002, we sold the swap and received $2,315,000 in cash. In 2003, we reduced interest expense by $1,420,000 by amortizing the adjustment to the fair value of the swap. The amortization of the swap was completed upon repayment of the $75,000,000 8.375% notes on December 1, 2003. On May 15, 2003, we refinanced our $75,000,000 8.375% notes with proceeds from the issuance of $125,000,000 senior notes.debt levels for acquisitions.
On Effective July 1, 2003,2005, we entered into an interest rate swap for a notional amount of €25,000,000€25.0 million outstanding on our prior revolving credit facility. We swapped the three-monthan adjustable rate of three month EURIBOR plus 0.7%,0.6% for a fixed rate of 2.3%3.02%. For 2004,We recorded a reduction to interest expense of approximately $0.7 million to recognize the EURIBOR rate did not fluctuate materially andfair value of the impact ofswap for 2006. The swap was immaterialterminated on October 3, 2006.
Other (Income) Expense. Other (income) expense increased $3.2 million, or 355.6% in 2007 compared to 2006, primarily due to currency movements and losses on forward currency contracts. Foreign currency losses were recorded in Europe, Canada and China in 2007, whereas foreign currency gains were recorded in 2006.
Minority interest. Minority interest increased $1.0 million, or 55.6%, for 2007 compared to 2006, primarily due to the overall interest expense.credit recorded for the 40% liability of our joint venture partner's share in the recording of the $2.4 million TWT restructuring costs.
Income Taxes.Our effective tax rate for continuing operations for 2004 decreased to 32.9%31.8% in 2007 from 38.0% for 2003.33.6% in 2006. The decrease is primarily due to improvementsa one-time benefit associated with a refund of withholding taxes in Italy and in 2006 the resultsrecording of our Chinese operations that have allowed us to recognizehigher taxes on the benefitsale of two buildings. This decrease is partially offset by the recording of a $3.2 million valuation allowance on the deferred tax assets and also have provided a favorable mix of earnings. We also recognized the benefit of a significant amount of state income tax credits in 2004. In addition, a credit of $462,000 was recorded for accounting corrections made in the fourth quarter of 2004 for an accrual that was related to prior years.our 60% owned Chinese joint venture.
35
Income From Continuing Operations.Income from continuing operations for 2004in 2007 increased $12,319,000,$0.5 million, or 33.8%0.6%, to $48,738,000,$77.6 million, or $1.49$1.99 per common share, from $36,419,000,$77.1 million, or $1.32$2.29 per common share, for 2003,2006, in each case, on a diluted basis. Income from continuing operations for 2007 includes a tax refund of $1.9 million, or $0.05 per common share. Income from continuing operations for 2007 and 2006 included costs, net of tax, from our restructuring plan and product line discontinuances of $5.1 million, or $0.13 per common share, and included income, net of tax, of $1.5 million, or $0.04 per share, respectively. In 2006, the gains on the sales of our buildings in Italy resulted in an after-tax gain of $5.1 million, or $0.15 per share. The appreciation of the euro, Chinese yuan and the Canadian dollar against the U.S. dollar resulted in a positive impact on income from continuing operations of $0.05$0.09 per common share for 20042007 compared to 2003.the comparable period last year. We cannot predict whether the euro, or the Canadian dollar or yuan will continue to appreciate or depreciate against the U.S. dollar in future periods or whether future foreign exchange rate fluctuations will have a positive or negative impact on our net income.
Additionally, in November 2006, the Company completed a public offering of 5.75 million shares of Class A Common Stock and received net proceeds of approximately $219.0 million. The interest earned on the net proceeds provided approximately $7.1 million in after-tax income in 2007. The issuance of an additional 5.75 million shares had a dilutive impact on earnings per share of $0.11 per share in 2007, after considering the interest income from the net proceeds.
Loss From Discontinued Operations. Loss from discontinued operations in 2007 and 2006 was $0.2 million, or $0.01 per common share, and $3.4 million, or $0.10 per common share, on a diluted basis for the comparable period. The losses for 2007 and 2006 were primarily attributable to increased deductible costs in 2006 and legal fees associated with the James Jones Litigation, as described in Part I, Item 1, "Business-Product Liability, Environmental and Other Litigation Matters." The 2007 loss was partially offset by reserve adjustments.
Year Ended December 31, 2006 Compared to Year Ended December 31, 2005
Net Sales. Our business is reported in three geographic segments: North America, Europe and China. Our net sales in each of these segments for the years ended December 31, 2006 and 2005 were as follows:
| | Year Ended
December 31, 2006
| | Year Ended
December 31, 2005
| |
| |
| |
|---|
| |
| | Change to
Consolidated
Net Sales
| |
|---|
| | Net Sales
| | % Sales
| | Net Sales
| | % Sales
| | Change
| |
|---|
| | (Dollars in millions)
| |
|---|
| North America | | $ | 821.3 | | 66.7 | % | $ | 629.9 | | 68.2 | % | $ | 191.4 | | 20.7 | % |
| Europe | | | 367.5 | | 29.9 | | | 266.3 | | 28.8 | | | 101.2 | | 11.0 | |
| China | | | 42.0 | | 3.4 | | | 28.1 | | 3.0 | | | 13.9 | | 1.5 | |
| | |
| |
| |
| |
| |
| |
| |
| Total | | $ | 1,230.8 | | 100.0 | % | $ | 924.3 | | 100.0 | % | $ | 306.5 | | 33.2 | % |
| | |
| |
| |
| |
| |
| |
| |
The increase in net sales is attributable to the following:
| |
| |
| |
| |
| | Change
As a % of Consolidated
Net Sales
| | Change
As a % of Segment
Net Sales
| |
|---|
| | North
America
| | Europe
| | China
| | Total
| | North
America
| | Europe
| | China
| | Total
| | North
America
| | Europe
| | China
| |
|---|
| | (Dollars in millions)
| |
|---|
| Organic growth | | $ | 54.0 | | $ | 45.2 | | $ | 3.0 | | $ | 102.2 | | 5.9 | % | 4.9 | % | .3 | % | 11.1 | % | 8.6 | % | 17.0 | % | 10.6 | % |
| Foreign exchange | | | 3.5 | | | 7.1 | | | .9 | | | 11.5 | | .3 | | .8 | | .1 | | 1.2 | | .6 | | 2.7 | | 3.0 | |
| Acquisitions | | | 133.9 | | | 48.9 | | | 10.0 | | | 192.8 | | 14.5 | | 5.3 | | 1.1 | | 20.9 | | 21.2 | | 18.3 | | 35.9 | |
| | |
| |
| |
| |
| |
| |
| |
| |
| |
| |
| |
| |
| Total | | $ | 191.4 | | $ | 101.2 | | $ | 13.9 | | $ | 306.5 | | 20.7 | % | 11.0 | % | 1.5 | % | 33.2 | % | 30.4 | % | 38.0 | % | 49.5 | % |
| | |
| |
| |
| |
| |
| |
| |
| |
| |
| |
| |
| |
The organic growth in net sales in North America was due to increased price and unit sales in certain product lines into both the wholesale and DIY markets. Our wholesale market in 2006, excluding the sales from the acquisitions of Alamo, Savard, Calflex, Flexflow, Core and Dormont, grew by 9.7% compared to 2005, primarily due to increased sales of water pressure regulators, relief valves and backflow preventer units, as well as in our plumbing and under-floor radiant heating product lines. Our sales into the North American DIY market in 2006 increased by 5.4% compared to 2005, primarily due to increased sales of fittings and supply lines and plumbing and under-floor radiant heating product lines partially offset by fewer new retail product introductions in 2006 than during 2005.
The acquired growth in net sales in North America was due to the inclusion of net sales of Alamo, acquired on June 20, 2005, Savard, acquired on July 8, 2005, Flexflow, acquired on November 4, 2005, Core, acquired on December 2, 2005, Dormont, acquired on December 28, 2005, and Calflex acquired on June 2, 2006.
The organic sales growth in Europe was broad-based with most markets and channels exhibiting improvement. Our sales into the wholesale and OEM markets in 2006, excluding the sales from the acquisitions of Electro Controls, Microflex, ATS, Kimsafe and Teknigas, grew by 18.5% and 16.4% respectively, compared to 2005.
The acquired growth in net sales in Europe was due to the inclusion of the net sales of Electro Controls, acquired on May 11, 2005, Microflex, acquired on July 5, 2005, ATS, acquired on May 19, 2006, Kimsafe, acquired on June 7, 2006, and Teknigas, acquired on August 14, 2006.
The organic sales growth in China was due to increased sales into the domestic and export markets, partially offset by decreased sales due to an approximately four- week work stoppage at our joint-venture facility in Tianjin. Additionally, the yuan strengthened against the U.S. dollar.
The acquired growth in net sales in China was due to the inclusion of the net sales of Changsha, acquired on April 26, 2006, and Ningbo, acquired on June 2, 2006.
The increases in net sales due to foreign exchange in North America, Europe and China were primarily due to the appreciation of the Canadian dollar, euro and yuan, respectively, against the U.S. dollar.
Gross Profit. Gross profit and gross margin for 2006 and 2005 were as follows:
| | Year Ended
December 31,
| |
| |
|---|
| | Point
Change
| |
|---|
| | 2006
| | 2005
| |
|---|
| | (dollars in millions)
| |
| |
|---|
| Gross profit | | $ | 425.0 | | $ | 324.7 | | | |
| Gross margin | | | 34.5 | % | | 35.1 | % | (.6 | %) |
Gross margin for 2006 decreased slightly from 2005. Raw materials cost increases have been predominantly offset by increased sales prices with the exception of the North American retail market and certain markets in Europe. In particular, price increases have been difficult to pass along to customers in Germany. Margins have also been negatively affected by sales of lower margin products sold by Core and by European acquisition costs. North American gross margin percentage decreases were partially offset by a favorable sales mix toward higher margin wholesale sales.
Margins were also negatively affected in 2006 by increased charges related to our manufacturing restructuring efforts. We recorded $4.7 million to cost of sales for primarily severance costs in 2006 as compared to $1.8 million in 2005 for accelerated depreciation and other costs.
Selling, General and Administrative Expenses. Selling, general and administrative expenses, or SG&A expenses, for 2006 increased $70.8 million, or 30.8%, compared to 2005. The increase in SG&A expenses is attributable to the following:
| | (in millions)
| | % Change
| |
|---|
| Organic growth | | $ | 24.6 | | 10.7 | % |
| Foreign exchange | | | 2.1 | | .9 | |
| Acquisitions | | | 44.1 | | 19.2 | |
| | |
| |
| |
| Total | | $ | 70.8 | | 30.8 | % |
| | |
| |
| |
The organic increase in SG&A expenses was primarily due to increased variable selling expenses due to increased sales volumes, increased insurance costs, increased compensation costs and corporate administration costs including costs incurred for compliance with FAS 123R, partially offset by lower costs for complying with Section 404 of the Sarbanes-Oxley Act of 2002 (SOX) and lower earn-out costs related to a prior acquisition. The increase in SG&A expenses from foreign exchange was primarily due to the appreciation of the euro, Canadian dollar and yuan against the U.S. dollar. The increase in SG&A expenses from acquisitions was due to the inclusion of Electro Controls, Alamo, Microflex, Savard, Flexflow, Core, Dormont, Changsha, ATS, Calflex, Ningbo, Kimsafe and Teknigas.
Restructuring and Other (Income) Charges. Restructuring and other (income) charges for 2006 decreased $6.4 million primarily due to a gain of approximately $8.2 million related to the sale of two buildings in Italy partially offset by a charge of $2.5 million primarily for severance costs related to our European restructuring plans. During 2005, we recorded $0.7 million primarily for severance costs related to our European restructuring plans.
Operating Income. Operating income by geographic segment for 2006 and 2005 was as follows:
| | Years Ended
| |
| |
| |
|---|
| |
| | % Change to
Consolidated
Operating
Income
| |
|---|
| | December 31,
2006
| | December 31,
2005
| | Change
| |
|---|
| | (Dollars in millions)
| |
|---|
| North America | | $ | 98.5 | | $ | 79.1 | | $ | 19.4 | | 20.6 | % |
| Europe | | | 50.0 | | | 31.5 | | | 18.5 | | 19.5 | |
| China | | | 7.2 | | | 3.5 | | | 3.7 | | 3.8 | |
| Corporate | | | (25.2 | ) | | (19.5 | ) | | (5.7 | ) | (5.9 | ) |
| | |
| |
| |
| |
| |
| Total | | $ | 130.5 | | $ | 94.6 | | $ | 35.9 | | 38.0 | % |
| | |
| |
| |
| |
| |
The change in operating income is attributable to the following:
| |
| |
| |
| |
| |
| | Change
As a % of Consolidated
Operating Income
| | Change
As a % of Segment
Operating Income
| |
|---|
| | North
America
| | Europe
| | China
| | Corp.
| | Total
| | North
America
| | Europe
| | China
| | Corp.
| | Total
| | North
America
| | Europe
| | China
| | Corp.
| |
|---|
| | (Dollars in millions)
| |
|---|
| Organic growth | | $ | 6.4 | | $ | 7.5 | | $ | 6.8 | | $ | (5.7 | ) | $ | 15.0 | | 6.9 | % | 7.8 | % | 7.1 | % | (5.9 | )% | 15.9 | % | 8.2 | % | 23.4 | % | 189.4 | % | (28.5 | )% |
| Foreign exchange | | | .8 | | | .9 | | | .3 | | | — | | | 2.0 | | .8 | | 1.0 | | .3 | | — | | 2.1 | | 1.0 | | 3.0 | | 8.3 | | — | |
| Acquisitions | | | 11.2 | | | 2.5 | | | 1.7 | | | — | | | 15.4 | | 11.8 | | 2.7 | | 1.8 | | — | | 16.3 | | 14.1 | | 8.1 | | 47.9 | | — | |
| Restructuring/other | | | 1.0 | | | 7.6 | | | (5.1 | ) | | — | | | 3.5 | | 1.1 | | 8.0 | | (5.4 | ) | — | | 3.7 | | 1.3 | | 24.0 | | (143.1 | ) | — | |
| | |
| |
| |
| |
| |
| |
| |
| |
| |
| |
| |
| |
| |
| |
| |
| Total | | $ | 19.4 | | $ | 18.5 | | $ | 3.7 | | $ | (5.7 | ) | $ | 35.9 | | 20.6 | % | 19.5 | % | 3.8 | % | (5.9 | )% | 38.0 | % | 24.6 | % | 58.5 | % | 102.5 | % | (28.5 | )% |
| | |
| |
| |
| |
| |
| |
| |
| |
| |
| |
| |
| |
| |
| |
| |
The organic growth in North America was primarily due to our increased gross profit from price increases and a favorable sales mix towards the wholesale market, benefits resulting from our completed manufacturing restructuring projects and product outsourcing, partially offset by increased net SG&A expense and inventory write-downs. In 2006, we did not record any costs associated with our manufacturing restructuring plan compared to costs of $1.0 million for 2005. The acquired growth was due to the inclusion of operating income from Alamo, Savard, Flexflow, Core, Dormont and Calflex.
The organic growth in Europe was primarily due to increased gross profit from price and unit increases in the wholesale and OEM markets and benefits resulting from our completed manufacturing restructuring projects, partially offset by increased net SG&A expense. In 2006, we recorded a net gain of $6.0 million associated with our manufacturing restructuring plan compared to a charge of $1.5 million for 2005. We recorded a gain of $8.2 million for the building sales in Italy partially offset by $2.2 million primarily for severance costs. The acquired growth in Europe was due to the inclusion of the operating income from Electro Controls, Microflex, ATS, Kimsafe and Teknigas.
The increase in organic growth in China was attributable to sales volume increase, favorable material purchases and improved manufacturing efficiencies associated with our wholly owned manufacturing plants, partially offset by increased net SG&A expense. The acquired growth in China was due to the inclusion of the operating income from Changsha and Ningbo. In 2006, we recorded $5.1 million of severance and accelerated depreciation costs associated with the planned move of our Chinese joint venture facility. We did not record any costs associated with our manufacturing restructuring plan in 2005.
The decrease in organic operating income in Corporate was primarily attributable to incremental administration charges for variable compensation including costs incurred for compliance with FAS 123R, increased audit costs and increased pension costs, partially offset by lower costs incurred for SOX compliance.
The net increase in operating income from foreign exchange was primarily due to the appreciation of the euro, Canadian dollar and yuan against the U.S. dollar.
Interest Income. Interest income increased $3.8 million, or 307.0%, for 2006 compared to 2005, primarily due to the investment of the residual proceeds from the private placement of $225.0 million 5.85% senior notes in April 2006 and the net proceeds from the public offering of 5.75 million shares of our Class A Common Stock in November 2006.
Interest Expense. Interest expense increased $11.7 million, or 113.9%, for 2006 compared to 2005, primarily due to interest expense associated with our $225.0 million 5.85% senior notes, increased debt levels for acquisitions made in 2005 and 2006, and an increase in the average variable rates charged on the revolving credit facility.
Effective July 1, 2005, we entered into an interest rate swap for a notional amount of €25.0 million outstanding on our revolving credit facility. We swapped an adjustable rate of three month EURIBOR plus 0.6% for a fixed rate of 3.02%. We recorded a reduction to interest expense of approximately $0.7 million to recognize the fair value of the swap for 2006. The swap was terminated on October 3, 2006.
Other (Income) Expense. Other (income) expense increased $0.2 million, or 27.6%, for 2006 compared to 2005, primarily due to the gains on settlements of officers' life insurance policies.
Minority interest. Minority interest increased $2.1 million, or 622.3%, for 2006 compared to 2005, primarily due to the credit recorded for the 40% liability of our joint venture partner's share in the recording of the $5.1 million manufacturing restructuring costs.
Income Taxes. Our effective tax rate for continuing operations decreased to 33.6% in 2006 from 35.9% in 2005. The decrease is primarily due to higher earnings in our European and China segments. The shift in the mix of earnings to these segments causes our rate to decrease as these segments have lower effective tax rates than our worldwide average. The effect of the European earnings mix is partially offset by a higher effective tax from the gain on the sales of our Italian facilities. We were able to claim tax credits based on qualified fixed asset purchases in China that helped reduce the worldwide rate.
Income From Continuing Operations. Income from continuing operations for 20042006 increased $22.1 million, or 40.1%, to $77.1 million, or $2.29 per common share, from $55.0 million, or $1.67 per common share, for 2005, in each case, on a diluted basis. Income from continuing operations for 2006 and 20032005 includes income, net costs incurredof tax, for our manufacturing restructuring plan of $1,825,000,$1.5 million, or ($0.06)$0.04 per share, and $1,084,000,costs of $1.6 million, or ($0.04)0.05) per share, respectively. Also includedThe gains on the sales of our buildings in Italy resulted in an after-tax gain of $5.1 million, or $0.15 per share. The appreciation of the Canadian dollar, euro and Chinese yuan against the U.S. dollar resulted in a positive impact on income from continuing operations for 2004 is the net charge of $2,289,000,$1.3 million, or ($0.07)$0.04 per share, for accounting corrections relating2006 compared to certain accrued expenses.2005.
Loss From Discontinued Operations.OperationsWe recorded a charge, net of tax, to discontinued operations for 20042006 and 2005 of $1,918,000,$3.4 million, or ($0.06)0.10) per common share, and $3,057,000,$0.4 million, or ($0.11)0.01) per common share, for 2003,respectively, in each case, on a diluted basis. IncludedIn the third quarter of 2006, we recorded a pre-tax charge of $5.0 million due to a recent federal appellate court decision which affirmed that an arbitration panel could decide which deductible agreements between Watts and Zurich American Insurance Company (Zurich) would control Zurich's reimbursement claim for defense costs paid in loss from discontinued operations for 2004 arethe James Jones case. Other charges were primarily attributable to legal fees associated with the James Jones litigation, and obligations to the former shareholders of the James Jones Company of $1,125,000, or ($0.04) per share, compared to $3,111,000, or ($0.11) per share, for 2003. Seeas described in Part I, Item 1, “Business—Product1. "Business-Product Liability, Environmental and Other Litigation Matters.” Additionally, losses"
Liquidity and Capital Resources
We generated $91.7 million of cash from continuing operations in 2007. We experienced increases in inventory in North America and China. The increases were primarily due to increased raw material costs. There was also a decrease in accounts payable, accrued expenses and other liabilities, primarily in Europe and North America. In Europe, accounts payable declined in 2007 due to a decline in
inventory. In North America, payments for cash compensation increased in 2007. Also, cash payments to cover income tax obligations were greater during 2007. Accounts receivable decreased in all three segments.
We used $87.4 million of net cash for investing activities in 2007. We invested $37.8 million in capital equipment as part of our ongoing commitment to improve our manufacturing capabilities. We invested $27.5 million in investment grade auction rate securities. We used $18.1 million to fund the acquisitions of Topway. We paid $4.5 million for additional acquisition costs related to prior years acquisitions. We expect to invest approximately $35.0 in capital equipment in 2008.
Recent distress in the markets has had an adverse impact on market activities including, among other things, volatility in security prices, diminished liquidity, rating downgrades of certain investments and declining valuations of others. We have assessed the implications of these factors on our current business and determined that there has not been a significant impact to our financial position, results of operations or liquidity during 2007.
We used $66.5 million of net cash from financing activities in 2007. This was primarily due to payments of debt, payments for our stock repurchase program and dividend payments, partially offset by increased borrowings under our line of credit and tax benefits from the exercise of stock awards.
In April 2006, we amended our revolving credit facility with a syndicate of banks to provide for multi-currency unsecured borrowings and stand-by letters of credit of up to $350.0 million and to extend the maturity date through April 2011. The revolving credit facility is being used to support our acquisition program, working capital requirements and for general corporate purposes.
Outstanding indebtedness under the revolving credit facility bears interest at a rate determined by the type of loan plus an applicable margin determined by our debt rating, depending on the applicable base rate and our bond rating. For 2007 the average interest rate under the revolving credit facility for euro-based borrowings was approximately 4.6%. There were no U.S. dollar borrowings at December 31, 2007. The revolving credit facility includes operational and financial covenants customary for facilities of this type, including, among others, restrictions on additional indebtedness, liens and investments and maintenance of certain leverage ratios. As of December 31, 2007, we were in compliance with all covenants related to the revolving credit facility, had $234.4 million of unused and potentially available credit under the revolving credit facility and had $81.8 million of euro-based borrowings outstanding and $33.8 million for stand-by letters of credit outstanding on our revolving credit facility.
We generated $0.1 million of net cash from discontinued operations in 2007. We paid approximately $0.5 million for 2004defense costs and 2003 includeapproximately $0.5 million for other legal costs we incurred in the James Jones Litigation. We also received $1.0 million for indemnity payments.
Working capital (defined as current assets less current liabilities) as of December 31, 2007 was $667.0 million compared to $653.0 million as of December 31, 2006. This increase was primarily due to an impairment chargeincrease in inventories and lower accounts payable, partially offset by an operating loss totaling $793,000, or ($0.02) per share,increase in accrued expenses. Cash and incomecash equivalents decreased to $290.3 million as of $54,000, or $0.00 per share, respectively,December 31, 2007 compared to $343.0 million as of December 31, 2006 primarily due to cash used to repurchase stock, fund capital expenditures and investments. The ratio of current assets to current liabilities was 3.3 to 1 as of December 31, 2007 compared to 3.2 to 1 as of December 31, 2006.
We generated $83.0 million of cash from continuing operations for 2006. We experienced an increase in inventory and accounts receivable in North America, Europe and China. The increase in accounts receivable of $17.0 million was primarily due to increased sales volume and selling prices. The increase in inventory of $37.3 million was primarily due to increased cost of raw materials and planned increases in European safety stocks. The increase in inventory and accounts receivable was partially offset by increased accounts payable, accrued expenses and other liabilities of $29.5 million.
We used $119.2 million of net cash for investing activities in 2006. We used $91.1 million to fund the acquisitions of Changsha, ATS, Calflex and Ningbo, Kimsafe and Teknigas, $1.9 million in
additional costs related to 2005 acquisitions and $0.4 million to complete the planned increase of our ownership in Stern. We invested $11.8 million in investment grade auction rate securities and $44.7 million in capital equipment. Capital expenditures consisted of approximately $26.7 million for manufacturing machinery and equipment and approximately $18.0 million for the planned divesturepurchase of land and a building and for infrastructure improvements for a site in Italy. We subsequently entered into a sale-leaseback transaction with respect to the building. We received proceeds of $31.9 million, which primarily included $16.0 million related to the sale-leaseback in Italy and $13.4 million from the sales of two facilities in northern Italy. We also received proceeds from two buildings held for sale, totaling approximately $2.5 million during 2006.
We generated $331.3 million of net cash from financing activities for 2006. On November 21, 2006, we completed a public offering of 5.75 million shares of newly issued Class A Common Stock at $40.00 per share. Net proceeds were approximately $218.6 million after taking into account underwriting discounts and expenses associated with the transaction. Additionally, we generated cash through the completion of our interest$225.0 million private placement of 5.85% notes in Jameco LLC.April 2006, increased borrowings under our line of credit for use in Europe and proceeds from the exercise of stock options, partially offset by payments of debt, dividend payments and debt issue costs.
Liquidity and Capital Resources
We generated $51,867,000$0.9 million of net cash by operations from discontinued operations in 2006. We also received approximately $2.8 million in cash for reimbursement of defense costs related to the James Jones Litigation. During 2006, we paid approximately $0.6 million for defense costs and approximately $0.5 million for indemnity costs we incurred in the James Jones Litigation.
We generated $53.1 million of cash from continuing operations in 2005. We experienced an increase in accounts receivable in North America, Europe and China totaling $16,546,000.$16.5 million. This increase is primarily due to increased sales volume. Additionally, we experienced an increase in inventories in North America, Europe and China totaling $20,330,000.$20.3 million. A portion of the overall increase in inventory is due to the increased costs of raw materials. The increase in inventory in Europe is primarily due to increased finished goods to support the delivery requirements of OEM customers in Europe and an increase in safety stocks during restructuring. North American and China inventories increased primarily due to the incremental volume of products being sourced from our extended China supply chain. The increase in inventory and accounts receivable was partially offset by increased accounts payable of approximately $14,257,000.$14.3 million.
We used $183,203,000$183.2 million of net cash for investing activities in 2005. We used $191,396,000$191.4 million to fund the acquisitions of Dormont, Core, Flexflow, Savard, Microflex, Alamo, Electro Controls, HF and Sea Tech. We also invested $18,590,000$18.6 million in capital equipment. Capital expenditures were primarily for manufacturing machinery and equipment as part of our ongoing commitment to improve our manufacturing capabilities. We expect to invest approximately $25,000,000 in capital equipment in 2006. We generated $26,600,000$26.6 million by the sale of investment securities.
We generated $112,924,000$111.7 million of net cash from financing activities in 2005 primarily from increased borrowings in the U.S. and Europe for acquisitions and proceeds from the exercise of stock options, offset by dividend payments and payments of debt. We paid $3,750,000$3.8 million of debt owed to the former shareholders of Hunter Innovations, leaving a balance of $3,750,000 remaining to be paid in May 2006.Innovations.
Our revolving credit facility with a syndicate of banks (the Revolving Credit Facility) provides for multi-currency unsecured borrowings and stand-by letters of credit of up to $300,000,000 and matures in September 2009. The Revolving Credit Facility is being used to support our acquisition program, working capital requirements and for general corporate purposes.
Outstanding indebtedness under the Revolving Credit Facility bears interest at a rate determined by the type of loan plus an applicable margin determined by the Company’s debt rating, depending on the
applicable base rate and our bond rating. For 2005 the average interest rate under the Revolving Credit Facility for U.S. dollar borrowings was approximately 5.0% and euro based borrowings was approximately 2.7%. We had approximately $100,096,000 of unused and potentially available revolving credit at December 31, 2005. At December 31, 2005, we had $127,000,000 for U.S dollar denominated debt and $40,263,000 for euro-based borrowings outstanding on our Revolving Credit Facility. Additionally, we had $32,641,000 outstanding for stand-by letters of credit on our Revolving Credit Facility at December 31, 2005. The Revolving Credit Facility includes operational and financial covenants customary for facilities of this type, including, among others, restrictions on additional indebtedness, liens and investments and maintenance of certain leverage ratios. At December 31, 2005, we were in compliance with all covenants related to the Revolving Credit Facility.
Effective July 1, 2005, we entered into a three-year interest rate swap with a counter party for a notional amount of €25,000,000, which is outstanding under our Revolving Credit Facility. We swapped the three-month EURIBOR plus 0.6% for a fixed rate of 3.02%. We have designated the swap as a hedge using the cash flow method. At December 31, 2005, the fair value of the swap was approximately $484,000.
We previously entered into an interest rate swap for a notional amount of €25,000,000 outstanding under our revolving credit facility that expired on June 30, 2005. The term of the swap was two years. We swapped the three-month EURIBOR plus 0.7% for a fixed rate of 2.3%. We designated the swap as a hedging instrument using the cash flow method.
We used $1,050,000$1.1 million of net cash for discontinued operations. During 2005, weoperations in 2005. We received approximately $548,000$0.5 million in cash as a settlement payment for indemnification costs we incurred in the James Jones case. An offsetting liability has been recorded at December 31, 2005 because of the possibility that we might have to reimburse the insurance company if it is ultimately successful with a future appeal. We also received approximately $2,100,000$2.1 million in cash for reimbursement of defense costs related to the James Jones case. During 2005, we paid approximately $2,503,000$2.5 million for defense costs, $550,000$0.6 million for legal costs and approximately $1,021,000$1.0 million for indemnity costs we incurred in the James Jones case.
Working capital (defined as current assets less current liabilities) as of December 31, 2005 was $305,092,000 compared to $303,374,000 as of December 31, 2004. The ratio of current assets to current liabilities was 2.4 to 1 as of December 31, 2005 compared to 2.6 to 1 as of December 31, 2004. Cash and cash equivalents were $45,758,000 as of December 31, 2005 compared to $65,913,000 as of December 31, 2004. This decrease in cash was primarily due to cash paid for acquisitions, increased working capital requirements and capital expenditures, offset by the sale of investment securities.
In May 2005, we filed a universal shelf registration statement on Form S-3 with the Securities and Exchange Commission, pursuant to which we registered $300,000,000 of an indeterminate amount of debt and/or equity securities. We expect that funds from any offerings would be used to finance acquisitions and working capital, repay or refinance debt and for other general corporate purposes. We generated $40,210,000 of cash from continuing operations in 2004. We experienced an increase in inventory in North America and China. The North America increase was primarily due to planned increases in finished goods as we set up additional distribution centers and a lengthened supply chain from producing more products abroad and increased sales volume. In addition, due to the cost increases in certain raw materials, the carrying value of our inventory in North America for 2004 has increased approximately $9,000,000 compared to 2003. Additionally, we experienced an increase in accounts receivable in North America partially offset by a decrease in Europe. The North America increase was primarily due to increased sales volume and timing of certain cash receipts from certain large customers.
We used $111,379,000 of net cash from investing activities in 2004. We invested $20,999,000 in capital equipment. Capital expenditures were primarily for manufacturing machinery and equipment as part of our ongoing commitment to improve our manufacturing capabilities. We received $2,143,000 of proceeds primarily from a sale of one of our North American manufacturing facilities with respect to which we
entered into a sale and lease back arrangement. Our business acquisitions, net of cash acquired, consisted of cash purchases of $16,796,000 for the assets of Flowmatic, $5,750,000 for the 40% equity interest in Shida that had been held by our former joint venture partner, $17,247,000 for the TEAM acquisition, $27,873,000 for the Orion acquisition and $787,000 for an additional 34% investment in Watts Stern Rubinetti S.r.l. Additionally, our net investment in securities, primarily investment grade auction rate securities, increased to $26,600,000 in 2004 from $4,000,000 in 2003.
We used $16,526,000 of net cash from financing activities in 2004 primarily for dividend payments, debt repayment in China and $3,750,000 of debt paid to the former shareholders of Hunter Innovations partially offset by proceeds from stock option exercises.
We generated $52,303,000 of net cash from continuing operations in 2003. We experienced an increase in inventories in North America, Europe and China. The increase in inventory in North America was primarily due to planned increases in imported raw materials and finished goods to support our delivery capability as we extended our supply chain to lower cost regions, as well as an increase in inventory to support increased retail business. The increase in inventory in Europe was primarily due to increased safety stock growth to cover planned distribution relocations and to support the delivery requirements of OEM customers in Europe. The increase in inventory in China was the result of our wholly-owned manufacturing plant start-up operations. We had reductions in accounts receivable in Europe and China, partially offset by increased accounts receivable in North America. The increase in North America was due to increased sales volume. We funded $6,800,000 into our pension plans in the year ended December 31, 2003.
We used $37,747,000 of net cash for investing activities in 2003. We invested $20,030,000 in capital equipment for the year ended December 31, 2003. Capital expenditures were primarily for manufacturing machinery and equipment as part of our ongoing commitment to improve our manufacturing capabilities. The two largest components of this expenditure were for a building added to our Shida joint venture facility in Taizhou, China and for additional machinery and equipment for our wholly-owned manufacturing plant in Tianjin, China. On January 29, 2003, we invested an additional $3,040,000 in our Shida joint venture, bringing our total amount to approximately $8,040,000. This joint venture was owned 60% by us and 40% by our Chinese partner. In addition, on April 18, 2003, we paid approximately $1,600,000 to acquire Martin Orgee UK Limited, and on July 30, 2003, we paid approximately $10,600,000, which is net of cash acquired of $1,400,000, to acquire Giuliani Anello S.r.l.
We generated $122,079,000 of net cash from financing activities in 2003. On December 10, 2003, we completed a public offering of 4,600,000 shares of newly issued Class A Common Stock at $19.00 per share. Net proceeds were approximately $82,500,000, after taking into account underwriter discounts and expenses associated with the transaction. On May 6, 2003 we paid $3,750,000 of debt owed to the former shareholders of Hunter Innovations, leaving a balance of $11,250,000 remaining to be paid.
We had free cash flow of $23,449,000 (defined$54.5 million (a non-GAAP financial measure defined as net cash provided by continuing operations minus capital expenditures and dividends plus proceeds from sale of assets) during the year ended December 31, 20052007 versus free cash flow of $12,283,000$70.2 million in 2004.2006. This increasedecrease in 20052007 compared to 20042006 was primarily due to decreased growththe proceeds from the sale of property, plant and equipment in inventories
2006 partially offset by increased accounts receivable.growth in cash generated by operations. Our net debt to capitalization ratio (defined as short and long-term interest-bearing liabilities less cash and cash equivalents as a percentage of the sum of short and long term interest-bearing liabilities less cash and cash equivalents plus total stockholders’ equity, including minority interest)stockholders' equity) increased to 33.1%13.5% for 20052007 from 19.3%11.4% for 2004.2006. The increase resulted from an increase in net debt, to fund acquisitions and a decreasepartially offset by an increase in cash due to other working capital requirements in 2005 and payments made for such acquisitions.stockholders' equity.
We had free cash flow of $12,283,000$70.2 million during the year ended December 31, 20042006 versus free cash flow of $27,179,000$35.2 million in 2003.2005. This decreaseincrease in 20042006 compared to 20032005 was primarily due to increased growth in
inventories, increased accounts receivable and increased dividends partially offset cash generated by increases in accrued expenses.operations, less net capital expenditures.
We believe free cash flow to be an appropriate supplemental measure of theour operating performance of our Company because it provides investors with a measure of our ability to generate cash, to repay debt and to fund acquisitions. Our computationWe may not be comparable to other companies that may define free cash flow differently. Free cash flow does not represent cash generated from operating activities in accordance with GAAP. Therefore it should not be considered an alternative to net cash provided by operations as an indication of our performance. Free cash flow should also not be considered an alternative to net cash provided by operations as defined by GAAP.
A reconciliation of net cash provided by continuing operations to free cash flow is provided below:
| | Years Ended December 31, | | | Years Ended December 31,
| |
|---|
| | 2005 | | 2004 | | 2003 | | | 2007
| | 2006
| | 2005
| |
|---|
| | (in thousands) | | | (in millions)
| |
|---|
Net cash provided by continuing operations | | $ | 51,867 | | $ | 40,210 | | $ | 52,303 | | | $ | 91.7 | | $ | 83.0 | | $ | 53.1 | |
Less: additions to property, plant, and equipment | | (18,590 | ) | (20,999 | ) | (20,030 | ) | | (37.8 | ) | | (44.7 | ) | | (18.6 | ) |
Plus: proceeds from the sale of property, plant, and equipment | | 652 | | 2,143 | | 1,765 | | | .6 | | 31.9 | | .7 | |
Less: dividends | | (10,480 | ) | (9,071 | ) | (6,859 | ) | |
| | | |
| |
| |
| |
Free cash flow | | $ | 23,449 | | $ | 12,283 | | $ | 27,179 | | | $ | 54.5 | | $ | 70.2 | | $ | 35.2 | |
| | | |
| |
| |
| |
Our net debt to capitalization ratio is not computed in accordance with GAAP.also a non-GAAP financial measure used by management. Management believes it to be an appropriate supplemental measure because it helps investors understand our ability to meet our financing needs.needs and as a basis to evaluate our financial structure. Our computation may not be comparable to other companies that may define net debt to capitalization differently.
A reconciliation of long-term debt (including current portion) to net debt and our net debt to capitalization ratio is provided below:
| | December 31, | | | December 31,
| |
|---|
| | 2005 | | 2004 | | | 2007
| | 2006
| |
|---|
| | (in thousands) | | | (in millions)
| |
|---|
Current portion of long-term debt | | $ | 13,635 | | $ | 4,981 | | | $ | 1.3 | | $ | 7.5 | |
Plus: long-term debt, net of current portion | | 293,350 | | 180,562 | | | 432.2 | | 441.7 | |
Less: cash and cash equivalents | | (45,758 | ) | (65,913 | ) | | (290.3 | ) | | (343.0 | ) |
| | | |
| |
| |
Net debt | | $ | 261,227 | | $ | 119,630 | | | $ | 143.2 | | $ | 106.2 | |
| | | |
| |
| |
A reconciliation of capitalization is provided below:
| | December 31, | | | December 31,
| |
|---|
| | 2005 | | 2004 | | | 2007
| | 2006
| |
|---|
| | (in thousands) | | | (in millions)
| |
|---|
Net debt | | $ | 261,227 | | $ | 119,630 | | | $ | 143.2 | | $ | 106.2 | |
Total stockholders’ equity | | 519,476 | | 492,788 | | |
Plus: minority interest | | 7,831 | | 7,515 | | |
| Total stockholders' equity | | | 915.5 | | 826.6 | |
| | | |
| |
| |
Capitalization | | $ | 788,534 | | $ | 619,933 | | | $ | 1,058.7 | | $ | 932.8 | |
| | | |
| |
| |
Net debt to capitalization ratio | | 33.1 | % | 19.3 | % | | 13.5 | % | | 11.4 | % |
| | | |
| |
| |
We anticipate that available funds from current operations, existing cash, our Revolving Credit Facilityrevolving credit facility and other sources of liquidity will be sufficient to meet current operating requirements and
anticipated capital expenditures for at least the next 12 months. However, we may have to consider external sources of financing for any large future acquisitions.
Our long-term contractual obligations as of December 31, 20052007 are presented in the following table:
| | | Payment Due by Period | | | Payments Due by Period
|
|---|
Contractual Obligations | | | | Total | | Less than
1 year | | 1-3 years | | 3-5 years | | More than
5 years | | | Total
| | Less than
1 year
| | 1 - 3 years
| | 3 - 5 years
| | More than
5 years
|
|---|
| | | (in thousands) | | | (in millions)
|
|---|
Long-term debt obligations, including current maturities(a) | Long-term debt obligations, including current maturities(a) | | $ | 306,985 | | | $ | 13,635 | | | | $ | 680 | | | $ | 217,670 | | | $ | 75,000 | | | | $ | 433.5 | | $ | 1.3 | | $ | 50.4 | | $ | 81.8 | | $ | 300.0 |
Operating lease obligations | Operating lease obligations | | 23,315 | | | 4,322 | | | | 6,743 | | | 3,875 | | | 8,375 | | | | 22.2 | | 7.4 | | 9.0 | | 3.6 | | 2.2 |
Capital lease obligations(a) | Capital lease obligations(a) | | 1,274 | | | 510 | | | | 425 | | | 189 | | | 150 | | | | 16.7 | | 1.4 | | 2.8 | | 2.8 | | 9.7 |
Pension contributions | Pension contributions | | 10,473 | | | 3,381 | | | | 189 | | | 198 | | | 6,705 | | | | 9.4 | | .5 | | .2 | | .1 | | 8.6 |
Other(b) | | 17,611 | | | 14,819 | | | | 1,554 | | | 1,102 | | | 136 | | | |
| Interest(b) | | | 159.5 | | 25.7 | | 47.5 | | 36.6 | | 49.7 |
| Earnout payments(a) | | | 3.8 | | 3.8 | | — | | — | | — |
| Other(c) | | | 23.0 | | 20.7 | | .7 | | .9 | | .7 |
| | | |
| |
| |
| |
| |
|
Total | Total | | $ | 359,658 | | | $ | 36,667 | | | | $ | 9,591 | | | $ | 223,034 | | | $ | 90,366 | | | | $ | 668.1 | | $ | 60.8 | | $ | 110.6 | | $ | 125.8 | | $ | 370.9 |
| | | | | | | | | | | | | | | | | | | | | | | | | |
| |
| |
| |
| |
|
- (a)
as recognized in the consolidated balance sheet
(b)assumes the balance on the revolving credit facility remains at $81.8 million and the interest rate remains at approximately 5.4% for the presented periods
(c)includes $8,900,000 in bonds due in less than one year from the Dormont acquisition to be settled by the former owners (see Note 11 to the Consolidated Financial Statements)(b) includes acquisition related agreement, commodity, and capital expenditure commitments and other benefits at December 31, 2005
2007In November 2005, we signed a definitive agreement to acquire the assets and business of Changsha Valve Works located in Changsha, China. Changsha Valve Works is a leading manufacturer of large diameter hydraulic actuated butterfly valves for thermo-power and hydro-power plants, water distribution projects and water works projects in China. Consummation of the acquisition remains subject to the fulfillment of certain closing conditions by Changsha Valve Works.
We have entered into a preliminary agreement where we will purchase a building located in Northern Italy from the local Italian government and, simultaneously, sell to the local Italian government one of our facilities in Northern Italy. This transaction is expected to be consummated in March 2006. The purchase price of the new building approximates $15,300,000. The selling price for our existing building approximates $9,100,000, with a book value of approximately $2,800,000. It is management’s intention to finance the purchase of this new building under a sale and lease back arrangement, however, the specific terms and conditions of the financing have not yet been determined. Therefore, payments on the future financing have not been included in the Contractual Obligations schedule above. In a related transaction, we have an agreement to sell another building in Northern Italy to a private third party for approximately $3,700,000. We expect that this transaction will be consummated in the fourth quarter of 2006. The book value of this building approximates $2,500,000. These transactions are part of our strategy to consolidate our Italian manufacturing activities.
We maintain letters of credit that guarantee our performance or payment to third parties in accordance with specified terms and conditions. Amounts outstanding for total letters of credit were approximately $48,651,000$45.0 million as of December 31, 20052007 and $42,570,000$49.6 million as of December 31, 2004.2006. Our letters of credit are primarily associated with insurance coverage and to a lesser extent foreign purchases and generally expire within one year of issuance. The increase is primarily associated with increased foreign purchases. These instruments may exist or expire without being drawn down, therefore they do not necessarily represent future cash flow obligations.
We own During the period January 1, 2008 to February 22, 2008, we repurchased 1.4 million shares of our Class A Common Stock for a 20% interesttotal cost of $38.2 million. As of February 22, 2008, 0.8 million shares remain to be repurchased under the November 2007 stock repurchase program. Although we are under no obligation to repurchase these shares, we estimate that the total cost to repurchase the remaining 0.8 million shares would be approximately $20.0 million.
Off-Balance Sheet Arrangements
Except for operating lease commitments, we have no off-balance sheet arrangements that have or are reasonably likely to have a current or future effect on our financial condition, changes in www.plumbworld.co.uk Limited (Plumbworld), a variable interest entity. Plumbworld is primarily an e-business that sells bathroom and sanitary appliances, as well as plumbing and heating products, tools and plumbing consumables. Its latest fiscal year sales were approximatelyfinancial
$11,600,000. We have a nominal investmentcondition, revenues or expenses, results of approximately $500 in Plumbworld and maintain a loan receivable in the amountoperations, liquidity, capital expenditures or capital resources that is material to investors.
Application of approximately $603,000 with Plumbworld. We have entered into an agreement with the majority shareholders of Plumbworld to exchange our 20% ownership interest for full receipt of our loan receivable. We expect to receive installment payments through September 2006, at which time we will relinquish our shares in Plumbworld. We continue to account for our investment in Plumbworld using the equity method.
Critical Accounting Policies and Key Estimates
The preparation of our consolidated financial statements in accordance with U.S. GAAP requires management to make judgments, assumptions and estimates that affect the amounts reported. A critical accounting estimate is an assumption about highly uncertain matters and could have a material effect on the consolidated financial statements if another, also reasonable, amount were used, or, a change in the estimate is reasonably likely from period to period. We base our assumptions on historical experience and on other estimates that we believe are reasonable under the circumstances. Actual results could differ significantly from these estimates. ThereExcept for the net increase in workers compensation reserves in the second quarter of 2007 primarily due to a change in estimate, there were no changes in accounting policies or significant changes in accounting estimates during 2005.2007.
We have discussedperiodically discuss the development, selection and disclosure of the estimates with theour Audit Committee. Management believes the following critical accounting policies reflect its’its more significant estimates and assumptions.
Revenue recognition
We recognize revenue when all of the following criteria are met: (1) we have entered into a binding agreement, (2) the product has shipped and title has passed, (3) the sales price to the customer is fixed or is determinable and (4) collectibility is reasonably assured. We recognize revenue based upon a determination that all criteria for revenue recognition have been met, which, based on the majority of our shipping terms, is considered to have occurred upon shipment of the finished product. Some shipping terms require the goods to be received by the customer before title passes. In those instances, revenues are not recognized until the customer has received the goods. We record estimated reductions to revenue for customer returns and allowances and for customer programs. Provisions for returns and allowances are made at the time of sale, derived from historical trends and form a portion of the allowance for doubtful accounts. Customer programs, which are primarily annual volume incentive plans, allow customers to earn credit for attaining agreed upon purchase targets from us. We record estimated reductions to revenue, made at the time of sale, for customer programs as an adjustment to net sales.based on estimated purchase targets.
Allowance for doubtful accounts
The allowance for doubtful accounts is established to represent our best estimate of the net realizable value of the outstanding accounts receivable. The development of our allowance for doubtful accounts varies by region but in general is based on a review of past due amounts, historical write-off experience, as well as aging trends affecting specific accounts and general operational factors affecting all accounts. In North America, management specifically analyzes individual accounts receivable and establishes specific reserves against financially troubled customers. In addition, factors are developed utilizing historical trends in bad debts, returns and allowances. The ratio of these factors to sales on a rolling twelve-month basis is applied to total outstanding receivables (net of accounts specifically identified) to establish a reserve. In Europe, management develops their bad debt allowance through an aging analysis of all their accounts. In China, management specifically analyzes individual accounts receivable and establishes specific reserves as needed. In addition, for waterworks customers, whose payment terms are generally extended, we reserve the majority of accounts receivable in excess of one year from the invoice date.
41
We uniformly consider current economic trends and changes in customer payment terms when evaluating the adequacy of the allowance for doubtful accounts. We also aggressively monitor the credit-worthinesscreditworthiness of our largest customers, and periodically review customer credit limits to reduce risk.
If circumstances relating to specific customers change or unanticipated changes occur in the general business environment, our estimates of the recoverability of receivables could be further adjusted.
Inventory valuation
Inventories are stated at the lower of cost or market with costs generally determined primarily on a first-in first-out basis. We utilize both specific product identification and historical product demand as the basis for determining our excess or obsolete inventory reserve. We identify all inventories that exceed a range of one to threefour years in sales. This is determined by comparing the current inventory balance against unit sales for the trailing twelve months. New products added to inventory within the past twelve months are excluded from this analysis. A portion of our products contain recoverable materials, therefore the excess and obsolete reserve is established net of any recoverable amounts. Changes in market conditions, lower than expected customer demand or changes in technology or features could result in additional obsolete inventory that is not saleable and could require additional inventory reserve provisions.
In certain countries, additional inventory reserves are maintained for potential shrinkage experienced in the manufacturing process. The reserve is established based on the prior year’syear's inventory losses adjusted for any change in the gross inventory balance.
Goodwill and other intangibles
We adopted Financial Accounting Standards Board Statement No. 142, “Goodwill and Other Intangible Assets” (FAS 142) on January 1, 2002, and as a result we no longer amortize goodwill. Goodwill and intangible assets with indefinite lives are tested annually for impairment in accordance with the provisions of FAS 142.Financial Accounting Standards Board Statement No. 142 "Goodwill and Other Intangible Assets" (FAS 142). We use our judgment in assessing whether assets may have become impaired between annual impairment tests. We concluded that no impairment existed at October 28, 2007, the time of our latest annual review. We perform our annual test for indicationsindicators of goodwill and non-amortizable intangible assets impairment onin the last dayfourth quarter of our fiscal October, which was October 30 for fiscal 2005.year or sooner if indicators of impairment exist.
Intangible assets such as purchased technology are generally recorded in connection with a business acquisition. Values assigned to intangible assets are determined by an independent valuation firm based on estimates and judgments regarding expectations of the success and life cycle of products and technology acquired.
Since the adoption of FAS 142 our valuations have been greater than the carrying value of our goodwill and intangibles. While we believe that our estimates of future cash flows are reasonable, different assumptions regarding such factors as future sales volume, selling price changes, material cost changes, cost savings programs and capital expenditures could significantly affect our valuations. Other changes that may affect our valuations include, but are not limited to product acceptances and regulatory approval. If actual product acceptance differs significantly from the estimates, we may be required to record an impairment charge to write down the assets to their realizable value. A severe decline in market value could result in an unexpected impairment charge to goodwill, which could have a material impact on the results of operations and financial position.
Product liability and workersworkers' compensation costs
Because of retention requirements associated with our insurance policies, we are generally self-insured for potential product liability claims and for workers’workers' compensation costs associated with workplace accidents. For product liability cases in the U.S., management estimates expected settlement costs by utilizing loss reports provided by our third partythird-party administrators as well as developing internal historical trend factors based on our specific claims experience. Management utilizes the internal trend
factors that reflect final expected settlement costs. In other countries, we maintain insurance coverage with relatively high deductible payments, as product liability claims tend to be smaller than those experienced in the U.S. Changes in the nature of claims or the actual settlement amounts could affect
the adequacy of this estimate and require changes to the provisions. Because the liability is an estimate, the ultimate liability may be more or less than reported.
Workers Workers' compensation liabilities in the U.S. are recognized for claims incurred (including claims incurred but not reported) and for changes in the status of individual case reserves. At the time a workers’workers' compensation claim is filed, a liability is estimated to settle the claim. The liability for workers’workers' compensation claims is determined based on management’smanagement's estimates of the nature and severity of the claims and based on analysis provided by third party administrators and by various state statutes and reserve requirements. We have developed our own trend factors based on our specific claims experience. In other countries where workersworkers' compensation costs are applicable, we maintain insurance coverage with limited deductible payments. Because the liability is an estimate, the ultimate liability may be more or less than reported.
We determine the trend factors for product liability and workers' compensation liabilities based on consultation with outside actuaries.
We maintain excess liability insurance with outside insurance carriers to minimize our risks related to catastrophic claims in excess of all self-insured positions. Any material change in the aforementioned factors could have an adverse impact on our operating results.
Legal contingencies
We are a defendant in numerous legal matters including those involving environmental law and product liability as discussed further in Note 15 of Notes to Consolidated Financial Statements.Part I, Item 1, "Business—Product Liability, Environmental and Other Litigation Matters." As required by Financial Accounting Standards Board Statement No. 5 “Accounting"Accounting for Contingencies”Contingencies" (FAS 5), we determine whether an estimated loss from a loss contingency should be accrued by assessing whether a loss is deemed probable and the loss amount can be reasonably estimated, net of any applicable insurance proceeds. Estimates of potential outcomes of these contingencies are developed in consultation with outside counsel. While this assessment is based upon all available information, litigation is inherently uncertain and the actual liability to fully resolve this litigation cannot be predicted with any assurance of accuracy. Final settlement of these matters could possibly result in significant effects on our results of operations, cash flows and financial position.
Pension benefits
We account for our pension plans in accordance with Financial Accounting Standards Board Statement No. 87 “Employers"Employers Accounting for Pensions”Pensions" (FAS 87) and Financial Accounting Standards Board Statement No. 158, "Employers' Accounting for Defined Benefit Pension and Other Postretirement Plans—an amendment of FASB Statements No. 87, 88, 106, and 132(R)," (FAS 158). In applying FAS 87 and FAS 158, assumptions are made regarding the valuation of benefit obligations and the performance of plan assets. The primary assumptions are as follows:
·
- •
- Weighted average discount rate—this rate is used to estimate the current value of future benefits. This rate is adjusted based on movement in long-term interest rates.
·
- •
- Expected long-term rate of return on assets—this rate is used to estimate future growth in investments and investment earnings. The expected return is based upon a combination of historical market performance and anticipated future returns for a portfolio reflecting the mix of equity, debt and other investments indicative of our plan assets.
·
- •
- Rates of increase in compensation levels—this rate is used to estimate projected annual pay increases, which are used to determine the wage base used to project
employees’employees' pension benefits at retirement.
We determine these assumptions based on consultation with outside actuaries and investment advisors. Any variance in the abovethese assumptions could have a significant impact on future recognized pension costs, assets and liabilities.
Income taxes
We estimate and use our expected annual effective income tax rates to accrue income taxes. Effective tax rates are determined based on budgeted earnings before taxes, including our best estimate of permanent items that will affect the effective rate for the year. Management periodically reviews these rates with outside tax advisors and changes are made if material discrepanciesvariances from expectations are identified.
We recognize deferred taxes for the expected future consequences of events that have been reflected in the consolidated financial statements in accordance with the rules of Financial Accounting Standards Board Statement No. 109 “Accounting"Accounting for Income Taxes”Taxes" (FAS 109). Under FAS 109, deferred tax assets and liabilities are determined based on differences between the book values and tax bases of particular assets and liabilities, using tax rates in effect for the years in which the differences are expected to reverse. A valuation allowance is provided to offset any net deferred tax assets if, based upon the available evidence, it is more likely than not that some or all of the deferred tax assets will not be realized. We consider estimated future taxable income and ongoing prudent tax planning strategies in assessing the need for a valuation allowance.
New Accounting Standards
In November 2004, On January 1, 2007, we adopted the provisions of Financial Accounting Standards Board (FASB) issued Financial Accounting Standards Board StatementInterpretation No. 151, “Inventory Costs” (FAS 151)48, "Accounting for Uncertainty in Income Taxes" (FIN 48). FAS 151 amendsThe purpose of FIN 48 is to increase the guidancecomparability in Accounting Research Bulletin No. 43, Chapter 4, “Inventory Pricing,”financial reporting of income taxes. FIN 48 requires that in order for a tax benefit to clarifybe booked in the accountingincome statement, the item in question must meet the more-likely-than-not (greater than 50% likelihood of being sustained upon examination by the taxing authorities) threshold. The adoption of FIN 48 did not have a material effect on our financial statements. No cumulative effect was booked through beginning retained earnings.
As of the adoption date, we had gross unrecognized tax benefits of approximately $4.8 million, of which, approximately $4.2 million, if recognized, would affect the effective tax rate. The difference between the amount of unrecognized tax benefits and the amount that would affect the effective tax rate consists of the federal tax benefit of state income tax items. During 2007, we reduced our unrecognized tax benefits by approximately $0.6 million for inventory costs. The provisionsa tax issue in Italy. As a result of this statement are effective for fiscal years beginning after June 15, 2005, although early applicationthe conclusion of state income tax audits, it is permitted.reasonably possible that the total amount of unrecognized tax benefits will change in the next twelve months. We estimate that it is reasonably possible that approximately $0.5 million of the currently remaining unrecognized tax benefit may be recognized by the end of 2008 as a result of the conclusion of the audits. Notwithstanding, we do not expect any further significant changes in the amounts of unrecognized tax benefits within the next twelve months.
As of December 31, 2007, we had gross unrecognized tax benefits of approximately $3.7 million, of which approximately $3.2 million, if recognized, would affect the effective tax rate. The difference between the amount of unrecognized tax benefits and the amount that would impact the impacteffective tax rate consists of this statement will be material to the consolidated financial statements.federal tax benefit of state income tax items.
New Accounting Standards
In December 2004, the FASB issued its final standard on accounting for share-based payments (SBP), Financial Accounting Standards Board Statement No. 123R (FAS 123R) that requires companies to expense the value of employee stock options and similar awards. The statement applies to all outstanding and unvested SBP awards at a company’s adoption date. The Securities and Exchange Commission delayed implementation to fiscal years beginning after June 15, 2005. Therefore, we implemented FAS 123R effective January 1, 2006 using the modified prospective method, which requires recognizing expense for options over their remaining vesting period. The portion of these options’ fair value attributable to vested awards prior to the adoption is never recognized. The impact of this statement on our results of operations (based on equity instruments outstanding at December 31, 2005) for the fiscal year ending December 31, 2006 is expected to be approximately ($0.03) per share.
In December 2004,2007, the FASB issued Financial Accounting Standards Board Statement (FAS) No. 141 (R)," Business Combinations," (FAS 141R), which requires most identifiable assets, liabilities, non-controlling interests, and goodwill acquired in a business combination to be recorded at "full fair value." Under FAS 141R, all business combinations will be accounted for under the acquisition method. Significant changes, among others, from current guidance resulting from FAS 141R includes the requirement that contingent assets and liabilities and contingent consideration shall be recorded at estimated fair value as of the acquisition date, with any subsequent changes in fair value charged or credited to earnings. Further, acquisition-related costs will be expensed rather than treated as part of the acquisition. FAS 141R is effective for periods beginning on or after December 15, 2008. We expect the adoption of FAS 141R will increase costs charged to operations.
In December 2007, the FASB issued FAS No. 160, "Non-controlling Interests in Consolidated Financial Statements, an amendment of ARB NO. 151," (FAS 160), which requires non-controlling interests (previously referred to as minority interest) to be treated as a separate component of equity, not as a liability as is current practice. FAS 160 applies to non-controlling interests and transactions with non-controlling interest holders in consolidated financial statements. FAS 160 is effective for periods beginning on or after December 15, 2008. We are currently evaluating the effect that FAS 160 will have on our consolidated financial statements.
In February 2007, the FASB issued FAS No. 159, "The Fair Value Option for Financial Assets and Financial Liabilities—including an Amendment to FAS No. 115," (FAS 159), which permits entities to choose to measure many financial instruments and certain other items at fair value. FAS 159 is effective for financial statements issued for fiscal years beginning after November 15, 2007 and interim periods within those fiscal years. Earlier application is encouraged. We do not expect to measure our financial instruments at fair value and therefore we do not expect the adoption of FAS 159 to have a material impact on our consolidated financial statements.
In September 2006, the Securities and Exchange Commission issued Staff Accounting Bulletin No. 108, "Considering the Effects of Prior Year Misstatements When Quantifying Misstatements in Current Year Financial Statements" (SAB 108), which provides interpretive guidance on how the effects of the carryover or reversal of prior year misstatements should be considered in quantifying a current year misstatement. SAB 108 is effective for fiscal years ending after November 15, 2006. The impact of SAB 108 was not material to our consolidated financial statements.
In September 2006, the FASB issued FAS No. 158, "Employers' Accounting for Defined Benefit Pension and Other Postretirement Plans—an amendment of FASB Statements No. 87, 88, 106, and 132(R)" (FAS 158), which requires an employer to: (a) recognize in its statement of financial position an asset for a plan's overfunded status or a liability for a plan's underfunded status; (b) measure a plan's assets and its obligations that determine its funded status as of the end of the employer's fiscal year; and (c) recognize changes in the funded status of a defined benefit postretirement plan in the year in which the changes occur. Those changes are reported in other comprehensive income. The requirement to recognize the funded status of a benefit plan and the disclosure requirements are effective as of the end of the fiscal year ending after December 15, 2006 for companies with publicly traded equity securities. The requirement to measure plan assets and benefit obligations as of the date of the employer's fiscal year-end statement of financial position is effective for fiscal years ending after December 15, 2008, although earlier adoption is permitted. As a result of the requirement to recognize the funded status of our benefit plans as of December 31, 2006, we recorded an increase in our pension liability of approximately $8.3 million, a decrease of approximately $1.3 million in other assets: other, net and a decrease in accumulated other comprehensive income of approximately $5.8 million, net of tax. We have early-adopted the measurement date provisions of FAS 158 effective January 1, 2007. Our pension plans previously used a September 30 measurement date. All plans are now measured as of December 31, consistent with our fiscal year end. The non-cash effect of the adoption of the measurement date provisions of FAS 158 was not material and there was no effect on our results of operations.
In September 2006, the FASB issued FAS No. 157, "Fair Value Measurements" (FAS 157), which defines fair value, establishes a framework for measuring fair value in generally accepted accounting principles and expands disclosures about fair value measurements. For financial assets and liabilities, FAS 157 is effective for financial statements issued for fiscal years beginning after November 15, 2007 and interim periods within those fiscal years. For non-financial assets and liabilities, FAS 157 is effective for financial statements issued for fiscal years beginning after November 15, 2008 and interim periods within those fiscal years. Earlier application is encouraged provided that the reporting company has not yet issued financial statements for that fiscal year, including financial statements for an interim period within that fiscal year. We do not expect the adoption of FAS 157 will have a material impact on our consolidated financial statements.
In July 2006, the FASB issued Financial Interpretation No. 48, "Accounting for Uncertainty in Income Taxes" (FIN 48), which clarifies the accounting for uncertainty in income taxes recognized in the financial statements in accordance with SFAS No. 109, "Accounting for Income Taxes." FIN 48 provides that a tax benefit from an uncertain tax position may be recognized when it is more likely than not that the position will be sustained upon examination, based on the technical merits. This interpretation also provides guidance on measurement, de-recognition, classification, interest and penalties, accounting in interim periods, disclosure and transition. We adopted the provisions of FIN 48 as of January 1, 2007 and the impact was not material to our consolidated financial statements.
In March 2006, the FASB issued FAS No. 156, "Accounting for Servicing of Financial Assets—an amendment of FASB Statement No. 140" (FAS 156). FAS 156 amends FAS Statement No. 140, "Accounting for Transfers and Servicing of Financial Assets and Extinguishments of Liabilities," with respect to the accounting for separately recognized servicing assets and servicing liabilities. FAS 156 addresses the recognition and measurement of separately recognized servicing assets and liabilities and provides an approach to simplify efforts to obtain hedge-like (offset) accounting. We adopted FAS 156 as of January 1, 2007 and the impact was not material to our consolidated financial statements.
In February 2006, the FASB issued FAS No. 155, "Accounting for Certain Hybrid Financial Instruments—an amendment of FASB Statements No. 133 and 140" (FAS 155). FAS 155 amends FAS 133, "Accounting for Derivatives and Hedging Activities," and FAS 140, "Accounting for Transfers and Servicing of Financial Assets and Extinguishments of Liabilities," and allows an entity to remeasure at fair value a hybrid financial instrument that contains an embedded derivative that otherwise would require bifurcation from the host, if the holder irrevocably elects to account for the whole instrument on a fair value basis. Subsequent changes in the fair value of the instrument would be recognized in earnings. We adopted FAS 155 as of January 1, 2007 and the impact was not material to our consolidated financial statements.
In May 2005, the FASB issued FAS No. 154, "Accounting Changes and Error Correction Replacement of APB Opinion No. 20 and FASB Statement No. 3" (FAS 154). FAS 154 replaces APB Opinion No. 20, "Accounting Changes" (APB 20), and FASB Statement No. 3, "Reporting Accounting Changes in Interim Financial Statements," and changes the requirements for the accounting for and reporting of a change in accounting principle. APB 20 previously required that most voluntary changes in accounting principle be recognized by including in net income of the period of the change the cumulative effect of changing to the new accounting principle. FAS 154 requires retrospective application to prior periods' financial statements of changes in accounting principle. FAS 154 defines retrospective application as the application of a different accounting principle to prior accounting periods as if that principle had always been used. FAS 154 also requires that a change in depreciation, amortization, or depletion method for long-lived, non-financial assets be accounted for as a change in accounting estimate affected by a change in accounting principle. The impact of FAS 154 was not material to our consolidated financial statements.
In December 2004, the FASB issued FAS No. 153, “Exchanges"Exchanges of Nonmonetary Assets, an amendment of APB Opinion No. 29, Accounting for Nonmonetary Transactions”Transactions" (FAS 153). The amendments made by FAS 153 are based on the principle that exchanges of nonmonetary assets should be measured based on the fair value of the assets exchanged. Further, the amendments eliminate the narrow exception for nonmonetary exchanges of similar productive assets and replace it with a broader exception for exchanges of nonmonetary assets that do not have commercial substance. Previously, Opinion No. 29 required that the accounting for an exchange of a productive asset for a similar productive asset or an equivalent interest in the same or similar productive asset should be based on the recorded amount of the asset relinquished. The statement is effective for nonmonetary asset exchanges occurring in fiscal periods beginning after June 15, 2005. Earlier application is permitted for nonmonetary asset exchanges occurring in fiscal periods beginning after the date of issuance. The impact of FAS 153 was not material to our consolidated financial statements.
In November 2004, the FASB issued FAS No. 151, "Inventory Costs" (FAS 151). FAS 151 amends the guidance in Accounting Research Bulletin No. 43, Chapter 4, "Inventory Pricing," to clarify the accounting for inventory costs. The provisions of this statement are being applied prospectively as of January 2006.
In March 2005, the FASB issued FASB Interpretation No. 47, “Accounting for Conditional Asset Retirement Obligations” (FIN 47). FIN 47 is an interpretation of FASB Statement No. 143, “Accounting
for Asset Retirement Obligations” (FAS 143) and serves to clarify that an entity is required to recognize a liability for the fair value of a conditional asset retirement obligation when incurred if the liability’s fair value can be reasonably estimated. FIN 47 also clarifies when an entity would have sufficient information to reasonably estimate such a liability. FIN 47 is effective no later than the end of fiscal years ending after December 15, 2005. We concluded that FIN 47 did not have a material impact on the consolidated financial statements as of December 31, 2005.
In May 2005, the FASB issued Financial Accounting Standards Board Statement No. 154, “Accounting Changes and Error Corrections” (FAS 154), a replacement of APB Opinion No. 20, “Accounting Changes” and a replacement of FASB Statement No. 3, “Reporting Accounting Changes in Interim Financial Statements”. FAS 154 changes the accounting for, and reporting of, a change in accounting principle. The statement requires retrospective application to prior periods financial statements of voluntary changes in accounting principles and changes required by new accounting standards when the standard does not include specific transition provisions, unless it is impracticable to do so. The statement is effective for accounting changes and corrections of errors in fiscal years beginning after December 15, 2005. Earlier application is permitted for accounting changes and corrections of errors during fiscal years beginning after June 1,15, 2005. The impact of FAS 151 was not material to our consolidated financial statements.
Item 7A.QUANTITATIVE AND QUALITATIVE DISCLOSURES ABOUT MARKET RISK.
We use derivative financial instruments primarily to reduce exposure to adverse fluctuations in foreign exchange rates, interest rates and costs of certain raw materials used in the manufacturing process. We do not enter into derivative financial instruments for trading purposes. As a matter of policy, all derivative positions are used to reduce risk by hedging underlying economic exposure. The derivatives we use are instruments with liquid markets.
Our consolidated earnings, which are reported in United States dollars, are subject to translation risks due to changes in foreign currency exchange rates. This risk is concentrated in the exchange rate between the U.S. dollar and the euro; the U.S. dollar and the Canadian dollar; and the U.S. dollar and the Chinese yuan.
Our foreign subsidiaries transact most business, including certain intercompany transactions, in foreign currencies. Such transactions are principally purchases or sales of materials and are denominated in European currencies the yuan, or the U.S. or Canadian dollar. We use foreign currency forward exchange contracts to manage the risk related to intercompany purchases that occur during the course of a year and certain open foreign currency denominated commitments to sell products to third parties. In 2005 and 2004,For 2007, the amounts recorded in other comprehensive income for the change in the fair value of such contracts was immaterial.
We have historically had a very low exposure on the cost of our debt to changes in interest rates. Interest rate swaps are used to mitigate the impact of interest rate fluctuations on certain variable rate debt instruments and reduce interest expense on certain fixed rate instruments. Information about our long-term debt including principal amounts and related interest rates appears in Notenote 11 of Notesnotes to Consolidated Financial Statementsconsolidated financial statements in our Annual Report on Form 10-K for the year ended December 31, 2005.2007.
We purchase significant amounts of bronze ingot, brass rod, cast iron, steel and plastic, which are utilized in manufacturing our many product lines. Our operating results can be adversely affected by changes in commodity prices if we are unable to pass on related price increases to our customers. We manage this risk by monitoring related market prices, working with our suppliers to achieve the maximum level of stability in their costs and related pricing, seeking alternative supply sources when necessary and passing increases in commodity costs to our customers, to the maximum extent possible, when they occur.
Additionally, on a limited basis, we use commodity futures contracts to manage this risk, but we did not use such contracts in 2005 or 2004.
Item 8.FINANCIAL STATEMENTS AND SUPPLEMENTARY DATA.
The index to financial statements is includedlisted in page 52section (a) (1) of "Part IV, Item 15. Exhibits and Financial Statement Schedules" of this Report andannual report are incorporated herein by reference.
Item 9.CHANGES IN AND DISAGREEMENTS WITH ACCOUNTANTS ON ACCOUNTING AND FINANCIAL DISCLOSURE.
None.
Item 9A.CONTROLS AND PROCEDURES.
As required by Rule 13a-15(b) under the Securities Exchange Act of 1934, as of the end of the period covered by this report, we carried out an evaluation under the supervision and with the participation of our management, including our Chief Executive Officer and Chief Financial Officer, of the effectiveness of our disclosure controls and procedures. In designing and evaluating our disclosure controls and procedures, we recognize that any controls and procedures, no matter how well designed and operated, can provide only reasonable assurance of achieving the desired control objectives, and
our management necessarily was required to applyapplies its judgment in evaluating and implementing possible controls and procedures. The effectiveness of our disclosure controls and procedures is also necessarily limited by the staff and other resources available to us and the geographic diversity of our operations. Based upon that evaluation, the Chief Executive Officer and Chief Financial Officer concluded that, as of the end of the period covered by this report, our disclosure controls and procedures were effective, in that they provide reasonable assurance that information required to be disclosed by us in the reports we file or submit under the Exchange Act is recorded, processed, summarized and reported within the time periods specified in the Securities and Exchange Commission’sCommission's rules and forms.forms and are designed to ensure that information required to be disclosed by us in the reports that we file or submit under the Exchange Act are accumulated and communicated to our management, including our Chief Executive Officer and Chief Financial Officer, as appropriate to allow timely decisions regarding required disclosure. There was no change in our internal control over financial reporting that occurred during the quarter ended December 31, 2005,2007, that has materially affected, or is reasonably likely to materially affect, our internal control over financial reporting. In connection with these rules, we will continue to review and document our disclosure controls and procedures, including our internal control over financial reporting, and may from time to time make changes aimed at enhancing their effectiveness and to ensure that our systems evolve with our business.
46
Management’sManagement's Annual Report on Internal Control Over Financial Reporting
Management of the Company is responsible for establishing and maintaining adequate internal control over financial reporting as defined in Rules 13a-15(f) and 15d-15(f) under the Securities Exchange Act of 1934. The Company’sCompany's internal control over financial reporting is designed to provide reasonable assurance regarding the reliability of financial reporting and the preparation of financial statements for external purposes in accordance with generally accepted accounting principles. The Company’sCompany's internal control over financial reporting includes those policies and procedures that:
pertain to the maintenance of records that, in reasonable detail, accurately and fairly reflect the transactions and dispositions of the assets of the Company;
(ii)provide reasonable assurance that transactions are recorded as necessary to permit preparation of financial statements in accordance with generally accepted accounting principles, and that receipts and expenditures of the Company are being made only in accordance with authorizations of management and directors of the Company; and
(iii)provide reasonable assurance regarding prevention or timely detection of unauthorized acquisition, use or disposition of the Company’sCompany's assets that could have a material effect on the financial statements.Because of its inherent limitations, internal control over financial reporting may not prevent or detect misstatements. Also, projections of any evaluation of effectiveness to future periods are subject to the risk that controls may become inadequate because of changes in conditions, or that the degree of compliance with the policies or procedures may deteriorate.
Management, including theour Chief Executive Officer and Chief Financial Officer, assessed the effectiveness of the Company’sCompany's internal control over financial reporting as of December 31, 2005.2007. In making this assessment, management used the criteria set forth by the Committee of Sponsoring Organizations of the Treadway Commission (COSO) in Internal Control—Integrated Framework.
Based on our assessment and those criteria, management believes that the Company maintained effective internal control over financial reporting as of December 31, 2005.2007.
The audited consolidated financial statements of the Company include the results of Dormont Manufacturing Company, which the Company acquired on December 28, 2005, Core IndustriesTopway Global Inc., which the Company acquired on December 2, 2005, Flexflow Tubing LLP, which the Company acquired on November 4, 2005, the water connector business of the Donald E. Savard Company, which the Company acquired on July 8, 2005, Microflex N.V., which the Company acquired on July 5, 2005, the water softener business of Alamo Water Refiners, Inc, which the Company acquired on June 20, 2005, Electro Controls Ltd., which the Company acquired on May 11, 2005, HF Scientific, Inc., which the Company acquired on January 5, 2005 and Sea Tech, Inc., which the Company acquired on January 4, 2005,9, 2007, but management’smanagement's assessment does not include an assessment of the internal control over financial reporting of these entities. Under rule 1-02(w) of Regulation S-X, Dormont is considered significant tothis entity.
The independent registered public accounting firm that audited the Company's consolidated financial statements ofincluded elsewhere in this Annual Report on Form 10-K has issued an attestation report on the Company. Additional disclosure about these acquisitions is set out under Part I, Item 1, “Business—Acquisitions.”
The Company’s independent auditors have audited management’s assessment of the Company’sCompany's internal control over financial reporting and issued an attestation report.reporting. That report appears immediately following this report.
Report of Independent Registered Public Accounting Firm
The Board of Directors and Stockholders
Watts Water Technologies, Inc.:
We have audited management’s assessment, included in the accompanying Management’s Annual Report on Internal Control over Financial Reporting, that Watts Water Technologies, Inc. maintained effective's internal control over financial reporting as of December 31, 2005,2007, based on criteria established inInternal Control—Integrated Framework issued by the Committee of Sponsoring Organizations of the Treadway Commission.Commission (COSO). Watts Water Technologies, Inc.’s's management is responsible for maintaining effective internal control over financial reporting, and for its assessment ofincluded in the effectiveness of internal control over financial reporting.accompanyingManagement's Annual Report on Internal Control Over Financial Reporting. Our responsibility is to express an opinion on management’s assessment and an opinion on the effectiveness of Watts Water Technologies, Inc.’sCompany's internal control over financial reporting based on our audit.
We conducted our audit in accordance with the standards of the Public Company Accounting Oversight Board (United States). Those standards require that we plan and perform the audit to obtain reasonable assurance about whether effective internal control over financial reporting was maintained in all material respects. Our audit included obtaining an understanding of internal control over financial reporting, evaluating management’s assessment,assessing the risk that a material weakness exists, and testing and evaluating the design and operating effectiveness of internal control andbased on the assessed risk. Our audit also included performing such other procedures as we considered necessary in the circumstances. We believe that our audit provides a reasonable basis for our opinion.
A company’scompany's internal control over financial reporting is a process designed to provide reasonable assurance regarding the reliability of financial reporting and the preparation of financial statements for external purposes in accordance with generally accepted accounting principles. A company’scompany's internal control over financial reporting includes those policies and procedures that (1) pertain to the maintenance of records that, in reasonable detail, accurately and fairly reflect the transactions and dispositions of the assets of the company; (2) provide reasonable assurance that transactions are recorded as necessary to permit preparation of financial statements in accordance with generally accepted accounting principles, and that receipts and expenditures of the company are being made only in accordance with authorizations of management and directors of the company; and (3) provide reasonable assurance regarding prevention or timely detection of unauthorized acquisition, use, or disposition of the company’scompany's assets that could have a material effect on the financial statements.
Because of its inherent limitations, internal control over financial reporting may not prevent or detect misstatements. Also, projections of any evaluation of effectiveness to future periods are subject to the risk that controls may become inadequate because of changes in conditions, or that the degree of compliance with the policies or procedures may deteriorate.
In our opinion, management’s assessment that Watts Water Technologies, Inc. maintained effective internal control over financial reporting as of December 31, 2005, is fairly stated, in all material respects, based on criteria established in Internal Control—Integrated Framework issued by the Committee of Sponsoring Organizations of the Treadway Commission. Also, in our opinion, Watts Water Technologies, Inc. maintained, in all material respects, effective internal control over financial reporting as of December 31, 2005,2007, based on criteria established inInternal Control—Integrated Framework issued by the Committee of Sponsoring Organizations of the Treadway Commission.Commission (COSO).
Watts Water Technologies, Inc. acquired Dormont Manufacturing Company, Core Industries Inc., Flexflow Tubing LLP, the water connector business of the Donald E. Savard Company, Microflex N.V., the water softener business of Alamo Water Refiners, Inc, Electro Controls Ltd., HF Scientific, Inc. and Sea Tech,Topway Global Inc. during 2005 (collectively the 2005 acquisitions)2007 (the 2007 acquisition). Management excluded from its assessment of internal control over financial reporting, the 2005 acquisitions2007 acquisition representing consolidated total assets of
$238 $19 million and consolidated revenues of $30$2 million included in the consolidated financial statements of Watts Water Technologies, Inc. as of and for the year ended December 31, 2005.2007. Our audit of internal control over financial reporting of Watts Water Technologies, Inc. also excluded an evaluation of the internal control over financial reporting of the 2005 acquisitions.2007 acquisition.
We also have audited, in accordance with the standards of the Public Company Accounting Oversight Board (United States), the consolidated balance sheets of Watts Water Technologies, Inc. as of December 31, 20052007 and 2004,2006, and the related consolidated statements of operations, stockholders’stockholders' equity, and cash flows for each of the years in the three-year period ended December 31, 2005,2007, and the
related financial statement schedule, and our report dated March 1, 2006February 29, 2008 expressed an unqualified opinion on those consolidated financial statements.statements and financial statement schedule.


Boston, Massachusetts
February 29, 2008
March 1, 2006
Item 9B.OTHER INFORMATION.
None.
49
PART III
Item 10.DIRECTORS, AND EXECUTIVE OFFICERS OF THE REGISTRANTAND CORPORATE GOVERNANCE..
Directors
The information appearing under the captions “Information as to Nominees for Director” and “Legal Proceeding Involving Director” in the Registrant’s Proxy Statement relating to the Annual Meeting of Stockholders to be held on May 4, 2006 is incorporated herein by reference. With respect to Directors and Executive Officers, the information appearing under the caption “Section 16(a) Beneficial Ownership Reporting Compliance” in the Registrant’s Proxy Statement relating to the Annual Meeting of Stockholders to be held on May 4, 2006 is incorporated herein by reference.
Audit Committee and Director Nominations
The information appearing under the caption “Corporate Governance—Committees of the Board” in the Registrant’s Proxy Statement relating to the Annual Meeting of Stockholders to be held on May 4, 2006 is incorporated herein by reference.
Executive Officers
Information with respect to the executive officers of the Company is set forth in Part I, Item 1 of this Report under the caption “Executive"Executive Officers and Directors”Directors" and is incorporated herein by reference.
Code The information provided under the captions "Information as to Nominees for Director," "Corporate Governance," and "Section 16(a) Beneficial Ownership Reporting Compliance" in our definitive Proxy Statement for our 2008 Annual Meeting of EthicsStockholders to be held on May 14, 2008 is incorporated herein by reference.
We have adopted a Code of Business Conduct and Ethics applicable to all officers, employees and Board members. The Code of Business Conduct and Ethics is posted on our website, www.wattswater.com. In order to access this portionin the Investor Relations section of our website, click on the “Investors” tab. Thewww.wattswater.com. We will provide you with a print copy of our Code of Business Conduct and Ethics is located under the “Codefree of Conduct” caption.charge on written request to Lester J. Taufen, Secretary, Watts Water Technologies, Inc., 815 Chestnut Street, North Andover, MA 01845. Any amendments to, or waivers of, the Code of Business Conduct and Ethics which appliesapply to our chief executive officer, chief financial officer, corporate controller or any person performing similar functions will be disclosed on our website promptly following the date of such amendment or waiver.
Item 11.EXECUTIVE COMPENSATIONCOMPENSATION..
The information provided under the captions "Director Compensation," "Corporate Governance," "Compensation Discussion and Analysis," "Executive Compensation," "Compensation Committee Interlocks and Insider Participation," and "Compensation Committee Report" in our definitive Proxy Statement for our 2008 Annual Meeting of Stockholders to be held on May 14, 2008 is incorporated herein by reference.
The "Compensation Committee Report" contained in our Proxy Statement shall not be deemed "soliciting material" or "filed" with the Securities and Exchange Commission or otherwise subject to the liabilities of Section 18 of the Securities Exchange Act of 1934, nor shall it be deemed incorporated by reference in any filings under the Securities Act of 1933 or the Exchange Act, except to the extent we specifically request that such information be treated as soliciting material or specifically incorporate such information by reference into a document filed under the Securities Act or Exchange Act.
Item 12. SECURITY OWNERSHIP OF CERTAIN BENEFICIAL OWNERS AND MANAGEMENT AND RELATED STOCKHOLDER MATTERS.
The information appearing under the captions “Compensation Arrangements” and “Director Compensation”caption "Principal Stockholders" in the Registrant’sRegistrant's Proxy Statement relating to the Annual Meeting of Stockholders to be held on May 4, 200614, 2008 is incorporated herein by reference.
50
Item 12.SECURITY OWNERSHIP OF CERTAIN BENEFICIAL OWNERS AND MANAGEMENT AND RELATED STOCKHOLDER MATTERS.
The information appearing under the caption “Principal Stockholders” in the Registrant’s Proxy Statement relating to the Annual Meeting of Stockholders to be held on May 4, 2006 is incorporated herein by reference.
Securities Authorized for Issuance Under Equity Compensation Plans
The following table givesprovides information as of December 31, 2007, about the shares of classClass A common stockCommon Stock that may be issued upon the exercise of stock options issued under the Company’sCompany's 2004 Stock Incentive Plan, 1991 Directors’Directors' Non-Qualified Stock Option Plan, 1996 Stock Option Plan and 2003 Non-Employee Directors' Stock Option Plan and the settlement of restricted stock units granted
under our Management Stock Purchase Plan as well as the number of shares remaining for future issuance under our 2004 Stock Incentive Plan and the 2003 Non-Employee Directors’Management Stock Option Plan, as of December 31, 2005.Purchase Plan.
| | | Equity Compensation Plan Information | | | Equity Compensation Plan Information
| |
| |
|---|
Plan category | | | | Number of securities to be
issued upon exercise of
outstanding options,
warrants and rights | | Weighted-average exercise
price of outstanding options,
warrants and rights | | Number of securities remaining
available for future issuance under
equity compensation plan
(excluding securities reflected in
column (a)) | | |
| | | (a) | | (b) | | (c) | | | Equity Compensation Plan Information
| | Number of securities remaining
available for future issuance under
equity compensation plan
(excluding securities reflected in
column (a))
(c)
| |
|---|
Plan Category
| | |
|---|
Equity compensation plans approved by security holders | Equity compensation plans approved by security holders | | | 1,417,456 | (1) | | | $ | 20.39 | | | | 2,735,609 | (2) | | | 1,533,767 | (1) | $ | 24.64 | | 3,078,132 | (2) |
Equity compensation plans not approved by security holders | Equity compensation plans not approved by security holders | | | None | | | | None | | | | None | | | | None | | None | | None | |
Total | Total | | | 1,417,456 | (1) | | | $ | 20.39 | | | | 2,735,609 | (2) | | | 1,533,767 | (1) | $ | 24.64 | | 3,078,132 | (2) |
|
- (1)
Represents 1,089,3951,168,233 outstanding options under the 1991 Directors’Directors' Non-Qualified Stock Option Plan, 1996 Incentive Stock Option Plan, 2003 Non-Employee Directors’Directors' Stock Option Plan and 2004 Stock Incentive Plan, and 328,061365,534 outstanding restricted stock units under the Management Stock Purchase Plan.
(2)
Includes 2,485,0002,074,517 shares available for future issuance under the 2004 Stock Incentive Plan, and 250,609 restricted stock units1,003,615 shares available for future issuance under the Management Stock Purchase Plan.
Item 13.CERTAIN RELATIONSHIPS AND RELATED TRANSACTIONS, AND DIRECTOR INDEPENDENCE..
The information appearingprovided under the caption “Compensation Arrangements—Certain Relationshipscaptions "Corporate Governance" and "Policies and Procedures for Related Transactions”Person Transactions" in the Registrant’sour definitive Proxy Statement relating to thefor our 2008 Annual Meeting of Stockholders to be held on May 4, 200614, 2008 is incorporated herein by reference.
Item 14.PRINCIPAL ACCOUNTANT FEES AND SERVICES.
The information appearingprovided under the caption “Ratification"Ratification of Independent Auditors”Registered Public Accounting Firm" in the Registrant’sour definitive Proxy Statement relating to thefor our 2008 Annual Meeting of Stockholders to be held on May 4, 200614, 2008 is incorporated herein by reference.
51
PART IV
Item 15.EXHIBITS AND FINANCIAL STATEMENT SCHEDULES.
(a)(1) Financial Statements
The following financial statements are included in a separate section of this Report commencing on the page numbers specified below:
Report of Independent Registered Public Accounting Firm | | 54
59 |
Consolidated Statements of Operations for the years ended December 31, 2005, 20042007, 2006 and 2003 2005 | | 55
60 |
Consolidated Balance Sheets as of December 31, 20052007 and 2004 2006 | | 56
61 |
Consolidated Statements of Stockholders’Stockholders' Equity for the years ended December 31, 2005, 20042007, 2006 and 2003 2005 | | 57
62 |
Consolidated Statements of Cash Flows for the years ended December 31, 2005, 20042007, 2006 and 2003 2005 | | 58
63 |
Notes to Consolidated Financial Statements | | 59–90
64 - 101 |
(a)(2) Schedules
All other required schedules for which provision is made in the applicable accounting regulations of the Securities and Exchange Commission are included in the Notes to the Consolidated Financial Statements.
(a)(3) Exhibits
The exhibits listed in the Exhibit Index immediately preceding the exhibits are filed as part of this Annual Report on Form 10-K.
52
SIGNATURES
Pursuant to the requirements of Section 13 or 15(d) of the Securities Exchange Act of 1934, the registrant has duly caused this report to be signed on its behalf by the undersigned, thereunto duly authorized.
|
| WATTS WATER TECHNOLOGIES, INC. |
|
|
By:
|
|
/s/S/ PATRICK S. O’KEEFEO'KEEFE
|
| | | |
Patrick S. O’Keefe |
O'Keefe
|
|
|
| Chief Executive Officer
President and Director |
DATED: March 1, 2006
February 29, 2008 |
|
|
|
|
Pursuant to the requirements of the Securities Exchange Act of 1934, this report has been signed below by the following persons on behalf of the registrant and in the capacities and on the dates indicated.
|
| Signature |
|
| |
| | Title |
|
| |
| | Date
|
|---|
|
|
|
|
|
/s/S/ PATRICK S. O’KEEFEO'KEEFE
Patrick S. O'Keefe | | Chief Executive Officer, | | March 1, 2006
| |
Patrick S. O’Keefe
| |
President and Director
| | | February 29, 2008 |
/s/S/ WILLIAM C. MCCARTNEY
William C. McCartney |
|
Chief Financial Officer and Treasurer
| | March 1, 2006
| |
William C. McCartney
| |
(Principal Financial and
Accounting Officer)
|
| |
February 29, 2008 |
/s/S/ TIMOTHY P. HORNE
| | Director
| | March 1, 2006
| |
Timothy P. Horne |
|
Director |
| |
February 29, 2008 |
/s/S/ ROBERT L. AYERS
Robert L. Ayers
|
|
Director |
|
February 29, 2008 |
/S/ RICHARD J. CATHCART
Richard J. Cathcart. |
|
Director |
|
February 29, 2008 |
/S/ RALPH E. JACKSON, JR. | | Director
| | March 1, 2006
| |
Ralph E. Jackson, Jr. |
|
Director |
| |
February 29, 2008 |
/s/S/ KENNETH J. MCAVOY
| | Director
| | March 1, 2006
| |
Kenneth J. McAvoy |
|
Director |
| |
February 29, 2008 |
/s/S/ JOHN K. MCGILLICUDDY
| | Director
| | March 1, 2006
| |
John K. McGillicuddy |
|
Director |
| |
February 29, 2008 |
/s/S/ GORDON W. MORAN
Gordon W. Moran |
|
Chairman of the Board
|
| March 1, 2006
|
February 29, 2008 |
Gordon W. Moran
| | | | | |
/s/S/ DANIEL J. MURPHY, III
| | Director
| | March 1, 2006
| |
Daniel J. Murphy, III |
|
Director |
| |
February 29, 2008 |
53
Report of Independent Registered Public Accounting Firm
The Board of Directors and Stockholders
Watts Water Technologies, Inc.:
We have audited the accompanying consolidated balance sheets of Watts Water Technologies, Inc. and subsidiaries as of December 31, 20052007 and 2004,2006, and the related consolidated statements of operations, stockholders’stockholders' equity, and cash flows for each of the years in the three-year period ended December 31, 2005.2007. In connection with our audits of the consolidated financial statements, we have also audited the financial statement schedule. These consolidated financial statements and financial statement schedule are the responsibility of the Company’sCompany's management. Our responsibility is to express an opinion on these consolidated financial statements and financial statement schedule based on our audits.
We conducted our audits in accordance with the standards of the Public Company Accounting Oversight Board (United States). Those standards require that we plan and perform the audit to obtain reasonable assurance about whether the financial statements are free of material misstatement. An audit includes examining, on a test basis, evidence supporting the amounts and disclosures in the financial statements. An audit also includes assessing the accounting principles used and significant estimates made by management, as well as evaluating the overall financial statement presentation. We believe that our audits provide a reasonable basis for our opinion.
In our opinion, the consolidated financial statements referred to above present fairly, in all material respects, the financial position of Watts Water Technologies, Inc. and subsidiaries as of December 31, 20052007 and 2004,2006, and the results of their operations and their cash flows for each of the years in the three-year period ended December 31, 2005,2007, in conformity with U.S. generally accepted accounting principles. Also, in our opinion, the financial statement schedule, when considered in relation to the basic consolidated financial statements taken as a whole, presents fairly, in all material respects, the information set forth therein.
As discussed in Note 2 to the consolidated financial statements, Watts Water Technologies, Inc. adopted Statement of Financial Accounting Standard No. 123(R), "Share Based Payment" effective January 1, 2006, utilizing the modified prospective application transition method.
Also, as discussed in Note 2 to the consolidated financial statements, Watts Water Technologies, Inc. adopted the recognition and disclosure provisions of Statement of Financial Accounting Standard No. 158, "Employers' Accounting for Defined Benefit Pension and Other Post Retirement Plans—an amendment of FASB Statements No. 87, 88, 106, and 132(R)" effective December 31, 2006 and its measurement date provisions on January 1, 2007.
Also, as discussed in Note 2 to the consolidated financial statements, Watts Water Technologies, Inc. adopted Financial Interpretation No. 48, "Accounting for Uncertainty in Income Taxes" effective January 1, 2007.
We also have audited, in accordance with the standards of the Public Company Accounting Oversight Board (United States), the effectiveness of Watts Water Technologies, Inc.’s's internal control over financial reporting as of December 31, 2005,2007, based on criteria established in Internal Control—Integrated Framework issued by the Committee of Sponsoring Organizations of the Treadway Commission (COSO) and our report dated March 1, 2006,February 29, 2008, expressed an unqualified opinion on management’s assessment of, and the effective operation of internal control over financial reporting.

Boston, Massachusetts
March 1, 2006February 29, 2008
54
Watts Water Technologies, Inc. and Subsidiaries
Consolidated Statements of Operations
(Amounts in thousands,millions, except per share information)
| | Years Ended December 31, | |
| | 2005 | | 2004 | | 2003 | |
Net sales | | $ | 924,346 | | $ | 824,558 | | $ | 701,859 | |
Cost of goods sold | | 599,644 | | 533,997 | | 461,994 | |
GROSS PROFIT | | 324,702 | | 290,561 | | 239,865 | |
Selling, general and administrative expenses | | 229,418 | | 206,866 | | 169,438 | |
Restructuring and other charges | | 729 | | 95 | | 426 | |
OPERATING INCOME | | 94,555 | | 83,600 | | 70,001 | |
Other (income) expense: | | | | | | | |
Interest income | | (1,232 | ) | (1,135 | ) | (1,043 | ) |
Interest expense | | 10,353 | | 10,564 | | 12,108 | |
Minority interest | | 350 | | 1,203 | | (554 | ) |
Other | | (727 | ) | 296 | | 748 | |
| | 8,744 | | 10,928 | | 11,259 | |
INCOME FROM CONTINUING OPERATIONS BEFORE INCOME TAXES | | 85,811 | | 72,672 | | 58,742 | |
Provision for income taxes | | 30,791 | | 23,934 | | 22,323 | |
INCOME FROM CONTINUING OPERATIONS | | 55,020 | | 48,738 | | 36,419 | |
Loss from discontinued operations, net of taxes of $258 in 2005, $1,156 in 2004 and $1,914 in 2003 | | (421 | ) | (1,918 | ) | (3,057 | ) |
NET INCOME | | $ | 54,599 | | $ | 46,820 | | $ | 33,362 | |
Basic EPS | | | | | | | |
Income (loss) per share: | | | | | | | |
Continuing operations | | $ | 1.69 | | $ | 1.51 | | $ | 1.33 | |
Discontinued operations | | (0.01 | ) | (0.06 | ) | (0.11 | ) |
NET INCOME | | $ | 1.68 | | $ | 1.45 | | $ | 1.22 | |
Weighted average number of shares | | 32,489 | | 32,276 | | 27,455 | |
Diluted EPS | | | | | | | |
Income (loss) per share: | | | | | | | |
Continuing operations | | $ | 1.67 | | $ | 1.49 | | $ | 1.32 | |
Discontinued operations | | (0.01 | ) | (0.06 | ) | (0.11 | ) |
NET INCOME | | $ | 1.66 | | $ | 1.43 | | $ | 1.21 | |
Weighted average number of shares | | 33,002 | | 32,719 | | 27,692 | |
Dividends per share | | $ | 0.32 | | $ | 0.28 | | $ | 0.25 | |
| | Years Ended December 31,
| |
|---|
| | 2007
| | 2006
| | 2005
| |
|---|
| Net sales | | $ | 1,382.3 | | $ | 1,230.8 | | $ | 924.3 | |
| Cost of goods sold | | | 920.7 | | | 805.8 | | | 599.6 | |
| | |
| |
| |
| |
| | GROSS PROFIT | | | 461.6 | | | 425.0 | | | 324.7 | |
| Selling, general and administrative expenses | | | 332.7 | | | 300.2 | | | 229.4 | |
| Restructuring and other (income) charges | | | 3.2 | | | (5.7 | ) | | .7 | |
| | |
| |
| |
| |
| | OPERATING INCOME | | | 125.7 | | | 130.5 | | | 94.6 | |
| | |
| |
| |
| |
| Other (income) expense: | | | | | | | | | | |
| | Interest income | | | (14.5 | ) | | (5.0 | ) | | (1.2 | ) |
| | Interest expense | | | 26.9 | | | 22.1 | | | 10.4 | |
| | Minority interest | | | (2.8 | ) | | (1.8 | ) | | .3 | |
| | Other | | | 2.3 | �� | | (.9 | ) | | (.7 | ) |
| | |
| |
| |
| |
| | | | 11.9 | | | 14.4 | | | 8.8 | |
| | |
| |
| |
| |
| INCOME FROM CONTINUING OPERATIONS BEFORE INCOME TAXES | | | 113.8 | | | 116.1 | | | 85.8 | |
| Provision for income taxes | | | 36.2 | | | 39.0 | | | 30.8 | |
| | |
| |
| |
| |
| | INCOME FROM CONTINUING OPERATIONS | | | 77.6 | | | 77.1 | | | 55.0 | |
| Loss from discontinued operations, net of taxes of $0.2 in 2007, $2.1 in 2006 and $0.3 in 2005 | | | (.2 | ) | | (3.4 | ) | | (.4 | ) |
| | |
| |
| |
| |
| | NET INCOME | | $ | 77.4 | | $ | 73.7 | | $ | 54.6 | |
| | |
| |
| |
| |
| Basic EPS | | | | | | | | | | |
| Income (loss) per share: | | | | | | | | | | |
| | Continuing operations | | $ | 2.01 | | $ | 2.32 | | $ | 1.69 | |
| | Discontinued operations | | | (.01 | ) | | (.10 | ) | | (.01 | ) |
| | |
| |
| |
| |
| | NET INCOME | | $ | 2.00 | | $ | 2.21 | | $ | 1.68 | |
| | |
| |
| |
| |
| Weighted average number of shares | | | 38.6 | | | 33.3 | | | 32.5 | |
| | |
| |
| |
| |
| Diluted EPS | | | | | | | | | | |
| Income (loss) per share: | | | | | | | | | | |
| | Continuing operations | | $ | 1.99 | | $ | 2.29 | | $ | 1.67 | |
| | Discontinued operations | | | (.01 | ) | | (.10 | ) | | (.01 | ) |
| | |
| |
| |
| |
| | NET INCOME | | $ | 1.99 | | $ | 2.19 | | $ | 1.66 | |
| | |
| |
| |
| |
| Weighted average number of shares | | | 39.0 | | | 33.7 | | | 33.0 | |
| | |
| |
| |
| |
| Dividends per share | | $ | .40 | | $ | .36 | | $ | .32 | |
| | |
| |
| |
| |
The accompanying notes are an integral part of these consolidated financial statements.
55
Watts Water Technologies, Inc. and Subsidiaries
Consolidated Balance Sheets
(Amounts in thousands,millions, except share information)
| | December 31, | |
| | 2005 | | 2004 | |
ASSETS | | | | | |
CURRENT ASSETS: | | | | | |
Cash and cash equivalents | | $ | 45,758 | | $ | 65,913 | |
Investment securities | | — | | 26,600 | |
Trade accounts receivable, less allowance for doubtful accounts of
$9,296 in 2005 and $7,551 in 2004 | | 177,364 | | 150,073 | |
Inventories, net | | 242,837 | | 205,049 | |
Prepaid expenses and other assets | | 25,361 | | 10,786 | |
Deferred income taxes | | 27,540 | | 27,463 | |
Assets of discontinued operations | | 9,555 | | 10,227 | |
Total Current Assets | | 528,415 | | 496,111 | |
PROPERTY, PLANT AND EQUIPMENT, NET | | 164,999 | | 150,689 | |
OTHER ASSETS: | | | | | |
Goodwill | | 296,636 | | 226,178 | |
Other, net | | 110,920 | | 49,702 | |
TOTAL ASSETS | | $ | 1,100,970 | | $ | 922,680 | |
LIABILITIES AND STOCKHOLDERS’ EQUITY | | | | | |
CURRENT LIABILITIES: | | | | | |
Accounts payable | | $ | 91,053 | | $ | 72,038 | |
Accrued expenses and other liabilities | | 67,071 | | 61,736 | |
Accrued compensation and benefits | | 28,496 | | 29,679 | |
Current portion of long-term debt | | 13,635 | | 4,981 | |
Liabilities of discontinued operations | | 23,068 | | 24,303 | |
Total Current Liabilities | | 223,323 | | 192,737 | |
LONG-TERM DEBT, NET OF CURRENT PORTION | | 293,350 | | 180,562 | |
DEFERRED INCOME TAXES | | 24,803 | | 19,578 | |
OTHER NONCURRENT LIABILITIES | | 32,187 | | 29,500 | |
MINORITY INTEREST | | 7,831 | | 7,515 | |
STOCKHOLDERS’ EQUITY: | | | | | |
Preferred Stock, $.10 par value; 5,000,000 shares authorized; no shares issued or outstanding | | — | | — | |
Class A Common Stock, $.10 par value; 80,000,000 shares authorized; 1 vote per share; issued and outstanding, 25,205,210 shares in 2005 and 25,049,338 shares in 2004 | | 2,521 | | 2,505 | |
Class B Common Stock, $.10 par value; 25,000,000 shares authorized; 10 votes per share; issued and outstanding, 7,343,880 shares in 2005 and 2004 | | 734 | | 734 | |
Additional paid-in capital | | 144,284 | | 140,172 | |
Retained earnings | | 368,264 | | 324,145 | |
Deferred compensation | | (1,590 | ) | (1,386 | ) |
Accumulated other comprehensive income | | 5,263 | | 26,618 | |
Total Stockholders’ Equity | | 519,476 | | 492,788 | |
TOTAL LIABILITIES AND STOCKHOLDERS’ EQUITY | | $ | 1,100,970 | | $ | 922,680 | |
| | December 31,
|
|---|
| | 2007
| | 2006
|
|---|
| ASSETS | | | | | | |
| CURRENT ASSETS: | | | | | | |
| | Cash and cash equivalents | | $ | 290.3 | | $ | 343.0 |
| | Short-term investment securities | | | 22.0 | | | 11.8 |
| | Trade accounts receivable, less allowance for doubtful accounts of $14.9 million in 2007 and $10.5 million in 2006 | | | 235.7 | | | 228.5 |
| | Inventories, net | | | 341.6 | | | 316.4 |
| | Prepaid expenses and other assets | | | 18.6 | | | 15.9 |
| | Deferred income taxes | | | 38.1 | | | 26.7 |
| | Assets of discontinued operations | | | 10.4 | | | 10.1 |
| | |
| |
|
| | | Total Current Assets | | | 956.7 | | | 952.4 |
| PROPERTY, PLANT AND EQUIPMENT, NET | | | 223.7 | | | 206.2 |
| OTHER ASSETS: | | | | | | |
| | Goodwill | | | 385.8 | | | 356.1 |
| | Long-term investment securities | | | 17.0 | | | — |
| | Other, net | | | 146.1 | | | 146.2 |
| | |
| |
|
| TOTAL ASSETS | | $ | 1,729.3 | | $ | 1,660.9 |
| | |
| |
|
| LIABILITIES AND STOCKHOLDERS' EQUITY | | | | | | |
| CURRENT LIABILITIES: | | | | | | |
| | Accounts payable | | $ | 108.0 | | $ | 121.0 |
| | Accrued expenses and other liabilities | | | 113.6 | | | 100.4 |
| | Accrued compensation and benefits | | | 38.2 | | | 42.6 |
| | Current portion of long-term debt | | | 1.3 | | | 7.5 |
| | Liabilities of discontinued operations | | | 28.6 | | | 27.9 |
| | |
| |
|
| | | Total Current Liabilities | | | 289.7 | | | 299.4 |
| LONG-TERM DEBT, NET OF CURRENT PORTION | | | 432.2 | | | 441.7 |
| DEFERRED INCOME TAXES | | | 42.9 | | | 34.5 |
| OTHER NONCURRENT LIABILITIES | | | 45.6 | | | 52.7 |
| MINORITY INTEREST | | | 3.4 | | | 6.0 |
| STOCKHOLDERS' EQUITY: | | | | | | |
| | Preferred Stock, $0.10 par value; 5,000,000 shares authorized; no shares issued or outstanding | | | — | | | — |
| | Class A Common Stock, $0.10 par value; 80,000,000 shares authorized; 1 vote per share; issued and outstanding, 30,600,056 shares in 2007 and 31,239,111 shares in 2006 | | | 3.1 | | | 3.1 |
| | Class B Common Stock, $0.10 par value; 25,000,000 shares authorized; 10 votes per share; issued and outstanding, 7,293,880 shares in 2007 and in 2006 | | | .7 | | | .7 |
| | Additional paid-in capital | | | 377.6 | | | 367.8 |
| | Retained earnings | | | 465.4 | | | 429.6 |
| | Accumulated other comprehensive income | | | 68.7 | | | 25.4 |
| | |
| |
|
| | | Total Stockholders' Equity | | | 915.5 | | | 826.6 |
| | |
| |
|
| TOTAL LIABILITIES AND STOCKHOLDERS' EQUITY | | $ | 1,729.3 | | $ | 1,660.9 |
| | |
| |
|
The accompanying notes are an integral part of these consolidated financial statements.
56
Watts Water Technologies, Inc. and Subsidiaries
Consolidated Statements of Stockholders’Stockholders' Equity
(Amounts in thousands,millions, except share information)
| | Class A
Common Stock | | Class B
Common Stock | | Additional
Paid-In | | Retained | | Deferred | | Accumulated
Other
Comprehensive | | Total
Stockholders’ | |
| | Shares | | Amount | | Shares | | Amount | | Capital | | Earnings | | Compensation | | Income (Loss) | | Equity | |
Balance at December 31, 2002 | | 18,863,482 | | | $ | 1,886 | | | 8,185,224 | | | $ | 819 | | | | $ | 45,132 | | | | $ | 259,893 | | | | $ | — | | | | $ | (11,794 | ) | | | $ | 295,936 | | |
Comprehensive income: | | | | | | | | | | | | | | | | | | | | | | | | | | | | | | | | | |
Net income | | | | | | | | | | | | | | | | | | | 33,362 | | | | | | | | | | | | 33,362 | | |
Cumulative translation adjustment and other | | | | | | | | | | | | | | | | | | | | | | | | | | | 27,440 | | | | 27,440 | | |
Pension plan additional minimumliability, net of tax of $1,205 | | | | | | | | | | | | | | | | | | | | | | | | | | | (1,841 | ) | | | (1,841 | ) | |
Comprehensive income | | | | | | | | | | | | | | | | | | | | | | | | | | | | | | | 58,961 | | |
Shares of Class B Common Stock converted to Class A Common Stock | | 580,000 | | | 58 | | | (580,000 | ) | | (58 | ) | | | | | | | | | | | | | | | | | | | | | |
Shares of Class A Common Stock issued upon the exercise of stock options | | 301,011 | | | 30 | | | | | | | | | | 4,029 | | | | | | | | | | | | | | | | 4,059 | | |
Tax benefit for stock options exercised | | | | | | | | | | | | | | | 423 | | | | | | | | | | | | | | | | 423 | | |
Net change in restricted stock units | | 114,628 | | | 12 | | | | | | | | | | 1,333 | | | | | | | | | | | | | | | | 1,345 | | |
Shares of Class A Common Stock issuedin Stock Offering net of offering costs of $4,874 | | 4,600,000 | | | 460 | | | | | | | | | | 82,066 | | | | | | | | | | | | | | | | 82,526 | | |
Common Stock dividends | | | | | | | | | | | | | | | | | | | (6,859 | ) | | | | | | | | | | | (6,859 | ) | |
Balance at December 31, 2003 | | 24,459,121 | | | $ | 2,446 | | | 7,605,224 | | | $ | 761 | | | | $ | 132,983 | | | | $ | 286,396 | | | | $ | — | | | | $ | 13,805 | | | | $ | 436,391 | | |
Comprehensive income: | | | | | | | | | | | | | | | | | | | | | | | | | | | | | | | | | |
Net income | | | | | | | | | | | | | | | | | | | 46,820 | | | | | | | | | | | | 46,820 | | |
Cumulative translation adjustment and other | | | | | | | | | | | | | | | | | | | | | | | | | | | 12,833 | | | | 12,833 | | |
Pension plan additional minimum liability, net of tax of ($54) | | | | | | | | | | | | | | | | | | | | | | | | | | | (20 | ) | | | (20 | ) | |
Comprehensive income | | | | | | | | | | | | | | | | | | | | | | | | | | | | | | | 59,633 | | |
Shares of Class B Common Stock converted to Class A Common Stock | | 261,344 | | | 27 | | | (261,344 | ) | | (27 | ) | | | | | | | | | | | | | | | | | | | | | |
Shares of Class A Common Stock issued upon the exercise of stock options | | 258,247 | | | 25 | | | | | | | | | | 3,794 | | | | | | | | | | | | | | | | 3,819 | | |
Tax benefit for stock options exercised | | | | | | | | | | | | | | | 969 | | | | | | | | | | | | | | | | 969 | | |
Issuance of shares of restricted Class A Common Stock | | 32,133 | | | 3 | | | | | | | | | | 802 | | | | | | | | (805 | ) | | | | | | | — | | |
Amortization of deferred compensation | | | | | | | | | | | | | | | | | | | | | | | 157 | | | | | | | | 157 | | |
Net change in restricted stock units | | 38,493 | | | 4 | | | | | | | | | | 1,624 | | | | | | | | (738 | ) | | | | | | | 890 | | |
Common Stock dividends | | | | | | | | | | | | | | | | | | | (9,071 | ) | | | | | | | | | | | (9,071 | ) | |
Balance at December 31, 2004 | | 25,049,338 | | | $ | 2,505 | | | 7,343,880 | | | $ | 734 | | | | $ | 140,172 | | | | $ | 324,145 | | | | $ | (1,386 | ) | | | $ | 26,618 | | | | $ | 492,788 | | |
Comprehensive income: | | | | | | | | | | | | | | | | | | | | | | | | | | | | | | | | | |
Net income | | | | | | | | | | | | | | | | | | | 54,599 | | | | | | | | | | | | 54,599 | | |
Cumulative translation adjustment and other | | | | | | | | | | | | | | | | | | | | | | | | | | | (19,377 | ) | | | (19,377 | ) | |
Pension plan additional minimum liability, net of tax of ($1,203) | | | | | | | | | | | | | | | | | | | | | | | | | | | (1,978 | ) | | | (1,978 | ) | |
Comprehensive income | | | | | | | | | | | | | | | | | | | | | | | | | | | | | | | 33,244 | | |
Shares of Class A Common Stock issued upon the exercise of stock options | | 107,823 | | | 11 | | | | | | | | | | 1,507 | | | | | | | | | | | | | | | | 1,518 | | |
Tax benefit for stock options exercised | | | | | | | | | | | | | | | 875 | | | | | | | | | | | | | | | | 875 | | |
Issuance of shares of restricted Class A Common Stock | | 5,616 | | | 1 | | | | | | | | | | 149 | | | | | | | | (150 | ) | | | | | | | — | | |
Amortization of deferred compensation | | | | | | | | | | | | | | | | | | | | | | | 289 | | | | | | | | 289 | | |
Net change in restricted stock units | | 42,433 | | | 4 | | | | | | | | | | 1,581 | | | | | | | | (343 | ) | | | | | | | 1,242 | | |
Common Stock dividends | | | | | | | | | | | | | | | | | | | (10,480 | ) | | | | | | | | | | | (10,480 | ) | |
Balance at December 31, 2005 | | 25,205,210 | | | $ | 2,521 | | | 7,343,880 | | | $ | 734 | | | | $ | 144,284 | | | | $ | 368,264 | | | | $ | (1,590 | ) | | | $ | 5,263 | | | | $ | 519,476 | | |
| | Class A
Common Stock
| | Class B
Common Stock
| |
| |
| |
| |
| |
|---|
| |
| |
| | Accumulated
Other
Comprehensive
Income (Loss)
| |
| |
|---|
| | Additional
Paid-In
Capital
| | Retained
Earnings
| | Total
Stockholders'
Equity
| |
|---|
| | Shares
| | Amount
| | Shares
| | Amount
| |
|---|
| Balance at December 31, 2004 | | 25,049,338 | | $ | 2.5 | | 7,343,880 | | $ | .7 | | $ | 138.8 | | $ | 324.2 | | $ | 26.7 | | $ | 492.9 | |
| | Comprehensive income: | | | | | | | | | | | | | | | | | | | | | | | |
| | | Net income | | | | | | | | | | | | | | | | 54.6 | | | | | | 54.6 | |
| | | Cumulative translation adjustment and other | | | | | | | | | | | | | | | | | | | (19.4 | ) | | (19.4 | ) |
| | | Pension plan additional minimum liability, net of tax of ($1.2m) | | | | | | | | | | | | | | | | | | | (2.0 | ) | | (2.0 | ) |
| | | | | | | | | | | | | | | | | | | | | |
| |
| | | Comprehensive income | | | | | | | | | | | | | | | | | | | | | | 33.2 | |
| | | | | | | | | | | | | | | | | | | | | |
| |
| | Shares of Class A Common Stock issued upon the exercise of stock options | | 107,823 | | | — | | | | | | | | 1.5 | | | | | | | | | 1.5 | |
| | Tax benefit for stock options exercised | | | | | | | | | | | | | .9 | | | | | | | | | .9 | |
| | Issuance of shares of restricted Class A Common Stock | | 5,616 | | | — | | | | | | | | — | | | | | | | | | — | |
| | Amortization of deferred compensation | | | | | | | | | | | | | .3 | | | | | | | | | .3 | |
| | Net change in restricted stock units | | 42,433 | | | — | | | | | | | | 1.2 | | | | | | | | | 1.2 | |
| | Common Stock dividends | | | | | | | | | | | | | | | | (10.5 | ) | | | | | (10.5 | ) |
| | |
| |
| |
| |
| |
| |
| |
| |
| |
| Balance at December 31, 2005 | | 25,205,210 | | $ | 2.5 | | 7,343,880 | | $ | .7 | | $ | 142.7 | | $ | 368.3 | | $ | 5.3 | | $ | 519.5 | |
| | Comprehensive income: | | | | | | | | | | | | | | | | | | | | | | | |
| | | Net income | | | | | | | | | | | | | | | | 73.7 | | | | | | 73.7 | |
| | | Cumulative translation adjustment and other | | | | | | | | | | | | | | | | | | | 25.0 | | | 25.0 | |
| | | Pension plan additional liability, net of tax of $0.6 million | | | | | | | | | | | | | | | | | | | .9 | | | .9 | |
| | | | | | | | | | | | | | | | | | | | | |
| |
| | | Comprehensive income | | | | | | | | | | | | | | | | | | | | | | 99.6 | |
| | | | | | | | | | | | | | | | | | | | | |
| |
| | Initial impact upon adoption of FAS 158, net of tax of ($3.8m) | | | | | | | | | | | | | | | | | | | (5.8 | ) | | (5.8 | ) |
| | Shares of Class A Common Stock issued upon the exercise of stock options | | 106,499 | | | — | | | | | | | | 1.9 | | | | | | | | | 1.9 | |
| | Tax benefit for stock options exercised | | | | | | | | | | | | | 1.4 | | | | | | | | | 1.4 | |
| | Stock-based compensation | | | | | | | | | | | | | 3.0 | | | | | | | | | 3.0 | |
| | Shares of Class B Common Stock converted to Class A Common Stock | | 50,000 | | | — | | (50,000 | ) | | — | | | | | | | | | | | | — | |
| | Issuance of shares of restricted Class A Common Stock | | 59,008 | | | — | | | | | | | | — | | | | | | | | | — | |
| | Net change in restricted stock units | | 68,394 | | | — | | | | | | | | .8 | | | | | | | | | .8 | |
| | Shares of Class A Common Stock issued in Stock Offering, net of offering costs of $11.4 million | | 5,750,000 | | | .6 | | | | | | | | 218.0 | | | | | | | | | 218.6 | |
| | Common Stock dividends | | | | | | | | | | | | | | | | (12.4 | ) | | | | | (12.4 | ) |
| | |
| |
| |
| |
| |
| |
| |
| |
| |
| Balance at December 31, 2006 | | 31,239,111 | | $ | 3.1 | | 7,293,880 | | $ | .7 | | $ | 367.8 | | $ | 429.6 | | $ | 25.4 | | $ | 826.6 | |
| | Comprehensive income: | | | | | | | | | | | | | | | | | | | | | | | |
| | | Net income | | | | | | | | | | | | | | | | 77.4 | | | | | | 77.4 | |
| | | Cumulative translation adjustment and other | | | | | | | | | | | | | | | | | | | 39.1 | | | 39.1 | |
| | | Pension plan gain arising during the year, net of tax of $3.0 million | | | | | | | | | | | | | | | | | | | 4.2 | | | 4.2 | |
| | | | | | | | | | | | | | | | | | | | | |
| |
| | | Comprehensive income | | | | | | | | | | | | | | | | | | | | | | 120.7 | |
| | | | | | | | | | | | | | | | | | | | | |
| |
| | Impact upon adoption of measurement date provisions of FAS158 | | | | | | | | | | | | | | | | (.8 | ) | | | | | (.8 | ) |
| | Shares of Class A Common Stock issued upon the exercise of stock options | | 66,658 | | | — | | | | | | | | 1.1 | | | | | | | | | 1.1 | |
| | Tax benefit for stock awards exercised | | | | | | | | | | | | | 1.0 | | | | | | | | | 1.0 | |
| | Stock-based compensation | | | | | | | | | | | | | 6.0 | | | | | | | | | 6.0 | |
| | Issuance of shares of restricted Class A Common Stock | | 58,726 | | | — | | | | | | | | — | | | | | | | | | — | |
| | Net change in restricted stock units | | 109,977 | | | — | | | | | | | | 1.7 | | | | | | | | | 1.7 | |
| | Repurchase and retirement of Class A Common Stock | | (874,416 | ) | | — | | | | | | | | | | | (25.2 | ) | | | | | (25.2 | ) |
| | Common Stock dividends | | | | | | | | | | | | | | | | (15.6 | ) | | | | | (15.6 | ) |
| | |
| |
| |
| |
| |
| |
| |
| |
| |
| Balance at December 31, 2007 | | 30,600,056 | | $ | 3.1 | | 7,293,880 | | $ | .7 | | $ | 377.6 | | $ | 465.4 | | $ | 68.7 | | $ | 915.5 | |
| | |
| |
| |
| |
| |
| |
| |
| |
| |
The accompanying notes are an integral part of these consolidated financial statements.
57
Watts Water Technologies, Inc. and Subsidiaries
Consolidated Statements of Cash Flows
(Amounts in thousands)millions)
| | Years Ended December 31, | |
| | 2005 | | 2004 | | 2003 | |
OPERATING ACTIVITIES | | | | | | | |
Income from continuing operations | | $ | 55,020 | | $ | 48,738 | | $ | 36,419 | |
Adjustments to reconcile net income from continuing operations to net cash provided by continuing operating activities: | | | | | | | |
Depreciation | | 23,542 | | 26,290 | | 20,502 | |
Amortization | | 2,576 | | 1,761 | | 763 | |
Other | | 572 | | 707 | | 1,065 | |
Deferred income taxes (benefit) | | (1,279 | ) | (5,735 | ) | (75 | ) |
Changes in operating assets and liabilities, net of effects frombusiness acquisitions and divestures: | | | | | | | |
Accounts receivable | | (16,546 | ) | (5,745 | ) | 1,858 | |
Inventories | | (20,330 | ) | (36,177 | ) | (7,176 | ) |
Prepaid expenses and other assets | | (4,098 | ) | 1,394 | | (1,289 | ) |
Accounts payable, accrued expenses and other liabilities | | 12,410 | | 8,977 | | 236 | |
Net cash provided by continuing operations | | 51,867 | | 40,210 | | 52,303 | |
INVESTING ACTIVITIES | | | | | | | |
Additions to property, plant and equipment | | (18,590 | ) | (20,999 | ) | (20,030 | ) |
Proceeds from the sale of property, plant and equipment | | 652 | | 2,143 | | 1,765 | |
Investments in securities | | — | | (25,000 | ) | (4,000 | ) |
Proceeds from sale of securities | | 26,600 | | 2,400 | | — | |
Increase in other assets | | (469 | ) | (1,470 | ) | (191 | ) |
Business acquisitions, net of cash acquired | | (191,396 | ) | (68,453 | ) | (15,291 | ) |
Net cash used in investing activities | | (183,203 | ) | (111,379 | ) | (37,747 | ) |
FINANCING ACTIVITIES | | | | | | | |
Proceeds from long-term debt | | 161,476 | | 92,480 | | 219,736 | |
Payments of long-term debt | | (41,995 | ) | (104,693 | ) | (177,916 | ) |
Shares transactions under employee stock plans | | 3,048 | | 4,868 | | 5,404 | |
Tax benefit of stock options exercised | | 875 | | 969 | | 423 | |
Debt issue costs | | — | | (1,079 | ) | (1,235 | ) |
Proceeds from stock offering, net | | — | | — | | 82,526 | |
Dividends | | (10,480 | ) | (9,071 | ) | (6,859 | ) |
Net cash provided by (used in) financing activities | | 112,924 | | (16,526 | ) | 122,079 | |
Effect of exchange rate changes on cash and cash equivalents | | (693 | ) | 2,054 | | 3,856 | |
Net cash provided by (used in) operating activities of discontinued operations (revised) | | (1,050 | ) | 6,553 | | (6,463 | ) |
INCREASE (DECREASE) IN CASH AND CASH EQUIVALENTS | | (20,155 | ) | (79,088 | ) | 134,028 | |
Cash and cash equivalents at beginning of year | | 65,913 | | 145,001 | | 10,973 | |
CASH AND CASH EQUIVALENTS AT END OF YEAR | | $ | 45,758 | | $ | 65,913 | | $ | 145,001 | |
NON CASH INVESTING AND FINANCING ACTIVITIES | | | | | | | |
Acquisition of businesses | | | | | | | |
Fair value of assets acquired | | $ | 230,587 | | $ | 80,126 | | $ | 21,217 | |
Cash paid, net of cash acquired | | 191,396 | | 68,453 | | 15,291 | |
Liabilities assumed | | $ | 39,191 | | $ | 11,673 | | $ | 5,926 | |
CASH PAID FOR: | | | | | | | |
Interest | | $ | 9,529 | | $ | 9,815 | | $ | 13,499 | |
Taxes | | $ | 30,698 | | $ | 33,000 | | $ | 17,700 | |
| | Years Ended December 31,
| |
|---|
| | 2007
| | 2006
| | 2005
| |
|---|
| OPERATING ACTIVITIES | | | | | | | | | | |
| | Net income | | $ | 77.4 | | $ | 73.7 | | $ | 54.6 | |
| | Less: loss from discontinued operations | | | (.2 | ) | | (3.4 | ) | | (.4 | ) |
| | |
| |
| |
| |
| | Income from continuing operations | | | 77.6 | | | 77.1 | | | 55.0 | |
| | Adjustments to reconcile income from continuing operations to net cash provided by continuing operating activities: | | | | | | | | | | |
| | | | Depreciation | | | 28.9 | | | 26.7 | | | 23.5 | |
| | | | Amortization | | | 10.5 | | | 8.6 | | | 2.6 | |
| | | | (Gain) loss on disposal and impairment of property, plant and equipment and other | | | 2.0 | | | (8.3 | ) | | .6 | |
| | | | Stock-based compensation | | | 6.0 | | | 3.0 | | | — | |
| | | | Deferred income tax benefit | | | (8.2 | ) | | (2.1 | ) | | (1.3 | ) |
| | | | Changes in operating assets and liabilities, net of effects from business acquisitions and divestures: | | | | | | | | | | |
| | | | | Accounts receivable | | | 6.5 | | | (17.0 | ) | | (16.5 | ) |
| | | | | Inventories | | | (8.1 | ) | | (37.3 | ) | | (20.3 | ) |
| | | | | Prepaid expenses and other assets | | | (1.2 | ) | | 2.0 | | | (4.1 | ) |
| | | | | Accounts payable, accrued expenses and other liabilities | | | (22.3 | ) | | 30.3 | | | 13.6 | |
| | |
| |
| |
| |
| | | Net cash provided by continuing operations | | | 91.7 | | | 83.0 | | | 53.1 | |
| | |
| |
| |
| |
| INVESTING ACTIVITIES | | | | | | | | | | |
| | Additions to property, plant and equipment | | | (37.8 | ) | | (44.7 | ) | | (18.6 | ) |
| | Proceeds from the sale of property, plant and equipment | | | .6 | | | 31.9 | | | .7 | |
| | Investments in securities | | | (27.5 | ) | | (11.8 | ) | | — | |
| | Proceeds from sale of securities | | | .4 | | | — | | | 26.6 | |
| | Increase in other assets | | | (.5 | ) | | (1.2 | ) | | (.5 | ) |
| | Business acquisitions, net of cash acquired | | | (22.6 | ) | | (93.4 | ) | | (191.4 | ) |
| | |
| |
| |
| |
| | | Net cash used in investing activities | | | (87.4 | ) | | (119.2 | ) | | (183.2 | ) |
| | |
| |
| |
| |
| FINANCING ACTIVITIES | | | | | | | | | | |
| | Proceeds from long-term debt | | | 43.8 | | | 356.6 | | | 161.5 | |
| | Payments of long-term debt | | | (71.5 | ) | | (228.3 | ) | | (42.0 | ) |
| | Payment of capital leases | | | (1.7 | ) | | (4.1 | ) | | — | |
| | Proceeds from share transactions under employee stock plans | | | 1.1 | | | 1.9 | | | 1.8 | |
| | Tax benefit of stock awards exercised | | | 1.0 | | | 1.4 | | | .9 | |
| | Debt issue costs | | | — | | | (2.4 | ) | | — | |
| | Proceeds from stock offering, net | | | — | | | 218.6 | | | — | |
| | Payments to repurchase common stock | | | (23.6 | ) | | — | | | — | |
| | Dividends | | | (15.6 | ) | | (12.4 | ) | | (10.5 | ) |
| | |
| |
| |
| |
| | | Net cash provided by (used in) financing activities | | | (66.5 | ) | | 331.3 | | | 111.7 | |
| | |
| |
| |
| |
| Effect of exchange rate changes on cash and cash equivalents | | | 9.4 | | | 1.2 | | | (.6 | ) |
| Net cash provided by (used in) operating activities of discontinued operations | | | .1 | | | .9 | | | (1.1 | ) |
| | |
| |
| |
| |
| INCREASE (DECREASE) IN CASH AND CASH EQUIVALENTS | | | (52.7 | ) | | 297.2 | | | (20.1 | ) |
| Cash and cash equivalents at beginning of year | | | 343.0 | | | 45.8 | | | 65.9 | |
| | |
| |
| |
| |
| CASH AND CASH EQUIVALENTS AT END OF YEAR | | $ | 290.3 | | $ | 343.0 | | $ | 45.8 | |
| | |
| |
| |
| |
| NON CASH INVESTING AND FINANCING ACTIVITIES | | | | | | | | | | |
| Fair value of assets acquired and liabilities assumed from the acquisition of businesses | | $ | 3.8 | | $ | 4.0 | | $ | — | |
| | |
| |
| |
| |
| Acquisitions of property, plant and equipment under capital lease | | $ | 1.4 | | $ | 16.0 | | $ | — | |
| | |
| |
| |
| |
| Issuance of stock under management stock purchase plan | | $ | 1.7 | | $ | .8 | | $ | 1.2 | |
| | |
| |
| |
| |
| Liability for shares repurchased | | $ | 1.4 | | $ | — | | $ | — | |
| | |
| |
| |
| |
| Retirement of variable rate demand bonds with cash collateral | | $ | — | | $ | (8.9 | ) | $ | 8.9 | |
| | |
| |
| |
| |
| CASH PAID FOR: | | | | | | | | | | |
| | Interest | | $ | 27.1 | | $ | 21.7 | | $ | 9.5 | |
| | |
| |
| |
| |
| | Taxes | | $ | 48.0 | | $ | 35.3 | | $ | 30.7 | |
| | |
| |
| |
| |
The accompanying notes are an integral part of these consolidated financial statements.
58
Watts Water Technologies, Inc. and Subsidiaries
Notes to Consolidated Financial Statements
(1) Description of Business
Watts Water Technologies, Inc. (the Company) designs, manufactures and sells an extensive line of water safety and flow control products primarily for the water quality, water safety, water flow control and water conservation markets located predominantly in North America, Europe, and China.
(2) Accounting Policies
Principles of Consolidation
The consolidated financial statements include the accounts of the Company and its majority and wholly owned subsidiaries. Upon consolidation, all significant intercompany accounts and transactions are eliminated.
Cash Equivalents
Cash equivalents consist of highly liquid investments with maturities of three months or less at the date of original issuance.
Investment Securities
Investment securities at December 31, 20042007 and 2006 consisted of auction rate certificates whose underlying investments were in AAA rated municipal bonds. The certificates are bought and sold at auction with reset dates of up to 35 days. The certificates are tradedwere purchased at par value, which approximates market value at December 31, 2004.2007 and 2006. The Company classifies its debt securities as available for sale.
Available-for-sale securities are recorded at fair value. Unrealized holding gains and losses, net of the related tax effect, on available-for-sale securities are excluded from earnings and are reported as a separate component of other comprehensive income until realized. Realized gains and losses from the sale of available-for-sale securities are determined on a specific-identification basis.
A decline in the market value of any available-for-sale security below cost that is deemed to be other-than-temporary results in a reduction in carrying amount to fair value. The impairment is charged to earnings and a new cost basis for the security is established. To determine whether an impairment is other-than-temporary, the Company considers whether it has the ability and intent to hold the investment until a market price recovery and considers whether evidence indicating the cost of the investment is recoverable outweighs evidence to the contrary. Evidence considered in this assessment includes the reasons for the impairment, the severity and duration of the impairment, changes in value subsequent to year-end, and forecasted performance of the investee.
Premiums and discounts are amortized or accreted over the life of the related available-for-sale security as an adjustment to yield using the effective-interest method. Dividend and interest income are recognized when earned.
Allowance for Doubtful Accounts
Allowance for doubtful accounts includes reserves for bad debts and sales returns and allowances. The Company analyzes the aging of accounts receivable, individual accounts receivable, historical bad debts, concentration of receivables by customer, customer credit worthiness, current economic trends and changes in customer payment terms. The Company specifically analyzes individual accounts receivable and
Watts Water Technologies, Inc. and Subsidiaries
Notes to Consolidated Financial Statements (Continued)
establishes specific reserves against financially troubled customers. In addition, factors
Watts Water Technologies, Inc. and Subsidiaries
Notes to Consolidated Financial Statements (Continued)
(2) Accounting Policies (Continued)
are developed in certain regions utilizing historical trends of sales and returns and allowances to derive a reserve for returns and allowances.
Concentration of Credit
The Company sells products to a diversified customer base and, therefore, has no significant concentrations of credit risk, except that approximately 10.7%, 10.3%10.0% and 11.1%10.7% of the Company’sCompany's total sales in 2006 and 2005, 2004 and 2003, respectively, arewere to one company.customer. These sales arewere transacted within the North America geographic segment. In 2007, no one customer accounted for 10.0% or more of the Company's total sales.
Inventories
Inventories are stated at the lower of cost (primarily(using primarily the first-in, first-out method) or market. Market value is determined by replacement cost or net realizable value. Historical experience is used as the basis for determining the reserve for excess or obsolete inventories.
Goodwill and Other Intangible Assets
Goodwill is recorded when the consideration paid for acquisitions exceeds the fair value of net tangible and intangible assets acquired. Goodwill and other intangible assets with indefinite useful lives are not amortized, but rather are tested annually for impairment. The test was performed as of October 30, 2005.28, 2007.
Impairment of Goodwill and Long-Lived Assets
Goodwill and intangible assets with indefinite lives are tested annually for impairment in accordance with the provisions of FAS 142.Financial Accounting Standards Board Statement No. 142 "Goodwill and Other Intangible Assets" (FAS 142). The Company’sCompany's impairment review is based on a discounted cash flow approach at the reporting unit level that requires management judgment with respect to revenue and expense growth rates, changes in working capital and the selection and use of an appropriate discount rate. The Company uses its judgment in assessing whether assets may have become impaired between annual impairment tests. Indicators such as unexpected adverse business conditions, economic factors, unanticipated technological change or competitive activities, loss of key personnel and acts by governments and courts, may signal that an asset has become impaired.
Intangible assets with estimable lives and other long-lived assets are reviewed for impairment whenever events or changes in circumstances indicate that the carrying amount of an asset or asset group may not be recoverable in accordance with Financial Accounting Standards Board Statement No. 144, “Accounting"Accounting for the Impairment or Disposal of Long-Lived Assets”Assets" (FAS 144). Recoverability of intangible assets with estimable lives and other long-lived assets is measured by a comparison of the carrying amount of an asset or asset group to future net undiscounted pretax cash flows expected to be generated by the asset or asset group. If these comparisons indicate that an asset is not recoverable, the impairment loss recognized is the amount by which the carrying amount of the asset or asset group exceeds the related estimated fair value. Estimated fair value is based on either discounted future pretax operating cash flows or appraised values, depending on the nature of the asset. The Company determines the discount rate for this analysis based on the expected internal rate of return for the related business and does not allocate interest charges to the asset or asset group being measured. Judgment is required to estimate discounted future operating cash flows.
Watts Water Technologies, Inc. and Subsidiaries
Notes to Consolidated Financial Statements (Continued)
(2) Accounting Policies (Continued)
The changes in the carrying amount of goodwill are as follows:
| | North
America | | Europe | | China | | Total | | | North
America
| | Europe
| | China
| | Total
|
|---|
| | (in thousands) | | | (in millions)
|
|---|
Carrying amount at December 31, 2003 | | $ 100,017 | | $ 81,812 | | $ 3,072 | | $ 184,901 | | |
| Carrying amount at December 31, 2005 | | | $ | 193.6 | | $ | 97.4 | | $ | 5.6 | | $ | 296.6 |
Goodwill acquired during the period | | 23,309 | | 9,546 | | 1,450 | | 34,305 | | | — | | 37.2 | | 3.4 | | 40.6 |
Adjustments to goodwill during the period | | 153 | | — | | — | | 153 | | | 5.3 | | — | | — | | 5.3 |
Effect of change in exchange rates used for translation | | 60 | | 6,759 | | — | | 6,819 | | | — | | 13.3 | | .3 | | 13.6 |
Carrying amount at December 31, 2004 | | $ 123,539 | | $ 98,117 | | $ 4,522 | | $ 226,178 | | |
| | | |
| |
| |
| |
|
| Carrying amount at December 31, 2006 | | | $ | 198.9 | | $ | 147.9 | | $ | 9.3 | | $ | 356.1 |
Goodwill acquired during the period | | 69,712 | | 12,295 | | — | | 82,007 | | | 7.6 | | — | | — | | 7.6 |
Adjustments to goodwill during the period | | 252 | | (188 | ) | 939 | | 1,003 | | | 3.8 | | 1.1 | | 2.4 | | 7.3 |
Effect of change in exchange rates used for translation | | 94 | | (12,786 | ) | 140 | | (12,552 | ) | | .7 | | 13.4 | | .7 | | 14.8 |
Carrying amount at December 31, 2005 | | $ 193,597 | | $ 97,438 | | $ 5,601 | | $ 296,636 | | |
| | | |
| |
| |
| |
|
| Carrying amount at December 31, 2007 | | | $ | 211.0 | | $ | 162.4 | | $ | 12.4 | | $ | 385.8 |
| | | |
| |
| |
| |
|
The adjustments to North American goodwill during the year ended December 31, 2007 relate to an accrual of approximately $3.8 million in earn-out provisions. The adjustment to European goodwill during the year ended December 31, 2007 includes the finalization of the ATS Expansion Group purchase price allocation. ATS Expansion Group was acquired in May 2006. The adjustment to China goodwill during the year ended December 31, 2007 includes the finalization of the Changsha Valve Works purchase price allocation. Changsha Valve Works was acquired in April 2006.
The adjustments to North American goodwill during the year ended December 31, 2006 relate to an accrual of approximately $4.0 million in earn-out provisions and in 2006 includes the finalization of the Dormont Manufacturing Company and Core Industries Inc. purchase price allocations. Dormont Manufacturing Company and Core Industries Inc. were acquired in December 2005.
Other intangible assets include the following and are presented in “Other"Other Assets: Other, net”net", in the Consolidated Balance Sheets:
| | December 31, | |
| | December 31,
| |
|---|
| | 2005 | | 2004 | |
| | 2007
| | 2006
| |
|---|
| | Gross
Carrying
Amount | | Accumulated
Amortization | | Gross
Carrying
Amount | | Accumulated
Amortization | |
| | Gross
Carrying
Amount
| | Accumulated
Amortization
| | Gross
Carrying
Amount
| | Accumulated
Amortization
| |
|---|
| | (in thousands) | |
| | (in millions)
| |
|---|
Patents | | $ 9,264 | | | $ (4,669 | ) | | $ 8,905 | | | $ (4,286 | ) | | Patents | | $ | 13.8 | | $ | (6.1 | ) | $ | 13.2 | | $ | (5.3 | ) |
| Customer relationships | | Customer relationships | | 70.0 | | (14.3 | ) | | 65.3 | | (7.5 | ) |
| Technology | | Technology | | 7.5 | | (2.3 | ) | | 7.5 | | (1.2 | ) |
Other | | 58,866 | | | (4,700 | ) | | 17,959 | | | (2,636 | ) | | Other | | 19.0 | | (5.8 | ) | | 15.3 | | (4.0 | ) |
Total amortizable intangibles | | 68,130 | | | (9,369 | ) | | 26,864 | | | (6,922 | ) | | |
| | | | |
| |
| |
| |
| |
| | | Total amortizable intangible assets | | 110.3 | | (28.5 | ) | | 101.3 | | (18.0 | ) |
| | | | |
| |
| |
| |
| |
Intangible assets not subject to amortization | | 40,582 | | | — | | | 18,875 | | | — | | | Intangible assets not subject to amortization | | 52.2 | | — | | 50.5 | | — | |
Total | | $ 108,712 | | | $ (9,369 | ) | | $ 45,739 | | | $ (6,922 | ) | | |
| | | | |
| |
| |
| |
| |
| | | Total | | $ | 162.5 | | $ | (28.5 | ) | $ | 151.8 | | $ | (18.0 | ) |
| | | | |
| |
| |
| |
| |
Aggregate amortization expense for amortized other intangible assets for the yearyears ended December 31, 2007, 2006 and 2005 2004was $10.5 million, $8.6 million and 2003 was $2,576,000, $1,761,000 and $763,000,$2.6 million, respectively. Additionally, future amortization expense on otheramortizable intangible assets approximates $5,861,000 for 2006, $5,284,000 for 2007, $5,135,000$9.3 million for 2008, $4,860,000$9.0 million for 2009, $8.9 million for 2010, $8.3 million for 2011 and $4,842,000$6.9 million for 2010. 2012.
Watts Water Technologies, Inc. and Subsidiaries
Notes to Consolidated Financial Statements (Continued)
(2) Accounting Policies (Continued)
Amortization expense is provided on a straight-line basis over the estimated useful lives of the intangible assets. The weighted-average remaining life of total amortizable intangiblesintangible assets is 10.110.8 years. Patents, customer relationships, technology and other amortizable intangibles have weighted-average remaining lives of 11.59.2 years, 9.4 years, 6.4 years and 10.019.2 years, respectively. Intangible assets not subject to amortization primarily include trademarks and unpatented technology.
Property, Plant and Equipment
Property, plant and equipment are recorded at cost. Depreciation is provided on a straight-line basis over the estimated useful lives of the assets, which range from 10 to 40 years for buildings and improvements and 3 to 15 years for machinery and equipment.
Taxes, Other than Income Taxes
Taxes assessed by governmental authorities on sale transactions are recorded on a net basis and excluded from sales, in the Company's consolidated statements of operations.
Income Taxes
Income taxes are accounted for under the asset and liability method. Deferred tax assets and liabilities are recognized for the future tax consequences attributable to differences between the financial statement
Watts Water Technologies, Inc. and Subsidiaries
Notes to Consolidated Financial Statements (Continued)
carrying amounts of existing assets and liabilities and their respective tax bases and operating loss and tax credit carry forwards. Deferred tax assets and liabilities are measured using enacted tax rates expected to apply to taxable income in the years in which those temporary differences are expected to be recovered or settled. The effect on deferred tax assets and liabilities of a change in tax rates is recognized in income in the period that includes the enactment date.
On January 1, 2007, the Company adopted the provisions of Financial Accounting Standards Board Interpretation No. 48, "Accounting for Uncertainty in Income Taxes" (FIN 48). The purpose of FIN 48 is to increase the comparability in financial reporting of income taxes. FIN 48 requires that in order for a tax benefit to be booked in the income statement, the item in question must meet the more-likely-than-not (greater than 50% likelihood of being sustained upon examination by the taxing authorities) threshold. The adoption of FIN 48 did not have a material effect on the Company's financial statements. No cumulative effect was booked through beginning retained earnings.
As of the adoption date, the Company had gross unrecognized tax benefits of approximately $4.8 million, of which approximately $4.2 million, if recognized, would affect the effective tax rate. The difference between the amount of unrecognized tax benefits and the amount that would impact the effective tax rate consists of the federal tax benefit of state income tax items. During 2007, the Company reduced its unrecognized tax benefits by approximately $0.6 million for a tax issue in Italy. As a result of the conclusion of state income tax audits, it is reasonably possible that the total amount of unrecognized tax benefits will change in the next twelve months. The Company estimates that it is reasonably possible that approximately $0.5 million of the currently remaining unrecognized tax benefit may be recognized by the end of 2008 as a result of the conclusion of the state income tax audits. Notwithstanding, the Company does not expect any further significant changes in the amounts of unrecognized tax benefits within the next twelve months.
As of December 31, 2007, the Company had gross unrecognized tax benefits of approximately $3.7 million, of which approximately $3.2 million, if recognized, would affect the effective tax rate. The difference between the amount of unrecognized tax benefits and the amount that would impact the
Watts Water Technologies, Inc. and Subsidiaries
Notes to Consolidated Financial Statements (Continued)
(2) Accounting Policies (Continued)
effective tax rate consists of the federal tax benefit of state income tax items. A reconciliation of the beginning and ending amount of unrecognized tax benefits and a separate analysis of accrued interest related to the unrecognized tax benefits is as follows:
| | (in millions)
| |
|---|
| Balance as of January 1, 2007 | | $ | 4.8 | |
| Increases related to prior year tax provisions | | | 1.1 | |
| Decreases related to prior year tax provisions | | | (1.6 | ) |
| Increases related to current year tax positions | | | .2 | |
| Settlements | | | (.8 | ) |
| | |
| |
| Balance as of December 31, 2007 | | $ | 3.7 | |
| | |
| |
Accrued interest related to unrecognized tax benefits:
| | (in millions)
|
|---|
| Balance as of January 1, 2007 | | $ | .6 |
| Increases | | | .4 |
| Decreases | | | — |
| | |
|
| Balance as of December 31, 2007 | | $ | 1.0 |
| | |
|
The Company was under audit by the Internal Revenue Service for the 2003 and 2004 tax years. The audit was completed in February 2008 and resulted in no significant adjustments. The Company conducts business in a variety of locations throughout the world resulting in tax filings in numerous domestic and foreign jurisdictions. The Company is subject to tax examinations regularly as part of the normal course of business. The Company's major jurisdictions are the U.S., Canada, China, Netherlands, U.K., Germany, Italy and France. With few exceptions the Company is no longer subject to U.S. federal, state and local, or non-U.S. income tax examinations for years before 2002.
The Company accounts for interest and penalties related to uncertain tax positions as a component of income tax expense.
Several tax years remain subject to examination by major jurisdictions. Years that remain open to examination with respect to U.S. federal taxes are 2005-2006. The Company is currently under audit by the Commonwealth of Massachusetts for 2001-2003. Upon conclusion of that audit, 2004-2006 will remain open. Years that remain open to examination in Canada are 2003-2006. Years that remain open to examination for major European countries include the United Kingdom 2002-2006, Germany 2005-2006, Italy 2002-2006, France 2005-2006 and the Netherlands 2002-2006.
Foreign Currency Translation
The financial statements of subsidiaries located outside the United States generally are measured using the local currency as the functional currency. Balance sheet accounts, including goodwill, of foreign subsidiaries are translated into United States dollars at year-end exchange rates. Income and expense items are translated at weighted average exchange rates for each period. Net translation gains or losses are included in other comprehensive income, a separate component of stockholders’stockholders' equity. The Company does not provide for U.S. income taxes on foreign currency translation adjustments since
Watts Water Technologies, Inc. and Subsidiaries
Notes to Consolidated Financial Statements (Continued)
(2) Accounting Policies (Continued)
it does not provide for such taxes on undistributed earnings of foreign subsidiaries. Gains and losses from foreign currency transactions of these subsidiaries are included in net earnings.
Stock-Based Compensation
Effective January 1, 2006, the Company adopted Financial Accounting Standards Board Statement No. 123R, "Share-Based Payment" (FAS 123R) utilizing the "modified prospective" method as described in FAS 123R. Under the "modified prospective" method, compensation cost is recognized for all share-based payments granted after the effective date and for all unvested awards granted prior to the effective date. In accordance with FAS 123R, prior period amounts were not restated. FAS 123R also requires the excess tax benefits associated with these share-based payments to be classified as financing activities in the Statements of Consolidated Cash Flows, rather than as operating cash flows as required under previous regulations.
At December 31, 2007, the Company had three stock-based compensation plans with total unrecognized compensation costs related to unvested stock-based compensation arrangements of approximately $9.5 million and a total weighted average remaining term of 2.3 years. For 2007 and 2006, the Company recognized compensation costs related to stock-based programs of approximately $6.0 million and $3.0 million, respectively, in selling, general and administrative expenses. The Company accountsrecorded approximately $0.7 million and $0.4 million of tax benefit during 2007 and 2006, respectively, for the compensation expense relating to its stock options. For 2007 and 2006, the Company recorded approximately $1.3 million and $0.6 million, respectively, of tax benefit for its other stock-based compensations in accordance withplans. For 2007 and 2006, the recognition of total stock-based compensation expense impacted both basic net income per common share and diluted net income per common share by $0.10 and $0.06, respectively.
Prior to the effective date, the stock-based compensation plans were accounted for under Accounting Principles Board Opinion (APB) No. 25, “Accounting"Accounting for Stock Issued to Employees” (APB No. 25),Employees," and related interpretations. The Company recordsPro-forma information regarding the impact of total stock-based compensation expense associated with its Management Stock Purchase Plan due to the discount from market price. Stock-based compensation expense is amortized to expense on a straight-line basis over the vesting period. The following table illustrates the effect on reported net income and earningsincome per common share for prior periods is required by FAS 123R.
Such pro-forma information, determined as if the Company had appliedaccounted for its employee stock options and restricted stock units (RSUs) under the fair value method to measure stock-based compensation which is described more fully in Note 13 as required under the disclosure provisions of Financial Accounting Standards Board Statement No. 123, “Accounting"Accounting for Stock-Based Compensation”Compensation" (FAS 123) as amended by Financial Accounting Standards Board Statement No. 148 “Accounting"Accounting for Stock-Based Compensation Transition and Disclosure” (FAS 148).
| | Years Ended December 31, | |
| | 2005 | | 2004 | | 2003 | |
| | (in thousands) | |
Net income, as reported | | $ 54,599 | | $ 46,820 | | $ 33,362 | |
Add: Stock-based employee compensation expense from the Management Stock Purchase Plan included in reported net income, net of tax | | 531 | | 384 | | 202 | |
Deduct: Stock-based employee expense determined under the fair value method, net of tax: | | | | | | | |
Restricted stock units (Management Stock Purchase Plan) | | (560 | ) | (381 | ) | (271 | ) |
Employee stock options | | (1,144 | ) | (670 | ) | (575 | ) |
Pro forma net income | | $ 53,426 | | $ 46,153 | | $ 32,718 | |
Earnings per share: | | | | | | | |
Basic—as reported | | $ 1.68 | | $ 1.45 | | $ 1.22 | |
Basic—pro forma | | 1.64 | | 1.43 | | 1.19 | |
Diluted—as reported | | 1.66 | | 1.43 | | 1.21 | |
Diluted—pro forma | | $ 1.62 | | $ 1.42 | | $ 1.18 | |
62
Watts Water Technologies, Inc. and Subsidiaries
Notes to Consolidated Financial Statements (Continued)
(2) Accounting Policies (Continued)
and Disclosure" (FAS 148) during 2005, is illustrated in the following tables (Amounts in millions, except per share information):
| | Year Ended
December 31,
2005
| |
|---|
| Net income, as reported | | $ | 54.6 | |
| Add: Stock-based employee compensation expense from the Management Stock Purchase Plan included in reported net income, net of tax | | | .5 | |
| Deduct: Stock-based employee expense determined under the fair value method, net of tax: | | | | |
| | Restricted stock units (Management Stock Purchase Plan) | | | (.6 | ) |
| | Employee stock options | | | (1.1 | ) |
| | |
| |
| Pro forma net income | | $ | 53.4 | |
| | |
| |
| Earnings per share: | | | | |
| | Basic—as reported | | $ | 1.68 | |
| | Basic—pro forma | | $ | 1.64 | |
| | Diluted—as reported | | $ | 1.66 | |
| | Diluted—pro forma | | $ | 1.62 | |
Net Income Per Common Share
Basic net income per common share is calculated by dividing net income by the weighted average number of common shares outstanding. The calculation of diluted earningsincome per share assumes the conversion of all dilutive securities (see Note 13).
Net income and number of shares used to compute net earningsincome per share, basic and assuming full dilution, are reconciled below:
| | Years Ended December 31, | | | Years Ended December 31,
| |
|---|
| | 2005 | | 2004 | | 2003 | | | 2007
| | 2006
| | 2005
| |
|---|
| | Net
Income | | Shares | | Per
Share
Amount | | Net
Income | | Shares | | Per
Share
Amount | | Net
Income | | Shares | | Per
Share
Amount | | | Net
Income
| | Shares
| | Per
Share
Amount
| | Net
Income
| | Shares
| | Per
Share
Amount
| | Net
Income
| | Shares
| | Per
Share
Amount
| |
|---|
| | (Amounts in thousands, except per share information) | | | (Amounts in millions, except per share information)
| |
|---|
Basic EPS | | $ | 54,599 | | 32,489 | | | $ | 1.68 | | | $ | 46,820 | | 32,276 | | | $ | 1.45 | | | $ | 33,362 | | 27,455 | | | $ | 1.22 | | | | $ | 77.4 | | 38.6 | | $ | 2.00 | | $ | 73.7 | | 33.3 | | $ | 2.21 | | $ | 54.6 | | 32.5 | | $ | 1.68 | |
Dilutive securities principally common stock options | | — | | 513 | | | 0.02 | | | — | | 443 | | | 0.02 | | | — | | 237 | | | 0.01 | | | | | — | | .4 | | | (.01 | ) | | — | | .4 | | | (.02 | ) | | — | | .5 | | | (.02 | ) |
| | | |
| |
| |
| |
| |
| |
| |
| |
| |
| |
Diluted EPS | | $ | 54,599 | | 33,002 | | | $ | 1.66 | | | $ | 46,820 | | 32,719 | | | $ | 1.43 | | | $ | 33,362 | | 27,692 | | | $ | 1.21 | | | | $ | 77.4 | | 39.0 | | $ | 1.99 | | $ | 73.7 | | 33.7 | | $ | 2.19 | | $ | 54.6 | | 33.0 | | $ | 1.66 | |
| | | |
| |
| |
| |
| |
| |
| |
| |
| |
| |
The computation of diluted net income per share for the year ended December 31, 2007 excludes the effect of the potential exercise of options to purchase approximately 0.5 million shares, because the exercise price of the option was greater than the average market price of the Class A Common Stock, as the effect would have been anti-dilutive.
During the period January 1, 2008 to February 22, 2008, the Company repurchased approximately 1.4 million shares of its Class A Common Stock.
Watts Water Technologies, Inc. and Subsidiaries
Notes to Consolidated Financial Statements (Continued)
(2) Accounting Policies (Continued)
Derivative Financial Instruments
In the normal course of business, the Company manages risks associated with commodity prices, foreign exchange rates and interest rates through a variety of strategies, including the use of hedging transactions, executed in accordance with the Company’sCompany's policies. The Company’sCompany's hedging transactions include, but are not limited to, the use of various derivative financial and commodity instruments. As a matter of policy, the Company does not use derivative instruments unless there is an underlying exposure. Any change in the value of ourthe derivative instruments would be substantially offset by an opposite change in the value of the underlying hedged items. The Company does not use derivative instruments for trading or speculative purposes.
Using qualifying criteria defined in Financial Accounting Standards Board Statement No. 133, “Accounting"Accounting for Derivative Instruments and Hedging Activities”Activities" (FAS 133), derivative instruments are designated and accounted for as either a hedge of a recognized asset or liability (fair value hedge) or a hedge of a forecasted transaction (cash flow hedge). For a fair value hedge, both the effective and ineffective portions of the change in fair value of the derivative instrument, along with an adjustment to the carrying amount of the hedged item for fair value changes attributable to the hedged risk, are recognized in earnings. For a cash flow hedge, changes in the fair value of the derivative instrument that are highly effective are deferred in accumulated other comprehensive income or loss until the underlying hedged item is recognized in earnings.
The ineffective portion of fair value changes on qualifying hedges is recognized in earnings immediately. If a fair value or cash flow hedge were to cease to qualify for hedge accounting or be terminated, it would continue to be carried on the balance sheet at fair value until settled, but hedge accounting would be discontinued prospectively. If a forecasted transaction werewas no longer probable of occurring, amounts previously deferred in accumulated other comprehensive income would be recognized immediately in earnings. On occasion, the Company may enter into a derivative instrument that does not qualify for which hedge accounting is not required because it is entered into to offset changes in the fair value of an underlying transaction which is required to be recognized in earnings (natural hedge). These instruments
Watts Water Technologies, Inc. and Subsidiaries
Notes to Consolidated Financial Statements (Continued)
are reflected in the Consolidated Balance Sheets at fair value with changes in fair value recognized in earnings.
Certain forecasted transactions, primarily intercompany sales between the United States and Canada, and assets are exposed to foreign currency risk. The Company monitors its foreign currency exposures on an ongoing basis to maximize the overall effectiveness of its foreign currency hedge positions. During 20052007 and 2004,2006, the Company used foreign currency forward contracts as a means of hedging exposure to foreign currency risks. The Company’sCompany's foreign currency forwards have been designated anddid not qualify as a cash flow hedgeshedge under the criteria of FAS 133. FAS 133 requires that changes in fair value of derivatives that qualify as cash flow hedges be recognized in other comprehensive income while the ineffective portion of the derivative’s change in fair value be recognized immediately in earnings.
Portions of the Company’sCompany's outstanding debt are exposed to interest rate risks. The Company monitors its interest rate exposures on an ongoing basis to maximize the overall effectiveness of its interest rates. During 2005 and 2004,2006, the Company used an interest rate swap as a means of hedging exposure to interest rate risks.risks (see Note 11). The Company's interest rate swap did not qualify as a cash flow hedge under the criteria of FAS 133.
Shipping and Handling
Shipping and handling costs included in selling, general and administrative expense amounted to $28,123,000, $25,110,000$39.1 million, $37.3 million and $22,111,000$28.1 million for the years ended December 31, 2007, 2006 and 2005, 2004respectively.
Watts Water Technologies, Inc. and 2003, respectively.Subsidiaries
Notes to Consolidated Financial Statements (Continued)
(2) Accounting Policies (Continued)
Research and Development
Research and development costs included in selling, general, and administrative expense amounted to $11,576,000, $9,942,000$15.1 million, $12.7 million and $9,178,000$11.6 million for the years ended December 31, 2005, 20042007, 2006 and 2003,2005, respectively.
Revenue Recognition
The Company recognizes revenue when all of the following criteria have been met: the Company has entered into a binding agreement, the product has been shipped and title passes, the sales price to the customer is fixed or is determinable, and collectability is reasonably assured. Provisions for estimated returns and allowances are made at the time of sale, and are recorded as a reduction of sales and included in the allowance for doubtful accounts in the Consolidated Balance Sheets. The Company records provisions for sales incentives (primarily volume rebates), as an adjustment to net sales in accordance with the Financial Accounting Standards Board’sBoard's Emerging Issues Task Force (EITF) Issue 00-14, “Accounting"Accounting for Certain Sales Incentives”Incentives" (EITF 00-14) and EITF Issue No 01-9, “Accounting"Accounting for Consideration Given by a Vendor to a Customer or a Reseller of the Vendor’s Products”Vendor's Products".
Basis of Presentation
Certain amounts for 20042006 and 2005 have been reclassified to permit comparison with the 20052007 presentation.
Estimates
The preparation of financial statements in conformity with accounting principles generally accepted in the United States requires management to make estimates and assumptions that affect the reported
Watts Water Technologies, Inc. and Subsidiaries
Notes to Consolidated Financial Statements (Continued)
amounts of assets and liabilities and disclosure of contingent assets and liabilities at the date of the financial statements and the reported amounts of revenues and expenses during the reporting period. Actual results could differ from those estimates.
New Accounting Standards
In November 2004,December 2007, the Financial Accounting Standards Board (FASB) issued Financial Accounting Standards Board Statement (FAS) No. 151, “Inventory Costs”141 (R), "Business Combinations," (FAS 151).141R), which requires most identifiable assets, liabilities, non-controlling interests, and goodwill acquired in a business combination to be recorded at "full fair value." Under FAS 151 amends141R, all business combinations will be accounted for under the acquisition method. Significant changes, among others, from current guidance resulting from FAS 141R includes the requirement that contingent assets and liabilities and contingent consideration shall be recorded at estimated fair value as of the acquisition date, with any subsequent changes in fair value charged or credited to earnings. Further, acquisition-related costs will be expensed rather than treated as part of the acquisition. FAS 141R is effective for periods beginning on or after December 15, 2008. The Company expects the adoption of FAS 141R will increase costs charged to its operations.
In December 2007, the FASB issued FAS No. 160, "Non-controlling Interests in Consolidated Financial Statements, an amendment of ARB NO. 151," (FAS 160), which requires non-controlling interests (previously referred to as minority interest) to be treated as a separate component of equity, not as a liability as is current practice. FAS 160 applies to non-controlling interests and transactions with non-controlling interest holders in consolidated financial statements. FAS 160 is effective for
Watts Water Technologies, Inc. and Subsidiaries
Notes to Consolidated Financial Statements (Continued)
(2) Accounting ResearchPolicies (Continued)
periods beginning on or after December 15, 2008. The Company is currently evaluating the effect that FAS 160 will have on its consolidated financial statements.
In February 2007, the FASB issued FAS No. 159, "The Fair Value Option for Financial Assets and Financial Liabilities—including an Amendment to FAS No. 115," (FAS 159), which permits entities to choose to measure many financial instruments and certain other items at fair value. FAS 159 is effective for financial statements issued for fiscal years beginning after November 15, 2007 and interim periods within those fiscal years. Earlier application is encouraged. The Company does not expect to measure its financial instruments at fair value and therefore does not expect the adoption of FAS 159 to have a material impact on its consolidated financial statements.
In September 2006, the FASB issued FAS No. 157, "Fair Value Measurements" (FAS 157), which defines fair value, establishes a framework for measuring fair value in generally accepted accounting principles and expands disclosures about fair value measurements. For financial assets and liabilities, FAS 157 is effective for financial statements issued for fiscal years beginning after November 15, 2007 and interim periods within those fiscal years. For nonfinancial assets and liabilities, FAS 157 is effective for financial statements issued for fiscal years beginning after November 15, 2008 and interim periods within those fiscal years. Earlier application is encouraged provided that the reporting company has not yet issued financial statements for that fiscal year, including financial statements for an interim period within that fiscal year. The Company does not expect the adoption of FAS 157 will have a material impact on its consolidated financial statements.
In September 2006, the Securities and Exchange Commission issued Staff Accounting Bulletin No. 43, Chapter 4, “Inventory Pricing,”108, "Considering the Effects of Prior Year Misstatements When Quantifying Misstatements in Current Year Financial Statements" (SAB 108), which provides interpretive guidance on how the effects of the carryover or reversal of prior year misstatements should be considered in quantifying a current year misstatement. SAB 108 is effective for fiscal years ending after November 15, 2006. The Company adopted the provisions of SAB 108 for fiscal year 2006 and the impact of SAB 108 was not material to clarifyits consolidated financial statements.
In September 2006, the FASB issued FAS No. 158, "Employers' Accounting for Defined Benefit Pension and Other Postretirement Plans—an amendment of FASB Statements No. 87, 88, 106, and 132(R)," (FAS 158), which requires an employer to: (a) recognize in its statement of financial position an asset for a plan's overfunded status or a liability for a plan's underfunded status; (b) measure a plan's assets and its obligations that determine its funded status as of the end of the employer's fiscal year; and (c) recognize changes in the funded status of a defined benefit postretirement plan in the year in which the changes occur. Those changes are reported in other comprehensive income. The requirement to recognize the funded status of a benefit plan and the disclosure requirements are effective as of the end of the fiscal year ending after December 15, 2006 for companies with publicly traded equity securities. The requirement to measure plan assets and benefit obligations as of the date of the employer's fiscal year-end statement of financial position is effective for fiscal years ending after December 15, 2008, although earlier adoption is permitted. As a result of the requirement to recognize the funded status of the Company benefit plans as of December 31, 2006, the Company recorded an increase in its pension liability of approximately $8.3 million, a decrease of approximately $1.3 million in other assets: other, net and a decrease in accumulated other comprehensive income of approximately $5.8 million, net of tax. The Company has early-adopted the measurement date provisions of FAS 158 effective January 1, 2007. The Company's pension plans previously used a September 30 measurement date. All plans are now measured as of December 31, consistent with the Company's fiscal year end.
Watts Water Technologies, Inc. and Subsidiaries
Notes to Consolidated Financial Statements (Continued)
(2) Accounting Policies (Continued)
The non-cash effect of the adoption of the measurement date provisions of FAS 158 was not material and there was no effect on the Company's results of operations.
In July 2006, the FASB issued Financial Interpretation No. 48, "Accounting for Uncertainty in Income Taxes," (FIN 48), which clarifies the accounting for inventory costs. The provisions of this statement areuncertainty in income taxes recognized in the financial statements in accordance with SFAS No. 109, "Accounting for Income Taxes." FIN 48 provides that a tax benefit from an uncertain tax position may be recognized when it is more likely than not that the position will be sustained upon examination, based on the technical merits. This interpretation also provides guidance on measurement, de-recognition, classification, interest and penalties, accounting in interim periods, disclosure and transition. FIN 48 was effective for fiscal years beginning after JuneDecember 15, 2005, although early application is permitted.2006. The Company does not expect thatadopted the provisions of FIN 48 for fiscal year 2007 and the impact of this statement will bewas not material to theits consolidated financial statements.
In March 2006, the FASB issued FAS No. 156 "Accounting for Servicing of Financial Assets—an amendment of FASB Statement No. 140," (FAS 156). FAS 156 amends FAS Statement No.140, "Accounting for Transfers and Servicing of Financial Assets and Extinguishments of Liabilities," with respect to the accounting for separately recognized servicing assets and servicing liabilities. FAS 156 addresses the recognition and measurement of separately recognized servicing assets and liabilities and provides an approach to simplify efforts to obtain hedge-like (offset) accounting. The Company adopted the provisions of FAS 156 for fiscal year 2007 and the impact was not material to its consolidated financial statements.
In February 2006, the FASB issued FAS No. 155 "Accounting for Certain Hybrid Financial Instruments—an amendment of FASB Statements No. 133 and 140" (FAS 155). FAS 155 amends FAS 133, "Accounting for Derivatives and Hedging Activities," and FAS 140, "Accounting for Transfers and Servicing of Financial Assets and Extinguishments of Liabilities," and allows an entity to remeasure at fair value a hybrid financial instrument that contains an embedded derivative that otherwise would require bifurcation from the host, if the holder irrevocably elects to account for the whole instrument on a fair value basis. Subsequent changes in the fair value of the instrument would be recognized in earnings. The Company adopted the provisions of FAS 155 for fiscal year 2007 and the impact was not material to its consolidated financial statements.
In May 2005, the FASB issued FAS No. 154, "Accounting Changes and Error Correction Replacement of APB Opinion No. 20 and FASB Statement No. 3" (FAS 154). FAS 154 replaces APB Opinion No. 20, "Accounting Changes" (APB 20), and FASB Statement No. 3, "Reporting Accounting Changes in Interim Financial Statements," and changes the requirements for the accounting for and reporting of a change in accounting principle. APB 20 previously required that most voluntary changes in accounting principles be recognized by including in net income of the period of the change the cumulative effect of changing to the new accounting principle. FAS 154 requires retrospective application to prior periods' financial statements of changes in accounting principle. FAS 154 defines retrospective application as the application of a different accounting principle to prior accounting periods as if that principle had always been used. FAS 154 also requires that a change in depreciation, amortization, or depletion method for long-lived, non-financial assets be accounted for as a change in accounting estimate affected by a change in accounting principle. The impact was not material to its consolidated financial statements.
In December 2004, the FASB issued its final standard on accounting for share-based payments (SBP), Financial Accounting Standards Board Statement No. 123R (FAS 123R) that requires companies to expense the value of employee stock options and similar awards. The statement applies to all outstanding and unvested SBP awards at a company’s adoption date. The Securities and Exchange Commission delayed implementation to fiscal years beginning after June 15, 2005. Therefore, the Company has implemented FAS 123R effective January 1, 2006 utilizing the modified prospective method, which requires recognizing expense for options over their remaining vesting period. The portion of these options’ fair value attributable to vested awards prior to the adoption is never recognized. The impact of this statement on the Company’s results of operations (based on equity instruments outstanding at December 31, 2005) for the fiscal year ending December 31, 2006 is expected to be approximately ($0.03) per share.
In December 2004, the FASB issued Financial Accounting Standards Board Statement No. 153, “Exchanges"Exchanges of Nonmonetary Assets, an amendment of APB Opinion No. 29, Accounting for Nonmonetary Transactions”Transactions" (FAS 153). The amendments made by FAS 153 are based on the principle that exchanges of nonmonetary assets should
Watts Water Technologies, Inc. and Subsidiaries
Notes to Consolidated Financial Statements (Continued)
(2) Accounting Policies (Continued)
be measured based on the fair value of the assets exchanged. Further, the amendments eliminate the narrow exception for nonmonetary exchanges of similar productive assets and replace it with a broader exception for exchanges of nonmonetary assets that do not have commercial substance. Previously, Opinion No. 29 required that the accounting for an exchange of a productive asset for a similar productive asset or an equivalent interest in the same or similar productive asset should be based on the recorded amount of the asset relinquished. The statement is effective for nonmonetary asset exchanges occurring in fiscal periods beginning after June 15, 2005. Earlier application is permitted for nonmonetary asset exchanges occurring in fiscal periods beginning after the date of issuance. The provisions of this statement shall bewere applied prospectively in January 2006.and the impact was not material to the Company's consolidated financial statements.
In March 2005,November 2004, the FASB issued FASB InterpretationFAS No. 47, “Accounting for Conditional Asset Retirement Obligations” (FIN 47). FIN 47 is an interpretation of FASB Statement No. 143, “Accounting for Asset Retirement Obligations”151, "Inventory Costs" (FAS 143) and serves to clarify that an entity is required to recognize a liability for the fair value of a conditional asset retirement obligation when incurred if the liability’s fair value can be reasonably estimated. FIN 47 also clarifies when an entity would have sufficient information to reasonably estimate such a liability. FIN 47 is effective no later than the end of fiscal years ending after December 15, 2005. The Company concluded that FIN 47 did not have a material impact on the consolidated financial statements as of December 31, 2005.
In May 2005, the FASB issued Financial Accounting Standards Board Statement No. 154, “Accounting Changes and Error Corrections”(FAS 154), a replacement of APB Opinion No. 20,
Watts Water Technologies, Inc. and Subsidiaries
Notes to Consolidated Financial Statements (Continued)
“Accounting Changes” and a replacement of FASB Statement No. 3, “Reporting Accounting Changes in Interim Financial Statements”151). FAS 154 changes151 amends the guidance in Accounting Research Bulletin No. 43, Chapter 4, "Inventory Pricing," to clarify the accounting for and reportinginventory costs. The provisions of a change in accounting principle. Thethis statement requires retrospective application to prior periods financial statements of voluntary changes in accounting principles and changes required by new accounting standards when the standard does not include specific transition provisions, unless it is impracticable to do so. The statement isare effective for accounting changes and corrections of errors in fiscal years beginning after December 15, 2005. Earlier application is permitted for accounting changes and corrections of errors during fiscal years beginning after June 1,15, 2005. The impact was not material to the Company's consolidated financial statements.
(3) Discontinued Operations
In September 1996, the Company divested its Municipal Water Group businesses, which included Henry Pratt, James Jones Company and Edward Barber and Company Ltd. Costs and expenses related to the Municipal Water Group for 2005 and 2004 relate to legal and settlement costs associated with the James Jones Litigation (see Note 15).
The Company also recorded an expense for payments to be made to the selling shareholders of the James Jones Company pursuant to the Company’s original purchase agreement. For the years ended December 31, 2005, 2004 and 2003, the Company recorded a net of tax charge of $91,000, $72,000 and $446,000, respectively.
In 2004 the Company divested its interest in its minority-owned subsidiary Jameco International, LLC (Jameco LLC) that had been previously consolidated as a result of Financial Accounting Standards Board Interpretation No. 46, “Consolidation of Variable Interest Entities—Revised” (FIN 46R). Jameco LLC was recorded in the North American segment. Management determined that Jameco LLC did not have a long-term strategic fit with the Company and decided to divest its interest. As a result, the Company recorded an impairment charge net of tax of $739,000 to write down its investment to estimated fair value of $250,000. Additionally, for the years ended December 31, 2004 and 2003, the Company recorded a net loss of $54,000 and net income of $54,000, respectively, from the operations of Jameco LLC. Jameco LLC imports and sells vitreous china, imported faucets and faucet parts and imported bathroom accessories to the North American home improvement retail market.
Condensed operating statements and balance sheets for discontinued operations are summarized below:
| | Years Ended December 31, | |
| | 2005 | | 2004 | | 2003 | |
| | (in thousands) | |
Net sales—Jameco International, LLC | | $ | — | | $ | 20,187 | | $ | 3,792 | |
Costs and expenses | | | | | | | |
Jameco International, LLC | | — | | (20,231 | ) | (3,705 | ) |
Municipal Water Group | | (679 | ) | (1,828 | ) | (5,058 | ) |
Loss on disposal of Jameco International, LLC | | — | | (1,202 | ) | — | |
Loss before income taxes | | (679 | ) | (3,074 | ) | (4,971 | ) |
Income tax benefit | | 258 | | 1,156 | | 1,914 | |
Loss from discontinued operations, net of taxes | | $ | (421 | ) | $ | (1,918 | ) | $ | (3,057 | ) |
| | Years Ended December 31,
| |
|---|
| | 2007
| | 2006
| | 2005
| |
|---|
| | (in millions)
| |
|---|
| Costs and expenses—Municipal Water Group | | $ | (.4 | ) | $ | (5.5 | ) | $ | (.7 | ) |
| | |
| |
| |
| |
| Loss before income taxes | | | (.4 | ) | | (5.5 | ) | | (.7 | ) |
| Income tax benefit | | | .2 | | | 2.1 | | | .3 | |
| | |
| |
| |
| |
| Loss from discontinued operations, net of taxes | | $ | (.2 | ) | $ | (3.4 | ) | $ | (.4 | ) |
| | |
| |
| |
| |
| | December 31,
|
|---|
| | 2007
| | 2006
|
|---|
| | (in millions)
|
|---|
| Prepaid expenses and other assets | | $ | (.3 | ) | $ | .3 |
| Deferred income taxes | | | 10.7 | | | 9.8 |
| | |
| |
|
| | Assets of discontinued operations | | $ | 10.4 | | $ | 10.1 |
| | |
| |
|
| Accrued expenses and other liabilities | | $ | 28.6 | | $ | 27.9 |
| | |
| |
|
| | Liabilities of discontinued operations | | $ | 28.6 | | $ | 27.9 |
| | |
| |
|
Watts Water Technologies, Inc. and Subsidiaries
Notes to Consolidated Financial Statements (Continued)
| | December 31, | |
| | 2005 | | 2004 | |
| | (in thousands) | |
Prepaid expenses and other assets | | $ | 2,511 | | $ | 2,561 | |
Deferred income taxes | | 7,044 | | 7,666 | |
Assets of discontinued operations | | $ | 9,555 | | $ | 10,227 | |
Accrued expenses and other liabilities | | 23,068 | | 24,303 | |
Liabilities of discontinued operations | | $ | 23,068 | | $ | 24,303 | |
The assets and liabilities for 20052007 and 20042006 primarily relate to reserves for the James Jones Litigation. Statements of CashflowsCash Flows amounts for 2005, 20042007, 2006 and 2003 primarily2005 relate to operating activities.
(4) Restructuring and Other (Income) Charges
During 2007, the Company undertook a review of certain product lines and its overall manufacturing capacity. Based on that review, the Company initiated a global restructuring program that was approved by the Company's Board of Directors on October 30, 2007. The Company is also discontinuing certain product lines. This program is expected to include the shutdown of five manufacturing facilities and the rightsizing of a sixth facility, including the relocation of its joint venture facility in China that was previously disclosed. The restructuring program and charges for certain product line discontinuances will include pre-tax charges totaling approximately $12.9 million. Charges are primarily for severance ($4.3 million), relocation costs ($2.8 million) and other asset write-downs and expected net losses on asset disposals ($2.0 million) and will result in the elimination of approximately 330 positions worldwide. The product lines that were discontinued and accelerated depreciation resulted in a pre-tax charge of $4.3 million during 2007. Total net after-tax charges for this program are expected to be approximately $9.4 million ($4.4 million non-cash), with costs being incurred through early 2010. The Company expects to spend approximately $13.4 million in capital expenditures to consolidate operations and will fund approximately $8.0 million of this amount through proceeds from the sale of buildings and other assets being disposed of as part of the restructuring program. Annual cash savings, net of tax, are estimated to be $4.5 million, which will be fully realized by the second half of 2009.
The following table presents the total estimated pre-tax charges to be incurred for the global restructuring program and product line discontinuances initiated in 2007 by the Company's reportable segments:
Reportable Segment
| | (in millions)
|
|---|
| North America | | $ | 5.7 |
| Europe | | | 3.9 |
| China | | | 3.3 |
| | |
|
| Total | | $ | 12.9 |
| | |
|
For 2007, the Company recorded pre-tax charges of approximately $7.5 million. Pre-tax costs of $4.3 million recorded in costs of goods sold were primarily for product line discontinuances. Pre-tax costs of $3.2 million recorded in restructuring and other charges were primarily for asset write-downs related to the Company's wholly owned Chinese manufacturing plants, accelerated depreciation related to the Company's relocation of its 60% owned Chinese joint venture and severance costs in both China and North America. The Company also recognized income of $0.9 million in minority interest representing the 40% liability of its Chinese joint venture partner in the restructuring plan.
For 2006, the Company recorded charges of $4.7 million in costs of goods sold primarily for manufacturing severance costs related to the Company's relocation plan for its 60% owned Chinese joint venture. The Company recorded income of $5.6 million to restructuring and other (income) charges which is primarily comprised of gains of approximately $8.2 million related to the sales of buildings in Italy, partially offset by charges of approximately $2.2 million for severance costs related to the Company's European restructuring plans and approximately $0.4 million for accelerated amortization related to the Company's Chinese restructuring plan. The Company also recognized income of $1.5 million in minority interest representing the 40% liability of its Chinese joint venture partner in the TWT restructuring plan.
Watts Water Technologies, Inc. and Subsidiaries
TheNotes to Consolidated Financial Statements (Continued)
(4) Restructuring and Other (Income) Charges (Continued)
For 2005, Company recorded charges, net of recoveries, of $2,545,000, $2,968,000 and $1,655,000 for 2005, 2004 and 2003, respectively.$2.5 million. The expenses incurred for 2005 were primarily for accelerated depreciation for both the planned closure of a U.S. manufacturing plant and a reduction in the estimated useful lives of certain manufacturing equipment, net of recoveries and for European severance related charges and asset write-downs.The expenses incurred for 2004 were
With respect to the table below, restructuring costs consist primarily for accelerated depreciation for both the planned closure of a U.S. manufacturing plant and a reduction in the estimated useful lives of certain manufacturing equipment and for severance costs. The expenses incurred for 2003In 2007 and 2005, severance costs were primarily for accelerated depreciation, asset write-downsrecorded in restructuring and severance costs.
other charges (income) and, in 2006, were recorded in cost of goods sold. Asset write-downs consist primarily of write-offs of fixed assets and accelerated depreciation. Product line discontinuances consist of inventory write-offs related to product lines that the Company has discontinued as part of this restructuring plan and are primarily recorded in cost of goods sold. Accelerated depreciation is based on shorter remaining estimated useful lives of certain fixed assets and is primarily recorded in cost of goods sold. Other costs consist primarilyof gains on sales of buildings in 2006 and of removal and shipping costs associated with relocation of manufacturing equipment in 2007 and have been primarily recorded in cost of goods sold and have been expensed as incurred. Severance costs are recorded in restructuring and other charges.2005.
Details of the Company’sCompany's manufacturing restructuring planplans through December 31, 20052007 are as follows:
| | Restructuring | | Asset Write-downs | | Other Costs | | Total | |
| | (in thousands) | |
Balance as of December 31, 2002 | | | $ | 419 | | | | $ | — | | | | $ | — | | | $ | 419 | |
Provisions during 2003 | | | 426 | | | | 479 | | | | 750 | | | 1,655 | |
Utilized during 2003 | | | (804 | ) | | | (479 | ) | | | (750 | ) | | (2,033 | ) |
Balance as of December 31, 2003 | | | 41 | | | | — | | | | — | | | 41 | |
Provisions during 2004 | | | 95 | | | | 2,873 | | | | — | | | 2,968 | |
Utilized during 2004 | | | (136 | ) | | | (2,873 | ) | | | — | | | (3,009 | ) |
Balance as of December 31, 2004 | | | — | | | | — | | | | — | | | — | |
Provisions during 2005 | | | 729 | | | | 1,360 | | | | 456 | | | 2,545 | |
Utilized during 2005 | | | (729 | ) | | | (1,360 | ) | | | (456 | ) | | (2,545 | ) |
Balance as of December 31, 2005 | | | $ | — | | | | $ | — | | | | $ | — | | | $ | — | |
| | Restructuring
| | Asset
Write-downs
| | Product line
discontinuance
| | Other Costs
| | Minority
Interest
| | Total
| |
|---|
| | (in millions)
| |
|---|
| Balance as of December 31, 2004 | | $ | — | | $ | — | | $ | — | | $ | — | | $ | — | | $ | — | |
| Provisions during 2005 | | | .7 | | | 1.4 | | | — | | | .4 | | | — | | | 2.5 | |
| Utilized during 2005 | | | (.7 | ) | | (1.4 | ) | | — | | | (.4 | ) | | — | | | (2.5 | ) |
| | |
| |
| |
| |
| |
| |
| |
| Balance as of December 31, 2005 | | | — | | | — | | | — | | | — | | | — | | | — | |
| | |
| |
| |
| |
| |
| |
| |
| Provisions during 2006 | | | 6.7 | | | .5 | | | — | | | (8.2 | ) | | (1.5 | ) | | (2.5 | ) |
| Utilized during 2006 | | | (2.5 | ) | | (.5 | ) | | — | | | 8.2 | | | 1.5 | | | 6.7 | |
| | |
| |
| |
| |
| |
| |
| |
| Balance as of December 31, 2006 | | | 4.2 | | | — | | | — | | | — | | | — | | | 4.2 | |
| | |
| |
| |
| |
| |
| |
| |
| Provisions during 2007 | | | .8 | | | 2.8 | | | 3.8 | | | .1 | | | (.9 | ) | | 6.6 | |
| Utilized during 2007 | | | (2.6 | ) | | (2.8 | ) | | (3.8 | ) | | (.1 | ) | | .9 | | | (8.4 | ) |
| | |
| |
| |
| |
| |
| |
| |
| Balance as of December 31, 2007 | | $ | 2.4 | | $ | — | | $ | — | | $ | — | | $ | — | | $ | 2.4 | |
| | |
| |
| |
| |
| |
| |
| |
Watts Water Technologies, Inc. and Subsidiaries
Notes to Consolidated Financial Statements (Continued)
(5) Business Acquisitions
The following acquisitions wereacquisition was accounted for by the purchase method of accounting and, accordingly, theirthe results have been included in the Company’sCompany's consolidated results of operation since their respective datesthe date of acquisition.
On December 28, 2005, a wholly-owned subsidiary ofNovember 9, 2007, the Company acquired 100%the assets and business of the stock of Dormont Manufacturing Company (Dormont)Topway Global Inc. (Topway) located in Export, Pennsylvania,Brea, California for approximately $94,875,000, net$18.4 million, of cash acquiredwhich $0.3 million of approximately $1,505,000.transaction costs remain to be paid. The preliminary allocations for goodwill and intangible assets are approximately $43,227,000$7.6 million and $35,945,000,$8.2 million, respectively. The amount recorded as intangible assets is primarily for customer relationships that havewith an estimated 13-year livesuseful life of 10 years and trade names with indefinite lives. Dormont provides flexible stainless steel connectors Topway manufactures a wide variety of water softeners, point-of-entry filter units, and point-of-use drinking water systems for naturalresidential, commercial and liquid propane gas. Dormont works with appliance OEM’s to provide internal component assemblies and private label gas connectors, which are sold underindustrial applications. The purchase price allocation for Topway is preliminary pending the OEM brand with the appliance in multiple leading retail chains. Dormont also supplies residential gas connectors through multiple trade channels and home improvement retailers.
The following pro forma consolidated results of operations have been prepared as though the acquisition of Dormont had occurred at the beginningfinal determination of the periods shown. The pro forma information, however, is not necessarily indicativefair values of the results of operations that would have been achieved had thecertain assumed assets and liabilities.
Certain acquisition occurred at the beginning of the periods presented, nor is it necessarily indicative of future results.
| | Years Ended December 31, | |
(Unaudited) | | | | 2005 | | 2004 | |
| | (in thousands, except per
share information) | |
Net sales | | $ | 980,471 | | $ | 877,017 | |
Net income | | $ | 56,389 | | $ | 48,370 | |
Earnings per share (basic) | | $ | 1.74 | | $ | 1.50 | |
Earnings per share (diluted) | | $ | 1.71 | | $ | 1.48 | |
| | | | | | | | | |
On December 2, 2005, a wholly-owned subsidiary of the Company acquired 100% of the stock of Core Industries Inc. (Core)agreements from SPX Corporation for approximately $45,000,000 in cash. Core consists of FEBCO, Mueller Steam Specialty and Polyjet Valves product lines. The preliminary allocations for goodwill and intangible assets are approximately $11,272,000 and $14,528,000, respectively. The amount recorded as intangible assets is primarily for trade names with indefinite lives and customer relationships that have estimated 12-year lives. FEBCO is a manufacturer of backflow prevention valves and has a strong presence in both residential and commercial landscape irrigation. Mueller Steam Specialty allows us to expand into large diameter commercial strainer and check valves. Polyjet Valves offers a customized sleeve valve, which is used in severe service applications to provide precise flow and pressure control.
On November 4, 2005, a wholly-owned subsidiary of the Company acquired the assets of Flexflow Tubing LLP (Flexflow), located in Langley, British Columbia, Canada for approximately $6,200,000. The preliminary allocations for goodwill and intangible assets are approximately $3,180,000 and $868,000, respectively. The amount recorded as intangible assets is primarily for customer relationships that have estimated 12-year lives. Flexflow manufactures pex tubing for potable and non-potable applications.
Watts Water Technologies, Inc. and Subsidiaries
Notes to Consolidated Financial Statements (Continued)
On July 8, 2005, a wholly-owned subsidiary of the Company acquired the water connector business of the Donald E. Savard Company (Savard) in an asset purchase transaction for approximately $3,680,000. The allocations for goodwill and intangible assets are approximately $1,350,000 and $1,750,000, respectively. The amount recorded as intangible assets is primarily for trade names with indefinite lives and customer relationships that have 14-year lives.
On July 5, 2005, a wholly-owned subsidiary of the Company acquired 100% of the outstanding stock of Microflex N.V. (Microflex) located in Rotselaar, Belgium for approximately $14,900,000 net of cash acquired of approximately $875,000. The allocations for goodwill and intangible assets are approximately $6,507,000 and $5,315,000, respectively. The amount recorded as intangible assets is primarily for customer relationships that have 7-year lives and trade names that have indefinite lives. Microflex produces and distributes flexible, pre-insulated, waterproof pex pipes for hot and cold water transport, as well as a range of accessory products including couplings, caps, and insulation kits in the HVAC and water protection markets.
On June 20, 2005, a wholly-owned subsidiary of the Company acquired the water softener business of Alamo Water Refiners, Inc. (Alamo) located in San Antonio, Texas in an asset purchase transaction for approximately $5,100,000. The allocation for intangible assets is approximately $285,000 and is primarily for the trade name with an indefinite life. There was no allocation to goodwill. The water softener products of Alamo are consistent with the Company’s theme of water quality and provide many synergistic opportunities when utilized in conjunction with its existing water filtration and water quality businesses.
On May 11, 2005, a wholly-owned subsidiary of the Company acquired 100% of the outstanding stock of Electro Controls Ltd. (Electro Controls) located in Hounslow, United Kingdom for approximately $11,737,000 net of cash acquired of approximately $5,014,000. The allocations for goodwill and intangible assets are approximately $5,788,000 and $315,000, respectively. The amount recorded as intangible assets is primarily for trade names that have indefinite lives. Electro Controls designs and assembles a range of electrical controls for the HVAC market, with sales primarily in the United Kingdom.
On January 5, 2005, a wholly-owned subsidiary of the Company acquired 100% of the outstanding stock of HF Scientific, Inc. (HF) located in Fort Myers, Florida for approximately $7,260,000 in cash plus $800,000 in assumed debt. The allocations for goodwill and intangible assets are approximately $4,178,000 and $2,660,000, respectively. The amount recorded as intangible assets is primarily for customer relationships that have 15-year lives and trade names that have indefinite lives. HF manufactures and distributes a line of instrumentation equipment, test kits and chemical reagents used for monitoring water quality in a variety of applications.
On January 4, 2005, a wholly-owned subsidiary of the Company acquired substantially all of the assets of Sea Tech, Inc. (Sea Tech) located in Wilmington, North Carolina for approximately $10,100,000 in cash. The allocations for goodwill and intangible assets are approximately $6,505,000 and $3,033,000, respectively. The amount recorded as intangible assets is primarily for customer relationships that have 15-year lives and trade names that have indefinite lives. Sea Tech provides cost-effective solutions for fluidic connection needs. Sea Tech offers a wide range of standard and custom quick connect fittings, valves and manifolds and pex tubing designed to address specific customer requirements.
69
Watts Water Technologies, Inc. and Subsidiaries
Notes to Consolidated Financial Statements (Continued)
Certain current and prior years acquisition agreements contain either an earn-out provision or a put feature on the remaining common stock not yet purchased by the Company. In 2007, the Company
Watts Water Technologies, Inc. and Subsidiaries
Notes to Consolidated Financial Statements (Continued)
(5) Business Acquisitions (Continued)
accrued approximately $3.8 million in earn-out provisions which were charged to goodwill and will be paid in 2008. In 2006, the Company accrued approximately $4.0 million in earn-out provisions which were charged to goodwill and paid in 2007. During 2005, the Company accruedcharged to operations approximately $1,500,000$1.5 million in earn-out costs from a prior year acquisition, which were also paid in 2005. The calculations are typically based on a multiple of future gross margins or operating earnings as defined in the agreements. The amounts of contingent consideration are not determinable beyond a reasonable doubt and therefore no liabilities have been established. All future earn-outs payments, if any, will be accounted for as additional purchase price.
(6) Accumulated Other Comprehensive Income (Loss)
Other Accumulated other comprehensive income (loss) consist of the following:
| | Foreign
Currency
Translation
and Other | | Pension
Adjustment | | Accumulated
Other
Comprehensive
Income (Loss) | | | Foreign
Currency
Translation
and Other
| | Defined Benefit
Pension Plans
| | Accumulated
Other
Comprehensive
Income
|
|---|
| | (in thousands) | | | (in millions)
|
|---|
Balance December 31, 2003 | | | $ | 19,634 | | | | $ | (5,829 | ) | | | $ | 13,805 | | | |
| Balance December 31, 2005 | | | $ | 13.1 | | $ | (7.8 | ) | $ | 5.3 |
Change in period | | | 12,833 | | | | (20 | ) | | | 12,813 | | | | 25.0 | | (4.9 | ) | | 20.1 |
Balance December 31, 2004 | | | 32,467 | | | | (5,849 | ) | | | 26,618 | | | |
| | | |
| |
| |
|
| Balance December 31, 2006 | | | 38.1 | | (12.7 | ) | | 25.4 |
Change in period | | | (19,377 | ) | | | (1,978 | ) | | | (21,355 | ) | | | 39.1 | | 4.2 | | 43.3 |
Balance December 31, 2005 | | | $ | 13,090 | | | | $ | (7,827 | ) | | | $ | 5,263 | | | |
| | | |
| |
| |
|
| Balance December 31, 2007 | | | $ | 77.2 | | $ | (8.5 | ) | $ | 68.7 |
| | | |
| |
| |
|
(7) Inventories, net
Inventories consist of the following:
| | December 31, | | | December 31,
|
|---|
| | 2005 | | 2004 | | | 2007
| | 2006
|
|---|
| | (in thousands) | | | (in millions)
|
|---|
Raw materials | | $ | 84,087 | | $ | 61,250 | | | $ | 108.9 | | $ | 103.6 |
Work in process | | 23,201 | | 28,020 | | | 45.7 | | 39.6 |
Finished goods | | 135,549 | | 115,779 | | | 187.0 | | 173.2 |
| | $ | 242,837 | | $ | 205,049 | | |
| |
|
| | | | $ | 341.6 | | $ | 316.4 |
| | | |
| |
|
Finished goods of $15,423,000$20.3 million and $14,549,000$18.3 million as of December 31, 20052007 and 2004,2006, respectively, were consigned.
Watts Water Technologies, Inc. and Subsidiaries
Notes to Consolidated Financial Statements (Continued)
(8) Property, Plant and Equipment
Property, plant and equipment consists of the following:
| | December 31, | | | December 31,
| |
|---|
| | 2005 | | 2004 | | | 2007
| | 2006
| |
|---|
| | (in thousands) | | | (in millions)
| |
|---|
Land | | $ | 12,274 | | $ | 9,567 | | | $ | 13.7 | | $ | 12.5 | |
Buildings and improvements | | 99,217 | | 84,876 | | | 132.6 | | 124.3 | |
Machinery and equipment | | 210,695 | | 222,274 | | | 270.5 | | 247.4 | |
Construction in progress | | 6,626 | | 4,938 | | | 20.6 | | 7.7 | |
| | 328,812 | | 321,655 | | |
| |
| |
Accumulated Depreciation | | (163,813 | ) | (170,966 | ) | |
| | $ | 164,999 | | $ | 150,689 | | | 437.4 | | 391.9 | |
| Accumulated depreciation | | | (213.7 | ) | | (185.7 | ) |
| | | |
| |
| |
| | | | $ | 223.7 | | $ | 206.2 | |
| | | |
| |
| |
(9) Income Taxes
The significant components of the Company’sCompany's deferred income tax liabilities and assets are as follows:
| | December 31, | |
| | 2005 | | 2004 | |
| | (in thousands) | |
Deferred income tax liabilities: | | | | | |
Excess tax over book depreciation | | $ | 12,874 | | $ | 14,101 | |
Intangibles | | 10,522 | | 10,458 | |
Other | | 10,654 | | 4,920 | |
Total deferred tax liabilities | | 34,050 | | 29,479 | |
Deferred income tax assets: | | | | | |
Accrued expenses | | 13,641 | | 15,199 | |
Net operating loss carry-forward | | 4,450 | | 7,145 | |
Inventory reserves | | 7,707 | | 4,825 | |
Other | | 10,989 | | 11,033 | |
Total deferred tax assets | | 36,787 | | 38,202 | |
Less: valuation allowance | | — | | (838 | ) |
Net deferred tax | | 36,787 | | 37,364 | |
Net deferred tax assets | | $ | 2,737 | | $ | 7,885 | |
| | December 31,
| |
|---|
| | 2007
| | 2006
| |
|---|
| | (in millions)
| |
|---|
| Deferred income tax liabilities: | | | | | | | |
| | Excess tax over book depreciation | | $ | 15.3 | | $ | 16.0 | |
| | Intangibles | | | 23.5 | | | 18.8 | |
| | Other | | | 12.4 | | | 11.1 | |
| | |
| |
| |
| | | Total deferred tax liabilities | | | 51.2 | | | 45.9 | |
| Deferred income tax assets: | | | | | | | |
| | Accrued expenses | | | 22.0 | | | 17.0 | |
| | Net operating loss carry-forward | | | 3.2 | | | 3.4 | |
| | Inventory reserves | | | 13.7 | | | 8.0 | |
| | Other | | | 10.7 | | | 9.7 | |
| | |
| |
| |
| | | Total deferred tax assets | | | 49.6 | | | 38.1 | |
| Less: valuation allowance | | | (3.2 | ) | | — | |
| | |
| |
| |
| | Net deferred tax assets | | | 46.4 | | | 38.1 | |
| | |
| |
| |
| | Net deferred tax liabilities | | $ | (4.8 | ) | $ | (7.8 | ) |
| | |
| |
| |
The provision for income taxes from continuing operations is based on the following pre-tax income:
| | Years Ended December 31, | | | Years Ended December 31,
|
|---|
| | 2005 | | 2004 | | 2003 | | | 2007
| | 2006
| | 2005
|
|---|
| | (in thousands) | | | (in millions)
|
|---|
Domestic | | $ | 46,418 | | $ | 39,300 | | $ | 40,370 | | | $ | 47.6 | | $ | 49.6 | | $ | 46.4 |
Foreign | | 39,393 | | 33,372 | | 18,372 | | | 66.2 | | 66.5 | | 39.4 |
| | $ | 85,811 | | $ | 72,672 | | $ | 58,742 | | |
| |
| |
|
| | | | $ | 113.8 | | $ | 116.1 | | $ | 85.8 |
| | | |
| |
| |
|
Watts Water Technologies, Inc. and Subsidiaries
Notes to Consolidated Financial Statements (Continued)
(9) Income Taxes (Continued)
The provision for income taxes from continuing operations consists of the following:
| | Years Ended December 31, | |
| | 2005 | | 2004 | | 2003 | |
| | (in thousands) | |
Current tax expense: | | | | | | | |
Federal | | $ | 15,209 | | $ | 15,428 | | $ | 12,167 | |
Foreign | | 14,027 | | 10,380 | | 6,256 | |
State | | 3,484 | | 3,318 | | 2,431 | |
| | 32,720 | | 29,126 | | 20,854 | |
Deferred tax expense (benefit): | | | | | | | |
Federal | | (963 | ) | (4,044 | ) | 802 | |
Foreign | | (747 | ) | (331 | ) | 509 | |
State | | (219 | ) | (817 | ) | 158 | |
| | (1,929 | ) | (5,192 | ) | 1,469 | |
| | $ | 30,791 | | $ | 23,934 | | $ | 22,323 | |
| | Years Ended December 31,
| |
|---|
| | 2007
| | 2006
| | 2005
| |
|---|
| | (in millions)
| |
|---|
| Current tax expense: | | | | | | | | | | |
| | Federal | | $ | 19.2 | | $ | 18.0 | | $ | 15.2 | |
| | Foreign | | | 20.4 | | | 20.5 | | | 14.0 | |
| | State | | | 4.8 | | | 4.1 | | | 3.5 | |
| | |
| |
| |
| |
| | | | 44.4 | | | 42.6 | | | 32.7 | |
| | |
| |
| |
| |
| Deferred tax expense (benefit): | | | | | | | | | | |
| | Federal | | | (5.7 | ) | | (1.7 | ) | | (1.0 | ) |
| | Foreign | | | (1.2 | ) | | (1.5 | ) | | (.7 | ) |
| | State | | | (1.3 | ) | | (.4 | ) | | (.2 | ) |
| | |
| |
| |
| |
| | | | (8.2 | ) | | (3.6 | ) | | (1.9 | ) |
| | |
| |
| |
| |
| | | $ | 36.2 | | $ | 39.0 | | $ | 30.8 | |
| | |
| |
| |
| |
Actual income taxes reported from continuing operations are different than would have been computed by applying the federal statutory tax rate to income from continuing operations before income taxes. The reasons for this difference are as follows:
| | Years Ended December 31, | | | Years Ended December 31,
| |
|---|
| | 2005 | | 2004 | | 2003 | | | 2007
| | 2006
| | 2005
| |
|---|
| | (in thousands) | | | (in millions)
| |
|---|
Computed expected federal income expense | | $ | 30,033 | | $ | 25,435 | | $ | 20,560 | | | $ | 39.8 | | $ | 40.6 | | $ | 30.0 | |
State income taxes, net of federal tax benefit | | 2,122 | | 1,626 | | 1,683 | | | 2.3 | | 2.4 | | 2.1 | |
Foreign tax rate differential | | (508 | ) | (1,632 | ) | 335 | | | (7.2 | ) | | (4.4 | ) | | (.5 | ) |
Tax credits | | — | | (1,041 | ) | — | | |
| Valuation allowance | | | 3.2 | | — | | — | |
Other, net | | (856 | ) | (454 | ) | (255 | ) | | (1.9 | ) | | .4 | | (.8 | ) |
| | $ | 30,791 | | $ | 23,934 | | $ | 22,323 | | |
| |
| |
| |
| | | | $ | 36.2 | | $ | 39.0 | | $ | 30.8 | |
| | | |
| |
| |
| |
At December 31, 2005,2007, the Company has foreign net operating loss carry forwards of $13,300,000$16.9 million for income tax purposes. $12,500,000All of the net operating losses are foreign losses. $7.0 million of the losses can be carried forward indefinitely and $800,000$4.8 million of the losses expires in 2013 and $5.1 million of the losses expire in 2008.2016. The net operating losses consist of $10,400,000$5.5 million related to German operations, $1,700,000$1.5 million to Austrian operations, $400,000 related$5.1 million to SwedishNetherlands operations and $800,000$4.8 million related to Chinese operations.
The Company did not providehas a valuation allowance as of December 31, 2005 and provided $838,000 as of December 31, 2004, against a portion of the net operating loss carry forwards. The Company’s earnings$3.2 million related to its German operations have measurably improved; therefore the Company believes that a valuation allowance is no longer necessary.deferred tax assets at its Chinese joint venture.
The Company believes that it is more likely than not that it will be able to recover the net deferred tax assets.
Undistributed earnings of the Company's foreign subsidiaries amounted to approximately $251.6 million, $168.9 million and $163.1 million at December 31, 2007, 2006 and 2005, respectively.
Watts Water Technologies, Inc. and Subsidiaries
Notes to Consolidated Financial Statements (Continued)
Undistributed earnings of the Company’s foreign subsidiaries amounted to approximately $163,100,000 at December 31, 2005. (9) Income Taxes (Continued)
Those earnings are considered to be indefinitely reinvested and, accordingly, no provision for U.S. federal and state income taxes has been recorded thereon. Upon distribution of those earnings, in the form of dividends or otherwise, the Company will be subject to withholding taxes payable to the various foreign countries. Determination of the amount of U.S. income tax liability that would be incurred is not practicable because of the complexities associated with its hypothetical calculation; however, unrecognized foreign tax credits would be available to reduce some portion of any U.S. income tax liability. Withholding taxes of approximately $2,140,000$5.4 million would be payable upon remittance of all previously unremitted earnings at December 31, 2005.2007.
The American Job Creation Act of 2004 (the AJCA) was signed into federal law on October 22, 2004. The AJCA contain a one-time foreign dividend repatriation provision. This provision provides an 85% special deduction with respect to certain qualifying dividends from foreign subsidiaries for a limited period. The Company did not repatriate any dividends from foreign affiliates under this provision.
(10) Accrued Expenses and Other Liabilities
Accrued expenses and other liabilities consist of the following:
| | December 31, | | | December 31,
|
|---|
| | 2005 | | 2004 | | | 2007
| | 2006
|
|---|
| | (in thousands) | | | (in millions)
|
|---|
Commissions and sales incentives payable | | $ | 30,807 | | $ | 25,618 | | | $ | 42.6 | | $ | 37.0 |
Accrued insurance | | 11,836 | | 13,751 | | | 26.1 | | 15.0 |
Pension liability | | 2,077 | | 2,012 | | |
Other | | 19,178 | | 17,255 | | | 38.5 | | 39.3 |
Income taxes payable | | 3,173 | | 3,100 | | | 6.4 | | 9.1 |
| | $ | 67,071 | | $ | 61,736 | | |
| |
|
| | | | $ | 113.6 | | $ | 100.4 |
| | | |
| |
|
73
Watts Water Technologies, Inc. and Subsidiaries
Notes to Consolidated Financial Statements (Continued)
(11) Financing Arrangements
Long-term debt consists of the following:
| | December 31, | |
| | 2005 | | 2004 | |
| | (in thousands) | |
4.87% notes due May 2010 | | $ | 50,000 | | $ | 50,000 | |
5.47% notes due May 2013 | | 75,000 | | 75,000 | |
$300,000,000 Revolving Credit Facility maturing in September 2009. Eurocurrency rate loans interest accruing at LIBOR or Euro LIBOR plus an applicable percentage (Euro LIBOR at 2.7% and 2.8% at December 31, 2005 and 2004, respectively) (LIBOR 5.0% at December 31, 2005) At December 31, 2005, $40,263,000 were for euro based borrowings and $127,000,000 were for U.S. borrowings. At December 31, 2004, $49,414,000 was for euro based borrowings and there were no outstanding U.S. borrowings. | | 167,263 | | 49,414 | |
Hunter Innovations notes with principal payable in three equal annual installments, accruing interest monthly, due May 2006 (annual interest rate of 5.0% and 3.9% at December 31, 2005 and 2004, respectively) | | 3,750 | | 7,500 | |
Variable rate demand bonds (4.3% at December 31, 2005) | | 8,900 | | — | |
Other—consists primarily of European borrowings (at interest rates ranging from 2.7% to 11.3%) | | 2,072 | | 3,629 | |
| | 306,985 | | 185,543 | |
Less Current Maturities | | 13,635 | | 4,981 | |
| | $ | 293,350 | | $ | 180,562 | |
| | December 31,
|
|---|
| | 2007
| | 2006
|
|---|
| | (in millions)
|
|---|
| 5.85% notes due April 2016 | | $ | 225.0 | | $ | 225.0 |
| 4.87% notes due May 2010 | | | 50.0 | | | 50.0 |
| 5.47% notes due May 2013 | | | 75.0 | | | 75.0 |
| $350.0 million Revolving Credit Facility maturing in April 2011. Eurocurrency rate loans interest accruing at LIBOR or Euro LIBOR plus an applicable percentage (Euro LIBOR at 4.7% and 3.6% at December 31, 2007 and 2006, respectively) At December 31, 2007, $81.8 million was for euro based borrowings and there were no outstanding U.S. borrowings. At December 31, 2006, $91.1 million were for euro based borrowings and there were no outstanding U.S. borrowings | | | 81.8 | | | 91.1 |
| Other—consists primarily of European borrowings (at interest rates ranging from 3.3% to 8.5%) | | | 1.7 | | | 8.1 |
| | |
| |
|
| | | | 433.5 | | | 449.2 |
| Less Current Maturities | | | 1.3 | | | 7.5 |
| | |
| |
|
| | | $ | 432.2 | | $ | 441.7 |
| | |
| |
|
Watts Water Technologies, Inc. and Subsidiaries
Notes to Consolidated Financial Statements (Continued)
(11) Financing Arrangements (Continued)
Principal payments during each of the next five years and thereafter are due as follows (in thousands)millions): 2006—$13,635; 2007—$355; 2008—$324;1.3; 2009—$167,500;0.2; 2010—$50,17150.2; 2011—$81.8; 2012—$0 and thereafter—$75,000.300.0.
The Company maintains letters of credit that guarantee its performance or payment to third parties in accordance with specified terms and conditions. Amounts outstanding were approximately $48,651,000$45.0 million as of December 31, 20052007 and $42,570,000$49.6 million as of December 31, 2004.2006. The Company’sCompany's letters of credit are primarily associated with insurance coverage and to a lesser extent foreign purchases. The Company’sCompany's letters of credit generally expire within one year of issuance and are drawn down against the Revolving Credit Facility. The increase is primarily associated with insurance coverage.revolving credit facility. These instruments may exist or expire without being drawn down. Therefore, they do not necessarily represent future cash flow obligations.
On April 27, 2006, the Company completed a private placement of $225.0 million of 5.85% senior unsecured notes due April 2016 (the 2006 Note Purchase Agreement). The 2006 Note Purchase Agreement includes operational and financial covenants, with which the Company is required to comply, including, among others, maintenance of certain financial ratios and restrictions on additional indebtedness, liens and dispositions. Events of default under the 2006 Note Purchase Agreement include failure to comply with its financial and operational covenants, as well as bankruptcy and other insolvency events. The Company may, at its option, upon notice to the noteholders, prepay at any time all or part of the Notes in an amount not less than $1 million by paying the principal amount plus a make-whole amount, which is dependent upon the yield of respective U.S. Treasury Securities. The Company used the net proceeds from the private placement to repay $147.0 million outstanding under its revolving credit facility. The balance of the net proceeds will be used to finance future acquisitions and for general corporate purposes. As of December 31, 2007, the Company was in compliance with all covenants related to the 2006 Note Purchase Agreement. The payment of interest on the senior unsecured notes is due semi-annually on April 30th and October 30th of each year. Additionally, the Company amended its 2003 Note Purchase Agreement to reflect the existence of the subsidiary guarantors and to substantially conform certain provisions of the 2003 Note Purchase Agreement to the 2006 Note Purchase Agreement.
On April 27, 2006, the Company amended and restated its unsecured revolving credit facility with a syndicate of banks (as amended, the revolving credit facility). The revolving credit facility provides for multi-currency unsecured borrowings and stand-by letters of credit of up to $350.0 million and expires in April 2011. Borrowings outstanding under the revolving credit facility bear interest at a fluctuating rate per annum equal to an applicable percentage equal to (i) in the case of Eurocurrency rate loans, the British Bankers Association LIBOR rate plus an applicable percentage of 0.625%, which is determined by reference to the Company's consolidated leverage ratio and debt rating, or (ii) in the case of base rate loans and swing line loans, the higher of (a) the federal funds rate plus 0.5% and (b) the rate of interest in effect for such day as announced by Bank of America, N.A. as its "prime rate." For 2007, the average interest rate under the revolving credit facility for euro-based borrowings was approximately 4.6%. The revolving credit facility includes operational and financial covenants customary for facilities of this type, including, among others, restrictions on additional indebtedness, liens and investments and maintenance of certain leverage ratios. As of December 31, 2007, the Company was in compliance with all covenants related to the revolving credit facility; had $234.4 million of unused and potentially available credit under the revolving credit facility; had no U.S dollar denominated debt and $81.8 million of euro-based borrowings outstanding on its revolving credit facility; and had $33.8 million for stand-by letters of credit outstanding on its revolving credit facility.
At the closing of the Dormont acquisition, Dormont had long-term debt outstanding of $8,900,000$8.9 million in the form of two series of taxable variable rate demand bonds (1998 Series with $1,500,000
Watts Water Technologies, Inc. and Subsidiaries
Notes to Consolidated Financial Statements (Continued)
(11) Financing Arrangements (Continued)
$1.5 million outstanding and the 2000 Series with $7,400,000$7.4 million outstanding) which, due to the provisions of the trust agreements, could only be redeemed at dates subsequent to the closing. Each of these bonds was secured by a letter of credit from a bank, which maintained a security interest in the assets of Dormont. As a condition of the purchase and to gain the bank’sbank's consent to the sale of Dormont to the Company, Dormont’sDormont's former owners were required to establish a cash collateral account for the bonds in an amount equal to the potential obligation of Dormont to the bank under the letter of credit reimbursement agreements. The entire obligation under the bonds approximates $9,096,000,$9.1 million, which represents the $8,900,000$8.9 million in bond principal plus interest and
Watts Water Technologies, Inc. and Subsidiaries
Notes to Consolidated Financial Statements (Continued)
related fees. At closing, a portion of the Dormont purchase price was placed in a cash collateral account as a guarantee of payment. The Company has recorded this escrow deposit in prepaid expenses and other assets at December 31, 2005. The 1998 series bonds were repaid in full on January 17, 2006 and the 2000 series bonds were repaid in full on February 1, 2006 by the former owners using the cash collateral account.
On September 23, 2004, Effective July 1, 2005, the Company entered into an unsecured revolving credit facilitya three-year interest rate swap with a syndicatecounter party for a notional amount of banks (the Revolving Credit Facility). The Revolving Credit Facility provides for multi-currency unsecured borrowings and stand-by letters of credit of up to $300,000,000 and expires in September 2009. Borrowings€25.0 million, which was outstanding under the Revolving Credit Facility bear interest atrevolving credit facility. The Company swapped three-month EURIBOR plus 0.6% for a fluctuatingfixed rate per annum for an applicable percentage equal to (i)of 3.02%. The change in the casefair value of Eurocurrency rate loans, the British Bankers Association LIBOR rate plus an applicable percentage, of up to 0.875% based on the Company’s current consolidated leverage ratioswap during 2006 approximated $0.7 million and debt rating, or (ii) in the case of base rate loans and swing line loans, the higher of (a) the federal funds rate plus 0.5% and (b) the annual ratewas recorded as a reduction of interest announced by Bank of America, N.A. as its “prime rate.” For 2005 the average interest rate under the Revolving Credit Facility for U.S. dollar borrowingsexpense in 2006. The swap was approximately 5.0% and euro based borrowings was approximately 2.7%. The Revolving Credit Facility replaced the unsecured revolving credit facility provided under the Revolving Credit Agreement dated February 28, 2002. The Revolving Credit Facility was used to pay off the debt that existedterminated on the previous credit facility that was to expire in February 2005. The Revolving Credit Facility includes operational and financial covenants customary for facilities of this type, including, among others, restrictions on additional indebtedness, liens and investments and maintenance of certain leverage ratios. As of December 31, 2005, the Company was in compliance with all covenants related to the Revolving Credit Facility. The Company had $100,096,000 of unused and potentially available credit under the Revolving Credit Facility at December 31, 2005.October 3, 2006.
On May 15, 2003, the Company completed a private placement of $125,000,000$125.0 million of senior unsecured notes consisting of $50,000,000$50.0 million principal amount of 4.87% senior notes due 2010 and $75,000,000$75.0 million principal amount of 5.47% senior notes due 2013. The Company used the net proceeds from the private placement to purchase treasury securities to repay the $75,000,000 principal amount of 8.375% Notes due December 2003. Additional net proceeds were used to repay approximately $32,000,000 outstanding under the previous revolving credit facility. The balance of the net proceeds was used for general corporate purposes. The payment of interest on the senior unsecured notes is due semi-annually on May 15th15th and November 15th15th of each year. The senior unsecured notes were issued by Watts Water Technologies, Inc. and arepari passu with the Revolving Credit Facility,revolving credit facility, which is at the subsidiary level. The senior unsecured notes allow the Company to have (i) debt senior to the notes in an amount up to $150,000,000$150.0 million plus 5% of stockholders’stockholders' equity and (ii) debtpari passu or junior to the senior unsecured notes to the extent the Company maintains compliance with a 2.00 to 1.00 fixed charge coverage ratio. The notes include a prepayment provision which might require a make-whole payment to the note holders. Such payment is dependent upon the level of the respective treasuries. The notes include other customary terms and conditions, including events of default.
Effective July 1, 2005, the Company entered into a three-year interest rate swap with a counter party for a notional amount of €25,000,000, which is outstanding under the Revolving Credit Facility. The Company swapped the three-month EURIBOR plus 0.6% for a fixed rate of 3.02%. The Company has designated the swap as a hedge using the cash flow method. At December 31, 2005, the fair value of the swap was approximately $484,000.
75
Watts Water Technologies, Inc. and Subsidiaries
Notes to Consolidated Financial Statements (Continued)
(12) Common Stock
The Class A Common Stock and Class B Common Stock have equal dividend and liquidation rights. Each share of the Company’sCompany's Class A Common Stock is entitled to one vote on all matters submitted to stockholders and each share of Class B Common Stock is entitled to ten votes on all such matters. Shares of Class B Common Stock are convertible into shares of Class A Common Stock, on a one-to-one basis, at the option of the holder. As of December 31, 2005,2007, the Company has reserved a total of 4,153,0654,611,899 of Class A Common Stock for issuance under its stock-based compensation plans and 7,343,8807,293,880 shares for conversion of Class B Common Stock to Class A Common Stock.
In February 2007, the Company's Board of Directors adopted an amendment, which was subsequently approved by the Company's stockholders, to increase the number shares of Class A Common Stock available to be granted under the Company's Management Stock Purchase Plan from 1,000,000 shares to 2,000,000 shares.
Watts Water Technologies, Inc. and Subsidiaries
Notes to Consolidated Financial Statements (Continued)
(12) Common Stock (Continued)
In November 2007, the Company announced that its Board of Directors had authorized a repurchase of up to 3,000,000 shares of its Class A Common Stock. As of December 31, 2007, the Company had repurchased 867,451 shares of stock for a total cost of $25.0 million.
(13) Stock-Based Compensation
There are four The Company maintains three stock optionincentive plans under which key employees and outside directors have been granted currently outstanding incentive stock options (ISOs) and nonqualified stock options (NSOs) to purchase the Company’sCompany's Class A Common Stock. Only one plan, the 2004 Stock Incentive Plan, is currently available for the grant of new options. Theequity awards. Stock options granted under the old plan, had becomeprior plans became exercisable over a five-year period at the rate of 20% per year and expire ten years after the date of grant. Under the 2004 Stock Incentive Plan, options become exercisable over a four-year period at the rate of 25% per year and expire ten years after the grant date. ISOs and NSOs granted under the plans may have exercise prices of not less than 100% and 50% of the fair market value of the common stockClass A Common Stock on the date of grant, respectively. The Company's current practice is to grant all options at fair market value on the grant date. At December 31, 2005, 2,485,0002007, 3,078,132 shares of Class A Common Stock were authorized for future grants of optionsnew equity awards under the Company’sCompany's stock optionincentive plans.
The following is a summary of stock option activity and related information:
| | Years Ended December 31, | |
| | 2005 | | 2004 | | 2003 | |
| | Options | | Weighted
Average
Exercise
Price | | Options | | Weighted
Average
Exercise
Price | | Options | | Weighted
Average
Exercise
Price | |
| | (Options in thousands) | |
Outstanding at beginning of year | | | 1,000 | | | | $ | 17.82 | | | | 1,015 | | | | $ | 14.90 | | | | 1,455 | | | | $ | 14.29 | | |
Granted | | | 310 | | | | 31.66 | | | | 254 | | | | 25.02 | | | | 248 | | | | 16.70 | | |
Cancelled | | | (113 | ) | | | 21.49 | | | | (11 | ) | | | 16.10 | | | | (387 | ) | | | 13.35 | | |
Exercised | | | (108 | ) | | | 14.26 | | | | (258 | ) | | | 14.24 | | | | (301 | ) | | | 14.98 | | |
Outstanding at end of year | | | 1,089 | | | | $ | 21.70 | | | | 1,000 | | | | $ | 17.82 | | | | 1,015 | | | | $ | 14.90 | | |
Exercisable at end of year | | | 422 | | | | $ | 16.05 | | | | 392 | | | | $ | 14.29 | | | | 504 | | | | $ | 13.92 | | |
Watts Water Technologies, Inc. and Subsidiaries
Notes to Consolidated Financial Statements (Continued)
The following table summarizes information about options outstanding at December 31, 2005:
| | Options Outstanding | | Options Exercisable | |
Range of Exercise Prices | | | | Number
Outstanding | | Weighted Average
Remaining Contractual
Life (years) | | Weighted Average
Exercise
Price | | Number
Exercisable | | Weighted Average
Exercise
Price | |
| | (Options in thousands) | |
$10.58 | | | 49 | | | | 3.9 | | | | $ | 10.58 | | | | 49 | | | | $ | 10.58 | | |
$11.75—$12.44 | | | 51 | | | | 4.1 | | | | 12.06 | | | | 51 | | | | 12.06 | | |
$15.40—$32.07 | | | 989 | | | | 7.9 | | | | 22.78 | | | | 322 | | | | 17.52 | | |
| | | 1,089 | | | | 5.3 | | | | $ | 21.70 | | | | 422 | | | | $ | 16.05 | | |
| | | | | | | | | | | | | | | | | | | | | | | | | |
In 2005, the Company issued 5,616also grants shares of restricted stock to itskey employees and non-employee members of the Company's Board of Directors thatunder the 2004 Stock Incentive Plan, which vest either immediately or over three years with a fair market pricethree-year period at the rate of $26.71one-third per share amounting to approximately $150,000 of deferred compensation.year. The restricted stock awards are amortized to expense on a straight-line basis over the vesting period.
In 2004, the Company issued 32,133 shares of restricted stock to its Directors (including the Company’s Chief Executive Officer) that vest over three years with a fair market price between $25.00 and $26.50 per share amounting to approximately $805,000 of deferred compensation. The restricted stock awards are amortized to expense on a straight-line basis over the vesting period.
The Company also has a Management Stock Purchase Plan that allows for the granting of Restricted Stock Unitsrestricted stock units (RSUs) to key employees. On an annual basis, key employees may elect to receive a portion of their annual incentive compensation in RSUs instead of cash. Each RSU provides the key employee with the right to purchase up to 1,000,000 sharesa share of Class A Common Stock at 67% of the fair market value on the date of grant. RSUs vest annually over a three-year period from the dategrant date. An aggregate of grant.2,000,000 shares of Class A Common Stock may be issued under the Management Stock Purchase Plan.
At December 31, 2007, total unrecognized compensation cost related to the unvested stock options was approximately $4.4 million with a total weighted average remaining term of 2.6 years. For 2007 and 2006, the Company recognized compensation cost of $2.7 million and $1.4 million, respectively, in selling, general and administrative expenses.
Watts Water Technologies, Inc. and Subsidiaries
Notes to Consolidated Financial Statements (Continued)
(13) Stock-Based Compensation (Continued)
The difference betweenfollowing is a summary of stock option activity and related information:
| | Years Ended December 31,
|
|---|
| | 2007
| | 2006
| | 2005
|
|---|
| | Options
| | Weighted
Average
Exercise
Price
| | Intrinsic
Value
| | Options
| | Weighted
Average
Exercise
Price
| | Options
| | Weighted
Average
Exercise
Price
|
|---|
| | (Options in thousands)
|
|---|
| Outstanding at beginning of year | | 1,140 | | $ | 23.99 | | | | | 1,089 | | $ | 21.70 | | 1,000 | | $ | 17.82 |
| Granted | | 189 | | | 33.36 | | | | | 164 | | | 35.20 | | 310 | | | 31.66 |
| Cancelled/Forfeitures | | (94 | ) | | 31.08 | | | | | (7 | ) | | 34.16 | | (113 | ) | | 21.49 |
| Exercised | | (67 | ) | | 17.17 | | | | | (106 | ) | | 17.61 | | (108 | ) | | 14.26 |
| | |
| | | | | | | |
| | | | |
| | | |
| Outstanding at end of year | | 1,168 | | $ | 25.32 | | $ | 4.48 | | 1,140 | | $ | 23.99 | | 1,089 | | $ | 21.70 |
| | |
| | | | | | | |
| | | | |
| | | |
| Exercisable at end of year | | 705 | | $ | 21.42 | | $ | 8.38 | | 566 | | $ | 19.13 | | 422 | | $ | 16.05 |
| | |
| | | | | | | |
| | | | |
| | | |
As of December 31, 2007, the RSUaggregate intrinsic values of outstanding and exercisable options were approximately $5.2 million and $5.9 million, respectively, representing the total pre-tax intrinsic value, based on the Company's closing Class A Common Stock price of $29.80 as of December 31, 2007 which would have been received by the option holders had all option holders exercised their options as of that date. The total intrinsic value of options exercised for 2007 and 2006 was approximately $1.4 million and $2.2 million, respectively.
Upon exercise of options, the Company issues shares of Class A Common Stock.
The following table summarizes information about options outstanding at December 31, 2007:
| | Options Outstanding
| | Options Exercisable
|
|---|
Range of Exercise Prices
| | Number
Outstanding
| | Weighted Average
Remaining Contractual
Life (years)
| | Weighted Average
Exercise
Price
| | Number
Exercisable
| | Weighted Average
Exercise
Price
|
|---|
| | (options in thousands)
|
|---|
| $10.56—$14.08 | | 64 | | 2.83 | | $ | 11.17 | | 64 | | $ | 11.17 |
| $14.09—$17.60 | | 370 | | 4.92 | | | 16.53 | | 333 | | | 16.43 |
| $24.64—$28.16 | | 208 | | 6.02 | | | 25.12 | | 156 | | | 25.15 |
| $31.68—$35.20 | | 526 | | 8.25 | | | 33.28 | | 152 | | | 32.86 |
| | |
| | | | | | |
| | | |
| | | 1,168 | | 6.50 | | $ | 25.32 | | 705 | | $ | 21.42 |
| | |
| | | | | | |
| | | |
The fair market value atof each option granted under the 2004 Stock Incentive Plan is estimated on the date of grant, using the Black-Scholes-Merton Model, based on the following weighted average assumptions:
| | Years Ended December 31,
| |
|---|
| | 2007
| | 2006
| | 2005
| |
|---|
| Expected life (years) | | 5.8 | | 5.8 | | 5.8 | |
| Expected stock price volatility | | 37.2 | % | 35.9 | % | 36.2 | % |
| Expected dividend yield | | 1.2 | % | 1.0 | % | 1.0 | % |
| Risk-free interest rate | | 4.6 | % | 4.9 | % | 4.0 | % |
Watts Water Technologies, Inc. and Subsidiaries
Notes to Consolidated Financial Statements (Continued)
(13) Stock-Based Compensation (Continued)
The risk-free interest rate is amortizedbased upon the U.S. Treasury yield curve at the time of grant for the respective expected life of the option. The expected life (estimated period of time outstanding) of options and volatility were calculated using historical data. The expected dividend yield of stock is the Company's best estimate of the expected future dividend yield. The Company applied an estimated forfeiture rate of 15% for its stock options. These rates were calculated based upon historical activity and are an estimate of granted shares not expected to vest. If actual forfeitures differ from the expected rates, the Company may be required to make additional adjustments to compensation expense ratably overin future periods.
The above assumptions were used to determine the vesting period.weighted average grant-date fair value of stock options of $12.75, $13.50 and $11.54 for the years ending December 31, 2007, 2006 and 2005, respectively.
The following is a summary of unvested restricted stock activity and related information:
| | Years Ended December 31,
|
|---|
| | 2007
| | 2006
| | 2005
|
|---|
| | Shares
| | Weighted
Average
Grant Date
Fair Value
| | Shares
| | Weighted
Average
Grant Date
Fair Value
| | Shares
| | Weighted
Average
Grant Date
Fair Value
|
|---|
| | (Shares in thousands)
|
|---|
| Unvested at beginning of year | | 73 | | $ | 33.62 | | 27 | | $ | 26.51 | | 32 | | $ | 25.05 |
| Granted | | 74 | | | 33.21 | | 60 | | | 35.27 | | 6 | | | 32.05 |
| Forfeitures | | (15 | ) | | 34.10 | | (1 | ) | | 35.20 | | — | | | — |
| Vested | | (43 | ) | | 31.85 | | (13 | ) | | 26.09 | | (11 | ) | | 25.05 |
| | |
| | | | |
| | | | |
| | | |
| Unvested at end of year | | 89 | | $ | 34.05 | | 73 | | $ | 33.62 | | 27 | | $ | 26.51 |
| | |
| | | | |
| | | | |
| | | |
The total fair value of shares vested during 2007, 2006 and 2005 was $1.4 million, $0.4 million and $0.3 million, respectively. At December 31, 2005, 328,0612007, total unrecognized compensation cost related to unvested restricted stock was approximately $2.9 million with a total weighted average remaining term of 2.1 years. For 2007 and 2006, the Company recognized compensation costs of $1.6 million and $0.6 million, respectively, in selling, general and administrative expenses. The Company applied an estimated forfeiture rate of 10% for restricted stock issued to key employees. The aggregate intrinsic value of restricted stock granted and outstanding approximated $2.7 million representing the total pre-tax intrinsic value based on the Company's closing Class A Common Stock price of $29.80 as of December 31, 2007.
Total unrecognized compensation cost related to unvested RSUs were outstanding.was approximately $2.2 million at December 31, 2007 with a total weighted average remaining term of 1.9 years. For 2007 and 2006 the Company recognized compensation cost of $1.7 million and $1.0 million, respectively, in selling, general and administrative expenses. Dividends declared for RSUs, that are paid to individuals, that remain unpaid at December 31, 20052007 total approximately $162,000. Deferred compensation for the restricted stock and RSU plans at December 31, 2005 is anticipated to be expensed as follows: 2006 -$1,016,000 and 2007 -$574,000.
The Company has elected to follow APB No. 25 and related interpretations in accounting for its stock-based compensation. In addition the Company provides pro forma disclosure of stock-based compensation, as measured under the fair value requirements of FAS 123. These pro forma disclosures, which are calculated for awards granted after June 30, 1995, are provided in Footnote 2 as required under FAS 148. The weighted average grant date fair value of options granted are $11.90, $9.01 and $5.94 for the years ending December 31, 2005, 2004 and 2003, respectively. Also, the weighted average grant date fair value of RSUs related to the Management Stock Purchase Plan are $12.60, $8.41 and $5.39 for the years ending December 31, 2005, 2004 and 2003, respectively.
The fair value of the Company’s stock-based awards to employees (used in reconciliation in Note 2) was estimated using a Black-Scholes option pricing model and the following assumptions:
| | Years Ended December 31, | |
| | 2005 | | 2004 | | 2003 | |
Expected life (years) | | 5.8 | | 5.0 | | 5.0 | |
Expected stock price volatility | | 36.2 | % | 20.3 | % | 28.3 | % |
Expected dividend yield | | 1.0 | % | 1.1 | % | 1.4 | % |
Risk-free interest rate | | 4.00 | % | 3.50 | % | 3.25 | % |
$0.2 million.
Watts Water Technologies, Inc. and Subsidiaries
Notes to Consolidated Financial Statements (Continued)
(13) Stock-Based Compensation (Continued)
A summary of the Company's RSUs activity and related information for 2007 is shown in the following table:
| | Years Ended December 31,
|
|---|
| | 2007
| | 2006
| | 2005
|
|---|
| | RSUs
| | Weighted
Average
Purchase Price
| | Intrinsic
Value
| | RSUs
| | Weighted
Average
Purchase Price
| | RSUs
| | Weighted
Average
Purchase Price
|
|---|
| | (RSUs in thousands)
|
|---|
| Outstanding at beginning of period | | 347 | | $ | 19.00 | | | | | 328 | | $ | 16.02 | | 267 | | $ | 12.27 |
| Granted | | 160 | | | 25.73 | | | | | 87 | | | 23.34 | | 120 | | | 22.28 |
| Cancelled/Forfeitures | | (31 | ) | | 25.03 | | | | | — | | | — | | (17 | ) | | 9.93 |
| Settled | | (110 | ) | | 15.62 | | | | | (68 | ) | | 10.20 | | (42 | ) | | 16.50 |
| | |
| | | | | | | |
| | | | |
| | | |
| Outstanding at end of period | | 366 | | $ | 22.45 | | $ | 7.35 | | 347 | | $ | 19.00 | | 328 | | $ | 16.02 |
| | |
| | | | | | | |
| | | | |
| | | |
| Vested at end of period | | 141 | | $ | 18.98 | | $ | 10.82 | | 148 | | $ | 15.64 | | 120 | | $ | 11.56 |
| | |
| | | | | | | |
| | | | |
| | | |
As of December 31, 2007, the aggregate intrinsic values of outstanding and vested RSUs were approximately $2.7 million and $1.5 million, respectively, representing the total pre-tax intrinsic value, based on the Company's closing Class A Common Stock price of $29.80 as of December 31, 2007 which would have been received by the RSUs holders had all RSUs settled as of that date. The total intrinsic value of RSUs settled for 2007 and 2006 was approximately $2.5 million and $1.4 million, respectively. Upon settlement of RSUs, the Company issues shares of Class A Common Stock.
The following table summarizes information about RSUs outstanding at December 31, 2007:
| | RSUs Outstanding
| | RSUs Vested
|
|---|
Range of Purchase Prices
| | Number
Outstanding
| | Weighted Average
Remaining Contractual
Life (years)
| | Weighted Average
Purchase
Price
| | Number
Vested
| | Weighted Average
Purchase
Price
|
|---|
| | (RSUs in thousands)
|
|---|
| | $7.04—$10.56 | | 35 | | 3.2 | | $ | 9.54 | | 35 | | $ | 9.54 |
| $14.08—$17.60 | | 7 | | 1.2 | | | 15.50 | | 7 | | | 15.50 |
| $21.12—$24.64 | | 188 | | .7 | | | 22.74 | | 99 | | | 22.58 |
| $24.65—$28.16 | | 136 | | 2.2 | | | 25.73 | | — | | | — |
| | |
| | | | | | |
| | | |
| | | 366 | | 1.5 | | $ | 22.45 | | 141 | | $ | 18.98 |
| | |
| | | | | | |
| | | |
The fair value of each share issued under the Company’s Management Stock Purchase Plan awards to employees (used in reconciliation in Note 2) wasis estimated on the date of grant, using a Black-Scholes option pricing model andthe Black-Scholes-Merton Model, based on the following weighted average assumptions:
| | Years Ended December 31, | | | Years Ended December 31,
| |
|---|
| | 2005 | | 2004 | | 2003 | | | 2007
| | 2006
| | 2005
| |
|---|
Expected life (years) | | 3.0 | | 3.0 | | 3.0 | | | 3.0 | | 3.0 | | 3.0 | |
Expected stock price volatility | | 26.0 | % | 20.3 | % | 28.3 | % | | 35.3 | % | 25.7 | % | 26.0 | % |
Expected dividend yield | | 1.44 | % | 1.2 | % | 1.5 | % | | 1.0 | % | 1.5 | % | 1.4 | % |
Risk-free interest rate | | 3.38 | % | 2.25 | % | 5.63 | % | | 4.8 | % | 4.5 | % | 3.4 | % |
Watts Water Technologies, Inc. and Subsidiaries
Notes to Consolidated Financial Statements (Continued)
(13) Stock-Based Compensation (Continued)
The risk-free interest rate is based upon the U.S. Treasury yield curve at the time of grant for the respective expected life of the RSU's. The expected life (estimated period of time outstanding) of RSU's and volatility were calculated using historical data. The expected dividend yield of stock is the Company's best estimate of the expected future dividend yield. The Company applied an estimated forfeiture rate of 10% for its RSUs. These rates were calculated based upon historical activity and are an estimate of granted shares not expected to vest. If actual forfeitures differ from the expected rates, the Company may be required to make additional adjustments to compensation expense in future periods.
The above assumptions were used to determine the weighted average grant-date fair value of RSUs granted of $16.79, $13.60 and $12.41 during 2007, 2006 and 2005, respectively.
The Company distributed dividends of $0.40 per share for 2007, $0.36 per share for 2006 and $0.32 per share for 2005 on the Company's Class A Common Stock and Class B Common Stock.
(14) Employee Benefit Plans
The Company sponsors funded and unfunded non-contributing defined benefit pension plans coveringthat together cover substantially all of its domestic employees. Benefits are based primarily on years of service and employees’employees' compensation. The funding policy of the Company for these plans is to contribute an annual amount that does not exceed the maximum amount that can be deducted for federal income tax purposes. TheBeginning in 2007, the Company uses a December 31 measurement date for its plans. Prior to 2007, the Company used a September 30 measurement date for its plans.
Watts Water Technologies, Inc. and Subsidiaries
Notes to Consolidated Financial Statements (Continued)
(14) Employee Benefit Plans (Continued)
The funded status of the defined benefit plans and amounts recognized in the balance sheet are as follows:
| | December 31, | |
| | December 31,
| |
|---|
| | 2005 | | 2004 | |
| | 2007
| | 2006
| |
|---|
| | (in thousands) | |
| | (in millions)
| |
|---|
Change in projected benefit obligation | | | | | | Change in projected benefit obligation | | | | | |
Balance at beginning of the year | | $ | 59,225 | | $ | 51,741 | | Balance at beginning of the year | | $ | 72.6 | | $ | 69.1 | |
Service cost | | 2,861 | | 2,462 | | Service cost | | 3.8 | | 3.5 | |
Administration cost | | (299 | ) | (297 | ) | Administration cost | | (.4 | ) | | (.4 | ) |
| Plan change | | Plan change | | .1 | | .7 | |
Interest cost | | 3,351 | | 3,054 | | Interest cost | | 4.3 | | 3.8 | |
Actuarial loss | | 5,934 | | 3,992 | | |
Amendments/curtailments | | 88 | | 193 | | |
| Actuarial gain | | Actuarial gain | | (6.0 | ) | | (1.9 | ) |
Benefits paid | | (2,046 | ) | (1,920 | ) | Benefits paid | | (2.3 | ) | | (2.2 | ) |
Balance at end of year | | $ | 69,114 | | $ | 59,225 | | |
| One-time adjustment for measurement date change | | One-time adjustment for measurement date change | | 1.3 | | — | |
| | | | |
| |
| |
| | | Balance at end of year | | $ | 73.4 | | $ | 72.6 | |
| | | | |
| |
| |
Change in fair value of plan assets | | | | | | Change in fair value of plan assets | | | | | |
Balance at beginning of the year | | $ | 37,021 | | $ | 32,189 | | Balance at beginning of the year | | $ | 42.6 | | $ | 40.1 | |
Actual gain on assets | | 3,511 | | 3,946 | | Actual gain on assets | | 3.6 | | 1.9 | |
Employer contributions | | 1,822 | | 3,103 | | Employer contributions | | 7.3 | | 3.2 | |
Administration cost | | (299 | ) | (297 | ) | Administration cost | | (.4 | ) | | (.4 | ) |
Benefits paid | | (2,046 | ) | (1,920 | ) | Benefits paid | | (2.3 | ) | | (2.2 | ) |
Fair value of plan assets at end of the year | | $ | 40,009 | | $ | 37,021 | | |
Funded Status | | $ | (29,105 | ) | $ | (22,204 | ) | |
Unrecognized prior service costs | | 1,310 | | 1,462 | | |
Unrecognized net actuarial loss | | 20,562 | | 15,826 | | |
| One-time adjustment for measurement date change | | One-time adjustment for measurement date change | | 8.0 | | — | |
| | | | |
| |
| |
| | | Fair value of plan assets at end of the year | | $ | 58.8 | | $ | 42.6 | |
| | | | |
| |
| |
Funded status at end of year | |
Funded status at end of year |
|
$ |
(14.6 |
) |
$ |
(30.0 |
) |
Contributions after measurement date and on or before fiscal year end | | 29 | | 36 | | Contributions after measurement date and on or before fiscal year end | | — | | 6.6 | |
Net amount recognized | | $ | (7,204 | ) | $ | (4,880 | ) | |
| | | | |
| |
| |
| | | Net amount recognized | | $ | (14.6 | ) | $ | (23.4 | ) |
| | | | |
| |
| |
Amounts recognized in the balance sheet are as follows:
| | December 31,
| |
|---|
| | 2007
| | 2006
| |
|---|
| | (in millions)
| |
|---|
| Current liabilities | | $ | (.1 | ) | $ | (.1 | ) |
| Noncurrent liabilities | | | (14.5 | ) | | (23.3 | ) |
| | |
| |
| |
| Net amount recognized | | $ | (14.6 | ) | $ | (23.4 | ) |
| | |
| |
| |
78 Amounts recognized in accumulated other comprehensive income consist of:
| | December 31,
|
|---|
| | 2007
| | 2006
|
|---|
| | (in millions)
|
|---|
| Net actuarial loss | | $ | 11.2 | | $ | 19.0 |
| Prior service cost | | | 1.8 | | | 1.7 |
| | |
| |
|
| Net amount recognized | | $ | 13.0 | | $ | 20.7 |
| | |
| |
|
Watts Water Technologies, Inc. and Subsidiaries
Notes to Consolidated Financial Statements (Continued)
Amounts recognized in the statement of financial position are as follows:(14) Employee Benefit Plans (Continued)
| | December 31, | |
| | 2005 | | 2004 | |
| | (in thousands) | |
Accrued benefit costs | | $ | (7,204 | ) | $ | (4,880 | ) |
Minimum pension liability | | $ | (13,934 | ) | $ | (10,905 | ) |
Intangible assets | | $ | 1,310 | | $ | 1,462 | |
Information for pension plans with an accumulated benefit obligation in excess of plan assets are as follows:
| | December 31, | | | December 31,
|
|---|
| | 2005 | | 2004 | | | 2007
| | 2006
|
|---|
| | (in thousands) | | | (in millions)
|
|---|
Projected benefit obligation | | $ | 69,114 | | $ | 59,225 | | | $ | 73.4 | | $ | 72.6 |
Accumulated benefit obligation | | $ | 61,175 | | $ | 52,841 | | | $ | 66.4 | | $ | 64.3 |
Fair value of plan assets | | $ | 40,009 | | $ | 37,021 | | | $ | 58.8 | | $ | 42.6 |
The components of net periodic benefit cost are as follows:
| | Years Ended December 31, | |
| | 2005 | | 2004 | | 2003 | |
| | (in thousands) | |
Service cost—benefits earned | | $ | 2,861 | | $ | 2,462 | | $ | 2,021 | |
Interest costs on benefits obligation | | 3,351 | | 3,054 | | 2,789 | |
Estimated return on assets | | (3,174 | ) | (2,856 | ) | (2,281 | ) |
Transitional obligation amortization | | — | | (148 | ) | (255 | ) |
Prior service cost amortization | | 240 | | 229 | | 219 | |
Net loss amortization | | 862 | | 756 | | 521 | |
Net periodic benefit cost | | $ | 4,140 | | $ | 3,497 | | $ | 3,014 | |
| | Years Ended December 31,
| |
|---|
| | 2007
| | 2006
| | 2005
| |
|---|
| | (in millions)
| |
|---|
| Service cost—benefits earned | | $ | 3.8 | | $ | 3.5 | | $ | 2.9 | |
| Interest costs on benefits obligation | | | 4.3 | | | 3.8 | | | 3.3 | |
| Expected return on assets | | | (4.4 | ) | | (3.5 | ) | | (3.2 | ) |
| Prior service cost amortization | | | .2 | | | .3 | | | .2 | |
| Net actuarial loss amortization | | | .9 | | | 1.2 | | | .9 | |
| Curtailment charge | | | .2 | | | — | | | — | |
| | |
| |
| |
| |
| | Net periodic benefit cost | | $ | 5.0 | | $ | 5.3 | | $ | 4.1 | |
| | |
| |
| |
| |
The estimated net actuarial loss and prior service cost for the defined benefit pension plans that will be amortized from accumulated other comprehensive income into net periodic benefit cost over the next year are $0.4 million and $0.2 million, respectively.
Additional Information:
| | December 31, | |
| | 2005 | | 2004 | |
| | (in thousands) | |
Increase in minimum liability included in other comprehensive income, net of tax | | $ | 1,978 | | | $ | 20 | | |
| | | | | | | | | |
Assumptions:
Weighted-average assumptions used to determine benefit obligations:
| | December 31, | | |
| | 2005 | | 2004 | | | 2007
| | 2006
| |
|---|
Discount rate | | 5.50 | % | 5.75 | % | | 6.50 | % | 5.875 | % |
Rate of compensation increase | | 4.00 | % | 4.00 | % | | 4.00 | % | 4.00 | % |
Watts Water Technologies, Inc. and Subsidiaries
Notes to Consolidated Financial Statements (Continued)
Weighted-average assumptions used to determine net periodic benefit costs:
| | December 31, | | |
| | 2005 | | 2004 | | 2003 | | | 2007
| | 2006
| | 2005
| |
|---|
Discount rate | | 5.75 | % | 6.00 | % | 6.75 | % | | 5.875 | % | 5.50 | % | 5.75 | % |
Long-term rate of return on asset | | 8.50 | % | 8.50 | % | 8.50 | % | |
| Long-term rate of return on assets | | | 8.50 | % | 8.50 | % | 8.50 | % |
Rate of compensation increase | | 4.00 | % | 4.00 | % | 4.00 | % | | 4.00 | % | 4.00 | % | 4.00 | % |
Discount rates are selected based upon rates of return at the measurement date utilizing benchmark pension discount rates currently available anda bond matching approach to match the expected to be available during the period to maturity of the pension benefits.benefit cash flows. In selecting the expected long-term rate of return on assets, the Company considers the average rate of earnings expected on the funds invested or to be invested to provide for the benefits of this plan. This includes considering the trust’strust's asset allocation and the expected returns likely to be earned over the life of the plan. This basis is consistent with the prior year.
Watts Water Technologies, Inc. and Subsidiaries
Notes to Consolidated Financial Statements (Continued)
(14) Employee Benefit Plans (Continued)
The weighted average asset allocations by asset category is as follows:
| | Plan Assets At
December 31, | | |
Asset Category | | | | 2005 | | 2004 | | | 2007
| | 2006
| |
|---|
Equity securities | Equity securities | | 66.0 | % | 71.2 | % | | 64.9 | % | 64.4 | % |
Debt securities | Debt securities | | 28.3 | % | 28.8 | % | | 29.8 | | 30.0 | |
Other | Other | | 5.7 | % | — | | | 5.3 | | 5.6 | |
| | | |
| |
| |
Total | Total | | 100 | % | 100 | % | | 100.0 | % | 100.0 | % |
| | | | | | | | |
| |
| |
The Company’sCompany's written Retirement Plan Investment Policy sets forth the investment policy, objectives and constraints of the Watts Water Technologies, Inc. Pension Plan. This Retirement Plan Investment Policy, set forth by the Pension Plan Committee, defines general investment principles and directs investment management policy, addressing preservation of capital, risk aversion and adherence to investment discipline. Investment managers are to make a reasonable effort to control risk and are evaluated quarterly against commonly accepted benchmarks to ensure that the risk assumed is commensurate with the given investment style and objectives.
The portfolio is designed to achieve a balanced return of current income and modest growth of capital, while achieving returns in excess of the rate of inflation over the investment horizon in order to preserve purchasing power of Plan assets. All Plan assets are required to be invested in liquid securities. Derivative investments will not be allowed.
Prohibited investments include, but are not limited to the following: commodities and futures contracts, private placements, options, limited partnerships, venture-capital investments, real estate properties, interest-only (IO), principal-only (PO), and residual tranche CMOs, and Watts Water Technologies, Inc. stock.
Prohibited transactions include, but are not limited to the following: short selling and margin transactions.
Watts Water Technologies, Inc. and Subsidiaries
Notes to Consolidated Financial Statements (Continued)
Allowable assets include: cash equivalents, fixed income securities, equity securities, mutual funds, and GICs.
Specific guidelines regarding allocation of assets are as follows: equities shall comprise between 25% and 75% of the total portfolio, while fixed income shall comprise between 30% and 65%. Investment performance is monitored on a regular basis and investments are re-allocated to stay within specific guidelines. An equity/fixed income allocation of 55%/45% is preferred. The securities of any one company or government agency should not exceed 10% of the total fund, and no more than 20% of the total fund should be invested in any one industry. Individual treasury securities may represent 50% of the total fund, while the total allocation to treasury bonds and notes may represent up to 100% of the Plan’sPlan's aggregate bond position.
Watts Water Technologies, Inc. and Subsidiaries
Notes to Consolidated Financial Statements (Continued)
(14) Employee Benefit Plans (Continued)
The information related to the Company’sCompany's pension funds cash flow is as follows:
| | December 31, | | | December 31,
|
|---|
| | 2005 | | 2004 | | | 2007
| | 2006
|
|---|
| | (in thousands) | | | (in millions)
|
|---|
Employer Contributions | | $ | 1,816 | | $ | 117 | | | $ | 7.3 | | $ | 9.8 |
Benefit Payments | | $ | 2,046 | | $ | 1,920 | | | $ | 2.3 | | $ | 2.2 |
Contributions made in January 2006 approximated $3,100,000, otherNo contributions are expected to be made in 2006 approximate $120,000.2008.
Expected benefit payments to be paid by the pension plans are as follows:
| | (in thousands) | | | (in millions)
|
|---|
During fiscal year ending December 31, 2006 | | | $ | 2,077 | | | |
During fiscal year ending December 31, 2007 | | | $ | 2,162 | | | |
During fiscal year ending December 31, 2008 | | | $ | 2,260 | | | | $ | 2.6 |
During fiscal year ending December 31, 2009 | | | $ | 2,454 | | | | $ | 2.8 |
During fiscal year ending December 31, 2010 | | | $ | 2,694 | | | | $ | 3.0 |
During fiscal year ending December 31, 2011 through
December 31, 2015 | | | $ | 17,018 | | | |
| During fiscal year ending December 31, 2011 | | | $ | 3.2 |
| During fiscal year ending December 31, 2012 | | | $ | 3.5 |
| During fiscal year ending December 31, 2013 through December 31, 2017 | | | $ | 24.0 |
Additionally, substantially all of the Company’sCompany's domestic employees are eligible to participate in certain 401(k) savings plans. Under these plans, the Company matches a specified percentage of employee contributions, subject to certain limitations. The Company’sCompany's match contributions (included in selling, general and administrative expense) for the years ended December 31, 2007, 2006, and 2005 2004,were $0.6 million, $0.6 million, and 2003 were $423,000, $421,000, and $300,000,$0.4 million, respectively. Charges for European pension plans approximated $2,000,000, $1,900,000$3.0 million, $1.9 million and $1,400,000$2.0 million for the years ended December 31, 2005, 2004,2007, 2006, and 2003,2005, respectively. These costs relate to plans administered by certain European subsidiaries, with benefits calculated according to government requirements and paid out to employees upon retirement or change of employment.
81
Watts Water Technologies, Inc. and Subsidiaries
Notes to Consolidated Financial Statements (Continued)
The Company entered into a Supplemental Compensation Agreement (the Agreement) with Timothy P. Horne on September 1, 1996. Per the Agreement, upon ceasing to be an employee of the Company, Mr. Horne must make himself available, as requested by the Board, to work a minimum of 300 but not more than 500 hours per year as a consultant in return for certain annual compensation as long as he is physically able to do so. If Mr. Horne complies with the consulting provisions of the agreement above, he shall receive supplemental compensation on an annual basis of $400,000 per year, subject to cost of living increases each year, in exchange for the services performed, as long as he is physically able to do so. In the event of physical disability, subsequent to commencing consulting services for the Company, Mr. Horne will continue to receive $400,000 annually. The payment for consulting services provided by Mr. Horne will be expensed as incurred by the Company. Mr. Horne retired effective December 31, 2002, and therefore the Supplemental Compensation period began on January 1, 2003. In accordance with Financial Accounting Standards Board Statement No. 106, “Employers"Employers Accounting for Post Retirement Benefits Other Than Pensions”Pensions", the Company will accrue for the future post-retirement disability benefits over the period from January 1, 2003, to the time in which Mr. Horne becomes physically unable to perform his consulting services (the period in which the disability benefits are earned).
Watts Water Technologies, Inc. and Subsidiaries
Notes to Consolidated Financial Statements (Continued)
(15) Contingencies and Environmental Remediation
James Jones Litigation
As previously disclosed, on On June 25, 1997, Nora Armenta (the Relator) filed a civil action in the California Superior Court for Los Angeles County (the Armenta case) against James Jones Company (James Jones), Mueller Co., Tyco International (U.S.), and Watts Industries, Inc., now Watts Water Technologies, Inc. (Watts).the Company. The Company formerly owned James Jones. The Relator filed under the qui tam provision of the California state False Claims Act, Cal. Govt. Code § 12650 et seq. (California False Claims Act) and generally alleged that James Jones and the other defendants violated this statute by delivering some “defective”"defective" or “non-conforming”"non-conforming" waterworks parts to thirty-four municipal water systems in the State of California. The Relator filed a First Amended Complaint in November 1998 and a Second Amended Complaint in December 2000, which brought the total number of plaintiffs to 161. In June 2002, the trial court excluded 47 cities from this total of 161, and the Relator was not able to obtain appellate modification of this order, which can still be appealed at the end of the case. To date, 11 of the named cities have intervened and attempts by four other named cities to intervene have been denied.
In June 2002, the trial court excluded 47 cities from this December 2000 total of 161, but this exclusion was reversed by an August 30, 2006 California Court of Appeal ruling that is now final. This August 30, 2006, Court of Appeal ruling also reversed dismissals of Tyco International and Mueller Co. and this allowed the Relator to make a successful motion that removed the Armenta Case litigation from Judge Lichtman's court to the court of Judge Chaney, another complex litigation judge.
One of the allegations in the Second Amended Complaint and the Complaints-in-Intervention is that purchased non-conforming James Jones waterworks parts may leach into public drinking water elevated amounts of lead that may create a public health risk because they were made out of ‘81'81 bronze alloy (UNS No. C8440) and contain more lead than the specified and advertised ‘85'85 bronze alloy (UNS No. C83600). This contention is based on the average difference of about 2% lead content between ‘81'81 bronze (6% to 8% lead) and ‘85'85 bronze (4%to 6% lead) and the assumption that this would mean increased consumable lead in public drinking water that could cause a public health concern. The Company believes the evidence and discovery available to date indicateindicates that this is not the case.
In addition, ‘81'81 bronze is used extensively in municipal and home plumbing systems and is approved by municipal, local and national codes. The Federal Environmental Protection Agency also defines metal for pipe fittings with no more than 8% lead as “lead free”"lead free" under Section 1417 of the Federal Safe Drinking Water Act.
Watts Water Technologies, Inc. and Subsidiaries
Notes to Consolidated Financial Statements (Continued)
In this case, the Relator seeks three times an unspecified amount of actual damages and alleges that the municipalities have suffered hundreds of millions of dollars in damages. She also seeks civil penalties of $10,000 for each false claim and alleges that defendants are responsible for tens of thousands of false claims. Finally, the Relator requests an award of costs of this action, including attorneys’attorneys' fees.
In December 1998, the Los Angeles Department of Water and Power (LADWP) intervened in this case and filed a complaint. WeThe Company settled with the city of Los Angeles, by far the most significant city, for $7,300,000$7.3 million plus attorneys’attorneys' fees. Co-defendants contributed $2.0 million toward this settlement.
In August 2003, an additional settlement payment was made for $13,000,000$13.0 million ($11,000,00011.0 million from the Company and $2,000,000$2.0 million from James Jones), which settled the claims of the three Phase I cities (Santa Monica, San Francisco and East Bay Municipal Utility District) chosen by the Relator as having the strongest claims to be tried first. This settlement payment included the Relator’sRelator's statutory share,
Watts Water Technologies, Inc. and Subsidiaries
Notes to Consolidated Financial Statements (Continued)
(15) Contingencies and Environmental Remediation (Continued)
and the claims of these three cities have been dismissed. In addition to this $13,000,000$13.0 million payment, the Company is obligated to pay the Relator’s attorney’sRelator's attorney's fees.
After the Phase I settlement, the Court permitted the defendants to select five additional cities to serve as the plaintiffs in a second trial phase of the case. Contra Costa, Corona, Santa Ana, Santa Cruz and Vallejo were chosen. WattsThe Company and James Jones then reached an agreement to settle the claims of the City of Santa Ana for a total of $45,000, an amount which approximates Santa Ana’sAna's purchases of James Jones products during the relevant period. The Santa Ana settlement was approved by the Court and then completed.
On June 22, 2005, the Court dismissed the claims of the remaining Phase II cities (Contra Costa, Corona, Santa Cruz and Vallejo). The Court ruled that the Relator and these cities were required to show that the cities had received out of spec parts which were related to specific invoices and that this showing had not been made. Although each city’scity's claim is unique, this ruling is significant for the claims of the remaining cities, and the Relator appealed. However, this judgment can be appealed again at the conclusion of the entire case. The trial court has appealed.scheduled a trial on March 17, 2009 for six Phase III cities with three cities to be selected by each side. Litigation is inherently uncertain, and the Company is unable to predict the outcome of this appeal.case.
On September 15, 2004, the Relator’sRelator's attorneys filed a new common law fraud lawsuit in the California Superior Court for the City of Banning and forty-fiveforty-six other cities and water districts against James Jones, Watts and Mueller Co. based on the same transactions alleged in the Armenta case. About thirty-fourforty-two of the plaintiffs in this new lawsuit are also plaintiffs in the Armenta case. On January 4, 2006, the Court denied much of the Defendants’ demurrer, which had been filed on claim-splitting andThe statute of limitations grounds.threshold issue is in the process of being resolved for these plaintiffs. Litigation is inherently uncertain, and the Company is unable to predict the outcome of this new lawsuit.case.
The Company has a reserve of approximately $21,000,000$28.0 million with respect to the James Jones Litigation in our consolidated balance sheet as of December 31, 2005.2007. The Company believes, on the basis of all available information, that this reserve is adequate to cover the probable and reasonably estimable losses resulting from the Armenta case and the insurance coverage litigation with Zurich American Insurance Company (Zurich) discussed below. The Company is currently unable to make an estimate of the range of any additional losses.
On February 14, 2001, after itsthe Company's insurers had denied coverage for the claims in the Armenta case, the Companyit filed a complaint for coverage against ourits insurers in the California Superior Court (the coverage case). James Jones filed a similar complaint, the cases were consolidated, and the trial court made summary adjudication rulings that Zurich must pay all reasonable defense costs incurred by Watts
Watts Water Technologies, Inc. and Subsidiaries
Notes to Consolidated Financial Statements (Continued)
the Company and James Jones in the Armenta case since April 23, 1998 as well as such future defense costs in the future until the end of the Armenta case. In JulyAugust 2004, the California Court of Appeal affirmed these rulings, and, on December 1, 2004, the California Supreme Court denied Zurich’sZurich's appeal of this decision. This denial permanently established Zurich’sZurich's obligation to pay Armenta defense costs for both Wattsthe Company (approximately $16,900,000$16.6 million plus future costs) and James Jones (which is estimatedthe Company estimates to be $17,300,000$17.0 million plus future costs), and Zurich is currently making payments of incurred Armenta defense costs. However, as noted below, Zurich asserts that the defense costs paid by it are subject to reimbursement.
In On November 22, 2002, the trial court madeentered a summary adjudication rulingorder that Zurich must indemnify and pay Wattsthe Company and James Jones for amounts paid to settle with the City of Los Angeles. Zurich’sZurich's attempt to obtain appellate review of this order was denied, but Zurich will still be able to appeal this order at the end of the coverage case. InOn August 6, 2004, the trial court made
Watts Water Technologies, Inc. and Subsidiaries
Notes to Consolidated Financial Statements (Continued)
(15) Contingencies and Environmental Remediation (Continued)
another summary adjudication ruling that Zurich must indemnify and pay Wattsus and James Jones for the $13,000,000$13.0 million paid to settle the claims of the Phase I cities described above. Zurich’sZurich's attempt to obtain appellate review of this ruling was denied on December 3, 2004 by the California Court of Appeal, but Zurich will still be able to appeal this order at the end of the coverage case. Although Zurich has now made mostall of the payments required by these indemnity orders,orders.
On February 8, 2006, Zurich filed a motion to set aside as void the November 22, 2002 and August 6, 2004 summary adjudication indemnity payment orders. After this motion was denied, Zurich's appeal was also denied and the California Supreme Court denied Zurich's petition for review. The Company is currently unable to predict the finality of these indemnity payment orders since Zurich can also appeal them at the end of the coverage case. The Company has recorded reimbursed indemnity settlement amounts (but not reimbursed defense costs) as a liability pending court resolution of the indemnification matter as it relates to Zurich.
Zurich has asserted that all amounts (which is estimatedthe Company estimates to be $51,000,000$56.0 million for both defense costs and indemnity amounts paid for settlements) paid by it to the Company and James Jones are subject to reimbursement under Deductible Agreements related to the insurance policies between Zurich and the Company.Watts. If Zurich were to prevail on this argument, James Jones would have a possible indemnity claim against the Company for its exposure from the Armenta case. The Company believes the Armenta case should be viewed as one occurrence and the deductible amount should be $500,000$0.5 million per occurrence.
These reimbursement claims are subject to arbitration under the Watts/Zurich Deductible Agreements. Zurich claims its reimbursement right for defense costs paid arises under six Deductible Agreements, and the Company contendscontend that only two Deductible Agreements apply. The Company further contendscontend that a final decision in California supports itsour position on the number of Deductible Agreements that should apply to defense costs. On January 31, 2006, the federal district court in Chicago, Illinois determined that there are disputes under all Deductible Agreements in effect during the period in which Zurich issued primary policies and that the arbitrator could decide which agreements would control reimbursement claims. The Company has appealed from this ruling. ManagementOn October 20, 2006, the United States Court of Appeals for the Seventh Circuit affirmed that an arbitration panel could decide which deductible agreements between Zurich and counsel anticipate that the Company will ultimately prevail onwould control Zurich's reimbursement claim for defense costs paid in the James Jones case. As a result of this reimbursement issue with Zurich.development, the Company recorded a pre-tax charge of $5.0 million to discontinued operations in 2006.
Based on management’smanagement's assessment, the Company does not believe that the ultimate outcome of the James Jones Litigation will have a material adverse effect on its liquidity, financial condition or results of operations. While this assessment is based on all available information, litigation is inherently uncertain, the actual liability to the Company to resolve this litigation fully cannot be predicted with any certainty and there exists a reasonable possibility that the Company may ultimately incur losses in the James Jones Litigation in excess of the amount accrued. The Company intends to continue to contest vigorously all aspects of the James Jones Litigation.
Watts Water Technologies, Inc. and Subsidiaries
Notes to Consolidated Financial Statements (Continued)
Environmental Remediation
The Company has been named as a potentially responsible party (PRP) with respect to a limited number of identified contaminated sites. The levels of contamination vary significantly from site to site as do the related levels of remediation efforts. Environmental liabilities are recorded based on the most probable cost, if known, or on the estimated minimum cost of remediation. The Company accrues
Watts Water Technologies, Inc. and Subsidiaries
Notes to Consolidated Financial Statements (Continued)
(15) Contingencies and Environmental Remediation (Continued)
estimated environmental liabilities based on assumptions, which are subject to a number of factors and uncertainties. Circumstances which can affect the reliability and precision of these estimates include identification of additional sites, environmental regulations, level of cleanup required, technologies available, number and financial condition of other contributors to remediation and the time period over which remediation may occur. The Company recognizes changes in estimates as new remediation requirements are defined or as new information becomes available. TheAt December 31, 2007, the Company has a reserve of approximately $1,500,000$1.4 million (environmental accrual), which the Companyit estimates will likely be paid for environmental remediation liabilities over the next five to ten years. Based on the facts currently known to it, the Company does not believe that the ultimate outcome of these matters will have a material adverse effect on its liquidity, financial condition or results of operations. Some of the Company’sits environmental matters are inherently uncertain and it there exists a possibility that the Companyit may ultimately incur losses from these matters in excess of the amount accrued. However, the Company cannot currently estimate the amount of any such additional losses.
Asbestos Litigation
The Company is defending approximately 121100 cases filed primarily, but not exclusively, in Mississippi and New Jersey state courts alleging injury or death as a result of exposure to asbestos. These filings typically name multiple defendants and are filed on behalf of many plaintiffs. They do not identify any particular Watts products as a source of asbestos exposure. To date, Wattsthe Company has been dismissed from each case when the scheduled trial date comes near or when discovery fails to yield any evidence of exposure to any Watts product.of its products. Based on the facts currently known to it, the Company does not believe that the ultimate outcome of these claims will have a material adverse effect on its liquidity, financial condition or results of operations.
Other Litigation
On or about March 26, 2003, a class action complaint was filed against Watts by North Carolina Hospitality Group, Inc. in the Circuit Court of Maryland, Prince George’s County. It alleges that certain commercial valve models contain a design defect that causes them to fail prematurely. On June 7, 2004, the trial court issued an opinion and order that denied the plaintiff’s request for class certification. This ruling was appealed at the end of 2004, and, on January 17, 2006, this ruling was affirmed by the Maryland Court of Special Appeals. Based on the facts currently known to it, the Company does not believe that the ultimate outcome of this matter will have a material adverse effect on its liquidity, financial condition or results of operations.
Other lawsuits and proceedings or claims, arising from the ordinary course of operations, are also pending or threatened against the Company. Based on the facts currently known to it, the Company does not believe that the ultimate outcome of these other litigation matters will have a material adverse effect on its liquidity, financial condition or results of operations.
85
Watts Water Technologies, Inc. and Subsidiaries
Notes to Consolidated Financial Statements (Continued)
(16) Financial Instruments
Fair Value
The carrying amounts of cash and cash equivalents, investment securities, trade receivables and trade payables approximate fair value because of the short maturity of these financial instruments.
The fair value of the Company’sCompany's 4.87% senior notes due 2010, and 5.47% senior notes due 2013 and 5.85% senior notes due 2016 is based on quoted market prices. The fair value of the Company’sCompany's variable rate debt approximates its carrying value. The carrying amount and the estimated fair market value of the Company’sCompany's long-term debt, including the current portion, are as follows:
| | December 31, | | | December 31,
|
|---|
| | 2005 | | 2004 | | | 2007
| | 2006
|
|---|
| | (in thousands) | | | (in millions)
|
|---|
Carrying amount | | $ | 306,985 | | $ | 185,543 | | | $ | 433.5 | | $ | 449.2 |
Estimated fair value | | $ | 306,485 | | $ | 186,606 | | | $ | 424.9 | | $ | 447.5 |
Watts Water Technologies, Inc. and Subsidiaries
Notes to Consolidated Financial Statements (Continued)
(16) Financial Instruments (Continued)
Derivative Instruments
The Company uses foreign currency forward exchange contracts as an economic hedge to reduce the impact of currency fluctuations on certain anticipated intercompany purchase transactions that are expected to occur withinduring the yearnext twelve months and certain other foreign currency transactions. RelatedRealized and unrealized gains and losses on the contracts are recognized in other income/expense when the contracts expire, which is generally in the same period as the underlying foreign currency denominated transaction.expense. These contracts do not subject the Company to significant market risk from exchange movement because they offset gains and losses on the related foreign currency denominated transactions. At December 31, 2005, 20042007 and 2003,2006, the fair value of the contracts approximated $0.1 million and $0.2 million, respectively. At December 31, 2005, the Company had no outstanding forward contracts to buy foreign currencies.
The Company occasionally uses commodity futures contracts to fix the price on a certain portion of certain raw materials used in the manufacturing process. These contracts highly correlate to the actual purchases of the commodity and the contract values are reflected in the cost of the commodity as it is actually purchased. There were no commodity contracts utilized for the years ended December 31, 2005, 20042007, 2006 and 2003.2005.
Effective July 1, 2005, the Company entered into a three-year interest rate swap with a counter party for a notional amount of Leases€25,000,000, which is outstanding under our Revolving Credit Facility. The Company swapped the three-month EURIBOR plus 0.6% for a fixed rate of 3.02%. The Company has designated the swap as a hedge using the cash flow method. At December 31, 2005, the fair value of the swap was approximately $484,000.
Watts Water Technologies, Inc. and Subsidiaries
Notes to Consolidated Financial Statements (Continued)
Leases
The Company leases certain manufacturing facilities, sales offices, warehouses, and equipment. Generally the leases carry renewal provisions and require the Company to pay maintenance costs. Future minimum lease payments under capital leases and non-cancelable operating leases as of December 31, 20052007 are as follows:
| | Capital Leases
| | Operating Leases
|
|---|
| | (in millions)
|
|---|
| 2008 | | $ | 1.8 | | $ | 7.4 |
| 2009 | | | 1.8 | | | 5.5 |
| 2010 | | | 1.8 | | | 3.5 |
| 2011 | | | 1.8 | | | 2.2 |
| 2012 | | | 1.6 | | | 1.4 |
| Thereafter | | | 11.4 | | | 2.2 |
| | |
| |
|
| | Total | | $ | 20.2 | | $ | 22.2 |
| | | | | |
|
| Less amount representing interest (at rates ranging from 4.2% to 8.7%) | | | (3.5 | ) | | |
| | |
| | | |
| Present value of net minimum capital lease payments | | | 16.7 | | | |
| Less current installments of obligations under capital leases | | | (1.4 | ) | | |
| | |
| | | |
| | Obligations under capital leases, excluding installments | | $ | 15.3 | | | |
| | |
| | | |
| | Operating Leases | | Capital Leases | |
| | (in thousands) | |
2006 | | | $ | 4,322 | | | | $ | 510 | | |
2007 | | | 3,499 | | | | 331 | | |
2008 | | | 3,244 | | | | 94 | | |
2009 | | | 2,378 | | | | 94 | | |
2010 | | | 1,497 | | | | 95 | | |
Thereafter | | | 8,375 | | | | 150 | | |
Total | | | $ | 23,315 | | | | $ | 1,274 | | |
Watts Water Technologies, Inc. and Subsidiaries
Notes to Consolidated Financial Statements (Continued)
(16) Financial Instruments (Continued)
Carrying amounts of assets under capital lease include:
| | December 31,
| |
|---|
| | 2007
| | 2006
| |
|---|
| | (in millions)
| |
|---|
| Buildings | | $ | 18.6 | | $ | 18.3 | |
| Machinery and equipment | | | 8.9 | | | 3.1 | |
| | |
| |
| |
| | | | 27.5 | | | 21.4 | |
| Less accumulated depreciation | | | (4.0 | ) | | (2.9 | ) |
| | |
| |
| |
| | | $ | 23.5 | | $ | 18.5 | |
| | |
| |
| |
(17) Segment Information
Under the criteria set forth in Financial Accounting Standards Board No. 131, “Disclosure"Disclosure about Segments of an Enterprise and Related Information,”" the Company operates in three geographic segments: North America, Europe, and China. Each of these segments sell similar products, is managed separately and has separate financial results that are reviewed by the Company’sCompany's chief operating decision-maker. All intercompany sales transactions have been eliminated. Sales by region are based upon location of the entity recording the sale. The accounting policies for each segment are the same as those described in the summary of significant accounting policies (see Note 2).
Watts Water Technologies, Inc. and Subsidiaries
Notes to Consolidated Financial Statements (Continued)
(17) Segment Information (Continued)
The following is a summary of the Company’sCompany's significant accounts and balances by segment, reconciled to its consolidated totals:
| | North
America | | Europe | | China | | Corporate(*) | | Consolidated | |
| | (in thousands) | |
As of or for the year ended December 31, 2005 | | | | | | | | | | | | | | | |
Net sales | | $ | 629,937 | | $ | 266,346 | | $ | 28,063 | | | $ | — | | | | $ | 924,346 | | |
Operating income (loss) | | 76,757 | | 31,528 | | 3,533 | | | (17,263 | ) | | | 94,555 | | |
Identifiable assets | | 717,424 | | 288,783 | | 94,763 | | | — | | | | 1,100,970 | | |
Long-lived assets | | 92,904 | | 45,674 | | 26,421 | | | — | | | | 164,999 | | |
Capital expenditures | | 9,502 | | 6,082 | | 3,006 | | | — | | | | 18,590 | | |
Depreciation and amortization | | 13,050 | | 8,888 | | 4,180 | | | — | | | | 26,118 | | |
As of or for the year ended December 31, 2004 | | | | | | | | | | | | | | | |
Net sales | | $ | 545,139 | | $ | 253,234 | | $ | 26,185 | | | $ | — | | | | $ | 824,558 | | |
Operating income (loss) | | 68,558 | | 31,597 | | 1,857 | | | (18,412 | ) | | | 83,600 | | |
Identifiable assets | | 537,898 | | 303,981 | | 80,801 | | | — | | | | 922,680 | | |
Long-lived assets | | 72,019 | | 52,276 | | 26,394 | | | — | | | | 150,689 | | |
Capital expenditures | | 8,029 | | 6,374 | | 6,596 | | | — | | | | 20,999 | | |
Depreciation and amortization | | 14,961 | | 8,870 | | 4,220 | | | — | | | | 28,051 | | |
As of or for the year ended December 31, 2003 | | | | | | | | | | | | | | | |
Net sales | | $ | 472,518 | | $ | 210,614 | | $ | 18,727 | | | $ | — | | | | $ | 701,859 | | |
Operating income (loss) | | 64,375 | | 22,592 | | (3,834 | ) | | (13,132 | ) | | | 70,001 | | |
Identifiable assets | | 511,285 | | 266,849 | | 62,784 | | | — | | | | 840,918 | | |
Long-lived assets | | 72,447 | | 48,882 | | 24,237 | | | — | | | | 145,566 | | |
Capital expenditures | | 6,495 | | 4,832 | | 8,703 | | | — | | | | 20,030 | | |
Depreciation and amortization | | 12,523 | | 6,593 | | 2,149 | | | — | | | | 21,265 | | |
| | December 31,
| |
|---|
| | 2007
| | 2006
| | 2005
| |
|---|
| | (in millions)
| |
|---|
| Net Sales | | | | | | | | | | |
| | North America | | $ | 871.0 | | $ | 821.3 | | $ | 629.9 | |
| | Europe | | | 452.6 | | | 367.5 | | | 266.3 | |
| | China | | | 58.7 | | | 42.0 | | | 28.1 | |
| | |
| |
| |
| |
| | | Consolidated net sales | | $ | 1,382.3 | | $ | 1,230.8 | | $ | 924.3 | |
| | |
| |
| |
| |
| Operating income (loss) | | | | | | | | | | |
| | North America | | $ | 93.3 | | $ | 98.5 | | $ | 79.1 | |
| | Europe | | | 53.6 | | | 50.0 | | | 31.5 | |
| | China | | | 7.9 | | | 7.2 | | | 3.5 | |
| | |
| |
| |
| |
| | | Subtotal reportable segments | | | 154.8 | | $ | 155.7 | | $ | 114.1 | |
| | Corporate(*) | | | (29.1 | ) | | (25.2 | ) | | (19.5 | ) |
| | |
| |
| |
| |
| | | Consolidated operating income | | | 125.7 | | | 130.5 | | | 94.6 | |
| | | Interest income | | | 14.5 | | | 5.0 | | | 1.2 | |
| | | Interest expense | | | (26.9 | ) | | (22.1 | ) | | (10.4 | ) |
| | | Minority interest | | | 2.8 | | | 1.8 | | | (.3 | ) |
| | | Other | | | (2.3 | ) | | .9 | | | .7 | |
| | |
| |
| |
| |
| | Income from continuing operations before income taxes | | $ | 113.8 | | $ | 116.1 | | $ | 85.8 | |
| | |
| |
| |
| |
| Identifiable Assets | | | | | | | | | | |
| | North America | | $ | 1,066.0 | | $ | 1,046.8 | | $ | 717.4 | |
| | Europe | | | 531.6 | | | 493.4 | | | 288.8 | |
| | China | | | 131.7 | | | 120.7 | | | 94.8 | |
| | |
| |
| |
| |
| | | Consolidated identifiable assets | | $ | 1,729.3 | | $ | 1,660.9 | | $ | 1,101.0 | |
| | |
| |
| |
| |
| Long-Lived Assets | | | | | | | | | | |
| | North America | | $ | 100.2 | | $ | 99.7 | | $ | 92.9 | |
| | Europe | | | 88.5 | | | 78.4 | | | 45.7 | |
| | China | | | 35.0 | | | 28.1 | | | 26.4 | |
| | |
| |
| |
| |
| | | Consolidated long-lived assets | | $ | 223.7 | | $ | 206.2 | | $ | 165.0 | |
| | |
| |
| |
| |
| Capital Expenditures | | | | | | | | | | |
| | North America | | $ | 13.9 | | $ | 14.6 | | $ | 9.5 | |
| | Europe | | | 12.6 | | | 27.5 | | | 6.1 | |
| | China | | | 11.3 | | | 2.6 | | | 3.0 | |
| | |
| |
| |
| |
| | | Consolidated capital expenditures | | $ | 37.8 | | $ | 44.7 | | $ | 18.6 | |
| | |
| |
| |
| |
| Depreciation and Amortization | | | | | | | | | | |
| | North America | | $ | 17.8 | | $ | 17.1 | | $ | 13.0 | |
| | Europe | | | 15.7 | | | 13.0 | | | 8.9 | |
| | China | | | 5.9 | | | 5.2 | | | 4.2 | |
| | |
| |
| |
| |
| | | Consolidated depreciation and amortization | | $ | 39.4 | | $ | 35.3 | | $ | 26.1 | |
| | |
| |
| |
| |
- *
Corporate expenses are primarily for compensation expense, Sarbanes-Oxley compliance, professional fees, including legal and audit expenses, shareholder services and benefit administration costs. These costs are not allocated to the geographic segments as they are viewed as corporate functions that support all activities.
Watts Water Technologies, Inc. and Subsidiaries
Notes to Consolidated Financial Statements (Continued)
(17) Segment Information (Continued)
The North America segment consists of U.S. net sales of $582,279,000, $507,061,000$805.5 million, $762.7 million and 439,436,000$582.3 million for the years ended December 31, 2005, 20042007, 2006 and 20032005, respectively. The North American segment also consists of U.S. long-lived assets of $86,099,000, $67,032,000$92.7 million, $93.1 million and $67,450,000$86.1 million as of December 31, 2005, 20042007, 2006 and 2003,2005, respectively.
Intersegment sales for the year ended December 31, 2007 for North America, Europe and China were $6.6 million, $6.0 million and $137.1 million, respectively. Intersegment sales for the year ended December 31, 2006 for North America, Europe and China were $6.9 million, $3.0 million and $82.3 million, respectively. Intersegment sales for the year ended December 31, 2005 for North America, Europe and China were $4,847,000, $5,279,000$4.8 million, $5.3 million and $48,770,000,$48.8 million, respectively. Intersegment sales for the year ended December 31, 2004 for North America, Europe and China were $6,040,000, $6,834,000 and $27,030,000, respectively. Intersegment sales for the year ended December 31, 2003 for North America, Europe and China were $4,180,000, $3,656,000 and $12,146,000, respectively.
Watts Water Technologies, Inc. and Subsidiaries
Notes to Consolidated Financial Statements (Continued)
(18) Quarterly Financial Information (unaudited)
| | First
Quarter | | Second
Quarter | | Third
Quarter | | Fourth
Quarter(1) | |
| | (in thousands, except per share information) | |
Year ended December 31, 2005 | | | | | | | | | | | |
Net sales | | $ | 219,027 | | $ | 228,183 | | $ | 232,729 | | | $ | 244,407 | | |
Gross profit | | 77,378 | | 81,183 | | 79,813 | | | 86,328 | | |
Income from continuing operations | | 12,397 | | 13,988 | | 13,439 | | | 15,196 | | |
Net income | | 12,358 | | 13,913 | | 13,368 | | | 14,960 | | |
Per common share: | | | | | | | | | | | |
Basic | | | | | | | | | | | |
Income from continuing operations | | 0.38 | | 0.43 | | 0.41 | | | 0.47 | | |
Net income | | 0.38 | | 0.43 | | 0.41 | | | 0.46 | | |
Diluted | | | | | | | | | | | |
Income from continuing operations | | 0.37 | | 0.42 | | 0.41 | | | 0.46 | | |
Net income | | 0.37 | | 0.42 | | 0.40 | | | 0.45 | | |
Dividends per common share | | 0.08 | | 0.08 | | 0.08 | | | 0.08 | | |
Year ended December 31, 2004 | | | | | | | | | | | |
Net sales | | $ | 186,008 | | $ | 206,954 | | $ | 210,190 | | | $ | 221,406 | | |
Gross profit | | 64,912 | | 75,627 | | 74,368 | | | 75,654 | | |
Income from continuing operations | | 10,995 | | 14,059 | | 13,835 | | | 9,849 | | |
Net income | | 11,001 | | 13,953 | | 13,705 | | | 8,161 | | |
Per common share: | | | | | | | | | | | |
Basic | | | | | | | | | | | |
Income from continuing operations | | 0.34 | | 0.44 | | 0.43 | | | 0.30 | | |
Net income | | 0.34 | | 0.43 | | 0.42 | | | 0.25 | | |
Diluted | | | | | | | | | | | |
Income from continuing operations | | 0.34 | | 0.43 | | 0.42 | | | 0.30 | | |
Net income | | 0.34 | | 0.43 | | 0.42 | | | 0.25 | | |
Dividends per common share | | 0.07 | | 0.07 | | 0.07 | | | 0.07 | | |
| | First
Quarter
| | Second
Quarter
| | Third
Quarter
| | Fourth
Quarter
|
|---|
| | (in millions, except per share information)
|
|---|
| Year ended December 31, 2007 | | | | | | | | | | | | |
| Net sales | | $ | 346.1 | | $ | 350.4 | | $ | 340.5 | | $ | 345.3 |
| Gross profit | | | 114.7 | | | 114.6 | | | 110.4 | | | 121.9 |
| Income from continuing operations | | | 20.0 | | | 17.7 | | | 18.2 | | | 21.7 |
| Net income | | | 20.0 | | | 17.8 | | | 18.1 | | | 21.5 |
| Per common share: | | | | | | | | | | | | |
| Basic | | | | | | | | | | | | |
| | Income from continuing operations | | | .52 | | | .46 | | | .47 | | | .56 |
| | Net income | | | .52 | | | .46 | | | .47 | | | .56 |
| Diluted | | | | | | | | | | | | |
| | Income from continuing operations | | | .51 | | | .45 | | | .47 | | | .56 |
| | Net income | | | .51 | | | .46 | | | .46 | | | .55 |
| Dividends per common share | | | .10 | | | .10 | | | .10 | | | .10 |
| Year ended December 31, 2006 | | | | | | | | | | | | |
| Net sales | | $ | 275.0 | | $ | 300.2 | | $ | 325.1 | | $ | 330.5 |
| Gross profit | | | 95.8 | | | 106.4 | | | 111.9 | | | 110.9 |
| Income from continuing operations | | | 15.1 | | | 22.5 | | | 21.3 | | | 18.1 |
| Net income | | | 15.0 | | | 22.4 | | | 18.2 | | | 18.1 |
| Per common share: | | | | | | | | | | | | |
| Basic | | | | | | | | | | | | |
| | Income from continuing operations | | | .46 | | | .69 | | | .65 | | | .52 |
| | Net income | | | .46 | | | .69 | | | .56 | | | .52 |
| Diluted | | | | | | | | | | | | |
| | Income from continuing operations | | | .46 | | | .68 | | | .65 | | | .51 |
| | Net income | | | .46 | | | .68 | | | .55 | | | .51 |
| Dividends per common share | | | .09 | | | .09 | | | .09 | | | .09 |
(1) During the fourth quarter of 2004, the Company identified and corrected errors related to certain accrued expenses. The adjustments to net income necessary to correct these errors amounted to $2,289,000, or ($0.07) per share. The portions of these adjustments that related to the year ended December 31, 2004 and the fourth quarter of 2004 were $1,520,000, or ($0.05) per share and $411,000, or ($0.01) per share, respectively. The impact of the amount that related to prior periods was not material to any of the financial statements of prior periods, thus the amount related to prior periods, including the first three quarters of 2004, was recorded in the fourth quarter of 2004.
Watts Water Technologies, Inc. and Subsidiaries
Notes to Consolidated Financial Statements (Continued)
(19) Related Party Transactions
In 2004, an agreement was executed with a relocation firm to purchase and sell the home of the Company’s chief executive officer, who is also a member of the Company’s board of directors. The relocation firm purchased the home from the Company’s chief executive officer, on the Company’s behalf, at a price based on fair market appraisals obtained by the Company. Accordingly, theCompany's 60% owned Chinese joint venture Tianjin Tanggu Watts Valve Company charged income from continuing operations for approximately $285,000 representing the difference between the original appraised value of the home and the final sale price to the third party.
The Company owns a 20% interest in www.plumbworld.co.uk Limited (Plumbworld), a variable interest entity. Plumbworld is primarily an e-business that sells bathroom and sanitary appliances, as well as plumbing and heating products, tools and plumbing consumables. Its latest fiscal year sales were approximately $11,600,000. The Company has a nominal investment of approximately $500 in Plumbworld and maintains a loan receivable in the amount of approximately $603,000 with Plumbworld. The Company has entered in to an agreement with the majority shareholders of Plumbworld to exchange its 20% ownership interest for full receipt of the loan receivable. The Company expects to receive installment payments on the loan receivable through September 2006, at which time it will relinquish it shares in Plumbworld. The Company continues to account for its investment in Plumbworld using the equity method.
The Company(TWT) leases the land and buildings occupied by its Chinese joint venture from the joint venture partner.partner in Tianjin China. The lease is classified as an operating lease and extends for another 18 years.lease. Total rental expense for 2007, 2006, and 2005 2004approximated
Watts Water Technologies, Inc. and 2003 approximated $275,000 each year. Total lease costsSubsidiaries
Notes to Consolidated Financial Statements (Continued)
(19) Related Party Transactions (Continued)
$0.3 million. During 2006, the local Chinese government informed the Company that the property leased by TWT would be taken over by eminent domain by the end of the second quarter of 2008. The Company has therefore established a plan to relocate and rationalize those operations (see note 4).
On December 3, 2007, the Company entered into an Equity Transfer Agreement (the Agreement) with its joint venture partners to purchase the remaining term40% of the leaseoutstanding ownership interest in TWT that it did not already own. The purchase price will approximate $4,950,000.be approximately $5.2 million, payable after certain closing conditions are met, including the approval of the Agreement by the local Chinese authorities, which the Company expects will occur by the end of the second quarter of 2008. The Company expects to record approximately $3.7 million in goodwill for this acquisition.
(20) Subsequent Events
In On February 7, 2006,5, 2008, the Company declared a quarterly dividend of nineeleven cents ($0.09)0.11) per share on the Company’seach outstanding share of Class A Common Stock and Class B Common Stock. This is an increase of $0.01 per share compared to the dividend paid for the comparable period last year.
From January 1, 2008 through February 25, 2008, the Company liquidated approximately $22.0 million of the Company's auction rate certificates at par value and invested the proceeds into money market accounts. At February 25, 2008, the Company held approximately $17.0 million of auction rate certificates whose underlying investments are AAA rated municipal bonds. The Company has no current indications that the securities its holds may be impaired. However, volatility in the credit markets could impact the Company's ability to liquidate these investments or cause the fair value of the securities to be impaired. If liquidity of the securities becomes prohibitive, the Company may be forced to hold the securities until maturity or until conditions improve which could be as long as 33 years. Subsequent to December 31, 2007 through February 25, 2008, the Company experienced failed auctions on $6.6 million of its auction rate certificates. The Company does not have a present need to access these funds for operational purposes. The amounts associated with failed auctions will not be accessible until a successful auction occurs, a buyer is found outside of the auction process or the underlying securities have matured. As a result, the Company has classified the $17.0 million of auction rate certificates held as of February 25, 2008 as long-term assets in the Company's December 31, 2007 consolidated balance sheet.
90
Watts Water Technologies, Inc. and Subsidiaries
Schedule II—Valuation and Qualifying Accounts
(Amounts in thousands)millions)
For the Three Years Ended December 31:
| | Balance At
Beginning of
Period
| | Additions
Charged To
Expense
| | Additions
Charged To
Other Accounts
| | Deductions
| | Balance At
End of
Period
|
|---|
| Year Ended December 31, 2005 | | | | | | | | | | | | |
| Allowance for doubtful accounts | | $ | 7.6 | | 3.9 | | .3 | | (2.5 | ) | $ | 9.3 |
| Allowance for excess and obsolete inventories | | $ | 16.2 | | 2.6 | | 1.1 | | (2.3 | ) | $ | 17.6 |
| Year Ended December 31, 2006 | | | | | | | | | | | | |
| Allowance for doubtful accounts | | $ | 9.3 | | 3.5 | | .3 | | (2.6 | ) | $ | 10.5 |
| Allowance for excess and obsolete inventories | | $ | 17.6 | | 9.1 | | 1.0 | | (7.2 | ) | $ | 20.5 |
| Year Ended December 31, 2007 | | | | | | | | | | | | |
| Allowance for doubtful accounts | | $ | 10.5 | | 5.4 | | 1.2 | | (2.2 | ) | $ | 14.9 |
| Allowance for excess and obsolete inventories | | $ | 20.5 | | 9.1 | | 2.0 | | (7.2 | ) | $ | 24.4 |
| | Balance At
Beginning of
Period | | Additions
Charged To
Expense | | Additions
Charged To
Other Accounts | | Deductions | | Balance At
End of
Period | |
Year Ended December 31, 2003 | | | | | | | | | | | | | | | | | | | | | |
Allowance for doubtful accounts | | | $ | 7,322 | | | | 2,373 | | | | 60 | | | | (1,983 | ) | | | $ | 7,772 | | |
Allowance for excess and obsolete inventories | | | $ | 13,201 | | | | 3,558 | | | | 172 | | | | (2,686 | ) | | | $ | 14,245 | | |
Year Ended December 31, 2004 | | | | | | | | | | | | | | | | | | | | | |
Allowance for doubtful accounts | | | $ | 7,772 | | | | 2,100 | | | | 337 | | | | (2,658 | ) | | | $ | 7,551 | | |
Allowance for excess and obsolete inventories | | | $ | 14,245 | | | | 7,325 | | | | 289 | | | | (5,660 | ) | | | $ | 16,199 | | |
Year Ended December 31, 2005 | | | | | | | | | | | | | | | | | | | | | |
Allowance for doubtful accounts | | | $ | 7,551 | | | | 3,914 | | | | 341 | | | | (2,510 | ) | | | $ | 9,296 | | |
Allowance for excess and obsolete inventories | | | $ | 16,199 | | | | 2,593 | | | | 1,074 | | | | (3,086 | ) | | | $ | 16,780 | | |
91
EXHIBIT INDEX
| Exhibit No. |
|
| | Description
|
|---|
2.1
3.1 | | Stock Purchase Agreement dated as of December 8, 2005 by and among Watts Water Technologies, Inc., Watts Regulator Co., Evan J. Segal and Stacy A. Brovitz (14)
|
3.1
| | Restated Certificate of Incorporation, as amended (22) (14) |
3.2 | | Amended and Restated By-Laws, as amended (1) |
9.1 | | The Amended and Restated George B. Horne Voting Trust Agreement—1997 dated as of September 14, 1999 (15) |
10.1* | | Supplemental Compensation Agreement effective as of September 1, 1996 between the Registrant and Timothy P. Horne (9), Amendment No. 1, dated July 25, 2000 (16), and Amendment No. 2 dated October 23, 2002 (3) |
10.2* | | Deferred Compensation Agreement between the Registrant and Timothy P. Horne, as amended (4)
|
10.3*
| | Form of Indemnification Agreement between the Registrant and certain directors and officers of the Registrant (23) (18) |
10.4*
10.3* | | 1996 Stock Option Plan, dated October 15, 1996 (10), and First Amendment dated February 28, 2003 (3) |
10.5*
10.4* | | Watts Industries, Inc. Retirement Plan for Salaried Employees dated December 30, 1994, as amended and restated effective as of January 1, 1994 (8), Amendment No. 1 (9), Amendment No. 2 (9), Amendment No. 3 (9), Amendment No. 4 dated September 4, 1996 (12), Amendment No. 5 dated January 1, 1998 (15), Amendment No. 6 dated May 3, 1999 (15), and Amendment No. 7 dated June 7, 1999 (15) |
10.6*
| | Watts Industries,Water Technologies, Inc. Pension Plan (amended and restated effective as of January 1, 1997) (3)2006) and First Amendment dated October 25, 2002 (3)
effective as of January 1, 2008 |
10.7
10.5 | | Registration Rights Agreement dated July 25, 1986 (5) |
10.8*
10.6* | | Executive Incentive Bonus Plan, as amended and restated (21) (8) |
10.9
10.7 | | Amended and Restated Stock Restriction Agreement dated October 30, 1991 (2), and Amendment dated August 26, 1997 (12) |
10.10*
10.8* | | Watts Industries, Inc. 1991 Non-Employee Directors’Directors' Nonqualified Stock Option Plan (6), and Amendment No. 1 (9) |
10.11*
10.9* | | Watts Industries, Inc. 2003 Non-Employee Directors’Directors' Stock Option Plan (3) |
10.12
10.10 | | Letter of Credit issued by Fleet National Bank (as successor to BankBoston, N.A.) for the benefit of Zurich-American Insurance Company dated June 25, 1999, as amended January 22, 2001 (17) |
10.13*
10.11* | | Form of Stock Restriction Agreement for management stockholders (5)
|
10.14
| | Credit Agreement dated as of September 23, 2004 among Watts Water Technologies, Inc. and certain of its subsidiaries, Bank of America, N.A., JP Morgan Chase Bank, Wachovia Bank, National Association, Key Bank National Association, SunTrust Bank and certain other lenders (20) and Amendment No. 1 dated March 21, 2005 (24)
|
10.15*
| | Watts Water Technologies, Inc. Management Stock Purchase Plan (Amended and Restated as of January 1, 2005), as amended and restated (21) (20) |
10.16
10.12 | | Stock Purchase Agreement dated as of June 19, 1996 by and among Mueller Co., Tyco Valves Limited, Watts Investment Company, Tyco International Ltd. and the Registrant (11) |
10.17
| | Relocation Management Agreement between the Registrant and Cendant Mobility Services Corporation dated April 6, 2004 (18)
|
10.18
10.13 | | Note Purchase Agreement dated as of May 15, 2003 between the Registrant and the Purchasers named in Schedule A thereto relating to the Registrant’sRegistrant's $50,000,000 4.87% Senior Notes, Series A, due May 15, 2010 and $75,000,000 5.47% Senior Notes, Series B, due May 15, 2013 (7) |
10.19
10.14 | | Form of 4.87% Senior Note due May 15, 2010 (7) |
10.20
10.15 | | Form of 5.47% Senior Note due May 15, 2013 (7) |
10.21*
10.16* | | Watts Water Technologies, Inc. 2004 Stock Incentive Plan, (17) as amended (20) |
10.22*
10.17* | | Non-Employee Director Compensation Arrangements (21) (1) |
10.23*
10.18* | | Watts Water Technologies, Inc. Supplemental Employees Retirement Plan as Amended and Restated Effective May 4, 2004, (19) First Amendment effective March 1, 2005 and Second Amendment effective January 1, 2008 |
10.24*
10.19* | | Form of Incentive Stock Option Agreement under the Watts Water Technologies, Inc. 2004 Stock Incentive Plan (20) (19) |
10.25*
10.20* | | Form of Non-Qualified Stock Option Agreement under the Watts Water Technologies, Inc. 2004 Stock Incentive Plan (20) |
10.26*
10.21* | | Form of Restricted Stock Award Agreement for Employees under the Watts Water Technologies, Inc. 2004 Stock Incentive Plan (Incremental Vesting) (20) |
10.27*
10.22* | | Form of Restricted Stock Award Agreement for Employees under the Watts Water Technologies, Inc. 2004 Stock Incentive Plan (20) (Cliff Vesting) (19) |
10.28*
10.23* | | Form of Restricted Stock Award Agreement for Non-Employee Directors under the Watts Water Technologies, Inc. 2004 Stock Incentive Plan (20) (19) |
11
10.24 | | Note Purchase Agreement, dated as of April 27, 2006, between the Registrant and the Purchasers named in Schedule A thereto relating to the Registrant's $225,000,000 5.85% Senior Notes due April 30, 2016 (4) |
| 10.25 | | Form of 5.85% Senior Note due April 30, 2016 (4) |
| 10.26 | | Subsidiary Guaranty, dated as of April 27, 2006, in connection with the Registrant's 5.85% Senior Notes due April 30, 2016 executed by the subsidiary guarantors party thereto, including the form of Joinder to Subsidiary Guaranty (4) |
| 10.27 | | First Amendment, dated as of April 27, 2006, to Note Purchase Agreement dated as of May 15, 2003 among the Registrant and the purchasers named therein (4) |
| 10.28 | | Amended and Restated Credit Agreement, dated as of April 27, 2006, among the Registrant, certain subsidiaries of the Registrant as Borrowers, Bank of America, N.A., as Administrative Agent, Swing Line Lender and L/C Issuer and the other lenders referred to therein (4) |
| 10.29 | | Amended and Restated Guaranty, dated as of April 27, 2006, by the Registrant, the Subsidiaries of the Registrant set forth therein and Watts Industries Europe B.V., in favor of Bank of America, N.A. (4) |
| 10.30* | | Resignation Agreement dated October 16, 2007 between the Registrant and William D. Martino (18) |
| 11 | | Statement Regarding Computation of Earnings per Common Share (13) |
21 | | Subsidiaries |
23 | | Consent of KPMG LLP |
31.1 | | Certification of Principal Executive Officer pursuant to Rule 13a-14(a) or Rule 15d-14(a) of the Securities Exchange Act of 1934, as amended |
31.2 | | Certification of Principal Financial Officer pursuant to Rule 13a-14(a) or Rule 15d-14(a) of the Securities Exchange Act of 1934, as amended |
32.1 | | Certification of Principal Executive Officer Pursuant to 18 U.S.C. Section 1350 |
32.2 | | Certification of Principal Financial Officer Pursuant to 18 U.S.C. Section 1350 |
- (1)
Incorporated by reference to the Registrant’s Registration StatementRegistrant's Current Report on Form S-3 (No. 333-105989) filed with the Securities and Exchange Commission on June 10, 2003.8-K dated February 5, 2007 (File No. 001-11499).
(2)Incorporated by reference to the Registrant’sRegistrant's Current Report on Form 8-K dated November 14, 1991 (File No. 001-11499).
(3)Incorporated by reference to the Registrant’sRegistrant's Annual Report on Form 10-K for the year ended December 31, 2002 (File No. 001-11499).
(4)Incorporated by reference to the Registrant’sRegistrant's Current Report on Form S-1 (No. 33-6515)8-K dated June 17, 1986.April 27, 2006 (File No. 001-11499).
(5)Incorporated by reference to the Registrant’sRegistrant's Form S-1 (No. 33-6515) as part of the Second Amendment to such Form S-1 dated August 21, 1986.
(6)Incorporated by reference to Amendment No. 1 to the Registrant’sRegistrant's Annual Report on Form 10-K for year ended June 30, 1992 (File No. 001-11499).
(7)Incorporated by reference to the Registrant’sRegistrant's Current Report on Form 8-K dated May 15, 2003 (File No. 001-11499).
(8)Incorporated by reference to the Registrant’s AnnualRegistrant's Current Report on Form 10-K for year ended June 30, 19958-K dated February 8, 2005 (File No. 001-11499).
(9)Incorporated by reference to the Registrant’sRegistrant's Annual Report on Form 10-K for year ended June 30, 1996 (File No. 001-11499).
(10)Incorporated by reference to the Registrant’sRegistrant's Form S-8 (No. 333-32685) dated August 1, 1997.
(11)Incorporated by reference to the Registrant’sRegistrant's Current Report on Form 8-K dated September 4, 1996 (File No. 001- 11499).
(12)Incorporated by reference to the Registrant’sRegistrant's Annual Report on Form 10-K for year ended June 30, 1997(File No. 001- 11499).
(13)Incorporated by reference to notes to Consolidated Financial Statements, Note 2 of this Report.
- (14)
Incorporated by reference to the Registrant’s CurrentRegistrant's Quarterly Report on Form 8-K dated December 28,10-Q for the quarter ended July 3, 2005 (File No. 001-11499). The Registrant hereby agrees to furnish supplementally a copy of any omitted schedule or similar attachment to this agreement to the Securities and Exchange Commission upon its request.
(15)Incorporated by reference to the Registrant’sRegistrant's Annual Report on Form 10-K for year ended June 30, 1999 (File No. 001-11499).
(16)Incorporated by reference to the Registrant’sRegistrant's Quarterly Report on Form 10-Q for quarter ended September 30, 2000 (File No. 001-11499).
(17)Incorporated by reference to the Registrant’sRegistrant's Annual Report on Form 10-K for the year ended December 31, 2003 (File No. 001-11499).
(18)Incorporated by reference to the Registrant’sRegistrant's Quarterly Report on Form 10-Q for the quarter ended March 28, 2004September 30, 2007 (File No. 001-11499).
(19)Incorporated by reference to the Registrant’s Quarterly Report on Form 10-Q for the quarter ended June 27, 2004 (File No. 001-11499).(20) Incorporated by reference to the Registrant’sRegistrant's Quarterly Report on Form 10-Q for the quarter ended September 26, 2004 (File No. 001-11499).
(21)
(20)Incorporated by reference to the Registrant’s Current Report on Form 8-K dated February 8, 2005 (File No. 001-11499).(22) Incorporated by reference to the Registrant’sRegistrant's Quarterly Report on Form 10-Q for the quarter ended July 3, 20051, 2007 (File No. 001-11499).
(23) Incorporated by reference to the Registrant’s Quarterly Report on Form 10-Q for the quarter ended October 2, 2005 (File No. 001-11499).
(24) Incorporated by reference to the Registrant’s Current Report on Form 8-K dated March 21, 2005 (File No. 001-11499).
- *
- Management contract or compensatory plan or arrangement.
94
QuickLinks
PART I
PART II
Report of Independent Registered Public Accounting Firm
PART III
PART IV
SIGNATURES
Report of Independent Registered Public Accounting Firm
Watts Water Technologies, Inc. and Subsidiaries Consolidated Statements of Operations (Amounts in millions, except per share information)
Watts Water Technologies, Inc. and Subsidiaries Consolidated Balance Sheets (Amounts in millions, except share information)
Watts Water Technologies, Inc. and Subsidiaries Consolidated Statements of Stockholders' Equity (Amounts in millions, except share information)
Watts Water Technologies, Inc. and Subsidiaries Consolidated Statements of Cash Flows (Amounts in millions)
Watts Water Technologies, Inc. and Subsidiaries Notes to Consolidated Financial Statements
Watts Water Technologies, Inc. and Subsidiaries Schedule II—Valuation and Qualifying Accounts (Amounts in millions)
EXHIBIT INDEX