Our core technologies include our proprietary VGF technique used to produce high quality crystals that are processed into compound substrates, and the technologies of our joint venture companies,
which enable us to manufacture a range of products that are used in the manufacture of compound semiconductor substrates or can be sold as raw materials to third parties.
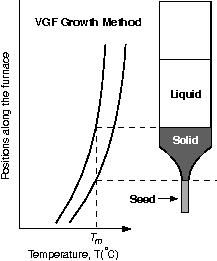
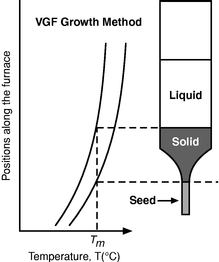
Our VGF technique is designed to control the crystal-growth process with minimal temperature variation and is the current technique we use to produce our GaAs, InP and Ge substrates. Unlike traditional techniques, our VGF technique places the hot compound melt above the cool crystal, and minimizes the temperature gradient between the crystal and the melt which reduces the turbulence at the interface of the melt and the solid crystal. In comparison, in the LEC technique the melt and crystal are inverted, there is a higher temperature gradient between the melt and the crystal, and more turbulence at the interface of the melt and solid crystal. These aspects of the VGF technique enable us to grow crystals that have a relatively low defect density and high uniformity. The crystal and the resulting substrate are mechanically strong, resulting in lower breakage rates during a customer’scustomer's manufacturing process. Since the temperature gradient is controlled electronically rather than by physical movement, the sensitive crystal is not disturbed as it may be during some competitors’competitors' VGF-like growth processes. In addition, the melt and growing crystal are contained in a closed chamber, which isolates the crystal from the outside environment to reduce potential contamination. This substrate isolation allows for more precise control of the gallium-to-arsenic ratio, resulting in better consistency and uniformity of the crystals.
Our Although we are exploring the use of other methods to control the crystal-growth process, including the CZ and LEC methods for select applications, for our traditional GaAs substrates, our VGF technique offers several benefits for producing our GaAs substrates when compared to traditional crystal growing technologies. The HBHorizontal Bridgman (HB) technique is the traditional method for producing semi-conducting GaAs substrates for opto-electronic applications. The HB technique holdsapplications, but because of the techniques used to hold the GaAs melt, in a semi-cylindrical container, causing crystals grown using the HB method to have a semi-circular, or D-shaped, cross-section. Accordingly, more crystal material is discarded when the D-shaped substrate is subsequently trimmed to a round shape. In addition, crystals grown using the HB technique have a higher defect density than VGF-grown crystals. The HB technique cannot be used cost-effectively to produce substrates greater than three inches in diameter. TheIn addition, the HB technique houses the GaAs melt in a quartz container during the growth process, which can contaminate the GaAs melt with silicon impurities, making it unsuitable for producing semi-insulating GaAs substrates.
Our VGF technique also offers advantages over the LEC technique for producing semi-insulating GaAs substrates for electronicwireless applications. During the LEC process, the crystal is grown by dipping a seed crystal through molten boric oxide into a melt of gallium and arsenic poly-crystal material and slowly pulling the seed up into the cool zone above the boron oxide where the crystal hardens. Unlike the VGF technique, the LEC technique is designed so that the hotter GaAs melt is located beneath the cooler crystal, resultingcan result in greater turbulence in the melt, and at a temperature gradient that is significantly higher than the VGF technique. The turbulence and high temperature gradienttechnique, which can cause LEC-grown crystals to have a higher dislocation density than VGF-grown crystals, resulting in a higher rate of breakage during the device manufacturing process. As an open process,However, the LEC technique also results in greater propensitycan be useful for contaminationGaAs semi-conducting substrates since the LED application specifications and difficulty controlling the ratiorequirements are less stringent than those of gallium to arsenic. It requires large, complex electro-mechanical systems that are expensive and require highly skilled personnel to operate.
The following table provides a comparison of these three techniques: in 2003, LEC retains about 40% of the semi-insulating market and HB is still present in the semi-conducting or opto-electronics market.wireless applications.
|
|
| ||||
|
|
|
| |||
|
|
|
| |||
|
|
|
| |||
|
|
|
| |||
|
|
|
| |||
|
|
|
| |||
|
|
|
| |||
|
|
|
| |||
|
|
|
| |||
|
|
|
|
We design, develop, manufacture and distribute high-performance semiconductor substrates. We make semi-insulating GaAs substrates used in applications such as amplifiers and switches for wireless handsets, and semi-conducting GaAs substrates used to create opto-electronic products including HBLEDs, which are often used to backlight wireless handsets and LCD TVs and for automotive and general illumination applications. InP is a high performance semiconductor substrate used in broadband and fiber optic applications. Ge substrates are used in emerging applications such as triple junction solar cells for space and terrestrial photovoltaic applications and for optical applications.
The table below sets forth our products and selected applications:
| Product | Applications | ||||||||||||||
|---|---|---|---|---|---|---|---|---|---|---|---|---|---|---|---|
| Substrates | Electronic | Opto-electronic | |||||||||||||
|
|
| • | LEDs | |||||||||||
|
|
| |||||||||||||
|
| Lasers | |||||||||||||
| High-performance transistors |
| Optical couplers | ||||||||||||
| Satellite communications | ||||||||||||||
InP |
| Fiber optic communications |
| Lasers | |||||||||||
| Satellite communications | ||||||||||||||
| High-performance transistors | ||||||||||||||
| Automotive collision avoidance radar | ||||||||||||||
Ge |
| Satellite solar cells | • | Optical applications | |||||||||||
Substrates.We currently sell compound substrates manufactured from GaAs and InP, as well as single-element substrates manufactured from Ge. We supply GaAs substrates in two-, three-, four-, five- and six-inch diameters. We manufacture InP substrates in two-, three- and four-inch diameters and Ge substrates in two- and four-inch diameters.
Materials.We participate in five joint ventures in China that sell raw materials used by us in substrate manufacturing and by others. These joint ventures produce products including 99.99% pure gallium (4N Ga), high purity gallium, arsenic, and germanium, germanium dioxide, paralytic boron nitride (pBN) crucibles, and boron oxide (B2O3)(B2O3). In 2005,2007 and 2006, sales of raw materials to parties other than us were approximately $4.8$13.8 million and $5.3 million, respectively, which comprised of all of these products.
We sell our compound semiconductor substrates and materials worldwide. Our top revenue producing customers include:
| Avago Technologies Manufacturing (Singapore) Pte. Ltd. | • | Intelligent Epitaxy Technology |
|
| Picogiga International SAS | ||||
|
|
| • | IQE (Europe) Limited | • | Recapture Metals Limited | ||||
|
| China Electronics Technology Group | • | IQE, plc. | • | Sumika Epi Solution Co., Ltd. | ||||
|
|
| ||||||||
|
| • | Ningbo Ker Ning Da Ri Fang Magnet Co., Ltd. | • | Visual Photonics Epitaxy Co., Ltd. | |||||
|
| Epitech Technology Corporation | • | MBE Technology Pte. Ltd. | • | Xiamen Sanan Electronics Co., Ltd. | ||||
|
| Epiworks, Inc. | • | MCP, UK. | • | Xiamen Xinde Co., Ltd. | ||||
| • | Freescale Semiconductor, Inc. | • | Osram Opto Semiconductors GmbH |
Historically, we have sold a significant portion of our products in any particular period to a limited number of customers. TwoNo customer represented greater than 10% of revenue for the year ended December 31, 2007, while one customer, Visual Photonics Epitaxy Co., Ltd., represented greater than 10% of revenue, totaling 12.8%, for the year ended December 31, 2006, while two customers, Osram Opto Semiconductors GmbH, and MBE Technology Pte. Ltd., represented greater than 10% of revenue, totaling 20.7%, for the year ended December 31, 2005, while no customers represented greater than 10% of revenue for the years ended December 31, 2004 and 2003. The company’s2005. Our top five customers represented 37.5%33.0% of revenues for the year ended December 31, 2005, 30.1% ofour revenue for the year ended December 31, 2004, and 28.9%2007, 40.0% of our revenue for the year ended December 31, 2003.2006, and 37.5% of our revenue for the year ended December 31, 2005. We expect that sales to a small number of customers will continue to comprise a significant portion of our revenue in the future.
The There have been no third party customers for our raw materials products are in many instancesthat account for greater than 10% of revenue for the same as our customers for substrates.years ended December 31, 2007, 2006 and 2005. Our joint ventures are a key strategic benefit for us as they give us a strong competitive advantage of allowing our customers to work with one supplier for all their substrate and raw material requirements.
Manufacturing, Raw Materials and Supplies
We believe that our results are partially due to our manufacturing efficiency and high product yields and we continually emphasize quality and process control throughout our manufacturing operations. We performmanufacture all of our substrate manufacturing operationsproducts at our facilities in Beijing, China. During 2004, we discontinued our manufacturingChina, which generally has favorable costs for facilities and research and development activities at our Fremont, California facility.labor. We believe that our capital investment and subsequent operating costs are lower for our manufacturing facilities in China relative to the U.S. Many of our manufacturing operations are fully automated and computer monitored or controlled, enhancing reliability and yield.yield, and we expect to continue to improve our processes and increase the number of automated processes in 2008. We use proprietary equipment in our substrate manufacturing operations to protect our intellectual property and control the timing and pace of capacity additions. All of our manufacturing facilities are ISO 9001 or 9002 certified. In January 2006, our Beijing facility successfully passed the ISO 14001 certification audit,audit.
We have five joint ventures in China that provide us favorable pricing, reliable supply and we expectshorter lead-times for raw materials central to receive the final documentationour manufactured productsm including gallium, arsenic, germanium, germanium dioxide, pyrolitic boron nitride crucibles, and boron oxide. We believe that these joint ventures and investments will be advantageous in the first quarter of 2006.
Althoughprocuring materials to support our growth and cost management goals. In addition, we purchase supply parts, components and raw materials from several other domestic and international suppliers, wesuppliers. We depend on a single or limited number of suppliers for certain critical materials used in the production of our substrates, such as quartz tubing, and polishing solutions. We generally purchase these materials through standard purchase orders and not pursuant to long-term supply contracts. Although we seek to maintain sufficient inventory levels of certain materials to guard against interruptions in supply and to meet our near term needs, and have to date been able to obtain sufficient supplies of materials in a timely manner, there may be shortages of certain key materials, such as gallium.
Accordingly, to help ensure continued supply of materials, we formed five joint ventures with and made investments in some suppliers of key raw materials required to manufacture our products, including gallium, arsenic, germanium, germanium dioxide, pyrolitic boron nitride crucibles, and boron oxide. We believe that these joint ventures and investments will be advantageous in procuring materials to support our growth and cost management goals.
We advertise in trade publications, distribute promotional materials, conduct marketing and sales programs, and participate in industry trade shows and conferences in order to raise market awareness of our products.
We sell our substrate products direct to customers through our direct sales force in the U.S. and through independent sales representatives in France, Germany, Japan, South Korea, Taiwan and the United Kingdom. Our direct sales force is knowledgeable in the use of compound and single-element substrates. Our applications engineers work with customers during all stages of the substrate
manufacturing process, from developing the precise composition of the substrate through manufacturing and processing the substrate to the customer’scustomer's specifications. We believe that maintaining a close relationship with customers and providing them with ongoing engineering support improves customer satisfaction and will provide us with a competitive advantage in selling other substrates to our customers. The substrate division launched a program in late 2000 with selected customers in which we guaranteed that certain volumes of six-inch GaAs and other substrates would be delivered on specific dates and the customer made a prepayment for part of the value of the entire order. Several major customers participated in this program. As of December 31, 2005, the unearned pre-payments we retain under this program equaled $125,000. We do not expect to continue this program.
International Sales.International sales are an important part of our business. For the year ended December 31, 2005, salesSales to customers outside North America (primarily United States) accounted for 80.5%80% of our revenue as compared with 78.8% in 2004,2007, 71% of our revenue in 2006 and with 65.4%81% of our revenue in 2003.2005. The primary markets for sales of our substrate products outside of the United States include countriesare to customers located in Asia and Western Europe.
In 2005, we increased our focus in our five joint ventures. In 2006, We also sell through our joint ventures we plan to expand our raw material offering that will includematerials including 4N, 6N, and 7N gallium, boron oxide, (B2O3), germanium, arsenic, germanium dioxide, paralytic boron nitride (pBN) crucibles used in crystal growth and parts for MBE (Molecular Beam Epitaxy). Our joint ventures are a key strategic benefit for us as they give us a strong competitive advantage of allowing our customers to work with one supplier for all their substrate and raw material requirements.
To maintain and improve our competitive position, we focus our research and development efforts on designing new proprietary processes and products, improving the performance of existing products and reducing manufacturing costs. We have assembled a multi-disciplinary team of skilled scientists, engineers and technicians to meet our research and development objectives.
Our current substrate research and development activities focus on continued development and enhancement of GaAs, InP and Ge substrates, including haze reduction, improved yield, enhanced surface and electrical characteristics and uniformity, greater substrate strength and increased crystal length. During 2005,2007, we continued to spend some research and development resources to reduce surface quality problems we experienced with our GaAs and InP substrates for some customers, particularly related to surface morphology. We continue to work on issues related to surface quality.
Research and development expenses were $1.7 million in 2005,2007, compared with $1.5$2.4 million in 20042006 and $1.3$1.7 million in 2003.2005. We expect to maintainmodestly increase our rate of expenditure on research and development costs in 2006.2008 as we explore other methods to grow our crystals.
Research and development at our joint ventures will remain at a minimal level.has been minimal.
The semiconductor substrate industry is characterized by rapid technological change and price erosion, as well as intense foreign and domestic competition. We believe we currently have a leading position in the market for GaAs substrates for HBLED applications primarily as a result of our expertise in VGF technology, overall product quality, response times and prices. However, we face actual and potential competition from a number of established domestic and international companies who may have advantages not available to us.us including substantially greater financial, technical and marketing resources; greater name recognition; and more established relationships in the industry and may utilize these advantages to expand their product offerings more quickly, adapt to new or emerging technologies and changes in customer requirements more quickly, and devote greater resources to the marketing and sale of their products.
We believe that the primary competitive factors in the markets in which our substrate products compete are:
·
- •
- quality;
· - •
- price;
·
- •
- performance;
· - •
- meeting customer specifications; and
· - •
- customer support and satisfaction.
Our ability to compete in target markets also depends on factors such as:
·
- •
- the timing and success of the development and introduction of new products and product features by us and our competitors;
· - •
- the availability of adequate sources of raw materials;
· - •
- protection of our products by effective use of intellectual property laws; and
· - •
- general economic conditions.
A compound semiconductor substrate customer typically has two or three substrates suppliers that it has qualified for the production of its products. These qualified suppliers must meet industry-standard specifications for quality, on-time delivery and customer support. Once a substrate supplier has qualified with a customer, price, consistent quality and current and future product delivery lead times become the most important competitive factors. A supplier that cannot meet customers' current lead times or that a customer perceives will not be able to meet future demand and provide consistent quality can lose current market shares. Our primary competition in the market for compound semiconductor substrates includes China Crystal Technologies, Freiberger Compound Materials, Japan Energy, Mitsubishi Chemical Corporation, and Sumitomo Electric Industries. We believe that at least two of our competitors are shipping high volumes of GaAs substrates manufactured using a technique similar to our VGF technique. In addition, as a result of quality problems that we have experienced, we believe that some customers have allocated some of their requirements for VGF grown substrates across more competitors and we believe that we may have lost revenue and market share as a result of these customer decisions. In addition, we also face competition from compound semiconductor device manufacturers that produce substrates for their own internal use, including Hitachi, and from companies such as IBM that are actively developing alternative compound semiconductor materials.
We are the only compound semiconductor substrate supplier to offer a full suite of raw materials and we believe that it gives us a strong competitive advantage in our marketplace.
Protection of our Intellectual Property
Our success and the competitive position of our VGF technique depend on our ability to maintain trade secrets and other intellectual property protections. We rely on a combination of patents, trademark and trade secret laws, non-disclosure agreements and other intellectual property protection methods to protect our proprietary technology. We believe that, due to the rapid pace of technological innovation in the markets for our products, our ability to establish and maintain a position of technology leadership depends as much on the skills of our development personnel as upon the legal protections afforded our
existing technologies. To protect our trade secrets, we take certain measures to ensure their secrecy, such as executing non-disclosure agreements with our employees, customers and suppliers. However, reliance on trade secrets is only an effective business practice insofar as trade secrets remain undisclosed and a proprietary product or process is not reverse engineered or independently developed.
To date, we have been issued two U.S.US patents and have three U.S. patent applications pending, which relate to our VGF products and processes.processes that expire in 2021 and 2016, respectively. We have twenty-threetwo US patent applications pending, seven foreign patent applications pending (in PCT/Patent Cooperation Treaty ("PCT")/national stage process) in Europe, Canada, China, Japan and South Korea which are based on our U.S.US patents that relate to our VGF processes. We have two issued foreign patents.
In connection with a final settlement of litigation, we entered into a global intellectual property cross-licensing agreement with Sumitomo Electric Industries, Ltd. (SEI). Under the terms of the settlement, we will make on-going royalty payments through 2012 on certain products sold by us in Japan.
In the normal course of business, we periodically receive and make inquiries regarding possible patent infringement. In dealing with such inquiries, it may become necessary or useful for us to obtain or grant licenses or other rights. However, there can be no assurance that such licenses or rights will be available to us on commercially reasonable terms. If weare not able to resolve or settle claims, obtain necessary licenses on commercially reasonable terms and/or successfully prosecute or defend its position, our business, financial condition and results of operations could be materially and adversely affected.
Environmental Regulations
We are subject to federal, state and local environmental laws and regulations, including laws in China as well as the U.S. These laws, rules and regulations govern the use, storage, discharge and disposal of hazardous chemicals during manufacturing, research and development and sales demonstrations. We maintain a number of environmental, health and safety programs that are primarily preventive in nature. As part of these programs, we regularly monitor ongoing compliance. If we fail to comply with applicable regulations, we could be subject to substantial liability for clean-up efforts, personal injury and fines or suspension or cessation of our operations.
As of December 31, 2005,2007, we had 8421,057 employees, of whom 680857 were principally engaged in manufacturing, 116 in sales and administration, and 4684 in research and development. Of these employees, 5538 are located in the U.S., and 7871,019 in China. As of December 31, 2004,2006, we had 1,0101,022 employees, of whom 854819 were principally engaged in manufacturing, 112119 in sales and administration, and 4484 in research and development. Of these employees, 6539 were located in the U.S., 943and 983 in China and 2 in Japan.China.
As a result of shifting more of our substrate manufacturing to China, we continued to reduce our headcount in our Fremont, California facility and accordingly announced our restructuring plan in In December 2005, which would eliminate approximately 15 positions over the next 120 days. Earlier in 2005, we also reduced our workforce at our Beijing, China manufacturing facility as part of our ongoing effort to reduce our cost structureFremont, California facility headcount, we reduced the workforce at the facility by 15 full-time equivalent positions that we no longer required to support production and bring capacity in line with current market demand.operations, or approximately 29% of the workforce based at this facility. Some of our employees in China are represented by a union, but we have never experienced a work stoppage. Although morale has been affected by our workforce reductions in California, we consider our relations with our employees to be good.
Our principal executive offices are located at 4281 Technology Drive, Fremont, CA 94538, and our main telephone number is (510) 683-5900. The public may read and copy any material we file with the Securities and Exchange Commission, or SEC, at the SEC’sSEC's Public Reference Room at 450 Fifth Street, N.W., Washington D.C., 20549. The public may obtain information on the operations of the Public Reference Room by calling the SEC at 1-800-SEC-0330. The SEC maintains an Internet site,http://www.sec.gov, that contains reports, proxy and information statements and other information regarding issuers that file electronically with the SEC.
11 Our web site is www.axt.com. We make available, free of charge, on or through our web site, our annual, quarterly and current reports, and any amendments to those reports as soon as reasonably practicable after those reports are filed with the SEC. The information on our seb site does not constitute a part of this Annual Report on Form 10-K and is not incorporated herein.
For ease of reference, we have divided these risks and uncertainties into the following general categories:
- •
- Risks related to our general business;
- •
- Risks related to international aspects of our business;
- •
- Risks related to our financial results and capital structure;
- •
- Risks related to our intellectual property; and
- •
- Risks related to compliance and other legal matters.
Risks Related to Our General Business
Our operatingThe Chinese Government has indicated that it plans to shutdown polluting factories for nine weeks within a 200 kilometer radius of Beijing to clear the smog for the 2008 Olympics, and if such restrictions are imposed on our facilities, it could materially and adversely impact our results depend in large part on further customer acceptance of operations and our existing substrate products manufactured in China.financial condition.
As Although we are now manufacturing only in China, if the shift of our substrate manufacturing operations to China is to be successful,do not currently believe that we will needhave any of the following restrictions imposed on us, and we currently understand from the Chinese authorities that our customers to qualify products manufactured in China. If weoperations are unable to continue to achieve qualifications for these products, our China facility will be underutilized, our investments in Chinanot a polluting factory and will not be recoupedaffected by these restrictions, the Chinese government has indicated that it plans to shutdown polluting factories for nine weeks from July 17, 2008 through September 20, 2008 within a 200 kilometer radius of Beijing to clear the smog for the 2008 Olympics and weParalympics. The areas reported to be affected include Beijing, Tianjin, Hebei, Shanxi, Inner Mongolia and Shandong provinces. The radius could be expanded by the Chinese Government if the air quality does not improve sufficiently prior to the Olympic Games. In addition, there could be a shut down of material transportation and power plants to clear the air. Some polluting factories have been given time limits to reduce emissions and others will have restricted operations from August 8, 2008 to August 24, 2008. Some companies may have to adjust their production time, some may have to reduce production and some may have to suspend their operations during this period, particularly businesses in heavily-polluting industries of power, iron and steel, chemicals and concrete. If, in the future, restrictions are imposed on our operations, including any requirement to curtail or close production during the Olympic Games, our ability to meet customer demand or supply current or new orders would be unablesignificantly impacted. Customers could then be required to lowerpurchase product from our costs by movingcompetitors, causing our competitors to China.take market share from us, and could result in our customers supplying future needs from our competitors. Land transportation and air transportation of certain raw materials is likely to be restricted during this period as well. Restrictions on material transport could limit our ability to transport our product, and could result in bottlenecks at shipping ports, limiting our ability to deliver products to our customers. We may lose salesincrease our stock of critical materials (such as arsenic, gallium, and other chemicals) for use during the period that these restrictions are likely to last, which will increase our products to competitors who are not manufacturinguse of cash and increase in China, or whose operations in China have already been qualified by customers. If customers do not fully qualify our China production, we may lose additional customers and fail to achieve revenue growth.
Furthermore, some customers reduced their orders from us until our surface quality is as good and consistent as that offered by competitors. As a result, some customers allocated their requirements for compound semiconductor substrates across more competitors and although our quality is improving, resulting in increased sales, we believe that we have lost revenue and market share as a resultinventory level. Any of these customer decisions, which we may be unable to recover. If we are unable to recoverrestrictions could materially and retainadversely impact our market share, we may be unable to growresults of operations and our business.financial condition.
Defects in our products could diminish demand for our products.
Our products are complex and may contain defects. We have experienced quality control problems with somemany of our products, which caused customers to return products to us, reduce orders for our products, or both. Although our quality has improved, resulting in some increases in product sales, we believe that we continue to experience some reduction in orders as a result of our prior product quality problems. If we continue to experience quality control problems, or experience these or other problems in new products, customers may cancel or reduce orders or purchase products from our competitors,
we may be unable to maintain or increase sales to our customers and sales of our products could decline. Defects in our products could cause us to incur higher manufacturing costs and suffer product returns and additional service expenses, all of which could adversely impact our operating results.
If new products developed by us contain defects when released, our customers may be dissatisfied and we may suffer negative publicity or customer claims against us, lose sales or experience delays in market acceptance of our new products.
If we fail to comply with environmental and safety regulations, we may be subject to significant fines or cessation of our operations; in addition, we could be subject to suits for personal injuries caused by hazardous materials.
We are subject to federal, state and local environmental and safety laws and regulations in all of our operating locations, including laws and regulations of China, including, but not limited to, regulations related to the development, manufacture and use of our products, the operation of our facilities, and the use of our real property. These laws, rules and regulations govern the use, storage, discharge and disposal of hazardous chemicals during manufacturing, research and development, and sales demonstrations. If we fail to comply with applicable regulations, we could be subject to substantial liability for clean-up efforts, personal injury and fines or suspension or cessation of our operations, and/or the suspension or termination of development, manufacture or use of certain of our products, or may affect the operation of our facilities or use of our real property, each of which could have a material adverse effect on our business, financial condition and results of operations.
In March 2001, we settled a claim made by the California Occupational Safety and Health Administration, or Cal-OSHA, in an investigation primarily regarding impermissible levels of potentially
hazardous materials in certain areas of our manufacturing facility in Fremont, California for $200,415, and during 2004 we were the target of press allegations and correspondence purportedly on behalf of current and/or former employees concerning our environmental compliance programs and exposure of our employees to hazardous materials. In June 2005, a complaint was filed against us and a current and former officer, alleging personal injury, general negligence, intentional tort, wage loss and other damages, including punitive damages, as a result of exposure of defendants, who are former employees of AXT, including a minor child in utero, to high levels of gallium arsenide in gallium arsenide wafers, and methanol. There is a possibility that other current and/or former employees may bring additional litigation against us. Although we have put in place engineering, administrative and personnel protective equipment programs to address these issues, our ability to expand or continue to operate our present locations could be restricted or we could be required to acquire costly remediation equipment or incur other significant expenses. Existing or future changes in laws or regulations in the United States and China may require us to incur significant expenditures or liabilities, or may restrict our operations. In addition, our employees could be exposed to chemicals or other hazardous materials at our facilities and we may be subject to lawsuits seeking damages for wrongful death or personal injuries allegedly caused by exposure to chemicals or hazardous materials at our facilities.
Litigation is inherently uncertain and while we would expect to defend ourselves vigorously, it is possible that our business, financial condition, results of operations or cash flows could be affected in any particular period by such litigation now pending, and any additional litigation if brought against us.
Existing or future litigation could result in significant judgments against us, or cause us to incur costly settlements.
In June 2005, a complaint was filed against us and a current and former officer, alleging personal injury, general negligence, intentional tort, wage loss and other damages, including punitive damages, as a result of exposure of plaintiffs, who are former employees of AXT, including a minor child in utero, to high levels of gallium arsenide in gallium arsenide wafers, and methanol. In addition, we are defendants in an ongoing securities litigation matter. Litigation is inherently uncertain and while we would expect to defend ourselves vigorously, it is possible that our business, financial condition, results of operations or cash flows could be affected in any particular period by such litigation now pending, and any additional litigation if brought against us. In addition, response to such litigation could divert management’s attention from our business and operations, causing our business and financial results to suffer. We could incur defense or settlement costs in excess of the insurance covering such litigation matters, or such litigation could result in significant judgments against us, in excess of our insurance limits.
Decreases in average selling prices of our products may reduce gross margins.
The market for compound semiconductor substrates is characterized by pressures on average selling prices resulting from factors such as increased competition or overcapacity. We have experienced and expect to continue to experience price pressures on our products, and if average selling prices decline in the future, our revenuesrevenue and gross margins could decline. We may be unable to reduce the cost of our products sufficiently to counteroffset the effect of lower selling prices and allow us to keep pace with competitive pricing pressures, and our margins could be adversely affected.
The loss of one or more of our key substrate customers would significantly hurt our operating results.
A small number of substrate customers have historically accounted for a substantial portion of our total revenue. Our top five customers represented 37.5%, 30.1% and 28.9%33.0% of revenues for the year ended December 31, 2007, 40.0% of revenue for the yearsyear ended December 31, 2005, 2004,2006, and 2003, respectively.37.5% of revenue for the year ended December 31, 2005. We expect that a significant portion of our future revenue will continue to be derived from a limited number of substrate customers. Our customers are not obligated to purchase a specified quantity of our products or to provide us with binding forecasts of
product purchases. In addition, our customers may reduce, delay or cancel orders at any time without any significant penalty, and duringpenalty. In the past, year, we have experienced slower bookings, significant push outspush-outs and cancellation of orders from some customers. If we lose a major customer or if a customer cancels, reduces or delays orders, our revenue would decline. In addition, customers that have accounted for significant revenue in the past may not continue to generate revenue for us in any future period. Any delay in scheduled shipments of our products could cause revenue to fall below our expectations and the expectations of market analysts or investors, causing our stock price to decline.
We may incur claims or other liabilities or obligations related to our failure to follow requirements for testing of products and provision of testing data and information relating to customer requirements. Additionally, customers may cancel or reduce future shipments in response to these failures, or require re-qualifications.
During the first quarter of 2004, we determined that we had not followed requirements for testing of products and provision of testing data and information relating to customer requirements. We notified affected customers concerning our findings, however, there can be no assurance that we will not incur customer claims or other liabilities or obligations in connection with this matter, nor, if we receive any such claims, that we will not have to restate results from prior periods. In addition, revenue in future periods may be adversely impacted if customers decide not to order from us as a result of this disclosure. We experienced several cancellations of future orders by customers pending further information regarding enhancements to our product testing and quality control systems. In addition, some customers are requiring additional qualification of our China operations before placing future orders with us. We cannot be sure that we will not receive additional cancellations of orders by other customers, or fail to win expected future orders from customers, as a result of our disclosure of our investigation conclusions, or that our customers will qualify our China operations and place future orders with us.
Problems incurred by our joint ventures or venture partners could result in a material adverse impact on our financial condition or results of operations
We have invested in five joint venture operations in China that produce products including 99.99% pure gallium (4N Ga), high purity gallium, arsenic, germanium, germanium dioxide, paralytic boron nitride (pBN) crucibles, and boron oxide. We purchase the materials produced by these ventures for our use and sell other portions of their production to third parties. Our ownership interest in these entities ranges from 25 percent to 83 percent. We consolidate the three ventures in which we own a majority interest and employ equity accounting for the two joint ventures in which we have a 25 percent interest. Several of these ventures occupy facilities within larger facilities owned and/or operated by one of the other venture partners. Several of these venture partners are engaged in other manufacturing activities at or near the same facility. In some facilities, we share access to certain functions, including water, treatment of hazardous waste or air quality treatment. If any of our joint venture partners in any of these five ventures experience problems with their operations, disruptions of our joint venture operations could result, having a material adverse effect on the financial condition and results of operation of our joint ventures, and correspondingly on our financial condition or results of operations.
In addition, if any of our joint ventures or venture partners with whom our joint ventures share facilities are deemed to have violated applicable laws, rules or regulations governing the use, storage, discharge or disposal of hazardous chemicals during manufacturing, research and development, or sales demonstrations, the operations of our joint ventures could be adversely affected and we could be subject to substantial liability for clean-up efforts, personal injury and fines or suspension or cessation of our joint venture operations as a result of the actions of the joint ventures or other venture partners. Employees working at the operations of our joint ventures or the operations of any of the other venture partners could bring litigation against us as a result of actions taken at the joint venture or venture partner facilities, even though we are not directly controlling the operations, including actions for exposure to chemicals or other
hazardous materials at the facilities of our joint ventures or the facilities of any venture partner that are shared by our joint ventures. If litigation is brought against us, litigation is inherently uncertain and while we would expect to defend ourselves vigorously, it is possible that our business, financial condition, results of operations or cash flows could be affected in any particular period by such litigation if brought against us, particularly if, as a non-Chinese company, litigation with us is deemed advantageous. Even if we are not deemed responsible for the actions of the joint ventures or venture partners, litigation could be costly, time consuming to defend and divert management attention; in addition, pursuit of us could occur if we are deemed to be the most financially viable of the partners.
Going forward, we believe that investing in additional joint ventures will be important to remaining competitive in our marketplace and ensuring a supply of critical raw materials. However, we may not be able to identify complementary joint venture opportunities or, even once opportunities are identified, we may not be able to reach agreement on the terms of the venture with the other venture partners. Additional joint ventures could cause us to incur contingent liabilities or other expenses, any of which could adversely affect our financial condition and operating results.
Since all of our joint venture activity is expected to occur in China, these activities could subject us to a number of risks associated with conducting operations internationally, including:
• difficulties in managing geographically disparate operations;
• difficulties in enforcing agreements through non-U.S. legal systems;
• unexpected changes in regulatory requirements that may limit our ability to export the venture products or sell into particular jurisdictions or impose multiple conflicting tax laws and regulations;
• political and economic instability, civil unrest or war;
• terrorist activities that impact international commerce;
• difficulties in protecting our intellectual property rights, particularly in countries where the laws and practices do not protect proprietary rights to as great an extent as do the laws and practices of the United States;
• changing laws and policies affecting economic liberalization, foreign investment, currency convertibility or exchange rates, taxation or employment; and
• nationalization of foreign owned assets, including intellectual property.
Intellectual property infringement claims may be costly to resolve and could divert management attention.
Other companies may hold or obtain patents on inventions or may otherwise claim proprietary rights to technology necessary to our business. The markets in which we compete are comprised of competitors who in some cases hold substantial patent portfolios covering aspects of products that could be similar to ours. We could become subject to claims that we are infringing patent, trademark, copyright or other proprietary rights of others. For example, we have previously been involved in two separate lawsuits alleging patent infringement, and could in the future be involved in similar litigation.
The semiconductor industry is cyclical and has experienced a downturn which has adversely impacted our operating results.
Our continuing business depends in significant part upon manufacturers of electronic and opto-electronic semiconductor devices, as well as the current and anticipated market demand for such devices and products using such devices. As a supplier to the semiconductor industry, we are subject to the business cycles that characterize the industry. The timing, length and volatility of these cycles are difficult to predict. The semiconductor industry has historically been cyclical because of sudden changes in demand
for semiconductors, the manufacturing capacity of these semiconductors and changes in the technology employed in the semiconductors. The rate of changes in demand, including end demand, is high, and the effect of these changes upon us occurs quickly, exacerbating the volatility of these cycles. These changes have affected the timing and amounts of customers’ purchases and investments in new technology. These industry cycles create pressure on our revenue, gross margin and net income (loss).
The industry has in the past experienced periods of oversupply that result in significantly reduced demand and prices for semiconductor devices and components, including our products, both as a result of general economic changes and overcapacity. When these periods occur, our operating results and financial condition are adversely affected, and create pressure on our revenue, gross margins and net income (loss). Inventory buildups in telecommunications products and slower than expected sales of computer equipment resulted in overcapacity and led to reduced sales by our customers, and therefore reduced purchases of our products. During periods of weak demand such as those experienced over the past years, customers typically reduce purchases, delay delivery of products and/or cancel orders of component parts such as our products.
Increased price competition has resulted, causing pressure on our net sales, gross margin and net income (loss). We experienced cancellations, price reductions, delays and push outs of orders, which have resulted in reduced revenues. If the economic downturn occurred again, further order cancellations, reductions in order size or delays in orders could occur and would materially adversely affect our business and results of operations. Actions to reduce our costs, such as those we have recently taken, may be insufficient to align our structure with prevailing business conditions. We may be required to undertake additional cost-cutting measures, and may be unable to invest in marketing, research and development and engineering at the levels we believe are necessary to maintain our competitive position. Our failure to make these investments could seriously harm our business.
During periods of increasing demand for semiconductor devices, we must have sufficient manufacturing capacity and inventory to meet customer demand, and must be able to attract, hire, train and retain qualified employees to meet demand. If we are unable to effectively manage our resources and production capacity during an industry upturn, there could be a material adverse effect on our business, financial condition and results of operations.
Our results of operations may suffer if we do not effectively manage our inventory.
We must manage our inventory of component parts, work-in-process and finished goods effectively to meet changing customer requirements, while keeping inventory costs down and improving gross margins. Some of our products and supplies have in the past and may in the future become obsolete while in inventory due to changing customer specifications, or become excess inventory due to decreased demand for our products and an inability to sell the inventory within a foreseeable period. Furthermore, if current costs of production increase or sales prices drop below the standard prices at which we value inventory, we may need to take a charge for a reduction in inventory values. We have in the past including during 2004, had to take inventory valuation and impairment charges. Any future unexpected changes in demand or increases in costs of production that cause us to take additional charges for un-saleable, obsolete or excess inventory, or to reduce inventory values, could adversely affect our results of operations. charges.
The impact of changes in global economic conditions on our customers may cause us to fail to meet expectations, which would negatively impact the price of our stock.
Our operating results can vary significantly based upon the impact of changes in global economic conditions on our customers. The revenue growth and profitability of our business depends on the overall demand for our substrates, and we are particularly dependant on the market conditions for the wireless, solid-state illumination, fiber optics and telecommunications industries. Because our sales are primarily to
major corporate customers whose businesses fluctuate with general economic and business conditions, a softening of demand for products that use our substrates, caused by a weakening economy may result in decreased revenues. Customers may find themselves facing excess inventory from earlier purchases, and may defer or reconsider purchasing products due to the downturn in their business and in the general economy.
If we have low product yields, the shipment of our products may be delayed and our operating results may be adversely impacted.
Our products are manufactured using complex technologies, and the number of usable substrates we can produce can fluctuate as a result of many factors, including:
- •
- contamination of the manufacturing environment;
- •
- substrate breakage;
- •
- equipment failure, power outages or variations in the manufacturing process; and
- •
- performance of personnel involved in the manufacturing process.
If our yields decrease, our revenue could decline if we are unable to produce needed product on time. At the same time, while our manufacturing costs could remain fixed, or could increase. We have experienced product shipment delays and difficulties in achieving acceptable yields on both new and older products, and delays and poor yields have adversely affected our operating results. We may experience similar problems in the future and we cannot predict when they may occur or their severity. In particular, many of our manufacturing processes are new and are still being refined, which can result in lower yields.
If our manufacturing processes result in defects in our products making them unfit for use by our customers, our products would be rejected, resulting in compensation costs paid to our customers, and possible disqualification. This could lead to revenue loss and market share loss.
If we do not successfully develop new products to respond to rapidly changing customer requirements, our ability to generate revenue, obtain new customers, and retain existing customers may suffer.
Our success depends on our ability to offer new products and product features that incorporate leading technology and respond to technological advances. In addition, our new products must meet customer needs and compete effectively on quality, price and performance. The life cycles of our products are difficult to predict because the markets for our products are characterized by rapid technological change, changing customer needs and evolving industry standards. If our competitors introduce products employing new technologies or performance characteristics, our existing products could become obsolete and unmarketable. During the past twothree years, we have seen our competitors selling more substrates manufactured using a crystal growth technology similar to ours, which has eroded our technological differentiation. Other companies, including Triquent, are actively developing substrate materials that could be used to manufacture devices that could provide the same high-performance, low-power capabilities as GaAs- and InP-based devices at competitive prices. If these substrate materials or VGF-derived products are successfully developed and semiconductor device manufacturers adopt them, demand for our GaAs substrates could decline and our revenue could suffer.
The development of new products can be a highly complex process, and we may experience delays in developing and introducing new products. Any significant delays could cause us to fail to timely introduce and gain market acceptance of new products. Further, the costs involved in researching, developing and engineering new products could be greater than anticipated. If we fail to offer new products or product enhancements or fail to achieve higher quality products, we may not generate sufficient revenue to offset our development costs and other expenses or meet our customers’customers' requirements.
17
Intense competition in the markets for our products could prevent us from increasing revenue and sustaining profitability.
The markets for our products are intensely competitive. We face competition for our substrate products from other manufacturers of substrates, such as Freiberger Compound Materials, Hitachi Cable Japan Energy and Sumitomo Electric, and from semiconductor device manufacturers that produce substrates for their own use, and from companies, such as Triquent, that are actively developing alternative materials to GaAs and somemarketing semiconductor devices are being marketed using these alternative materials. We believe that at least two of our major competitors are shipping high volumes of GaAs substrates manufactured using a
technique similar to our VGF technique. Other competitors may develop and begin using similar technology. If we are unable to compete effectively, our revenue may not increase and we may be unable to bebecome profitable. We face many competitors that have a number of significant advantages over us, including:
Our competitors could develop new or enhanced products that are more effective than our products are.
The level and intensity of competition has increased over the past year and we expect competition to continue to increase in the future. Competitive pressures caused by the current economic conditions have resulted in reductions in the prices of our products, and continued or increased competition could reduce our market share, require us to further reduce the prices of our products, affect our ability to recover costs orand result in reduced gross margins.
In addition, new competitors have and may continue to emerge, such as a small crystal growing company established by a former employee of ours in China that is supplying ingots to the market. While new competitors such as this company currently do not appear to be fully competitive, competition from sources such as this could increase, particularly if these competitors are able to obtain large capital investments.
Demand for our products may decrease if our customers experience difficulty manufacturing, marketing or selling their products.
Our products are used as components in our customers’customers' products. Accordingly, demand for our products is subject to factors affecting the ability of our customers to successfully introduce and market their products successfully, including:
If demand for the end userend-user applications for which our products are used decreases, or our customers are unable to develop, market and sell their products, demand for our products will decrease.
The financial condition of our customers may affect their ability to pay amounts owed to us.
Many of our customers are facing business downturns that have reduced their cash balances and their prospects. We frequently allow our customers extended payment terms after shipping products to pay for products we ship to them within 30 to 120 days after delivery.them. Subsequent to our shipping a product, some customers have been unable to make payments aswhen due, reducing our cash balances and causing us to incur charges to allow for a possibility that some
accounts might not be paid. During 2004, a customer of one agent filed for bankruptcy protection. We incurred a charge equal to the amount owed us and believe that there is a substantial likelihood that we will not be able to recoup any of this amount. Other customersCustomers may also be forced to file for bankruptcy. If our
customers do not pay their accounts when due, we will be required to incur charges that would reduce our earnings.
We purchase critical raw materials and parts for our equipment from single or limited sources, and could lose sales if these sources fail to fill our needs.
We depend on a limited number of suppliers for certain raw materials, components and equipment used in manufacturing our products, including key materials such as quartz tubing, polishing solutions and paralytic boron nitride. Although several of these raw materials are purchased from suppliers in whomwhich we hold an ownership interest, we generally purchase these materials through standard purchase orders and not pursuant to long-term supply contracts and no supplier guarantees supply of raw materials or equipment to us. If we lose any of our key suppliers, our manufacturing efforts could be significantly hampered and we could be prevented from timely producing and delivering products to our customers. We havePrior to investing in the pastour raw material joint ventures, we sometimes experienced delays obtaining critical raw materials and spare parts, including gallium, due to shortages of these materials. Although we hope to alleviate some of thesematerials and could experience such delays and shortages as a result of our interestsagain in our joint ventures, we may experience delaysthe future due to shortages of materials and may be unable to obtain an adequate supply of materials. These shortages and delays could result in higher materials costs and cause us to delay or reduce production of our products. If we have to delay or reduce production, we could fail to meet customer delivery schedules and our revenue and operating results could suffer.
We have made and may continue to make strategic investments in raw materials suppliers, which may not be successful and may result in the loss of all or part of our investment.
We have made investments through our five joint ventures in raw material suppliers in China, thatwhich provide us with opportunities to gain supplysupplies of key raw materials that are important to our substrate business. These affiliates each have a market beyond that provided by us. We do not have influence over all of these companies, each of which is located in China, and in some we have made only a strategic, minority investment. We may not be successful in achieving the financial, technological or commercial advantage upon which any given investment is premised, and we could end up losing all or part of our investment.
Our substrate products have a long qualification cycle that makes it difficult to plan our expenses and forecast our results.
Customers typically place orders with us for our substrate products three months to a year or more after our initial contact with them. The sale of our products may be subject to delays due to our customers’customers' lengthy internal budgeting, approval and evaluation processes. During this time, we may incur substantial expenses and expend sales, marketing and management efforts while the customers evaluate our products. These expenditures may not result in sales of our products. If we do not achieve anticipated sales in a period as expected, we may experience an unplanned shortfall in our revenue. As a result, we may not be able to cover expenses, causing our operating results to vary. In addition, if a customer decides not to incorporate our products into its initial design, we may not have another opportunity to sell products to this customer for many months or even years. In the current competitive and economic climate, the average sales cycle for our products has lengthened even further and is expected to continue to make it difficult to accurately forecast our future sales.sales accurately. We anticipate that sales of any future substrate products will also have lengthy sales cycles and will, therefore, be subject to risks substantially similar to those inherent in the lengthy sales cyclecycles of our current substrate products.
Risks Related to International Aspects of Our Business
Changes in tariffs, import restrictions, export restrictions or other trade barriers may reduce gross margins.
We may incur increases in costs due to changes in tariffs, import or export restrictions, or other trade barriers, or unexpected changes in regulatory requirements, any of which could reduce our gross margins. For example, in 2006, tax authorities in the PRC changed the treatment of refunds of value-added taxes that companies pay when they purchase certain raw materials, including gallium and arsenic. The cumulative effect is that our PRC joint venture companies no longer receive a refund of value-added tax for exports of gallium or arsenic, including certain shipments to our wholly-owned PRC subsidiary that are treated as exports under PRC tax regulations. Given the relatively fluid regulatory environment in the PRC, there could be additional tax or other regulatory changes in the future. Any such changes could directly and materially adversely impact our financial results and general business condition.
Our operating results depend in large part on continued customer acceptance of our substrate products manufactured in China and continued improvements in product quality.
We manufacture all of our products in China, and source most of our raw materials in China. Accordingly, we continue to seek customer qualification of our China-manufactured products. In addition, we have in the past experienced quality problems with our China-manufactured products. Our previous quality problems caused us to lose market share to our competitors, as some customers reduced their orders from us until our surface quality was as good and consistent as that offered by competitors and customers allocated their requirements for compound semiconductor substrates across more competitors. If we are unable to protectcontinue to achieve customer qualifications for our products, or if we again experience quality problems, customers may not increase purchases of our products, our China facility will become underutilized, and we will be unable to achieve expected revenue growth. We may again lose sales of our products to competitors and experience loss of market share. If we are unable to recover and retain our market share, we may be unable to grow our business.
Problems incurred by our joint ventures or venture partners could result in a material adverse impact on our financial condition or results of operations.
We have invested in five joint venture operations in China that produce products including 99.99% pure gallium (4N Ga), high purity gallium, arsenic, germanium, germanium dioxide, paralytic boron nitride (pBN) crucibles and boron oxide. We purchase a portion of the materials produced by these ventures for our use and sell the remainder of their production to third parties. Our ownership interest in these entities ranges from 25% to 83%. We consolidate the three ventures in which we own a majority or controlling financial interest and employ equity accounting for the two joint ventures in which we have a 25% interest. Several of these ventures occupy space within larger facilities owned and/or operated by one of the other venture partners. Several of these venture partners are engaged in other manufacturing activities at or near the same facility. In some facilities, we share access to certain functions, including water, hazardous waste treatment or air quality treatment. If any of our joint venture partners in any of these five ventures experiences problems with its operations, disruptions of our joint venture operations could result, having a material adverse effect on the financial condition and results of operation of our joint ventures, and correspondingly on our financial condition or results of operations.
In addition, if any of our joint ventures or venture partners with which our joint ventures share facilities is deemed to have violated applicable laws, rules or regulations governing the use, storage, discharge or disposal of hazardous chemicals during manufacturing, research and development, or sales demonstrations, the operations of our joint ventures could be adversely affected and we could be subject to substantial liability for clean-up efforts, personal injury and fines or suspension or cessation
of our joint venture operations as a result of the actions of the joint ventures or other venture partners. Employees working for our joint ventures or any of the other venture partners could bring litigation against us as a result of actions taken at the joint venture or venture partner facilities, even though we are not directly controlling the operations, including actions for exposure to chemicals or other hazardous materials at the facilities of our joint ventures or the facilities of any venture partner that are shared by our joint ventures. If litigation is brought against us, litigation is inherently uncertain and, while we would expect to defend ourselves vigorously, it is possible that our business, financial condition, results of operations or cash flows could be affected in any particular period by any litigation if brought against us, particularly if litigation with us, as a non-Chinese company, is deemed advantageous. Even if we are not deemed responsible for the actions of the joint ventures or venture partners, litigation could be costly, time consuming to defend and divert management attention; in addition, pursuit of us could occur if we are deemed to be the most financially viable of the partners.
Going forward, we believe that investing in additional joint ventures will be important to remaining competitive in our marketplace and ensuring a supply of critical raw materials. However, we may not be able to identify complementary joint venture opportunities or, even once opportunities are identified, we may not be able to reach agreement on the terms of the venture with the other venture partners. Additional joint ventures could cause us to incur contingent liabilities or other expenses, any of which could adversely affect our financial condition and operating results.
Since all of our joint venture activity is expected to occur in China, these activities could subject us to a number of risks associated with conducting operations internationally, including:
- •
- difficulties in managing geographically disparate operations;
- •
- difficulties in enforcing agreements through non-U.S. legal systems;
- •
- unexpected changes in regulatory requirements that may limit our ability to export the venture products or sell into particular jurisdictions or impose multiple conflicting tax laws and regulations;
- •
- political and economic instability, civil unrest or war;
- •
- terrorist activities that impact international commerce;
- •
- difficulties in protecting our intellectual property
we may lose valuable assets or incur costly litigation.We rely on a combination of patents, copyrights, trademark and trade secret laws, non-disclosure agreements and other intellectual property protection methods to protect our proprietary technology. However, we believe that, due to the rapid pace of technological innovationrights, particularly inthe markets for our products, our ability to establish and maintain a position of technology leadership also depends on the skills of our development personnel.Despite our efforts to protect our intellectual property, a third party could develop products or processes similar to ours. Our means of protecting our proprietary rights may not be adequate and our competitors may independently develop similar technology, duplicate our products or design around our patents. We believe that at least two of our competitors have begun to ship GaAs substrates produced using a process similar to our VGF technique. Our competitors may also develop and patent improvements to the VGF technology upon which we rely, and thus may limit any exclusivity we enjoy by virtue of our patents or trade secrets.It is possible that pending or future United States or foreign patent applications made by us will not be approved, that our issued patents will not protect our intellectual property, or that third parties will challenge the ownership rights or the validity of our patents. In addition,countries where the lawsof some foreign countries mayand practices do not protectourproprietary rights to as great an extent as do the laws and practices of the UnitedStatesStates; - •
- changing laws and
itpolicies affecting economic liberalization, foreign investment, currency convertibility or exchange rates, taxation or employment; and - •
- nationalization of foreign-owned assets, including intellectual property.
Changes in global economic conditions on our customers may be more difficult to monitoradversely impact us, resulting in a decline in our revenue and profitability.
Our operating results can vary significantly based upon the useimpact of changes in global economic conditions on our customers. The revenue growth and profitability of our intellectual property. Our competitorsbusiness depends on the overall demand for our substrates, and we are particularly dependent on the market conditions for the wireless, solid-state illumination, fiber optics and telecommunications industries. Because our sales are primarily to major corporate customers whose businesses fluctuate with general economic and business conditions, a softening of demand for products that use our substrates, caused by a weakening economy, may be able to legitimately ascertain non-patented proprietary technology embeddedresult in our systems. If this occurs, wedecreased revenue. Customers may not be able to prevent the development of technology substantially similar to ours.
We may have to resort to costly litigation to enforce our intellectual property rights, to protect our trade secrets or know-how or to determine their scope, validity or enforceability. Enforcing or defending our proprietary technology is expensive, could cause us to divert resourcesfind themselves facing excess inventory from earlier purchases, and may not prove successful. Our protective measures may prove inadequatedefer or reconsider purchasing products due to protect our proprietary rights,the downturn in their business and if we fail to enforce or protect our rights, we could lose valuable assets.
For example, we have recently been involved in litigation with Sumitomo Electric Industries, Ltd. (“SEI”) in Japan as well as interference actions in the United States. We and SEI approved a settlement of this litigation during the fourth quarter of 2004 and the litigation was withdrawn and we abandoned the interference proceeding. We incurred an initial charge of approximately $1.4 million and will have to pay ongoing royalties to SEI on certain of our products.general economy.
We derive a significant portion of our revenue from international sales, and our ability to sustain and increase our international sales involves significant risks.
Our revenue growth depends in part on the expansion of our international sales and operations. International sales represented 81%80%, 71% and 79%81% of our total revenue for the years ended December 31, 20052007, 2006 and 2004,2005, respectively. We expect that sales to customers outside the U.S., particularly sales to customers in Asia, will continue to represent a significant portion of our revenue, particularly sales to customers in Asia.revenue.
Currently, an increasing percentage of our sales areis to customers headquartered in Asia. CertainAll of our manufacturing facilities and some of our suppliers are also located outside the U.S. Managing our globaloverseas operations presents challenges, including periodic regional economic downturns, trade balance issues, varying business conditions and demands, political instability, variations in enforcement of intellectual property and contract rights in different jurisdictions, differences in the ability to develop relationships with suppliers and other local businesses, changes in U.S. and international laws and regulations including U.S. export restrictions, fluctuations in interest and currency exchange rates, the ability to provide sufficient levels of technical support in different locations, cultural differences, shipping delays and terrorist acts or acts of war, among other risks. Many of these challenges are present in China, which
represents a large potential market for semiconductor equipmentdevices and where we anticipate significant opportunity for growth. Global uncertainties with respect to: (i) economic growth rates in various countries; (ii) sustainability of demand for electronics products; (iii) capital spending by semiconductor manufacturers; (iv) price weakness for certain semiconductor devices; and (v) political instability in regions where we have operations may also affect our business, financial condition and results of operations.
Our dependence on international sales involves a number of risks, including:
Our sales are denominated in U.S. dollars, except for sales to our Japanese and some Taiwanese customers, which are denominated in Japanese yen. Thus, increases in the value of the U.S. dollar could increase the price of our products in non-U.S. markets and make our products more expensive than competitors’competitors' products in these markets.
Also, denominating some sales in Japanese yen subjects us to fluctuations in the exchange rates between the U.S. dollar and the Japanese yen. The functional currenciescurrency of our Chinese subsidiaries aresubsidiary and joint ventures is the local currencies.currency. We incur transaction gains or losses resulting from consolidation of expenses incurred in local currencies for these subsidiaries,entities, as well as in translation of the assets and liabilities of thesetheir assets at each balance sheet date. If we do not effectively manage the risks associated with international sales, our revenue, cash flows and financial condition could be adversely affected.
Because ofIf there are power shortages in China,the PRC, we may have to temporarily close our China operations, which would adversely impact our ability to manufacture our products and meet customer orders, and would result in reduced revenues.revenue.
The In the past, the Chinese government has faced a power crunch over the summer of 2004 and reported thatshortage resulting in power demand in 24 provinces outstrippedoutstripping supply in peak periods during the first four months of 2004.periods. Instability in electrical supply in past years has caused sporadic outages among residential and commercial consumers. As a result,consumers causing the Chinese government implementedto implement tough measures in 2004 to ease the energy shortage. Provinces imposed power brownouts during 2004 to reduce electricity demandshortage, and some companies in Beijing were ordered to give their employees a week off to ease the pressure on power supply. The plants, most of which are state-owned, were closed and reopened on a staggered schedule to reduce power consumption during the capital’s hottest months during 2004. Asas a result, we closed most of our operations for a week in late July 2004 in conformance with this policy. Although
In 2006 we were able to switch the electrical supply for our manufacturing facility onto the same power grid as that used by vital PRC government services such as hospitals and police. However, if even despite this switch, further problems with power shortages requiring closure of facilities did not occur during summer 2005, ifare incurred in the future, and we are required to make additional temporary closures of our Beijingsubsidiary and joint venture operations, at any time during 2006, we may be unable to manufacture our products, and would then be unable to meet customer orders except from inventory on hand. As a result, weour revenue could lose sales,be adversely impacting our revenues,impacted, and our relationships with our customers could suffer, impacting our ability to generate future sales.revenue. In addition, if power is shut off at our Beijing operationssubsidiary at any time, either voluntarily or as a result of unplanned brownouts, during certain phases of our manufacturing process including our crystal growth phase, the work in process may be ruined and rendered unusable, causing us to incur expense that will not be covered by revenue, and negatively impacting our cost of goods soldrevenue and
gross margins. We are attempting to partially mitigate the potential effects of power outages by building inventory in anticipation of power outages during the summer. This inventory build is prepared to accommodate forecast demand rather specific customer orders. If the inventory we build is not ordered by customers, we may have to scrap these products and incur a cost which will reduce our gross margins.
We need to continue to improve or implement our systems, procedures and controls and may not receive a favorable attestation report on our internal control systems by our independent registered public accounting firm.
The requirements adopted by the Securities and Exchange Commission, or SEC, in response to the passage of the Sarbanes-Oxley Act of 2002 will require annual review and evaluation of our internal control systems, and an attestation of these systems by our independent registered public accounting firm beginning with our fiscal year ending December 31, 2007. This may be due earlier beginning with our fiscal year ending December 31, 2006 if our market capitalization increases above $75 million on the determining date on June 30, 2006. We are currently reviewing our internal control procedures and considering further documentation of such procedures that may be necessary. We are currently evaluating the extent to which any of our joint ventures may also be required to comply, if at all. We can give no assurances that our systems will satisfy the new requirements of the Securities and Exchange Commission, or if required, that any of the systems of our joint ventures will meet such requirements, or that we will receive a favorable review and attestation by our independent registered public accounting firm.
In addition, the shift of our manufacturing operations to China has placed and continues to place a significant strain on our operations and management resources. We have upgraded our inventory control systems and may implement additional systems relating to consolidation of our financial results, but continue to rely on certain manual processes in our operations and in connection with consolidation of our financial results. If we fail to manage these changes effectively, our operations may be disrupted.
To manage our business effectively, we may need to implement additional and improved management information systems, further develop our operating, administrative, financial and accounting systems and controls, add experienced senior level managers, and maintain close coordination among our executive, engineering, accounting, marketing, sales and operations organizations.
Legislative actions, higher insurance costs and potential new accounting pronouncements are likely to cause our general and administrative expenses to increase and impact our future financial position and results of operations.
In order to comply with rules and regulations adopted pursuant to the Sarbanes-Oxley Act of 2002 by the SEC, as well as changes to listing standards adopted by NASDAQ, and accounting changes adopted affecting accounting for stock-based compensation we may be required to increase our internal controls, hire additional personnel and additional outside legal, accounting and advisory services, all of which will cause our general and administrative costs to increase. Insurers may increase premiums as a result of the high claims rates they incurred over the past year. Changes in the accounting rules, including legislative and other rules to account for employee stock options as a compensation expense among others, could materially increase the expense that we report under generally accepted accounting principles and adversely affect our operating results.
22
If we fail to manage periodic contractions, we may utilize our cash balances and our existing cash and cash equivalent balances could decline.
We anticipate that our existing cash resources will fund any anticipated operating losses, purchases of capital equipment and provide adequate working capital for the next twelve months. However, our liquidity is affected by many factors including, among others, the extent to which we pursue additional capital expenditures, the level of our production, and other factors related to the uncertainties of the industry and global economies. If we fail to manage our contractions successfully we may draw down our cash reserves, which would adversely affect our operating results and financial condition, reduce our value and may impinge our ability to raise debt and equity funding in the future, at a time when we may be required to raise additional cash. Accordingly, there can be no assurance that events in the future will not require us to seek additional capital, or, if so required, that such capital will be available on terms acceptable to us, if at all. As part of our effort to reduce costs, we may lose key staff, production resources, and technology that we will need to grow when end markets recover. These events could reduce our ability to grow profitably as markets recover.
Changes in China’sChina's political, social and economic environment may affect our financial performance.
Our financial performance may be affected by changes in China’sChina's political, social and economic environment. The role of the Chinese central and local governments in the Chinese economy is significant. Chinese policies toward economic liberalization, and laws and policies affecting technology companies, foreign investment, currency exchange rates and other matters could change, resulting in greater restrictions on our ability to do business and operate our manufacturing facilities in China. Any imposition of surcharges or any increase in Chinese tax rates or reduction or elimination of Chinese tax benefits could hurt our operating results. The Chinese government could revoke, terminate or suspend our license for national security and similar reasons without compensation to us. If the government of China were to take any of these actions, we would be prevented from conducting all or part of our business. Any failure on our part to comply with governmental regulations could result in the loss of our ability to manufacture our products in China.
China has from time to time experienced instances of civil unrest and hostilities. Confrontations have occurred between the military and civilians. Events of this nature could influence the Chinese economy, result in nationalization of foreign-owned operations such as ours, and could negatively affect our ability to operate our facilities in China.
We may face additional risks as a result of the revaluation of the Chinese currency.
In July 2005, the People’s Republic of China agreed to a shift in Chinese currency policy andpolicy. It established a 2% revaluation of the renminbi and referenced the renminbi will now be referenced to a basket of currencies, with a daily trading band of +/-0.3%. Depending on market conditions and the state of the Chinese economy, it is possible that China will make more adjustments in the future. Over the next five to ten years, China may move to a managed float system, with opportunistic interventions. This reserve diversification may negatively impact the United States dollar and U.S. interest rates, which, could in turn, could negatively impact the Company’sour operating results and financial condition. A significant percentage of our sales are made to customers located outside of the United States, particularly Asia. Our sales are denominated in U.S. dollars, except for sales to our Japanese and some Taiwanese customers, which are denominated in Japanese yen. Thus, increases in the value of the U.S. dollar could increase the price of our products in non-U.S. markets and make our products more expensive than competitors’ products in these markets. The functional currenciescurrency of our Chinese subsidiaries,subsidiary, including our joint ventures, areis the local currency; since most of our operations are conducted in China, manymost of our costs are incurred in Chinese currency, which subjects us to fluctuations in the exchange rates between the U.S. dollar and the Chinese renminbi. We incur transaction gains or losses resulting from consolidation of expenses incurred in local currencies for these subsidiaries, as well as in translation of the assets and liabilities of these assets
at each balance sheet date. These risks may be increased by the fluctuation and revaluation of the Chinese renminbi. If we do not effectively manage the risks associated with this currency risk, our revenue, cash flows and financial condition could be adversely affected.
A reoccurrence of Severe Acute Respiratory Syndrome (SARS) or the outbreak of a different contagious diseasesuchdisease such as the Avian Flu may adversely impact our manufacturing operations and some of our key suppliers and customers.
The majority of our substrate manufacturing activities are conducted in China. In addition, we source key raw materials, including gallium, from our joint ventures and other suppliers in China. The 2003 SARS outbreak was most notable in China and a small number of cases were reported in 2004. Oneone employee at our LED production facility in China contracted SARS, in late April 2003 prompting us to close the facility for ten days. There was no significant impact to our ability to fill customer orders. If there were to be another outbreakAny reoccurrence of SARS or a different contagious disease, such as Avian Flu and if our employees contracted the disease, we may be requiredcause us to temporarily close our manufacturing operations.operations if any of our employees are again affected. Similarly, if one of our key suppliers is required to close for an extended period, we maymight not have enough raw material inventory to continue manufacturing operations. In addition, while we possess management skills among our China staff that enable us to maintain our manufacturing operations with minimal on-site supervision from our US-based staff, our business could also be harmed if travel to or from Asia and the United States is restricted or inadvisable, as it was during parts of 2003. None of our substrate competitors is as dependent on manufacturing facilities in China as we are. If our manufacturing operations were closed for a significant period, we could lose revenue and market share during that period, which would depress our financial performance and could be difficult to recapture. Finally, if one of our key customers is required to close for an extended period, we maymight not be able to ship product to them, our revenue would decline and our financial performance would suffer.
Risks Related to Our Financial Results and Capital Structure
The compound semiconductor industry is cyclical and has experienced a downturn which has adversely impacted our operating results.
Our continuing business depends in significant part upon manufacturers of electronic and opto-electronic compound semiconductor devices, as well as the current and anticipated market demand for these devices and products using these devices. As a supplier to the compound semiconductor industry, we are subject to the business cycles that characterize the industry. The timing, length and volatility of these cycles are difficult to predict. The compound semiconductor industry has historically been cyclical because of sudden changes in demand, the amount of manufacturing capacity and changes in the technology employed in compound semiconductors. The rate of changes in demand, including end demand, is high, and the effect of terrorist threatsthese changes upon us occurs quickly, exacerbating the volatility of these cycles. These changes have affected the timing and actionsamounts of customers' purchases and investments in new technology. These industry cycles create pressure on our revenue, gross margin and net income.
The industry has in the general economy could decrease our revenues.
The United States continues to be on alertpast experienced periods of oversupply that result in significantly reduced demand and prices for terrorist activity. The potential near-compound semiconductor devices and long-term impact terrorist activities may have in regards to our suppliers, customers and markets forcomponents, including our products, both as a result of general economic changes and the U.S. economy are uncertain. There may be embargos of ports or products, or destruction of shipments or our facilities, or attacks that affect our personnel. There may be other potential adverse effects onovercapacity. When these periods occur and our operating results dueand financial condition are adversely affected, oversupply creates pressure on our revenue, gross margins and net income (loss). Inventory buildups in telecommunications products and slower than expected sales of computer equipment resulted in overcapacity and led to a significant event that we cannot foresee. Since we perform substantially allreduced sales by our customers, and therefore reduced purchases of our manufacturing operations in China, and a significant portionproducts. During periods of our customers are located outside of the Untied States, terrorist activity or threats against US-owned enterprise are a particular concern to us.
If any of our facilities is damaged by actionsweak demand such as fire, explosion, those experienced historically, customers typically reduce purchases, delay delivery of products and/or natural disaster,cancel orders of component parts such as our products. Increased price competition has resulted, causing pressure on our net sales, gross margin and net income (loss). We experienced cancellations, price reductions, delays and push-outs of orders, which have resulted in reduced revenue. If the economic downturn occurred again, further order cancellations, reductions in order size or delays in orders could occur and would materially adversely affect our business and results of operations. Actions to reduce our costs, such as those we have recently taken, may notbe insufficient to align our structure with prevailing business conditions. We may be required to undertake additional cost-cutting measures, and may be unable to invest in marketing, research and development and engineering at the levels we
believe are necessary to maintain our competitive position. Our failure to make these investments could seriously harm our business.
During periods of increasing demand for compound semiconductor devices, we must have sufficient manufacturing capacity and inventory to meet customer demand, and must be able to manufactureattract, hire, train and retain qualified employees to meet demand. We must effectively manage our products.
The ongoing operation of our manufacturingresources and production facilities in China is critical to our abilitycapacity to meet rapidly changing demand. During periods of decreasing demand, for our products. If we are not able to use all or a significant portion of our facilities for prolonged periods for any reason, we will notmust be able to manufacture products forappropriately align our customers. For example, a natural disaster, fire or explosion caused bycost structure with prevailing market conditions, motivate and retain key employees and effectively manage our usesupply chain. During periods of combustible chemicalsincreasing demand, we must have sufficient manufacturing capacity and high temperatures during our manufacturing processes would render some or all of our facilities inoperable for an indefinite period of time. Actions outside of our control, such as earthquakes, could also damage our facilities, rendering them inoperable.inventory to meet customer demand. If we are unable to operateeffectively manage our facilitiesresources and manufactureproduction capacity during an industry upturn, there could be a material adverse effect on our products,business, financial condition and results of operations.
If we fail to manage periodic contractions, we may utilize our cash balances, resulting in the decline of our existing cash, cash equivalents and investment balances.
We anticipate that our existing cash resources will fund our operations and purchases of capital equipment, as well as provide adequate working capital for the next twelve months. However, our liquidity is affected by many factors including, among others, the extent to which we pursue additional capital expenditures, the level of our production, and other factors related to the uncertainties of the industry and global economies. If we fail to manage our contractions successfully we may draw down our cash reserves, which would adversely affect our operating results and financial condition, reduce our value and possibly impinge our ability to raise debt and equity funding in the future, at a time when we might be required to raise additional cash. Accordingly, there can be no assurance that events in the future will not require us to seek additional capital or, if required, that such capital would be available on terms acceptable to us, if at all. As part of our effort to reduce costs, we may lose key staff, production resources and technology that we will lose customers and revenue andneed to grow when end markets recover. These events could reduce our business will be harmed.ability to grow profitably as markets recover.
Unpredictable fluctuations in our operating results could disappoint analysts or our investors, which could cause our stock price to decline.
We have not over the past year been able to sustain growth, and may not be able to return to historic growth levels in the current economic environment. Our net loss in 2002 was the largest in our history and our losses continued during 2003, 2004, and 2005.
We haveexperienced and may continue to experience significant fluctuations in our revenue and earnings. Our quarterly and annual revenue and operating results have varied significantly in the past and may vary significantly in the future due to a number of factors, including:
orders once made;
- •
- increases in our expenses, including expenses for research and development.
Due to these factors, we believe that period-to-period comparisons of our operating results may not be meaningful indicators of our future performance. Our operating results have over the past year at times been below the expectations of securities analysts or investors. If this occurs again in future periods, the price of our common stock could decline or fluctuate.
A substantial percentage of our operating expenses areis fixed in the short term, and we may be unable to adjust spending to compensate for an unexpected shortfall in revenues.revenue. As a result, any delay in generating revenue could cause our operating results to be below the expectations of market analysts or investors, which could also cause our stock price to fall.
Our stock price has been and may continue to be volatile.
Our stock price has fluctuated significantly since we began trading on the NASDAQ National Market. For the year ended December 31, 2005, the high and low closing sales prices of our common stock were $2.47 and $1.08, respectively. A number of factors could cause the price of our common stock to continue to fluctuate substantially, including:
• actual or anticipated fluctuations in our quarterly or annual operating results;
• changes in expectations about our future financial performance or changes in financial estimates of securities analysts;
• announcements of technological innovations by us or our competitors;
• new product introduction by us or our competitors;
• large customer orders or order cancellations; and
• the operating and stock price performance of comparable companies.
In addition, the stock market in general has experienced extreme volatility that often has been unrelated to the operating performance of particular companies. These broad market and industry fluctuations may adversely affect the trading price of our common stock, regardless of our actual operating performance.
We have adopted certain anti-takeover measures that may make it more difficult for a third party to acquire us.
Our board of directors has the authority to issue up to 2,000,000 shares of preferred stock and to determine the price, rights, preferences and privileges of those shares without any further vote or action by the stockholders. The rights of the holders of common stock will be subject to, and may be adversely affected by, the rights of the holders of any preferred stock that may be issued in the future. The issuance of shares of preferred stock while potentially providing desirable flexibility in connection with possible acquisitions and for other corporate purposes, could have the effect of making it more difficult for a third party to acquire a majority of our outstanding voting stock. We have no present intention to issue additional shares of preferred stock.
We have adopted a preferred stock purchase rights plan intended to guard against certain takeover tactics. The adoption of this plan was not in response to any proposal to acquire us, and the board is not aware of any such effort. The existence of this plan could also have the effect of making it more difficult for a third party to acquire a majority of our outstanding voting stock. In addition, certain provisions of our certificate of incorporation may have the effect of delaying or preventing a change of control, which could adversely affect the market price of our common stock.
In addition, provisions in our amended and restated certificate of incorporation and amended and restated bylaws may have the effect of delaying or preventing a merger, acquisition or change of control, of us, or changes in our management, including:which could adversely affect the market price of our common stock. The following are some examples of these provision:
and
•
Furthermore, because we are incorporated in Delaware, we are subject to the provisions of Section 203 of the Delaware General Corporation Law. These provisions prohibit large stockholders, in particular those owning 15% or more of the outstanding voting stock, from consummating a merger or combination with a corporation unless:
- •
•662¤/3% of the shares of voting stock not owned by these large stockholders approve the merger or combination, or- •
- the board of directors approves the merger or combination or the transaction which resulted in the large stockholder owning 15% or more of our outstanding voting stock.
Risks Related to Our Intellectual Property
26Intellectual property infringement claims may be costly to resolve and could divert management attention.
Other companies may hold or obtain patents on inventions or may otherwise claim proprietary rights to technology necessary to our business. The markets in which we compete are comprised of
competitors that in some cases hold substantial patent portfolios covering aspects of products that could be similar to ours. We could become subject to claims that we are infringing patent, trademark, copyright or other proprietary rights of others. For example, we have in the past been involved in two separate lawsuits alleging patent infringement, and could in the future be involved in similar litigation.
If we are unable to protect our intellectual property, we may lose valuable assets or incur costly litigation.
We rely on a combination of patents, copyrights, trademark and trade secret laws, non-disclosure agreements and other intellectual property protection methods to protect our proprietary technology. However, we believe that, due to the rapid pace of technological innovation in the markets for our products, our ability to establish and maintain a position of technology leadership also depends on the skills of our development personnel. Despite our efforts to protect our intellectual property, third parties can develop products or processes similar to ours. Our means of protecting our proprietary rights may not be adequate, and our competitors may independently develop similar technology, duplicate our products or design around our patents. We believe that at least two of our competitors have begun to ship GaAs substrates produced using a process similar to our VGF technique. Our competitors may also develop and patent improvements to the VGF technology upon which we rely, and thus may limit any exclusivity we enjoy by virtue of our patents or trade secrets.
It is possible that pending or future United States or foreign patent applications made by us will not be approved, that our issued patents will not protect our intellectual property, or that third parties will challenge the ownership rights or the validity of our patents. In addition, the laws of some foreign countries may not protect our proprietary rights to as great an extent as do the laws of the United States and it may be more difficult to monitor the use of our intellectual property. Our competitors may be able to legitimately ascertain non-patented proprietary technology embedded in our systems. If this occurs, we may not be able to prevent the development of technology substantially similar to ours.
We may have to resort to costly litigation to enforce our intellectual property rights, to protect our trade secrets or know-how or to determine their scope, validity or enforceability. Enforcing or defending our proprietary technology is expensive, could cause us to divert resources and may not prove successful. Our protective measures may prove inadequate to protect our proprietary rights, and if we fail to enforce or protect our rights, we could lose valuable assets.
For example, in the past we have been involved in litigation with Sumitomo Electric Industries, Ltd. ("SEI") in Japan as well as interference actions in the United States. We and SEI approved a settlement of this litigation during the fourth quarter of 2004 and the litigation was withdrawn and we abandoned the interference proceeding. We made an initial payment of approximately $1.4 million and will have to pay ongoing royalties to SEI on certain of our products pursuant to a four-year cross-licensing agreement for all intellectual property used by either company related to compound semiconductor substrates, which will expire on December 31, 2008, with the exception of the patents that were the basis for the litigation in Japan and the interference in the U.S. where the license agreement shall last for the life of these patents. There can be no assurance that the cross-license expiring on December 31, 2008 will be renewed, or on terms acceptable to us.
Risks Related to Compliance and Other Legal Matters
We need to continue to improve or implement our systems, procedures and controls.
The shift of our manufacturing operations to China and growth of our business has placed and continues to place a significant strain on our operations and management resources. We have upgraded our inventory control systems, but continue to rely on certain manual processes in our operations and in connection with consolidation of our financial results. If we fail to manage these changes effectively, our operations may be disrupted.
To manage our business effectively, we may need to implement additional and improved management information systems, further develop our operating, administrative, financial and accounting systems and controls, add experienced senior level managers, and maintain close coordination among our executive, engineering, accounting, marketing, sales and operations organizations.
We are subject to internal control evaluations and attestation requirements of Section 404 of the Sarbanes-Oxley Act.
Pursuant to Section 404 of the Sarbanes-Oxley Act of 2002, we must include in our Annual Report on Form 10-K a report of management on the effectiveness of our internal control over financial reporting. Ongoing compliance with this requirement is complex, costly and time-consuming. If: (1) we fail to maintain effective internal control over financial reporting; (2) our management does not timely assess the adequacy of such internal control; or (3) our independent registered public accounting firm does not timely deliver an unqualified opinion as to the effectiveness of our internal controls, we could be subject to regulatory sanctions and the public's perception of us may decline.
If we fail to comply with environmental and safety regulations, we may be subject to significant fines or forced to cease our operations; in addition, we could be subject to suits for personal injuries caused by hazardous materials.
We are subject to federal, state and local environmental and safety laws and regulations in all of our operating locations, including laws and regulations of China, such as laws and regulations related to the development, manufacture and use of our products, the operation of our facilities, and the use of our real property. These laws and regulations govern the use, storage, discharge and disposal of hazardous chemicals during manufacturing, research and development, and sales demonstrations. If we fail to comply with applicable regulations, we could be subject to substantial liability for clean-up efforts, personal injury and fines or suspension or be forced to cease our operations, and/or suspend or terminate the development, manufacture or use of certain of our products, the use of our facilities, or the use of our real property, each of which could have a material adverse effect on our business, financial condition and results of operations.
We have in the past been the subject of claims made by the California Occupational Safety and Health Administration, or Cal-OSHA, in an investigation primarily regarding impermissible levels of potentially hazardous materials in certain areas of our manufacturing facility in Fremont, California. We were also previously the target of press allegations and correspondence purportedly on behalf of current and/or former employees concerning our environmental compliance programs and exposure of our employees to hazardous materials. In addition, a complaint was previously filed against us and two current officers, alleging personal injury, general negligence, intentional tort, wage loss and other damages, including punitive damages, as a result of exposure of plaintiffs to high levels of gallium arsenide in gallium arsenide wafers, and methanol. Other current and/or former employees could bring litigation against us in the future. Although we have put in place engineering, administrative and personnel protective equipment programs to address these issues, our ability to expand or continue to operate our present locations could be restricted or we could be required to acquire costly remediation equipment or incur other significant expenses if we were found liable for failure to comply with environmental and safety regulations. Existing or future changes in laws or regulations in the United States and China may require us to incur significant expenditures or liabilities, or may restrict our operations. In addition, our employees could be exposed to chemicals or other hazardous materials at our facilities and we may be subject to lawsuits seeking damages for wrongful death or personal injuries allegedly caused by exposure to chemicals or hazardous materials at our facilities.
Litigation is inherently uncertain and while we would expect to defend ourselves vigorously, it is possible that our business, financial condition, results of operations or cash flows could be affected in
any particular period by litigation pending and any additional litigation brought against us. In addition, future litigation could divert management's attention from our business and operations, causing our business and financial results to suffer. We could incur defense or settlement costs in excess of the insurance covering these litigation matters, or that could result in significant judgments against us or cause us to incur costly settlements, in excess of our insurance limits.
The effect of terrorist threats and actions on the general economy could decrease our revenue.
The United States continues to be on alert for terrorist activity. The potential near- and long-term impact terrorist activities may have in regards to our suppliers, customers and markets for our products and the U.S. economy is uncertain. There may be embargos of ports or products, or destruction of shipments or our facilities, or attacks that affect our personnel. There may be other potentially adverse effects on our operating results due to a significant event that we cannot foresee. Since we perform all of our manufacturing operations in China, and a significant portion of our customers are located outside of the Untied States, terrorist activity or threats against US-owned enterprise are a particular concern to us.
If any of our facilities is damaged by occurrences such as fire, explosion, or natural disaster, we might not be able to manufacture our products.
The ongoing operation of our manufacturing and production facilities in China is critical to our ability to meet demand for our products. If we are not able to use all or a significant portion of our facilities for prolonged periods for any reason, we would not be able to manufacture products for our customers. For example, a fire or explosion caused by our use of combustible chemicals and high temperatures during our manufacturing processes could render some or all of our facilities inoperable for an indefinite period of time. Actions outside of our control, such as earthquakes or other natural disasters, could also damage our facilities, rendering them inoperable. If we are unable to operate our facilities and manufacture our products, we would lose customers and revenue and our business would be harmed.
Item 1B.Unresolved Staff Comments
None.
None.
Our principal properties as of February 21, 20062008 are as follows:
| Location | Square | Principal Use | Ownership | ||||||||||||
|---|---|---|---|---|---|---|---|---|---|---|---|---|---|---|---|
| Fremont, CA | 80,000 | Vacant | Owned | ||||||||||||
Fremont, CA |
|
|
| ||||||||||||
|
|
|
| ||||||||||||
|
| Production and Administration | Operating lease, expires March 2013 | ||||||||||||
|
|
|
| ||||||||||||
Beijing, China | 31,000 | Production and Administration | Owned | ||||||||||||
Beijing, China | 31,000 | Production | Owned | ||||||||||||
Beijing, China | 32,000 | Production | Owned | ||||||||||||
Beijing, China | 16,000 | Housing | Owned | ||||||||||||
Beijing, China | 34,000 | Production | Owned | ||||||||||||
Beijing, China | 48,000 | Production | Owned | ||||||||||||
Beijing, China | 22,000 | Production and | Owned | ||||||||||||
|
|
|
| ||||||||||||
Beijing, China | 53,000 | Production | Owned | ||||||||||||
| Xianxi, China | 56,500 | Production | Owned by Beijing Ji Ya Semiconductor | ||||||||||||
Xianxi, China | 7,500 | Administration | Owned by Beijing Ji Ya Semiconductor | ||||||||||||
Xianxi, China | 1,000 | Administration | Owned by Beijing Ji Ya Semiconductor | ||||||||||||
Nanjing, China | 22,000 | Production | Owned by Nanjing Jin Mei Gallium Co., Ltd.* | ||||||||||||
Nanjing, China | 5,700 | R&D and Administration | Owned by Nanjing Jin Mei Gallium Co., Ltd.* | ||||||||||||
Nanjing, China | 3,900 | Production | Owned by Nanjing Jin Mei Gallium Co., Ltd.* | ||||||||||||
Beijing, China | 7,600 | Production and Administration | Owned by Beijing | ||||||||||||
We consider each facility to be in good operating condition and adequate for its present use, and believe that each facility has sufficient plant capacity to meet its current and anticipated operating requirements.
From time to time we may be involved in judicial or administrative proceedings concerning matters arising in the ordinary course of business. We do not intend to renewexpect that any of these matters, individually or in the operating leasesaggregate, will have a material adverse effect on our business, financial condition, cash flows or results of properties in Fremont and El Monte, California, that expire in 2006, as we are no longer using such facilities.operation.
On October 15, 2004, a purported securities class action lawsuit was filed in the United States Court for the Northern District of California.California, City of Harper Woods Employees Retirement System v. AXT, Inc. et al., No. C 04 4362 MJJ. The Court consolidated the case with a subsequent related case and appointed a lead plaintiff. On April 5, 2005, the lead plaintiff filed a consolidated complaint, captioned as Morgan v. AXT, Inc. et al., No. C 04 4362 MJJ. The lawsuit complaint names AXT, Inc. and our former chief technology officer as defendants, and is brought on behalf of a class of all purchasers of our securities from
February 6, 2001 through April 27, 2004. The complaint alleges that we announced financial results during this period that were false and misleading. No specific amount of damages is claimed. On September 23, 2005, the Court granted our motion to dismiss the complaint, with leave to amend. Leadamend. The lead plaintiff filed an amended complaint, which we havehad moved to dismiss. We believe that there are meritorious defenses againstOn April 24, 2007, we reached a settlement of this litigationlitigation. On February 27, 2008, the district court approved the settlement, and intend to vigorously defend it. However, due to the inherent uncertaintiessubsequently entered a judgment of litigation, we cannot accurately predict the ultimate outcome of the litigation. Any unfavorable outcome of the litigation could have an adverse impact on our business, financial condition and results of operations.dismissal.
On June 1, 2005, a lawsuit was filed in the Superior Court of California, County of Alameda, Zhao et. Al. vs.et al. v. American Xtal Technology, et.et al., No. R 605215713. The lawsuit complaint names as defendants AXT, itsInc., our former chief technology officer its former interim chief executive officer, a former safety department employee and a supplier to AXT.one of our suppliers. The lawsuit iswas brought on behalf of two former employees and their minor child. The complaint allegesalleged personal injury, general negligence, intentional tort, wage loss and other damages, including punitive damages, as a result of exposure toof the child while in utero to high levels of gallium arsenide and methanol used in the production of gallium arsenide wafers. On April 23, 2007, we reached a settlement of this litigation.
A former employee, Steve X. Chen, has demanded arbitration of his claim that his position with AXT, Inc. was eliminated due to his race and national origin. We believe that there are meritorious defenses againstis no merit to this litigationclaim and intend to vigorously defend it. AXT’s commercial general liability insurance carriercontest it vigorously. This proceeding is at a very early stage, and no arbitrator has agreed to fund AXT’s defense of the case, but has reserved the right to deny coverage, in whole or in part, in the future under selected policy provisions and applicable law. There is $21 million in available limits under the policies in question. Due to the inherent uncertainties of litigation, we cannot accurately predict the ultimate outcome of the litigation. Any unfavorable outcome of the litigation could have an adverse impact on our business, financial condition and results of operations.been selected.
Item 4.Submission of Matters to a Vote of Security Holders
None.
28
Item 5.Market for Registrant’sRegistrant's Common Equity, Related Stockholder Matters and Issuer Purchases of Equity Securities
Our common stock has been trading publicly on the Nasdaq NationalNASDAQ Global Market, (NASDAQ) under the symbol “AXTI”"AXTI" since May 20, 1998, the date we consummated our initial public offering. The following table sets forth the range of high and low sales prices of the common stock for the periods indicated, as reported by NASDAQ. Such quotations represent inter-dealer prices without retail markup, markdown or commission and may not necessarily represent actual transactions.
|
| High |
| Low |
| ||
2005 |
|
|
|
|
| ||
First Quarter |
| $ | 1.57 |
| $ | 1.10 |
|
Second Quarter |
| $ | 1.42 |
| $ | 1.08 |
|
Third Quarter |
| $ | 1.65 |
| $ | 1.14 |
|
Fourth Quarter |
| $ | 2.47 |
| $ | 1.21 |
|
2004 |
|
|
|
|
| ||
First Quarter |
| $ | 4.68 |
| $ | 3.00 |
|
Second Quarter |
| $ | 3.57 |
| $ | 1.73 |
|
Third Quarter |
| $ | 1.97 |
| $ | 1.05 |
|
Fourth Quarter |
| $ | 2.04 |
| $ | 1.37 |
|
| | High | Low | |||||
|---|---|---|---|---|---|---|---|
| 2007 | |||||||
| First Quarter | $ | 5.45 | $ | 4.16 | |||
| Second Quarter | $ | 5.05 | $ | 3.53 | |||
| Third Quarter | $ | 6.20 | $ | 4.18 | |||
| Fourth Quarter | $ | 6.84 | $ | 3.83 | |||
| 2006 | |||||||
| First Quarter | $ | 3.87 | $ | 1.98 | |||
| Second Quarter | $ | 4.47 | $ | 2.84 | |||
| Third Quarter | $ | 4.26 | $ | 2.84 | |||
| Fourth Quarter | $ | 5.37 | $ | 4.19 | |||
As of December 31, 2005,2007, there were 10291 holders of record of our common stock. Because many shares of AXT’sAXT's common stock are held by brokers and other institutions on behalf of stockholders, we are unable to estimate the total number of stockholders.beneficial owners of our common stock.
We have never paid or declared any cash dividends on our common stock and do not anticipate paying cash dividends in the foreseeable future. Dividends accrue on our outstanding Series A preferred stock at the rate of $0.20 per annum per share of Series A preferred stock.
Issuer Purchases of Equity Securities
During the three-month periodyears ended December 31, 2005,2007 and 2006, we did not repurchase any shares of our common stock. During the twelve-month period ended
Use of Proceeds
On December 31, 2005,19, 2006 and January 9, 2007, we repurchased the followingsold 5,750,000 shares and 862,500 shares, respectively, of our common stock:
Period |
|
|
| Total Number |
| Average Price |
| Total Number of |
| Approximate |
| ||||||||||
Jan. 1, 2005 through Mar. 31, 2005 |
|
| 23,383 |
|
|
| $ | 1.23 |
|
|
| 23,383 |
|
|
| $ | 1,971,313 |
|
| ||
Apr. 1, 2005 through Jun. 30, 2005 |
|
| 134,700 |
|
|
| 1.22 |
|
|
| 134,700 |
|
|
| 1,807,145 |
|
| ||||
Jul 1, 2005 through Sep. 30, 2005 |
|
| 43,433 |
|
|
| 1.22 |
|
|
| 43,433 |
|
|
| 1,754,160 |
|
| ||||
Oct 1, 2005 through Dec. 31, 2005 |
|
| — |
|
|
| — |
|
|
| — |
|
|
| 1,754,160 |
|
| ||||
Total |
|
| 201,516 |
|
|
| $ | 1.22 |
|
|
| 201,516 |
|
|
| $ | 1,754,160 |
|
| ||
(1) Pursuantstock in a firmly underwritten public offering pursuant to a Plan publicly announcedregistration statement on Form S-3 (SEC file number 333-135474), which was declared effective by the SEC on August 25, 20043, 2006, and extendeda registration statement on Form S-3MEF (SEC file number 333-139365), which was effective upon filing with the SEC on December 15, 2006. Needham & Company, LLC acted as the sole underwriter. The price per share to the public was $4.50. We received net proceeds of $24.1 million and $3.6 million, for aggregate net proceeds of $27.7 million. The net proceeds have been and will continue to be used for corporate and joint venture capacity expansion, research and development and working capital requirements, as well as potential acquisitions of complementary products, technologies or businesses.
Comparison of Stockholder Return
Set forth below is a line graph comparing the annual percentage change in July, 2005, in accordance with Rule 10b5-1the cumulative total return to the stockholders of the Securities Exchange Act of 1934 to provideCompany on our common stock with the CRSP Total Return Index for the repurchaseNasdaq Stock Market (U.S. Companies) and the Nasdaq Electronic Components Index for the period commencing December 31, 2002, and ending December 31, 2007.
COMPARISON OF 5 YEAR CUMULATIVE TOTAL RETURN*
Among AXT, Inc., The NASDAQ Composite Index
And The NASDAQ Electronic Components Index

- *
- $100 invested on 12/31/02 in stock or index-including reinvestment of
up to $2 million ofdividends.
Fiscal year ending December 31.
| | 12/02 | 12/03 | 12/04 | 12/05 | 12/06 | 12/07 | ||||||
|---|---|---|---|---|---|---|---|---|---|---|---|---|
| AXT, Inc. | 100.00 | 172.78 | 87.78 | 118.89 | 262.22 | 344.44 | ||||||
| NASDAQ Composite | 100.00 | 149.75 | 164.64 | 168.60 | 187.83 | 205.22 | ||||||
| NASDAQ Electronic Components | 100.00 | 196.18 | 153.08 | 166.42 | 155.47 | 180.19 |
Other consolidated financial statements and supplementary data required by this item are set forth at the Company’s common stock. Repurchases will be made from time to time in the open market during the twelve-month period ending July 31, 2006,pages indicated at prevailing market prices. RepurchasesItem 15(a).
will be made under the program using the Company’s own cash resources. As of December 31, 2005, we had 22,977,301 shares of common stock outstanding and 201,516 were repurchased in 2005 under this program.
Item 6.Selected Consolidated Financial Data
The following selected consolidated financial data is derived from and should be read in conjunction with our consolidated financial statements and related notes set forth in Item 8 below, and in our previously filed reports on Form 10-K. See also Item 7 “Management’s7. "Management's Discussion and Analysis of Financial Condition and Results of Operations”Operations" for further information relating to items reflecting our results of operations and financial condition.
|
| Years Ended December 31, |
| |||||||||||||
|
| 2005 |
| 2004 |
| 2003 |
| 2002 |
| 2001 |
| |||||
|
| (in thousands, except per share data) |
| |||||||||||||
Income Statement Data: |
|
|
|
|
|
|
|
|
|
|
| |||||
Revenue |
| $ | 26,536 |
| $ | 35,454 |
| $ | 34,713 |
| $ | 44,865 |
| $ | 108,800 |
|
Cost of revenue |
| 24,337 |
| 35,705 |
| 32,478 |
| 53,758 |
| 67,494 |
| |||||
Gross profit (loss) |
| 2,199 |
| (251 | ) | 2,235 |
| (8,893 | ) | 41,306 |
| |||||
Operating expenses: |
|
|
|
|
|
|
|
|
|
|
| |||||
Selling, general, and administrative |
| 12,955 |
| 11,561 |
| 10,475 |
| 13,860 |
| 17,208 |
| |||||
Research and development |
| 1,723 |
| 1,479 |
| 1,337 |
| 2,339 |
| 3,876 |
| |||||
Impairment charges |
| — |
| 210 |
| — |
| 14,632 |
| — |
| |||||
Restructuring costs |
| 836 |
| 1,308 |
| — |
| — |
| — |
| |||||
Total operating expenses |
| 15,514 |
| 14,558 |
| 11,812 |
| 30,831 |
| 21,084 |
| |||||
Income (loss) from operations |
| (13,315 | ) | (14,809 | ) | (9,577 | ) | (39,724 | ) | 20,222 |
| |||||
Interest income, net |
| 516 |
| 262 |
| 172 |
| 2,746 |
| 1,847 |
| |||||
Other (income) and expense, net |
| (910 | ) | (94 | ) | 1,688 |
| 15,886 |
| 16,057 |
| |||||
Income (loss) from continuing operations before provision for income taxes |
| (13,709 | ) | (14,453 | ) | (11,093 | ) | (52,864 | ) | 6,012 |
| |||||
Provision (benefit) for income taxes |
| (950 | ) | 71 |
| — |
| 2,119 |
| 2,164 |
| |||||
Income (loss) from continuing operations |
| (12,759 | ) | (14,524 | ) | (11,093 | ) | (54,983 | ) | 3,848 |
| |||||
Discontinued operations: |
|
|
|
|
|
|
|
|
|
|
| |||||
Gain (loss) from discontinued operations |
| 544 |
| 472 |
| (6,163 | ) | (34,625 | ) | (13,818 | ) | |||||
Gain (loss) on disposal |
| — |
| 419 |
| (9,475 | ) | — |
| — |
| |||||
Benefit for income taxes |
| — |
| — |
| — |
| (8,427 | ) | (4,974 | ) | |||||
Gain (loss) from discontinued operations |
| 544 |
| 891 |
| (15,638 | ) | (26,198 | ) | (8,844 | ) | |||||
Net loss |
| $ | (12,215 | ) | $ | (13,633 | ) | $ | (26,731 | ) | $ | (81,181 | ) | $ | (4,996 | ) |
Basic and diluted income (loss) per share: |
|
|
|
|
|
|
|
|
|
|
| |||||
Income (loss) from continuing operations |
| $ | (0.56 | ) | $ | (0.64 | ) | $ | (0.49 | ) | $ | (2.46 | ) | $ | 0.17 |
|
Gain (loss) from discontinued operations |
| 0.02 |
| 0.04 |
| (0.69 | ) | (1.17 | ) | (0.40 | ) | |||||
Net loss |
| $ | (0.54 | ) | $ | (0.60 | ) | $ | (1.18 | ) | $ | (3.63 | ) | $ | (0.23 | ) |
Shares used in per share calculations: |
|
|
|
|
|
|
|
|
|
|
| |||||
Basic |
| 23,047 |
| 23,063 |
| 22,781 |
| 22,433 |
| 22,278 |
| |||||
Diluted |
| 23,047 |
| 23,063 |
| 22,781 |
| 22,433 |
| 22,879 |
| |||||
| | Years Ended December 31, | |||||||||||||||||
|---|---|---|---|---|---|---|---|---|---|---|---|---|---|---|---|---|---|---|
| | 2007 | 2006 | 2005 | 2004 | 2003 | |||||||||||||
| | (in thousands, except per share data) | |||||||||||||||||
| Statements of Operations | ||||||||||||||||||
| Revenue | $ | 58,203 | $ | 44,445 | $ | 26,536 | $ | 35,454 | $ | 34,713 | ||||||||
| Cost of revenue | 37,942 | 31,709 | 24,337 | 35,705 | 32,478 | |||||||||||||
| Gross profit (loss) | 20,261 | 12,736 | 2,199 | (251 | ) | 2,235 | ||||||||||||
| Operating expenses: | ||||||||||||||||||
| Selling, general, and administrative | 13,746 | 12,650 | 12,955 | 11,561 | 10,475 | |||||||||||||
| Research and development | 1,699 | 2,351 | 1,723 | 1,479 | 1,337 | |||||||||||||
| Impairment (recovery of impairment) on assets held for sale | (481 | ) | 1,417 | — | 210 | — | ||||||||||||
| Restructuring charge (benefit) | — | (2 | ) | 836 | 1,308 | — | ||||||||||||
| Total operating expenses | 14,964 | 16,416 | 15,514 | 14,558 | 11,812 | |||||||||||||
| Income (loss) from continuing operations | 5,297 | (3,680 | ) | (13,315 | ) | (14,809 | ) | (9,577 | ) | |||||||||
| Interest income, net | 704 | 443 | 516 | 262 | 172 | |||||||||||||
| Other income (expense), net | 16 | 2,709 | (910 | ) | 94 | (1,688 | ) | |||||||||||
| Income (loss) from continuing operations before provision (benefit) for income taxes | 6,017 | (528 | ) | (13,709 | ) | (14,453 | ) | (11,093 | ) | |||||||||
| Provision (benefit) for income taxes | 728 | (1,454 | ) | (950 | ) | 71 | — | |||||||||||
| Income (loss) from continuing operations | 5,289 | 926 | (12,759 | ) | (14,524 | ) | (11,093 | ) | ||||||||||
| Discontinued operations: | ||||||||||||||||||
| Gain (loss) from discontinued operations, net of tax | — | 18 | (59 | ) | 472 | (6,163 | ) | |||||||||||
| Gain (loss) from disposal, net of tax | — | — | 603 | 419 | (9,475 | ) | ||||||||||||
| Gain (loss) from discontinued operations, net of taxes | — | 18 | 544 | 891 | (15,638 | ) | ||||||||||||
| Net income (loss) | $ | 5,289 | $ | 944 | $ | (12,215 | ) | $ | (13,633 | ) | $ | (26,731 | ) | |||||
| Basic income (loss) per share: | ||||||||||||||||||
| Income (loss) from continuing operations | $ | 0.17 | $ | 0.03 | $ | (0.56 | ) | $ | (0.64 | ) | $ | (0.49 | ) | |||||
| Gain (loss) from discontinued operations, net of tax | — | — | 0.02 | 0.04 | (0.69 | ) | ||||||||||||
| Net income (loss) | $ | 0.17 | $ | 0.03 | $ | (0.54 | ) | $ | (0.60 | ) | $ | (1.18 | ) | |||||
| Diluted income (loss) per share: | ||||||||||||||||||
| Income (loss) from continuing operations | $ | 0.16 | $ | 0.03 | $ | (0.56 | ) | $ | (0.64 | ) | $ | (0.49 | ) | |||||
| Gain (loss) from discontinued operations, net of tax | — | — | 0.02 | 0.04 | (0.69 | ) | ||||||||||||
| Net income (loss) | $ | 0.16 | $ | 0.03 | $ | (0.54 | ) | $ | (0.60 | ) | $ | (1.18 | ) | |||||
| Shares used in per share calculations: | ||||||||||||||||||
| Basic | 30,035 | 23,303 | 23,047 | 23,063 | 22,781 | |||||||||||||
| Diluted | 31,348 | 24,600 | 23,047 | 23,063 | 22,781 | |||||||||||||
| | Years Ended December 31, | ||||||||||||||
|---|---|---|---|---|---|---|---|---|---|---|---|---|---|---|---|
| | 2007 | 2006 | 2005 | 2004 | 2003 | ||||||||||
| | (in thousands) | ||||||||||||||
| Balance Sheet Data: | |||||||||||||||
| Cash and cash equivalents | $ | 18,380 | $ | 16,116 | $ | 17,472 | $ | 12,117 | $ | 24,339 | |||||
| Short-term investments | 20,825 | 19,428 | 5,555 | 20,062 | 14,669 | ||||||||||
| Working capital | 75,350 | 66,359 | 36,347 | 46,141 | 57,335 | ||||||||||
| Restricted deposits | 6,700 | 7,150 | 7,450 | 8,215 | 9,302 | ||||||||||
| Total assets | 112,772 | 98,332 | 74,798 | 87,540 | 107,023 | ||||||||||
| Long-term debt, net of current portion | 6,250 | 6,839 | 7,420 | 7,880 | 8,842 | ||||||||||
| Stockholders' equity | 93,250 | 81,200 | 55,618 | 68,017 | 82,298 | ||||||||||
|
| Years Ended December 31, |
| |||||||||||||
|
| 2005 |
| 2004 |
| 2003 |
| 2002 |
| 2001 |
| |||||
|
| (in thousands) |
| |||||||||||||
Balance Sheet Data: |
|
|
|
|
|
|
|
|
|
|
| |||||
Cash and cash equivalents |
| $ | 17,472 |
| $ | 12,117 |
| $ | 24,339 |
| $ | 13,797 |
| $ | 37,538 |
|
Short-term investments |
| 5,555 |
| 20,062 |
| 14,669 |
| 8,205 |
| 25,673 |
| |||||
Working capital |
| 36,347 |
| 46,141 |
| 57,335 |
| 65,375 |
| 125,295 |
| |||||
Restricted deposits |
| 7,450 |
| 8,215 |
| 9,302 |
| 11,150 |
| — |
| |||||
Long-term investments |
| — |
| — |
| — |
| 3,657 |
| 6,552 |
| |||||
Total assets |
| 74,798 |
| 87,540 |
| 107,023 |
| 145,667 |
| 243,359 |
| |||||
Long-term capital lease, net of current portion |
| — |
| — |
| — |
| 4,847 |
| 10,002 |
| |||||
Long-term debt, net of current portion |
| 7,420 |
| 7,880 |
| 8,842 |
| 13,289 |
| 14,342 |
| |||||
Stockholders’ equity |
| 55,618 |
| 68,017 |
| 82,298 |
| 105,657 |
| 186,322 |
| |||||
All periods have been restated to reflect the accounting for discontinued operations. As a result, the discontinued opto-electronics and consumer products divisions have been eliminated from continuing operations in the statements of operations.
31
Item 7.Management’sManagement's Discussion and Analysis of Financial Condition and Results of Operations
In addition to historical information, the following discussion contains forward-looking statements that are subject to risks and uncertainties. Actual results may differ substantially from those referred to herein due to a number of factors, including but not limited to risks described in the section entitled Item 1A. Risk Factors"Risk Factors" and elsewhere in this Annual Report. This discussion should be read in conjunction with Item 6 “Selected6. "Selected Consolidated Financial Data”Data" and our consolidated financial statements and related notes included elsewhere in this Form 10-K.
Critical Accounting Policies and Estimates
We have preparedprepare our consolidated financial statements in accordance with accounting principles generally accepted in the United States of America. Accordingly, we have had to make estimates, assumptions and judgments that affect the amounts reported on our consolidated financial statements. These estimates, assumptions and judgments about future events and their effects on our results cannot be determined with certainty, and are made based upon our historical experience and on other assumptions that are believed to be reasonable under the circumstances. These estimates may change as new events occur or additional information is obtained, and we may periodically be faced with uncertainties, the outcomes of which are not within our control and may not be known for a prolonged period of time.
We have identified the policies below as critical to our business operations and understanding of our financial condition and results of operations. A critical accounting policy is one that is both material to the presentation of our consolidated financial statements and requires us to make difficult, subjective or complex judgments that could have a material impact on our consolidated financial statements. Different estimates that we could have used, or changes in the estimates that are reasonably likely to occur, may have a material impact on our financial condition or results of operations. We also refer you to our “The"The Company and Summary of Significant Accounting Policies”Policies" discussed in the accompanying notes to our consolidated financial statements included elsewhere in this Form 10-K.
Revenue Recognition
We manufacture and sell high-performance compound semiconductor substrates and sell certain raw materials including gallium, germanium dioxide, and pBN crucibles. After we ship our products, there are no remaining obligations or customer acceptance requirements that would preclude revenue recognition. Our products are typically sold pursuant to a purchase order placed by our customers, and our terms and conditions of sale do not require customer acceptance. We recognize revenue upon shipment and transfer of title of products to our customers, which is either upon shipment from our dock, receipt at the customer’scustomer's dock, or removal from consignment inventory at the customer’scustomer's location, provided that we have received a signed purchase order, the price is fixed or determinable, title and risk of ownership have transferred, collection of resulting receivables is probable, and product returns are reasonably estimable. We do not provide training, installation or commissioning services. Additionally, we do not provide discounts or other incentives to customers except for one customer with whom we agreed in the fourth quarter of 2004 to provide a certain amount of cumulative discounts on future product purchases from us. We recognize these discounts as a reduction in revenue as products are sold to this customer.customers.
We provide for future returns based on historical experience, current economic trends and changes in customer demand at the time revenue is recognized. In the first quarter of 2004, we recorded a reserve for sales returns of $745,000$0.7 million related to our failure to follow certain testing requirements and provision of testing data and information to certain customers. This reserve was based on discussions with some of the affected customers and review of specific shipments. Approximately $487,000As of the $745,000 sales returnsDecember 31, 2007, this reserve haswas zero since approximately $0.5 million had been utilized and approximately $205,000 has$0.2 million had been reversed to revenue as of December 31,
2005in 2006 as we favorably resolved an outstanding matter with a customer. We will continue to monitor the returns for this specific reserve. See further discussion in “Results of Operations” below.
Allowance for Doubtful Accounts
We periodically review the likelihood of collection on our accounts receivable balances and provide an allowance for doubtful accounts receivable primarily based upon the age of these accounts. We provide a 100% allowance for U.S. receivables in excess of 90 days and for foreign receivables in excess of 120 days. We assess the probability of collection based on a number of factors, including the length of time a receivable balance has been outstanding, our past history with the customer and their credit worthiness.
In previous years, three of our customers had filed for bankruptcy protection. Upon notification of the bankruptcy, we immediately stopped shipping orders to these customers other than on payment in advance. At that time, the outstanding balances of these customers had been fully reserved. The related accounts receivable balances and reserve were subsequently written off in November 2004 when we finally determined that the balances were uncollectible. This determination was made as a result of our unsuccessful efforts to collect these accounts receivable, the significant length of time that the receivables balance was outstanding, and the unlikelihood that we would collect the balances from the bankrupt’s estate. As of December 31, 2005, our allowance for doubtful accounts was $0.5 million primarily from an increase in the allowance for a large customer in China of $0.4 million. During 2006, we increased our collection efforts and collected the entire amount from this large customer in China requiring us to reverse this $0.4 million allowance resulting in the allowance for doubtful accounts of $0.1 million at December 31, 2006. During 2007, we increased this allowance by $0.3 million primarily for slow-paying customers in Asia, resulting in the allowance for doubtful accounts of $0.4 million as of December 31, 2007. As of December 31, 2007, our accounts receivable balance was $5.2$12.1 million, which was net of an allowance for doubtful accounts of $533,000. From$0.4 million. As of December 31, 2006, our accounts receivable balance was $9.7 million, which was net of an allowance for doubtful accounts of $537,000 as of December 31, 2004, we wrote off $68,000 of fully reserved$0.1 million. The increase in gross accounts receivable for a Korean customer and decreased the allowance by $343,000balance was primarily due to improved collections mainly from a Japanese customer,increased sales, while increasing the allowance for a large customerincrease in China of $396,000, and other doubtful accounts of $11,000, resulting in the allowance for doubtful accounts of $533,000 as of December 31, 2005.was mainly for our slow-paying customers in Asia. If actual uncollectible accounts differ substantially from our estimates, revisions to the estimated allowance for doubtful accounts would be required, which could have a material impact on our financial results for the period.
The allowance for sales returns is also deducted from gross accounts receivable. From our allowance for sales returns of $550,000 as of December 31, 2004, we utilized $487,000 for investigation related returns, while increasing the allowance for sales returns based on our history of sales returns $23,000 resulting in the allowance for sales returns of $86,000 as of December 31, 2005. The total allowancesallowance deducted from gross accounts receivable as of December 31, 2005 is $619,000, compared to $1,087,000 as of December 31, 2004.2007 and 2006 was less than $0.1 million.
Warranty Reserve
We maintain a warranty reserve based upon our claims experience during the prior twelve months. Warranty costs are accrued at the time revenue is recognized. As of December 31, 2005,2007 and 2006, accrued product warranties totaled $120,000.$1.0 million and $0.5 million, respectively. The increase in accrued product warranties is primarily attributable to increased claims for quality issues experienced by some customers as well as an increase in revenues. If actual warranty costs differ substantially from our estimates, revisions to the estimated warranty liability would be required, which could have a material impact on our financial condition and results of operations.required.
Inventory Valuation
Inventories are stated at the lower of cost or market. Cost is determined using the weighted average cost method. Our inventory consists of raw materials as well as finished goods and work-in-process that include material, labor and manufacturing overhead costs. Given the nature of our substrate products, and the materials used in the manufacturing process, the wafers and ingots comprising work-in-process may be held in inventory for up to two years and three years, respectively, as the risk of obsolescence for these materials is low. We routinely evaluate the levels of our inventory in light of current market conditions in order to identify excess and obsolete inventory and provide a valuation allowance for certain inventories
based upon the age and quality of the product and the projections for sale of the completed products. As of December 31, 2005, we had an inventory reserve of $16.9 million. If actual demand for our products were to be substantially lower than estimated, additional inventory adjustments for excess or obsolete inventory might be required, which could have a material impact on our business, financial condition and results of operations.
Impairment of Investments
We classify our investments in debt and equity securities as available-for-sale securities as prescribed by Statement of Financial Accounting Standards (SFAS) No. 115,“"Accounting for Certain Investments in Debt and Equity Securities.”" All available-for-sale securities with a quoted market value below cost (or adjusted cost) are reviewed in order to determine whether the decline is other-than-temporary. Factors considered in determining whether a loss is temporary include the magnitude of the decline in market value, the length of time the market value has been below cost (or adjusted cost), credit quality, and our ability and intent to hold the securities for a period of time sufficient to allow for any anticipated recovery in market value.
We invest in equity instruments of privately-held companies for business and strategic purposes. These investments are classified as other assets and are accounted for under the cost method as we do not have the ability to exercise significant influence over their operations. We monitor our investments for impairment and record reductions in carrying value when events or changes in circumstances indicate that the carrying value may not be recoverable. Determination of impairment is highly subjective and is based on a number of factors, including an assessment of the strength of investee’sinvestee's management, the length of time and extent to which the fair value has been less than our cost basis, the financial condition and near-term prospects of the investee, fundamental changes to the business prospects of the investee, share prices of subsequent offerings, and our intent and ability to hold the investment for a period of time sufficient to allow for any anticipated recovery in our carrying value. We had no write-downs in 2007, 2006 or 2005.
Impairment of Long-Lived Assets
We evaluate the recoverability of property, plant and equipment, and intangible assets in accordance with SFAS No. 144,“"Accounting for the Impairment or Disposal of Long-Lived Assets.”" When events and circumstances indicate that long-lived assets may be impaired, we compare the carrying value of the long-lived assets to the projection of future undiscounted cash flows attributable to such assets. In the event that the carrying value exceeds the future undiscounted cash flows, we record an impairment charge against income equal to the excess of the carrying value over the asset’sasset's fair value. Fair value is generally determined by calculating the discounted future cash flows using a discount rate based upon our weighted average cost of capital, and specific appraisal in certain instances. Significant judgments and assumptions are required in the forecast of future operating results used in the preparation of the estimated future cash flows, including long-term forecasts of the amounts and timing of overall market growth and our percentage of that market, groupings of assets, discount rate and terminal growth rates. Changes in these estimates could have a material adverse effect on the assessment of long-lived assets, thereby requiring us to write down the assets. In the third quarter of 2006, we incurred an impairment charge of $1.4 million to write down our U.S. property in Fremont, California, which was being decontaminated and was being prepared for sale. In the second quarter of 2007, we benefited from a recovery of impairment on this asset held for sale in connection with our adjustment of the fair value. We recorded a $481,000 market value adjustment after we entered into an agreement with an independent third party purchaser in June 2007 to purchase the property for estimated net proceeds of $5.1 million, after deducting estimated commission and selling expenses. In the fourth quarter of 2007, that agreement was terminated and we entered into a new sales agreement with another independent third party purchaser to purchase this property for a similar amount. We expect the sale to be completed in the first or second quarter of 2008. This property has been classified as "Assets held for sale" in the amount of $5.1 million on the consolidated balance sheet as of December 31, 2007.
Stock Based Compensation
34
Employee Stock Options
We believe that employee stock options represent an appropriate and essential component of our overall compensation program. We grant options to substantially all management employees and believe that this broad-based program helps us to attract, motivate and retain high quality employees, to the ultimate benefit of our stockholders. Effective January 1, 2006, we adopted the provisions of SFAS No. 123 (revised 2004), "Share-Based Payment," ("SFAS No. 123(R)") using the modified prospective transition method. Under this transition method, stock compensation expense for fiscal 2007 includes compensation expense for all stock-based compensation awards granted prior to, but not yet vested as of January 1, 2006, based on the grant date fair value estimated in accordance with the original provision of SFAS No. 123, "Accounting for Stock-Based Compensation" ("SFAS No. 123"). Stock compensation expense for all stock-based compensation awards granted after January 1, 2006 is based on the grant-date fair value estimated in accordance with the provisions of SFAS No. 123(R). We currentlyrecognize these compensation costs net of an estimated forfeiture rate over the requisite service period of the award, which is generally the vesting term of four years for stock options.
In March 2005, the Securities and Exchange Commission ("SEC") issued Staff Accounting Bulletin No. 107 ("SAB 107") regarding the SEC's interpretation of SFAS No. 123(R) and the valuation of share-based payments for public companies. We have applied the provisions of SAB 107 in the adoption of SFAS No. 123(R). Stock compensation expense recorded in cost of revenue, research and development, and selling, general and administrative expenses is the amortization of the fair value of share-based payments made to employees and members of our board of directors, primarily in the form of stock options as we adopted the provisions of SFAS No. 123(R) on January 1, 2006 (see Note 1—Summary of Significant Accounting Policies—Stock-Based Compensation). All of our stock compensation is accounted for as an equity instrument.
We account for share-based paymentsstock compensation costs in accordance with SFAS No. 123(R) and apply the provisions of SAB 107. We utilize the Black-Scholes option pricing model to employeesestimate the grant date fair value of employee stock compensation awards, which requires the input of highly subjective assumptions, including expected volatility and expected term. Historical and implied volatility were used in estimating the fair value of our stock compensation awards, while the expected term for our options was estimated based on historical trends. Further, as required under SFAS No. 123(R), we now estimate forfeitures for stock compensation awards that are not expected to vest. Changes in these inputs and assumptions can materially affect the measure of estimated fair value of our stock compensation. We charge the estimated fair value to earnings on a straight-line basis over the vesting period of the underlying awards, which is generally four years for our stock option awards.
The Black-Scholes option pricing model was developed for use in estimating the fair value of traded options that have no vesting restrictions and are fully transferable. As our stock option awards have characteristics that differ significantly from traded options, and as changes in the subjective assumptions can materially affect the estimated value, our estimate of fair value may not accurately represent the value assigned by a third party in an arms-length transaction. There currently is no market-based mechanism to verify the reliability and accuracy of the estimates derived from the Black-Scholes option pricing model or other allowable valuation models, nor is there a means to compare and adjust the estimates to actual values. While our estimate of fair value and the associated charge to earnings materially affects our results of operations, it has no impact on our cash position.
The guidance in SFAS No. 123(R) and SAB 107 is relatively new and the application of these principles may be subject to further interpretation and guidance. There are significant variations among allowable valuation models, and there is a possibility that we may adopt a different valuation model or refine the inputs and assumptions under our current valuation model in the future resulting in a lack of consistency in future periods. Our current or future valuation model and the inputs and assumptions we make may also lack comparability to other companies that use different models, inputs, or assumptions, and the resulting differences in comparability could be material.
Prior to the adoption of SFAS No. 123(R), we measured compensation expense for stock compensation made to our employee and members of our board of directors, primarily in the form of stock options and purchases under the employee stock purchase plan, using the intrinsic value method underprovided by Accounting Principles Board (“APB”) Opinion No. 25, "“Accounting for Stock Issued to Employees,”Employees" and related interpretations thereof and, as such, generally recognize no compensation cost for employee stock options.. We will adopt Statement of Financial Accounting Standards No. 123 (revised), “Share-Based Payment” (SFAS 123R) beginning January 1, 2006. The adoptionapplied the disclosure provisions of SFAS 123R is expected to result in a material increase in expense during 2006 based on unvested options outstanding as of December 31, 2005 and current compensation plans. While the effect of adoption depends on the level of share-based payments granted in the future and unvested grants on the date we adopt SFAS 123(R), the effect of this accounting standard on our prior operating results would approximate the effect of Statement of Financial Accounting Standards (“SFAS”) No. 123,“Accounting for Stock-Based Compensation,” as amended by SFAS No. 148, "“Accounting for Stock-Based Compensation Compensation—Transition and Disclosure,” Disclosures" as describedif the fair-value-based method had been applied in measuring compensation expense.
On November 10, 2005, the Financial Accounting Standards Board ("FASB") issued FASB Staff Accounting Position No. FAS 123 (R)-3 "Transition Election Related to Accounting for Tax Effects of Share-Based Payment Awards." We have elected to adopt the alternative transition method provided in the disclosureFASB Staff Position for calculating the tax effects of pro forma net loss and net loss per share. See “Note 1—stock-based compensation pursuant to SFAS No. 123(R). The Company and Summary of Significant Accounting Policies”alternative transition method includes simplified methods to establish the beginning balance of the notesadditional paid-in capital pool ("APIC pool") related to the tax effects of employee stock-based compensation, and to determine the subsequent impact on the APIC pool and consolidated financial statements.statements of cash flows of the tax effects of the employee stock-based compensation awards that are outstanding upon adoption of SFAS No. 123(R).
Income Taxes
We account for income taxes in accordance with SFAS No. 109 (SFAS 109),“"Accounting for Income Taxes,”" which requires that deferred tax assets and liabilities be recognized using enacted tax rates for the effect of temporary differences between the book and tax bases of recorded assets and liabilities. SFAS 109 also requires that deferred tax assets be reduced by a valuation allowance if it is more likely than not that a portion of the deferred tax asset will not be realized.
We provide for income taxes based upon the geographic composition of worldwide earnings and tax regulations governing each region, particularly China. The calculation of tax liabilities involves significant judgment in estimating the impact of uncertainties in the application of complex tax laws, particularly in foreign countries such as China.
Results of Operations
Overview
We were founded in 1986 to commercialize and enhance our proprietary vertical gradient freeze (VGF) technique for producing high-performance compound semiconductor substrates. We have one operating segment: our substrate business, with limited additional raw materials sales. We recorded our first substrate sales in 1990 and our substrate division currently sells gallium arsenide (GaAs) and indium phosphide (InP) substrates to manufacturers of semiconductor devices for use in applications such as fiber optic and wireless telecommunications, light emitting diodes (LEDs) and lasers. We also sell raw materials including gallium and germanium through our participation in majority- and minority-owned joint ventures. We had the capability to manufacture germanium substrates for use in satellite solar cells but withdrew from this business during 2000 so that we could more profitably use our then constrained capacity. We are now trying to re-qualifyin the process of qualifying our germanium substrates with the few existing satellite solar cell system manufacturers.
Continuing Operations
Our sales of substrate products is dependant on the semiconductor industry, which is highly cyclical and has historically experienced downturns both as a result of economic changes and overcapacity.
In 2003, we believed that the wireless communications and HBLED markets grew, but our revenue did not increase until the fourth quarter of 2003 due to continued reductions in prices, and time required to improve our substrate surface quality and regain some lost customers. Revenue for 2003 fell by $10.2 million, or 22.6% compared with 2002. We recorded net losses in each quarter of 2003. During 2003, we continued to shift more of our manufacturing operations to China and reduced our costs incurred in the United States.
In 2004, our revenue increased $0.7 million as compared to 2003, primarily as a result of increased demand for HBLEDs.
In March 2004, we learned of certain failures to comply with requirements for product testing and the provision of testing data and information relating to requirements of certain customers. Specifically, we determined that in some cases we had not provided accurate data to customers confirming that products shipped were compliant with all specifications provided by the customer, or had been manufactured at the location specified by the customer. As a result of our conclusions, we reorganized our production and quality control procedures, established quality control and assurance as a direct reporting group to the chief executive officer, and implemented measures, including additional employee training, statistical sampling of product shipments during the quarter, and review of our satisfaction of customer specifications each quarter, to ensure adherence to operational controls. We also implemented certain executive management changes.
As a result of the weaknesses identified, in the first quarter of 2004 we increased our sales return reserve by $745,000, based on our best estimate of future returns related to this matter. Approximately $487,000 of the $745,000 sales returns reserve had been utilized and approximately $205,000 has been reversed to revenue as of December 31, 2005 as we favorably resolved an outstanding matter with a customer. This reserve was based, in part, on discussion with affected customers. The amount of the reserve was determined in part based upon the amount of our historical product returns, payment history of prior period receivables, discussions with customers concerning the non-compliant product and testing data, and estimated levels of our product maintained by customers, and likelihood that products previously shipped would be returned to us.
During the second quarter of 2004, we announced plans to cease all production activities in the United States and to manufacture our products only in China.
In 2005, Since 2006, we made a number of important changes to our management team. Philip C.S. Yin, Ph.D., joined the companyAXT in March 20052006 as chief executive officer and restructured the organization from the top down. In June 2005,2006, two new positions were created: chief operating officer and chief technology officer. Also, the former president of AXT’sAXT's China operations became president of joint venture operations. In September 2005,2006, our new vice president of global sales and marketing joined the company. In December 2007, we announced the appointment of our new chief technology officer. This new structure enablesenabled us to maximize the expertise and skill sets of our team while placing enhanced emphasis on manufacturing, production and quality, and quality systems improvement.
With the new management team in place, quality, quality systems and revenue began to improve beginning the third quarter of 2005. In December 2005 and we continued to execute our workforce reduction in our Fremont, California facility and accordingly we will eliminate approximately 15 positions in California over the following 120 days. See further discussion under “Restructuring Charges” below.
Discontinued Opto-Electronics Business
In June 2003, we announced the discontinuation of our opto-electronics division, which we had established as part of our acquisition of Lyte Optronics, Inc. in May 1999. The discontinued opto-electronics division manufactured blue, cyan, and green high-brightness light emitting diodes (HBLEDs) for the illumination markets, including full-color displays, wireless handset backlighting and
traffic signals, and also manufactured vertical cavity surface emitting lasers (VCSELs) and laser diodes for fiber optic communications and storage area networks. Accordingly, the results of operations of the opto-electronics division have been segregated from continuing operations and are reported separately as discontinued operations in our consolidated statements of operations for all periods presented. See Note 2 to our consolidated financial statements for details regarding the accounting for discontinued operations.
In September 2003, we completed the sale of substantially all of the assets of our opto-electronics business to Lumei Optoelectronics Corp. (Lumei) and Dalian Luming Science and Technology Group, Co., Ltd. for the Chinese Renminbi (RMB) equivalent of $9.6 million. A portion of the purchase price equal to $1.0 million was held in escrow to satisfy any claims that the purchasers might make for breaches of representations or warrantiesturned profitable by us. Of this total escrow, $750,000 could be released after the one year anniversary of the sale of the opto-electronics business and the remainder could be released after the second anniversary of the sale. To date, we have resolved all claims made against the $1.0 million that was held in escrow. For the year ended December 31, 2005 we recorded $550,000 gains from escrow, $9,000 gain from interest, and $58,000 in property tax refunds.
In June 2005, we completed the sale of a building located in Monterey Park, California. This asset had been classified as “assets held for sale” in the amount of $1.25 million on the consolidated balance sheet as of December 31, 2004. We received net proceeds on the sale of the property of approximately $1.3 million and accordingly recorded a gain on disposal of $53,000.
Impairment
Inventory Impairment
In September 2004, we wrote down $2.1 million of obsolete inventory. The wafers and ingots comprising the written-down inventory had been manufactured within the prior two and three years, respectively. During the third quarter of 2004, it became apparent that2006.
During 2006 we sold all of our revenues were likely to continue to decline in the fourthshares of common stock of Finisar Corporation generating net proceeds of $4.4 million and subsequent quarters due to the need to re-qualify our products with several customers. Furthermore, many new orders were for products with specifications that differedrecorded a gain of $3.3 million. In December 2006, we received net proceeds of $24.1 million from the featurespublic offering of the products held in inventory. In accordance with our policy, we evaluated the levels5,750,000 shares of our inventory,common stock, and determined that in lightJanuary 2007, we received net proceeds of current market conditions, we had excess and obsolete inventory based upon its age and quality, and thatanother $3.6 million from the inventory exceeded the sales projections as revised. Accordingly, we established a reserve for the excess. The majorityissuance of this inventory has not been scrapped. There were no significant inventory impairments for the year ended December 31, 2005.
Other Impairment
In the third quarter of 2004, we recorded an impairment charge of $210,000 to write down the valueadditional 862,500 shares of our investment in a private company. We made the decision to write down the investmentcommon stock as a result of the declining financial positionfollow-on stock offering. During the fourth quarter of the investee, evidenced2006 we completed an increase in our production capacity for 6 inch diameter GaAs substrates by fifty percent and increased capacity by an audit opinion with a going concern explanatory paragraph receivedadditional forty percent by the investee. The $210,000 was the remaining balancesecond quarter of this investment. No further write-downs were recorded in 2005.2007.
Revenue
|
|
|
| 2004 to 2005 |
| 2003 to 2004 |
| | | | | 2006 to 2007 | 2005 to 2006 | ||||||||||||||||||||||||||||||||||||
|---|---|---|---|---|---|---|---|---|---|---|---|---|---|---|---|---|---|---|---|---|---|---|---|---|---|---|---|---|---|---|---|---|---|---|---|---|---|---|---|---|---|---|---|---|---|---|---|---|---|
|
| Year Ended Dec. 31, |
| Increase |
|
|
| Increase |
|
|
| | Year Ended Dec. 31, | ||||||||||||||||||||||||||||||||||||
($ in thousands) |
| 2005 |
| 2004 |
| 2003 |
| (Decrease) |
| % Change |
| (Decrease) |
| % Change |
| ($ in thousands) | Increase (Decrease) | % Change | Increase (Decrease) | | |||||||||||||||||||||||||||||
| ($ in thousands) | 2007 | 2006 | 2005 | % Change | |||||||||||||||||||||||||||||||||||||||||||||
| $ | 20,831 |
| $ | 27,272 |
| $ | 28,354 |
|
| $ | (6,441 | ) |
|
| -23.6 | % |
|
| $ | (1,082 | ) |
|
| -3.8 | % |
| GaAs | $ | 40,219 | $ | 36,511 | $ | 20,831 | $ | 3,708 | 10.2 | % | $ | 15,680 | 75.3 | % | |||||||
InP |
| 906 |
| 1,588 |
| 2,075 |
|
| (682 | ) |
|
| -42.9 | % |
|
| (487 | ) |
|
| -23.5 | % |
| InP | 1,916 | 1,705 | 906 | 211 | 12.4 | 799 | 88.2 | ||||||||||||||||||
| Ge | Ge | 2,225 | 909 | 42 | 1,316 | 144.8 | 867 | 2,064.3 | |||||||||||||||||||||||||||||||||||||||||
Raw Materials |
| 4,794 |
| 6,499 |
| 4,118 |
|
| (1,705 | ) |
|
| -26.2 | % |
|
| 2,381 |
|
|
| 57.8 | % |
| Raw Materials | 13,790 | 5,293 | 4,752 | 8,497 | 160.5 | 541 | 11.4 | ||||||||||||||||||
Other |
| 5 |
| 95 |
| 166 |
|
| (90 | ) |
|
| -94.7 | % |
|
| (71 | ) |
|
| -42.8 | % |
| Other | 53 | 27 | 5 | 26 | 96.3 | 22 | 440.0 | ||||||||||||||||||
Total revenue |
| $ | 26,536 |
| $ | 35,454 |
| $ | 34,713 |
|
| $ | (8,918 | ) |
|
| -25.2 | % |
|
| $ | 741 |
|
|
| 2.1 | % |
| |||||||||||||||||||||
| Total revenue | $ | 58,203 | $ | 44,445 | $ | 26,536 | $ | 13,758 | 31.0 | % | $ | 17,909 | 67.5 | % | |||||||||||||||||||||||||||||||||||
Revenue decreased $8.9increased by $13.8 million or 25.2%31.0%, to $26.5$58.2 million in 2005 compared to $35.52007 from $44.4 million in 2004.2006. Total GaAs substrate revenue decreased $6.4increased $3.7 million, or 23.6%10.2%, to $20.8$40.2 million in 2005 compared to $27.22007 from $36.5 million in 2004. Overall sales of smaller diameter GaAs substrates decreased $7.2 million due to the earlier quality issues, the continuing pricing pressures causing prices to decline, overall lower demand from our wireless application customers and a decline in orders from customers who were qualifying our China-grown products. On the other hand, sales of larger diameter GaAs substrates, which were used exclusively to manufacture electronic devices, increased $1.4 million compared to 2004 due to an increase in orders from customers who have qualified our China-grown products. InP substrate revenue decreased $0.7 million, or 42.9%, to $0.9 million in 2005 compared to $1.6 million in 2004. InP substrates were used almost exclusively for telecommunications applications. The decrease in GaAs and InP substrate revenue was due to the pricing pressures causing prices to decline and overall lesser demand from our telecommunications and wireless application customers. Raw material sales decreased $1.7 million, or 26.2%, to $4.8 million in 2005 compared to $6.5 million in 2004. The decrease in raw material sales was due to customers’ lower demand, particularly for raw gallium and germanium dioxide.
Revenue from continuing operations increased $741,000, or 2.1%, to $35.5 million in 2004 compared to $34.7 million in 2003. Total GaAs substrate revenue decreased $1.1 million, or 3.8%, to $27.3 million in 2004 compared to $28.4 million in 2003.2006. Sales of 5 inch and 6 inch diameter GaAs substrates which were used exclusively$16.3 million in 2007 compared to manufacture electronic devices, decreased $1.9$16.7 million in 2006. The decrease of $0.4 million in larger diameter substrate revenue was due to less than expected orders from a few handset market customers and inventory adjustments. Total revenue increased $17.9 million or 36.1%67.5%, to $3.5$44.4 million in 2004 compared to $5.42006 from $26.5 million in 2003. InP2005.
Total GaAs substrate revenue decreased $0.5increased by $15.7 million, or 23.5%75.3%, to $1.6$36.5 million in 2004 compared to $2.12006 from $20.8 million in 2003.2005. Sales of 5 inch and 6 inch diameter GaAs substrates were $16.7 million in 2006 compared with $4.8 million in 2005. The decreaseincrease in GaAs and InPlarger diameter substrate revenue was due to the pricing pressures causing pricesfact that, while the GaAs device market grew in strength for both cellular and the WLAN (Wide Local Area Network) markets, the compound semiconductor industry had been experiencing capacity constraints. With our excess capacity and our ability to declineincrease capacity in a timely and overall lesser demandcost efficient manner, we were able to benefit from the overflow business from our telecommunicationscompetition.
Sales of 2 inch, 3 inch and wireless application customers. Raw material sales4 inch diameter GaAs substrates were $23.9 million in 2007 compared to $19.7 million in 2006. The increase in revenue from smaller diameter substrates was generally due to the continued market growth of LED laser diodes and commercial epitaxy. Sales of 2 inch, 3 inch and 4 inch diameter GaAs substrates were $19.7 million in 2006 compared with $15.9 million in 2005. The increase in revenue from smaller diameter substrates was generally due to the continued market growth of LED laser diodes and commercial epitaxy.
InP revenue increased $2.4by $211,000, or 12.4%, to $1.9 million in 2007 compared to $1.7 million in 2006. The increase in InP revenue was primarily due to a one-time sale of $251,000 indium scrap metal, while InP substrate revenue from customers in the optical networking industry decreased slightly. We do not expect significant near term changes in the market for InP. InP substrate revenue increased $0.8 million, or 57.8%88.2%, to $6.5$1.7 million in 2004 compared to $4.12006 from $0.9 million in 2003.2005 as a result of one large customer order for a government contract which was not repeated.
Ge substrate revenue increased by $1.3 million, or 144.8%, to $2.2 million in 2007 from $0.9 million in 2006. The increase in Ge substrate revenue was mainly due to a customer in Germany who has now qualified our product, as demand for photovoltaic and opto-electronic applications continues to increase. We had our first significant Ge substrate revenue in 2006, which increased $0.9 million, or 2,064.3%, to $0.9 million in 2006 from $42,000 in 2005. The increase in Ge substrate revenue was due to an increase in customers in the PRC that had qualified our product, as demand for photovoltaic applications was strong in the PRC.
Raw materials revenue increased by $8.5 million, or 160.5%, to $13.8 million in 2007 from $5.3 million in 2006. The increase in raw material salesmaterials revenue was primarily due to customers’ highersales of gallium to new customers in Japan and Europe, and increased demand particularlyby a customer in North America as the demand for gallium increased, as well as an increase in sales prices of raw materials. Raw materials revenue increased $0.5 million, or 11.4%, to $5.3 million in 2006 from $4.8 million in 2005. The increase in raw materials revenue was primarily due to sales of germanium dioxide to a new customer, and increased sales of gallium to existing customers. The new customer for germanium dioxide was located in North America, and germanium dioxide.had been purchasing consistently in 2006. Our raw materials business is increasingly becoming an important part of our business, both in terms of providing us protection against raw materials pricing increases and supply constraints, and in opportunities for sales of raw materials. Accordingly, we expect to continue to expand our raw materials sales efforts.
Two customers No customer represented greater than 10% revenue for the year ended December 31, 2007, while only one customer represented greater than 10% of our total revenue, totaling 12.8% for the year ended December 31, 2006. Two customers each represented greater than 10% of our total revenue, totaling 20.7% for the year ended December 31, 2005. No customer represented greater than 10% of product revenues for the years ended December 31, 2004 and 2003. Our top five customers represented 37.5%33.0%, 30.1%40.0%, and 28.9%37.5% of product revenue for the years ended December 31, 2005, 2004,2007, 2006, and 2003,2005, respectively.
Revenue by Geographic Region
|
|
|
| 2004 to 2005 |
| 2003 to 2004 |
| |||||||||||||||||||||
|
| Years Ended Dec. 31, |
| Increase |
|
|
| Increase |
|
|
| |||||||||||||||||
| 2005 |
| 2004 |
| 2003 |
| (Decrease) |
| % Change |
| (Decrease) |
| % Change |
| ||||||||||||||
|
| ($ in thousands) |
| |||||||||||||||||||||||||
North America* |
| $ | 5,168 |
| $ | 7,514 |
| $ | 12,009 |
|
| $ | (2,346 | ) |
|
| (31.2 | )% |
|
| $ | (4,495 | ) |
|
| (37.4 | )% |
|
% of total revenue |
| 19 | % | 21 | % | 35 | % |
|
|
|
|
|
|
|
|
|
|
|
|
|
|
|
| |||||
Europe |
| 6,186 |
| 6,840 |
| 5,638 |
|
| (654 | ) |
|
| (9.6 | ) |
|
| 1,202 |
|
|
| 21.3 |
|
| |||||
% of total revenue |
| 23 | % | 19 | % | 16 | % |
|
|
|
|
|
|
|
|
|
|
|
|
|
|
|
| |||||
Japan |
| 2,854 |
| 5,156 |
| 4,167 |
|
| (2,302 | ) |
|
| (44.6 | ) |
|
| 989 |
|
|
| 23.7 |
|
| |||||
% of total revenue |
| 11 | % | 15 | % | 12 | % |
|
|
|
|
|
|
|
|
|
|
|
|
|
|
|
| |||||
Taiwan |
| 3,843 |
| 8,397 |
| 7,055 |
|
| (4,554 | ) |
|
| (54.2 | ) |
|
| 1,342 |
|
|
| 19.0 |
|
| |||||
% of total revenue |
| 15 | % | 24 | % | 20 | % |
|
|
|
|
|
|
|
|
|
|
|
|
|
|
|
| |||||
Asia Pacific (excluding Japan and Taiwan) |
| 8,485 |
| 7,547 |
| 5,844 |
|
| 938 |
|
|
| 12.4 |
|
|
| 1,703 |
|
|
| 29.1 |
|
| |||||
% of total revenue |
| 32 | % | 21 | % | 17 | % |
|
|
|
|
|
|
|
|
|
|
|
|
|
|
|
| |||||
Total revenue |
| $ | 26,536 |
| $ | 35,454 |
| $ | 34,713 |
|
| $ | (8,918 | ) |
|
| (25.2 | )% |
|
| $ | 741 |
|
|
| 2.1 | % |
|
| | | | | 2006 to 2007 | 2005 to 2006 | ||||||||||||||||
|---|---|---|---|---|---|---|---|---|---|---|---|---|---|---|---|---|---|---|---|---|---|
| | Years Ended Dec. 31, | ||||||||||||||||||||
| | Increase (Decrease) | % Change | Increase (Decrease) | % Change | |||||||||||||||||
| | 2007 | 2006 | 2005 | ||||||||||||||||||
| | ($ in thousands) | ||||||||||||||||||||
| North America* | $ | 11,839 | $ | 13,029 | $ | 5,168 | $ | (1,190 | ) | (9.1 | )% | $ | 7,861 | 152.1 | % | ||||||
| % of total revenue | 20 | % | 29 | % | 19 | % | |||||||||||||||
| Europe | 9,930 | 8,365 | 6,186 | 1,565 | 18.7 | 2,179 | 35.2 | ||||||||||||||
| % of total revenue | 17 | % | 19 | % | 23 | % | |||||||||||||||
| Japan | 13,280 | 3,347 | 2,854 | 9,933 | 296.8 | 493 | 17.3 | ||||||||||||||
| % of total revenue | 23 | % | 8 | % | 11 | % | |||||||||||||||
| Taiwan | 9,329 | 7,647 | 3,843 | 1,682 | 22.0 | 3,804 | 99.0 | ||||||||||||||
| % of total revenue | 16 | % | 17 | % | 15 | % | |||||||||||||||
| Asia Pacific (excluding Japan and Taiwan) | 13,825 | 12,057 | 8,485 | 1,768 | 14.7 | 3,572 | 42.1 | ||||||||||||||
| % of total revenue | 24 | % | 27 | % | 32 | % | |||||||||||||||
| Total revenue | $ | 58,203 | $ | 44,445 | $ | 26,536 | $ | 13,758 | 31.0 | % | $ | 17,909 | 67.5 | % | |||||||
Sales to customers located outside of North America represented approximately 81%80%, 79%71%, and 65%81% of our revenue during 2007, 2006 and 2005, 2004respectively.
Revenue from customers located in North America decreased by $1.2 million, or 9.1%, to $11.8 million in 2007 from $13.0 million in 2006. This decrease in 2007 was caused mainly by a one-time purchase of $1.7 million of large diameter wafers by a customer in the fourth quarter of 2006 and 2003, respectively.a $0.2 million decrease in raw material sales, partially offset by $0.7 million in increased revenue from three large customers in 2007. We expect our North America revenue to increase substantially in 2008 based upon a supply agreement we signed in the fourth quarter of 2007 with IQE plc for $15.1 million, with an option to purchase an additional $3.5 million, primarily in 6-inches GaAs substrates.
Revenue from customers located in Europe increased by $1.6 million, or 18.7%, to $9.9 million in 2007 from $8.4 million in 2006. This increase resulted mainly from $1.9 million in increased sales to customers in Germany, which was mainly in Ge sales, $0.6 million in increased sales of raw materials to customers in the Netherlands, $0.3 million in increased sales of smaller diameter substrates to customers in Russia, partially offset by a $0.8 million decrease in sales to a major customer in the United Kingdom, as this customer moved to a new supplier, and $0.4 million decrease in sales to customers in France, as one major customer's end user delayed its purchases from us.
Revenue from customers in Japan increased by $9.9 million, or 296.8%, to $13.3 million in 2007 from $3.3 million in 2006. The increase mainly came from sales of raw materials to three new customers amounting to $7.1 million, while substrate sales to existing customers increased by $2.8 million, mainly in large diameter substrates.
Revenue from customers in Taiwan increased by $1.7 million, or 22.0%, to $9.3 million in 2007 from $7.6 million in 2006. We had increased sales of mostly small diameter substrates to three major existing customers in Taiwan of $2.6 million, partially offset by a $0.9 million decrease in revenue from a major customer who had transitioned to a new device and delayed purchases of our products in the third quarter of 2007 pending this transition. That customer encountered an issue with our substrates due to a change in the customer specifications, but resumed orders from us in the fourth quarter of 2007.
Revenue from customers in the Asia Pacific (excluding Japan and Taiwan) increased by $1.8 million, or 14.7%, to $13.8 million in 2007 from $12.1 million in 2006. Of this increase, sales to customers in the PRC increased by $2.5 million due to an increase in demand for raw materials and substrates, and sales to customers in Korea increased by $0.2 million, partially offset by decreased in sales to customers in Malaysia and Singapore by $0.9 million, mainly due to the relocation by one of our major customers of its headquarters from Singapore to North America resulting in our inclusion of revenue from this customer with revenue from customers located in North America.
Gross Margin
| | | | | 2006 to 2007 | 2005 to 2006 | ||||||||||||||||
|---|---|---|---|---|---|---|---|---|---|---|---|---|---|---|---|---|---|---|---|---|---|
| | Years Ended Dec. 31, | ||||||||||||||||||||
| | Increase (Decrease) | % Change | Increase (Decrease) | % Change | |||||||||||||||||
| | 2007 | 2006 | 2005 | ||||||||||||||||||
| | ($ in thousands) | ||||||||||||||||||||
| Gross profit | $ | 20,261 | $ | 12,736 | $ | 2,199 | $ | 7,525 | 59.1 | % | $ | 10,537 | 479.2 | % | |||||||
| Gross Margin % | 34.8 | % | 28.7 | % | 8.3 | % | |||||||||||||||
Gross margin increased to 32%34.8% of total revenue in 2005 compared with 21%2007 from 28.7% of total revenue in 2004. The increase2006. Gross margin in 2007 was primarily due to increasedpositively impacted by sales of approximately $2.2 million of GaAs substrateswafers that were previously fully reserved. Product mix also contributed to customers in Chinahigher gross margins as we sold InP scrap metal, as well as raw materials, both of which contributed higher gross margins. In addition, we had manufacturing equipment that has become fully depreciated since the third quarter of 2006, and Singapore, which products are being used in opto-electronics applications. The Taiwan revenue decreasedthe absence of depreciation expense for this equipment, partially offset by $4.6 million or 54.2%,depreciation on property, plant and equipment additions, contributed approximately 2.5 percentage points to $3.8 million in 2005 compared with $8.4 milliongross margin for 2004. The decrease in Taiwan and other geographic areas for our GaAs substrates was due to continuing pricing pressures causing average sales prices to decline, overall lower demand from our wireless application customers, and delays in orders from customers who had not yet qualified our China-grown products.the twelve months ended December 31, 2007.
International revenue increased during 2004 as compared to 2003 primarily due to sales growth of $1.2 million in Europe, $1.7 million in Asia Pacific, $1.3 million in Taiwan, and $1.0 million in Japan. The increase was the result of our continued penetration into the Asian markets, particularly Taiwan, Japan and China.
Gross Margin
|
|
|
| 2004 to 2005 |
| 2003 to 2004 |
| |||||||||||||||||||||
|
| Years Ended Dec. 31, |
| Increase |
|
|
| Increase |
|
|
| |||||||||||||||||
| 2005 |
| 2004 |
| 2003 |
| (Decrease) |
| % Change |
| (Decrease) |
| % Change |
| ||||||||||||||
|
| ($ in thousands) |
| |||||||||||||||||||||||||
Gross profit (loss) |
| $ | 2,199 |
| $ | (251 | ) | $ | 2,235 |
|
| $ | 2,450 |
|
|
| 976 | % |
|
| $ | (2,486 | ) |
|
| (111 | )% |
|
Gross Margin % |
| 8.3 | % | (0.7 | )% | 6.4 | % |
|
|
|
|
|
|
|
|
|
|
|
|
|
|
|
| |||||
Gross margin increased to 28.7% of total revenue in 2006 from 8.3% of total revenue in 2005 compared to negative 0.7% of revenue in 2004. The improvement in gross2005. Gross margin in 20052006 was due to the increased sales in the larger diameter wafers as demands increased, and thepositively impacted by sales of approximately $2.9 million of GaAs wafers that were previously fully reserved, wafers which accounted for revenueand by approximately $0.1 million as a result of approximately $2.1 million in 2005. In 2006, we may have a similar volume of sales of fully reserved wafers.
Gross margin decreased to negative 0.7% of revenue in 2004 compared to 6.4% of revenue in 2003. The decrease was primarily due to the following factors: (i) a $2.1 million charge for excess and obsolete inventory in the third quarter of 2004, (ii) an approximately $1.4 million charge incurred in connection with our settlement of our patent dispute with Sumitomo Electric Industries, Ltd. in the third quarter of 2004,
and (iii) the establishmentreversal of a sales return reserve established in 2004 as we favorably resolved an outstanding matter with a customer. In addition, we sold a greater amount of $745,000InP substrates and larger diameter GaAs wafers in 2006, which contributed higher gross margins. In December 2005, we reduced the first quarterworkforce at our Fremont, California facility to eliminate positions that we no longer required to support production, and this reduction accounted for approximately 1.5 percentage points to gross margin in 2006. In addition, we had manufacturing equipment that became fully depreciated in 2006, and the absence of 2004 relateddepreciation expense for this equipment contributed approximately 1.5 percentage points to our failure to follow certain testing requirements, which reduced revenues without affecting costsgross margin in 2006. Finally, higher substrates gross margins were also achieved through better slicing techniques, longer length ingot growth, shorter runtimes, and higher production volumes, partially offset by higher prices of revenues.raw materials for gallium and arsenic.
Selling, General and Administrative Expenses
|
|
| 2004 to 2005 |
| 2003 to 2004 |
| ||||||||||||||||||||||
|
| Years Ended Dec. 31, |
| Increase |
|
|
| Increase |
|
|
| |||||||||||||||||
|
| 2005 |
| 2004 |
| 2003 |
| (Decrease) |
| % Change |
| (Decrease) |
| % Change |
| |||||||||||||
|
| ($ in thousands) |
| |||||||||||||||||||||||||
SG&A expenses |
| $ | 12,955 |
| $ | 11,561 |
| $ | 10,475 |
|
| $ | 1,394 |
|
|
| 12.1 | % |
|
| $ | 1,086 |
|
|
| 10.4 | % |
|
% of total revenue |
| 48.8 | % | 32.6 | % | 30.2 | % |
|
|
|
|
|
|
|
|
|
|
|
|
|
|
|
| |||||
| | | | | 2006 to 2007 | 2005 to 2006 | |||||||||||||||
|---|---|---|---|---|---|---|---|---|---|---|---|---|---|---|---|---|---|---|---|---|
| | Years Ended Dec. 31, | |||||||||||||||||||
| | Increase (Decrease) | % Change | Increase (Decrease) | % Change | ||||||||||||||||
| | 2007 | 2006 | 2005 | |||||||||||||||||
| | ($ in thousands) | |||||||||||||||||||
| Selling, general and administrative expenses | $ | 13,746 | $ | 12,650 | $ | 12,955 | 1,096 | 8.7 | % | $ | (305 | ) | (2.4 | )% | ||||||
| % of total revenue | 23.6 | % | 28.5 | % | 48.8 | % | ||||||||||||||
Selling, general and administrative expenses increased $1.4 million to $12.9 million for 2005 compared with $11.6 million for 2004. The increase in absolute dollars and as a percentage of revenue was primarily due to $2.0 million of decommissioning expenses for our Fremont, California facilities, higher travel expenses of $337,000 as operations have moved resulting in more travel to China , higher recruiting expenses of $118,000 mainly in recruiting our new chief executive officer, partially offset by $556,000 lower insurance costs as operations have moved to China where rates are lower, $152,000 lower Delaware franchise tax using the alternative method, $137,000 lower sales commissions due to lower sales, and lower rates, and $127,000 lower bad debt expenses as collections and aging improved.
Selling, general and administrative expenses increased $1.1 million or 10.4%, to $11.6$13.8 million in 2004for 2007 compared to $10.5$12.7 million for 2006. The increase was primarily due to (i) $0.6 million higher legal expenses in 2003. As2007, including $0.3 million paid by us in connection with the settlement of the securities class action lawsuit reached on April 24, 2007, offset by our receipt in 2006 of a percentage$0.3 million refund from insurance, (ii) $0.5 million higher bad debt expenses, mainly from a $0.1 million increase to bad debt expense in 2007 for our slow-paying customers in Asia, compared to a $0.4 million bad debt recovery in 2006 following recovery of total revenue, selling,an expense in 2005 provided for an Asian customer, (iii) $0.4 million for increased consulting and audit fees for compliance with the Sarbanes-Oxley Act of 2002, (iv) $0.4 million for higher joint venture labor related costs, and (v) $0.2 million higher sales commission due to increased sales volume, partially offset by (vi) the absence in 2007 of $0.6 million decontamination fees on our property owned in Fremont, California, (vii) $0.3 million sales compensation expenses given to customers as compensation for their epitaxial costs on defective wafers supplied to them, and (viii) $0.1 million reduced depreciation and other expenses.
Selling, general and administrative expenses were 32.6% in 2004decreased $0.3 million to $12.7 million for 2006 compared to 30.2%$13.0 million for 2005. The decrease was primarily due to decreases of (i) $1.3 million for decontamination expenses as we prepared our U.S. property in 2003. The increaseFremont, California for sale, (ii) $0.8 million for bad debt expenses as we collected on past due accounts and improved aging, (iii) $0.3 million for legal fees reimbursed by our insurance company for fees incurred in selling, general and administrative expenses is primarily the result of increasedconnection with ongoing litigation, (iv) $0.2 million for legal and professional fees, with respect to our product testing investigation, the Sumitomo litigation settlement, and progress on our implementation(v) $0.1 million for recruiting fees, partially offset by increases of Section 404 of(vi) $0.5 million for compensation related payments, (vii) $0.5 million for stock-based compensation expense, (viii) $0.4 million for consulting fees for compliance with the Sarbanes-Oxley Act of 2002.2002, (ix) $0.3 million for customer compensation costs, (x) $0.3 million for sales commissions and other miscellaneous expenses, (xi) $0.2 million for consulting fees for corporate design and human resources, and (xii) $0.2 million for joint venture labor related costs.
Research and Development Expenses
|
|
| 2004 to 2005 |
| 2003 to 2004 |
| ||||||||||||||||||||||
|
| Years Ended Dec. 31, |
| Increase |
|
|
| Increase |
|
|
| |||||||||||||||||
|
| 2005 |
| 2004 |
| 2003 |
| (Decrease) |
| % Change |
| (Decrease) |
| % Change |
| |||||||||||||
|
| ($ in thousands) |
| |||||||||||||||||||||||||
R&D expenses |
| $ | 1,723 |
| $ | 1,479 |
| $ | 1,337 |
|
| $ | 244 |
|
|
| 16.5 | % |
|
| $ | 142 |
|
|
| 10.6 | % |
|
% of total revenue |
| 6.5 | % | 4.2 | % | 3.9 | % |
|
|
|
|
|
|
|
|
|
|
|
|
|
|
|
| |||||
| | | | | 2006 to 2007 | 2005 to 2006 | ||||||||||||||||
|---|---|---|---|---|---|---|---|---|---|---|---|---|---|---|---|---|---|---|---|---|---|
| | Years Ended Dec. 31, | ||||||||||||||||||||
| | Increase (Decrease) | % Change | Increase (Decrease) | % Change | |||||||||||||||||
| | 2007 | 2006 | 2005 | ||||||||||||||||||
| | ($ in thousands) | ||||||||||||||||||||
| Research and development expenses | $ | 1,699 | $ | 2,351 | $ | 1,723 | $ | (652 | ) | (27.7 | )% | $ | 628 | 36.4 | % | ||||||
| % of total revenue | 2.9 | % | 5.3 | % | 6.5 | % | |||||||||||||||
Research and development expenses decreased $0.7 million, or 27.7%, to $1.7 million for 2007, from $2.4 million for 2006 mainly from $0.4 million in savings in salary and related costs as a result of the retirement of Dr. Morris Young, our former chief technology officer. We only appointed a new chief technology officer in the fourth quarter of 2007. In 2007, we also had the absence of $0.4 million in severance payments that we incurred in 2006, partially offset by $0.1 million increased consulting fees to enhance our production facilities at one of our joint ventures.
Research and development expenses increased $244,000,$0.6 million, or 16.5%36.4%, to $2.4 million for 2006, from $1.7 million for 2005, compared with $1.5 million for 2004.2005. During 2005,2006, we incurred $64,000$0.4 million in severance payments to employees that had been performing research and development activities.Dr. Morris Young, our former chief technology officer who retired on December 31, 2006. We also incurred $0.2 million for stock-based compensation expense.
We believe that continued investment in product development is critical to attaining our strategic objectives of maintaining and enhancing our technology leadership, and have therefore appointed Dr. Morris Young as our chief technology officer.leadership. As a result, we expect research and development expenses to remain at the levels of recent quarters or tomodestly increase in future periods. Research2008 as we explore other methods to grow our crystals.
Impairment (recovery of impairment) on Assets Held for Sale, and development efforts during 2005 were focused primarilyRestructuring Charges (Benefit)
| | | | | 2006 to 2007 | 2005 to 2006 | ||||||||||||||||
|---|---|---|---|---|---|---|---|---|---|---|---|---|---|---|---|---|---|---|---|---|---|
| | Years Ended Dec. 31, | ||||||||||||||||||||
| | Increase (Decrease) | % Change | Increase (Decrease) | % Change | |||||||||||||||||
| | 2007 | 2006 | 2005 | ||||||||||||||||||
| | ($ in thousands) | ||||||||||||||||||||
| Impairment (recovery of impairment) on assets held for sale | $ | (481 | ) | $ | 1,417 | $ | — | $ | (1,898 | ) | (133.9 | )% | $ | 1,417 | NM | ||||||
| % of total revenue | (0.8 | )% | 3.2 | % | — | % | |||||||||||||||
| Restructuring charge (benefit) | $ | $ | (2 | ) | $ | 836 | $ | 2 | NM | $ | (838 | ) | (100.2 | )% | |||||||
| % of total revenue | — | % | 0.0 | % | 3.2 | % | |||||||||||||||
- NM:
- percentage not meaningful
Impairment (recovery of impairment) on improvingAssets Held for Sale
In the yieldsecond quarter of 2007, we benefited from a recovery of impairment on our U.S. property located in Fremont, California in connection with our adjustment of the fair value. We recorded a $481,000 market value adjustment after we entered into an agreement with an independent third party purchaser in June 2007 to purchase the property for estimated net proceeds of $5.1 million, after deducting estimated commission and surface qualityselling expenses. In the fourth quarter of our GaAs substrates,2007, that agreement was terminated and we entered into a new sales agreement with another independent third party purchaser to purchase this property for a similar amount. We expect these activitiesthe sale to continue.be completed in the first or second quarter of 2008. This property has been classified as "Assets held for sale" in the amount of $5.1 million on the consolidated balance sheet as of December 31, 2007.
Research and development expenses increased $142,000, or 10.6%, to $1.5 million in 2004 compared to $1.3 million in 2003. As a percentage of total revenue, research and development expenses were 4.2% in 2004 compared to 3.9% in 2003. As planned, we maintained our investment in product development in 2004 in order to improve our substrate manufacturing technologies.
40
Impairment and Restructuring Charges
|
|
| 2004 to 2005 |
| 2003 to 2004 |
| |||||||||||||||||||||||||||
|
| Years Ended Dec. 31, |
| Increase |
|
|
| Increase |
|
|
| ||||||||||||||||||||||
|
| 2005 |
| 2004 |
| 2003 |
| (Decrease) |
| % Change |
| (Decrease) |
| % Change |
| ||||||||||||||||||
|
| ($ in thousands) |
| ||||||||||||||||||||||||||||||
Impairment charges |
| $ | — |
| $ | 210 |
|
| $ | — |
|
|
| $ | (210 | ) |
|
| NM |
|
|
| $ | 210 |
|
|
| NM |
|
| |||
% of total revenue |
| — |
| 0.6 | % |
| — |
|
|
|
|
|
|
|
|
|
|
|
|
|
|
|
|
|
| ||||||||
Restructuring costs |
| $ | 836 |
| $ | 1,308 |
|
| $ | — |
|
|
| $ | (472 | ) |
|
| (36.1 | )% |
|
| $ | 1,308 |
|
|
| NM |
|
| |||
% of total revenue |
| 3.2 | % | 3.7 | % |
| — |
|
|
|
|
|
|
|
|
|
|
|
|
|
|
|
|
|
| ||||||||
NM: percentage not meaningful
Impairment Charges
In the third quarter of 2004,2006, we recordedincurred an impairment charge of $210,000$1.4 million to write down this asset held for sale as the valueproperty had been decontaminated and was being prepared for sale. That property had been classified as "Assets held for sale" in the amount of our investment in a private company. We made$4.7 million on the decision to write down the investmentconsolidated balance sheet as a result of the declining financial position of the investee, evidenced by an audit opinion with a going concern explanatory paragraph received by the investee. The $210,000 was the remaining balance of this investment. No further write-downs were recorded in 2005.December 31, 2006.
Restructuring Charges (Benefit)
In 2007 we had no restructuring charges. In 2006, we recognized a $2,000 benefit related to an adjustment to a prior accrual.
In March 2005, we announced that we would be reducing the workforce at our Beijing, China manufacturing facility by approximately 100 positions or approximately 15%. This measure was taken as part of our ongoing effort to reduce our cost structure and bring capacity in line with current market demand. Accordingly, we recorded a restructuring charge of $56,000 in March 20052006 relating to the reduction in work force, which we completed in June 2005.2005. We anticipate annual savings ofsaved approximately $0.3 million in payroll and related expense relating to this reduction in force.
In April 2005, we closed our Japan office as part of our ongoing effort to reduce our cost structure. Accordingly, we recorded restructuring charges of $98,000 and $9,000, in the second and third quarters of 2005, respectively, relating to the closure of our Japan office. We also anticipatesaved approximately $0.3 million in payroll and related expense annual savings of approximately $0.3 million.expense.
In December 2005, we further reduced the workforce at our Fremont, California facility by approximately 15 positions that are nowere longer required to support production and operations, or approximately 29 percent, over the next 120 days.percent. This measure was being taken as part of our ongoing effort to downsize our Fremont, California facility headcount. Accordingly, we recorded a restructuring charge of approximately $273,000$0.3 million in December 2005 related to the reduction in force for severance-related expenses from the reduction in force, all of which will be cash expenditures. We anticipate that theThe cash outflow from this charge to bewas incurred over the first two quarters commencing in the first quarter of 2006 and we expect to save2006. We saved approximately $0.9 million annually in payroll and related expenses. Also in December 2005, we recorded an additional restructuring charge of approximately $164,000,$0.2 million, primarily related to the final liquidation procedures of AXT’sAXT's Japan office so as to eliminate the remaining assets. There iswas no expectedfurther cash outflow offrom this charge.
Overall for the year ended December 31, 2005, wewe recorded restructuring charges of $236,000$0.2 million relating to leaselease costs associated with facilities located in California that are no longer required to support production. The remaining restructuring accrual for future lease payments related to abandoned U.S. facilities of $250,000 is expected to be$0.3 million was paid out through 2006, and iswas included on the accompanying consolidated balance sheet as accrued restructuring. Refer to Note 8 to our consolidated financial statements.
In 2004 in the second quarter, we announced plansInterest Income, Net
| | | | | 2006 to 2007 | 2005 to 2006 | ||||||||||||||||
|---|---|---|---|---|---|---|---|---|---|---|---|---|---|---|---|---|---|---|---|---|---|
| | Years Ended Dec. 31, | ||||||||||||||||||||
| | Increase (Decrease) | % Change | Increase (Decrease) | % Change | |||||||||||||||||
| | 2007 | 2006 | 2005 | ||||||||||||||||||
| | ($ in thousands) | ||||||||||||||||||||
| Interest income, net | $ | 704 | $ | 443 | $ | 516 | $ | 261 | 58.9 | % | $ | (73 | ) | (14.1 | )% | ||||||
| % of total revenue | 1.2 | % | 1.0 | % | 1.9 | % | |||||||||||||||
Interest income, net increased $0.3 million to cease all production activities in the United States and to manufacture our products only in China. In June 2004, we incurred a restructuring charge of $1.1$0.7 million for 2007 from $0.4 million for 2006 as a result of higher balances of our decision to close downinvestments which came from the net proceeds of our remaining manufacturing facilitiespublic offering of common stock, completed in the United States. In the thirdDecember 2006 and fourth quarter of 2004, we incurred additional restructuring charges of $231,000 for a total of $1.3 million in 2004. These charges comprised costs related to the reduction in work force effected in June 2004, and lease costs associated with the facilities located in California that are no longer required to support production. In aggregate, we eliminated 50 positions, 47 of which were production workers. As of December 31, 2004, we saved approximately $560,000 in annual payroll and related expenses.January 2007.
Interest Income, Net
|
|
| 2004 to 2005 |
| 2003 to 2004 |
| ||||||||||||||||||||||
|
| Years Ended Dec. 31, |
| Increase |
|
|
| Increase |
|
|
| |||||||||||||||||
|
| 2005 |
| 2004 |
| 2003 |
| (Decrease) |
| % Change |
| (Decrease) |
| % Change |
| |||||||||||||
|
| ($ in thousands) |
| |||||||||||||||||||||||||
Interest income, net |
| $ | 516 |
| $ | 262 |
| $ | 172 |
|
| $ | 254 |
|
|
| 96.9 | % |
|
| $ | 90 |
|
|
| 52.3 | % |
|
% of total revenue |
| 1.9 | % | 0.7 | % | 0.5 | % |
|
|
|
|
|
|
|
|
|
|
|
|
|
|
|
| |||||
Interest income, net increased $254,000decreased $0.1 million to $516,000$0.4 million for 2005 compared with $262,0002006 from $0.5 million for 20042005 as a result of our lower debt levels as we continued to pay downhigher interest rates on our debt. and lower overall cash balances.
InterestOther Income and (Expense), Net
| | | | | 2006 to 2007 | 2005 to 2006 | ||||||||||||||||
|---|---|---|---|---|---|---|---|---|---|---|---|---|---|---|---|---|---|---|---|---|---|
| | Years Ended Dec. 31, | ||||||||||||||||||||
| | Increase (Decrease) | % Change | Increase (Decrease) | % Change | |||||||||||||||||
| | 2007 | 2006 | 2005 | ||||||||||||||||||
| | ($ in thousands) | ||||||||||||||||||||
| Other income and (expense), net | $ | 16 | $ | 2,709 | $ | (910 | ) | $ | (2,693 | ) | (99.4 | )% | $ | 3,619 | 397.7 | % | |||||
| % of total revenue | 0.0 | % | 6.1 | % | (3.4 | )% | |||||||||||||||
Other income and expense, net, was $16,000 in 2007 compared to other income and expense, net, of $2.7 million in 2006. Other income, net increased $90,000, or 52.3%, to $262,000 in 2004 compared to $172,000 in 2003. The increase in interest income, net reflected the absence of equipment financing charges. By the end of 2003, we had repaid $10.1 million in equipment lease and loan debt.
Other (Expense) and Income, Net
|
|
| 2004 to 2005 |
| 2003 to 2004 |
| ||||||||||||||||||||||
|
| Years Ended Dec. 31, |
| Increase |
|
|
| Increase |
|
|
| |||||||||||||||||
|
| 2005 |
| 2004 |
| 2003 |
| (Decrease) |
| % Change |
| (Decrease) |
| % Change |
| |||||||||||||
|
| ($ in thousands) |
| |||||||||||||||||||||||||
Other (expense) and income, net |
| $ | (910 | ) | $ | 94 |
| $ | (1,688 | ) |
| $ | (1,004 | ) |
|
| (1068 | )% |
|
| $ | 1,782 |
|
|
| 105.6 | % |
|
% of total revenue |
| (3.4 | )% | 0.3 | % | (4.9 | )% |
|
|
|
|
|
|
|
|
|
|
|
|
|
|
|
| |||||
Other expense was $910,000$16,000 for 2005 compared with other income of $94,000 for 2004. The change from other income to other expense was mainly2007 primarily due to an increase ina realized gain of $1.0 million on the sale of investments, receipt of $0.3 million mainly comprising of insurance proceeds and sale of fully depreciated assets, partially offset by a $1.0 million expense incurred from our minority interest’s shareinterests in our joint ventures, of $393,000,and a $0.3 million expense for foreign exchange losses primarily related to the Japanese yen of $238,000 and to the Chinese renminbi of $44,000, and $237,000 of other income in 2004 received from a customer to terminate a supply guarantee contract, and other losses on asset and marketable security disposals of $93,000.yen.
Other income and expense, net, was $94,000$2.7 million in 20042006 compared to other expense, net, of $1.7$0.9 million in 2003.2005. Other income, net was $2.7 million for 2006 primarily due to a realized gain of $3.3 million on the sale of all of our shares of common stock of Finisar Corporation, partially offset by expenses incurred from our minority interests in our joint ventures. Other expense was $0.9 million for 2005 due to $0.7 million for minority interests in 2003 included a charge of $2.1our joint ventures, and $0.2 million for foreign exchange losses primarily related to the write-down of investments we held in two privately held U.S. companies. In 2004, other (expense) comprised of foreign exchange gain (loss) and minority interests from our China joint ventures was offset by a gain of $237,000 as a result of a customer’s forfeiture of deposits originally made in connection with the program we launched in late 2000 with selected customers to guarantee volume delivery of substrates. We terminated all remaining obligations under the program with this customer by mutual consent.Japanese yen.
Minority interest in earnings of consolidated subsidiaries is included in other (expense)income and income,(expense), net and for the years ended December 31, 2005, 2004,2007, 2006, and 20032005 were ($660,000),1.9) million ($267,000)1.0) million, and ($4,000),0.7) million, respectively, as the consolidated subsidiaries’subsidiaries' profitability increased.
Provision (benefit) for Income Taxes
|
|
| 2004 to 2005 |
| 2003 to 2004 |
| ||||||||||||||||||||||||
|
| Years Ended Dec. 31, |
| Increase |
|
|
| Increase |
|
|
| |||||||||||||||||||
|
| 2005 |
| 2004 |
| 2003 |
| (Decrease) |
| % Change |
| (Decrease) |
| % Change |
| |||||||||||||||
|
| ($ in thousands) |
| |||||||||||||||||||||||||||
Provision (benefit) for income taxes |
| $ | (950 | ) | $ | 71 |
|
| $ | — |
|
|
| $ | (1,021 | ) |
|
| (1438 | )% |
|
| $ | 71 |
|
|
| NM |
|
|
% of total revenue |
| 3.6 | % | 0.2 | % |
| — |
|
|
|
|
|
|
|
|
|
|
|
|
|
|
|
|
|
| |||||
| | | | | 2006 to 2007 | 2005 to 2006 | ||||||||||||||||
|---|---|---|---|---|---|---|---|---|---|---|---|---|---|---|---|---|---|---|---|---|---|
| | Years Ended Dec. 31, | ||||||||||||||||||||
| | Increase (Decrease) | % Change | Increase (Decrease) | % Change | |||||||||||||||||
| | 2007 | 2006 | 2005 | ||||||||||||||||||
| | ($ in thousands) | ||||||||||||||||||||
| Provision (benefit) for income taxes | $ | 728 | $ | (1,454 | ) | $ | (950 | ) | $ | 2,182 | 150.1 | % | $ | (504 | ) | (53.1 | )% | ||||
| % of total revenue | 1.3 | % | 3.3 | % | 3.6 | % | |||||||||||||||
NM: percentage not meaningful
Provision for income taxes for 2007 was $728,000, which was related to our foreign subsidiaries. In 2005, the Internal Revenue Service closed its examination of our tax return for the 2002 tax year, including the calculation of our 1999 and 2000 net operating loss carry back. As a result, of this, we reversed approximately $2.1 million and $1.1 million of income tax payable accrued for potential exposures relating to those years. This amount is2006 and 2005, respectively. These amounts are shown as a benefitbenefits from income taxes in 2006 and 2005. ProvisionThe other amounts in 2006 and 2005 relate to provisions for income taxes for 2004 was $71,000, which was related to our foreign subsidiaries. Due to our continuing operating losses and uncertainty regarding our future profitability, we recorded a full valuation allowance against our net deferred tax assets of $53.7 million in 2007, $49.9 million in 2006, and $50.9 million in 2005, and $38.8 million in 2004.2005.
Gain or Loss from Discontinued Operations
|
|
| 2004 to 2005 |
| 2003 to 2004 |
| ||||||||||||||||||||||
|
| Years Ended December 31, |
| Increase |
|
|
| Increase |
|
|
| |||||||||||||||||
|
| 2005 |
| 2004 |
| 2003 |
| (Decrease) |
| % Change |
| (Decrease) |
| % Change |
| |||||||||||||
|
| ($ in thousands) |
| |||||||||||||||||||||||||
Gain (loss) from discontinued operations |
| $ | 544 |
| $ | 891 |
| $ | (15,638 | ) |
| $ | (347 | ) |
|
| (38.9 | )% |
|
| $ | 16,529 |
|
|
| 105.7 | % |
|
| | | | | 2006 to 2007 | 2005 to 2006 | |||||||||||||||
|---|---|---|---|---|---|---|---|---|---|---|---|---|---|---|---|---|---|---|---|---|
| | Years Ended December 31, | |||||||||||||||||||
| | Increase (Decrease) | % Change | Increase (Decrease) | % Change | ||||||||||||||||
| | 2007 | 2006 | 2005 | |||||||||||||||||
| | ($ in thousands) | |||||||||||||||||||
| Gain (loss) from discontinued operations, net of tax | $ | — | $ | 18 | $ | 544 | $ | (18 | ) | NM | $ | (526 | ) | (96.7 | )% | |||||
- NM:
- percentage not meaningful
In the first quarter of 2007, we dissolved the corporation that previously operated our discontinued operations and transferred the cash balance to our continuing operations. Accordingly, we no longer have discontinued operations. In 2006, we recorded $18,000 in interest income on cash balances held in discontinued operations.
In 2005, the $0.5 million gain from discontinued operations iswas made up of a gain of $559,000$0.6 million, which was the remaining portion of the first $750,000$0.8 million held in escrow due to us from the sale of our opto-electronics business, to Lumei Optoelectronics Corp. and includes $9,000 interest, $58,000 in property tax refunds, and a gain of $53,000 from the sale of a building located in Monterey Park, California. During the fourth quarter we recorded a loss of $126,000 as a result of consulting fees of $52,000, rental accruals of $31,000, tax payments of $23,000, and $20,000 for accounts receivables written off.
In 2004, we realized a $419,000 gain on discontinued opto-electronics operations as a result of the partial release of escrow funds. Also in 2004, we entered into an agreement with a real estate developer for the purchase of our discontinued opto-electronics’ property held for sale and realized a gain of $250,000 reflecting an adjustment to the realizable market value of the property. The remaining gain of $222,000 was a result of our reversal of accrued liabilities of general and administrative expenses no longer required. Loss from our discontinued opto-electronics division for 2003 was $15.6 million, which included a loss on disposal of $9.5 million and the operating loss of $6.1 million. Loss from our discontinued opto-electronics division for 2002 was $26.2 million, which included the operating loss and certain impairment charges for a total of $34.6 million, partially offset by a benefit$0.1 million in expenses for income taxes of $8.4 million. See further discussion under “Results of Operations—Overview” elsewhere in Management’s Discussionconsulting fees, rent and Analysis of Financial Condition and Results of Operations of this Form 10-K.
American Jobs Creation Act of 2004—Repatriation of Foreign Earnings
The American Jobs Creation Act of 2004 (the “Jobs Act”), enacted on October 22, 2004, allows us to repatriate earnings from our foreign subsidiaries at a reduced tax rate. Under the Jobs Act, we may elect, for one taxable year, an 85% dividends received deduction for eligible dividends from our foreign subsidiaries. The deduction would result in an approximate 5.25% federal tax rate on the repatriatedpayments.
earnings. To qualify for the deduction, the repatriated earnings must be reinvested in the United States pursuant to a domestic reinvestment plan established by our chief executive officer and approved by the company’s board of directors. Certain other criteria in the Jobs Act must be satisfied as well. We may elect to apply this provision to qualifying earnings repatriations in fiscal 2006. We are in the process of evaluating whether we will repatriate foreign earnings under the repatriation provisions of the Jobs Act.
We are not yet in a position to determine the impact of a qualifying repatriation, should we choose to make one, on our income tax expense for fiscal 2006, the amount of our indefinitely reinvested foreign earnings, or the amount of our deferred tax liability with respect to foreign earnings.
Liquidity and Capital Resources
| Years Ended December 31, |
| | Years Ended December 31, | ||||||||||||||||||||
|---|---|---|---|---|---|---|---|---|---|---|---|---|---|---|---|---|---|---|---|---|---|---|---|---|
|
| 2005 |
| 2004 |
| 2003 |
| | 2007 | 2006 | 2005 | |||||||||||||
|
| ($ in thousands) |
| | ($ in thousands) | |||||||||||||||||||
Net cash provided by (used in): |
|
|
|
|
|
|
| Net cash provided by (used in): | ||||||||||||||||
Operating activities |
| $ | (7,746 | ) | $ | (340 | ) | $ | 6,269 |
| ||||||||||||||
Investing activities |
| 13,886 |
| (7,846 | ) | 13,723 |
| |||||||||||||||||
Financing activities |
| (792 | ) | (4,216 | ) | (9,647 | ) | |||||||||||||||||
| Operating activities | $ | 1,320 | $ | (10,263 | ) | $ | (7,746 | ) | ||||||||||||||||
| Investing activities | (3,514 | ) | (15,809 | ) | 13,886 | |||||||||||||||||||
| Financing activities | 3,924 | 24,248 | (792 | ) | ||||||||||||||||||||
Effect of exchange rate changes |
| 7 |
| 180 |
| 197 |
| Effect of exchange rate changes | 534 | 468 | 7 | |||||||||||||
Net change in cash and cash equivalents |
| 5,355 |
| (12,222 | ) | 10,542 |
| Net change in cash and cash equivalents | 2,264 | (1,356 | ) | 5,355 | ||||||||||||
Cash and cash equivalents—beginning period |
| 12,117 |
| 24,339 |
| 13,797 |
| Cash and cash equivalents—beginning period | 16,116 | 17,472 | 12,117 | |||||||||||||
Cash and cash equivalents—end of period |
| 17,472 |
| 12,117 |
| 24,339 |
| Cash and cash equivalents—end of period | 18,380 | 16,116 | 17,472 | |||||||||||||
Short-term investments—end of period |
| 5,555 |
| 20,062 |
| 14,669 |
| Short-term investments—end of period | 20,825 | 19,428 | 5,555 | |||||||||||||
Total cash, cash equivalents and short-term investments |
| $ | 23,027 |
| $ | 32,179 |
| $ | 39,008 |
| Total cash, cash equivalents and short-term investments | $ | 39,205 | $ | 35,544 | $ | 23,027 | |||||||
We consider cash and cash equivalents, and short-term investments as liquid and available for use. Short-term investments are comprised of government bonds and high-grade commercial debt instruments. Also historically included in short-term investments iswas our investment in common stock of Finisar Corporation, a United States publicly-traded company. During 2006 we sold all of our shares of common stock of Finisar Corporation generating net proceeds of $4.4 million and recorded a gain of $3.3 million, which was included in other income (expense). As of December 31, 2005,2007, our principal sources of liquidity were $23.0$39.2 million in cash and cash equivalents and short-term investments, excluding restricted deposits.
Cash and cash equivalents and short-term investments, excluding $2.4 million and $2.7 million for our investment in Finisar common stock as of December 31, 2005 and December 31, 2004, respectively, decreased $8.9increased $3.7 million to $20.6$39.2 million as of December 31, 2005 compared with $29.52007 from $35.5 million as of December 31, 2004.2006. The combined decreaseincrease in cash and cash equivalents and short-term investments was primarily due to the net proceeds of $3.6 million received from the public offering of 862,500 shares of our common stock in January 2007 and the generation of funds from our operations, partially offset by the purchase of machinery and equipment of $2.3$3.7 million, and payments of long-term debt of $0.7$0.6 million.
Net cash provided by operating activities of $1.3 million for 2007 was primarily comprised of our net income of $5.3 million, adjusted for non-cash items of depreciation of $1.5 million, stock-based compensation of $0.5 million, partially offset by a realized gain on sale of investments of $1.1 million, a recovery of impairment on assets held for sale of $0.5 million, and the continual fundingby a net increase of our operations.
$4.4 million in assets and liabilities. The decreasenet increase in operating cash flowassets and liabilities of $4.4 million resulted from a $4.3 million increase in 2005, as compared with 2004 included our $1.4inventories, net, a $2.4 million payment to Sumitomo Electric Industries, Ltd.increase in connection with the settlement of our litigation and cross-license fee with them, $1.2 million decommissioning costs for our Fremont, California facilities, and $1.2 million for increases in our accounts receivable, net, and a $0.9 million increase in other assets, partially offset by a $1.0 million increase in other long-term liabilities, primarily minority interests, a $0.9 million increase in accrued liabilities, primarily for warranty reserves and accounting fees, a $0.6 million decrease in prepaid expenses, primarily for insurance premiums, a $0.5 million increase in accounts payable, and a $0.2 million increase in income taxes payable. Inventories, net, increased $4.3 million, or 21.1% to $24.8 million as of December 31, 2007 from $20.3 million as of December 31, 2006, as we increased inventory in raw materials, work in process and finished goods to increase production in anticipation of increased forecast sales. Accounts receivable, net, increased by $2.4 million, or 24.3%, to $12.1 million as of December 31, 2007 from $9.7 million as of December 31, 2006. The increase was primarily a result of our increased fourth quarter 2005 sales, partially offset by an increase in our accounts payable of $1.2 million primarily for the accrual of inventory in transit at December 31, 2005.
Net accounts receivable increased by $1.2 million, or 30.0%, to $5.2allowances of $0.4 million as of December 31, 20052007 compared with $4.0to $0.1 million as of December 31, 2004. The increase reflects improved fourth quarter2006 as we provided for our slow paying Asian customers. Our days sales in 2005 compared to the same period in 2004, as well as decreased accounts receivable allowances of $619,000outstanding was 64 days as of December 31, 20052007 compared to $1,087,00068 days as of December 31, 2004 reflecting continuous improvements in our collection efforts from customers.2006.
Net inventories decreased $0.3 million, or 1.9% to $16.2 million as of December 31, 2005 compared with $16.5 million as of December 31, 2004. We adopted a strategy of using inventory to conserve cash and we are expecting to continue to decrease our levels of inventory.
Net cash provided by operating activities was $1.3 million in 2007, compared to net cash used in operations of $10.3 million in 2006, which was primarily comprised of our net income of $0.9 million, adjusted for non-cash items of depreciation of $2.6 million, stock-based compensation of $0.8 million, a loss on disposal of property, plant and equipment of $0.1 million, impairment of assets held for sale of $1.4 million, which was offset by a net increase of $12.8 million in assets and liabilities and a realized gain of $3.3 million.
Net cash used in investing activities of $13.9$3.5 million for the year ended December 31, 20052007 included proceeds from the salenet purchases of our Monterey Park, CA property of $1.3 million, net sales of high grade investment securities totaling $14.1$0.3 million, net purchases of property and equipment of $3.7 million, partially offset by a decrease in our restricted deposits of $0.8$0.5 million.
Net cash used in investing activities of $15.8 million partially offset byfor the year ended December 31, 2006 included net purchases of investment securities totaling $11.8 million, net purchases of property and equipment of $2.3$4.3 million, partially offset by a decrease in our restricted deposits of $0.3 million.
We do not have any plans to initiate any major new capital spending projects in 2006. We are currently completing certain projectsexpanding capacity at our China facilities and we expect to invest up to approximately $4.2$5.8 million in capital expansion and other projects in 20062008 related to our China facilities. We believe that our existing and planned facilities and equipment are sufficient to fulfill current and expected future orders.
Net cash used inprovided by financing activities of $0.8$3.9 million for the year ended December 31, 20052007 consisted of payments of $0.7$3.6 million related to long-term borrowings and $0.2 million for the repurchase of our common stock under our 10b5-1 plan, and partially offset by $0.1 millionnet proceeds from the issuance of 862,500 shares of common stock.
In December 2004, we reachedstock as a final settlementresult of our litigation with Sumitomo Electric Industries, Ltd. (SEI), which includesDecember 2006 public stock offering, $0.9 million from the proceeds from the exercise of employee stock options, partially offset by payments of $0.6 million related to long-term borrowings.
Net cash provided by financing activities of $24.2 million for the year ended December 31, 2006 consisted of $24.1 million net proceeds from the issuance of 5,750,000 shares of common stock as a global intellectual property cross-licensing agreement. We recorded a chargeresult of approximately $1.4our December 2006 public stock offering, $0.6 million infrom the quarter ended September 30, 2004 in connection with this settlement. Underproceeds from the termsexercise of the settlement, we made a paymentemployee stock options, partially offset by payments of $0.4 million related to SEI in the amount of Japanese Yen one hundred and forty-seven million (¥147,000,000) on January 4, 2005, and we will make on-going royalty payments through 2012 on certain products sold by AXT in Japan. Subsequent to that payment, SEI dropped the litigation in Japan and we abandoned the interference proceedings in the U.S.long-term borrowings.
We believe that we have adequate cash and investments to meet our needs over the next 12 months. If our sales decrease, however, our ability to generate cash from operations will be adversely affected which could adversely affect our future liquidity, require us to use cash at a more rapid rate than expected, and require us to seek additional capital. There can be no assurance that such additional capital will be available or, if available it will be at terms acceptable to us. Cash from operations could be affected by various risks and uncertainties, including, but not limited to those set forth below under “Risk Factors” in Item 1A1A. "Risk Factors" above.
Off-Balance Sheet Arrangements
We do not have never entered into any off-balance sheet financing arrangements and have never established any special purpose entities. We have not entered into any options on non-financial assets.
We previously had entered into contracts to supply several large customers with GaAs wafers. The contractssubstrates that guaranteed delivery of a certain number of wafers between January 1, 2001 and December 31, 2004. The contract sales prices were subject to review quarterly and could be adjusted in the event that raw material prices changed. In the event of non-delivery of the determined wafer quantities in any monthly delivery period, we could be subject to non-performance penalties of between 5% and 10% of the value of the delinquent monthly deliveries. We have not received any claims for non-performance penalties due to non-delivery.2005. As of December 31, 2005,2007, we havehad met all of our current delivery obligations under these contracts and the contracts have expired.no future obligations pursuant thereto. Partial prepayments received for these supply contracts totaling $125,000 and $130,000 arewas included in accrued liabilitiescustomer prepayments in the accompanying condensed consolidated balance sheetssheet as of December 31, 2005 and 2004, respectively.2006.
We indemnify certain customers for attorney fees and damages and costs awarded against these parties in certain circumstances if our products are found to infringe certain patents and they are sued by the patent holder and awarded damages. There are limits on and exceptions to our potential liability for
indemnification relating to intellectual patent infringement claims. We cannot estimate the amount of potential future payments, if any, that we might be required to make as a result of these agreements. To date, we have not paid any claim or been required to defend any action related to our indemnification obligations, and accordingly, we have not accrued any amounts for such indemnification obligations. However, we may record charges in the future as a result of these indemnification obligations.
Contractual Obligations
As of December 31, 2005,2007, the credit facility maintained by us with a bank included a letter of credit supporting repayment of our industrial bonds with an outstanding amount of approximately $7.5$6.7 million. We have pledged and placed certain investment securities with an affiliate of the bank as
additional collateral for this facility. We have also pledged certain investments for a credit facility for our workers compensation insurance policy for portions of 2003. Accordingly, $7.5$6.7 million of our cash and short-term investments are restricted.
We lease certain office space, manufacturing facilities and property under long-term operating leases expiring at various dates through March 2013. On March 11, 2003, we completed the sale of our property located at 4281 Technology Drive, Fremont, California, for $6.3 million. Net cash proceeds from the sale were $5.2 million. The gain incurred by us on this transaction was less than $15,000. Under the terms of the sale agreement, we have agreed to lease back the property for a ten-year period. Accordingly, on March 11, 2003, we signed an operating lease for this property through March 2013. Total rent expensesexpense under these operating leases were approximately $1.3$0.5 million, $1.3$0.9 million and $1.2$1.3 million for years ended December 31, 2005, 20042007, 2006 and 2003,2005, respectively.
The following table summarizes our contractual obligations as of December 31, 20052007 (in thousands):
| Payments due by period |
| Payments due by period | ||||||||||||||||||||||||||||||||||||||||
|---|---|---|---|---|---|---|---|---|---|---|---|---|---|---|---|---|---|---|---|---|---|---|---|---|---|---|---|---|---|---|---|---|---|---|---|---|---|---|---|---|---|---|---|
Contractual Obligations |
|
|
| Total |
| Less than |
| 1-3 |
| 3-5 |
| More than |
| Total | Less than 1 year | 1-3 years | 3-5 years | More than 5 years | |||||||||||||||||||||||||
Long-term debt | Long-term debt |
| $ | 7,720 |
|
| $ | 300 |
|
| $ | 1,240 |
| $ | 900 |
|
| $ | 5,280 |
|
| $ | 6,700 | $ | 450 | $ | 900 | $ | 750 | $ | 4,600 | ||||||||||||
Operating leases | Operating leases |
| 5,517 |
|
| 940 |
|
| 2,091 |
| 1,530 |
|
| 956 |
|
| 3,932 | 714 | 1,486 | 1,576 | 156 | ||||||||||||||||||||||
| Less: Sublease income | (1,051 | ) | (188 | ) | (393 | ) | (416 | ) | (54 | ) | |||||||||||||||||||||||||||||||||
| Purchase obligation | 4,920 | 4,920 | — | — | — | ||||||||||||||||||||||||||||||||||||||
Total | Total |
| $ | 13,237 |
|
| $ | 1,240 |
|
| $ | 3,331 |
| $ | 2,430 |
|
| $ | 6,236 |
|
| $ | 14,501 | $ | 5,896 | $ | 1,993 | $ | 1,910 | $ | 4,702 | ||||||||||||
Selected Quarterly Results of Operations
The following table sets forth unaudited quarterly results for the eight quarters ended December 31, 2007. We believe that all necessary adjustments, consisting only of normal recurring adjustments, have been included in the amounts stated below to present fairly such quarterly information. The operating results for any quarter are not necessarily indicative of results for any subsequent period.
| | Quarters Ended | ||||||||||||||||||||||||||
|---|---|---|---|---|---|---|---|---|---|---|---|---|---|---|---|---|---|---|---|---|---|---|---|---|---|---|---|
| | Dec. 31, 2007 | Sept. 30, 2007 | June 30, 2007 | Mar. 31, 2007 | Dec. 31, 2006 | Sept. 30, 2006 | June 30, 2006 | Mar. 31, 2006 | |||||||||||||||||||
| Revenue | $ | 17,564 | $ | 14,474 | $ | 13,639 | $ | 12,526 | $ | 13,072 | $ | 12,547 | $ | 10,355 | $ | 8,471 | |||||||||||
| Cost of revenue | 12,270 | 9,944 | 8,607 | 12,270 | 8,084 | 9,068 | 7,596 | 6,961 | |||||||||||||||||||
| Gross profit | 5,294 | 4,530 | 5,032 | 5,405 | 4,988 | 3,479 | 2,759 | 1,510 | |||||||||||||||||||
| Operating expenses: | |||||||||||||||||||||||||||
| Selling, general and administrative | 3,218 | 3,082 | 3,743 | 3,703 | 2,926 | 2,641 | 3,853 | 3,230 | |||||||||||||||||||
| Research and development | 508 | 383 | 348 | 460 | 854 | 392 | 571 | 534 | |||||||||||||||||||
| Impairment (recovery of impairment) on assets held for sale | — | — | (481 | ) | — | — | 1,417 | — | — | ||||||||||||||||||
| Restructuring charge (benefit) | — | — | — | — | — | — | — | (2 | ) | ||||||||||||||||||
| Total operating expenses | 3,726 | 3,465 | 3,610 | 4,163 | 3,780 | 4,450 | 4,424 | 3,762 | |||||||||||||||||||
| Income (loss) from continuing operations | 1,568 | 1,065 | 1,422 | 1,242 | 1,208 | (971 | ) | (1,665 | ) | (2,252 | ) | ||||||||||||||||
| Interest income, net | 153 | 102 | 225 | 224 | 101 | 103 | 111 | 128 | |||||||||||||||||||
| Other income and (expense), net | 455 | (156 | ) | (272 | ) | (11 | ) | 1,016 | 641 | 814 | 238 | ||||||||||||||||
| Income (loss) from continuing operations before provision (benefit) for income taxes | 2,176 | 1,011 | 1,375 | 1,455 | 2,325 | (227 | ) | (740 | ) | (1,886 | ) | ||||||||||||||||
| Provision (benefit) for income taxes | 302 | 153 | 162 | 111 | (1,048 | ) | (862 | ) | 138 | 318 | |||||||||||||||||
| Income (loss) from continuing operations | 1,874 | 858 | 1,213 | 1,344 | 3,373 | 635 | (878 | ) | (2,204 | ) | |||||||||||||||||
| Discontinued operations: | |||||||||||||||||||||||||||
| Gain from discontinued operations, net of tax | — | — | — | — | 11 | 4 | 2 | 1 | |||||||||||||||||||
| Net income (loss) | $ | 1,874 | $ | 858 | $ | 1,213 | $ | 1,344 | $ | 3,384 | $ | 639 | $ | (876 | ) | $ | (2,203 | ) | |||||||||
| Income (loss) per share—basic | $ | 0.06 | $ | 0.03 | $ | 0.04 | $ | 0.04 | $ | 0.14 | $ | 0.03 | $ | (0.04 | ) | $ | (0.04 | ) | |||||||||
| Income (loss) per share—diluted | $ | 0.06 | $ | 0.03 | $ | 0.04 | $ | 0.04 | $ | 0.13 | $ | 0.02 | $ | (0.04 | ) | $ | (0.04 | ) | |||||||||
| Shares used in computing income (loss) per share—basic | 30,337 | 30,150 | 29,943 | 29,798 | 24,009 | 23,158 | 23,052 | 22,986 | |||||||||||||||||||
| Shares used in computing income (loss) per share—diluted | 31,550 | 31,464 | 31,142 | 31,324 | 25,543 | 24,378 | 23,052 | 22,986 | |||||||||||||||||||
46
Recent Accounting Pronouncements
In November 2004,December 2007, the Financial Accounting Standards Board (“FASB”("FASB") issued Statement of Financial Accounting Standards ("SFAS") No. 151, “Inventory Costs—An Amendment of ARB No. 43, Chapter 4” (“141 (revised 2007), "Business Combinations", ("SFAS 151”141R"). SFAS 151 amends141R establishes the guidanceprinciples and requirements for how an acquirer in ARB No. 43, Chapter 4, “Inventory Pricing,”a business combination (1) recognizes and measures in its financial statements the identifiable assets acquired, the liabilities assumed and any non-controlling interest in the acquiree, (2) recognizes and measures the goodwill acquired in the business combination or a gain from a bargain purchase and (3) determines what information to clarifydisclose to enable users of the accounting for abnormal amountsfinancial statements to evaluate the nature and financial effects of idle facility expense, freight, handling costs,the business combination. SFAS 141(R) is effective beginning with the Company's fiscal 2009. The impact of the adoption of SFAS 141(R) on the Company's results of operations and wasted material (spoilage). Among other provisions,financial position will depend on the new rule requires that items such as idle facility expense, excessive spoilage, double freightnature and re-handling costs must be recognized as current-period charges regardlessextent of whether they meet the criterion of “so abnormal” as stated in ARB No. 43. Additionally, SFAS 151 requiresbusiness combinations that the allocation of fixed production overheads toCompany completes, if any, in or after fiscal 2009.
In September 2006, the costs of conversion be based on the normal capacity of the production facilities.FASB issued SFAS 151No. 157, "Fair Value Measurements" ("SFAS 157"). SFAS 157 defines fair value, establishes a framework for measuring fair value in generally accepted accounting principles (GAAP) and expands disclosures about fair value measurements. SFAS 157 is effective for fiscal years beginning after JuneNovember 15, 20052007 and is required to be adopted by the Company in the first quarter of 2006, beginning on January 1, 2006. We do not expect SFAS 151 to have a material financial statement impact.
interim periods within those fiscal years. In December 2004,2007, the FASB issuedreleased a proposed FASB Staff Position (FSP FAS 157-b—Effective Date of FASB Statement of Financial Accounting Standards No. 153, “Exchanges of Non-monetary Assets—An Amendment of APB Opinion No. 29” (“SFAS 153”). SFAS 153 eliminates the exception from fair value measurement for non-monetary exchanges of similar productive assets in paragraph 21(b) of APB Opinion No. 29, “Accounting for Non-monetary Transactions,” and replaces it with the exception for exchanges that do not have commercial substance. SFAS 153 specifies that a non-monetary exchange has commercial substance157) which, if the future cash flows of the entity are expected to change significantlyadopted as a result of the exchange. SFAS 153 is effective for the fiscal periods beginning after June 15, 2005 and is required to be adopted by the Company in the first quarter of fiscal 2006, beginning on January 1, 2006. We do not expect it to have a material financial statement impact.
In December 2004, the FASB issued Statement of Financial Accounting Standards No. 123 (revised 2004), “Share-Based Payment” (“SFAS 123R”), which requires the measurement of all share-based payments to employees, including grants of stock options, using a fair-value-based method and the recording of such expense in the consolidated statements of operations. The accounting provisions of SFAS 123R were originally effective for all reporting periods beginning after June 15, 2005. The pro forma disclosures previously permitted under SFAS 123 no longer will be an alternative to financial statement recognition. See “Stock-Based Compensation” above for the pro forma net income (loss) and net income (loss) per share amounts, as if we had used a fair-value-based method similar to the methods required under SFAS 123R to measure compensation expense for employee stock incentive awards.
In March 2005, the SEC issued Staff Accounting Bulletin (“SAB”) No. 107, providing supplemental implementation guidance for SFAS 123R. In April 2005, the Securities and Exchange Commission approved a rule that delayedproposed, would delay the effective date of SFAS 123R to157 for all nonfinancial assets and nonfinancial liabilities, except those that are recognized or disclosed at fair value in the first annual reporting period beginning after June 15, 2005. Althoughfinancial statements on a recurring basis (at least annually). Based on our current operations, we havedo not yet determined whetherexpect that the adoption of SFAS 123R will result in amounts that are similar to the current pro forma disclosures under SFAS 123, we are evaluating the requirements under SFAS 123R and SAB 107 and expect the adoption to have a significant adverse impact on our consolidated statements of operations and net loss per share. SFAS123R will be effective for us beginning with the first quarter of 2006.
In May 2005, the FASB issued SFAS 154, “Accounting Changes and Error Corrections—a replacement of APB Opinion No. 20 and FASB Statement No. 3” (“SFAS 154”). SFAS 154 changes the requirements for the accounting for and reporting of a change in accounting principle, and applies to all voluntary changes in accounting principle. It also applies to changes required by an accounting pronouncement in the unusual instance that the pronouncement does not include specific transition provisions. This statement requires retrospective application to prior periods’ financial statements of changes in accounting principle, unless it is impracticable to determine either the period-specific effects or the cumulative effect of the change. SFAS 154 is effective for accounting changes made in fiscal years
beginning after December 15, 2005. We do not expect the adoption of this statement157 will have a material impact on our financial position or results of operations or financial condition.operations.
In November 2005,February 2007, the FASB issued SFAS No. 159, "The Fair Value Option for Financial Assets and Financial Liabilities—Including an amendment of FASB Staff Posistion FAS 115-1Statement No. 115" ("SFAS 159"). SFAS 159 expands the use of fair value accounting to many financial instruments and FAS 124-1, “The Meaning of Other-Than-Temporary Impairmentcertain other items. The fair value option is irrevocable and Its Applicationgenerally made on an instrument-by-instrument basis, even if a company has similar instruments that it elects not to Certain Investments” (“FSP FAS 115-1”), which provides guidancemeasure based on determining when investments in certain debt and equity securities are considered impaired, whether that impairmentfair value. SFAS 159 is other-than-temporary, and on measuring such impairment loss. FSP FAS 115-1 also includes accounting considerations subsequent to the recognition of an other-than temporary impairment and requires certain disclosures about unrealized losses that have not been recognized as other-than-temporary impairments. FSP FAS 115-1 is required to be applied to reporting periodseffective for fiscal years beginning after DecemberNovember 15, 2005. We are required to adopt FSP FAS 115-1 in the first quarter of fiscal 2006. We2007. Based on our current operations, we do not expect that the adoption of this statementSFAS 159 will have a material impact on our financial position or results of operations.
In December 2007, the FASB issued SFAS No. 160,"Noncontrolling Interests in Consolidated Financial Statements" ("SFAS 160"). SFAS 160 requires that minority interest be separately reported in the consolidated entity's equity section and that no gain or loss shall be reported when transactions occur between the controlling interest and the non-controlling interests. Furthermore, the acquisition of non-controlling interest by the controlling interest is not treated as a business combination. SFAS 160 is effective for fiscal years beginning after December 15, 2008. We have not yet evaluated the impact of SFAS 160 on our consolidated financial position, results of operations or financial condition.cash flows.
Item 7A.Quantitative and Qualitative Disclosures about Market Risk
Foreign Currency Risk
A significant portion of our business is conducted in currencies other than the U.S. dollar. The functional currency for our foreign operations is the Renminbi, the local currency of China, where our operating expenses are predominantly in the local currency. Since most of our operations are conducted in China, most of our costs are incurred in Chinese currency, which subjects us to fluctuations in the exchange rates between the U.S. dollar and the Chinese Renminbi. We incur transaction gains or losses resulting from consolidation of expenses incurred in local currencies for thse subsidiaries, as well as in translation of the assets and liabilities of these assets at each balance sheet date. These risks may be increased by the fluctuations and revaluations of the Chinese Renminbi. Our financial results could be adversely affected by factors such as changes in foreign currency exchange
rates or weak economic conditions in foreign markets, including the revaluation by China of the Renminbi, and any future adjustments that China may make to its currency such as any move it might make to a managed float systems with opportunistic interventions. In the future we may experience foreign exchange losses on our non-functional currency denominated receivables and payables to the extent that we have not mitigated our exposure utilizing foreign currency forward exchange contracts. Foreign exchange losses could have a materially adverse effect on our operating results and cash flows.
We do not currently use short-term forward exchange contracts for hedging purposes to reduce the effects of adverse foreign exchange rate movements. We havehad previously purchased foreign exchange contracts to hedge against certain trade accounts receivable denominated in Japanese yen. The change in the fair value of the forward contracts iswas recognized as part of the related foreign currency transactions as they occur. As of December 31, 2005,2007 and 2006, we had no outstanding commitments with respect to foreign exchange contracts.
During 2007, we recorded net realized foreign exchange losses of $320,000, included as part of other expense in our consolidated statements of operations. The foreign exchange losses were primarily due to fluctuation in the Chinese Renminbi versus the U.S. dollar. It is uncertain whether these currency trends will continue. In the future we may experience foreign exchange losses on our non-functional currency denominated receivables and payables to the extent that we have not mitigated our exposure utilizing foreign currency forward exchange contracts. Foreign exchange losses could have a materially adverse effect on our operating results and cash flows. During 2007, we recorded unrealized foreign currency gain of $2.3 million, in cumulative other comprehensive income on our consolidated balance sheets.
Interest Rate Risk
Cash and cash equivalents earning interest and certain variable rate debt instruments are subject to interest rate fluctuations. The following table sets forth the probable impact of a 10% change in interest rates (in thousands):
Instrument |
|
|
| Balance as of |
| Current |
| Projected Annual |
| Proforma 10% |
| Proforma 10% |
| Balance as of December 31, 2007 | Current Interest Rate | Projected Annual Interest Income/(Expense) | Proforma 10% Interest Rate Decline Income/(Expense) | Proforma 10% Interest Rate Increase Income/(Expense) | ||||||||||||||||||||||||
|---|---|---|---|---|---|---|---|---|---|---|---|---|---|---|---|---|---|---|---|---|---|---|---|---|---|---|---|---|---|---|---|---|---|---|---|---|---|---|---|---|---|---|
Cash | Cash |
|
| $ | 12,803 |
|
|
| 0.50 | % |
|
| $ | 64 |
|
|
| $ | 58 |
|
|
| $ | 70 |
|
| $ | 10,818 | 0.50 | % | $ | 54 | $ | 49 | $ | 59 | ||||||
Cash equivalents | Cash equivalents |
|
| 4,669 |
|
|
| 4.22 |
|
|
| 197 |
|
|
| 177 |
|
|
| 217 |
|
| 7,562 | 4.99 | 377 | 340 | 415 | |||||||||||||||
Investment in debt and equity instruments | Investment in debt and equity instruments |
|
| 13,005 |
|
|
| 4.09 |
|
|
| 532 |
|
|
| 479 |
|
|
| 585 |
|
| 27,525 | 5.16 | 1,420 | 1,278 | 1,562 | |||||||||||||||
Long-term debt | Long-term debt |
|
| (7,720 | ) |
|
| 4.43 |
|
|
| (342 | ) |
|
| (308 | ) |
|
| (376 | ) |
| (6,700 | ) | 5.16 | (346 | ) | (311 | ) | (380 | ) | |||||||||||
|
|
|
|
|
|
|
|
|
|
|
| $ | 451 |
|
|
| $ | 406 |
|
|
| $ | 496 |
|
| |||||||||||||||||
| $ | 1,505 | $ | 1,356 | $ | 1,656 | |||||||||||||||||||||||||||||||||||||
The primary objective of our investment activities is to preserve principal while maximizing income without significantly increasing risk. Financial instruments that potentially subject us to concentration of credit risk consist primarily of cash equivalents, short-term investments, and trade accounts receivable. We invest primarily in money market accounts, commercial paper instruments, and investment grade securities. We are exposed to credit risks in the event of default by the issuers to the extent of the amount recorded on the consolidated balance sheets. These securities are generally classified as available-for-sale and consequently are recorded on the balance sheet at fair value with unrealized gains or losses reported as a separate component of accumulated other comprehensive income (loss), net of estimated tax. Our cash, cash equivalents and short-term investments are in high-quality securities placed with major banks and financial institutions and commercial paper. We have no investments in auction rate securities.
We perform periodic credit evaluations of our customers' financial condition and generally do not require collateral. Three customers each accounted for 10% or more of our trade accounts receivable balance as of December 31, 2007 at 13%, 10% and 10%, respectively. Two customers each accounted for 10% or more of our trade accounts receivable balance as of December 31, 2006 at 20.4% and 13.7%, respectively.
Equity Risk
We maintain minority investments in private and publicly tradedprivately-held companies. These investments are reviewed for other than temporary declines in value on a quarterly basis. These investments are classified as other assets in the consolidated balance sheets and are accounted for under the cost method as we do not have the ability to exercise significant influence over their operations. We monitor our investments for impairment and record reductions in carrying value when events or changes in circumstances indicate that the carrying value may not be recoverable. Reasons for other than temporary declines in value include whether the related company would have insufficient cash flow to operate for the next twelve months, significant changes in the operating performance and changes in market conditions. As of December 31, 20052007 and 2004,2006, the minority investments totaled $392,000$0.4 million for both years. In 2004, we recorded a $0.2 million charge related to impairment in one of the U.S. private companies.
Item 8.Consolidated Financial Statements and Supplementary Data
Selected Quarterly Results of Operations
The following table sets forth unaudited quarterly results for the eight quarters ended December 31, 2005. We believe that all necessary adjustments, consisting only of normal recurring adjustments, have been included in the amounts stated below to present fairly such quarterly information. The operating results for any quarter are not necessarily indicative of results for any subsequent period.
|
| Quarters Ended |
| ||||||||||||||||||||||||||||||||||||||
|
| Dec. 31, |
| Sept. 30, |
| June 30, |
| Mar. 31, |
| Dec. 31, |
| Sept. 30, |
| June 30, |
| Mar. 31, |
| ||||||||||||||||||||||||
Revenue |
|
| $ | 7,717 |
|
|
| $ | 6,153 |
|
|
| $ | 6,032 |
|
|
| $ | 6,634 |
|
|
| $ | 7,623 |
|
|
| $ | 8,531 |
|
|
| $ | 9,524 |
|
|
| $ | 9,776 |
|
|
Cost of revenue |
|
| 7,069 |
|
|
| 5,008 |
|
|
| 5,905 |
|
|
| 6,355 |
|
|
| 7,000 |
|
|
| 10,767 |
|
|
| 8,695 |
|
|
| 9,243 |
|
| ||||||||
Gross profit (loss) |
|
| 648 |
|
|
| 1,145 |
|
|
| 127 |
|
|
| 279 |
|
|
| 623 |
|
|
| (2,236 | ) |
|
| 829 |
|
|
| 533 |
|
| ||||||||
Operating expenses: |
|
|
|
|
|
|
|
|
|
|
|
|
|
|
|
|
|
|
|
|
|
|
|
|
|
|
|
|
|
|
|
|
| ||||||||
Selling, general and administrative |
|
| 3,089 |
|
|
| 2,898 |
|
|
| 2,716 |
|
|
| 4,252 |
|
|
| 3,120 |
|
|
| 2,468 |
|
|
| 3,203 |
|
|
| 2,770 |
|
| ||||||||
Research and development |
|
| 466 |
|
|
| 472 |
|
|
| 423 |
|
|
| 362 |
|
|
| 391 |
|
|
| 397 |
|
|
| 350 |
|
|
| 341 |
|
| ||||||||
Impairment charges |
|
| — |
|
|
| — |
|
|
| — |
|
|
| — |
|
|
| — |
|
|
| 210 |
|
|
| — |
|
|
| — |
|
| ||||||||
Restructuring costs |
|
| 460 |
|
|
| 14 |
|
|
| 237 |
|
|
| 125 |
|
|
| 73 |
|
|
| 158 |
|
|
| 1,077 |
|
|
| — |
|
| ||||||||
Total operating expenses |
|
| 4,015 |
|
|
| 3,384 |
|
|
| 3,376 |
|
|
| 4,739 |
|
|
| 3,584 |
|
|
| 3,233 |
|
|
| 4,630 |
|
|
| 3,111 |
|
| ||||||||
Loss from operations |
|
| (3,367 | ) |
|
| (2,239 | ) |
|
| (3,249 | ) |
|
| (4,460 | ) |
|
| (2,961 | ) |
|
| (5,469 | ) |
|
| (3,801 | ) |
|
| (2,578 | ) |
| ||||||||
Interest income, net |
|
| 130 |
|
|
| 136 |
|
|
| 131 |
|
|
| 119 |
|
|
| 63 |
|
|
| 95 |
|
|
| 54 |
|
|
| 24 |
|
| ||||||||
Other (income) and expense, net |
|
| (416 | ) |
|
| (193 | ) |
|
| (196 | ) |
|
| (105 | ) |
|
| (212 | ) |
|
| 225 |
|
|
| (225 | ) |
|
| 34 |
|
| ||||||||
Loss from continuing operations before provision for income |
|
| (3,653 | ) |
|
| (2,296 | ) |
|
| (3,314 | ) |
|
| (4,446 | ) |
|
| (2,812 | ) |
|
| (5,149 | ) |
|
| (3,972 | ) |
|
| (2,520 | ) |
| ||||||||
Provision (benefit) for income |
|
| (1,048 | ) |
|
| 45 |
|
|
| 18 |
|
|
| 35 |
|
|
| (106 | ) |
|
| 40 |
|
|
| 97 |
|
|
| 40 |
|
| ||||||||
Loss from continuing operations |
|
| (2,605 | ) |
|
| (2,341 | ) |
|
| (3,332 | ) |
|
| (4,481 | ) |
|
| (2,706 | ) |
|
| (5,189 | ) |
|
| (4,069 | ) |
|
| (2,560 | ) |
| ||||||||
Discontinued operations: |
|
|
|
|
|
|
|
|
|
|
|
|
|
|
|
|
|
|
|
|
|
|
|
|
|
|
|
|
|
|
|
|
| ||||||||
Gain (loss) from discontinued operations |
|
| (126 | ) |
|
| 259 |
|
|
| 53 |
|
|
| 358 |
|
|
| 250 |
|
|
| — |
|
|
| 222 |
|
|
| — |
|
| ||||||||
Gain on disposal |
|
| — |
|
|
| — |
|
|
| — |
|
|
| — |
|
|
| 194 |
|
|
| 225 |
|
|
| — |
|
|
| — |
|
| ||||||||
Gain (loss) from discontinued operations |
|
| (126 | ) |
|
| 259 |
|
|
| 53 |
|
|
| 358 |
|
|
| 444 |
|
|
| 225 |
|
|
| 222 |
|
|
| — |
|
| ||||||||
Net loss |
|
| $ | (2,731 | ) |
|
| $ | (2,082 | ) |
|
| $ | (3,279 | ) |
|
| $ | (4,123 | ) |
|
| $ | (2,262 | ) |
|
| $ | (4,964 | ) |
|
| $ | (3,847 | ) |
|
| $ | (2,560 | ) |
|
Other consolidated financial statements, related notes thereto and supplementary datafinancial statement schedule required by this item are listed and set forth atbeginning on page 55, and is incorporated by reference here. Supplementary financial information regarding quarterly financial information required by this item is set forth under the pages indicated atcaption "Quarterly Results of Operations" in Item 15(a).7. "Management's Discussion and Analysis of Financial Condition and Results of Operations," and is incorporated by reference here.
Item 9.Changes in and Disagreements with Accountants on Accounting and Financial Disclosure
None.
Item 9A.Controls and Procedures
Evaluation of disclosure controls and procedures.Under Disclosure controls and procedures are those controls and procedures designed to ensure that information required to be disclosed in our reports filed under the supervisionExchange Act is recorded, processed, summarized and withreported within the participation oftime periods specified in the SEC's rules and forms, and that such information is accumulated and communicated to our management, ourincluding the Chief Executive Officer and Chief Financial Officer, have evaluated the effectiveness of our disclosure controls and procedures, as such term is defined under Rule 13a-15(e) promulgated under the Securities Exchange Act of 1934, as amended. Based upon that evaluation, our Chief Executive Officer and our Chief Financial Officer concluded that the our disclosure controls and procedures were effective asto allow timely decisions regarding required disclosure.
As of the end of the period covered by this report.
Changes in internal control over financial reporting.As required by Rule 13a-15(d),report, we evaluated the effectiveness of the design and operation of our management, includingdisclosure controls and procedures pursuant to the Exchange Act rules. This evaluation was done under the supervision and with the participation of our Chief Executive Officer and Chief Financial Officer also conducted anand other management. Based upon this evaluation, of our internal control over financial reporting to determine whether any changes occurred during the period
covered by this report that have materially affected, or are reasonably likely to materially affect, our internal control over financial reporting. Based on that evaluation, there has been no such change during the period covered by this report.
Limitations of the effectiveness of internal control.A control system, no matter how well conceived and operated, can provide only reasonable, not absolute, assurance that the objectives of the internal control system are met. Because of the inherent limitations of any internal control system, no evaluation of controls can provide absolute assurance that all control issues, if any, within a company have been detected. Notwithstanding these limitations, our disclosure controls and procedures are designed to provide reasonable assurance of achieving their objectives. Our Chief Executive Officer and Chief Financial Officer have concluded that our disclosure controls and procedures were effective as of December 31, 2007 to provide a reasonable level of assurance that the financial information we are required to disclose in fact,the reports we file or submit under the Exchange Act was recorded, processed, summarized and reported accurately within the time periods specified in the SEC's rules and forms. Management believes that the financial statements included in this Annual Report on Form 10-K fairly present in all material respects our financial condition, results of operations and cash flows in accordance with the accounting principles generally accepted in the United States ("GAAP") for the periods presented.
Management's report on internal control over financial reporting
Our management is responsible for establishing and maintaining adequate internal control over financial reporting, as such term is defined in Rules 13a-15(f) and 15d-15(f) under the Exchange Act. Internal control over financial reporting is a process designed by, or under the supervision of, our Chief Executive Officer and Chief Financial Officer, and implemented by our Board of Directors, management and other personnel to provide reasonable assurance regarding the reliability of financial reporting and the preparation of financial statements for external purposes in accordance with GAAP. Internal control over financial reporting includes those policies and procedures that:
- •
- pertain to the maintenance of records that in reasonable detail accurately and fairly reflect our transactions and dispositions of our assets;
- •
- provide reasonable assurance that transactions are recorded as necessary to permit preparation of financial statements in accordance with GAAP, and that receipts and expenditures are being made only in accordance with authorizations of our management and directors; and
- •
- provide reasonable assurance regarding prevention or timely detection of unauthorized acquisition, use or disposition of our assets that could have a material effect on the financial statements.
Because of inherent limitations, internal control over financial reporting may not prevent or detect misstatements. Also, projections of any evaluation of effectiveness to future periods are subject to the risk that controls may become inadequate because of changes in conditions, or that the degree of compliance with the policies or procedures may deteriorate.
Our management, under the supervision and with the participation of our Chief Executive Officer and Chief Financial Officer, has assessed the effectiveness of our internal control over financial reporting as of December 31, 2007 based on the criteria established inInternal Control—Integrated Framework issued by the Committee of Sponsoring Organizations of the Treadway Commission (COSO). Management has concluded that our internal control over financial reporting was effective atas of December 31, 2007.
The effectiveness of our internal control over financial reporting as of December 31, 2007 has been audited by Burr, Pilger & Mayer LLP, an independent registered public accounting firm, as stated in their report which is included in this Annual Report on Form 10-K.
Changes in internal control over financial reporting. There were no changes in our internal control over financial reporting that occurred during the “reasonable assurance” level.year covered by this report that has materially affected, or is reasonably likely to materially affect, our internal control over financial reporting.
None.
50
REPORT OF INDEPENDENT REGISTERED PUBLIC ACCOUNTING FIRM
To the Board of Directors and Stockholders of AXT, Inc.
We have audited the internal control over financial reporting of AXT, Inc. and its subsidiaries (the "Company") as of December 31, 2007, based on criteria established in Internal Control—Integrated Framework issued by the Committee of Sponsoring Organizations of the Treadway Commission (COSO). The Company's management is responsible for maintaining effective internal control over financial reporting and for its assessment of the effectiveness of internal control over financial reporting included in the accompanying Management's Report on Internal Control Over Financial Reporting. Our responsibility is to express an opinion on the effectiveness of the Company's internal control over financial reporting based on our audit.
We conducted our audit in accordance with the standards of the Public Company Accounting Oversight Board (United States). Those standards require that we plan and perform the audit to obtain reasonable assurance about whether effective internal control over financial reporting was maintained in all material respects. Our audit included obtaining an understanding of internal control over financial reporting, assessing the risk that a material weakness exists, testing and evaluating the design and operating effectiveness of internal control based on the assessed risk, and performing such other procedures as we considered necessary in the circumstances. We believe that our audit provides a reasonable basis for our opinion.
A company's internal control over financial reporting is a process designed to provide reasonable assurance regarding the reliability of financial reporting and the preparation of financial statements for external purposes in accordance with generally accepted accounting principles. A company's internal control over financial reporting includes those policies and procedures that (1) pertain to the maintenance of records that, in reasonable detail, accurately and fairly reflect the transactions and dispositions of the assets of the company; (2) provide reasonable assurance that transactions are recorded as necessary to permit preparation of financial statements in accordance with generally accepted accounting principles, and that receipts and expenditures of the company are being made only in accordance with authorizations of management and directors of the company; and (3) provide reasonable assurance regarding prevention or timely detection of unauthorized acquisition, use, or disposition of the company's assets that could have a material effect on the financial statements.
Because of its inherent limitations, internal control over financial reporting may not prevent or detect misstatements. Also, projections of any evaluation of effectiveness to future periods are subject to the risk that controls may become inadequate because of changes in conditions, or that the degree of compliance with the policies or procedures may deteriorate.
In our opinion, AXT, Inc. and its subsidiaries maintained, in all material respects, effective internal control over financial reporting as of December 31, 2007, based on the COSO criteria.
We also have audited, in accordance with the standards of the Public Company Accounting Oversight Board (United States), the consolidated balance sheets of AXT, Inc. and its subsidiaries as of December 31, 2007 and 2006, and the related consolidated statements of operations, stockholders' equity and cash flows for each of the three years in the period ended December 31, 2007 and our report dated March 13, 2008 expressed an unqualified opinion thereon.
/s/ Burr, Pilger & Mayer LLP
San Jose, California
March 13, 2008
The United States Securities and Exchange Commission (“SEC”("SEC") allows us to include information required in this report by referring to other documents or reports we have already or will soon be filing. This is called “Incorporation"Incorporation by Reference.”" We intend to file our definitive proxy statement pursuant to Regulation 14A not later than 120 days after the end of the fiscal year covered by this report, and certain information therein is incorporated in this report by reference.
Item 10.Directors, and Executive Officers of the Registrant.and Corporate Governance
The information required by this item pursuantwith respect to Item 401identification of Regulation S-K concerning directors is incorporated by reference to the information contained in the section entitled “Proposal No. 1, Electioncaptioned "Information About our Board of Directors”Directors" in the Proxy Statement.
The information required by this item pursuantwith respect to Item 401 of Regulation S-K concerningour executive officers, is incorporated by reference to the information contained in the section entitled “Proposal No.1 Election of Directors” and “Executive Compensation and Other Matters”captioned "Executive Officers" in the Proxy Statement.
The information required by this item pursuant Information with respect to ItemItems 405 and 406 of Regulation S-K concerning compliance with Section 16(a) of the Securities Exchange Act of 1934, as amended, is incorporated by reference to the information contained in the section entitled “Security Ownershipsections of Certain Holders—Sectionthe Proxy Statement captioned "Section 16(a) Beneficial Ownership Reporting Compliance”Compliance" and "Corporate Governance—Code of Conduct. There will be no disclosure under Item 407(c)(3). Information with respect to Items 407(d)(4) and 407(d)(5) is incorporated by reference to the information contained in the sections of the Proxy Statement.Statement captioned "Corporate Governance—Committees of the Boadr of Directors."
The Board of Directors of AXT, Inc. has adopted a codeCode of ethicsConduct and Ethics (the "Code") that applies to our principal executive officers, principal financial officer, and corporate controller, as well as other employees. A copy of this code of ethicsCode has been posted on our Internet website atwww.axt.comwww.axt.com. Any amendments to, or waivers from, a provision of our code of ethicsCode that applies to our principal executive officer, principal financial officer, controller, or persons performing similar functions and that relates to any element of the code of ethicsCode enumerated in paragraph (b) of Item 406 of Regulation S-K shall be disclosed by posting such information on our website.
Item 11.Executive Compensation.Compensation
The information required by this Item is incorporated herein by reference to information set forth in our definitive Proxy statement to be filed in connection with our annual meeting of stockholders to be held on May 23, 2006,20, 2008, under the section entitled “Executive"Executive Compensation and Other Matters.”"
Item 12.Security Ownership of Certain Beneficial Owners and Management and Related Stockholder Matters.Matters
The information required by this Item is incorporated herein by reference to information set forth in our definitive Proxy statement to be filed in connection with our annual meeting of stockholders to be held on May 23, 2006,20, 2008, under the section entitled “Security"Security Ownership of Certain Beneficial Owners and Management and Equity Compensation Plan Information.”"
Item 13.Certain Relationships and Related Transactions and Director Independence
Since January 2002, there has not been, nor is there currently proposed, any transaction or series of similar transactions to which we were or are to Information required by this item will be a partyset forth in which the amount involved exceeds $60,000, and in which any director, executive officer or holder of more than 5% of any class of our voting securities or members of that person’s immediate family had or will have a direct or indirect material interest other than the transactions described below.
We entered into an operating lease in July 2001 for warehouse space in Fremont, CA with 4160 Business Center, LLC, a real estate holding company, in which Davis Zhang, president of our joint
venture operations, was the sole shareholder. Lease payments to 4160 Business Center, LLC were approximately $484,000Proxy Statement for the year ended December 31, 20022008 Annual Meeting of Stockholders under the headings "Compensation Committee Interlocks and $121,000 for the three months ended March 31, 2003. In April of 2003, Mr. Zhang sold this warehouse to a party unrelated to us. We began leasing this warehouse from the new owner on the date of sale. Mr. Zhang continued to hold a $3.7 million note on the property as of December 31, 2005.Insider Participation" and "Certain Relationships and Related Transactions," which information is incorporated herein by reference.
Item 14.Principal Accountant Fees and Services
The information required by this Item is incorporated herein by reference to information set forth in our definitive Proxy statement to be filed in connection with our annual meeting of stockholders to be held on May 23, 2006,20, 2008, under the section entitled “Principal"Principal Accounting Firm Fees.”"
52
Item 15.Exhibits and Financial Statement Schedules
(a) The following documents are filed as part of this report:
(1) Financial Statements:
INDEX TO CONSOLIDATED FINANCIAL STATEMENTS
(2) Financial Statement Schedules
All schedules have been omitted because the required information is not applicable or because the information required is included in the consolidated financial statements or notes thereto.
(b) Exhibits
See Index to Exhibits attached elsewhere to this Form 10-K. The exhibits listed in the accompanying Index to Exhibits are filed as part of, or incorporated by reference into, this report on Form 10-K.
53
REPORT OF INDEPENDENT REGISTERED PUBLIC ACCOUNTING FIRM
To the Stockholders and Board of Directors and Stockholders of AXT, Inc.:
We have audited the accompanying consolidated balance sheets of AXT, Inc. and its subsidiaries (the Company)"Company") as of December 31, 20052007 and 2004,2006, and the related consolidated statements of operations, stockholders’stockholders' equity and cash flows for each of the twothree years in the period ended December 31, 2005.2007. These consolidated financial statements are the responsibility of the Company’sCompany's management. Our responsibility is to express an opinion on these consolidated financial statements based on our audits.
We conducted our audits in accordance with the standards of the Public Company Accounting Oversight Board (United States). Those standards require that we plan and perform the audit to obtain reasonable assurance about whether the financial statements are free of material misstatement. An audit includes examining, on a test basis, evidence supporting the amounts and disclosures in the financial statements. An audit also includes assessing the accounting principles used and significant estimates made by management, as well as evaluating the overall financial statement presentation. We believe that our audits provide a reasonable basis for our opinion.
In our opinion, the consolidated financial statements referred to above present fairly, in all material respects, the financial position of AXT, Inc. and its subsidiaries as of December 31, 20052007 and 2004,2006, and the results of their operations and their cash flows for each of the twothree years in the period ended December 31, 2005,2007, in conformity with accounting principles generally accepted in the United States of America.
/s/ BURR, PILGER & MAYER LLP
Burr, Pilger & Mayer LLPPalo Alto, CaliforniaFebruary As discussed in Note 1 and Note 13 to the consolidated financial statements, on January 1, 2007 the Company changed its method of accounting for uncertain tax positions as a result of adopting Financial Accounting Standards Board Interpretation No. 48, "Accounting for Uncertainty in Income Taxes—an interpretation of FASB Statement No. 109" and as discussed in Note 1 to the consolidated financial statements, on January 1, 2006
REPORT OF INDEPENDENT REGISTERED PUBLIC ACCOUNTING FIRM the Company changed its method of accounting for stock-based compensation as a result of adopting Statement of Financial Accounting Standards No. 123 (revised 2004), "Share-Based Payment" applying the modified prospective method.
To the Board of Directors and Stockholders of AXT, Inc.:
In our opinion, the accompanying consolidated statements of operations, stockholders’ equity and cash flows for the year ended December 31, 2003 present fairly, in all material respects, the results of operations and cash flows of AXT, Inc. and its subsidiaries for the year ended December 31, 2003, in conformity with accounting principles generally accepted in the United States of America. These financial statements are the responsibility of the Company’s management. Our responsibility is to express an opinion on these financial statements based on our audit. We conducted our audit of these statementsalso have audited, in accordance with the standards of the Public Company Accounting Oversight Board (United States). Those standards require that we plan, the effectiveness of the Company's internal control over financial reporting as of December 31, 2007, based on criteria established in Internal Control—Integrated Framework issued by the Committee of Sponsoring Organizations of the Treadway Commission and perform the audit to obtain reasonable assurance about whether the financial statements are free of material misstatement. An audit includes examining, on a test basis, evidence supporting the amounts and disclosures in the financial statements, assessing the accounting principles used and significant estimates made by management, and evaluating the overall financial statement presentation. We believe that our audit provides a reasonable basis for our opinion.report dated March 13, 2008 expressed an unqualified opinion thereon.
/s/ PRICEWATERHOUSECOOPERSBurr, Pilger & Mayer LLP
PricewaterhouseCoopers LLP
San Jose, California
March 5, 200413, 2008
55
AXT, INC.
CONSOLIDATED BALANCE SHEETS
|
| December 31, |
| ||||
|
| 2005 |
| 2004 |
| ||
|
| (In thousands, except |
| ||||
ASSETS |
|
|
|
|
| ||
Current assets |
|
|
|
|
| ||
Cash and cash equivalents |
| $ | 17,472 |
| $ | 12,117 |
|
Short-term investments |
| 5,555 |
| 20,062 |
| ||
Accounts receivable, net of allowance of $619 and $1,087 as of December 31, 2005 and 2004, respectively |
| 5,226 |
| 4,034 |
| ||
Inventories, net |
| 16,156 |
| 16,462 |
| ||
Prepaid expenses and other current assets |
| 1,801 |
| 2,523 |
| ||
Assets held for sale |
| — |
| 1,250 |
| ||
Total current assets |
| 46,210 |
| 56,448 |
| ||
Property, plant and equipment, net |
| 17,306 |
| 19,045 |
| ||
Restricted deposits |
| 7,450 |
| 8,215 |
| ||
Other assets |
| 3,832 |
| 3,832 |
| ||
Total assets |
| $ | 74,798 |
| $ | 87,540 |
|
LIABILITIES AND STOCKHOLDERS’ EQUITY |
|
|
|
|
| ||
Current liabilities |
|
|
|
|
| ||
Accounts payable |
| $ | 3,070 |
| $ | 1,895 |
|
Accrued liabilities |
| 2,682 |
| 3,640 |
| ||
Accrued compensation and related charges |
| 726 |
| 715 |
| ||
Accrued restructuring costs |
| 465 |
| 552 |
| ||
Customer prepayments |
| 125 |
| 130 |
| ||
Current portion of long-term debt |
| 300 |
| 450 |
| ||
Income taxes payable |
| 2,495 |
| 2,925 |
| ||
Total current liabilities |
| 9,863 |
| 10,307 |
| ||
Long-term debt, net of current portion |
| 7,420 |
| 7,880 |
| ||
Other long-term liabilities |
| 1,897 |
| 1,336 |
| ||
Total liabilities |
| 19,180 |
| 19,523 |
| ||
Commitments and contingencies (Note 18) |
|
|
|
|
| ||
Stockholders’ equity: |
|
|
|
|
| ||
Preferred stock, $0.001 par value; 2,000 shares authorized; 883 shares issued and outstanding as of December 31, 2005 and 2004, respectively |
| 3,532 |
| 3,532 |
| ||
Common stock, $0.001 par value; 70,000 shares authorized; 22,977 and 23,119 shares issued and outstanding as of December 31, 2005 and 2004, respectively |
| 23 |
| 23 |
| ||
Additional paid-in-capital |
| 155,441 |
| 155,431 |
| ||
Accumulated deficit |
| (104,776 | ) | (92,561 | ) | ||
Other comprehensive income |
| 1,398 |
| 1,592 |
| ||
Total stockholders’ equity |
| 55,618 |
| 68,017 |
| ||
Total liabilities and stockholders’ equity |
| $ | 74,798 |
| $ | 87,540 |
|
| | December 31, | ||||||||
|---|---|---|---|---|---|---|---|---|---|
| | 2007 | 2006 | |||||||
| | (In thousands, except per share data) | ||||||||
| ASSETS | |||||||||
| Current assets | |||||||||
| Cash and cash equivalents | $ | 18,380 | $ | 16,116 | |||||
| Short-term investments | 20,825 | 19,428 | |||||||
| Accounts receivable, net of allowances of $379 and $140 as of December 31, 2007 and 2006, respectively | 12,149 | 9,658 | |||||||
| Inventories, net | 24,781 | 20,263 | |||||||
| Prepaid expenses and other current assets | 3,569 | 3,985 | |||||||
| Assets held for sale | 5,140 | 4,659 | |||||||
| Total current assets | 84,844 | 74,109 | |||||||
| Property, plant and equipment, net | 15,986 | 12,775 | |||||||
| Restricted deposits | 6,700 | 7,150 | |||||||
| Other assets | 5,242 | 4,298 | |||||||
| Total assets | $ | 112,772 | $ | 98,332 | |||||
| LIABILITIES AND STOCKHOLDERS' EQUITY | |||||||||
| Current liabilities | |||||||||
| Accounts payable | $ | 4,328 | $ | 3,764 | |||||
| Accrued liabilities | 2,330 | 1,797 | |||||||
| Accrued compensation and related charges | 966 | 1,102 | |||||||
| Accrued product warranty | 1,030 | 459 | |||||||
| Current portion of long-term debt | 450 | 450 | |||||||
| Income taxes payable | 390 | 178 | |||||||
| Total current liabilities | 9,494 | 7,750 | |||||||
Long-term debt, net of current portion | 6,250 | 6,839 | |||||||
| Other long-term liabilities | 3,778 | 2,543 | |||||||
| Total liabilities | 19,522 | 17,132 | |||||||
| Commitments and contingencies (Note 18) | |||||||||
| Stockholders' equity: | |||||||||
| Preferred stock, $0.001 par value; 2,000 shares authorized; 883 shares issued and outstanding as of December 31, 2007 and 2006 | 3,532 | 3,532 | |||||||
| Common stock, $0.001 par value; 70,000 shares authorized; 30,358 and 29,011 shares issued and outstanding as of December 31, 2007 and 2006, respectively | 30 | 29 | |||||||
| Additional paid-in-capital | 185,949 | 180,936 | |||||||
| Accumulated deficit | (98,543 | ) | (103,832 | ) | |||||
| Other comprehensive income | 2,282 | 535 | |||||||
| Total stockholders' equity | 93,250 | 81,200 | |||||||
| Total liabilities and stockholders' equity | $ | 112,772 | $ | 98,332 | |||||
The accompanying notes are an integral part of these consolidated financial statements.
AXT, INC. Years Ended December 31, 2005 2004 2003 (In thousands, except per share data) Revenue $ 26,536 $ 35,454 $ 34,713 Cost of revenue 24,337 35,705 32,478 Gross profit (loss) 2,199 (251 ) 2,235 Operating expenses: Selling, general and administrative 12,955 11,561 10,475 Research and development 1,723 1,479 1,337 Impairment charges — 210 — Restructuring costs 836 1,308 — Total operating expenses 15,514 14,558 11,812 Loss from operations (13,315 ) (14,809 ) (9,577 ) Interest income, net 516 262 172 Other (expense) and income, net (910 ) 94 (1,688 ) Loss from continuing operations before provision for income taxes (13,709 ) (14,453 ) (11,093 ) Provision (benefit) for income taxes (950 ) 71 — Loss from continuing operations (12,759 ) (14,524 ) (11,093 ) Discontinued operations: Gain (loss) from discontinued operations 544 472 (6,163 ) Gain (loss) on disposal — 419 (9,475 ) Gain (loss) from discontinued operations 544 891 (15,638 ) Net loss $ (12,215 ) $ (13,633 ) $ (26,731 ) Basic and diluted income (loss) per share: Loss from continuing operations $ (0.56 ) $ (0.64 ) $ (0.49 ) Gain (loss) from discontinued operations 0.02 0.04 (0.69 ) Net loss $ (0.54 ) $ (0.60 ) $ (1.18 ) Shares used in computing basic and diluted net loss per share 23,047 23,063 22,781 The accompanying notes are an integral part of these consolidated financial statements. AXT, INC. Retained Common Stock Earnings Other Preferred Stock Additional (Accumulated Comprehensive Comprehensive Shares Amount Shares Amount Paid In Capital Deficit) Income/(loss) Total Income/(loss) (In thousands) Balance as of December 31, 2002 883 $ 3,532 22,495 $ 22 $ 154,463 $ (52,197 ) $ (163 ) $ 105,657 Common stock options exercised 33 73 73 Issuance of Employee Stock Purchase Plan stock 404 1 591 592 Issuance of common stock to board members 25 28 28 Comprehensive loss: Net loss (26,731 ) (26,731 ) $ (26,731 ) Unrealized gain (loss) on marketable securities 2,482 2,482 2,482 Currency translation adjustment 197 197 197 Balance as of December 31, 2003 883 3,532 22,957 23 155,155 (78,928 ) 2,516 82,298 (24,052 ) Common stock options exercised 56 153 153 Issuance of Employee Stock Purchase Plan stock 106 117 117 Compensation related to stock options 6 6 Comprehensive loss: Net loss (13,633 ) (13,633 ) (13,633 ) Unrealized (loss) gain on marketable securities (1,104 ) (1,104 ) (1,104 ) Currency translation adjustment 180 180 180 Balance as of December 31, 2004 883 3,532 23,119 23 155,431 (92,561 ) 1,592 68,017 (14,557 ) Common stock options exercised 5 5 5 Issuance of Employee Stock Purchase Plan stock 55 59 59 Common stock repurchased (202 ) (246 ) (246 ) Compensation related to stock options 192 192 Comprehensive loss: Net loss (12,215 ) (12,215 ) (12,215 ) Unrealized (loss) gain on marketable securities (201 ) (201 ) (201 ) Currency translation adjustment 7 7 7 Balance as of December 31, 2005 883 $ 3,532 22,977 $ 23 $ 155,441 $ (104,776 ) $ 1,398 $ 55,618 $ (12,409 ) The accompanying notes are an integral part of these consolidated financial statements. AXT, INC. Years Ended December 31, 2005 2004 2003 (In thousands) Cash flows from operating activities: Net loss $ (12,215 ) $ (13,633 ) $ (26,731 ) Adjustments to reconcile net loss to cash (used in) provided by operations: Depreciation 3,745 4,869 5,782 Amortization of marketable securities premium/discount 192 307 502 Stock-based compensation 192 6 28 Non-cash restructuring charge 736 1,308 — Impairment of investments — 210 2,128 Loss (gain) on disposal of property, plant and equipment 290 10 (11 ) (Gain) loss on disposal on discontinued operations (53 ) (472 ) 9,475 Changes in assets and liabilities: Accounts receivable, net (1,192 ) 2,263 232 Inventories 306 7,621 11,541 Prepaid expenses 722 (948 ) 2,217 Other assets — (77 ) (137 ) Accounts payable 1,175 (743 ) (1,590 ) Accrued liabilities (1,775 ) (1,001 ) (5,493 ) Income taxes (430 ) (140 ) 8,783 Other long-term liabilities 561 80 (457 ) Net cash (used in) provided by operating activities (7,746 ) (340 ) 6,269 Cash flows from investing activities: Purchases of property, plant and equipment (2,329 ) (2,139 ) (2,175 ) Proceeds from disposal of property, plant and equipment 33 10 — Purchases of marketable securities (10,227 ) (25,876 ) (5,941 ) Proceeds from sale of marketable securities 24,341 19,072 13,885 Proceeds from sale of property and equipment from discontinued opto-electronics business — — 8,600 Proceeds from sale of assets held for sale 1,303 — 5,172 Decrease (increase) in restricted deposits 765 (1,087 ) (5,818 ) Net cash provided by (used in) investing activities 13,886 (7,846 ) 13,723 Cash flows from financing activities: Proceeds from issuance of common stock 64 270 480 Repurchase of common stock (246 ) — — Capital lease payments — — (8,409 ) Proceeds from long-term debt borrowings 49 — — Long-term debt payments (659 ) (4,486 ) (1,718 ) Net cash used in financing activities (792 ) (4,216 ) (9,647 ) Effect of exchange rate changes 7 180 197 Net increase (decrease) in cash and cash equivalents 5,355 (12,222 ) 10,542 Cash and cash equivalents at the beginning of the period 12,117 24,339 13,797 Cash and cash equivalents at the end of the period $ 17,472 $ 12,117 $ 24,339 Supplemental Disclosures: Interest paid $ 266 $ 271 $ 790 Income tax refund (paid) $ 150 $ (197 ) $ (248 ) The accompanying notes are an integral part of these consolidated financial statements. AXT, INC. Note 1. The Company and Summary of Significant Accounting Policies The Company AXT, Inc. Use of Estimates The preparation of financial statements in conformity with accounting principles generally accepted in the United States of America requires management to make estimates and assumptions that affect the reported amounts of assets and liabilities and disclosure of contingent assets and liabilities at the date of the financial statements and the reported amounts of revenues and expenses during the reporting period. Actual results could differ materially from these estimates. Principles of Consolidation The consolidated financial statements include the accounts of AXT and our majority-owned subsidiaries. All significant intercompany accounts and transactions have been eliminated. Investments in business entities in which we do not have control, but have the ability to exercise significant influence over operating and financial policies (generally 20-50% ownership), are accounted for by the equity method. Fair Value of Financial Instruments The carrying amounts of certain of our financial instruments including cash and cash equivalents, accounts receivable, short-term investments, accounts payable and accrued liabilities approximate fair value due to their short maturities. The carrying amounts of short-term and long-term debt approximate fair value due to the market interest rates that these debts bear and interest rates currently available to us. Reclassifications Certain reclassifications have been made to the prior Foreign Currency Translation The functional currencies of our The assets and liabilities of the subsidiaries are translated at the rates of exchange on the balance sheet date. Revenue and expense items are translated at the average rate of exchange for the period. Gains and losses from foreign currency translation are included in other comprehensive income (loss) in Revenue Recognition We recognize revenue upon the shipment of our products to customers when: We do not provide training, installation or commissioning services. Our terms and conditions of sale do not require customer acceptance. We assess the probability of collection based on a number of factors including past history with the customer and credit worthiness. We provide for future returns based on historical experience, current economic trends and changes in customer demand at the time revenue is recognized. Additionally, we do not provide discounts or other incentives to Accounting for We report sales taxes collected on sales of our products as a component of net revenues and as an expense in selling, general and administrative in the Concentration of Credit Risk Our business is very dependant on the semiconductor industry, which is highly cyclical and has historically experienced downturns as a result of economic changes, overcapacity, and technological advancements. Significant technological changes in the industry or customer requirements, or the emergence of competitive products with new capabilities or technologies, could adversely affect operating results. In addition, a significant portion of our revenues and net income (loss) is derived from international sales. Fluctuations of the United States dollar against foreign currencies and changes in local regulatory or economic conditions, particularly in an emerging market such as China, could adversely affect operating results. We depend on a single or limited number of suppliers for certain critical materials used in the production of our substrates, such as quartz tubing, and polishing solutions. We generally purchase these materials through standard purchase orders and not pursuant to long-term supply contracts. Financial instruments that potentially subject us to concentration of credit risk consist primarily of cash equivalents, short-term investments, and trade accounts receivable. We invest primarily in money market accounts, commercial paper instruments, and investment grade We perform ongoing credit evaluations of our Cash Equivalents and Short-Term Investments We classify our investments in debt and equity securities as available-for-sale securities as prescribed by Statement of Financial Accounting Standards All available-for-sale securities with a quoted market value below cost (or adjusted cost) are reviewed in order to determine whether the decline is other-than-temporary. Factors considered in determining whether a loss is temporary include the magnitude of the decline in market value, the length of time the market value has been below cost (or adjusted cost), credit quality, and our ability and intent to hold the securities for a period of time sufficient to allow for any anticipated recovery in market value. We maintain in restricted deposits an amount approximately equal to the amount of the taxable Accounts Receivable and Allowance for Doubtful Accounts Accounts receivable are recorded at the invoiced amount and are not interest bearing. We maintain an allowance for doubtful accounts to reserve for potentially uncollectible trade receivables. We also review our trade receivables by aging category to identify specific customers with known disputes or collectibility issues. We exercise judgment when determining the adequacy of these reserves as we evaluate historical bad debt trends, general economic conditions in the United States and internationally, and changes in customer financial conditions. Uncollectible receivables are recorded as bad debt expense when all efforts to collect have been exhausted and recoveries are recognized when they are received. As of December 31, 2005, our allowance for doubtful accounts was $0.5 million primarily from an increase in the allowance for a large customer in China of $0.4 million. During 2006, we increased our collection efforts and collected the entire amount from this large customer in China requiring us to reverse this $0.4 million allowance resulting in the allowance for doubtful accounts of $0.1 million as of December 31, 2006. During 2007, we increased this allowance by $0.3 million primarily for slow-paying customers in Asia, resulting in the allowance for doubtful accounts of $0.4 million at December 31, 2007. As of December 31, 2007, our accounts receivable balance was The allowance for sales returns is also deducted from gross accounts receivable. From our allowance for sales returns of Inventories Inventories are stated at the lower of cost (approximated by standard cost) or market. Cost is determined using the weighted average cost method. Our inventory consists of raw materials as well as finished goods and work-in-process that include material, labor and manufacturing overhead costs. Provision for potentially obsolete or slow moving inventory is made based on Property, Plant and Equipment Property, plant and equipment are stated at cost less accumulated depreciation computed using the straight-line method over the estimated economic lives of the assets, which vary from 3 to 27.5 years. Leasehold improvements are amortized over the shorter of the estimated useful life or the term of the lease. We generally depreciate computers and software over 3 years, office equipment, furniture and fixtures over 3 years, automobiles over 5 years, leasehold improvements over 10 years, and buildings over 27.5 years. Repairs and maintenance costs are expensed as incurred. Impairment of Long-Lived Assets We evaluate the recoverability of property, plant and equipment, and intangible assets in accordance with SFAS No. 144, sale in connection with our adjustment of the fair value. We recorded a $481,000 market value adjustment after we entered into an agreement with an independent third party purchaser in June 2007 to purchase the property for estimated net proceeds of $5.1 million, after deducting estimated commission and selling expenses. In the fourth quarter of 2007, that agreement was terminated and we entered into a new sales agreement with another independent third party purchaser to purchase this property for a similar amount. We expect the sale to be completed in the first or second quarter of 2008. This property has been classified as "Assets held for sale" in the amount of $5.1 million on the consolidated balance sheet as of December 31, 2007 and $4.7 million as of December 31, 2006. Segment Reporting Our business is conducted in a single operating segment. Our chief executive officer reviews a single set of financial data that encompasses our entire operations for purposes of making operating decisions and assessing financial performance. Investments We invest in equity instruments of privately-held companies for business and strategic purposes. These investments are classified as other assets and are accounted for under the cost method as we do not have the ability to exercise significant influence over their operations. We monitor our investments for impairment and record reductions in carrying value when events or changes in circumstances indicate that the carrying value may not be recoverable. Determination of impairment is highly subjective and is based on a number of factors, including an assessment of the strength of Stock-Based Compensation We have employee stock option plans, which are described more fully in Note 11—Employee Benefit Plans. We have elected the Prior to the Adoption of SFAS 123(R) Prior to the adoption of SFAS 123(R), we provided the disclosures required under SFAS 123, as amended by SFAS No. 148, "Accounting for Stock-Based Compensation—Transition and Disclosures." SFAS 123(R) requires us to present pro forma information for the comparative period prior to adoption as if we had accounted for all our employee stock We elected to adopt the modified prospective application transition method as As of December 31, 2007, the total compensation cost related to unvested stock-based awards granted to employees under our stock option The amortization of stock compensation under SFAS 123(R) for the period after our January 1, 2006 adoption is based on the single-option approach. We estimate the fair value of Years Ended December 31, 2005 2004 2003 (in thousands, except per share data) Net loss to common stockholders: As reported $ (12,392 ) $ (13,810 ) $ (26,908 ) Add: Stock-based employee compensation expense included in net loss as reported 192 6 28 Less: Stock-based compensation expense using the fair value based method, net of related tax (1,035 ) (1,330 ) (7,323 ) Pro forma net loss $ (13,235 ) $ (15,134 ) $ (34,203 ) Basic and diluted net loss per share: As reported $ (0.54 ) $ (0.60 ) $ (1.18 ) Pro forma $ (0.57 ) $ (0.66 ) $ (1.50 ) Shares used in computing basic and diluted net loss per share 23,047 23,063 22,781 SFAS 123). The Years Ended 2005 2004 2003 Risk-free interest rate 4.3 % 3.6 % 2.9 % Expected life (in years) 5.0 5.0 5.0 Dividend yield — — — Volatility 89.7 % 103.0 % 109.0 %
CONSOLIDATED STATEMENTS OF OPERATIONS Years Ended December 31, 2007 2006 2005 (In thousands, except per share data) Revenue $ 58,203 $ 44,445 $ 26,536 Cost of revenue 37,942 31,709 24,337 Gross profit 20,261 12,736 2,199 Operating expenses: Selling, general, and administrative 13,746 12,650 12,955 Research and development 1,699 2,351 1,723 Impairment (recovery of impairment) on assets held for sale (481 ) 1,417 — Restructuring charge (benefit) — (2 ) 836 Total operating expenses 14,964 16,416 15,514 Income (loss) from continuing operations 5,297 (3,680 ) (13,315 ) Interest income, net 704 443 516 Other income (expense), net 16 2,709 (910 ) Income (loss) from continuing operations before provision (benefit) for income taxes 6,017 (528 ) (13,709 ) Provision (benefit) for income taxes 728 (1,454 ) (950 ) Income (loss) from continuing operations 5,289 926 (12,759 ) Discontinued operations: Gain (loss) from discontinued operations, net of tax — 18 (59 ) Gain from disposal, net of tax — — 603 Gain from discontinued operations, net of tax — 18 544 Net income (loss) $ 5,289 $ 944 $ (12,215 ) Basic income (loss) per share: Income (loss) from continuing operations $ 0.17 $ 0.03 $ (0.56 ) Gain from discontinued operations, net of tax — — 0.02 Net income (loss) $ 0.17 $ 0.03 $ (0.54 ) Shares used in computing basic net income (loss) per share 30,035 23,303 23,047 Diluted income (loss) per share: Income (loss) from continuing operations $ 0.16 $ 0.03 $ (0.56 ) Gain from discontinued operations, net of tax — — 0.02 Net income (loss) $ 0.16 $ 0.03 $ (0.54 ) Shares used in computing diluted net income (loss) per share 31,348 24,600 23,047
CONSOLIDATED STATEMENTS OF STOCKHOLDERS’STOCKHOLDERS' EQUITY Common Stock Preferred Stock Additional
Paid In Capital Accumulated
Deficit Other
Comprehensive
Income/(loss) Comprehensive
Income/(loss) Shares Amount Shares Amount Total (In thousands) Balance as of December 31, 2004 883 $ 3,532 23,119 $ 23 $ 155,431 $ (92,561 ) $ 1,592 $ 68,017 Common stock options exercised 5 5 5 Issuance of Employee Stock Purchase Plan stock 55 59 59 Common stock repurchased (202 ) (246 ) (246 ) Compensation related to stock options 192 192 Comprehensive loss: Net loss (12,215 ) (12,215 ) $ (12,215 ) Unrealized (loss) gain on marketable securities (201 ) (201 ) (201 ) Currency translation adjustment 7 7 7 Balance as of December 31, 2005 883 3,532 22,977 23 155,441 (104,776 ) 1,398 55,618 (12,409 ) Common stock options exercised 284 556 556 Stock-based compensation 822 822 Issuance of common stock, net of stock issuance costs of $1,752 5,750 6 24,117 24,123 Comprehensive income: Net income 944 944 944 Unrealized (loss) gain on marketable securities (1,331 ) (1,331 ) (1,331 ) Currency translation adjustment 468 468 468 Balance as of December 31, 2006 883 3,532 29,011 29 180,936 (103,832 ) 535 81,200 81 Common stock options exercised 461 902 902 Stock-based compensation 498 498 Issuance of common stock, net of stock issuance costs of $60 863 1 3,613 3,614 Issuance of common stock in the form of restricted stock 23 Comprehensive income: Net income 5,289 5,289 5,289 Unrealized (loss) gain on marketable securities (3 ) (3 ) (3 ) Currency translation adjustment 1,750 1,750 1,750 Balance as of December 31, 2007 883 $ 3,532 30,358 $ 30 $ 185,949 $ (98,543 ) $ 2,282 $ 93,250 $ 7,036
CONSOLIDATED STATEMENTS OF CASH FLOWS Years Ended December 31, 2007 2006 2005 (In thousands) Cash flows from operating activities: Net income (loss) $ 5,289 $ 944 $ (12,215 ) Adjustments to reconcile net income (loss) to cash provided by (used in) operations: Depreciation 1,473 2,625 3,745 Amortization (accretion) of marketable securities premium/discount (52 ) (79 ) 192 Stock-based compensation 498 822 192 Non-cash restructuring charge — — 736 Impairment (recovery of impairment) on assets held for sale (481 ) 1,417 — Realized gain on sale of investments (1,028 ) (3,301 ) — Loss (gain) on disposal of property, plant and equipment (16 ) 115 290 Gain on disposal of discontinued operations — — (53 ) Changes in assets and liabilities: Accounts receivable, net (2,351 ) (4,432 ) (1,192 ) Inventories (4,269 ) (4,107 ) 306 Prepaid expenses 591 (2,184 ) 722 Other assets (874 ) (466 ) — Accounts payable 461 694 1,175 Accrued liabilities 893 (640 ) (1,775 ) Income taxes 188 (2,317 ) (430 ) Other long-term liabilities 998 646 561 Net cash provided by (used in) operating activities 1,320 (10,263 ) (7,746 ) Cash flows from investing activities: Purchases of property, plant and equipment (3,706 ) (4,458 ) (2,329 ) Proceeds from disposal of property, plant and equipment 62 173 33 Purchases of marketable securities (36,105 ) (27,346 ) (10,227 ) Proceeds from sale of marketable securities 35,785 15,522 24,341 Proceeds from sale of assets held for sale — — 1,303 Decrease in restricted deposits 450 300 765 Net cash provided by (used in) investing activities (3,514 ) (15,809 ) 13,886 Cash flows from financing activities: Proceeds from issuance of common stock 4,516 24,679 64 Repurchase of common stock — — (246 ) Proceeds from long-term debt borrowings — — 49 Long-term debt payments (592 ) (431 ) (659 ) Net cash provided by (used in) financing activities 3,924 24,248 (792 ) Effect of exchange rate changes 534 468 7 Net increase (decrease) in cash and cash equivalents 2,264 (1,356 ) 5,355 Cash and cash equivalents at the beginning of the year 16,116 17,472 12,117 Cash and cash equivalents at the end of the year $ 18,380 $ 16,116 $ 17,472 Supplemental Disclosures: Interest paid $ 382 $ 372 $ 266 Income taxes paid $ 483 $ 1,978 $ 111
NOTES TO CONSOLIDATED FINANCIAL STATEMENTS(“AXT”("AXT", “we,” “us,”"we," "us," and “our”"our" refer to AXT, Inc. and all of its subsidiaries) designs, develops, manufactures and distributes high-performance compound semiconductor substrates. Our substrate products are used primarily in wireless communications, lighting display applications, and fiber optic communications. We believe our vertical gradient freeze, or VGF, technique for manufacturing semiconductor substrates provides significant benefits over other methods and enabled us to become a leading manufacturer of such substrates. We pioneered the commercial use of VGF technology to manufacture gallium arsenide (GaAs) substrates and subsequently used VGF technology to manufacture substrates from indium phosphide (InP), and germanium (Ge). We also manufacture and sell raw materials related to our substrate business through five joint ventures located in China. These joint ventures produce products including 99.99% pure gallium (4N Ga), high purity gallium, arsenic, and germanium, germanium dioxide, paralytic boron nitride (pBN) crucibles, and boron oxide. AXT’sAXT's ownership interest in these entities ranges from 25 percent to 83 percent. We consolidate the three ventures in which we own a majority share and employ equity accounting for the two joint ventures in which we have a 25 percent interest. We purchase the materials produced by these ventures for our use and sell other portions of their production to third parties.On June 24, 2003, our Board of Directors approved management’s plan to exit our unprofitable Opto-electronics business. Substantially all of the assets of this division were sold in September 2003. The decision to dispose of the business was due to continuing operating losses and negative cash flows from the division and significant uncertainty regarding future profitability.years’years' consolidated financial statements to conform to current year presentation. These reclassifications had no impact on previously reported total assets, stockholders’stockholders' equity or net loss. Japanese and Chinese subsidiaries are the local currencies. Transaction gains and losses resulting from transactions denominated in currencies other than the U.S. dollar or in the functional currencies of our subsidiaries are included in other income and (expense) and income, net for the periods presented.stockholders’stockholders' equity.···customer’scustomer's dock, or removal from consignment inventory at customer’scustomer's location,··customers exceptcustomers. We present our revenue net of any taxes assessed by any governmental authority.one customer with whom we agreedSales Taxes in Net Revenuesfourth quarterconsolidated statements of 2004 to provide a certainoperations. The amount of cumulative discounts on future product purchases from us. We will recognize these discounts in future periods as a reduction in revenue as products are sold to this customer.is immaterial for fiscal years 2007, 2006 and 2005.securities.securities with high quality financial institutions. The composition and maturities are regularly monitored by management. Such deposits are in excess of the amount of the insurance provided by the federal government on such deposits. We are exposed to credit risks in the event of default by the issuers to the extent of the amount recorded on the consolidated balance sheets.customers’customers' financial condition, and limit the amount of credit extended when deemed necessary, but generally do not require collateral. The credit risk in our accounts receivable is substantially mitigated by our credit evaluation process, reasonably short collection terms and the geographical dispersion of sales transactions. Two customers represented greater than 10% of product revenues totaling 20.7% for the year ended December 31, 2005, while no customersNo customer represented greater than 10% of revenue for the yearsyear ended December 31, 20042007, while one customer represented greater than 10% of revenue, totaling 12.8%, for the year ended December 31, 2006, and 2003.two customers represented greater than 10% of revenue, totaling 20.7%, for the year ended December 31, 2005. Our top five customers represented 37.5%, 30.1%, and 28.9%33.0% of product revenue for the yearsyear ended December 31, 2005, 2004,2007, 40.0% of revenue for the year ended December 31, 2006, and 2003, respectively.37.5% of revenue for the year ended December 31, 2005. We expect that sales to certaina small number of customers will continue to comprise a significant portion of our revenue in the future. TwoThree customers each accounted for 10% or more of our trade accounts receivable balance as of December 31, 20052007 at 30.0%13.0%, 10.0% and 18.8%10.0%, respectively. Two customers each accounted for 10% or more of our trade accounts receivable balance as of December 31, 20042006 at 10.1%20.4% and 10.0%13.7%, respectively.(SFAS)("SFAS") No. 115,“"Accounting for Certain Investments in Debt and Equity Securities.”" We consider investments in highly liquid instruments purchased with an original maturity of three months or less to be cash equivalents. Our short-term investments are reported at fair value as of the respective balance sheet dates with unrealized gains and losses included in accumulated other comprehensive income (loss) within stockholders’stockholders' equity on the consolidated balance sheets. The amortized cost of securities is adjusted for amortization of premiums and accretion of discounts to maturity. Such amortization is included in other income and (expense) and income, net in the consolidated statements of operations. Realized gains and losses and declines in value judged to be other than temporary on available-for-sale securities are also included in other income and (expense) and income, net in the consolidated statements of operations. The cost of securities sold is based upon the specific identification method.bond of our long-term debt.bond.$5.2$12.1 million, which was net of an allowance for doubtful accounts of $533,000. From$0.4 million. As of December 31, 2006, our accounts receivable balance was $9.7 million, which was net of an allowance for doubtful accounts of $537,000 at December 31, 2004, we wrote off $68,000 of fully reserved$0.1 million. The increase in gross accounts receivable for a Korean customer and decreased the allowance by $343,000balance was primarily due to improved collections mainly from a Japanese customer,increased sales, while increasing the allowance for a large customerincrease in China of $396,000, and other doubtful accounts of $11,000, resulting in the allowance for doubtful accounts of $533,000 at December 31, 2005.was mainly for our slow-paying customers in Asia. If actual uncollectible accounts differ substantially from our estimates, revisions to the estimated allowance for doubtful accounts would be required, which could have a material impact on our financial results for the period.$550,000 at$0.6 million as of December 31, 2004, we utilized $487,000$0.5 million for investigation related returns, while increasing the allowance for sales returns based on our history of sales returns $23,000 resulting in the allowance for sales returns of $86,000 atas of December 31, 2005. The total allowances deducted from gross accounts receivable atDuring 2006 and 2007, we utilized $38,000 and $45,000, respectively resulting in the allowance for sales returns of $48,000 and $3,000 as of December 31, 2005 is $619,000, compared to $1,087,000 at December 31, 2004.2006 and 2007, respectively.management’smanagement's analysis of inventory levels and sales forecasts.“"Accounting for the Impairment or Disposal of Long-Lived Assets.”" When events and circumstance indicate that long-lived assets may be impaired, management compares the carrying value of the long-lived assets to the projection of future undiscounted cash flows attributable to such assets and in the event that the carrying value exceeds the future undiscounted cash flows, we record an impairment charge against income equal to the excess of the carrying value over the asset’sasset's fair value. In the third quarter of 2006, we incurred an impairment charge of $1.4 million to write down our U.S. property in Fremont, California, which was being decontaminated and was being prepared for sale. In the second quarter of 2007, we benefited from a recovery of impairment on this asset held forSegment Reportinginvestee’sinvestee's management, the length of time and extent to which the fair value has been less than our cost basis, the financial condition and near-term prospects of the investee, fundamental changes to the business prospects of the investee, share prices of subsequent offerings, and our intent and ability to hold the investment for a period of time sufficient to allow for any anticipated recovery in our carrying value.We accountEffective January 1, 2006, we adopted the provisions of SFAS No. 123 (revised 2004), "Share-Based Payment," ("SFAS 123(R)"). SFAS 123(R) establishes accounting for stock-based awards exchanged for employee services. Accordingly, stock-based compensation arrangements usingcost is measured at each grant date, based on the intrinsicfair value methodof the award, and is recognized as prescribed inexpense over the employee's requisite service period of the award. All of the Company's stock compensation is accounted for as an equity instrument. The Company previously applied Accounting Principles Board ("APB") Opinion No. 25, "“Accounting for Stock Issued to Employees”," and related interpretations thereof. Accordingly, compensation costand provided the required pro forma disclosures of SFAS No. 123, "Accounting for stock options is measuredStock-Based Compensation" ("SFAS 123"), as amended by SFAS No. 148,"Accounting for Stock-Based Compensation—Transition and Disclosures."excess, if any,modified prospective application transition method for adopting SFAS 123(R). Under this method, the provisions of SFAS 123(R) apply to all awards granted or modified after the market pricedate of AXT’s stockadoption. The unrecognized expense of awards not yet vested at the date of grant overadoption will be recognized in net income (loss) in the periods after the date of adoption using the same Black-Scholes valuation method and assumptions determined under the original provisions of SFAS 123, as disclosed in our previous quarterly and annual reports.option exercise price.options under the fair value method of the original SFAS 123. The following table illustrates the effect on our net loss and net loss per share if we had applied the fair value recognition provisions of SFAS No. 123 to stock-based employee compensation to the prior-year periods (in thousands, except per share data): Year Ended December 31, 2005 Net loss: As reported $ (12,392 ) Add: Stock-based employee compensation expense included in net loss as reported 192 Less: Stock-based compensation expense using the fair value based method, net of related tax (1,035 ) Pro forma net loss $ (13,235 ) Basic and diluted net loss per common share As reported $ (0.54 ) Pro forma $ (0.57 ) Shares used in computing basic and diluted net loss per share 23,047 “Accounting for Stock-Based Compensation,”Impact of the Adoption of SFAS 123(R)amendedprovided by SFAS No. 148, “Accounting123(R), and we recorded $499,000 and $822,000 in our consolidated statements of operations for Stock-Based Compensation Transitionthe years ended December 31, 2007 and Disclosure,”2006, respectively. We elected not to optionscapitalize any stock-based compensation to inventory as of January 1, 2007 when the provisions of SFAS 123(R) were initially adopted. We utilized the Black-Scholes valuation model for estimating the fair value of the stock compensation granted both before and after the adoption of SFAS 123(R). In accordance with the modified prospective application transition method, our consolidated financial statements for prior periods have not been restated to reflect, and do not include, the impact of SFAS 123(R). The following table summarizes compensation costs related to our stock-based compensation awards (in thousands, except per share data): Year Ended
December 31,
2007 Year Ended
December 31,
2006 Stock-based compensation in the form of employee stock options and restricted stock, included in: ��
Cost of revenue
$
53
$
96
Selling, general and administrative 360 539 Research and development 85 187 Total stock-based compensation 498 822 Tax effect on stock-based compensation — — Net effect on net income $ 498 $ 822
Shares used in computing basic net income per share
30,035
23,303
Shares used in computing diluted net income per share 31,348 24,600
Effect on basic net income per share
$
(0.02
)
$
(0.04
)Effect on diluted net income per share $ (0.02 ) $ (0.03 ) plans. For purposesplans but not yet recognized was approximately $1,500,000, net of this pro forma disclosure,estimated forfeitures of $53,000. This cost will be amortized on a straight-line basis over a weighted-average period of approximately 2.55 years and will be adjusted for subsequent changes in estimated forfeitures. We elected not to capitalize any stock-based compensation to inventory as of December 31, 2007, as the amount is not significant.thestock options is estimated using a Black-Scholes option pricingvaluation model, consistent with the provisions of SFAS 123(R), Securities and amortized to expense over the options’ vesting periods. Because the estimatedExchange Commission Staff Accounting Bulletin No. 107 and our prior period pro forma disclosures of net loss, including stock-based compensation (determined under a fair value is determinedmethod as of the date of grant, the actual value ultimately realizedprescribed by the employee may be significantly different.weighted average estimated per shareweighted-average grant date fair value of employeeour stock options granted to employees during 2007, 2006, and 2005 2004,was $2.60, $2.89, and 2003 was $0.89 $1.17, and $1.70,per share, respectively. The fair value of options granted was estimated at the date of grant using the following weighted averageweighted-average assumptions:
December 31, Years Ended December 31, 2007 2006 2005 3.11 % 4.7 % 4.3 % 3.9 3.9 5.0 — — — Estimated forfeitures 5.7 % 12.4 % — 59.8 % 78.2 % 89.7 % 64
An analysisThe dividend yield of historical informationzero is used to determine the above assumptions, to the extent that historical information is relevant, based on the termsfact that we have never paid cash dividends and have no present intention to pay cash dividends. Expected volatility is based on the combination of historical volatility of the grants being issued in any given period.Company's common stock and the expected future volatility over the period commensurate with the expected life of the options. The risk-free interest rates are taken from the Daily Federal Yield Curve Rates as of the grant dates as published by the Federal Reserve and represent the yields on actively traded Treasury securities for terms equal to the expected term of the options. The expected term calculation for stock options is based on the observed historical option exercise behavior and post-vesting forfeitures of options by our employees. Assumptions related to the Employee Stock Purchase Plan are not presented as the related compensation expense amounts are insignificant. The Employee Stock Purchase Plan was suspended in February 2005.2006.
SFAS No. 123 requires the use of option pricing models that were not developed for use in valuing employee stock options. The Black-Scholes option pricing model was developed for use in estimating the fair value of short-lived exchange-traded options that have no vesting restrictions and are fully transferable. In addition, option pricing models require the input of highly subjective assumptions, including the option’s expected life and the price volatility of the underlying stock. Because our employee stock options have characteristics significantly different from those of traded options, and because changes in the subjective input assumptions can materially affect the fair value estimate, in the opinion of management, the existing models do not necessarily provide a reliable single measure of the fair value of employee stock options.
Research and Development
Research and development costs consisting primarily of salaries including stock compensation expense and related personnel costs, depreciation and product testing are expensed as incurred.
Advertising Costs
Advertising costs, included in selling, general and administrative, are expensed as incurred. Advertising costs for the years ended December 31, 2007, 2006, and 2005 2004,were $75,000, $52,000 and 2003 were $22,000, $51,000 and $53,000, respectively.
Shipping and Handling costs
We include fees billed to customers and costs incurred for shipping and handling as a component of cost of sales.
Income Taxes
We account for deferred income taxes using the liability method, under which the expected future tax consequences of timing differences between the book and tax basis of assets and liabilities are recognized as deferred tax assets and liabilities. Valuation allowances are established when necessary to reduce net deferred tax assets when management estimates, based on available objective evidence, that it is more likely than not that the future income tax benefit represented by the net deferred tax asset will not be realized.
We adopted FASB Interpretation No. 48 ("FIN 48"),"Accounting for Uncertainty in Income Taxes—an interpretation of FASB Statement No. 109)," on January 1, 2007. FIN 48 is an interpretation of SFAS No. 109 ("SFAS 109"),"Accounting for Income Taxes," and it seeks to reduce the diversity in practice associated with certain aspects of measurement and recognition in accounting for income taxes. FIN 48 prescribes a recognition threshold and measurement attribute for the financial statement recognition and measurement of a tax provision that an entity takes or expects to take in a tax return. Additionally, FIN 48 provides guidance on de-recognition, classification, interest and penalties, accounting in interim periods, disclosures, and transition. Under FIN 48, an entity may only recognize or continue to recognize tax positions that meet a "more likely than not" threshold. In accordance with our accounting policy, we recognize accrued interests and penalties related to unrecognized tax benefits as a component of income tax expense. The impact on adoption of FIN 48 is more fully described in Note 13.
Comprehensive Income (Loss)
We report comprehensive income or loss in accordance with the provisions of SFAS No. 130, “"Reporting Comprehensive Income,” "which establishes standards for reporting comprehensive income or loss and its components in the financial statements. The components of other comprehensive income (loss) consist of unrealized gains and losses on marketable securities and foreign currency translation adjustments. Comprehensive income (loss) and the components of accumulated other comprehensive income areis presented in the accompanying consolidated statements of stockholders’stockholders' equity. The balance of accumulated other comprehensive income is as follows (in thousands):
| | As of December 31, | |||||||
|---|---|---|---|---|---|---|---|---|
| | 2007 | 2006 | ||||||
| Accumulated other comprehensive income: | ||||||||
| Unrealized loss on investments, net | $ | (46 | ) | $ | (43 | ) | ||
| Cumulative translation adjustment | 2,328 | 578 | ||||||
| $ | 2,282 | $ | 535 | |||||
Net Income (Loss) Per Share
Basic net income (loss) per share is computed using the weighted average number of common shares outstanding during the periods. Diluted net income (loss) per share is computed using the weighted average number of common shares outstanding and potentially dilutive common shares outstanding during the periods. Potentially dilutive common shares consist of common shares issuable upon the exercise of
stock options. Potentially dilutive common shares are excluded in net loss periods, as their effect would be anti-dilutive.
Recent Accounting Pronouncements
In November 2004,December 2007, the Financial Accounting Standards Board (“FASB”("FASB") issued Statement of Financial Accounting Standards ("SFAS") No. 151, “Inventory Costs - An Amendment of ARB No. 43, Chapter 4” (“141 (revised 2007), "Business Combinations",
("SFAS 151”141R"). SFAS 151 amends141R establishes the guidanceprinciples and requirements for how an acquirer in ARB No. 43, Chapter 4, “Inventory Pricing,”a business combination (1) recognizes and measures in its financial statements the identifiable assets acquired, the liabilities assumed and any non-controlling interest in the acquiree, (2) recognizes and measures the goodwill acquired in the business combination or a gain from a bargain purchase and (3) determines what information to clarifydisclose to enable users of the accounting for abnormal amountsfinancial statements to evaluate the nature and financial effects of idle facility expense, freight, handling costs,the business combination. SFAS 141(R) is effective beginning with the Company's fiscal 2009. The impact of the adoption of SFAS 141(R) on the Company's results of operations and wasted material (spoilage). Among other provisions,financial position will depend on the new rule requires that items such as idle facility expense, excessive spoilage, double freightnature and re-handling costs must be recognized as current-period charges regardlessextent of whether they meet the criterion of “so abnormal” as stated in ARB No. 43. Additionally, SFAS 151 requiresbusiness combinations that the allocation of fixed production overheads toCompany completes, if any, in or after fiscal 2009.
In September 2006, the costs of conversion be based on the normal capacity of the production facilities.FASB issued SFAS 151No. 157, "Fair Value Measurements" ("SFAS 157"). SFAS 157 defines fair value, establishes a framework for measuring fair value in generally accepted accounting principles (GAAP) and expands disclosures about fair value measurements. SFAS 157 is effective for fiscal years beginning after JuneNovember 15, 20052007 and is required to be adopted by the Company in the first quarter of 2006, beginning on January 1, 2006. We do not expect SFAS 151 to have a material financial statement impact.
interim periods within those fiscal years. In December 2004,2007, the FASB issuedreleased a proposed FASB Staff Position (FSP FAS 157-b—Effective Date of FASB Statement of Financial Accounting Standards No. 153, “Exchanges of Non-monetary Assets - - An Amendment of APB Opinion No. 29” (“SFAS 153”). SFAS 153 eliminates the exception from fair value measurement for non-monetary exchanges of similar productive assets in paragraph 21(b) of APB Opinion No. 29, “Accounting for Non-monetary Transactions,” and replaces it with the exception for exchanges that do not have commercial substance. SFAS 153 specifies that a non-monetary exchange has commercial substance157) which, if the future cash flows of the entity are expected to change significantlyadopted as a result of the exchange. SFAS 153 is effective for the fiscal periods beginning after June 15, 2005 and is required to be adopted by the Company in the first quarter of fiscal 2006, beginning on January 1, 2006. We do not expect it to have a material financial statement impact.
In December 2004, the FASB issued Statement of Financial Accounting Standards No. 123 (revised 2004), “Share-Based Payment” (“SFAS 123R”), which requires the measurement of all share-based payments to employees, including grants of stock options, using a fair-value-based method and the recording of such expense in the consolidated statements of operations. The accounting provisions of SFAS 123R were originally effective for all reporting periods beginning after June 15, 2005. The pro forma disclosures previously permitted under SFAS 123 no longer will be an alternative to financial statement recognition. See “Stock-Based Compensation” above for the pro forma net income (loss) and net income (loss) per share amounts, as if we had used a fair-value-based method similar to the methods required under SFAS 123R to measure compensation expense for employee stock incentive awards.
In March 2005, the SEC issued Staff Accounting Bulletin (“SAB”) No. 107, providing supplemental implementation guidance for SFAS 123R. In April 2005, the Securities and Exchange Commission approved a rule that delayedproposed, would delay the effective date of SFAS 123R to157 for all nonfinancial assets and nonfinancial liabilities, except those that are recognized or disclosed at fair value in the first annual reporting period beginning after June 15, 2005. Althoughfinancial statements on a recurring basis (at least annually). Based on our current operations, we havedo not yet determined whetherexpect that the adoption of SFAS 123R will result in amounts that are similar to the current pro forma disclosures under SFAS 123, we are evaluating the requirements under SFAS 123R and SAB 107 and expect the adoption to have a significant adverse impact on our consolidated statements of operations and net loss per share. SFAS123R will be effective for us beginning with the first quarter of 2006.
In May 2005, the FASB issued SFAS 154, “Accounting Changes and Error Corrections—a replacement of APB Opinion No. 20 and FASB Statement No. 3” (“SFAS 154”). SFAS 154 changes the requirements for the accounting for and reporting of a change in accounting principle, and applies to all voluntary changes in accounting principle. It also applies to changes required by an accounting pronouncement in the unusual instance that the pronouncement does not include specific transition provisions. This statement requires retrospective application to prior periods’ financial statements of
changes in accounting principle, unless it is impracticable to determine either the period-specific effects or the cumulative effect of the change. SFAS 154 is effective for accounting changes made in fiscal years beginning after December 15, 2005. We do not expect the adoption of this statement157 will have a material impact on our financial position or results of operations or financial condition.operations.
In November 2005,February 2007, the FASB issued SFAS No. 159, "The Fair Value Option for Financial Assets and Financial Liabilities—Including an amendment of FASB Staff Posistion FAS 115-1Statement No. 115" ("SFAS 159"). SFAS 159 expands the use of fair value accounting to many financial instruments and FAS 124-1, “The Meaning of Other-Than-Temporary Impairmentcertain other items. The fair value option is irrevocable and Its Applicationgenerally made on an instrument-by-instrument basis, even if a company has similar instruments that it elects not to Certain Investments” (“FSP FAS 115-1”), which provides guidancemeasure based on determining when investments in certain debt and equity securities are considered impaired, whether that impairmentfair value. SFAS 159 is other-than-temporary, and on measuring such impairment loss. FSP FAS 115-1 also includes accounting considerations subsequent to the recognition of an other-than temporary impairment and requires certain disclosures about unrealized losses that have not been recognized as other-than-temporary impairments. FSP FAS 115-1 is required to be applied to reporting periodseffective for fiscal years beginning after DecemberNovember 15, 2005. We are required to adopt FSP FAS 115-1 in the first quarter of fiscal 2006. We2007. Based on our current operations, we do not expect that the adoption of this statementSFAS 159 will have a material impact on our financial position or results of operations.
In December 2007, the FASB issued SFAS No. 160,"Noncontrolling Interests in Consolidated Financial Statements" ("SFAS 160"). SFAS 160 requires that minority interest be separately reported in the consolidated entity's equity section and that no gain or loss shall be reported when transactions occur between the controlling interest and the non-controlling interests. Furthermore, the acquisition of non-controlling interest by the controlling interest is not treated as a business combination. SFAS 160 is effective for fiscal years beginning after December 15, 2008. We have not yet evaluated the impact of SFAS 160 on our consolidated financial position, results of operations or financial condition.cash flows.
Note 2. Discontinued Operations
In the first quarter of 2007, we dissolved the corporation that previously operated our discontinued operations and Related Assets Held for Saletransferred the cash balance to our continuing operations. Accordingly, we no longer have discontinued operations.
In 2006, the $18,000 in income was from interest on cash balances held in the discontinued operations.
In June 2003, we announced the discontinuation of our opto-electronics division, which we had established as part of our acquisition of Lyte Optronics, Inc. in May 1999. The discontinued opto-electronics division manufactured blue, cyan,1999, and green high-brightness light emitting diodes (HBLEDs) for the illumination markets, including full-color displays, wireless handset backlighting and traffic signals, and also manufactured vertical cavity surface emitting lasers (VCSELs) and laser diodes for fiber optic communications and storage area networks. Accordingly,thereafter segregated the results of operations of the opto-electronics division have been segregated from continuing operations and are reported them separately as discontinued operations in our consolidated statements of operations for all periods presented.
In September 2003, we completed the sale of substantially all of the assets of our opto-electronics business to Lumei Optoelectronics Corp. (Lumei) and Dalian Luming Science and Technology
Group, Co., Ltd. for the Chinese Renminbi (RMB) equivalent of $9.6 million. A portion of the purchase price equal to $1.0 million was held in escrow to satisfy any claims that the purchasers might make for breaches of representations or warranties by us. Of this total escrow, $750,000 could be released after the one year anniversaryAfter resolution of the sale of the opto-electronics business and the remainder could be released after the second anniversary of the sale. To date, we have resolved all claims made against the $1.0escrow, approximately $0.2 million that was heldreceived from escrow in escrow.2004, while the remaining $0.6 million was received in 2005. For the year ended December 31, 2005, we recorded a $550,000$0.6 million gain from escrow refund, a $58,000$0.1 million gain in property tax refunds a $53,000and gain on disposal of properties, and $9,000 in interest income, offset by $126,000$0.2 million in expenses totaling a net gain of $544,000. Of the $750,000 escrow amount, approximately $200,000 was received in 2004, while the remaining $550,000 was received in 2005.$0.5 million.
In June 2005, we completed the sale of a building located in Monterey Park, California. This asset had been classified as “assets held for sale” in the amount of $1.25 million on the consolidated balance sheet as of December 31, 2004. We received net proceeds on the sale of the property of approximately $1.3 million and accordingly recorded a gain on disposal of $53,000.$0.1 million.
Our consolidated financial statements have been presented to reflect the opto-electronics business as a discontinued operation for all periods presented. Operating results of the discontinued operation are as follows (in thousands):
| Years Ended December 31, |
| ||||||||
|
| 2005 |
| 2004 |
| 2003 |
| |||
Revenue |
| $ | — |
| $ | — |
| $ | 7,245 |
|
Cost of revenue |
| — |
| — |
| 9,972 |
| |||
Gross loss |
| — |
| — |
| (2,727 | ) | |||
Operating expenses: |
|
|
|
|
|
|
| |||
Selling, general and administrative |
| — |
| (222 | ) | 2,297 |
| |||
Research and development |
| — |
| — |
| 814 |
| |||
Total operating expenses |
| — |
| (222 | ) | 3,111 |
| |||
Gain (loss) from operations |
| — |
| 222 |
| (5,838 | ) | |||
Other (income) expense, net |
| — |
| (250 | ) | — |
| |||
Interest expense |
| — |
| — |
| 325 |
| |||
Gain (loss) from discontinued operations before benefit for income taxes and gain (loss) on disposal |
| — |
| 472 |
| (6,163 | ) | |||
Income tax benefit |
| — |
| — |
| — |
| |||
Gain (loss) on disposal |
| 544 |
| 419 |
| (9,475 | ) | |||
Net gain (loss) from discontinued operations |
| $ | 544 |
| $ | 891 |
| $ | (15,638 | ) |
| | Years Ended December 31, | |||||||||||
|---|---|---|---|---|---|---|---|---|---|---|---|---|
| | 2007 | 2006 | 2005 | |||||||||
| Revenue | $ | — | $ | — | $ | — | ||||||
| Cost of revenue | — | — | — | |||||||||
| Gross loss | — | — | — | |||||||||
| Operating expenses: | ||||||||||||
| Selling, general and administrative | — | — | (59 | ) | ||||||||
| Total operating expenses | — | — | (59 | ) | ||||||||
| Gain (loss) from operations | — | 59 | ||||||||||
| Other income (expense), net | — | 18 | — | |||||||||
| Gain (loss) from discontinued operations before gain on disposal | — | 18 | (59 | ) | ||||||||
| Gain on disposal | — | — | 603 | |||||||||
| Net gain from discontinued operations | $ | — | $ | 18 | $ | 544 | ||||||
The carrying value of the assets and liabilities of the discontinued opto-electronics business included in the consolidated balance sheets are as follows (in thousands):
| As of |
| |||||
|
| 2005 |
| 2004 |
| ||
Current assets: |
|
|
|
|
| ||
Cash |
| $ | 472 |
| $ | 537 |
|
Accounts receivable, net |
| — |
| 19 |
| ||
Assets held for sale |
| — |
| 1,250 |
| ||
Total current assets |
| 472 |
| 1,806 |
| ||
Other assets |
| — |
| 200 |
| ||
Total assets |
| $ | 472 |
| $ | 2,006 |
|
Current liabilities: |
|
|
|
|
| ||
Accounts payable |
| $ | — |
| $ | — |
|
Accrued liabilities |
| 95 |
| 359 |
| ||
Total liabilities |
| 95 |
| 359 |
| ||
Net assets |
| 377 |
| 1,647 |
| ||
Total liabilities and net assets |
| $ | 472 |
| $ | 2,006 |
|
| | As of December 31, | |||||||
|---|---|---|---|---|---|---|---|---|
| | 2007 | 2006 | ||||||
| Current assets: | ||||||||
| Cash | $ | — | $ | 395 | ||||
| Total current assets | — | 395 | ||||||
| Other assets | — | — | ||||||
| Total assets | $ | — | $ | 395 | ||||
| Current liabilities: | ||||||||
| Accrued liabilities | $ | — | $ | — | ||||
| Total liabilities | — | — | ||||||
| Net assets | — | 395 | ||||||
| Total liabilities and net assets | $ | — | $ | 395 | ||||
Note 3. Cash, Cash Equivalents and Short-Term Investments
Our cash, cash equivalents and short term investments are classified as follows (in thousands):
|
| ||||||||||||||||||||||||||||
|
|
|
|
|
|
|
| ||||||||||||||||||||||
| |||||||||||||||||||||||||||||
Cash |
|
| $ | 12,803 |
|
|
| $ | — |
|
|
| $ | — |
|
| $ | 12,803 |
|
| $ | 8,638 |
|
|
| $ | — |
|
|
| $ | — |
|
| $ | 8,638 |
|
Cash equivalents: |
|
|
|
|
|
|
|
|
|
|
|
|
|
|
|
|
|
|
|
|
|
|
|
|
|
|
|
|
| ||||||||
Money market fund |
|
| 1,729 |
|
|
| — |
|
|
| — |
|
| 1,729 |
|
| 1,681 |
|
|
| — |
|
|
| — |
|
| 1,681 |
| ||||||||
US Treasury and agency securities |
|
| — |
|
|
| — |
|
|
| — |
|
| — |
|
| — |
|
|
| — |
|
|
| — |
|
| — |
| ||||||||
Commercial paper |
|
| 2,940 |
|
|
| — |
|
|
| — |
|
| 2,940 |
|
| 398 |
|
|
| — |
|
|
| — |
|
| 398 |
| ||||||||
Repurchase agreements |
|
| — |
|
|
| — |
|
|
| — |
|
| — |
|
| 1,400 |
|
|
| — |
|
|
| — |
|
| 1,400 |
| ||||||||
Total cash equivalents |
|
| 4,669 |
|
|
| — |
|
|
| — |
|
| 4,669 |
|
| 3,479 |
|
|
| — |
|
|
| — |
|
| 3,479 |
| ||||||||
Total cash and cash equivalents |
|
| 17,472 |
|
|
| — |
|
|
| — |
|
| 17,472 |
|
| 12,117 |
|
|
| — |
|
|
| — |
|
| 12,117 |
| ||||||||
Short-term investments: |
|
|
|
|
|
|
|
|
|
|
|
|
|
|
|
|
|
|
|
|
|
|
|
|
|
|
|
|
| ||||||||
US Treasury and agency securities |
|
| 4,460 |
|
|
| — |
|
|
| (12 | ) |
| 4,448 |
|
| 10,468 |
|
|
| — |
|
|
| (16 | ) |
| 10,452 |
| ||||||||
Asset-backed securities |
|
| 3,285 |
|
|
| — |
|
|
| (11 | ) |
| 3,274 |
|
| 4,410 |
|
|
| — |
|
|
| (25 | ) |
| 4,385 |
| ||||||||
Commercial paper |
|
| — |
|
|
| — |
|
|
| — |
|
| — |
|
| 1,708 |
|
|
| — |
|
|
| (1 | ) |
| 1,707 |
| ||||||||
Corporate bonds |
|
| 2,504 |
|
|
| — |
|
|
| (13 | ) |
| 2,491 |
|
| 8,737 |
|
|
| — |
|
|
| (30 | ) |
| 8,707 |
| ||||||||
Corporate equity securities |
|
| 1,468 |
|
|
| 1,324 |
|
|
| — |
|
| 2,792 |
|
| 1,465 |
|
|
| 1,561 |
|
|
| — |
|
| 3,026 |
| ||||||||
Total short-term investments |
|
| 11,717 |
|
|
| 1,324 |
|
|
| (36 | ) |
| 13,005 |
|
| 26,788 |
|
|
| 1,561 |
|
|
| (72 | ) |
| 28,277 |
| ||||||||
Total cash, cash equivalents and short-term investments |
|
| $ | 29,189 |
|
|
| $ | 1,324 |
|
|
| $ | (36 | ) |
| $ | 30,477 |
|
| $ | 38,905 |
|
|
| $ | 1,561 |
|
|
| $ | (72 | ) |
| $ | 40,394 |
|
Contractual maturities on short-term investments: |
|
|
|
|
|
|
|
|
|
|
|
|
|
|
|
|
|
|
|
|
|
|
|
|
|
|
|
|
| ||||||||
Due within 1 year |
|
| $ | 8,384 |
|
|
|
|
|
|
|
|
|
| $ | 9,682 |
|
| $ | 21,879 |
|
|
|
|
|
|
|
|
|
| $ | 23,394 |
| ||||
Due after 1 through 5 years |
|
| 3,333 |
|
|
|
|
|
|
|
|
|
| 3,323 |
|
| 4,909 |
|
|
|
|
|
|
|
|
|
| 4,883 |
| ||||||||
|
|
| $ | 11,717 |
|
|
|
|
|
|
|
|
|
| $ | 13,005 |
|
| $ | 26,788 |
|
|
|
|
|
|
|
|
|
| $ | 28,277 |
| ||||
| | December 31, 2007 | December 31, 2006 | |||||||||||||||||||||||
|---|---|---|---|---|---|---|---|---|---|---|---|---|---|---|---|---|---|---|---|---|---|---|---|---|---|
| | Amortized Cost | Gross Unrealized Gain | Gross Unrealized (Loss) | Fair Value | Amortized Cost | Gross Unrealized Gain | Gross Unrealized (Loss) | Fair Value | |||||||||||||||||
| Classified as: | |||||||||||||||||||||||||
| Cash | $ | 10,818 | $ | — | $ | — | $ | 10,818 | $ | 6,892 | $ | — | $ | — | $ | 6,892 | |||||||||
| Cash equivalents: | |||||||||||||||||||||||||
| Money market fund | 7,562 | — | — | 7,562 | 7,045 | — | — | 7,045 | |||||||||||||||||
| US Treasury and agency securities | — | — | — | — | 2,179 | — | — | 2,179 | |||||||||||||||||
| Total cash equivalents | 7,562 | — | — | 7,562 | 9,224 | — | — | 9,224 | |||||||||||||||||
| Total cash and cash equivalents | 18,380 | — | — | 18,380 | 16,116 | — | — | 16,116 | |||||||||||||||||
| Investments: | |||||||||||||||||||||||||
| US Treasury and agency securities | 1,400 | — | — | 1,400 | 12,277 | — | (39 | ) | 12,238 | ||||||||||||||||
| Asset-backed securities | 3,820 | — | (77 | ) | 3,743 | 809 | — | (1 | ) | 808 | |||||||||||||||
| Commercial paper | 3,300 | — | (115 | ) | 3,185 | 500 | — | — | 500 | ||||||||||||||||
| Corporate bonds | 19,051 | 260 | (114 | ) | 19,197 | 13,035 | — | (3 | ) | 13,032 | |||||||||||||||
| Total investments | 27,571 | 260 | (306 | ) | 27,525 | 26,621 | — | (43 | ) | 26,578 | |||||||||||||||
| Total cash, cash equivalents and investments | $ | 45,951 | $ | 260 | $ | (306 | ) | $ | 45,905 | $ | 42,735 | $ | — | $ | (43 | ) | $ | 42,694 | |||||||
| Contractual maturities on investments: | |||||||||||||||||||||||||
| Due within 1 year | $ | 2,050 | $ | 2,050 | $ | 13,767 | $ | 13,727 | |||||||||||||||||
| Due after 1 through 5 years | 25,521 | 25,475 | 12,854 | 12,851 | |||||||||||||||||||||
| $ | 27,571 | $ | 27,525 | $ | 26,621 | $ | 26,578 | ||||||||||||||||||
69
The short-term investments amounts include $7.5$6.7 million and $8.2$7.2 million recorded as restricted deposits on the consolidated balance sheets as of December 31, 20052007 and 2004, respectively.2006, respectively, as a result of the outstanding principal amount on our industrial revenue bonds.
We manage our short-term investments as a single portfolio of highly marketable securities that is intended to be available to meet our current cash requirements. We have no investments in auction rate securities. For the yearsyear ended December 31, 2005 and 2004,2007, we had no$1.0 million of gross realized gain or lossgains on sales of our available-for-sale securities. For the year ended December 31, 2006, we had $3.3 million of gross realized gains on sales of our available-for-sale securities.
The gross unrealized losses related to our portfolio of available-for-sale securities were primarily due to a decrease in the fair value of debt securities as a result of an increase in interest rates during 2005.2007. We have determined that the gross unrealized losses on our available-for-sale securities as of December 31, 20052007 are temporary in nature. We reviewed our investment portfolio to identify and evaluate investments that have indications of possible impairment. Factors considered in determining whether a loss is temporary include the magnitude of the decline in market value, the length of time the market value has been below cost (or adjusted cost), credit quality, and our ability and intent to hold the securities for a period of time sufficient to allow for any anticipated recovery in market value.
The following table provides a breakdown of our available-for-sale securities with unrealized losses as of December 31, 20052007 and 20042006 (in thousands):
|
| In Loss Position |
| In Loss Position |
| Total In |
| ||||||||||||||||||||
2005 |
|
|
| Fair |
| Gross |
| Fair |
| Gross |
| Fair |
| Gross |
| ||||||||||||
Short-term investments: |
|
|
|
|
|
|
|
|
|
|
|
|
|
|
|
|
|
|
| ||||||||
US Treasury and agency securities |
| $ | 2,757 |
|
| $ | (9 | ) |
| $ | 1,691 |
|
| $ | (3 | ) |
| $ | 4,448 |
|
| $ | (12 | ) |
| ||
Asset-backed securities |
| 1,642 |
|
| (4 | ) |
| 1,632 |
|
| (7 | ) |
| 3,274 |
|
| (11 | ) |
| ||||||||
Corporate bonds |
| 2,491 |
|
| (13 | ) |
| — |
|
| — |
|
| 2,491 |
|
| (13 | ) |
| ||||||||
Total in loss position |
| $ | 6,890 |
|
| $ | (26 | ) |
| $ | 3,323 |
|
| $ | (10 | ) |
| $ | 10,213 |
|
| $ | (36 | ) |
| ||
| | In Loss Position < 12 months | In Loss Position > 12 months | Total In Loss Position | |||||||||||||||||
|---|---|---|---|---|---|---|---|---|---|---|---|---|---|---|---|---|---|---|---|---|
| 2007 | Fair Value | Gross Unrealized (Loss) | Fair Value | Gross Unrealized (Loss) | Fair Value | Gross Unrealized (Loss) | ||||||||||||||
| Investments: | ||||||||||||||||||||
| Asset-backed securities | $ | 3,743 | $ | (77 | ) | $ | — | $ | — | $ | 3,743 | $ | (77 | ) | ||||||
| Commercial paper | 3,185 | (115 | ) | — | — | 3,185 | (115 | ) | ||||||||||||
| Corporate bonds | 13,286 | (114 | ) | — | — | 13,286 | (114 | ) | ||||||||||||
| Total in loss position | $ | 20,214 | $ | (306 | ) | $ | — | $ | — | $ | 20,214 | $ | (306 | ) | ||||||
| | In Loss Position < 12 months | In Loss Position > 12 months | Total In Loss Position | |||||||||||||||||
|---|---|---|---|---|---|---|---|---|---|---|---|---|---|---|---|---|---|---|---|---|
| 2006 | Fair Value | Gross Unrealized (Loss) | Fair Value | Gross Unrealized (Loss) | Fair Value | Gross Unrealized (Loss) | ||||||||||||||
| Investments: | ||||||||||||||||||||
| US Treasury and agency securities | $ | 10,542 | $ | (36 | ) | $ | 1,696 | $ | (3 | ) | $ | 12,238 | $ | (39 | ) | |||||
| Asset-backed securities | 499 | — | 310 | (1 | ) | 809 | (1 | ) | ||||||||||||
| Corporate bonds | 1,683 | (3 | ) | — | — | 1,683 | (3 | ) | ||||||||||||
| Total in loss position | $ | 12,724 | $ | (39 | ) | $ | 2,006 | $ | (4 | ) | $ | 14,730 | $ | (43 | ) | |||||
|
| In Loss Position |
| In Loss Position |
| Total In |
| ||||||||||||||||||||
2004 |
|
|
| Fair |
| Gross |
| Fair |
| Gross |
| Fair |
| Gross |
| ||||||||||||
Short-term investments: |
|
|
|
|
|
|
|
|
|
|
|
|
|
|
|
|
|
|
| ||||||||
US Treasury and agency securities |
| $ | 9,452 |
|
| $ | (16 | ) |
| $ | — |
|
| $ | — |
|
| $ | 9,452 |
|
| $ | (16 | ) |
| ||
Asset-backed securities |
| 4,385 |
|
| (25 | ) |
| — |
|
| — |
|
| 4,385 |
|
| (25 | ) |
| ||||||||
Commercial paper |
| 1,312 |
|
| (1 | ) |
| — |
|
| — |
|
| 1,312 |
|
| (1 | ) |
| ||||||||
Corporate bonds |
| 8,707 |
|
| (30 | ) |
| — |
|
| — |
|
| 8,707 |
|
| (30 | ) |
| ||||||||
Total in loss position |
| $ | 23,856 |
|
| $ | (72 | ) |
| $ | — |
|
| $ | — |
|
| $ | 23,856 |
|
| $ | (72 | ) |
| ||
Note 4. Inventories, Net
The components of inventory are summarized below (in thousands):
|
| As of December 31, |
| ||||
|
| 2005 |
| 2004 |
| ||
Inventories: |
|
|
|
|
| ||
Raw materials |
| $ | 6,667 |
| $ | 4,416 |
|
Work in process |
| 9,141 |
| 10,474 |
| ||
Finished goods |
| 348 |
| 1,572 |
| ||
|
| $ | 16,156 |
| $ | 16,462 |
|
| | As of December 31, | ||||||
|---|---|---|---|---|---|---|---|
| | 2007 | 2006 | |||||
| Inventories: | |||||||
| Raw materials | $ | 11,154 | $ | 8,419 | |||
| Work in process | 12,254 | 11,222 | |||||
| Finished goods | 1,373 | 622 | |||||
| $ | 24,781 | $ | 20,263 | ||||
Note 5. Property, Plant and Equipment, Net
The components of our property, plant and equipment are summarized below (in thousands):
|
| As of December 31, |
| As of December 31, | ||||||||||
|---|---|---|---|---|---|---|---|---|---|---|---|---|---|---|
|
| 2005 |
| 2004 |
| 2007 | 2006 | |||||||
Property, plant and equipment: |
|
|
|
|
| |||||||||
Land |
| $ | 1,120 |
| $ | 1,120 |
| |||||||
Building |
| 16,421 |
| 15,751 |
| $ | 12,642 | $ | 10,019 | |||||
Machinery and equipment |
| 17,798 |
| 16,176 |
| 22,835 | 19,523 | |||||||
Leasehold improvements |
| 868 |
| 828 |
| 861 | 769 | |||||||
Construction in progress |
| 623 |
| 634 |
| 2,290 | 2,363 | |||||||
|
| 36,830 |
| 34,509 |
| |||||||||
| 38,628 | 32,674 | |||||||||||||
Less: accumulated depreciation and amortization |
| (19,524 | ) | (15,464 | ) | (22,642 | ) | (19,899 | ) | |||||
|
| $ | 17,306 |
| $ | 19,045 |
| |||||||
| $ | 15,986 | $ | 12,775 | |||||||||||
Depreciation expenses were $3.7expense was $1.5 million, $4.9$2.6 million, and $5.8$3.7 million for the years ended 2005, 2004,2007, 2006, and 2003,2005, respectively.
Note 6. Corporate AffiliatesInvestments in Privately-held Companies
We have made strategic investments in private companies located in China in order to gain access to raw materials at competitive cost that are critical to our substrate business.
Our corporate affiliatesinvestments are summarized below (in thousands):
|
|
| Investment Balance |
| Accounting |
| Ownership |
| Investment Balance As of December 31, | | | |||||||||||||||
|---|---|---|---|---|---|---|---|---|---|---|---|---|---|---|---|---|---|---|---|---|---|---|---|---|---|---|
Affiliate |
|
|
| 2005 |
| 2004 |
| Method |
| Percentage |
| |||||||||||||||
| Company | Investment Balance As of December 31, | Accounting Method | Ownership Percentage | |||||||||||||||||||||||
Beijing Ji Ya Semiconductor Material Co., Ltd | Beijing Ji Ya Semiconductor Material Co., Ltd |
| $ | 996 |
| $ | 1,071 |
| Consolidated |
|
| 46 | % |
| $ | 996 | $ | 996 | Consolidated | 46 | % | |||||
Nanjing Jin Mei Gallium Co., Ltd | Nanjing Jin Mei Gallium Co., Ltd |
| 592 |
| 616 |
| Consolidated |
|
| 83 |
|
| 592 | 592 | Consolidated | 83 | ||||||||||
Beijing BoYu Manufacturing Co., Ltd |
| 410 |
| 409 |
| Consolidated |
|
| 70 |
|
| |||||||||||||||
| Beijing BoYu Semiconductor Vessel Craftwork Technology Co., Ltd | 410 | 410 | Consolidated | 70 | ||||||||||||||||||||||
Xilingol Tongli Germanium Co. Ltd | Xilingol Tongli Germanium Co. Ltd |
| 864 |
| 863 |
| Equity |
|
| 25 |
|
| 2,138 | 1,304 | Equity | 25 | ||||||||||
Emeishan Jia Mei High Purity Metals Co., Ltd | Emeishan Jia Mei High Purity Metals Co., Ltd |
| 596 |
| 593 |
| Equity |
|
| 25 |
|
| 761 | 670 | Equity | 25 | ||||||||||
Our ownership of Beijing Ji Ya Semiconductor Material Co., Ltd. (Ji Ya) at inception was 51%. As of December 31, 2005,During 2006, our ownership share was reduced to 46% as 5% of our ownership was given to Ji Ya’sYa's management upon fulfillment of working at Ji Ya for at least four years. There are no further outstanding commitments. We will continue to consolidate Ji Ya as we have significant influence in management and have a majority control of the board. Our chief financial officer is chairman of the board, while our chief executive officer, our chief operating officer, and our president of joint venture operations are members of the board.
We have a similar arrangement with Nanjing Jin Mei Gallium Co., Ltd. (Jin Mei) where our ownership at inception was 88%. As of December 31, 2005,During 2006, our ownership share was reduced to 83% as 5% of our ownership was given to Jin Mei’sMei's management upon fulfillment of working at Jin Mei for at least three years. There are no further outstanding commitments. We will continue to consolidate Jin Mei as we have significant influence in management and have a majority control of the board. Our chief operating officer is chairman of the board, while our chief executive officer and our president of joint venture operations are members of the board.
We have significant influence over management of Beijing BoYu Semiconductor Vessel Craftwork Technology Co., Ltd (BoYu), have a controlling financial interest of 70%, and have a majority control of the board. Our chief executive officer is chairman of the board, while our chief operating officer and our president of joint venture operations are members of the board.
The investment balances for the two affiliatescompanies accounted for under the equity method are included in other assets in the consolidated balance sheets.sheets and totaled $2.9 million and $2.0 million as of December 31, 2007 and 2006, respectively. We own 25% of the ownership interests in each of these affiliates.companies. These two affiliatescompanies are not considered variable interest entities because:
·
- •
- both
affiliatescompanies have sustainable businesses of their own;· - •
- our voting power is proportionate to our ownership interests;
and· - •
- we only recognize our respective share of the losses and/or residual returns generated by the
affiliatescompanies if theyoccur, or both.Weoccur; and - •
- we do not have controlling financial
interestsinterest in,either affiliate,do not maintain operational or management controlnorof, do not controlofthe board of directors of, and are not required to provide additional investment or financial support to eitheraffiliate.company.
Undistributed retained earnings relating to our corporate affiliatesinvestments in these privately-held companies were $2.6$7.8 million and $1.4$4.4 million as of December 31, 20052007 and 2004,2006, respectively. Net income recorded from our corporate affiliates wereinvestments was $3.5 million, $1.8 million, and $1.1 million, and $668,000 for the years ended December 31, 20052007, 2006, and 2004,2005, respectively.
Note 7. Investments
We As of December 31, 2007 we only maintain minority investments in private andcompanies. During 2006 we sold all of our shares of common stock of the only publicly traded companies. Thesecompany we held, Finisar Corporation, generating net proceeds of $4.4 million and recording a gain of $3.3 million, which is included in other income and (expense). Our investments in private companies are reviewed for other than temporary declines in value on a quarterly basis. These investments are classified as other assets in the consolidated balance sheets and are accounted for under the cost method as we do not have the ability to exercise significant influence over their operations. We monitor our investments for impairment and record reductions in carrying value when events or changes in circumstances indicate that the carrying value may not be recoverable. Reasons for other than temporary declines in value include whether the related company would have insufficient cash flow to operate for the next twelve months, significant changes in the operating performance and changes in market conditions. As of December 31, 20052007 and 2004,2006, the minority investments totaled approximately $392,000$0.4 million for both years. In 2004, we recorded a $0.2 million charge related to impairment in one of the U.S. private companies.
Note 8. Restructuring Costs
As Our restructuring accrual balance as of December 31, 20052007 and 2004, our2006 was zero. We did not have any restructuring accruals are as follows (in thousands):in 2007 nor 2006.
2005 |
|
|
| Restructuring |
| Additions |
| Payments |
| Restructuring |
| ||||||||||||
Future lease payments related to abandoned facilities |
|
| $ | 552 |
|
|
| $ | 236 |
|
|
| $ | (538 | ) |
|
| $ | 250 |
|
| ||
Workforce reduction |
|
| — |
|
|
| 329 |
|
|
| (114 | ) |
|
| 215 |
|
| ||||||
Japan office closure |
|
| — |
|
|
| 271 |
|
|
| (271 | ) |
|
| — |
|
| ||||||
Total |
|
| $ | 552 |
|
|
| $ | 836 |
|
|
| $ | (923 | ) |
|
| $ | 465 |
|
| ||
2004 |
|
|
| Restructuring |
| Additions |
| Payments |
| Restructuring |
| ||||||||||||
Future lease payments related to abandoned facilities |
|
| $ | — |
|
|
| $ | 845 |
|
|
| $ | (293 | ) |
|
| $ | 552 |
|
| ||
Workforce reduction |
|
| — |
|
|
| 463 |
|
|
| (463 | ) |
|
| — |
|
| ||||||
Total |
|
| $ | — |
|
|
| $ | 1,308 |
|
|
| $ | (756 | ) |
|
| $ | 552 |
|
| ||
In March 2005, we announced that we would be reducing the workforce at our Beijing, China manufacturing facility by approximately 100 positions or approximately 15%. This measure was taken as
| | Restructuring Accrual as of December 31, 2005 | Reversals/ Additions | Payments | Restructuring Accrual as of December 31, 2006 | ||||||||
|---|---|---|---|---|---|---|---|---|---|---|---|---|
| Future lease payments related to abandoned facilities | $ | 250 | $ | — | $ | (250 | ) | $ | — | |||
| Workforce reduction | 215 | (2 | ) | (213 | ) | — | ||||||
| Total | $ | 465 | $ | (2 | ) | $ | (463 | ) | $ | — | ||
part of our ongoing effort to reduce our cost structure and bring capacity in line with current market demand. Accordingly, During 2006, we recorded a restructuring charge of $56,000 in March 2005paid down the remaining $250,000 relating to the reductionlease costs associated with facilities located in work force, which we completed in June 2005. We anticipate annual savings of $0.3 million relating to this reduction in force.
In April 2005, we closed our Japan office as part of our ongoing effort to reduce our cost structure. Accordingly, we recorded restructuring charges of $98,000 and $9,000, for the second and third quarters of 2005, respectively, relating to the closure of our Japan office. We also anticipate payroll and related expense annual savings of approximately $0.3 million.
In December 2005, we further reduced the workforce at our Fremont, California facility by approximately 15 positions that arewere no longer required to support production and operations, or approximately 29 percent, overproduction. During the next 120 days. This measure was being taken as partfirst quarter of our ongoing effort to downsize our Fremont, California facility headcount. Accordingly,2006, we recorded a restructuring charge of approximately $273,000 in December 2005 relatedpaid down $213,000 relating to the reduction in force for severance-related expenses from the reduction in force, all of which will be cash expenditures.force. We anticipate that the cash outflow from this charge to be incurred over the two quarters commencing in the first quarter of 2006 and we expect to save $0.9 million annually in payroll and related expenses. Also in December 2005, we recorded an additional restructuring charge of approximately $164,000, primarilyalso recognized a $2,000 benefit related to the final liquidation procedures of AXT’s Japan office so asan adjustment to eliminate the remaining assets. There is no expected cash outflow of this charge.prior accrual.
Overall for the year ended December 31, 2005, wNote 9. Debte recorded restructuring charges of $236,000 relating to lease costs associated with facilities located in California that are no longer required to support production. The remaining restructuring accrual for future lease payments related to abandoned U.S. facilities of $250,000 is expected to be paid out through 2006, and is included on the accompanying consolidated balance sheet as accrued restructuring.
For 2004, we announced plans to cease all production activities in the United States and to manufacture our products only in China during the second quarter. In June 2004, we incurred a restructuring charge of $1.1 million as a result of our decision to close down our remaining manufacturing facilities in the United States. In the third and fourth quarter of 2004, we incurred additional restructuring charges of $231,000 for a total of $1.3 million in 2004. These charges comprised costs related to the reduction in work force effected in June 2004, and lease costs associated with the facilities located in California that are no longer required to support production. In aggregate, we eliminated 50 positions, 47 of which were production workers.Credit Facility
As of December 31, 2004, we saved approximately $560,000 in payroll and related expenses.
Note 9. Debt
Credit Facility
As of December 31, 2005,2007, the credit facility maintained by us with a bank included a letter of credit supporting repayment of our industrial bonds with an outstanding amount of $7.5$6.7 million. We have pledged and placed cash and certain investment securities with the trust department of the bank as additional collateral for this facility. Accordingly, $7.5$6.7 million of cash and short-term investments are restricted.
73
Long-Term Debt
The components of long-term debt are summarized below (in thousands):
|
| As of December 31, |
| As of December 31, | ||||||||||
|---|---|---|---|---|---|---|---|---|---|---|---|---|---|---|
|
| 2005 |
| 2004 |
| 2007 | 2006 | |||||||
Taxable revenue bonds, collateralized by a letter of credit from a bank, bearing interest at the H15 30 day bond yield for commercial paper which was 4.43% on December 31, 2005, maturing December 2023 |
| $ | 7,450 |
| $ | 8,050 |
| |||||||
Joint venture long term debt by outside shareholder at zero % interest maturing |
| 270 |
| 280 |
| |||||||||
| Taxable revenue bonds, collateralized by a letter of credit from a bank, bearing interest at the H15 30 day bond yield for commercial paper which was 5.16% as of December 31, 2007, maturing December 2023 | $ | 6,700 | $ | 7,150 | ||||||||||
| Joint venture long term debt by outside shareholder at zero% interest maturing in 2007 | — | 139 | ||||||||||||
|
| 7,720 |
| 8,330 |
| 6,700 | 7,289 | |||||||
Less current portion |
| (300 | ) | (450 | ) | (450 | ) | (450 | ) | |||||
|
| $ | 7,420 |
| $ | 7,880 |
| |||||||
Maturities of long-term debt as of December 31, 2005 were as follows: |
|
|
|
|
| |||||||||
2006 |
| $ | 300 |
|
|
| ||||||||
2007 |
| 720 |
|
|
| |||||||||
| $ | 6,250 | $ | 6,839 | |||||||||||
| Maturities of long-term debt as of December 31, 2007 were as follows: | ||||||||||||||
2008 |
| 520 |
|
|
| $ | 450 | |||||||
2009 |
| 450 |
|
|
| 450 | ||||||||
2010 |
| 450 |
|
|
| 450 | ||||||||
| 2011 | 450 | |||||||||||||
| 2012 | 450 | |||||||||||||
Thereafter |
| 5,280 |
|
|
| 4,450 | ||||||||
|
| $ | 7,720 |
|
|
| ||||||||
| $ | 6,700 | |||||||||||||
Note 10. Stockholders’Stockholders' Equity
In August 2004, we announced the adoption of a stock repurchase program in accordance with Rule 10b5-1 of the Securities Exchange Act of 1934 to provide for the repurchase of up to $2 million of our common stock. This plan was extended for one year in July 2005. Repurchases may bewere made from time to time in the open market during the twelve-month period endingended July 31, 2006, at prevailing market prices using our own cash resources. As of December 31, 2005,2007, we had 22,977,30130,357,982 shares of common stock outstanding and 201,516no shares were repurchased in 20052007 under this program.program, which has now expired.
The 883,000 shares of $0.001 par value Series A preferred stock issued and outstanding at December 31, 20052007 and 2006, valued at $3,532,000 are non-voting and non-convertible preferred stock with a 5.0% cumulative annual dividend rate payable when declared by the board of directors and $4
per share liquidation preference over common stock. These preferred shares were issued when we completed our acquisition of Lyte Optronics, IncInc. on May 28, 1999.
Note 11. Employee Benefit Plans
Stock Option Plans and Equity Incentive Plans
In March 1993, our board of directors approved the 1993 Stock Option Plan (1993 Plan), which provided for granting of incentive and non-qualified stock options to our employees and directors. Under the 1993 Plan, 880,000 shares of common stock were authorized for issuance. Options granted under the 1993 Plan were generally for periods not to exceed ten years and were granted at the fair market value of the stock at the date of grant as determined by the board of directors. Options granted under the 1993 Plan generally vested 25% upon grant and 25% each year thereafter, with full vesting occurring on the third anniversary of the grant date. This plan terminated on March 12, 2003.
In July 1997, our board of directors approved the 1997 Stock Option Plan (1997 Plan)("1997 Plan"), which provides for granting of incentive and non-qualified stock options to our employees and directors. Under the 1997 Plan, 5,423,583 shares of common stock have been authorized for issuance. Options granted under the
1997 Plan are generally for periods not to exceed ten years (five years if the option is granted to a 10% stockholder) and are granted at the fair market value of the stock at the date of grant as determined by the board of directors. Options granted under the 1997 Plan generally vest 25% at the end of one year and 2.1% each month thereafter, with full vesting after four years.
In May 2003, we announced2007, our shareholders approved our 2007 Equity Incentive Plan (the "2007 Plan"). The 2007 Plan is a voluntaryrestatement of the 1997 Plan which was scheduled to expire in 2007. The share reserve of the 1997 Plan became the reserve of the 2007 Plan, together with 1,300,000 additional shares approved for issuance under the 2007 Plan. As of December 31, 2007, approximately 2.9 million shares remained available for grant under the 2007 Plan. Awards may be made under the 2007 Plan of stock option exchange program for our employees. Underoptions, stock appreciation rights, restricted stock, restricted stock units, performance shares, performance units, deferred compensation awards and other stock-based awards. Stock options and stock appreciation rights awarded under the program, option holders, excluding our executive officers2007 Plan may not be repriced without stockholder approval. Stock options and independent directors, had the opportunity to cancel outstanding options with an exercise price in excess of $2.10 per share in exchange for new options tostock appreciation rights may not be granted atbelow fair market value. Stock options or stock appreciation rights generally shall not be fully vested over a future date that was at least six months and one day afterperiod of less than three years from the date of cancellation, which was June 30, 2003. The numbergrant and cannot be exercised more than 10 years from the date of shares of commongrant. Restricted stock, subject to the new options was equal to 75% of the number subject to the exchanged options. Under the exchange program, options to purchase an aggregate of 738,027 shares of our commonrestricted stock representing approximately 48% of the options that were eligible to be tendered in the offer as of May 27, 2003, were tenderedunits, and cancelled. New options willperformance awards generally shall not vest at the same rate as the exchanged options and have an exercise price equal to the fair market value of our common stock at the new grant date, which was $3.11 per share. On December 31, 2003, the Company granted options to purchase an aggregate of 522,754 shares of our common stock in exchange for such tendered options. In 2004, several officers voluntarily cancelled 771,000 options granted to them previously.faster than over a three-year period (or a twelve-month period if vesting is based on a performance measure).
The following summarizes our stock option activity under the 19931997 Plan and the 19972007 Plan, and the related weighted average exercise price within each category for each of the years ended December 31, 2003, 2004,2005, 2006, and 20052007 (in thousands)thousands, except per share data):
|
| Available |
| Number of |
| Weighted |
| Available for Grant | Number of Options Outstanding | Weighted- average Exercise Price | Weighted- average Remaining Contractual Life | Aggregate Intrinsic Value | ||||||||||||||
|---|---|---|---|---|---|---|---|---|---|---|---|---|---|---|---|---|---|---|---|---|---|---|---|---|---|---|
Balance as of December 31, 2002 |
|
| 1,455 |
|
|
| 3,564 |
|
|
| $ | 14.15 |
|
| ||||||||||||
Granted |
|
| (1,117 | ) |
|
| 1,117 |
|
|
| 2.29 |
|
| |||||||||||||
Exercised |
|
| — |
|
|
| (33 | ) |
|
| 2.19 |
|
| |||||||||||||
Cancelled |
|
| 2,060 |
|
|
| (2,060 | ) |
|
| 15.64 |
|
| |||||||||||||
Balance as of December 31, 2003 |
|
| 2,398 |
|
|
| 2,588 |
|
|
| 10.79 |
|
| |||||||||||||
Granted |
|
| (600 | ) |
|
| 600 |
|
|
| 1.51 |
|
| |||||||||||||
Exercised |
|
| — |
|
|
| (56 | ) |
|
| 2.73 |
|
| |||||||||||||
Cancelled |
|
| 822 |
|
|
| (822 | ) |
|
| 15.47 |
|
| |||||||||||||
| | | | | (in years) | | |||||||||||||||||||||
Balance as of December 31, 2004 |
|
| 2,620 |
|
|
| 2,310 |
|
|
| 2.70 |
|
| 2,620 | 2,310 | $ | 2.70 | |||||||||
Granted |
|
| (866 | ) |
|
| 866 |
|
|
| 1.27 |
|
| (866 | ) | 866 | 1.27 | |||||||||
Exercised |
|
| — |
|
|
| (5 | ) |
|
| 1.28 |
|
| — | (5 | ) | 1.28 | |||||||||
Cancelled |
|
| 254 |
|
|
| (254 | ) |
|
| 2.45 |
|
| |||||||||||||
| Canceled | 254 | (254 | ) | 2.45 | ||||||||||||||||||||||
Balance as of December 31, 2005 |
|
| 2,008 |
|
|
| 2,917 |
|
|
| $ | 2.30 |
|
| 2,008 | 2,917 | 2.30 | |||||||||
| Granted | (180 | ) | 180 | 4.52 | ||||||||||||||||||||||
| Exercised | — | (284 | ) | 1.96 | ||||||||||||||||||||||
| Canceled | 85 | (85 | ) | 1.50 | ||||||||||||||||||||||
| Balance as of December 31, 2006 | 1,913 | 2,728 | 2.51 | 6.37 | $ | 7,091 | ||||||||||||||||||||
| Additional shares authorized | 1,300 | |||||||||||||||||||||||||
| Plan shares expired | (124 | ) | ||||||||||||||||||||||||
| Granted | (354 | ) | 354 | 5.89 | ||||||||||||||||||||||
| Exercised | — | (461 | ) | 1.95 | ||||||||||||||||||||||
| Canceled | 144 | (144 | ) | 5.04 | ||||||||||||||||||||||
| Balance as of December 31, 2007 | 2,879 | 2,477 | $ | 2.95 | 6.93 | $ | 8,858 | |||||||||||||||||||
| Options vested and expected to vest as of December 31, 2007 | 2,366 | $ | 2.93 | 6.86 | $ | 8,557 | ||||||||||||||||||||
| Options exercisable as of December 31, 2007 | 1,638 | $ | 2.56 | 6.08 | $ | 6,747 | ||||||||||||||||||||
Information about stockThe options outstanding and exercisable as of December 31, 2005 is summarized below (in thousands):
|
| Options Outstanding |
|
|
| ||||||||||||||||||||
|
|
|
|
|
| Weighted |
|
|
| Options Exercisable |
| ||||||||||||||
Range of |
|
|
| Number |
| Average |
| Weighted |
| Number |
| Weighted |
| ||||||||||||
$1.17 - $ 1.37 |
|
| 1,200 |
|
|
| 8.89 |
|
|
| $ | 1.25 |
|
|
| 164 |
|
|
| $ | 1.22 |
|
| ||
$1.38 - $ 1.42 |
|
| 495 |
|
|
| 6.42 |
|
|
| 1.38 |
|
|
| 406 |
|
|
| 1.38 |
|
| ||||
$1.43 - $ 2.23 |
|
| 609 |
|
|
| 6.49 |
|
|
| 2.16 |
|
|
| 458 |
|
|
| 2.18 |
|
| ||||
$2.24 - $ 4.99 |
|
| 405 |
|
|
| 8.09 |
|
|
| 2.93 |
|
|
| 306 |
|
|
| 3.01 |
|
| ||||
$5.00 - $41.50 |
|
| 208 |
|
|
| 2.84 |
|
|
| 9.76 |
|
|
| 202 |
|
|
| 9.76 |
|
| ||||
|
|
| 2,917 |
|
|
| 7.43 |
|
|
| $ | 2.30 |
|
|
| 1,536 |
|
|
| $ | 3.03 |
|
| ||
As of December 31, 2004 and 2003, options to purchase 1,114,000 shares at a weighted average2007 were in the following exercise price ranges (in thousands, except per share data):
| | Options Outstanding as of December 31, 2007 | Options Vested and Exercisable as of December 31, 2007 | ||||||||||
|---|---|---|---|---|---|---|---|---|---|---|---|---|
| Range of Exercise Price | Shares | Weighted-average Exercise Price | Weighted-average Remaining Contractual Life | Shares | Weighted-Average Exercise Price | |||||||
| $1.17 - $ 1.38 | 1,230 | $ | 1.28 | 6.91 | 891 | $ | 1.29 | |||||
| $1.39 - $ 1.44 | 12 | $ | 1.41 | 7.39 | 7 | $ | 1.41 | |||||
| $1.45 - $ 2.24 | 466 | $ | 2.17 | 5.38 | 442 | $ | 2.18 | |||||
| $2.25 - $ 6.31 | 677 | $ | 4.95 | 8.67 | 206 | $ | 3.48 | |||||
| $6.32 - $41.50 | 92 | $ | 14.69 | 2.33 | 92 | $ | 14.69 | |||||
| 2,477 | $ | 2.95 | 6.93 | 1,638 | $ | 2.56 | ||||||
The total intrinsic value of $3.40 and 1,060,000 shares at a weighted average exercise price of $9.80, respectively, of our common stock were exercisable.
Employee Stock Purchase Plan
In February 1998, our board of directors approved the 1998 Employee Stock Purchase Plan (1998 Purchase Plan). Our stockholders approved the 1998 Purchase Plan in March 1998. A total of 900,000 shares of our common stock were reserved for issuance under the 1998 Purchase Plan, of which a total of approximately 845,000 shares were purchased as of December 31, 2005. The 1998 Purchase Plan permited eligible employees to acquire shares of our common stock through payroll deductions. The common stock purchase price was 85% of the lower of the market price of the common stock at the purchase date or the date of offer to the employee. A total of approximately 55,000, 106,000 and 404,000 shares, respectively, of common stock have been issued under the 1998 Purchase Planoptions exercised for the years ended December 31, 2007, 2006 and 2005 2004,were $1.4 million, $0.4 million and 2003,$2,000, respectively. We suspendedCash received from option exercises for the 1998 Purchase Plan in February 2005.years ended December 31, 2007, 2006 and 2005 were $0.9 million, $0.6 million, and $5,600, respectively.
As of December 31, 2006 and 2005, options to purchase 1,857,000 shares and 1,536,000 shares at weighted average exercise prices of $2.74 and $3.03 per share were vested and exercisable, respectively.
Restricted stock awards
A summary of activity related to restricted stock awards for the year ended December 31, 2007 is presented below:
| | Shares | Weighted-Average Grant Date Fair Value | |||
|---|---|---|---|---|---|
| Non-vested restricted stock shares outstanding at beginning of the year | — | $ | — | ||
| Restricted stock shares granted | 23,480 | $ | 4.26 | ||
| Restricted stock shares vested | — | $ | — | ||
| Non-vested restricted stock shares outstanding as of December 31, 2007 | 23,480 | $ | 4.26 | ||
As of December 31, 2007, we had $84,000 of unrecognized compensation expense, net of forfeitures, related to restricted stock awards, which will be recognized over the weighted average period of 2.51 years. During the year ended December 31, 2007, no shares of restricted stock were vested.
Retirement Savings Plan
We have a 401(k) Savings Plan (Savings Plan)("Savings Plan") which qualifies as a thrift plan under Section 401(k) of the Internal Revenue Code. All full-time U.S. employees are eligible to participate in the Savings Plan after 90 days from the date of hire. In 20052006 we amended the savings plan to allow all full-time participants (as defined) to contribute up to 10% of their earnings to the Savings Plan with a discretionary matching amount provided by us. Our contributions to the Savings Plan were $289,000, $177,000,$0.4 million, $0.4 million, and $191,000$0.3 million for the years ended December 31, 2005, 20042007, 2006 and 2003,2005, respectively.
Note 12. Guarantees
Indemnification Agreements
We enter into standard indemnification arrangements in the ordinary course of business. Pursuant to these arrangements, we indemnify, hold harmless, and agree to reimburse the indemnified parties for losses suffered or incurred by the indemnified party, generally their business partners or customers, in connection with any U.S. patent, or any copyright or other intellectual property infringement claim by any third party with respect to our products. The term of these indemnification agreements is generally perpetual anytime after the execution of the agreement. The maximum potential amount of future payments we could be required to make under these agreements is unlimited. We have never incurred costs to defend lawsuits or settle claims related to these indemnification agreements. As a result, we believe the estimated fair value of these agreements is minimal.
We have entered into indemnification agreements with our directors and officers that may require us to indemnify our directors and officers against liabilities that may arise by reason of their status or service as directors or officers, other than liabilities arising from wilful misconduct of a culpable nature; to advance their expenses incurred as a result of any proceeding against them as to which they could be indemnified; and to obtain directors’directors' and officers’officers' insurance if available on reasonable terms, which we currently have in place.
Product Warranty
We warrant our products for a specific period of time, generally twelve months, against material defects. We provide for the estimated future costs of warranty obligations in cost of sales when the
related revenue is recognized. The accrued warranty costs represents the best estimate at the time of sale of the total costs that we expect to incur to repair or replace product parts, which fail while still under warranty. The amount of accrued estimated warranty costs are primarily based on historical experience as to product failures as well as current information on repair costs. On a quarterly basis, we review the accrued balances and updatesupdate the historical warranty cost trends. The following table reflects the change in our warranty accrual during 20052007 and 20042006 (in thousands):
|
| Years Ended |
| Years Ended December 31, | ||||||||||
|---|---|---|---|---|---|---|---|---|---|---|---|---|---|---|
|
| 2005 |
| 2004 |
| 2007 | 2006 | |||||||
Beginning accrued warranty and related costs |
| $ | 135 |
| $ | 135 |
| $ | 459 | $ | 120 | |||
Charged to cost of revenue |
| 54 |
| — |
| 792 | 668 | |||||||
Actual warranty expenditures |
| (69 | ) | — |
| (221 | ) | (329 | ) | |||||
Ending accrued warranty and related costs |
| $ | 120 |
| $ | 135 |
| $ | 1,030 | $ | 459 | |||
Sales Returns
In March 2004, we increased our reserve for repair and replacement costs by $745,000. Approximately $487,000 of the $745,000 sales returns reserve has been utilized and approximately $205,000 has been reversed to revenue as of December 31, 2005 as we favorably resolved an outstanding matter with a customer. We will continue to monitor the returns for this specific reserve.
77