Use these links to rapidly review the document
TABLE OF CONTENTS
Table of Contents
UNITED STATES
SECURITIES AND EXCHANGE COMMISSION
Washington, D.C. 20549
FORM 10-K
| | |
| (Mark One) | | |
þ |
|
ANNUAL REPORT PURSUANT TO SECTION 13 OR 15(d) OF THE SECURITIES EXCHANGE ACT OF 1934 |
For the fiscal year ended June 30, 2009 |
OR |
o |
|
TRANSITION REPORT PURSUANT TO SECTION 13 OR 15(d) OF THE SECURITIES EXCHANGE ACT OF 1934 |
For the transition period from to
|
ANNUAL REPORT PURSUANT TO SECTIONS 13 OR 15(d)
OF THE SECURITIES EXCHANGE ACT OF 1934
þ ANNUAL REPORT PURSUANT TO SECTION 13 OR 15(d) OF THE SECURITIES EXCHANGE ACT OF 1934
For the fiscal year ended June 30, 2006
OR
o TRANSITION REPORT PERSUANT TO SECTION 13 OR 15(d) OF THE SECURITIES EXCHANGE ACT OF 1934
For the transition period from to
Commission file number: 0-1375
FARMER BROS. CO.
(Exact Name of Registrant as Specified in Its Charter)
Delaware
| | 95-0725980
|
Delaware
(State of Incorporation) | | 95-0725980
(I.R.S. Employer Identification No.) |
20333 South Normandie Avenue, Torrance, California 90502
(Address of Principal Executive Offices; Zip Code) |
Registrant's telephone number, including area code310-787-5200 |
20333 South Normandie Avenue, Torrance, California, 90502
(Address of Principal Executive Offices; Zip Code)
Registrants’s telephone number, including area code 310-787-5200
Securities registered pursuant to Section 12(g) of thethe Act:
| | |
| Title of Each Class |
|
| | Name of Each Exchange on Which Registered
|
|---|
Common stock,Stock, $1.00 par value |
| NASDAQ |
Indicate by check mark if the registrant is a well-known seasoned issuer, as defined in Rule 405 of the Securities Act. YES þ NO o
Indicate by check mark if the registrant is not required to file reports pursuant to Section 13 or Section 15(d) of the Act. YES o NO þ
Indicate by check mark whether the registrant: (1) has filed all reports required to be filed by Section 13 or 15(d) of the Securities Exchange Act of 1934 during the preceding 12 months (or for such shorter period that the registrant was required to file such reports), and (2) has been subject to such filing requirements for the past 90 days. YES þ NO o
Indicate by check mark whether the registrant has submitted electronically and posted on its corporate Web site, if any, every Interactive Data File required to be submitted and posted pursuant to Rule 405 of Regulation S-T (§232.405 of this chapter) during the preceding 12 months (or for such shorter period that the registrant was required to submit and post such files). YES o NO o
Indicate by check mark if disclosure of delinquent filers pursuant to Item 405 of Regulation S-K (§229.405) is not contained herein, and will not be contained, to the best of registrant’sregistrant's knowledge, in definitive proxy or information statements incorporated by reference in Part III of this Form 10-K or any amendment to this Form 10-K. þo
Indicate by check mark whether the registrant is a large accelerated filer, an accelerated filer, a non-accelerated filer or a non-accelerated filer. Large Accelerated Filer o Accelerated Filer þ Non-Accelerated Filer osmaller reporting company.
| | | | | | |
| Large accelerated filer o | | Accelerated filer þ | | Non-accelerated filer o | | Smaller reporting company o |
Indicate by check mark whether the registrant is a shell company (as defined in Rule 12b-2 of the Exchange Act). YES o NO þ
The aggregate market value of the voting and non-voting common equity held by non-affiliates computed by reference to the closing price at which the Farmer Bros. Co. common stock was sold on June 30, 2006December 31, 2008 was approximately $146$167 million.
On September 1, 2006 the registrant had 16,075,080 shares outstanding of its common stock, par value $1.00 per share, which is the registrant’s only class of common stock.
DOCUMENTS INCORPORATED BY REFERENCE
The following documents are incorporated by reference into Part III of this Form 10-K: certain portions of the definitive proxy statement for the fiscal year ended June 30, 20062009 that is expected to be filed with the U.S. Securities and Exchange Commission on or before October 28, 2006.2009.
On September 3, 2009 the registrant had 16,126,580 shares outstanding of its common stock, par value $1.00 per share, which is the registrant's only class of common stock.
Table of Contents
Table of Contents
PART I
Item 1. Business
GeneralOverview
Farmer Bros. Co. (the “Company,” “we,” “our”, a Delaware corporation (including its consolidated subsidiaries unless the context otherwise requires, the "Company," "we," "our" or “Farmer"Farmer Bros.”") is a manufacturer, wholesaler and distributor of coffee and spicesnon-coffee ("allied") products to the institutional food service segment. The Company wasWe were incorporated in California in 1923, and reincorporated in Delaware in 2004. We operate in one business segment and are in the business of roasting, packaging, and distributing coffee and allied products through direct and brokered sales to our customers throughout the contiguous United States.
Business Strategy
On April 27, 2007, to enhance our product offerings to include specialty coffee products, we completed the acquisition of Coffee Bean Holding Co., Inc., a Delaware corporation ("CBH"), the parent company of Coffee Bean International, Inc., an Oregon corporation ("CBI"), a specialty coffee manufacturer and wholesaler headquartered in Portland, Oregon (the "CBI Acquisition"). To expand our national presence and improve our channel penetration, on February 28, 2009, we completed the acquisition from Sara Lee Corporation, a Maryland corporation ("Sara Lee"), and Saramar, L.L.C., a Delaware limited liability company ("Saramar" and collectively with Sara Lee, "Seller Parties") of certain assets used in connection with Seller Parties' direct store delivery coffee business in the United States (the "DSD Coffee Business"). The acquired business also includes the distribution, sale and service of brewed and liquid coffee equipment as well as the right to distribute sauces and dressings to customers of the DSD Coffee Business.
Our mission is to "sell great coffee and allied products and provide superior service one customer at a time." In fiscal 2009, the acquisition of the DSD Coffee Business furthered our efforts to achieve this mission. As a primary result of this acquisition, our sales grew to $341.7 million in fiscal 2009 from $266.5 million in fiscal 2008, and we acquired over 2,000 new SKU's and over 60 trademarks, tradenames and service marks including the major regional brands MCGARVEY®, CAIN'S®, IRELAND®, JUSTIN LLOYD®, METROPOLITAN®, PREBICA®, WECHSLER®, WORLD'S FINEST® and CAFÉ ROYAL®, and the national brand SUPERIOR®, broadened and diversified our customer base to include a major presence in the gaming industry as well as significant national chain accounts, and expanded geographically from our previous 28 state marketing area into all 48 contiguous states. During fiscal 2010 we plan to complete the post-acquisition integration of the DSD Coffee Business in an effort to realize the selling and operating efficiencies of the combined organization through consolidation of product offerings and SKU's, streamlining of routes and distribution logistics, and consolidation of warehouses and distribution centers, with an expanded, customer-focused organization enabled by enhanced information management tools and training.
Business Operations
Our product line is specifically focused on the needs of our market segment: restaurants and other institutional food service establishments that prepareincluding restaurants, hotels, casinos, hospitals and market meals, including hotels, hospitals,food service providers, as well as retailers such as convenience stores, coffee houses, general merchandisers, private-label retailers and fast food outlets.grocery stores. Our product line includes roasted coffee, liquid coffee, coffee related products such as coffee filters, sugar and creamers, assorted teas, cappuccino, cocoa, spices, gelatins and puddings, soup, gravy and beverage bases.sauce mixes, pancake and biscuit mixes, and jellies and preserves. Our product line presently includes over 300400 items. For the past three fiscal years sales of roasted coffee products represented approximately 50% of our total sales and no single product other than roasted coffee accounted for more than 10% of our revenue.total sales. Coffee purchasing, roasting and packaging takes place at our
Table of Contents
Torrance, Portland and Houston plants. Spice blending and packaging takes place at our Torrance, California plant, which also servesand Oklahoma City, Oklahoma plants. Our distribution centers include our Torrance, Houston and Portland plants, as thewell as new distribution hub for our branches.centers in Fridley, Minnesota, Bensenville, Illinois and Moonachie, New Jersey.
Raw Materials and Supplies
Our primary raw material is green coffee, an agricultural commodity. Green coffee is mainly grown outside the United States and can be subject to volatile price fluctuations. Weather, real or perceived shortages, political unrest, labor actions, andcurrency fluctuations, armed conflict in coffee producing nations, and government actions, including treaties and trade controls between the U.S. and coffee producing nations, can affect the price of green coffee. Green specialty coffees sell at a premium to other green coffees due to the inability of producers to increase supply in the short run to meet rising demand. As a result, the price spread between specialty coffee and non-specialty coffee is likely to widen as demand continues to increase.
Green coffee prices can also be affected by the actions of producer organizations. The most prominent of these are the Colombian Coffee Federation, Inc. (CCF), the Association of Coffee Producing Countries (ACPC) and the International Coffee Organization (ICO). These organizations seek to increase green coffee prices largely by attempting to restrict supplies, thereby limiting the availability of green coffee to coffee consuming nations.
Other raw materials used in the manufacture of our non-coffeeallied products (“allied products”) include a wide variety of spices, such as pepper, chilies, oregano and thyme, as well as cocoa, dehydrated milk products, salt and sugar. These raw materials are agricultural products and can be subject to wide cost fluctuations. Such fluctuations, however, historically have not had a material effect on our operating results.
Trademarks and Licenses
We own 62132 registered U.S. trademarks which are integral to customer identification of our products. It is not possible to assess the impact of the loss of such identification. The Company and Sara Lee have entered into certain operational agreements that include trademark and formula license agreements.
Seasonality
We experience some seasonal influences. The winter months are generally the best sales months. However, our product line and geographic diversity provide some sales stability during the warmer months when coffee consumption ordinarily decreases. Additionally, we usually experience an increase in sales during the summer months from seasonal businesses located in vacation areas.
Distribution
Sales Most sales are made “off-truck”"off-truck" to our institutional food service customers at their places of business by our sales representatives who are responsible for soliciting, selling and collecting from and otherwise
maintaining our customer accounts. We serve our customers from six distribution centers strategically located for national coverage. Our distribution trucks are replenished from 179 branch warehouses located in a number of cities inthroughout the westerncontiguous United States. We operate our own long haul trucking fleet in an effort to more effectively control the supplysupport our long-haul distribution requirements. A portion of our products to these warehouses. Inventoryare distributed by third parties or are direct shipped via common carrier. We maintain inventory levels are maintained at each branch warehouse consisting of our complete product line and additional safety stocks to accommodate a modestallow for minimal interruption in supply.
Customers
We serve a wide variety of customers, from small restaurants and donut shops to large institutional buyers like restaurant chains, hotels, casinos, hospitals, food service providers and convenience stores.
Table of Contents
As a result of the CBI Acquisition we added additional customer categories including gourmet coffee houses, private-label retailers, national mass market merchandisers and other national accounts, and grocery stores. We believe customer contact, our distribution network and our service quality, are integral to our sales effort. No single customer represents a significant concentration of sales. As a result, the loss of one or more of our larger customer accounts is not likely to have a material adverse effect on our results of operations. We serve a wide variety of customers, from small restaurants and donut shops to large institutional buyers like restaurant chains, hospitals, hotels, contract food services and convalescent hospitals. Customer contact, our distribution network and our service quality, are integral to our sales effort.
Competition
Competition
We face competition from many sources, including the institutional food service divisions of multi-national manufacturers of retail products such as Procter & GambleThe J.M. Smucker Company (Folgers Coffee), Kraft Foods Inc. (Maxwell House Coffee) and Sara Lee Foods (Superior Coffee),Corporation, wholesale grocery distributors such as Sysco Corporation and U.S. Food Service, and regional institutional coffee roasters such as S & D Coffee, Inc. and Boyd Coffee Company. Management believes we may have some competitive advantages due toCompany, and specialty coffee suppliers such as Green Mountain Coffee Roasters, Inc. and Peet's Coffee & Tea, Inc. We believe our longevity, strong regional roots and our sales and service force. We differentiate ourselves from our competitors by the quality of our products, our national distribution network and our superior customer service. Someservice operations are the major factors that differentiate us from our competitors.
Competition is robust and is primarily based on products and price, with distribution often a major factor. Most of our competitors outsource their productcustomers rely on us for distribution, while othershowever some of our customers use third party distribution or conduct their own distribution. Some of our customers are “price”"price" buyers, seeking the low cost provider with little concern about service;service, while others find great value in the service programs we provide. We compete well when service and distribution are valued by our customers, and are less effective when only price matters. Our customer base is price sensitive, and we are often faced with price competition.
Working Capital
We finance our operations internally and wethrough borrowings under our $50 million senior secured revolving credit facility with Wachovia Bank, National Association. We believe thatthis credit facility, in addition to our other liquid assets, provides sufficient capital resources and flexibility for the next twelve months to allow us to make investments in the DSD Coffee Business, fund integration expenses, meet necessary working capital requirements and implement our business plan without relying solely on cash flow from internal sources will be adequate for the coming fiscal year.operations.
Foreign Operations
We have no material revenues from foreign operations.
Other
On June 30, 20062009 we employed 1,0912,218 employees, 441691 of whom are subject to collective bargaining agreements. Compliance with government regulations relating to the discharge of materials into the environment has not had a material effect on our financial condition or results of operations. The nature of our business does not provide for maintenance of or reliance upon a sales backlog. No portionNone of our business may beis subject to renegotiation of profits or termination of contracts or subcontracts at the election of the Government.government.
Available Information
We file reports electronically with the U.S. Securities and Exchange Commission (“SEC”), including Forms 10-K, 10-Q, 8-K and amendments thereto. The public may read and copy any materials filed with the SEC at the SEC’s Public Reading Room at 450 Fifth Street, NW, Washington, DC 20549. The public may obtain information on the operation of the Public Reference Room by calling the SEC
at 1-800-SEC-0330. The SEC maintains an Internet site that contains reports, proxy and information statements, and other information regarding issuers that file electronically with the SEC. The site address is http://www.sec.gov.
Our Internet website address is http://www.farmerbroscousa.comwww.farmerbros.com (the website address is not intended to function as a hyperlink, and the information contained in our website is not intended to be part of this filing), where we make available, free of charge, copies of our annual report on Form 10-K, quarterly reports on Form 10-Q and current reports on Form 8-K including amendments thereto as soon as
Table of Contents
reasonably practicable after filing such material electronically or otherwise furnishing it to the SEC. The Company’s Code of Ethics for its principal executiveSecurities and principal financial officers is also posted on our Internet website.Exchange Commission ("SEC").
Item 1A. Risk Factors
Certain statements contained in this Annual Reportannual report on Form 10-K regarding the risks, circumstances and financial trends that may affect our future operating results, financial position and cash flows may beare not based on historical fact and are forward-looking statements within the meaning of federal securities laws.laws and regulations. These statements are based on management’smanagement's current expectations, assumptions, estimates and observations about our businessof future events and are subjectinclude any statements that do not directly relate to risks and uncertainties. As a result, actual results could materially differ from the forward-looking statements contained herein.any historical or current fact. These forward-looking statements can be identified by the use of words like “expects,” “plans,” “believes,” “intends,” “will,” “assumes”"anticipates," "feels," "estimates," "projects," "expects," "plans," "believes," "intends," "will," "assumes" and other words of similar meaning. These and other similar words can be identified byOwing to the fact that they do not relate solely to historical or current facts. While we believe our assumptions are reasonable, we caution that it is impossible to predict the impact of such factors which could causeuncertainties inherent in forward-looking statements, actual results tocould differ materially from predicted results.those set forth in forward-looking statements. We intend these forward-looking statements to speak only at the time of this report and do not undertake to update or revise these statements as more information becomes available. For these statements, we claimavailable except as required under federal securities laws and the protectionrules and regulations of the safe harbor forSEC. Factors that could cause actual results to differ materially from those in forward-looking statements provided byinclude, but are not limited to, fluctuations in availability and cost of green coffee, competition, organizational changes, our ability to successfully integrate the Private Securities Litigation Reform ActCBI and DSD Coffee Business acquisitions, the impact of 1995.
The Company’sa weaker economy, business its future performance and forward-looking statements are affected by generalconditions in the coffee industry and market conditionsfood industry in general, our continued success in attracting new customers, variances from budgeted sales mix and growth rates, general U.S.weather and non-U.S. economic and political conditions (includingspecial or unusual events, changes in the global economy), competition, interest rate and currency exchange rate fluctuations,quality or dividend stream of third parties' securities and other events. The following items are representativeinvestment vehicles in which we have invested our assets, as well as other risks described in this report and other factors described from time to time in our filings with the SEC.
You should consider each of the risks, uncertainties andfollowing factors as well as the other conditions that may impact the Company’s business, future performance and the forward-looking statements that it makesinformation in this Annual Reportannual report in evaluating our business and our prospects. The risks and uncertainties described below are not the only ones we face. Additional risks and uncertainties not presently known to us or that we currently consider immaterial may also negatively affect our business operations. If any of the following risks actually occurs, our business and financial results could be harmed. In that case, the trading price of our common stock could decline. You should also refer to the other information set forth in this annual report on Form 10-K, including our financial statements and the related notes.
WE MAY NOT BE ABLE TO SUCCESSFULLY INTEGRATE THE DSD COFFEE BUSINESS INTO OUR EXISTING BUSINESS, WHICH MAY PREVENT US FROM REALIZING THE EXPECTED SYNERGIES AND OTHER BENEFITS OF THE ACQUISITION, WHICH COULD ADVERSELY AFFECT OUR FUTURE RESULTS.
The integration of the DSD Coffee Business into our business is a complex, costly and time-consuming process which presents significant challenges and risks to our business, including:
- •
- distraction of management from ongoing business concerns;
- •
- assimilation and retention of employees and customers of the DSD Coffee Business;
- •
- differences in the culture of the DSD Coffee Business and the Company's culture;
- •
- unforeseen difficulties in integrating the DSD Coffee Business, including information systems and accounting controls;
- •
- failure of the DSD Coffee Business to continue to generate income at the levels upon which we based our acquisition decision;
Table of Contents
- •
- managing the DSD Coffee Business operations through offices in Downers Grove, Illinois, which is distant from the Company's headquarters in Torrance, California;
- •
- expansion into new geographical markets in which we have limited or
thatno experience;
- •
- integration of technologies, services and products; and
- •
- achievement of appropriate internal control over financial reporting.
We may fail to successfully complete the integration of the DSD Coffee Business into our business and, as a result, may fail to realize the operating efficiencies, synergies, economies of scale, cost savings and other benefits expected from the acquisition. We may fail to grow and build profits in the DSD Coffee Business or achieve sufficient cost savings through the integration of customers or administrative and other operational activities. Furthermore, we must achieve these objectives without adversely affecting our revenues. If we are not able to successfully achieve these objectives, the anticipated benefits of the acquisition may not be realized fully or at all, or it may maketake longer to realize them than expected, and our results of operations could be adversely affected.
WE ARE RELYING ON SARA LEE TO PROVIDE US WITH CERTAIN TRANSITION SERVICES THAT ARE CRITICAL TO THE ONGOING OPERATION OF THE DSD COFFEE BUSINESS.
We continue to rely on Sara Lee to provide us with certain services previously provided by Sara Lee to the DSD Coffee Business for a transition period of up to eighteen (18) months through August 2010 depending on the specific service. These services include maintaining the IT infrastructure and communications services, including network hosting, monitoring and reporting. Sara Lee provides the support for the software and processes that record and maintain sales transactions, create accounts receivable and bills customers, maintain accounts payable and pays vendors, provide inventory control and generally provide for most critical business accounting needs. These transition services are critical to the ongoing operation of the DSD Coffee Business during the transition period. If Sara Lee fails or is unable to continue to provide such services to us, we may be unable to service customers of the DSD Coffee Business which may harm our reputation and adversely affect the business, financial condition and results of operations of the DSD Coffee Business. Our dependency on Sara Lee for IT services during the transition period may increase the risk of material internal control deficiencies and the related probability of a restatement of our operating results as a result of untraced accounting errors within the Sara Lee maintained software and/or Sara Lee's inability to effectively maintain both internal control and data integrity.
UPON EXPIRATION OF THE TRANSITION PERIOD, WE MAY BE UNABLE TO PROVIDE THE TRANSITION SERVICES OURSELVES OR OBTAIN SUCH SERVICES FROM A THIRD-PARTY ON COMMERCIALLY REASONABLE TERMS.
After the dates on which Sara Lee is no longer required to provide transition services to us, we expect that such services will be provided by our internal operations and/or third-party service providers. These services include integrating the IT infrastructure of several hardware and software systems. A failure to identify all of the components of IT infrastructure and personnel necessary to transition successfully from Sara Lee may adversely impact our ability to operate the DSD Coffee Business following the transition period. There can be no assurance that we will be able to develop the ability to provide these services ourselves on a cost efficient basis or obtain such services from a third-party on commercially reasonable terms.
Table of Contents
WE RELY ON INFORMATION TECHNOLOGY AND ARE DEPENDENT ON ENTERPRISE RESOURCE PLANNING SOFTWARE IN OUR OPERATIONS. ANY MATERIAL FAILURE, INADEQUACY, INTERRUPTION OR SECURITY FAILURE OF THAT TECHNOLOGY COULD AFFECT OUR ABILITY TO EFFECTIVELY OPERATE OUR BUSINESS.
We rely on information technology systems across our operations, including management of our supply chain, point-of-sale processing, and various other processes and transactions. Our ability to effectively manage our business and coordinate the production, distribution and sale of our products depends significantly on the reliability and capacity of these systems. The failure of these systems to operate effectively, problems with transitioning to upgraded or replacement systems, our inability to integrate the DSD Coffee Business systems with ours, or a breach in security of these systems could result in delays in processing replenishment orders from our branches, our inability to record product sales and reduced operational efficiency. Significant capital investments could be required to remediate any potential problems.
We rely on WTS, a company affiliated with Oracle, and its employees, in connection with the hosting of our integrated management information system. This system is essential to our operations and currently includes all accounting and production software applications. WTS also hosts our route sales application software. If WTS were to experience financial, operational or quality assurance difficulties, or if there were any other disruption in our relationship with WTS, we might be unable to produce financial statements, fill replenishment orders for our branch warehouses, issue payroll checks, process payments to our vendors or bill customers. Any of these items could have a material adverse effect on the Company.
IMPAIRMENT CHARGES RELATED TO OUR GOODWILL OR LONG-LIVED ASSETS COULD ADVERSELY AFFECT OUR FUTURE OPERATING RESULTS.
We perform an analysis on our goodwill balances to test for impairment on an annual basis or whenever events occur that may indicate impairment possibly exists. Goodwill is deemed to be impaired if the net book value of a reporting unit exceeds the estimated fair value. The impairment of a long-lived intangible asset other than goodwill is only deemed to have occurred if the sum of the forecasted undiscounted future cash flows related to the asset are less than the carrying value of the intangible asset we are testing for impairment. If the forecasted cash flows are less than the carrying value, then we must write down the carrying value to its estimated fair value.
For the purposes of this analysis, our estimates of fair value were based on a combination of the income approach, which estimates the fair value of our reporting units based on the future discounted cash flows, and the market approach, which estimates the fair value of our reporting units based on comparable market prices. Our estimates of future cash flows included estimated growth rates and assumptions about the extent and duration of the current economic downturn and operating results of our subsidiary, CBI.
As of June 30, 2009, we had a goodwill balance of $5,310,000. Goodwill impairment analysis and measurement is a process that requires significant judgment and the use of significant estimates related to valuation such as discount rates, long term growth rates and the level and timing of future cash flows. As a result, several factors could result in impairment of a material amount of our $5,310,000 goodwill balance in future periods, including, but not limited to:
- •
- A decline in our stock price and resulting market capitalization, if we determine that the decline is sustained and is indicative of a reduction in the
future. Our actualfair value of any of our reporting units below its carrying value.
Table of Contents
- •
- Further weakening of the economy or the failure of CBI to reach our internal forecasts could impact our ability to achieve our forecasted levels of cash flows and reduce the estimated discounted cash flow value of our reporting units.
It is not possible at this time to determine if any such future impairment charge would result from these factors, or, if it does, whether such charge would be material. We will continue to review our goodwill and other intangible assets for possible impairment. We cannot be certain that a future downturn in CBI's business, changes in market conditions or a longer-term decline in the quoted market price of our stock will not result in an impairment of goodwill and the recognition of resulting expenses in future periods, which could adversely affect our results could differ materially from anticipatedof operations for those periods.
We also test our other long-lived assets for impairment whenever events or changes in circumstances indicate that their carrying amount may be impaired. Failure to achieve our forecasted operating results, due to somefurther weakness in the economic environment or allother factors, could result in impairment of the factors discussed below.a significant amount of our long-lived intangible or tangible assets. As of June 30, 2009, we had $35,921,000 of long-lived intangible assets.
OUR EFFORTS TO SECURE AN ADEQUATE SUPPLY OF QUALITY COFFEES MAY BE UNSUCCESSFUL AND EXPOSE US TO COMMODITY PRICE RISK.
Maintaining a steady supply of green coffee is essential to keep inventory levels low and secure sufficient stock to meet customer needs. To help ensure future supplies, we may purchase our coffee on forward contracts for delivery as long as six months in the future. In the event of non-performanceNon-performance by the suppliers the Company could be exposedexpose us to credit and supply risk. EnteringAdditionally, entering into such future commitments also leaves the Company subjectexposes us to purchase price risk. Various techniquesBecause we are usednot always able to hedge these purchases against untowardpass price movement. Competitive factors make it difficult for the Companychanges through to “pass through” such price fluctuationour customers due to its customers. Therefore,competitive pressures, unpredictable price changes can have an immediate effect on operating results that cannot be corrected in the short run. To reduce itsour potential price risk exposure to the volatile fluctuation of green coffee costs, Farmer Bros. has,we have, from time to time, entered into futures contracts to hedge coffee purchase commitments. Open contracts associated with these hedging activities are described in Item 7A. “Quantitative"Quantitative and Qualitative Disclosures About Market Risk.”"
INCREASES IN THE COST OF GREEN COFFEE COULD REDUCE OUR GROSS MARGIN AND PROFIT.
Our primary raw material is green coffee, an agricultural commodity. Green coffee is mainly grown outside the U.S.United States and can be subject to volatile price fluctuations. Weather, real or perceived shortages, political unrest, labor actions, political unrest andcurrency fluctuations, armed conflict in coffee producing nations, and government actions, including treaties and trade controls between the U.S. and coffee producing nations, can affect the price of green coffee. Green specialty coffees sell at a premium to other green coffees due to the inability of producers to increase supply in the short run to meet rising demand. As a result, the price spread between specialty coffee and non-specialty coffee is likely to widen as demand continues to increase.
Green coffee prices can also be affected by the actions of producer organizations. The most prominent of these are the Colombian Coffee Federation, Inc. (CCF), and the International Coffee Organization (ICO) and the Association of Coffee Producing Countries (ACPC). These organizations seek to increase green coffee prices largely beby attempting to restrict supplies, thereby limiting the availability of green coffee to coffee consuming nations. As a result these organizations or others may succeed in raising green coffee prices.
In the past, we generally have been able to pass on increases in green coffee costs to our customers. However, there can be no assurance that we will be successful in passing such fluctuations on to our customers without losses in sales volume or gross margin in the future. Similarly, rapid, sharp decreases in the cost of green coffee could also force us to lower sales prices before realizing cost reductions in our green coffee inventory.
Table of Contents
OUR INDUSTRY IS HIGHLY COMPETITIVE AND WE MAY NOT HAVE THE RESOURCES TO COMPETE EFFECTIVELY.
We primarily compete with other coffee companies, including multi-national firms with substantially greater financial, marketing and operating resources than the Company. We face competition from many sources including the food service divisions of multi-national manufacturers of retail products such as Proctor and Gamble (Folgers Coffee), Kraft Foods (Maxwell House Coffee) and Sara Lee Foods (Superior Coffee), wholesale grocery distributors such as Sysco and U.S. Food Service, and regional coffee roasters such as Boyd Coffee Company. Some of our competitors outsource their product distribution, while others conduct their own distribution. Large roasters have volumes far in excess of ours, with a business model that is substantially different from ours. We compete with those firms and others for a wide variety of customers, from small restaurants and donut shops, to large institutional buyers like restaurant chains, hospitals, hotels, contract food services and convalescent hospitals. If we do not succeed in differentiating ourselves from our competitors or our competitors adopt our strategies, then our competitive position may be weakened. At Farmer Bros. we differentiate ourselves from our competitors by the quality of our products, our distribution network and our customer service. Some of our customers are “price” buyers, seeking the low cost provider with little concern about service; others find great value in the service programs we provide. We compete well when service and distribution are valued by our customers, and are less effective when only price matters. Our customer base is price sensitive and we are often faced with price competition.
CHANGES IN CONSUMER PREFERENCESLEVEL OF INDEBTEDNESS COULD ADVERSELY AFFECT OUR BUSINESS.ABILITY TO RAISE ADDITIONAL CAPITAL TO FUND OUR OPERATIONS, AND LIMIT OUR ABILITY TO REACT TO CHANGES IN THE ECONOMY OR OUR INDUSTRY.
Our continued success depends, in part, upon the demand for coffee. Shifts in consumer preferences away from We have a “standard” cup$50 million senior secured revolving credit facility. As of coffeeSeptember 3, 2009, approximately $9 million was outstanding under this credit facility. Maintaining a large loan balance under our credit facility could adversely affect our profitability.business and limit our ability to plan for or respond to changes in our business. Additionally, our borrowings under the credit facility are at variable rates of interest, exposing us to the risk of interest rate volatility, which could lead to a decrease in our net income. Our primary market is restaurantsdebt obligations could also:
- •
- increase our vulnerability to general adverse economic and industry conditions;
- •
- require us to dedicate a portion of our cash flow from operations to payments on our indebtedness, thereby reducing the availability of our cash flow for other purposes, including the payment of dividends, funding daily operations, investing in future business opportunities and capital expenditures;
- •
- limit our flexibility in planning for, or reacting to, changes in our business and the industry in which we operate thereby placing us at a competitive disadvantage compared to our competitors that may have less debt or debt with less restrictive debt covenants;
- •
- limit, by the financial and other
food service establishments. We also provide coffeerestrictive covenants in our loan agreement, our ability to borrow additional funds; and related products
- •
- have a material adverse effect on us if we fail to
offices. We believecomply with the successcovenants in our loan agreement because such failure could result in an event of default which, if not cured or waived, could result in our indebtedness becoming immediately due and payable.
RESTRICTIVE COVENANTS IN OUR CREDIT FACILITY MAY RESTRICT OUR ABILITY TO PURSUE OUR BUSINESS STRATEGIES.
Our senior secured revolving credit facility contains various covenants that limit our ability and/or our subsidiaries' ability to, among other things:
- •
- incur additional indebtedness;
- •
- pay dividends on or make distributions in respect of capital stock or make certain other restricted payments or investments;
- •
- sell assets;
- •
- create liens on certain assets to secure debt; and
- •
- consolidate, merge, sell or otherwise dispose of all or substantially all of our
market segment is dependent upon personalassets.
Our credit facility also contains restrictive covenants that require the Company and business expendituresits subsidiaries to satisfy financial condition tests. Our ability to meet those tests may be affected by events beyond our control, and there can be no assurance that we will meet those tests. The breach of any of these covenants or our failure to meet the financial condition tests could result in restaurantsa default under the credit facility, and other food service businesses. There are many beverages, hotthe lender could elect to declare all amounts borrowed thereunder, together with accrued interest, to be due and cold, competing forpayable and could proceed against the same restaurant dollar.collateral securing that indebtedness.
OUR BUSINESS IS SUBJECT TO RISKS ASSOCIATED WITH THE CURRENT ECONOMIC CLIMATE.
Our restaurant customers report that competition from such beverages continuesrevenues and performance depend significantly on consumer confidence and spending, which have deteriorated due to dilute the demand for coffee. Consumers who choose soft drinks, bottled water,current economic conditions. This economic downturn and flavored coffees and teas are all reducing the restaurant dollar formerly spent on a “standard” cup of coffee. While restaurants and coffee houses that sell “specialty” coffee and flavored coffee products may have increaseddecrease in
the demand for coffee beverages,Table of Contents
consumer spending may continue to adversely impact our revenues, and may affect our ability to market our products or otherwise implement our business strategy. Additionally, many of these establishments have taken market share from existing Farmer Bros. customers. Wethe effects and consequences of the global financial crisis and a broader global economic downturn are currently unknown; any one or all of them could potentially have a line of products that compares favorably with products soldmaterial adverse effect on our liquidity and capital resources, including our ability to sell third-party securities in such “specialty coffee” stores, but mostwhich we have invested some of our restaurant customers do not specializeshort-term assets or raise additional capital, if needed, or the ability of our lender to honor draws on our credit facility, or otherwise negatively impact our business and financial results.
VOLATILITY IN THE EQUITY MARKETS OR INTEREST RATE FLUCTUATIONS COULD SUBSTANTIALLY INCREASE OUR PENSION COSTS AND NEGATIVELY IMPACT OUR OPERATING RESULTS.
At the end of fiscal 2009, the projected benefit obligation of our defined benefit pension plans was $100.1 million and assets were $61.7 million. The difference between plan obligations and assets, or the funded status of the plans, significantly affects the net periodic benefit costs of our pension plans and the ongoing funding requirements of those plans. Among other factors, changes in coffee drinks. As a result, a further shift toward “specialty” coffee housesinterest rates, mortality rates, early retirement rates, investment returns and the market value of plan assets can affect the level of plan funding, cause volatility in the net periodic pension costs, and increase our future funding requirements. We expect to make approximately $4.8 million in contributions to our pension plans in fiscal 2010 and record an accrued expense of approximately $7 million per year beginning in fiscal 2010. These payments are expected to continue at this level for several years, and the current economic environment increases the risk that we may adversely impactbe required to make even larger contributions in the demand for the Company’s products.future.
REDUCTIONS IN CONSUMER DISCRETIONARY SPENDING COULD ADVERSELY AFFECT OUR BUSINESS.
Our success depends to a significant extent on a number of factors that affect discretionary consumer spending, including economic conditions, disposable consumer income and consumer confidence. In a slow economy, businesses and individuals scale back their discretionary spending on travel and entertainment, including “dining out.”"dining out" as well as the purchase of high-end consumables like specialty coffee. Economic conditions may also cause businesses to reduce travel and entertainment expenses, and may even cause office coffee benefits to be eliminated. These factors could reduce demand for our products or impose practical limits on pricing, either of which could adversely affect our business, financial condition, operating results and cash flows.
CHANGES IN CONSUMER PREFERENCES COULD ADVERSELY AFFECT OUR BUSINESS.
Our continued success depends, in part, upon the demand for coffee. We believe that competition from other beverages continues to dilute the demand for coffee. Consumers who choose soft drinks, juices, bottled water, teas and other beverages all reduce spending on coffee. Consumer trends away from coffee could negatively impact our business.
OUR INDUSTRY IS HIGHLY COMPETITIVE AND WE MAY NOT HAVE THE RESOURCES TO COMPETE EFFECTIVELY.
We primarily compete with other coffee companies, including multi-national firms with substantially greater financial, marketing and operating resources than the Company. We face competition from many sources including the food service divisions of multi-national manufacturers of retail products such as The J.M. Smucker Company (Folgers Coffee), Kraft Foods Inc. (Maxwell House Coffee) and Sara Lee Corporation, wholesale grocery distributors such as Sysco Corporation and U.S. Food Service, regional coffee roasters such as S & D Coffee, Inc. and Boyd Coffee Company and specialty coffee suppliers such as Green Mountain Coffee Roasters, Inc. and Peet's Coffee & Tea, Inc.
Table of Contents
If we do not succeed in differentiating ourselves from our competitors or our competitors adopt our strategies, then our competitive position may be weakened.
OUR SALES AND DISTRIBUTION NETWORK IS COSTLY TO MAINTAIN.
Our sales and distribution network requires a large investment to maintain and operate. Costs include the fluctuating cost of gasoline, diesel and oil, the costs associated with managing, purchasing, leasing, maintaining and insuring a fleet of delivery vehicles, the costscost of maintaining distribution centers and branch warehouses throughout the country, and the costscost of hiring, training and managing our route sales professionals. Many of these costs are beyond our control, and others are fixed rather than variable. Some competitors use alternate methods of distribution that eliminate somemany of the costs associated with our method of distribution.
WE ARE SELF-INSURED. OUR RESERVES MAY NOT BE SUFFICIENT TO COVER FUTURE CLAIMS.
We are self-insured for many risks up to significant deductible amounts. The premiums associated with our insurance have recently increased substantially.continue to increase. General liability, fire, workers’workers' compensation, directors and officers liability, life, employee medical, dental and vision and automobile risks present a large potential liability. While we accrue for this liability based on historical experience, future claims may exceed claims we have incurred in the past. Should a different amountnumber of claims occur compared to what was estimated or the cost of the claims increase or decrease beyond what was anticipated, reserves recorded may not be sufficient and the accruals may need to be adjusted accordingly in future periods.
EMPLOYEE STRIKES AND OTHER LABOR-RELATED DISRUPTIONS MAY ADVERSELY AFFECT OUR OPERATIONS.
We have union contracts relating to the majoritya significant portion of our workforce in California, Oregon, Washington and Nevada.workforce. Although we believe union relations have been amicable in the past, there is no assurance that this will continue in the future. There are potential adverse effects of labor disputes with our own employees or by others who provide transportation (shipping lines, truck drivers) or cargo handling (longshoremen), both domestic and foreign, of our raw materials or other products. These actions could restrict our ability to obtain, process and/or distribute our products.
WE MAY ENTER INTO NEW BUSINESS VENTURES THAT COULD HAVE A NEGATIVE IMPACT ON OPERATING RESULTS.
From time to time, we evaluate potential business ventures and acquisitions. Entering into any such transaction entails many risks, any of which could materially harm our business. There is no assurance that any such venture, should we decide to enter into one, will accrue the projected returns. It is possible that such ventures could result in losses or returns that would have a negative impact on operating results.
5
OUR ROASTING AND BLENDING METHODS ARE NOT PROPRIETARY, SO COMPETITORS MAY BE ABLE TO DUPLICATE THEM, WHICH COULD HARM OUR COMPETITIVE POSITION.
We consider our roasting and blending methods essential to the flavor and richness of our coffeecoffees and, therefore, essential to our brand. Because the Company’sour roasting methods cannot be patented, we would be unable to prevent competitors from copying these methods if such methods became known. If our competitors copy our roasts or blends, the value of our brand may be diminished, and we may lose customers to our competitors. In addition, competitors may be able to develop roasting or blending methods that are more advanced than our production methods, which may also harm our competitive position.
BECAUSE A SUBSTANTIAL PORTION OF OUR BUSINESS IS BASEDWE ARE LARGELY RELIANT ON MAJOR FACILITIES IN CALIFORNIA, TEXAS COLORADO, ARIZONA AND WASHINGTON, AN INTERRUPTION IN OPERATIONS IN ANYOREGON FOR PRODUCTION OF THESE MARKETS WOULD ADVERSELY IMPACT OUR BUSINESS.PRODUCT LINE.
Over half of our business is conducted in California, Texas, Colorado, Arizona and Washington. We expect that these operations will continue to generate a substantial portion of our revenue. A significant interruption in operations at our manufacturing facilities in these markets,Torrance, California (our largest facility), Houston, Texas or Portland, Oregon, whether as a result of an earthquake, hurricane, natural disaster, terrorism or other causes, could significantly impair our ability to operate our business. Our major manufacturing facility and distribution hub is in Los Angeles County. The majority of our green coffee comes through the PortPorts of Los Angeles, or the Port of Long Beach.Beach, Houston, San Francisco and Portland. Any interruption to port operations, highway arteries, gas mains or electrical
Table of Contents
service in this areathese areas could restrict our ability to supply our branches with product and would adversely impact our business.
OUR OPERATING RESULTS MAY HAVE SIGNIFICANT FLUCTUATIONS FROM QUARTER TO QUARTER WHICH COULD HAVE A NEGATIVE EFFECT ON OUR STOCK PRICE.
From time to time, our Our operating results likely will fall below investor expectations. These results are influenced bymay fluctuate from period to period or within certain periods as a result of a number of factors, including fluctuations in the price and supply of green coffee, fluctuations in the selling prices of our products, the success of our hedging strategy, competition from existing or new competitors in our industry, and changes in consumer preferences.
Quarterly fluctuationspreferences, and our ability to manage inventory and fulfillment operations and maintain gross margins. Fluctuations in our operating results as thea result of these factors or for any other reason, could cause our stock price to decline. Accordingly, we believe that period-to-period comparisons of our historical or future operating results are not necessarily meaningful, and such comparisons should not be relied upon as indicators of future performance.
OPERATING LOSSES MAY CONTINUE AND, AS A RESULT, THE PRICE OF OUR STOCK MAY BE NEGATIVELY AFFECTED.
For We have incurred operating losses for each of the prior three fiscal year ended June 30, 2006, we had an operating loss of ($2,965,000). For the fiscal year ended June 30, 2005, we had an operating loss of ($6,583,000)years and a net loss in two of ($5,427,000). Wethe prior three fiscal years. If our current strategies are unsuccessful we may not achieve the levels of sales and earnings we expect. As a result, we could suffer additional losses in future years and as a result our stock price could decline.
FUTURE FUNDING DEMANDS UNDER PENSION PLANS FOR CERTAIN UNION EMPLOYEES ARE UNKNOWN.
We participate in twoseveral multi-employer defined benefit plans for certain union employees. The management, funding status and future viability of these plans is not known at this time. The nature of the contract with these plans allows for future funding demands that are outside our control or ability to estimate.
WE RELY ON A SINGLE THIRD PARTY SUPPLIER TO MANAGE OUR INTEGRATED ORACLE SYSTEM THAT IS INTEGRAL TO THE SUCCESS AND OPERATION OF OUR BUSINESS.
We rely on WTS, a company affiliated with Oracle, and its employees, in connection with the hosting of our integrated Management Information System. This System is essential to our operations and currently includes all accounting and production software applications. By the end of fiscal 2007, WTS is also expected to host our Route Sales application software. If WTS were to experience financial, operational, or quality assurance difficulties, or if there were any other disruption in our relationship with WTS, we might be unable to produce financial statements, fill replenishment orders for our branch warehouses, issue payroll checks, process payments to our vendors or bill customers. Any of these items could have a material adverse effect on the Company.
WE ARE DEPENDENT ON ENTERPRISE RESOURCE MANAGEMENT (“ERP”) SOFTWARE TO OPERATE OUR BUSINESS. SHOULD WE FAIL TO OPERATE EFFECTIVELY OR IF WE ENCOUNTER DIFFICULTIES INTEGRATING SYSTEMS OR SUFFER ILL-TIMED POWER OR COMMUNICATIONS FAILURES, THE RESULT COULD HAVE A MATERIAL ADVERSE EFFECT ON OUR OPERATIONS.
We rely on complex software and hardware to invoice our customers, produce customer statements, account for our inventory and manufacturing costs, fill branch inventory replenishment orders, pay our bills, pay our employees and produce our financial statements. We have in the past encountered, and in the future may encounter, software and hardware errors, system design errors and errors in the operation of our systems. This has resulted in and may in the future result in a number of adverse consequences, including: users being disconnected from systems and being unable to perform their job functions, delays in producing financial statements and other key management system information.
Reliance on such software also leaves us exposed to harmful software programs such as viruses that could disrupt our business and damage our network. It is possible that a security breach or inappropriate use of our network could expose us to the possibility of system failure or other disruption. A security breach could jeopardize security of confidential information and thereby expose the Company to potential legal liability.
THE COMPANY DEPENDSDEPEND ON THE EXPERTISE OF KEY PERSONNEL. THE UNEXPECTED LOSS OF ONE OR MORE OF THESE KEY EMPLOYEES COULD HAVE A MATERIAL ADVERSE EFFECT ON OUR OPERATIONS ORAND COMPETITIVE POSITION.
Our continued success largely depends on the efforts and abilities of our executive officers and other key personnel. There is limited management depth in certain key positions throughout the Company. We must continue to recruit, retain and motivate management and other employees sufficient to maintain our current business and support our projected growth. The unexpected loss of one or more of these key employees could have a material adverse effect onadversely affect our operations and competitive position.
Our former Chairman and Chief Executive Officer and sole coffee buyer, Roy E. Farmer, died unexpectedly in January 2005. Guenter W. Berger, a long time member We do not maintain key person life insurance policies on any of our Board of Directors and Vice President, Production was appointed interim CEO and in August 2005 assumed the title of Chairman, CEO and President. A new coffee buyer was hired in June 2005. In July 2006 we hired Roger M. Laverty III as President and COO. We continue to evaluate and recruit key personnel to enhance the depth of our management.executive officers.
WE ARE SUBJECT TO RE-FUNDING OBLIGATIONS AND MAY ACQUIRE ADDITIONAL SHARES UNDER THE ESOP.
The Farmer Bros. Co. Employee Stock Ownership Plan (the "ESOP") was designed to help us attract and retain employees and to better align the efforts of our employees with the interests of our stockholders. To that
end, the Company has purchased 3,000,500 shares of Company stock for the ESOP to allocate to employees over the next 12 years. It is possible that additional shares could be acquired that might deplete the Company’s cash.our available cash or require us to borrow additional funds. We expect that the future re-funding liability of the existing shares in the ESOP will increase and require additional investment as the ESOP matures and individual holdings grow. When employees vested in the ESOP leave the Company, they have the right to “put”"put" their shares to the Company for cash. This requiresOur re-funding liability for fiscal 2010 is estimated to be
Table of Contents
$2.1 million. Major assumptions which lead to this result include a 5% appreciation rate in the Company to repurchase those shares atprice of our common stock, the current market value. Assuming allnumber of shares currently owned byin the ESOP are fully distributed, the Company’s re-funding liability is approximately $64,700,000 based on the June 30, 2006 closing share price.and participant demographics.
CONCENTRATION OF OWNERSHIP AMONG OUR EXISTING PRINCIPAL STOCKHOLDERS MAY PREVENT NEW INVESTORS FROM INFLUENCING SIGNIFICANT CORPORATE DECISIONS AND MAY RESULT IN A LOWER TRADING PRICE FOR OUR STOCK THAN IF OWNERSHIP OF OUR STOCK WAS LESS CONCENTRATED.
As of September 1, 2006,3, 2009, members of the Farmer family or entities controlled by the Farmer family (such as(including trusts or business entities)and a family partnership) as a group beneficially owned approximately 40% of our outstanding common stock. As a result, these stockholders, acting together, may be able to influence the outcome of stockholder votes, including votes concerning the election and removal of directors and approval of significant corporate transactions. This level of concentrated ownership along with the factors described in “Risk Factors—ANTI-TAKEOVER PROVISIONS COULD MAKE IT MORE DIFFICULT FOR A THIRD PARTY TO ACQUIRE US,” may have the effect of delaying or preventing a change in the management or voting control of the Company. In addition, this significant concentration of share ownership may adversely affect the trading price forof our common stock if investors perceive disadvantages in owning stock in a company with such concentrated ownership.
FUTURE SALES OF SHARES BY EXISTING STOCKHOLDERS COULD CAUSE OUR STOCK PRICE TO DECLINE.
All of our outstanding shares are eligible for sale in the public market, subject in certain cases to limitations under Rule 144 of the Securities Act of 1933, as amended (the "Securities Act"). Also, shares subject to outstanding options and restricted stock under the Farmer Bros. Co. 2007 Omnibus Plan are eligible for sale in the public market to the extent permitted by the provisions of various vesting agreements, our stock ownership guidelines, and Rule 144 under the Securities Act. If these shares are sold, or if it is perceived that they will be sold in the public market, the trading price of our common stock could decline.
ANTI-TAKEOVER PROVISIONS COULD MAKE IT MORE DIFFICULT FOR A THIRD PARTY TO ACQUIRE US.
We have adopted a stockholder rights plan (the “Rights Plan”"Rights Plan") and declared a dividend distributionpursuant to which each share of our outstanding common stock is accompanied by one preferred share purchase right (a “Right”"Right") for each outstanding share of our common stock to stockholders of record as of March 28, 2005.. Each Right, when exercisable, will entitle the registered holder to purchase from the Company one one-hundredth of a share of Series A Junior Participating Preferred Stock, $1.00 par value per share, at a purchase price of $112.50, subject to adjustment. The Rights expire on March 28, 2015, unless they are earlier redeemed, exchanged or terminated as provided in the Rights Plan. Because the Rights may substantially dilute the stock ownership of a person or group attempting to take us over without the approval of our Board of Directors, our Rights Plan could make it more difficult for a third party to acquire us (or a significant percentage of our outstanding capital stock) without first negotiating with our Board of Directors regarding such acquisition.
In addition, our Board of Directors has the authority to issue up to 500,000 shares of Preferred Stockpreferred stock (of which 200,000 shares have been designated as Series A Junior Participating Preferred Stock) and to determine the price, rights, preferences, privileges and restrictions, including voting rights, of those shares without any further vote or action by the stockholders. The rights of the holders of our common stock may be subject to, and may be adversely affected by, the rights of the holders of any preferred stock that may be issued in the future. The issuance of preferred stock may have the effect of delaying, deterring or preventing a change of control of Farmer Bros.the Company without further action by the stockholders and may adversely affect the voting and other rights of the holders of our common stock.
Table of Contents
Further, certain provisions of our charter documents, including a classified board of directors, provisions eliminating the ability of stockholders to take action by written consent, and provisions limiting the ability of stockholders to raise matters at a meeting of stockholders without giving advance notice, may have the effect of delaying or preventing changes in control or management of Farmer Bros.,the Company, which could
have an adverse effect on the market price of our stock. In addition, our charter documents do not permit cumulative voting, which may make it more difficult for a third party to gain control of our Board of Directors. Further, we are subject to the anti-takeover provisions of Section 203 of the Delaware General Corporation Law, which will prohibit us from engaging in a “business combination”"business combination" with an “interested stockholder”"interested stockholder" for a period of three years after the date of the transaction in which the person became an interested stockholder, even if such combination is favored by a majority of stockholders, unless the business combination is approved in a prescribed manner. The application of Section 203 also could have the effect of delaying or preventing a change of control or management.
FAILURE TO MAINTAIN EFFECTIVE INTERNAL CONTROLS IN ACCORDANCE WITH SECTION 404 OF THE SARBANES-OXLEY ACT OF 2002 COULD HAVE A MATERIAL ADVERSE EFFECT ON OUR BUSINESS AND STOCK PRICE.
As directed by Section 404 of the Sarbanes-Oxley Act of 2002 (“SOX”("SOX"), the SEC adopted rules requiring us, as a public company, to include a report of management on our internal controls over financial reporting in our annual report on Form 10-K and quarterly reports on Form 10-Q that contains an assessment by management of the effectiveness of our internal controls over financial reporting. In addition, our independent auditors must attest to and report on management’smanagement's assessment of the effectiveness of our internal controls over financial reporting as of the end of the fiscal year. Compliance with SOX Section 404 has been a challenge for many companies. Our ability to continue to comply is uncertain as we expect that our internal controls will continue to evolve as our business activities change. If, during any year, our independent auditors are not satisfied with our internal controls over financial reporting or the level at which these controls are documented, designed, operated, tested or assessed, or if the independent auditors interpret the requirements, rules or regulations differently than we do, then they may decline to attest to management’smanagement's assessment or may issue a report that is qualified. In addition, if we fail to maintain the adequacy of our internal controls, as such standards are modified, supplemented or amended from time to time, we may not be able to ensure that we can conclude on an ongoing basis that we have effective internal controls over financial reporting in accordance with SOX Section 404. Failure to maintain an effective internal control environment could have a material adverse effect on our stock price. In addition, there can be no assurance that we will be able to remediate material weaknesses, if any, that may be identified in future periods.
COMPLIANCE WITH CHANGING REGULATION OF CORPORATE GOVERNANCE AND PUBLIC DISCLOSURE MAY RESULT IN ADDITIONAL EXPENSES.
Changing laws, regulations and standards relating to corporate governance and public disclosure, including SOX, new SEC and Public Accounting Oversight Board regulations and NASDAQ National Market rules, are creating uncertainty for public companies. These new or changed laws, regulations and standards are subject to varying interpretations in many cases due to their lack of specificity, and as a result, their application in practice may evolve over time as new guidance is provided by regulatory and governing bodies, which could result in continuing uncertainty regarding compliance matters and higher costs necessitated by ongoing revisions to disclosure and governance practices. We are committed to maintaining high standards of corporate governance and public disclosure. As a result, our efforts to comply with evolving laws, regulations and standards have resulted in, and are likely to continue to result in, increased general and administrative expenses and management time related to compliance activities. Substantial costs have been incurred in fiscal 2006, and will continue to be incurred to comply with various of these mandates, including the engagement of separate public accounting firms to perform work that is now prohibited to be performed by our regular independent accounting firm, internal costs associated with documenting the adequacy of our internal controls over financial reporting and similar compliance activities, and increased costs of audit by our independent accounting firm. If our efforts to comply with new or changed laws, regulations and standards differ from the activities intended by regulatory or
governing bodies due to ambiguities related to practice, our reputation may be harmed and we might be subject to sanctions or investigation by regulatory authorities, such as the SEC. Any such action could adversely affect our financial results and the market price of our common stock. While Farmer Bros. believes that it has been at all times in material compliance with laws and regulations pertaining to the proper recording and reporting of our financial results, there can be no assurance that future regulations, implementing SOX and otherwise, will not have a material adverse impact on our reported results as compared with prior reporting periods.
Item 1.B. Unresolved Staff Comments
None.
Item 2. Properties
Our largest and most significant facility consists of our roasting plant, warehouses and administrative offices in Torrance, California. This facility is our primary manufacturing facility and the distribution hub for our long haullong-haul trucking fleet. Coffee purchasing, roasting and packaging takes place at our Torrance, California, Portland, Oregon, and Houston, Texas plants. Spice blending and packaging takes place at our Torrance, California and Oklahoma City, Oklahoma plants. Our distribution centers include our Torrance, Portland and Houston plants as well as new distribution centers in Fridley, Minnesota, Bensenville, Illinois and Moonachie, New Jersey.
Table of Contents
During fiscal 2008 we completed improvements to a new 125,000 square foot leased manufacturing facility in Portland, Oregon that serves as the manufacturing and distribution point for our specialty coffee customers. CBI relocated to this new facility in August 2008.
We stage our products in 101 small179 branch warehouses throughout our service area.the contiguous United States. These warehouses, taken together, represent a vital part of our business, but no individual warehouse is material to the groupbusiness as a whole. Our branch warehouses vary in size from approximately 2,500 to 20,00050,000 square feet. Approximately 40%34% of these warehousesour facilities are leased with a variety of expiration dates through 2011.2014. The lease on the new CBI facility expires in 2018 and has a 10 year renewal option.
We believe our existing plantplants, distribution centers and branch warehouses will continue to provide adequate capacity for the foreseeable future.
A complete list of properties and facilities operated by Farmer Bros. is attached hereto, and incorporated herein by reference, as Exhibit 99.1.
Item 3. Legal Proceedings
We are both defendant and plaintiff in various legal proceedings incidental to our business which are ordinary and routine. It is our opinion that the resolution of these lawsuits will not have a material impact on our financial condition or results of operations.
Item 4. Submission of Matters to a Vote of Security Holders
During the fourth quarter of fiscal 20062009 no matters were submitted to a vote of security holders, through the solicitation of proxies or otherwise.
10
Table of Contents
PART II
Item 5. Market for Registrant’sRegistrant's Common Equity, Related Stockholder Matters and Issuer Purchases of Equity Securities
Market Information
We have one class of common stock which is traded on the NASDAQ NationalGlobal Market under the symbol “FARM.”"FARM." The following table sets forth, for the periods indicated, the cash dividends declared and the high and low sales prices of the shares of Common Stockcommon stock of the Company. Prices areCompany as reportedquoted on the NASDAQ National Market and represent prices between dealers, without including retail mark-up, mark-down or commission, and do not necessarily represent actual trades.Global Market.
| | | 2006 | | 2005 | | | Fiscal year ended June 30, 2009 | | Fiscal year ended June 30, 2008 | |
|---|
| | High | | Low | | Dividend | | High | | Low | | Dividend | | | High | | Low | | Dividend | | High | | Low | | Dividend | |
|---|
1st Quarter | | $ | 24.98 | | $ | 19.50 | | | $ | 0.105 | | | $ | 27.55 | | $ | 24.50 | | | $ | 0.100 | | | | $ | 28.49 | | $ | 20.21 | | $ | 0.115 | | $ | 25.33 | | $ | 19.89 | | $ | 0.115 | |
2nd Quarter | | $ | 22.87 | | $ | 19.11 | | | $ | 0.105 | | | $ | 28.40 | | $ | 24.03 | | | $ | 0.100 | | | | $ | 25.46 | | $ | 17.00 | | $ | 0.115 | | $ | 27.25 | | $ | 21.30 | | $ | 0.115 | |
3rd Quarter | | $ | 22.61 | | $ | 19.31 | | | $ | 0.105 | | | $ | 29.65 | | $ | 22.05 | | | $ | 0.100 | | | | $ | 25.49 | | $ | 14.26 | | $ | 0.115 | | $ | 24.50 | | $ | 20.12 | | $ | 0.115 | |
4th Quarter | | $ | 23.18 | | $ | 19.72 | | | $ | 0.105 | | | $ | 24.49 | | $ | 20.78 | | | $ | 0.100 | | | | $ | 25.49 | | $ | 17.31 | | $ | 0.115 | | $ | 25.00 | | $ | 21.15 | | $ | 0.115 | |
Holders
There were approximately 3,9372,291 holders of record on September 1, 2006.3, 2009. Holders of record is based upon the number of record holders and individual participants in security position listings.
Effective asDividends
Dividends have been or will be funded through cash flow from operations and available cash on hand. We, at the discretion of March 17, 2005, our Board of Directors approvedand subject to applicable law, anticipate paying regular quarterly dividends on our common stock for the foreseeable future. The amount, if any, of the dividends to be paid in the future will depend upon our then available cash, anticipated cash needs, overall financial condition, loan agreement restrictions, future prospects for earnings and cash flows, as well as other relevant factors. For a stockholder rights plan (the “Rights Plan”), pursuantdescription of the loan agreement restrictions on the payment of dividends, see "Management's Discussion and Analysis of Financial Condition and Results of Operations—Liquidity and Capital Resources" included in Part II, Item 7 of this Form 10-K and Note 9 to which the Company entered into a Rights Agreement dated March 17, 2005 (the “Rights Agreement”) with Wells Fargo Bank, N.A., as Rights Agent,consolidated financial statements included in Part II, Item 8 of this Form 10-K.
Equity Compensation Plan Information
This information appears in Part III, Item 12, hereof.
Table of Contents
Performance Graph
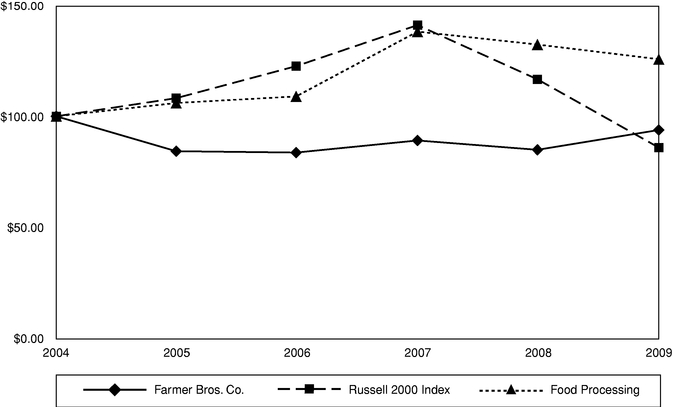
The chart set forth below shows the value of an investment of $100 on June 30, 2004 in each of Farmer Bros. Co. common stock, the Russell 2000 Index and the Board declared a dividend of one preferred share purchase right (a “Right”) for each outstanding shareValue Line Food Processing Index. All values assume reinvestment of the Company’s Common Stock to stockholderspre-tax value of recorddividends paid by companies included in these indices and are calculated as of June 30 of each year. The historical stock price performance of the Company's common stock shown in the performance graph below is not necessarily indicative of future stock price performance.
Comparison of Five-Year Cumulative Total Return*
Farmer Bros. Co., Russell 2000 Index And Value Line Food Processing Index
(Performance Results Through 6/30/09)
| | | | | | | | | | | | | | | | | | | |
| | 2004 | | 2005 | | 2006 | | 2007 | | 2008 | | 2009 | |
|---|
Farmer Bros. Co. | | $ | 100.00 | | $ | 84.31 | | $ | 83.70 | | $ | 89.13 | | $ | 84.94 | | $ | 93.84 | |
Russell 2000 Index | | $ | 100.00 | | $ | 108.14 | | $ | 122.51 | | $ | 140.94 | | $ | 116.59 | | $ | 85.93 | |
Food Processing | | $ | 100.00 | | $ | 105.97 | | $ | 108.90 | | $ | 138.02 | | $ | 132.21 | | $ | 125.63 | |
Assumes $100 invested at the close of business on March 28, 2005. Each Right, when exercisable, will entitletrading June 30, 2004 in Farmer Bros. Co. common stock, Russell 2000 Index, and Value Line Food Processing Index.
* Cumulative total return assumes reinvestment of dividends.
Source: Value Line, Inc.
Factual material is obtained from sources believed to be reliable, but the registered holder to purchase from the Company one one-hundredthpublisher is not responsible for any errors or omissions contained herein.
Table of a share of Series A Junior Participating Preferred Stock, $1.00 par value per share, at a purchase price of $112.50, subject to adjustment. The description and terms of the Rights are set forth in the Rights Plan. Initially, ownership of the Rights is evidenced by the certificates representing our Common Stock then outstanding, and no separate Rights Certificates, as defined in the Rights Plan, have been distributed. The Rights are not exercisable until the distribution date, as described in the Rights Agreement, and will expire on March 28, 2015, unless they are earlier redeemed, exchanged or terminated as provided in the Rights Plan. ContentsNo rights have been exercised at this time.
Item 6. Selected Financial Data
| | | For the fiscal years ended June 30, | | | For the fiscal years ended June 30, | |
|---|
| | 2006 | | 2005 | | 2004 | | 2003 | | 2002 | | | 2009(1) | | 2008(2) | | 2007 | | 2006 | | 2005 | |
|---|
| | (In thousands, except per share data) | | | (In thousands, except per share data)
| |
|---|
Net sales | | $ | 207,453 | | $ | 198,420 | | $ | 193,589 | | $ | 201,558 | | $ | 205,857 | | | $ | 341,724 | | $ | 266,485 | | $ | 216,259 | | $ | 207,453 | | $ | 198,420 | |
(Loss) income from operations | | $ | (2,965 | ) | $ | (6,583 | ) | $ | 3,763 | | $ | 23,888 | | $ | 38,210 | | | $ | (15,203 | ) | $ | (10,644 | ) | $ | (4,076 | ) | $ | (2,965 | ) | $ | (6,583 | ) |
Net income (loss) | | $ | 4,756 | | $ | (5,427 | ) | $ | 12,687 | | $ | 23,629 | | $ | 30,569 | | |
Net income (loss) per common share(a) | | $ | 0.34 | | $ | (0.40 | ) | $ | 0.81 | | $ | 1.30 | | $ | 1.65 | | |
Net (loss) income (3) | | | $ | (33,270 | ) | $ | (7,924 | ) | $ | 6,815 | | $ | 4,756 | | $ | (5,427 | ) |
Net (loss) income per common share | | | $ | (2.29 | ) | $ | (0.55 | ) | $ | 0.48 | | $ | 0.34 | | $ | (0.40 | ) |
Total assets | | $ | 317,237 | | $ | 314,923 | | $ | 317,871 | | $ | 416,415 | | $ | 417,524 | | | $ | 330,017 | | $ | 312,984 | | $ | 337,609 | | $ | 317,237 | | $ | 314,923 | |
Dividends per common share(a) | | $ | 0.42 | | $ | 0.40 | | $ | 0.38 | | $ | 0.36 | | $ | 0.34 | | |
Capital lease obligations | | | $ | 1,252 | | $ | — | | $ | — | | — | | — | |
Cash dividends per common share | | | $ | 0.46 | | $ | 0.46 | | $ | 0.44 | | $ | 0.42 | | $ | 0.40 | |
- (1)
- Includes the results of operations of the DSD Coffee Business since it was acquired by the Company on February 28, 2009.
- (2)
- Includes the results of operations of CBH since it was acquired by the Company on April 27, 2007.
- (3)
- Includes deferred tax asset valuation allowance in the amount of $19,663,000 recorded as a tax expense in fiscal 2009.
(a) All per share disclosures have been adjusted The Notes to reflectConsolidated Financial Statements and Management's Discussion and Analysis of Financial Condition and Results of Operations included elsewhere in this annual report should be read in conjunction with the stock split that became effective on May 10, 2004.selected financial data in order to understand factors such as business combinations and unusual items which may affect the comparability of the information shown above.
11
Item 7. Management’sManagement's Discussion and Analysis of Financial Condition and Results of Operations
Management’s discussion and analysis discusses the results of operations as reflected in the Company’s consolidated financial statements. The following discussion contains forward-looking statements that involve risks and uncertainties. Our actual results could differ materially from those anticipated in these forward-looking statements as a result of many factors. The results of operations for the fiscal years ended June 30, 2006, 20052009, 2008, and 20042007 are not necessarily indicative of the results that may be expected for any future period. The following discussion should be read in combination with the consolidated financial statements and the notes thereto included in Item 8 of this report and with the “Risk Factors”"Risk Factors" described in Item 11A of this report.
Overview
Farmer Bros. Co. is a manufacturer, wholesaler and distributor of coffee and allied products through direct and brokered sales to our customers throughout the contiguous United States. Our product line is specifically focused on the needs of our market segment: institutional food service establishments including restaurants, hotels, casinos, hospitals and food service providers, as well as retailers such as convenience stores, coffee houses, general merchandisers, private-label retailers and grocery stores. Our product line includes roasted coffee, liquid coffee, coffee related products such as coffee filters, sugar and creamers, assorted teas, cappuccino, cocoa, spices gelatins and puddings, soup, gravy and sauce mixes, pancake and biscuit mixes, and jellies and preserves.
In April 2007, we acquired all of the outstanding shares of CBH for a purchase price of $23.6 million in cash, including transaction costs of approximately $1.4 million, net of the amount of all outstanding indebtedness of CBH and its subsidiaries. The results of operations of CBH have been included in our consolidated financial statements since April 27, 2007.
On February 28, 2009, we completed the acquisition of the DSD Coffee Business. Subject to certain post-closing adjustments relating to the amount of consumable inventory and prepaid expenses at closing, and after giving effect to certain reimbursement obligations of the parties relating to accounting costs, IT carve-out costs, and transfer taxes and fees, as well as real and personal property
Table of Contents
tax and utility prorations, the amount paid to Seller Parties at closing was approximately $45.6 million. The purchase price was paid with approximately $16.1 million of Company cash and $29.5 million of proceeds from a bank loan. In addition, we paid approximately $2.7 million of acquisition related expenses in cash. At closing, we assumed certain liabilities, including obligations under contracts, environmental liabilities with respect to the transferred facilities, pension liabilities, advertising and trade promotion accruals, and accrued vacation as of the closing for hired personnel. As of June 30, 2009, these liabilities are estimated to be a total of $2,026,000 consisting of $1,322,000 for costs related to exiting certain acquired operations, $609,000 for accrued vacation and $95,000 in other estimated liabilities. The results of operations of the DSD Coffee Business have been included in our consolidated financial statements since March 1, 2009. We re-financed and replaced certain existing truck leases relating to DSD Coffee Business vehicles during the fourth quarter of fiscal 2009 as described below under the heading "Contractual Obligations."
In connection with the closing, Seller Parties and the Company entered into certain operational agreements, including trademark and formula license agreements, co-pack agreements, a liquid coffee distribution agreement, a transition services agreement, and a green coffee and tea purchase agreement. One of the co-pack agreements provides that Sara Lee will manufacture branded products for us for a period of three years. Under this agreement we have agreed to purchase certain minimum product quantities from Sara Lee subject to certain permitted reductions. Under the other co-pack agreement, we have agreed to perform co-packing services for Sara Lee as Sara Lee's agent. As a result, we recognize revenue from this arrangement on a net basis, net of direct costs of revenue. The transition services agreement provides that Sara Lee will perform a number of services for us on an interim basis, including distribution and warehousing of finished goods for up to six months and hosting, maintaining and supporting IT infrastructure for up to eighteen months.
The accompanying unaudited consolidated financial statements do not include pro-forma historical information, as if the results of the DSD Coffee Business had been included from the beginning of the periods presented, since the use of forward-looking information would be necessary in order to meaningfully present the effects of the acquisition. Forward-looking information, rather than historical information, would be required since the DSD Coffee Business was operated as part of a larger business within Sara Lee and there will be a different operating cost structure and different operations support under the Company's ownership. Net revenue of the DSD Coffee Business for the eight months ended February 28, 2009 (the effective date of the acquisition) was approximately $134 million, and approximately $228 million for the fiscal year ended June 30, 2008. However the Company has not provided forward-looking information with respect to incremental costs and expenses to be incurred because such information is not determinable.
The acquisition has been accounted for as an asset purchase. The total purchase price has been allocated to tangible and intangible assets based on their estimated fair values as of February 28, 2009 as determined by management based upon a third-party valuation. The purchase price allocation has not been finalized, since it is possible that certain adjustments may be made if additional facts or circumstances become known that impact the estimates. Revisions to the allocation, which may be significant, will be reported as changes to various assets and liabilities. Certain costs related to the integration of the DSD Coffee Business with our existing business, including the costs of exiting certain acquired operations, have been capitalized as purchase-related costs and allocated to the acquired assets. The purchase price allocation is expected to be finalized during fiscal 2010.
Table of Contents
The following table summarizes the estimated fair values of the assets acquired and liabilities assumed at the date of acquisition, based on the preliminary purchase price allocation (dollars in thousands):
| | | | | | | | |
Fair Value of Assets Acquired | |
| | Estimated Useful
Life
(years) | |
|---|
Inventory | | $ | 16,437 | | | | |
Prepaid expense | | | 1,138 | | | | |
| | | | | | | |
| | Current assets | | | 17,575 | | | | |
Vehicles | | |
1,044 | | | 5 | |
Machinery | | | 10,954 | | | 3-5 | |
Property, plant & equipment | | | 5,577 | | | 30 | |
Land | | | 1,945 | | | | |
| | | | | | | |
| | Fixed assets | | | 19,520 | | | | |
Trademarks | | |
2,115 | | | indefinite | |
Customer relationships | | | 7,855 | | | 8 | |
Distribution agreement | | | 2,493 | | | 10 | |
Co-pack agreement | | | 755 | | | 6 | |
| | | | | | | |
| | Intangible assets | | | 13,218 | | | | |
| | | | | | | |
Total assets acquired | | |
50,313 | | | | |
Liabilities assumed | | | (2,026 | ) | | | |
| | | | | | | |
Net assets acquired | | $ | 48,287 | | | | |
| | | | | | | |
Critical Accounting Policies and Estimates
Overview
Management’s Management's discussion and analysis of financial condition and results of operations is based upon our consolidated financial statements, which have been prepared in accordance with U.S. generally accepted accounting principles. Our significant accounting policies are discussed in Note 1 to our consolidated financial statements, included herein at Item 8. The preparation of these financial statements requires us to make estimates, judgments and judgmentsassumptions that affect the reported amounts of assets, liabilities, revenues and expenses, and related disclosure of contingent assets and liabilities. On an ongoing basis, we evaluate our estimates, including those related to inventory valuation, including LIFO reserves, the allowance for doubtful accounts, deferred tax assets, liabilities relating to retirement benefits, liabilities resulting from self-insurance of our workers’workers' compensation liabilities, tax liabilities and litigation. We base our estimates, judgments and assumptions on historical experience and other relevant factors that are believed to be reasonable underbased on information available to us at the circumstances.time these estimates are made.
While we believe that the historical experience and other factors considered provide a meaningful basis for the accounting policies applied in the preparation of the consolidated financial statements, actual results may differ from these estimates, which could require the Companyus to make adjustments to these estimates in future periods.
We believe that the estimates, judgments and assumptions involved in the accounting policies described below require the most subjective judgment and have the greatest potential impact on our financial statements, so we consider these to be our critical accounting policies. Our senior management has reviewed the development and selection of these critical accounting policies and
InvestmentsTable of Contents
estimates, and their related disclosure in this report, with the Audit Committee of our Board of Directors.
Coffee Brewing Equipment and Service
Expenses related to coffee brewing equipment provided to customers include the cost of the equipment as well as the cost of servicing that equipment (including service employees' salaries, the cost of transportation and the cost of supplies and parts). Coffee brewing equipment is capitalized and depreciated over a three year period and the depreciation expense is reported in cost of sales. Since we believe the costs of servicing the equipment are better characterized as direct costs of generating revenues from our customers, we have reported such costs as cost of sales in the accompanying financial statements.
Investments
Our investments consist of investment grademoney market instruments, marketable debt instruments issued by the U.S. Government and major U.S. and foreign corporations, equity securities primarily preferred stock, and various derivative instruments, primarily exchange traded treasury futures and options, green coffee forward purchase contracts and commodity purchase agreements. All derivativesderivative instruments not designated as accounting hedges are marked to market and changes are recognized in current earnings. At June 30, 2009 and 2008 no derivative instruments were designated as accounting hedges. The fair value of derivative instruments is based upon broker quotes where possible.quotes. The cost of investments sold is determined on the specific identification method. Dividend and interest income is accrued as earned.
Allowance for Doubtful Accounts
We maintain an allowance for estimated losses resulting from the inability of our customers to meet their obligations. Our ability to maintain a relatively small reserve is directly related to our ability to collect from our customers when our salespeople regularly interact with our customers in person. This method of operation has provided us with a historically low bad debt experience. There can be no assurance this will be the case in the future.
Inventories
Inventories are valued at the lower of cost or market and the costsmarket. Costs of coffee and allied products are determined on the last in, first out (LIFO) basis. Costs of coffee brewing equipment manufactured are accounted for on the first in, first out (FIFO) basis. We regularly evaluate these inventories to determine whether market conditions are correctly reflected in the recorded carrying value.
Impairment of Goodwill and Intangible Assets
We perform our annual goodwill and indefinite-lived intangible assets impairment test as of March 31 of each fiscal year. Under SFAS No. 142, "Goodwill and Other Intangible Assets" ("SFAS 142"), goodwill and other indefinite-lived intangible assets are not amortized but instead are reviewed for impairment annually and on an interim basis if events or changes in circumstances between annual tests indicate that an asset might be impaired. Under SFAS 142, indefinite-lived intangible assets are tested for impairment by comparing their fair values to their carrying values. Testing for impairment of goodwill is a two-step process. The first step requires us to compare the fair value of its reporting units to the carrying value of the net assets of the respective reporting units, including goodwill. If the fair value of the reporting unit is less than the carrying value, goodwill of the reporting unit is potentially impaired and we then complete step two to measure the impairment loss, if any. The second step requires the calculation of the implied fair value of goodwill by deducting the fair value of all tangible and intangible net assets of the reporting unit from the fair value of the reporting
Self-Insurance RetentionTable of Contents
unit. If the implied fair value of goodwill is less than the carrying amount of goodwill, an impairment loss is recognized equal to the difference.
In addition to an annual test, goodwill and indefinite-lived intangible assets must also be tested on an interim basis if events or circumstances indicate that the estimated fair value of such assets has decreased below their carrying value. There were no such events or circumstances during the fiscal years ended June 30, 2009 or 2008.
Self-Insurance
We are self-insured for California workers’workers' compensation insurance subject to specific retention levels and use historical analysis to determine and record the estimates of expected future expenses resulting from workers’workers' compensation claims. Additionally,The estimated outstanding losses are the accrual cost of unpaid claims valued as of June 30, 2009. The estimated outstanding losses, including allocated loss adjustment expenses ("ALAE"), include case reserves, the development on known claims and incurred but not reported (IBNR) claims. ALAE are the direct expenses for settling specific claims. The amounts reflect the per occurrence and annual aggregate limits maintained by the Company. The analysis does not include estimating a provision for unallocated loss adjustment expenses.
Management believes that the amount accrued is adequate to cover all known claims at June 30, 2009. If the actual costs of such claims and related expenses exceed the amount estimated, additional reserves may be required which could have a material negative effect on operating results. If our estimate were off by as much as 15%, the reserve could be under or overstated by approximately $852,000 as of June 30, 2009.
Estimated Company liability resulting from our general liability policies, within our deductible limits, is accounted for by specific identification. Large losses have historically been infrequent, and the lag between incurred but not reported claims has historically been short. Once a potential loss has been identified, the case is monitored by our risk manager to try and determine a likely outcome. Lawsuits arising from injury that are expected to reach our deductible are not reserved until we accrue forhave consulted with legal counsel, become aware of the likely amount of loss and determined when payment is expected.
The estimated lossesliability related to our self-insured group medical insurance is recorded on an incurred but not covered byreported basis, within deductible limits, based on actual claims and the average lag time between the date insurance for liability, auto, medicalclaims are filed and fire up to the deductible amounts.date those claims are paid.
Retirement Plans
We have two defined benefit plans that provide retirement benefits for the majority of our employees (the balance of ournon-union employees. Our union employees are covered by multiemployer union defined benefit plans).plans.
We obtain actuarial valuations for bothour plans and at present we discount the pension obligations using a 6.25% discount rate and we estimate an 8%8.25% return on plan assets. The performance of the stock market and other investments as well as the overall health of the economy can have a material effect on pension investment returns and these assumptions. A change in these assumptions could affect our operating results. Our retiree medical
At the end of fiscal 2009, the projected benefit obligation of our defined benefit pension plans was $100.1 million and assets were $61.7 million. This decrease in asset values is recognized in a decrease in other comprehensive income ("OCI") and an increase in pension liability and deferred tax assets. The difference between plan is notobligations and assets, or the funded status of the plans, significantly affects the net periodic benefit costs of our pension plans and shares the sameongoing funding requirements of those plans. Among other factors, changes in interest rates, mortality rates, early retirement rates, investment returns and the market value of plan assets can affect the level of plan funding, cause
Table of Contents
volatility in the net periodic pension costs, and increase our future funding requirements. We expect to make approximately $4.8 million in contributions to our pension plans in fiscal 2010 and record an accrued expense of approximately $7 million per year beginning in 2010. These payments are expected to continue at this level for several years, and the current economic environment increases the risk that we may be required to make even larger contributions in the future.
The following chart quantifies the effect on the projected benefit obligation and the net periodic benefit cost of a change in the discount rate asassumption and the definedimpact on the net periodic benefit plans. We project an initial medical trendcost of a change in the assumed long term rate of 9% ultimately reducing to 5.5% in 6 years.return for fiscal 2010.
| | | | | | | | | | |
Farmer Bros. Plan
(dollars in thousands)
Discount Rate | | 5.75% | | Actual 6.25% | | 6.75% | |
|---|
2010 net periodic benefit cost | | $ | 9,942 | | $ | 9,034 | | $ | 8,215 | |
Projected benefit obligation | | $ | 103,198 | | $ | 96,652 | | $ | 90,747 | |
| | | | | | | | | | |
Long Term Rate of Return | | 7.75% | | Actual 8.25% | | 8.75% | |
|---|
2010 net periodic benefit cost | | $ | 9,321 | | $ | 9,034 | | $ | 8,747 | |
| | | | | | | | | | |
Brewmatic Plan
(in thousands)
Discount Rate | | 5.75% | | Actual 6.25% | | 6.75% | |
|---|
2010 net periodic benefit cost | | $ | 240 | | $ | 232 | | $ | 225 | |
Projected benefit obligation | | $ | 3,637 | | $ | 3,476 | | $ | 3,329 | |
| | | | | | | | | | |
Long Term Rate of Return | | 7.75% | | Actual 8.25% | | 8.75% | |
|---|
2010 net periodic benefit cost | | $ | 243 | | $ | 232 | | $ | 220 | |
Income Taxes
Deferred income taxes are determined based on the temporary differences between the financial reporting and tax bases of assets and liabilities, using enacted tax rates in effect for the year in which differences are expected to reverse. Estimating our tax liabilities involves judgments related to uncertainties in the application of complex tax regulations. We make certain estimates and judgments to determine tax expense for financial statement purposes as we evaluate the effect of tax credits, tax benefits and deductions, some of which result from differences in timing of recognition of revenue or expense for tax and financial statement purposes. Changes to these estimates may result in significant changes to our tax provision in future periods. Each fiscal quarter we reevaluate our tax provision and reconsider our estimates and our assumptions related to specific tax assets and liabilities, making adjustments as circumstances change.
Deferred Tax Asset Valuation Allowance
The Financial Accounting Standards Board's Statement of Financial Accounting Standards ("SFAS") No. 109, "Accounting for Income Taxes" ("SFAS 109"), requires that companies assess whether a valuation allowance should be recorded against deferred tax assets based on the likelihood that the benefits of the deferred tax assets will or will not ultimately be realized in future periods. In making such assessment, significant weight is to be given to evidence that can be objectively verified such as recent operating results and less consideration is to be given to less objective indicators such as future earnings projections. The Company has evaluated its deferred tax assets in accordance with these requirements.
A significant negative factor was the Company's three-year historical cumulative loss as of the end of the fourth quarter of fiscal 2009, compared to the size of deferred tax assets. The deferred tax assets
Table of Contents
in fiscal 2009 increased to $41,387,000 as compared to $21,556,000 in fiscal 2008. This increase primarily resulted from decreased pension asset values which in turn created increased pension plan contribution obligations. These considerations outweighed our ability to rely on projections of future taxable income and future appreciation of pension assets, and as a result the Company has established a valuation allowance against the deferred tax assets in the amount of $33,278,000, of this amount $19,663,000 was recorded as a current year tax expense and $13,615,000 was recorded as a reduction in other comprehensive income.
Post-Retirement Benefits
We sponsor a defined benefit post-retirement medical and dental plan that covers non-union employees and retirees, and certain union locals. The plan is contributory and retiree contributions are fixed at a current level. Our retiree medical plan is not funded and its liability was calculated using an assumed discount rate of 6.61% at June 30, 2009. We project an initial medical trend rate of 8% ultimately reducing to 5.5% in 4 years.
Effective January 1, 2008 the Company adopted a new plan for retiree medical benefits. The new plan is a cost sharing approach between the Company and covered employees and dependents in which the Company subsidizes a larger proportion of covered expenses for retirees who were long-term employees, and provides less coverage for retirees who were short-term employees. Additionally, the plan establishes a maximum Company contribution.
The effect of adopting this new plan was recorded on the effective date of the plan, January 1, 2008, as an increase in Accumulated Other Comprehensive Income of $16,739,000 (net of related tax effects of $10,571,000), and a reduction to the retiree medical liability of $27,311,000. The Accumulated Other Comprehensive Income amount is expected to be amortized as a reduction in expense over a period of 7 to 12 years. Amortization in fiscal 2009 was $712,000.
Share-Based Compensation
We apply the provisions of Statement of Financial Accounting Standards ("SFAS") No. 123 (revised 2004),"Share-Based Payment" ("SFAS 123R") for our share-based compensation. Under SFAS 123R, all share-based compensation cost is measured at the grant date, based on the fair value of the award, and is recognized as an expense in our consolidated statement of operations over the requisite service period. The process of estimating the fair value of share-based compensation awards and recognizing share-based compensation cost over the requisite service period involves significant assumptions and judgments. We estimate the fair value of stock option awards on the date of grant using the Black-Scholes option-valuation model which requires that we make certain assumptions regarding: (i) the expected volatility in the market price of our common stock, (ii) dividend yield, (iii) risk-free interest rates and (iv) the period of time employees are expected to hold the award prior to exercise (referred to as the expected holding period). In addition, SFAS 123R requires us to estimate the expected impact of forfeited awards and recognize share-based compensation cost only for those awards expected to vest. If actual forfeiture rates differ materially from our estimates, share-based compensation expense could differ significantly from the amounts we have recorded in the current period. We will periodically review actual forfeiture experience and revise our estimates, as necessary. We will recognize as compensation cost the cumulative effect of the change in estimated forfeiture rate on current and prior periods in earnings of the period of revision. As a result, if we revise our assumptions and estimates, our share-based compensation expense could change materially in the future.
Table of Contents
Liquidity and Capital Resources
Credit Facility
On March 2, 2009 we entered into a Loan and Security Agreement (the "Loan Agreement"), with Wachovia Bank, National Association, as Lender, providing for a $50 million senior secured revolving credit facility expiring in February 2012 to help finance the DSD Coffee Business acquisition and for general corporate purposes. The Loan Agreement contains a variety of restrictive covenants customary in an asset-based lending facility, including a fixed charge coverage requirement, and it places limits on capital expenditures and dividends. The Loan Agreement allows the Company to pay dividends at the current rate, subject to certain cash flow and liquidity requirements.
All outstanding obligations under the Loan Agreement are collateralized by perfected security interests in our assets, excluding the preferred stock held in investment accounts. The revolving line provides for advances of 85% of eligible accounts receivable and 65% of eligible inventory, as defined. The Loan Agreement has an unused commitment fee of 0.375%. The interest rate varies based upon line usage, borrowing base availability and market conditions. The range is PRIME + 0.25% to PRIME + 0.75% or LIBOR + 2.25% to LIBOR + 2.75%, subject to a minimum for LIBOR based advances of 3.25%. The interest rate was 3.75% at June 30, 2009.
We are in compliance with all restrictive covenants and limitations as of June 30, 2009 and anticipate being in compliance with all restrictive covenants for the foreseeable future. On June 30, 2009 borrowings under the credit facility were $16.2 million and we had excess availability under the credit facility of $33.8 million. As of September 3, 2009, approximately $9 million was outstanding under this credit facility.
Liquidity
The continued weakness in the economy and the sustained decline in the housing market have been ablekept pressure on the financial markets and reduced the value and liquidity of the preferred stock we hold. In order to maintainhave sufficient liquidity to complete the acquisition of the DSD Coffee Business without selling our preferred stock investments, we obtained a strong$50 million senior secured revolving line of credit with Wachovia Bank described above. Although we expect cost reductions and other positive synergies from integrating the DSD Coffee Business with our operations, the timing of these improvements is uncertain. We believe this credit facility, in addition to our other liquid assets, provides sufficient capital resources and flexibility for the next twelve months to allow us to make investments in the DSD Coffee Business, fund integration expenses, meet necessary working capital position,requirements and believe thatimplement our business plan without relying solely on cash flow from operations. Future liquidity, both short and long term, cash requirements willcan be providednegatively affected by then current economic conditions.
In addition to our acquisition of the DSD Coffee Business described above, during fiscal 2009 we continued to invest in our plants and expand our operations. These additional capital expenditures were approximately $38,901,000 and included the following:
In August 2008, we relocated CBI's operations to the new CBI headquarters and manufacturing plant in Portland, Oregon. This facility was built with funds derived from internal sources. The total capitalized cost of the new CBI plant and equipment was approximately $22,306,000, of which $11,243,000 was incurred in fiscal 2009.
We do nothave invested a total of $2,910,000 for two new roasters and associated production and packaging equipment for our Torrance facility, of which $1,664,000 was incurred in in fiscal 2009. The roasters have arrived but installation has been delayed due to delays in the regulatory approval process. We expect to relycomplete this project in fiscal 2010 at an additional cost of approximately $6,000,000.
Table of Contents
We completed the implementation of our mobile sales software in fiscal 2009 at a total cost of approximately $3,084,000 of which $2,175,000 was incurred in fiscal 2009. We expect to implement the same software across the DSD Coffee Business sales network during fiscal 2010.
In addition to the above, on banks orFebruary 28, 2009, we acquired the DSD Coffee Business and paid approximately $48.3 million consisting of $16.1 million in cash, $29.5 million in borrowings from the revolving credit facility, and $2.7 million in acquisition-related costs.
Our expected capital expenditures for fiscal 2010 include completion of the installation of the two roasters and other third parties forproduction equipment at an approximate additional cost of $6,000,000, deployment of our working capital needs.mobile sales systems to the route operations of the DSD Coffee Business and expenditures to replace normal wear and tear of coffee brewing equipment, vehicles and machinery and equipment.
Our working capital is composedcomprised of the following:
| | | June 30, | | | June 30, | |
|---|
| | 2006 | | 2005 | | 2004 | | | 2009 | | 2008 | | 2007 | |
|---|
| | (In thousands) | | | (In thousands)
| |
|---|
Current assets | | $ | 246,808 | | $ | 245,219 | | $ | 252,720 | | | $ | 186,546 | | $ | 217,750 | | $ | 239,362 | |
Current liabilities | | $ | 16,578 | | $ | 20,693 | | $ | 21,189 | | | 76,457 | | 28,909 | | 27,096 | |
| | | | | | | | | |
Working capital | | $ | 230,230 | | $ | 224,526 | | $ | 231,531 | | | $ | 110,088 | | $ | 188,841 | | $ | 212,266 | |
Capital expenditures | | $ | 12,840 | | $ | 8,832 | | $ | 7,683 | | | $ | 38,901 | | $ | 24,293 | | $ | 12,485 | |
Purchase of business | | | $ | 48,287 | | $ | — | | $ | 23,167 | |
Dividends paid | | | $ | 6,631 | | $ | 6,670 | | $ | 6,142 | |
At June 30, 20062009, other than those described above, we had no major commitments for new capital expenditures.
Results of Operations
Fiscal Years Ended June 30, 20062009 and 20052008
Overview
Management Fiscal 2009 has been another year of acquisition for us as we acquired the DSD Coffee Business in February 2009, and a number of shortyear in which we continued integrating CBI (acquired in April 2007) and long term initiatives underway designedmade extensive plans for integrating the DSD Coffee Business into our operations. Our sales revenue grew to strengthen$341.7 million in fiscal 2009 from $266.5 million in fiscal 2008, we acquired over 2,000 new SKU's and over 60 trademarks, tradenames and service marks including the Company’s salesmajor regional brands MCGARVEY®, CAIN'S®, IRELAND®, JUSTIN LLOYD®, METROPOLITAN®, PREBICA®, WECHSLER®, WORLD'S FINEST® and distribution networkCAFÉ ROYAL®, and improve sales. Our efforts are focused primarily on enhancingthe national brand SUPERIOR®, broadened and diversified our brand identification, expanding our product line and customer base and improving our sales and distribution efficiency. Our initiatives include:
· Promotion of our BRAND.
· We have designed and ordered new packaging for our entire product line. The updated designs employ the use of bright colors to better appeal to modern tastes. The roll-out for the new packaging is expected to begin in October 2006.
· We have designed, and areinclude a major presence in the process of producinggaming industry as well as significant national chain accounts, and distributing new point of sale marketing materials to helpexpanded geographically from our customers increase sales of our products. Many of these materials were distributed to customers during fiscal 2006 and others will be distributed in connection with the new packaging roll-out.
· We are promoting our brand and product line in an expanded trade show schedule throughout ourold 28 state marketing area to highlight the “new spirit” our packaging represents.into all 48 contiguous states.
· Introduction of New Products.
· During fiscal 20062010 we developed a varietyplan to complete the post-acquisition integration of new products designed to appeal to both new and existing customers, including horchata (a sweet rice drink flavored with cinnamon and almond), fruit smoothies (iced beverages), an expanded line of teas, liquid coffee and some seasonal products (pumpkin pie cappuccino). We believe these new products afford us with an opportunity to engage our customers and cross-sell other products and share ideas for future new products.
· Expansion of Customer Base.
· Inthe DSD Coffee Business in an effort to expandrealize the selling and operating efficiencies of the combined organization through consolidation of product offerings and SKU's, streamlining of routes and distribution logistics, and consolidation of warehouses and distribution centers, with an expanded, customer-focused organization enabled by enhanced tools and training. We also intend to continue our customer base we have createdintegration efforts with respect to CBI, acquired in April 2007. These integration efforts include the creation of a National Accountsnew national sales organization, as well as a national coffee brewing equipment service organization to solicitenable us to better serve the needs of our larger, customers and national accounts. This group is currently comprisedgeographically diverse customer base.
Table of 15 professionals who are working from our existing branch facilities to reach potential customers throughout the country.Contents
·Operations Improved Sales and Distribution Efficiency.
· In an effort to cut costs and improve our Net sales and distribution efficiency we have evaluated our branches, routes and sales staff responsibilities. In connection with these efforts we have reduced staffing and consolidated routes in certain areas, while increasing staffing in areas where we are experiencing growth.
· During fiscal 2007 we expect to implement new Route Sales application software to further enhance our ability to evaluate customer, product and route profitability.
Management continues to concentrate on improving our gross profit margins and controlling our selling and general and administrative expenses. Although we were able to maintain gross profit margins in fiscal 2006,2009 increased $75,239,000 or 28% to $341,724,000 from $266,485,000 in fiscal 2008. Approximately 81% of this increase resulted from the addition of DSD Coffee Business net sales beginning on March 1, 2009. Non-DSD net sales increased $14,541,000 or 5% in fiscal 2009 as compared to fiscal 2005, inflationary pressures on2008. Unit sales increased approximately 35% in fiscal 2009 as compared to fiscal 2008, and approximately 54% of this increase resulted from the cost of our raw materials and packaging supplies remains a threat to our ability to maintain these margins in the future. Despite efforts to reduce operating costs during fiscal 2006, certain expenses are beyond our control, such as gasoline and diesel prices which directly impact our distribution costs. Moreover, during fiscal 2006 we also experienced
an increase of approximately $1,000,000 in compensation expenses associated with the costaddition of the National Accounts organization. We continue to evaluate all departments in an effort to eliminate unnecessary procedures and staff and align needed staff skills to match business requirements through re-training or new hires.DSD Coffee Business.
Comparative Information
Net sales in fiscal 2006 increased $9,033,000 or 5% to $207,453,000 from $198,420,000 in fiscal 2005, primarily because of higher sales prices. Programs to enhance sales began during fiscal 2005 and continue to be deployed as discussed above.
Cost of goods sold in fiscal 20062009 increased $34,435,000, or 23%, to $84,910,000,$181,508,000, or 41%53% of sales, as compared to $82,964,000,from $147,073,000, or 42%55% of sales, in fiscal 2005. Although we stabilized our margins2008. Approximately 87% of this increase resulted from the addition of the DSD Coffee Business. Our annual LIFO adjustment for inventory on hand at the end of fiscal 2009 increased cost of goods sold by $1,508,000 compared to $5,832,000 in fiscal 2006 compared to2008. In a rising market LIFO costs represent replacement costs of inventory, not actual cost, and in fiscal 2005,2009 we added additional inventory with the volatility of green coffee prices, higher prices on a variety of raw materials and product packaging and strong competition have restricted our ability to return to previous gross profit margins. We continue to seek alternative and competitive sources of raw materials, packaging supplies and other key cost components in an effort to improve our profit margins. There can be no assurance that such efforts will be successful.
The average closing price of green coffee nearby contract for eachpurchase of the last three fiscal years, as compiled by the New York BoardDSD Coffee Business. Cost of Trade, is presented in the following table.
Comparison of Average Periodic Green Coffee Prices
| | Twelve months ended June 30, | |
| | 2006 | | 2005 | | 2004 | |
Average coffee price per pound | | $ | 1.03 | | $ | 0.97 | | $ | 0.68 | |
Change from prior year | | 6 | % | 43 | % | 14 | % |
| | | | | | | | | | |
Selling, General and Administrative Expenses in fiscal 2006 increased $3,469,000 or 3% to $125,508,000 from $122,039,000 in fiscal 2005. This increase is primarily attributed to higher coffee brewing equipment included in cost of good sold for the fiscal year ended June 30, 2009 was $13,140,000 compared to $20,400,000 for the fiscal year ended June 30, 2008. In years prior to fiscal 2007, these costs largelywere presented as selling expenses. This change reduces reported gross profit in the years presented by these amounts but has no impact on net income, total assets, or cash flows in any year.
Gross profit in fiscal 2009 increased $40,804,000 or 34% to $160,217,000 from $119,412,000 in fiscal 2008. Approximately 76% of this change resulted from the addition of the DSD Coffee Business.
Operating expenses in fiscal 2009 increased $45,363,000, or 35%, to $175,419,000, or 51% of sales, from $130,056,000, or 49% of sales, in fiscal 2008. Approximately 54% of this increase reflects the addition of the DSD Coffee Business, and approximately 16% of this increase reflects expenses associated with the relocation of CBI's operations to the new products, higher gasoline and dieselmanufacturing facility in Portland, Oregon, together with associated start-up costs and increased California workers’ compensation expense, offset by declinesrelated depreciation and amortization from the plant investment. Additional increases in self-insured employee medical costs, IT project consulting costsoperating expenses in fiscal 2009 include approximately $2,000,000 of additional overhead associated with the operation of the DSD Coffee Business from March 1, 2009 through the end of fiscal 2009 and SOX compliance consulting and auditing costs. Continuing developmentone-time costs of our multi-year information systems project are currently capitalized. The new sales system implementation has been delayedapproximately $2,100,000 related to CBI's move and development costs associated with that project will begin depreciatingplant start-up.
For the reasons noted above, loss from operations in fiscal 2007.2009 increased to ($15,203,000) from ($10,644,000) in fiscal 2008.
Principal Changes in Selling, General and Administrative Expenses
| | For year ended June 30, | |
| | 2006 | | 2005 | |
| | (In thousands) | |
Coffee brewing equipment | | $ | 11,376 | | | $ | 9,106 | | |
Self-insured employee medical costs | | 6,883 | | | 6,334 | | |
Fuel costs | | 6,943 | | | 5,638 | | |
Workers’ compensation costs | | 3,028 | | | 1,495 | | |
IT project depreciation | | 3,915 | | | 3,228 | | |
IT project consulting | | 682 | | | 2,272 | | |
SOX compliance consulting/auditing costs | | 430 | | | 1,100 | | |
| | | | | | | | | |
Total other (expense) income
Total other (expense) income, (expense)improved in fiscal 2006 was $6,970,000 as compared2009 to ($4,746,000)3,785,000) from ($4,679,000) in fiscal 2005.2008. This increase is primarily the result of (1) highersmaller realized and unrealized investment losses in fiscal 2009 compared to fiscal 2008, partially offset by lower dividend and interest rates duringincome. Other, net (expense) income was ($8,248,000) in fiscal 2006 and (2)2009 as compared to ($12,343,000) in fiscal 2008. Losses in other, net (expense) income incurred in fiscal 2009 are primarily the reductionresult of
losses associated with higher green coffee prices during conditions in the second quarter of fiscal 2005U.S. financial markets which resulted in a decreaselower expense in the value of green coffee futures and options used by the Companyfiscal 2009 compared to hedge against a decline in commodity prices. Other, net (expense) during fiscal 2005 consisted of net realized and unrealized coffee trading losses of ($12,992,000), offset by net gains on other investments.2008.
Net Loss
As a result of the forgoingabove operating factors, net income for fiscal 2006 was $4,756,000 as comparedloss increased to a net loss of ($5,427,000) in fiscal 2005. Net income33,270,000) or ($2.29) per common share, was $0.34including the reserve against deferred tax assets of ($19,660,000) or ($1.35) in fiscal 2006 as compared to a net loss2009, from ($7,924,000) or ($0.55) per common share of ($0.40) in fiscal 2005.2008.
Table of Contents
Fiscal Years Ended June 30, 20052008 and 20042007
Overview
Fiscal 2008 was a year in which we devoted substantial resources to the Company's future. These resources included investment in our plants and our national sales organization. During fiscal 2008 we invested approximately $11,063,000 in the new CBI plant and related equipment. We ordered two new roasters and associated production equipment for our Torrance facility and continued to implement our mobile sales software across our sales network.
Operations
Net sales in fiscal 20052008 increased $4,831,000$50,226,000, or 2%23%, to $198,420,000$266,485,000 from $193,589,000$216,259,000 in fiscal 2004, primarily because2007. Approximately 70% of higher sales prices of roast coffee. During fiscal 2005 we initiated a number of programs intended to improve sales. In an effort to advance our image more clearly and aggressively with current and potential customers we redesigned our merchandising and point of sale materials and set an aggressive trade show schedule with a newly designed booth. We assembled a team of sales professionals drawnthis increase resulted from the ranksaddition of our routeCBI in fiscal 2008. Non-CBI revenue increased $14,841,000, or 7%, in fiscal 2008 as compared to fiscal 2007. Non-CBI unit sales organizationincreased 5% in fiscal 2008 as compared to solicit new large customer accounts. We developed some new products that we believe will appeal to both new and existing customers.fiscal 2007.
Cost of goods sold in fiscal 20052008 increased 16%$38,902,000 or 36% to $82,964,000$147,073,000 from $108,171,000 in fiscal 2007. Approximately 58% of this increase resulted from the addition of CBI. Non-CBI cost of goods sold increased $16,297,000, or 42% of sales,16%, in fiscal 2008 as compared to $71,405,000, or 37%fiscal 2007. This increase was primarily the result of sales, in fiscal 2004. A volatile, sustained increase in green coffee prices in the second and third quarters of fiscal 2005 resulted in a decrease in profit margins on roast coffee during those periods. We attempt to pass on this cost increase to our customers through higher roast coffee prices, but sales price increases lag increases in green coffee costs and our sales price increases did not take effect until June 2005.increased inventory levels. Our annual LIFO adjustment for inventory on hand at the end of fiscal 2008 added $5,832,000 to cost of goods sold. Additionally, volatile price increases cannot, because of competition and market conditions, always be passed on to our customers.
Selling, General and Administrative Expenses induring fiscal 2005 increased 3% to $122,039,000 from $118,421,000 in fiscal 2004. This increase is primarily attributed to costs associated with the employee medical program,2008 the cost of the ESOP, the project-related costs ofproviding coffee brewing equipment and service to our multi-year information systems project and consulting costs related to compliance with SOX Section 404 as summarized in the following table.
Principal Changes in Selling, General and Administrative Expenses
| | June 30, | |
| | 2005 | | 2004 | |
| | (In thousands) | |
Employee medical costs | | $ | 6,945 | | $ | 6,091 | |
ESOP | | 7,163 | | 6,298 | |
IT project expenses | | 3,035 | | 3,400 | |
IT project depreciation | | 3,228 | | 1,467 | |
SOX compliance | | 1,100 | | 360 | |
| | | | | | | |
Another result of the dramatic increase in green coffee costs during fiscal 2005 was a realized loss on green coffee futures and options used by the Company to hedge against a decline in commodity prices. Total other (expense) was ($4,746,000) in fiscal 2005 as compared to Total other income of $12,219,000 in fiscal 2004. Other, net (expense) was ($10,887,000) for fiscal 2005 as compared to Other, net income of $6,305,000 for fiscal 2004.
Higher green coffee prices during fiscal 2005 resulted in a decrease in the value of green coffee futures and options used by the Company to hedge against a decline in commodity prices. Other, net
(expense) income during fiscal 2005 included realized coffee trading gains of $3,655,000 offset by realized coffee trading losses of ($16,764,000).
Rising interest rates resulted incustomers increased interest income in fiscal 2005, but the January 2004 purchase of $111 million of Company stock from the Crowe family reduced the amount available for investment in fiscal 2005,$1,800,000, or 9%, as compared to fiscal 2004.2007 costs. Gross profit in fiscal 2008 increased $11,324,000, or 10%, reflecting $12,780,000 gross profit added by CBI. In general, higher commodity prices and higher energy costs put pressure on our profit margins in fiscal 2008. There were many reasons for the higher costs, including higher demand for oil and a weak dollar.
Operating expenses in fiscal 2008 increased $17,892,000, or 16%, to $130,056,000 from $112,164,000 in fiscal 2007. This increase primarily reflected the addition Other,of CBI in the amount of $16,900,000, including amortization of intangibles connected with the CBI Acquisition in the amount of $1,644,000. The non-CBI related increase in operating expenses in fiscal 2008 was approximately 1%.
For the reasons noted above, loss from operations in fiscal 2008 increased to ($10,644,000) from ($4,076,000) in fiscal 2007 primarily due to the significant increase in cost of goods sold and our inability to pass those increases on to our customers in the form of higher selling prices.
Total other (expense) income
Total other (expense) income decreased to an expense of ($4,679,000) in fiscal 2008 as compared to income of $10,024,000 in fiscal 2007. This was primarily the result of a loss in other, net (expense) income in fiscal 20042008 of ($12,343,000) as compared to income of $1,233,000 in fiscal 2007. Net realized and unrealized losses from investments in fiscal 2008 were ($13,992,000) as compared to net realized and unrealized losses in fiscal 2007 of ($1,233,000).
The change in other, net (expense) income was primarily the result of conditions in the U.S. financial markets. During fiscal 2008 the weakness of the economy and the dramatic decline of the U.S. housing market put pressure on the valuations of the preferred stock we hold. Since approximately 85% of preferred stock issuers are financial institutions, the U.S. sub-prime mortgage crisis hurt the values of our preferred stock portfolio. Selling pressure from leveraged investors who needed liquidity and a new supply of preferred issues taking advantage of lower dividend rates resulted in a downward pressure on values. Even though only 34% of our portfolio was invested in financials, all preferred stocks were affected. Our holdings included $5,778,000such financial issuers as Merrill Lynch, Lehman Brothers and MetLife. The weakness in the financial markets was dramatic, and at June 30, 2008 we had unrealized losses in preferred stock of non-recurring income.$9,472,000. Part of our preferred stock investment program
Table of Contents
included a hedge against the risk of rising long-term interest rates using purchased Treasury put options. This part of the program suffered during fiscal 2008 as the investor flight to quality distorted the historical relationship between Treasury instruments and preferred stock, leading to hedge losses not offset by portfolio gains. Hedge losses in fiscal 2008 were $3,555,000.
Net Loss
As a result of the forgoingabove factors, the net loss for fiscal 20052008 was ($5,427,000)7,924,000) or ($0.55) per share, as compared to net income $12,687,000 for fiscal 2004. Net lossof $6,815,000 or $0.48 per common share was ($0.40) in fiscal 2005 as compared to net income per common share of $0.81 in fiscal 2004.2007.
Contractual Obligations
With the acquisition of DSD Coffee Business, the Company assumed some of the operating lease obligations associated with the acquired vehicles. The Company also refinanced some of the existing leases and entered into new leases for certain vehicles. Pursuant to SFAS 13, "Accounting for Leases", the Company determined that the 98 new vehicle leases met the criteria for classification as capital leases. The following table contains supplemental information regarding total contractual obligations as of June 30, 2006.2009, including capital leases (including imputed interest):
| | Total | | Less Than
One Year | | 2-3 Years | | 4-5 Years | | More Than
5 years | |
| | (In thousands) | |
Operating lease obligations | | $ | 1,551 | | | $ | 739 | | | | $ | 685 | | | | $ | 127 | | | | — | | |
| | | | | | | | | | | | | | | | | | | | | | | |
| | | | | | | | | | | | | | | | |
| | Payment due by period (in thousands) | |
|---|
| | Total | | Less Than
One Year | | 1-3 Years | | 3-5 Years | | More Than
5 Years | |
|---|
Operating lease obligations | | $ | 14,742 | | $ | 5,878 | | $ | 5,629 | | $ | 2,926 | | $ | 309 | |
Capital lease obligations | | | 1,309 | | | 958 | | | 351 | | | — | | | — | |
Pension plan obligations | | | 54,690 | | | 4,290 | | | 9,210 | | | 10,250 | | | 30,940 | |
Revolving credit facility | | | 16,182 | | | 16,182 | | | — | | | — | | | — | |
| | | | | | | | | | | | |
| | $ | 86,923 | | $ | 27,308 | | $ | 15,190 | | $ | 13,876 | | $ | 31,439 | |
| | | | | | | | | | | | |
Off-Balance Sheet Arrangements
The Company has We have no off-balance sheet arrangements.
Item 7A. QualitativeQuantitative and QuantitativeQualitative Disclosures About Market Risk
Interest Rate Risk
We are exposed to market value risk arising from changes in interest rates on our securities portfolio. Our portfolio of investment grade money market instruments can include at any given time discount commercial paper, medium term notes, federal agency issues and treasury securities. As of June 30, 2006, over 90% of these funds were invested in U.S. Treasury securities and approximately 43% of these issues have maturities shorter than 90 days. This portfolio’s interest rate risk is not hedged and its average maturity is approximately 80 days. A 100 basis point move in the general level of interest rates would result in a change in the market value of the portfolio of approximately $1,150,000.
Our portfolio of preferred securities includeshas sometimes included investments in derivatives that provide a natural economic hedge of interest rate risk. We review the interest rate sensitivity of these securities and (a) may enter into “short positions”"short positions" in futures contracts on U.S. Treasury securities or (b) may hold put options on such futures contracts in order to reduce the impact of certain interest rate changes on such preferred stocks. Specifically, we attempt to manage the risk arising from changes in the general level of interest rates. We do not transact in futures contracts or put options for speculative purposes.
The following table demonstrates the impact of varying interest rate changes based on the preferred stock holdings, futures and options positions, and market yield and price relationships at June 30, 2006.2009. This table is predicated on an instantaneous change in the general level of interest rates and assumes predictable relationships between the prices of preferred securities holdings, the yields on U.S. Treasury securities and related futures and options.
The number and type of futures and options contracts entered into depends on, among other items, the specific maturity and issuer redemption provisions for each preferred stock held, the slope of the Treasury yield curve, the expected volatility of U.S. Treasury yields, and the costs of using futures
Table of Contents
and/or options. At June 30, 2009 we had no futures contracts or put options designated as interest rate risk hedges.
| | | Market Value at June 30, 2006 | | Change in Market | | | | | | | | | | | | | | |
| | | Preferred | | Futures and | | Total | | Value of Total | | | Market Value at June 30, 2009 | |
| |
|---|
Interest Rate Changes | | | | Securities | | Options | | Portfolio | | Portfolio | | | Preferred
Securities | | Futures and
Options | | Total
Portfolio | | Changes in Market
Value of Total
Portfolio | |
|---|
| | | (In thousands) | | | (In thousands)
| |
|---|
-150 basis points | | | $ | 68,248 | | | | $ | 0 | | | $ | 68,248 | | | $ | 5,440 | | | |
-100 basis points | | | $ | 66,355 | | | | $ | 2 | | | $ | 66,357 | | | $ | 3,549 | | | |
-150 basis points | | | $ | 44,089 | | $ | — | | $ | 44,089 | | $ | 1,623 | |
-100 basis points | | | $ | 43,846 | | $ | — | | $ | 43,846 | | $ | 1,380 | |
Unchanged | Unchanged | | | $ | 61,716 | | | | $ | 1,092 | | | $ | 62,808 | | | $ | 0 | | | | $ | 42,466 | | $ | — | | $ | 42,466 | | $ | — | |
+100 basis points | +100 basis points | | | $ | 56,475 | | | | $ | 5,880 | | | $ | 62,355 | | | $ | (453 | ) | | | $ | 39,951 | | $ | — | | $ | 39,951 | | $ | (2,515 | ) |
+150 basis points | +150 basis points | | | $ | 53,907 | | | | $ | 8,804 | | | $ | 62,711 | | | $ | (97 | ) | | | $ | 38,560 | | $ | — | | $ | 38,560 | | $ | (3,906 | ) |
|
Our revolving line of credit with Wachovia Bank is at a variable rate. The interest rate varies based upon line usage, borrowing base availability and market conditions. The range is PRIME + 0.25% to PRIME + 0.75% or LIBOR + 2.25% to LIBOR + 2.75%, subject to a minimum for LIBOR based advances of 3.25%. The balance outstanding as of June 30, 2009 was $16,182,000 and the interest rate at June 30, 2009 was 3.75%.
The following table demonstrates the impact of interest rate changes on our interest expense on the revolving credit facility for a full year based on the outstanding balance and interest rate as of June 30, 2009:
| | | | | | | |
Interest Rate Changes | | Interest Rate | | Annual Interest Expense | |
|---|
| |
| | (In thousands)
| |
|---|
-150 basis points | | | 2.25 | % | $ | 364 | |
-100 basis points | | | 2.75 | % | $ | 445 | |
Unchanged | | | 3.75 | % | $ | 607 | |
+100 basis points | | | 4.75 | % | $ | 768 | |
+150 basis points | | | 5.25 | % | $ | 850 | |
Commodity Price Risk
We are exposed to commodity price risk arising from changes in the market price of green coffee. We price ourgreen coffee inventory on the LIFOlast-in, first-out (LIFO) basis. In the normal course of business we hold a large green coffee inventory and enter into forward commodity purchase agreements with suppliers. We are subject to price risk resulting from the volatility of green coffee prices. Volatile price increases cannot, because ofDue to competition and market conditions, volatile price increases cannot always be passed on to our customers. From time to time the Company willwe may hold a mix of futures contracts and options to help hedge against volatile green coffee price decreases. Gains and losses on these derivative instruments are realized immediately in Other,"Other, net (expense) income."
On June 30, 20062009 we had no open hedge derivative contracts, and our entire exposure to commodity risk was in the potential change of our inventory value resulting from changes in the market price of green coffee. The following table demonstrates the impact of changes in market value of coffee cost on market value of coffee forward purchase contracts:
| | | | | | | | | | | | | | | | |
| | Market Value (in thousands) | |
| |
| |
|---|
| | Change in Market Value | |
|---|
| | Coffee
Inventory | | Futures &
Options | |
| |
|---|
Coffee Cost Change | | Total | | Derivatives | | Inventory | |
|---|
-10% | | $ | 32,000 | | $ | (101 | ) | $ | 31,899 | | $ | (101 | ) | $ | (3,428 | ) |
unchanged | | $ | 35,428 | | $ | 460 | | $ | 35,888 | | $ | — | | $ | — | |
10% | | $ | 39,000 | | $ | 101 | | $ | 39,101 | | $ | 101 | | $ | 3,572 | |
Table of Contents
Item 8. Financial Statements and Supplementary Data
18Table of Contents
Report of Independent Registered Public Accounting Firm
The Board of Directors and Stockholders of
Farmer Bros. Co. and SubsidiarySubsidiaries
We have audited the accompanying consolidated balance sheets of Farmer Bros. Co. and SubsidiarySubsidiaries as of June 30, 20062009 and 2005,2008, and the related consolidated statements of operations, stockholders’stockholders' equity and cash flows for each of the three years in the period ended June 30, 2006.2009. These financial statements are the responsibility of the Company’sCompany's management. Our responsibility is to express an opinion on these financial statements based on our audits.
We conducted our audits in accordance with the standards of the Public Company Accounting Oversight Board (United States). Those standards require that we plan and perform the audit to obtain reasonable assurance about whether the financial statements are free of material misstatement. An audit includes examining, on a test basis, evidence supporting the amounts and disclosures in the financial statements. An audit also includes assessing the accounting principles used and significant estimates made by management, as well as evaluating the overall financial statement presentation. We believe that our audits provide a reasonable basis for our opinion.
In our opinion, the financial statements referred to above present fairly, in all material respects, the consolidated financial position of Farmer Bros. Co. and SubsidiarySubsidiaries at June 30, 20062009 and 2005,2008, and the consolidated results of their operations and their cash flows for each of the three years in the period ended June 30, 2006,2009, in conformity with U.S. generally accepted accounting principles.
We also have audited, in accordance with the standards of the Public Company Accounting Oversight Board (United States), the effectiveness of Farmer Bros. Co. and Subsidiary’sSubsidiaries' internal control over financial reporting as of June 30, 2006,2009, based on criteria established in Internal Control-Integrated Framework issued by the Committee of Sponsoring Organizations of the Treadway Commission and our report dated September 7, 200614, 2009 expressed an unqualified opinion thereon.
| 
| |
Los Angeles, California
| |
September 7, 2006
|
/s/ Ernst & Young LLP |
Los Angeles, California
September 14, 2009
19Table of Contents
FARMER BROS. CO.
CONSOLIDATED BALANCE SHEETS
(Dollars in thousands, except share and per share data)
| | June 30, 2006 | | June 30, 2005 | |
ASSETS | | | | | | | | | |
Current assets: | | | | | | | | | |
Cash and cash equivalents | | | $ | 5,333 | | | | $ | 9,814 | | |
Short term investments | | | 176,336 | | | | 171,055 | | |
Accounts and notes receivable, net | | | 13,250 | | | | 15,485 | | |
Inventories | | | 45,008 | | | | 41,086 | | |
Income tax receivable | | | — | | | | 4,064 | | |
Deferred income taxes | | | 3,300 | | | | — | | |
Prepaid expenses | | | 3,581 | | | | 3,715 | | |
Total current assets | | | $ | 246, 808 | | | | $ | 245,219 | | |
Property, plant and equipment, net | | | 46,385 | | | | 42,671 | | |
Other assets | | | 17,427 | | | | 21,268 | | |
Deferred income taxes | | | 6,617 | | | | 5,765 | | |
Total assets | | | $ | 317,237 | | | | $ | 314,923 | | |
LIABILITIES AND STOCKHOLDERS’ EQUITY | | | | | | | | | |
Current liabilities: | | | | | | | | | |
Accounts payable | | | $ | 4,197 | | | | $ | 7,852 | | |
Accrued payroll expenses | | | 6,235 | | | | 7,590 | | |
Deferred income taxes | | | — | | | | 321 | | |
Other | | | 6,146 | | | | 4,930 | | |
Total current liabilities | | | $ | 16,578 | | | | $ | 20,693 | | |
Accrued postretirement benefits | | | $ | 31,436 | | | | $ | 29,344 | | |
Total liabilities | | | $ | 48,014 | | | | $ | 50,037 | | |
Commitments and contingencies | | | | | | | | | |
Stockholders’ equity: | | | | | | | | | |
Common stock, $1.00 par value, authorized 25,000,000 shares; 16,075,080 issued and outstanding | | | $ | 16,075 | | | | $ | 16,075 | | |
Additional paid-in capital | | | 31,518 | | | | 32,292 | | |
Retained earnings | | | 271,733 | | | | 272,791 | | |
Unearned ESOP shares | | | (50,103 | ) | | | (55,415 | ) | |
Less accumulated comprehensive loss | | | — | | | | (857 | ) | |
Total stockholders’ equity | | | $ | 269,223 | | | | $ | 264,886 | | |
Total liabilities and stockholders’ equity | | | $ | 317,237 | | | | $ | 314,923 | | |
| | | | | | | | | |
| | June 30, 2009 | | June 30, 2008 | |
|---|
ASSETS | | | | | | | |
Current assets: | | | | | | | |
| | Cash and cash equivalents | | $ | 20,038 | | $ | 9,973 | |
| | Short term investments | | | 42,926 | | | 113,286 | |
| | Accounts and notes receivable, net | | | 45,744 | | | 19,856 | |
| | Inventories | | | 68,961 | | | 54,253 | |
| | Income tax receivable | | | 4,163 | | | 2,879 | |
| | Deferred income taxes | | | 1,089 | | | 7,485 | |
| | Prepaid expenses | | | 3,625 | | | 10,018 | |
| | | | | | |
| | | Total current assets | | | 186,546 | | | 217,750 | |
| | | | | | |
Property, plant and equipment, net | | |
112,063 | | |
69,065 | |
Goodwill and other intangible assets, net | | | 28,758 | | | 17,568 | |
Other assets | | | 1,758 | | | 746 | |
Deferred income taxes | | | 892 | | | 7,855 | |
| | | | | | |
| | | Total assets | | $ | 330,017 | | $ | 312,984 | |
| | | | | | |
LIABILITIES AND STOCKHOLDERS' EQUITY | | | | | | | |
Current liabilities: | | | | | | | |
| | Accounts payable | | $ | 34,627 | | $ | 12,169 | |
| | Accrued payroll expenses | | | 13,121 | | | 8,449 | |
| | Short term borrowings under revolving credit facility | | | 16,182 | | | — | |
| | Short term obligations under capital leases | | | 908 | | | — | |
| | Deferred state taxes | | | 2,198 | | | — | |
| | Other liabilities | | | 9,421 | | | 8,291 | |
| | | | | | |
| | | Total current liabilities | | | 76,457 | | | 28,909 | |
| | Accrued postretirement benefits | | | 18,259 | | | 17,620 | |
| | Other long term liabilities-capital leases | | | 344 | | | — | |
| | Accrued pension liabilities | | | 38,468 | | | — | |
| | | | | | |
| | | Total liabilities | | $ | 133,528 | | $ | 46,529 | |
| | | | | | |
Commitments and contingencies (Note 14) | | | | | | | |
Stockholders' equity: | | | | | | | |
| | Preferred stock, $1.00 par value, 500,000 shares authorized and none issued | | $ | — | | $ | — | |
| | Common stock, $1.00 par value, 25,000,000 shares authorized; 16,078,111 and 16,075,080 issued and outstanding in 2009 and 2008, respectively | | | 16,078 | | | 16,075 | |
| | Additional paid-in capital | | | 31,135 | | | 30,612 | |
| | Retained earnings | | | 217,792 | | | 257,693 | |
| | Unearned ESOP shares | | | (33,604 | ) | | (38,529 | ) |
| | Less accumulated comprehensive (loss) income | | | (34,912 | ) | | 604 | |
| | | | | | |
| | | Total stockholders' equity | | $ | 196,489 | | $ | 266,455 | |
| | | | | | |
| | | Total liabilities and stockholders' equity | | $ | 330,017 | | $ | 312,984 | |
| | | | | | |
The accompanying notes are an integral part of these financial statements.
20
Table of Contents
FARMER BROS. CO.
CONSOLIDATED STATEMENTS OF OPERATIONS
(Dollars in thousands, except share and per share data)
| | Years ended June 30, | |
| | 2006 | | 2005 | | 2004 | |
Net sales | | $ | 207,453 | | $ | 198,420 | | $ | 193,589 | |
Cost of goods sold | | 84,910 | | 82,964 | | 71,405 | |
Gross profit | | $ | 122,543 | | $ | 115,456 | | $ | 122,184 | |
Selling expense | | 100,354 | | 92,112 | | 92,029 | |
General and administrative expenses | | 25,154 | | 29,927 | | 26,392 | |
Operating expenses | | $ | 125,508 | | $ | 122,039 | | $ | 118,421 | |
(Loss) income from operations | | $ | (2,965 | ) | $ | (6,583 | ) | $ | 3,763 | |
Other income (expense): | | | | | | | |
Dividend income | | 3,597 | | 3,420 | | 3,396 | |
Interest income | | 4,445 | | 2,721 | | 2,518 | |
Other, net (expense) income | | (1,072 | ) | (10,887 | ) | 6,305 | |
Total other income (expense) | | $ | 6,970 | | $ | (4,746 | ) | $ | 12,219 | |
Income (loss) before taxes | | 4,005 | | (11,329 | ) | 15,982 | |
Income tax (benefit) expense | | (751 | ) | (5,902 | ) | 3,295 | |
Net income (loss) | | $ | 4,756 | | $ | (5,427 | ) | $ | 12,687 | |
Net income (loss) per common share | | $ | 0.34 | | $ | (0.40 | ) | $ | 0.81 | |
Weighted average shares outstanding | | 13,890,609 | | 13,653,420 | | 15,576,450 | |
| | | | | | | | | | | | |
| | Years ended June 30, | |
|---|
| | 2009 | | 2008 | | 2007 | |
|---|
Net sales | | $ | 341,724 | | $ | 266,485 | | $ | 216,259 | |
Cost of goods sold | | | 181,508 | | | 147,073 | | | 108,171 | |
| | | | | | | | |
Gross profit | | | 160,216 | | | 119,412 | | | 108,088 | |
| | | | | | | | |
Selling expense | | |
138,876 | | |
98,918 | | |
83,943 | |
General and administrative expenses | | | 36,543 | | | 31,138 | | | 28,221 | |
| | | | | | | | |
Operating expenses | | | 175,419 | | | 130,056 | | | 112,164 | |
| | | | | | | | |
Loss from operations | | | (15,203 | ) | | (10,644 | ) | | (4,076 | ) |
| | | | | | | | |
Other (expense) income: | | | | | | | | | | |
| | Dividend income | | | 3,563 | | | 4,056 | | | 3,923 | |
| | Interest income | | | 1,236 | | | 3,608 | | | 5,768 | |
| | Interest expense | | | (335 | ) | | — | | | — | |
| | Other, net (expense) income | | | (8,248 | ) | | (12,343 | ) | | 1,233 | |
| | | | | | | | |
| | | Total other (expense) income | | | (3,784 | ) | | (4,679 | ) | | 10,924 | |
| | | | | | | | |
(Loss) income before taxes | | |
(18,987 |
) | |
(15,323 |
) | |
6,848 | |
Income tax (benefit) expense | | |
14,283 | | |
(7,399 |
) | |
33 | |
| | | | | | | | |
Net (loss) income | |
$ |
(33,270 |
) |
$ |
(7,924 |
) |
$ |
6,815 | |
| | | | | | | | |
Net (loss) income per common share | |
$ |
(2.29 |
) |
$ |
(0.55 |
) |
$ |
0.48 | |
| | | | | | | | |
Weighted average shares outstanding | | |
14,508,320 | | |
14,284,324 | | |
14,106,011 | |
Cash dividends declared per common share | | $ | 0.46 | | $ | 0.46 | | $ | 0.44 | |
The accompanying notes are an integral part of these financial statements.
21
Table of Contents
FARMER BROS. CO.
CONSOLIDATED STATEMENTS OF CASH FLOWS
(Dollars in thousands)
| | Years ended June 30, | |
| | 2006 | | 2005 | | 2004 | |
Cash flows from operating activities: | | | | | | | |
Net income (loss) | | $ | 4,756 | | $ | (5,427 | ) | $ | 12,687 | |
Adjustments to reconcile net income (loss) to net cash provided by operating activities: | | | | | | | |
Depreciation | | 8,963 | | 8,396 | | 7,098 | |
Deferred income taxes | | (5,001 | ) | (3,510 | ) | (1,536 | ) |
Gain on sales of assets | | (396 | ) | (100 | ) | (94 | ) |
ESOP compensation expense | | 4,538 | | 6,171 | | 5,516 | |
Net loss (gain) on investments | | 2,301 | | 11,571 | | (706 | ) |
Change in operating assets and liabilities: | | | | | | | |
Short term investments | | (7,582 | ) | (5,723 | ) | (12,914 | ) |
Accounts and notes receivable | | 2,235 | | (777 | ) | (759 | ) |
Inventories | | (3,922 | ) | (5,507 | ) | (877 | ) |
Income tax receivable | | 4,064 | | (3,656 | ) | 2,470 | |
Prepaid expenses and other assets | | 5,056 | | (637 | ) | 4,064 | |
Accounts payable | | (3,655 | ) | (1,737 | ) | 6,268 | |
Accrued payroll, expenses and other liabilities | | (139 | ) | 920 | | (762 | ) |
Accrued postretirement benefits | | 2,396 | | 2,126 | | 2,285 | |
Other long term liabilities | | — | | — | | (5,570 | ) |
Total adjustments | | $ | 8,858 | | $ | 7,537 | | $ | 4,483 | |
Net cash provided by operating activities | | $ | 13,614 | | $ | 2,110 | | $ | 17,170 | |
Cash flows from investing activities: | | | | | | | |
Purchases of property, plant and equipment | | (12,840 | ) | (8,832 | ) | (7,683 | ) |
Proceeds from sales of property, plant and equipment | | 559 | | 165 | | 132 | |
Net cash used in investing activities | | $ | (12,281 | ) | $ | (8,667 | ) | $ | (7,551 | ) |
Cash flows from financing activities: | | | | | | | |
Dividends paid | | (5,814 | ) | (5,436 | ) | (5,621 | ) |
ESOP contributions | | — | | — | | (32,412 | ) |
Proceeds from sale of short term investments | | — | | — | | 111,161 | |
Purchase of capital stock | | — | | — | | (111,161 | ) |
Sale of capital stock | | — | | — | | 31,235 | |
Net cash used in financing activities | | $ | (5,814 | ) | $ | (5,436 | ) | $ | (6,798 | ) |
Net (decrease) increase in cash and cash equivalents | | $ | (4,481 | ) | $ | (11,993 | ) | $ | 2,821 | |
Cash and cash equivalents at beginning of year | | 9,814 | | 21,807 | | 18,986 | |
Cash and cash equivalents at end of year | | $ | 5,333 | | $ | 9,814 | | $ | 21,807 | |
| | | | | | | | | | | | |
| | Years ended June 30, | |
|---|
| | 2009 | | 2008 | | 2007 | |
|---|
Cash flows from operating activities: | | | | | | | | | | |
| | Net income (loss) | | $ | (33,270 | ) | $ | (7,924 | ) | $ | 6,815 | |
Adjustments to reconcile net income (loss) to net cash provided by operating activities: | | | | | | | | | | |
| | Depreciation | | | 18,292 | | | 9,757 | | | 9,324 | |
| | Deferred income taxes | | | 15,556 | | | 719 | | | (8,141 | ) |
| | Gain on sales of assets | | | (46 | ) | | (1,325 | ) | | (244 | ) |
| | Share-based compensation expense | | | 5,452 | | | 5,501 | | | 5,168 | |
| | Net loss (gain) on investments | | | 8,989 | | | 13,992 | | | (819 | ) |
| | Change in operating assets and liabilities: | | | | | | | | | | |
| | | Short term investments | | | 61,371 | | | 30,772 | | | 19,104 | |
| | | Accounts and notes receivable | | | (25,888 | ) | | (2,205 | ) | | (675 | ) |
| | | Inventories | | | 1,730 | | | (9,257 | ) | | 4,200 | |
| | | Income tax receivable | | | (1,283 | ) | | (2,998 | ) | | — | |
| | | Prepaid expenses and other assets | | | 6,518 | | | 5,877 | | | 5,026 | |
| | | Accounts payable | | | 22,457 | | | 3,466 | | | (614 | ) |
| | | Accrued payroll, expenses and other liabilities | | | 3,776 | | | (1,655 | ) | | 5,634 | |
| | | Accrued postretirement benefits | | | 638 | | | (17,224 | ) | | 4,013 | |
| | | Other long term liabilities | | | 2,952 | | | — | | | — | |
| | | | | | | | |
Net cash provided by operating activities | | $ | 87,244 | | $ | 27,496 | | $ | 48,791 | |
Cash flows from investing activities: | | | | | | | | | | |
| | Acquisition of businesses, net of cash acquired | | | (48,287 | ) | | — | | | (23,167 | ) |
| | Purchases of property, plant and equipment | | | (38,901 | ) | | (24,852 | ) | | (12,485 | ) |
| | Proceeds from sales of property, plant and equipment | | | 605 | | | 1,413 | | | 256 | |
| | | | | | | | |
Net cash used in investing activities | | $ | (86,583 | ) | $ | (23,439 | ) | $ | (35,396 | ) |
Cash flows from financing activities: | | | | | | | | | | |
| | Proceeds from revolving line of credit | | | 29,500 | | | — | | | — | |
| | Repayments on revolving line of credit | | | (13,318 | ) | | — | | | — | |
| | Payments of capital lease obligations | | | (147 | ) | | — | | | — | |
| | Dividends paid | | | (6,631 | ) | | (6,670 | ) | | (6,142 | ) |
| | | | | | | | |
Net cash used in financing activities | | $ | 9,404 | | $ | (6,670 | ) | $ | (6,142 | ) |
Net increase (decrease) in cash and cash equivalents | | $ | 10,065 | | $ | (2,613 | ) | $ | 7,253 | |
Cash and cash equivalents at beginning of year | | | 9,973 | | | 12,586 | | | 5,333 | |
| | | | | | | | |
Cash and cash equivalents at end of year | | $ | 20,038 | | $ | 9,973 | | $ | 12,586 | |
| | | | | | | | |
Supplemental disclosure of cash flow information: | | | | | | | | | | |
| | Cash paid for interest | | $ | 812 | | $ | — | | $ | — | |
| | Cash paid for income taxes | | $ | 136 | | $ | 3,742 | | $ | 116 | |
Non-cash financing and investing activities: | | | | | | | | | | |
| | Equipment acquired under capital leases | | $ | 1,252 | | $ | — | | $ | — | |
| | Dividends accrued, but not paid | | $ | 1,849 | | $ | — | | $ | — | |
The accompanying notes are an integral part of these financial statements.
22
Table of Contents
FARMER BROS. CO.
CONSOLIDATED STATEMENTS OF STOCKHOLDERS’STOCKHOLDERS' EQUITY
(In thousands, except share and per share data)
| | Common
Shares | | Stock
Amount | | Additional
Paid-in
Capital | | Retained
Earnings | | Unearned
ESOP
Shares | | Other
Comprehensive
Income
(Loss) | | Total | |
Balance at June 30, 2003 | | 1,926,414 | | | $ | 1,926 | | | | $ | 18,798 | | | $ | 382,831 | | | $ | (33,364 | ) | | | $ | (1,046 | ) | | $ | 369,145 | |
Comprehensive income | | | | | | | | | | | | | | | | | | | | | | | |
Net income | | | | | | | | | | | | 12,687 | | | | | | | | | | 12,687 | |
Minimum pension liability | | | | | | | | | | | | | | | | | | | 309 | | | 309 | |
Total comprehensive income | | | | | | | | | | | | | | | | | | | | | | 12,996 | |
Dividends ($3.80 per share) | | | | | | | | | | | | (5,621 | ) | | | | | | | | | (5,621 | ) |
ESOP contributions | | | | | | | | | | | | | | | (32,412 | ) | | | | | | (32,412 | ) |
ESOP compensation expense | | | | | | | | | 1,282 | | | | | | 4,234 | | | | | | | 5,516 | |
Purchase capital stock | | (443,845 | ) | | (444 | ) | | | (4,474 | ) | | (106,243 | ) | | | | | | | | | (111,161 | ) |
Issue capital stock | | 124,939 | | | 125 | | | | 31,110 | | | | | | | | | | | | | 31,235 | |
Stock dividend | | 14,467,572 | | | 14,468 | | | | (14,468 | ) | | | | | | | | | | | | 0 | |
Balance at June 30, 2004 | | 16,075,080 | | | $ | 16,075 | | | | $ | 32,248 | | | $ | 283,654 | | | $ | (61,542 | ) | | | $ | (737 | ) | | $ | 269,698 | |
Comprehensive income | | | | | | | | | | | | | | | | | | | | | | | |
Net loss | | | | | | | | | | | | (5,427 | ) | | | | | | | | | (5,427 | ) |
Minimum pension liability | | | | | | | | | | | | | | | | | | | (120 | ) | | (120 | ) |
Total comprehensive income | | | | | | | | | | | | | | | | | | | | | | (5,547 | |
Dividends ($0.40 per share) | | | | | | | | | | | | (5,436 | ) | | | | | | | | | (5,436 | ) |
ESOP compensation expense | | | | | | | | | 44 | | | | | | 6,127 | | | | | | | 6,171 | |
Balance at June 30, 2005 | | 16,075,080 | | | $ | 16,075 | | | | $ | 32,292 | | | $ | 272,791 | | | $ | (55,415 | ) | | | $ | (857 | ) | | $ | 264,886 | |
Comprehensive income | | | | | | | | | | | | | | | | | | | | | | | |
Net income | | | | | | | | | | | | 4,756 | | | | | | | | | | 4,756 | |
Minimum pension liability | | | | | | | | | | | | | | | | | | | 857 | | | 857 | |
Total comprehensive income | | | | | | | | | | | | | | | | | | | | | | 5,613 | |
Dividends ($0.42 per share) | | | | | | | | | | | | (5,814 | ) | | | | | | | | | (5,814 | ) |
ESOP compensation expense | | | | | | | | | (774 | ) | | | | | 5,312 | | | | | | | 4,538 | |
Balance at June 30, 2006 | | 16,075,080 | | | $ | 16,075 | | | | $ | 31,518 | | | $ | 271,733 | | | $ | (50,103 | ) | | | $ | 0 | | | $ | 269,223 | |
| | | | | | | | | | | | | | | | | | | | | | | |
| | Common
Shares | | Stock
Amount | | Additional
Paid-in
Capital | | Retained
Earnings | | Unearned
ESOP
Shares | | Accumulated
Other
Comprehensive
Income
(Loss) | | Total | |
|---|
Balance at June 30, 2006 | | | 16,075,080 | | $ | 16,075 | | $ | 31,518 | | $ | 271,733 | | $ | (50,103 | ) | $ | 0 | | $ | 269,223 | |
Comprehensive income | | | | | | | | | | | | | | | | | | | | | | |
| | Net income | | | | | | | | | | | | 6,815 | | | | | | | | | 6,815 | |
| | Other comprehensive income | | | | | | | | | | | | | | | | | | | | | — | |
| | | | | | | | | | | | | | | | | | | | | | |
Total comprehensive loss | | | | | | | | | | | | | | | | | | | | | 6,815 | |
Dividends ($0.44 per share) | | | | | | | | | | | | (6,142 | ) | | | | | | | | (6,142 | ) |
ESOP compensation expense | | | | | | | | | (695 | ) | | | | | 5,863 | | | | | | 5,168 | |
Adoption SFAS No. 158(a) | | | | | | | | | | | | | | | | | | (8,848 | ) | | (8,848 | ) |
| | | | | | | | | | | | | | | | |
Balance at June 30, 2007 | | | 16,075,080 | | $ | 16,075 | | $ | 30,823 | | $ | 272,406 | | $ | (44,240 | ) | $ | (8,848 | ) | $ | 266,216 | |
Comprehensive income | | | | | | | | | | | | | | | | | | | | | | |
| | Net loss | | | | | | | | | | | | (7,924 | ) | | | | | | | | (7,924 | ) |
| | Retiree benefits(c) | | | | | | | | | | | | | | | | | | 9,452 | | | 9,452 | |
| | Other comprehensive income | | | | | | | | | | | | | | | | | | | | | — | |
| | | | | | | | | | | | | | | | | | | | | | |
Total comprehensive income | | | | | | | | | | | | | | | | | | | | | 1,528 | |
Dividends ($0.46 per share) | | | | | | | | | | | | (6,670 | ) | | | | | | | | (6,670 | ) |
ESOP compensation expense | | | | | | | | | (364 | ) | | | | | 5,711 | | | | | | 5,347 | |
Share based compensation | | | | | | | | | 153 | | | | | | | | | | | | 153 | |
Adoption FIN 48(b) | | | | | | | | | | | | (119 | ) | | | | | | | | (119 | ) |
| | | | | | | | | | | | | | | | |
Balance at June 30, 2008 | | | 16,075,080 | | $ | 16,075 | | $ | 30,612 | | $ | 257,693 | | $ | (38,529 | ) | $ | 604 | | $ | 266,455 | |
Comprehensive income | | | | | | | | | | | | | | | | | | | | | | |
| | Net loss | | | | | | | | | | | | (33,270 | ) | | | | | | | | (33,270 | ) |
| | Retiree benefits(c) | | | | | | | | | | | | | | | | | | (21,901 | ) | | | |
| | Valuation allowance(d) | | | | | | | | | | | | | | | | | | (13,615 | ) | | | |
| | | | | | | | | | | | | | | | | | | | | | |
| | Other comprehensive income net of tax ($0.00) | | | | | | | | | | | | | | | | | | (35,516 | ) | | (35,516 | ) |
| | | | | | | | | | | | | | | | | | | | | | |
Total comprehensive income | | | | | | | | | | | | | | | | | | | | | (68,786 | ) |
Dividends ($0.46 per share) | | | | | | | | | | | | (6,631 | ) | | | | | | | | (6,631 | ) |
ESOP compensation expense | | | | | | | | | (151 | ) | | | | | 4,925 | | | | | | 4,774 | |
Share based compensation | | | 3,031 | | | 3 | | | 674 | | | | | | | | | | | | 678 | |
| | | | | | | | | | | | | | | | |
Balance at June 30, 2009 | | | 16,078,111 | | $ | 16,078 | | $ | 31,135 | | $ | 217,792 | | $ | (33,604 | ) | $ | (34,912 | ) | $ | 196,489 | |
| | | | | | | | | | | | | | | | |
- (a)
- During the fiscal year ended June 30, 2007, the Company adopted the recognition provisions of SFAS No. 158 and applied them to the funded status of its defined benefit plans resulting in a decrease in stockholders' equity of $8.8 million as of June 30, 2007. In the Company's consolidated statement of stockholders' equity contained in its Form 10-K for the fiscal year ended June 30, 2007, this decrease was presented as a decrease of $8.8 million to other comprehensive income. In accordance with SFAS No. 158, this adjustment should have been recorded against accumulated other comprehensive income ("AOCI"). As a result, the Company has adjusted the AOCI (Loss) and other comprehensive income balances presented in the consolidated statements of stockholders' equity for the fiscal year ended June 30, 2007 in accordance with SFAS No. 158. AOCI (Loss) adjustment at June 30, 2007 is in the amount of ($8,848,000), net of related tax effects of $5,888,000.
- (b)
- Adoption FIN 48 accrual reflects the unrecognized tax benefit of $145,000, net of related tax effects of $26,000, resulting from adoption of FIN 48 on July 1, 2007.
- (c)
- Retiree benefits (expense) are shown net of related tax effects of ($13,615,000) and $5,969,000 for fiscal 2009 and 2008, respectively.
- (d)
- The Company has established a valuation allowance against deferred tax assets in the amount of $33,278,000, of this amount $19,663,000 was recorded as a current year tax expense and $13,615,000 was recorded as a reduction in other comprehensive income.
The accompanying notes are an integral part of these financial statements.
23
Table of Contents
Farmer Bros. Co.
Notes to Consolidated Financial Statements
Note 1. Summary of Significant Accounting Policies
Organization
The Company, which operates in one business segment, is in the businessa manufacturer, wholesaler and distributor of roasting, packaging, and distributing coffee and allied products through direct and brokered sales tothroughout the contiguous United States. The Company's customers include restaurants, hotels, casinos, hospitals and food service providers, as well as retailers such as convenience stores, coffee houses, general merchandisers, private-label retailers and fast food outlets.grocery stores. The Company’sCompany's product line includes roasted coffee, liquid coffee, coffee related products such as coffee filters, sugar and creamers, assorted teas, cappuccino, cocoa, spices gelatins and puddings, soup, gravy and sauce mixes, pancake and biscuit mixes, and jellies and preserves. Most sales are made "off-truck" by the Company to its customers at their places of business. The Company serves its customers from six distribution centers. The Company's distribution trucks are replenished from 165 branch warehouses located throughout the contiguous United States. The Company operates its own trucking fleet to support its long-haul distribution requirements. A portion of the Company's products are distributed by its selling divisions from branch warehouses located in most large cities throughout the western United States.third parties or are direct shipped via common carrier.
Principles of Consolidation
The consolidated financial statements include the accounts of the Company and its wholly-owned subsidiarywholly owned subsidiaries FBC Finance Company.Company and CBH. All inter-company balances and transactions have been eliminated.
Financial Statement Preparation
The preparation of financial statements in conformity with U.S. generally accepted accounting principles requires management to make estimates and assumptions that affect the reported amounts of assets and liabilities and disclosure of contingent assets and liabilities at the date of the financial statements and the reported amounts of revenue and expenses during the reporting period. Actual results could differ from those estimates.
Cash Equivalents
The Company considers all highly liquid investments with original maturity dates of 90 days or less to be cash equivalents. Fair values of cash equivalents approximate cost due to the short period of time to maturity.
Investments
The Company’sCompany's investments consist of marketable debt and equity securities, money market instruments and various derivative instruments, primarily exchange traded treasury futures and options, green coffee forward purchase contracts and commodity purchase agreements. All such derivative instruments not designated as accounting hedges are marked to market and changes are recognized in current earnings. At June 30, 20062009 and 20052008 no derivative instruments were designated as accounting hedges. The fair value of derivative instruments is based upon broker quotes. The cost of investments sold is determined on the specific identification method. Dividend and interest income is accrued as earned.
Concentration of Credit Risk
At June 30, 2006,2009, the financial instruments which potentially expose the Company to concentrationsconcentration of credit risk consist of cash in financial institutions (which exceeds federally insured limits), cash
Table of Contents
equivalents (principally commercial paper), short term investments, investments in the preferred stocks of other companies and trade receivables. Cash equivalents and short term investments are not concentrated by issuer, industry or geographic area. Maturities are generally shorter than 180 days. Other investments are in U.S. government securities. Investments in the preferred stocks of other companies are limited to high quality issuers and are not concentrated by geographic area or issuer. Concentration of credit risk with respect to trade receivables for the Company is limited due to the large number of customers comprising the Company’sCompany's customer base and their dispersion across many different geographic areas. The trade receivables are generally short term, and all probable bad debt losses have been appropriately considered in establishing the allowance for doubtful accounts.
Inventories
Inventories are valued at the lower of cost or market. Costs of coffee and allied products for the Company are determined on the last in, first out (LIFO) basis. Costs of coffee brewing equipment manufactured are accounted for on the first in, first out (FIFO) basis. The Company regularly evaluates these inventories to determine whether market conditions are correctly reflected in the recorded carrying value.
Property, Plant and Equipment
Property, plant and equipment is carried at cost, less accumulated depreciation. Depreciation is computed using the straight-line method. The following useful lives are used:
| | |
Building and facilities | | 10 to 30 years | |
Machinery and equipment | | 3 to 5 years | |
Office furniture and equipment | | 5 years | |
Capitalized software | | 3 years | |
When assets are sold or retired the asset and related depreciation allowance are eliminated from the records and any gain or loss on disposal is included in operations. Maintenance and repairs are charged to expense, and betterments are capitalized.
Coffee Brewing Equipment and Service
The Company has reclassified its reporting of certain expenses related to coffee brewing equipment provided to customers. These costs include the cost of the equipment as well as the cost of servicing that equipment (including service employees' salaries, cost of transportation and the cost of supplies and parts) and are now considered directly attributable to the generation of revenues from its customers. Accordingly such costs that had been previously reported as selling expenses are now reported as cost of goods sold in the accompanying financial statements for the years ended June 30, 2009, 2008 and 2007 in the amounts of $13.1 million, $20.4 million and $18.6 million, respectively.
During the fourth quarter of fiscal 2008 the Company changed its convention for capitalizing coffee brewing equipment provided to customers and as a result has capitalized coffee brewing equipment in the amounts of $5.4 million and $1.2 million in fiscal 2009 and 2008, respectively. During fiscal 2009 and 2008 the Company had depreciation expense related to the capitalized coffee brewing equipment reported as cost of goods sold in the amounts of $1.7 million and $72,000, respectively. Prior to the change in its convention for capitalization, the Company had immediately expensed all coffee brewing equipment provided to its customers. Prior to the change in its convention, the amount of coffee brewing equipment charged immediately to expense totaled $3.0 million and $7.3 million in fiscal years 2008 and 2007, respectively.
Table of Contents
Income Taxes
In June 2006, the Financial Accounting Standards Board ("FASB") issued Interpretation No. 48, "Accounting for Uncertainty in Income Taxes," an interpretation of SFAS 109, Accounting for Income Taxes ("FIN 48"), to create a single model to address accounting for uncertainty in tax positions. FIN 48 clarifies the accounting for income taxes, by prescribing a minimum recognition threshold a tax position is required to meet before being recognized in the financial statements. FIN 48 also provides guidance on derecognition, measurement, classification, interest and penalties, accounting in interim periods, disclosure and transition. FIN 48 is effective for fiscal years beginning after December 15, 2006. The Company adopted FIN 48 on July 1, 2007, as required. The cumulative effect of adopting FIN 48 was recorded on July 1, 2007 as a $119,000 reduction to beginning retained earnings.
Deferred income taxes are determined based on the temporary differences between the financial reporting and tax bases of assets and liabilities using enacted tax rates in effect for the year in which differences are expected to reverse. A valuation allowance is recorded, if necessary,Estimating the Company's tax liabilities involves judgments related to reduce deferreduncertainties in the application of complex tax regulations. The Company makes certain estimates and judgments to determine tax expense for financial statement purposes as they evaluate the effect of tax credits, tax benefits and deductions, some of which result from differences in timing of recognition of revenue or expense for tax and financial statement purposes. Changes to these estimates may result in significant changes to the Company's tax provision in future periods. Each fiscal quarter the Company reevaluates their tax provision and reconsiders their estimates and their assumptions related to specific tax assets to an amount management believes is more likely than not to be realized.and liabilities, making adjustments as circumstances change.
Revenue Recognition
Products Most products are sold and delivered to the Company’sCompany's customers at their places of business by the Company’sCompany's route sales employees. Revenue is recognized at the time the Company’sCompany's sales representatives physically deliver products to customers and title passes.passes or when it is accepted by the customer when shipped by third party delivery.
In connection with the acquisition of the DSD Coffee Business described in Note 2, the Company entered into an agreement with Sara Lee pursuant to which the Company performs co-packing services for Sara Lee as Sara Lee's agent. The Company recognizes revenue from this arrangement on a net basis, net of direct costs of revenue.
Net Income (Loss) Per Common Share
Net income (loss) per common share has been computed in accordance with SFAS Statement of Financial Accounting Standards ("SFAS") No. 128, “Earnings"Earnings per Share”Share." Basic earnings (loss) per share (EPS) is computed by dividing net income (loss) by the weighted average common shares outstanding, excluding unallocated shares held by the Company’sCompany's Employee Stock Ownership Plan (see Note 7)10). Diluted EPS includes the effect of any potential shares outstanding, which for the Company consists of dilutive stock options. The Company has no dilutive shares for anyeffect of stock options is calculated using the treasury stock method with an offset from expected proceeds upon exercise of the three fiscal years instock options and unrecognized compensation expense. Diluted EPS for the periodyear ended June 30, 2006.2009 does not include the dilutive effect of 39,231 shares under stock options since their inclusion would be anti-dilutive. In years ended June 30, 2008 and 2007 the Company had no dilutive shares. Accordingly, the consolidated financial statements present only basic net income (loss) per common share. A ten-for-one stock split in the form of a one-time stock dividend became effective May 10, 2004. All share and per share amounts used in calculating net income (loss) per share have been restated to reflect the split.
Employee Stock Ownership Plan (“ESOP”("ESOP")
The ESOP is accounted for in accordance with AICPA Statement of Position (“SOP”("SOP") 93-6. SOP 93-6 recognizes that the ESOP is a form of compensation. Compensation cost is based on the fair market value of shares released or deemed to be released for the period. Dividends on allocated shares
Table of Contents
retain the character of true dividends, but dividends on unallocated shares are considered compensation cost. As a leveraged ESOP with the Company as lender, a contra equity account is established to offset the Company’sCompany's note receivable. The contra account will change as compensation is recognized. Repurchase liability is disclosed as the current value of allocated shares.
Impairment of Goodwill and Intangible Assets
The Company performs its annual goodwill and indefinite-lived intangible assets impairment test as of March 31 of each fiscal year. Under SFAS No. 142, "Goodwill and Other Intangible Assets" ("SFAS 142"), goodwill and other indefinite-lived intangible assets are not amortized but instead are reviewed for impairment annually and on an interim basis if events or changes in circumstances between annual tests indicate that an asset might be impaired. Under SFAS 142, indefinite-lived intangible assets are tested for impairment by comparing their fair values to their carrying values. Testing for impairment of goodwill is a two-step process. The first step requires the Company to compare the fair value of its reporting units to the carrying value of the net assets of the respective reporting units, including goodwill. If the fair value of the reporting unit is less than the carrying value, goodwill of the reporting unit is potentially impaired and the Company then completes step two to measure the impairment loss, if any. The second step requires the calculation of the implied fair value of goodwill by deducting the fair value of all tangible and intangible net assets of the reporting unit from the fair value of the reporting unit. If the implied fair value of goodwill is less than the carrying amount of goodwill, an impairment loss is recognized equal to the difference.
In addition to an annual test, goodwill and indefinite-lived intangible assets must also be tested on an interim basis if events or circumstances indicate that the estimated fair value of such assets has decreased below their carrying value. There were no such events or circumstances during the fiscal years ended June 30, 2009 or 2008.
Long-Lived Assets, Excluding Goodwill and Indefinite-Lived Intangible Assets
When there are indicators of impairment, the Company reviews the recoverability of its long-lived assets as required by Statement of Financial Accounting Standards (“SFAS”)SFAS No. 144, “Accounting"Accounting for the Impairment or Disposal of Long-Lived Assets,”" whenever events or changes in circumstances indicate that the carrying amount of such assets may not be recoverable. The estimated future cash flows are based upon, among other things, assumptions about expected future operating performance, and may differ from actual cash flows. Long-lived assets evaluated for impairment are grouped with other assets to the lowest level for which identifiable cash flows are largely independent of the cash flows of other groups of assets and liabilities. If the sum of the projected undiscounted cash flows (excluding interest) is less than the carrying value of the assets, the assets will be written down to the estimated fair value in the period in which the determination is made. The Company has determined that no indicators of impairment of long-lived assets existed as of or during the fiscal year ended June 30, 2006.2009.
Shipping and Handling Costs
The Company distributes its products directly to its customers and shipping and handling costs are recorded as Company selling expenses.
Collective Bargaining Agreements
Certain Company employees are subject to collective bargaining agreements. The duration of these agreements extend from 20072009 to 2010.2013.
Table of Contents
Reclassifications
Certain reclassifications have been made to prior year balances to conform to the current year presentation.
New PronouncementsAccounting Standards
In JuneSeptember 2006, the Financial Accounting Standards Board (“FASB”)FASB issued InterpretationSFAS No. 48, “Accounting for Uncertainty in Income Taxes,” an interpretation of FAS 109, Accounting for Income Taxes (“FIN 48”157, "Fair Value Measurement" ("SFAS 157"), which defines fair value, establishes a framework for measuring fair value in accordance with GAAP and expands disclosures about fair value measurements. The provisions of SFAS 157 are effective for fiscal years beginning after November 15, 2007. In February 2008, the FASB issued FSP SFAS 157-1 and FSP SFAS 157-2. FSP SFAS 157-1 amends SFAS 157 to create a single model toexclude SFAS No. 13, "Accounting for Leases," and its related interpretive accounting pronouncements that address accountingleasing transactions. FSP SFAS 157-2 will delay the effective date of SFAS 157 for uncertainty in tax positions. FIN 48 clarifies the accounting for income taxes, by prescribing a minimum recognition threshold a tax position is required to meet before beingall nonfinancial assets and nonfinancial liabilities, except those that are recognized or disclosed at fair value in the financial statements. FIN 48 also provides guidancestatements on derecognition, measurement, classification, interesta recurring basis (at least annually). FSP SFAS 157-2 partially defers the effective date of SFAS 157 to fiscal years beginning after November 15, 2008, and penalties, accounting in interim periods within those fiscal years for items within the scope of FSP SFAS 157-2. The Company adopted SFAS 157 effective July 1, 2009 for all financial assets and liabilities as required. Refer to Note 3, Investments and Derivative Instruments for additional information. The adoption of SFAS 157 did not have a material impact on the Company's financial position or results of operations. The Company is currently evaluating the potential impact of the adoption of FSP SFAS 157-2 on the Company's consolidated financial statements.
In February 2007, the FASB issued SFAS No. 159, "The Fair Value Option for Financial Assets and Financial Liabilities" ("SFAS 159"), which permits entities to voluntarily choose to measure many financial instruments and certain other items at fair value. SFAS 159 provides entities an opportunity to mitigate volatility in reported earnings that is caused by measuring related assets and liabilities differently without having to apply complex hedge accounting provisions. SFAS 159 is effective for fiscal years beginning after November 15, 2007 and was effective for the Company beginning on February 3, 2008. SFAS 159 allows the Company to elect the fair value option on an instrument by instrument basis. SFAS 159 did not have an impact on the Company's consolidated results of operations or financial condition as the Company did not elect to adopt the fair value option for any of its financial assets or liabilities.
In December 2007, the FASB issued SFAS No. 141 (Revised), "Business Combinations" ("SFAS 141(R)"), replacing SFAS No. 141, "Business Combinations" ("SFAS 141"), and SFAS No. 160, "Noncontrolling Interests in Consolidated Financial Statements—An Amendment of ARB No. 51" ("SFAS 160"). SFAS 141(R) retains the fundamental requirements of SFAS 141, broadens its scope by applying the acquisition method to all transactions and other events in which one entity obtains control over one or more other businesses, and requires, among other things, that assets acquired and liabilities assumed be measured at fair value as of the acquisition date, that liabilities related to contingent considerations be recognized at the acquisition date and re-measured at fair value in each subsequent reporting period, that acquisition-related costs be expensed as incurred, and that income be recognized if the fair value of the net assets acquired exceeds the fair value of the consideration transferred. SFAS 160 establishes accounting and reporting standards for noncontrolling interests (i.e., minority interests) in a subsidiary, including changes in a parent's ownership interest in a subsidiary and requires, among other things, that noncontrolling interests in subsidiaries be classified as a separate component of equity. Except for the presentation and disclosure requirements of SFAS 160, which are to be applied retrospectively for all periods presented, SFAS 141(R) and transition. FIN 48SFAS 160 are to be applied prospectively in financial statements issued for fiscal years beginning after December 15, 2008. SFAS 141(R) and SFAS 160 will be effective for the Company beginning July 1, 2009. Though the accounting on future transactions is expected to be impacted, the Company does not anticipate any material impact to its historical financial statements from the adoption of SFAS 141(R) and SFAS 160.
Table of Contents
In April 2008, the FASB issued FSP SFAS No. 142-3,"Determination of the Useful Life of Intangible Assets" ("FSP SFAS 142-3"). FSP SFAS 142-3 amends the factors that should be considered in developing renewal or extension assumptions used to determine the useful life of a recognizable intangible asset under SFAS 142. FSP SFAS 142-3 is intended to improve the consistency between the useful life of a recognizable intangible asset under SFAS 142 and the period of expected cash flows used to measure the fair value of the asset under SFAS 142. FSP SFAS 142-3 is effective for fiscal years beginning after December 15, 2006.2008. The Company adopted FSP SFAS 142-3 effective July 1, 2009. FSP SFAS 142-3 will change the Company's determination of useful lives for intangible assets on a prospective basis.
In June 2008, the FASB released a proposed SFAS, "Disclosure of Certain Loss Contingencies, an amendment of FASB Statements No. 5 and 141)" (the "Proposed Statement"), for a comment period that ended during August 2008. The Proposed Statement would (a) expand the population of loss contingencies that are required to be disclosed, (b) require disclosure of specific quantitative and qualitative information about those loss contingencies, (c) require a tabular reconciliation of recognized loss contingencies and (d) provide an exemption from disclosing certain required information if disclosing that information would be prejudicial to an entity's position in a dispute. The Proposed Statement would be effective for financial statements issued for fiscal years ending after December 15, 2008, and for interim and annual periods in subsequent fiscal years. When and if the Proposed Statement is approved in final form by FASB, the Company will evaluate whether the adoption of the Proposed Statement will have any material impact on its financial position or results of operations.
In June 2008, the FASB issued FSP No. EITF 03-6-1, "Determining Whether Instruments Granted in Share-Based Payment Transactions Are Participating Securities" ("FSP EITF 03-6-1"), which requires unvested share-payment awards that contain rights to receive non-forfeitable dividends or dividend equivalents to be included in the two-class method of computing earnings per share. FSP EITF 03-6-1 also requires retrospective application to all periods presented. FSP EITF 03-6-1 is effective as of the beginning of the Company's 2010 fiscal year. Prior periods will be restated to reflect this impact in future reporting periods. The Company is currently evaluating the potential impact of the adoption of FSP SFAS 03-6-1 on the Company's consolidated financial statements.
In December 2008, the FASB issued FSP SFAS 132(R)-1, "Employers' Disclosures about Postretirement Benefit Plan Assets" ("FSP SFAS 132(R)-1"). FSP SFAS 132(R)-1 amends SFAS No. 132(R), "Employer's Disclosures about Pensions and Other Postretirement Benefits," to require additional disclosures about assets held in an employer's defined benefit pension or other postretirement plan. FSP SFAS 132(R)-1 is effective for fiscal years ending after December 15, 2009, with early adoption permitted. The Company will adopt FIN 48 no later than July 1, 2007, as required. The cumulative effectthe disclosure requirements of adopting FIN 48, if any, will be recordedFSP SFAS 132(R)-1 beginning in retained earnings and other accounts as applicable. The Company does not expect that the adoptionfirst quarter of FIN 48 will have a significant impact on the Company’s financial position and results of operations.fiscal 2011.
In May 2005,June 2009, the FASB issued SFAS No. 154, “Accounting Changes168, "The FASB Accounting Standards Codification and Error Corrections—A Replacementthe Hierarchy of APB Opinion No. 20 andGenerally Accepted Accounting Principles—a replacement of FASB Statement No. 3.”162" ("SFAS 168"). The new statement modifies the U.S. generally accepted accounting principles ("GAAP") hierarchy created by SFAS No. 154 requires retrospective application162, "The Hierarchy of Generally Accepted Accounting Principles" by establishing only two levels of GAAP: authoritative and nonauthoritative. This is accomplished by authorizing the FASB Accounting Standards Codification (the "Codification") to prior periods’become the single source of authoritative U.S. accounting and reporting standards, except for rules and interpretive releases of the SEC under authority of the federal securities laws, which are sources of authoritative GAAP for SEC registrants. SFAS 168 is effective for financial statements for changesinterim and annual periods ending after September 15, 2009. All existing accounting standard documents are superseded and all other accounting literature not included in accounting principle, unless itthe Codification is impracticable to determine either the period-specific effects or the cumulative effect of the change. SFAS No. 154 is effective for accounting changes and corrections of errors made in fiscal years beginning after December 15, 2005.considered nonauthoritative. The Company will adopt this Statement effective July 1, 2006, and does not expectanticipate the adoption toof SFAS 168 will have a material impacteffect on the Company’sCompany's financial position, results of operationsoperation, or cash flows.
Table of Contents
Note 2. Acquisitions
Acquisition of Coffee Bean International, Inc.
On April 27, 2007, the Company acquired 100% of the outstanding common shares of Coffee Bean Holding Co., Inc., a Delaware corporation ("CBH"), the parent company of Coffee Bean International, Inc., an Oregon corporation ("CBI"), a gourmet specialty coffee roaster and wholesaler headquartered in Portland, Oregon. The purchase price was $23.6 million in cash, including transaction costs of approximately $1.4 million, less the amount of all outstanding indebtedness of CBH and its subsidiaries. The results of operations of CBH have been included in the Company's consolidated financial statements since April 27, 2007.
The Company has obtained a third-party valuation of CBH's acquired net assets. The Company believes the fair values assigned to the assets acquired and liabilities assumed are based on reasonable assumptions. The purchase price allocation was finalized during the year ended June 30, 2008. The following table summarizes the estimated fair values of the assets acquired and liabilities assumed at the date of acquisition, based on the final purchase price allocation (in millions):
Fair Value of Assets Acquired
| | | | |
Current assets, excluding inventories | | $ | 2,3 | |
Inventory | | | 4.2 | |
Property, plant & equipment | | | 3.1 | |
Customer relationships | | | 10.1 | |
Tradenames | | | 4.1 | |
Goodwill | | | 5.3 | |
| | | | |
Total assets acquired | | | 29.1 | |
Liabilities assumed | | | (5.5 | ) |
| | | | |
Net assets acquired | | $ | 23.6 | |
| | | | |
The customer relationships include both contractual and non-contractual relationships, and have estimated lives ranging from 3.5 to 8 years. Because these relationships have definite lives, the Company will amortize the assets over the estimated lives on a straight-line basis. The CBI tradenames have an indefinite life and thus are not subject to amortization.
Acquisition of DSD Coffee Business
Effective as of February 28, 2009, the Company completed the acquisition from Sara Lee Corporation, a Maryland corporation ("Seller"), and Saramar, L.L.C., a Delaware limited liability company ("Saramar" and collectively with Seller, "Seller Parties") of certain assets used in connection with Seller Parties' direct store delivery coffee business in the United States (the "DSD Coffee Business"). The acquired business generally consists of manufacturing and selling coffee, tea and related products through a network of facilities and vehicles which was acquired to complement and expand the Company's previously existing operations. This business also includes the distribution, sale and service of brewed and liquid coffee equipment, as well as the right to distribute sauces and dressings to customers of the DSD Coffee Business. The results of operations of the DSD Coffee Business are included in the Company's consolidated financial statements beginning on March 1, 2009.
The assets purchased include, among other things, the following: (i) a manufacturing plant in Houston, Texas, a spice plant in Oklahoma City, Oklahoma, and a warehouse in Indianapolis, Indiana; (ii) 64 leased branch facilities in 31 states; (iii) a vehicle fleet consisting of 431 owned and leased vehicles; (iv) certain tangible personal property; (v) inventories of raw materials, work in process, finished goods and packaging; (vi) certain contracts, permits, books and records; (vii) prepaid expenses
Table of Contents
relating to the DSD Coffee Business; and (viii) all goodwill relating to the DSD Coffee Business. The Company also acquired Seller Parties' rights (including related goodwill) in the trademarks and trade names relating to the SUPERIOR®, MCGARVEY®, CAIN'S®, IRELAND®, JUSTIN LLOYD®, METROPOLITAN®, PREBICA®, WECHSLER®, WORLD'S FINEST® and CAFÉ ROYAL® brands.
Subject to certain post-closing adjustments relating to the amount of consumable inventory and prepaid expenses at closing, and after giving effect to certain reimbursement obligations of the parties relating to accounting costs, IT carve-out costs, and transfer taxes and fees, as well as real and personal property tax and utility prorations, the amount paid to Seller was $45.6 million, which consisted of $16.1 million of Company cash and proceeds of a bank loan of $29.5 million. The Company paid approximately $2.7 million of acquisition related expenses. At closing, the Company assumed certain liabilities, including obligations under contracts, environmental liabilities with respect to the transferred facilities, pension liabilities, advertising and trade promotion accruals, and accrued vacation as of the closing for hired personnel. As of June 30, 2009, these liabilities are estimated to be a total of $2,026,000 consisting of $1,322,000 for costs related to exiting certain acquired operations, $609,000 for accrued vacation and $95,000 in other estimated liabilities. Seller Parties retained all liabilities that were not specifically assumed by the Company. The Company re-financed and replaced certain leases relating to the DSD Coffee Business vehicles in the fourth quarter of fiscal 2009 as described in Note 14. Additionally, the Company assumed lease liabilities for sixty-four warehouse leases with lease terms that generally do not exceed three years. See Note 14, "Commitments and Contingencies."
In connection with the closing, Seller Parties and the Company entered into certain operational agreements, including trademark and formula license agreements, co-pack agreements, a liquid coffee distribution agreement, a transition services agreement, and a green coffee and tea purchase agreement. One of the co-pack agreements provides that Seller will manufacture branded products for the Company for a period of three years. Under this agreement the Company has agreed to purchase certain minimum product quantities from Seller subject to certain permitted reductions. The transition services agreement provides that Seller will perform a number of services for the Company on an interim basis, including distribution and warehousing of finished goods for up to six months and hosting, maintaining and supporting IT infrastructure and communications for up to eighteen months.
The accompanying consolidated financial statements do not include pro-forma historical information, as if the results of the DSD Coffee Business had been included from the beginning of the periods presented, since the use of forward-looking information would be necessary in order to meaningfully present the effects of the acquisition. Forward-looking information, rather than historical information, would be required since the DSD Coffee Business was operated as part of a larger business within Seller and there will be a different operating cost structure and different operations support under the Company's ownership. Net revenue of the DSD Coffee Business for the eight months ended February 28, 2009 (the effective date of the acquisition) was approximately $134 million, and approximately $228 million for the fiscal year ended June 30, 2008. However the Company has not provided forward-looking information with respect to incremental costs and expenses to be incurred because such information is not determinable.
The acquisition has been accounted for as an asset purchase. The total purchase price has been allocated to tangible and intangible assets based on their estimated fair values as of February 28, 2009 as determined by management based upon a third-party valuation. The purchase price allocation has not been finalized, since it is possible that certain adjustments may be made if additional facts or circumstances become known that impact the estimates. Revisions to the allocation, which may be significant, and relate primarily to exit activities, will be reported as changes to various assets and liabilities. The purchase price allocation is expected to be finalized during fiscal 2010. The following
Table of Contents
table summarizes the estimated fair values of the assets acquired and liabilities assumed at the date of acquisition, based on the preliminary purchase price allocation (dollars in thousands):
| | | | | | |
Fair Value of Assets Acquired | |
| | Estimated Useful
Life (years) |
|---|
Inventory | | $ | 16,437 | | |
Prepaid expense | | | 1,138 | | |
| | | | | |
| | Current assets | | | 17,575 | | |
Vehicles | | |
1,044 | | 5 |
Machinery | | | 10,954 | | 3-5 |
Property, plant & equipment | | | 5,577 | | 30 |
Land | | | 1,945 | | |
| | | | | |
| | Fixed assets | | | 19,520 | | |
Trademarks | | |
2,115 | | indefinite |
Customer relationships | | | 7,855 | | 8 |
Distribution agreement | | | 2,493 | | 10 |
Co-pack agreement | | | 755 | | 6 |
| | | | | |
| | Intangible assets | | | 13,218 | | |
| | | | | |
Total assets acquired | | |
50,313 | | |
Liabilities | | | (2,026 | ) | |
| | | | | |
Net assets acquired | | $ | 48,287 | | |
| | | | | |
Intangible assets consist of trademarks, customer relationships, and service agreements with a gross carrying value and accumulated amortization as of June 30, 2009 of $13.2 million and $0.5 million, respectively. The accumulated amortization represents aggregate amortization for the four months ended June 30, 2009 from February 28, 2009, the date of acquisition. Estimated aggregate amortization of intangible assets for each of the following five years based on the estimated fair values of the intangible assets is expected to be approximately $1.4 million.
Note 2.3. Investments and Derivative Instruments
The Company purchases various derivative instruments as investments or to create economic hedges of its interest rate risk and commodity price risk. At June 30, 20062009 and 2005,2008, derivative instruments are not designated as accounting hedges as defined by SFAS No. 133.133, "Accounting for Derivative Instruments and Hedging Activities." The fair value of derivative instruments is based upon broker quotes. The Company records unrealized gains and losses on trading securities and changes in the market value of certain coffee contracts meeting the definition of derivatives in other incomeOther, net (expense) income.
The Company adopted SFAS No. 157, "Fair Value Measurements" ("SFAS 157") on July 1, 2008. SFAS 157 defines fair value and expense.expands disclosure for each major asset and liability category measured at fair value on either a recurring or nonrecurring basis. Under SFAS 157, the Company groups its assets and liabilities at fair value in three levels, based on the markets in which the assets and liabilities are traded and the reliability of the assumptions used to determine fair value. These levels are:
- •
- Level 1—Valuation is based upon quoted prices for identical instruments traded in active markets.
- •
- Level 2—Valuation is based upon quoted prices for similar instruments in active markets, quoted prices for identical or similar instruments in markets that are not active, and model-based valuation techniques for which all significant assumptions are observable in the market.
- •
- Level 3—Valuation is generated from model-based techniques that use significant assumptions not observable in the market. These unobservable assumptions reflect estimates of assumptions that market participants would use in pricing the asset or liability. Valuation techniques include use of option pricing models, discounted cash flow models and similar techniques.
Table of Contents
The Company's preferred stock investments have been grouped as follows at June 30, 2009 (in thousands):
| | | | | | | | | | | | | |
| | Total | | Level 1 | | Level 2 | | Level 3 | |
|---|
Preferred stock | | $ | 42,466 | | $ | 11,759 | | $ | 30,707 | | $ | — | |
Investments, consisting of marketable debt and equity securities, and money market instruments and various derivative instruments, are held for trading purposes and are stated at fair value.
Investments at June 30, are as follows:
| | 2006 | | 2005 | |
| | (In thousands) | |
Trading securities at fair value | | | | | |
U.S. Treasury Obligations | | $ | 113,502 | | $ | 109,134 | |
Preferred Stock | | 61,716 | | 61,660 | |
Futures, options and other derivatives | | 1,092 | | 239 | |
Other | | 26 | | 22 | |
| | $ | 176,336 | | $ | 171,055 | |
| | | | | | | | |
| | 2009 | | 2008 | |
|---|
| | (In thousands)
| |
|---|
Trading securities at fair value | | | | | | | |
| | U.S. Treasury Obligations | | $ | — | | $ | 54,517 | |
| | Preferred Stock | | | 42,466 | | | 58,204 | |
| | Futures, options and other derivatives | | | 460 | | | 565 | |
| | | | | | |
| | $ | 42,926 | | $ | 113,286 | |
| | | | | | |
Gains and losses, both realized and unrealized, are included in other, incomenet (expense) income. Net realized and expense. Gross realized gains/unrealized gains and losses at June 30, are as follows:
| | 2006 | | 2005 | | 2004 | |
| | (In thousands) | |
Gains | | $ | 5,071 | | $ | 5,599 | | $ | 12,259 | |
Losses | | $ | (1,660 | ) | $ | (21,112 | ) | $ | (6,955 | ) |
| | | | | | | | | | | | |
| | 2009 | | 2008 | | 2007 | |
|---|
| | (In thousands)
| |
|---|
Investments | | | | | | | | | | |
| | Unrealized gains | | $ | — | | $ | — | | $ | 1,922 | |
| | Unrealized losses | | | (3,584 | ) | | (9,271 | ) | | (11 | ) |
| | Realized gains | | | 238 | | | 372 | | | (4,189 | ) |
| | Realized losses | | | (5,643 | ) | | (5,093 | ) | | 3,123 | |
| | | | | | | | |
| | | Net realized and unrealized gains (losses) | | | (8,989 | ) | | (13,992 | ) | | 845 | |
Net gains from sales of assets | | |
475 | | |
1,413 | | |
260 | |
Other gains (losses), net | | | 266 | | | 236 | | | 128 | |
| | | | | | | | |
| | | Other, net (expense) income | | $ | (8,248 | ) | $ | (12,343 | ) | $ | 1,233 | |
| | | | | | | | |
Note 3.4. Accounts Receivable, net
| | | | | | | |
| | 2009 | | 2008 | |
|---|
| | (In thousands)
| |
|---|
Trade Receivables | | $ | 37,076 | | $ | 19,591 | |
Other receivables | | | 9,841 | | | 759 | |
Allowance for doubtful accounts | | | (1,173 | ) | | (494 | ) |
| | | | | | |
| | $ | 45,744 | | $ | 19,856 | |
| | | | | | |
Allowance for Doubtful Accountsdoubtful accounts (In thousands):
| | | | | |
Balance at July 1, 2006 | | $ | (265 | ) |
| | Additions from CBI acquisition | | | (186 | ) |
| | | | |
Balance at June 30, 2007 | | | (451 | ) |
| | Additions | | | (311 | ) |
| | Write-offs | | | 268 | |
| | | | |
Balance at June 30, 2008 | | | (494 | ) |
| | Additions | | | (810 | ) |
| | Write-offs | | | 131 | |
| | | | |
Balance at June 30, 2009 | | $ | (1,173 | ) |
| | | | |
Table of Contents
Doubtful accounts at June 30, are as follows:Note 5. Inventories
| | 2006 | | 2005 | |
| | (In thousands) | |
Balance at beginning of year | | $ | 310 | | $ | 345 | |
Additions | | 107 | | 194 | |
Deductions | | (152 | ) | (229 | ) |
Balance at end of year | | $ | 265 | | $ | 310 | |
| | | | | | | | | | |
June 30, 2009 | | Processed | | Unprocessed | | Total | |
|---|
| | (In thousands)
| |
|---|
Coffee | | $ | 15,612 | | $ | 19,816 | | $ | 35,428 | |
Allied products | | | 20,760 | | | 4,686 | | | 25,446 | |
Coffee brewing equipment | | | 4,745 | | | 3,342 | | | 8,087 | |
| | | | | | | | |
| | $ | 41,117 | | $ | 27,844 | | $ | 68,961 | |
| | | | | | | | |
Note 4. Inventories
June 30, 2006 | | | | Processed | | Unprocessed | | Total | | |
| | | (In thousands) | | | | | | | | | | | |
June 30, 2008 | | | Processed | | Unprocessed | | Total | |
|---|
Coffee | Coffee | | | $ | 4,949 | | | | $ | 12,735 | | | $ | 17,684 | | | $ | 9,929 | | $ | 16,933 | | $ | 26,862 | |
Allied products | Allied products | | | 15,556 | | | | 4,487 | | | 20,043 | | | 14,440 | | 4,601 | | 19,041 | |
Coffee brewing equipment | Coffee brewing equipment | | | 1,528 | | | | 5,753 | | | 7,281 | | | 1,883 | | 6,467 | | 8,350 | |
| | | | $ | 22,033 | | | | $ | 22,975 | | | $ | 45,008 | | | | | | | | |
| | | $ | 26,252 | | $ | 28,001 | | $ | 54,253 | |
| | | | | | | | | |
June 30, 2005 | | | | Processed | | Unprocessed | | Total | |
Coffee | | | $ | 4,888 | | | | $ | 12,568 | | | $ | 17,456 | |
Allied products | | | 12,860 | | | | 5,478 | | | 18,338 | |
Coffee brewing equipment | | | 2,081 | | | | 3,211 | | | 5,292 | |
| | | $ | 19,829 | | | | $ | 21,257 | | | $ | 41,086 | |
Current cost of coffee and allied products inventories is greater thanexceeds the LIFO cost by approximately $18,750,000 and $16,506,000 as ofat June 30 2006 and 2005, respectively.by (In thousands):
| | | | | | | | | | | |
| | 2009 | | 2008 | | 2007 | |
|---|
Coffee | | $ | 22,094 | | $ | 22,932 | | $ | 15,564 | |
Allied products | | | 5,064 | | | 4,239 | | | 2,903 | |
| | | | | | | | |
| | Total | | $ | 27,158 | | $ | 27,171 | | $ | 18,467 | |
| | | | | | | | |
The change in the Company’sCompany's green coffee and allied product inventories during fiscal 2006, 2005,2009, 2008 and 20042007 resulted in LIFO (increments)/decrements which had the effect of (decreasing)/increasing (loss)/income before taxesresulted in a net increase (decrease) in gross profit for those years by ($971,000)1,508,000), ($1,747,000)5,832,117) and ($499,000),$1,969,000, respectively.
Note 5.6. Property, Plant and Equipment
| | | 2006 | | 2005 | |
| | 2009 | | 2008 | |
|---|
| | (In thousands) | |
| | (In thousands)
| |
|---|
Buildings and facilities | | $ | 47,561 | | $ | 42,757 | | Buildings and facilities | | $ | 74,857 | | $ | 62,149 | |
Machinery and equipment | | 50,375 | | 49,642 | | Machinery and equipment | | 93,379 | | 65,285 | |
Equipment under capital leases | | Equipment under capital leases | | 3,239 | | — | |
Capitalized software costs | | 14,318 | | 12,689 | | Capitalized software costs | | 15,464 | | 15,182 | |
Office furniture and equipment | | 6,824 | | 6,301 | | Office furniture and equipment | | 13,328 | | 9,168 | |
| | $ | 119,078 | | $ | 111,389 | | | | | | | |
| | | | $ | 200,267 | | $ | 151,784 | |
Accumulated depreciation | | (79,166 | ) | (74,865 | ) | Accumulated depreciation | | (98,184 | ) | | (90,754 | ) |
Land | | 6,473 | | 6,147 | | Land | | 9,980 | | 8,035 | |
Total property plant and equipment | | $ | 46,385 | | $ | 42,671 | | |
| | | | | | | | |
| | | Total property, plant and equipment | | $ | 112,063 | | $ | 69,065 | |
| | | | | | | | |
The Company has capitalized coffee brewing equipment in the amounts of $5,487,000, $1,234,000 and $0 in fiscal years 2009, 2008 and 2007, respectively. Depreciation expense related to capitalized coffee brewing equipment reported as cost of goods sold was $1,665,000, $72,000 and $0 in fiscal years 2009, 2008 and 2007, respectively.
Maintenance and repairs charged to expense for the years ended June 30, 2006, 20052009, 2008 and 20042007 were $12,112,000, $10,719,000$15,177,000, $13,478,000, and $11,151,000,$12,499,000 respectively.
Table of Contents
Note 7. Goodwill and Intangible Assets
The following is a summary of our amortized and unamortized intangible assets other than goodwill, along with amortization expense on these intangible assets for the past three fiscal years and estimated aggregate amortization expense for each of the next five fiscal years:
| | | | | | | | | | | | | | | |
| | 2009 | | 2008 | |
|---|
| | Gross Carrying
Amount | | Accumulated
Amortization | | Gross Carrying
Amount | | Accumulated
Amortization | |
|---|
| | (In thousands)
| |
|---|
Amortized intangible assets: | | | | | | | | | | | | | |
| | Customer relationships | | $ | 17,968 | | $ | 4,491 | | $ | 10,113 | | $ | 2,664 | |
| | Distribution agreement | | | 2,493 | | | 83 | | | — | | | — | |
| | Co-pack agreement | | | 755 | | | 41 | | | — | | | — | |
| | Other | | | 2,139 | | | 1,487 | | | 2,071 | | | 1,342 | |
| | | | | | | | | | |
| | | Total intangible assets | | $ | 23,355 | | $ | 6,102 | | $ | 12,184 | | $ | 4,006 | |
| | | | | | | | | | |
Unamortized intangible assets | | | | | | | | | | | | | |
| | Tradenames with indefinite lives | | $ | 4,080 | | $ | — | | $ | 4,080 | | $ | — | |
| | Trademarks with indefinite lives | | | 2,115 | | | — | | | — | | | — | |
| | Goodwill | | | 5,310 | | | — | | | 5,310 | | | — | |
| | | | | | | | | | |
| | | Total unamortized intangible assets | | $ | 11,505 | | $ | — | | $ | 9,390 | | $ | — | |
| | | | | | | | | | |
| | | Total intangible assets | | $ | 34,860 | | $ | 6,102 | | $ | 21,574 | | $ | 4,006 | |
| | | | | | | | | | |
Aggregate amortization expense for the past three fiscal years: | | | | | | | | | | | | | |
| | For the year ended June 30, 2009 | | $ | 3,263 | | | | | | | | | | |
| | For the year ended June 30, 2008 | | $ | 1,695 | | | | | | | | | | |
| | For the year ended June 30, 2007 | | $ | 558 | | | | | | | | | | |
Estimated amortization expense for each of the next five fiscal years: | | | | | | | | | | | | | |
| | For the year ended June 30, 2010 | | $ | 3,622 | | | | | | | | | | |
| | For the year ended June 30, 2011 | | $ | 3,472 | | | | | | | | | | |
| | For the year ended June 30, 2012 | | $ | 3,103 | | | | | | | | | | |
| | For the year ended June 30, 2013 | | $ | 2,614 | | | | | | | | | | |
| | For the year ended June 30, 2014 | | $ | 2,225 | | | | | | | | | | |
The remaining weighted average amortization periods for intangible assets with finite lives are as follows: | | | | | | | | | | | | | |
| | Customer relationships | | | 7 years | | | | | | | | | | |
The following is a summary of the changes in the carrying value of goodwill (in thousands): | | | | | | | | | | | | | |
Balance at July 1, 2007 | | $ | 3,300 | | | | | | | | | | |
| | Acquisitions during year | | | — | | | | | | | | | | |
| | Purchase price adjustments | | | 2,010 | | | | | | | | | | |
| | | | | | | | | | | | | |
Balance at June 30, 2008 | | $ | 5,310 | | | | | | | | | | |
| | Acquisitions during year | | | — | | | | | | | | | | |
| | | | | | | | | | | | | |
Balance at June 30, 2009 | | $ | 5,310 | | | | | | | | | | |
| | | | | | | | | | | | | |
During fiscal 2008 management finalized purchase price allocation of the CBI acquisition which resulted in an increase of approximately $2,010,000 in goodwill.
Table of Contents
Note 6.8. Employee Benefit Plans
The Company provides pension plans for most full time employees. Generally the plans provide benefits based on years of service and/or a combination of years of service and earnings. Retirees are also eligible for medical and life insurance benefits.
In September 2006, the FASB issued SFAS No. 158 "Employers' Accounting for Defined Benefit Pension and Other Postretirement Plans, an amendment of FASB Statements No. 87, 88, 106, and 132(R)" ("SFAS 158"). This standard requires recognition of the funded status of a benefit plan in the balance sheet. The standard also requires recognition in other comprehensive income of certain gains and losses that arise during the period but are deferred under pension accounting rules, as well as modifies the timing of reporting and adds certain disclosures. SFAS 158 provides recognition and disclosure elements to be effective as of the end of fiscal years ending after December 15, 2006 and measurement elements to be effective for fiscal years ending after December 15, 2008. The Company adopted the recognition provisions of SFAS 158 for fiscal 2008 and applied them to the funded status of its defined benefit and postretirement plans resulting in a decrease in stockholders' equity of $8.8 million.
Union Pension Plans
The Company contributes to twoseveral multi-employer defined benefit pension plans for certain union employees. The contributions to these multi-employer pension plans were approximately $2,400,000, $2,278,000$2,823,000, $2,505,000 and $2,114,000$2,373,000 for the fiscal years ended June 30, 2006, 20052009, 2008 and 2004,2007, respectively.
Company Pension Plans
The Company has a defined benefit pension plan for allthe majority of its employees who are not covered under a collective bargaining agreement (Farmer Bros. Co. Plan) and a defined benefit pension plan (Brewmatic Co. Plan) for certain hourly employees covered under a collective bargaining agreement.agreement (Brewmatic Plan). All assets and benefit obligations were determined using a measurement date of June 30, 2006.
28
Disclosure for the Company Pension Plans
| | Years ended June 30 | |
| | 2006 | | 2005 | |
| | (In thousands) | |
Change in benefit obligation | | | | | |
Benefit obligation at the beginning of the year | | $ | 86,841 | | $ | 69,516 | |
Service cost | | 2,815 | | 2,117 | |
Interest cost | | 4,510 | | 4,284 | |
Plan participants contributions | | 235 | | 189 | |
Amendments | | 0 | | 0 | |
Actuarial (gain)/loss | | (9,653 | ) | 14,358 | |
Benefits paid | | (3,397 | ) | (3,623 | ) |
Benefit obligation at the end of the year | | $ | 81,351 | | $ | 86,841 | |
Change in plan assets | | | | | |
Fair value in plan assets at the beginning of the year | | $ | 84,457 | | $ | 79,387 | |
Actual return on plan assets | | 7,337 | | 8,484 | |
Employer contributions | | 24 | | 20 | |
Plan participants contributions | | 235 | | 189 | |
Benefits paid | | (3,397 | ) | (3,623 | ) |
Fair value in plan assets at the end of the year | | $ | 88,656 | | $ | 84,457 | |
Funded status | | $ | 7,305 | | $ | (2,385 | ) |
Unrecognized net asset | | 0 | | 0 | |
Unrecognized actuarial loss | | 9,321 | | 20,692 | |
Unrecognized prior service cost | | 302 | | 366 | |
Net amount recognized | | $ | 16,928 | | $ | 18,673 | |
| | Years ended June 30 | |
| | 2006 | | 2005 | |
| | (In thousands) | |
Amounts recognized in the consolidated balance sheet | | | | | |
Prepaid benefit cost | | $ | 16,928 | | $ | 17,291 | |
Accrued benefit liability | | — | | (304 | ) |
Intangible asset | | — | | 301 | |
Accumulated other comprehensive income | | — | | 1,385 | |
Net amount recognized | | $ | 16,928 | | $ | 18,673 | |
30.
The accumulated benefit obligation forTable of Contents
Obligations and Funded Status
| | | | | | | | | | | | | | |
| | Farmer Bros. Plan
Years ended
June 30, | | Brewmatic Plan
Years ended
June 30, | |
|---|
| | 2009 | | 2008 | | 2009 | | 2008 | |
|---|
| | (In thousands)
| | (In thousands)
| |
|---|
Change in projected benefit obligation | | | | | | | | | | | | | |
Benefit obligation at the beginning of the year | | $ | 85,681 | | $ | 83,576 | | $ | 3,352 | | $ | 3,526 | |
| | Service cost | | | 2,757 | | | 2,317 | | | 47 | | | 39 | |
| | Interest cost | | | 5,689 | | | 4,907 | | | 219 | | | 203 | |
| | Plan participant contributions | | | 492 | | | 268 | | | — | | | — | |
| | Actuarial (gain)/loss | | | 6,156 | | | (3,227 | ) | | 122 | | | (208 | ) |
| | Benefits paid | | | (4,123 | ) | | (3,986 | ) | | (264 | ) | | (229 | ) |
| | Other | | | — | | | 1,826 | | | — | | | 21 | |
| | | | | | | | | | |
Projected benefit obligation at the end of the year | | $ | 96,652 | | $ | 85,681 | | $ | 3,476 | | $ | 3,352 | |
Change in plan assets | | | | | | | | | | | | | |
Fair value in plan assets at the beginning of the year | | | 84,219 | | | 95,557 | | | 3,540 | | | 4,077 | |
| | Actual return on plan assets | | | (21,322 | ) | | (7,619 | ) | | (910 | ) | | (334 | ) |
| | Employer contributions | | | — | | | — | | | 28 | | | 26 | |
| | Plan participant contributions | | | 492 | | | 267 | | | — | | | — | |
| | Benefits paid | | | (4,123 | ) | | (3,986 | ) | | (264 | ) | | (229 | ) |
| | | | | | | | | | |
Fair value in plan assets at the end of the year | | $ | 59,266 | | $ | 84,219 | | $ | 2,394 | | $ | 3,540 | |
Funded status at end of year (underfunded)/overfunded | |
$ |
(37,386 |
) |
$ |
(1,462 |
) |
$ |
(1,082 |
) |
$ |
188 | |
Amounts recognized in statement of financial position | | | | | | | | | | | | | |
| | Noncurrent assets | | $ | — | | $ | — | | $ | — | | $ | 188 | |
| | Current liabilities | | | — | | | — | | | — | | | — | |
| | Noncurrent liabilities | | | (37,386 | ) | | (1,462 | ) | | (1,082 | ) | | — | |
| | | | | | | | | | |
Total | | $ | (37,386 | ) | $ | (1,462 | ) | $ | (1,082 | ) | $ | 188 | |
Amounts recognized in statement of financial position | | | | | | | | | | | | | |
| | Total net (gain)/loss | | $ | 49,325 | | $ | 15,588 | | $ | 2,235 | | $ | 965 | |
| | Transition (asset)/obligation | | | — | | | — | | | — | | | — | |
| | Prior service cost/(credit) | | | 1,724 | | | 1,870 | | | 102 | | | 157 | |
| | | | | | | | | | |
Total accumulated OCI (not adjusted for applicable tax) | | $ | 51,049 | | $ | 17,458 | | $ | 2,337 | | $ | 1,122 | |
| | | | | | | | | | |
Weighted-average assumptions used to determine benefit obligations | | | | | | | | | | | | | |
| | Discount rate | | | 6.25 | % | | 6.80 | % | | 6.25 | % | | 6.80 | % |
| | Rate of compensation increase | | | 3.00 | % | | 3.00 | % | | N/A | | | N/A | |
Table of Contents
Components of Net Periodic Benefit Cost and
Other Changes Recognized in Other Comprehensive Income (OCI)
| | | | | | | | | | | | | | |
| | Farmer Bros. Plan
Years ended
June 30, | | Brewmatic Plan
Years ended
June 30, | |
|---|
| | 2009 | | 2008 | | 2009 | | 2008 | |
|---|
| | (In thousands)
| | (In thousands)
| |
|---|
Components of net periodic benefit cost | | | | | | | | | | | | | |
| | Service cost | | $ | 2,757 | | $ | 2,317 | | $ | 47 | | $ | 39 | |
| | Interest cost | | | 5,689 | | | 4,907 | | | 219 | | | 203 | |
| | Expected return on plan assets | | | (6,793 | ) | | (7,743 | ) | | (282 | ) | | (326 | ) |
| | Amortization of net (gain)/loss | | | 535 | | | — | | | 45 | | | 9 | |
| | Amortization of prior service cost/(credit) | | | 146 | | | 7 | | | 55 | | | 54 | |
| | | | | | | | | | |
| | Net periodic benefit cost | | $ | 2,334 | | $ | (512 | ) | $ | 84 | | $ | (21 | ) |
Other Changes Recognized in OCI | | | | | | | | | | | | | |
| | Net (gain)/loss | | $ | 34,271 | | $ | 12,135 | | $ | 1,314 | | $ | 452 | |
| | Prior service cost/(credit) | | | — | | | 1,826 | | | — | | | 21 | |
| | Amortization of net gain/(loss) | | | (535 | ) | | — | | | (45 | ) | | (9 | ) |
| | Amortization of transition asset/(obligation) | | | — | | | — | | | — | | | — | |
| | Amortization of prior service (cost)/credit | | | (146 | ) | | (7 | ) | | (55 | ) | | (54 | ) |
| | | | | | | | | | |
| | Total recognized in other comprehensive income | | $ | 33,590 | | $ | 13,954 | | $ | 1,214 | | $ | 410 | |
| | Total recognized in net periodic benefit cost and OCI | |
$ |
35,924 | |
$ |
13,442 | |
$ |
1,298 | |
$ |
389 | |
Weighted-average assumptions used to determine net periodic benefit cost | | | | | | | | | | | | | |
| | Discount rate | | | 6.80 | % | | 6.00 | % | | 6.80 | % | | 6.00 | % |
| | Expected long-term return on plan assets | | | 8.25 | % | | 8.25 | % | | 8.25 | % | | 8.25 | % |
| | Rate of compensation increase | | | 3.00 | % | | 3.00 | % | | N/A | | | N/A | |
All qualifying employees of the DSD Coffee Business who accepted the Company's offer of employment were allowed to enroll in the Farmer Bros. Co. Plan was $71,896,000 and $74,826,000 as of June 30, 2006 and June 30, 2005, respectively. The accumulated benefit obligation for the Brewmatic Co. Plan was $3,457,000 and $3,888,000 as of June 30, 2006 and June 30, 2005, respectively.
| | Years ended June 30 | |
| | 2006 | | 2005 | |
| | (In thousands) | |
Accumulated benefit obligation | | $ | 75,144 | | $ | 78,714 | |
Components of net periodic benefit cost | | | | | |
Service cost | | $ | 2,814 | | $ | 2,117 | |
Interest cost | | $ | 4,510 | | $ | 4,284 | |
Expected return on plan assets | | $ | (6,624 | ) | $ | (6,238 | ) |
Amortization of prior service cost | | $ | 63 | | $ | 184 | |
Amortization of net (gain)/loss | | $ | 1,006 | | $ | 70 | |
Net periodic benefit cost | | $ | 1,769 | | $ | 418 | |
Estimated future benefit payments for years ended June 30,
| | (In thousands) | |
2007 | | | $ | 3,750 | | |
2008 | | | $ | 3,940 | | |
2009 | | | $ | 4,120 | | |
2010 | | | $ | 4,320 | | |
2011 | | | $ | 4,630 | | |
years 2012 - 2016 | | | $ | 28,420 | | |
These amounts are based on current data and assumptions and reflect expected future service, as appropriate.
The Company expects to make no contributions toduring March 2009. Those who enrolled in the Farmer Bros. Co. Plan were granted full service credit for plan vesting and eligibility but not for purposes of benefit accruals. Additional cost in fiscal 2007, but expects2009 related to contribute approximately $25,000these employees was $345,000.
Basis Used to the Brewmatic Co.Determine Expected Long-term Return on Plan in fiscal 2007.Assets
Farmer Bros. Co. Plan
Assumptions: | | | | | |
Weighted average assumptions used to determine benefit obligations at June 30 | | | | | |
| | 2006 | | 2005 | |
Discount rate | | 6.25 | % | 5.30 | % |
Rate of compensation increase | | 3.50 | % | 3.50 | % |
Weighted average assumptions used to determine net periodic benefit cost for years ended June 30 | | | | | |
| | 2006 | | 2005 | |
Discount rate | | 5.30 | % | 6.30 | % |
Rate of return on assets | | 8.00 | % | 8.00 | % |
Rate of compensation increase | | 3.50 | % | 3.50 | % |
Brewmatic Co. Plan
Assumptions:
Weighted average assumptions used Historical and future projected returns of multiple asset classes were analyzed to determine benefit obligations at June 30
| | 2006 | | 2005 | |
Discount rate | | 6.25 | % | 5.30 | % |
Rate of compensation increase | | N/A | | N/A | |
Weighted average assumptions used to determine net periodic benefit cost for years ended June 30
| | 2006 | | 2005 | |
Discount rate | | 5.30 | % | 6.30 | % |
Rate of return on assets | | 8.00 | % | 8.00 | % |
Rate of compensation increase | | N/A | | N/A | |
Information for pension plans with an accumulated benefit obligation in excess of plan assets
| | 2006 | | 2005 | |
| | (In thousands) | |
Projected benefit obligation | | $ | 3,457 | | $ | 3,888 | |
Accumulated benefit obligation | | $ | 3,457 | | $ | 3,888 | |
Fair value of plan assets | | $ | 3,697 | | $ | 3,583 | |
(Decrease) increase in minimum liability included in other comprehensive income | | $ | (1,385 | ) | $ | 181 | |
To develop the expected long terma risk-free real rate of return on asset assumption the Company considers the current level of returns on long term bonds and equities, the level of risk associated with each asset class and the expectationspremiums for future returns of each asset class. The overall rate for each asset class was developed by combining a long-term inflation component, the risk-free real rate of return, and the associated risk premium. A weighted average rate was developed based on those overall rates and the target asset assumption for our plans is 8% forallocations of the years ended June 30, 2006 and 2005.
Plan Assets
The tables below detail assets by category for the Company’s pension plans.
Percent of Plan Assets
| | Farmer Bros. Plan
As of June 30, | | Brewmatic Plan
As of June 30, | |
Asset Categories | | | | 2006 | | 2005 | | 2006 | | 2005 | |
Equity securities | | | 69 | % | | | 86 | % | | | 69 | % | | | 90 | % | |
Debt securities | | | 22 | % | | | 14 | % | | | 22 | % | | | 10 | % | |
Real estate | | | 9 | % | | | 0 | % | | | 9 | % | | | 0 | % | |
| | | 100 | % | | | 100 | % | | | 100 | % | | | 100 | % | |
| | | | | | | | | | | | | | | | | | | |
Description of Investment Policy
Our The Company's investment strategy for employee benefit plans is to build an efficient, well-diversified portfolio based on a long-term, strategic outlook of the investment markets. The investment markets outlook utilizes both the historical-based and forward-looking return forecasts to establish future return expectations for various asset classes. These return expectations are used to develop a core asset allocation based on the
Table of Contents
specific needs of each plan. The core asset allocation utilizes multiple investment managers in order to maximize the plan’splan's return while minimizing risk.
Additional Disclosures
| | | | | | | | | | | | | | | |
| | Farmer Bros. Plan
Years ended
June 30, | | Brewmatic Plan
Years ended
June 30, | |
|---|
| | 2008 | | 2008 | | 2008 | | 2008 | |
|---|
| | (In thousands)
| | (In thousands)
| |
|---|
Comparison of obligations to plan assets | | | | | | | | | | | | | |
| | Projected benefit obligation | | $ | 96,652 | | $ | 85,681 | | $ | 3,476 | | $ | 3,352 | |
| | Accumulated benefit obligation | | $ | 88,269 | | $ | 78,112 | | $ | 3,476 | | $ | 3,352 | |
| | Fair value of plan assets at measurement date | | $ | 59,266 | | $ | 84,219 | | $ | 2,395 | | $ | 3,540 | |
Plan assets by category | | | | | | | | | | | | | |
| | Equity securities | | | 71 | % | | 68 | % | | 72 | % | | 68 | % |
| | Debt securities | | | 21 | % | | 24 | % | | 19 | % | | 24 | % |
| | Real Estate | | | 8 | % | | 8 | % | | 9 | % | | 8 | % |
| | | | | | | | | | |
| | | Total | | | 100 | % | | 100 | % | | 100 | % | | 100 | % |
Target Plan Asset Allocation
| | | | |
| | 2009 | |
|---|
Equity securities |
| 2006
|
70.70 | % |
EquityDebt securities
| | 67.5
| 21.03 | % |
Debt securitiesReal estate
| | 24.0
| 8.27 | % |
| | | |
Real estateTotal
| | 8.5
| 100.00 | % |
Total
| | 100.0
| %
|
Estimated Future Contributions and Refunds
The Company expects to make $4,800,000 in contributions to the Farmer Bros. Co. Plan in fiscal 2010, and expects to contribute approximately $28,000 to the Brewmatic Co. Plan in fiscal 2010. The Company is not aware of any refunds expected from postretirement plans.
Estimated Future Benefit Payments
The following benefit payments are expected to be paid over the next 10 fiscal years ending:
Estimated future benefit payments
(In thousands)
| | | | | | | |
Year ending | | Farmer Bros. Plan | | Brewmatic Plan | |
|---|
June 30, 2010 | | $ | 4,520 | | $ | 310 | |
June 30, 2011 | | $ | 4,770 | | $ | 300 | |
June 30, 2012 | | $ | 5,090 | | $ | 300 | |
June 30, 2013 | | $ | 5,560 | | $ | 290 | |
June 30, 2014 | | $ | 5,970 | | $ | 280 | |
June 30, 2015 – June 30, 2019 | | $ | 37,320 | | $ | 1,400 | |
These amounts are based on current data and assumptions and reflect expected future service, as appropriate.
Table of Contents
Defined Contribution Plans
The Company also has defined contribution plans for all its eligible employees. No Company contributions have been made nor are any required to be made to these defined contribution plans.plans during the years ended June 30, 2009, 2008 or 2007, except contributions in the amount of $4,000 to a CBI defined contribution plan during fiscal 2007. CBI's defined contribution plan was merged with the the Farmer Bros. Plan during fiscal 2008.
Post RetirementPost-Retirement Benefits
The Company sponsors defined benefit postretirement medical and dental plans that cover non-union employees and retirees, and certain union locals. The plan is contributory and retiree contributions are fixed at a current level. The plan is not funded. Effective January 1, 2008 the Company adopted a new plan for retiree medical benefits. The new plan is a cost sharing approach between the Company and covered employees and dependents in which the Company subsidizes a larger proportion of covered expenses for retirees who were long-term employees, and provides less coverage for retirees who were short-term employees. Additionally, the plan establishes a maximum Company contribution.
| | | | | | | |
Change in Benefit Obligation | | Fiscal 2009 | | Fiscal 2008 | |
|---|
| | (In thousands)
| |
|---|
Projected benefit obligation at beginning of year | | $ | 18,630 | | $ | 45,855 | |
Service cost | | | 788 | | | 1,428 | |
Interest cost | | | 1,278 | | | 1,960 | |
Plan change | | | — | | | (21,988 | ) |
Gains | | | (601 | ) | | (7,683 | ) |
Benefits paid | | | (874 | ) | | (942 | ) |
| | | | | | |
Projected benefit obligation at end of year | | $ | 19,221 | | $ | 18,630 | |
| | | | | | | |
Change in Plan Assets | | Fiscal 2009 | | Fiscal 2008 | |
|---|
| | (In thousands)
| |
|---|
Fair value of plan assets at beginning of year | | $ | — | | $ | — | |
Actual return on assets | | | — | | | — | |
Employer contributions | | | 874 | | | 942 | |
Participant contributions | | | — | | | — | |
Benefits paid | | | (874 | ) | | (942 | ) |
| | | | | | |
Fair value of plan assets at end of year | | $ | — | | $ | — | |
Funded Status of Plan | | $ | (19,221 | ) | $ | (18,630 | ) |
| | | | | | | |
Amounts Recognized in the Statement of Financial Position Consist of: | | Fiscal 2009 | | Fiscal 2008 | |
|---|
| | (In thousands)
| |
|---|
Noncurrent assets | | $ | — | | $ | — | |
Current liabilities | | | 963 | | | 1,010 | |
Noncurrent liabilities | | | 18,258 | | | 17,620 | |
| | | | | | |
Total | | $ | 19,221 | | $ | 18,630 | |
Table of Contents
| | | | | | | |
Amounts Recognized in Accumulated Other Comprehensive Income Consist of: | | Fiscal 2009 | | Fiscal 2008 | |
|---|
| | (In thousands)
| |
|---|
Net gain | | $ | (16,510 | ) | $ | (16,991 | ) |
Transition obligation | | | — | | | — | |
Prior service credit | | | (2,344 | ) | | (2,575 | ) |
| | | | | | |
Total accumulated other comprehensive income | | $ | (18,854 | ) | $ | (19,566 | ) |
| | | | | | | |
Other Changes in Plan Assets and Benefit Obligations Recognized in Other Comprehensive Income | | Fiscal 2009 | | Fiscal 2008 | |
|---|
| | (In thousands)
| |
|---|
Unrecognized actuarial gain | | $ | (601 | ) | $ | (7,683 | ) |
Unrecognized transition (asset)/obligation | | | — | | | — | |
Unrecognized prior service cost | | | — | | | (21,987 | ) |
Amortization of net loss | | | 1,082 | | | 858 | |
Amortization of prior service cost | | | 230 | | | (973 | ) |
| | | | | | |
Total recognized in other comprehensive income | | $ | 711 | | $ | (29,785 | ) |
| | | | | | |
The following weighted average assumptions were used to determine the benefit obligationsestimated net gain and theprior service cost that will be amortized from accumulated other comprehensive income into net periodic benefit cost.cost over fiscal 2009 is ($1,015,000) and ($230,000) respectively.
| | | | |
Estimated Future Benefit Payments (In thousands) | |
| |
|---|
Fiscal 2010 | | $ | 963 | |
Fiscal 2011 | | | 1,076 | |
Fiscal 2012 | | | 1,146 | |
Fiscal 2013 | | | 1,227 | |
Fiscal 2014 | | | 1,330 | |
Fiscal 2015-2019 | | | 9,109 | |
| | | | |
Expected Contributions for the Year ending June 30, 2010 (In thousands) | |
| |
|---|
Fiscal 2010 | | $ | 963 | |
| | | | | | | |
Components of Net Periodic Postretirement Benefit Cost | | Fiscal 2009 | | Fiscal 2008 | |
|---|
| | (In thousands)
| |
|---|
Service cost | | $ | 788 | | $ | 1,428 | |
Interest cost | | | 1,278 | | | 1,960 | |
Expected return on assets | | | — | | | — | |
Amortization of unrecognized net gain | | | (1,082 | ) | | (858 | ) |
Amortization of unrecognized transition (asset)/obligation | | | — | | | — | |
Amortization of unrecognized prior service cost | | | (230 | ) | | 973 | |
| | | | | | |
Net periodic benefit cost | | $ | 754 | | $ | 3,503 | |
Total recognized in other comprehensive income | | | 711 | | | (29,786 | ) |
| | | | | | |
Total recognized in net periodic benefit cost and other comprehensive income | | $ | 1,465 | | $ | (26,283 | ) |
| | | | | | |
Table of Contents
Weighted average assumptions usedSensitivity in Fiscal 2009 Results
Assumed health care cost trend rates have a significant effect on the amounts reported for the health care plan. A one percentage point change in assumed health care cost trend rates would have the following effects in fiscal 2009 (in thousands):
| | | | | | | |
| | 1-Percentage Point | |
|---|
| | Increase | | Decrease | |
|---|
Effect on total of service and interest cost components | | $ | 327 | | $ | (266 | ) |
Effect on accumulated postretirement benefit obligation | | $ | 2,532 | | $ | (2,089 | ) |
Note 9. Bank Loans
On March 2, 2009 the Company and its wholly owned subsidiary, CBI, as Borrowers, entered into a Loan and Security Agreement (the "Loan Agreement"), with Wachovia Bank, National Association, as Lender, providing for a $50 million senior secured revolving credit facility expiring in February 2012 to determine benefit obligationhelp finance the DSD Coffee Business acquisition and for general corporate purposes. The Loan Agreement contains a variety of restrictive covenants customary in an asset-based lending facility, including a fixed charge coverage requirement, and it places limits on capital expenditures and dividends. The Loan Agreement allows the Company to pay dividends at the current rate, subject to certain cash flow and liquidity requirements.
All outstanding obligations under the Loan Agreement are collateralized by perfected security interests in the assets of the Borrowers, excluding the preferred stock held in investment accounts. The revolving line provides for advances of 85% of eligible accounts receivable and 65% of eligible inventory, as defined. The Loan Agreement has an unused commitment fee of 0.375%. The interest rate varies based upon line usage, borrowing base availability and market conditions. The range is PRIME + 0.25% to PRIME + 0.75% or LIBOR + 2.25% to LIBOR + 2.75%, subject to a minimum for LIBOR based advances of 3.25%. The interest rate was 3.75% at June 30, 2009.
| | 2006 | | 2005 | |
Discount rate | | 6.25 | % | 5.30 | % |
Rate of compensation increase | | | | | |
Initial medical rate trend | | 9.00 | % | 10.00 | % |
Ultimate medical trend rate | | 5.50 | % | 5.50 | % |
Number of years from initial to ultimate trend rate | | 6 | | 6 | |
Initial dental/vision trend rate | | 6.50 | % | 7.00 | % |
Ultimate dental/vision trend rate | | 5.50 | % | 5.50 | % |
Reconciliation of funded status.
| | 2006 | | 2005 | |
| | (In thousands) | |
Accumulated post retirement benefit obligation (“APBO”) | | | | | |
Actives not eligible to rehire | | $ | (10,625 | ) | $ | (12,887 | ) |
Actives eligible to rehire | | (7,269 | ) | (9,230 | ) |
Retirees | | (11,955 | ) | (11,539 | ) |
Total APBO* | | $ | (29,849 | ) | $ | (33,656 | ) |
Fair market value of assets | | $ | 0 | | $ | 0 | |
Funded status | | $ | (29,849 | ) | $ | (33,656 | ) |
Unrecognized transition obligation | | 0 | | 0 | |
Unrecognized prior service cost | | 7,380 | | 1,046 | |
Unrecognized cumulative net loss | | (8,967 | ) | 3,570 | |
Accrued post retirement benefit cost as of June 30 | | $ | (31,436 | ) | $ | (29,041 | ) |
Retiree medical claims paid | | $ | 1,214 | | $ | 1,012 | |
*The APBO reflects the recognition of an estimate of the subsidy available under Medicare Part DCompany is in accordancecompliance with FASB Staff Position No. FAS 106-2 (“FSP FAS 106-2”). This change decreased the APBO by $2,132,000all restrictive covenants and limitations as of June 30, 2005.
SFAS No. 106, as amended by SFAS No. 132, also requires2009, and anticipates being in compliance with all restrictive covenants for the disclosureforeseeable future. On June 30, 2009 borrowings under the credit facility were $16.2 million and the Company had excess availability under the credit facility of the effects of a 1% increase and decrease in the health care inflation trend assumption on the accumulated postretirement benefit obligation and net periodic service and interest cost. These results are shown below.$33.8 million.
| | Plan Year | | Effect of 1% | |
| | Results | | Increase | | Decrease | |
| | (In thousands) | |
Accumulated postretirement benefit obligation as of June 30, 2006 | | | $ | 29,849 | | | | $ | 2,510 | | | $ | (2,105 | ) |
Service cost for plan year ended June 30, 2006 | | | $ | 1,269 | | | | $ | 177 | | | $ | (137 | ) |
Interest for plan year ended June 30, 2006 | | | $ | 1,650 | | | | $ | 145 | | | $ | (120 | ) |
Presented below is the change in the accumulated postretirement benefit obligation from the prior year.
| | 2006 | | 2005 | |
| | (In thousands) | |
Accumulated postretirement benefit obligation beginning of year | | $ | 33,656 | | $ | 29,590 | |
Service cost | | 1,269 | | 1,140 | |
Interest cost | | 1,651 | | 1,815 | |
Actuarial loss or (gain) | | (12,688 | ) | 4,255 | |
Benefits paid | | (1,214 | ) | (1,012 | ) |
Plan change | | 7,175 | | — | |
Change due to Medicare Part D subsidy* | | — | | (2,132 | ) |
Accumulated postretirement benefit obligation as of end of year | | $ | 29,849 | | $ | 33,656 | |
* Recognized in accordance with FSP FAS 106-2.
Presented below is the change in the fair value of assets from the prior year.
| | 2006 | | 2005 | |
| | (In thousands) | |
Fair value of plan assets at the beginning of the year | | $ | 0 | | $ | 0 | |
Actual return on plan assets | | 0 | | 0 | |
Company contributions | | 1,214 | | 1,012 | |
Plan participants contributions | | 253 | | 216 | |
Benefit paid | | (1,467 | ) | (1,228 | ) |
Fair value of plan assets at the end of the year | | $ | 0 | | $ | 0 | |
Presented below is a table of projected benefit payments from the plan, net of expected retiree contributions.
Years ended June 30, | | | | With Medicare
Part D Subsidy | | Without Medicare
Part D Subsidy | | Medicare
Part D Subsidy | |
| | (In thousands) | |
2007 | | | $ | 1,592 | | | | $ | 1,689 | | | | $ | 97 | | |
2008 | | | $ | 1,774 | | | | $ | 1,884 | | | | $ | 110 | | |
2009 | | | $ | 1,918 | | | | $ | 2,042 | | | | $ | 124 | | |
2010 | | | $ | 2,125 | | | | $ | 2,259 | | | | $ | 133 | | |
2011 | | | $ | 2,205 | | | | $ | 2,350 | | | | $ | 145 | | |
2012-2016 | | | $ | 12,808 | | | | $ | 13,633 | | | | $ | 825 | | |
Expected 2007 benefit payments (net of retiree contributions): $1,458,000.
Note 7.10. Employee Stock Ownership Plan
The Farmer Bros. Co. Employee Stock Ownership Plan (ESOP)Company's ESOP was established in 2000 to provide benefits to all employees. The plan is a leveraged ESOP in which Company is the lender. The loanloans will be repaid from the Company’sCompany's discretionary plan contributions over athe original fifteen year termterms with a variable rate of interest. The interest 6.85%rate was 1.85% at June 30, 2006.2009.
| | | As of and for the years ended June 30, | | | As of and for the years ended
June 30, | |
|---|
| | 2006 | | 2005 | | 2004 | | | 2009 | | 2008 | | 2007 | |
|---|
Loan amount (in thousands) | | $ | 54,441 | | $ | 59,242 | | $ | 64,567 | | | $ | 40,039 | | $ | 44,840 | | $ | 49,640 | |
Shares purchased | | — | | — | | 1,286,430 | | | — | | — | | — | |
|
Shares are held by the plan trustee for allocation among participants as the loan is repaid. The unencumbered shares are allocated to participants using a compensation-based formula. Subject to vesting requirements, allocated shares are owned by participants and shares are held by the plan trustee until the participant retires.
Table of Contents
The Company reports compensation expense equal to the fair market price of shares committed to be released to employees in the period in which they are committed. The cost of shares purchased by the ESOP which have not been committed to be released or allocated to participants are shown as a contra-equity account “Unearned"Unearned ESOP Shares”Shares" and are excluded from earnings per share calculations.
During the fiscal years ended June 30, 2006, 20052009, 2008 and 20042007 the Company charged $5,312,000, $6,127,000$4,925,000, $5,711,000 and $4,234,000$5,863,000 to compensation expense related to the ESOP. The difference between cost and fair market value of committed to be released shares, which was ($774,000) 151,000), $44,000($364,000) and $1,282,000($695,000) for the years ended June 30, 2006, 20052009, 2008 and 2004,2007, respectively, is recorded as additional paid-in capital.
| | | June 30, | |
| | June 30, | |
|---|
| | 2006 | | 2005 | |
| | 2009 | | 2008 | |
|---|
Allocated shares | | 846,737 | | 636,572 | | Allocated shares | | 1,497,454 | | 840,984 | |
Committed to be released shares | | 119,440 | | 119,434 | | Committed to be released shares | | 202,897 | | 115,800 | |
Unallocated shares | | 2,019,839 | | 2,242,671 | | Unallocated shares | | 1,475,787 | | 2,023,481 | |
Total ESOP shares | | 2,986,016 | | 2,998,677 | | |
| | | | | | | | |
| | | Total ESOP shares | | 3,176,138 | | 2,980,265 | |
| | | | | | | | |
| | | | (In thousands) | |
Fair value of ESOP shares | | Fair value of ESOP shares | | $ | 70,307 | | $ | 63,033 | |
| | (In thousands) | |
Fair value of ESOP shares | | $ | 64,737 | | $ | 66,751 | |
| | | | | | | |
Note 8. Income Taxes11. Share-Based Compensation
The current and deferred components On August 23, 2007, the Company's Board of Directors approved the Farmer Bros. Co. 2007 Omnibus Plan (the "Plan"), which was approved by stockholders on December 6, 2007. Prior to adoption of the provision for income taxes consistPlan the Company had no share-based compensation plan. Awards issued under the Plan may take the form of stock options, stock appreciation rights, restricted stock, restricted stock units, dividend equivalents, performance-based awards, stock payments, cash-based awards or other incentives payable in cash or shares of stock, or any combination thereof. Each award will be set forth in a separate agreement with the person receiving the award and will indicate the type, terms and conditions of the following:award. The maximum number of shares of common stock as to which awards may be granted under the Plan is 1,000,000, subject to adjustment as provided in the Plan.
| | June 30, | |
| | 2006 | | 2005 | | 2004 | |
| | (In thousands) | |
Current federal | | $ | 3,124 | | $ | (1,703 | ) | $ | 4,753 | |
Current state | | 1,126 | | (689 | ) | 78 | |
Total current provision | | $ | 4,250 | | $ | (2,392 | ) | $ | 4,831 | |
Deferred federal | | $ | (4,338 | ) | $ | (1,165 | ) | $ | (1,402 | ) |
Deferred state | | (663 | ) | (2,345 | ) | (134 | ) |
Total deferred provision | | $ | (5,001 | ) | $ | (3,510 | ) | $ | (1,536 | ) |
Total tax provision | | $ | (751 | ) | $ | (5,902 | ) | $ | 3,295 | |
The Company accounts for share-based compensation in accordance with SFAS No. 123 (revised 2004), "Share-Based Payment" ("SFAS 123R"), and related SEC rules included in Staff Accounting Bulletin No. 107 , which require the measurement and recognition of compensation expense for all share-based payment awards made under the Plan based on estimated fair values.
SFAS 123R requires companies to estimate the fair value of share-based payment awards on the date of grant using an option-pricing model. The value of the provisionportion of the award that is ultimately expected to vest is recognized as expense over the requisite service period in the Company's consolidated statement of operations. Prior to fiscal 2008 the Company did not have share-based compensation.
Share-based compensation expense recognized during the period is based on the value of the portion of share-based payment awards that is ultimately expected to vest during the period. Compensation expense recognized for income taxes toall stock option awards granted is recognized using the statutory federal income taxstraight-line method over the vesting period of three years. The share-based compensation expense is as follows:
| | June 30, | |
| | 2006 | | 2005 | | 2004 | |
| | (In thousands) | |
Federal statutory tax rate | | 34 | % | 34 | % | 35 | % |
Income tax expense (benefit) at statutory rate | | $ | 1,362 | | $ | (3,852 | ) | $ | 5,594 | |
State income tax (net federal tax benefit) | | 206 | | (696 | ) | 831 | |
Life insurance proceeds | | 0 | | 0 | | (1,476 | ) |
Dividend income exclusion | | (849 | ) | (819 | ) | (821 | ) |
Valuation allowance | | (1,379 | ) | 1,379 | | 0 | |
Change in contingency reserve | | 406 | | (2,492 | ) | (896 | ) |
Other (net) | | (497 | ) | 578 | | 63 | |
| | $ | (751 | ) | $ | (5,902 | ) | $ | 3,295 | |
Income taxes paid | | $ | 2,301 | | $ | 2,356 | | $ | 3,443 | |
35
The primary componentsrecognized in the Company's consolidated statement of temporary differences which give rise tooperations for the Company’s net deferred tax assets are as follows:
| | June 30, | |
| | 2006 | | 2005 | |
| | (In thousands) | |
Deferred tax assets: | | | | | |
Postretirement benefits | | $ | 12,187 | | $ | 11,664 | |
Accrued liabilities | | 3,266 | | 3,121 | |
Capital loss carry forwards | | 2,807 | | 4,427 | |
Other | | 1,808 | | 780 | |
Total deferred tax assets | | $ | 20,068 | | $ | 19,992 | |
Deferred tax liabilities: | | | | | |
Pension assets | | $ | (6,563 | ) | $ | (7,040 | ) |
Unrealized gain on investments | | (449 | ) | (2,759 | ) |
Other | | (3,139 | ) | (3,370 | ) |
Total deferred tax liabilities | | $ | (10,151 | ) | $ | (13,169 | ) |
Valuation allowance | | 0 | | (1,379 | ) |
Net deferred tax assets | | $ | 9,917 | | $ | 5,444 | |
The Company has approximately $6.8 million and $12.0 million of federal and state capital loss carry forwards, respectively, that will expire on June 30, 2010, unless previously utilized. During the yearfiscal years ended June 30, 2006,2009 and 2008 is based on awards ultimately expected to vest. Currently, management estimates that there will be no forfeitures based on the Company's historical turnover. SFAS 123R requires forfeitures
Table of Contents
to be estimated at the time of grant and revised, if necessary, in subsequent periods if actual forfeitures differ from those estimates.
The Company uses the Black-Scholes option valuation allowancemodel, which requires management to make certain assumptions for estimating the fair value of stock options at the date of the grant. The Black-Scholes option valuation model was developed for use in estimating the fair value of traded options that have no vesting restrictions and are fully transferable. In addition, option valuation models require the input of highly subjective assumptions including the expected stock price volatility. Because the Company's stock options have characteristics significantly different from those of traded options, and because changes in the subjective input assumptions can materially affect the fair value estimates, in management's opinion the existing models may not necessarily provide a reliable single measure of the fair value of the Company's stock options. Although the fair value of stock options is determined in accordance with SFAS 123R using an option valuation model, that value may not be indicative of the fair value observed in a willing buyer/willing seller market transaction.
The following are the weighted average assumptions used in the Black-Scholes valuation model for the fiscal years ended June 30, 2009 and 2008:
| | | | | | | |
| | FY 2009 | | FY 2008 | |
|---|
Average fair value of options | | $ | 6.68 | | $ | 6.12 | |
Risk-free interest rate | | | 5.45 | % | | 2.95 | % |
Dividend yield | | | 2.20 | % | | 2.03 | % |
Average expected life | | | 5 years | | | 5 years | |
Expected stock price volatility | | | 32.38 | % | | 32.38 | % |
The Company's assumption regarding expected stock price volatility is based on the historical volatility of the Company's stock price. The risk-free interest rate is based on U.S. Treasury zero-coupon issues at the date of grant with a remaining term equal to the expected life of the stock options.
The following table summarizes stock option activity from adoption of the Plan through June 30, 2009:
Outstanding Awards
| | | | | | | | | | | | | | | | |
| | Number of
Stock options | | Weighted
Average
Exercise Price | | Weighted
Average Fair
Value | | Weighted
Average
Remaining
Life
(Years) | | Aggregate
Intrinsic
Value
(In thousands) | |
|---|
Balance January 1, 2008 | | | 0 | | | | | | | | | | | | | |
Granted | | | 117,500 | | $ | 22.62 | | $ | 6.16 | | | 6.6 | | $ | — | |
| | | | | | | | | | | | | | | | |
Balance July 1, 2008 | | | 117,500 | | $ | 22.62 | | $ | 6.16 | | | 6.6 | | $ | — | |
Granted | | | 121,500 | | $ | 21.76 | | $ | 6.68 | | | — | | $ | 2 | |
| | | | | | | | | | | | | | | | |
Balance June 30, 2009 | | | 239,000 | | $ | 22.22 | | $ | 6.41 | | | 6.1 | | $ | 60 | |
| | | | | | | | | | | | | | | | |
Vested and exercisable, June 30, 2009 | | | 40,490 | | $ | 22.66 | | $ | 6.16 | | | 5.7 | | $ | 9 | |
Vested and expected to vest, June 30, 2009 | | | 232,000 | | $ | 22.23 | | $ | 6.41 | | | 6.0 | | $ | 52 | |
Table of Contents
Unvested Awards
| | | | | | | | | | | | | | |
| | Number of
Awards | | Weighted
Average
Exercise price | | Weighted
Average
Grant Date
Fair Value | | Weighted
Average
Remaining
Amortization
Period (Years) | |
|---|
Outstanding at January 1, 2008 | | | 0 | | | | | | | | | | |
| | Granted | | | 117,500 | | $ | 22.62 | | $ | 6.16 | | | — | |
| | Vested | | | 0 | | | — | | | — | | | — | |
| | | | | | | | | | | | | |
Outstanding at July 1, 2008 | | | 117,500 | | $ | 22.62 | | $ | 6.16 | | | — | |
| | Granted | | | 121,500 | | $ | 21.76 | | $ | 6.68 | | | — | |
| | Vested | | | (40,490 | ) | $ | 22.66 | | $ | 6.16 | | | — | |
| | | | | | | | | | | | | |
Outstanding at June 30, 2009 | | | 198,510 | | $ | 22.13 | | $ | 6.46 | | | 2.12 | |
| | | | | | | | | | | | | |
The aggregate intrinsic values in the table above represent the total pretax intrinsic value, based on the Company's closing stock price of $22.88 at June 30, 2009 and $21.15 at June 30, 2008, representing the last trading day of the respective years, which would have been received by award holders had all award holders exercised their awards that were in-the-money as of those dates. As of June 30, 2009 and 2008, respectively, there was approximately $1,014,000 and $489,000 of unrecognized compensation cost related to stock options. Compensation expense recognized in general and administrative expense was $385,000 and $66,000 for fiscal 2009 and 2008, respectively.
During fiscal 2009 and 2008 the capital loss carry forwards has been released as management believes realizationCompany granted a total of 26,100 and 25,600 shares of restricted stock, respectively, with a weighted average grant date fair value of $21.76 and $22.66 per share, respectively, to eligible employees, officers and directors under the Plan. Shares of restricted stock vest at the end of three years for eligible employees and officers who are employees. Shares of restricted stock vest ratably over a period of three years for directors and officers who are not employees. Compensation expense is more likely than not based upon projected generation of capital gains prior torecognized on a straight-line basis over the expiration of the carry forwardservice period based on factsthe estimated fair value of the restricted stock. Compensation expense recognized in general and circumstances at this time.administrative expense was $293,000 and $68,000, respectively, for the fiscal years ended June 30, 2009 and 2008. As of June 30, 2009 and 2008, there was approximately $760,000 and $503,000, respectively, of unrecognized compensation cost related to restricted stock.
Table of Contents
The following table summarizes the status of the Company's restricted stock as of June 30, 2009 and June 30, 2008:
Outstanding Awards
| | | | | | | | | | | | | |
| | Shares
Awarded | | Weighted
Average Fair
Value | | Weighted
Average
Remaining
Life (Years) | | Aggregate
Intrinsic
Value
(In thousands) | |
|---|
Balance January 1, 2008 | | | 0 | | | | | | | | | | |
Granted | | | 25,600 | | $ | 22.67 | | | | | $ | 545.3 | |
Exercised/Released | | | 0 | | | | | | | | | | |
Cancelled/Forfeited | | | 0 | | | | | | | | | | |
| | | | | | | | | | | | | |
Balance July 1, 2008 | | | 25,600 | | $ | 22.67 | | | | | $ | 545.3 | |
Granted | | | 26,100 | | $ | 21.76 | | | | | $ | 568.2 | |
Exercised/Released | | | (3,031 | ) | $ | 22.70 | | | | | $ | 57.5 | |
Cancelled/Forfeited | | | (500 | ) | $ | 21.76 | | | | | $ | 11.4 | |
| | | | | | | | | | | | | |
Balance June 30, 2009 | | | 48,169 | | $ | 22.19 | | | 2.107 | | $ | 1,072.2 | |
| | | | | | | | | | | | | |
Vested and execisable, June 30, 2009 | | | 0 | | | | | | | | | | |
Vested and expected to vest, June 30, 2009 | | | 47,469 | | $ | 22.19 | | | 2.095 | | $ | 1,056.7 | |
Unvested Awards
| | | | | | | | |
| | Shares
Awarded | | Weighted
Average
Grant Date
Fair Value | |
|---|
Outstanding at January 1, 2008 | | | 0 | | | | |
| | Granted | | | 25,600 | | $ | 22.67 | |
| | Vested | | | 0 | | | | |
Cancelled/Forfeited | | | 0 | | | | |
| | | | | | | |
Outstanding at July 1, 2008 | | | 25,600 | | $ | 22.67 | |
| | Granted | | | 26,100 | | $ | 21.76 | |
| | Vested | | | (3,031 | ) | $ | 22.70 | |
Cancelled/Forfeited | | | (500 | ) | $ | 21.76 | |
| | | | | | | |
Outstanding at June 30, 2009 | | | 48,169 | | $ | 22.19 | |
| | | | | | | |
Note 9.12. Other Current Liabilities
Other current liabilities consist of the following:
| | June 30, | | | | | | | | |
| | 2006 | | 2005 | | | June 30, | |
|---|
| | (In thousands) | | | 2009 | | 2008 | |
|---|
Accrued workers’ compensation liabilities | | | $ | 4,052 | | | $ | 2,725 | | |
| | | (In thousands)
| |
|---|
Accrued workers' compensation liabilities | | | $ | 5,681 | | $ | 4,908 | |
Dividends payable | | | 1,688 | | | 1,608 | | | 1,849 | | 1,849 | |
Postretirement medical liability | | | 963 | | 1,010 | |
Other (including net taxes payable) | | | 406 | | | 597 | | | 928 | | 524 | |
| | | $ | 6,146 | | | $ | 4,930 | | | | | | |
| | | $ | 9,421 | | $ | 8,291 | |
| | | | | | | |
Table of Contents
Note 13. Income Taxes
The current and deferred components of the provision for income taxes consist of the following:
| | | | | | | | | | | | | |
| | June 30,
2009 | | June 30,
2008 | | June 30,
2007 | |
|---|
| | (In thousands)
| |
|---|
Current: | | | | | | | | | | |
| | Federal | | $ | (1,433 | ) | $ | (1,431 | ) | $ | 2,511 | |
| | State | | | (5 | ) | | (596 | ) | | 74 | |
| | | | | | | | |
| | | Total current (benefit) expense | | | (1,439 | ) | | (2,027 | ) | | 2,585 | |
Deferred: | | | | | | | | | | |
| | Federal | | | 11,916 | | | (3,924 | ) | | (1,864 | ) |
| | State | | | 3,805 | | | (1,449 | ) | | (689 | ) |
| | | | | | | | |
| | | Total deferred expense (benefit) | | | 15,721 | | | (5,373 | ) | | (2,553 | ) |
| | | | | | | | |
| | | | Total tax expense (benefit) | | $ | 14,283 | | $ | (7,399 | ) | $ | 33 | |
| | | | | | | | |
A reconciliation of income tax expense (benefit) to the federal statutory tax rate is as follows:
| | | | | | | | | | |
| | June 30,
2009 | | June 30,
2008 | | June 30,
2007 | |
|---|
Statutory tax rate | | | 34 | % | | 34 | % | | 34 | % |
|
|
(In thousands)
|
|
|---|
Income tax expense at statutory rate | | $ | (6,456 | ) | $ | (5,210 | ) | $ | 2,328 | |
State income tax (net of federal tax benefit) | | | (985 | ) | | (779 | ) | | 55 | |
Dividend income exclusion | | | (840 | ) | | (974 | ) | | (918 | ) |
Valuation Allowance | | | 19,663 | | | — | | | — | |
Change in Contingency Reserve (net) | | | 3,578 | | | (427 | ) | | 358 | |
Research Tax Credit (net) | | | (97 | ) | | (91 | ) | | (945 | ) |
Other (net) | | | (580 | ) | | 81 | | | (846 | ) |
| | | | | | | | |
| | $ | 14,283 | | $ | (7,399 | ) | $ | 33 | |
| | | | | | | | |
Table of Contents
The primary components of temporary differences which give rise to the Company's net deferred tax assets are as follows:
| | | | | | | | | | | |
| | June 30,
2009 | | June 30,
2008 | | June 30,
2007 | |
|---|
| | (In thousands)
| |
|---|
Deferred tax assets: | | | | | | | | | | |
| | Postretirement benefits | | $ | 22,110 | | $ | 7,701 | | $ | 17,749 | |
| | Accrued liabilities | | | 4,594 | | | 3,947 | | | 3,643 | |
| | Capital loss carryover | | | 2,757 | | | 4,668 | | | 3,270 | |
| | Net operating loss carryover | | | 5,564 | | | 0 | | | | |
| | Other | | | 6,362 | | | 5,240 | | | 1,186 | |
| | | | | | | | |
| | | 41,387 | | | 21,556 | | | 25,848 | |
Deferred tax liabilities: | | | | | | | | | | |
| | Pension assets | | | — | | | — | | | (4,851 | ) |
| | Unrealized gain on investments | | | — | | | — | | | (448 | ) |
| | Fixed assets | | | (5,056 | ) | | — | | | | |
| | Other | | | (3,270 | ) | | (6,217 | ) | | (2,490 | ) |
| | | (8,326 | ) | | (6,217 | ) | | (7,789 | ) |
Valuation allowance | | | (33,278 | ) | | — | | | — | |
| | | | | | | | |
Net deferred tax (liability) asset | | $ | (217 | ) | $ | 15,339 | | $ | 18,059 | |
| | | | | | | | |
The Company has approximately $14,600,000 and $13,500,000 of federal and state net operating loss carryforwards that will begin to expire in the years ended June 30, 2025 and June 30, 2020 respectively. The Company also has approximately $6,000,000 and $19,300,000 of federal and state capital loss carryforwards, respectively, that may only be used to offset capital gains and they expire beginning in June 30, 2013. Consideration of whether a valuation allowance should be recorded against deferred tax assets is based on the likelihood that the benefits of the deferred tax assets will or will not ultimately be realized in future periods. In making such assessment, significant weight is to be given to evidence that can be objectively verified such as recent operating results and less consideration is to be given to less objective indicators such as future earnings projections. The Company has evaluated its deferred tax assets in accordance with these requirements.
A significant negative factor was the Company's three-year historical cumulative loss as of the end of the fourth quarter of fiscal 2009, compared to the size of deferred tax assets. The deferred tax assets in fiscal 2009 increased to $41,387,000 as compared to $21,556,000 in fiscal 2008. This increase primarily resulted from decreased pension asset values which in turn created increased pension plan contribution obligations. These considerations outweighed our ability to rely on projections of future taxable income and future appreciation of pension assets as of June 30, 2009.
Accordingly, a valuation allowance of approximately $33,278,000 has been recorded to offset this deferred tax asset. Of this amount $19,663,000 was recorded as current year tax expense and $13,615,000 was recorded as a reduction in other comprehensive income.
On July 1, 2007, the Company adopted the provisions of FIN 48. The Company recorded a cumulative change of $119,000 as a decrease to retained earnings and increase to long term liabilities for uncertain tax positions and related interest and penalties.
Table of Contents
A tabular reconciliation of the total amounts (in absolute values) of unrecognized tax benefits at the beginning and end of fiscal 2009 and fiscal 2008 are as follows (in thousands):
| | | | | | | |
| | June 30,
2009 | | June 30,
2008 | |
|---|
Unrecognized tax benefits at beginning of year | | $ | 807 | | $ | 1,455 | |
Increases in tax positions for prior years | | | 4,005 | | | 158 | |
Increases in tax positions for current years | | | — | | | 31 | |
Settlements | | | (430 | ) | | (836 | ) |
Lapse in statute of limitations | | | — | | | — | |
| | | | | | |
Unrecognized tax benefits at end of year | | $ | 4,382 | | $ | 807 | |
| | | | | | |
At June 30, 2009, the Company has approximately $4,117,000 of unrecognized tax liabilities that, if recognized, would affect the effective tax rate.
In September 2008, the Internal Revenue Service ("IRS") completed an examination of the Company's U.S. income tax returns for the fiscal years ended June 30, 2004, 2005 and 2006. The Company and the IRS reached a settlement on certain issues which resulted in a decrease to the Company's total unrecognized tax benefits of $421,000 (excluding interest and penalties). Of this amount, $266,000 was realized as income in fiscal 2009.
California is currently conducting a state examination of the Company's open tax years. The Company believes it is reasonably possible that a portion of its total unrecognized tax benefits will decrease in the next 12 months upon the conclusion of this and other exams. However, it is premature to assess the range or the nature of the reasonably possible changes to the Company's unrecognized tax benefits.
The Company files income tax returns in the U.S. and in various state jurisdictions with varying statutes of limitations. The Company is no longer subject to U.S. income tax examinations for the fiscal years prior to June 30, 2006 and is no longer subject to state income tax examinations for fiscal years prior to June 30, 2005. The Company's policy is to recognize interest expense and penalties related to income tax matters as a component of income tax expense. The Company has recorded $25,000 of accrued interest and penalties associated with uncertain tax positions as of June 30, 2009.
Note 10.14. Commitments and Contingencies
With the acquisition of DSD Coffee Business, the Company assumed some of the operating lease obligations associated with the acquired vehicles. The Company incurred rent expensealso refinanced some of approximately $907,000, $779,000the existing leases and $753,000entered into new leases for certain vehicles. Pursuant to SFAS 13, "Accounting for Leases." The terms of the fiscal years ended June 30, 2006, 2005 and 2004, respectively, andcapital leases vary from 42 months to 72 months, expiring through 2015. The Company is obligated under operating leases for branch warehouses. Some operating leases have renewal options that allow the Company, as lessee, to extend the lease at the Company’s option for one or two years at a pre-agreed rental rate.leases. The Company also has one operating lease with a term greater than five years, that expires in 2019 and has a 10 year renewal option, and operating leases for computer hardware with terms that do not exceed threefour years. Rent expense for the fiscal years ended June 30, 2009, 2008 and 2007 was $3,211,000, $1,513,000 and $914,000, respectively. Amortization of assets recorded under capital leases is included with depreciation expense.
Future minimum lease paymentsTable of Contents
Contractual obligations for future fiscal years are as follows:follows (In thousands):
| | (In thousands) | |
2007 | | | $ | 739 | | |
2008 | | | 448 | | |
2009 | | | 237 | | |
2010 | | | 106 | | |
2011 | | | 21 | | |
Total | | | $ | 1,551 | | |
| | | | | | | | | | |
| | Contractual Obligations | |
|---|
Years Ended June 30, | | Capital Lease
Obligations | | Operating Lease
Obligations | | Pension Plan
Obligations | |
|---|
2010 | | $ | 958 | | $ | 5,878 | | $ | 4,290 | |
2011 | | | 351 | | | 3,180 | | | 4,480 | |
2012 | | | — | | | 2,449 | | | 4,730 | |
2013 | | | — | | | 1,888 | | | 4,970 | |
2014 | | | — | | | 1,038 | | | 5,280 | |
Thereafter | | | — | | | 309 | | | 30,940 | |
| | | | | | | | | |
| | | | | $ | 14,742 | | $ | 54,690 | |
| | | | | | | | |
Total minimum lease payments | | $ | 1,309 | | | | | | | |
Less: imputed interest (1.77% - 19.42%) | | | (57 | ) | | | | | | |
| | | | | | | | | | |
Present value of future minimum lease payments | | $ | 1,252 | | | | | | | |
Less: current portion | | | (908 | ) | | | | | | |
| | | | | | | | | | |
Long-term capital lease obligation | | $ | 344 | | | | | | | |
| | | | | | | | | | |
The Company is a party to various pending legal and administrative proceedings. It is management’smanagement's opinion that the outcome of such proceedings will not have a material impact on the Company’sCompany's financial position, results of operations, or cash flows.
Note 11.15. Quarterly Financial Data (Unaudited)
| | | September 30
2005 | | December 31
2005 | | March 31
2006 | | June 30
2006 | | | September 30,
2008 | | December 31,
2008 | | March 31,
2009 | | June 30,
2009 | |
|---|
| | (In thousands except share data) | | | (In thousands except share data)
| |
|---|
Net sales | | | $ | 48,424 | | | | $ | 54,950 | | | | $ | 53,561 | | | $ | 50,518 | | | $ | 66,524 | | $ | 76,530 | | $ | 85,604 | | $ | 113,066 | |
Gross profit | | | $ | 28,885 | | | | $ | 33,154 | | | | $ | 32,039 | | | $ | 28,465 | | | $ | 30,951 | | $ | 37,318 | | $ | 42,658 | | $ | 49,289 | |
(Loss) income from operations | | | $ | (1,124 | ) | | | $ | 3,149 | | | | $ | 67 | | | $ | (5,057 | ) | | $ | (4,255 | ) | $ | 213 | | $ | (1,606 | ) | $ | (9,555 | ) |
Net (loss) income | | | $ | (1,079 | ) | | | $ | 4,164 | | | | $ | 2,463 | | | $ | (792 | ) | |
Net (loss) income per common
share | | | $ | (0.08 | ) | | | $ | 0.30 | | | | $ | 0.18 | | | $ | (0.06 | ) | |
Net loss | | | $ | (6,085 | ) | $ | (106 | ) | $ | (1,437 | ) | $ | (25,642 | ) |
Net loss per common share | | | $ | (0.42 | ) | $ | (0.01 | ) | $ | (0.10 | ) | $ | (1.76 | ) |
| | September 30
2004 | | December 31
2004 | | March 31
2005 | | June 30
2005 | |
Net sales | | | $ | 46,708 | | | | $ | 51,220 | | | | $ | 50,271 | | | $ | 50,221 | |
Gross profit | | | $ | 29,239 | | | | $ | 30,298 | | | | $ | 29,343 | | | $ | 26,576 | |
Income (loss) from operations | | | $ | 1,002 | | | | $ | 699 | | | | $ | (2,167 | ) | | $ | (6,117 | ) |
Net income (loss) | | | $ | 1,497 | | | | $ | (4,068 | ) | | | $ | 856 | | | $ | (3,712 | ) |
Net income (loss) per common
share | | | $ | 0.11 | | | | $ | (0.30 | ) | | | $ | 0.06 | | | $ | (0.27 | ) |
| | | | | | | | | | | | | |
| | September 30,
2007 | | December 31,
2007 | | March 31,
2008 | | June 30,
2008 | |
|---|
| | (In thousands except share data)
| |
|---|
Net sales | | $ | 60,943 | | $ | 71,359 | | $ | 67,276 | | $ | 66,907 | |
Gross profit | | $ | 28,727 | | $ | 34,177 | | $ | 30,657 | | $ | 25,851 | |
(Loss) income from operations | | $ | (2,528 | ) | $ | 789 | | $ | (1,004 | ) | $ | (7,901 | ) |
Net loss | | $ | (953 | ) | $ | (227 | ) | $ | (2,710 | ) | $ | (4,034 | ) |
Net loss per common share | | $ | (0.07 | ) | $ | (0.02 | ) | $ | (0.19 | ) | $ | (0.28 | ) |
Item 9. Changes in and Disagreements with Accountants on Accounting and Financial Disclosure
None.
Item 9A. Controls and Procedures
Disclosure Controls and Procedures
Disclosure controls and procedures, as defined in Rules 13a-15(e) and 15d-15(e) promulgated under the Securities Exchange Act of 1934, as amended (the "Exchange Act"), are controls and other procedures that are designed to ensure that information required to be disclosed by us in the reports
Table of Contents
that we file or submit under the Securities Exchange Act of 1934 (the “Exchange Act”) is recorded, processed, summarized and reported, within the time periods specified in the rules and forms of the SEC. Disclosure controls and procedures include, without limitation, controls and procedures designed to ensure that information we are required to disclose in the reports that we file or submit under the Exchange Act is accumulated and communicated to our management, including our Chief Executive Officer and Chief Financial Officer, as appropriate to allow timely decisions regarding required disclosures.
As of June 30, 20062009 our management, with the participation of our Chief Executive Officer and Chief Financial Officer, carried out an evaluation of the effectiveness of our disclosure controls and procedures pursuant to Rules 13(a)-15(e) and 15(d)-15(e)Rule 13a-15(e) promulgated under the Exchange Act. Based upon this evaluation, our Chief Executive Officer and our Chief Financial Officer concluded that, as of June 30, 2006,2009, our disclosure controls and procedures were (1) designed to ensure that material information relating to our Company is accumulated and made known to our management, including our Chief Executive Officer and Chief Financial Officer, in a timely manner, particularly during the period in which this report was being prepared and (2) effective, in that they provide reasonable assurance that information we are required to disclose in the reports that we file or submit under the Exchange Act is recorded, processed, summarized and reported within the time periods specified in the SEC’s rules and forms.effective.
Management believes, however, that a controls system, no matter how well designed and operated, cannot provide absolute assurance that the objectives of the controls system are met, and no evaluation of controls can provide absolute assurance that all control deficiencies and instances of fraud, if any, within a company have been detected.
Management Report on Internal Control Over Financial Reporting
Our management is responsible for establishing and maintaining adequate internal control over financial reporting as such term is defined in Exchange Act Rules 13a-15(f) and 15d-15(f). With the participation of the Chief Executive Officer and Chief Financial Officer, our management conducted an evaluation of the effectiveness of our internal control over financial reporting based on the framework and criteria established in Internal Control—Integrated Framework, issued by the Committee of Sponsoring Organizations of the Treadway Commission. Based on this evaluation, our management has concluded that our internal control over financial reporting was effective as of June 30, 2006.2009.
On February 28, 2009, the Company completed the DSD Acquisition. Due to the timing of the acquisition, processes including the information system related to the DSD Coffee Business were not included in management's assessment and report on internal control over financial reporting as of June 30, 2009, the year the acquisition closed. The DSD Coffee Business' operations since the acquisition are included in our 2009 consolidated financial statements of Farmer Bros. Co. and its subsidiaries and constitute 7% of total assets (consisting primarily of accounts receivable, inventory, and certain equipment) and 17% of net assets (consisting primarily of accounts receivable, inventory, certain equipment, and related accounts payable), respectively, as of June 30, 2009, and 18% of total sales and 18% of cost of goods sold for the year then ended.
Ernst & Young LLP, an independent registered public accounting firm, has audited our management’s assessment ofissued an attestation report on the effectiveness of ourCompany's internal control over financial reporting as of June 30, 2006,2009, as stated in their report which is included herein.
Changes in Internal Control Over Financial Reporting
There has been no change in our internal control over financial reporting (as defined in Rules 13a-15(f) and 15d-15(f) promulgated under the Exchange Act) during our fiscal quarter ended June 30, 2006,2009, that has materially affected, or is reasonably likely to materially affect, our internal control over financial reporting.
38 During the fiscal quarter ended March 31, 2009 the Company entered into a transition services agreement with Sara Lee to host, maintain and support the IT infrastructure of the DSD Coffee Business for up to eighteen months. This change in our internal operations is reasonably likely to affect our internal controls. IT support is critical to the ongoing operation of the DSD Coffee Business during the transition period. Management's ability to maintain our internal control over financial reporting depends significantly on the reliability of these systems for which we will rely on Sara Lee for up to eighteen months under the transition services agreement.
Table of Contents
Report of Independent Registered Public Accounting Firm
The Board of Directors and Stockholders of
Farmer Bros. Co. and SubsidiarySubsidiaries
We have audited management’s assessment, included in the accompanying “Management Report on Internal Control over Financial Reporting,” that Farmer Bros. Co. and Subsidiary maintained effectiveSubsidiaries' internal control over financial reporting as of June 30, 2006,2009, based on criteria established in Internal Control-IntegratedControl—Integrated Framework issued by the Committee of Sponsoring Organizations of the Treadway Commission (the COSO criteria). Farmer Bros. Co. and Subsidiary’sSubsidiaries' management is responsible for maintaining effective internal control over financial reporting, and for its assessment of the effectiveness of internal control over financial reporting.reporting included in the accompanying "Management Report on Internal Control over Financial Reporting." Our responsibility is to express an opinion on management’s assessment and an opinion on the effectiveness of the company’scompany's internal control over financial reporting based on our audit.
We conducted our audit in accordance with the standards of the Public Company Accounting Oversight Board (United States). Those standards require that we plan and perform the audit to obtain reasonable assurance about whether effective internal control over financial reporting was maintained in all material respects. Our audit included obtaining an understanding of internal control over financial reporting, evaluating management’s assessment,assessing the risk that a material weakness exists, testing and evaluating the design and operating effectiveness of internal control based on the assessed risk, and performing such other procedures as we considered necessary in the circumstances. We believe that our audit provides a reasonable basis for our opinion.
A company’scompany's internal control over financial reporting is a process designed to provide reasonable assurance regarding the reliability of financial reporting and the preparation of financial statements for external purposes in accordance with generally accepted accounting principles. A company’scompany's internal control over financial reporting includes those policies and procedures that (1) pertain to the maintenance of records that, in reasonable detail, accurately and fairly reflect the transactions and dispositions of the assets of the company; (2) provide reasonable assurance that transactions are recorded as necessary to permit preparation of financial statements in accordance with generally accepted accounting principles, and that receipts and expenditures of the company are being made only in accordance with authorizations of management and directors of the company; and (3) provide reasonable assurance regarding prevention or timely detection of unauthorized acquisition, use, or disposition of the company’scompany's assets that could have a material effect on the financial statements.
As indicated in the accompanying Management's Report on Internal Control over Financial Reporting, management's assessment of and conclusion on the effectiveness of internal control over financial reporting did not include the internal controls of Sara Lee's Direct Store Delivery Coffee Business (DSD), which is included in the 2009 consolidated financial statements of Farmer Bros. Co. and Subsidiaries and constitute 7% of total assets (consisting primarily of accounts receivable, inventory and certain equipment) and 17% of net assets (consisting primarily of accounts receivable, inventory, certain equipment, and related accounts payable), respectively, as of June 30, 2009, and 18% of total sales and 18% of cost of goods sold for the year then ended. Our audit of internal control over financial reporting of Farmer Bros. Co. and Subsidiaries also did not include an evaluation of the internal control over financial reporting of DSD.
Because of its inherent limitations, internal control over financial reporting may not prevent or detect misstatements. Also, projections of any evaluation of effectiveness to future periods are subject to the risk that controls may become inadequate because of changes in conditions, or that the degree of compliance with the policies or procedures may deteriorate.
In our opinion, management’s assessment that Farmer Bros. Co. and Subsidiary maintained effective internal control over financial reporting as of June 30, 2006, is fairly stated, in all material respects, based on the COSO criteria. Also, in our opinion, Farmer Bros. Co. and SubsidiarySubsidiaries maintained, in all material respects, effective internal control over financial reporting as of June 30, 2006,2009, based on the COSO criteria.
Table of Contents
We also have audited, in accordance with the standards of the Public Company Accounting Oversight Board (United States), the consolidated balance sheets of Farmer Bros. Co. and Subsidiaries as of June 30, 20062009 and 2005,2008, and the related consolidated statements of operations, stockholders’shareholders' equity, and cash flows for each of the three years in the period ended June 30, 20062009 of Farmer Bros. Co. and SubsidiarySubsidiaries and our report dated September 7, 200614, 2009 expressed an unqualified opinion thereon.
| 
| |
Los Angeles, California
September 7, 2006
|
|
/s/ Ernst & Young LLP |
Los Angeles, California
September 14, 2009
Table of Contents
Item 9A(T). Controls and Procedures
Not applicable.
39
Item 9B. Other Information.Information
None.
PART III
None.
PART III
Item 10. Directors, and Executive Officers of the Registrantand Corporate Governance
The information required by this item will be subsequently incorporated herein by reference to our Proxy Statement expected to be dated and filed with the SEC on or before October 28, 2006.2009.
To the Company’sCompany's knowledge, based solely on a review of the copies of such reports furnished to the Company and written representations that no other reports were required during the fiscal year ended June 30, 2006,2009, its officers, directors and ten percent shareholders complied with all applicable Section 16(a) filing requirements, with the exception of those filings listed in the Registrant’sRegistrant's Proxy Statement expected to be dated and filed with the SEC on or before October 28, 2006.2009.
Item 11. Executive Compensation
The information required by this item will be subsequently incorporated herein by reference to our Proxy Statement expected to be dated and filed with the SEC on or before October 28, 2006.2009.
Item 12. Security Ownership of Certain Beneficial Owners and Management and Related Stockholder Matters
The information required by this item will be subsequently incorporated herein by reference to our Proxy Statement expected to be dated and filed with the SEC on or before October 28, 2006.2009.
Equity Compensation Plan Information
Information about our equity compensation plans at June 30, 2009 that were either approved or not approved by our stockholders was as follows:
| | | | | | | | | | | |
Plan Category | | Number of
Shares to be
Issued Upon
Exercise of
Outstanding
Options | | Weighted
Average
Exercise
Price of
Outstanding
Options | | Number of
Shares
Remaining
Available
for Future
Issuance(b) | |
|---|
Equity compensation plans approved by stockholders(a) | | | 239,000 | | $ | 22.22 | | | 717,500 | |
Equity compensation plans not approved by stockholders | | | — | | | — | | | — | |
| | Total | | | 239,000 | | $ | 22.22 | | | 717,500 | |
- (a)
- Includes the Farmer Bros. Co. 2007 Omnibus Plan (the "Omnibus Plan").
- (b)
- Shares available for future issuance under the Omnibus Plan may be awarded in the form of stock options, stock appreciation rights, restricted stock, restricted stock units, dividend equivalents, performance-based awards, stock payments, or other incentives payable in shares of stock, or any combination thereof.
Table of Contents
Item 13. Certain Relationships and Related Transactions, and Director Independence
The information required by this item will be subsequently incorporated herein by reference to our Proxy Statement expected to be dated and filed with the SEC on or before October 28, 2006.2009.
Item 14. Principal Accountant Fees and Services
The information required by this item will be subsequently incorporated herein by reference to our Proxy Statement expected to be dated and filed with the SEC on or before October 28, 2006.2009.
PART IV
Item 15. Exhibits and Financial Statement Schedules
(a) List of Financial Statements and Financial Statement Schedules:
1. Financial Statements included in Item 8:
Consolidated Balance Sheets as of June 30, 20062009 and 2005.2008.
Consolidated Statements of Operations for the Years Ended
June 30, 2006, 20052009, 2008, and 2004.2007.
Consolidated Statements of Cash Flows for the Years Ended
June 30, 2006, 20052009, 2008, and 2004.2007.
Consolidated Statements of Stockholders’Stockholders' Equity Forfor the Years Ended
Ended June 30, 2006, 20052009, 2008, and 2004.2007.
Notes to Consolidated Financial Statements.
2. Financial Statement Schedules: Financial Statement Schedules are omitted as they are not applicable, or the required information is given in the consolidated financial statements and notes thereto.
3. The exhibits to this Annual Report on Form 10-K are listed on the accompanying index to exhibits and are incorporated herein by reference or are filed as part of the Annual Report on Form 10-K.
Each management contract or compensation plan required to be filed as an exhibit is identified by an asterisk (*).
(b) Exhibits: See Exhibit IndexIndex.
41
SIGNATURES
Table of Contents
SIGNATURES
Pursuant to the requirements of Section 13 or 15(d) of the Securities Exchange Act of 1934, the Registrant has duly caused this report to be signed on its behalf by the undersigned, thereunto duly authorized.
| | | |
| FARMER BROS. CO. |
|
By:
|
|
/s/ ROGER M. LAVERTY III
GUENTER W. BERGER
|
| | | Guenter W. Berger,
|
| | |
Roger M. Laverty III
ChairmanPresident and Chief Executive Officer
(principal executive officer)
Date: September 14, 2009 |
|
By: |
|
/s/ JOHN E. SIMMONS
John E. Simmons
Treasurer and Chief Financial Officer
(principal financial and accounting officer)
Date: September 11, 200614, 2009 |
|
By: |
|
/s/ HORTENSIA GOMEZ
Hortensia Gomez
Vice President and Controller
(controller)
Date: September 14, 2009 |
Table of Contents
Pursuant to the requirements of the Securities Exchange Act of 1934, this report has been signed below by the following persons on behalf of the Registrant and in the capacities and on the dates indicated.
| Name
|
|
|
| Title
|
|
|
| Date
|
|
|
|
|
|
|
/s/ ROGER M. LAVERTY III
GUENTER W. BERGER
Roger M. Laverty III | | Chairman andPresident, Chief Executive
Officer and Director | | September 11, 2006 14, 2009 |
Guenter W. Berger |
| Officer (principal executive officer)
Chairman of the Board and Director |
|
September 14, 2009 |
/s/ MARTIN A. LYNCH
JOHN E. SIMMONS
Martin A. Lynch |
| Treasurer and Chief Financial
Director |
|
September 14, 2009 |
John E. Simmons
/s/ THOMAS A. MALOOF
Thomas A. Maloof |
| Officer (principal financial and
Director |
|
September 11, 2006
14, 2009 |
James J. McGarry |
| accounting officer)
Director |
|
September 14, 2009 |
/s/ LEWIS A. COFFMAN
| | Director
| | September 11, 2006
|
Lewis A. Coffman
| | |
/s/ JOHN H. MERRELL
| | Director
| | September 11, 2006
|
John H. Merrell |
|
Director |
|
September 14, 2009 |
/s/
THOMAS A. MALOOF
| | Director
| | September 11, 2006
|
Thomas A. Maloof
| | |
/s/ JOHN SAMORE, JR. | | Director
| | September 11, 2006
|
John Samore, Jr.
| | |
/s/ CAROL FARMER WAITE
| | Director
| | September 11, 2006
|
Carol Farmer Waite |
|
Director
|
|
September 14, 2009 |
Table of Contents
EXHIBIT INDEX
| | |
/s/ KENNETH R. CARSON
3.1 | | Director
| | September 11, 2006
|
Kenneth R. Carson
| | |
42
EXHIBIT INDEX
3.1
| | Certificate of Incorporation (filed as an exhibitExhibit 3.1 to the Company's Quarterly Report on Form 10-Q for the quarter ended March 31, 20042009 filed with the SEC on May 11, 2009 and incorporated herein by reference). |
3.2
|
|
Amended and Restated Bylaws (filed as Exhibit 3.2 to the Company’sCompany's Current Report on Form 8-K filed with the SEC on June 8, 2006 and incorporated herein by reference).
|
4.1
|
|
Certificate of DesignationsDesignation, Preferences and Rights of Series A Junior Participating Preferred Stock (filed as Exhibit 3.1 to the Company’sCompany's Current Report on Form 8-K datedfiled with the SEC on March 17, 2005 and incorporated herein by reference).
|
4.2
|
|
Rights Agreement, dated March 17, 2005, by and between Farmer Bros. Co. and Wells Fargo Bank, N.A., as Rights Agent (filed as Exhibit 4.1 to the Company’sCompany's Current Report on Form 8-K datedfiled with the SEC on March 17,18, 2005 and incorporated herein by reference).
|
10.1
4.3 |
| The
Specimen Stock Certificate (filed as Exhibit 4.1 to the Company's Form 8-A/A filed with the SEC on February 6, 2009 and incorporated herein by reference).
|
10.1 |
|
Asset Purchase Agreement, dated as of December 2, 2008, by and among Sara Lee Corporation, Saramar, LLC and Farmer Bros. Co. (filed as Exhibit 10.1 to the Company's Quarterly Report on Form 10-Q for the quarter ended December 31, 2008 filed with the SEC on February 10, 2009 and incorporated herein by reference). |
10.2 |
|
Amendment No. 1 to Asset Purchase Agreement, dated February 27, 2009, by and among Sara Lee Corporation, Saramar, LLC and Farmer Bros. Co. (filed herewith). |
10.3 |
|
Stock Purchase Agreement, dated April 27, 2007, by and among Farmer Bros. Co., Coffee Bean Holding Co., Inc., and the Stockholders of Coffee Bean Holding Co., Inc. (filed as Exhibit 10.1 to the Company's Current Report on Form 8-K filed with the SEC on May 1, 2007 and incorporated herein by reference). |
10.4 |
|
Loan and Security Agreement, dated March 2, 2009, by and among Farmer Bros. Co. and Coffee Bean International, Inc., as Borrowers, Coffee Bean Holding Co., Inc., FBC Finance Company and SL Realty, LLC, as Guarantors, and Wachovia Bank, National Association, as Lender (filed as Exhibit 10.1 to the Company's Quarterly Report on Form 10-Q for the quarter ended December 31, 2008 filed with the SEC on February 10, 2009 and incorporated herein by reference). |
10.5 |
|
Amendment No. 1 to Loan and Security Agreement and Consent, dated March 2, 2009, by and among Farmer Bros. Co. and Coffee Bean International, Inc., as Borrowers, Coffee Bean Holding Co., Inc. and FBC Finance Company, as Guarantors, and Wachovia Bank, National Association, as Lender (filed herewith). |
10.6 |
|
Farmer Bros. Co. Pension Plan for Salaried Employees (filed as an exhibitExhibit 10.1 to the Company's Annual Report on Form 10-K for the fiscal year ended June 30, 20022007 filed with the SEC on September 13, 2007 and incorporated herein by reference).* |
10.2
10.7 |
| The Farmer Bros. Co. Incentive Compensation Plan (filed as an exhibit to the Form 10-K for the year ended June 30, 2002 and incorporated herein by reference).*
|
10.3
| |
Farmer Bros. Co. 2005 Incentive Compensation Plan (Amended and Restated as of December 31, 2008) (filed as Exhibit 99.110.4 to the Company’s CurrentCompany's Quarterly Report on Form 8-K filed with the SEC on October 12, 2005 and incorporated herein by reference).*
|
10.4
| | Form of Notification Letter Under Farmer Bros. Co. 2005 Incentive Compensation Plan (filed as Exhibit 99.2 to the Company’s Current Report on Form 8-K filed with the SEC on October 12, 2005 and incorporated herein by reference).*
|
10.5
| | Form of Award Letter (Fiscal 2006) under Farmer Bros. Co. 2005 Incentive Compensation Plan (filed as Exhibit 99.1 to the Company’s Current Report on Form 8-K filed with the SEC on August 30, 2006 and incorporated herein by reference).*
|
10.6
| | The Farmer Bros. Co. Employee Stock Ownership Plan (filed as an exhibit to the Form 10-K for the year ended June 30, 2002 and incorporated herein by reference).*
|
10.7
| | Farmer Bros. Co. Employee Stock Ownership Plan Amendment 2 (filed as an exhibit to the Form 10-Q for the quarter ended December 31, 20032008 filed with the SEC on February 10, 2009 and incorporated herein by reference).*
|
10.8
|
|
Farmer Bros. Co. Amended and Restated Employee Stock Ownership Plan Amendment 3 (filed as an exhibit 10.5 to the Company's Annual Report on Form 10-Q10-K for the quarterfiscal year ended December 31, 2003June 30, 2007 filed with the SEC on September 13, 2007 and incorporated herein by reference).*
|
Table of Contents
| | |
10.9 | | ESOP Loan Agreement No. 2, dated July 21, 2003 between the CompanyFarmer Bros. Co. and Wells Fargo Bank, N.A., Trustee offor the Farmer Bros Co. Employee Stock Ownership Plan (filed as an exhibitExhibit 10.6 to the Company's Quarterly Report on Form 10-Q for the quarter ended December 31, 20032008 filed with the SEC on February 10, 2009 and incorporated herein by reference). |
10.10
|
| Form of Change in Control Severance Agreements entered into with each of the following officers: Guenter Berger, Michael J. King and John E. Simmons (filed as an exhibit to the Form 10-Q for the quarter ended March 31, 2005 and incorporated herein by reference).*
|
10.11
| | Change in Control Severance Agreement (Laverty), dated as of June 2, 2006, by and between Farmer Bros. Co. and Roger M. Laverty III (filed as Exhibit 10.4 to the Company’s Current Report on Form 8-K filed with the SEC on June 8, 2006 and incorporated herein by reference).*
|
10.12
| |
Employment Agreement, dated as of June 2, 2006, by and between Farmer Bros. Co. and Roger M. Laverty III (filed as Exhibit 10.1 to the Company’sCompany's Current Report on Form 8-K filed with the SEC on June 8, 2006 and incorporated herein by reference).*
|
10.13
10.11 |
|
Amendment No. 1 to Employment Agreement, dated as of December 5, 2007, by and between Farmer Bros. Co. and Roger M. Laverty III (filed as Exhibit 10.1 to the Company's Current Report on Form 8-K/A filed with the SEC on December 11, 2007 and incorporated herein by reference).* |
10.12 |
|
Amendment No. 2 to Employment Agreement, dated as of December 31, 2008, by and between Farmer Bros. Co. and Roger M. Laverty III (filed as Exhibit 10.13 to the Company's Quarterly Report on Form 10-Q for the quarter ended December 31, 2008 filed with the SEC on February 10, 2009 and incorporated herein by reference).* |
10.13 |
|
Employment Agreement, dated as of March 3, 2008, by and between Farmer Bros. Co. and Drew H. Webb (filed as Exhibit 10.1 to the Company's Current Report on Form 8-K filed with the SEC on March 7, 2008 and incorporated herein by reference).* |
10.14 |
|
Amendment No. 1 to Employment Agreement, dated as of December 31, 2008, by and between Farmer Bros. Co. and Drew H. Webb (filed as Exhibit 10.15 to the Company's Quarterly Report on Form 10-Q for the quarter ended December 31, 2008 filed with the SEC on February 10, 2009 and incorporated herein by reference).* |
10.15 |
|
Employment Agreement, dated as of March 14, 2009, by and between Farmer Bros. Co. and Heidi L. Modaro (filed herewith).* |
10.16 |
|
Consulting Agreement, dated as of March 2, 2009, by and between Farmer Bros. Co. and Michael J. King (filed herewith).* |
10.17 |
|
2007 Omnibus Plan (filed as Exhibit 10.1 to the Company's Current Report on Form 8-K filed with the SEC on August 29, 2007 and incorporated herein by reference) * |
10.18 |
|
Form of 2007 Omnibus Plan Stock Option Grant Notice and Stock Option Agreement (filed as Exhibit 10.1 to the Company's Current Report on Form 8-K filed with the SEC on February 26, 2008 and incorporated herein by reference).* |
10.19 |
|
Form of 2007 Omnibus Plan Restricted Stock Award Grant Notice and Restricted Stock Award Agreement (filed as Exhibit 10.2 to the Company's Current Report on Form 8-K filed with the SEC on February 26, 2008 and incorporated herein by reference).* |
10.20 |
|
Stock Ownership Guidelines for Directors and Executive Officers (filed as Exhibit 10.3 to the Company's Current Report on Form 8-K filed with the SEC on February 26, 2008 and incorporated herein by reference).* |
10.21 |
|
Form of 2007 Target Award Notification Letter under Farmer Bros. Co. 2005 Incentive Compensation Plan (filed as Exhibit 99.1 to the Company's Current Report on Form 8-K filed with the SEC on December 22, 2006 and incorporated herein by reference).* |
10.22 |
|
Form of Award Letter (Fiscal 2007) under Farmer Bros. Co. 2005 Incentive Compensation Plan (filed as Exhibit 10.3 to the Company's Current Report on Form 8-K filed with the SEC on August 29, 2007 and incorporated herein by reference)* |
Table of Contents
| | |
| 10.23 | | Form of 2008 Target Award Notification Letter under Farmer Bros. Co. 2005 Incentive Compensation Plan (filed as Exhibit 10.2 to the Company's Current Report on Form 8-K filed with the SEC on December 11, 2007 and incorporated herein by reference) * |
10.24 |
|
Form of Fiscal 2008 Award Letter under Farmer Bros. Co. 2005 Incentive Compensation Plan (filed as Exhibit 10.1 to the Company's Current Report on Form 8-K filed with the SEC on October 3, 2008 and incorporated herein by reference).* |
10.25 |
|
Amendment 2008-1 to the Farmer Bros. Co. Amended and Restated Employee Stock Ownership Plan (filed as Exhibit 10.30 to the Company's Quarterly Report on Form 10-Q for the quarter ended December 31, 2008 filed with the SEC on February 10, 2009 and incorporated herein by reference).* |
10.26 |
|
Good Faith Amendment to comply with Code Section 401(a)(31)(B) as amended by the Economic Growth and Tax Relief Reconciliation Act of 2001 (EGTRRA) for the Farmer Bros. Co. Amended and Restated Employee Stock Ownership Plan (filed as Exhibit 10.31 to the Company's Quarterly Report on Form 10-Q for the quarter ended December 31, 2008 filed with the SEC on February 10, 2009 and incorporated herein by reference). |
10.27 |
|
Form of Change in Control Severance Agreement for Executive Officers of the Company (with schedule of executive officers attached) (filed herewith).* |
10.28 |
|
Form of Indemnification Agreement for Directors and Officers of the Company, as adopted on May 18, 2006 and as amended on December 31, 2008 (with updated schedule of indemnitees attached) (filed herewith).* |
14.1 |
|
Farmer Bros. Co. Code of Conduct and Ethics adopted on August 26, 2009 (filed as Exhibit 10.0114.1 to the Company’sCompany's Current Report on Form 8-K filed with the SEC on May 22, 2006 and incorporated herein by reference)August 31, 2009).* |
21.1
|
|
List of all Subsidiaries of the registrant.Farmer Bros. Co. (filed as an exhibit to the Form 10-K for the year ended June 30, 2005 and incorporated herein by reference.)
herewith). |
31.1
23.1 |
|
Consent of Independent Registered Accounting Firm (filed herewith).
|
31.1 |
|
Principal Executive Officer Certification Pursuant to Securities Exchange Act Rules 13a-14 and 15d-14 as Adopted Pursuant to Section 302 of the Sarbanes-Oxley Act of 2002.2002 (filed herewith). |
31.2
|
|
Principal Financial Officer Certification Pursuant to Securities Exchange Act Rules 13a-14 and 15d-14 as Adopted Pursuant to Section 302 of the Sarbanes-Oxley Act of 2002.2002 (filed herewith)
. |
32.1
|
|
Principal Executive Officer Certification Pursuant to 18 U.S.C. Section 1350 as Adopted Pursuant to Section 906 of the Sarbanes-Oxley Act of 2002.2002 (furnished herewith)
. |
32.2
|
|
Principal Financial Officer Certification Pursuant to 18 U.S.C. Section 1350 as Adopted Pursuant to Section 906 of the Sarbanes-Oxley Act of 2002.2002 (furnished herewith)
. |
99.1
|
|
Properties List of properties. (filed herewith)
. |
44
- *
- Management contract or compensatory plan or arrangement.